UNITED STATES
SECURITIES AND EXCHANGE COMMISSION
Washington, D.C. 20549
FORM N-CSR
Certified Shareholder Report of
Registered Management Investment Companies
Investment Company Act File Number: 811-02444
The Bond Fund of America
(Exact Name of Registrant as Specified in Charter)
333 South Hope Street
Los Angeles, California 90071
(Address of Principal Executive Offices)
Registrant's telephone number, including area code: (213) 486-9200
Date of fiscal year end: December 31
Date of reporting period: December 31, 2014
Steven I. Koszalka
The Bond Fund of America
333 South Hope Street
Los Angeles, California 90071
(Name and Address of Agent for Service)
Copies to:
Michael Glazer
Morgan, Lewis & Bockius LLP
355 South Grand Avenue, Suite 4400
Los Angeles, California 90071
(Counsel for the Registrant)
ITEM 1 – Reports to Stockholders

Invest with a measured,
long-term perspective.
 |
The Bond Fund of America® |
| |
Annual report
for the year ended
December 31, 2014 |
The Bond Fund of America seeks to provide as high a level of current income as is consistent with the preservation of capital.
This fund is one of more than 40 offered by one of the nation’s largest mutual fund families, American Funds, from Capital Group. For more than 80 years, Capital has invested with a long-term focus based on thorough research and attention to risk.
Fund results shown in this report, unless otherwise indicated, are for Class A shares at net asset value. If a sales charge (maximum 3.75%) had been deducted, the results would have been lower. Results are for past periods and are not predictive of results for future periods. Current and future results may be lower or higher than those shown. Share prices and returns will vary, so investors may lose money. Investing for short periods makes losses more likely. Investments are not FDIC-insured, nor are they deposits of or guaranteed by a bank or any other entity, so they may lose value. For current information and month-end results, visit americanfunds.com.
See page 4 for Class A share results with relevant sales charges deducted. For other share class results, visit americanfunds.com and americanfundsretirement.com.
Investment results assume all distributions are reinvested and reflect applicable fees and expenses. When applicable, investment results reflect fee waivers, without which results would have been lower. Visit americanfunds.com for more information.
The fund’s 30-day yield for Class A shares as of January 31, 2015, calculated in accordance with the U.S. Securities and Exchange Commission (SEC) formula, was 1.65%. The fund’s 12-month distribution rate for Class A shares as of that date was 1.94%. Both reflect the 3.75% maximum sales charge. The SEC yield reflects the rate at which the fund is earning income on its current portfolio of securities while the distribution rate reflects the fund’s past dividends paid to shareholders. Accordingly, the fund’s SEC yield and distribution rate may differ.
The return of principal for bond funds and for funds with significant underlying bond holdings is not guaranteed. Fund shares are subject to the same interest rate, inflation and credit risks associated with the underlying bond holdings. High-yield bonds are subject to greater fluctuations in value and risk of loss of income and principal than investment-grade bonds. Investing in bonds issued outside the U.S. may be subject to additional risks. They include currency fluctuations, political and social instability, differing securities regulations and accounting standards, higher transaction costs, possible changes in taxation, illiquidity and price volatility. These risks may be heightened in connection with investments in developing countries. Refer to the fund prospectus and the Risk Factors section of this report for more information on these and other risks associated with investing in the fund.

Fellow investors:
A declining interest rate environment, driven by global economic uncertainty and heightened geopolitical conflicts, resulted in a favorable market for investment-grade bond investors in 2014. The Bond Fund of America returned 5.53% for the 12-month period ended December 31.
By way of comparison, the unmanaged Barclays U.S. Aggregate Index — a measure of the investment-grade (BBB/Baa and above) bond market — returned 5.97%. The fund’s peer group, as measured by the Lipper Core Bond Funds Average, returned 5.33%. The fund continues to keep pace with these benchmarks over longer periods, as shown in the chart below.
The fund’s dividend income complemented the rise in bond prices. During the period, the fund paid dividends exceeding 27 cents a share. For investors, this amounted to an income return of 2.21% with dividends reinvested, or 2.19% if taken in cash.
Bond market overview
The fund’s fiscal year was characterized by a surprising decline in long-term interest rates and uneven but improving growth in the U.S. economy. Early in the year, severe winter weather hampered business transactions in many regions, resulting in lower-than-expected economic activity. However, the economy improved over time, with U.S. gross domestic product (GDP) rising 5% during the third quarter, the strongest rate in more than a decade. In spite of this turnaround, the yield on the benchmark 10-year U.S. Treasury bond fell from 3.04% at the end of 2013 to 2.17% at the close of 2014.
U.S. bond yields declined for many reasons, but chief among them were slowing economic growth in Europe and Asia, political and economic turmoil in some emerging markets nations, worsening geopolitical conflicts in Ukraine and the Middle East, and declining inflation expectations in many parts of the world. These and other
Results at a glance
For periods ended December 31, 2014, with all distributions reinvested
| | | Cumulative
total returns | | Average annual total returns |
| | | 1
year | | 3
years | | 5
years | | 10
years | | Lifetime
(since 5/28/74) |
| | | | | | | | | | | | | | | | | | | | | |
| The Bond Fund of America (Class A shares) | | | 5.53 | % | | | 3.08 | % | | | 4.59 | % | | | 3.48 | % | | | 7.97 | % |
| Barclays U.S. Aggregate Index* | | | 5.97 | | | | 2.66 | | | | 4.45 | | | | 4.71 | | | | 7.93 | |
| Lipper Core Bond Funds Average | | | 5.33 | | | | 3.16 | | | | 4.68 | | | | 4.24 | | | | 7.75 | |
| * | The Barclays U.S. Aggregate Index began on January 1, 1976. From May 28, 1974, through December 31, 1975, Barclays U.S. Government/Credit Index was used. The indexes are unmanaged and, therefore, have no expenses. Investors cannot invest directly in an index. |
| The Bond Fund of America | 1 |
Over the long term, higher interest rates are beneficial for fixed-income investors. As bonds are sold or reach maturity, the proceeds can be reinvested in less expensive bonds at higher yields.
events spurred safe-haven buying. Demand for U.S. Treasury bonds, viewed as the soundest investments in the world, soared to record highs in 2014.
Downward pressure on bond yields came despite significant monetary policy changes at the U.S. Federal Reserve, including a months-long deceleration of the central bank’s bond buying program, known as quantitative easing. Amid an improving U.S. job market and generally benign inflation, the Fed slashed its bond purchases from $85 billion a month in January to zero in October. The move capped an unprecedented intervention program that is widely credited with rescuing the U.S. economy from the depths of the global financial crisis.
Inside the portfolio
The fund adopted a more defensive posture during the year, gradually moving into higher quality areas of the bond market. Portfolio managers sold investment-grade corporate bonds and mortgage-backed securities as those sectors advanced. They also reduced the fund’s relatively modest holdings of high-yield corporate and emerging markets debt. The fund’s shorter-than-index duration hurt results relative to the benchmark, but its yield curve positioning among longer dated bonds helped to boost returns as the long end of the market rallied.
Fund holdings in U.S. Treasury and agency bonds increased during the year, representing 38% of the portfolio at the end of 2014, compared to 34% at the end of 2013. Part of that rise included an increase in the fund’s holdings of Treasury Inflation-Protected Securities (TIPS). Managers decided to add to the TIPS position as an insurance policy against potentially higher inflation. TIPS returns were disappointing due to lower inflation expectations, particularly as oil prices fell. However, managers believed valuations were attractive, and they continue to maintain a high level of conviction in the fund’s TIPS investments.
The fund’s holdings of mortgage-backed securities fluctuated throughout the year, but closed 2014 at about 23% of the portfolio, roughly the same as December 2013. Mortgage bond valuations started the year high and moved higher. As a result, managers maintained an underweight exposure to mortgage bonds relative to the index.
Corporate bond exposure was reduced steadily throughout most of the year as the corporate market generated strong returns before reversing course in the third quarter. Investment-grade U.S. corporate bonds made up 27% of the portfolio at the end of 2014, down from 32% at the end of 2013. The fund’s exposure to high-yield corporate bonds (rated BB and below) was also significantly reduced. Managers invested in a number of new corporate bond issues during the year. Low interest rates encouraged a flurry of new corporate bond sales, resulting in record-high issuance of $1.1 trillion for the year.
Looking ahead
The outlook for the U.S. economy remains bright, as evidenced by an improving employment picture, accelerating GDP growth and moderate-to-low levels of inflation. Portfolio managers believe these healthy trends will
| 2 | The Bond Fund of America |

continue and inflation will gradually move higher. Given the positive conditions, managers are convinced the Fed will raise short-term interest rates this year — barring an unforeseen deterioration in the job market or economic growth. The Fed has indicated it would raise rates, should the data support such a move, and managers likewise believe the threshold will be met before the end of the year. (See our feature story on page 6 for more on this topic.)
Rising rates would put stress on the bond market. Managers expect higher volatility at times as the Fed contemplates changes in monetary policy and ultimately raises short-term rates for the first time since 2006. In such an environment, bonds can lose value. However, over the long term, higher interest rates are beneficial for fixed-income investors. As bonds are sold or reach maturity, the proceeds can be reinvested in less expensive bonds at higher yields, providing better income opportunities and contributing to total return.
The Bond Fund of America seeks to provide investors with income, as well as capital preservation, and it can do well during periods when equity prices are under pressure. It is important to remember that bonds are a valuable diversification tool in any portfolio, regardless of the direction of interest rates. This is especially true for investors who are saving for long-term goals such as a college education or a comfortable retirement. We remain confident that the fund can continue to serve our investors well in this regard.
As always, we take a long-term, research-driven approach to investing that we believe will benefit shareholders. It is during challenging periods of the market that we believe disciplined, active investing can better demonstrate its value. We thank you for your continued interest in The Bond Fund of America, and we look forward to reporting to you again in six months.
Cordially,

John H. Smet
President
February 5, 2015
For current information about the fund, visit americanfunds.com.
| The Bond Fund of America | 3 |
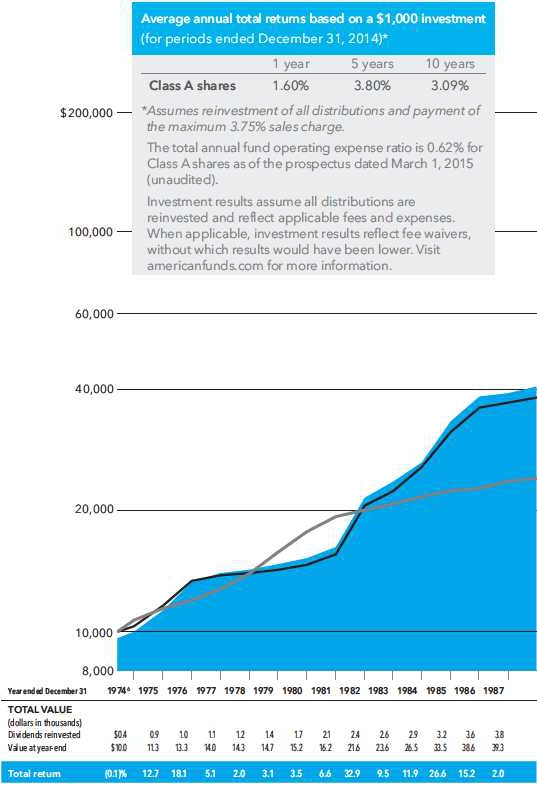
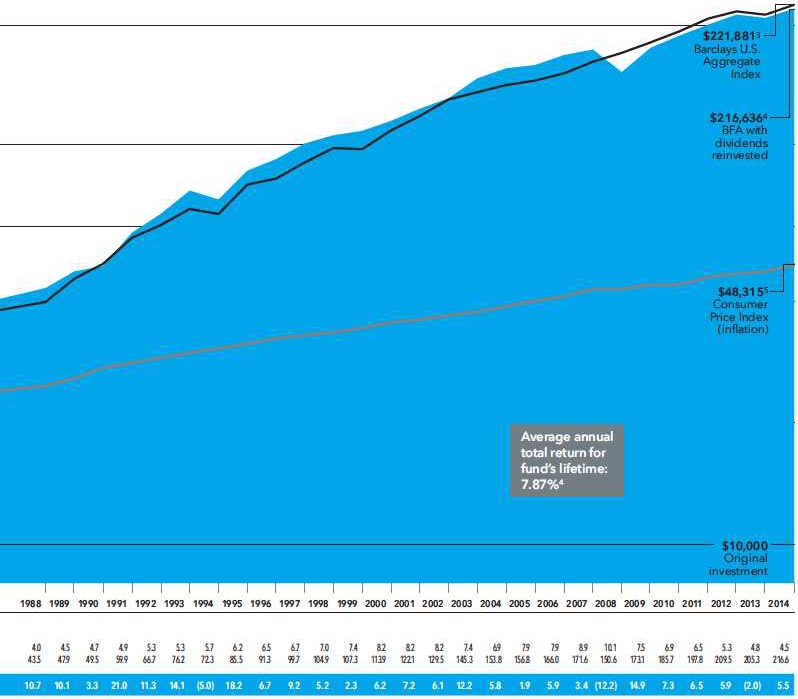
The value of a long-term perspective
Fund results shown are for Class A shares and reflect deduction of the maximum sales charge of 3.75% on the $10,000 investment.1 Thus, the net amount invested was $9,625.2 Results are for past periods and are not predictive of results for future periods. Current and future results may be lower or higher than those shown. Share prices and returns will vary, so investors may lose money. For current information and month-end results, visit americanfunds.com.
The results shown are before taxes on fund distributions and sale of fund shares.
| 1 | As outlined in the prospectus, the sales charge is reduced for accounts (and aggregated investments) of $100,000 or more and is eliminated for purchases of $1 million or more. There is no sales charge on dividends or capital gain distributions that are reinvested in additional shares. |
| 2 | The maximum initial sales charge was 8.5% prior to December 15, 1986, when it became 4.75% until January 9, 2000. |
| 3 | From May 28, 1974, through December 31, 1975, Barclays U.S. Government/Credit Index was used because Barclays U.S. Aggregate Index did not yet exist. Since January 1, 1976, the Barclays U.S. Aggregate Index has been used. These indexes are unmanaged and, therefore, have no expenses. Investors cannot invest directly in an index. |
| 4 | Includes reinvested dividends of $205,868 and reinvested captital gain distributions of $4,573. |
| 5 | Computed from data supplied by the U.S. Department of Labor, Bureau of Labor Statistics. |
| 6 | For the period May 28, 1974, commencement of operations, through December 31, 1974. |
| 4 | The Bond Fund of America |
How a $10,000 investment has grown
There always have been reasons not to invest. You will find, however, that despite occasional stumbles, financial markets have tended to reward investors over the long term. Dividends, particularly when reinvested, have accounted for virtually all of the fund’s overall results. The table beneath the chart details the fund’s annual dividends and the cumulative value of the original investment.
| The Bond Fund of America | 5 |

| 6 | The Bond Fund of America |
The U.S. economy is growing, the employment picture is improving and, beyond that, I think the Fed very much wants to bring an end to the era of zero-bound rates. John Smet, portfolio manager
2015 Outlook: Tension building as interest rates set to rise
For years, bond fund managers have faced the same persistent question from investors: What will you do when interest rates rise? Particularly at the start of 2014, virtually no one was predicting that rates would head in the opposite direction, but that is exactly what happened. Confounding many Wall Street strategists, the yield on the benchmark 10-year U.S. Treasury note declined from roughly 3.00% in January to end the year at 2.17%, tumbling nearly a full percentage point, oddly enough, at a time when the U.S. economy was picking up steam.
Persistent downward pressure on rates came despite a widely feared reduction in the Federal Reserve’s extraordinary bond buying program, known as quantitative easing, or QE. Amid an improving job market and generally benign inflation, the Fed gradually cut its bond purchases from $85 billion a month in January to zero in October, capping an unprecedented stimulus program that was credited with rescuing the U.S. economy from the depths of the global financial crisis.
Could 2015 be the year that interest rates go higher? Many of our fixed-income portfolio managers believe the answer is yes — rates will rise this year as the Fed seeks to normalize monetary policy. That could result in higher bond market volatility and some short-term pain for fixed-income investors. However, our managers believe rates won’t climb as fast or as far as some investors fear. In fact, rates could stay relatively low for a long time, given several powerful economic and geopolitical trends that have emerged in recent years:
| • | Declining inflation expectations, exemplified by falling oil prices, and slow wage growth suggest that the Fed may wait longer before deciding to raise the federal funds rate for the first time since 2006. Fed officials said as much in their December meeting: They intend to be “patient” before making a move. |
| | |
| • | Monetary stimulus from other central banks, particularly the Bank of Japan and the European Central Bank, is putting enormous downward pressure on global bond yields. U.S. Treasuries look far more attractive by comparison, which serves to keep a lid on rates. |
| | |
| • | Intensifying geopolitical conflicts around the world are making Treasuries more desirable as safe-haven |
| The Bond Fund of America | 7 |
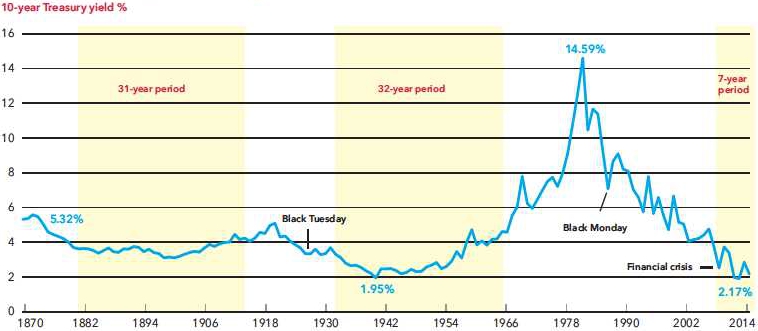
Interest rates can stay low for a long time
Source: U.S. Bureau of Economic Analysis.
Low interest rates have been the norm throughout much of U.S. history. High interest rates prevailed during the 1980s and 1990s, while many other periods, going back to the 1870s, look much more like today.
investments. Demand for Treasuries grew to record-high levels in 2014, and there are no signs of that trend abating anytime soon.
| • | Banks and other financial institutions are adding to their Treasury holdings due to more stringent regulatory requirements. At the same time, more volatile financial markets increase demand for Treasuries held as collateral against derivative positions. |
“I am convinced the Fed will raise interest rates this year,” says John Smet, a portfolio manager with The Bond Fund of America. “The U.S. economy is growing, the employment picture is improving and, beyond that, I think the Fed very much wants to bring an end to the era of zero-bound rates. That said, there have been times in history when interest rates have remained relatively low for extended periods. So while we may be moving gradually higher in the months ahead, there is a compelling case to be made for the argument that we are in the midst one of those extended low-rate periods.”
Indeed, as the chart above illustrates, low interest rates have been the norm throughout much of U.S. history. High interest rates prevailed mostly during the 1980s and 1990s, while time periods dating back to the 1870s look much more like today. “If your point of reference is the ‘80s and ‘90s, then you may very well see today as an outlier period of historically low interest rates,” says Wesley Phoa, also a portfolio manager with The Bond Fund of America. “However, if you look at just about any other time, interest rates from 2% to 5% are very much within the range of normal.”
“The Fed has been telling us to look at the economic data — that will determine the Fed’s course,” he adds. “I think we should finally believe them.”
Economic tailwinds emerge
The U.S. economy has clearly improved over the past year, although it didn’t get off to a good start. Severe winter weather put a damper on economic activity in the first quarter of 2014, sending Gross Domestic Product (GDP) growth down –2.1%. Second-quarter growth was significantly better, rising 4.6% as consumer spending rebounded. Third-quarter activity continued the trend as GDP
| 8 | The Bond Fund of America |
growth surged to 5.0%, the strongest rate in more than a decade.
Capital Group economist Darrell Spence believes the U.S. economy is now on firm footing and will ultimately settle at a healthy annualized GDP growth rate of 3.0% to 3.5% this year. That view is based on several positive factors, including:
| • | improving fiscal conditions at state and local governments |
| | |
| • | a strengthening labor market and a declining federal budget deficit |
| | |
| • | a pick-up in business investment and rising corporate earnings |
“The economy is starting to gain some real traction,” Darrell says. “Several drags on economic growth are disappearing, including the painful retrenchment at state and local governments. U.S. tax increases and spending cuts have been significant in recent years, but the appetite to do any more of that appears to be dwindling. That bodes well for economic growth in the months and years ahead.”

Job picture brightens
The outlook for American jobs has also improved dramatically. The U.S. unemployment rate has declined from 10.0% at the height of the financial crisis to 5.6% in December, the lowest level since 2008. However, Fed officials often cite a disappointing labor force participation rate — fewer people actually working or looking for work — as reason to be skeptical about top-line job growth. The U.S. economy created an average of 246,000 new jobs per month in 2014, but the participation rate fell to 62.7% in December, near a 36-year low. That remains a concern — and another reason for the Fed to stand pat on rates.
Meanwhile, despite worries that several years of ultra-low interest rates and quantitative easing would produce alarmingly high inflation, consumer prices rose just 0.8% in 2014, weighed down by a sharp drop in oil prices. At such levels, U.S. consumer price increases are well below the Fed’s target rate of 2.0%, suggesting that inflation remains in check.
The rapid decline in oil prices that we’ve seen since last summer has changed the inflation outlook here in the U.S. and around the world.
The Fed’s preferred inflation measure — known as the personal consumption expenditures price index, or PCE — is rising at a rate of 1.2%, and it has stayed below the target rate for 31 consecutive months. Consequently, there is little pressure for the Fed to quickly raise rates.
U.S. inflation rate is running below the Federal Reserve’s 2% target
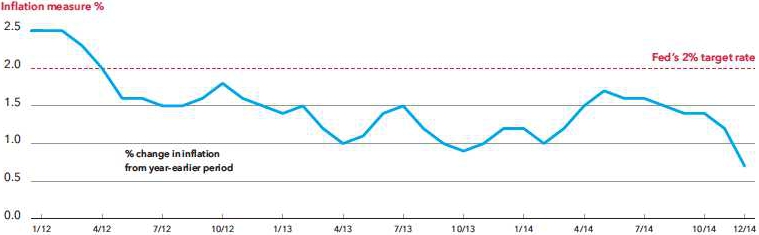
Source: U.S. Commerce Department, U.S. Federal Reserve.
The annual change in the personal consumption expenditures (PCE) price index shows inflation is not a concern, meaning there is little pressure on the Fed to raise interest rates anytime soon.
| The Bond Fund of America | 9 |
In other words, the Fed indeed can be “patient” — as long as inflation remains low.
“The rapid decline in oil prices that we’ve seen since last summer has changed the inflation outlook here in the U.S. and around the world,” says Andy Barth, a portfolio manager with The Bond Fund of America. “How the oil story plays out — and the effect it has on global growth expectations — could have a significant influence on everything else that happens in the financial markets this year.”
U.S. interest rates will eventually go up, Barth says. But the key questions for investors to consider are: “When?” and “How fast?” Some of our portfolio managers believe it could take longer than many investors think and it could be a very slow process. One reason for this extended outlook is that many important factors are not within the Fed’s control. Central banks in Europe, Japan and China are moving in the opposite direction, cutting interest rates and ramping up stimulus measures, and that trend is not likely to change anytime soon.
A world awash in liquidity
The European Central Bank (ECB) announced in September that it was slashing interest rates and launching a U.S.-style bond buying program in an attempt to revive Europe’s sluggish economy. Mounting deflationary pressures prompted the ECB to reduce its main lending rate by 10 basis points to 0.05% and commit to asset purchases that could amount to more than €1 trillion over time. Meanwhile, the People’s Bank of China recently injected 500 billion yuan ($81 billion) into the country’s five major state-owned banks in a bid to encourage lending activity. And the Bank of Japan — the pioneer of quantitative easing in the early 2000s — continues to purchase ¥6 trillion to ¥8 trillion ($55 billion to $74 billion) in government bonds each month in an aggressive attempt to push inflation up to the bank’s 2.0% target.
These stimulus measures put tremendous pressure on global bond yields, including U.S. Treasuries, which have become even more attractive to investors because of their relatively high yields. German 10-year bond yields recently fell below 0.40%, and comparable Japanese bonds hover around 0.30%. That makes the yield on 10-year Treasuries look downright generous. Fully 45% of government bonds issued around the world are yielding less than 1.0%, according to a report by Bank of America Merrill Lynch.
Demand for bonds from pension plans has accelerated as they seek to match long-term liabilities with high-quality long-duration bonds.
Foreign buyers and pension funds are aware of this trend and are acting on it. In November, the total amount of U.S. Treasuries owned by foreign investors hit a record high of $6.1 trillion. Demand for bonds from pension plans has accelerated as they seek to match long-term liabilities with high-quality long-duration bonds. In addition, stricter regulatory requirements are forcing banks and insurance companies to increase their Treasury purchases. Altogether, these trends have produced a serious shortfall in the global supply of bonds. J.P. Morgan estimates that global demand for bonds of all types will outstrip supply by roughly $460 billion a year.
The fear trade
Another factor weighing on interest rates is what investors sometimes call the “fear trade.” Demand for perceived safe-haven assets such as Treasuries and high-grade corporate bonds, soars whenever geopolitical tensions flare up. With the U.S. slowly reducing its role as world policeman, 2014 had no shortage of armed disputes. Major events included Russia’s invasion of Ukrainian territory in the Crimean Peninsula, renewed fighting between Israel and Hamas in the Gaza Strip, and the emergence of an al-Qaeda splinter group known as the Islamic State in Iraq and Syria (ISIS). Market volatility increased dramatically in May when the Ukrainian crisis erupted, and again in September as U.S. fighter jets bombed suspected ISIS strongholds in Syria.
“The fact is, the world is riper now for geopolitical risk than it has been since the end of the Cold War,” says David Hoag, a portfolio manager with The Bond Fund of America. “With the U.S. stepping back, the world becomes a
| 10 | The Bond Fund of America |
much more dangerous place. That is the most difficult part of the outlook to assess. If two events move against us — let’s say Europe falls into recession and there is another geopolitical crisis — then my interest rate outlook changes significantly. The Fed could be forced to delay its timetable.”
The long view
Over the long term, however, rising interest rates — particularly in a market starved for yield — are not necessarily a bad thing. In this environment, existing bonds will lose some value in the short term, but newly issued bonds will offer better yields and, ultimately, higher total return opportunities. Especially among short-dated bonds that pay almost nothing today, “It would be like bringing oxygen back into the market,” David says.
As the financial markets enter a new year, investors should keep in mind why they hold bonds in the first place: to preserve capital and provide income in a diversified portfolio. With U.S. equity valuations arguably at lofty levels, the importance of owning low-risk, non-correlated assets becomes even more evident.
“It is always important to stay invested in bonds, even if you think rates are going up,” adds John Smet. “High-quality bonds provide a degree of safety and diversification that cannot be found elsewhere in the markets. Bonds can provide a measure of protection in times of trouble and uncertainty.” n

Our view of the bond market:
| • | Falling interest rates and moderate inflation provided support for bond prices in 2014. We expect that environment to change this year as the Federal Reserve contemplates raising short-term interest rates for the first time since 2006. |
| | |
| • | Rates are likely to move higher, though perhaps not as high or as fast as many investors expect. While the U.S. economy is clearly improving, signs of slowing economic growth in Asia and Europe could combine to keep rates from climbing too fast. |
| | |
| • | We see more headwinds than tailwinds, which could result in higher bond market volatility, particularly as the U.S. moves to tighten monetary policy. |
The impact on investors:
| • | Expect a difficult market for bonds if rates move higher, but there also may be periods of global economic weakness, geopolitical conflict or other unexpected events when bond prices will rally. |
| | |
| • | With fewer attractive investment opportunities, security selection and downside protection will be paramount. Opportunities may arise in lesser-known areas of the bond market, such as asset-backed securities. |
| | |
| • | Rising interest rates should not dissuade investors from participating in the fixed-income markets. Bonds are an important diversification tool that should help mitigate losses during stock market downturns and periods of economic uncertainty. |
| The Bond Fund of America | 11 |
Summary investment portfolio December 31, 2014
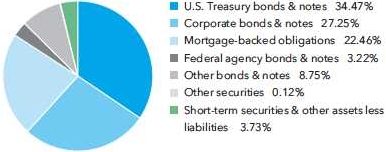
| Portfolio quality summary* | Percent of
net assets |
| U.S. Treasury and agency† | | | 37.69 | % |
| AAA/Aaa | | | 23.27 | |
| AA/Aa | | | 6.46 | |
| A/A | | | 12.83 | |
| BBB/Baa | | | 13.31 | |
| Below investment grade | | | 2.30 | |
| Unrated | | | 0.27 | |
| Other | | | 0.14 | |
| Short-term securities & other assets less liabilities | | | 3.73 | |
| * | Bond ratings, which typically range from AAA/Aaa (highest) to D (lowest), are assigned by credit rating agencies such as Standard & Poor’s, Moody’s and/or Fitch as an indication of an issuer’s creditworthiness. In assigning a credit rating to a security, the fund looks specifically to the ratings assigned to the issuer of the security by Standard & Poor’s, Moody’s and/or Fitch. If agency ratings differ, the security will be considered to have received the highest of those ratings, consistent with the fund’s investment policies. Securities in the “unrated” category (above) have not been rated by a rating agency; however, the investment adviser performs its own credit analysis and assigns comparable ratings that are used for compliance with the fund’s investment policies. The ratings are not covered by the Report of Independent Registered Public Accounting Firm. |
| † | These securities are guaranteed by the full faith and credit of the United States government. |
Bonds, notes & other debt
instruments 96.15% | | Principal amount
(000) | | | Value
(000) | |
| U.S. Treasury bonds & notes 34.47% | | | | | | |
| U.S. Treasury 27.98 % | | | | | | | | |
| U.S. Treasury 0.75% 2017 | | $ | 107,671 | | | $ | 107,267 | |
| U.S. Treasury 0.875% 2017 | | | 210,200 | | | | 210,480 | |
| U.S. Treasury 1.25% 2018 | | | 540,350 | | | | 536,886 | |
| U.S. Treasury 1.25% 2018 | | | 245,500 | | | | 243,715 | |
| U.S. Treasury 1.375% 2018 | | | 106,750 | | | | 106,859 | |
| U.S. Treasury 1.50% 2019 | | | 746,076 | | | | 744,382 | |
| U.S. Treasury 1.50% 2019 | | | 421,040 | | | | 418,324 | |
| U.S. Treasury 1.50% 2019 | | | 343,559 | | | | 341,371 | |
| U.S. Treasury 1.50% 2019 | | | 104,025 | | | | 104,082 | |
| U.S. Treasury 1.625% 2019 | | | 764,450 | | | | 765,704 | |
| U.S. Treasury 1.625% 2019 | | | 287,750 | | | | 287,433 | |
| U.S. Treasury 1.625% 2019 | | | 267,725 | | | | 268,437 | |
| U.S. Treasury 1.625% 2019 | | | 205,295 | | | | 205,511 | |
| U.S. Treasury 1.75% 2019 | | | 386,188 | | | | 388,389 | |
| U.S. Treasury 2.00% 2021 | | | 152,000 | | | | 152,439 | |
| U.S. Treasury 2.125% 2021 | | | 119,000 | | | | 120,211 | |
| U.S. Treasury 2.25% 2021 | | | 309,300 | | | | 315,789 | |
| U.S. Treasury 2.25% 2021 | | | 90,550 | | | | 92,326 | |
| U.S. Treasury 2.25% 2024 | | | 154,426 | | | | 155,536 | |
| U.S. Treasury 2.375% 2024 | | | 225,000 | | | | 229,113 | |
| U.S. Treasury 6.875% 2025 | | | 77,500 | | | | 112,012 | |
| U.S. Treasury 4.50% 2036 | | | 84,207 | | | | 112,469 | |
| U.S. Treasury 2.875% 2043 | | | 131,220 | | | | 134,285 | |
| U.S. Treasury 3.625% 2043 | | | 114,200 | | | | 134,363 | |
| U.S. Treasury 3.75% 2043 | | | 90,000 | | | | 108,232 | |
| U.S. Treasury 3.00% 2044 | | | 128,589 | | | | 135,129 | |
| U.S. Treasury 3.625% 2044 | | | 120,250 | | | | 141,585 | |
| U.S. Treasury 0.25%–8.75% 2015–20441 | | | 1,119,197 | | | | 1,151,942 | |
| | | | | | | | 7,824,271 | |
| 12 | The Bond Fund of America |
| | | Principal amount
(000) | | | Value
(000) | |
| U.S. Treasury inflation-protected securities 6.49 % | | | | | | | | |
| U.S. Treasury Inflation-Protected Security 0.50% 20152 | | $ | 164,936 | | | $ | 162,794 | |
| U.S. Treasury Inflation-Protected Security 1.625% 20152 | | | 112,685 | | | | 112,481 | |
| U.S. Treasury Inflation-Protected Security 0.125% 20192 | | | 168,980 | | | | 167,465 | |
| U.S. Treasury Inflation-Protected Security 0.125% 20242 | | | 208,106 | | | | 201,369 | |
| U.S. Treasury Inflation-Protected Security 0.625% 20242 | | | 256,730 | | | | 259,051 | |
| U.S. Treasury Inflation-Protected Security 1.375% 20442 | | | 373,313 | | | | 426,681 | |
| U.S. Treasury Inflation-Protected Security 0.13%–2.80% 2015–20432 | | | 485,881 | | | | 486,610 | |
| | | | | | | | 1,816,451 | |
| | | | | | | | | |
| Total U.S. Treasury bonds & notes | | | | | | | 9,640,722 | |
| | | | | | | | | |
| Corporate bonds & notes 27.25% | | | | | | | | |
| | | | | | | | | |
| Financials 7.75% | | | | | | | | |
| Other securities | | | | | | | 2,167,735 | |
| | | | | | | | | |
| Energy 3.40% | | | | | | | | |
| Other securities | | | | | | | 950,426 | |
| | | | | | | | | |
| Health care 3.40% | | | | | | | | |
| Other securities | | | | | | | 949,737 | |
| | | | | | | | | |
| Utilities 2.98 % | | | | | | | | |
| Other securities | | | | | | | 833,347 | |
| | | | | | | | | |
| Consumer discretionary 2.80% | | | | | | | | |
| Other securities | | | | | | | 783,444 | |
| | | | | | | | | |
| Consumer staples 2.52% | | | | | | | | |
| Other securities | | | | | | | 704,152 | |
| | | | | | | | | |
| Industrials 1.73% | | | | | | | | |
| Other securities | | | | | | | 483,707 | |
| | | | | | | | | |
| Telecommunication services 1.45% | | | | | | | | |
| Other securities | | | | | | | 405,708 | |
| | | | | | | | | |
| Materials 0.78% | | | | | | | | |
| Other securities | | | | | | | 219,545 | |
| | | | | | | | | |
| Information technology 0.44% | | | | | | | | |
| Other securities | | | | | | | 124,297 | |
| | | | | | | | | |
| Total corporate bonds & notes | | | | | | | 7,622,098 | |
| | | | | | | | | |
| Mortgage-backed obligations 22.46% | | | | | | | | |
| Federal agency mortgage-backed obligations 17.16% | | | | | | | | |
| Fannie Mae 3.50% 20453,4 | | | 822,956 | | | | 857,523 | |
| Fannie Mae 3.50% 20453,4 | | | 136,300 | | | | 141,652 | |
| Fannie Mae 4.00% 20453,4 | | | 377,840 | | | | 402,117 | |
| Fannie Mae 4.50% 20453,4 | | | 552,547 | | | | 598,703 | |
| Fannie Mae 4.50% 20453,4 | | | 522,039 | | | | 566,625 | |
| Fannie Mae 0%–11.03% 2017–20473,4,5 | | | 858,679 | | | | 915,343 | |
| Freddie Mac 0%–7.50% 2019–20473,4,5 | | | 390,356 | | | | 425,802 | |
| Government National Mortgage Assn. 4.00% 20443 | | | 374,226 | | | | 402,100 | |
| Government National Mortgage Assn. 4.00% 20443 | | | 188,387 | | | | 202,337 | |
| Government National Mortgage Assn. 4.00% 20443 | | | 114,019 | | | | 122,356 | |
| Government National Mortgage Assn. 2.50%–10.00% 2021–20443 | | | 144,872 | | | | 157,234 | |
| Other securities | | | | | | | 5,813 | |
| | | | | | | | 4,797,605 | |
| The Bond Fund of America | 13 |
Bonds, notes & other debt
instruments (continued) | | Principal amount
(000) | | | Value
(000) | |
| Mortgage-backed obligations (continued) | | | | | | | | |
| Other 5.30% | | | | | | | | |
| Other securities | | | | | | $ | 1,484,103 | |
| | | | | | | | | |
| Total mortgage-backed obligations | | | | | | | 6,281,708 | |
| | | | | | | | | |
| Federal agency bonds & notes 3.22% | | | | | | | | |
| Fannie Mae 0.48%–7.13% 2015–20303,5 | | $ | 246,619 | | | | 254,308 | |
| Federal Home Loan Bank 2.13%–5.50% 2016–2036 | | | 64,145 | | | | 67,641 | |
| Freddie Mac 0.50%–4.88% 2016–20243,5 | | | 279,354 | | | | 284,245 | |
| Other securities | | | | | | | 295,599 | |
| | | | | | | | 901,793 | |
| Other 8.75% | | | | | | | | |
| Other securities | | | | | | | 2,445,072 | |
| | | | | | | | | |
| Total bonds, notes & other debt instruments (cost: $26,248,949,000) | | | | | | | 26,891,393 | |
| | | | | | | | | |
| Convertible stocks 0.04% | | | Shares | | | | | |
| Industrials 0.04% | | | | | | | | |
| Other securities | | | | | | | 11,728 | |
| | | | | | | | | |
| Total convertible stocks (cost: $13,570,000) | | | | | | | 11,728 | |
| | | | | | | | | |
| Preferred securities 0.02% | | | | | | | | |
| U.S. government agency securities 0.02% | | | | | | | | |
| Other securities | | | | | | | 4,270 | |
| | | | | | | | | |
| Total preferred securities (cost: $5,820,000) | | | | | | | 4,270 | |
| | | | | | | | | |
| Common stocks 0.06% | | | | | | | | |
| Other 0.06 % | | | | | | | | |
| Other securities | | | | | | | 17,968 | |
| | | | | | | | | |
| Total common stocks (cost: $70,281,000) | | | | | | | 17,968 | |
| | | | | | | | | |
| Rights & warrants 0.00% | | | | | | | | |
| | | | | | | | | |
| Energy 0.00 % | | | | | | | | |
| Other securities | | | | | | | 11 | |
| | | | | | | | | |
| Total rights & warrants (cost: $672,000) | | | | | | | 11 | |
| | | | | | | | | |
| Short-term securities 12.33% | | Principal amount
(000) | | | | | |
| Chariot Funding, LLC 0.22%–0.27% due 4/23/2015–8/17/20156 | | $ | 66,200 | | | | 66,125 | |
| Chevron Corp. 0.08%–0.14% due 1/13/2015–4/10/20156 | | | 145,200 | | | | 145,169 | |
| Coca-Cola Co. 0.14%–0.19% due 1/12/2015–5/12/20156 | | | 117,300 | | | | 117,266 | |
| Fannie Mae 0.07%–0.14% due 2/17/2015–7/1/2015 | | | 361,800 | | | | 361,638 | |
| Federal Farm Credit Banks 0.11%–0.13% due 2/6/2015–8/5/2015 | | | 183,200 | | | | 183,151 | |
| Federal Home Loan Bank 0.07%–0.16% due 2/6/2015–9/9/2015 | | | 1,032,700 | | | | 1,032,325 | |
| Freddie Mac 0.09%–0.16% due 1/8/2015–8/18/2015 | | | 1,047,762 | | | | 1,047,367 | |
| General Electric Capital Corp. 0.19%–0.20% due 4/2/2015–5/5/2015 | | | 125,000 | | | | 124,946 | |
| 14 | The Bond Fund of America |
| | | Principal amount
(000) | | | Value
(000) | |
| Jupiter Securitization Co., LLC 0.21% due 5/5/20156 | $ | 25,000 | | $ | 24,980 | |
| Procter & Gamble Co. 0.12%–0.15% due 1/7/2015–3/3/20156 | | 90,300 | | | 90,288 | |
| Other securities | | | | | 254,676 | |
| | | | | | | |
| Total short-term securities (cost: $3,447,672,000) | | | | | 3,447,931 | |
| Total investment securities 108.60% (cost: $29,786,964,000) | | | | | 30,373,301 | |
| Other assets less liabilities (8.60)% | | | | | (2,404,889 | ) |
| | | | | | | |
| Net assets 100.00% | | | | $ | 27,968,412 | |
This summary investment portfolio is designed to streamline the report and help investors better focus on the fund’s principal holdings. See the inside back cover for details on how to obtain a complete schedule of portfolio holdings.
“Other securities” includes all issues that are not disclosed separately in the summary investment portfolio, including securities which were valued under fair value procedures adopted by authority of the board of trustees. The total value of securities which were valued under fair value procedures was $85,124,000, which represented .30% of the net assets of the fund. Some of these securities (with an aggregate value of $4,694,000, an aggregate cost of $31,919,000, and which represented .02% of the net assets of the fund) were acquired from 3/10/2010 to 10/25/2012 through private placement transactions exempt from registration under the Securities Act of 1933, which may subject them to legal or contractual restrictions on resale. “Other securities” also includes loan participations and assignments which may be subject to legal or contractual restrictions on resale. The total value of all such loans was $61,692,000, which represented ..22% of the net assets of the fund.
Forward currency contracts
The fund has entered into forward currency contracts as shown in the following table. The average notional amount of open forward currency contracts was $327,954,000 over the prior 12-month period.
| | | | | | | Contract amount | | Unrealized
appreciation
(depreciation) | |
| | | Settlement date | | Counterparty | | Receive
(000) | | Deliver
(000) | | at 12/31/2014
(000) | |
| Sales: | | | | | | | | | | | | |
| Australian dollars | | 1/12/2015 | | Bank of America, N.A. | | $8,263 | | A$ 10,000 | | | $106 | |
| Brazilian reais | | 1/9/2015 | | Barclays Bank PLC | | $2,439 | | BRL5,975 | | | 196 | |
| Brazilian reais | | 1/12/2015 | | Citibank | | $7,205 | | BRL18,970 | | | 91 | |
| Brazilian reais | | 1/16/2015 | | Citibank | | $6,790 | | BRL17,675 | | | 169 | |
| Brazilian reais | | 1/16/2015 | | UBS AG | | $3,500 | | BRL9,438 | | | (35 | ) |
| British pounds | | 1/8/2015 | | UBS AG | | $5,275 | | £3,365 | | | 31 | |
| British pounds | | 1/22/2015 | | Bank of New York Mellon | | $1,879 | | £1,200 | | | 9 | |
| British pounds | | 1/29/2015 | | Bank of America, N.A. | | $6,140 | | £3,900 | | | 63 | |
| Colombian pesos | | 1/8/2015 | | Citibank | | $12,879 | | COP27,951,025 | | | 1,120 | |
| Colombian pesos | | 1/23/2015 | | UBS AG | | $986 | | COP2,400,000 | | | (24 | ) |
| Colombian pesos | | 1/27/2015 | | Barclays Bank PLC | | $6,789 | | COP16,357,000 | | | (89 | ) |
| Euros | | 1/8/2015 | | JPMorgan Chase | | $83,479 | | €67,700 | | | 1,551 | |
| Euros | | 1/12/2015 | | UBS AG | | $27,459 | | €22,280 | | | 495 | |
| Euros | | 1/14/2015 | | JPMorgan Chase | | $10,867 | | €8,700 | | | 337 | |
| Euros | | 1/16/2015 | | Bank of America, N.A. | | $2,786 | | €2,250 | | | 63 | |
| Euros | | 1/16/2015 | | Bank of America, N.A. | | $98 | | €80 | | | 2 | |
| Euros | | 1/22/2015 | | Bank of New York Mellon | | $15,656 | | €12,750 | | | 224 | |
| Euros | | 1/22/2015 | | Barclays Bank PLC | | $9,462 | | €7,700 | | | 143 | |
| Euros | | 1/29/2015 | | UBS AG | | $8,165 | | €6,700 | | | 55 | |
| Euros | | 1/29/2015 | | UBS AG | | $8,583 | | €7,050 | | | 49 | |
| Euros | | 2/6/2015 | | JPMorgan Chase | | $6,069 | | €4,834 | | | 218 | |
| Mexican pesos | | 1/14/2015 | | Barclays Bank PLC | | $11,593 | | MXN157,995 | | | 893 | |
| Mexican pesos | | 2/23/2015 | | HSBC Bank | | $20,393 | | MXN279,600 | | | 1,505 | |
| Russian rubles | | 1/16/2015 | | JPMorgan Chase | | $11,986 | | RUB652,400 | | | 1,348 | |
| Russian rubles | | 1/16/2015 | | Citibank | | $1,500 | | RUB81,675 | | | 168 | |
| Turkish lira | | 1/22/2015 | | Citibank | | $950 | | TRY2,275 | | | (19 | ) |
| | | | | | | | | | | | $8,669 | |
| The Bond Fund of America | 15 |
Interest rate swaps
The fund has entered into interest rate swaps as shown in the following table. The average notional amount of interest rate swaps was $3,097,778,000 over the prior 12-month period.
Pay/receive
fixed rate | | Clearinghouse | | Floating rate
index | | Fixed
rate | | | Expiration date | | Notional amount (000) | | Unrealized
(depreciation)
appreciation
at 12/31/2014
(000) | |
| Pay | | LCH.Clearnet | | 3-month USD-LIBOR | | 0.796 | % | | 9/24/2016 | | $180,000 | | $ | (88 | ) |
| Pay | | LCH.Clearnet | | 3-month USD-LIBOR | | 0.7875 | | | 9/29/2016 | | 225,550 | | | (58 | ) |
| Pay | | LCH.Clearnet | | 3-month USD-LIBOR | | 0.644 | | | 10/27/2016 | | 80,000 | | | 234 | |
| Pay | | LCH.Clearnet | | 3-month USD-LIBOR | | 0.6365 | | | 10/29/2016 | | 102,000 | | | 322 | |
| Pay | | LCH.Clearnet | | 3-month USD-LIBOR | | 0.6425 | | | 10/30/2016 | | 107,000 | | | 324 | |
| Pay | | LCH.Clearnet | | 3-month USD-LIBOR | | 0.896 | | | 12/31/2016 | | 900,000 | | | (216 | ) |
| Pay | | LCH.Clearnet | | 3-month USD-LIBOR | | 0.8935 | | | 1/2/2017 | | 16,000 | | | — | |
| Pay | | LCH.Clearnet | | 3-month USD-LIBOR | | 1.1625 | | | 9/2/2017 | | 185,000 | | | 43 | |
| Pay | | LCH.Clearnet | | 3-month USD-LIBOR | | 1.1375 | | | 11/6/2017 | | 430,000 | | | 1,183 | |
| Pay | | LCH.Clearnet | | 3-month USD-LIBOR | | 1.139 | | | 11/6/2017 | | 344,700 | | | 934 | |
| Pay | | LCH.Clearnet | | 3-month USD-LIBOR | | 1.0925 | | | 12/2/2017 | | 16,000 | | | 78 | |
| Pay | | LCH.Clearnet | | 3-month USD-LIBOR | | 1.2125 | | | 12/16/2017 | | 300,000 | | | 549 | |
| Pay | | LCH.Clearnet | | 3-month USD-LIBOR | | 1.322 | | | 1/14/2018 | | 60,000 | | | (32 | ) |
| Receive | | LCH.Clearnet | | 3-month USD-LIBOR | | 2.39925 | | | 12/30/2018 | | 229,000 | | | 582 | |
| Receive | | LCH.Clearnet | | 3-month USD-LIBOR | | 2.33 | | | 12/31/2018 | | 220,600 | | | 267 | |
| Receive | | LCH.Clearnet | | 3-month USD-LIBOR | | 1.789 | | | 6/20/2019 | | 202,700 | | | 1,103 | |
| Receive | | LCH.Clearnet | | 3-month USD-LIBOR | | 1.7945 | | | 6/20/2019 | | 126,700 | | | 720 | |
| Receive | | LCH.Clearnet | | 3-month USD-LIBOR | | 1.7905 | | | 6/20/2019 | | 50,600 | | | 278 | |
| Receive | | LCH.Clearnet | | 3-month USD-LIBOR | | 1.8065 | | | 7/29/2019 | | 210,000 | | | 1,142 | |
| Receive | | LCH.Clearnet | | 3-month USD-LIBOR | | 1.821 | | | 7/31/2019 | | 96,000 | | | 588 | |
| Receive | | LCH.Clearnet | | 3-month USD-LIBOR | | 1.799 | | | 8/8/2019 | | 100,000 | | | 487 | |
| Receive | | LCH.Clearnet | | 3-month USD-LIBOR | | 1.7725 | | | 8/11/2019 | | 128,000 | | | 458 | |
| Receive | | LCH.Clearnet | | 3-month USD-LIBOR | | 1.773 | | | 8/11/2019 | | 124,000 | | | 446 | |
| Receive | | LCH.Clearnet | | 3-month USD-LIBOR | | 1.956 | | | 9/24/2019 | | 40,000 | | | 442 | |
| Receive | | LCH.Clearnet | | 3-month USD-LIBOR | | 1.9225 | | | 9/25/2019 | | 120,000 | | | 1,140 | |
| Receive | | LCH.Clearnet | | 3-month USD-LIBOR | | 1.925 | | | 9/29/2019 | | 160,000 | | | 1,492 | |
| Receive | | LCH.Clearnet | | 3-month USD-LIBOR | | 1.619 | | | 10/24/2019 | | 100,000 | | | (514 | ) |
| Receive | | LCH.Clearnet | | 3-month USD-LIBOR | | 1.664 | | | 10/27/2019 | | 100,000 | | | (313 | ) |
| Receive | | LCH.Clearnet | | 3-month USD-LIBOR | | 1.669 | | | 10/28/2019 | | 240,000 | | | (694 | ) |
| Receive | | LCH.Clearnet | | 3-month USD-LIBOR | | 1.649 | | | 10/29/2019 | | 120,000 | | | (456 | ) |
| Receive | | LCH.Clearnet | | 3-month USD-LIBOR | | 1.675 | | | 10/30/2019 | | 38,000 | | | (98 | ) |
| Receive | | LCH.Clearnet | | 3-month USD-LIBOR | | 1.7725 | | | 11/14/2019 | | 256,047 | | | 397 | |
| Receive | | LCH.Clearnet | | 3-month USD-LIBOR | | 1.77 | | | 11/14/2019 | | 238,953 | | | 342 | |
| Pay | | LCH.Clearnet | | 3-month USD-LIBOR | | 1.8215 | | | 12/10/2019 | | 11,000 | | | (37 | ) |
| Receive | | LCH.Clearnet | | 3-month USD-LIBOR | | 1.66 | | | 12/19/2019 | | 22,000 | | | (102 | ) |
| Receive | | LCH.Clearnet | | 3-month USD-LIBOR | | 1.785 | | | 1/2/2020 | | 80,000 | | | 78 | |
| Pay | | LCH.Clearnet | | 3-month USD-LIBOR | | 2.279 | | | 3/14/2021 | | 20,000 | | | (398 | ) |
| Pay | | LCH.Clearnet | | 3-month USD-LIBOR | | 2.1892 | | | 8/13/2021 | | 50,000 | | | (610 | ) |
| Pay | | LCH.Clearnet | | 6-month EURIBOR | | 0.544 | | | 12/31/2021 | | 30,000 | | | (47 | ) |
| Pay | | LCH.Clearnet | | 3-month USD-LIBOR | | 2.95 | | | 1/21/2024 | | 30,000 | | | (1,842 | ) |
| Pay | | LCH.Clearnet | | 3-month USD-LIBOR | | 2.942 | | | 1/24/2024 | | 15,000 | | | (912 | ) |
| Pay | | LCH.Clearnet | | 3-month USD-LIBOR | | 2.82125 | | | 4/11/2024 | | 97,000 | | | (4,892 | ) |
| Pay | | LCH.Clearnet | | 3-month USD-LIBOR | | 2.736 | | | 4/17/2024 | | 20,000 | | | (862 | ) |
| Pay | | LCH.Clearnet | | 3-month USD-LIBOR | | 2.633 | | | 5/23/2024 | | 9,330 | | | (317 | ) |
| Pay | | LCH.Clearnet | | 3-month USD-LIBOR | | 2.7455 | | | 6/19/2024 | | 45,000 | | | (1,963 | ) |
| Pay | | LCH.Clearnet | | 3-month USD-LIBOR | | 2.661 | | | 6/27/2024 | | 12,000 | | | (434 | ) |
| Pay | | LCH.Clearnet | | 3-month USD-LIBOR | | 2.608 | | | 7/24/2024 | | 200,000 | | | (6,276 | ) |
| Pay | | LCH.Clearnet | | 3-month USD-LIBOR | | 2.683 | | | 8/4/2024 | | 54,000 | | | (2,043 | ) |
| Pay | | LCH.Clearnet | | 3-month USD-LIBOR | | 2.4915 | | | 8/19/2024 | | 5,000 | | | (104 | ) |
| Pay | | LCH.Clearnet | | 3-month USD-LIBOR | | 2.5315 | | | 9/8/2024 | | 8,600 | | | (207 | ) |
| Pay | | LCH.Clearnet | | 3-month USD-LIBOR | | 2.645 | | | 9/29/2024 | | 51,125 | | | (1,736 | ) |
| Pay | | LCH.Clearnet | | 6-month EURIBOR | | 0.9852 | | | 10/17/2024 | | 20,000 | | | (455 | ) |
| Pay | | LCH.Clearnet | | 3-month USD-LIBOR | | 2.415 | | | 10/27/2024 | | 40,000 | | | (527 | ) |
| Pay | | LCH.Clearnet | | 3-month USD-LIBOR | | 2.421 | | | 10/30/2024 | | 95,000 | | | (1,320 | ) |
| Pay | | LCH.Clearnet | | 3-month USD-LIBOR | | 2.526 | | | 11/10/2024 | | 49,350 | | | (1,135 | ) |
| Pay | | LCH.Clearnet | | 3-month USD-LIBOR | | 2.2325 | | | 12/19/2024 | | 10,000 | | | 42 | |
| Pay | | LCH.Clearnet | | 3-month USD-LIBOR | | 3.008 | | | 12/30/2024 | | 103,500 | | | (653 | ) |
| Pay | | LCH.Clearnet | | 3-month USD-LIBOR | | 2.9125 | | | 12/31/2024 | | 99,000 | | | (224 | ) |
| Pay | | LCH.Clearnet | | 3-month USD-LIBOR | | 2.86625 | | | 1/6/2025 | | 122,000 | | | — | |
| 16 | The Bond Fund of America |
| Pay/receive fixed rate | | Clearinghouse | | Floating rate
index | | Fixed
rate | | | Expiration date | | Notional amount
(000) | | Unrealized
(depreciation)
appreciation
at 12/31/2014
(000) | |
| Pay | | LCH.Clearnet | | 3-month USD-LIBOR | | 2.864 | % | | 1/6/2025 | | $15,500 | | $ | — | |
| Pay | | LCH.Clearnet | | 6-month EURIBOR | | 1.4385 | | | 11/6/2029 | | 17,100 | | | (905 | ) |
| Receive | | LCH.Clearnet | | 3-month USD-LIBOR | | 3.4275 | | | 4/11/2034 | | 72,000 | | | 9,302 | |
| Receive | | LCH.Clearnet | | 3-month USD-LIBOR | | 3.76 | | | 1/21/2044 | | 15,000 | | | 3,366 | |
| Pay | | LCH.Clearnet | | 3-month USD-LIBOR | | 3.635 | | | 3/24/2044 | | 17,000 | | | (3,378 | ) |
| Receive | | LCH.Clearnet | | 3-month USD-LIBOR | | 3.5475 | | | 4/11/2044 | | 3,500 | | | 632 | |
| Receive | | LCH.Clearnet | | 3-month USD-LIBOR | | 3.51 | | | 4/23/2044 | | 15,000 | | | 2,590 | |
| Pay | | LCH.Clearnet | | 3-month USD-LIBOR | | 3.3535 | | | 6/27/2044 | | 14,000 | | | (1,957 | ) |
| Pay | | LCH.Clearnet | | 3-month USD-LIBOR | | 3.34 | | | 6/27/2044 | | 70,000 | | | (9,584 | ) |
| Pay | | LCH.Clearnet | | 3-month USD-LIBOR | | 3.206 | | | 7/31/2044 | | 24,000 | | | (2,614 | ) |
| Pay | | LCH.Clearnet | | 3-month USD-LIBOR | | 3.238 | | | 8/8/2044 | | 25,000 | | | (2,884 | ) |
| Pay | | LCH.Clearnet | | 3-month USD-LIBOR | | 3.2635 | | | 9/24/2044 | | 12,000 | | | (1,452 | ) |
| Pay | | LCH.Clearnet | | 3-month USD-LIBOR | | 3.014 | | | 10/29/2044 | | 18,000 | | | (1,223 | ) |
| Pay | | LCH.Clearnet | | 3-month USD-LIBOR | | 3.035 | | | 10/30/2044 | | 3,000 | | | (218 | ) |
| Pay | | LCH.Clearnet | | 6-month EURIBOR | | 1.6397 | | | 10/31/2044 | | 21,400 | | | (1,216 | ) |
| Receive | | LCH.Clearnet | | 3-month USD-LIBOR | | 2.9255 | | | 11/28/2044 | | 50,000 | | | 2,444 | |
| Pay | | LCH.Clearnet | | 3-month USD-LIBOR | | 2.9005 | | | 12/2/2044 | | 5,000 | | | (217 | ) |
| Receive | | LCH.Clearnet | | 3-month USD-LIBOR | | 2.9715 | | | 12/4/2044 | | 47,200 | | | 2,765 | |
| Receive | | LCH.Clearnet | | 3-month USD-LIBOR | | 2.933 | | | 12/8/2044 | | 35,000 | | | 1,761 | |
| Pay | | LCH.Clearnet | | 3-month USD-LIBOR | | 2.7045 | | | 1/2/2045 | | 33,000 | | | (33 | ) |
| | | | | | | | | | | | | | $ | (18,715 | ) |
Credit default swaps
The fund has entered into a credit default swap as shown in the following table. The average notional amount of credit default swaps was $49,800,000 over the prior five-month period.
Centrally cleared credit default swaps on credit indices — buy protection
| Referenced index | | Clearinghouse | | Pay
fixed rate | | | Expiration
date | | Notional
amount
(000) | | Unrealized
depreciation
at 12/31/2014
(000) | |
| CDX North American High Yield Index Series 23 | | Intercontinental Exchange, Inc. | | 5.00 | % | | 12/20/2019 | | | $50,000 | | | $(177 | ) |
The following footnotes apply to either the individual securities noted or one or more of the securities aggregated and listed as a single line item.
| 1 | A portion of this security was pledged as collateral. The total value of pledged collateral was $30,142,000, which represented .10% of the net assets of the fund. |
| 2 | Index-linked bond whose principal amount moves with a government price index. |
| 3 | Principal payments may be made periodically. Therefore, the effective maturity date may be earlier than the stated maturity date. |
| 4 | A portion or all of the security purchased on a TBA basis. |
| 5 | Coupon rate may change periodically. |
| 6 | Acquired in a transaction exempt from registration under Rule 144A or Section 4(2) of the Securities Act of 1933. May be resold in the U.S. in transactions exempt from registration, normally to qualified institutional buyers. The total value of all such securities, including those in “Other securities,” was $3,373,234,000, which represented 12.06% of the net assets of the fund. |
Key to abbreviations and symbols
TBA = To be announced
A$ = Australian dollars
BRL = Brazilian reais
COP = Colombian pesos
€ = Euros
£ = British pounds
MXN = Mexican pesos
RUB = Russian rubles
TRY = Turkish lira
See Notes to Financial Statements
| The Bond Fund of America | 17 |
Financial statements
| Statement of assets and liabilities | | | | | | | | |
| at December 31, 2014 | | (dollars in thousands) | |
| | | | | | | | | |
| Assets: | | | | | | | | |
| Investment securities, at value (cost: $29,786,964) | | | | | | $ | 30,373,301 | |
| Cash denominated in currencies other than U.S. dollars (cost: $1,907) | | | | | | | 1,910 | |
| Unrealized appreciation on open forward currency contracts | | | | | | | 8,836 | |
| Receivables for: | | | | | | | | |
| Sales of investments | | $ | 2,807,687 | | | | | |
| Sales of fund’s shares | | | 74,451 | | | | | |
| Closed forward currency contracts | | | 1,137 | | | | | |
| Variation margin | | | 1,343 | | | | | |
| Dividends and interest | | | 163,456 | | | | 3,048,074 | |
| | | | | | | | 33,432,121 | |
| Liabilities: | | | | | | | | |
| Unrealized depreciation on open forward currency contracts | | | | | | | 167 | |
| Payables for: | | | | | | | | |
| Purchases of investments | | | 5,403,284 | | | | | |
| Repurchases of fund’s shares | | | 37,033 | | | | | |
| Dividends on fund’s shares | | | 2,065 | | | | | |
| Closed forward currency contracts | | | 199 | | | | | |
| Investment advisory services | | | 4,421 | | | | | |
| Services provided by related parties | | | 11,436 | | | | | |
| Trustees’ deferred compensation | | | 762 | | | | | |
| Bank overdraft | | | 3,355 | | | | | |
| Other | | | 987 | | | | 5,463,542 | |
| Net assets at December 31, 2014 | | | | | | $ | 27,968,412 | |
| | | | | | | | | |
| Net assets consist of: | | | | | | | | |
| Capital paid in on shares of beneficial interest | | | | | | $ | 29,200,223 | |
| Undistributed net investment income | | | | | | | 9,730 | |
| Accumulated net realized loss | | | | | | | (1,816,780 | ) |
| Net unrealized appreciation | | | | | | | 575,239 | |
| Net assets at December 31, 2014 | | | | | | $ | 27,968,412 | |
(dollars and shares in thousands, except per-share amounts)
Shares of beneficial interest issued and outstanding (no stated par value) —
unlimited shares authorized (2,183,603 total shares outstanding)
| | | | | | Shares | | | Net asset | |
| | | Net assets | | | outstanding | | | value per share | |
| Class A | | $ | 18,691,082 | | | | 1,459,286 | | | $ | 12.81 | |
| Class B | | | 165,960 | | | | 12,957 | | | | 12.81 | |
| Class C | | | 1,501,950 | | | | 117,263 | | | | 12.81 | |
| Class F-1 | | | 653,196 | | | | 50,997 | | | | 12.81 | |
| Class F-2 | | | 1,302,595 | | | | 101,698 | | | | 12.81 | |
| Class 529-A | | | 939,328 | | | | 73,337 | | | | 12.81 | |
| Class 529-B | | | 14,890 | | | | 1,162 | | | | 12.81 | |
| Class 529-C | | | 371,272 | | | | 28,987 | | | | 12.81 | |
| Class 529-E | | | 50,607 | | | | 3,951 | | | | 12.81 | |
| Class 529-F-1 | | | 66,283 | | | | 5,175 | | | | 12.81 | |
| Class R-1 | | | 55,467 | | | | 4,331 | | | | 12.81 | |
| Class R-2 | | | 606,449 | | | | 47,348 | | | | 12.81 | |
| Class R-2E | | | 162 | | | | 13 | | | | 12.81 | |
| Class R-3 | | | 730,564 | | | | 57,038 | | | | 12.81 | |
| Class R-4 | | | 479,608 | | | | 37,445 | | | | 12.81 | |
| Class R-5 | | | 207,414 | | | | 16,194 | | | | 12.81 | |
| Class R-6 | | | 2,131,585 | | | | 166,421 | | | | 12.81 | |
See Notes to Financial Statements
| 18 | The Bond Fund of America |
| Statement of operations | | | | | | |
| for the year ended December 31, 2014 | | (dollars in thousands) | |
| | | | |
| Investment income: | | | | | | | | |
| Income: | | | | | | | | |
| Interest (net of non-U.S. taxes of $332) | | $ | 742,549 | | | | | |
| Dividends | | | 381 | | | $ | 742,930 | |
| Fees and expenses*: | | | | | | | | |
| Investment advisory services | | | 53,390 | | | | | |
| Distribution services | | | 82,293 | | | | | |
| Transfer agent services | | | 40,093 | | | | | |
| Administrative services | | | 6,054 | | | | | |
| Reports to shareholders | | | 1,612 | | | | | |
| Registration statement and prospectus | | | 549 | | | | | |
| Trustees’ compensation | | | 277 | | | | | |
| Auditing and legal | | | 203 | | | | | |
| Custodian | | | 279 | | | | | |
| Other | | | 1,870 | | | | 186,620 | |
| Net investment income | | | | | | | 556,310 | |
| | | | | | | | | |
| Net realized gain and unrealized appreciation on investments, forward currency contracts, interest rate swaps, credit default swaps and currency: | | | | | | | | |
| Net realized gain (loss) on: | | | | | | | | |
| Investments (net of non-U.S. taxes of $149) | | | 554,932 | | | | | |
| Forward currency contracts | | | 28,262 | | | | | |
| Interest rate swaps | | | (24,764 | ) | | | | |
| Credit default swaps | | | (1,217 | ) | | | | |
| Currency transactions | | | (1,257 | ) | | | 555,956 | |
| Net unrealized (depreciation) appreciation on: | | | | | | | | |
| Investments (net of non-U.S. taxes of $20,178) | | | 336,517 | | | | | |
| Forward currency contracts | | | 11,593 | | | | | |
| Interest rate swaps | | | (18,787 | ) | | | | |
| Credit default swaps | | | (177 | ) | | | | |
| Currency translations | | | (752 | ) | | | 328,394 | |
| Net realized gain and unrealized appreciation on investments, forward currency contracts, interest rate swaps, credit default swaps and currency | | | | | | | 884,350 | |
| | | | | | | | | |
| Net increase in net assets resulting from operations | | | | | | $ | 1,440,660 | |
*Additional information related to class-specific fees and expenses is included in the Notes to Financial Statements.
See Notes to Financial Statements
| The Bond Fund of America | 19 |
| Statements of changes in net assets | | | | | | |
| | | (dollars in thousands) | |
| | | | |
| | | Year ended December 31 | |
| | | 2014 | | | 2013 | |
| | | | | | | | | |
| Operations: | | | | | | | | |
| Net investment income | | $ | 556,310 | | | $ | 615,380 | |
| Net realized gain on investments, forward currency contracts, interest rate swaps, credit default swaps and currency transactions | | | 555,956 | | | | 5,182 | |
| Net unrealized (depreciation) appreciation on investments, forward currency contracts, interest rate swaps, credit default swaps and currency translations | | | 328,394 | | | | (1,291,536 | ) |
| Net increase (decrease) in net assets resulting from operations | | | 1,440,660 | | | | (670,974 | ) |
| | | | | | | | | |
| Dividends paid or accrued to shareholders from net investment income | | | (565,791 | ) | | | (680,633 | ) |
| | | | | | | | | |
| Net capital share transactions | | | 81,839 | | | | (5,620,774 | ) |
| | | | | | | | | |
| Total increase (decrease) in net assets | | | 956,708 | | | | (6,972,381 | ) |
| | | | | | | | | |
| Net assets: | | | | | | | | |
| Beginning of year | | | 27,011,704 | | | | 33,984,085 | |
| End of year (including undistributed net investment income: $9,730 and $5,218, respectively) | | $ | 27,968,412 | | | $ | 27,011,704 | |
See Notes to Financial Statements
| 20 | The Bond Fund of America |
Notes to financial statements
1. Organization
The Bond Fund of America (the “fund”) is registered under the Investment Company Act of 1940 as an open-end, diversified investment company. The fund seeks as high a level of current income as is consistent with the preservation of capital.
The fund has 17 share classes consisting of five retail share classes (Classes A, B and C, as well as two F share classes, F-1 and F-2), five 529 college savings plan share classes (Classes 529-A, 529-B, 529-C, 529-E and 529-F-1) and seven retirement plan share classes (Classes R-1, R-2, R-2E, R-3, R-4, R-5 and R-6). The 529 college savings plan share classes can be used to save for college education. The retirement plan share classes are generally offered only through eligible employer-sponsored retirement plans. The fund’s share classes are described further in the following table:
| Share class | | Initial sales charge | | Contingent deferred sales
charge upon redemption | | Conversion feature |
| Classes A and 529-A | | Up to 3.75% | | None (except 1% for certain redemptions within one year of purchase without an initial sales charge) | | None |
| Classes B and 529-B* | | None | | Declines from 5% to 0% for redemptions within six years of purchase | | Classes B and 529-B convert to
Classes A and 529-A, respectively, after eight years |
| Class C | | None | | 1% for redemptions within one year of purchase | | Class C converts to Class F-1 after 10 years |
| Class 529-C | | None | | 1% for redemptions within one year of purchase | | None |
| Class 529-E | | None | | None | | None |
| Classes F-1, F-2 and 529-F-1 | | None | | None | | None |
| Classes R-1, R-2, R-2E, R-3, R-4, R-5 and R-6 | | None | | None | | None |
*Class B and 529-B shares of the fund are not available for purchase.
On August 29, 2014, the fund made an additional retirement plan share class (Class R-2E) available for sale pursuant to an amendment to its registration statement filed with the U.S. Securities and Exchange Commission. Refer to the fund’s prospectus for more details.
Holders of all share classes have equal pro rata rights to the assets, dividends and liquidation proceeds of the fund. Each share class has identical voting rights, except for the exclusive right to vote on matters affecting only its class. Share classes have different fees and expenses (“class-specific fees and expenses”), primarily due to different arrangements for distribution, transfer agent and administrative services. Differences in class-specific fees and expenses will result in differences in net investment income and, therefore, the payment of different per-share dividends by each share class.
2. Significant accounting policies
The fund is an investment company that applies the accounting and reporting guidance issued in Topic 946 by the U.S. Financial Accounting Standards Board. The fund’s financial statements have been prepared to comply with U.S. generally accepted accounting principles (“U.S. GAAP”). These principles require the fund’s investment adviser to make estimates and assumptions that affect reported amounts and disclosures. Actual results could differ from those estimates. The fund follows the significant accounting policies described in this section, as well as the valuation policies described in the next section on valuation.
Security transactions and related investment income — Security transactions are recorded by the fund as of the date the trades are executed with brokers. Realized gains and losses from security transactions are determined based on the specific identified cost of the securities. In the event a security is purchased with a delayed payment date, the fund will segregate liquid assets sufficient to meet its payment obligations. Dividend income is recognized on the ex-dividend date and interest income is recognized on an accrual basis. Market discounts, premiums and original issue discounts on fixed-income securities are amortized daily over the expected life of the security.
| The Bond Fund of America | 21 |
Class allocations — Income, fees and expenses (other than class-specific fees and expenses) are allocated daily among the various share classes based on the relative value of their settled shares. Realized and unrealized gains and losses are allocated daily among the various share classes based on their relative net assets. Class-specific fees and expenses, such as distribution, administrative and shareholder services, are charged directly to the respective share class.
Dividends and distributions to shareholders — Dividends to shareholders are declared daily after the determination of the fund’s net investment income and are paid to shareholders monthly. Distributions to shareholders are recorded on the ex-dividend date.
Currency translation — Assets and liabilities, including investment securities, denominated in currencies other than U.S. dollars are translated into U.S. dollars at the exchange rates supplied by one or more pricing vendors on the valuation date. Purchases and sales of investment securities and income and expenses are translated into U.S. dollars at the exchange rates on the dates of such transactions. The effects of changes in exchange rates on investment securities are included with the net realized gain or loss and net unrealized appreciation or depreciation on investments in the fund’s statement of operations. The realized gain or loss and unrealized appreciation or depreciation resulting from all other transactions denominated in currencies other than U.S. dollars are disclosed separately.
3. Valuation
Capital Research and Management Company (“CRMC”), the fund’s investment adviser, values the fund’s investments at fair value as defined by U.S. GAAP. The net asset value of each share class of the fund is generally determined as of approximately 4:00 p.m. New York time each day the New York Stock Exchange is open.
Methods and inputs — The fund’s investment adviser uses the following methods and inputs to establish the fair value of the fund’s assets and liabilities. Use of particular methods and inputs may vary over time based on availability and relevance as market and economic conditions evolve.
Equity securities are generally valued at the official closing price of, or the last reported sale price on, the exchange or market on which such securities are traded, as of the close of business on the day the securities are being valued or, lacking any sales, at the last available bid price. Prices for each security are taken from the principal exchange or market on which the security trades.
Fixed-income securities, including short-term securities, are generally valued at prices obtained from one or more pricing vendors. Vendors value such securities based on one or more of the inputs described in the following table. The table provides examples of inputs that are commonly relevant for valuing particular classes of fixed-income securities in which the fund is authorized to invest. However, these classifications are not exclusive, and any of the inputs may be used to value any other class of fixed-income security.
| Fixed-income class | | Examples of standard inputs |
| All | | Benchmark yields, transactions, bids, offers, quotations from dealers and trading systems, new issues, spreads and other relationships observed in the markets among comparable securities; and proprietary pricing models such as yield measures calculated using factors such as cash flows, financial or collateral performance and other reference data (collectively referred to as “standard inputs”) |
| Corporate bonds & notes; convertible securities | | Standard inputs and underlying equity of the issuer |
| Bonds & notes of governments & government agencies | | Standard inputs and interest rate volatilities |
| Mortgage-backed; asset-backed obligations | | Standard inputs and cash flows, prepayment information, default rates, delinquency and loss assumptions, collateral characteristics, credit enhancements and specific deal information |
| Municipal securities | | Standard inputs and, for certain distressed securities, cash flows or liquidation values using a net present value calculation based on inputs that include, but are not limited to, financial statements and debt contracts |
When the fund’s investment adviser deems it appropriate to do so (such as when vendor prices are unavailable or deemed to be not representative), fixed-income securities will be valued in good faith at the mean quoted bid and ask prices that are reasonably and timely available (or bid prices, if ask prices are not available) or at prices for securities of comparable maturity, quality and type.
Securities with both fixed-income and equity characteristics, or equity securities traded principally among fixed-income dealers, are generally valued in the manner described for either equity or fixed-income securities, depending on which method is deemed most appropriate by the fund’s investment adviser. Forward currency contracts are valued at the mean of representative quoted bid and ask
| 22 | The Bond Fund of America |
prices, generally based on prices supplied by one or more pricing vendors. Interest rate swaps are generally valued by pricing vendors based on market inputs that include the index and term of index, reset frequency, payer/receiver, currency and pay frequency. Credit default swaps are generally valued by pricing vendors based on market inputs that include the index and term of index, reset frequency, payer/receiver, currency and pay frequency.
Securities and other assets for which representative market quotations are not readily available or are considered unreliable by the fund’s investment adviser are fair valued as determined in good faith under fair valuation guidelines adopted by authority of the fund’s board of trustees as further described. The investment adviser follows fair valuation guidelines, consistent with U.S. Securities and Exchange Commission rules and guidance, to consider relevant principles and factors when making fair value determinations. The investment adviser considers relevant indications of value that are reasonably and timely available to it in determining the fair value to be assigned to a particular security, such as the type and cost of the security; contractual or legal restrictions on resale of the security; relevant financial or business developments of the issuer; actively traded similar or related securities; conversion or exchange rights on the security; related corporate actions; significant events occurring after the close of trading in the security; and changes in overall market conditions. In addition, the closing prices of equity securities that trade in markets outside U.S. time zones may be adjusted to reflect significant events that occur after the close of local trading but before the net asset value of each share class of the fund is determined. Fair valuations and valuations of investments that are not actively trading involve judgment and may differ materially from valuations that would have been used had greater market activity occurred.
Processes and structure — The fund’s board of trustees has delegated authority to the fund’s investment adviser to make fair value determinations, subject to board oversight. The investment adviser has established a Joint Fair Valuation Committee (the “Fair Valuation Committee”) to administer, implement and oversee the fair valuation process, and to make fair value decisions. The Fair Valuation Committee regularly reviews its own fair value decisions, as well as decisions made under its standing instructions to the investment adviser’s valuation teams. The Fair Valuation Committee reviews changes in fair value measurements from period to period and may, as deemed appropriate, update the fair valuation guidelines to better reflect the results of back testing and address new or evolving issues. The Fair Valuation Committee reports any changes to the fair valuation guidelines to the board of trustees with supplemental information to support the changes. The fund’s board and audit committee also regularly review reports that describe fair value determinations and methods.
The fund’s investment adviser has also established a Fixed-Income Pricing Review Group to administer and oversee the fixed-income valuation process, including the use of fixed-income pricing vendors. This group regularly reviews pricing vendor information and market data. Pricing decisions, processes and controls over security valuation are also subject to additional internal reviews, including an annual control self-evaluation program facilitated by the investment adviser’s compliance group.
Classifications — The fund’s investment adviser classifies the fund’s assets and liabilities into three levels based on the inputs used to value the assets or liabilities. Level 1 values are based on quoted prices in active markets for identical securities. Level 2 values are based on significant observable market inputs, such as quoted prices for similar securities and quoted prices in inactive markets. Certain securities trading outside the U.S. may transfer between Level 1 and Level 2 due to valuation adjustments resulting from significant market movements following the close of local trading. Level 3 values are based on significant unobservable inputs that reflect the investment adviser’s determination of assumptions that market participants might reasonably use in valuing the securities. The valuation levels are not necessarily an indication of the risk or liquidity associated with the underlying investment. For example, U.S. government securities are reflected as Level 2 because the inputs used to determine fair value may not always be quoted prices in an active market. The following table presents the fund’s valuation levels as of December 31, 2014 (dollars in thousands):
| | | Investment securities | |
| | | Level 1 | | | Level 2 | | | Level 3 | | | Total | |
| Assets: | | | | | | | | | | | | | | | | |
| Bonds, notes & other debt instruments: | | | | | | | | | | | | | | | | |
| U.S. Treasury bonds & notes | | $ | — | | | $ | 9,640,722 | | | $ | — | | | $ | 9,640,722 | |
| Corporate bonds & notes | | | — | | | | 7,609,008 | | | | 13,090 | | | | 7,622,098 | |
| Mortgage-backed obligations | | | — | | | | 6,281,708 | | | | — | | | | 6,281,708 | |
| Federal agency bonds & notes | | | — | | | | 901,793 | | | | — | | | | 901,793 | |
| Other | | | — | | | | 2,430,404 | | | | 14,668 | | | | 2,445,072 | |
| Convertible stocks | | | — | | | | 11,728 | | | | — | | | | 11,728 | |
| Preferred securities | | | — | | | | 4,270 | | | | — | | | | 4,270 | |
| Common stocks | | | — | | | | 12,136 | | | | 5,832 | | | | 17,968 | |
| Rights & warrants | | | — | | | | — | | | | 11 | | | | 11 | |
| Short-term securities | | | — | | | | 3,447,931 | | | | — | | | | 3,447,931 | |
| Total | | $ | — | | | $ | 30,339,700 | | | $ | 33,601 | | | $ | 30,373,301 | |
| The Bond Fund of America | 23 |
| | | Other investments* | |
| | | Level 1 | | | Level 2 | | | Level 3 | | | Total | |
| Asset: | | | | | | | | | | | | | | | | |
| Unrealized appreciation on forward currency contracts | | $ | — | | | $ | 8,836 | | | $ | — | | | $ | 8,836 | |
| Unrealized appreciation on interest rate swaps | | | — | | | | 36,531 | | | | — | | | | 36,531 | |
| Liability: | | | | | | | | | | | | | | | | |
| Unrealized depreciation on forward currency contracts | | | — | | | | (167 | ) | | | — | | | | (167 | ) |
| Unrealized depreciation on interest rate swaps | | | — | | | | (55,246 | ) | | | — | | | | (55,246 | ) |
| Unrealized depreciation on credit default swaps | | | — | | | | (177 | ) | | | — | | | | (177 | ) |
| Total | | $ | — | | | $ | (10,223 | ) | | $ | — | | | $ | (10,223 | ) |
*Forward currency contracts, interest rate swaps and credit default swaps are not included in the investment portfolio.
4. Risk factors
Investing in the fund may involve certain risks including, but not limited to, those described below.
Market conditions — The prices of, and the income generated by, the securities held by the fund may decline – sometimes rapidly or unpredictably – due to various factors, including events or conditions affecting the general economy or particular industries; overall market changes; local, regional or global political, social or economic instability; governmental or governmental agency responses to economic conditions; and currency exchange, interest rate and commodity price fluctuations.
Issuer risks — The prices of, and the income generated by, securities held by the fund may decline in response to various factors directly related to the issuers of such securities, including reduced demand for an issuer’s goods or services, poor management performance and strategic initiatives such as mergers, acquisitions or dispositions and the market response to any such initiatives.
Investing in debt instruments — The prices of, and the income generated by, bonds and other debt securities held by the fund may be affected by changing interest rates and by changes in the effective maturities and credit ratings of these securities.
Rising interest rates will generally cause the prices of bonds and other debt securities to fall. Falling interest rates may cause an issuer to redeem, call or refinance a debt security before its stated maturity, which may result in the fund having to reinvest the proceeds in lower yielding securities. Longer maturity debt securities generally have greater sensitivity to changes in interest rates and may be subject to greater price fluctuations than shorter maturity debt securities.
Bonds and other debt securities are also subject to credit risk, which is the possibility that the credit strength of an issuer will weaken and/or an issuer of a debt security will fail to make timely payments of principal or interest and the security will go into default. Lower quality debt securities generally have higher rates of interest and may be subject to greater price fluctuations than higher quality debt securities. Credit risk is gauged, in part, by the credit ratings of the debt securities in which the fund invests. However, ratings are only the opinions of the rating agencies issuing them and are not guarantees as to credit quality or an evaluation of market risk. The fund’s investment adviser relies on its own credit analysts to research issuers and issues in seeking to mitigate various credit and default risks.
Investing in mortgage-related and other asset-backed securities — Mortgage-related securities, such as mortgage-backed securities, and other asset-backed securities, include debt obligations that represent interests in pools of mortgages or other income-bearing assets, such as consumer loans or receivables. Such securities often involve risks that are different from or more acute than the risks associated with investing in other types of debt securities. Mortgage-backed and other asset-backed securities are subject to changes in the payment patterns of borrowers of the underlying debt. When interest rates fall, borrowers are more likely to refinance or prepay their debt before its stated maturity. This may result in the fund having to reinvest the proceeds in lower yielding securities, effectively reducing the fund’s income. Conversely, if interest rates rise and borrowers repay their debt more slowly than expected, the time in which the mortgage-backed and other asset-backed securities are paid off could be extended, reducing the fund’s cash available for reinvestment in higher yielding securities.
| 24 | The Bond Fund of America |
Investing in securities backed by the U.S. government — Securities backed by the U.S. Treasury or the full faith and credit of the U.S. government are guaranteed only as to the timely payment of interest and principal when held to maturity. Accordingly, the current market values for these securities will fluctuate with changes in interest rates. Securities issued by government-sponsored entities and federal agencies and instrumentalities that are not backed by the full faith and credit of the U.S. government are neither issued nor guaranteed by the U.S. government.
Thinly traded securities — There may be little trading in the secondary market for particular bonds or other debt securities, which may make them more difficult to value, acquire or sell.
Investing outside the U.S. — Securities of issuers domiciled outside the U.S., or with significant operations or revenues outside the U.S., may lose value because of adverse political, social, economic or market developments (including social instability, regional conflicts, terrorism and war) in the countries or regions in which the issuers operate or generate revenue. These securities may also lose value due to changes in foreign currency exchange rates against the U.S. dollar and/or currencies of other countries. Issuers of these securities may be more susceptible to actions of foreign governments, such as the imposition of price controls or punitive taxes, that could adversely impact revenues. Securities markets in certain countries may be more volatile and/or less liquid than those in the U.S. Investments outside the U.S. may also be subject to different accounting practices and different regulatory, legal and reporting standards and practices, and may be more difficult to value, than those in the U.S. In addition, the value of investments outside the U.S. may be reduced by foreign taxes, including foreign withholding taxes on interest and dividends. Further, there may be increased risks of delayed settlement of securities purchased or sold by the fund. The risks of investing outside the U.S. may be heightened in connection with investments in emerging markets.
Investing in future delivery contracts — The fund may enter into contracts, such as to be announced contracts and mortgage dollar rolls, that involve the fund selling mortgage-related securities and simultaneously contracting to repurchase similar securities for delivery at a future date at a predetermined price. This can increase the fund's market exposure, and the market price of the securities that the fund contracts to repurchase could drop below their purchase price. While the fund can preserve and generate capital through the use of such contracts, by for example, realizing the difference between the sale price and the future purchase price, the income generated by the fund may be reduced by engaging in such transactions. In addition, these transactions may increase the turnover rate of the fund.
Investing in interest rate swaps — The use of interest rate swaps involves the risk that the investment adviser will not accurately predict anticipated changes in interest rates, which may result in losses to the fund. Interest rate swaps also involve the possible failure of a counterparty to perform in accordance with the terms of the swap agreement. If a counterparty defaults on its obligations under a swap agreement, the fund may lose any amount it expected to receive from the counterparty, potentially including amounts in excess of the fund’s initial investment.
Management — The investment adviser to the fund actively manages the fund’s investments. Consequently, the fund is subject to the risk that the methods and analyses employed by the investment adviser in this process may not produce the desired results. This could cause the fund to lose value or its investment results to lag relevant benchmarks or other funds with similar objectives.
5. Certain investment techniques
Index-linked bonds — The fund has invested in index-linked bonds, which are fixed-income securities whose principal value is periodically adjusted to a government price index. Over the life of an index-linked bond, interest is paid on the adjusted principal value. Increases or decreases in the principal value of index-linked bonds are recorded as interest income in the fund’s statement of operations.
Mortgage dollar rolls — The fund has entered into mortgage dollar roll transactions in which the fund sells a mortgage-backed security to a counterparty and simultaneously enters into an agreement with the same counterparty to buy back a similar security on a specific future date at a predetermined price. Mortgage dollar rolls are accounted for as purchase and sale transactions, which may increase the fund’s portfolio turnover rate.
Loan transactions — The fund has entered into loan transactions in which the fund acquires a loan either through an agent, by assignment from another holder, or as a participation interest in another holder's portion of a loan. The loan is often administered by a financial institution that acts as agent for the holders of the loan, and the fund may be required to receive approval from the agent and/or borrower prior to the sale of the investment. The loan’s interest rate and maturity date may change based on the terms of the loan, including potential early payments of principal.
| The Bond Fund of America | 25 |
Forward currency contracts — The fund has entered into forward currency contracts, which represent agreements to exchange currencies on specific future dates at predetermined rates. The fund’s investment adviser uses forward currency contracts to manage the fund’s exposure to changes in exchange rates. Upon entering into these contracts, risks may arise from the potential inability of counterparties to meet the terms of their contracts and from possible movements in exchange rates.
On a daily basis, the fund’s investment adviser values forward currency contracts and records unrealized appreciation or depreciation for open forward currency contracts in the fund’s statement of assets and liabilities. Realized gains or losses are recorded at the time the forward currency contract is closed or offset by another contract with the same broker for the same settlement date and currency.
Closed forward currency contracts that have not reached their settlement date are included in the respective receivables or payables for closed forward currency contracts in the fund’s statement of assets and liabilities. Net realized gains or losses from closed forward currency contracts and net unrealized appreciation or depreciation from open forward currency contracts are recorded in the fund’s statement of operations.
Interest rate swaps — The fund has entered into interest rate swap contracts, which are agreements to exchange one stream of future interest payments for another based on a specified notional amount. Typically, interest rate swaps exchange a fixed interest rate for a payment that floats relative to a benchmark or vice versa. The fund’s investment adviser uses interest rate swaps to seek to manage the interest rate sensitivity of the fund by increasing or decreasing the duration of the fund or a portion of the fund’s portfolio. Risks may arise as a result of the fund’s investment adviser incorrectly anticipating changes in interest rates, increased volatility, reduced liquidity and the potential inability of counterparties to meet the terms of their agreements.
Upon entering into an interest rate swap contract, the fund is required to deposit cash, U.S. government securities or other liquid securities, which is known as “initial margin.” Generally, the initial margin required for a particular interest rate swap is set and held as collateral by the clearinghouse on which the contract is cleared. The amount of initial margin required may be significantly modified from time to time by the clearinghouse during the term of the contract.
On a daily basis, the fund’s investment adviser records daily interest accruals related to the exchange of future payments as a receivable and payable in the fund’s statement of assets and liabilities. The fund also pays or receives a “variation margin” based on the increase or decrease in the value of the interest rate swaps, including accrued interest, and records variation margin on interest rate swaps in the statement of assets and liabilities. The fund records realized gains and losses on both the net accrued interest and any gain or loss recognized at the time the interest rate swap is closed or expires. Net realized gains or losses, as well as any net unrealized appreciation or depreciation, from interest rate swaps are recorded in the fund’s statement of operations.
Credit default swap indices — The fund has entered into centrally cleared credit default swap agreements on credit indices (“CDSI”) that involve one party (the protection buyer) making a stream of payments to another party (the protection seller) in exchange for the right to receive a specified return upon the occurrence of a credit event, such as a default or restructuring, with respect to any of the underlying issuers (reference obligations) in the referenced index. The fund's investment adviser uses credit default swaps to assume exposure to a diversified portfolio of credits or to hedge against existing credit risks. When the fund provides sell protection, its maximum exposure is the notional amount of the credit default swap agreement.
CDSI are portfolios of credit instruments or exposures designed to be representative of some part of the credit market, such as the high-yield or investment-grade credit market. CDSI are generally traded using standardized terms, including a fixed spread and standard maturity dates, and reference all the names in the index. If there is a credit event, it is settled based on that name’s weight in the index. The composition of the underlying issuers or obligations within a particular index may change periodically, usually every six months. A specified credit event may affect all or individual underlying reference obligations included in the index, and will be settled based upon the relative weighting of the affected obligation(s) within the index.
Upon entering into a centrally cleared CDSI contract, the fund is required to deposit with a derivatives clearing member (“DCM”) in a segregated account in the name of the DCM an amount of cash, U.S. government securities or other liquid securities, which is known as “initial margin.” Generally, the initial margin required for a particular credit default swap is set and held as collateral by the clearinghouse on which the contract is cleared. The amount of initial margin required may be significantly modified from time to time by the clearinghouse during the term of the contract. Securities deposited as initial margin are designated on the investment portfolio.
On a daily basis, interest accruals related to the exchange of future payments are recorded as a receivable and payable in the fund’s statement of assets and liabilities. The fund also pays or receives a “variation margin” based on the increase or decrease in the value of the centrally cleared swaps, and records variation margin in the statement of assets and liabilities. The fund records realized gains and
| 26 | The Bond Fund of America |
losses on both the net accrued interest and any gain or loss recognized at the time the swap is closed or expires. Net realized gains or losses, as well as any net unrealized appreciation or depreciation, from credit default swaps are recorded in the fund’s statement of operations.
The following tables present the financial statement impacts resulting from the fund’s use of forward currency contracts, interest rate swaps and credit default swaps as of December 31, 2014 (dollars in thousands):
| | | Assets | | | Liabilities |
| | | Location on statement of | | | | | Location on statement of | | | |
| Contract | | assets and liabilities | | Value | | | assets and liabilities | | Value | |
| Forward currency | | Unrealized appreciation on open forward currency contracts | | $ | 8,836 | | | Unrealized depreciation on open forward currency contracts | | $ | 167 | |
| Forward currency | | Receivables for closed forward currency contracts | | | 1,137 | | | Payables for closed forward currency contracts | | | 199 | |
| Interest rate swaps | | Variation margin | | | 1,425 | | | Variation margin | | | — | |
| Credit default swaps | | Variation margin | | | — | | | Variation margin | | | 82 | |
| | | | | $ | 11,398 | | | | | $ | 448 | |
| | | | | | | | | | | |
| | | Location on statement of | | | | | Location on statement of | | | |
| Contract | | operations | | Value | | | operations | | Value | |
| Forward currency | | Net realized gain on forward currency contracts | | $ | 28,262 | | | Net unrealized appreciation on forward currency contracts | | $ | 11,593 | |
| Interest rate swaps | | Net realized loss on interest rate swaps | | | (24,764 | ) | | Net unrealized depreciation on interest rate swaps | | | (18,787 | ) |
| Credit default swaps | | Net realized loss on credit default swaps | | | (1,217 | ) | | Net unrealized depreciation on credit default swaps | | | (177 | ) |
| | | | | $ | 2,281 | | | | | $ | (7,371 | ) |
Collateral — The fund participates in a collateral program due to its use of forward currency contracts, interest rate swaps and credit default swaps. For forward currency contracts, the program calls for the fund to either receive or pledge collateral based on the net gain or loss on unsettled forward currency contracts by counterparty. For interest rate swaps and credit default swaps, the program calls for the fund to pledge collateral for initial and variation margin by contract. The purpose of the collateral is to cover potential losses that could occur in the event that either party cannot meet its contractual obligations.
Rights of offset — The fund has entered into enforceable master netting agreements with certain counterparties for forward currency contracts, where amounts payable by each party to the other in the same currency, with the same settlement date and with the same counterparty are settled net of each party’s payment obligation. For financial reporting purposes, the fund does not offset financial assets and financial liabilities that are subject to netting arrangements in the statement of assets and liabilities.
The following table presents the fund’s forward currency contracts by counterparty, including those that are subject to potential offset on the statement of assets and liabilities as of December 31, 2014 (dollars in thousands):
| | | | | | Gross amounts not offset in the | | | | |
| | | Gross amounts
recognized in the | | | statement of assets and liabilities and
subject to a master netting agreement | | | | |
| | | statement of assets | | | Available | | | Non-cash | | | Cash | | | Net | |
| Counterparty | | and liabilities | | | to offset | | | collateral* | | | collateral | | | amount | |
| Assets: | | | | | | | | | | | | | | | | | | | | |
| Bank of America, N.A. | | $ | 233 | | | $ | — | | | $ | — | | | $ | — | | | $ | 233 | |
| Bank of New York Mellon | | | 233 | | | | — | | | | — | | | | — | | | | 233 | |
| Barclays Bank PLC | | | 1,522 | | | | (89 | ) | | | — | | | | — | | | | 1,433 | |
| Citibank | | | 2,225 | | | | (19 | ) | | | — | | | | — | | | | 2,206 | |
| HSBC Bank | | | 1,505 | | | | — | | | | — | | | | — | | | | 1,505 | |
| JPMorgan Chase | | | 3,624 | | | | — | | | | — | | | | — | | | | 3,624 | |
| UBS AG | | | 631 | | | | (59 | ) | | | — | | | | — | | | | 572 | |
| Total | | $ | 9,973 | | | $ | (167 | ) | | $ | — | | | $ | — | | | $ | 9,806 | |
| The Bond Fund of America | 27 |
| | | | | | Gross amounts not offset in the | | | | |
| | | Gross amounts
recognized in the | | | statement of assets and liabilities and
subject to a master netting agreement | | | | |
| | | statement of assets | | | Available | | | Non-cash | | | Cash | | | Net | |
| Counterparty | | and liabilities | | | to offset | | | collateral* | | | collateral | | | amount | |
| Liabilities: | | | | | | | | | | | | | | | | | | | | |
| Barclays Bank PLC | | $ | 89 | | | $ | (89 | ) | | $ | — | | | $ | — | | | $ | — | |
| Citibank | | | 19 | | | | (19 | ) | | | — | | | | — | | | | — | |
| JPMorgan Chase | | | 199 | | | | — | | | | — | | | | — | | | | 199 | |
| UBS AG | | | 59 | | | | (59 | ) | | | — | | | | — | | | | — | |
| Total | | $ | 366 | | | $ | (167 | ) | | $ | — | | | $ | — | | | $ | 199 | |
*Non-cash collateral is shown on a settlement basis.
6. Taxation and distributions
Federal income taxation — The fund complies with the requirements under Subchapter M of the Internal Revenue Code applicable to mutual funds and intends to distribute substantially all of its net taxable income and net capital gains each year. The fund is not subject to income taxes to the extent such distributions are made. Therefore, no federal income tax provision is required.
As of and during the period ended December 31, 2014, the fund did not have a liability for any unrecognized tax benefits. The fund recognizes interest and penalties, if any, related to unrecognized tax benefits as income tax expense in the statement of operations. During the period, the fund did not incur any interest or penalties.
The fund is not subject to examination by U.S. federal tax authorities for tax years before 2011, by state tax authorities for tax years before 2010 and by tax authorities outside the U.S. for tax years before 2009.
Non-U.S. taxation — Dividend and interest income are recorded net of non-U.S. taxes paid. Gains realized by the fund on the sale of securities in certain countries are subject to non-U.S. taxes. The fund records a liability based on unrealized gains to provide for potential non-U.S. taxes payable upon the sale of these securities.
Distributions — Distributions paid to shareholders are based on net investment income and net realized gains determined on a tax basis, which may differ from net investment income and net realized gains for financial reporting purposes. These differences are due primarily to different treatment for items such as currency gains and losses; short-term capital gains and losses; capital losses related to sales of certain securities within 30 days of purchase; deferred expenses; cost of investments sold; paydowns on fixed-income securities; net capital losses; amortization of premiums and discounts; and income on certain investments. The fiscal year in which amounts are distributed may differ from the year in which the net investment income and net realized gains are recorded by the fund for financial reporting purposes.
During the year ended December 31, 2014, the fund reclassified $5,000 from undistributed net investment income to capital paid in on shares of beneficial interest and $13,998,000 from accumulated net realized loss to undistributed net investment income to align financial reporting with tax reporting.
Under the Regulated Investment Company Modernization Act of 2010 (the “Act”), net capital losses recognized after December 31, 2010, may be carried forward indefinitely, and their character is retained as short-term and/or long-term losses. Previously, net capital losses were carried forward for eight years and treated as short-term losses. As a transition rule, the Act requires that post-enactment net capital losses be used before pre-enactment net capital losses.
| 28 | The Bond Fund of America |
As of December 31, 2014, the tax-basis components of distributable earnings, unrealized appreciation (depreciation) and cost of investment securities were as follows (dollars in thousands):
| Undistributed ordinary income | | $ | 22,320 | |
| Capital loss carryforward expiring 2017* | | | (1,784,837 | ) |
| Gross unrealized appreciation on investment securities | | | 754,965 | |
| Gross unrealized depreciation on investment securities | | | (204,583 | ) |
| Net unrealized appreciation on investment securities | | | 550,382 | |
| Cost of investment securities | | | 29,822,919 | |
| * | Reflects the utilization of capital loss carryforward of $447,635,000. The capital loss carryforward will be used to offset any capital gains realized by the fund in future years through the expiration date. The fund will not make distributions from capital gains while a capital loss carryforward remains. |
Tax-basis distributions paid to shareholders from ordinary income were as follows (dollars in thousands):
| | | Year ended December 31 |
| Share class | | 2014 | | | 2013 | |
| Class A | | $ | 399,783 | | | $ | 499,382 | |
| Class B | | | 2,929 | | | | 5,259 | |
| Class C | | | 21,248 | | | | 30,981 | |
| Class F-1 | | | 18,072 | | | | 28,234 | |
| Class F-2 | | | 18,212 | | | | 11,145 | |
| Class 529-A | | | 19,406 | | | | 23,025 | |
| Class 529-B | | | 243 | | | | 439 | |
| Class 529-C | | | 4,883 | | | | 6,374 | |
| Class 529-E | | | 935 | | | | 1,141 | |
| Class 529-F-1 | | | 1,439 | | | | 1,662 | |
| Class R-1 | | | 806 | | | | 1,050 | |
| Class R-2 | | | 8,512 | | | | 11,420 | |
| Class R-2E* | | | — | † | | | | |
| Class R-3 | | | 13,502 | | | | 17,155 | |
| Class R-4 | | | 10,391 | | | | 12,573 | |
| Class R-5 | | | 5,287 | | | | 7,761 | |
| Class R-6 | | | 40,143 | | | | 23,032 | |
| Total | | $ | 565,791 | | | $ | 680,633 | |
*Class R-2E shares were offered beginning August 29, 2014.
†Amount less than one thousand.
7. Fees and transactions with related parties
CRMC, the fund’s investment adviser, is the parent company of American Funds Distributors,® Inc. (“AFD”), the principal underwriter of the fund’s shares, and American Funds Service Company® (“AFS”), the fund’s transfer agent. CRMC, AFD and AFS are considered related parties to the fund.
Investment advisory services — The fund has an investment advisory and service agreement with CRMC that provides for monthly fees accrued daily. These fees are based on a series of decreasing annual rates beginning with 0.300% on the first $60 million of daily net assets and decreasing to 0.110% on such assets in excess of $36 billion. The agreement also provides for monthly fees, accrued daily, of 2.25% on the first $8,333,333 of the fund’s monthly gross income and decreasing to 1.75% on such income in excess of $41,666,667. For the year ended December 31, 2014, the investment advisory services fee was $53,390,000, which was equivalent to an annualized rate of 0.196% of average daily net assets.
Class-specific fees and expenses — Expenses that are specific to individual share classes are accrued directly to the respective share class. The principal class-specific fees and expenses are further described below:
Distribution services — The fund has plans of distribution for all share classes, except Class F-2, R-5 and R-6 shares. Under the plans, the board of trustees approves certain categories of expenses that are used to finance activities primarily intended to sell fund shares and service existing accounts. The plans provide for payments, based on an annualized percentage of average daily net assets, ranging from 0.25% to 1.00% as noted below. In some cases, the board of trustees has limited the amounts that may be paid to less than the maximum allowed by the plans. All share classes with a plan may use up to 0.25% of average daily net assets to pay service
| The Bond Fund of America | 29 |
fees, or to compensate AFD for paying service fees, to firms that have entered into agreements with AFD to provide certain shareholder services. The remaining amounts available to be paid under each plan are paid to dealers to compensate them for their sales activities.
For Class A and 529-A shares, distribution-related expenses include the reimbursement of dealer and wholesaler commissions paid by AFD for certain shares sold without a sales charge. These share classes reimburse AFD for amounts billed within the prior 15 months but only to the extent that the overall annual expense limit of 0.25% is not exceeded. As of December 31, 2014, there were no unreimbursed expenses subject to reimbursement for Class A or 529-A shares.
| Share class | | Currently approved limits | | Plan limits |
| Class A | | | 0.25 | % | | | 0.25 | % |
| Class 529-A | | | 0.25 | | | | 0.50 | |
| Classes B and 529-B | | | 1.00 | | | | 1.00 | |
| Classes C, 529-C and R-1 | | | 1.00 | | | | 1.00 | |
| Class R-2 | | | 0.75 | | | | 1.00 | |
| Class R-2E | | | 0.60 | | | | 0.85 | |
| Classes 529-E and R-3 | | | 0.50 | | | | 0.75 | |
| Classes F-1, 529-F-1 and R-4 | | | 0.25 | | | | 0.50 | |
Transfer agent services — The fund has a shareholder services agreement with AFS under which the fund compensates AFS for providing transfer agent services to each of the fund’s share classes. These services include recordkeeping, shareholder communications and transaction processing. In addition, the fund reimburses AFS for amounts paid to third parties for performing transfer agent services on behalf of fund shareholders.
Administrative services — The fund has an administrative services agreement with CRMC under which the fund compensates CRMC for providing administrative services to Class A, C, F, 529 and R shares. These services include, but are not limited to, coordinating, monitoring, assisting and overseeing third parties that provide services to fund shareholders. Under the agreement, Class A shares pay an annual fee of 0.01% and Class C, F, 529 and R shares pay an annual fee of 0.05% of their respective average daily net assets.
529 plan services — Each 529 share class is subject to service fees to compensate the Virginia College Savings Plan (“Virginia529”) for its oversight and administration of the 529 college savings plan. During the period January 1, 2014, to March 31, 2014, the quarterly fee was based on a series of decreasing annual rates beginning with 0.10% on the first $30 billion of the net assets invested in Class 529 shares of the American Funds and decreasing to 0.06% on such assets between $120 billion and $150 billion. Effective April 1, 2014, the quarterly fee was amended to provide for reduced annual rates of 0.07%, 0.06% and 0.05% over $30 billion, $50 billion and $70 billion, respectively, of the net assets invested in Class 529 shares of the American Funds. The fee for any given calendar quarter is accrued and calculated on the basis of the average net assets of Class 529 shares of the American Funds for the last month of the prior calendar quarter. The fee is included in other expenses in the fund’s statement of operations. Virginia529 is not considered a related party to the fund.
| 30 | The Bond Fund of America |
For the year ended December 31, 2014, class-specific expenses under the agreements were as follows (dollars in thousands):
| Share class | | Distribution
services | | | Transfer agent
services | | | Administrative services | | | 529 plan
services | |
| Class A | | | | $46,090 | | | | $ | 29,416 | | | | | $1,869 | | | Not applicable | |
| Class B | | | | 2,065 | | | | | 331 | | | Not applicable | | | Not applicable | |
| Class C | | | | 15,642 | | | | | 2,427 | | | | | 785 | | | Not applicable | |
| Class F-1 | | | | 2,084 | | | | | 947 | | | | | 418 | | | Not applicable | |
| Class F-2 | | Not applicable | | | | | 708 | | | | | 385 | | | Not applicable | |
| Class 529-A | | | | 2,175 | | | | | 1,231 | | | | | 473 | | | | | $863 | |
| Class 529-B | | | | 188 | | | | | 29 | | | | | 9 | | | | | 17 | |
| Class 529-C | | | | 3,755 | | | | | 520 | | | | | 190 | | | | | 347 | |
| Class 529-E | | | | 254 | | | | | 41 | | | | | 26 | | | | | 46 | |
| Class 529-F-1 | | | | — | | | | | 82 | | | | | 32 | | | | | 58 | |
| Class R-1 | | | | 571 | | | | | 67 | | | | | 29 | | | Not applicable | |
| Class R-2 | | | | 4,602 | | | | | 2,406 | | | | | 310 | | | Not applicable | |
| Class R-2E* | | | | — | † | | | | — | † | | | | — | † | | Not applicable | |
| Class R-3 | | | | 3,673 | | | | | 1,287 | | | | | 369 | | | Not applicable | |
| Class R-4 | | | | 1,194 | | | | | 486 | | | | | 241 | | | Not applicable | |
| Class R-5 | | Not applicable | | | | | 110 | | | | | 108 | | | Not applicable | |
| Class R-6 | | Not applicable | | | | | 5 | | | | | 810 | | | Not applicable | |
| Total class-specific expenses | | | | $82,293 | | | | $ | 40,093 | | | | | $6,054 | | | | | $1,331 | |
*Class R-2E shares were offered beginning August 29, 2014.
†Amount less than one thousand.
Trustees’ deferred compensation — Trustees who are unaffiliated with CRMC may elect to defer the cash payment of part or all of their compensation. These deferred amounts, which remain as liabilities of the fund, are treated as if invested in shares of the fund or other American Funds. These amounts represent general, unsecured liabilities of the fund and vary according to the total returns of the selected funds. Trustees’ compensation of $277,000 in the fund’s statement of operations includes $194,000 in current fees (either paid in cash or deferred) and a net increase of $83,000 in the value of the deferred amounts.
Affiliated officers and trustees — Officers and certain trustees of the fund are or may be considered to be affiliated with CRMC, AFD and AFS. No affiliated officers or trustees received any compensation directly from the fund.
8. Capital share transactions
Capital share transactions in the fund were as follows (dollars and shares in thousands):
| | | Sales1 | | | Reinvestments of
dividends | | | Repurchases1 | | | Net (decrease)
increase | |
| Share class | | Amount | | | Shares | | | Amount | | | Shares | | | Amount | | | Shares | | | Amount | | | Shares | |
| | | | | | | | | | | | | | | | | | | | | | | | | |
| Year ended December 31, 2014 | | | | | | | | | | | | | | | | | | | | | | |
| | | | | | | | | | | | | | | | | | | | | | | | | | | | | | | | | |
| Class A | | $ | 2,363,895 | | | | 186,023 | | | $ | 385,649 | | | | 30,331 | | | $ | (3,556,698 | ) | | | (280,538 | ) | | $ | (807,154 | ) | | | (64,184 | ) |
| Class B | | | 5,483 | | | | 431 | | | | 2,842 | | | | 224 | | | | (106,430 | ) | | | (8,397 | ) | | | (98,105 | ) | | | (7,742 | ) |
| Class C | | | 203,523 | | | | 16,014 | | | | 20,275 | | | | 1,595 | | | | (453,345 | ) | | | (35,768 | ) | | | (229,547 | ) | | | (18,159 | ) |
| Class F-1 | | | 229,080 | | | | 18,073 | | | | 17,592 | | | | 1,385 | | | | (584,745 | ) | | | (45,914 | ) | | | (338,073 | ) | | | (26,456 | ) |
| Class F-2 | | | 976,946 | | | | 76,753 | | | | 17,348 | | | | 1,361 | | | | (178,557 | ) | | | (14,072 | ) | | | 815,737 | | | | 64,042 | |
| Class 529-A | | | 119,787 | | | | 9,433 | | | | 19,325 | | | | 1,520 | | | | (177,124 | ) | | | (13,960 | ) | | | (38,012 | ) | | | (3,007 | ) |
| Class 529-B | | | 1,103 | | | | 87 | | | | 241 | | | | 19 | | | | (10,595 | ) | | | (836 | ) | | | (9,251 | ) | | | (730 | ) |
| Class 529-C | | | 53,289 | | | | 4,197 | | | | 4,858 | | | | 382 | | | | (86,968 | ) | | | (6,855 | ) | | | (28,821 | ) | | | (2,276 | ) |
| Class 529-E | | | 6,864 | | | | 541 | | | | 930 | | | | 73 | | | | (10,324 | ) | | | (814 | ) | | | (2,530 | ) | | | (200 | ) |
| Class 529-F-1 | | | 16,346 | | | | 1,285 | | | | 1,429 | | | | 112 | | | | (15,431 | ) | | | (1,215 | ) | | | 2,344 | | | | 182 | |
| Class R-1 | | | 10,902 | | | | 860 | | | | 800 | | | | 63 | | | | (16,485 | ) | | | (1,299 | ) | | | (4,783 | ) | | | (376 | ) |
| Class R-2 | | | 132,683 | | | | 10,454 | | | | 8,431 | | | | 663 | | | | (191,051 | ) | | | (15,070 | ) | | | (49,937 | ) | | | (3,953 | ) |
| Class R-2E2 | | | 161 | | | | 13 | | | | — | 3 | | | — | 3 | | | — | | | | — | | | | 161 | | | | 13 | |
| Class R-3 | | | 180,165 | | | | 14,196 | | | | 13,381 | | | | 1,052 | | | | (235,049 | ) | | | (18,539 | ) | | | (41,503 | ) | | | (3,291 | ) |
| Class R-4 | | | 134,317 | | | | 10,594 | | | | 10,346 | | | | 814 | | | | (165,165 | ) | | | (13,021 | ) | | | (20,502 | ) | | | (1,613 | ) |
| Class R-5 | | | 47,912 | | | | 3,781 | | | | 5,199 | | | | 409 | | | | (78,962 | ) | | | (6,221 | ) | | | (25,851 | ) | | | (2,031 | ) |
| Class R-6 | | | 983,571 | | | | 77,488 | | | | 40,154 | | | | 3,154 | | | | (66,059 | ) | | | (5,208 | ) | | | 957,666 | | | | 75,434 | |
| Total net increase (decrease) | | $ | 5,466,027 | | | | 430,223 | | | $ | 548,800 | | | | 43,157 | | | $ | (5,932,988 | ) | | | (467,727 | ) | | $ | 81,839 | | | | 5,653 | |
| The Bond Fund of America | 31 |
| | | Sales1 | | | Reinvestments of
dividends | | | Repurchases1 | | | Net (decrease)
increase | |
| Share class | | Amount | | | Shares | | | Amount | | | Shares | | | Amount | | | Shares | | | Amount | | | Shares | |
| | | | | | | | | | | | | | | | | | | | | | | | | |
| Year ended December 31, 2013 | | | | | | | | | | | | | |
| | | | | | | | | | | | | | |
| Class A | | $ | 2,123,545 | | | | 167,068 | | | $ | 479,812 | | | | 37,976 | | | $ | (6,896,608 | ) | | | (545,969 | ) | | $ | (4,293,251 | ) | | | (340,925 | ) |
| Class B | | | 8,606 | | | | 674 | | | | 5,091 | | | | 403 | | | | (182,890 | ) | | | (14,441 | ) | | | (169,193 | ) | | | (13,364 | ) |
| Class C | | | 201,014 | | | | 15,797 | | | | 29,413 | | | | 2,329 | | | | (859,829 | ) | | | (68,051 | ) | | | (629,402 | ) | | | (49,925 | ) |
| Class F-1 | | | 301,246 | | | | 23,782 | | | | 27,658 | | | | 2,188 | | | | (766,949 | ) | | | (60,666 | ) | | | (438,045 | ) | | | (34,696 | ) |
| Class F-2 | | | 269,984 | | | | 21,393 | | | | 10,145 | | | | 803 | | | | (275,888 | ) | | | (21,855 | ) | | | 4,241 | | | | 341 | |
| Class 529-A | | | 131,181 | | | | 10,341 | | | | 22,886 | | | | 1,812 | | | | (262,387 | ) | | | (20,815 | ) | | | (108,320 | ) | | | (8,662 | ) |
| Class 529-B | | | 1,521 | | | | 120 | | | | 435 | | | | 34 | | | | (16,271 | ) | | | (1,286 | ) | | | (14,315 | ) | | | (1,132 | ) |
| Class 529-C | | | 59,239 | | | | 4,669 | | | | 6,326 | | | | 501 | | | | (135,037 | ) | | | (10,712 | ) | | | (69,472 | ) | | | (5,542 | ) |
| Class 529-E | | | 7,237 | | | | 571 | | | | 1,133 | | | | 89 | | | | (14,979 | ) | | | (1,189 | ) | | | (6,609 | ) | | | (529 | ) |
| Class 529-F-1 | | | 17,884 | | | | 1,413 | | | | 1,646 | | | | 130 | | | | (27,235 | ) | | | (2,158 | ) | | | (7,705 | ) | | | (615 | ) |
| Class R-1 | | | 12,250 | | | | 966 | | | | 1,042 | | | | 82 | | | | (32,534 | ) | | | (2,565 | ) | | | (19,242 | ) | | | (1,517 | ) |
| Class R-2 | | | 161,855 | | | | 12,746 | | | | 11,290 | | | | 894 | | | | (312,518 | ) | | | (24,686 | ) | | | (139,373 | ) | | | (11,046 | ) |
| Class R-3 | | | 201,109 | | | | 15,844 | | | | 16,974 | | | | 1,344 | | | | (387,263 | ) | | | (30,603 | ) | | | (169,180 | ) | | | (13,415 | ) |
| Class R-4 | | | 145,027 | | | | 11,429 | | | | 12,479 | | | | 988 | | | | (251,028 | ) | | | (19,820 | ) | | | (93,522 | ) | | | (7,403 | ) |
| Class R-5 | | | 90,869 | | | | 7,173 | | | | 7,540 | | | | 597 | | | | (171,230 | ) | | | (13,599 | ) | | | (72,821 | ) | | | (5,829 | ) |
| Class R-6 | | | 670,763 | | | | 52,979 | | | | 23,027 | | | | 1,828 | | | | (88,355 | ) | | | (7,014 | ) | | | 605,435 | | | | 47,793 | |
| Total net increase (decrease) | | $ | 4,403,330 | | | | 346,965 | | | $ | 656,897 | | | | 51,998 | | | $ | (10,681,001 | ) | | | (845,429 | ) | | $ | (5,620,774 | ) | | | (446,466 | ) |
| 1 | Includes exchanges between share classes of the fund. |
| 2 | Class R-2E shares were offered beginning August 29, 2014. |
| 3 | Amount less than one thousand. |
9. Investment transactions
The fund made purchases and sales of investment securities, excluding short-term securities and U.S. government obligations, if any, of $68,034,272,000 and $68,684,887,000, respectively, during the year ended December 31, 2014.
| 32 | The Bond Fund of America |
Financial highlights
| | | | | Income (loss) from investment operations1 | | | | | | | | | | | | | | | | |
| | | Net asset
value,
beginning
of period | | Net
investment
income
(loss) | | | Net gains
(losses) on
securities
(both
realized and
unrealized) | | | Total from
investment
operations | | Dividends
(from net
investment
income) | | | Net asset
value,
end
of period | | Total
return2,3 | | | Net assets,
end of period
(in millions) | | Ratio of
expenses to
average
net assets | | | Ratio of
net income
(loss) to
average
net assets | |
| Class A: | | | | | | | | | | | | | | | | | | | | | | | | | | | | | | | | | | |
| Year ended 12/31/2014 | | $ | 12.40 | | $ | .27 | | | $ | .41 | | | $ | .68 | | | $ | (.27 | ) | | $ | 12.81 | | 5.53 | % | | $ | 18,691 | | .62 | % | | 2.11 | % |
| Year ended 12/31/2013 | | | 12.95 | | | .26 | | | | (.52 | ) | | | (.26 | ) | | | (.29 | ) | | | 12.40 | | (1.99 | ) | | | 18,895 | | .61 | | | 2.10 | |
| Year ended 12/31/2012 | | | 12.55 | | | .30 | | | | .43 | | | | .73 | | | | (.33 | ) | | | 12.95 | | 5.90 | | | | 24,142 | | .60 | | | 2.33 | |
| Year ended 12/31/2011 | | | 12.19 | | | .40 | | | | .38 | | | | .78 | | | | (.42 | ) | | | 12.55 | | 6.51 | | | | 23,654 | | .60 | | | 3.23 | |
| Year ended 12/31/2010 | | | 11.80 | | | .44 | | | | .41 | | | | .85 | | | | (.46 | ) | | | 12.19 | | 7.30 | | | | 25,627 | | .59 | | | 3.61 | |
| Class B: | | | | | | | | | | | | | | | | | | | | | | | | | | | | | | | | | | |
| Year ended 12/31/2014 | | | 12.40 | | | .18 | | | | .41 | | | | .59 | | | | (.18 | ) | | | 12.81 | | 4.75 | | | | 166 | | 1.36 | | | 1.40 | |
| Year ended 12/31/2013 | | | 12.95 | | | .17 | | | | (.52 | ) | | | (.35 | ) | | | (.20 | ) | | | 12.40 | | (2.72 | ) | | | 257 | | 1.36 | | | 1.33 | |
| Year ended 12/31/2012 | | | 12.55 | | | .21 | | | | .43 | | | | .64 | | | | (.24 | ) | | | 12.95 | | 5.10 | | | | 441 | | 1.35 | | | 1.60 | |
| Year ended 12/31/2011 | | | 12.19 | | | .31 | | | | .38 | | | | .69 | | | | (.33 | ) | | | 12.55 | | 5.70 | | | | 612 | | 1.36 | | | 2.49 | |
| Year ended 12/31/2010 | | | 11.80 | | | .35 | | | | .41 | | | | .76 | | | | (.37 | ) | | | 12.19 | | 6.50 | | | | 891 | | 1.35 | | | 2.88 | |
| Class C: | | | | | | | | | | | | | | | | | | | | | | | | | | | | | | | | | | |
| Year ended 12/31/2014 | | | 12.40 | | | .17 | | | | .41 | | | | .58 | | | | (.17 | ) | | | 12.81 | | 4.71 | | | | 1,502 | | 1.41 | | | 1.33 | |
| Year ended 12/31/2013 | | | 12.95 | | | .16 | | | | (.52 | ) | | | (.36 | ) | | | (.19 | ) | | | 12.40 | | (2.76 | ) | | | 1,680 | | 1.41 | | | 1.29 | |
| Year ended 12/31/2012 | | | 12.55 | | | .20 | | | | .43 | | | | .63 | | | | (.23 | ) | | | 12.95 | | 5.05 | | | | 2,400 | | 1.39 | | | 1.54 | |
| Year ended 12/31/2011 | | | 12.19 | | | .30 | | | | .38 | | | | .68 | | | | (.32 | ) | | | 12.55 | | 5.66 | | | | 2,520 | | 1.40 | | | 2.43 | |
| Year ended 12/31/2010 | | | 11.80 | | | .35 | | | | .41 | | | | .76 | | | | (.37 | ) | | | 12.19 | | 6.45 | | | | 2,931 | | 1.39 | | | 2.81 | |
| Class F-1: | | | | | | | | | | | | | | | | | | | | | | | | | | | | | | | | | | |
| Year ended 12/31/2014 | | | 12.40 | | | .27 | | | | .41 | | | | .68 | | | | (.27 | ) | | | 12.81 | | 5.53 | | | | 653 | | .62 | | | 2.15 | |
| Year ended 12/31/2013 | | | 12.95 | | | .26 | | | | (.52 | ) | | | (.26 | ) | | | (.29 | ) | | | 12.40 | | (2.03 | ) | | | 961 | | .64 | | | 2.06 | |
| Year ended 12/31/2012 | | | 12.55 | | | .30 | | | | .43 | | | | .73 | | | | (.33 | ) | | | 12.95 | | 5.88 | | | | 1,452 | | .61 | | | 2.32 | |
| Year ended 12/31/2011 | | | 12.19 | | | .40 | | | | .38 | | | | .78 | | | | (.42 | ) | | | 12.55 | | 6.48 | | | | 1,520 | | .63 | | | 3.21 | |
| Year ended 12/31/2010 | | | 11.80 | | | .44 | | | | .41 | | | | .85 | | | | (.46 | ) | | | 12.19 | | 7.27 | | | | 1,866 | | .62 | | | 3.59 | |
| Class F-2: | | | | | | | | | | | | | | | | | | | | | | | | | | | | | | | | | | |
| Year ended 12/31/2014 | | | 12.40 | | | .29 | | | | .43 | | | | .72 | | | | (.31 | ) | | | 12.81 | | 5.82 | | | | 1,303 | | .35 | | | 2.27 | |
| Year ended 12/31/2013 | | | 12.95 | | | .29 | | | | (.52 | ) | | | (.23 | ) | | | (.32 | ) | | | 12.40 | | (1.75 | ) | | | 467 | | .37 | | | 2.36 | |
| Year ended 12/31/2012 | | | 12.55 | | | .33 | | | | .43 | | | | .76 | | | | (.36 | ) | | | 12.95 | | 6.16 | | | | 483 | | .35 | | | 2.56 | |
| Year ended 12/31/2011 | | | 12.19 | | | .43 | | | | .38 | | | | .81 | | | | (.45 | ) | | | 12.55 | | 6.76 | | | | 319 | | .36 | | | 3.48 | |
| Year ended 12/31/2010 | | | 11.80 | | | .47 | | | | .41 | | | | .88 | | | | (.49 | ) | | | 12.19 | | 7.55 | | | | 402 | | .36 | | | 3.89 | |
| Class 529-A: | | | | | | | | | | | | | | | | | | | | | | | | | | | | | | | | | | |
| Year ended 12/31/2014 | | | 12.40 | | | .26 | | | | .41 | | | | .67 | | | | (.26 | ) | | | 12.81 | | 5.44 | | | | 939 | | .71 | | | 2.02 | |
| Year ended 12/31/2013 | | | 12.95 | | | .25 | | | | (.52 | ) | | | (.27 | ) | | | (.28 | ) | | | 12.40 | | (2.08 | ) | | | 947 | | .70 | | | 2.01 | |
| Year ended 12/31/2012 | | | 12.55 | | | .29 | | | | .43 | | | | .72 | | | | (.32 | ) | | | 12.95 | | 5.80 | | | | 1,101 | | .68 | | | 2.24 | |
| Year ended 12/31/2011 | | | 12.19 | | | .39 | | | | .38 | | | | .77 | | | | (.41 | ) | | | 12.55 | | 6.42 | | | | 981 | | .68 | | | 3.13 | |
| Year ended 12/31/2010 | | | 11.80 | | | .44 | | | | .41 | | | | .85 | | | | (.46 | ) | | | 12.19 | | 7.24 | | | | 898 | | .65 | | | 3.53 | |
| Class 529-B: | | | | | | | | | | | | | | | | | | | | | | | | | | | | | | | | | | |
| Year ended 12/31/2014 | | | 12.40 | | | .16 | | | | .41 | | | | .57 | | | | (.16 | ) | | | 12.81 | | 4.62 | | | | 15 | | 1.49 | | | 1.27 | |
| Year ended 12/31/2013 | | | 12.95 | | | .15 | | | | (.52 | ) | | | (.37 | ) | | | (.18 | ) | | | 12.40 | | (2.84 | ) | | | 23 | | 1.49 | | | 1.21 | |
| Year ended 12/31/2012 | | | 12.55 | | | .19 | | | | .43 | | | | .62 | | | | (.22 | ) | | | 12.95 | | 4.96 | | | | 39 | | 1.48 | | | 1.47 | |
| Year ended 12/31/2011 | | | 12.19 | | | .29 | | | | .38 | | | | .67 | | | | (.31 | ) | | | 12.55 | | 5.58 | | | | 54 | | 1.47 | | | 2.36 | |
| Year ended 12/31/2010 | | | 11.80 | | | .34 | | | | .41 | | | | .75 | | | | (.36 | ) | | | 12.19 | | 6.39 | | | | 73 | | 1.45 | | | 2.76 | |
See page 35 for footnotes.
| The Bond Fund of America | 33 |
Financial highlights (continued)
| | | | | Income (loss) from investment operations1 | | | | | | | | | | | | | | | | | |
| | | Net asset
value,
beginning
of period | | Net
investment
income
(loss) | | | Net gains
(losses) on
securities
(both
realized and
unrealized) | | | Total from
investment
operations | | Dividends
(from net
investment
income) | | | Net asset
value,
end
of period | | Total
return2,3 | | | Net assets,
end of period
(in millions) | | | Ratio of
expenses to
average
net assets | | | Ratio of
net income
(loss) to
average
net assets | |
| Class 529-C: | | | | | | | | | | | | | | | | | | | | | | | | | | | | | | | | | | | |
| Year ended 12/31/2014 | | $ | 12.40 | | $ | .16 | | | $ | .41 | | | $ | .57 | | | $ | (.16 | ) | | $ | 12.81 | | 4.64 | % | | $ | 371 | | | 1.47 | % | | 1.26 | % |
| Year ended 12/31/2013 | | | 12.95 | | | .16 | | | | (.52 | ) | | | (.36 | ) | | | (.19 | ) | | | 12.40 | | (2.83 | ) | | | 388 | | | 1.48 | | | 1.24 | |
| Year ended 12/31/2012 | | | 12.55 | | | .19 | | | | .43 | | | | .62 | | | | (.22 | ) | | | 12.95 | | 4.97 | | | | 477 | | | 1.46 | | | 1.46 | |
| Year ended 12/31/2011 | | | 12.19 | | | .29 | | | | .38 | | | | .67 | | | | (.31 | ) | | | 12.55 | | 5.59 | | | | 444 | | | 1.46 | | | 2.35 | |
| Year ended 12/31/2010 | | | 11.80 | | | .34 | | | | .41 | | | | .75 | | | | (.36 | ) | | | 12.19 | | 6.40 | | | | 428 | | | 1.44 | | | 2.74 | |
| Class 529-E: | | | | | | | | | | | | | | | | | | | | | | | | | | | | | | | | | | | |
| Year ended 12/31/2014 | | | 12.40 | | | .23 | | | | .41 | | | | .64 | | | | (.23 | ) | | | 12.81 | | 5.21 | | | | 51 | | | .93 | | | 1.80 | |
| Year ended 12/31/2013 | | | 12.95 | | | .22 | | | | (.52 | ) | | | (.30 | ) | | | (.25 | ) | | | 12.40 | | (2.30 | ) | | | 52 | | | .93 | | | 1.79 | |
| Year ended 12/31/2012 | | | 12.55 | | | .26 | | | | .43 | | | | .69 | | | | (.29 | ) | | | 12.95 | | 5.55 | | | | 61 | | | .93 | | | 1.99 | |
| Year ended 12/31/2011 | | | 12.19 | | | .36 | | | | .38 | | | | .74 | | | | (.38 | ) | | | 12.55 | | 6.14 | | | | 54 | | | .94 | | | 2.87 | |
| Year ended 12/31/2010 | | | 11.80 | | | .40 | | | | .41 | | | | .81 | | | | (.42 | ) | | | 12.19 | | 6.93 | | | | 49 | | | .93 | | | 3.24 | |
| Class 529-F-1: | | | | | | | | | | | | | | | | | | | | | | | | | | | | | | | | | | | |
| Year ended 12/31/2014 | | | 12.40 | | | .28 | | | | .42 | | | | .70 | | | | (.29 | ) | | | 12.81 | | 5.68 | | | | 66 | | | .48 | | | 2.24 | |
| Year ended 12/31/2013 | | | 12.95 | | | .28 | | | | (.52 | ) | | | (.24 | ) | | | (.31 | ) | | | 12.40 | | (1.86 | ) | | | 62 | | | .48 | | | 2.24 | |
| Year ended 12/31/2012 | | | 12.55 | | | .32 | | | | .43 | | | | .75 | | | | (.35 | ) | | | 12.95 | | 6.04 | | | | 73 | | | .46 | | | 2.45 | |
| Year ended 12/31/2011 | | | 12.19 | | | .42 | | | | .38 | | | | .80 | | | | (.44 | ) | | | 12.55 | | 6.65 | | | | 59 | | | .46 | | | 3.36 | |
| Year ended 12/31/2010 | | | 11.80 | | | .46 | | | | .41 | | | | .87 | | | | (.48 | ) | | | 12.19 | | 7.47 | | | | 54 | | | .44 | | | 3.74 | |
| Class R-1: | | | | | | | | | | | | | | | | | | | | | | | | | | | | | | | | | | | |
| Year ended 12/31/2014 | | | 12.40 | | | .17 | | | | .42 | | | | .59 | | | | (.18 | ) | | | 12.81 | | 4.75 | | | | 55 | | | 1.36 | | | 1.37 | |
| Year ended 12/31/2013 | | | 12.95 | | | .17 | | | | (.52 | ) | | | (.35 | ) | | | (.20 | ) | | | 12.40 | | (2.72 | ) | | | 58 | | | 1.37 | | | 1.34 | |
| Year ended 12/31/2012 | | | 12.55 | | | .20 | | | | .43 | | | | .63 | | | | (.23 | ) | | | 12.95 | | 5.08 | | | | 81 | | | 1.36 | | | 1.57 | |
| Year ended 12/31/2011 | | | 12.19 | | | .30 | | | | .38 | | | | .68 | | | | (.32 | ) | | | 12.55 | | 5.68 | | | | 91 | | | 1.38 | | | 2.45 | |
| Year ended 12/31/2010 | | | 11.80 | | | .35 | | | | .41 | | | | .76 | | | | (.37 | ) | | | 12.19 | | 6.47 | | | | 99 | | | 1.38 | | | 2.82 | |
| Class R-2: | | | | | | | | | | | | | | | | | | | | | | | | | | | | | | | | | | | |
| Year ended 12/31/2014 | | | 12.40 | | | .17 | | | | .41 | | | | .58 | | | | (.17 | ) | | | 12.81 | | 4.73 | | | | 606 | | | 1.39 | | | 1.34 | |
| Year ended 12/31/2013 | | | 12.95 | | | .17 | | | | (.52 | ) | | | (.35 | ) | | | (.20 | ) | | | 12.40 | | (2.70 | ) | | | 636 | | | 1.35 | | | 1.37 | |
| Year ended 12/31/2012 | | | 12.55 | | | .20 | | | | .43 | | | | .63 | | | | (.23 | ) | | | 12.95 | | 5.09 | | | | 807 | | | 1.36 | | | 1.57 | |
| Year ended 12/31/2011 | | | 12.19 | | | .30 | | | | .38 | | | | .68 | | | | (.32 | ) | | | 12.55 | | 5.67 | | | | 806 | | | 1.39 | | | 2.43 | |
| Year ended 12/31/2010 | | | 11.80 | | | .34 | | | | .41 | | | | .75 | | | | (.36 | ) | | | 12.19 | | 6.44 | | | | 832 | | | 1.39 | | | 2.79 | |
| Class R-2E: | | | | | | | | | | | | | | | | | | | | | | | | | | | | | | | | | | | |
| Period from 8/29/2014 to 12/31/20144,5 | | | 12.82 | | | .07 | | | | .01 | | | | .08 | | | | (.09 | ) | | | 12.81 | | .63 | 6 | | | — | 7 | | .25 | 3,6 | | .52 | 3,6 |
| Class R-3: | | | | | | | | | | | | | | | | | | | | | | | | | | | | | | | | | | | |
| Year ended 12/31/2014 | | | 12.40 | | | .23 | | | | .41 | | | | .64 | | | | (.23 | ) | | | 12.81 | | 5.21 | | | | 731 | | | .93 | | | 1.80 | |
| Year ended 12/31/2013 | | | 12.95 | | | .22 | | | | (.52 | ) | | | (.30 | ) | | | (.25 | ) | | | 12.40 | | (2.30 | ) | | | 748 | | | .92 | | | 1.79 | |
| Year ended 12/31/2012 | | | 12.55 | | | .26 | | | | .43 | | | | .69 | | | | (.29 | ) | | | 12.95 | | 5.55 | | | | 955 | | | .92 | | | 2.00 | |
| Year ended 12/31/2011 | | | 12.19 | | | .36 | | | | .38 | | | | .74 | | | | (.38 | ) | | | 12.55 | | 6.15 | | | | 963 | | | .94 | | | 2.89 | |
| Year ended 12/31/2010 | | | 11.80 | | | .40 | | | | .41 | | | | .81 | | | | (.42 | ) | | | 12.19 | | 6.94 | | | | 1,053 | | | .93 | | | 3.26 | |
| 34 | The Bond Fund of America |
| | | | | Income (loss) from investment operations1 | | | | | | | | | | | | | | | | |
| | | Net asset
value,
beginning
of period | | Net
investment
income
(loss) | | | Net gains
(losses) on
securities
(both
realized and
unrealized) | | | Total from
investment
operations | | Dividends
(from net
investment
income) | | | Net asset
value,
end
of period | | Total
return2,3 | | | Net assets,
end of period
(in millions) | | Ratio of
expenses to
average
net assets | | | Ratio of
net income
(loss) to
average
net assets | |
| Class R-4: | | | | | | | | | | | | | | | | | | | | | | | | | | | | | | | | | | |
| Year ended 12/31/2014 | | $ | 12.40 | | $ | .27 | | | $ | .41 | | | $ | .68 | | | $ | (.27 | ) | | $ | 12.81 | | 5.55 | % | | $ | 480 | | .61 | % | | 2.12 | % |
| Year ended 12/31/2013 | | | 12.95 | | | .26 | | | | (.52 | ) | | | (.26 | ) | | | (.29 | ) | | | 12.40 | | (1.99 | ) | | | 484 | | .60 | | | 2.11 | |
| Year ended 12/31/2012 | | | 12.55 | | | .30 | | | | .43 | | | | .73 | | | | (.33 | ) | | | 12.95 | | 5.89 | | | | 602 | | .60 | | | 2.33 | |
| Year ended 12/31/2011 | | | 12.19 | | | .40 | | | | .38 | | | | .78 | | | | (.42 | ) | | | 12.55 | | 6.48 | | | | 669 | | .62 | | | 3.21 | |
| Year ended 12/31/2010 | | | 11.80 | | | .44 | | | | .41 | | | | .85 | | | | (.46 | ) | | | 12.19 | | 7.27 | | | | 768 | | .62 | | | 3.57 | |
| Class R-5: | | | | | | | | | | | | | | | | | | | | | | | | | | | | | | | | | | |
| Year ended 12/31/2014 | | | 12.40 | | | .31 | | | | .41 | | | | .72 | | | | (.31 | ) | | | 12.81 | | 5.86 | | | | 207 | | .31 | | | 2.43 | |
| Year ended 12/31/2013 | | | 12.95 | | | .30 | | | | (.52 | ) | | | (.22 | ) | | | (.33 | ) | | | 12.40 | | (1.70 | ) | | | 226 | | .31 | | | 2.41 | |
| Year ended 12/31/2012 | | | 12.55 | | | .34 | | | | .43 | | | | .77 | | | | (.37 | ) | | | 12.95 | | 6.20 | | | | 311 | | .31 | | | 2.63 | |
| Year ended 12/31/2011 | | | 12.19 | | | .43 | | | | .38 | | | | .81 | | | | (.45 | ) | | | 12.55 | | 6.80 | | | | 310 | | .32 | | | 3.51 | |
| Year ended 12/31/2010 | | | 11.80 | | | .48 | | | | .41 | | | | .89 | | | | (.50 | ) | | | 12.19 | | 7.59 | | | | 370 | | .32 | | | 3.88 | |
| Class R-6: | | | | | | | | | | | | | | | | | | | | | | | | | | | | | | | | | | |
| Year ended 12/31/2014 | | | 12.40 | | | .31 | | | | .42 | | | | .73 | | | | (.32 | ) | | | 12.81 | | 5.92 | | | | 2,132 | | .26 | | | 2.42 | |
| Year ended 12/31/2013 | | | 12.95 | | | .31 | | | | (.52 | ) | | | (.21 | ) | | | (.34 | ) | | | 12.40 | | (1.65 | ) | | | 1,128 | | .26 | | | 2.51 | |
| Year ended 12/31/2012 | | | 12.55 | | | .35 | | | | .43 | | | | .78 | | | | (.38 | ) | | | 12.95 | | 6.26 | | | | 559 | | .25 | | | 2.61 | |
| Year ended 12/31/2011 | | | 12.19 | | | .44 | | | | .38 | | | | .82 | | | | (.46 | ) | | | 12.55 | | 6.85 | | | | 237 | | .27 | | | 3.55 | |
| Year ended 12/31/2010 | | | 11.80 | | | .48 | | | | .41 | | | | .89 | | | | (.50 | ) | | | 12.19 | | 7.64 | | | | 280 | | .27 | | | 3.90 | |
| | | Year ended December 31 |
| Portfolio turnover rate for all share classes8 | | 2014 | | 2013 | | 2012 | | 2011 | | 2010 |
| Including mortgage dollar roll transactions | | | 348 | % | | | 419 | % | | | 264 | % | | | 154 | % | | | 99 | % |
| Excluding mortgage dollar roll transactions | | | 136 | % | | Not available |
| 1 | Based on average shares outstanding. |
| 2 | Total returns exclude any applicable sales charges, including contingent deferred sales charges. |
| 3 | Not annualized. |
| 4 | Based on operations for the period shown and, accordingly, is not representative of a full year. |
| 5 | Class R-2E shares were offered beginning August 29, 2014. |
| 6 | Although the fund has a plan of distribution for Class R-2E shares, fees for distribution services are not paid by the fund on accounts for which a broker-dealer (or other financial intermediary) has not been assigned, including amounts invested in the fund by CRMC and/or its affiliates. If fees for distribution services were charged on these assets, fund expenses would be higher and net income and total return would be lower. |
| 7 | Amount less than $1 million. |
| 8 | Refer to Note 5 for more information on mortgage dollar rolls. |
See Notes to Financial Statements
| The Bond Fund of America | 35 |
Report of Independent Registered Public Accounting Firm
To the Shareholders and Board of Trustees of The Bond Fund of America:
We have audited the accompanying statement of assets and liabilities of The Bond Fund of America (the “Fund”), including the summary investment portfolio, as of December 31, 2014, and the related statement of operations for the year then ended, the statements of changes in net assets for each of the two years in the period then ended, and the financial highlights for each of the periods presented. These financial statements and financial highlights are the responsibility of the Fund’s management. Our responsibility is to express an opinion on these financial statements and financial highlights based on our audits.
We conducted our audits in accordance with the standards of the Public Company Accounting Oversight Board (United States). Those standards require that we plan and perform the audit to obtain reasonable assurance about whether the financial statements and financial highlights are free of material misstatement. The Fund is not required to have, nor were we engaged to perform, an audit of its internal control over financial reporting. Our audits included consideration of internal control over financial reporting as a basis for designing audit procedures that are appropriate in the circumstances, but not for the purpose of expressing an opinion on the effectiveness of the Fund’s internal control over financial reporting. Accordingly, we express no such opinion. An audit also includes examining, on a test basis, evidence supporting the amounts and disclosures in the financial statements, assessing the accounting principles used and significant estimates made by management, as well as evaluating the overall financial statement presentation. Our procedures included confirmation of securities owned as of December 31, 2014, by correspondence with the custodian and brokers; where replies were not received from brokers, we performed other auditing procedures. We believe that our audits provide a reasonable basis for our opinion.
In our opinion, such financial statements and financial highlights referred to above present fairly, in all material respects, the financial position of The Bond Fund of America as of December 31, 2014, the results of its operations for the year then ended, the changes in its net assets for each of the two years in the period then ended, and the financial highlights for each of the periods presented, in conformity with accounting principles generally accepted in the United States of America.
Deloitte & Touche LLP
Costa Mesa, California
Feburary 5, 2015
| 36 | The Bond Fund of America |
As a fund shareholder, you incur two types of costs: (1) transaction costs, such as initial sales charges on purchase payments and contingent deferred sales charges on redemptions (loads), and (2) ongoing costs, including management fees, distribution and service (12b-1) fees, and other expenses. This example is intended to help you understand your ongoing costs (in dollars) of investing in the fund so you can compare these costs with the ongoing costs of investing in other mutual funds. The example is based on an investment of $1,000 invested at the beginning of the period and held for the entire six-month period (July 1, 2014, through December 31, 2014).
Actual expenses:
The first line of each share class in the table on the following page provides information about actual account values and actual expenses. You may use the information in this line, together with the amount you invested, to estimate the expenses that you paid over the period. Simply divide your account value by $1,000 (for example, an $8,600 account value divided by $1,000 = 8.6), then multiply the result by the number in the first line under the heading entitled “Expenses paid during period” to estimate the expenses you paid on your account during this period.
Hypothetical example for comparison purposes:
The second line of each share class in the table on the following page provides information about hypothetical account values and hypothetical expenses based on the actual expense ratio for the share class and an assumed rate of return of 5.00% per year before expenses, which is not the actual return of the share class. The hypothetical account values and expenses may not be used to estimate the actual ending account balance or expenses you paid for the period. You may use this information to compare the ongoing costs of investing in the fund and other funds. To do so, compare this 5.00% hypothetical example with the 5.00% hypothetical examples that appear in the shareholder reports of the other funds.
Notes:
Retirement plan participants may be subject to certain fees charged by the plan sponsor, and Class F-1, F-2 and 529-F-1 shareholders may be subject to fees charged by financial intermediaries, typically ranging from 0.75% to 1.50% of assets annually depending on services offered. You can estimate the impact of these fees by adding the amount of the fees to the total estimated expenses you paid on your account during the period as calculated above. In addition, your ending account value would be lower by the amount of these fees.
Note that the expenses shown in the table on the following page are meant to highlight your ongoing costs only and do not reflect any transactional costs, such as sales charges (loads). Therefore, the second line of each share class in the table is useful in comparing ongoing costs only and will not help you determine the relative total costs of owning different funds. In addition, if these transactional costs were included, your costs would have been higher.
| The Bond Fund of America | 37 |
| | | Beginning | | | Ending | | | | | | | |
| | | account value | | | account value | | | Expenses paid | | | Annualized | |
| | | 7/1/2014 | | | 12/31/2014 | | | during period* | | | expense ratio | |
| Class A - actual return | | $ | 1,000.00 | | | $ | 1,012.34 | | | $ | 3.14 | | | | .62 | % |
| Class A - assumed 5% return | | | 1,000.00 | | | | 1,022.08 | | | | 3.16 | | | | .62 | |
| Class B - actual return | | | 1,000.00 | | | | 1,008.65 | | | | 6.83 | | | | 1.35 | |
| Class B - assumed 5% return | | | 1,000.00 | | | | 1,018.40 | | | | 6.87 | | | | 1.35 | |
| Class C - actual return | | | 1,000.00 | | | | 1,008.40 | | | | 7.09 | | | | 1.40 | |
| Class C - assumed 5% return | | | 1,000.00 | | | | 1,018.15 | | | | 7.12 | | | | 1.40 | |
| Class F-1 - actual return | | | 1,000.00 | | | | 1,012.30 | | | | 3.14 | | | | .62 | |
| Class F-1 - assumed 5% return | | | 1,000.00 | | | | 1,022.08 | | | | 3.16 | | | | .62 | |
| Class F-2 - actual return | | | 1,000.00 | | | | 1,013.72 | | | | 1.78 | | | | .35 | |
| Class F-2 - assumed 5% return | | | 1,000.00 | | | | 1,023.44 | | | | 1.79 | | | | .35 | |
| Class 529-A - actual return | | | 1,000.00 | | | | 1,011.93 | | | | 3.55 | | | | .70 | |
| Class 529-A - assumed 5% return | | | 1,000.00 | | | | 1,021.68 | | | | 3.57 | | | | .70 | |
| Class 529-B - actual return | | | 1,000.00 | | | | 1,007.99 | | | | 7.49 | | | | 1.48 | |
| Class 529-B - assumed 5% return | | | 1,000.00 | | | | 1,017.74 | | | | 7.53 | | | | 1.48 | |
| Class 529-C - actual return | | | 1,000.00 | | | | 1,008.08 | | | | 7.44 | | | | 1.47 | |
| Class 529-C - assumed 5% return | | | 1,000.00 | | | | 1,017.80 | | | | 7.48 | | | | 1.47 | |
| Class 529-E - actual return | | | 1,000.00 | | | | 1,010.82 | | | | 4.66 | | | | .92 | |
| Class 529-E - assumed 5% return | | | 1,000.00 | | | | 1,020.57 | | | | 4.69 | | | | .92 | |
| Class 529-F-1 - actual return | | | 1,000.00 | | | | 1,013.09 | | | | 2.38 | | | | .47 | |
| Class 529-F-1 - assumed 5% return | | | 1,000.00 | | | | 1,022.84 | | | | 2.40 | | | | .47 | |
| Class R-1 - actual return | | | 1,000.00 | | | | 1,008.65 | | | | 6.83 | | | | 1.35 | |
| Class R-1 - assumed 5% return | | | 1,000.00 | | | | 1,018.40 | | | | 6.87 | | | | 1.35 | |
| Class R-2 - actual return | | | 1,000.00 | | | | 1,008.54 | | | | 6.94 | | | | 1.37 | |
| Class R-2 - assumed 5% return | | | 1,000.00 | | | | 1,018.30 | | | | 6.97 | | | | 1.37 | |
| Class R-2E - actual return† | | | 1,000.00 | | | | 1,006.34 | | | | 2.59 | | | | .76 | |
| Class R-2E - assumed 5% return† | | | 1,000.00 | | | | 1,021.37 | | | | 3.87 | | | | .76 | |
| Class R-3 - actual return | | | 1,000.00 | | | | 1,010.82 | | | | 4.66 | | | | .92 | |
| Class R-3 - assumed 5% return | | | 1,000.00 | | | | 1,020.57 | | | | 4.69 | | | | .92 | |
| Class R-4 - actual return | | | 1,000.00 | | | | 1,012.43 | | | | 3.04 | | | | .60 | |
| Class R-4 - assumed 5% return | | | 1,000.00 | | | | 1,022.18 | | | | 3.06 | | | | .60 | |
| Class R-5 - actual return | | | 1,000.00 | | | | 1,013.91 | | | | 1.52 | | | | .30 | |
| Class R-5 - assumed 5% return | | | 1,000.00 | | | | 1,023.69 | | | | 1.53 | | | | .30 | |
| Class R-6 - actual return | | | 1,000.00 | | | | 1,014.18 | | | | 1.27 | | | | .25 | |
| Class R-6 - assumed 5% return | | | 1,000.00 | | | | 1,023.95 | | | | 1.28 | | | | .25 | |
| * | The “expenses paid during period” are equal to the “annualized expense ratio,” multiplied by the average account value over the period, multiplied by the number of days in the period, and divided by 365 (to reflect the one-half year period). |
| † | The period for the ”annualized expense ratio” and ”actual return” line is based on the number of days since the initial sale of the share class on August 29, 2014. |
| | The ”assumed 5% return” line is based on 184 days. |
We are required to advise you of the federal tax status of certain distributions received by shareholders during the fiscal year. The fund hereby designates the following amounts for the fund’s fiscal year ended December 31, 2014:
| Qualified dividend income | | | $3,380,000 | |
| Corporate dividends received deduction | | | $1,425,000 | |
| U.S. government income that may be exempt from state taxation | | | $122,777,000 | |
Individual shareholders should refer to their Form 1099 or other tax information, which was mailed in January 2015, to determine the calendar year amounts to be included on their 2014 tax returns. Shareholders should consult their tax advisors.
| 38 | The Bond Fund of America |
Board of trustees and other officers
Independent trustees1
| Name and year of birth | | Year first
elected a
trustee of
the fund2 | | Principal occupation(s) during past five years | | Number of
portfolios in fund
complex overseen
by trustee | | Other directorships3
held by trustee |
| William H. Baribault, 1945 | | 2010 | | CEO and President, Richard Nixon Foundation; former Chairman of the Board and CEO, Oakwood Enterprises (private investment and consulting) | | 72 | | None |
| James G. Ellis, 1947 | | 2006 | | Dean and Professor of Marketing, Marshall School of Business, University of Southern California | | 72 | | Mercury General Corp. |
| Leonard R. Fuller, 1946 | | 1994 | | President and CEO, Fuller Consulting (financial management consulting firm) | | 72 | | None |
R. Clark Hooper, 1946
Chairman of the Board
(Independent and Non-Executive) | | 2005 | | Private investor | | 74 | | The Swiss Helvetia Fund, Inc. |
| Merit E. Janow, 1958 | | 2010 | | Dean and Professor, Columbia University, School of International and Public Affairs | | 71 | | MasterCard Incorporated; The NASDAQ Stock Market LLC; Trimble Navigation Limited |
| Laurel B. Mitchell, PhD, 1955 | | 2009 | | Distinguished Professor of Accounting, University of Redlands | | 68 | | None |
| Frank M. Sanchez, 1943 | | 1999 | | Principal, The Sanchez Family Corporation dba McDonald’s Restaurants (McDonald’s licensee) | | 68 | | None |
| Margaret Spellings, 1957 | | 2010 | | President, George W. Bush Foundation; former President and CEO, Margaret Spellings & Company (public policy and strategic consulting); former President, U.S. Chamber Foundation and Senior Advisor to the President and CEO, U.S. Chamber of Commerce | | 72 | | None |
| Steadman Upham, PhD, 1949 | | 2007 | | President and University Professor, The University of Tulsa | | 71 | | None |
Interested trustee4,5
Name, year of birth and
position with fund | | Year first
elected a
trustee or
officer of
the fund2 | | Principal occupation(s) during past five years and
positions held with affiliated entities or the principal
underwriter of the fund | | Number of
portfolios in fund
complex overseen
by trustee | | Other directorships3
held by trustee |
John H. Smet, 1956
Vice Chairman of the Board and
President | | 1994 | | Partner — Capital Fixed Income Investors, Capital Research and Management Company; Director, Capital Research and Management Company | | 21 | | None |
The fund’s statement of additional information includes further details about fund trustees and is available without charge upon request by calling American Funds Service Company at (800) 421-4225 or by visiting the American Funds website at americanfunds.com. The address for all trustees and officers of the fund is 333 South Hope Street, Los Angeles, CA 90071, Attention: Secretary.
See page 40 for footnotes.
| The Bond Fund of America | 39 |
Other officers5
Name, year of birth and
position with fund | | Year first elected
an officer of the
fund2 | | Principal occupation(s) during past five years and positions held with affiliated entities or the principal
underwriter of the fund |
Andrew F. Barth, 1961
Senior Vice President | | 2011 | | Partner — Capital Fixed Income Investors, Capital Research and Management Company; Director, Capital Group International, Inc.;6 Chairman of the Board, Capital Guardian Trust Company;6 Partner — Capital Fixed Income Investors, Capital Guardian Trust Company6 |
Robert H. Neithart, 1965
Senior Vice President | | 2011 | | Partner — Capital Fixed Income Investors, Capital Research and Management Company; Director, The Capital Group Companies, Inc.;6 Chairman of the Board, Capital Strategy Research, Inc.6 |
Kristine M. Nishiyama, 1970
Senior Vice President | | 2003 | | Senior Vice President and Senior Counsel — Fund Business Management Group, Capital Research and Management Company; Senior Vice President and General Counsel, Capital Bank and Trust Company6 |
Steven I. Koszalka, 1964
Secretary | | 2010 | | Vice President — Fund Business Management Group, Capital Research and Management Company |
Brian C. Janssen, 1972
Treasurer | | 2011 | | Vice President — Investment Operations, Capital Research and Management Company |
Jane Y. Chung, 1974
Assistant Secretary | | 2014 | | Fund Boards Coordinator — Fund Business Management Group, Capital Research and Management Company |
Karl C. Grauman, 1968
Assistant Treasurer | | 2012 | | Vice President — Investment Operations, Capital Research and Management Company |
Dori Laskin, 1951
Assistant Treasurer | | 2010 | | Vice President — Investment Operations, Capital Research and Management Company |
| 1 | The term independent trustee refers to a trustee who is not an “interested person” of the fund within the meaning of the Investment Company Act of 1940. |
| 2 | Trustees and officers of the fund serve until their resignation, removal or retirement. |
| 3 | This includes all directorships/trusteeships (other than those in the American Funds or other funds managed by Capital Research and Management Company or its affiliates) that are held by each trustee as a trustee or director of a public company or a registered investment company. |
| 4 | The term interested trustee refers to a trustee who is an “interested person” within the meaning of the Investment Company Act of 1940, on the basis of their affiliation with the fund’s investment adviser, Capital Research and Management Company, or affiliated entities (including the fund’s principal underwriter). |
| 5 | All of the directors/trustees and/or officers listed are officers and/or directors/trustees of one or more of the other funds for which Capital Research and Management Company serves as investment adviser. |
| 6 | Company affiliated with Capital Research and Management Company. |
| 40 | The Bond Fund of America |
Offices of the fund and of the investment adviser
Capital Research and Management Company
333 South Hope Street
Los Angeles, CA 90071-1406
6455 Irvine Center Drive
Irvine, CA 92618-4518
Transfer agent for shareholder accounts
American Funds Service Company
(Write to the address near you.)
P.O. Box 6007
Indianapolis, IN 46206-6007
P.O. Box 2280
Norfolk, VA 23501-2280
Custodian of assets
JPMorgan Chase Bank
270 Park Avenue
New York, NY 10017-2070
Counsel
Morgan, Lewis & Bockius LLP
355 South Grand Avenue, Suite 4400
Los Angeles, CA 90071-3106
Independent registered public accounting firm
Deloitte & Touche LLP
695 Town Center Drive
Suite 1200
Costa Mesa, CA 92626-7188
Principal underwriter
American Funds Distributors, Inc.
333 South Hope Street
Los Angeles, CA 90071-1406
Investors should carefully consider investment objectives, risks, charges and expenses. This and other important information is contained in the fund prospectus and summary prospectus, which can be obtained from your financial professional and should be read carefully before investing. You may also call American Funds Service Company (AFS) at (800) 421-4225 or visit the American Funds website at americanfunds.com.
“American Funds Proxy Voting Procedures and Principles” — which describes how we vote proxies relating to portfolio securities — is available on the American Funds website or upon request by calling AFS. The fund files its proxy voting record with the U.S. Securities and Exchange Commission (SEC) for the 12 months ended June 30 by August 31. The proxy voting record is available free of charge on the SEC website at sec.gov and on the American Funds website.
A complete December 31, 2014, portfolio of The Bond Fund of America’s investments is available free of charge by calling AFS or visiting the SEC website (where it is part of Form N-CSR).
The Bond Fund of America files a complete list of its portfolio holdings with the SEC for the first and third quarters of each fiscal year on Form N-Q. This fling is available free of charge on the SEC website. You may also review or, for a fee, copy this fling at the SEC’s Public Reference Room in Washington, D.C. Additional information regarding the operation of the Public Reference Room may be obtained by calling the SEC’s Office of Investor Education and Advocacy at (800) SEC-0330. Additionally, the list of portfolio holdings is available by calling AFS.
This report is for the information of shareholders of The Bond Fund of America, but it also may be used as sales literature when preceded or accompanied by the current prospectus or summary prospectus, which gives details about charges, expenses, investment objectives and operating policies of the fund. If used as sales material after March 31, 2015, this report must be accompanied by an American Funds statistical update for the most recently completed calendar quarter.
The American Funds Advantage
Since 1931, American Funds, part of Capital Group, has helped investors pursue long-term investment success. Our consistent approach — in combination with The Capital SystemSM — has resulted in a superior long-term track record.
| | Aligned with investor success |
| | We base our decisions on a long-term perspective, which we believe aligns our goals with the interests of our clients. Our portfolio managers average 27 years of investment experience, including 22 years at our company, reflecting a career commitment to our long-term approach.1 |
| | |
| | The Capital SystemSM |
| | Our investment process, The Capital System, combines individual accountability with teamwork. Each fund is divided into portions that are managed independently by investment professionals with diverse backgrounds, ages and investment approaches. An extensive global research effort is the backbone of our system. |
| | |
| | Superior long-term track record |
| | Our equity funds have beaten their Lipper peer indexes in 91% of 10-year periods and 96% of 20-year periods. Our fixed-income funds have beaten their Lipper indexes in 54% of 10-year periods and 57% of 20-year periods.2 Our fund management fees have been among the lowest in the industry.3 |
| | 1 | Portfolio manager experience as of December 31, 2014. |
| | 2 | Based on Class A share results for rolling periods through December 31, 2014. Periods covered are the shorter of the fund’s lifetime or since the comparable Lipper index inception date (except SMALLCAP World Fund, for which the Lipper average was used). |
| | 3 | On average, our management fees were in the lowest quintile 70% of the time, based on the 20-year period ended December 31, 2014, versus comparable Lipper categories, excluding funds of funds. |

ITEM 2 – Code of Ethics
The Registrant has adopted a Code of Ethics that applies to its Principal Executive Officer and Principal Financial Officer. The Registrant undertakes to provide to any person without charge, upon request, a copy of the Code of Ethics. Such request can be made to American Funds Service Company at 800/421-9225 or to the Secretary of the Registrant, 333 South Hope Street, Los Angeles, California 90071.
ITEM 3 – Audit Committee Financial Expert
The Registrant’s board has determined that Laurel B. Mitchell, a member of the Registrant’s audit committee, is an “audit committee financial expert” and "independent," as such terms are defined in this Item. This designation will not increase the designee’s duties, obligations or liability as compared to his or her duties, obligations and liability as a member of the audit committee and of the board, nor will it reduce the responsibility of the other audit committee members. There may be other individuals who, through education or experience, would qualify as "audit committee financial experts" if the board had designated them as such. Most importantly, the board believes each member of the audit committee contributes significantly to the effective oversight of the Registrant’s financial statements and condition.
ITEM 4 – Principal Accountant Fees and Services
| | Registrant: |
| | | a) Audit Fees: |
| | | | 2013 | $148,000 |
| | | | 2014 | $182,000 |
| | | | |
| | | b) Audit-Related Fees: |
| | | | 2013 | $14,000 |
| | | | 2014 | $6,000 |
| | | | The audit-related fees consist of assurance and related services relating to the examination of the Registrant’s investment adviser conducted in accordance with Statement on Standards for Attestation Engagements Number 16 issued by the American Institute of Certified Public Accountants. |
| | | | |
| | | c) Tax Fees: |
| | | | 2013 | None |
| | | | 2014 | $7,000 |
| | | | The tax fees consist of professional services relating to the preparation of the Registrant’s tax returns including returns relating to the Registrant’s investments in non-U.S. jurisdictions. |
| | | | |
| | | d) All Other Fees: |
| | | | 2013 | None |
| | | | 2014 | None |
| | | | |
| | Adviser and affiliates (includes only fees for non-audit services billed to the adviser and affiliates for engagements that relate directly to the operations and financial reporting of the Registrant and were subject to the pre-approval policies described below): |
| | | a) Audit Fees: |
| | | | Not Applicable |
| | | | |
| | | b) Audit-Related Fees: |
| | | | 2013 | $1,020,000 |
| | | | 2014 | $927,000 |
| | | | The audit-related fees consist of assurance and related services relating to the examination of the Registrant’s transfer agent, principal underwriter and investment adviser conducted in accordance with Statement on Standards for Attestation Engagements Number 16 issued by the American Institute of Certified Public Accountants. |
| | | | |
| | | c) Tax Fees: |
| | | | 2013 | $10,000 |
| | | | 2014 | $33,000 |
| | | | The tax fees consist of consulting services relating to the Registrant’s investments. |
| | | | |
| | | d) All Other Fees: |
| | | | 2013 | $3,000 |
| | | | 2014 | $3,000 |
| | | | The other fees consist of subscription services related to an accounting research tool. |
| | | | |
All audit and permissible non-audit services that the Registrant’s audit committee considers compatible with maintaining the independent registered public accounting firm’s independence are required to be pre-approved by the committee. The pre-approval requirement will extend to all non-audit services provided to the Registrant, the investment adviser, and any entity controlling, controlled by, or under common control with the investment adviser that provides ongoing services to the Registrant, if the engagement relates directly to the operations and financial reporting of the Registrant. The committee will not delegate its responsibility to pre-approve these services to the investment adviser. The committee may delegate to one or more committee members the authority to review and pre-approve audit and permissible non-audit services. Actions taken under any such delegation will be reported to the full committee at its next meeting. The pre-approval requirement is waived with respect to non-audit services if certain conditions are met. The pre-approval requirement was not waived for any of the non-audit services listed above provided to the Registrant, adviser and affiliates.
Aggregate non-audit fees paid to the Registrant’s auditors, including fees for all services billed to the Registrant, adviser and affiliates that provide ongoing services to the Registrant, were $1,459,000 for fiscal year 2013 and $1,276,000 for fiscal year 2014. The non-audit services represented by these amounts were brought to the attention of the committee and considered to be compatible with maintaining the auditors’ independence.
ITEM 5 – Audit Committee of Listed Registrants
Not applicable to this Registrant, insofar as the Registrant is not a listed issuer as defined in Rule 10A-3 under the Securities Exchange Act of 1934.
ITEM 6 – Schedule of Investments
The Bond Fund of America®
Investment portfolio
December 31, 2014
Bonds, notes & other debt instruments 96.15%
U.S. Treasury bonds & notes 34.47%
U.S. Treasury 27.98% | Principal amount
(000) | Value
(000) |
| U.S. Treasury 0.25% 2015 | $2,000 | $2,002 |
| U.S. Treasury 0.375% 20151 | 36,390 | 36,437 |
| U.S. Treasury 0.375% 2016 | 5,000 | 4,979 |
| U.S. Treasury 0.625% 2016 | 40,000 | 39,973 |
| U.S. Treasury 1.50% 20161 | 64,550 | 65,522 |
| U.S. Treasury 7.50% 2016 | 45,000 | 50,745 |
| U.S. Treasury 0.75% 2017 | 107,671 | 107,267 |
| U.S. Treasury 0.875% 2017 | 210,200 | 210,480 |
| U.S. Treasury 0.875% 2017 | 5,035 | 5,010 |
| U.S. Treasury 8.75% 2017 | 25,000 | 29,656 |
| U.S. Treasury 1.25% 2018 | 540,350 | 536,886 |
| U.S. Treasury 1.25% 2018 | 245,500 | 243,715 |
| U.S. Treasury 1.375% 2018 | 106,750 | 106,859 |
| U.S. Treasury 1.50% 2018 | 85,450 | 85,858 |
| U.S. Treasury 2.375% 2018 | 20,000 | 20,731 |
| U.S. Treasury 1.00% 2019 | 32,250 | 31,470 |
| U.S. Treasury 1.50% 2019 | 746,076 | 744,382 |
| U.S. Treasury 1.50% 2019 | 421,040 | 418,324 |
| U.S. Treasury 1.50% 2019 | 343,559 | 341,371 |
| U.S. Treasury 1.50% 2019 | 104,025 | 104,082 |
| U.S. Treasury 1.625% 2019 | 764,450 | 765,704 |
| U.S. Treasury 1.625% 2019 | 287,750 | 287,433 |
| U.S. Treasury 1.625% 2019 | 267,725 | 268,437 |
| U.S. Treasury 1.625% 2019 | 205,295 | 205,511 |
| U.S. Treasury 1.625% 2019 | 58,455 | 58,656 |
| U.S. Treasury 1.75% 2019 | 386,188 | 388,389 |
| U.S. Treasury 3.625% 2019 | 78,000 | 85,093 |
| U.S. Treasury 1.125% 2020 | 66,975 | 65,065 |
| U.S. Treasury 1.25% 2020 | 44,275 | 43,341 |
| U.S. Treasury 1.375% 2020 | 67,150 | 65,899 |
| U.S. Treasury 3.50% 2020 | 31,850 | 34,746 |
| U.S. Treasury 2.00% 2021 | 152,000 | 152,439 |
| U.S. Treasury 2.125% 2021 | 119,000 | 120,211 |
| U.S. Treasury 2.125% 2021 | 1,543 | 1,560 |
| U.S. Treasury 2.25% 2021 | 309,300 | 315,789 |
| U.S. Treasury 2.25% 2021 | 90,550 | 92,326 |
| U.S. Treasury 2.25% 2021 | 44,150 | 45,054 |
| U.S. Treasury 8.00% 2021 | 500 | 696 |
| U.S. Treasury 1.625% 2022 | 22,328 | 21,707 |
| U.S. Treasury 1.625% 2022 | 22,218 | 21,547 |
| U.S. Treasury 1.75% 2022 | 30,530 | 30,014 |
| U.S. Treasury 1.75% 2023 | 22,250 | 21,656 |
| U.S. Treasury 2.00% 2023 | 66,154 | 65,864 |
| U.S. Treasury 2.50% 2023 | 21,075 | 21,744 |
| U.S. Treasury 2.75% 2023 | 20,500 | 21,573 |
| U.S. Treasury 2.25% 2024 | 154,426 | 155,536 |
The Bond Fund of America — Page 1 of 37
Bonds, notes & other debt instruments
U.S. Treasury bonds & notes (continued)
U.S. Treasury (continued) | Principal amount
(000) | Value
(000) |
| U.S. Treasury 2.375% 2024 | $225,000 | $229,113 |
| U.S. Treasury 2.75% 2024 | 73,200 | 77,009 |
| U.S. Treasury 6.875% 2025 | 77,500 | 112,012 |
| U.S. Treasury 6.00% 2026 | 300 | 411 |
| U.S. Treasury 4.50% 2036 | 84,207 | 112,469 |
| U.S. Treasury 3.50% 2039 | 1,000 | 1,150 |
| U.S. Treasury 3.75% 2041 | 19,275 | 23,250 |
| U.S. Treasury 2.875% 2043 | 131,220 | 134,285 |
| U.S. Treasury 3.625% 2043 | 114,200 | 134,363 |
| U.S. Treasury 3.75% 2043 | 90,000 | 108,232 |
| U.S. Treasury 3.00% 2044 | 128,589 | 135,129 |
| U.S. Treasury 3.125% 2044 | 34,044 | 36,637 |
| U.S. Treasury 3.375% 2044 | 32,750 | 36,887 |
| U.S. Treasury 3.625% 2044 | 120,250 | 141,585 |
| | | 7,824,271 |
| U.S. Treasury inflation-protected securities 6.49% | | |
| U.S. Treasury Inflation-Protected Security 0.50% 20152 | 164,936 | 162,794 |
| U.S. Treasury Inflation-Protected Security 1.625% 20152 | 112,685 | 112,481 |
| U.S. Treasury Inflation-Protected Security 1.875% 20152 | 45,919 | 46,065 |
| U.S. Treasury Inflation-Protected Security 0.125% 20162 | 21,515 | 21,455 |
| U.S. Treasury Inflation-Protected Security 2.00% 20162 | 23,927 | 24,289 |
| U.S. Treasury Inflation-Protected Security 2.375% 20172 | 23,549 | 24,724 |
| U.S. Treasury Inflation-Protected Security 0.125% 20182 | 36,980 | 36,887 |
| U.S. Treasury Inflation-Protected Security 0.125% 20192 | 168,979 | 167,465 |
| U.S. Treasury Inflation-Protected Security 1.375% 20202 | 13,177 | 13,863 |
| U.S. Treasury Inflation-Protected Security 0.625% 20212 | 15,266 | 15,515 |
| U.S. Treasury Inflation-Protected Security 0.125% 20222 | 17,781 | 17,393 |
| U.S. Treasury Inflation-Protected Security 0.125% 20232 | 35,059 | 34,048 |
| U.S. Treasury Inflation-Protected Security 0.375% 20232 | 66,908 | 66,431 |
| U.S. Treasury Inflation-Protected Security 0.125% 20242 | 208,106 | 201,369 |
| U.S. Treasury Inflation-Protected Security 0.625% 20242 | 256,730 | 259,051 |
| U.S. Treasury Inflation-Protected Security 2.00% 20262 | 28,713 | 33,039 |
| U.S. Treasury Inflation-Protected Security 1.75% 20282 | 9,521 | 10,820 |
| U.S. Treasury Inflation-Protected Security 0.75% 20422 | 69,357 | 67,936 |
| U.S. Treasury Inflation-Protected Security 0.625% 20432 | 78,209 | 74,145 |
| U.S. Treasury Inflation-Protected Security 1.375% 20442 | 373,313 | 426,681 |
| | | 1,816,451 |
| Total U.S. Treasury bonds & notes | | 9,640,722 |
Corporate bonds & notes 27.25%
Financials 7.75% | | |
| ACE INA Holdings Inc. 2.60% 2015 | 19,990 | 20,309 |
| ACE INA Holdings Inc. 3.35% 2024 | 8,700 | 8,809 |
| Alexandria Real Estate Equities, Inc. 2.75% 2020 | 3,990 | 3,956 |
| Alexandria Real Estate Equities, Inc. 3.90% 2023 | 2,250 | 2,261 |
| Alexandria Real Estate Equities, Inc. 4.50% 2029 | 755 | 775 |
| Allianz SE, 5.625% 2042 | €1,200 | 1,759 |
| Allianz SE, 4.75% (undated)3 | 800 | 1,080 |
| American Campus Communities, Inc. 3.75% 2023 | $17,460 | 17,461 |
| American Campus Communities, Inc. 4.125% 2024 | 6,310 | 6,386 |
| American Express Co. 6.15% 2017 | 150 | 167 |
| American Express Co. 1.55% 2018 | 15,500 | 15,365 |
The Bond Fund of America — Page 2 of 37
Bonds, notes & other debt instruments
Corporate bonds & notes (continued)
Financials (continued) | Principal amount
(000) | Value
(000) |
| American Express Credit Co. 1.75% 2015 | $14,500 | $14,582 |
| American Express Credit Co. 1.55% 2017 | 5,090 | 5,104 |
| American International Group, Inc. 2.30% 2019 | 8,390 | 8,408 |
| American International Group, Inc. 3.375% 2020 | 3,000 | 3,120 |
| American International Group, Inc. 4.125% 2024 | 3,740 | 3,989 |
| American International Group, Inc. 4.50% 2044 | 6,010 | 6,376 |
| American Tower Corp. 4.625% 2015 | 7,000 | 7,063 |
| American Tower Corp. 3.40% 2019 | 18,075 | 18,415 |
| American Tower Corp. 5.90% 2021 | 2,000 | 2,255 |
| ANZ National (International) Ltd. 3.125% 20154 | 16,500 | 16,748 |
| Assicurazioni Generali SPA 7.75% 20423 | €3,000 | 4,549 |
| Assicurazioni Generali SPA 10.125% 2042 | 3,700 | 6,212 |
| AvalonBay Communities, Inc. 3.625% 2020 | $8,465 | 8,815 |
| AXA SA 8.60% 2030 | 6,715 | 9,139 |
| AXA SA, Series B, junior subordinated 6.379% (undated)3,4 | 5,065 | 5,508 |
| Banco de Crédito del Perú 5.375% 20204 | 7,000 | 7,595 |
| Bank of America Corp., Series L, 3.625% 2016 | 9,700 | 9,977 |
| Bank of America Corp. 3.75% 2016 | 11,890 | 12,323 |
| Bank of America Corp. 1.25% 2017 | 13,000 | 12,978 |
| Bank of America Corp. 2.60% 2019 | 26,850 | 27,074 |
| Bank of America Corp., Series L, 2.65% 2019 | 24,300 | 24,503 |
| Bank of America Corp. 5.625% 2020 | 10,500 | 11,969 |
| Bank of America Corp. 3.30% 2023 | 6,815 | 6,823 |
| Bank of America Corp. 4.00% 2024 | 15,980 | 16,658 |
| Bank of America Corp. 4.20% 2024 | 8,775 | 8,950 |
| Bank of America Corp. 4.25% 2026 | 15,765 | 15,751 |
| Bank of America Corp. junior subordinated 6.50% noncumulative (undated)3 | 2,250 | 2,296 |
| Bank of India 3.625% 20184 | 5,000 | 5,115 |
| Bank of New York Mellon Corp., Series G, 2.50% 2016 | 16,000 | 16,312 |
| Barclays Bank PLC 2.50% 2019 | 6,210 | 6,299 |
| Barclays Bank PLC 6.00% 2021 | €6,800 | 10,107 |
| Barclays Bank PLC 10.179% 20214 | $16,205 | 21,811 |
| BB&T Corp. 1.00% 2017 | 13,000 | 12,902 |
| BB&T Corp. 2.45% 2020 | 42,600 | 42,537 |
| BBVA Bancomer SA 4.50% 20164 | 1,250 | 1,294 |
| BBVA Bancomer SA 6.50% 20214 | 2,355 | 2,562 |
| Berkshire Hathaway Finance Corp. 4.30% 2043 | 1,000 | 1,065 |
| Berkshire Hathaway Inc. 2.20% 2016 | 14,000 | 14,301 |
| Berkshire Hathaway Inc. 2.00% 2018 | 5,210 | 5,273 |
| Berkshire Hathaway Inc. 2.90% 2020 | 2,400 | 2,464 |
| Berkshire Hathaway Inc. 3.00% 2022 | 4,575 | 4,654 |
| Berkshire Hathaway Inc. 4.40% 2042 | 2,000 | 2,160 |
| BNP Paribas 3.60% 2016 | 14,000 | 14,397 |
| BNP Paribas 4.25% 2024 | 5,330 | 5,396 |
| BPCE SA group 5.70% 20234 | 22,130 | 23,834 |
| BPCE SA group 4.625% 20244 | 2,000 | 1,945 |
| BPCE SA group 5.15% 20244 | 9,845 | 10,164 |
| BPCE SA group 4.50% 20254 | 4,875 | 4,773 |
| Brandywine Operating Partnership, LP 5.70% 2017 | 25 | 27 |
| Brandywine Operating Partnership, LP 3.95% 2023 | 100 | 101 |
| Charles Schwab Corp, 2.20% 2018 | 1,390 | 1,409 |
| CIT Group Inc. 4.25% 2017 | 1,400 | 1,431 |
| CIT Group Inc. 3.875% 2019 | 3,600 | 3,600 |
| Citigroup Inc. 4.587% 2015 | 13,200 | 13,645 |
The Bond Fund of America — Page 3 of 37
Bonds, notes & other debt instruments
Corporate bonds & notes (continued)
Financials (continued) | Principal amount
(000) | Value
(000) |
| Citigroup Inc. 3.953% 2016 | $8,300 | $8,621 |
| Citigroup Inc. 4.45% 2017 | 4,000 | 4,231 |
| Citigroup Inc. 6.125% 2017 | 7,000 | 7,811 |
| Citigroup Inc. 2.50% 2019 | 9,500 | 9,514 |
| Citigroup Inc. 2.55% 2019 | 15,080 | 15,194 |
| Citigroup Inc. 8.50% 2019 | 5,695 | 7,103 |
| CME Group Inc. 5.30% 2043 | 11,850 | 14,415 |
| CNA Financial Corp. 7.35% 2019 | 2,770 | 3,313 |
| CNA Financial Corp. 3.95% 2024 | 9,195 | 9,315 |
| Corporate Office Properties Trust 3.60% 2023 | 2,834 | 2,728 |
| Credit Suisse Group AG 1.375% 2017 | 9,400 | 9,381 |
| Credit Suisse Group AG 2.30% 2019 | 9,400 | 9,394 |
| Credit Suisse Group AG 3.00% 2021 | 7,020 | 6,998 |
| Credit Suisse Group AG 3.625% 2024 | 5,000 | 5,092 |
| Crescent Resources 10.25% 20174 | 1,425 | 1,535 |
| DCT Industrial Trust Inc. 4.50% 2023 | 19,230 | 20,061 |
| Developers Diversified Realty Corp. 5.50% 2015 | 13,863 | 14,067 |
| Developers Diversified Realty Corp. 9.625% 2016 | 18,706 | 20,544 |
| Developers Diversified Realty Corp. 7.50% 2017 | 16,896 | 18,941 |
| Developers Diversified Realty Corp. 4.75% 2018 | 1,225 | 1,310 |
| Developers Diversified Realty Corp. 7.875% 2020 | 9,047 | 11,171 |
| Discover Financial Services 2.00% 2018 | 5,200 | 5,190 |
| Discover Financial Services 4.20% 2023 | 12,283 | 12,912 |
| Eole Finance SPC, 2.341% 20244,5 | 1,884 | 1,860 |
| ERP Operating LP 6.584% 2015 | 10,000 | 10,040 |
| ERP Operating LP 7.125% 2017 | 5,595 | 6,387 |
| ERP Operating LP 4.625% 2021 | 2,045 | 2,240 |
| ERP Operating LP 4.50% 2044 | 5,400 | 5,651 |
| Essex Portfolio L.P. 3.25% 2023 | 4,935 | 4,784 |
| Essex Portfolio L.P. 3.875% 2024 | 9,210 | 9,391 |
| Franklin Resources, Inc. 1.375% 2017 | 2,700 | 2,692 |
| Franklin Resources, Inc. 2.80% 2022 | 1,300 | 1,300 |
| Goldman Sachs Group, Inc. 3.625% 2016 | 27,625 | 28,357 |
| Goldman Sachs Group, Inc. 1.041% 20173 | 8,000 | 7,994 |
| Goldman Sachs Group, Inc. 2.55% 2019 | 52,685 | 52,493 |
| Goldman Sachs Group, Inc. 5.25% 2021 | 3,300 | 3,728 |
| Goldman Sachs Group, Inc. 5.75% 2022 | 5,000 | 5,789 |
| Goldman Sachs Group, Inc. 3.625% 2023 | 14,095 | 14,298 |
| Goldman Sachs Group, Inc. 3.85% 2024 | 22,265 | 22,862 |
| Goldman Sachs Group, Inc. 4.00% 2024 | 41,060 | 42,675 |
| Goodman Funding Pty Ltd. 6.375% 20204 | 8,425 | 9,727 |
| Goodman Funding Pty Ltd. 6.00% 20224 | 20,000 | 22,827 |
| HBOS PLC 6.75% 20184 | 7,610 | 8,500 |
| Hospitality Properties Trust 6.30% 2016 | 28,918 | 30,222 |
| Hospitality Properties Trust 6.70% 2018 | 28,250 | 31,233 |
| Hospitality Properties Trust 5.00% 2022 | 10,800 | 11,398 |
| Hospitality Properties Trust 4.50% 2023 | 11,265 | 11,484 |
| Hospitality Properties Trust 4.50% 2025 | 2,280 | 2,300 |
| HSBC Bank PLC 1.50% 20184 | 12,650 | 12,523 |
| HSBC Holdings PLC 4.125% 20204 | 9,453 | 10,246 |
| HSBC Holdings PLC 4.25% 2024 | 15,500 | 16,160 |
| HSBC Holdings PLC 5.25% 2044 | 1,500 | 1,687 |
| HSBK (Europe) BV 7.25% 20214 | 6,710 | 6,625 |
| Icahn Enterprises Finance Corp. 3.50% 2017 | 7,350 | 7,368 |
The Bond Fund of America — Page 4 of 37
Bonds, notes & other debt instruments
Corporate bonds & notes (continued)
Financials (continued) | Principal amount
(000) | Value
(000) |
| Intercontinentalexchange, Inc. 2.50% 2018 | $1,735 | $1,768 |
| Intesa Sanpaolo SpA 5.017% 20244 | 22,080 | 21,469 |
| iStar Financial Inc. 4.00% 2017 | 4,175 | 4,076 |
| iStar Financial Inc., Series B, 9.00% 2017 | 6,000 | 6,585 |
| JPMorgan Chase & Co. 3.40% 2015 | 2,500 | 2,533 |
| JPMorgan Chase & Co. 1.35% 2017 | 13,000 | 13,007 |
| JPMorgan Chase & Co. 1.625% 2018 | 5,680 | 5,623 |
| JPMorgan Chase & Co. 3.20% 2023 | 5,000 | 5,007 |
| JPMorgan Chase & Co. 3.625% 2024 | 2,280 | 2,337 |
| JPMorgan Chase & Co. 3.875% 2024 | 41,460 | 41,545 |
| JPMorgan Chase & Co., Series-V, junior subordinated, perpetual, 5.00% (undated)3 | 7,500 | 7,376 |
| Keybank National Association 2.50% 2019 | 13,500 | 13,571 |
| Kimco Realty Corp., Series C, 4.904% 2015 | 1,770 | 1,779 |
| Kimco Realty Corp., Series C, 5.783% 2016 | 9,000 | 9,483 |
| Kimco Realty Corp. 5.70% 2017 | 28,450 | 31,004 |
| Kimco Realty Corp. 4.30% 2018 | 10,000 | 10,714 |
| Kimco Realty Corp. 6.875% 2019 | 5,440 | 6,454 |
| Leucadia National Corp. 5.50% 2023 | 4,695 | 4,825 |
| Liberty Mutual Group Inc. 6.70% 20164 | 6,250 | 6,785 |
| Liberty Mutual Group Inc. 4.85% 20444 | 1,600 | 1,633 |
| Lloyds Banking Group PLC 2.30% 2018 | 1,010 | 1,020 |
| Lloyds Banking Group PLC 2.35% 2019 | 6,775 | 6,778 |
| Lloyds Banking Group PLC 6.50% 20204 | 4,400 | 5,105 |
| Lloyds Banking Group PLC 4.50% 2024 | 31,200 | 31,547 |
| Merrill Lynch & Co., Inc. 4.625% 2018 | €6,280 | 8,556 |
| MetLife Global Funding I 2.50% 20154 | $17,000 | 17,249 |
| MetLife Global Funding I 2.30% 20194 | 20,505 | 20,606 |
| Metlife, Inc. 3.60% 2024 | 9,965 | 10,247 |
| Morgan Stanley 3.80% 2016 | 8,850 | 9,147 |
| Morgan Stanley 2.125% 2018 | 19,745 | 19,774 |
| Morgan Stanley 2.375% 2019 | 34,495 | 34,390 |
| Morgan Stanley 2.50% 2019 | 19,675 | 19,712 |
| Morgan Stanley 3.70% 2024 | 31,960 | 32,462 |
| Morgan Stanley, Series F, 3.875% 2024 | 9,185 | 9,443 |
| Morgan Stanley 4.35% 2026 | 11,475 | 11,559 |
| Morgan Stanley 6.375% 2042 | 900 | 1,200 |
| National Australia Bank 2.40% 20194 | 16,595 | 16,583 |
| New York Life Global Funding 2.10% 20194 | 17,000 | 17,077 |
| NN Group NV, 4.50% (undated)3 | €8,750 | 10,580 |
| Nordea Bank AB 4.875% 20214 | $4,185 | 4,540 |
| Northern Trust Corp. 5.85% 20174 | 3,750 | 4,179 |
| Ocwen Financial Corp. 6.625% 20194 | 2,500 | 2,300 |
| Piedmont Operating Partnership LP 3.40% 2023 | 5,300 | 5,145 |
| PNC Bank 2.40% 2019 | 26,000 | 26,139 |
| PNC Financial Services Group, Inc. 2.854% 2022 | 19,960 | 19,663 |
| PNC Financial Services Group, Inc. 3.90% 2024 | 5,225 | 5,321 |
| PNC Funding Corp. 3.30% 2022 | 8,000 | 8,240 |
| PNC Preferred Funding Trust I, junior subordinated 1.884% (undated)3,4 | 12,700 | 12,176 |
| PRICOA Global Funding I 1.35% 20174 | 16,500 | 16,444 |
| Prologis, Inc. 2.75% 2019 | 6,000 | 6,091 |
| Prologis, Inc. 3.35% 2021 | 12,500 | 12,685 |
| Prologis, Inc. 4.25% 2023 | 6,390 | 6,764 |
| Prudential Financial, Inc. 2.30% 2018 | 2,895 | 2,931 |
| Prudential Financial, Inc. 3.50% 2024 | 19,800 | 20,166 |
The Bond Fund of America — Page 5 of 37
Bonds, notes & other debt instruments
Corporate bonds & notes (continued)
Financials (continued) | Principal amount
(000) | Value
(000) |
| Prudential Financial, Inc. 4.60% 2044 | $2,900 | $3,069 |
| QBE Insurance Group Ltd. 2.40% 20184 | 18,590 | 18,607 |
| Rabobank Nederland 2.25% 2019 | 13,000 | 13,109 |
| Rabobank Nederland 4.625% 2023 | 44,585 | 47,378 |
| Realogy Corp. 4.50% 20194 | 6,375 | 6,343 |
| Realogy Corp. 5.25% 20214 | 1,025 | 1,001 |
| Realogy Corp., LOC, 4.40% 20163,5,6 | 13 | 13 |
| Regions Financial Corp., Series A-I, 5.20% 2015 | 590 | 596 |
| Regions Financial Corp. 5.75% 2015 | 5,725 | 5,844 |
| Regions Financial Corp. 2.00% 2018 | 5,850 | 5,798 |
| Royal Bank of Scotland PLC 5.625% 2020 | 6,435 | 7,336 |
| RSA Insurance Group PLC 9.375% 20393 | £5,140 | 9,857 |
| Scentre Group 2.375% 20194 | $6,170 | 6,132 |
| Scentre Group, 3.50% 20254 | 19,000 | 19,115 |
| Simon Property Group, LP 10.35% 2019 | 8,995 | 11,775 |
| Sovereign Bancorp, Inc. 8.75% 2018 | 1,880 | 2,241 |
| Svenska Handelsbanken AB 2.25% 2019 | 11,100 | 11,167 |
| Swiss RE Treasury 2.875% 20224 | 4,025 | 3,958 |
| UDR, Inc., Series A, 5.25% 2015 | 4,430 | 4,435 |
| UDR, Inc. 3.70% 2020 | 3,615 | 3,752 |
| Unum Group 7.125% 2016 | 10,100 | 11,040 |
| Unum Group 5.625% 2020 | 345 | 389 |
| UnumProvident Finance Co. PLC 6.85% 20154 | 1,224 | 1,282 |
| US Bancorp., Series T, 1.65% 2017 | 13,000 | 13,105 |
| US Bancorp. 3.70% 2024 | 5,500 | 5,793 |
| VEB Finance Ltd. 6.902% 20204 | 9,100 | 7,328 |
| VEB Finance Ltd. 6.80% 20254 | 500 | 397 |
| WEA Finance LLC 1.75% 20174 | 4,750 | 4,728 |
| WEA Finance LLC 2.70% 20194 | 15,940 | 15,953 |
| WEA Finance LLC 3.75% 20244 | 18,760 | 19,076 |
| WEA Finance LLC 4.75% 20444 | 5,495 | 5,884 |
| Wells Fargo & Co. 3.676% 2016 | 14,000 | 14,531 |
| Wells Fargo & Co. 3.30% 2024 | 29,610 | 29,832 |
| Westpac Banking Corp. 3.00% 2015 | 14,400 | 14,710 |
| | | 2,167,735 |
| Energy 3.40% | | |
| Alpha Natural Resources, Inc. 9.75% 2018 | 3,415 | 1,554 |
| Alpha Natural Resources, Inc. 7.50% 20204 | 2,275 | 1,439 |
| American Energy (Marcellus), Term Loan B, 5.25% 20203,5,6 | 1,400 | 1,239 |
| American Energy (Marcellus), Term Loan A, 8.50% 20213,5,6 | 1,125 | 965 |
| American Energy (Permian Basin) 7.125% 20204 | 1,100 | 820 |
| American Energy (Permian Basin) 7.375% 20214 | 1,000 | 740 |
| Anadarko Petroleum Corp. 5.95% 2016 | 13,500 | 14,446 |
| Anadarko Petroleum Corp. 6.375% 2017 | 12,500 | 13,907 |
| Anadarko Petroleum Corp. 8.70% 2019 | 6,860 | 8,411 |
| Anadarko Petroleum Corp. 3.45% 2024 | 2,310 | 2,260 |
| Anadarko Petroleum Corp. 6.45% 2036 | 685 | 826 |
| Anadarko Petroleum Corp. 6.20% 2040 | 635 | 746 |
| Anadarko Petroleum Corp. 4.50% 2044 | 555 | 541 |
| Arch Coal, Inc. 7.00% 2019 | 1,125 | 343 |
| Arch Coal, Inc. 8.00% 20194 | 725 | 406 |
| Arch Coal, Inc. 9.875% 2019 | 350 | 121 |
| BG Energy Capital PLC 2.50% 20154 | 7,200 | 7,313 |
The Bond Fund of America — Page 6 of 37
Bonds, notes & other debt instruments
Corporate bonds & notes (continued)
Energy (continued) | Principal amount
(000) | Value
(000) |
| BG Energy Capital PLC 2.875% 20164 | $8,635 | $8,857 |
| Blue Racer Midstream LLC / Blue Racer Finance Corp. 6.125% 20224 | 315 | 305 |
| Boardwalk Pipeline Partners 3.375% 2023 | 5,000 | 4,563 |
| Boardwalk Pipelines, LP 4.95% 2024 | 3,455 | 3,442 |
| Bonanza Creek Energy, Inc. 6.75% 2021 | 425 | 376 |
| BP Capital Markets PLC 0.657% 20163 | 13,380 | 13,388 |
| Canadian Natural Resources Ltd. 3.45% 2021 | 6,185 | 6,111 |
| Canadian Natural Resources Ltd. 3.80% 2024 | 1,780 | 1,750 |
| Cenovus Energy Inc. 3.00% 2022 | 25,115 | 23,546 |
| Cenovus Energy Inc. 3.80% 2023 | 6,785 | 6,638 |
| Chevron Corp. 2.193% 2019 | 7,595 | 7,632 |
| Chevron Corp. 2.355% 2022 | 7,500 | 7,286 |
| CNOOC Finance (2013) Ltd. 3.00% 2023 | 2,615 | 2,479 |
| Denbury Resources Inc. 4.625% 2023 | 625 | 545 |
| Devon Energy Corp. 2.25% 2018 | 10,160 | 10,133 |
| Devon Energy Corp. 3.25% 2022 | 12,825 | 12,619 |
| Diamond Offshore Drilling, Inc. 4.875% 2043 | 24,970 | 21,348 |
| Ecopetrol SA 5.875% 2023 | 2,700 | 2,865 |
| Ecopetrol SA 5.875% 2045 | 6,065 | 5,640 |
| Enbridge Energy Partners, LP, Series B, 6.50% 2018 | 25,120 | 28,473 |
| Enbridge Energy Partners, LP 9.875% 2019 | 27,005 | 34,192 |
| Enbridge Energy Partners, LP 5.20% 2020 | 1,500 | 1,636 |
| Enbridge Energy Partners, LP 4.20% 2021 | 6,100 | 6,381 |
| Enbridge Energy Partners, LP 5.50% 2040 | 3,500 | 3,443 |
| Enbridge Inc. 5.60% 2017 | 17,750 | 19,281 |
| Enbridge Inc. 4.00% 2023 | 22,440 | 21,955 |
| Enbridge Inc. 3.50% 2024 | 3,500 | 3,294 |
| EnLink Midstream Partners, LP 4.40% 2024 | 9,930 | 10,078 |
| EnLink Midstream Partners, LP 5.05% 2045 | 2,660 | 2,580 |
| Enterprise Products Operating LLC 2.55% 2019 | 2,050 | 2,032 |
| Enterprise Products Operating LLC 5.20% 2020 | 1,925 | 2,126 |
| Enterprise Products Operating LLC 4.05% 2022 | 8,300 | 8,625 |
| Enterprise Products Operating LLC 3.35% 2023 | 7,445 | 7,377 |
| Enterprise Products Operating LLC 3.90% 2024 | 9,585 | 9,780 |
| Enterprise Products Operating LLC 3.75% 2025 | 15,205 | 15,294 |
| Enterprise Products Operating LLC 4.85% 2044 | 3,860 | 4,041 |
| Exxon Mobil Corp. 0.921% 2017 | 13,000 | 12,991 |
| Exxon Mobil Corp. 1.819% 2019 | 3,670 | 3,682 |
| Exxon Mobil Corp. 3.176% 2024 | 2,005 | 2,072 |
| Gazprom OJSC 5.092% 20154 | 4,825 | 4,741 |
| Gazprom OJSC 6.51% 20224 | 14,500 | 13,054 |
| Gazprom OJSC, Series 9, 6.51% 2022 | 5,000 | 4,501 |
| Kinder Morgan Energy Partners, LP 5.625% 2015 | 12,600 | 12,665 |
| Kinder Morgan Energy Partners, LP 6.00% 2017 | 15,000 | 16,212 |
| Kinder Morgan Energy Partners, LP 9.00% 2019 | 4,395 | 5,333 |
| Kinder Morgan Energy Partners, LP 5.30% 2020 | 1,250 | 1,348 |
| Kinder Morgan Energy Partners, LP 6.85% 2020 | 16,835 | 19,358 |
| Kinder Morgan Energy Partners, LP 3.50% 2021 | 955 | 941 |
| Kinder Morgan Energy Partners, LP 4.15% 2022 | 5,000 | 5,046 |
| Kinder Morgan Energy Partners, LP 3.50% 2023 | 6,160 | 5,859 |
| Kinder Morgan Energy Partners, LP 4.15% 2024 | 7,900 | 7,895 |
| Kinder Morgan Energy Partners, LP 4.25% 2024 | 13,815 | 13,869 |
| Kinder Morgan Energy Partners, LP 6.95% 2038 | 2,350 | 2,720 |
| Kinder Morgan Energy Partners, LP 6.55% 2040 | 2,000 | 2,279 |
The Bond Fund of America — Page 7 of 37
Bonds, notes & other debt instruments
Corporate bonds & notes (continued)
Energy (continued) | Principal amount
(000) | Value
(000) |
| Kinder Morgan Energy Partners, LP 5.00% 2042 | $3,000 | $2,861 |
| Kinder Morgan Energy Partners, LP 5.40% 2044 | 6,800 | 6,839 |
| Kinder Morgan Energy Partners, LP 5.50% 2044 | 4,479 | 4,570 |
| Kinder Morgan, Inc. 3.05% 2019 | 6,810 | 6,763 |
| Kinder Morgan, Inc. 4.30% 2025 | 27,750 | 27,900 |
| Kinder Morgan, Inc. 5.30% 2034 | 8,300 | 8,450 |
| Kinder Morgan, Inc. 5.55% 2045 | 25,150 | 25,854 |
| Laredo Petroleum, Inc. 9.50% 2019 | 450 | 450 |
| NGL Energy Partners LP 6.875% 20214 | 425 | 421 |
| NGPL PipeCo LLC 9.625% 20194 | 3,725 | 3,753 |
| Oasis Petroleum Inc. 6.875% 2022 | 1,425 | 1,304 |
| Odebrecht Drilling Norbe VIII/IX Ltd 6.35% 20214,5 | 4,977 | 4,678 |
| Odebrecht Offshore Drilling Finance Ltd. 6.75% 20224,5 | 2,941 | 2,698 |
| PDC Energy Inc. 7.75% 2022 | 1,250 | 1,194 |
| Peabody Energy Corp. 7.375% 2016 | 225 | 232 |
| Peabody Energy Corp. 6.00% 2018 | 13,395 | 12,223 |
| Pemex Project Funding Master Trust, Series 13, 6.625% 2035 | 7,915 | 9,181 |
| Petrobras Global Finance Co. 6.25% 2024 | 8,580 | 8,186 |
| Petrobras Global Finance Co. 5.625% 2043 | 1,060 | 869 |
| Petrobras International Finance Co. 5.375% 2021 | 810 | 755 |
| Petróleos Mexicanos 4.875% 2022 | 1,115 | 1,171 |
| Petróleos Mexicanos 6.50% 2041 | 6,150 | 7,088 |
| Petróleos Mexicanos 5.50% 2044 | 18,230 | 18,686 |
| Petróleos Mexicanos 5.50% 20444 | 8,410 | 8,620 |
| QGOG Atlantic/Alaskan Rigs Ltd. 5.25% 20194,5 | 16,583 | 15,671 |
| QGOG Constellation SA 6.25% 20194 | 2,775 | 1,755 |
| Ras Laffan Liquefied Natural Gas II 5.298% 20204,5 | 9,768 | 10,525 |
| Ras Laffan Liquefied Natural Gas III 5.832% 20165 | 758 | 791 |
| Ras Laffan Liquefied Natural Gas III 6.332% 20275 | 2,000 | 2,326 |
| Rice Energy Inc. 6.25% 20224 | 325 | 304 |
| Sabine Pass Liquefaction, LLC 5.625% 2021 | 1,400 | 1,382 |
| Sabine Pass Liquefaction, LLC 5.75% 2024 | 900 | 888 |
| Schlumberger Investment SA 3.65% 2023 | 6,550 | 6,860 |
| Shell International Finance BV 3.10% 2015 | 10,000 | 10,128 |
| Shell International Finance BV 2.00% 2018 | 8,105 | 8,168 |
| Spectra Energy Partners, LP 2.95% 2018 | 2,430 | 2,489 |
| Statoil ASA 0.524% 20183 | 7,690 | 7,686 |
| Statoil ASA 1.95% 2018 | 6,110 | 6,114 |
| Statoil ASA 2.25% 2019 | 3,835 | 3,842 |
| Statoil ASA 2.75% 2021 | 10,765 | 10,814 |
| Statoil ASA 3.25% 2024 | 6,210 | 6,243 |
| Targa Resources Corp. 4.125% 20194 | 1,000 | 967 |
| Teekay Corp. 8.50% 2020 | 2,000 | 2,234 |
| Tesoro Logistics LP 5.50% 20194 | 625 | 622 |
| Total Capital International 2.10% 2019 | 13,000 | 13,019 |
| Total Capital International 3.75% 2024 | 15,000 | 15,572 |
| Total Capital SA 3.00% 2015 | 17,000 | 17,200 |
| TransCanada PipeLines Ltd. 6.50% 2018 | 7,500 | 8,515 |
| Transocean Inc. 5.05% 2016 | 2,405 | 2,418 |
| Transocean Inc. 2.50% 2017 | 4,470 | 3,955 |
| Transocean Inc. 6.375% 2021 | 23,480 | 21,689 |
| Transocean Inc. 3.80% 2022 | 6,300 | 5,113 |
| Transportadora de Gas Peru SA 4.25% 20284,5 | 4,570 | 4,433 |
| Western Gas Partners LP 2.60% 2018 | 515 | 517 |
The Bond Fund of America — Page 8 of 37
Bonds, notes & other debt instruments
Corporate bonds & notes (continued)
Energy (continued) | Principal amount
(000) | Value
(000) |
| Western Gas Partners LP 4.00% 2022 | $5,370 | $5,452 |
| Williams Companies, Inc. 4.55% 2024 | 1,900 | 1,770 |
| Williams Partners LP 3.80% 2015 | 15,800 | 15,846 |
| Williams Partners LP 5.25% 2020 | 11,625 | 12,634 |
| Williams Partners LP 4.50% 2023 | 3,975 | 4,019 |
| Williams Partners LP 4.30% 2024 | 18,870 | 18,871 |
| Williams Partners LP 3.90% 2025 | 3,435 | 3,308 |
| Williams Partners LP 5.40% 2044 | 8,000 | 7,860 |
| Williams Partners LP 4.90% 2045 | 2,895 | 2,722 |
| Woodside Finance Ltd. 4.60% 20214 | 9,565 | 10,204 |
| | | 950,426 |
| Health care 3.40% | | |
| AbbVie Inc. 1.75% 2017 | 8,750 | 8,776 |
| AbbVie Inc. 2.90% 2022 | 31,865 | 31,426 |
| AbbVie Inc. 4.40% 2042 | 4,795 | 4,967 |
| Aetna Inc. 1.50% 2017 | 6,730 | 6,683 |
| Aetna Inc. 2.20% 2019 | 7,450 | 7,408 |
| Aetna Inc. 4.75% 2044 | 1,000 | 1,107 |
| Amgen Inc. 2.20% 2019 | 415 | 414 |
| Baxter International Inc. 1.85% 2018 | 4,850 | 4,830 |
| Bayer AG 2.375% 20194 | 17,175 | 17,262 |
| Bayer AG 3.00% 20214 | 12,940 | 13,065 |
| Bayer AG 3.375% 20244 | 12,445 | 12,690 |
| Becton, Dickinson and Co. 1.80% 2017 | 8,500 | 8,538 |
| Becton, Dickinson and Co. 2.675% 2019 | 11,285 | 11,447 |
| Becton, Dickinson and Co. 3.734% 2024 | 26,015 | 26,828 |
| Becton, Dickinson and Co. 4.685% 2044 | 12,005 | 12,982 |
| Biogen Idec Inc. 6.875% 2018 | 17,000 | 19,606 |
| Boston Scientific Corp. 6.00% 2020 | 8,075 | 9,110 |
| Cardinal Health, Inc. 1.90% 2017 | 5,650 | 5,698 |
| Cardinal Health, Inc. 1.70% 2018 | 2,210 | 2,198 |
| Catholic Health Initiatives, Series 2012, 1.60% 2017 | 1,250 | 1,246 |
| Celgene Corp 3.625% 2024 | 21,300 | 21,792 |
| Celgene Corp 4.625% 2044 | 18,880 | 19,663 |
| Centene Corp. 5.75% 2017 | 1,265 | 1,347 |
| Centene Corp. 4.75% 2022 | 3,425 | 3,438 |
| Community Health Systems, Inc. 5.125% 2018 | 1,320 | 1,369 |
| ConvaTec Finance International SA 8.25% 20193,4,7 | 3,500 | 3,555 |
| DENTSPLY International Inc. 2.75% 2016 | 5,620 | 5,746 |
| Dignity Health 3.125% 2022 | 4,100 | 4,065 |
| DJO Finance LLC 9.75% 2017 | 5,175 | 5,201 |
| DJO Finance LLC 7.75% 2018 | 1,100 | 1,072 |
| DJO Finance LLC 9.875% 2018 | 1,625 | 1,657 |
| Express Scripts Inc. 3.125% 2016 | 15,127 | 15,558 |
| Express Scripts Inc. 2.65% 2017 | 5,500 | 5,627 |
| Forest Laboratories, Inc. 5.00% 20214 | 1,115 | 1,209 |
| Gilead Sciences, Inc. 3.70% 2024 | 19,410 | 20,397 |
| Gilead Sciences, Inc. 3.50% 2025 | 17,730 | 18,236 |
| Gilead Sciences, Inc. 4.80% 2044 | 4,360 | 4,856 |
| Gilead Sciences, Inc. 4.50% 2045 | 19,300 | 20,714 |
| GlaxoSmithKline Capital Inc. 5.65% 2018 | 15,000 | 16,911 |
| HCA Inc. 3.75% 2019 | 9,250 | 9,285 |
| HCA Inc. 6.50% 2020 | 1,090 | 1,224 |
The Bond Fund of America — Page 9 of 37
Bonds, notes & other debt instruments
Corporate bonds & notes (continued)
Health care (continued) | Principal amount
(000) | Value
(000) |
| Humana Inc. 2.625% 2019 | $2,870 | $2,873 |
| Humana Inc. 3.85% 2024 | 10,950 | 11,116 |
| Humana Inc. 4.95% 2044 | 12,605 | 13,456 |
| inVentiv Health Inc, Term Loan B4, 7.75% 20183,5,6 | 2,325 | 2,318 |
| inVentiv Health Inc. 9.00% 20184 | 4,465 | 4,577 |
| inVentiv Health Inc. 11.00% 20184 | 6,795 | 5,929 |
| inVentiv Health Inc. 12.00% 20183,4,7 | 9,765 | 9,228 |
| Jaguar Holding Co. 9.375% 20173,4,7 | 200 | 205 |
| Kindred Healthcare, Inc. 8.00% 20204 | 1,975 | 2,108 |
| Kinetic Concepts, Inc. 10.50% 2018 | 12,065 | 13,151 |
| Kinetic Concepts, Inc. 12.50% 2019 | 1,960 | 2,176 |
| McKesson Corp. 3.25% 2016 | 1,580 | 1,618 |
| McKesson Corp. 1.292% 2017 | 8,300 | 8,265 |
| McKesson Corp. 1.40% 2018 | 370 | 366 |
| McKesson Corp. 2.284% 2019 | 11,850 | 11,837 |
| McKesson Corp. 3.796% 2024 | 19,610 | 20,183 |
| McKesson Corp. 4.883% 2044 | 870 | 962 |
| Medco Health Solutions, Inc. 2.75% 2015 | 10,310 | 10,448 |
| Medtronic, Inc. 2.50% 20204 | 21,070 | 21,151 |
| Medtronic, Inc. 3.50% 20254 | 46,400 | 47,567 |
| Medtronic, Inc. 4.375% 20354 | 12,805 | 13,630 |
| Medtronic, Inc. 4.625% 2044 | 1,550 | 1,675 |
| Medtronic, Inc. 4.625% 20454 | 39,895 | 43,427 |
| Merck & Co., Inc. 2.80% 2023 | 17,590 | 17,500 |
| Multiplan Inc., Term Loan B, 3.75% 20213,5,6 | 9,290 | 9,052 |
| Novartis Capital Corp. 3.40% 2024 | 22,045 | 22,979 |
| Ortho-Clinical Diagnostics Inc., Term Loan B, 4.75% 20213,5,6 | 3,667 | 3,614 |
| Pfizer Inc. 7.20% 2039 | 3,524 | 5,140 |
| Pfizer Inc. 2.10% 2019 | 13,000 | 13,083 |
| Pfizer Inc. 3.40% 2024 | 5,210 | 5,431 |
| Pfizer Inc. 4.40% 2044 | 3,626 | 3,961 |
| PRA Holdings, Inc. 9.50% 20234 | 948 | 1,029 |
| Roche Holdings, Inc. 2.25% 20194 | 29,500 | 29,720 |
| Roche Holdings, Inc. 6.00% 20194 | 8,656 | 9,997 |
| Roche Holdings, Inc. 2.875% 20214 | 13,750 | 13,943 |
| Roche Holdings, Inc. 3.35% 20244 | 10,680 | 11,059 |
| Roche Holdings, Inc. 4.00% 20444 | 1,700 | 1,793 |
| Rotech Healthcare Inc., Term Loan A, 5.50% 20183,5,6,8 | 3,555 | 3,537 |
| Rotech Healthcare Inc., Term Loan B, 10.00% 20193,5,6,8 | 2,715 | 2,701 |
| Rotech Healthcare Inc., Term Loan, 13.00% 20203,5,6,7,8 | 5,830 | 5,800 |
| Tenet Healthcare Corp., First Lien, 4.75% 2020 | 1,035 | 1,056 |
| Tenet Healthcare Corp., First Lien, 6.00% 2020 | 8,830 | 9,504 |
| Thermo Fisher Scientific Inc. 1.30% 2017 | 14,130 | 14,059 |
| Thermo Fisher Scientific Inc. 2.40% 2019 | 2,405 | 2,411 |
| Thermo Fisher Scientific Inc. 3.30% 2022 | 2,875 | 2,884 |
| Thermo Fisher Scientific Inc. 4.15% 2024 | 18,290 | 19,325 |
| UnitedHealth Group Inc. 0.85% 2015 | 5,525 | 5,543 |
| UnitedHealth Group Inc. 1.40% 2017 | 6,095 | 6,094 |
| UnitedHealth Group Inc. 1.40% 2017 | 1,080 | 1,080 |
| UnitedHealth Group Inc. 6.00% 2017 | 17,920 | 19,882 |
| UnitedHealth Group Inc. 2.875% 2023 | 15,985 | 15,911 |
| VPI Escrow Corp. 6.75% 20184 | 3,650 | 3,892 |
| VPI Escrow Corp. 6.375% 20204 | 8,880 | 9,313 |
| VWR Funding, Inc. 7.25% 2017 | 6,325 | 6,633 |
The Bond Fund of America — Page 10 of 37
Bonds, notes & other debt instruments
Corporate bonds & notes (continued)
Health care (continued) | Principal amount
(000) | Value
(000) |
| WellPoint, Inc. 2.30% 2018 | $6,680 | $6,723 |
| WellPoint, Inc. 2.25% 2019 | 18,500 | 18,334 |
| WellPoint, Inc. 3.50% 2024 | 9,200 | 9,285 |
| | | 949,737 |
| Utilities 2.98% | | |
| Abu Dhabi National Energy Co. PJSC (TAQA) 5.875% 20214 | 1,055 | 1,224 |
| Abu Dhabi National Energy Co. PJSC (TAQA) 3.625% 20234 | 610 | 615 |
| Abu Dhabi National Energy Co. PJSC (TAQA) 6.50% 2036 | 1,500 | 1,877 |
| Abu Dhabi National Energy Co. PJSC (TAQA) 6.50% 20364 | 1,000 | 1,251 |
| American Electric Power Co. 1.65% 2017 | 7,180 | 7,188 |
| American Electric Power Co. 2.95% 2022 | 14,416 | 14,166 |
| Berkshire Hathaway Energy Co. 2.40% 20204 | 8,105 | 8,079 |
| Berkshire Hathaway Energy Co. 3.50% 20254 | 10,500 | 10,589 |
| Berkshire Hathaway Energy Co. 4.50% 20454 | 15,500 | 16,286 |
| CEZ, a s 4.25% 20224 | 1,510 | 1,612 |
| Cleveland Electric Illuminating Co. 8.875% 2018 | 12,864 | 15,890 |
| CMS Energy Corp. 8.75% 2019 | 11,330 | 14,198 |
| CMS Energy Corp. 6.25% 2020 | 11,431 | 13,251 |
| CMS Energy Corp. 5.05% 2022 | 18,057 | 20,275 |
| CMS Energy Corp. 3.875% 2024 | 16,231 | 16,886 |
| CMS Energy Corp. 4.70% 2043 | 2,795 | 2,991 |
| CMS Energy Corp. 4.875% 2044 | 3,481 | 3,824 |
| Colbun SA 6.00% 20204 | 2,400 | 2,663 |
| Colbun SA 4.50% 20244 | 2,450 | 2,458 |
| Comision Federal de Electricidad 4.875% 20244 | 2,500 | 2,619 |
| Consumers Energy Co. 2.85% 2022 | 12,500 | 12,517 |
| Consumers Energy Co., First Mortgage Bonds, 6.125% 2019 | 1,500 | 1,743 |
| Consumers Energy Co., First Mortgage Bonds, 6.70% 2019 | 731 | 872 |
| Consumers Energy Co., First Mortgage Bonds, 3.125% 2024 | 4,690 | 4,716 |
| Dominion Gas Holdings LLC 2.50% 2019 | 14,035 | 14,086 |
| Dominion Gas Holdings LLC 3.60 2024 | 16,575 | 16,896 |
| Dominion Gas Holdings LLC 4.60 2044 | 4,250 | 4,470 |
| Duke Energy Carolinas, Inc. 4.0% 2042 | 130 | 134 |
| Duke Energy Corp. 3.95% 2023 | 6,672 | 7,087 |
| Duke Energy Corp. 3.75% 2024 | 10,195 | 10,626 |
| Duke Energy Progress Inc. 4.15% 2044 | 880 | 940 |
| Dynegy Finance Inc. 7.375% 20224 | 700 | 713 |
| E.ON International Finance BV 5.80% 20184 | 15,000 | 16,742 |
| EDP Finance BV 4.125% 20204 | 30,600 | 30,821 |
| EDP Finance BV 5.25% 20214 | 7,000 | 7,383 |
| Electricité de France SA 1.15% 20174 | 1,000 | 1,000 |
| Electricité de France SA 4.875% 20444 | 3,850 | 4,290 |
| Electricité de France SA 5.25% (undated)4 | 3,000 | 3,082 |
| Electricité de France SA 6.00% 2114 | £1,000 | 2,115 |
| Empresa Nacional de Electricidad SA 8.625% 2015 | $3,000 | 3,123 |
| Empresa Nacional de Electricidad SA 4.25% 2024 | 1,500 | 1,514 |
| Enel Finance International SA 5.125% 20194 | 2,000 | 2,212 |
| Enel Finance International SA 6.00% 20394 | 2,210 | 2,606 |
| Enel Società per Azioni 8.75% 20733,4 | 9,500 | 11,079 |
| Entergy Arkansas, INC 3.05% 2023 | 6,100 | 6,112 |
| Entergy Corp. 4.70% 2017 | 9,900 | 10,431 |
| Eskom Holdings SOC Ltd. 5.75% 2021 | 11,000 | 11,110 |
| Iberdrola Finance Ireland 5.00% 20194 | 4,000 | 4,418 |
The Bond Fund of America — Page 11 of 37
Bonds, notes & other debt instruments
Corporate bonds & notes (continued)
Utilities (continued) | Principal amount
(000) | Value
(000) |
| Israel Electric Corp. Ltd. 8.10% 20964 | $6,250 | $6,852 |
| MidAmerican Energy Co. 3.50% 2024 | 1,268 | 1,315 |
| MidAmerican Energy Holdings Co. 5.75% 2018 | 35,700 | 40,037 |
| MidAmerican Energy Holdings Co. 3.75% 2023 | 9,223 | 9,634 |
| National Grid PLC 6.30% 2016 | 31,805 | 34,353 |
| National Rural Utilities Cooperative Finance Corp. 10.375% 2018 | 21,035 | 27,426 |
| Nevada Power Co., General and Refunding Mortgage Notes, Series V, 7.125% 2019 | 11,100 | 13,255 |
| Niagara Mohawk Power Corp. 3.508% 20244 | 7,400 | 7,637 |
| Niagara Mohawk Power Corp. 4.278% 20344 | 2,500 | 2,654 |
| Northern States Power Co., First Mortgage Bonds, 7.125% 2025 | 254 | 337 |
| Northern States Power Co. 5.25% 2035 | 2,885 | 3,520 |
| NRG Energy, Inc. 6.25% 2022 | 1,050 | 1,079 |
| NV Energy, Inc 6.25% 2020 | 31,400 | 36,937 |
| Ohio Power Co., Series G, 6.60% 2033 | 1,385 | 1,850 |
| Ohio Power Co., Series H, 6.60% 2033 | 723 | 954 |
| Pacific Gas and Electric Co. 8.25% 2018 | 4,000 | 4,817 |
| Pacific Gas and Electric Co. 2.45% 2022 | 7,500 | 7,229 |
| Pacific Gas and Electric Co. 3.25% 2023 | 21,950 | 22,032 |
| Pacific Gas and Electric Co. 3.85% 2023 | 4,684 | 4,884 |
| Pacific Gas and Electric Co. 3.40% 2024 | 19,803 | 20,081 |
| Pacific Gas and Electric Co. 3.75% 2024 | 4,470 | 4,663 |
| Pacific Gas and Electric Co. 4.30% 2045 | 8,482 | 8,744 |
| PacifiCorp., First Mortgage Bonds, 2.95% 2023 | 1,300 | 1,297 |
| PacifiCorp., First Mortgage Bonds, 3.60% 2024 | 1,530 | 1,584 |
| PG&E Corp. 2.40% 2019 | 7,445 | 7,464 |
| Progress Energy, Inc. 7.05% 2019 | 8,340 | 9,892 |
| Progress Energy, Inc. 7.00% 2031 | 2,500 | 3,445 |
| Progress Energy, Inc. 7.75% 2031 | 5,670 | 8,232 |
| Public Service Co. of Colorado 5.80% 2018 | 9,606 | 10,925 |
| Public Service Co. of Colorado 3.20% 2020 | 5,279 | 5,499 |
| Public Service Co. of Colorado 2.25% 2022 | 1,205 | 1,158 |
| Public Service Electric and Gas Co., Series E, 5.30% 2018 | 2,190 | 2,435 |
| Public Service Electric and Gas Co. 2.00% 2019 | 12,278 | 12,258 |
| Public Service Electric and Gas Co., 2.375% 2023 | 1,076 | 1,037 |
| Public Service Electric and Gas Co., 3.05% 2024 | 5,300 | 5,332 |
| Puget Sound Energy Inc. 6.724% 2036 | 2,250 | 3,276 |
| Puget Sound Energy, Inc., First Lien, 6.50% 2020 | 12,091 | 14,227 |
| Puget Sound Energy, Inc., First Lien, 6.00% 2021 | 13,305 | 15,587 |
| Puget Sound Energy, Inc., First Lien, 5.625% 2022 | 16,162 | 18,731 |
| Scottish Power PLC 5.375% 2015 | 10,000 | 10,082 |
| Southern Co. 2.15% 2019 | 9,325 | 9,275 |
| Tampa Electric Co. 2.60% 2022 | 4,575 | 4,484 |
| Tampa Electric Co. 4.10% 2042 | 5,060 | 5,194 |
| Tampa Electric Co. 4.35% 2044 | 1,455 | 1,558 |
| Teco Finance, Inc. 6.75% 2015 | 200 | 204 |
| Teco Finance, Inc. 4.00% 2016 | 60 | 62 |
| Teco Finance, Inc. 5.15% 2020 | 11,923 | 13,329 |
| Tri-State Generation and Transmission Assn. Inc., Pass Through Trust, Series 2003-A, 6.04% 20184,5 | 1,230 | 1,305 |
| Virginia Electric and Power Co., Series B, 5.95% 2017 | 10,000 | 11,163 |
| Virginia Electric and Power Co. 1.20% 2018 | 9,600 | 9,488 |
| Virginia Electric and Power Co. 2.95% 2022 | 3,535 | 3,576 |
| Virginia Electric and Power Co. 3.45% 2024 | 6,310 | 6,510 |
| Virginia Electric and Power Co. 4.45% 2044 | 11,885 | 13,037 |
The Bond Fund of America — Page 12 of 37
Bonds, notes & other debt instruments
Corporate bonds & notes (continued)
Utilities (continued) | Principal amount
(000) | Value
(000) |
| Xcel Energy Inc. 4.70% 2020 | $5,680 | $6,310 |
| Xcel Energy Inc. 6.50% 2036 | 3,178 | 4,321 |
| | | 833,347 |
| Consumer discretionary 2.80% | | |
| 21st Century Fox America, Inc. 3.70% 20244 | 5,675 | 5,849 |
| Amazon.com, Inc. 3.80% 2024 | 10,875 | 11,164 |
| Amazon.com, Inc. 4.95% 2044 | 27,000 | 28,022 |
| American Honda Finance Corp. 2.25% 2019 | 13,500 | 13,552 |
| Bed Bath & Beyond Inc. 3.749% 2024 | 5,370 | 5,450 |
| Carnival Corp. 3.95% 2020 | 3,000 | 3,147 |
| CBS Corp. 1.95% 2017 | 2,000 | 2,008 |
| CBS Corp. 2.30% 2019 | 13,750 | 13,601 |
| Cequel Communications Holdings I, LLC and Cequel Capital Corp. 6.375% 20204 | 5,075 | 5,278 |
| Charter Communications Operating, LLC and Charter Communications Operating Capital Corp. 5.50% 2022 | 2,600 | 2,646 |
| Clear Channel Worldwide Holdings, Inc. 7.625% 2020 | 1,630 | 1,724 |
| Comcast Corp. 5.875% 2018 | 7,320 | 8,242 |
| Comcast Corp. 5.15% 2020 | 7,500 | 8,504 |
| Comcast Corp. 4.65% 2042 | 7,285 | 8,006 |
| Comcast Corp. 4.75% 2044 | 11,700 | 13,092 |
| Cooper-Standard Holdings Inc., Term Loan B, 4.00% 20213,5,6 | 1,393 | 1,378 |
| Cox Communications, Inc. 2.95% 20234 | 14,400 | 13,834 |
| DaimlerChrysler North America Holding Corp. 1.30% 20154 | 11,000 | 11,047 |
| DaimlerChrysler North America Holding Corp. 1.25% 20164 | 6,250 | 6,270 |
| DaimlerChrysler North America Holding Corp. 2.625% 20164 | 7,250 | 7,432 |
| DaimlerChrysler North America Holding Corp. 1.375% 20174 | 13,080 | 13,028 |
| DaimlerChrysler North America Holding Corp. 1.10% 20183,4 | 7,500 | 7,602 |
| DaimlerChrysler North America Holding Corp. 1.875% 20184 | 13,450 | 13,507 |
| DaimlerChrysler North America Holding Corp. 2.375% 20184 | 9,200 | 9,337 |
| DaimlerChrysler North America Holding Corp. 2.875% 20214 | 26,250 | 26,522 |
| DaimlerChrysler North America Holding Corp. 3.25% 20244 | 10,675 | 10,772 |
| DaimlerChrysler North America Holding Corp. 8.50% 2031 | 3,000 | 4,600 |
| DIRECTV Holdings LLC and DIRECTV Financing Co., Inc. 5.15% 2042 | 2,700 | 2,800 |
| DISH DBS Corp. 4.25% 2018 | 10,500 | 10,749 |
| DISH DBS Corp. 5.125% 2020 | 375 | 379 |
| Dollar General Corp. 4.125% 2017 | 938 | 968 |
| Dollar General Corp. 1.875% 2018 | 1,817 | 1,757 |
| Dollar General Corp. 3.25% 2023 | 10,130 | 9,237 |
| Ford Motor Co. 4.75% 2043 | 2,500 | 2,648 |
| Ford Motor Credit Co. 1.70% 2016 | 10,500 | 10,543 |
| Ford Motor Credit Co. 2.50% 2016 | 9,000 | 9,104 |
| Ford Motor Credit Co. 2.375% 2018 | 11,550 | 11,625 |
| Ford Motor Credit Co. 2.375% 2019 | 22,325 | 22,192 |
| Ford Motor Credit Co. 2.597% 2019 | 29,495 | 29,369 |
| Ford Motor Credit Co. 4.375% 2023 | 14,665 | 15,706 |
| Ford Motor Credit Co. 3.664% 2024 | 15,000 | 15,060 |
| Gannett Co., Inc. 4.875% 20214 | 860 | 856 |
| General Motors Co. 4.00% 2025 | 1,745 | 1,754 |
| General Motors Co. 5.00% 2035 | 18,395 | 19,215 |
| General Motors Co. 5.20% 2045 | 11,000 | 11,633 |
| General Motors Financial Co. 3.00% 2017 | 790 | 800 |
| General Motors Financial Co. 3.25% 2018 | 225 | 226 |
| General Motors Financial Co. 3.50% 2019 | 3,715 | 3,797 |
| General Motors Financial Co. 4.375% 2021 | 9,000 | 9,405 |
The Bond Fund of America — Page 13 of 37
Bonds, notes & other debt instruments
Corporate bonds & notes (continued)
Consumer discretionary (continued) | Principal amount
(000) | Value
(000) |
| Grupo Televisa, SAB 6.625% 2040 | $5,200 | $6,346 |
| Grupo Televisa, SAB 7.25% 2043 | MXN25,290 | 1,477 |
| Home Depot, Inc. 2.00% 2019 | $17,500 | 17,561 |
| Home Depot, Inc. 4.40% 2021 | 7,500 | 8,355 |
| Jaguar Land Rover PLC 4.25% 20194 | 820 | 830 |
| MGM Resorts International 8.625% 2019 | 3,000 | 3,416 |
| NBC Universal Enterprise, Inc. 0.919% 20183,4 | 10,425 | 10,520 |
| NBC Universal Enterprise, Inc. 1.974% 20194 | 7,175 | 7,112 |
| NBC Universal Enterprise, Inc. 5.25% (undated)4 | 17,895 | 18,656 |
| NBCUniversal Media, LLC 2.875% 2016 | 15,000 | 15,389 |
| NBCUniversal Media, LLC 2.875% 2023 | 5,000 | 5,004 |
| News America Inc. 6.90% 2019 | 12,750 | 15,048 |
| News America Inc. 6.15% 2037 | 300 | 377 |
| News America Inc. 5.40% 2043 | 1,000 | 1,195 |
| RCI Banque 3.50% 20184 | 18,500 | 19,168 |
| Seminole Tribe of Florida 7.804% 20204,5 | 5,705 | 6,076 |
| Thomson Reuters Corp. 1.30% 2017 | 1,890 | 1,881 |
| Thomson Reuters Corp. 1.65% 2017 | 14,825 | 14,745 |
| Thomson Reuters Corp. 6.50% 2018 | 25,855 | 29,410 |
| Thomson Reuters Corp. 4.30% 2023 | 8,805 | 9,384 |
| Thomson Reuters Corp. 5.65% 2043 | 1,905 | 2,210 |
| Time Inc., Term Loan B, 4.25% 20213,5,6 | 9,826 | 9,752 |
| Time Warner Cable Inc. 6.75% 2018 | 11,650 | 13,372 |
| Time Warner Inc. 5.875% 2016 | 13,270 | 14,395 |
| Time Warner Inc. 3.55% 2024 | 4,000 | 3,992 |
| Time Warner Inc. 7.57% 2024 | 12,340 | 16,047 |
| Time Warner Inc. 6.20% 2040 | 9,450 | 11,545 |
| Toyota Motor Credit Corp. 0.875% 2015 | 11,000 | 11,032 |
| Toyota Motor Credit Corp. 2.125% 2019 | 2,000 | 2,008 |
| Viacom Inc. 2.75% 2019 | 6,010 | 6,029 |
| Viacom Inc. 4.25% 2023 | 2,735 | 2,825 |
| Viacom Inc. 3.875% 2024 | 6,600 | 6,638 |
| Viacom Inc. 4.85% 2034 | 6,740 | 6,919 |
| Viacom Inc. 5.85% 2043 | 7,100 | 7,924 |
| Viacom Inc. 5.25% 2044 | 1,200 | 1,274 |
| Volkswagen Group of America Finance, LLC 1.60% 20174 | 9,200 | 9,173 |
| Volkswagen Group of America Finance, LLC 2.45% 20194 | 4,850 | 4,887 |
| Volkswagen International Finance NV 4.00% 20204 | 11,650 | 12,567 |
| Warner Music Group 5.625% 20224 | 50 | 49 |
| WPP Finance 2010 3.75% 2024 | 3,000 | 3,017 |
| Wynn Macau, Ltd. 5.25% 20214 | 425 | 402 |
| | | 783,444 |
| Consumer staples 2.52% | | |
| Altria Group, Inc. 9.25% 2019 | 4,392 | 5,650 |
| Altria Group, Inc. 2.625% 2020 | 24,835 | 24,936 |
| Altria Group, Inc. 2.85% 2022 | 5,000 | 4,867 |
| Altria Group, Inc. 2.95% 2023 | 16,500 | 15,984 |
| Altria Group, Inc. 4.00% 2024 | 3,600 | 3,760 |
| Altria Group, Inc. 9.95% 2038 | 6,350 | 10,896 |
| Altria Group, Inc. 10.20% 2039 | 4,000 | 6,986 |
| Altria Group, Inc. 4.50% 2043 | 3,500 | 3,539 |
| Altria Group, Inc. 5.375% 2044 | 2,300 | 2,628 |
| Anheuser-Busch InBev NV 3.625% 2015 | 25,250 | 25,475 |
The Bond Fund of America — Page 14 of 37
Bonds, notes & other debt instruments
Corporate bonds & notes (continued)
Consumer staples (continued) | Principal amount
(000) | Value
(000) |
| Anheuser-Busch InBev NV 4.125% 2015 | $32,375 | $32,406 |
| British American Tobacco International Finance PLC 9.50% 20184 | 15,750 | 19,842 |
| Coca-Cola Co. 1.50% 2015 | 18,970 | 19,163 |
| Coca-Cola Co. 1.80% 2016 | 10,500 | 10,678 |
| Coca-Cola Co. 3.15% 2020 | 4,190 | 4,386 |
| ConAgra Foods, Inc. 1.30% 2016 | 9,630 | 9,632 |
| ConAgra Foods, Inc. 1.90% 2018 | 21,475 | 21,348 |
| ConAgra Foods, Inc. 3.20% 2023 | 27,635 | 27,116 |
| CVS Caremark Corp. 2.25% 2019 | 16,090 | 16,040 |
| CVS Caremark Corp. 4.00% 2023 | 12,600 | 13,359 |
| CVS Caremark Corp. 5.30% 2043 | 4,075 | 4,891 |
| Delhaize Group 6.50% 2017 | 16,205 | 17,888 |
| General Mills, Inc. 1.40% 2017 | 8,010 | 7,982 |
| General Mills, Inc. 2.20% 2019 | 2,055 | 2,040 |
| Imperial Tobacco Finance PLC 2.05% 20184 | 8,050 | 8,011 |
| Imperial Tobacco Finance PLC 3.50% 20234 | 2,673 | 2,631 |
| Kraft Foods Inc. 1.625% 2015 | 6,120 | 6,147 |
| Kraft Foods Inc. 2.25% 2017 | 5,300 | 5,391 |
| Kraft Foods Inc. 6.50% 2040 | 2,000 | 2,580 |
| Kraft Foods Inc. 5.00% 2042 | 3,400 | 3,757 |
| Kroger Co. 3.90% 2015 | 10,000 | 10,218 |
| Kroger Co. 3.85% 2023 | 4,470 | 4,643 |
| Kroger Co. 5.00% 2042 | 3,950 | 4,320 |
| Kroger Co. 5.15% 2043 | 8,705 | 9,950 |
| Mondelez International, Inc. 4.00% 2024 | 8,262 | 8,660 |
| PepsiCo, Inc. 2.50% 2016 | 7,500 | 7,667 |
| Pernod Ricard SA 2.95% 20174 | 13,500 | 13,820 |
| Pernod Ricard SA 4.45% 20224 | 36,850 | 39,514 |
| Philip Morris International Inc. 1.875% 2019 | 15,975 | 15,893 |
| Philip Morris International Inc. 3.25% 2024 | 24,000 | 24,102 |
| Philip Morris International Inc. 4.875% 2043 | 3,000 | 3,358 |
| Philip Morris International Inc. 4.25% 2044 | 9,950 | 10,161 |
| Procter & Gamble Co. 3.50% 2015 | 150 | 150 |
| Reynolds American Inc. 3.25% 2022 | 19,360 | 18,890 |
| Reynolds American Inc. 4.85% 2023 | 3,750 | 4,044 |
| Reynolds American Inc. 4.75% 2042 | 2,500 | 2,436 |
| Reynolds American Inc. 6.15% 2043 | 7,050 | 8,205 |
| SABMiller Holdings Inc. 2.45% 20174 | 9,875 | 10,081 |
| SABMiller Holdings Inc. 2.20% 20184 | 2,600 | 2,609 |
| SABMiller Holdings Inc. 3.75% 20224 | 12,030 | 12,575 |
| Tyson Foods, Inc. 2.65% 2019 | 3,500 | 3,536 |
| Tyson Foods, Inc. 3.95% 2024 | 14,375 | 14,889 |
| Tyson Foods, Inc. 5.15% 2044 | 8,360 | 9,427 |
| Walgreens Boots Alliance, Inc. 3.80% 2024 | 20,825 | 21,282 |
| Wal-Mart Stores, Inc. 2.875% 2015 | 11,550 | 11,617 |
| Wal-Mart Stores, Inc. 2.80% 2016 | 11,500 | 11,807 |
| Wal-Mart Stores, Inc. 1.00% 2017 | 11,910 | 11,894 |
| Wal-Mart Stores, Inc. 5.80% 2018 | 11,095 | 12,550 |
| Wal-Mart Stores, Inc. 3.30% 2024 | 4,215 | 4,360 |
| Wal-Mart Stores, Inc. 4.00% 2043 | 1,197 | 1,247 |
| Wal-Mart Stores, Inc. 4.30% 2044 | 2,803 | 3,073 |
| WM. Wrigley Jr. Co 2.40% 20184 | 1,025 | 1,033 |
The Bond Fund of America — Page 15 of 37
Bonds, notes & other debt instruments
Corporate bonds & notes (continued)
Consumer staples (continued) | Principal amount
(000) | Value
(000) |
| WM. Wrigley Jr. Co 3.375% 20204 | $42,300 | $43,293 |
| WM. Wrigley Jr. Co. 2.90% 20194 | 2,800 | 2,839 |
| | | 704,152 |
| Industrials 1.73% | | |
| ABB Finance (USA) Inc. 2.875% 2022 | 2,000 | 2,013 |
| ADT Corp. 4.125% 2019 | 3,875 | 3,846 |
| AECOM Technology Corp. 5.75% 20224 | 710 | 728 |
| Altegrity, Inc. 9.50% 20194 | 3,675 | 3,500 |
| Associated Materials, LLC and AMH New Finance, Inc. 9.125% 2017 | 12,170 | 10,101 |
| Builders Firstsource 7.625% 20214 | 2,125 | 2,183 |
| Burlington Northern Santa Fe LLC 5.75% 2018 | 6,535 | 7,330 |
| Burlington Northern Santa Fe LLC 3.45% 2021 | 2,800 | 2,926 |
| Burlington Northern Santa Fe LLC 3.00% 2023 | 4,735 | 4,728 |
| Burlington Northern Santa Fe LLC 4.45% 2043 | 6,450 | 6,766 |
| Canadian National Railway Co. 1.45% 2016 | 6,090 | 6,136 |
| Canadian National Railway Co. 2.85% 2021 | 10,000 | 10,248 |
| CEVA Group PLC, LOC, 6.50% 20213,5,6 | 691 | 649 |
| CEVA Group PLC, Term Loan B, 6.50% 20213,5,6 | 997 | 937 |
| CEVA Group PLC, Term Loan, 6.50% 20213,5,6 | 723 | 680 |
| CEVA Group PLC, Term Loan, 6.50% 20213,5,6 | 125 | 117 |
| Continental Airlines, Inc., Series 1997-1, Class A, 7.461% 20165 | 506 | 513 |
| Continental Airlines, Inc., Series 1998-1, Class B, 6.748% 20185 | 521 | 551 |
| Continental Airlines, Inc., Series 1998-1, Class A, 6.648% 20195 | 6,950 | 7,302 |
| Continental Airlines, Inc., Series 1997-4, Class A, 6.90% 20195 | 11,486 | 12,082 |
| Continental Airlines, Inc., Series 2000-2, Class B, 8.307% 20195 | 85 | 93 |
| Continental Airlines, Inc., Series 1999-1, Class A, 6.545% 20205 | 6,657 | 7,368 |
| Continental Airlines, Inc., Series 1999-1, Class B, 6.795% 20205 | 1,564 | 1,643 |
| Continental Airlines, Inc., Series 1999-2, Class A-1, 7.256% 20215 | 207 | 229 |
| Continental Airlines, Inc., Series 2001-1, Class A-1, 6.703% 20225 | 10,607 | 11,429 |
| Continental Airlines, Inc., Series 2000-2, Class A-1, 7.707% 20225 | 9,879 | 11,040 |
| Continental Airlines, Inc., Series 2000-1, Class A-1, 8.048% 20225 | 8,889 | 10,089 |
| CSX Corp. 7.375% 2019 | 7,500 | 8,989 |
| CSX Corp. 3.40% 2024 | 7,950 | 8,068 |
| Delta Air Lines, Inc., Series 2002-1, Class G-1, MBIA insured, 6.718% 20245 | 1,247 | 1,438 |
| ENA Norte Trust 4.95% 20284,5 | 3,177 | 3,272 |
| ERAC USA Finance Co. 5.625% 20424 | 993 | 1,168 |
| Euramax International, Inc. 9.50% 2016 | 6,060 | 5,666 |
| European Aeronautic Defence and Space Company 2.70% 20234 | 15,500 | 15,244 |
| General Electric Capital Corp., Series A, 2.25% 2015 | 19,500 | 19,774 |
| General Electric Capital Corp. 1.50% 2016 | 6,718 | 6,792 |
| General Electric Capital Corp. 2.95% 2016 | 2,790 | 2,873 |
| General Electric Capital Corp. 2.30% 2017 | 5,000 | 5,124 |
| General Electric Capital Corp. 2.45% 2017 | 13,000 | 13,364 |
| General Electric Capital Corp., Series A, 6.00% 2019 | 10,500 | 12,226 |
| General Electric Capital Corp. 3.10% 2023 | 19,600 | 19,866 |
| General Electric Co. 0.85% 2015 | 13,000 | 13,037 |
| General Electric Co. 2.70% 2022 | 15,500 | 15,533 |
| General Electric Co. 4.125% 2042 | 4,000 | 4,158 |
| General Electric Co. 4.50% 2044 | 1,600 | 1,766 |
| General Electric Corp. 5.25% 2017 | 4,377 | 4,858 |
| Hardwoods Acquisition Inc 7.50% 20214 | 2,400 | 2,376 |
| Hawker Beechcraft Acquisition Co., LLC, LOC, 0.008% 20153,5,6,8 | 1,107 | 1,052 |
| HD Supply, Inc. 11.50% 2020 | 4,850 | 5,578 |
The Bond Fund of America — Page 16 of 37
Bonds, notes & other debt instruments
Corporate bonds & notes (continued)
Industrials (continued) | Principal amount
(000) | Value
(000) |
| HD Supply, Inc. 5.25% 20214 | $1,175 | $1,199 |
| HDTFS Inc. 5.875% 2020 | 450 | 456 |
| Honeywell International Inc. 5.00% 2019 | 8,725 | 9,809 |
| Jeld-Wen Escrow Corp., Term Loan B, 5.25% 20213,5,6 | 4,600 | 4,579 |
| KLX Inc. 5.875% 20224 | 1,230 | 1,245 |
| Navios Maritime Acquisition Corp. and Navios Acquisition Finance (US) Inc. 8.125% 20214 | 4,000 | 3,920 |
| Navios Maritime Holdings Inc. 7.375% 20224 | 2,475 | 2,302 |
| Navios Maritime Holdings Inc. and Navios Maritime Finance II (US) Inc. 8.125% 2019 | 2,890 | 2,558 |
| Nielsen Finance LLC and Nielsen Finance Co. 4.50% 2020 | 1,650 | 1,667 |
| Nielsen Finance LLC and Nielsen Finance Co. 5.50% 20214 | 4,500 | 4,613 |
| Norfolk Southern Corp. 5.75% 2016 | 3,390 | 3,554 |
| Norfolk Southern Corp. 3.00% 2022 | 14,672 | 14,756 |
| Nortek Inc. 10.00% 2018 | 3,100 | 3,263 |
| Nortek Inc. 8.50% 2021 | 2,690 | 2,892 |
| Parker-Hannifin Corp. 4.45% 2044 | 1,300 | 1,407 |
| Ply Gem Industries, Inc. 6.50% 2022 | 4,000 | 3,775 |
| Ply Gem Industries, Inc. 6.50% 20224 | 900 | 842 |
| R.R. Donnelley & Sons Co. 7.25% 2018 | 2,586 | 2,870 |
| R.R. Donnelley & Sons Co. 7.875% 2021 | 250 | 278 |
| R.R. Donnelley & Sons Co. 7.00% 2022 | 2,000 | 2,155 |
| Raytheon Co. 6.75% 2018 | 4,030 | 4,657 |
| Red de Carreteras de Occidente 9.00% 20285 | MXN61,570 | 4,085 |
| Republic Services, Inc. 5.00% 2020 | $5,000 | 5,534 |
| Republic Services, Inc. 3.55% 2022 | 500 | 514 |
| Republic Services, Inc. 5.70% 2041 | 2,000 | 2,475 |
| Silver II Borrower S.C.A./Silver II U.S. Holdings, LLC 7.75% 20204 | 1,175 | 1,116 |
| Southwest Airlines Co. 2.75% 2019 | 1,870 | 1,881 |
| Union Pacific Corp. 5.75% 2017 | 12,250 | 13,693 |
| United Technologies Corp. 1.80% 2017 | 3,660 | 3,710 |
| United Technologies Corp. 4.50% 2042 | 14,195 | 15,518 |
| US Investigations Services, Inc. 13.00% 20204,7 | 3,527 | 1,569 |
| US Investigations Services, Inc. 14.00% 20204,5,7 | 743 | 330 |
| US Investigations Services, Inc. 15.00% 20214,7 | 2,586 | 774 |
| Volvo Treasury AB 5.95% 20154 | 52,193 | 52,804 |
| Waste Management, Inc. 2.60% 2016 | 3,330 | 3,409 |
| Waste Management, Inc. 4.60% 2021 | 5,455 | 6,049 |
| | | 483,707 |
| Telecommunication services 1.45% | | |
| América Móvil, SAB de CV 8.46% 2036 | MXN27,000 | 1,844 |
| AT&T Inc. 0.90% 2016 | $10,000 | 10,002 |
| AT&T Inc. 1.40% 2017 | 12,015 | 11,904 |
| AT&T Inc. 4.80% 2044 | 8,200 | 8,389 |
| British Telecommunications PLC 2.35% 2019 | 2,745 | 2,744 |
| Deutsche Telekom International Finance BV 3.125% 20164 | 5,850 | 5,999 |
| Deutsche Telekom International Finance BV 2.25% 20174 | 8,575 | 8,716 |
| Deutsche Telekom International Finance BV 9.25% 2032 | 4,994 | 8,093 |
| Digicel Group Ltd. 8.25% 20204 | 6,450 | 6,289 |
| Digicel Group Ltd. 6.00% 20214 | 4,465 | 4,186 |
| Digicel Group Ltd. 7.125% 20224 | 1,975 | 1,842 |
| France Télécom 4.125% 2021 | 2,025 | 2,172 |
| Frontier Communications Corp. 8.125% 2018 | 3,675 | 4,144 |
| Frontier Communications Corp. 8.50% 2020 | 925 | 1,036 |
| Frontier Communications Corp. 6.875% 2025 | 825 | 827 |
The Bond Fund of America — Page 17 of 37
Bonds, notes & other debt instruments
Corporate bonds & notes (continued)
Telecommunication services (continued) | Principal amount
(000) | Value
(000) |
| Intelsat Jackson Holding Co. 6.625% 2022 | $9,300 | $9,602 |
| MetroPCS Wireless, Inc. 6.25% 2021 | 6,825 | 7,011 |
| MetroPCS Wireless, Inc. 6.625% 2023 | 1,000 | 1,029 |
| NII Capital Corp. 10.00% 20169 | 4,900 | 1,715 |
| NII Capital Corp. 7.875% 20194,9 | 3,125 | 2,266 |
| NII Capital Corp. 8.875% 20199 | 5,900 | 2,094 |
| NII Capital Corp. 11.375% 20194,9 | 9,485 | 6,877 |
| NII Capital Corp. 7.625% 20219 | 13,780 | 2,618 |
| Numericable Group SA, First Lien, 4.875% 20194 | 9,450 | 9,403 |
| Orange SA 2.75% 2019 | 8,938 | 9,113 |
| SoftBank Corp. 4.50% 20204 | 3,600 | 3,559 |
| Sprint Nextel Corp. 7.00% 2020 | 7,650 | 7,688 |
| Sprint Nextel Corp. 7.875% 2023 | 8,000 | 7,938 |
| Telecom Italia Capital SA 6.999% 2018 | 13,887 | 15,484 |
| Telecom Italia Capital SA 7.175% 2019 | 3,789 | 4,353 |
| Telefónica Emisiones, SAU 3.992% 2016 | 14,500 | 14,920 |
| Telefónica Emisiones, SAU 3.192% 2018 | 10,500 | 10,807 |
| T-Mobile US, Inc. 6.542% 2020 | 5,250 | 5,440 |
| T-Mobile US, Inc. 6.375% 2025 | 2,000 | 2,037 |
| Trilogy International Partners, LLC 10.25% 20164 | 2,250 | 2,258 |
| Verizon Communications Inc. 2.625% 20204 | 2,110 | 2,088 |
| Verizon Communications Inc. 5.15% 2023 | 30,569 | 33,779 |
| Verizon Communications Inc. 3.50% 2024 | 25,468 | 25,074 |
| Verizon Communications Inc. 4.15% 2024 | 5,000 | 5,180 |
| Verizon Communications Inc. 4.40% 2034 | 22,175 | 22,114 |
| Verizon Communications Inc. 5.05% 2034 | 9,785 | 10,457 |
| Verizon Communications Inc. 6.55% 2043 | 27,687 | 35,523 |
| Verizon Communications Inc. 4.862% 20464 | 28,499 | 29,347 |
| Verizon Communications Inc. 5.012% 20544 | 27,782 | 28,868 |
| Wind Acquisition SA 4.75% 20204 | 4,425 | 4,148 |
| Wind Acquisition SA 7.375% 20214 | 5,000 | 4,731 |
| | | 405,708 |
| Materials 0.78% | | |
| ArcelorMittal 6.00% 20213 | 735 | 767 |
| ArcelorMittal 7.25% 20413 | 5,105 | 5,182 |
| CEMEX SAB de CV 5.875% 20194 | 6,000 | 6,105 |
| Cliffs Natural Resources Inc. 4.875% 2021 | 9,920 | 5,382 |
| Dow Chemical Co. 5.70% 2018 | 1,004 | 1,116 |
| Dow Chemical Co. 3.00% 2022 | 7,500 | 7,341 |
| E.I. du Pont de Nemours and Co. 5.25% 2016 | 500 | 541 |
| E.I. du Pont de Nemours and Co. 2.80% 2023 | 10,000 | 9,854 |
| Eastman Chemical Co. 3.80% 2025 | 5,300 | 5,406 |
| Ecolab Inc. 3.00% 2016 | 7,275 | 7,517 |
| First Quantum Minerals Ltd. 6.75% 20204 | 7,074 | 6,437 |
| First Quantum Minerals Ltd. 7.00% 20214 | 3,049 | 2,759 |
| FMG Resources 6.00% 20174 | 7,580 | 7,272 |
| FMG Resources 6.875% 20184,5 | 5,736 | 5,219 |
| Georgia Gulf Corp. 4.625% 2021 | 650 | 618 |
| Georgia-Pacific Corp. 5.40% 20204 | 2,000 | 2,253 |
| Georgia-Pacific Corp. 3.60% 20254 | 13,500 | 13,586 |
| Glencore Xstrata LLC 1.594% 20193,4 | 4,450 | 4,477 |
| Glencore Xstrata LLC 2.50% 20194 | 6,500 | 6,407 |
| Holcim Ltd. 6.00% 20194 | 1,607 | 1,841 |
The Bond Fund of America — Page 18 of 37
Bonds, notes & other debt instruments
Corporate bonds & notes (continued)
Materials (continued) | Principal amount
(000) | Value
(000) |
| Holcim Ltd. 5.15% 20234 | $3,315 | $3,701 |
| International Paper Co. 7.95% 2018 | 4,500 | 5,309 |
| International Paper Co. 3.65% 2024 | 8,900 | 8,911 |
| JMC Steel Group Inc. 8.25% 20184 | 3,900 | 3,720 |
| Monsanto Co. 2.75% 2021 | 2,425 | 2,421 |
| Monsanto Co. 3.375% 2024 | 7,400 | 7,534 |
| Monsanto Co. 4.70% 2064 | 9,400 | 9,905 |
| Mosaic Co. 4.25% 2023 | 9,500 | 10,043 |
| Newcrest Finance Pty Ltd. 4.45% 20214 | 11,305 | 10,759 |
| Packaging Corp. of America 4.50% 2023 | 1,585 | 1,663 |
| Reynolds Group Inc. 5.75% 2020 | 11,405 | 11,747 |
| Rio Tinto Finance (USA) Ltd. 2.25% 2016 | 10,500 | 10,701 |
| Rio Tinto Finance (USA) Ltd. 1.625% 2017 | 11,000 | 11,003 |
| Rio Tinto Finance (USA) Ltd. 9.00% 2019 | 5,670 | 7,180 |
| Ryerson Inc. 11.25% 2018 | 2,854 | 3,054 |
| Tembec Industries Inc. 9.00% 20194 | 1,140 | 1,124 |
| Walter Energy, Inc. 9.50% 20194 | 4,975 | 3,806 |
| Xstrata Canada Financial Corp. 4.95% 20214 | 4,060 | 4,290 |
| Yara International ASA 7.875% 20194 | 2,175 | 2,594 |
| | | 219,545 |
| Information technology 0.44% | | |
| Alcatel-Lucent USA Inc. 4.625% 20174 | 4,075 | 4,136 |
| Alcatel-Lucent USA Inc. 6.75% 20204 | 2,135 | 2,264 |
| Alcatel-Lucent USA Inc. 8.875% 20204 | 1,850 | 2,021 |
| Avago Technologies Ltd., Term Loan B, 3.75% 20213,5,6 | 3,782 | 3,772 |
| First Data Corp. 8.25% 20214 | 1,950 | 2,096 |
| First Data Corp. 11.75% 2021 | 4,800 | 5,532 |
| First Data Corp. 12.625% 2021 | 1,200 | 1,428 |
| Freescale Semiconductor, Inc. 5.00% 20214 | 6,775 | 6,809 |
| Freescale Semiconductor, Inc. 6.00% 20224 | 2,675 | 2,802 |
| International Business Machines Corp. 2.00% 2016 | 12,500 | 12,689 |
| International Business Machines Corp. 3.625% 2024 | 4,335 | 4,525 |
| KLA-Tencor Corp. 4.65% 2024 | 13,500 | 14,003 |
| National Semiconductor Corp. 6.60% 2017 | 6,000 | 6,756 |
| NXP BV and NXP Funding LLC 3.75% 20184 | 4,100 | 4,121 |
| Oracle Corp. 2.80% 2021 | 26,100 | 26,464 |
| Samsung Electronics America, Inc. 1.75% 20174 | 4,500 | 4,516 |
| SRA International, Inc. 11.00% 2019 | 3,000 | 3,203 |
| SRA International, Inc., Term Loan B, 6.50% 20183,5,6 | 8,436 | 8,446 |
| TIBCO Software, Inc., Term Loan B, 6.50% 20203,5,6 | 1,125 | 1,091 |
| Xerox Corp. 2.95% 2017 | 2,535 | 2,606 |
| Xerox Corp. 2.75% 2019 | 5,000 | 5,017 |
| | | 124,297 |
| Total corporate bonds & notes | | 7,622,098 |
Mortgage-backed obligations 22.46%
Federal agency mortgage-backed obligations 17.16% | | |
| Fannie Mae 3.306% 20175 | 3,896 | 4,075 |
| Fannie Mae 11.038% 20203,5 | 29 | 33 |
| Fannie Mae 5.00% 20235 | 1,760 | 1,909 |
| Fannie Mae 5.50% 20235 | 9,499 | 10,378 |
| Fannie Mae 6.00% 20235 | 258 | 284 |
The Bond Fund of America — Page 19 of 37
Bonds, notes & other debt instruments
Mortgage-backed obligations (continued)
Federal agency mortgage-backed obligations (continued) | Principal amount
(000) | Value
(000) |
| Fannie Mae 4.50% 20245 | $5,694 | $6,147 |
| Fannie Mae 4.50% 20255 | 7,156 | 7,735 |
| Fannie Mae 4.50% 20255 | 4,501 | 4,866 |
| Fannie Mae 4.50% 20255 | 4,447 | 4,807 |
| Fannie Mae 2.403% 20263,5 | 188 | 197 |
| Fannie Mae 6.00% 20265 | 4,677 | 5,294 |
| Fannie Mae 2.50% 20275 | 23,812 | 24,307 |
| Fannie Mae 2.50% 20275 | 6,869 | 7,008 |
| Fannie Mae 2.50% 20275 | 4,734 | 4,829 |
| Fannie Mae 2.50% 20275 | 2,107 | 2,151 |
| Fannie Mae 2.50% 20275 | 1,642 | 1,676 |
| Fannie Mae 2.50% 20275 | 1,436 | 1,466 |
| Fannie Mae 2.50% 20275 | 1,279 | 1,304 |
| Fannie Mae 2.50% 20275 | 807 | 824 |
| Fannie Mae 2.50% 20275 | 682 | 696 |
| Fannie Mae 2.50% 20275 | 679 | 692 |
| Fannie Mae 5.50% 20275 | 2,279 | 2,547 |
| Fannie Mae 2.50% 20285 | 23,907 | 24,390 |
| Fannie Mae 2.50% 20285 | 6,544 | 6,676 |
| Fannie Mae 6.00% 20285 | 668 | 757 |
| Fannie Mae 6.50% 20325 | 120 | 127 |
| Fannie Mae 6.50% 20345 | 489 | 532 |
| Fannie Mae 6.50% 20365 | 3,083 | 3,506 |
| Fannie Mae 6.50% 20365 | 1,984 | 2,261 |
| Fannie Mae 7.00% 20365 | 610 | 677 |
| Fannie Mae 7.00% 20365 | 279 | 318 |
| Fannie Mae 7.50% 20365 | 359 | 407 |
| Fannie Mae 8.00% 20365 | 254 | 290 |
| Fannie Mae 6.00% 20375 | 1,523 | 1,716 |
| Fannie Mae 6.00% 20375 | 694 | 782 |
| Fannie Mae 6.50% 20375 | 2,347 | 2,663 |
| Fannie Mae 6.50% 20375 | 1,614 | 1,782 |
| Fannie Mae 6.50% 20375 | 1,453 | 1,586 |
| Fannie Mae 6.50% 20375 | 156 | 167 |
| Fannie Mae 7.00% 20375 | 924 | 1,032 |
| Fannie Mae 7.00% 20375 | 731 | 816 |
| Fannie Mae 7.00% 20375 | 538 | 593 |
| Fannie Mae 7.00% 20375 | 240 | 266 |
| Fannie Mae 7.00% 20375 | 136 | 152 |
| Fannie Mae 7.00% 20375 | 119 | 132 |
| Fannie Mae 7.50% 20375 | 269 | 305 |
| Fannie Mae 7.50% 20375 | 256 | 291 |
| Fannie Mae 7.50% 20375 | 166 | 188 |
| Fannie Mae 7.50% 20375 | 151 | 171 |
| Fannie Mae 7.50% 20375 | 124 | 137 |
| Fannie Mae 7.50% 20375 | 112 | 125 |
| Fannie Mae 7.50% 20375 | 100 | 111 |
| Fannie Mae 7.50% 20375 | 82 | 97 |
| Fannie Mae 7.50% 20375 | 66 | 68 |
| Fannie Mae 7.50% 20375 | 26 | 28 |
| Fannie Mae 8.00% 20375 | 119 | 129 |
| Fannie Mae 5.281% 20383,5 | 263 | 282 |
| Fannie Mae 5.50% 20385 | 40 | 45 |
| Fannie Mae 6.00% 20385 | 1,212 | 1,367 |
The Bond Fund of America — Page 20 of 37
Bonds, notes & other debt instruments
Mortgage-backed obligations (continued)
Federal agency mortgage-backed obligations (continued) | Principal amount
(000) | Value
(000) |
| Fannie Mae 6.50% 20385 | $51,239 | $58,333 |
| Fannie Mae 2.19% 20393,5 | 1,349 | 1,439 |
| Fannie Mae 2.191% 20393,5 | 2,121 | 2,263 |
| Fannie Mae 2.25% 20393,5 | 983 | 1,051 |
| Fannie Mae 2.28% 20393,5 | 611 | 655 |
| Fannie Mae 2.286% 20393,5 | 1,360 | 1,457 |
| Fannie Mae 3.446% 20393,5 | 5,927 | 6,331 |
| Fannie Mae 2.335% 20393,5 | 671 | 720 |
| Fannie Mae 3.058% 20393,5 | 3,389 | 3,635 |
| Fannie Mae 3.636% 20393,5 | 265 | 285 |
| Fannie Mae 3.47% 20393,5 | 718 | 770 |
| Fannie Mae 3.766% 20393,5 | 1,164 | 1,248 |
| Fannie Mae 4.50% 20395 | 17,665 | 19,203 |
| Fannie Mae 5.00% 20395 | 15,132 | 16,914 |
| Fannie Mae 5.50% 20395 | 12,731 | 14,236 |
| Fannie Mae 5.50% 20395 | 1,892 | 2,115 |
| Fannie Mae 3.608% 20403,5 | 2,942 | 3,155 |
| Fannie Mae 3.225% 20403,5 | 14,413 | 15,068 |
| Fannie Mae 4.00% 20405 | 1,770 | 1,908 |
| Fannie Mae 4.186% 20403,5 | 1,018 | 1,080 |
| Fannie Mae 4.38% 20403,5 | 3,344 | 3,547 |
| Fannie Mae 4.50% 20405 | 4,122 | 4,479 |
| Fannie Mae 5.00% 20405 | 1,808 | 2,023 |
| Fannie Mae 5.50% 20405 | 7,784 | 8,728 |
| Fannie Mae 5.50% 20405 | 1,051 | 1,176 |
| Fannie Mae 2.924% 20413,5 | 2,433 | 2,532 |
| Fannie Mae 3.076% 20413,5 | 2,935 | 3,135 |
| Fannie Mae 3.529% 20413,5 | 1,146 | 1,204 |
| Fannie Mae 3.547% 20413,5 | 8,315 | 8,724 |
| Fannie Mae 4.00% 20415 | 12,726 | 13,751 |
| Fannie Mae 4.00% 20415 | 2,946 | 3,175 |
| Fannie Mae 4.00% 20415 | 1,680 | 1,811 |
| Fannie Mae 4.00% 20415 | 1,397 | 1,504 |
| Fannie Mae 4.00% 20415 | 952 | 1,026 |
| Fannie Mae 4.50% 20415 | 4,389 | 4,770 |
| Fannie Mae 5.00% 20415 | 12,221 | 13,537 |
| Fannie Mae 5.00% 20415 | 5,842 | 6,574 |
| Fannie Mae 5.00% 20415 | 4,446 | 5,004 |
| Fannie Mae 5.00% 20415 | 2,922 | 3,292 |
| Fannie Mae 5.00% 20415 | 1,828 | 2,058 |
| Fannie Mae 3.50% 20425 | 36,570 | 38,167 |
| Fannie Mae 3.50% 20425 | 20,594 | 21,540 |
| Fannie Mae 3.50% 20425 | 17,481 | 18,241 |
| Fannie Mae 3.50% 20425 | 10,777 | 11,284 |
| Fannie Mae 3.50% 20425 | 5,714 | 5,981 |
| Fannie Mae 4.00% 20425 | 29,696 | 32,096 |
| Fannie Mae 4.00% 20425 | 17,120 | 18,397 |
| Fannie Mae 4.00% 20425 | 14,583 | 15,713 |
| Fannie Mae 4.00% 20425 | 8,955 | 9,676 |
| Fannie Mae 4.00% 20425 | 7,496 | 8,100 |
| Fannie Mae 4.00% 20425 | 4,822 | 5,196 |
| Fannie Mae 4.00% 20425 | 1,424 | 1,539 |
| Fannie Mae 4.00% 20425 | 681 | 729 |
| Fannie Mae 3.00% 20435 | 34,952 | 35,391 |
The Bond Fund of America — Page 21 of 37
Bonds, notes & other debt instruments
Mortgage-backed obligations (continued)
Federal agency mortgage-backed obligations (continued) | Principal amount
(000) | Value
(000) |
| Fannie Mae 3.00% 20435 | $28,145 | $28,503 |
| Fannie Mae 3.00% 20435 | 18,889 | 19,131 |
| Fannie Mae 3.00% 20435 | 14,355 | 14,536 |
| Fannie Mae 3.00% 20435 | 9,430 | 9,550 |
| Fannie Mae 3.00% 20435 | 9,340 | 9,459 |
| Fannie Mae 3.00% 20435 | 4,701 | 4,760 |
| Fannie Mae 3.00% 20435 | 4,368 | 4,422 |
| Fannie Mae 4.00% 20435 | 12,274 | 13,191 |
| Fannie Mae 4.00% 20435 | 11,407 | 12,327 |
| Fannie Mae 3.111% 20443,5 | 1,230 | 1,282 |
| Fannie Mae 4.00% 20445 | 8,064 | 8,700 |
| Fannie Mae 4.00% 20445 | 3,796 | 4,103 |
| Fannie Mae 3.00% 20455,10 | 55,975 | 56,592 |
| Fannie Mae 3.50% 20455,10 | 822,956 | 857,523 |
| Fannie Mae 3.50% 20455,10 | 136,300 | 141,652 |
| Fannie Mae 4.00% 20455,10 | 377,840 | 402,117 |
| Fannie Mae 4.50% 20455,10 | 552,547 | 598,703 |
| Fannie Mae 4.50% 20455,10 | 522,039 | 566,625 |
| Fannie Mae 5.00% 20455,10 | 66,660 | 73,650 |
| Fannie Mae 6.50% 20475 | 119 | 135 |
| Fannie Mae 7.00% 20475 | 484 | 546 |
| Fannie Mae 7.00% 20475 | 24 | 28 |
| Fannie Mae, Series 2002-15, Class PG, 6.00% 20175 | 533 | 550 |
| Fannie Mae, Series 2001-4, Class GA, 9.437% 20253,5 | 84 | 95 |
| Fannie Mae, Series 2001-4, Class NA, 10.005% 20253,5 | 98 | 108 |
| Fannie Mae, Series 1998-W5, Class B3, 6.50% 20285 | 979 | 971 |
| Fannie Mae, Series 2002-W7, Class A-5, 7.50% 20295 | 239 | 277 |
| Fannie Mae, Series 2001-25, Class ZA, 6.50% 20315 | 1,849 | 2,073 |
| Fannie Mae, Series 2001-20, Class E, 9.561% 20313,5 | 19 | 21 |
| Fannie Mae, Series 2005-68, Class PG, 5.50% 20355 | 2,055 | 2,314 |
| Fannie Mae, Series 2006-51, Class PO, principal only, 0% 20365 | 2,497 | 2,381 |
| Fannie Mae, Series 2006-32, Class OA, principal only, 0% 20365 | 2,074 | 1,977 |
| Fannie Mae, Series 2006-96, Class OP, principal only, 0% 20365 | 662 | 601 |
| Fannie Mae, Series 2006-101, Class PC, 5.50% 20365 | 1,771 | 1,941 |
| Fannie Mae, Series 2006-106, Class HG, 6.00% 20365 | 6,596 | 7,394 |
| Fannie Mae, Series 2006-43, Class PX, 6.00% 20365 | 4,261 | 4,779 |
| Fannie Mae, Series 2007-40, Class PT, 5.50% 20375 | 5,937 | 6,584 |
| Fannie Mae, Series 2001-T10, Class A-1, 7.00% 20415 | 2,710 | 3,164 |
| Fannie Mae, Series 2001-50, Class BA, 7.00% 20415 | 701 | 780 |
| Fannie Mae, Series 2002-W3, Class A-5, 7.50% 20415 | 1,516 | 1,761 |
| Fannie Mae, Series 2002-W1, Class 2A, 6.532% 20423,5 | 2,138 | 2,494 |
| FDIC Structured Sale Guaranteed Notes, Series 2010-S1, Class 1-A, 0.704% 20483,4,5 | 177 | 177 |
| Freddie Mac 5.00% 20235 | 1,689 | 1,827 |
| Freddie Mac 5.00% 20235 | 61 | 66 |
| Freddie Mac 5.00% 20235 | 10 | 10 |
| Freddie Mac 5.00% 20245 | 4,173 | 4,541 |
| Freddie Mac 6.00% 20265 | 2,777 | 3,145 |
| Freddie Mac 6.00% 20275 | 16,885 | 19,137 |
| Freddie Mac 4.50% 20305 | 1,998 | 2,165 |
| Freddie Mac 2.113% 20373,5 | 2,970 | 3,148 |
| Freddie Mac 4.50% 20375 | 8,797 | 9,582 |
| Freddie Mac 5.50% 20375 | 3,287 | 3,678 |
| Freddie Mac 5.50% 20375 | 82 | 91 |
| Freddie Mac 5.50% 20375 | 19 | 21 |
The Bond Fund of America — Page 22 of 37
Bonds, notes & other debt instruments
Mortgage-backed obligations (continued)
Federal agency mortgage-backed obligations (continued) | Principal amount
(000) | Value
(000) |
| Freddie Mac 7.00% 20375 | $160 | $177 |
| Freddie Mac 7.50% 20375 | 845 | 961 |
| Freddie Mac 4.95% 20383,5 | 973 | 1,044 |
| Freddie Mac 5.50% 20385 | 2,629 | 2,939 |
| Freddie Mac 5.50% 20385 | 2,362 | 2,644 |
| Freddie Mac 5.50% 20385 | 1,999 | 2,232 |
| Freddie Mac 5.50% 20385 | 1,073 | 1,201 |
| Freddie Mac 5.50% 20385 | 757 | 847 |
| Freddie Mac 5.50% 20385 | 445 | 498 |
| Freddie Mac 5.50% 20385 | 275 | 308 |
| Freddie Mac 3.347% 20393,5 | 2,071 | 2,217 |
| Freddie Mac 4.50% 20395 | 2,213 | 2,398 |
| Freddie Mac 5.00% 20395 | 16,612 | 18,354 |
| Freddie Mac 5.50% 20395 | 16,115 | 18,025 |
| Freddie Mac 5.50% 20395 | 6,296 | 7,045 |
| Freddie Mac 4.50% 20405 | 39,906 | 43,305 |
| Freddie Mac 5.50% 20405 | 11 | 12 |
| Freddie Mac 4.50% 20415 | 15,155 | 16,522 |
| Freddie Mac 4.50% 20415 | 4,096 | 4,444 |
| Freddie Mac 4.50% 20415 | 2,379 | 2,581 |
| Freddie Mac 4.50% 20415 | 751 | 819 |
| Freddie Mac 5.00% 20415 | 12,591 | 13,964 |
| Freddie Mac 5.00% 20415 | 8,369 | 9,407 |
| Freddie Mac 5.00% 20415 | 5,143 | 5,691 |
| Freddie Mac 5.50% 20415 | 8,834 | 9,882 |
| Freddie Mac 2.582% 20423,5 | 2,487 | 2,553 |
| Freddie Mac 4.00% 20435 | 23,837 | 25,583 |
| Freddie Mac 4.00% 20435 | 6,811 | 7,337 |
| Freddie Mac 4.00% 20435 | 6,365 | 6,834 |
| Freddie Mac 4.00% 20435 | 4,077 | 4,394 |
| Freddie Mac 4.00% 20435 | 3,482 | 3,739 |
| Freddie Mac 4.00% 20435 | 3,353 | 3,612 |
| Freddie Mac 4.00% 20435 | 2,827 | 3,043 |
| Freddie Mac 4.00% 20435 | 2,692 | 2,907 |
| Freddie Mac 4.00% 20435 | 1,704 | 1,828 |
| Freddie Mac 3.128% 20443,5 | 3,176 | 3,285 |
| Freddie Mac 4.00% 20445 | 2,786 | 3,007 |
| Freddie Mac 4.00% 20435,10 | 52,950 | 56,275 |
| Freddie Mac 6.50% 20475 | 312 | 348 |
| Freddie Mac 7.00% 20475 | 163 | 185 |
| Freddie Mac, Series 2890, Class KT, 4.50% 20195 | 1,982 | 2,097 |
| Freddie Mac, Series 2626, Class NG, 3.50% 20235 | 83 | 86 |
| Freddie Mac, Series 1617, Class PM, 6.50% 20235 | 452 | 507 |
| Freddie Mac, Series 2153, Class GG, 6.00% 20295 | 789 | 886 |
| Freddie Mac, Series 2122, Class QM, 6.25% 20295 | 1,321 | 1,456 |
| Freddie Mac, Series 3061, Class PN, 5.50% 20355 | 9,200 | 10,170 |
| Freddie Mac, Series 3136, Class OP, principal only, 0% 20365 | 1,621 | 1,545 |
| Freddie Mac, Series 3149, Class MO, principal only, 0% 20365 | 1,493 | 1,410 |
| Freddie Mac, Series 3147, Class OD, principal only, 0% 20365 | 1,464 | 1,400 |
| Freddie Mac, Series 3149, Class AO, principal only, 0% 20365 | 1,343 | 1,272 |
| Freddie Mac, Series 3156, Class PO, principal only, 0% 20365 | 26 | 24 |
| Freddie Mac, Series 3257, Class PA, 5.50% 20365 | 14,696 | 16,370 |
| Freddie Mac, Series 3233, Class PA, 6.00% 20365 | 10,698 | 12,000 |
| Freddie Mac, Series 3156, Class NG, 6.00% 20365 | 3,195 | 3,491 |
The Bond Fund of America — Page 23 of 37
Bonds, notes & other debt instruments
Mortgage-backed obligations (continued)
Federal agency mortgage-backed obligations (continued) | Principal amount
(000) | Value
(000) |
| Freddie Mac, Series 3286, Class JN, 5.50% 20375 | $12,035 | $13,264 |
| Freddie Mac, Series 3312, Class PA, 5.50% 20375 | 6,939 | 7,648 |
| Freddie Mac, Series 3318, Class JT, 5.50% 20375 | 6,546 | 7,215 |
| Freddie Mac, Series 3271, Class OA, 6.00% 20375 | 4,644 | 5,103 |
| Government National Mortgage Assn. 10.00% 20215 | 138 | 152 |
| Government National Mortgage Assn. 2.50% 20285 | 4,278 | 4,396 |
| Government National Mortgage Assn. 5.00% 20355 | 1,627 | 1,790 |
| Government National Mortgage Assn. 6.00% 20385 | 12,099 | 13,597 |
| Government National Mortgage Assn. 6.50% 20385 | 232 | 265 |
| Government National Mortgage Assn. 3.50% 20395 | 6,989 | 7,347 |
| Government National Mortgage Assn. 5.00% 20395 | 1,764 | 1,938 |
| Government National Mortgage Assn. 3.50% 20405 | 7,138 | 7,529 |
| Government National Mortgage Assn. 4.50% 20405 | 4,036 | 4,438 |
| Government National Mortgage Assn. 5.50% 20405 | 11,322 | 12,776 |
| Government National Mortgage Assn. 3.50% 20415 | 341 | 359 |
| Government National Mortgage Assn. 4.50% 20415 | 22,457 | 24,638 |
| Government National Mortgage Assn. 4.50% 20415 | 1,755 | 1,919 |
| Government National Mortgage Assn. 4.50% 20415 | 1,482 | 1,620 |
| Government National Mortgage Assn. 4.50% 20415 | 1,254 | 1,377 |
| Government National Mortgage Assn. 5.00% 20415 | 11,284 | 12,374 |
| Government National Mortgage Assn. 3.50% 20425 | 1,384 | 1,437 |
| Government National Mortgage Assn. 3.50% 20435 | 4,571 | 4,805 |
| Government National Mortgage Assn. 4.00% 20445 | 374,226 | 402,100 |
| Government National Mortgage Assn. 4.00% 20445 | 188,387 | 202,337 |
| Government National Mortgage Assn. 4.00% 20445 | 114,019 | 122,356 |
| Government National Mortgage Assn. 4.00% 20445 | 50,721 | 54,477 |
| National Credit Union Administration, Series 2011-M1, Class A2, 1.40% 20155 | 1,368 | 1,375 |
| National Credit Union Administration, Series 2010-R2, Class 1A, 0.527% 20173,5 | 1,264 | 1,268 |
| National Credit Union Administration, Series 2011-R3, Class 1A, 0.559% 20203,5 | 1,349 | 1,354 |
| National Credit Union Administration, Series 2011-R1, Class 1A, 0.606% 20203,5 | 1,629 | 1,639 |
| | | 4,797,605 |
| Commercial mortgage-backed securities 3.81% | | |
| Aventura Mall Trust, Series A, 3.743% 20323,4,5 | 11,250 | 11,969 |
| Banc of America Commercial Mortgage Inc., Series 2006-3, Class A-4, 5.889% 20443,5 | 10,279 | 10,826 |
| Banc of America Commercial Mortgage Inc., Series 2005-5, Class A-4, 5.115% 20453,5 | 2,173 | 2,205 |
| Banc of America Commercial Mortgage Inc., Series 2006-1, Class A1A, 5.378% 20453,5 | 10,623 | 10,974 |
| Banc of America Commercial Mortgage Inc., Series 2007-3, Class A-4, 5.563% 20493,5 | 3,615 | 3,883 |
| Banc of America Commercial Mortgage Inc., Series 2007-2, Class A-M, 5.791% 20493,5 | 4,083 | 4,418 |
| Banc of America Commercial Mortgage Inc., Series 2007-4, Class A-M, 5.821% 20513,5 | 5,895 | 6,420 |
| Banc of America Commercial Mortgage Inc., Series 2008-1, Class A-4, 6.427% 20513,5 | 5,180 | 5,726 |
| Bear Stearns Commercial Mortgage Securities Trust, Series 2006-T22, Class A1A, 5.557% 20383,5 | 2,769 | 2,892 |
| Bear Stearns Commercial Mortgage Securities Trust, Series 2007-T28, Class A-1A, 5.71% 20423,5 | 3,259 | 3,552 |
| Bear Stearns Commercial Mortgage Securities Trust, Series 2007-PW17, Class A-1-A, 5.65% 20503,5 | 1,536 | 1,675 |
| Bear Stearns Commercial Mortgage Securities Trust, Series 2007-PW18, Class A-M, 6.084% 20503,5 | 5,730 | 6,311 |
| Citigroup Commercial Mortgage Trust, Series 2006-C5, Class A-4, 5.431% 20495 | 5,293 | 5,608 |
| Citigroup Commercial Mortgage Trust, Series 2008-C7, Class A-M, 6.133% 20493,5 | 7,468 | 8,186 |
| Citigroup-Deutsche Bank Commercial Mortgage Trust, Series 2005-CD1, Class A-4, 5.40% 20443,5 | 15,915 | 16,178 |
| Citigroup-Deutsche Bank Commercial Mortgage Trust, Series 2006-CD3, Class A-5, 5.617% 20485 | 20,168 | 21,194 |
| COMM Mortgage Trust Series 2014-277P, Class A, 3.611% 20493,4,5 | 20,000 | 20,928 |
| Commercial Mortgage Trust, Series 2005-LP5, Class E, 5.179% 20433,4,5 | 1,750 | 1,772 |
| Commercial Mortgage Trust, Series 2006-C8, Class A1A, 5.292% 20465 | 15,175 | 16,221 |
| Commercial Mortgage Trust, Series 2007-C9, Class A-1-A, 5.796% 20493,5 | 312 | 338 |
| Crown Castle Towers LLC, Series 2010-5, Class C, 4.174% 20374,5 | 20,000 | 20,961 |
The Bond Fund of America — Page 24 of 37
Bonds, notes & other debt instruments
Mortgage-backed obligations (continued)
Commercial mortgage-backed securities (continued) | Principal amount
(000) | Value
(000) |
| Crown Castle Towers LLC, Series 2010-2, Class C, 5.495% 20374,5 | $10,000 | $10,888 |
| CS First Boston Mortgage Securities Corp., Series 2014-ICE, Class A, 01.05% 20273,4,5 | 15,620 | 15,602 |
| CS First Boston Mortgage Securities Corp., Series 2014-ICE, Class B, 1.45% 20273,4,5 | 1,000 | 1,000 |
| CS First Boston Mortgage Securities Corp., Series 2014-ICE, Class C, 1.80% 20273,4,5 | 1,000 | 1,001 |
| CS First Boston Mortgage Securities Corp., Series 2014-ICE, Class D, 2.40% 20273,4,5 | 500 | 498 |
| CS First Boston Mortgage Securities Corp., Series 2005-C5, Class D, 5.10% 20383,5 | 1,500 | 1,525 |
| CS First Boston Mortgage Securities Corp., Series 2006-C5, Class A-3, 5.311% 20395 | 24,708 | 26,055 |
| CS First Boston Mortgage Securities Corp., Series 2006-C4, Class A1A, 5.46% 20395 | 2,250 | 2,373 |
| CS First Boston Mortgage Securities Corp., Series 2007-C3, Class A-1-A-1, 5.893% 20393,5 | 9,240 | 9,927 |
| CS First Boston Mortgage Securities Corp., Series 2007-C5, Class A4, 5.695% 20403,5 | 4,000 | 4,321 |
| CS First Boston Mortgage Securities Corp., Series 2007-C2, Class A-M, 5.615% 20493,5 | 12,708 | 13,625 |
| DBUBS Mortgage Trust, Series 2011-LC2A, Class A-2, 3.386% 20444,5 | 13,486 | 13,868 |
| DBUBS Mortgage Trust, Series 2011-LC1A, Class A1, 3.742% 20464,5 | 50,817 | 52,046 |
EQTY 2014-INNS Mortgage Trust Commercial Mortgage Pass-Through Certificates,
Series 2014-A, 1.003% 20313,4,5 | 20,287 | 20,300 |
EQTY 2014-INNS Mortgage Trust Commercial Mortgage Pass-Through Certificates,
Series 2014-B, 1.353% 20313,4,5 | 5,245 | 5,195 |
| GMAC Commercial Mortgage Securities, Inc., Series 2006-C1, Class AM, 5.29% 20453,5 | 2,998 | 3,086 |
| Grace Mortgage Trust, Series 2014-GRCE, Class A, 3.3687% 20284,5 | 3,000 | 3,111 |
| Greenwich Capital Commercial Funding Corp., Series 2006-GG7, Class A-4, 5.819% 20383,5 | 12,967 | 13,563 |
| Greenwich Capital Commercial Funding Corp., Series 2006-GG7, Class A-1-A, 5.819% 20383,5 | 916 | 962 |
| Greenwich Capital Commercial Funding Corp., Series 2007-GG9, Class A-1-A, 5.426% 20395 | 5,340 | 5,738 |
| Greenwich Capital Commercial Funding Corp., Series 2007-GG9, Class A-4, 5.444% 20395 | 32,300 | 34,484 |
| Greenwich Capital Commercial Funding Corp., Series 2007-GG11, Class A-1-A, 5.704% 20495 | 9,880 | 10,827 |
Greenwich Capital Commercial Funding Corp., Series 2007-GG11, Class A-M,
5.867% 20493,5 | 13,585 | 14,748 |
| GS Mortgage Securities Corp. II, Series 2011-GC3, Class A-2, 3.645% 20444,5 | 2,343 | 2,400 |
| GS Mortgage Securities Corp. II, Series 2007-GG10, Class A-1-A, 5.796% 20453,5 | 940 | 1,023 |
| Hilton USA Trust, Series 2013-HLF-AFX, 2.662% 20304,5 | 19,920 | 19,962 |
| Hilton USA Trust, Series 2013-HLF-BFX, 3.367% 20304,5 | 8,500 | 8,615 |
| Hilton USA Trust, Series 2013-HLF, CFX, 3.714% 20304,5 | 3,610 | 3,652 |
| Hilton USA Trust, Series 2013-HLF, DFX, 4.407% 20304,5 | 1,000 | 1,024 |
| J.P. Morgan Chase Commercial Mortgage Securities Corp., Series 2014-INN, Class A, 1.074% 20293,4,5 | 7,000 | 6,987 |
| J.P. Morgan Chase Commercial Mortgage Securities Corp., Series 2005-CIBC12, Class A-3B, 5.467% 20373,5 | 6,447 | 6,447 |
| J.P. Morgan Chase Commercial Mortgage Securities Corp., Series 2005-LDP3, Class A-4A, 4.936% 20423,5 | 1,425 | 1,440 |
| J.P. Morgan Chase Commercial Mortgage Securities Corp., Series 2006-LDP6, Class A-1-A, 5.471% 20433,5 | 1,154 | 1,207 |
| J.P. Morgan Chase Commercial Mortgage Securities Corp., Series 2006-CB15, Class A-1-A, 5.811% 20433,5 | 448 | 471 |
| J.P. Morgan Chase Commercial Mortgage Securities Corp., Series 2006-CB15, Class A-4, 5.814% 20433,5 | 9,788 | 10,268 |
| J.P. Morgan Chase Commercial Mortgage Securities Corp., Series 2006-CB-16, Class A1A, 5.546% 20455 | 7,095 | 7,518 |
| J.P. Morgan Chase Commercial Mortgage Securities Corp., Series 2006-LDP7, Class A-4, 5.863% 20453,5 | 47,285 | 49,404 |
| J.P. Morgan Chase Commercial Mortgage Securities Corp., Series 2011-C3A, Class A-2, 3.673% 20464,5 | 29,752 | 30,630 |
| J.P. Morgan Chase Commercial Mortgage Securities Corp., Series 2007-CB18, Class A-1-A, 5.092% 20473,5 | 1,701 | 1,817 |
| J.P. Morgan Chase Commercial Mortgage Securities Corp., Series 2007-LDPX, Class A-1-A, 5.439% 20495 | 1,900 | 2,033 |
| J.P. Morgan Chase Commercial Mortgage Securities Corp., Series 2007-CB19, Class A-1-A, 5.703% 20493,5 | 35,287 | 38,200 |
| J.P. Morgan Chase Commercial Mortgage Securities Corp., Series 2007-CB19, Class A-4, 5.703% 20493,5 | 33,812 | 36,327 |
| J.P. Morgan Chase Commercial Mortgage Securities Corp., Series 2007-C1, Class A-4, 5.716% 20515 | 15,595 | 16,802 |
| J.P. Morgan Chase Commercial Mortgage Securities Corp., Series 2007-LD12, Class A-1-A, 5.85% 20513,5 | 3,967 | 4,330 |
| J.P. Morgan Chase Commercial Mortgage Securities Trust, Series 2006-LDP6, Class A-4, 5.475% 20433,5 | 40,835 | 42,111 |
| J.P. Morgan Chase Commercial Mortgage Securities Trust, Series 2006-LDP8, Class A-4, 5.399% 20455 | 6,929 | 7,296 |
| J.P. Morgan Chase Commercial Mortgage Securities Trust, Series 2006-LDP9, Class A-M, 5.372% 20475 | 2,135 | 2,219 |
| L.A. Arena Funding, LLC, Series 1, Class A, 7.656% 20264,5 | 24,369 | 27,312 |
| LB Commercial Mortgage Trust, Series 2007-C3, Class A-1-A, multifamily 5.858% 20443,5 | 6,310 | 6,881 |
| LB-UBS Commercial Mortgage Trust, Series 2006-C3, Class A1A, 5.641% 20393,5 | 5,031 | 5,239 |
| LB-UBS Commercial Mortgage Trust, Series 2007-C2, Class A-1-A, 5.387% 20405 | 12,511 | 13,461 |
The Bond Fund of America — Page 25 of 37
Bonds, notes & other debt instruments
Mortgage-backed obligations (continued)
Commercial mortgage-backed securities (continued) | Principal amount
(000) | Value
(000) |
| LB-UBS Commercial Mortgage Trust, Series 2007-C2, Class A-M, 5.493% 20403,5 | $8,725 | $9,212 |
| LB-UBS Commercial Mortgage Trust, Series 2007-C6, Class A-M, 6.114% 20403,5 | 30,967 | 33,627 |
| LB-UBS Commercial Mortgage Trust, Series 2007-C7, Class A-M, 6.163% 20453,5 | 8,680 | 9,672 |
| Merrill Lynch Mortgage Trust, Series 2006-C2, Class A-4, 5.742% 20433,5 | 9,135 | 9,653 |
| Merrill Lynch Mortgage Trust, Series 2007-C1, Class A-4, 6.028% 20503,5 | 7,050 | 7,584 |
| ML-CFC Commercial Mortgage Trust, Series 2006-4, Class A-3, 5.172% 20495 | 38,962 | 41,264 |
| ML-CFC Commercial Mortgage Trust, Series 2007-8, Class A-3, 6.079% 20493,5 | 7,410 | 8,092 |
| Morgan Stanley Capital I Trust, Series 2014-CPT, Class A, 3.35% 20214,5 | 15,365 | 15,919 |
| Morgan Stanley Capital I Trust, Series 2005-HQ6, Class AJ, 5.073% 20423,5 | 2,000 | 2,030 |
| Morgan Stanley Capital I Trust, Series 2007-TA27, Class A-1-A, 5.831% 20423,5 | 2,700 | 2,927 |
| Morgan Stanley Capital I Trust, Series 2006-IQ12, Class A1A, 5.319% 20435 | 9,666 | 10,278 |
| Morgan Stanley Capital I Trust, Series 2007-IQ13, Class A-1A, 5.312% 20445 | 556 | 592 |
| Morgan Stanley Capital I Trust, Series 2007-IQ13, Class A-M, 5.406% 20445 | 13,600 | 14,496 |
| Morgan Stanley Capital I Trust, Series 2007-IQ15, Class A-4, 6.105% 20493,5 | 21,795 | 23,729 |
| Wachovia Bank Commercial Mortgage Trust, Series 2005-C20, Class A-7, 5.118% 20423,5 | 8,086 | 8,157 |
| Wachovia Bank Commercial Mortgage Trust, Series 2006-C25, Class A1A, 5.707% 20433,5 | 8,794 | 9,172 |
| Wachovia Bank Commercial Mortgage Trust, Series 2006-C27, Class A1A, 5.749% 20453,5 | 7,119 | 7,549 |
| Wachovia Bank Commercial Mortgage Trust, Series 2007-C31, Class A-5, 5.50% 20475 | 4,900 | 5,287 |
| Wachovia Bank Commercial Mortgage Trust, Series 2007-C31, Class A-M, 5.591% 20473,5 | 17,020 | 18,193 |
| Wachovia Bank Commercial Mortgage Trust, Series 2007-C32, Class A-3, 5.933% 20493,5 | 15,250 | 16,395 |
| WFLD Mortgage Trust, Series 2014-MONT, Class B, 3.755% 20313,4,5 | 4,388 | 4,573 |
| WFLD Mortgage Trust, Series 2014-MONT, Class C, 3.755% 20313,4,5 | 3,150 | 3,205 |
| WFLD Mortgage Trust, Series 2014-MONT, Class D, 3.755% 20313,4,5 | 1,575 | 1,547 |
| WFLD Mortgage Trust, Series 2014-MONT, Class A, 3.755% 20313,4,5 | 850 | 900 |
| | | 1,066,109 |
| Other mortgage-backed securities 0.96% | | |
| Australia & New Zealand Banking Group Ltd. 1.00% 20164,5 | 4,250 | 4,263 |
| Australia & New Zealand Banking Group Ltd. 2.40% 20164,5 | 4,250 | 4,351 |
| Bank of Montreal 2.85% 20154,5 | 17,000 | 17,172 |
| Bank of Montreal 2.625% 20164,5 | 4,250 | 4,342 |
| Bank of Nova Scotia 2.15% 20164,5 | 4,650 | 4,739 |
| Bank of Nova Scotia 1.75% 20174,5 | 14,150 | 14,324 |
| Barclays Bank PLC 2.50% 20154,5 | 3,600 | 3,651 |
| Caisse Centrale Desjardins 1.60% 20174,5 | 3,375 | 3,408 |
| Canadian Imperial Bank of Commerce 2.75% 20164,5 | 4,150 | 4,239 |
| Commonwealth Bank of Australia 0.75% 20164,5 | 3,850 | 3,851 |
| Commonwealth Bank of Australia 2.25% 20174,5 | 4,150 | 4,243 |
| Commonwealth Bank of Australia 1.875% 20184,5 | 10,300 | 10,296 |
| Commonwealth Bank of Australia 2.00% 20194,5 | 8,950 | 8,945 |
| Credit Mutuel-CIC Home Loan SFH 1.50% 20174,5 | 4,400 | 4,419 |
| Credit Suisse Group AG 2.60% 20164,5 | 4,300 | 4,405 |
| DEPFA ACS Bank 5.125% 20374,5 | 10,405 | 13,093 |
| DNB ASA 1.45% 20194,5 | 4,375 | 4,346 |
| National Australia Bank 2.00% 20174,5 | 3,500 | 3,554 |
| National Australia Bank 1.25% 20184,5 | 2,880 | 2,845 |
| National Australia Bank 2.00% 20194,5 | 8,575 | 8,598 |
| National Australia Bank 2.125% 20194,5 | 4,000 | 4,014 |
| National Bank of Canada 2.20% 20164,5 | 4,175 | 4,270 |
| Norddeutsche Landesbank 2.00% 20194,5 | 4,000 | 4,032 |
| Nordea Eiendomskreditt AS 2.125% 20174,5 | 4,000 | 4,076 |
| Northern Rock PLC 5.625% 20174,5 | 850 | 933 |
| Royal Bank of Canada 3.125% 20154,5 | 18,160 | 18,297 |
| Royal Bank of Canada 1.125% 20165 | 4,000 | 4,019 |
The Bond Fund of America — Page 26 of 37
Bonds, notes & other debt instruments
Mortgage-backed obligations (continued)
Other mortgage-backed securities (continued) | Principal amount
(000) | Value
(000) |
| Royal Bank of Canada 2.00% 20195 | $4,075 | $4,117 |
| Royal Bank of Canada 2.20% 20195 | 7,350 | 7,412 |
| Skandinaviska Enskilda 1.375% 20184,5 | 4,375 | 4,341 |
| Sparebank 1 Boligkreditt AS 2.625% 20174,5 | 3,400 | 3,486 |
| Sparebank 1 Boligkreditt AS 1.25% 20194,5 | 4,000 | 3,943 |
| Sparebank 1 Boligkreditt AS 1.75% 20204,5 | 5,125 | 5,022 |
| Stadshypotek AB 1.875% 20194,5 | 4,275 | 4,227 |
| Swedbank AB 2.125% 20164,5 | 3,400 | 3,472 |
| Swedbank AB 2.95% 20164,5 | 3,000 | 3,079 |
| Swedbank AB 1.375% 20184,5 | 4,375 | 4,336 |
| Toronto-Dominion Bank 1.625% 20164,5 | 4,400 | 4,454 |
| Toronto-Dominion Bank 1.50% 20174,5 | 10,000 | 10,083 |
| UBS AG 1.875% 20154,5 | 4,200 | 4,203 |
| UBS AG 0.75% 20174,5 | 4,375 | 4,372 |
| Westpac Banking Corp. 1.375% 20154,5 | 4,325 | 4,347 |
| Westpac Banking Corp. 2.45% 20164,5 | 4,325 | 4,436 |
| Westpac Banking Corp. 1.25% 20174,5 | 4,425 | 4,384 |
| Westpac Banking Corp. 1.85% 20184,5 | 9,000 | 9,009 |
| Westpac Banking Corp. 1.375% 20194,5 | 4,375 | 4,320 |
| Westpac Banking Corp. 2.00% 20194,5 | 7,150 | 7,132 |
| | | 268,900 |
| Collateralized mortgage-backed (privately originated) 0.53% | | |
| Connecticut Avenue Securities, Series 2013-C01, Class M-1, 2.155% 20233,4,5 | 2,448 | 2,461 |
| Connecticut Avenue Securities, Series 2014-C02, Class 2M1, 1.105% 20243,5 | 5,171 | 5,072 |
| Connecticut Avenue Securities, Series 2014-C02, Class 1M1, 1.105% 20243,5 | 2,590 | 2,545 |
| Connecticut Avenue Securities, Series 2014-C03, Class 1M-1, 1.355% 20243,5 | 2,117 | 2,096 |
| Connecticut Avenue Securities, Series 2014-C01, Class M-1, 1.755% 20243,4,5 | 1,734 | 1,727 |
| CS First Boston Mortgage Securities Corp., Series 2002-30, Class I-A-1, 7.50% 20325 | 170 | 184 |
| CS First Boston Mortgage Securities Corp., Series 2002-34, Class I-A-1, 7.50% 20325 | 24 | 26 |
| CS First Boston Mortgage Securities Corp., Series 2003-21, Class V-A-1, 6.50% 20335 | 1,240 | 1,331 |
| CS First Boston Mortgage Securities Corp., Series 2003-29, Class V-A-1, 7.00% 20335 | 22 | 24 |
| Firstmac Bond Trust, Series 2014-1A, Class A2A, 0.504% 20153,4,5 | 9,000 | 9,010 |
| Freddie Mac, Series 2013-DN2, Class M-1, 1.605% 20233,5 | 6,393 | 6,362 |
| Freddie Mac, Series 2013-DN1, Class M-1, 3.555% 20233,5 | 6,701 | 6,928 |
| Freddie Mac, Series 2014-DN2, Class M-1, 1.005% 20243,5 | 5,182 | 5,142 |
| Freddie Mac, Series 2014-DN1, Class M-1, 1.155% 20243,5 | 929 | 923 |
| Freddie Mac, Series 2014-DN3, Class M-1, 1.507% 20243,5 | 17,205 | 17,184 |
| Freddie Mac, Series 2014-HQ2, Class M-1, 1.604% 20243,5 | 11,348 | 11,299 |
| Freddie Mac, Series 2014-HQ1, Class M-1, 1.807% 20243,5 | 15,349 | 15,353 |
| Freddie Mac, Series 2014-HQ3, Class M-1, 1.82% 20243,5 | 10,417 | 10,413 |
| Freddie Mac, Series 2014-DN2, Class M-2, 1.805% 20243,5 | 2,965 | 2,864 |
| Freddie Mac, Series 2014-HQ2, Class M-2, 2.354% 20243,5 | 17,865 | 17,305 |
| Freddie Mac, Series 2014-DN4, Class M-2, 2.57% 20243,5 | 7,710 | 7,701 |
| Freddie Mac, Series 2014-DN3, Class M-2, 2.557% 20243,5 | 2,200 | 2,197 |
| Freddie Mac, Series 2014-HQ1, Class M-2, 2.657% 20243,5 | 9,200 | 9,069 |
| TBW Mortgage-backed Trust, Series 2007-2, Class A-4-B, 0.575% 20373,5 | 14,036 | 11,878 |
| | | 149,094 |
| Total mortgage-backed obligations | | 6,281,708 |
The Bond Fund of America — Page 27 of 37
Bonds, notes & other debt instruments
Bonds & notes of governments & government agencies outside the U.S. 4.02% | Principal amount
(000) | Value
(000) |
| Argentina (Republic of) 7.00% 2017 | $26,395 | $25,132 |
| Bermuda Government 5.603% 20204 | 4,075 | 4,482 |
| Bermuda Government 5.603% 2020 | 3,940 | 4,334 |
| Bermuda Government 4.138% 20234 | 1,700 | 1,726 |
| Bermuda Government 4.854% 20244 | 10,650 | 11,129 |
| Brazil (Federal Republic of) 6.00% 20172 | BRL8,787 | 3,277 |
| Brazil (Federal Republic of) 6.00% 20182 | 2,492 | 920 |
| Brazil (Federal Republic of) 6.00% 20202 | 10,173 | 3,753 |
| Brazil (Federal Republic of) 10.00% 2023 | 28,910 | 9,600 |
| Brazil (Federal Republic of) 10.00% 2025 | 7,690 | 2,521 |
| Caisse d’Amortissement de la Dette Sociale 1.625% 20154 | $4,000 | 4,027 |
| Caisse d’Amortissement de la Dette Sociale 1.125% 20174 | 10,470 | 10,516 |
| Caisse d’Amortissement de la Dette Sociale 2.00% 20204 | 5,000 | 4,993 |
| Caisse d’Amortissement de la Dette Sociale 3.375% 20244 | 8,180 | 8,759 |
| Chilean Government 3.875% 2020 | 3,000 | 3,228 |
| Colombia (Republic of), Series B, 10.00% 2024 | COP40,968,000 | 20,593 |
| Colombia (Republic of) Global 4.375% 2021 | $16,200 | 17,172 |
| Colombia (Republic of) Global 4.00% 2024 | 1,400 | 1,435 |
| Colombia (Republic of) Global 6.125% 2041 | 4,000 | 4,820 |
| Colombia (Republic of) Global 5.625% 2044 | 900 | 1,017 |
| Dominican Republic 7.50% 20214,5 | 7,000 | 7,710 |
| Dominican Republic 7.50% 20215 | 950 | 1,046 |
| Dominican Republic 7.45% 20444 | 7,500 | 8,238 |
| El Salvador (Republic of) 7.375% 2019 | 4,800 | 5,364 |
| Europe Government Agency-Guaranteed, Dexia Credit Local 1.25% 20164 | 4,100 | 4,120 |
| European Investment Bank 1.00% 2015 | 9,100 | 9,136 |
| FMS Wertmanagement 1.125% 2016 | 4,050 | 4,081 |
| FMS Wertmanagement 1.00% 2017 | 4,400 | 4,348 |
| FMS Wertmanagement 1.625% 2018 | 6,400 | 6,421 |
| Gabonese Republic 6.375% 20244,5 | 9,154 | 8,742 |
| Greek Government 2.00%/3.00% 202311 | €570 | 440 |
| Greek Government 2.00%/3.00% 202411 | 570 | 436 |
| Greek Government 2.00%/3.00% 202511 | 570 | 412 |
| Greek Government 2.00%/3.00% 202611 | 570 | 394 |
| Greek Government 2.00%/3.00% 202711 | 570 | 384 |
| Greek Government 2.00%/3.00% 202811 | 570 | 372 |
| Greek Government 2.00%/3.00% 202911 | 835 | 543 |
| Greek Government 2.00%/3.00% 203011 | 835 | 535 |
| Greek Government 2.00%/3.00% 203111 | 835 | 530 |
| Greek Government 2.00%/3.00% 203211 | 835 | 523 |
| Greek Government 2.00%/3.00% 203311 | 835 | 523 |
| Greek Government 2.00%/3.00% 203411 | 835 | 517 |
| Greek Government 2.00%/3.00% 203511 | 835 | 514 |
| Greek Government 2.00%/3.00% 203611 | 1,035 | 633 |
| Greek Government 2.00%/3.00% 203711 | 1,035 | 627 |
| Greek Government 2.00%/3.00% 203811 | 1,035 | 631 |
| Greek Government 2.00%/3.00% 203911 | 1,035 | 631 |
| Greek Government 2.00%/3.00% 204011 | 1,035 | 632 |
| Greek Government 2.00%/3.00% 204111 | 1,035 | 632 |
| Greek Government 2.00%/3.00% 204211 | 1,035 | 635 |
| Hungarian Government 6.25% 2020 | $6,700 | 7,563 |
| Hungarian Government 6.375% 2021 | 3,200 | 3,674 |
| Hungarian Government 5.375% 2023 | 11,600 | 12,629 |
| Hungarian Government 5.375% 2024 | 1,000 | 1,085 |
| India (Republic of) 7.28% 2019 | INR2,740,000 | 42,581 |
The Bond Fund of America — Page 28 of 37
Bonds, notes & other debt instruments
Bonds & notes of governments & government agencies outside the U.S. (continued) | Principal amount
(000) | Value
(000) |
| India (Republic of) 8.83% 2023 | INR730,000 | $12,181 |
| India (Republic of) 8.60% 2028 | 230,000 | 3,877 |
| Indonesia (Republic of) 5.875% 20204 | $6,200 | 6,897 |
| Indonesia (Republic of) 5.875% 2020 | 5,500 | 6,119 |
| Indonesia (Republic of) 4.875% 2021 | 5,460 | 5,794 |
| Indonesia (Republic of) 3.75% 2022 | 10,150 | 10,048 |
| Indonesia (Republic of), Series 71, 9.00% 2029 | IDR34,700,000 | 3,012 |
| Indonesia (Republic of) 8.375% 2034 | 241,300,000 | 19,733 |
| Indonesia (Republic of) 7.75% 2038 | $8,400 | 11,035 |
| Indonesia (Republic of) 5.25% 2042 | 8,700 | 8,820 |
| Indonesia (Republic of) 4.625% 2043 | 1,500 | 1,397 |
| Indonesia (Republic of) 6.75% 2044 | 1,800 | 2,232 |
| Indonesia (Republic of) 6.75% 20444 | 1,125 | 1,395 |
| Instituto de Credito Oficial 1.125% 20164 | 8,000 | 8,009 |
| Inter-American Development Bank 4.375% 2044 | 11,500 | 14,109 |
| Iraq (Republic of) 5.80% 20285 | 21,050 | 17,735 |
| Irish Government 3.90% 2023 | €19,750 | 29,175 |
| Israeli Government 5.125% 2019 | $500 | 570 |
| Italian Government 4.50% 2024 | €8,500 | 12,662 |
| Japan Bank for International Cooperation 3.00% 2024 | $9,330 | 9,760 |
| Japan Finance Organization for Municipalities 2.125% 20194 | 10,000 | 10,063 |
| Kenya (Republic of) 6.875% 20244 | 12,000 | 12,630 |
| Kenya (Republic of) 6.875% 2024 | 7,500 | 7,894 |
| KfW 1.00% 2015 | 8,400 | 8,401 |
| KfW 2.00% 2022 | 4,325 | 4,285 |
| Landwirtschaftliche Rentenbank 1.75% 2019 | 8,970 | 9,003 |
| Lithuania (Republic of) 6.125% 2021 | 6,000 | 7,009 |
| Morocco Government 4.25% 2022 | 5,400 | 5,440 |
| Morocco Government 4.25% 20224 | 2,700 | 2,720 |
| Morocco Government 5.50% 2042 | 19,300 | 20,120 |
| Morocco Government 5.50% 20424 | 2,300 | 2,398 |
| Municipality Finance PLC 1.125% 20184 | 4,900 | 4,850 |
| Nigeria (Republic of) 5.125% 20184 | 7,975 | 7,925 |
| Nigeria (Republic of) 6.375% 2023 | 13,490 | 13,321 |
| Nigeria (Republic of) 6.375% 20234 | 5,325 | 5,258 |
| Peru (Republic of) 5.625% 2050 | 7,500 | 8,869 |
| Perusahaan Penerbit SBSN 4.35% 20244 | 3,850 | 3,879 |
| Philippines (Republic of) 6.375% 2034 | 15,500 | 20,809 |
| Philippines (Republic of) 6.25% 2036 | PHP621,000 | 15,627 |
| Polish Government 2.75% 20232 | PLN17,334 | 5,409 |
| Province of Manitoba 3.05% 2024 | $6,050 | 6,260 |
| Province of Ontario 3.20% 2024 | 20,000 | 20,865 |
| Queensland Treasury Corp. 4.75% 2025 | A$10,000 | 9,269 |
| Romanian Government 6.75% 20224 | $8,000 | 9,659 |
| Russian Federation 6.20% 2018 | RUB617,500 | 8,030 |
| Russian Federation 7.50% 2018 | 403,000 | 5,390 |
| Russian Federation 5.00% 2020 | $17,800 | 16,639 |
| Russian Federation 7.50% 20305 | 24,111 | 25,063 |
| Russian Federation 7.50% 20304,5 | 95 | 99 |
| Slovenia (Republic of) 4.75% 2018 | 8,375 | 8,982 |
| Slovenia (Republic of) 4.125% 20194 | 870 | 914 |
| Slovenia (Republic of) 5.50% 2022 | 32,660 | 36,334 |
| Slovenia (Republic of) 5.50% 20224 | 3,000 | 3,338 |
| Slovenia (Republic of) 5.85% 2023 | 18,850 | 21,407 |
| Slovenia (Republic of) 5.85% 20234 | 10,650 | 12,095 |
The Bond Fund of America — Page 29 of 37
Bonds, notes & other debt instruments
Bonds & notes of governments & government agencies outside the U.S. (continued) | Principal amount
(000) | Value
(000) |
| Slovenia (Republic of) 5.25% 2024 | $3,260 | $3,598 |
| South Africa (Republic of) 5.50% 2020 | 10,750 | 11,825 |
| South Africa (Republic of), Series R-213, 7.00% 2031 | ZAR200,000 | 15,113 |
| Spanish Government 4.00% 20184 | $9,310 | 9,809 |
| Spanish Government 5.40% 2023 | €10,000 | 15,837 |
| Spanish Government 5.15% 2028 | 14,000 | 22,719 |
| Spanish Government 5.15% 2044 | 26,250 | 45,466 |
| Sri Lanka (Republic of) 6.25% 20214 | $3,400 | 3,578 |
| Swedish Export Credit Corp. 2.875% 20234 | 9,000 | 8,916 |
| Turkey (Republic of) 4.557% 20184 | 1,195 | 1,256 |
| Turkey (Republic of) 7.00% 2019 | 2,000 | 2,288 |
| Turkey (Republic of) 3.00% 20212 | TRY2,690 | 1,247 |
| Turkey (Republic of) 5.625% 2021 | $8,000 | 8,830 |
| Turkey (Republic of) 8.00% 2034 | 1,250 | 1,714 |
| Turkey (Republic of) 6.75% 2040 | 11,300 | 13,998 |
| Turkey (Republic of) 6.00% 2041 | 14,650 | 16,683 |
| United Mexican States Government, Series M, 5.00% 2017 | MXN60,000 | 4,170 |
| United Mexican States Government 3.50% 20172 | 191,034 | 13,829 |
| United Mexican States Government 2.50% 20202 | 31,663 | 2,198 |
| United Mexican States Government, Series M20, 10.00% 2024 | 220,000 | 19,568 |
| United Mexican States Government Global 3.60% 2025 | $17,925 | 17,952 |
| United Mexican States Government 4.00% 20402 | MXN103,433 | 7,903 |
| United Mexican States Government Global, Series A, 5.125% 2020 | $2,100 | 2,321 |
| United Mexican States Government Global, Series A, 3.625% 2022 | 4,400 | 4,506 |
| United Mexican States Government Global, Series A, 4.00% 2023 | 8,000 | 8,310 |
| United Mexican States Government Global 5.55% 2045 | 10,000 | 11,650 |
| Uruguay (Republic of) 4.375% 20282,5 | UYU138,487 | 5,718 |
| Venezuela (Republic of) 7.65% 2025 | $985 | 423 |
| Venezuela (Republic of) 9.25% 2028 | 18,980 | 8,427 |
| Zambia (Republic of) 5.375% 2022 | 8,500 | 7,884 |
| | | 1,123,266 |
| Federal agency bonds & notes 3.22% | | |
| CoBank, ACB 7.875% 20184 | 23,615 | 27,566 |
| CoBank, ACB 0.834% 20223,4 | 29,725 | 27,867 |
| Export-Import Bank of the United States-Guaranteed, Ethiopian Leasing 2012 LLC 2.646% 20265 | 4,817 | 4,851 |
| Fannie Mae 0.50% 2016 | 69,775 | 69,749 |
| Fannie Mae 5.375% 2016 | 10,420 | 11,179 |
| Fannie Mae 5.00% 2017 | 10,290 | 11,199 |
| Fannie Mae 1.75% 2019 | 34,125 | 34,152 |
| Fannie Mae 2.625% 2024 | 40,305 | 40,871 |
| Fannie Mae 7.125% 2030 | 3,900 | 5,997 |
| Fannie Mae, Series 2014-M2, Class A-S-Q2, multifamily 0.478% 20155 | 7,879 | 7,879 |
| Fannie Mae, Series 2013-M4, multifamily 2.608% 20225 | 4,325 | 4,349 |
| Fannie Mae, Series 2012-M2, Class A2, multifamily 2.717% 20225 | 8,400 | 8,565 |
| Fannie Mae, Series 2012-M3, Class 1-A2, multifamily 3.044% 20225 | 3,500 | 3,629 |
| Fannie Mae, Series 2013-M14, Class A2, multifamily 3.329% 20233,5 | 7,175 | 7,559 |
| Fannie Mae, Series 2014-M1, multifamily 3.373% 20233,5 | 8,350 | 8,761 |
| Fannie Mae, Series 2014-M2, Class A2, multifamily 3.513% 20233,5 | 11,990 | 12,804 |
| Fannie Mae, Series 2014-M13, Class A-2, multifamily 3.021% 20245 | 1,500 | 1,537 |
| Fannie Mae, Series 2014-M9, multifamily 3.103% 20243,5 | 6,395 | 6,616 |
| Fannie Mae, Series 2014-M3, Class A2, multifamily 3.477% 20243,5 | 18,290 | 19,462 |
| Federal Agricultural Mortgage Corp. 5.125% 20174 | 5,000 | 5,459 |
| Federal Farm Credit Banks 0.212% 20173 | 26,250 | 26,258 |
| Federal Farm Credit Banks 0.225% 20173 | 21,501 | 21,504 |
The Bond Fund of America — Page 30 of 37
Bonds, notes & other debt instruments
Federal agency bonds & notes (continued) | Principal amount
(000) | Value
(000) |
| Federal Home Loan Bank 2.125% 2016 | $18,860 | $19,276 |
| Federal Home Loan Bank 2.75% 2018 | 16,635 | 17,423 |
| Federal Home Loan Bank 3.375% 2023 | 28,050 | 30,121 |
| Federal Home Loan Bank 5.50% 2036 | 600 | 821 |
| Freddie Mac 0.50% 2016 | 35,245 | 35,237 |
| Freddie Mac 4.875% 2018 | 13,365 | 14,976 |
| Freddie Mac 1.25% 2019 | 43,500 | 42,642 |
| Freddie Mac, Series K705, Class A2, multifamily 2.303% 20185 | 3,092 | 3,156 |
| Freddie Mac, Series K706, Class A2, multifamily 2.323% 20185 | 3,225 | 3,293 |
| Freddie Mac, Series K704, Class A2, multifamily 2.412% 20185 | 3,100 | 3,178 |
| Freddie Mac, Series K702, Class A2, multifamily 3.154% 20185 | 2,455 | 2,571 |
| Freddie Mac, Series K712, Class A2, multifamily 1.869% 20195 | 3,365 | 3,349 |
| Freddie Mac, Series KGRP, Class A, multifamily 0.536% 20203,5 | 6,688 | 6,713 |
| Freddie Mac, Series KF02, Class A2, multifamily 0.705% 20203,5 | 25,063 | 25,178 |
| Freddie Mac, Series KF02, Class A3, multifamily 0.80% 20203,5 | 13,649 | 13,694 |
| Freddie Mac, Series K009, Class A1, multifamily 2.757% 20205 | 2,550 | 2,630 |
| Freddie Mac, Series K013, Class A1, multifamily 2.902% 20205 | 3,021 | 3,123 |
| Freddie Mac, Series K714, Class A2, multifamily 3.034% 20203,5 | 6,650 | 6,956 |
| Freddie Mac, Series K010, Class A1, multifamily 3.32% 20205 | 2,533 | 2,652 |
| Freddie Mac, Series K019, Class A1, multifamily 1.459% 20215 | 1,891 | 1,868 |
| Freddie Mac, Series K017, Class A2, multifamily 2.873% 20215 | 4,200 | 4,336 |
| Freddie Mac, Series K716, Class A2, multifamily 3.132% 20215 | 13,590 | 14,215 |
| Freddie Mac, Series K022, Class A2, multifamily 2.355% 20225 | 4,325 | 4,294 |
| Freddie Mac, Series K020, Class A2, multifamily 2.373% 20225 | 14,350 | 14,277 |
| Freddie Mac, Series K021, Class A2, multifamily 2.396% 20225 | 22,995 | 22,959 |
| Freddie Mac, Series K031, Class A1, multifamily 2.778% 20225 | 2,835 | 2,931 |
| Freddie Mac, Series K029, Class A1, multifamily 2.839% 20225 | 3,843 | 3,984 |
| Freddie Mac, Series KS01, Class A2, multifamily 2.522% 20235 | 6,735 | 6,746 |
| Freddie Mac, Series K036, Class A2, multifamily 3.527% 20233,5 | 24,490 | 26,175 |
| Freddie Mac, Series K041, Class A-2, multifamily 3.171% 20245 | 10,600 | 11,020 |
| Freddie Mac, Series K040, Class A2, multifamily 3.241% 20245 | 2,000 | 2,092 |
| Private Export Funding Corp., Series W, 5.00% 2016 | 3,400 | 3,662 |
| Private Export Funding Corp. 3.55% 2024 | 26,425 | 28,218 |
| Tennessee Valley Authority, Series A, 3.875% 2021 | 8,750 | 9,617 |
| Tennessee Valley Authority 1.875% 2022 | 23,750 | 22,864 |
| Tennessee Valley Authority 4.65% 2035 | 4,000 | 4,831 |
| Tennessee Valley Authority 5.25% 2039 | 21,250 | 27,145 |
| Tennessee Valley Authority, Series B, 3.50% 2042 | 25,113 | 24,971 |
| Tennessee Valley Authority, Series 2008, Class A, 4.875% 2048 | 3,200 | 3,916 |
| TVA Southaven 3.846% 20335 | 3,240 | 3,445 |
| United States Agency for International Development, Jordan (Kingdom of) 1.945% 2019 | 16,500 | 16,720 |
| United States Agency for International Development, Jordan (Kingdom of) 2.503% 2020 | 8,600 | 8,858 |
| United States Agency for International Development, Republic of Egypt 4.45% 2015 | 5,000 | 5,136 |
| United States Agency for International Development, Ukraine, 1.844% 2019 | 6,930 | 6,992 |
United States Government-Guaranteed Certificates of Participation, Overseas Private
Investment Corp, 0% 2016 | 2,301 | 2,320 |
United States Government-Guaranteed Certificates of Participation, Overseas Private
Investment Corp, 3.49% 20295 | 4,032 | 4,233 |
United States Government-Guaranteed Certificates of Participation, Overseas Private
Investment Corp, 3.82% 20325 | 4,491 | 4,823 |
United States Government-Guaranteed Certificates of Participation, Overseas Private
Investment Corp, 3.938% 20325 | 1,624 | 1,732 |
| Export-Import Bank of the United States-Guaranteed, VCK Lease SA 2.591% 20265 | 2,618 | 2,611 |
| | | 901,793 |
The Bond Fund of America — Page 31 of 37
Bonds, notes & other debt instruments
Asset-backed obligations 2.69% | Principal amount
(000) | Value
(000) |
| AEP Texas Central Transitioning Funding II LLC, Secured Transition Bonds, Series A, Class A-3, 5.09% 20175 | $5,415 | $5,537 |
| Aesop Funding II LLC, Series 2010-5A, Class A, 3.15% 20174,5 | 20,000 | 20,463 |
| Aesop Funding LLC, Series 2014-2A, Class A, 2.50% 20214,5 | 19,500 | 19,432 |
| Ally Auto Receivables Trust, Series 2014-1, Class A3, 0.97% 20185 | 18,300 | 18,276 |
| Ally Master Owner Trust, Series 2014-1, Class A1, 0.624% 20193,5 | 8,015 | 8,011 |
| Ally Master Owner Trust, Series 2014-1, Class A2, 1.29% 20195 | 8,700 | 8,684 |
| Ally Master Owner Trust, Series 2014-5, Class A2, 1.60% 20195 | 10,860 | 10,840 |
| American Express Credit Account Master Trust, Series 2014-4, Class A, 1.43% 20205 | 30,600 | 30,557 |
| AmeriCredit Automobile Receivables Trust, Series 2012-1, Class C-2, 2.67% 20155 | 1,400 | 1,417 |
| AmeriCredit Automobile Receivables Trust, Series 2014-3, Class A-3, 1.15% 20175 | 3,405 | 3,385 |
| AmeriCredit Automobile Receivables Trust, Series 2014-4, Class A-2-A, 0.72% 20185 | 10,690 | 10,687 |
| AmeriCredit Automobile Receivables Trust, Series 2012-4, Class C, 1.93% 20185 | 650 | 654 |
| AmeriCredit Automobile Receivables Trust, Series 2014-4, Class A-3, 1.27% 20195 | 7,220 | 7,197 |
| Appalachian Consumer Rate Relief Funding LLC, Series 2013-1, Class A-1, 2.01% 20245 | 6,401 | 6,403 |
| Appalachian Consumer Rate Relief Funding LLC, Series 2013-1, Class A-2, 3.77% 20315 | 4,215 | 4,539 |
| ARI Fleet Lease Trust, Series 2014-A, Class A-2, 0.81% 20224,5 | 2,260 | 2,254 |
| BA Credit Card Trust, Series 2014-A1, Class A, 0.534% 20213,5 | 12,590 | 12,570 |
| Bank of the West Auto Trust, Series 2014-1, Class A-3, 1.09% 20194,5 | 4,400 | 4,401 |
| Capital One Multi-asset Execution Trust, Series 2014-A5, Class A, 1.48% 20205 | 12,000 | 12,021 |
| Carlyle Global Market Strategies Commodities Fund, Series 2014-1A, Class A, 2.131% 20213,4,5,8 | 30,365 | 30,357 |
| CarMaxAuto Owner Trust, Series 2014-1, Class A-2, 0.47% 20175 | 5,761 | 5,760 |
| CarMaxAuto Owner Trust, Series 2014-1, Class A-3, 0.79% 20185 | 15,625 | 15,580 |
| CarMaxAuto Owner Trust, Series 2014-3, Class A-3, 1.16% 20195 | 7,385 | 7,363 |
| CarMaxAuto Owner Trust, Series 2014-4, Class A-3, 1.25% 20195 | 12,800 | 12,775 |
| Chesapeake Funding LLC, Series 2014-1-A, Class A, 0.579% 20263,4,5 | 16,700 | 16,704 |
| Chrysler Capital Auto Receivables Trust, Series 2014-A-A, Class A-3, 0.83% 20184,5 | 5,775 | 5,763 |
| Chrysler Capital Auto Receivables Trust, Series 2014-A-A, Class A-4, 1.31% 20194,5 | 3,850 | 3,839 |
| Citibank Credit Card Issuance Trust, Series 2014-A-2, Class A-2, 1.02% 20195 | 7,520 | 7,493 |
| Citibank Credit Card Issuance Trust, Series 2014-A6, Class A6, 2.15% 20195 | 9,000 | 9,051 |
| Conseco Finance Home Equity Loan Trust, Series 2002-B, Class M-1, 1.904% 20333,5 | 808 | 804 |
| Conseco Finance Securitizations Corp., Series 2002-2, Class A-2, 6.03% 20335 | 1,709 | 1,744 |
| CWHEQ Revolving Home Equity Loan Trust, Series 2005-C, Class 2-A, FSA insured, 0.334% 20353,5 | 6,902 | 6,315 |
| CWHEQ Revolving Home Equity Loan Trust, Series 2006-I, Class 2-A, FSA insured, 0.293% 20373,5 | 8,310 | 7,692 |
| CWHEQ Revolving Home Equity Loan Trust, Series 2007-B, Class A, FSA insured, 0.303% 20373,5 | 12,500 | 11,346 |
| Discover Card Execution Note Trust, Series 2014-A4, Class A4, 2.12% 20215 | 13,500 | 13,568 |
| Enterprise Fleet Financing LLC, Series 2014-1, Class A2, 0.87% 20194,5 | 11,352 | 11,346 |
| Enterprise Fleet Financing LLC, Series 2014-2, Class A2, 1.05% 20204,5 | 12,280 | 12,271 |
| Fifth Third Auto Trust, Series 2014-1, Class A3, 0.68% 20185 | 10,175 | 10,163 |
| Fifth Third Auto Trust, Series 2014-3, Class A3, 0.96% 20195 | 6,000 | 5,980 |
| Flagstar Home Equity Loan Trust, Series 2006-2A, Class A, FSA insured, 0.315% 20193,4,5 | 6,295 | 6,123 |
| Ford Credit Auto Lease Trust, Series 2014-B, Class A3, 0.89% 20175 | 7,265 | 7,249 |
| Ford Credit Auto Owner Trust, Series 2014-B-A3, 0.90% 20185 | 12,285 | 12,274 |
| Ford Credit Auto Owner Trust, Series 2014-1-A, 2.26% 20254,5 | 7,220 | 7,267 |
| Ford Credit Auto Owner Trust, Series 2014-2-A, 2.31% 20264,5 | 19,235 | 19,330 |
| Green Tree Financial Corp., Series 1997-6, Class A-7, 7.14% 20295 | 1,014 | 1,060 |
| Henderson Receivables LLC, Series 2014-3A, Class A, 3.50% 20774,5 | 4,994 | 5,020 |
| Hertz Fleet Lease Funding LP, Series 2014-1-A, 0.554% 20283,4,5 | 12,215 | 12,217 |
| Hertz Vehicle Financing LLC, Rental Car Asset-backed Notes, Series 2009-2A, Class A-2, 5.29% 20164,5 | 8,750 | 8,799 |
| Hertz Vehicle Financing LLC, Rental Car Asset-backed Notes, Series 2013-1A, Class A-1, 1.12% 20174,5 | 11,075 | 11,071 |
| Hertz Vehicle Financing LLC, Rental Car Asset-backed Notes, Series 2010-1A, Class A-2, 3.74% 20174,5 | 8,500 | 8,723 |
| Hertz Vehicle Financing LLC, Rental Car Asset-backed Notes, Series 2013-1A, Class A-2, 1.83% 20194,5 | 15,000 | 14,799 |
| Hilton Grand Vacation Trust, Series 2014-AA, Class A, 1.77% 20264,5 | 3,994 | 3,956 |
| Home Equity Asset Trust, Series 2004-7, Class M-1, 1.085% 20353,5 | 6,500 | 6,319 |
| Honda Auto Receivables Owner Trust, Series 2014-1, Class A-3, 0.67% 20175 | 26,410 | 26,353 |
| Honda Auto Receivables Owner Trust, Series 2014-3, Class A-3, 0.88% 20175 | 11,880 | 11,843 |
The Bond Fund of America — Page 32 of 37
Bonds, notes & other debt instruments
Asset-backed obligations (continued) | Principal amount
(000) | Value
(000) |
| Honda Auto Receivables Owner Trust, Series 2014-4, Class A-3, 0.99% 20185 | $9,180 | $9,161 |
| Hyundai Auto Receivables Trust, Series 2014-A, Class A2, 0.46% 20175 | 3,141 | 3,141 |
IndyMac Home Equity Mortgage Loan Asset-backed Trust, Series 2007-H1, Class A-1,
FSA insured, 0.312% 20373,5 | 6,378 | 5,697 |
| Lehman ABS Manufactured Housing Contract Trust, Series 2002-A, Class A, 0.605% 20333,5 | 1,701 | 1,664 |
| Lehman ABS Manufactured Housing Contract Trust, Series 2001-B, Class A-3, 4.35% 20405 | 763 | 807 |
| Lehman ABS Manufactured Housing Contract Trust, Series 2001-B, Class A-4, 5.27% 20405 | 391 | 421 |
| Lehman ABS Manufactured Housing Contract Trust, Series 2001-B, Class A-5, 5.873% 20405 | 1,285 | 1,396 |
| Mercedes-Benz Auto Receivables Trust, Series 2014-1, Class A3, 0.87% 20185 | 10,700 | 10,675 |
| Mississippi Higher Education Assistance Corp., Series 2014-1, Class A1, 0.835% 20353,5 | 3,717 | 3,711 |
| Navient Student Loan Trust, Series 2014-AA, Class A-1, 0.641% 20223,4,5 | 3,406 | 3,410 |
| New Residential Advance Receivables Trust, Series 2014-T-2, Class A-2, 2.377% 20474,5 | 10,745 | 10,760 |
| Origen Manufactured Housing Contract Trust, Series 2004-B, Class M-1, 5.73% 20355 | 1,027 | 1,080 |
| Origen Manufactured Housing Contract Trust, Series 2004-B, Class M-2, 6.51% 20355 | 823 | 890 |
| RAMP Trust, Series 2004-RS10, Class A-I-6, 4.55% 20345 | 1,838 | 1,869 |
| Residential Funding Mortgage Securities II, Inc., Series 2006-HSA3, Class A, FSA insured, 0.285% 20363,5 | 907 | 796 |
| Santander Drive Auto Receivables Trust, Series 2012-2, Class C, 3.20% 20155 | 835 | 844 |
| Santander Drive Auto Receivables Trust, Series 2011-4, Class C, 3.82% 20155 | 751 | 760 |
| Santander Drive Auto Receivables Trust, Series 2012-6, Class C, 1.94% 20165 | 1,165 | 1,173 |
| Santander Drive Auto Receivables Trust, Series 2012-4, Class C, 2.94% 20165 | 1,335 | 1,353 |
| Santander Drive Auto Receivables Trust, Series 2013-2, Class C, 1.95% 20175 | 3,860 | 3,881 |
| Santander Drive Auto Receivables Trust, Series 2011-1, Class D, 4.01% 20175 | 1,740 | 1,769 |
| Santander Drive Auto Receivables Trust, Series 2014-3, Class A3, 0.81% 20185 | 6,000 | 5,988 |
| Santander Drive Auto Receivables Trust, Series 2014-4, Class A3, 1.08% 20185 | 10,620 | 10,610 |
| Santander Drive Auto Receivables Trust, Series 2014-1, Class B, 1.59% 20185 | 5,400 | 5,413 |
| Santander Drive Auto Receivables Trust, Series 2012-3, Class C, 3.01% 20185 | 615 | 624 |
| Santander Drive Auto Receivables Trust, Series 2014-5, Class A-3, 1.15% 20195 | 1,975 | 1,973 |
| Santander Drive Auto Receivables Trust, Series 2014-5, Class B, 1.76% 20195 | 2,670 | 2,665 |
| Santander Drive Auto Receivables Trust, Series 2014-1, Class C, 2.36% 20205 | 4,465 | 4,494 |
| Santander Drive Auto Receivables Trust, Series 2013-4, Class C, 3.25% 20205 | 1,175 | 1,210 |
| SLM Private Credit Student Loan Trust, Series 2014-A, Class A-1, 0.755% 20223,4,5 | 3,763 | 3,771 |
| SLM Student Loan Trust, Series 2003-10, Class A-4, 5.15% 20394,5 | £1,160 | 1,706 |
| South Carolina Student Loan Corp., Series 2014-1, Class A1, 0.918% 20303,5 | $3,600 | 3,606 |
| South Carolina Student Loan Corp., Series 2014-1, Class A2, 1.168% 20333,5 | 5,500 | 5,487 |
| South Carolina Student Loan Corp., Series 2014-1, Class B, 1.668% 20353,5 | 2,650 | 2,513 |
| SpringCastle America Funding LLC, Series 2014-AA, Class A, 2.70% 20234,5 | 5,856 | 5,856 |
| Toyota Auto Receivables Owner Trust, Series 2014-B, Class A3, 0.76% 20185 | 2,500 | 2,495 |
| Trade Maps Ltd., 2013-1-A-A, 0.854% 20183,4,5 | 14,685 | 14,711 |
| Trade Maps Ltd., 2013-1-A-B, 1.404% 20183,4,5 | 2,900 | 2,900 |
| UCFC Manufactured Housing Contract, Series 1996-2, Class A, MBIA insured, 7.135% 20285 | 2,318 | 2,421 |
| Utility Debt Securitization Auth., Series 2013-T, 3.435% 20255 | 6,735 | 7,046 |
| Vanderbilt Acquisition Loan Trust, Series 2002-1, Class A-4, 6.57% 20275 | 2,729 | 2,842 |
| Vanderbilt Acquisition Loan Trust, Series 2002-1, Class A-5, 7.12% 20325 | 3,000 | 3,250 |
| Vanderbilt Mortgage and Finance, Inc., Series 2002-C, Class A-4, 6.57% 20245 | 1,538 | 1,562 |
| Vanderbilt Mortgage and Finance, Inc., Series 2002-C, Class M-1, 7.82% 20325 | 869 | 922 |
| Vega ContainerVessel PLC, Series 2006-1, Class A, XLCA insured, 5.562% 20214,5,8 | 14,668 | 14,668 |
| Volkswagen Auto Lease Trust, Series 2014-A, Class A-3, 0.80% 20175 | 2,910 | 2,903 |
| Volkswagen Auto Loan Enhanced Trust, Series 2014-2, Class A-3 0.95% 20195 | 13,500 | 13,433 |
| World Financial Network Credit Card Master Note Trust, Series 2014-A, Class A, 0.534% 20193,5 | 8,700 | 8,706 |
| World Omni Auto Receivables Trust, Series 2014-B, Class A-3, 1.14% 20205 | 6,935 | 6,902 |
| | | 751,580 |
The Bond Fund of America — Page 33 of 37
Bonds, notes & other debt instruments
Municipals 2.04% | Principal amount
(000) | Value
(000) |
| State of California, Bay Area Toll Auth., San Francisco Bay Area Toll Bridge Rev. Ref. Bonds, Series 2014-F1, 5.00% 2054 | $10,000 | $11,273 |
State of California, Infrastructure and Econ. Dev. Bank, Rev. Ref. Bonds (J. Paul Getty Trust),
Series 2011-A-2, 0.32% 2038 (put 2017)3 | 2,400 | 2,402 |
State of California, Public Works Board, Lease Rev. Bonds (Dept. of Corrections and Rehabilitation),
Series 2014-A, 5.00% 2039 | 20,000 | 22,945 |
| State of California, Regents of the University of California, General Rev. Bonds, Series 2014-AN, 4.765% 2044 | 2,600 | 2,796 |
State of California, Regents of the University of California, Limited Project Rev. Bonds, Series 2012-G,
5.00% 2042 | 16,305 | 18,407 |
| State of California, Sacramento County Sanitation Districts Fncg. Auth., Rev. Bonds (Sacramento Regional County Sanitation Dist.), Series 2014-A, 5.00% 2044 | 5,000 | 5,822 |
| State of California, Various Purpose G.O. Bonds, 4.50% 2043 | 10,000 | 10,940 |
| State of California, Various Purpose G.O. Bonds, 5.00% 2024 | 10,000 | 12,457 |
| State of California, Various Purpose G.O. Bonds, 5.00% 2043 | 21,685 | 24,638 |
| State of California, Various Purpose G.O. Bonds, 5.00% 2043 | 4,050 | 4,640 |
| State of California, Various Purpose G.O. Bonds, 7.30% 20395 | 2,290 | 3,368 |
| State of California, Various Purpose G.O. Bonds, 7.35% 2039 | 1,335 | 1,975 |
| State of California, Various Purpose G.O. Bonds, 7.50% 2034 | 4,240 | 6,364 |
| State of California, Various Purpose G.O. Bonds, 7.55% 2039 | 11,680 | 18,065 |
| State of California, Various Purpose G.O. Bonds, 7.60% 2040 | 30,435 | 48,352 |
| State of California, Various Purpose G.O. Bonds, 7.625% 2040 | 6,830 | 10,508 |
| State of Florida, Hurricane Catastrophe Fund Fin. Corp., Rev. Bonds, Series 2013-A, 2.107% 2018 | 8,000 | 8,068 |
| State of Florida, Hurricane Catastrophe Fund Fin. Corp., Rev. Bonds, Series 2013-A, 2.995% 2020 | 40,090 | 40,794 |
State of Florida, Miami-Dade County Expressway Auth., Toll System Rev. Ref. Bonds, Series 2014-A,
5.00% 2044 | 3,000 | 3,360 |
| State of Georgia, Hospital Auth. of Hall County and City of Gainesville, Rev. Anticipation Certificates (Northeast Georgia Health System, Inc. Project), Series 2014-B, 0.99% 2035 (put 2020)3 | 5,000 | 5,007 |
| State of Illinois, Board of Trustees of the University of Illinois, University of Illinois Auxiliary Facs. System Rev. Bonds, Series 2014-A, 5.00% 2044 | 8,500 | 9,532 |
| State of Illinois, Chicago Transit Auth., Sales Tax Receipts Rev. Bonds, Series 2014, 5.25% 2049 | 15,000 | 17,150 |
| State of Illinois, Fin. Auth., Rev. Bonds (University of Chicago), Series 2012-A, 5.00% 2051 | 5,000 | 5,461 |
| State of Illinois, G.O. Bonds, Build America Bonds, Series 2010-3, 5.727% 2020 | 17,000 | 18,710 |
| State of Illinois, G.O. Bonds, Series 2014, 5.00% 2039 | 21,150 | 22,392 |
| State of Illinois, Housing Dev. Auth., Housing Rev. Bonds, Series 2013-A, 2.45% 20435 | 727 | 699 |
| State of Illinois, Regional Transportation Auth. of Cook, DuPage, Kane, Lake, McHenry and Will Counties, G.O. Rev. Ref. Bonds, Series 2003-A, FGIC-National insured, 6.00% 2033 | 12,120 | 16,614 |
| State of Kentucky, Housing Corp., Housing Rev. Bonds, Series 2013-D, 3.50% 2033 | 1,835 | 1,954 |
| State of Maryland, Community Dev. Administration, Dept. of Housing and Community Dev., Residential Rev. Bonds, Series 2014-B, AMT, 3.25% 2044 | 4,245 | 4,441 |
| State of Maryland, Montgomery County Housing Opportunities Commission, Single-family Housing Rev. Bonds, Series 2013-A, 4.00% 2031 | 875 | 945 |
| State of Massachusetts, Housing Fin. Agcy., Single-family Housing Rev. Bonds, Series 167, 4.00% 2043 | 690 | 749 |
| State of Minnesota, Housing Fin. Agcy., Homeownership Fin. Bonds (GNMA and FNMA Pass-Through Program), Series 2012-B, 2.25% 20425 | 6,680 | 6,355 |
| State of Minnesota, Housing Fin. Agcy., Residential Housing Fin. Bonds, Series 2013-A, AMT, 3.00% 2031 | 1,895 | 1,932 |
| State of Minnesota, Housing Fin. Agcy., Residential Housing Fin. Bonds, Series 2014-C, AMT, 4.00% 2045 | 5,000 | 5,431 |
| State of Nebraska, Investment Fin. Auth., Single-family Housing Rev. Bonds, Series 2013-A, 3.00% 2043 | 1,545 | 1,616 |
| State of Nebraska, Investment Fin. Auth., Single-family Housing Rev. Bonds, Series 2013-C, 4.50% 2043 | 1,580 | 1,671 |
| State of Nebraska, Investment Fin. Auth., Single-family Housing Rev. Bonds, Series 2013-E, 3.00% 2043 | 425 | 440 |
| State of Nebraska, Investment Fin. Auth., Single-family Housing Rev. Bonds, Series 2013-E, 3.00% 2043 | 530 | 554 |
State of New Jersey, Transportation Trust Fund Auth., Transportation System Rev. Ref. Bonds,
Series 2013-B, 1.758% 2018 | 10,500 | 10,266 |
State of New York, Dormitory Auth., State Personal Income Tax Rev. Bonds (Education), Series 2014-C,
5.00% 2044 | 10,000 | 11,455 |
The Bond Fund of America — Page 34 of 37
Bonds, notes & other debt instruments
Municipals (continued) | Principal amount
(000) | Value
(000) |
| State of New York, Liberty Dev. Corp., Liberty Rev. Ref. Bonds (4 World Trade Center Project), Series 2011, 5.00% 2044 | $4,660 | $5,181 |
| State of New York, Metropolitan Transportation Auth., Dedicated Tax Fund Bonds (Build America Bonds), Series 2009-C, 7.336% 2039 | 5,500 | 8,426 |
State of New York, Metropolitan Transportation Auth., Transportation Rev. Bonds, Series 2014-A-1,
5.00% 2044 | 15,690 | 17,643 |
| State of New York, Metropolitan Transportation Auth., Transportation Rev. Bonds, Series 2014-B, 5.00% 2044 | 10,000 | 11,296 |
| State of New York, New York City Municipal Water Fin. Auth., Water and Sewer System Second General Resolution Rev. Bonds, Fiscal 2012 Series CC, 5.00% 2045 | 10,000 | 11,244 |
| State of New York, New York City Municipal Water Fin. Auth., Water and Sewer System Second General Resolution Rev. Bonds, Fiscal 2014 Series BB, 5.00% 2046 | 26,100 | 29,525 |
| State of New York, New York City Transitional Fin. Auth., Future Tax Secured Rev. Ref. Bonds, Series 2014-A1, 5.00% 2038 | 14,500 | 16,840 |
| State of North Dakota, Housing Fin. Agcy., Housing Fin. Program Bonds (Home Mortgage Fin. Program), Series 2012-A, 3.75% 2042 | 1,990 | 2,146 |
| State of Puerto Rico, Electric Power Auth., Power Rev. Ref. Bonds, Series UU, Assured Guaranty Municipal insured, 0.678% 20293 | 5,500 | 4,171 |
| State of Puerto Rico, Highways and Transportation Auth., Transportation Rev. Ref. Bonds, Series 2002-D, Assured Guaranty Municipal insured, 5.00% 2032 | 2,300 | 2,300 |
| State of Puerto Rico, Highways and Transportation Auth., Transportation Rev. Ref. Bonds, Series 2007-N, Assured Guaranty insured, 5.25% 2034 | 935 | 961 |
| State of Puerto Rico, Highways and Transportation Auth., Transportation Rev. Ref. Bonds, Series 2007-N, Assured Guaranty insured 5.25% 2036 | 2,100 | 2,149 |
| State of Puerto Rico, Public Improvement Ref. Bonds (G.O. Bonds), Series 2014-A, 8.00% 2035 | 10,000 | 8,720 |
| State of South Carolina, Housing Fin. Auth., Mortgage Rev. Ref. Bonds, AMT, 4.0% 2041 | 3,195 | 3,477 |
| State of South Carolina, Public Service Auth., Rev. Obligations (Santee Cooper), Series 2014-A, 5.00% 2049 | 4,300 | 4,812 |
State of South Dakota, Housing Dev. Auth., Homeownership Mortgage Bonds, Series 2013-E, AMT,
4.00% 2044 | 820 | 866 |
| State of South Dakota, Housing Dev. Auth., Homeownership Mortgage Bonds, Series 2014-F, 4.00% 2034 | 1,300 | 1,361 |
| State of Tennessee, Housing Dev. Agcy., Residential Fin. Program Bonds, Series 2013-2-A, AMT, 4.00% 2043 | 1,010 | 1,070 |
| State of Texas, Grand Parkway Transportation Corp., Grand Parkway System Toll Rev. Bonds, Series 2013-B, 5.00% 2053 | 10,000 | 10,999 |
| State of Texas, Grand Parkway Transportation Corp., Grand Parkway System Toll Rev. Bonds, Series 2013-B, 5.25% 2051 | 10,000 | 11,345 |
| State of Texas, SA Energy Acquisition Public Fac. Corp., Gas Supply Rev. Bonds, Series 2007, 5.50% 2023 | 6,000 | 7,178 |
State of Washington, Energy Northwest, Columbia Generating Station Electric Rev. Bonds,
Series 2012-E, 2.197% 2019 | 8,000 | 7,968 |
| | | 570,226 |
| Total bonds, notes & other debt instruments (cost: $26,248,949,000) | | 26,891,393 |
Convertible stocks 0.04%
Industrials 0.04% | Shares | |
| CEVA Group PLC, Series A-1, 3.253% convertible preferred8 | 9,732 | 9,732 |
| CEVA Group PLC, Series A-2, 2.253% convertible preferred8,12 | 2,576 | 1,996 |
| Total convertible stocks (cost: $13,570,000) | | 11,728 |
Preferred securities 0.02%
U.S. government agency securities 0.02% | | |
| CoBank, ACB, Class E, noncumulative4 | 6,250 | 4,270 |
| Total preferred securities (cost: $5,820,000) | | 4,270 |
The Bond Fund of America — Page 35 of 37
Common stocks 0.06%
Industrials 0.03% | Shares | Value
(000) |
| CEVA Group PLC4,8,13 | 12,179 | $9,438 |
| Atrium Corp.4,8,13 | 985 | 1 |
| | | 9,439 |
| Health care 0.02% | | |
| Rotech Healthcare Inc.8,13 | 342,069 | 5,771 |
| Materials 0.01% | | |
| NewPage Holdings Inc.12 | 30,840 | 2,698 |
| Energy 0.00% | | |
| General Maritime Corp.4,8,13 | 1,716 | 60 |
| Consumer discretionary 0.00% | | |
| Revel AC, Inc.8,12,13 | 222,053 | — |
| Total common stocks (cost: $70,281,000) | | 17,968 |
Rights & warrants 0.00%
Energy 0.00% | | |
| General Maritime Corp., warrants, expire 20174,8,13 | 2,654 | 11 |
| Total rights & warrants (cost: $672,000) | | 11 |
| Short-term securities 12.33% | Principal amount
(000) | |
| Abbott Laboratories 0.10% due 1/20/20154 | $61,800 | 61,798 |
| Army and Air Force Exchange Service 0.13% due 2/11/20154 | 15,000 | 14,998 |
| Chariot Funding, LLC 0.22%–0.27% due 4/23/2015–8/17/20154 | 66,200 | 66,125 |
| Chevron Corp. 0.08%–0.14% due 1/13/2015–4/10/20154 | 145,200 | 145,169 |
| Ciesco LLC 0.17% due 3/3/2015 | 25,000 | 24,992 |
| Coca-Cola Co. 0.14%–0.19% due 1/12/2015–5/12/20154 | 117,300 | 117,266 |
| Fannie Mae 0.07%–0.14% due 2/17/2015–7/1/2015 | 361,800 | 361,638 |
| Federal Farm Credit Banks 0.11%–0.13% due 2/6/2015–8/5/2015 | 183,200 | 183,151 |
| Federal Home Loan Bank 0.07%–0.16% due 2/6/2015–9/9/2015 | 1,032,700 | 1,032,325 |
| Freddie Mac 0.09%–0.17% due 1/8/2015–8/18/2015 | 1,047,762 | 1,047,367 |
| General Electric Capital Corp. 0.19%–0.20% due 4/2/2015–5/5/2015 | 125,000 | 124,946 |
| Google Inc. 0.11% due 3/4/20154 | 11,400 | 11,398 |
| Jupiter Securitization Co., LLC 0.21% due 5/5/20154 | 25,000 | 24,980 |
| Microsoft Corp. 0.09% due 2/9/20154 | 50,000 | 49,995 |
| National Rural Utilities Cooperative Finance Corp. 0.12% due 1/8/2015 | 25,000 | 24,999 |
| Paccar Financial Corp. 0.09% due 1/6/2015 | 26,500 | 26,499 |
| Procter & Gamble Co. 0.12%–0.15% due 1/7/2015–3/3/20154 | 90,300 | 90,288 |
| Wells Fargo Bank, N.A. 0.00% due 6/3/2015 | 40,000 | 39,997 |
| Total short-term securities (cost: $3,447,672,000) | | 3,447,931 |
| Total investment securities 108.60% (cost: $29,786,964,000) | | 30,373,301 |
| Other assets less liabilities (8.60)% | | (2,404,889) |
| Net assets 100.00% | | $27,968,412 |
The Bond Fund of America — Page 36 of 37
| 1 | A portion of this security was pledged as collateral. The total value of pledged collateral was $30,142,000, which represented .10% of the net assets of the fund. |
| 2 | Index-linked bond whose principal amount moves with a government price index. |
| 3 | Coupon rate may change periodically. |
| 4 | Acquired in a transaction exempt from registration under Rule 144A or Section 4(2) of the Securities Act of 1933. May be resold in the U.S. in transactions exempt from registration, normally to qualified institutional buyers. The total value of all such securities was $3,373,234,000, which represented 12.06% of the net assets of the fund. |
| 5 | Principal payments may be made periodically. Therefore, the effective maturity date may be earlier than the stated maturity date. |
| 6 | Loan participations and assignments; may be subject to legal or contractual restrictions on resale. The total value of all such loans was $61,692,000, which represented .22% of the net assets of the fund. |
| 7 | Payment in kind; the issuer has the option of paying additional securities in lieu of cash. |
| 8 | Valued under fair value procedures adopted by authority of the board of trustees. The total value of all such securities, was $85,124,000, which represented .30% of the net assets of the fund. |
| 9 | Scheduled interest and/or principal payment was not received. |
| 10 | A portion or all of the security purchased on a TBA basis. |
| 11 | Step bond; coupon rate will increase at a later date. |
| 12 | Acquired through a private placement transaction exempt from registration under the Securities Act of 1933. May be subject to legal or contractual restrictions on resale. Further details on these holdings appear below. |
| 13 | Security did not produce income during the last 12 months. |
| Private placement securities | Acquisition
dates | Cost
(000) | Value
(000) | Percent
of net
assets |
| NewPage Holdings Inc. | 6/24/2011-9/9/2011 | $5,092 | $2,698 | .01% |
| CEVA Group PLC, Series A-2, 2.234% convertible preferred | 3/10/2010-1/23/2012 | 3,703 | 1,996 | .01 |
| Revel AC, Inc. | 2/14/2011-10/25/2012 | 23,124 | — | — |
| Total private placement securities | | 31,919 | 4,694 | 0.02 |
| Key to abbreviations and symbols | | |
| TBA = To be announced | £ = British pounds | PLN = Polish zloty |
| A$ = Australian dollars | IDR = Indonesian rupiah | RUB = Russian rubles |
| BRL = Brazilian reais | INR = Indian rupees | TRY = Turkish lira |
| COP = Colombian pesos | MXN = Mexican pesos | UYU = Uruguayan pesos |
| € = Euros | PHP = Philippine pesos | ZAR = South African rand |
Investments are not FDIC-insured, nor are they deposits of or guaranteed by a bank or any other entity, so they may lose value.
Investors should carefully consider investment objectives, risks, charges and expenses. This and other important information is contained in the fund prospectus and summary prospectus, which can be obtained from your financial professional and should be read carefully before investing. You may also call American Funds Service Company (AFS) at (800) 421-4225 or visit the American Funds website at americanfunds.com.
| MFGEFPX-008-0215O-S42204 | The Bond Fund of America — Page 37 of 37 |
REPORT OF INDEPENDENT REGISTERED PUBLIC ACCOUNTING FIRM
To the Shareholders and Board of Trustees of
The Bond Fund of America:
We have audited the accompanying statement of assets and liabilities of The Bond Fund of America (the “Fund”), including the summary schedule of investments, as of December 31, 2014, and the related statements of operations for the year then ended, the statements of changes in net assets for each of the two years in the period then ended (collectively, the “financial statements”), the financial highlights for each of the five years in the period then ended (the financial statements and financial highlights are included in Item 1 of this Form N-CSR), and the schedule of investments in securities as of December 31, 2014 (included in Item 6 of this Form N-CSR). These financial statements, financial highlights, and schedule of investments in securities are the responsibility of the Fund’s management. Our responsibility is to express an opinion on these financial statements, financial highlights, and schedule of investments in securities based on our audits.
We conducted our audits in accordance with the standards of the Public Company Accounting Oversight Board (United States). Those standards require that we plan and perform the audit to obtain reasonable assurance about whether the financial statements, financial highlights, and schedule of investments in securities are free of material misstatement. An audit includes examining, on a test basis, evidence supporting the amounts and disclosures in the financial statements and schedule of investments in securities. Our procedures included confirmation of securities owned as of December 31, 2014, by correspondence with the custodian and brokers; where replies were not received from brokers, we performed other auditing procedures. An audit also includes assessing the accounting principles used and significant estimates made by management, as well as evaluating the overall financial statement presentation. We believe that our audits provide a reasonable basis for our opinion.
In our opinion, the financial statements, financial highlights, and schedule of investments in securities referred to above present fairly, in all material respects, the financial position of The Bond Fund of America as of December 31, 2014, and the results of its operations for the year then ended, the changes in its net assets for each of the two years in the period then ended, and the financial highlights for each of the five years in the period then ended, in conformity with accounting principles generally accepted in the United States of America.
DELOITTE & TOUCHE LLP
Costa Mesa, California
February 5, 2015
ITEM 7 – Disclosure of Proxy Voting Policies and Procedures for Closed-End Management Investment Companies
Not applicable to this Registrant, insofar as the Registrant is not a closed-end management investment company.
ITEM 8 – Portfolio Managers of Closed-End Management Investment Companies
Not applicable to this Registrant, insofar as the Registrant is not a closed-end management investment company.
ITEM 9 – Purchases of Equity Securities by Closed-End Management Investment Company and Affiliated Purchasers
Not applicable to this Registrant, insofar as the Registrant is not a closed-end management investment company.
ITEM 10 – Submission of Matters to a Vote of Security Holders
There have been no material changes to the procedures by which shareholders may recommend nominees to the Registrant’s board of trustees since the Registrant last submitted a proxy statement to its shareholders. The procedures are as follows. The Registrant has a nominating and governance committee comprised solely of persons who are not considered ‘‘interested persons’’ of the Registrant within the meaning of the Investment Company Act of 1940, as amended. The committee periodically reviews such issues as the board’s composition, responsibilities, committees, compensation and other relevant issues, and recommends any appropriate changes to the full board of trustees. While the committee normally is able to identify from its own resources an ample number of qualified candidates, it will consider shareholder suggestions of persons to be considered as nominees to fill future vacancies on the board. Such suggestions must be sent in writing to the nominating and governance committee of the Registrant, c/o the Registrant’s Secretary, and must be accompanied by complete biographical and occupational data on the prospective nominee, along with a written consent of the prospective nominee for consideration of his or her name by the nominating and governance committee.
ITEM 11 – Controls and Procedures
| (a) | The Registrant’s Principal Executive Officer and Principal Financial Officer have concluded, based on their evaluation of the Registrant’s disclosure controls and procedures (as such term is defined in Rule 30a-3 under the Investment Company Act of 1940), that such controls and procedures are adequate and reasonably designed to achieve the purposes described in paragraph (c) of such rule. |
| | |
| (b) | There were no changes in our internal control over financial reporting during the quarter ended December 31, 2014, which were identified in connection with management's evaluation required by paragraph (d) of Rule 13a-15 and 15d-15 under the Exchange Act, that have materially affected, or are reasonably likely to materially affect, our internal control over financial reporting, other than as provided below. Effective November 10, 2014, the The Bond Fund of America’s investment adviser implemented a new accounting system. In connection with introducing this new system, additional automated and manual controls were implemented and some existing controls were modified. None of these changes were in response to any identified deficiency or weakness in the The Bond Fund of America’s internal control over financial reporting. |
ITEM 12 – Exhibits
| (a)(1) | The Code of Ethics that is the subject of the disclosure required by Item 2 is attached as an exhibit hereto. |
| | |
| (a)(2) | The certifications required by Rule 30a-2 of the Investment Company Act of 1940 and Sections 302 and 906 of the Sarbanes-Oxley Act of 2002 are attached as exhibits hereto. |
SIGNATURES
Pursuant to the requirements of the Securities Exchange Act of 1934 and the Investment Company Act of 1940, the Registrant has duly caused this report to be signed on its behalf by the undersigned, thereunto duly authorized.
| | THE BOND FUND OF AMERICA |
| | |
| | By /s/ John H. Smet |
| | John H. Smet, Vice Chairman, President and Principal Executive Officer |
| | |
| | Date: February 27, 2015 |
Pursuant to the requirements of the Securities Exchange Act of 1934 and the Investment Company Act of 1940, this report has been signed below by the following persons on behalf of the Registrant and in the capacities and on the dates indicated.
| By /s/ John H. Smet |
John H. Smet, Vice Chairman, President and Principal Executive Officer |
| |
| Date: February 27, 2015 |
| By /s/ Brian C. Janssen |
Brian C. Janssen, Treasurer and Principal Financial Officer |
| |
| Date: February 27, 2015 |