Washington, D.C. 20549
The Bond Fund of America seeks as high a level of current income as is consistent with preservation of capital through a diversified portfolio of bonds and other fixed-income obligations.
This fund is one of more than 40 offered by American Funds, which is one of the nation’s largest mutual fund families. For more than 80 years, Capital Research and Management Company,SM the American Funds adviser, has invested with a long-term focus based on thorough research and attention to risk.
Here are the average annual total returns on a $1,000 investment with all distributions reinvested for periods ended December 31, 2012:
The total annual fund operating expense ratio is 0.60% for Class A shares as of the prospectus dated March 1, 2013 (unaudited).
Investment results assume all distributions are reinvested and reflect applicable fees and expenses. When applicable, investment results reflect fee waivers, without which results would have been lower. Visit americanfunds.com for more information.
Results for other share classes can be found on page 34.
The return of principal for bond funds and for funds with significant underlying bond holdings is not guaranteed. Fund shares are subject to the same interest rate, inflation and credit risks associated with the underlying bond holdings. Bond ratings, which typically range from Aaa/AAA (highest) to D (lowest), are assigned by credit rating agencies such as Moody’s, Standard & Poor’s and/or Fitch as an indication of an issuer’s creditworthiness. High-yield bonds are subject to greater fluctuations in value and risk of loss of income and principal than investment-grade bonds. Investing in bonds issued outside the U.S. may be subject to additional risks. They include currency fluctuations, political and social instability, differing securities regulations and accounting standards, higher transaction costs, possible changes in taxation, illiquidity and price volatility. These risks may be heightened in connection with investments in developing countries. Refer to the fund prospectus and the Risk Factors section of this report for more information on these and other risks associated with investing in the fund.
With the economic picture improving for much of the world, including the United States, the bond market continued to produce positive returns for investors during 2012.
For the fiscal year ended December 31, 2012, The Bond Fund of America had a total return of 5.9%, surpassing the 4.2% return of its primary benchmark, the unmanaged Barclays U.S. Aggregate Index. The fund’s peer group measure, the Lipper Intermediate Investment Grade Debt Funds Average, returned 6.9% for the period.
Alongside preservation of capital, income remains a primary goal of the fund. For 2012, the fund paid monthly dividends totaling more than 33 cents a share. That amounts to an income return of 2.68% for those reinvesting dividends and a 2.65% income return for those taking dividends in cash.
The fund’s year was marked by slow but steady improvement in the domestic and global economy — though the improvement was not consistent. The rough patches, including Europe’s ongoing debt and fiscal concerns, as well as continued economic worries at home, kept bond prices steady through much of the year.
The United States saw an uptick in gross domestic product through the year, including a 3.1% increase in the third quarter of 2012. Likewise, unemployment fell below 8% during the year. Nonetheless, concerns remained regarding the pace and strength of the economic recovery.
The Federal Reserve kept the nation’s benchmark rate between zero and 0.25%, and instituted a series of monthly bond purchases that will be regularly adjusted depending on the health of the economy. The Fed also promised to keep rates unchanged until such time as unemployment falls to 6.5%.
President Obama and Congress reached an agreement in December to keep income taxes from rising for most Americans, but much of the fiscal cliff debate remains unresolved. Payroll taxes did increase at the beginning of 2013, but the question of deep spending cuts was merely postponed for a few months. These issues, as well as congressional approval of an increase in the nation’s debt ceiling, face political leaders in the coming months, and may have a negative effect on the economy.
Overseas, the member nations of the euro zone continued to wrestle with high levels of debt and continued austerity measures in several countries. Despite some headway on a number of fronts, including a newfound willingness on the part of the European Central Bank to lower interest rates, many debt-related questions have yet to be addressed as of this writing.
Despite these issues, bond investors seemed willing to take on additional risk during the fund’s fiscal year. Yields on most U.S. Treasuries were little changed year-to-year, whereas corporate offerings saw strong returns, particularly those of longer duration and lower credit quality.
In the current environment, the fund’s portfolio counselors opted for a more conservative approach. As the economy continues to improve, the bond market bears the risk of a selloff, which would decrease the value of the fund’s holdings. We believe the fund’s current position can allow it to better take advantage of future moves in the bond market.
The fund’s holdings in corporate bonds and notes remained steady over the course of the year — from 31% of the portfolio a year ago to 30% as of December 31. Overall, corporates were additive to returns, especially when compared to the Barclays index.
The fund increased its holdings in Treasuries. As of December 31, the fund held 22% of the portfolio in Treasuries, up from 20% a year ago. Within all asset classes, the fund remains positioned with a bias toward shorter durations and higher credit quality throughout the portfolio, with a small number of high-yield bonds the exception.
Mortgage-backed securities continued to be a staple of the portfolio, as they tend to yield more than Treasuries while still
boasting government backing. The fund’s mortgage holdings represented 34% of the portfolio, compared to 35% the year prior.
High-yield corporate bonds were particularly helpful to the fund’s total return. The fund’s high-yield position was 5.2% of the portfolio at year’s end, down from 6.5% a year ago.
While it can be tempting to seek out additional yield in the current environment, especially with safer investments like Treasuries yielding relatively little, the fund’s portfolio counselors believe in a long-term view. This view currently takes into account the probability of continued economic improvement over the coming year. Historically, this has often meant declines in bond prices as investors’ risk appetites prompt a move out of bonds.
If there are price declines in the bond market, the fund can offset them to a degree. As bonds in the portfolio mature, we are able to buy new bonds at higher yields, thus increasing income as we seek to maintain a positive total return. We believe the fund is well-positioned to do this in the months and years ahead.
There are certainly challenges to the global economy that could keep bond prices higher. The ongoing negotiations over the debt ceiling and spending could prompt investors to maintain or even increase their bond holdings, especially if the talks remain contentious. Likewise, the situation in Europe remains difficult, though we are cautiously optimistic that incremental solutions may help improve the debt and economic issues there.
Our outlook for the bond market and the fund’s positioning is informed by our research. For a closer look at how the fund’s investment professionals seek to understand the challenges and opportunities in the bond market, please see our special feature starting on page 6.
We thank you for your continued interest in The Bond Fund of America and look forward to reporting to you again in six months.
John H. Smet
President
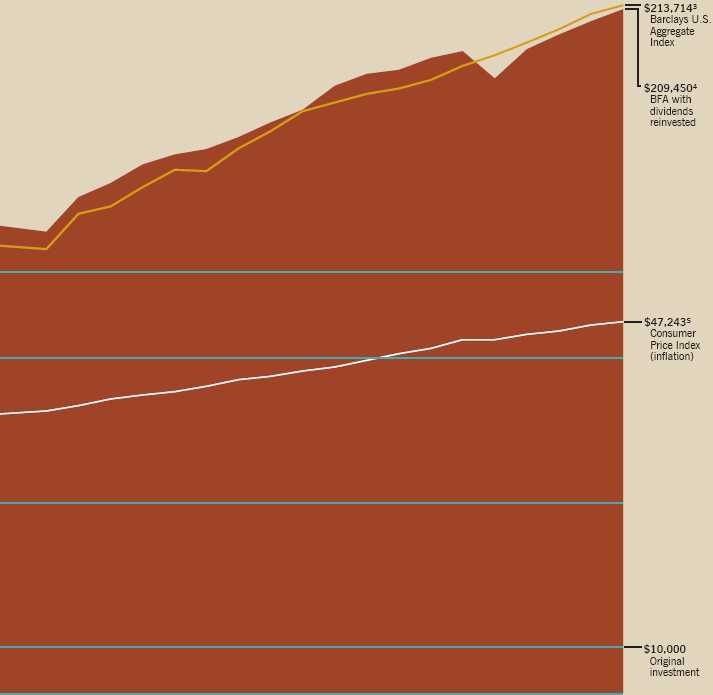
There have always been reasons not to invest. You will find, however, that despite occasional stumbles, financial markets have tended to reward investors over the long term.
Dividends, particularly when reinvested, have accounted for virtually all of the fund’s overall results. The table beneath the chart details the fund’s annual dividends and the cumulative value of the original investment.
Average annual total returns based on a $1,000 investment (for periods ended December 31, 2012)* 1 year 5 years 10 years Class A shares 1.92% 3.27% 4.53% *Assumes reinvestment of all distributions and payment of the maximum 3.75% sales charge. The total annual fund operating expense ratio is 0.60% for Class A shares as of the prospectus dated March 1,2013 (unaudited). Investment results assume all distributions are reinvested and reflect applicable fees and expenses. When applicable, investment results reflect fee waivers, without which results would have been lower. Visit americanfunds.com for more information.
Since January 1, 1976, the Barclays U.S. Aggregate Index has been used. These indexes are unmanaged and, therefore, have no expenses.
The results shown are before taxes on fund distributions and sale of fund shares.
In order to succeed on behalf of investors, The Bond Fund of America’s investment professionals seek to generate returns while being aware of the risks inherent in today’s bond markets.
In order to meet those needs in today’s challenging bond market, the investment professionals working on behalf of The Bond Fund of America seek to understand the unique risks that bond investing entails, and balance those risks against the desire for return.
While the bond market is widely regarded as safer than the historically more volatile equity market, the risk of losing money is still a part of bond investing. Thus, risk analysis within The Bond Fund of America is a continual process, one that informs every decision the fund’s investment professionals make.
“We know that investors come to us in order to preserve capital, while generating income at the same time,” says fund president John Smet. “In order to succeed, we have to really understand the risks we take, both as individual managers and within the fund as a whole.”
The Bond Fund of America always has been known for the comprehensive research that informs the fund’s investment decisions. In addition to researching the individual characteristics of each bond offering, the fund employs a variety of tools to look at the bigger picture as well, from economic analysis to computerized market modeling.
The totality of this research goes into both individual potential investments and continued monitoring of all the fund’s assets. Decisions, ultimately, come down to experience and judgment.
“You have to start with the concept of being very deliberate about the positions you’re taking as an investor,” says portfolio counselor David Hoag. “Everything you do has to take into account the risks the portfolio is currently taking, and whether that’s consistent with the investment view you have. It sounds really basic, but there are a lot of moving parts in a bond portfolio.”
Indeed, there are multiple risk factors to account for in any given potential investment, as you can see in the sidebar on page 9. Every one of those factors comes into play when an investment professional weighs the holdings in his or her portfolio, as well as when the fund’s portfolio counselors weigh the current market environment against the entirety of the fund’s assets.
The interplay of these various risk factors on an individual level becomes exponentially more complex when looking at the fund as a whole. In order to best study the fund’s current holdings, the Risk and Quantitative Solutions (RQS) group provides the fund’s portfolio counselors with detailed analysis based on computer modeling.
This is done by taking a “virtual” portfolio — representing each of the fund’s nearly 2,000 individual holdings — and subjecting it to a variety of simulations designed to mirror the effects of potential economic scenarios and market movements over time. The level of detail such analysis offers allows the fund’s investment professionals to ferret out potential weaknesses and identify possible opportunities before they might actually arise.
“The big challenge for us is future risk,” says John. “It’s not just saying, for example, what happens if Europe declines? It’s about the second and third derivatives of those future events, and modeling those allows us to really understand the bigger picture.”
Twice a year, the RQS group formally presents a wide variety of simulations to the fund’s investment professionals, providing possible answers to a multitude of what-ifs. What if inflation rises? What if the economy falters? What would a European recovery look like? These and many other possibilities are projected for the portfolio counselors and analysts to consider when making their investment decisions.
“We can explore a lot of different questions by running these projections, and not just economic ones, but questions about the decisions we could make,” says RQS analyst Pei Yin. “What if we increase or decrease our duration? What if we add to municipal or high-yield bonds? What about currency impacts? These are all experiments we can do within the virtual portfolio and analyze the results.”
In addition, they provide frequent updates to each individual investment professional, and can readily answer a variety of risk-related questions.
“They give us an objective look at our portfolios we might not otherwise have,” says portfolio counselor Thomas Hogh. “You never want to take on excessive risk, and the RQS group can help us find those risks that aren’t immediately evident.”
This kind of computer modeling can also help investment professionals understand how even small-scale decisions — the purchase or sale of a single bond, perhaps — can affect entire portfolios and perhaps the fund overall.
Any kind of investing requires a great deal of research to understand the risks involved, but the number of variables in the fixed-income marketplace is striking. Here’s a handful of the many types of risk BFA’s professionals consider with each potential investment.
“Once you isolate the risks within an investment, the next step is to understand how all those risks interact with one another — and that can get complex,” David says. “That to me is what the RQS group does, counseling me on the risks I’m taking, making me aware of the different ways any given decision could affect what I’m doing overall.”
Of course, the decision is still up to the individual portfolio counselor and analyst, and each individual weighs risk in his or her portfolio in different ways. Portfolio counselor Wesley Phoa, for example, asks himself three basic questions about any given investment and how that will relate to the overall success of his portfolio:
Success comes not only from minimizing potential risks, but offsetting them whenever possible. Analyst Ritchie Tuazon, who researches the U.S. Treasury market, prefers to find bond market disparities that may work in his favor — investments that have a potential to make more if his views are right and lose less if he’s wrong.
Currently, Ritchie helps the fund analyze TIPS — Treasury Inflation-Protected Securities. The value of these securities is indexed to inflation, so if inflation rises, so does the value of the bond. By analyzing the potential for inflation in the U.S. economy, Ritchie can determine whether or not a certain TIPS offering could prove beneficial to the fund over the long term.
For example, Ritchie may consider adding a particular TIPS note to his holdings. If
his outlook on the Treasury market is correct, he could stand to make a 1% profit on the investment if inflation rises as he expects. If he’s wrong, the worst case scenario might be that he only loses 0.3%. “That’s the kind of investment I look for,” he says. “When the market presents you with an opportunity like that, I think that’s a worthwhile level of risk to take.”
That 1% might not seem like a lot, but in the bond market, outsized returns are uncommon. Successful incremental investments, even small ones, can provide meaningful returns over time, and can make more sense than taking on large amounts of risk with the promise of larger returns.
“We’re very much aware of the reasons why investors choose this fund — for preservation of capital as well as income,” Thomas says. “A bad year in the bond market would be nothing compared to a bad year in equities, and even then we’re working to try to make those losses as minimal as possible.”
Diversification helps as well. Different segments of the bond market react to events differently. For example, a strong economy may mean Treasuries can have weaker prices, while corporate bonds can rise in value. A diverse portfolio can help reduce risk and volatility, while also providing steadier returns for the overall fund.
“When you get risk and return from a variety of places, it makes it less likely for any one thing to have a major negative impact,” John says. “Knowing where to find value, knowing where you can offset risks and diversify returns — those are the things that are going to make a bond portfolio like BFA truly effective for our investors.” ¾
With thousands of variables and at least as many scenarios that could affect them, doing any kind of computer modeling of the bond market requires a great deal of expertise. A Ph.D. in mathematics, for example, might be a good place to start.
Pei Yin received her doctorate, with a concentration in mathematical finance, from the University of Missouri-Columbia. She also holds a dual master’s degree in both economics and mathematics from the same institution, and has taught advanced mathematics both in the U.S. and her native China.
Her focus within the RQS group includes stress testing the fund, and individual portfolios within it, through a battery of different market and economic scenarios. She also helps develop recommendations on how to position investments along the yield curve and how they might be hedged.
“To me, there needs to be science behind investing,” Pei says. “There are still risks, because we’re in the business of probabilities, and you can’t know the future. But you need to take an informed risk and that’s what I try to do — to inform my colleagues.”
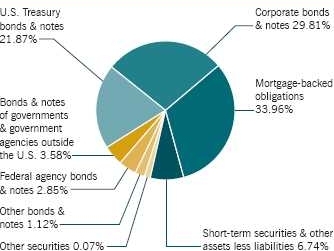
The following summary investment portfolio is designed to streamline the report and help investors better focus on the fund’s principal holdings. See the inside back cover for details on how to obtain a complete schedule of portfolio holdings.
Portfolio by type of security Percent of net assets U.S. Treasury Corporate bonds bonds & notes & notes 29.81% 21.87% Mortgage-backed obligations Bonds & notes 33.96% of governments & government agencies outside the U.S. 3.58% Federal agency bonds & notes 2.85% Other bonds & notes 1.12% Short-term securities & other Other securities 0.07% assets less liabilities 6.74%
“Other securities” includes all issues that are not disclosed separately in the summary investment portfolio. One of these securities (with a value of $4,983,000, at a cost of $9,452,000, and which represented .01% of the net assets of the fund) was acquired from 9/17/2009 to 9/9/2011 through private placement transactions exempt from registration under the Securities Act of 1933 which may subject it to legal or contractual restrictions on resale.
The fund has entered into forward currency contracts to sell currencies as shown in the following table. The open forward currency contracts shown are generally indicative of the level of activity over the prior 12-month period.
The fund has entered into interest rate swaps as shown in the following table. The interest rate swaps shown are generally indicative of the volume of activity over the prior 12-month period.
The following footnotes apply to either the individual securities noted or one or more of the securities aggregated and listed as a single line item.
The Bond Fund of America (the “fund”) is registered under the Investment Company Act of 1940 as an open-end, diversified management investment company. The fund seeks as high a level of current income as is consistent with preservation of capital through a diversified portfolio of bonds and other fixed-income obligations.
The fund has 16 share classes consisting of five retail share classes (Classes A, B and C, as well as two F share classes, F-1 and F-2), five 529 college savings plan share classes (Classes 529-A, 529-B, 529-C, 529-E and 529-F-1) and six retirement plan share classes (Classes R-1, R-2, R-3, R-4, R-5 and R-6). The 529 college savings plan share classes can be used to save for college education. The retirement plan share classes are generally offered only through eligible employer-sponsored retirement plans. The fund’s share classes are further described below:
Holders of all share classes have equal pro rata rights to assets, dividends and liquidation proceeds. Each share class has identical voting rights, except for the exclusive right to vote on matters affecting only its class. Share classes have different fees and expenses (“class-specific fees and expenses”), primarily due to different arrangements for distribution, administrative and shareholder services. Differences in class-specific fees and expenses will result in differences in net investment income and, therefore, the payment of different per-share dividends by each class.
The financial statements have been prepared to comply with accounting principles generally accepted in the United States of America. These principles require management to make estimates and assumptions that affect reported amounts and disclosures. Actual results could differ from those estimates. The fund follows the significant accounting policies described below, as well as the valuation policies described in the next section on valuation.
accompanying financial statements, the effects of changes in exchange rates on investment securities are included with the net realized gain or loss and net unrealized appreciation or depreciation on investments. The realized gain or loss and unrealized appreciation or depreciation resulting from all other transactions denominated in currencies other than U.S. dollars are disclosed separately.
Capital Research and Management Company (“CRMC”), the fund’s investment adviser, values the fund’s investments at fair value as defined by accounting principles generally accepted in the United States of America. The net asset value of each share class of the fund is generally determined as of approximately 4:00 p.m. New York time each day the New York Stock Exchange is open.
Equity securities are generally valued at the official closing price of, or the last reported sale price on, the exchange or market on which such securities are traded, as of the close of business on the day the securities are being valued or, lacking any sales, at the last available bid price. Prices for each security are taken from the principal exchange or market on which the security trades.
Fixed-income securities, including short-term securities purchased with more than 60 days left to maturity, are generally valued at prices obtained from one or more pricing vendors. Vendors value such securities based on one or more of the inputs described in the following table. The table provides examples of inputs that are commonly relevant for valuing particular classes of fixed-income securities in which the fund is authorized to invest. However, these classifications are not exclusive, and any of the inputs may be used to value any other class of fixed-income security.
When the fund’s investment adviser deems it appropriate to do so (such as when vendor prices are unavailable or not deemed to be representative), fixed-income securities will be valued in good faith at the mean quoted bid and ask prices that are reasonably and timely available (or bid prices, if ask prices are not available) or at prices for securities of comparable maturity, quality and type.
Securities with both fixed-income and equity characteristics, or equity securities traded principally among fixed-income dealers, are generally valued in the manner described above for either equity or fixed-income securities, depending on which method is deemed most appropriate by the fund’s investment adviser. Short-term securities purchased within 60 days to maturity are valued at amortized cost, which approximates fair value. The value of short-term securities originally purchased with maturities greater than 60 days is determined based on an amortized value to par when they reach 60 days. Forward currency contracts are valued at the mean of representative quoted bid and ask prices, generally based on prices supplied by one or more pricing vendors. Interest rate swaps are generally valued by pricing vendors based on market inputs that include the index and term of index, reset frequency, payer/receiver, currency, and pay frequency.
Securities and other assets for which representative market quotations are not readily available or are considered unreliable by the fund’s investment adviser are fair valued as determined in good faith under fair value guidelines adopted by authority of the fund’s board of trustees as further described below. The investment adviser follows fair valuation guidelines, consistent with U.S. Securities and Exchange Commission rules and guidance, to consider relevant principles and factors when making fair value determinations. The investment adviser considers relevant indications of value that are reasonably and timely available to it in determining the fair value to be assigned to a particular security, such as the type and cost of the security; contractual or legal restrictions on resale of the security; relevant financial or business
developments of the issuer; actively traded similar or related securities; conversion or exchange rights on the security; related corporate actions; significant events occurring after the close of trading in the security; and changes in overall market conditions. Fair valuations and valuations of investments that are not actively trading involve judgment and may differ materially from valuations that would have been used had greater market activity occurred.
The fund’s investment adviser has also established a Fixed-Income Pricing Review Group to administer and oversee the fixed-income valuation process, including the use of fixed-income pricing vendors. This group regularly reviews pricing vendor information and market data. Pricing decisions, processes and controls over security valuation are also subject to additional internal reviews, including an annual control self-evaluation program facilitated by the investment adviser’s compliance group.
Investing in the fund may involve certain risks including, but not limited to, those described below.
Bonds and other debt securities are subject to credit risk, which is the possibility that the credit strength of an issuer will weaken and/or an issuer of a debt security will fail to make timely payments of principal or interest and the security will go into default. Lower quality debt securities generally have higher rates of interest and may be subject to greater price fluctuations than higher quality debt securities. Credit risk is gauged, in part, by the credit ratings of the securities in which the fund invests. However, ratings are only the opinions of the rating agencies issuing them and are not guarantees as to credit quality or an evaluation of market risk.
On a daily basis, the fund’s investment adviser values forward currency contracts based on the applicable exchange rates and records unrealized appreciation or depreciation for open forward currency contracts in the fund’s statement of assets and liabilities. Realized gains or losses are recorded at the time the forward currency contract is closed or offset by another contract with the same broker for the same settlement date and currency.
On a daily basis, the fund’s investment adviser records interest accruals related to the exchange of future payments as a receivable and payable in the fund’s statement of assets and liabilities. Unrealized appreciation or depreciation as a result of market fluctuation is recorded as an asset or liability. Periodic payments received or made by the fund are recorded in the fund’s statement of operations as realized gains or losses, respectively. Gains or losses are realized upon early termination or expiration of the interest rate swap agreement.
The following tables present the financial statement impacts resulting from the fund’s use of forward currency contracts and interest rate swaps as of December 31, 2012 (dollars in thousands):
As of and during the period ended December 31, 2012, the fund did not have a liability for any unrecognized tax benefits. The fund recognizes interest and penalties, if any, related to unrecognized tax benefits as income tax expense in the statement of operations. During the period, the fund did not incur any interest or penalties.
The fund is not subject to examination by U.S. federal tax authorities for tax years before 2009, by state tax authorities for tax years before 2008 and by tax authorities outside the U.S. for tax years before 2007.
During the year ended December 31, 2012, the fund reclassified $17,000 from undistributed net investment income to capital paid in on shares of beneficial interest and $84,581,000 from accumulated net realized loss to undistributed net investment income to align financial reporting with tax reporting.
Under the Regulated Investment Company Modernization Act of 2010 (the “Act”), net capital losses recognized after December 31, 2010, may be carried forward indefinitely, and their character is retained as short-term and/or long-term losses. Previously, net capital losses were carried forward for eight years and treated as short-term losses. As a transition rule, the Act requires that post-enactment net capital losses be used before pre-enactment net capital losses.
As of December 31, 2012, the tax basis components of distributable earnings, unrealized appreciation (depreciation) and cost of investment securities were as follows (dollars in thousands):
Tax-basis distributions paid to shareholders from ordinary income were as follows (dollars in thousands):
CRMC, the fund’s investment adviser, is the parent company of American Funds Distributors,® Inc. (“AFD”), the principal underwriter of the fund’s shares, and American Funds Service Company® (“AFS”), the fund’s transfer agent.
For Class A and 529-A shares, distribution-related expenses include the reimbursement of dealer and wholesaler commissions paid by AFD for certain shares sold without a sales charge. These share classes reimburse AFD for amounts billed within the prior 15 months but only to the extent that the overall annual expense limit of 0.25% is not exceeded. As of December 31, 2012, there were no unreim-bursed expenses subject to reimbursement for Class A or 529-A shares.
Class-specific expenses under the agreements described above for the year ended December 31, 2012, were as follows (dollars in thousands):
Capital share transactions in the fund were as follows (dollars and shares in thousands):
The fund made purchases and sales of investment securities, excluding short-term securities and U.S. government obligations, if any, of $71,237,368,000 and $73,044,945,000, respectively, during the year ended December 31, 2012.
See page 30 for footnotes.
We have audited the accompanying statement of assets and liabilities of The Bond Fund of America (the “Fund”), including the summary investment portfolio, as of December 31, 2012, and the related statement of operations for the year then ended, the statements of changes in net assets for each of the two years in the period then ended, and the financial highlights for each of the periods presented. These finan-cial statements and financial highlights are the responsibility of the Fund’s management. Our responsibility is to express an opinion on these financial statements and financial highlights based on our audits.
We conducted our audits in accordance with the standards of the Public Company Accounting Oversight Board (United States). Those standards require that we plan and perform the audit to obtain reasonable assurance about whether the financial statements and financial highlights are free of material misstatement. The Fund is not required to have, nor were we engaged to perform, an audit of its internal control over financial reporting. Our audits included consideration of internal control over financial reporting as a basis for designing audit procedures that are appropriate in the circumstances, but not for the purpose of expressing an opinion on the effectiveness of the Fund’s internal control over financial reporting. Accordingly, we express no such opinion. An audit also includes examining, on a test basis, evidence supporting the amounts and disclosures in the financial statements, assessing the accounting principles used and significant estimates made by management, as well as evaluating the overall financial statement presentation. Our procedures included confirmation of securities owned as of December 31, 2012, by correspondence with the custodian and brokers; where replies were not received from brokers, we performed other auditing procedures. We believe that our audits provide a reasonable basis for our opinion.
In our opinion, such financial statements and financial highlights referred to above present fairly, in all material respects, the financial position of The Bond Fund of America as of December 31, 2012, the results of its operations for the year then ended, the changes in its net assets for each of the two years in the period then ended, and the financial highlights for each of the periods presented, in conformity with accounting principles generally accepted in the United States of America.
As a shareholder of the fund, you incur two types of costs: (1) transaction costs, such as initial sales charges on purchase payments and contingent deferred sales charges on redemptions (loads), and (2) ongoing costs, including management fees, distribution and service (12b-1) fees, and other expenses. This example is intended to help you understand your ongoing costs (in dollars) of investing in the fund so you can compare these costs with the ongoing costs of investing in other mutual funds. The example is based on an investment of $1,000 invested at the beginning of the period and held for the entire six-month period (July 1, 2012, through December 31, 2012).
The first line of each share class in the table on the next page provides information about actual account values and actual expenses. You may use the information in this line, together with the amount you invested, to estimate the expenses that you paid over the period. Simply divide your account value by $1,000 (for example, an $8,600 account value divided by $1,000 = 8.6), then multiply the result by the number in the first line under the heading entitled “Expenses paid during period” to estimate the expenses you paid on your account during this period.
The second line of each share class in the table on the next page provides information about hypothetical account values and hypothetical expenses based on the actual expense ratio for the share class and an assumed rate of return of 5.00% per year before expenses, which is not the actual return of the share class. The hypothetical account values and expenses may not be used to estimate the actual ending account balance or expenses you paid for the period. You may use this information to compare the ongoing costs of investing in the fund and other funds. To do so, compare this 5.00% hypothetical example with the 5.00% hypothetical examples that appear in the shareholder reports of the other funds.
There are some account fees that are charged to certain types of accounts, such as individual retirement accounts and 529 college savings plan accounts (generally, a $10 fee is charged to set up the account and an additional $10 fee is charged to the account annually), that would increase the amount of expenses paid on your account. In addition, retirement plan participants may be subject to certain fees charged by the plan sponsor, and Class F-1, F-2 and 529-F-1 shareholders may be subject to fees charged by financial intermediaries, typically ranging from 0.75% to 1.50% of assets annually depending on services offered. You can estimate the impact of these fees by adding the amount of the fees to the total estimated expenses you paid on your account during the period as calculated above. In addition, your ending account value would be lower by the amount of these fees.
Note that the expenses shown in the table are meant to highlight your ongoing costs only and do not reflect any transactional costs, such as sales charges (loads). Therefore, the second line of each share class in the table is useful in comparing ongoing costs only and will not help you determine the relative total costs of owning different funds. In addition, if these transactional costs were included, your costs would have been higher.
We are required to advise you of the federal tax status of certain distributions received by shareholders during the fiscal year. The fund hereby designates the following amounts for the fund’s fiscal year ended December 31, 2012:
Investment results assume all distributions are reinvested and reflect applicable fees and expenses. When applicable, investment results reflect fee waivers, without which results would have been lower. Visit americanfunds.com for more information.
For information regarding the differences among the various share classes, refer to the fund prospectus.
See page 36 for footnotes.
“American Funds Proxy Voting Procedures and Principles” — which describes how we vote proxies relating to portfolio securities — is available on the American Funds website or upon request by calling AFS. The fund files its proxy voting record with the U.S. Securities and Exchange Commission (SEC) for the 12 months ended June 30 by August 31. The proxy voting record is available free of charge on the SEC website at sec.gov and on the American Funds website.
A complete December 31, 2012, portfolio of The Bond Fund of America’s investments is available free of charge by calling AFS or visiting the SEC website (where it is part of Form N-CSR).
The Bond Fund of America files a complete list of its portfolio holdings with the SEC for the first and third quarters of each fiscal year on Form N-Q. This filing is available free of charge on the SEC website. You may also review or, for a fee, copy this filing at the SEC’s Public Reference Room in Washington, D.C. Additional information regarding the operation of the Public Reference Room may be obtained by calling the SEC’s Office of Investor Education and Advocacy at 800/SEC-0330. Additionally, the list of portfolio holdings is available by calling AFS.
This report is for the information of shareholders of The Bond Fund of America, but it also may be used as sales literature when preceded or accompanied by the current prospectus or summary prospectus, which gives details about charges, expenses, investment objectives and operating policies of the fund. If used as sales material after March 31, 2013, this report must be accompanied by an American Funds statistical update for the most recently completed calendar quarter.
Since 1931, American Funds has helped investors pursue long-term investment success. Our consistent approach — in combination with a proven system — has resulted in a superior long-term track record.
The Registrant has adopted a Code of Ethics that applies to its Principal Executive Officer and Principal Financial Officer. The Registrant undertakes to provide to any person without charge, upon request, a copy of the Code of Ethics. Such request can be made to American Funds Service Company at 800/421-0180 or to the Secretary of the Registrant, 333 South Hope Street, Los Angeles, California 90071.
The Registrant’s board has determined that Laurel B. Mitchell, a member of the Registrant’s audit committee, is an “audit committee financial expert” and "independent," as such terms are defined in this Item. This designation will not increase the designee’s duties, obligations or liability as compared to his or her duties, obligations and liability as a member of the audit committee and of the board, nor will it reduce the responsibility of the other audit committee members. There may be other individuals who, through education or experience, would qualify as "audit committee financial experts" if the board had designated them as such. Most importantly, the board believes each member of the audit committee contributes significantly to the effective oversight of the Registrant’s financial statements and condition.
All audit and permissible non-audit services that the Registrant’s audit committee considers compatible with maintaining the independent registered public accounting firm’s independence are required to be pre-approved by the committee. The pre-approval requirement will extend to all non-audit services provided to the Registrant, the investment adviser, and any entity controlling, controlled by, or under common control with the investment adviser that provides ongoing services to the Registrant, if the engagement relates directly to the operations and financial reporting of the Registrant. The committee will not delegate its responsibility to pre-approve these services to the investment adviser. The committee may delegate to one or more committee members the authority to review and pre-approve audit and permissible non-audit services. Actions taken under any such delegation will be reported to the full committee at its next meeting. The pre-approval requirement is waived with respect to non-audit services if certain conditions are met. The pre-approval requirement was not waived for any of the non-audit services listed above provided to the Registrant, adviser and affiliates.
Aggregate non-audit fees paid to the Registrant’s auditors, including fees for all services billed to the Registrant, adviser and affiliates that provide ongoing services to the Registrant, were $1,602,000 for fiscal year 2011 and $1,580,000 for fiscal year 2012. The non-audit services represented by these amounts were brought to the attention of the committee and considered to be compatible with maintaining the auditors’ independence.
Not applicable to this Registrant, insofar as the Registrant is not a listed issuer as defined in Rule 10A-3 under the Securities Exchange Act of 1934.
| | Principal amount | Value |
| Bonds & notes — 93.19% | (000) | (000) |
| | | |
| MORTGAGE-BACKED OBLIGATIONS — 33.96% | |
| FEDERAL AGENCY MORTGAGE-BACKED OBLIGATIONS1 — 30.76% | |
| Fannie Mae 3.308% 20172 | $ 4,050 | $ 4,441 |
| Fannie Mae, Series 2002-15, Class PG, 6.00% 2017 | 1,844 | 1,964 |
| Fannie Mae 5.50% 2019 | 55 | 59 |
| Fannie Mae 5.50% 2020 | 5,164 | 5,540 |
| Fannie Mae 5.50% 2020 | 665 | 715 |
| Fannie Mae 11.073% 20202 | 51 | 57 |
| Fannie Mae, Series 2012-M5, Class A1, multifamily 1.787% 2022 | 3,627 | 3,730 |
| Fannie Mae 2.50% 2022 | 52,941 | 55,583 |
| Fannie Mae 2.50% 2022 | 49,854 | 52,341 |
| Fannie Mae 2.50% 2022 | 19,054 | 20,005 |
| Fannie Mae 2.50% 2022 | 17,075 | 17,927 |
| Fannie Mae 2.50% 2022 | 16,444 | 17,265 |
| Fannie Mae 2.50% 2022 | 13,632 | 14,312 |
| Fannie Mae 2.50% 2022 | 10,670 | 11,202 |
| Fannie Mae, Series 2012-M2, Class A2, multifamily 2.717% 2022 | 8,400 | 8,792 |
| Fannie Mae, Series 2012-M3, Class 1-A2, multifamily 3.044% 2022 | 3,500 | 3,752 |
| Fannie Mae, Series 2003-48, Class TJ, 4.50% 2022 | 1,561 | 1,570 |
| Fannie Mae 2.50% 2023 | 18,221 | 19,076 |
| Fannie Mae 5.00% 2023 | 3,065 | 3,336 |
| Fannie Mae 5.50% 2023 | 17,988 | 19,373 |
| Fannie Mae 5.50% 2023 | 17,437 | 18,783 |
| Fannie Mae 6.00% 2023 | 2,010 | 2,247 |
| Fannie Mae 4.50% 2024 | 11,193 | 12,048 |
| Fannie Mae 6.00% 2024 | 4,569 | 5,092 |
| Fannie Mae 3.50% 2025 | 20,609 | 21,882 |
| Fannie Mae 3.50% 2025 | 15,855 | 16,834 |
| Fannie Mae 3.50% 2025 | 10,549 | 11,200 |
| Fannie Mae 3.50% 2025 | 9,263 | 9,835 |
| Fannie Mae 3.50% 2025 | 8,356 | 8,872 |
| Fannie Mae 3.50% 2025 | 5,158 | 5,476 |
| Fannie Mae 4.50% 2025 | 15,389 | 16,611 |
| Fannie Mae 4.50% 2025 | 8,845 | 9,547 |
| Fannie Mae 4.50% 2025 | 8,560 | 9,240 |
| Fannie Mae, Series 2001-4, Class GA, 9.631% 20252 | 179 | 208 |
| Fannie Mae, Series 2001-4, Class NA, 11.187% 20252 | 386 | 430 |
| Fannie Mae 2.478% 20262 | 289 | 302 |
| Fannie Mae 3.50% 2026 | 71,009 | 75,393 |
| Fannie Mae 3.50% 2026 | 17,288 | 18,506 |
| Fannie Mae 3.50% 2026 | 8,885 | 9,434 |
| Fannie Mae 3.50% 2026 | 7,938 | 8,428 |
| Fannie Mae 4.00% 2026 | 13,432 | 14,395 |
| Fannie Mae 6.00% 2026 | 11,683 | 13,037 |
| Fannie Mae 2.50% 2027 | 237,442 | 248,547 |
| Fannie Mae 2.50% 2027 | 50,240 | 52,818 |
| Fannie Mae 2.50% 2027 | $ 30,805 | $ 32,366 |
| Fannie Mae 2.50% 2027 | 29,101 | 30,512 |
| Fannie Mae 2.50% 2027 | 21,734 | 22,835 |
| Fannie Mae 2.50% 2027 | 20,858 | 21,899 |
| Fannie Mae 2.50% 2027 | 19,222 | 20,182 |
| Fannie Mae 2.50% 2027 | 16,714 | 17,488 |
| Fannie Mae 2.50% 2027 | 15,500 | 16,285 |
| Fannie Mae 2.50% 2027 | 15,500 | 16,273 |
| Fannie Mae 2.50% 2027 | 15,403 | 16,183 |
| Fannie Mae 2.50% 2027 | 15,400 | 16,168 |
| Fannie Mae 2.50% 2027 | 13,955 | 14,632 |
| Fannie Mae 2.50% 2027 | 13,378 | 14,027 |
| Fannie Mae 2.50% 2027 | 10,835 | 11,342 |
| Fannie Mae 2.50% 2027 | 10,237 | 10,716 |
| Fannie Mae 2.50% 2027 | 9,510 | 9,954 |
| Fannie Mae 2.50% 2027 | 8,952 | 9,398 |
| Fannie Mae 2.50% 2027 | 6,899 | 7,222 |
| Fannie Mae 2.50% 2027 | 5,010 | 5,260 |
| Fannie Mae 2.50% 2027 | 4,927 | 5,158 |
| Fannie Mae 2.50% 2027 | 3,631 | 3,807 |
| Fannie Mae 2.50% 2027 | 3,067 | 3,220 |
| Fannie Mae 2.50% 2027 | 2,958 | 3,096 |
| Fannie Mae 2.50% 2027 | 2,635 | 2,768 |
| Fannie Mae 2.50% 2027 | 2,406 | 2,526 |
| Fannie Mae 2.50% 2027 | 2,058 | 2,158 |
| Fannie Mae 2.50% 2027 | 2,015 | 2,115 |
| Fannie Mae 2.50% 2027 | 1,814 | 1,907 |
| Fannie Mae 2.50% 2027 | 1,648 | 1,730 |
| Fannie Mae 2.50% 2027 | 974 | 1,022 |
| Fannie Mae 2.50% 2027 | 813 | 854 |
| Fannie Mae 2.50% 2027 | 790 | 829 |
| Fannie Mae 2.50% 2027 | 541 | 566 |
| Fannie Mae 2.50% 2027 | 214 | 224 |
| Fannie Mae 3.00% 2027 | 95,361 | 101,950 |
| Fannie Mae 3.00% 2027 | 54,650 | 58,204 |
| Fannie Mae 5.50% 2027 | 5,253 | 5,700 |
| Fannie Mae 2.50% 2028 | 490,520 | 513,054 |
| Fannie Mae 3.00% 2028 | 419,558 | 442,961 |
| Fannie Mae 3.50% 2028 | 303,440 | 321,978 |
| Fannie Mae 6.00% 2028 | 3,124 | 3,491 |
| Fannie Mae 6.00% 2028 | 1,645 | 1,837 |
| Fannie Mae, Series 1998-W5, Class B3, 6.50% 2028 | 1,288 | 1,221 |
| Fannie Mae, Series 2002-W7, Class A-5, 7.50% 2029 | 415 | 500 |
| Fannie Mae, Series 2001-25, Class ZA, 6.50% 2031 | 2,666 | 3,018 |
| Fannie Mae, Series 2001-20, Class E, 9.584% 20312 | 33 | 38 |
| Fannie Mae 6.50% 2032 | 128 | 140 |
| Fannie Mae 4.50% 2034 | 52,439 | 56,942 |
| Fannie Mae 6.50% 2034 | 827 | 921 |
| Fannie Mae 5.00% 2035 | 50,412 | 54,854 |
| Fannie Mae, Series 2005-68, Class PG, 5.50% 2035 | 3,145 | 3,540 |
| Fannie Mae, Series 2006-51, Class PO, principal only, 0% 2036 | 4,932 | 4,601 |
| Fannie Mae, Series 2006-32, Class OA, principal only, 0% 2036 | 4,256 | 3,917 |
| Fannie Mae, Series 2006-96, Class OP, principal only, 0% 2036 | 1,009 | 903 |
| Fannie Mae, Series 2006-101, Class PC, 5.50% 2036 | 3,252 | 3,628 |
| Fannie Mae, Series 2006-106, Class HG, 6.00% 2036 | 11,324 | 12,786 |
| Fannie Mae, Series 2006-43, Class PX, 6.00% 2036 | 8,615 | 9,637 |
| Fannie Mae 6.00% 2036 | 7,802 | 8,568 |
| Fannie Mae 6.00% 2036 | 3,957 | 4,349 |
| Fannie Mae 6.00% 2036 | 2,367 | 2,606 |
| Fannie Mae 6.50% 2036 | 6,995 | 7,795 |
| Fannie Mae 6.50% 2036 | $ 4,073 | $ 4,571 |
| Fannie Mae 7.00% 2036 | 860 | 977 |
| Fannie Mae 7.00% 2036 | 694 | 787 |
| Fannie Mae 7.50% 2036 | 359 | 410 |
| Fannie Mae 7.50% 2036 | 112 | 128 |
| Fannie Mae 8.00% 2036 | 546 | 626 |
| Fannie Mae 2.199% 20372 | 3,363 | 3,533 |
| Fannie Mae 2.709% 20372 | 2,826 | 2,989 |
| Fannie Mae 2.892% 20372 | 5,531 | 5,874 |
| Fannie Mae 3.398% 20372 | 5,756 | 6,104 |
| Fannie Mae 5.00% 2037 | 2,735 | 2,973 |
| Fannie Mae, Series 2007-40, Class PT, 5.50% 2037 | 14,108 | 15,644 |
| Fannie Mae 6.00% 2037 | 37,039 | 40,557 |
| Fannie Mae 6.00% 2037 | 35,374 | 38,742 |
| Fannie Mae 6.00% 2037 | 21,046 | 23,045 |
| Fannie Mae 6.00% 2037 | 5,781 | 6,323 |
| Fannie Mae 6.00% 2037 | 5,656 | 6,193 |
| Fannie Mae 6.00% 2037 | 4,732 | 5,181 |
| Fannie Mae 6.00% 2037 | 4,254 | 4,612 |
| Fannie Mae 6.00% 2037 | 2,990 | 3,275 |
| Fannie Mae 6.00% 2037 | 2,005 | 2,173 |
| Fannie Mae 6.00% 2037 | 1,086 | 1,189 |
| Fannie Mae 6.00% 2037 | 814 | 892 |
| Fannie Mae 6.50% 2037 | 7,754 | 8,627 |
| Fannie Mae 6.50% 2037 | 5,468 | 6,082 |
| Fannie Mae 6.50% 2037 | 4,442 | 4,937 |
| Fannie Mae 6.50% 2037 | 914 | 1,015 |
| Fannie Mae 7.00% 2037 | 2,409 | 2,708 |
| Fannie Mae 7.00% 2037 | 2,105 | 2,365 |
| Fannie Mae 7.00% 2037 | 1,011 | 1,147 |
| Fannie Mae 7.00% 2037 | 512 | 580 |
| Fannie Mae 7.00% 2037 | 246 | 283 |
| Fannie Mae 7.00% 2037 | 217 | 249 |
| Fannie Mae 7.50% 2037 | 659 | 753 |
| Fannie Mae 7.50% 2037 | 583 | 665 |
| Fannie Mae 7.50% 2037 | 566 | 647 |
| Fannie Mae 7.50% 2037 | 484 | 553 |
| Fannie Mae 7.50% 2037 | 456 | 521 |
| Fannie Mae 7.50% 2037 | 413 | 472 |
| Fannie Mae 7.50% 2037 | 411 | 470 |
| Fannie Mae 7.50% 2037 | 371 | 424 |
| Fannie Mae 7.50% 2037 | 318 | 363 |
| Fannie Mae 7.50% 2037 | 306 | 349 |
| Fannie Mae 7.50% 2037 | 234 | 268 |
| Fannie Mae 7.50% 2037 | 190 | 217 |
| Fannie Mae 7.50% 2037 | 127 | 149 |
| Fannie Mae 7.50% 2037 | 68 | 77 |
| Fannie Mae 7.50% 2037 | 26 | 30 |
| Fannie Mae 8.00% 2037 | 178 | 204 |
| Fannie Mae 8.00% 2037 | 119 | 138 |
| Fannie Mae 8.00% 2037 | 101 | 115 |
| Fannie Mae 5.338% 20382 | 2,473 | 2,630 |
| Fannie Mae 5.367% 20382 | 623 | 678 |
| Fannie Mae 5.46% 20382 | 6,205 | 6,676 |
| Fannie Mae 5.50% 2038 | 114 | 124 |
| Fannie Mae 6.00% 2038 | 111,079 | 121,672 |
| Fannie Mae 6.00% 2038 | 86,877 | 95,127 |
| Fannie Mae 6.00% 2038 | 65,080 | 71,261 |
| Fannie Mae 6.00% 2038 | 35,736 | 39,824 |
| Fannie Mae 6.00% 2038 | 3,934 | 4,296 |
| Fannie Mae 6.00% 2038 | $ 3,776 | $ 4,135 |
| Fannie Mae 6.00% 2038 | 3,660 | 3,997 |
| Fannie Mae 6.00% 2038 | 590 | 646 |
| Fannie Mae 6.00% 2038 | 166 | 181 |
| Fannie Mae 6.50% 2038 | 86,210 | 95,935 |
| Fannie Mae 3.518% 20392 | 4,418 | 4,618 |
| Fannie Mae 3.522% 20392 | 3,088 | 3,266 |
| Fannie Mae 3.607% 20392 | 11,005 | 11,562 |
| Fannie Mae 3.711% 20392 | 625 | 659 |
| Fannie Mae 3.773% 20392 | 3,022 | 3,162 |
| Fannie Mae 3.80% 20392 | 1,330 | 1,395 |
| Fannie Mae 3.845% 20392 | 4,054 | 4,267 |
| Fannie Mae 3.903% 20392 | 1,473 | 1,551 |
| Fannie Mae 3.904% 20392 | 1,697 | 1,776 |
| Fannie Mae 3.94% 20392 | 1,324 | 1,387 |
| Fannie Mae 3.956% 20392 | 6,563 | 6,862 |
| Fannie Mae 4.50% 2039 | 31,148 | 33,667 |
| Fannie Mae 5.00% 2039 | 24,061 | 26,714 |
| Fannie Mae 5.50% 2039 | 20,066 | 21,805 |
| Fannie Mae 5.50% 2039 | 2,847 | 3,094 |
| Fannie Mae 6.00% 2039 | 49,415 | 54,108 |
| Fannie Mae 6.00% 2039 | 5,951 | 6,508 |
| Fannie Mae 6.00% 2039 | 3,083 | 3,369 |
| Fannie Mae 6.00% 2039 | 2,902 | 3,167 |
| Fannie Mae 6.00% 2039 | 530 | 580 |
| Fannie Mae 6.00% 2039 | 291 | 318 |
| Fannie Mae 3.209% 20402 | 32,794 | 34,566 |
| Fannie Mae 3.603% 20402 | 5,527 | 5,798 |
| Fannie Mae 4.00% 2040 | 44,283 | 47,533 |
| Fannie Mae 4.00% 2040 | 18,511 | 20,350 |
| Fannie Mae 4.00% 2040 | 9,254 | 9,933 |
| Fannie Mae 4.184% 20402 | 1,813 | 1,932 |
| Fannie Mae 4.409% 20402 | 6,881 | 7,339 |
| Fannie Mae 4.50% 2040 | 66,885 | 72,503 |
| Fannie Mae 4.50% 2040 | 7,328 | 7,944 |
| Fannie Mae 4.50% 2040 | 4,762 | 5,145 |
| Fannie Mae 4.50% 2040 | 3,437 | 3,725 |
| Fannie Mae 4.50% 2040 | 426 | 474 |
| Fannie Mae 5.00% 2040 | 33,556 | 36,686 |
| Fannie Mae 5.00% 2040 | 16,084 | 17,918 |
| Fannie Mae 5.00% 2040 | 2,897 | 3,245 |
| Fannie Mae 5.00% 2040 | 2,885 | 3,154 |
| Fannie Mae 5.00% 2040 | 2,176 | 2,368 |
| Fannie Mae 5.50% 2040 | 13,710 | 15,035 |
| Fannie Mae 5.50% 2040 | 1,533 | 1,681 |
| Fannie Mae 6.00% 2040 | 9,415 | 10,289 |
| Fannie Mae 2.92% 20412 | 3,442 | 3,625 |
| Fannie Mae 3.568% 20412 | 2,099 | 2,222 |
| Fannie Mae 3.578% 20412 | 13,114 | 13,876 |
| Fannie Mae 3.766% 20412 | 6,805 | 7,233 |
| Fannie Mae 4.00% 2041 | 151,081 | 166,085 |
| Fannie Mae 4.00% 2041 | 89,327 | 98,198 |
| Fannie Mae 4.00% 2041 | 72,379 | 77,690 |
| Fannie Mae 4.00% 2041 | 30,281 | 32,502 |
| Fannie Mae 4.00% 2041 | 23,523 | 25,698 |
| Fannie Mae 4.00% 2041 | 15,530 | 16,674 |
| Fannie Mae 4.00% 2041 | 12,539 | 13,784 |
| Fannie Mae 4.00% 2041 | 11,391 | 12,227 |
| Fannie Mae 4.00% 2041 | 9,823 | 10,798 |
| Fannie Mae 4.00% 2041 | 8,325 | 8,938 |
| Fannie Mae 4.00% 2041 | $ 7,712 | $ 8,278 |
| Fannie Mae 4.00% 2041 | 6,572 | 7,225 |
| Fannie Mae 4.00% 2041 | 6,106 | 6,554 |
| Fannie Mae 4.00% 2041 | 6,012 | 6,438 |
| Fannie Mae 4.50% 2041 | 60,976 | 66,213 |
| Fannie Mae 4.50% 2041 | 45,846 | 49,783 |
| Fannie Mae 4.50% 2041 | 35,414 | 39,607 |
| Fannie Mae 4.50% 2041 | 31,662 | 35,232 |
| Fannie Mae 4.50% 2041 | 31,863 | 34,540 |
| Fannie Mae 4.50% 2041 | 24,436 | 26,534 |
| Fannie Mae 4.50% 2041 | 23,193 | 25,808 |
| Fannie Mae 4.50% 2041 | 23,749 | 25,788 |
| Fannie Mae 4.50% 2041 | 23,632 | 25,662 |
| Fannie Mae 4.50% 2041 | 9,833 | 10,997 |
| Fannie Mae 4.50% 2041 | 9,243 | 10,394 |
| Fannie Mae 4.50% 2041 | 6,853 | 7,442 |
| Fannie Mae 4.50% 2041 | 1,719 | 1,867 |
| Fannie Mae 4.50% 2041 | 1,302 | 1,449 |
| Fannie Mae 5.00% 2041 | 20,073 | 22,626 |
| Fannie Mae 5.00% 2041 | 18,015 | 20,306 |
| Fannie Mae 5.00% 2041 | 16,958 | 18,891 |
| Fannie Mae 5.00% 2041 | 16,429 | 18,518 |
| Fannie Mae 5.00% 2041 | 14,584 | 16,439 |
| Fannie Mae 5.00% 2041 | 13,458 | 15,170 |
| Fannie Mae 5.00% 2041 | 12,519 | 14,111 |
| Fannie Mae 5.00% 2041 | 8,239 | 9,281 |
| Fannie Mae 5.00% 2041 | 7,147 | 8,056 |
| Fannie Mae 5.00% 2041 | 6,610 | 7,217 |
| Fannie Mae 5.00% 2041 | 6,007 | 6,768 |
| Fannie Mae 5.00% 2041 | 3,747 | 4,221 |
| Fannie Mae 5.00% 2041 | 2,549 | 2,871 |
| Fannie Mae 5.00% 2041 | 2,413 | 2,719 |
| Fannie Mae 5.00% 2041 | 1,958 | 2,206 |
| Fannie Mae, Series 2001-T10, Class A-1, 7.00% 2041 | 3,615 | 4,202 |
| Fannie Mae, Series 2001-50, Class BA, 7.00% 2041 | 957 | 1,093 |
| Fannie Mae, Series 2002-W3, Class A-5, 7.50% 2041 | 2,120 | 2,530 |
| Fannie Mae 2.505% 20422 | 5,986 | 6,270 |
| Fannie Mae 3.50% 2042 | 93,237 | 100,270 |
| Fannie Mae 3.50% 2042 | 66,525 | 71,242 |
| Fannie Mae 3.50% 2042 | 46,250 | 49,681 |
| Fannie Mae 3.50% 2042 | 40,328 | 43,522 |
| Fannie Mae 3.50% 2042 | 31,741 | 34,095 |
| Fannie Mae 3.50% 2042 | 24,627 | 26,577 |
| Fannie Mae 3.50% 2042 | 23,043 | 24,868 |
| Fannie Mae 3.50% 2042 | 21,136 | 22,704 |
| Fannie Mae 3.50% 2042 | 15,844 | 17,098 |
| Fannie Mae 3.50% 2042 | 14,789 | 15,817 |
| Fannie Mae 3.50% 2042 | 14,359 | 15,377 |
| Fannie Mae 3.50% 2042 | 13,846 | 14,943 |
| Fannie Mae 3.50% 2042 | 12,631 | 13,678 |
| Fannie Mae 3.50% 2042 | 12,070 | 12,909 |
| Fannie Mae 3.50% 2042 | 8,074 | 8,635 |
| Fannie Mae 3.50% 2042 | 7,399 | 7,923 |
| Fannie Mae 3.50% 2042 | 7,343 | 7,862 |
| Fannie Mae 3.50% 2042 | 7,176 | 7,771 |
| Fannie Mae 3.50% 2042 | 4,841 | 5,224 |
| Fannie Mae 3.50% 2042 | 4,762 | 5,139 |
| Fannie Mae 3.50% 2042 | 4,648 | 5,016 |
| Fannie Mae 3.50% 2042 | 2,044 | 2,205 |
| Fannie Mae 3.50% 2042 | 1,173 | 1,266 |
| Fannie Mae 4.00% 2042 | $ 45,805 | $ 50,039 |
| Fannie Mae 4.00% 2042 | 5,592 | 6,071 |
| Fannie Mae 4.00% 2042 | 4,077 | 4,426 |
| Fannie Mae, Series 2002-W1, Class 2A, 6.94% 20422 | 2,727 | 3,191 |
| Fannie Mae 2.47% 20432,3 | 6,685 | 6,975 |
| Fannie Mae 3.00% 2043 | 1,332,405 | 1,396,527 |
| Fannie Mae 3.50% 2043 | 721,888 | 769,854 |
| Fannie Mae 4.00% 2043 | 122,055 | 130,866 |
| Fannie Mae 4.50% 2043 | 34,836 | 37,641 |
| Fannie Mae 5.00% 2043 | 16,184 | 17,532 |
| Fannie Mae 5.50% 2043 | 34,648 | 37,647 |
| Fannie Mae 6.00% 2043 | 107,733 | 117,682 |
| Fannie Mae 6.00% 2047 | 367 | 395 |
| Fannie Mae 6.50% 2047 | 492 | 547 |
| Fannie Mae 6.50% 2047 | 119 | 132 |
| Fannie Mae 7.00% 2047 | 826 | 923 |
| Fannie Mae 7.00% 2047 | 58 | 65 |
| Freddie Mac, Series K501, Class A1, multifamily 1.337% 2016 | 4,000 | 4,070 |
| Freddie Mac, Series K702, Class A1, multifamily 2.084% 2017 | 2,166 | 2,241 |
| Freddie Mac, Series K701, Class A2, multifamily 3.882% 20172 | 3,300 | 3,713 |
| Freddie Mac, Series K705, Class A2, multifamily 2.303% 2018 | 3,092 | 3,264 |
| Freddie Mac, Series K706, Class A2, multifamily 2.323% 2018 | 3,225 | 3,398 |
| Freddie Mac, Series K704, Class A2, multifamily 2.412% 2018 | 3,100 | 3,283 |
| Freddie Mac, Series K702, Class A2, multifamily 3.154% 2018 | 15,455 | 16,929 |
| Freddie Mac, Series K711, Class A2, multifamily 1.73% 2019 | 4,325 | 4,408 |
| Freddie Mac, Series K710, Class A2, multifamily 1.883% 2019 | 2,330 | 2,394 |
| Freddie Mac, Series K709, Class A2, multifamily 2.086% 2019 | 1,870 | 1,949 |
| Freddie Mac, Series 2890, Class KT, 4.50% 2019 | 2,500 | 2,770 |
| Freddie Mac 5.50% 2019 | 2,678 | 2,852 |
| Freddie Mac, Series K015, Class A1, multifamily 2.257% 2020 | 3,453 | 3,640 |
| Freddie Mac, Series K009, Class A1, multifamily 2.757% 2020 | 3,678 | 3,927 |
| Freddie Mac, Series K014, Class A1, multifamily 2.788% 2020 | 3,758 | 4,031 |
| Freddie Mac, Series K013, Class A1, multifamily 2.902% 2020 | 3,931 | 4,217 |
| Freddie Mac, Series K010, Class A1, multifamily 3.32% 20202 | 3,476 | 3,785 |
| Freddie Mac, Series K011, Class A2, multifamily 4.084% 20202 | 4,150 | 4,796 |
| Freddie Mac, Series K019, Class A1, multifamily 1.459% 2021 | 2,189 | 2,229 |
| Freddie Mac, Series K017, Class A2, multifamily 2.873% 2021 | 4,200 | 4,495 |
| Freddie Mac, Series K023, Class A2, multifamily 2.307% 2022 | 34,990 | 35,331 |
| Freddie Mac, Series K022, Class A2, multifamily 2.355% 2022 | 4,325 | 4,401 |
| Freddie Mac, Series K020, Class A2, multifamily 2.373% 2022 | 32,600 | 33,194 |
| Freddie Mac, Series K021, Class A2, multifamily 2.396% 2022 | 40,350 | 41,017 |
| Freddie Mac, Series 2626, Class NG, 3.50% 2023 | 326 | 337 |
| Freddie Mac, Series 2922, Class EL, 4.50% 2023 | 1,552 | 1,557 |
| Freddie Mac 5.00% 2023 | 3,832 | 4,111 |
| Freddie Mac 5.00% 2023 | 140 | 151 |
| Freddie Mac 5.00% 2023 | 21 | 22 |
| Freddie Mac, Series 1617, Class PM, 6.50% 2023 | 782 | 880 |
| Freddie Mac 5.00% 2024 | 8,879 | 9,537 |
| Freddie Mac 6.00% 2026 | 6,659 | 7,428 |
| Freddie Mac 6.00% 2026 | 6,087 | 6,792 |
| Freddie Mac 5.50% 2027 | 3,797 | 4,098 |
| Freddie Mac 6.00% 2027 | 42,400 | 47,312 |
| Freddie Mac 4.50% 2029 | 2,006 | 2,163 |
| Freddie Mac, Series 2153, Class GG, 6.00% 2029 | 1,331 | 1,497 |
| Freddie Mac, Series 2122, Class QM, 6.25% 2029 | 2,152 | 2,432 |
| Freddie Mac 4.50% 2030 | 4,702 | 5,070 |
| Freddie Mac 2.728% 20352 | 5,792 | 6,206 |
| Freddie Mac 4.50% 2035 | 4,761 | 5,119 |
| Freddie Mac 4.50% 2035 | 2,615 | 2,811 |
| Freddie Mac 4.50% 2035 | 956 | 1,028 |
| Freddie Mac, Series 3061, Class PN, 5.50% 2035 | $18,873 | $20,908 |
| Freddie Mac, Series 3136, Class OP, principal only, 0% 2036 | 3,754 | 3,471 |
| Freddie Mac, Series 3149, Class MO, principal only, 0% 2036 | 2,656 | 2,511 |
| Freddie Mac, Series 3147, Class OD, principal only, 0% 2036 | 2,599 | 2,456 |
| Freddie Mac, Series 3149, Class AO, principal only, 0% 2036 | 2,329 | 2,205 |
| Freddie Mac, Series 3156, Class PO, principal only, 0% 2036 | 50 | 48 |
| Freddie Mac 4.50% 2036 | 3,825 | 4,112 |
| Freddie Mac 4.50% 2036 | 2,095 | 2,249 |
| Freddie Mac, Series 3257, Class PA, 5.50% 2036 | 26,075 | 28,712 |
| Freddie Mac, Series 3233, Class PA, 6.00% 2036 | 20,674 | 23,209 |
| Freddie Mac, Series 3156, Class NG, 6.00% 2036 | 6,473 | 7,297 |
| Freddie Mac 2.098% 20372 | 2,194 | 2,302 |
| Freddie Mac 2.339% 20372 | 4,926 | 5,243 |
| Freddie Mac 4.50% 2037 | 18,870 | 20,291 |
| Freddie Mac 4.50% 2037 | 3,192 | 3,432 |
| Freddie Mac, Series 3286, Class JN, 5.50% 2037 | 26,463 | 29,290 |
| Freddie Mac, Series 3318, Class JT, 5.50% 2037 | 14,955 | 16,553 |
| Freddie Mac, Series 3312, Class PA, 5.50% 2037 | 13,984 | 15,477 |
| Freddie Mac 5.50% 2037 | 7,636 | 8,241 |
| Freddie Mac 5.50% 2037 | 278 | 301 |
| Freddie Mac 5.50% 2037 | 53 | 57 |
| Freddie Mac 5.713% 20372 | 3,322 | 3,573 |
| Freddie Mac, Series 3271, Class OA, 6.00% 2037 | 8,555 | 9,700 |
| Freddie Mac 7.00% 2037 | 239 | 269 |
| Freddie Mac 7.00% 2037 | 139 | 158 |
| Freddie Mac 7.50% 2037 | 1,517 | 1,712 |
| Freddie Mac 4.36% 20382 | 9,076 | 9,644 |
| Freddie Mac 4.50% 2038 | 3,614 | 3,888 |
| Freddie Mac 4.975% 20382 | 4,112 | 4,386 |
| Freddie Mac 5.234% 20382 | 7,682 | 8,266 |
| Freddie Mac 5.50% 2038 | 62,544 | 67,535 |
| Freddie Mac 5.50% 2038 | 8,068 | 8,733 |
| Freddie Mac 5.50% 2038 | 7,522 | 8,123 |
| Freddie Mac 5.50% 2038 | 7,207 | 7,782 |
| Freddie Mac 5.50% 2038 | 6,414 | 6,930 |
| Freddie Mac 5.50% 2038 | 3,963 | 4,280 |
| Freddie Mac 5.50% 2038 | 2,940 | 3,317 |
| Freddie Mac 5.50% 2038 | 3,040 | 3,284 |
| Freddie Mac 5.50% 2038 | 2,733 | 2,951 |
| Freddie Mac 5.50% 2038 | 1,961 | 2,119 |
| Freddie Mac 5.50% 2038 | 1,261 | 1,362 |
| Freddie Mac 5.50% 2038 | 770 | 831 |
| Freddie Mac 5.50% 2038 | 692 | 747 |
| Freddie Mac 5.50% 2038 | 636 | 687 |
| Freddie Mac 6.00% 2038 | 19,282 | 20,956 |
| Freddie Mac 3.747% 20392 | 3,989 | 4,190 |
| Freddie Mac 4.50% 2039 | 39,226 | 42,106 |
| Freddie Mac 4.50% 2039 | 30,700 | 32,954 |
| Freddie Mac 4.50% 2039 | 28,112 | 30,176 |
| Freddie Mac 4.50% 2039 | 16,269 | 17,464 |
| Freddie Mac 4.50% 2039 | 4,174 | 4,481 |
| Freddie Mac 4.50% 2039 | 3,974 | 4,266 |
| Freddie Mac 4.50% 2039 | 3,960 | 4,250 |
| Freddie Mac 4.50% 2039 | 3,267 | 3,507 |
| Freddie Mac 4.50% 2039 | 2,837 | 3,045 |
| Freddie Mac 4.50% 2039 | 1,245 | 1,336 |
| Freddie Mac 4.50% 2039 | 362 | 389 |
| Freddie Mac 4.50% 2039 | 342 | 368 |
| Freddie Mac 5.00% 2039 | 28,357 | 30,518 |
| Freddie Mac 5.50% 2039 | 28,256 | 30,564 |
| Freddie Mac 5.50% 2039 | $16,612 | $ 17,948 |
| Freddie Mac 4.50% 2040 | 72,677 | 78,284 |
| Freddie Mac 4.50% 2040 | 54,194 | 58,172 |
| Freddie Mac 4.50% 2040 | 34,215 | 36,855 |
| Freddie Mac 4.50% 2040 | 6,907 | 7,440 |
| Freddie Mac 4.50% 2040 | 5,741 | 6,184 |
| Freddie Mac 4.50% 2040 | 4,102 | 4,419 |
| Freddie Mac 4.50% 2040 | 3,518 | 3,790 |
| Freddie Mac 4.50% 2040 | 2,728 | 2,938 |
| Freddie Mac 4.50% 2040 | 1,530 | 1,648 |
| Freddie Mac 5.50% 2040 | 691 | 746 |
| Freddie Mac 5.50% 2040 | 28 | 31 |
| Freddie Mac 4.50% 2041 | 47,716 | 51,218 |
| Freddie Mac 4.50% 2041 | 41,436 | 44,477 |
| Freddie Mac 4.50% 2041 | 20,804 | 23,047 |
| Freddie Mac 4.50% 2041 | 10,966 | 12,148 |
| Freddie Mac 4.50% 2041 | 9,577 | 10,280 |
| Freddie Mac 4.50% 2041 | 9,551 | 10,252 |
| Freddie Mac 4.50% 2041 | 9,342 | 10,083 |
| Freddie Mac 4.50% 2041 | 8,640 | 9,325 |
| Freddie Mac 4.50% 2041 | 7,388 | 7,958 |
| Freddie Mac 4.50% 2041 | 5,256 | 5,674 |
| Freddie Mac 4.50% 2041 | 3,565 | 3,848 |
| Freddie Mac 4.50% 2041 | 3,301 | 3,563 |
| Freddie Mac 4.50% 2041 | 3,010 | 3,249 |
| Freddie Mac 4.50% 2041 | 1,937 | 2,091 |
| Freddie Mac 4.50% 2041 | 1,358 | 1,504 |
| Freddie Mac 4.50% 2041 | 986 | 1,063 |
| Freddie Mac 4.50% 2041 | 409 | 442 |
| Freddie Mac 4.50% 2041 | 221 | 238 |
| Freddie Mac 4.50% 2041 | 184 | 203 |
| Freddie Mac 5.00% 2041 | 20,142 | 22,691 |
| Freddie Mac 5.00% 2041 | 13,452 | 15,154 |
| Freddie Mac 5.00% 2041 | 11,365 | 12,728 |
| Freddie Mac 5.00% 2041 | 8,437 | 9,504 |
| Freddie Mac 5.00% 2041 | 6,347 | 7,150 |
| Freddie Mac 5.50% 2041 | 66,283 | 71,615 |
| Freddie Mac 5.50% 2041 | 21,988 | 23,757 |
| Freddie Mac 2.259% 20422 | 6,328 | 6,582 |
| Freddie Mac 2.562% 20422 | 7,090 | 7,416 |
| Freddie Mac 2.584% 20422 | 3,581 | 3,751 |
| Freddie Mac 4.50% 2042 | 92,864 | 99,680 |
| Freddie Mac 4.50% 2042 | 52,908 | 56,792 |
| Freddie Mac 4.50% 2042 | 50,277 | 53,967 |
| Freddie Mac 6.50% 2047 | 468 | 511 |
| Freddie Mac 7.00% 2047 | 278 | 311 |
| Government National Mortgage Assn. 10.00% 2021 | 326 | 357 |
| Government National Mortgage Assn. 2.50% 2027 | 9,963 | 10,494 |
| Government National Mortgage Assn. 2.50% 2027 | 9,111 | 9,618 |
| Government National Mortgage Assn. 2.50% 2027 | 5,098 | 5,382 |
| Government National Mortgage Assn. 3.00% 2027 | 9,670 | 10,348 |
| Government National Mortgage Assn., Series 2005-58, Class NO, principal only, 0% 2035 | 1,304 | 1,297 |
| Government National Mortgage Assn. 5.00% 2035 | 2,350 | 2,592 |
| Government National Mortgage Assn. 6.00% 2038 | 25,778 | 28,658 |
| Government National Mortgage Assn. 6.50% 2038 | 1,370 | 1,553 |
| Government National Mortgage Assn. 3.50% 2039 | 10,354 | 11,263 |
| Government National Mortgage Assn. 3.50% 2039 | 9,915 | 10,786 |
| Government National Mortgage Assn. 5.00% 2039 | 3,554 | 3,927 |
| Government National Mortgage Assn. 3.50% 2040 | 8,892 | 9,760 |
| Government National Mortgage Assn. 4.00% 2040 | 98,989 | 109,094 |
| Government National Mortgage Assn. 4.50% 2040 | $ 6,543 | $ 7,237 |
| Government National Mortgage Assn. 5.50% 2040 | 23,411 | 25,761 |
| Government National Mortgage Assn. 3.50% 2041 | 1,054 | 1,147 |
| Government National Mortgage Assn. 4.00% 2041 | 5,253 | 5,768 |
| Government National Mortgage Assn. 4.50% 2041 | 47,089 | 51,580 |
| Government National Mortgage Assn. 4.50% 2041 | 4,169 | 4,598 |
| Government National Mortgage Assn. 4.50% 2041 | 3,334 | 3,677 |
| Government National Mortgage Assn. 4.50% 2041 | 3,179 | 3,506 |
| Government National Mortgage Assn. 5.00% 2041 | 20,477 | 22,404 |
| Government National Mortgage Assn. 3.00% 2042 | 16,241 | 17,297 |
| Government National Mortgage Assn. 3.50% 2042 | 9,667 | 10,519 |
| Government National Mortgage Assn. 3.50% 2042 | 1,625 | 1,746 |
| Government National Mortgage Assn. 3.00% 2043 | 62,250 | 66,199 |
| Government National Mortgage Assn. 3.50% 2043 | 114,883 | 124,854 |
| Government National Mortgage Assn. 4.00% 2043 | 36,250 | 39,484 |
| FDIC Structured Sale Guaranteed Notes, Series 2010-L2A, Class A, 3.00% 20194 | 14,915 | 15,185 |
| FDIC Structured Sale Guaranteed Notes, Series 2010-S1, Class 1-A, 0.759% 20482,4 | 400 | 401 |
| National Credit Union Administration, Series 2011-M1, Class A1, 0.232% 20132 | 2,486 | 2,486 |
| National Credit Union Administration, Series 2011-M1, Class A2, 1.40% 2015 | 1,368 | 1,400 |
| National Credit Union Administration, Series 2010-R2, Class 1A, 0.583% 20172 | 1,974 | 1,981 |
| National Credit Union Administration, Series 2011-R3, Class 1A, 0.612% 20202 | 1,961 | 1,970 |
| National Credit Union Administration, Series 2011-R1, Class 1A, 0.663% 20202 | 2,185 | 2,197 |
| | | 10,452,448 |
| | | |
| COMMERCIAL MORTGAGE-BACKED SECURITIES1 — 2.52% | | |
| J.P. Morgan Chase Commercial Mortgage Securities Corp., Series 2004-CBX, Class A-5, 4.654% 2037 | 2,016 | 2,050 |
| J.P. Morgan Chase Commercial Mortgage Securities Corp., Series 2005-CIBC12, Class A-3B, 5.291% 20372 | 16,160 | 16,436 |
| J.P. Morgan Chase Commercial Mortgage Securities Corp., Series 2004-C3, Class A-3, 4.545% 2042 | 2,638 | 2,693 |
| J.P. Morgan Chase Commercial Mortgage Securities Corp., Series 2005-LDP3, Class A-4A, 4.936% 20422 | 1,655 | 1,815 |
| J.P. Morgan Chase Commercial Mortgage Securities Corp., Series 2005-LDP5, Class A-2, 5.198% 2044 | 5,084 | 5,117 |
| J.P. Morgan Chase Commercial Mortgage Securities Corp., Series 2006-LDP7, Class A-4, 5.871% 20452 | 66,235 | 76,443 |
| J.P. Morgan Chase Commercial Mortgage Securities Corp., Series 2011-C3A, Class A-2, 3.673% 20464 | 43,400 | 47,146 |
| J.P. Morgan Chase Commercial Mortgage Securities Corp., Series 2005-LDP1, Class A-2, 4.625% 2046 | 4,789 | 4,799 |
| J.P. Morgan Chase Commercial Mortgage Securities Corp., Series 2007-CB19, Class A-4, 5.728% 20492 | 33,812 | 39,815 |
| Greenwich Capital Commercial Funding Corp., Series 2005-GG5, Class A-2, 5.117% 2037 | 498 | 500 |
| Greenwich Capital Commercial Funding Corp., Series 2005-GG5, Class A-5, 5.224% 20372 | 11,000 | 12,159 |
| Greenwich Capital Commercial Funding Corp., Series 2005-GG5, Class A-4-1, 5.243% 20372 | 15,000 | 15,025 |
| Greenwich Capital Commercial Funding Corp., Series 2006-GG7, Class A-4, 5.867% 20382 | 13,465 | 15,497 |
| Greenwich Capital Commercial Funding Corp., Series 2007-GG9, Class A-4, 5.444% 2039 | 39,945 | 46,160 |
| American Tower Trust I, Series 2007-1A, Class A-FX, 5.42% 20374 | 18,500 | 18,867 |
| American Tower Trust I, Series 2007-1A, Class B, 5.537% 20374 | 10,000 | 10,341 |
| American Tower Trust I, Series 2007-1A, Class C, 5.615% 20374 | 10,000 | 10,426 |
| American Tower Trust I, Series 2007-1A, Class D, 5.957% 20374 | 35,515 | 36,437 |
| American Tower Trust I, Series 2007-1A, Class F, 6.639% 20374 | 5,000 | 5,081 |
| Citigroup-Deutsche Bank Commercial Mortgage Trust, Series 2005-CD1, Class A-4, 5.219% 20442 | 17,005 | 18,907 |
| Citigroup-Deutsche Bank Commercial Mortgage Trust, Series 2006-CD3, Class A-5, 5.617% 2048 | 45,484 | 52,258 |
| CS First Boston Mortgage Securities Corp., Series 2004-C5, Class A-3, 4.499% 2037 | 6,263 | 6,432 |
| CS First Boston Mortgage Securities Corp., Series 2005-C3, Class A-AB, 4.614% 2037 | 9,176 | 9,487 |
| CS First Boston Mortgage Securities Corp., Series 2004-C1, Class E, 5.015% 20374 | 8,240 | 7,961 |
| CS First Boston Mortgage Securities Corp., Series 2005-C5, Class A-AB, 5.10% 20382 | 6,397 | 6,521 |
| CS First Boston Mortgage Securities Corp., Series 2006-C5, Class A-3, 5.311% 2039 | 25,026 | 28,505 |
| CS First Boston Mortgage Securities Corp., Series 2006-C1, Class A-3, 5.409% 20392 | 6,547 | 6,719 |
| J.P. Morgan Chase Commercial Mortgage Securities Trust, Series 2006-LDP6, Class A-4, 5.475% 20432 | 41,806 | 47,314 |
| J.P. Morgan Chase Commercial Mortgage Securities Trust, Series 2006-LDP8, Class A-4, 5.399% 2045 | 14,040 | 16,159 |
| DBUBS Mortgage Trust, Series 2011-LC1A, Class A1, 3.742% 20464 | 54,743 | 59,261 |
| ML-CFC Commercial Mortgage Trust, Series 2006-4, Class A-3, 5.172% 20492 | 41,210 | 47,004 |
| Merrill Lynch Mortgage Trust, Series 2005-CKI1, Class AM, 5.263% 20372 | 4,620 | 4,970 |
| Merrill Lynch Mortgage Trust, Series 2004-BPC1, Class A-5, 4.855% 20412 | 6,805 | 7,171 |
| Merrill Lynch Mortgage Trust, Series 2005-MCP1, Class A-4, 4.747% 20432 | 8,080 | 8,761 |
| Merrill Lynch Mortgage Trust, Series 2005-MCP1, Class AM, 4.805% 20432 | 6,300 | 6,685 |
| Merrill Lynch Mortgage Trust, Series 2006-C2, Class A-4, 5.742% 20432 | $10,250 | $ 11,899 |
| L.A. Arena Funding, LLC, Series 1, Class A, 7.656% 20264 | 32,973 | 36,580 |
| Crown Castle Towers LLC, Series 2010-1, Class C, 4.523% 20354 | 2,000 | 2,125 |
| Crown Castle Towers LLC, Series 2010-5, Class C, 4.174% 20374 | 20,000 | 21,963 |
| Crown Castle Towers LLC, Series 2010-2, Class C, 5.495% 20374 | 10,000 | 11,400 |
| Banc of America Commercial Mortgage Inc., Series 2004-5, Class A-AB, 4.673% 2041 | 18 | 19 |
| Banc of America Commercial Mortgage Inc., Series 2005-3, Class A-2, 4.501% 2043 | 144 | 146 |
| Banc of America Commercial Mortgage Inc., Series 2005-5, Class A-4, 5.115% 20452 | 2,500 | 2,768 |
| Banc of America Commercial Mortgage Inc., Series 2006-4, Class A-4, 5.634% 2046 | 15,990 | 18,334 |
| Banc of America Commercial Mortgage Inc., Series 2007-3, Class A-4, 5.685% 20492 | 3,615 | 4,203 |
| Wachovia Bank Commercial Mortgage Trust, Series 2005-C18, Class A-PB, 4.807% 2042 | 1,345 | 1,391 |
| Wachovia Bank Commercial Mortgage Trust, Series 2005-C20, Class A-7, 5.118% 20422 | 9,605 | 10,563 |
| Wachovia Bank Commercial Mortgage Trust, Series 2005-C22, Class A-4, 5.293% 20442 | 5,350 | 5,978 |
| Wachovia Bank Commercial Mortgage Trust, Series 2005-C22, Class A-PB, 5.298% 20442 | 5,177 | 5,388 |
| Commercial Mortgage Trust, Series 2003-LNB1, Class A-2, 4.084% 2038 | 11,671 | 11,782 |
| GE Commercial Mortgage Corp., Series 2006-C1, Class A-4, 5.296% 20442 | 9,210 | 10,353 |
| COBALT CMBS Commercial Mortgage Trust, Series 2006-C1, Class A-2, 5.174% 2048 | 637 | 650 |
| LB-UBS Commercial Mortgage Trust, Series 2005-C7, Class A-2, 5.103% 2030 | 85 | 85 |
| | | 856,549 |
| | | |
| OTHER MORTGAGE-BACKED SECURITIES1 — 0.56% | | |
| Bank of Montreal 1.30% 20144 | 4,000 | 4,065 |
| Bank of Montreal 2.85% 20154 | 17,000 | 17,965 |
| Bank of Montreal 2.625% 20164 | 4,250 | 4,508 |
| Compagnie de Financement Foncier 2.125% 20134 | 16,700 | 16,777 |
| Compagnie de Financement Foncier 2.25% 20144 | 6,500 | 6,623 |
| Royal Bank of Canada 3.125% 20154 | 18,160 | 19,205 |
| Westpac Banking Corp. 1.375% 20154 | 4,325 | 4,391 |
| Westpac Banking Corp. 2.45% 20164 | 4,325 | 4,561 |
| Westpac Banking Corp. 1.25% 20174 | 4,425 | 4,423 |
| Bank of Nova Scotia 1.25% 20144 | 4,000 | 4,062 |
| Bank of Nova Scotia 2.15% 20164 | 4,650 | 4,885 |
| Bank of Nova Scotia 1.75% 20174 | 4,150 | 4,290 |
| DEPFA ACS Bank 5.125% 20374 | 16,250 | 12,900 |
| Australia & New Zealand Banking Group Ltd. 1.00% 20154 | 4,250 | 4,280 |
| Australia & New Zealand Banking Group Ltd. 2.40% 20164 | 4,250 | 4,473 |
| UBS AG 1.875% 20154 | 4,200 | 4,304 |
| UBS AG 2.25% 20174 | 4,150 | 4,293 |
| Barclays Bank PLC 2.50% 20154 | 3,600 | 3,749 |
| Barclays Bank PLC 2.25% 20174 | 4,375 | 4,517 |
| Swedbank AB 2.125% 20164 | 3,400 | 3,543 |
| Swedbank AB 2.95% 20164 | 3,000 | 3,196 |
| Toronto-Dominion Bank 1.625% 20164 | 4,400 | 4,541 |
| Credit Suisse Group AG 2.60% 20164 | 4,300 | 4,540 |
| HSBC Bank PLC 1.625% 20144 | 4,400 | 4,485 |
| Canadian Imperial Bank of Commerce 2.75% 20164 | 4,150 | 4,418 |
| National Bank of Canada 2.20% 20164 | 4,175 | 4,397 |
| Credit Mutuel-CIC Home Loan SFH 1.50% 20174 | 4,400 | 4,365 |
| Commonwealth Bank of Australia 2.25% 20174 | 4,150 | 4,336 |
| Stadshypotek AB 1.875% 20194 | 4,275 | 4,276 |
| Nordea Eiendomskreditt AS 2.125% 20174 | 4,000 | 4,171 |
| National Australia Bank 2.00% 20174 | 3,500 | 3,621 |
| Sparebank 1 Boligkreditt AS 2.625% 20164 | 3,400 | 3,593 |
| Caisse Centrale Desjardins 1.60% 20174 | 3,375 | 3,464 |
| | | 191,217 |
| | | |
| COLLATERALIZED MORTGAGE-BACKED OBLIGATIONS (PRIVATELY ORIGINATED)1 — 0.12% | | |
| Residential Accredit Loans, Inc., Series 2005-QR1, Class A, 6.00% 2034 | 17,345 | 17,760 |
| TBW Mortgage-backed Trust, Series 2007-2, Class A-4-B, 0.63% 20372 | 16,404 | 13,410 |
| American General Mortgage Loan Trust, Series 2010-1A, Class A-1, 5.15% 20582,4 | 7,304 | 7,537 |
| CS First Boston Mortgage Securities Corp., Series 2002-30, Class I-A-1, 7.50% 2032 | $ 207 | $ 219 |
| CS First Boston Mortgage Securities Corp., Series 2002-34, Class I-A-1, 7.50% 2032 | 29 | 32 |
| CS First Boston Mortgage Securities Corp., Series 2003-21, Class V-A-1, 6.50% 2033 | 1,626 | 1,703 |
| CS First Boston Mortgage Securities Corp., Series 2003-29, Class V-A-1, 7.00% 2033 | 30 | 33 |
| | | 40,694 |
| | | |
| Total mortgage-backed obligations | | 11,540,908 |
| | | |
| | | |
| CORPORATE BONDS & NOTES — 29.81% | | |
| FINANCIALS — 7.25% | | |
| REAL ESTATE — 2.30% | | |
| Westfield Capital Corp. Ltd., WT Finance (Australia) Pty Ltd. and WEA Finance LLC 5.125% 20144 | 5,000 | 5,363 |
| Westfield Group 7.50% 20144 | 16,670 | 18,144 |
| Westfield Group 5.75% 20154 | 35,300 | 39,433 |
| Westfield Group 5.70% 20164 | 19,445 | 22,217 |
| Westfield Group 7.125% 20184 | 16,725 | 20,624 |
| Westfield Group 6.75% 20194 | 14,400 | 17,850 |
| Westfield Group 4.625% 20214 | 14,655 | 16,422 |
| Westfield Group 3.375% 20224 | 26,165 | 26,915 |
| Prologis, Inc. 7.625% 2014 | 28,750 | 31,462 |
| Prologis, Inc. 5.75% 2016 | 9,300 | 10,372 |
| Prologis, Inc. 6.125% 2016 | 5,690 | 6,511 |
| Prologis, Inc. 6.25% 2017 | 6,115 | 7,011 |
| Prologis, Inc. 6.625% 2018 | 37,885 | 45,794 |
| Prologis, Inc. 6.625% 2019 | 3,740 | 4,459 |
| Prologis, Inc. 7.375% 2019 | 16,237 | 20,143 |
| Prologis, Inc. 6.875% 2020 | 21,985 | 26,631 |
| Pan Pacific Retail Properties, Inc. 6.125% 2013 | 1,605 | 1,608 |
| Kimco Realty Corp., Series C, 4.82% 2014 | 25,280 | 26,599 |
| Kimco Realty Corp., Series C, 4.904% 2015 | 1,770 | 1,896 |
| Kimco Realty Corp., Series C, 5.783% 2016 | 14,000 | 15,727 |
| Kimco Realty Corp. 5.70% 2017 | 28,450 | 32,794 |
| Kimco Realty Corp. 4.30% 2018 | 24,420 | 26,872 |
| Kimco Realty Corp. 6.875% 2019 | 5,440 | 6,724 |
| Hospitality Properties Trust 7.875% 2014 | 950 | 1,014 |
| Hospitality Properties Trust 5.125% 2015 | 6,665 | 7,013 |
| Hospitality Properties Trust 6.30% 2016 | 29,368 | 32,406 |
| Hospitality Properties Trust 5.625% 2017 | 1,195 | 1,320 |
| Hospitality Properties Trust 6.70% 2018 | 30,450 | 34,984 |
| Hospitality Properties Trust 5.00% 2022 | 5,625 | 5,956 |
| Simon Property Group, LP 6.75% 2014 | 9,100 | 9,709 |
| Simon Property Group, LP 4.20% 2015 | 2,430 | 2,578 |
| Simon Property Group, LP 5.875% 2017 | 13,000 | 15,402 |
| Simon Property Group, LP 1.50% 20184 | 19,820 | 19,724 |
| Simon Property Group, LP 6.125% 2018 | 10,000 | 12,191 |
| Simon Property Group, LP 10.35% 2019 | 8,995 | 12,870 |
| Realogy Corp., Term Loan B, 4.461% 20161,2,5 | 12,648 | 12,703 |
| Realogy Corp., Letter of Credit, 4.461% 20161,2,5 | 32 | 32 |
| Realogy Corp. 7.875% 20194 | 23,406 | 25,630 |
| Realogy Corp. 9.00% 20204 | 12,515 | 14,455 |
| Developers Diversified Realty Corp. 5.50% 2015 | 11,643 | 12,617 |
| Developers Diversified Realty Corp. 9.625% 2016 | 4,000 | 4,913 |
| Developers Diversified Realty Corp. 7.50% 2017 | 8,655 | 10,388 |
| Developers Diversified Realty Corp. 7.875% 2020 | 3,720 | 4,772 |
| Goodman Funding Pty Ltd. 6.00% 20224 | 26,535 | 29,754 |
| ERP Operating LP 6.584% 2015 | 10,000 | 11,230 |
| ERP Operating LP 5.125% 2016 | 3,945 | 4,402 |
| ERP Operating LP 7.125% 2017 | 5,000 | 6,125 |
| ERP Operating LP 4.625% 2021 | 2,645 | 2,982 |
| UDR, Inc., Series A, 5.25% 2015 | $12,780 | $ 13,742 |
| American Tower Corp. 4.625% 2015 | 10,000 | 10,635 |
| American Tower Corp. 5.90% 2021 | 2,000 | 2,389 |
| AvalonBay Communities, Inc. 2.85% 2023 | 7,940 | 7,846 |
| Weingarten Realty Investors, Series A, 4.857% 2014 | 6,080 | 6,294 |
| Host Hotels & Resorts LP 5.875% 2019 | 4,325 | 4,736 |
| Host Hotels & Resorts LP, Series C, 4.75% 2023 | 450 | 479 |
| Brandywine Operating Partnership, LP 5.40% 2014 | 3,000 | 3,206 |
| Crescent Resources 10.25% 20174 | 2,775 | 2,942 |
| Mack-Cali Realty Corp. 2.50% 2017 | 1,450 | 1,467 |
| FelCor Lodging Trust Inc. 5.625% 20234 | 915 | 913 |
| | | 781,390 |
| | | |
| BANKS — 1.92% | | |
| HSBC Finance Corp. 0.741% 20162 | 12,304 | 11,963 |
| HSBC Holdings PLC 4.125% 20204 | 9,453 | 10,528 |
| HSBC Holdings PLC 4.875% 2020 | 20,125 | 22,444 |
| HSBC Holdings PLC 4.00% 2022 | 17,060 | 18,694 |
| PNC Funding Corp. 5.40% 2014 | 10,000 | 10,669 |
| PNC Financial Services Group, Inc. 2.854% 2022 | 39,635 | 39,903 |
| PNC Preferred Funding Trust I, junior subordinated 1.958% (undated)2,4 | 12,700 | 10,668 |
| PNC Financial Services Group, Inc., Series O, junior subordinated 6.75% (undated)2 | 435 | 496 |
| Standard Chartered PLC 3.85% 20154 | 19,327 | 20,419 |
| Standard Chartered PLC 3.20% 20164 | 26,136 | 27,497 |
| Standard Chartered Bank 6.40% 20174 | 10,000 | 11,656 |
| BNP Paribas 3.60% 2016 | 14,000 | 14,826 |
| BNP Paribas 5.00% 2021 | 33,530 | 37,687 |
| BNP Paribas, junior subordinated 7.195% (undated)2,4 | 3,000 | 3,090 |
| Royal Bank of Scotland PLC 3.40% 2013 | 12,325 | 12,510 |
| Royal Bank of Scotland PLC 3.95% 2015 | 15,000 | 15,937 |
| Royal Bank of Scotland Group PLC 4.375% 2016 | 7,500 | 8,119 |
| Royal Bank of Scotland PLC 5.625% 2020 | 8,435 | 9,800 |
| Regions Financial Corp. 4.85% 2013 | 2,711 | 2,748 |
| Regions Financial Corp. 4.875% 2013 | 515 | 521 |
| Regions Financial Corp. 7.75% 2014 | 23,863 | 26,519 |
| Regions Financial Corp. 5.20% 2015 | 590 | 618 |
| Regions Financial Corp. 5.75% 2015 | 7,287 | 7,897 |
| CIT Group Inc., Series C, 4.75% 20154 | 19,000 | 19,855 |
| CIT Group Inc. 4.25% 2017 | 1,400 | 1,448 |
| CIT Group Inc. 5.00% 2017 | 9,750 | 10,384 |
| CIT Group Inc., Series C, 5.50% 20194 | 2,250 | 2,464 |
| UniCredito Italiano SpA 6.00% 20174 | 19,483 | 19,976 |
| HVB Funding Trust I, junior subordinated 8.741% 20314 | 8,264 | 7,376 |
| HVB Funding Trust III, junior subordinated 9.00% 20314 | 7,180 | 6,480 |
| Korea Development Bank 5.30% 2013 | 13,085 | 13,106 |
| Korea Development Bank 8.00% 2014 | 10,265 | 11,000 |
| Korea Development Bank 4.00% 2016 | 1,500 | 1,626 |
| Korea Development Bank 3.50% 2017 | 3,160 | 3,388 |
| Korea Development Bank 3.875% 2017 | 640 | 693 |
| Sovereign Bancorp, Inc. 8.75% 2018 | 1,880 | 2,215 |
| Santander Issuances, SA Unipersonal 6.50% 20192,4 | 21,200 | 21,624 |
| Wells Fargo & Co. 3.676% 2016 | 14,000 | 15,144 |
| Wells Fargo & Co., Series I, 3.50% 2022 | 6,400 | 6,832 |
| Nordea Bank, Series 2, 3.70% 20144 | 8,000 | 8,402 |
| Nordea Bank AB 3.125% 20174 | 12,500 | 13,320 |
| Barclays Bank PLC 5.125% 2020 | 18,125 | 20,657 |
| HBOS PLC 6.75% 20184 | 15,015 | 16,235 |
| HBOS PLC 4.375% 20192 | €2,870 | 3,514 |
| Intesa Sanpaolo SpA 6.50% 20214 | $17,770 | 18,737 |
| ANZ National (International) Ltd. 3.125% 20154 | 16,500 | 17,299 |
| Westpac Banking Corp. 3.00% 2015 | $14,400 | $ 15,282 |
| US Bancorp., Series T, 1.65% 2017 | 13,000 | 13,255 |
| VEB Finance Ltd. 6.902% 20204 | 9,100 | 11,125 |
| VEB Finance Ltd. 6.80% 20254 | 500 | 615 |
| Banco del Estado de Chile 4.125% 20204 | 10,000 | 10,969 |
| BBVA Bancomer SA 4.50% 20164 | 3,225 | 3,443 |
| BBVA Bancomer SA, junior subordinated 7.25% 20204 | 2,430 | 2,722 |
| BBVA Bancomer SA 6.50% 20214 | 2,355 | 2,626 |
| Société Générale 5.20% 20214 | 7,500 | 8,319 |
| Banco de Crédito del Perú 5.375% 20204 | 7,000 | 7,822 |
| HSBK (Europe) BV 7.25% 20214 | 6,710 | 7,197 |
| Development Bank of Kazakhstan 5.50% 20154 | 2,735 | 2,944 |
| | | 653,303 |
| | | |
| DIVERSIFIED FINANCIALS — 1.89% | | |
| Bank of America Corp. 1.50% 2015 | 15,500 | 15,589 |
| Bank of America Corp., Series L, 3.625% 2016 | 9,700 | 10,283 |
| Bank of America Corp. 3.75% 2016 | 24,640 | 26,353 |
| Bank of America Corp. 3.875% 2017 | 2,000 | 2,170 |
| Bank of America Corp. 5.75% 2017 | 1,000 | 1,166 |
| Bank of America Corp. 5.65% 2018 | 6,520 | 7,592 |
| Bank of America Corp. 5.625% 2020 | 19,350 | 22,958 |
| Bank of America Corp. 5.00% 2021 | 5,000 | 5,713 |
| Bank of America Corp. 5.875% 2021 | 16,110 | 19,302 |
| Bank of America Corp. 5.70% 2022 | 4,000 | 4,814 |
| Goldman Sachs Group, Inc. 3.625% 2016 | 27,625 | 29,256 |
| Murray Street Investment Trust I 4.647% 2017 | 10,370 | 11,224 |
| Goldman Sachs Group, Inc. 5.25% 2021 | 13,100 | 14,945 |
| Goldman Sachs Group, Inc. 5.75% 2022 | 36,925 | 43,688 |
| Goldman Sachs Group, Inc. 6.25% 2041 | 7,470 | 9,173 |
| Citigroup Inc. 4.587% 2015 | 18,750 | 20,483 |
| Citigroup Inc. 4.75% 2015 | 21,500 | 23,189 |
| Citigroup Inc. 3.953% 2016 | 8,300 | 8,939 |
| Citigroup Inc. 4.45% 2017 | 13,000 | 14,411 |
| Citigroup Inc. 6.125% 2017 | 7,000 | 8,337 |
| Citigroup Inc. 6.125% 2018 | 2,600 | 3,118 |
| Citigroup Inc. 8.50% 2019 | 9,914 | 13,338 |
| Citigroup Inc., Series B, junior subordinated 5.90% (undated)2 | 1,000 | 1,014 |
| Citigroup Inc., Series A, junior subordinated 5.95% (undated)2 | 3,400 | 3,447 |
| UBS AG 2.25% 2014 | 14,500 | 14,713 |
| UBS AG 5.75% 2018 | 18,202 | 21,626 |
| UBS AG 4.875% 2020 | 23,709 | 27,569 |
| JPMorgan Chase & Co. 3.40% 2015 | 17,500 | 18,475 |
| JPMorgan Chase & Co. 4.35% 2021 | 4,500 | 5,036 |
| JPMorgan Chase & Co. 4.625% 2021 | 6,500 | 7,417 |
| JPMorgan Chase & Co. 3.25% 2022 | 26,900 | 27,726 |
| Morgan Stanley, Series F, 2.875% 2014 | 14,750 | 15,002 |
| Morgan Stanley 3.80% 2016 | 8,850 | 9,296 |
| Morgan Stanley, Series F, 5.625% 2019 | 21,900 | 24,784 |
| Morgan Stanley 5.50% 2021 | 3,000 | 3,409 |
| Morgan Stanley 6.375% 2042 | 900 | 1,056 |
| Lazard Group LLC 7.125% 2015 | 16,500 | 18,352 |
| The Export-Import Bank of Korea 5.875% 2015 | 12,400 | 13,606 |
| The Export-Import Bank of Korea 4.375% 2021 | 4,000 | 4,435 |
| iStar Financial Inc., Term Loan B, 5.75% 20171,2,5 | 12,821 | 12,981 |
| iStar Financial Inc., Series B, 9.00% 2017 | 4,610 | 5,048 |
| Springleaf Finance Corp., Term Loan B, 5.50% 20171,2,5 | 17,230 | 17,160 |
| Bank of New York Mellon Corp., Series G, 2.50% 2016 | 16,000 | 16,775 |
| American Express Credit Co. 1.75% 2015 | 14,500 | 14,811 |
| American Express Co. 6.15% 2017 | 150 | 181 |
| International Lease Finance Corp. 4.875% 2015 | $13,445 | $ 13,967 |
| Northern Trust Corp. 4.625% 2014 | 8,475 | 8,934 |
| Northern Trust Corp. 5.85% 20174 | 3,750 | 4,481 |
| Jefferies Group, Inc. 6.875% 2021 | 5,000 | 5,625 |
| NASDAQ OMX Group, Inc. 5.25% 2018 | 3,800 | 4,156 |
| Franklin Resources, Inc. 1.375% 2017 | 2,700 | 2,715 |
| Franklin Resources, Inc. 2.80% 2022 | 1,300 | 1,317 |
| | | 641,155 |
| | | |
| INSURANCE — 1.03% | | |
| American International Group, Inc. 4.875% 2016 | 12,500 | 13,989 |
| American International Group, Inc. 3.80% 2017 | 32,750 | 35,470 |
| American International Group, Inc. 4.875% 2022 | 1,500 | 1,714 |
| ACE INA Holdings Inc. 5.875% 2014 | 17,445 | 18,741 |
| ACE INA Holdings Inc. 2.60% 2015 | 19,990 | 20,998 |
| ACE INA Holdings Inc. 5.80% 2018 | 1,000 | 1,220 |
| Monumental Global Funding 5.50% 20134 | 16,370 | 16,605 |
| Monumental Global Funding III 5.25% 20144 | 20,000 | 20,888 |
| CNA Financial Corp. 5.85% 2014 | 4,500 | 4,888 |
| CNA Financial Corp. 6.50% 2016 | 10,000 | 11,544 |
| CNA Financial Corp. 7.35% 2019 | 2,770 | 3,476 |
| CNA Financial Corp. 5.875% 2020 | 1,250 | 1,476 |
| CNA Financial Corp. 7.25% 2023 | 12,145 | 15,368 |
| MetLife Global Funding I 5.125% 20134 | 16,000 | 16,201 |
| MetLife Global Funding I 2.50% 20154 | 17,000 | 17,744 |
| Berkshire Hathaway Inc. 2.20% 2016 | 14,000 | 14,616 |
| Berkshire Hathaway Inc. 3.00% 2022 | 11,175 | 11,653 |
| Berkshire Hathaway Inc. 4.40% 2042 | 3,500 | 3,625 |
| Prudential Financial, Inc. 4.50% 2021 | 5,000 | 5,628 |
| Prudential Holdings, LLC, Series C, 8.695% 20231,4 | 14,150 | 18,568 |
| Principal Life Insurance Co. 5.30% 2013 | 18,150 | 18,411 |
| Allstate Life Global Funding Trust, Series 2008-4, 5.375% 2013 | 15,000 | 15,250 |
| RSA Insurance Group PLC 9.375% 20392 | £3,765 | 7,866 |
| RSA Insurance Group PLC 8.50% (undated)2 | 2,429 | 4,301 |
| AXA SA 8.60% 2030 | $ 4,615 | 5,788 |
| AXA SA, Series B, junior subordinated 6.379% (undated)2,4 | 5,065 | 4,989 |
| Jackson National Life Global 5.375% 20134 | 10,000 | 10,173 |
| UnumProvident Finance Co. PLC 6.85% 20154 | 2,000 | 2,264 |
| Unum Group 7.125% 2016 | 6,500 | 7,662 |
| New York Life Global Funding 4.65% 20134 | 8,720 | 8,843 |
| Liberty Mutual Group Inc. 6.70% 20164 | 6,250 | 7,174 |
| Assicurazioni Generali SpA 10.125% 2042 | €2,500 | 3,941 |
| Loews Corp. 6.00% 2035 | $ 225 | 266 |
| | | 351,340 |
| | | |
| AUTOMOBILES & COMPONENTS — 0.11% | | |
| Toyota Motor Credit Corp. 1.375% 2013 | 16,500 | 16,601 |
| Toyota Motor Credit Corp. 0.875% 2015 | 11,000 | 11,051 |
| Ford Motor Credit Co. 2.50% 2016 | 9,000 | 9,116 |
| | | 36,768 |
| | | |
| ENERGY — 4.16% | | |
| Transocean Inc. 5.05% 2016 | 20,500 | 22,839 |
| Transocean Inc. 2.50% 2017 | 9,880 | 9,992 |
| Transocean Inc. 6.375% 2021 | 40,950 | 49,805 |
| Transocean Inc. 3.80% 2022 | 41,520 | 42,593 |
| Transocean Inc. 7.35% 2041 | 5,205 | 6,920 |
| Kinder Morgan Energy Partners, LP 5.125% 2014 | 14,410 | 15,527 |
| Kinder Morgan Energy Partners, LP 5.625% 2015 | 12,600 | 13,812 |
| Kinder Morgan Energy Partners, LP 3.50% 2016 | 1,700 | 1,818 |
| Kinder Morgan Energy Partners, LP 6.00% 2017 | $17,000 | $19,869 |
| Kinder Morgan Energy Partners, LP 9.00% 2019 | 4,395 | 5,927 |
| Kinder Morgan Energy Partners, LP 5.30% 2020 | 2,750 | 3,208 |
| Kinder Morgan Energy Partners, LP 6.85% 2020 | 26,370 | 33,246 |
| Kinder Morgan Energy Partners, LP 3.95% 2022 | 6,000 | 6,421 |
| Kinder Morgan Energy Partners, LP 4.15% 2022 | 5,000 | 5,422 |
| Kinder Morgan Energy Partners, LP 3.45% 2023 | 10,000 | 10,308 |
| Kinder Morgan Energy Partners, LP 6.95% 2038 | 4,250 | 5,597 |
| Kinder Morgan Energy Partners, LP 6.55% 2040 | 2,000 | 2,509 |
| StatoilHydro ASA 2.90% 2014 | 15,360 | 15,992 |
| StatoilHydro ASA 1.80% 2016 | 1,800 | 1,852 |
| Statoil ASA 3.125% 2017 | 26,500 | 28,863 |
| StatoilHydro ASA 1.20% 2018 | 8,880 | 8,889 |
| StatoilHydro ASA 5.25% 2019 | 2,000 | 2,400 |
| Statoil ASA 3.15% 2022 | 33,900 | 35,859 |
| StatoilHydro ASA 2.45% 2023 | 29,755 | 29,714 |
| Enbridge Energy Partners, LP, Series B, 6.50% 2018 | 25,120 | 30,594 |
| Enbridge Energy Partners, LP 9.875% 2019 | 27,005 | 36,586 |
| Enbridge Energy Partners, LP 5.20% 2020 | 1,500 | 1,693 |
| Enbridge Energy Partners, LP 4.20% 2021 | 11,750 | 12,640 |
| Enbridge Energy Partners, LP, Series B, 7.50% 2038 | 7,450 | 9,534 |
| Enbridge Energy Partners, LP, junior subordinated 8.05% 20772 | 1,100 | 1,250 |
| BG Energy Capital PLC 2.50% 20154 | 7,200 | 7,520 |
| BG Energy Capital PLC 2.875% 20164 | 31,930 | 33,721 |
| BG Energy Capital PLC 4.00% 20214 | 36,825 | 40,621 |
| Total Capital SA 3.00% 2015 | 17,000 | 17,966 |
| Total Capital International 1.50% 2017 | 2,000 | 2,017 |
| Total Capital International 1.55% 2017 | 13,140 | 13,352 |
| Total Capital International 2.875% 2022 | 31,870 | 33,296 |
| Total Capital International 2.70% 2023 | 12,000 | 12,237 |
| Shell International Finance BV 1.875% 2013 | 16,500 | 16,560 |
| Shell International Finance BV 3.10% 2015 | 10,000 | 10,599 |
| Shell International Finance BV 1.125% 2017 | 34,650 | 34,839 |
| Shell International Finance BV 2.375% 2022 | 1,800 | 1,810 |
| Shell International Finance BV 3.625% 2042 | 10,880 | 10,796 |
| Enterprise Products Operating LLC 5.65% 2013 | 17,850 | 18,050 |
| Enterprise Products Operating LLC 5.20% 2020 | 8,425 | 10,063 |
| Enterprise Products Operating LLC 5.25% 2020 | 2,000 | 2,378 |
| Enterprise Products Operating LLC 4.05% 2022 | 23,605 | 26,114 |
| Enterprise Products Operating LLC 4.85% 2042 | 10,000 | 10,744 |
| Enterprise Products Operating LLC 5.70% 2042 | 2,750 | 3,224 |
| Enterprise Products Operating LLC 7.00% 20672 | 600 | 647 |
| Anadarko Petroleum Corp. 5.95% 2016 | 15,500 | 17,853 |
| Anadarko Petroleum Corp. 6.375% 2017 | 30,260 | 36,171 |
| Anadarko Petroleum Corp. 8.70% 2019 | 2,000 | 2,700 |
| Anadarko Petroleum Corp. 6.20% 2040 | 1,750 | 2,160 |
| Pemex Finance Ltd., Series 1999-2, Class A-3, 10.61% 20171 | 11,700 | 14,196 |
| Pemex Project Funding Master Trust 5.75% 2018 | 3,150 | 3,693 |
| Petróleos Mexicanos 4.875% 2022 | 2,600 | 2,941 |
| Pemex Project Funding Master Trust, Series 13, 6.625% 2035 | 11,750 | 14,981 |
| Petróleos Mexicanos 6.50% 2041 | 4,150 | 5,229 |
| Petróleos Mexicanos 5.50% 20444 | 1,000 | 1,103 |
| Reliance Holdings Ltd. 4.50% 20204 | 6,350 | 6,654 |
| Reliance Holdings Ltd. 4.50% 2020 | 1,750 | 1,834 |
| Reliance Holdings Ltd. 5.40% 20224 | 16,800 | 18,805 |
| Reliance Holdings Ltd. 6.25% 20404 | 10,750 | 12,367 |
| Chevron Corp. 1.104% 2017 | 14,935 | 15,051 |
| Chevron Corp. 4.95% 2019 | 7,500 | 8,953 |
| Chevron Corp. 2.355% 2022 | 14,000 | 14,037 |
| El Paso Pipeline Partners Operating Co., LLC 5.00% 2021 | 25,320 | 28,793 |
| El Paso Pipeline Partners Operating Co., LLC 4.70% 2042 | $ 8,835 | $ 8,680 |
| Williams Partners L.P. and Williams Partners Finance Corp. 3.80% 2015 | 15,800 | 16,714 |
| Williams Partners L.P. and Williams Partners Finance Corp. 5.25% 2020 | 11,625 | 13,400 |
| Gazprom OJSC 5.092% 20154 | 6,125 | 6,578 |
| Gazprom OJSC 6.51% 20224 | 14,500 | 17,364 |
| Gazprom OJSC, Series 9, 6.51% 2022 | 5,000 | 5,988 |
| QGOG Atlantic/Alaskan Rigs Ltd. 5.25% 20181,4 | 27,970 | 29,578 |
| Petrobras International Finance Co. 5.375% 2021 | 17,220 | 19,455 |
| Petrobras International Finance Co. 6.875% 2040 | 6,970 | 8,901 |
| Petrobras International Finance Co. 6.75% 2041 | 500 | 634 |
| Woodside Finance Ltd. 4.60% 20214 | 24,125 | 26,610 |
| Enbridge Inc. 5.80% 2014 | 1,200 | 1,288 |
| Enbridge Inc. 5.60% 2017 | 19,200 | 22,331 |
| Ras Laffan Liquefied Natural Gas III 5.50% 2014 | 3,335 | 3,603 |
| Ras Laffan Liquefied Natural Gas III 5.50% 20144 | 330 | 356 |
| Ras Laffan Liquefied Natural Gas III 5.832% 20161 | 1,293 | 1,427 |
| Ras Laffan Liquefied Natural Gas II 5.298% 20201,4 | 12,975 | 14,630 |
| Ras Laffan Liquefied Natural Gas III 6.332% 20271 | 2,000 | 2,566 |
| Apache Corp. 2.625% 2023 | 11,390 | 11,380 |
| Apache Corp. 4.25% 2044 | 7,560 | 7,732 |
| Husky Energy Inc. 6.20% 2017 | 12,830 | 15,395 |
| Western Gas Partners LP 4.00% 2022 | 14,445 | 15,233 |
| Alpha Natural Resources, Inc. 9.75% 2018 | 7,415 | 8,045 |
| Alpha Natural Resources, Inc. 6.00% 2019 | 4,025 | 3,723 |
| Alpha Natural Resources, Inc. 6.25% 2021 | 3,050 | 2,806 |
| TransCanada PipeLines Ltd. 6.50% 2018 | 7,500 | 9,453 |
| TransCanada PipeLines Ltd. 7.125% 2019 | 3,040 | 3,875 |
| TransCanada PipeLines Ltd., junior subordinated 6.35% 20672 | 1,000 | 1,073 |
| Cenovus Energy Inc. 3.00% 2022 | 9,260 | 9,466 |
| Cenovus Energy Inc. 6.75% 2039 | 1,750 | 2,371 |
| Marathon Oil Corp. 0.90% 2015 | 11,000 | 11,016 |
| ConocoPhillips 1.05% 2017 | 11,000 | 10,974 |
| QGOG Constellation S.A. 6.25% 20194 | 9,800 | 10,241 |
| Arch Coal, Inc. 7.00% 2019 | 2,350 | 2,197 |
| Arch Coal, Inc. 7.25% 2021 | 7,625 | 7,072 |
| Phillips 66 5.875% 20424 | 7,430 | 8,949 |
| Spectra Energy Partners, LP 2.95% 2016 | 6,375 | 6,565 |
| Spectra Energy Partners 4.60% 2021 | 2,185 | 2,345 |
| Korea National Oil Corp. 4.00% 20164 | 6,850 | 7,431 |
| Southwestern Energy Co. 4.10% 2022 | 6,270 | 6,750 |
| Canadian Natural Resources Ltd. 3.45% 2021 | 6,185 | 6,606 |
| Regency Energy Partners LP and Regency Energy Finance Corp. 6.50% 2021 | 3,875 | 4,263 |
| Regency Energy Partners LP and Regency Energy Finance Corp. 5.50% 2023 | 2,150 | 2,306 |
| Devon Energy Corp. 1.875% 2017 | 6,405 | 6,534 |
| Odebrecht Drilling Norbe VIII/IX Ltd 6.35% 20211,4 | 5,562 | 6,271 |
| Energy Transfer Partners, L.P. 5.20% 2022 | 4,500 | 5,137 |
| Energy Transfer Partners, L.P. 6.50% 2042 | 665 | 815 |
| Peabody Energy Corp. 6.00% 2018 | 4,660 | 4,975 |
| Peabody Energy Corp. 6.25% 2021 | 875 | 934 |
| CONSOL Energy Inc. 8.00% 2017 | 1,945 | 2,115 |
| CONSOL Energy Inc. 8.25% 2020 | 3,430 | 3,730 |
| PDC Energy Inc. 7.75% 20224 | 4,350 | 4,481 |
| Energy Transfer Partners, LP 7.50% 2020 | 3,700 | 4,292 |
| Plains Exploration & Production Co. 6.50% 2020 | 3,030 | 3,371 |
| Laredo Petroleum, Inc. 9.50% 2019 | 1,950 | 2,189 |
| Access Midstream Partners, L.P. 4.875% 2023 | 2,150 | 2,185 |
| NGPL PipeCo LLC 7.119% 20174 | 600 | 657 |
| NGPL PipeCo LLC 9.625% 20194 | 1,000 | 1,155 |
| Transportadora de Gas Internacional 5.70% 20224 | 1,250 | 1,388 |
| Teekay Corp. 8.50% 2020 | 725 | 769 |
| Dolphin Energy Ltd. 5.50% 20214 | $ 500 | $ 584 |
| PTT Exploration & Production Ltd. 6.35% 20424 | 400 | 501 |
| | | 1,415,207 |
| | | |
| HEALTH CARE — 3.52% | | |
| PHARMACEUTICALS, BIOTECHNOLOGY & LIFE SCIENCES — 2.23% | | |
| AbbVie Inc. 1.75% 20174 | 34,440 | 34,842 |
| AbbVie Inc. 2.90% 20224 | 58,845 | 59,983 |
| AbbVie Inc. 4.40% 20424 | 31,640 | 33,672 |
| Amgen Inc. 2.50% 2016 | 27,200 | 28,596 |
| Amgen Inc. 2.125% 2017 | 22,567 | 23,395 |
| Amgen Inc. 3.875% 2021 | 1,000 | 1,099 |
| Amgen Inc. 3.625% 2022 | 10,330 | 11,111 |
| Amgen Inc. 5.15% 2041 | 5,000 | 5,632 |
| Amgen Inc. 5.375% 2043 | 12,755 | 15,053 |
| Roche Holdings Inc. 5.00% 20144 | 6,685 | 7,030 |
| Roche Holdings Inc. 6.00% 20194 | 41,520 | 51,788 |
| Roche Holdings Inc. 7.00% 20394 | 16,310 | 24,615 |
| Gilead Sciences, Inc. 2.40% 2014 | 7,215 | 7,444 |
| Gilead Sciences, Inc. 3.05% 2016 | 14,765 | 15,824 |
| Gilead Sciences, Inc. 4.40% 2021 | 38,560 | 43,992 |
| Gilead Sciences, Inc. 5.65% 2041 | 11,405 | 14,182 |
| GlaxoSmithKline Capital Inc. 4.85% 2013 | 20,000 | 20,338 |
| GlaxoSmithKline Capital Inc. 1.50% 2017 | 10,500 | 10,660 |
| GlaxoSmithKline Capital Inc. 5.65% 2018 | 15,000 | 18,285 |
| GlaxoSmithKline Capital Inc. 2.85% 2022 | 14,500 | 15,074 |
| GlaxoSmithKline Capital Inc. 6.375% 2038 | 7,100 | 9,817 |
| Novartis Capital Corp. 1.90% 2013 | 15,000 | 15,079 |
| Novartis Capital Corp. 4.125% 2014 | 11,025 | 11,469 |
| Novartis Securities Investment Ltd. 5.125% 2019 | 23,780 | 28,438 |
| Novartis Capital Corp. 2.40% 2022 | 7,250 | 7,276 |
| Biogen Idec Inc. 6.00% 2013 | 30,050 | 30,310 |
| Biogen Idec Inc. 6.875% 2018 | 17,000 | 21,073 |
| Schering-Plough Corp. 5.30% 20132 | 6,000 | 6,274 |
| Schering-Plough Corp. 5.375% 2014 | €6,395 | 9,155 |
| Schering-Plough Corp. 6.00% 2017 | $ 5,300 | 6,500 |
| Merck & Co., Inc. 1.10% 2018 | 10,000 | 10,000 |
| Merck & Co., Inc. 2.40% 2022 | 12,000 | 12,015 |
| inVentiv Health Inc. 9.00% 20184 | 12,725 | 12,884 |
| inVentiv Health Inc. 10.00% 20184 | 7,655 | 6,679 |
| inVentiv Health Inc. 10.25% 20184 | 19,255 | 16,800 |
| Pfizer Inc 5.35% 2015 | 125 | 138 |
| Pfizer Inc 6.20% 2019 | 18,140 | 22,942 |
| Quintiles, Term Loan B-2, 4.50% 20181,2,5 | 15,650 | 15,650 |
| VPI Escrow Corp. 6.375% 20204 | 12,850 | 13,846 |
| Elan Finance PLC and Elan Finance Corp. 6.25% 20194 | 12,850 | 13,493 |
| Teva Pharmaceutical Financial IV LLC, 2.25% 2020 | 2,390 | 2,413 |
| Teve Pharmaceutical Finance Company BV, 2.95% 2022 | 9,350 | 9,467 |
| Sanofi 0.62% 20142 | 10,000 | 10,040 |
| Patheon Inc., Term Loan B1, 7.25% 20181,2,5 | 8,500 | 8,463 |
| Grifols Inc. 8.25% 2018 | 5,065 | 5,603 |
| Johnson & Johnson 0.40% 20142 | 5,000 | 5,012 |
| Alkermes Inc., Term Loan B, 4.50% 20191,2,5 | 3,890 | 3,936 |
| INC Research LLC 11.50% 20194 | 590 | 614 |
| | | 758,001 |
| | | |
| HEALTH CARE EQUIPMENT & SERVICES — 1.29% | | |
| Express Scripts Inc. 2.75% 20144 | 15,500 | 15,997 |
| Express Scripts Inc. 6.25% 2014 | 27,133 | 29,229 |
| Medco Health Solutions, Inc. 2.75% 2015 | 10,310 | 10,753 |
| Express Scripts Inc. 3.125% 2016 | $18,427 | $ 19,438 |
| Express Scripts Inc. 3.50% 20164 | 3,000 | 3,209 |
| Express Scripts Inc. 2.65% 20174 | 26,335 | 27,390 |
| Express Scripts Inc. 4.75% 20214 | 13,500 | 15,333 |
| Express Scripts Inc. 3.90% 20224 | 33,060 | 35,677 |
| Express Scripts Inc. 6.125% 20414 | 7,000 | 8,938 |
| UnitedHealth Group Inc. 0.85% 2015 | 6,075 | 6,099 |
| UnitedHealth Group Inc. 1.40% 2017 | 6,710 | 6,726 |
| UnitedHealth Group Inc. 6.00% 2017 | 19,920 | 23,908 |
| UnitedHealth Group Inc. 2.75% 2023 | 1,585 | 1,601 |
| UnitedHealth Group Inc. 5.70% 2040 | 1,250 | 1,516 |
| UnitedHealth Group Inc. 4.625% 2041 | 2,685 | 2,869 |
| UnitedHealth Group Inc. 3.95% 2042 | 315 | 314 |
| Kinetic Concepts, Inc. 10.50% 20184 | 19,650 | 20,706 |
| Kinetic Concepts, Inc. 12.50% 20194 | 9,000 | 8,651 |
| Cardinal Health, Inc. 5.50% 2013 | 2,035 | 2,078 |
| Cardinal Health, Inc. 4.00% 2015 | 3,990 | 4,290 |
| Cardinal Health, Inc. 1.90% 2017 | 3,550 | 3,619 |
| Cardinal Health, Inc. 4.625% 2020 | 6,020 | 6,837 |
| Allegiance Corp. 7.00% 2026 | 7,635 | 10,314 |
| Aetna Inc. 1.50% 2017 | 10,375 | 10,404 |
| Aetna Inc. 2.75% 2022 | 13,000 | 12,905 |
| PTS Acquisition Corp. 9.50% 20156 | 9,040 | 9,268 |
| PTS Acquisition Corp. 9.75% 2017 | €8,775 | 12,075 |
| Humana Inc. 3.15% 2022 | $ 9,650 | 9,605 |
| Humana Inc. 4.625% 2042 | 5,350 | 5,408 |
| Boston Scientific Corp. 6.00% 2020 | 10,900 | 12,723 |
| Coventry Health Care, Inc. 6.30% 2014 | 11,395 | 12,314 |
| Tenet Healthcare Corp. 9.25% 2015 | 10,600 | 11,952 |
| DENTSPLY International Inc. 1.81% 20132 | 5,000 | 5,028 |
| DENTSPLY International Inc. 2.75% 2016 | 5,620 | 5,834 |
| Symbion Inc. 8.00% 2016 | 10,050 | 10,402 |
| VWR Funding, Inc. 7.25% 20174 | 9,040 | 9,537 |
| Rotech Healthcare Inc. 10.50% 2018 | 12,400 | 8,370 |
| McKesson Corp. 0.95% 2015 | 2,255 | 2,260 |
| McKesson Corp. 3.25% 2016 | 1,580 | 1,694 |
| McKesson Corp. 2.70% 2022 | 4,010 | 4,015 |
| Merge Healthcare Inc 11.75% 2015 | 5,250 | 5,663 |
| Surgical Care Affiliates, Inc. 8.875% 20154 | 3,927 | 4,035 |
| Surgical Care Affiliates, Inc. 10.00% 20174 | 925 | 974 |
| Dignity Health 3.125% 2022 | 4,100 | 4,093 |
| Centene Corp. 5.75% 2017 | 3,425 | 3,699 |
| Bausch & Lomb Inc. 9.875% 2015 | 2,811 | 2,909 |
| Baxter International Inc. 2.40% 2022 | 2,600 | 2,575 |
| HCA Inc. 6.50% 2020 | 2,250 | 2,537 |
| Catholic Health Initiatives, Series 2012, 1.60% 2017 | 1,250 | 1,265 |
| Multiplan Inc. 9.875% 20184 | 980 | 1,098 |
| | | 438,134 |
| | | |
| INDUSTRIALS — 3.14% | | |
| CAPITAL GOODS — 1.77% | | |
| General Electric Co. 0.85% 2015 | 13,000 | 13,054 |
| General Electric Capital Corp. 1.00% 2015 | 10,800 | 10,850 |
| General Electric Capital Corp., Series A, 2.25% 2015 | 19,500 | 20,150 |
| General Electric Capital Corp. 2.95% 2016 | 2,790 | 2,940 |
| General Electric Capital Corp. 1.60% 2017 | 14,000 | 14,020 |
| General Electric Capital Corp. 2.30% 2017 | 14,200 | 14,734 |
| General Electric Corp. 5.25% 2017 | 7,455 | 8,797 |
| General Electric Capital Corp., Series A, 5.625% 2018 | 4,000 | 4,754 |
| General Electric Capital Corp. 2.10% 2019 | 8,750 | 8,781 |
| General Electric Capital Corp., Series A, 6.00% 2019 | $26,050 | $ 31,711 |
| General Electric Co. 2.70% 2022 | 23,500 | 23,976 |
| General Electric Capital Corp. 3.15% 2022 | 16,000 | 16,362 |
| General Electric Co. 4.125% 2042 | 4,000 | 4,119 |
| Volvo Treasury AB 5.95% 20154 | 56,693 | 61,901 |
| United Technologies Corp. 1.80% 2017 | 5,770 | 5,944 |
| United Technologies Corp. 3.10% 2022 | 29,765 | 31,549 |
| United Technologies Corp. 4.50% 2042 | 16,195 | 18,014 |
| Hawker Beechcraft Acquisition Co., LLC, Debtor in Possession Delayed Draw, 9.75% 20131,2,5 | 7,315 | 7,428 |
| Hawker Beechcraft Acquisition Co., LLC, Letter of Credit, 2.211% 20141,2,5 | 1,657 | 899 |
| Hawker Beechcraft Acquisition Co., LLC, Term Loan B, 4.25% 20141,2,5 | 47,542 | 25,792 |
| Hawker Beechcraft Acquisition Co., LLC, Term Loan B, 10.75% 20141,2,5 | 2,344 | 1,325 |
| Hawker Beechcraft Acquisition Co., LLC 8.875% 20156,7 | 1,568 | 141 |
| Hawker Beechcraft Acquisition Co., LLC 9.75% 20177 | 2,185 | 1 |
| Ply Gem Industries, Inc. 9.375% 20174 | 3,300 | 3,523 |
| Ply Gem Industries, Inc. 8.25% 2018 | 24,595 | 26,686 |
| JELD-WEN Escrow Corp. 12.25% 20174 | 25,000 | 29,000 |
| Northrop Grumman Corp. 3.70% 2014 | 9,500 | 9,942 |
| Northrop Grumman Corp. 5.05% 2019 | 14,180 | 16,562 |
| Associated Materials, LLC and AMH New Finance, Inc. 9.125% 2017 | 24,305 | 24,791 |
| Nortek Inc. 10.00% 2018 | 8,000 | 8,940 |
| Nortek Inc. 8.50% 2021 | 9,220 | 10,280 |
| US Investigations Services, Inc., Term Loan B, 2.961% 20151,2,5 | 521 | 485 |
| US Investigations Services, Inc., Term Loan D, 7.75% 20151,2,5 | 4,929 | 4,905 |
| US Investigations Services, Inc. 10.50% 20154 | 7,200 | 6,336 |
| US Investigations Services, Inc. 11.75% 20164 | 6,610 | 4,990 |
| DAE Aviation Holdings, Inc. 11.25% 20154 | 12,558 | 12,966 |
| DAE Aviation Holdings, Inc. and Standard Aero Ltd., Term Loan B 6.25% 20181,2,5 | 2,265 | 2,299 |
| DAE Aviation Holdings, Inc., Term Loan B2 6.25% 20181,2,5 | 1,027 | 1,042 |
| ABB Finance (USA) Inc. 1.625% 2017 | 9,245 | 9,372 |
| ABB Finance (USA) Inc. 2.875% 2022 | 6,750 | 6,917 |
| BAE Systems Holdings Inc. 4.95% 20144 | 13,505 | 14,191 |
| Raytheon Co. 6.75% 2018 | 4,030 | 5,014 |
| Raytheon Co. 4.40% 2020 | 7,895 | 9,042 |
| Euramax International, Inc. 9.50% 2016 | 13,010 | 12,197 |
| Honeywell International Inc. 5.00% 2019 | 8,725 | 10,343 |
| Hutchison Whampoa International Ltd. 6.50% 20134 | 7,200 | 7,253 |
| BE Aerospace, Inc. 5.25% 2022 | 6,135 | 6,534 |
| Esterline Technologies Corp. 6.625% 2017 | 2,495 | 2,576 |
| Esterline Technologies Corp. 7.00% 2020 | 3,475 | 3,866 |
| Odebrecht Finance Ltd 5.125% 20224 | 720 | 783 |
| Odebrecht Finance Ltd 6.00% 20234 | 420 | 488 |
| Odebrecht Finance Ltd 7.125% 20424 | 3,000 | 3,495 |
| John Deere Capital Corp., Series D, 4.50% 2013 | 2,000 | 2,021 |
| Deere & Co. 2.60% 2022 | 2,600 | 2,635 |
| Precision Castparts Corp. 1.25% 2018 | 1,300 | 1,303 |
| Precision Castparts Corp. 2.50% 2023 | 2,600 | 2,619 |
| Silver II Borrower S.C.A./Silver II U.S. Holdings, LLC 7.75% 20204 | 3,650 | 3,796 |
| RBS Global, Inc. and Rexnord LLC 8.50% 2018 | 2,650 | 2,885 |
| TransDigm Inc. 5.50% 20204 | 2,700 | 2,821 |
| Eaton Corp. 0.638% 20142 | 2,000 | 1,998 |
| Danaher Corp. 2.30% 2016 | 565 | 591 |
| | | 602,729 |
| | | |
| TRANSPORTATION — 1.30% | | |
| Continental Airlines, Inc., Series 1997-1, Class A, 7.461% 20161 | 3,190 | 3,334 |
| Continental Airlines, Inc., Series 2001-1, Class B, 7.373% 20171 | 60 | 63 |
| Continental Airlines, Inc., Series 1998-1, Class B, 6.748% 20181 | 726 | 762 |
| Continental Airlines, Inc., Series 1997-4B, Class B, 6.90% 20181 | 102 | 105 |
| Continental Airlines, Inc., Series 1998-1, Class A, 6.648% 20191 | 12,533 | 13,406 |
| Continental Airlines, Inc., Series 1997-4, Class A, 6.90% 20191 | $15,988 | $ 17,422 |
| Continental Airlines, Inc., Series 2000-2, Class B, 8.307% 20191 | 256 | 273 |
| Continental Airlines, Inc., Series 1999-1, Class A, 6.545% 20201 | 8,151 | 8,935 |
| Continental Airlines, Inc., Series 1999-1, Class B, 6.795% 20201 | 5,886 | 6,173 |
| Continental Airlines, Inc., Series 1999-2, Class A-1, 7.256% 20211 | 260 | 286 |
| United Air Lines, Inc., Series 2007-1, Class B, 7.336% 20211,4 | 779 | 791 |
| Continental Airlines, Inc., Series 1999-2, Class B, 7.566% 20211 | 1,404 | 1,468 |
| Continental Airlines, Inc., Series 2001-1, Class A-1, 6.703% 20221 | 10,800 | 11,826 |
| Continental Airlines, Inc., Series 2007-1, Class B, 6.903% 20221 | 3,776 | 4,038 |
| Continental Airlines, Inc., Series 2000-2, Class A-1, 7.707% 20221 | 12,417 | 14,125 |
| Continental Airlines, Inc., Series 2000-1, Class A-1, 8.048% 20221 | 10,053 | 11,599 |
| Continental Airlines, Inc., Series 2000-1, Class B, 8.388% 20221 | 895 | 958 |
| Union Pacific Corp. 5.125% 2014 | 8,430 | 8,853 |
| Union Pacific Corp. 5.75% 2017 | 12,250 | 14,698 |
| Union Pacific Corp. 4.00% 2021 | 14,000 | 15,707 |
| Union Pacific Corp. 4.163% 2022 | 7,437 | 8,420 |
| Union Pacific Railroad Co. Pass Through Trust, Series 2001-1, 6.63% 20221 | 5,766 | 6,607 |
| Union Pacific Corp. 2.95% 2023 | 4,500 | 4,657 |
| Union Pacific Corp. 6.15% 2037 | 10,930 | 14,282 |
| Burlington Northern Santa Fe LLC 7.00% 2014 | 875 | 934 |
| Burlington Northern Santa Fe LLC 5.65% 2017 | 12,500 | 14,724 |
| Burlington Northern Santa Fe LLC 5.75% 2018 | 9,035 | 10,939 |
| Burlington Northern Santa Fe LLC 3.60% 2020 | 7,500 | 8,129 |
| Burlington Northern Santa Fe LLC 3.45% 2021 | 2,800 | 3,016 |
| Burlington Northern Santa Fe LLC 3.05% 2022 | 22,850 | 23,636 |
| Burlington Northern Santa Fe LLC 5.05% 2041 | 500 | 568 |
| Burlington Northern Santa Fe LLC 4.375% 2042 | 500 | 526 |
| Northwest Airlines, Inc., Term Loan B, 3.81% 20131,2,5 | 1,132 | 1,118 |
| Northwest Airlines, Inc., Term Loan A, 2.06% 20181,2,5 | 50,701 | 47,659 |
| Delta Air Lines, Inc., Series 2002-1, Class G-1, MBIA insured, 6.718% 20241 | 87 | 96 |
| Norfolk Southern Corp. 5.75% 2016 | 5,740 | 6,534 |
| Norfolk Southern Corp. 5.75% 2018 | 5,000 | 5,976 |
| Norfolk Southern Corp. 5.90% 2019 | 9,250 | 11,282 |
| Norfolk Southern Corp. 3.25% 2021 | 2,000 | 2,095 |
| Norfolk Southern Corp. 3.00% 2022 | 16,500 | 16,939 |
| CEVA Group PLC 11.625% 20164 | 5,715 | 5,901 |
| CEVA Group PLC 8.375% 20174 | 1,600 | 1,592 |
| CEVA Group PLC 11.50% 20184 | 5,305 | 4,483 |
| CEVA Group PLC 12.75% 20204 | 27,200 | 20,468 |
| Canadian National Railway Co. 1.45% 2016 | 6,090 | 6,201 |
| Canadian National Railway Co. 5.55% 2018 | 2,000 | 2,405 |
| Canadian National Railway Co. 2.85% 2021 | 10,000 | 10,496 |
| CSX Corp. 5.75% 2013 | 8,385 | 8,472 |
| CSX Corp. 7.375% 2019 | 7,500 | 9,542 |
| United Parcel Service, Inc., 1.125% 2017 | 12,000 | 12,031 |
| AMR Corp. 9.00% 20127 | 1,300 | 1,053 |
| American Airlines, Inc., Series 2011-2, Class A, 8.625% 20231 | 9,871 | 10,260 |
| Navios Maritime Acquisition Corporation and Navios Acquisition Finance (US) Inc. 8.625% 2017 | 7,850 | 7,399 |
| Navios Maritime Holdings Inc. and Navios Maritime Finance II (US) Inc. 8.125% 2019 | 3,925 | 3,434 |
| Navios Logistics Finance (US) Inc., 9.25% 2019 | 375 | 370 |
| Brunswick Rail Finance Ltd. 6.50% 20174 | 4,590 | 4,765 |
| ENA Norte Trust 4.95% 20281,4 | 3,500 | 3,602 |
| TRAC Intermodal 11.00% 20194 | 2,950 | 3,083 |
| CMA CGM 8.50% 20174 | 2,025 | 1,635 |
| ERAC USA Finance Co. 5.625% 20424 | 1,000 | 1,109 |
| | | 441,260 |
| | | |
| COMMERCIAL & PROFESSIONAL SERVICES — 0.07% | | |
| Republic Services, Inc. 3.80% 2018 | 2,000 | 2,201 |
| Republic Services, Inc. 5.00% 2020 | 5,000 | 5,802 |
| Republic Services, Inc. 3.55% 2022 | $ 500 | $ 522 |
| Republic Services, Inc. 5.70% 2041 | 2,000 | 2,394 |
| Waste Management, Inc. 2.60% 2016 | 3,330 | 3,490 |
| Waste Management, Inc. 4.60% 2021 | 5,455 | 6,186 |
| R.R. Donnelley & Sons Co. 6.125% 2017 | 925 | 899 |
| R.R. Donnelley & Sons Co. 7.25% 2018 | 1,875 | 1,819 |
| ADS Waste Escrow, Term Loan B, 5.25% 20191,2,5 | 375 | 380 |
| ADS Waste Escrow 8.25% 20204 | 650 | 686 |
| Nielsen Finance LLC and Nielsen Finance Co. 11.625% 2014 | 211 | 235 |
| | | 24,614 |
| | | |
| CONSUMER DISCRETIONARY — 2.67% | | |
| MEDIA — 1.66% | | |
| Comcast Corp. 6.30% 2017 | 13,410 | 16,463 |
| Comcast Corp. 5.875% 2018 | 18,570 | 22,395 |
| Comcast Corp. 5.15% 2020 | 7,500 | 8,895 |
| Comcast Corp. 3.125% 2022 | 21,510 | 22,430 |
| Comcast Corp. 6.95% 2037 | 12,020 | 16,313 |
| Comcast Corp. 6.40% 2040 | 3,500 | 4,538 |
| Comcast Corp. 4.65% 2042 | 20,625 | 21,761 |
| NBCUniversal Media, LLC 2.10% 2014 | 12,000 | 12,223 |
| NBCUniversal Media, LLC 2.875% 2016 | 17,000 | 17,932 |
| NBCUniversal Media, LLC 5.15% 2020 | 7,000 | 8,304 |
| NBCUniversal Media, LLC 4.375% 2021 | 14,250 | 16,020 |
| NBCUniversal Media, LLC 2.875% 2023 | 25,730 | 25,864 |
| NBCUniversal Media, LLC 4.45% 2043 | 6,100 | 6,183 |
| Time Warner Inc. 5.875% 2016 | 19,170 | 22,459 |
| Time Warner Companies, Inc. 7.25% 2017 | 1,600 | 2,011 |
| Time Warner Inc. 4.75% 2021 | 11,090 | 12,754 |
| Time Warner Inc. 3.40% 2022 | 2,500 | 2,610 |
| Time Warner Companies, Inc. 7.57% 2024 | 12,340 | 16,641 |
| Time Warner Inc. 6.20% 2040 | 9,450 | 11,583 |
| Time Warner Inc. 6.25% 2041 | 5,800 | 7,168 |
| Time Warner Inc. 4.90% 2042 | 3,000 | 3,221 |
| Time Warner Cable Inc. 6.20% 2013 | 5,700 | 5,857 |
| Time Warner Cable Inc. 7.50% 2014 | 10,175 | 11,028 |
| Time Warner Cable Inc. 6.75% 2018 | 13,650 | 17,065 |
| Time Warner Cable Inc. 8.25% 2019 | 7,215 | 9,607 |
| Time Warner Cable Inc. 4.00% 2021 | 10,280 | 11,293 |
| Time Warner Cable Inc. 6.75% 2039 | 5,150 | 6,538 |
| Thomson Reuters Corp. 6.50% 2018 | 29,355 | 36,715 |
| News America Inc. 8.00% 2016 | 1,000 | 1,233 |
| News America Inc. 6.90% 2019 | 12,750 | 15,988 |
| News America Inc. 3.00% 20224 | 6,000 | 6,033 |
| News America Inc. 6.15% 2037 | 300 | 369 |
| News America Inc. 6.65% 2037 | 7,800 | 10,087 |
| Cox Communications, Inc. 5.45% 2014 | 3,773 | 4,117 |
| Cox Communications, Inc. 9.375% 20194 | 6,225 | 8,564 |
| Cox Communications, Inc. 3.25% 20224 | 16,895 | 17,439 |
| Walt Disney Co. 0.875% 2014 | 14,000 | 14,122 |
| Walt Disney Co. 1.10% 2017 | 9,800 | 9,829 |
| WPP Finance 2010 4.75% 2021 | 15,840 | 17,170 |
| WPP Finance 2010 5.125% 2042 | 1,300 | 1,272 |
| Virgin Media Finance PLC 8.375% 20194 | 8,050 | 9,177 |
| Virgin Media Secured Finance PLC 5.25% 2021 | 1,775 | 2,074 |
| Virgin Media Finance PLC 4.875% 2022 | 2,400 | 2,466 |
| DISH DBS Corp. 4.625% 2017 | 7,005 | 7,338 |
| DISH DBS Corp 6.75% 2021 | 4,075 | 4,666 |
| DISH DBS Corp. 5.875% 2022 | 1,000 | 1,080 |
| Mediacom LLC and Mediacom Capital Corp. 9.125% 2019 | 9,000 | 10,013 |
| CBS Corp. 1.95% 2017 | $8,500 | $ 8,666 |
| Univision Communications Inc., Term Loan B, 4.462% 20171,2,5 | 5,113 | 5,039 |
| Univision Communications Inc. 8.50% 20214 | 2,240 | 2,324 |
| Omnicom Group Inc. 3.625% 2022 | 6,500 | 6,777 |
| Grupo Televisa, SAB 6.625% 2040 | 5,200 | 6,668 |
| Cequel Communications Holdings I, LLC and Cequel Capital Corp. 6.375% 20204 | 5,350 | 5,597 |
| Quebecor Media Inc. 5.75% 20234 | 4,375 | 4,632 |
| Warner Music Group 6.00% 20214 | 2,800 | 2,968 |
| UPC Germany GmbH 9.625% 2019 | €1,250 | 1,868 |
| | | 563,447 |
| | | |
| CONSUMER SERVICES — 0.45% | | |
| MGM Resorts International 5.875% 2014 | $34,190 | 35,729 |
| MGM Resorts International 6.625% 2015 | 2,600 | 2,802 |
| MGM Resorts International 6.625% 2021 | 1,650 | 1,652 |
| Boyd Gaming Corp. 6.75% 2014 | 10,830 | 10,830 |
| Boyd Gaming Corp. 7.125% 2016 | 10,285 | 10,131 |
| Boyd Gaming Corp. 9.125% 2018 | 3,920 | 4,018 |
| Revel Entertainment, Term Loan B, 9.00% 20171,2,5 | 26,513 | 13,831 |
| Mohegan Tribal Gaming Authority 10.50% 20164 | 6,375 | 6,311 |
| Mohegan Tribal Gaming Authority 11.00% 20182,4,6 | 6,750 | 5,383 |
| Caesars Entertainment Operating Co. 11.25% 2017 | 6,890 | 7,415 |
| Caesars Entertainment Operating Co. 9.00% 20204 | 3,375 | 3,392 |
| Seminole Tribe of Florida 5.798% 20131,4 | 2,270 | 2,316 |
| Seminole Tribe of Florida 7.804% 20201,4 | 7,115 | 7,317 |
| CityCenter Holdings, LLC and CityCenter Finance Corp. 7.625% 2016 | 6,910 | 7,428 |
| NCL Corp. Ltd. 11.75% 2016 | 3,000 | 3,405 |
| NCL Corp. Ltd. 9.50% 2018 | 3,125 | 3,484 |
| Burger King Corp 0%/11.00% 20194,8 | 8,075 | 6,844 |
| Royal Caribbean Cruises Ltd. 11.875% 2015 | 5,150 | 6,257 |
| Laureate Education, Inc. 9.25% 20194 | 5,625 | 5,906 |
| Seneca Gaming Corp. 8.25% 20184 | 2,775 | 2,942 |
| Marina District Finance Co., Inc. 9.50% 2015 | 2,000 | 1,950 |
| Education Management LLC and Education Management Finance Corp. 8.75% 2014 | 2,025 | 1,635 |
| Circus and Eldorado Joint Venture and Silver Legacy Resort Casino 10.00% 20182,6 | 1,449 | 1,215 |
| | | 152,193 |
| | | |
| RETAILING — 0.28% | | |
| Staples, Inc. 9.75% 2014 | 23,470 | 25,523 |
| Nordstrom, Inc. 6.75% 2014 | 18,975 | 20,591 |
| Toys “R” Us-Delaware, Inc., Term Loan B, 6.00% 20161,2,5 | 4,252 | 4,138 |
| Toys “R” Us Property Co. II, LLC 8.50% 2017 | 7,275 | 7,748 |
| Toys “R” Us Property Co. I, LLC 10.75% 2017 | 650 | 704 |
| Neiman Marcus Group, Inc., Term Loan B, 4.75% 20181,2,5 | 12,335 | 12,375 |
| Macy’s Retail Holdings, Inc. 7.875% 20152 | 9,891 | 11,528 |
| Home Depot, Inc. 4.40% 2021 | 7,500 | 8,852 |
| Target Corp. 0.495% 20142 | 2,000 | 2,007 |
| Lowe’s Companies, Inc. 3.12% 2022 | 1,500 | 1,580 |
| | | 95,046 |
| | | |
| AUTOMOBILES & COMPONENTS — 0.25% | | |
| DaimlerChrysler North America Holding Corp. 6.50% 2013 | 16,775 | 17,613 |
| DaimlerChrysler North America Holding Corp. 1.30% 20154 | 11,000 | 11,070 |
| DaimlerChrysler North America Holding Corp. 2.625% 20164 | 15,050 | 15,647 |
| Daimler Finance NA LLC 3.00% 20164 | 2,000 | 2,093 |
| DaimlerChrysler North America Holding Corp. 8.50% 2031 | 7,250 | 11,292 |
| Volkswagen International Finance NV 0.97% 20142,4 | 12,000 | 12,042 |
| Volkswagen International Finance NV 2.875% 20164 | 1,000 | 1,050 |
| Volkswagen International Finance NV 4.00% 20204 | 11,650 | 12,976 |
| Dynacast International LLC 9.25% 2019 | 2,325 | 2,499 |
| | | 86,282 |
| CONSUMER DURABLES & APPAREL — 0.03% | | |
| Mattel, Inc. 2.50% 2016 | $ 5,000 | $ 5,204 |
| Jarden Corp. 8.00% 2016 | 3,020 | 3,224 |
| | | 8,428 |
| | | |
| UTILITIES — 2.40% | | |
| Consumers Energy Co., First Mortgage Bonds, 5.15% 2017 | 11,574 | 13,431 |
| Consumers Energy Co. 5.65% 2018 | 6,075 | 7,429 |
| Consumers Energy Co., First Mortgage Bonds, 6.125% 2019 | 33,202 | 41,556 |
| Consumers Energy Co., First Mortgage Bonds, 6.70% 2019 | 1,898 | 2,471 |
| Consumers Energy Co. 5.65% 2020 | 2,090 | 2,583 |
| Consumers Energy Co. 2.85% 2022 | 22,062 | 22,824 |
| National Rural Utilities Cooperative Finance Corp. 5.50% 2013 | 21,750 | 22,299 |
| National Rural Utilities Cooperative Finance Corp. 10.375% 2018 | 41,425 | 61,284 |
| MidAmerican Energy Co. 4.65% 2014 | 5,000 | 5,339 |
| MidAmerican Energy Holdings Co., Series D, 5.00% 2014 | 225 | 236 |
| MidAmerican Energy Holdings Co. 5.75% 2018 | 37,700 | 45,436 |
| PacifiCorp., First Mortgage Bonds, 2.95% 2022 | 10,000 | 10,459 |
| Niagara Mohawk Power 3.553% 20144 | 14,850 | 15,537 |
| National Grid PLC 6.30% 2016 | 37,605 | 43,657 |
| National Grid Co. PLC 5.875% 2024 | £170 | 341 |
| CenterPoint Energy Resources Corp. 4.50% 2021 | $41,336 | 47,045 |
| Public Service Co. of Colorado 5.80% 2018 | 9,606 | 11,780 |
| Public Service Co. of Colorado 5.125% 2019 | 4,350 | 5,241 |
| Public Service Co. of Colorado 3.20% 2020 | 5,000 | 5,459 |
| Xcel Energy Inc. 4.70% 2020 | 2,500 | 2,926 |
| Northern States Power Co., First Mortgage Bonds, 2.15% 2022 | 8,945 | 8,841 |
| Northern States Power Co., First Mortgage Bonds, 7.125% 2025 | 6,842 | 9,560 |
| Public Service Co. of Colorado 3.60% 2042 | 2,200 | 2,138 |
| Teco Finance, Inc. 6.75% 2015 | 15,546 | 17,509 |
| Teco Finance, Inc. 4.00% 2016 | 3,333 | 3,565 |
| Teco Finance, Inc. 6.572% 2017 | 4,514 | 5,448 |
| Teco Finance, Inc. 5.15% 2020 | 8,949 | 10,416 |
| Tampa Electric Co. 2.60% 2022 | 1,900 | 1,919 |
| Tampa Electric Co. 4.10% 2042 | 5,060 | 5,311 |
| Iberdrola Finance Ireland 3.80% 20144 | 15,069 | 15,484 |
| Scottish Power PLC 5.375% 2015 | 15,000 | 16,091 |
| TXU, Term Loan, 4.713% 20171,2,5 | 32,068 | 21,595 |
| Texas Competitive Electric Holdings Co. LLC, 11.50% 20204 | 12,560 | 9,891 |
| Ohio Edison Co. 6.40% 2016 | 6,260 | 7,347 |
| Cleveland Electric Illuminating Co. 8.875% 2018 | 12,864 | 17,147 |
| Toledo Edison Co. 7.25% 2020 | 5,025 | 6,392 |
| Ohio Power Co., Series H, 4.85% 2014 | 5,965 | 6,215 |
| American Electric Power Co. 1.65% 2017 | 10,195 | 10,239 |
| American Electric Power Co. 2.95% 2022 | 12,905 | 12,921 |
| Abu Dhabi National Energy Co. PJSC (TAQA) 6.165% 20174 | 12,000 | 14,100 |
| Abu Dhabi National Energy Co. PJSC (TAQA) 6.165% 2017 | 2,700 | 3,173 |
| Abu Dhabi National Energy Co. PJSC (TAQA) 5.875% 20214 | 3,055 | 3,661 |
| Abu Dhabi National Energy Co. PJSC (TAQA) 3.625% 20234 | 610 | 631 |
| Abu Dhabi National Energy Co. PJSC (TAQA) 6.50% 20364 | 2,000 | 2,675 |
| Abu Dhabi National Energy Co. PJSC (TAQA) 6.50% 2036 | 1,500 | 2,006 |
| Progress Energy, Inc. 6.05% 2014 | 2,100 | 2,229 |
| Progress Energy, Inc. 7.05% 2019 | 8,840 | 11,116 |
| Carolina Power & Light Co. d/b/a Progress Energy Carolinas, Inc. 2.80% 2022 | 6,000 | 6,198 |
| Progress Energy, Inc. 7.00% 2031 | 750 | 967 |
| Progress Energy, Inc. 7.75% 2031 | 3,920 | 5,359 |
| E.ON International Finance BV 5.80% 20184 | 20,500 | 24,933 |
| Sierra Pacific Power Co., General and Refunding Mortgage Notes, Series Q, 5.45% 2013 | 4,275 | 4,413 |
| Nevada Power Co., General and Refunding Mortgage Notes, Series M, 5.95% 2016 | 1,000 | 1,147 |
| Nevada Power Co., General and Refunding Mortgage Notes, Series S, 6.50% 2018 | 12,165 | 15,334 |
| Nevada Power Co., General and Refunding Mortgage Notes, Series V, 7.125% 2019 | $ 2,050 | $ 2,630 |
| Virginia Electric and Power Co., Series B, 5.95% 2017 | 10,000 | 12,226 |
| Virginia Electric and Power Co. 2.95% 2022 | 8,000 | 8,432 |
| AES Corp. 7.75% 2015 | 6,575 | 7,413 |
| AES Corp. 8.00% 2020 | 8,350 | 9,644 |
| Entergy Corp. 4.70% 2017 | 14,900 | 16,151 |
| Veolia Environnement 6.00% 2018 | 11,445 | 13,429 |
| Veolia Environnement 6.125% 2033 | €1,075 | 1,848 |
| PG&E Corp. 5.75% 2014 | $ 2,000 | 2,120 |
| Pacific Gas and Electric Co. 8.25% 2018 | 4,000 | 5,451 |
| Pacific Gas and Electric Co. 2.45% 2022 | 7,500 | 7,497 |
| CEZ, a s 4.25% 20224 | 8,480 | 9,120 |
| Empresa Nacional de Electricidad SA 8.35% 2013 | 5,000 | 5,204 |
| Empresa Nacional de Electricidad SA 8.625% 2015 | 3,000 | 3,524 |
| SP PowerAssets Ltd. 5.00% 20134 | 8,000 | 8,259 |
| Midwest Generation, LLC, Series B, 8.56% 20161 | 7,968 | 7,809 |
| Consolidated Edison Company of New York, Inc., Series 2012 A, 4.20% 2042 | 6,470 | 6,903 |
| PSEG Power LLC 2.75% 2016 | 3,140 | 3,269 |
| Public Service Electric and Gas Co., Series E, 5.30% 2018 | 2,190 | 2,631 |
| Public Service Electric and Gas Co., Series H, 3.65% 2042 | 600 | 591 |
| Israel Electric Corp. Ltd. 8.10% 20964 | 6,250 | 6,121 |
| Colbun SA 6.00% 20204 | 5,400 | 6,029 |
| Wisconsin Electric Power Co. 2.95% 2021 | 3,000 | 3,144 |
| Wisconsin Electric Power Co. 3.65% 2042 | 1,000 | 979 |
| Enel Finance International SA 3.875% 20144 | 3,235 | 3,332 |
| Electricité de France SA 5.50% 20144 | 3,000 | 3,152 |
| NRG Energy, Inc. 7.875% 2021 | 2,250 | 2,509 |
| Tri-State Generation and Transmission Assn. Inc., Pass Through Trust, Series 2003-A, 6.04% 20181,4 | 1,858 | 2,004 |
| | | 814,725 |
| | | |
| CONSUMER STAPLES — 2.17% | | |
| FOOD, BEVERAGE & TOBACCO — 1.63% | | |
| Anheuser-Busch InBev NV 2.50% 2013 | 3,000 | 3,014 |
| Anheuser-Busch InBev NV 0.70% 20142 | 8,710 | 8,746 |
| Anheuser-Busch InBev NV 3.625% 2015 | 25,250 | 26,956 |
| Anheuser-Busch InBev NV 4.125% 2015 | 32,375 | 34,610 |
| Anheuser-Busch InBev NV 1.375% 2017 | 12,505 | 12,646 |
| Anheuser-Busch InBev NV 8.625% 2017 | €2,500 | 4,345 |
| Anheuser-Busch InBev NV 6.875% 2019 | $ 6,740 | 8,856 |
| Anheuser-Busch InBev NV 7.75% 2019 | 16,250 | 21,716 |
| Anheuser-Busch InBev NV 2.50% 2022 | 6,420 | 6,466 |
| Anheuser-Busch InBev NV 3.75% 2042 | 5,400 | 5,431 |
| SABMiller Holdings Inc. 1.85% 20154 | 2,000 | 2,040 |
| SABMiller Holdings Inc. 2.45% 20174 | 47,360 | 49,400 |
| SABMiller Holdings Inc. 3.75% 20224 | 15,500 | 16,752 |
| SABMiller Holdings Inc. 4.95% 20424 | 3,500 | 3,971 |
| Coca-Cola Co. 1.50% 2015 | 18,970 | 19,439 |
| Coca-Cola Co. 1.80% 2016 | 21,315 | 22,026 |
| Coca-Cola Co. 3.15% 2020 | 8,690 | 9,464 |
| Kraft Foods Inc. 1.625% 20154 | 9,120 | 9,288 |
| Kraft Foods Inc. 2.25% 20174 | 8,050 | 8,332 |
| Kraft Foods Inc. 3.50% 20224 | 24,180 | 25,832 |
| Kraft Foods Inc. 6.50% 20404 | 3,000 | 3,947 |
| Kraft Foods Inc. 5.00% 20424 | 3,000 | 3,377 |
| British American Tobacco International Finance PLC 2.125% 20174 | 23,125 | 23,712 |
| British American Tobacco International Finance PLC 9.50% 20184 | 13,000 | 18,092 |
| Pernod Ricard SA 2.95% 20174 | 16,000 | 16,839 |
| Pernod Ricard SA 4.45% 20224 | 15,000 | 16,603 |
| Pernod Ricard SA 5.50% 20424 | 3,000 | 3,499 |
| Altria Group, Inc. 9.25% 2019 | 4,392 | 6,113 |
| Altria Group, Inc. 4.75% 2021 | $ 2,000 | $ 2,268 |
| Altria Group, Inc. 2.85% 2022 | 6,800 | 6,735 |
| Altria Group, Inc. 9.95% 2038 | 6,350 | 10,469 |
| Altria Group, Inc. 10.20% 2039 | 4,000 | 6,696 |
| Altria Group, Inc. 4.25% 2042 | 3,000 | 2,912 |
| PepsiCo, Inc. 3.10% 2015 | 17,000 | 17,850 |
| PepsiCo, Inc. 2.50% 2016 | 7,500 | 7,903 |
| Reynolds American Inc. 3.25% 2022 | 21,895 | 22,014 |
| Reynolds American Inc. 4.75% 2042 | 3,000 | 3,030 |
| Philip Morris International Inc. 1.125% 2017 | 4,000 | 3,990 |
| Philip Morris International Inc. 1.625% 2017 | 4,000 | 4,088 |
| Philip Morris International Inc. 2.90% 2021 | 9,200 | 9,577 |
| Philip Morris International Inc. 2.50% 2022 | 3,600 | 3,620 |
| Philip Morris International Inc. 4.375% 2041 | 2,000 | 2,146 |
| Kraft Foods Inc. 2.625% 2013 | 3,830 | 3,855 |
| Kraft Foods Inc. 6.125% 2018 | 6,000 | 7,306 |
| Kraft Foods Inc. 5.375% 2020 | 2,500 | 3,020 |
| Heineken NV 1.40% 20174 | 13,335 | 13,305 |
| Brown-Forman Corp. 1.00% 2018 | 3,000 | 2,986 |
| Brown-Forman Corp. 2.25% 2023 | 5,100 | 5,039 |
| Brown-Forman Corp. 3.75% 2043 | 960 | 965 |
| Fortune Brands, Inc. 6.375% 2014 | 6,467 | 6,973 |
| Del Monte Corp. 7.625% 2019 | 4,000 | 4,190 |
| BFF International Ltd. 7.25% 20204 | 2,500 | 3,000 |
| Smithfield Foods, Inc. 7.75% 2017 | 750 | 878 |
| Smithfield Foods, Inc. 6.625% 2022 | 1,370 | 1,517 |
| CEDC Finance Corp. 9.125% 20164 | 3,500 | 2,275 |
| Constellation Brands, Inc. 8.375% 2014 | 550 | 617 |
| Constellation Brands, Inc. 7.25% 2017 | 750 | 887 |
| TreeHouse Foods, Inc. 7.75% 2018 | 1,200 | 1,305 |
| Cott Beverages Inc. 8.375% 2017 | 1,000 | 1,093 |
| Tyson Foods, Inc. 6.60% 20162 | 500 | 575 |
| | | 554,596 |
| | | |
| FOOD & STAPLES RETAILING — 0.53% | | |
| Kroger Co. 5.00% 2013 | 18,000 | 18,231 |
| Kroger Co. 7.50% 2014 | 6,500 | 6,955 |
| Kroger Co. 3.90% 2015 | 10,000 | 10,798 |
| Kroger Co. 6.40% 2017 | 23,450 | 28,324 |
| Wal-Mart Stores, Inc. 2.875% 2015 | 11,550 | 12,141 |
| Wal-Mart Stores, Inc. 2.80% 2016 | 11,500 | 12,271 |
| Wal-Mart Stores, Inc. 5.80% 2018 | 11,095 | 13,602 |
| Rite Aid Corp. 9.75% 2016 | 18,550 | 20,173 |
| Rite Aid Corp. 10.25% 2019 | 40 | 46 |
| Rite Aid Corp. 8.00% 2020 | 2,075 | 2,381 |
| Delhaize Group 6.50% 2017 | 16,205 | 18,407 |
| Tesco PLC 5.50% 20174 | 12,459 | 14,702 |
| SUPERVALU Inc. 7.50% 2014 | 11,345 | 11,061 |
| Safeway Inc. 5.00% 2019 | 6,000 | 6,459 |
| Safeway Inc. 3.95% 2020 | 4,000 | 4,004 |
| | | 179,555 |
| | | |
| HOUSEHOLD & PERSONAL PRODUCTS — 0.01% | | |
| Procter & Gamble Co. 3.50% 2015 | 150 | 159 |
| Procter & Gamble Co. 1.45% 2016 | 2,645 | 2,697 |
| | | 2,856 |
| | | |
| TELECOMMUNICATION SERVICES — 1.83% | | |
| Verizon Communications Inc. 0.70% 2015 | 13,000 | 13,011 |
| Verizon Communications Inc. 3.00% 2016 | 24,000 | 25,569 |
| Verizon Communications Inc. 1.10% 2017 | $13,000 | $ 12,952 |
| Verizon Communications Inc. 8.50% 2018 | 8,000 | 11,015 |
| Verizon Communications Inc. 8.75% 2018 | 7,888 | 10,961 |
| Verizon Communications Inc. 2.45% 2022 | 16,500 | 16,521 |
| SBC Communications Inc. 5.625% 2016 | 22,575 | 25,925 |
| AT&T Inc. 1.40% 2017 | 38,030 | 38,068 |
| AT&T Inc. 2.625% 2022 | 14,200 | 14,237 |
| Telecom Italia Capital SA 5.25% 2015 | 9,124 | 9,731 |
| Telecom Italia Capital SA 6.999% 2018 | 20,100 | 23,075 |
| Telecom Italia Capital SA 7.175% 2019 | 20,787 | 24,227 |
| Telecom Italia Capital SA 7.20% 2036 | 3,179 | 3,335 |
| Telecom Italia Capital SA 7.721% 2038 | 8,380 | 9,113 |
| Deutsche Telekom International Finance BV 4.875% 2014 | 16,250 | 17,200 |
| Deutsche Telekom International Finance BV 3.125% 20164 | 12,175 | 12,885 |
| Deutsche Telekom International Finance BV 2.25% 20174 | 5,500 | 5,644 |
| Deutsche Telekom International Finance BV 9.25% 2032 | 10,917 | 17,449 |
| Deutsche Telekom International Finance BV 4.875% 20424 | 4,352 | 4,650 |
| Clearwire Communications and Clearwire Finance, Inc., Series A, 12.00% 20154 | 26,195 | 28,291 |
| Clearwire Communications and Clearwire Finance, Inc., Series B, 12.00% 20154 | 20,200 | 21,816 |
| Clearwire Communications and Clearwire Finance, Inc. 14.75% 20164 | 1,925 | 2,652 |
| Clearwire Communications and Clearwire Finance, Inc. 12.00% 20174 | 2,735 | 3,241 |
| Koninklijke KPN NV 8.375% 2030 | 31,280 | 41,306 |
| Wind Acquisition SA 11.75% 20174 | 27,212 | 28,641 |
| Wind Acquisition SA 7.25% 20184 | 7,025 | 7,148 |
| Sprint Nextel Corp. 8.375% 2017 | 2,500 | 2,919 |
| Sprint Nextel Corp. 9.125% 2017 | 9,250 | 10,938 |
| Sprint Nextel Corp. 7.00% 2020 | 9,000 | 9,878 |
| Sprint Nextel Corp. 11.50% 2021 | 8,550 | 11,660 |
| Frontier Communications Corp. 8.25% 2017 | 14,620 | 16,959 |
| Frontier Communications Corp. 8.125% 2018 | 1,500 | 1,733 |
| Frontier Communications Corp. 8.50% 2020 | 2,950 | 3,407 |
| Frontier Communications Corp. 9.25% 2021 | 2,450 | 2,885 |
| Frontier Communications Corp. 8.75% 2022 | 1,275 | 1,485 |
| Frontier Communications Corp. 7.125% 2023 | 4,575 | 4,867 |
| Telefónica Emisiones, SAU 3.992% 2016 | 19,845 | 20,698 |
| Telefónica Emisiones, SAU 5.134% 2020 | 3,604 | 3,798 |
| Telefónica Emisiones, SAU 5.462% 2021 | 5,297 | 5,661 |
| France Télécom 4.375% 2014 | 11,440 | 12,044 |
| France Télécom 2.125% 2015 | 8,830 | 9,087 |
| France Télécom 4.125% 2021 | 2,525 | 2,785 |
| LightSquared, Term Loan B, 12.00% 20141,5,6,7 | 18,669 | 15,915 |
| América Móvil, SAB de CV 2.375% 2016 | 3,000 | 3,132 |
| América Móvil, SAB de CV 5.00% 2020 | 6,700 | 7,822 |
| América Móvil, SAB de CV 8.46% 2036 | MXN27,000 | 2,310 |
| Cricket Communications, Inc. 7.75% 2016 | $ 9,175 | 9,760 |
| Cricket Communications, Inc. 7.75% 2020 | 1,900 | 1,947 |
| Vodafone Group PLC, Term Loan B, 6.875% 20151,5,6 | 5,095 | 5,260 |
| Vodafone Group PLC, Term Loan B, 6.25% 20161,3,5,6 | 5,491 | 5,670 |
| Digicel Group Ltd. 12.00% 20144 | 5,000 | 5,438 |
| Digicel Group Ltd. 8.25% 20204 | 4,950 | 5,470 |
| Trilogy International Partners, LLC, 10.25% 20164 | 9,250 | 8,186 |
| Level 3 Communications, Inc. 11.875% 2019 | 1,000 | 1,157 |
| tw telecom holdings inc. 5.375% 20224 | 775 | 815 |
| Syniverse Holdings, Inc. 9.125% 2019 | 500 | 536 |
| | | 622,885 |
| | | |
| MATERIALS — 1.72% | | |
| Rio Tinto Finance (USA) Ltd. 8.95% 2014 | 5,000 | 5,530 |
| Rio Tinto Finance (USA) Ltd. 2.25% 2016 | 10,500 | 10,900 |
| Rio Tinto Finance (USA) Ltd. 2.50% 2016 | 14,650 | 15,302 |
| Rio Tinto Finance (USA) Ltd. 1.625% 2017 | $30,600 | $31,006 |
| Rio Tinto Finance (USA) Ltd. 9.00% 2019 | 11,170 | 15,351 |
| Rio Tinto Finance (USA) Ltd. 2.875% 2022 | 14,510 | 14,619 |
| ArcelorMittal 5.375% 2013 | 6,500 | 6,566 |
| ArcelorMittal 4.25% 20152 | 16,000 | 16,170 |
| ArcelorMittal 5.00% 20172 | 13,065 | 13,196 |
| ArcelorMittal 10.35% 20192 | 2,500 | 3,000 |
| ArcelorMittal 6.00% 20212 | 18,440 | 18,400 |
| ArcelorMittal 6.75% 20222 | 9,700 | 10,188 |
| ArcelorMittal 7.25% 20412 | 18,548 | 17,215 |
| Xstrata Canada Financial Corp. 1.80% 20154 | 2,000 | 2,012 |
| Xstrata Canada Financial Corp. 3.60% 20174 | 12,500 | 13,172 |
| Xstrata Canada Financial Corp. 4.95% 20214 | 18,750 | 20,155 |
| Xstrata Canada Financial Corp. 4.00% 20224 | 12,600 | 12,747 |
| International Paper Co. 7.40% 2014 | 24,650 | 26,707 |
| International Paper Co. 7.95% 2018 | 8,300 | 10,739 |
| International Paper Co. 4.75% 2022 | 1,500 | 1,699 |
| Reynolds Group Inc. 8.50% 2018 | 390 | 402 |
| Reynolds Group Inc. 7.875% 2019 | 2,605 | 2,911 |
| Reynolds Group Inc. 9.875% 2019 | 12,160 | 13,072 |
| Reynolds Group Inc. 5.75% 20204 | 21,370 | 22,118 |
| Newcrest Finance Pty Ltd. 4.45% 20214 | 22,785 | 24,004 |
| Newcrest Finance Pty Ltd. 4.20% 20224 | 8,410 | 8,657 |
| Newcrest Finance Pty Ltd. 5.75% 20414 | 3,000 | 3,318 |
| Cliffs Natural Resources Inc. 4.875% 2021 | 28,670 | 28,495 |
| Cliffs Natural Resources Inc. 6.25% 2040 | 1,725 | 1,683 |
| Teck Resources Ltd. 3.15% 2017 | 1,555 | 1,631 |
| Teck Resources Ltd. 4.75% 2022 | 13,360 | 14,714 |
| Teck Resources Ltd. 6.25% 2041 | 6,750 | 7,947 |
| Dow Chemical Co. 7.60% 2014 | 8,679 | 9,479 |
| Dow Chemical Co. 5.70% 2018 | 3,500 | 4,166 |
| Dow Chemical Co. 3.00% 2022 | 7,500 | 7,490 |
| CEMEX Finance LLC 9.50% 2016 | 5,925 | 6,473 |
| CEMEX Finance LLC 9.50% 20164 | 5,200 | 5,681 |
| CEMEX España, SA 9.25% 20204 | 1,126 | 1,233 |
| CEMEX Finance LLC 9.375% 20224 | 5,175 | 5,848 |
| BHP Billiton Finance (USA) Ltd. 5.50% 2014 | 8,795 | 9,345 |
| BHP Billiton Finance (USA) Ltd. 1.00% 2015 | 5,000 | 5,039 |
| BHP Billiton Finance (USA) Ltd. 1.625% 2017 | 3,000 | 3,070 |
| Inmet Mining Corp. 8.75% 20204 | 11,675 | 12,813 |
| Inmet Mining Corp. 7.50% 20214 | 4,000 | 4,170 |
| Sherwin-Williams Co. 1.35% 2017 | 13,600 | 13,581 |
| Praxair, Inc. 4.375% 2014 | 200 | 210 |
| Praxair, Inc. 4.625% 2015 | 500 | 545 |
| Praxair, Inc. 1.05% 2017 | 11,000 | 11,011 |
| Georgia Gulf Corp. 9.00% 20174 | 9,976 | 11,148 |
| Ecolab Inc. 3.00% 2016 | 7,320 | 7,784 |
| Ecolab Inc. 4.35% 2021 | 1,000 | 1,117 |
| Ecolab Inc. 5.50% 2041 | 1,250 | 1,493 |
| Newpage Corp., Term Loan B, 7.75% 20191,2,5 | 7,480 | 7,480 |
| MacDermid 9.50% 20174 | 5,870 | 6,141 |
| JMC Steel Group Inc. 8.25% 20184 | 5,750 | 6,037 |
| Walter Energy, Inc. 9.875% 20204 | 4,835 | 5,415 |
| Taminco Global Chemical Corp. 9.75% 20204 | 4,500 | 4,950 |
| Ball Corp. 7.125% 2016 | 1,270 | 1,365 |
| Ball Corp. 5.75% 2021 | 1,850 | 2,012 |
| Ball Corp. 5.00% 2022 | 1,405 | 1,510 |
| FMG Resources 7.00% 20154 | 3,000 | 3,165 |
| FMG Resources, Term Loan, 5.25% 20171,2,5 | 1,232 | 1,244 |
| Smurfit Capital Funding PLC 7.50% 2025 | 3,345 | 3,521 |
| Georgia-Pacific Corp. 5.40% 20204 | $ 2,775 | $ 3,304 |
| Barrick Gold Corp. 3.85% 2022 | 3,000 | 3,178 |
| Yara International ASA 7.875% 20194 | 2,175 | 2,795 |
| AngloGold Ashanti Holdings PLC 5.125% 2022 | 2,600 | 2,637 |
| PQ Corp. 8.75% 20184 | 2,375 | 2,506 |
| Airgas, Inc. 7.125% 2018 | 2,000 | 2,114 |
| ICI Wilmington, Inc. 5.625% 2013 | 2,000 | 2,089 |
| OMNOVA Solutions Inc. 7.875% 2018 | 2,000 | 2,073 |
| Potash Corp. of Saskatchewan Inc. 5.875% 2036 | 1,250 | 1,553 |
| Packaging Dynamics Corp. 8.75% 20164 | 1,430 | 1,501 |
| Consolidated Minerals Ltd. 8.875% 20164 | 825 | 714 |
| E.I. du Pont de Nemours and Co. 5.25% 2016 | 500 | 578 |
| | | 583,204 |
| | | |
| INFORMATION TECHNOLOGY — 0.95% | | |
| SOFTWARE & SERVICES — 0.72% | | |
| International Business Machines Corp. 0.75% 2015 | 16,510 | 16,620 |
| International Business Machines Corp. 1.95% 2016 | 12,105 | 12,588 |
| International Business Machines Corp. 2.00% 2016 | 28,500 | 29,463 |
| International Business Machines Corp. 1.875% 2019 | 12,000 | 12,188 |
| International Business Machines Corp. 1.875% 2022 | 9,420 | 9,074 |
| International Business Machines Corp. 4.00% 2042 | 5,002 | 5,300 |
| First Data Corp. 9.875% 2015 | 821 | 841 |
| First Data Corp. 10.55% 20156 | 4,371 | 4,497 |
| First Data Corp. 11.25% 2016 | 51,360 | 50,590 |
| First Data Corp., Term Loan D, 5.211% 20171,2,5 | 3,022 | 2,978 |
| First Data Corp. 8.25% 20214 | 2,843 | 2,857 |
| First Data Corp. 12.625% 2021 | 6,545 | 6,921 |
| First Data Corp. 8.75% 20222,4,6 | 10,627 | 10,919 |
| Oracle Corp. 1.20% 2017 | 20,510 | 20,587 |
| Oracle Corp. 2.50% 2022 | 17,200 | 17,371 |
| SRA International, Inc., Term Loan B, 6.50% 20181,2,5 | 12,162 | 11,630 |
| SRA International, Inc. 11.00% 2019 | 12,080 | 12,382 |
| SunGard Data Systems Inc. 7.375% 2018 | 2,990 | 3,218 |
| SunGard Data Systems Inc., Term Loan B, 4.50% 20191,2,5 | 1,375 | 1,390 |
| SunGard Data Systems Inc. 7.625% 2020 | 4,761 | 5,225 |
| Blackboard Inc., Term Loan B, 7.50% 20181,2,5 | 4,516 | 4,570 |
| eBay Inc. 1.35% 2017 | 2,300 | 2,328 |
| | | 243,537 |
| | | |
| TECHNOLOGY HARDWARE & EQUIPMENT — 0.13% | | |
| Xerox Corp. 6.40% 2016 | 768 | 866 |
| Xerox Corp. 2.95% 2017 | 21,035 | 21,597 |
| Cisco Systems, Inc. 2.90% 2014 | 10,125 | 10,572 |
| Jabil Circuit, Inc. 8.25% 2018 | 5,850 | 7,137 |
| Jabil Circuit, Inc. 4.70% 2022 | 700 | 739 |
| Hewlett-Packard Co. 0.711% 20142 | 2,000 | 1,961 |
| Hughes Satellite Systems Corp. 7.625% 2021 | 575 | 657 |
| | | 43,529 |
| | | |
| SEMICONDUCTORS & SEMICONDUCTOR EQUIPMENT — 0.10% | | |
| Freescale Semiconductor, Inc. 9.25% 20184 | 6,250 | 6,859 |
| Freescale Semiconductor, Inc., Term Loan B, 6.00% 20191,2,5 | 11,662 | 11,604 |
| Samsung Electronics America, Inc. 1.75% 20174 | 8,900 | 9,011 |
| National Semiconductor Corp. 6.60% 2017 | 6,000 | 7,415 |
| NXP BV and NXP Funding LLC 3.09% 20132 | 398 | 399 |
| | | 35,288 |
| | | |
| | | |
| Total corporate bonds & notes | | 10,129,472 |
| | Principal amount | Value |
| Bonds & notes | (000) | (000) |
| | | |
| U.S. TREASURY BONDS & NOTES — 21.87% | | |
| U.S. TREASURY — 19.19% | | |
| U.S. Treasury 0.625% 2013 | $ 18,300 | $ 18,309 |
| U.S. Treasury 1.125% 2013 | 43,955 | 44,155 |
| U.S. Treasury 3.375% 2013 | 7,900 | 8,027 |
| U.S. Treasury 3.50% 2013 | 50,000 | 50,698 |
| U.S. Treasury 3.875% 2013 | 25,000 | 25,114 |
| U.S. Treasury 0.125% 2014 | 13,400 | 13,367 |
| U.S. Treasury 0.25% 2014 | 171,500 | 171,587 |
| U.S. Treasury 0.25% 2014 | 8,000 | 8,005 |
| U.S. Treasury 1.25% 2014 | 299,085 | 302,578 |
| U.S. Treasury 1.875% 2014 | 221,550 | 225,830 |
| U.S. Treasury 2.375% 2014 | 41,500 | 43,042 |
| U.S. Treasury 2.625% 2014 | 79,340 | 82,330 |
| U.S. Treasury 0.375% 2015 | 64,950 | 65,006 |
| U.S. Treasury 1.25% 2015 | 15,000 | 15,375 |
| U.S. Treasury 1.875% 2015 | 40,055 | 41,609 |
| U.S. Treasury 2.125% 2015 | 115,500 | 121,545 |
| U.S. Treasury 4.25% 2015 | 50,000 | 55,092 |
| U.S. Treasury 0.875% 2016 | 79,020 | 80,128 |
| U.S. Treasury 0.875% 2016 | 2,245 | 2,275 |
| U.S. Treasury 1.00% 2016 | 180,450 | 183,862 |
| U.S. Treasury 1.00% 2016 | 94,165 | 95,952 |
| U.S. Treasury 1.50% 2016 | 20,670 | 21,431 |
| U.S. Treasury 1.75% 2016 | 86,870 | 90,738 |
| U.S. Treasury 2.00% 2016 | 95,000 | 99,935 |
| U.S. Treasury 2.375% 2016 | 100,000 | 106,328 |
| U.S. Treasury 2.625% 2016 | 55,640 | 59,544 |
| U.S. Treasury 3.00% 2016 | 3,560 | 3,885 |
| U.S. Treasury 4.875% 2016 | 34,750 | 40,227 |
| U.S. Treasury 5.125% 2016 | 36,000 | 41,632 |
| U.S. Treasury 7.50% 2016 | 58,000 | 73,513 |
| U.S. Treasury 0.625% 2017 | 110,845 | 110,691 |
| U.S. Treasury 0.625% 2017 | 37,750 | 37,608 |
| U.S. Treasury 0.625% 2017 | 5,000 | 4,989 |
| U.S. Treasury 0.75% 2017 | 83,300 | 83,401 |
| U.S. Treasury 0.75% 2017 | 61,429 | 61,764 |
| U.S. Treasury 0.875% 2017 | 229,700 | 232,454 |
| U.S. Treasury 0.875% 2017 | 100,810 | 102,105 |
| U.S. Treasury 1.00% 2017 | 244,646 | 248,957 |
| U.S. Treasury 3.00% 2017 | 39,750 | 43,729 |
| U.S. Treasury 3.25% 2017 | 93,480 | 103,960 |
| U.S. Treasury 4.625% 2017 | 50,000 | 58,275 |
| U.S. Treasury 8.75% 2017 | 25,000 | 33,803 |
| U.S. Treasury 2.375% 2018 | 20,000 | 21,652 |
| U.S. Treasury 3.50% 2018 | 58,625 | 66,730 |
| U.S. Treasury 1.00% 2019 | 100,000 | 99,207 |
| U.S. Treasury 1.00% 2019 | 89,250 | 88,634 |
| U.S. Treasury 1.00% 2019 | 4,000 | 3,957 |
| U.S. Treasury 1.125% 2019 | 435,950 | 438,269 |
| U.S. Treasury 1.125% 2019 | 5,000 | 4,981 |
| U.S. Treasury 1.25% 2019 | 41,750 | 42,338 |
| U.S. Treasury 3.125% 2019 | 2,575 | 2,914 |
| U.S. Treasury 8.125% 2019 | 25,000 | 36,371 |
| U.S. Treasury 8.75% 2020 | 11,530 | 17,842 |
| U.S. Treasury 2.00% 2021 | 50,000 | 51,838 |
| U.S. Treasury 8.00% 2021 | 40,000 | 61,722 |
| U.S. Treasury 1.625% 2022 | 691,617 | 683,318 |
| U.S. Treasury 1.75% 2022 | 243,000 | 244,822 |
| U.S. Treasury 2.00% 2022 | 21,525 | 22,235 |
| U.S. Treasury 7.125% 2023 | 85,000 | 128,058 |
| U.S. Treasury 6.875% 2025 | $ 77,500 | $ 119,217 |
| U.S. Treasury 6.00% 2026 | 88,325 | 127,630 |
| U.S. Treasury 6.50% 2026 | 49,550 | 75,134 |
| U.S. Treasury 5.25% 2028 | 50,000 | 68,953 |
| U.S. Treasury 6.25% 2030 | 11,435 | 17,646 |
| U.S. Treasury 4.50% 2036 | 116,957 | 153,369 |
| U.S. Treasury 3.50% 2039 | 10,000 | 11,264 |
| U.S. Treasury 4.375% 2039 | 48,000 | 62,231 |
| U.S. Treasury 3.875% 2040 | 47,010 | 56,305 |
| U.S. Treasury 4.625% 2040 | 71,725 | 96,576 |
| U.S. Treasury 3.75% 2041 | 100,846 | 118,100 |
| U.S. Treasury 2.75% 2042 | 42,500 | 40,880 |
| U.S. Treasury 2.75% 2042 | 40,100 | 38,527 |
| U.S. Treasury 3.00% 2042 | 168,500 | 171,027 |
| U.S. Treasury 3.125% 2042 | 35,000 | 36,460 |
| | | 6,521,062 |
| | | |
| U.S. TREASURY INFLATION-PROTECTED SECURITIES9 — 2.68% | | |
| U.S. Treasury Inflation-Protected Security 0.625% 2013 | 63,431 | 63,368 |
| U.S. Treasury Inflation-Protected Security 1.875% 2013 | 51,171 | 52,022 |
| U.S. Treasury Inflation-Protected Security 1.625% 2015 | 24,168 | 25,684 |
| U.S. Treasury Inflation-Protected Security 0.125% 2016 | 38,513 | 40,557 |
| U.S. Treasury Inflation-Protected Security 0.125% 2017 | 286,935 | 307,241 |
| U.S. Treasury Inflation-Protected Security 0.125% 2022 | 150,518 | 163,378 |
| U.S. Treasury Inflation-Protected Security 0.125% 2022 | 25,551 | 27,746 |
| U.S. Treasury Inflation-Protected Security 2.375% 2025 | 45,623 | 61,574 |
| U.S. Treasury Inflation-Protected Security 2.00% 2026 | 5,361 | 7,031 |
| U.S. Treasury Inflation-Protected Security 2.125% 2041 | 6,232 | 9,199 |
| U.S. Treasury Inflation-Protected Security 0.75% 2042 | 139,891 | 153,295 |
| | | 911,095 |
| | | |
| | | |
| Total U.S. Treasury bonds & notes | | 7,432,157 |
| | | |
| | | |
| BONDS & NOTES OF GOVERNMENTS & GOVERNMENT AGENCIES OUTSIDE THE U.S. — 3.58% | | |
| United Mexican States Government 3.50% 20179 | MXN95,016 | 8,173 |
| United Mexican States Government Global 5.95% 2019 | $5,170 | 6,385 |
| United Mexican States Government, Series M, 6.50% 2021 | MXN292,500 | 24,568 |
| United Mexican States Government Global, Series A, 3.625% 2022 | $11,000 | 12,059 |
| United Mexican States Government, Series M20, 10.00% 2024 | MXN 76,000 | 8,242 |
| United Mexican States Government, Series M30, 10.00% 2036 | 55,500 | 6,219 |
| United Mexican States Government 4.00% 20409 | 144,247 | 14,623 |
| JPMorgan Chase & Co. 7.50% 20182 | RUB403,000 | 13,361 |
| Russian Federation 5.00% 2020 | $23,900 | 28,274 |
| Russian Federation 7.50% 20301 | 28,528 | 36,698 |
| Russian Federation 7.50% 20301,4 | 112 | 145 |
| Turkey (Republic of) 9.00% 2016 | TRY4,900 | 2,968 |
| Turkey (Republic of) 7.50% 2017 | $ 5,725 | 6,990 |
| Turkey (Republic of) 6.75% 2018 | 17,250 | 20,959 |
| Turkey (Republic of) 4.00% 20209 | TRY16,355 | 11,379 |
| Turkey (Republic of) 10.50% 2020 | 4,500 | 3,092 |
| Turkey (Republic of) 5.625% 2021 | $ 8,000 | 9,540 |
| Turkey (Republic of) 8.00% 2034 | 1,250 | 1,878 |
| Turkey (Republic of) 6.75% 2040 | 9,300 | 12,660 |
| Turkey (Republic of) 6.00% 2041 | 5,650 | 7,069 |
| Venezuela (Republic of) 8.50% 2014 | 245 | 252 |
| Venezuela (Republic of) 7.65% 2025 | 985 | 872 |
| Venezuela (Republic of) 9.25% 2027 | 41,315 | 41,522 |
| Venezuela (Republic of) 9.25% 2028 | 25,605 | 25,349 |
| Polish Government, Series 1017, 5.25% 2017 | PLN52,195 | $18,394 |
| Polish Government 6.375% 2019 | $36,085 | 45,123 |
| Polish Government 5.00% 2022 | 2,700 | 3,195 |
| Indonesia (Republic of) 5.875% 2020 | 6,800 | 8,211 |
| Indonesia (Republic of) 5.875% 20204 | 6,200 | 7,486 |
| Indonesia (Republic of) 3.75% 2022 | 10,150 | 10,848 |
| Indonesia (Republic of) 7.75% 2038 | 18,400 | 27,876 |
| Indonesia (Republic of) 5.25% 2042 | 6,900 | 8,073 |
| Japanese Government, Series 296, 1.50% 2018 | ¥2,468,700 | 30,537 |
| Japanese Government, Series 29, 2.40% 2038 | 1,342,250 | 17,113 |
| Brazil (Federal Republic of) 10.00% 2017 | BRL28,515 | 14,698 |
| Brazil (Federal Republic of) 6.00% 20179 | 41,654 | 23,455 |
| Brazil (Federal Republic of) Global 4.875% 2021 | $ 5,250 | 6,352 |
| Brazil (Federal Republic of) Global 12.25% 2030 | 425 | 863 |
| France Government Agency-Guaranteed, Société Finance 2.875% 20144 | 33,200 | 34,551 |
| France Government Agency-Guaranteed, Société Finance 3.375% 20144 | 10,000 | 10,390 |
| Colombia (Republic of) Global 12.00% 2015 | COP8,795,000 | 6,066 |
| Colombia (Republic of) Global 7.375% 2019 | $6,725 | 8,874 |
| Colombia (Republic of) Global 4.375% 2021 | 2,400 | 2,770 |
| Colombia (Republic of) Global 7.75% 2021 | COP 7,505,000 | 5,347 |
| Colombia (Republic of) Global 9.85% 2027 | 12,551,000 | 10,940 |
| Colombia (Republic of) Global 7.375% 2037 | $ 7,000 | 10,923 |
| Australia Government Agency-Guaranteed, Commonwealth Bank of Australia 2.90% 20144 | 23,005 | 23,967 |
| Australia Government Agency-Guaranteed, Commonwealth Bank of Australia 3.625% 20144 | 20,000 | 20,936 |
| South Korean Government 5.75% 2014 | 21,100 | 22,417 |
| South Korean Government 5.25% 2015 | KRW11,137,000 | 11,057 |
| South Korean Government 5.50% 2017 | 10,100,000 | 10,484 |
| Philippines (Republic of) 5.50% 2026 | $ 9,750 | 12,358 |
| Philippines (Republic of) 6.375% 2034 | 15,500 | 21,816 |
| Philippines (Republic of) 6.25% 2036 | PHP326,000 | 9,493 |
| Uruguay (Republic of) 5.00% 20189 | UYU400,564 | 24,953 |
| Uruguay (Republic of) 4.375% 20281,9 | 230,444 | 14,472 |
| Uruguay (Republic of) 7.625% 20361 | $1,250 | 1,942 |
| Spanish Government 3.80% 2017 | €8,475 | 11,177 |
| Spanish Government 5.50% 2017 | 7,975 | 11,162 |
| Spanish Government 5.50% 2021 | 8,275 | 11,217 |
| Spanish Government 4.20% 2037 | 4,300 | 4,558 |
| Sweden Government Agency-Guaranteed, Swedbank AB 2.90% 20134 | $35,000 | 35,026 |
| New Zealand Government Agency-Guaranteed, Westpac Securities Co. 3.45% 20144 | 33,320 | 34,849 |
| Chilean Government 3.875% 2020 | 3,000 | 3,392 |
| Chilean Government 5.50% 2020 | CLP4,135,000 | 9,674 |
| Chilean Government 3.25% 2021 | $9,950 | 10,845 |
| Chilean Government 6.00% 2021 | CLP2,310,000 | 4,999 |
| Iraq (Republic of) 5.80% 20281 | $28,450 | 27,099 |
| Peru (Republic of) 8.75% 2033 | 8,226 | 14,334 |
| Peru (Republic of) 6.55% 20371 | 7,500 | 10,875 |
| Argentina (Republic of) 7.00% 2015 | 1,285 | 1,143 |
| Argentina (Republic of) 8.28% 20331,6 | 26,324 | 18,953 |
| Netherlands Government 1.00% 2017 | 18,300 | 18,478 |
| European Investment Bank 1.00% 2015 | 9,100 | 9,221 |
| European Investment Bank 1.00% 2017 | 5,000 | 5,023 |
| KfW 1.00% 2015 | 8,400 | 8,498 |
| KfW 2.00% 2022 | 4,325 | 4,329 |
| South Africa (Republic of) 5.50% 2020 | 10,750 | 12,792 |
| Croatian Government 6.75% 2019 | 7,985 | 9,193 |
| Croatian Government 6.75% 20194 | 2,865 | 3,298 |
| Bermudan Government 5.603% 20204 | 5,110 | 6,019 |
| Bermudan Government 5.603% 2020 | 3,940 | 4,641 |
| Bermudan Government 4.138% 20234 | 1,700 | 1,811 |
| Bahrain Government 5.50% 2020 | 10,440 | 11,275 |
| Bahrain Government 5.50% 20204 | $ 510 | $ 551 |
| State of Qatar 3.125% 20174 | 3,750 | 3,969 |
| State of Qatar 5.25% 2020 | 5,000 | 5,987 |
| State of Qatar 4.50% 20224 | 500 | 576 |
| Dominican Republic 9.04% 20181,4 | 4,481 | 5,086 |
| Dominican Republic 7.50% 20211,4 | 3,500 | 4,091 |
| Dominican Republic 7.50% 20211 | 950 | 1,111 |
| Lithuania (Republic of) 6.625% 2022 | 3,700 | 4,745 |
| Lithuania (Republic of) 6.625% 20224 | 3,400 | 4,361 |
| Aries Vermögensverwaltungs GmbH, Series C, 9.60% 2014 | 7,000 | 8,141 |
| United Kingdom Government Agency-Guaranteed, Network Rail Infrastructure Ltd 1.50% 20144 | 8,000 | 8,105 |
| German Government 3.25% 2042 | €4,570 | 7,525 |
| Hungarian Government 6.25% 2020 | $6,700 | 7,429 |
| Netherlands Government Agency-Guaranteed, ING Bank NV 3.90% 20144 | 7,000 | 7,299 |
| Kommunalbanken 1.00% 20144 | 2,924 | 2,947 |
| Kommunalbanken 0.443% 20162,4 | 4,250 | 4,255 |
| Gabonese Republic 8.20% 2017 | 5,300 | 6,479 |
| El Salvador (Republic of) 7.375% 2019 | 4,800 | 5,537 |
| Morocco Government 4.25% 20224 | 2,700 | 2,713 |
| Morocco Government 5.50% 20424 | 2,300 | 2,339 |
| Italian Government 4.75% 2017 | €3,175 | 4,476 |
| Israeli Government 5.125% 2019 | $ 500 | 585 |
| Israeli Government 4.00% 2022 | 3,500 | 3,814 |
| FMS Wertmanagement 1.00% 2017 | 4,400 | 4,389 |
| Caisse d’Amortissement de la Dette Sociale 1.625% 20154 | 4,000 | 4,089 |
| Sri Lanka (Republic of) 6.25% 20214 | 3,400 | 3,721 |
| Panama (Republic of) Global 7.125% 2026 | 300 | 427 |
| Panama (Republic of) Global 8.875% 2027 | 250 | 408 |
| Panama (Republic of) Global 9.375% 2029 | 340 | 583 |
| Panama (Republic of) Global 6.70% 20361 | 1,504 | 2,143 |
| Slovenia (Republic of) 5.50% 20224 | 3,000 | 3,157 |
| Province of Buenos Aires 10.875% 20211,4 | 1,500 | 1,125 |
| Ireland Government Agency-Guaranteed, Irish Life & Permanent 3.60% 20134 | 600 | 603 |
| LCR Finance PLC 5.10% 2051 | £165 | 367 |
| | | 1,216,271 |
| | | |
| FEDERAL AGENCY BONDS & NOTES — 2.85% | | |
| Federal Home Loan Bank, Series 2753, 0.28% 2013 | $100,000 | 100,031 |
| Federal Home Loan Bank 1.625% 2013 | 22,100 | 22,171 |
| Federal Home Loan Bank 3.625% 2013 | 75,000 | 77,037 |
| Federal Home Loan Bank 2.50% 2014 | 25,000 | 25,797 |
| Federal Home Loan Bank 5.50% 2014 | 8,000 | 8,672 |
| Federal Home Loan Bank, Series 2816, 1.00% 2017 | 31,025 | 31,381 |
| Federal Home Loan Bank 2.75% 2018 | 16,635 | 18,182 |
| Federal Home Loan Bank 4.125% 2020 | 14,525 | 17,186 |
| Federal Home Loan Bank 5.50% 2036 | 2,600 | 3,567 |
| Freddie Mac 0.50% 2014 | 12,400 | 12,441 |
| Freddie Mac 2.50% 2014 | 12,000 | 12,350 |
| Freddie Mac 4.50% 2014 | 7,400 | 7,728 |
| Freddie Mac 5.00% 2014 | 25,000 | 26,813 |
| Freddie Mac 1.75% 2015 | 37,350 | 38,711 |
| Freddie Mac 2.50% 2016 | 15,200 | 16,210 |
| Freddie Mac 5.50% 2016 | 17,980 | 21,095 |
| Freddie Mac 5.00% 2017 | 11,500 | 13,589 |
| Freddie Mac 4.875% 2018 | 13,365 | 16,136 |
| Freddie Mac 1.25% 2019 | 96,640 | 96,362 |
| Fannie Mae 0.75% 2013 | 99,300 | 99,793 |
| Fannie Mae 4.625% 2013 | 36,700 | 37,975 |
| Fannie Mae 2.50% 2014 | 7,250 | 7,472 |
| Fannie Mae 3.00% 2014 | 9,500 | 9,939 |
| Fannie Mae 0.50% 2015 | $17,500 | $ 17,563 |
| Fannie Mae 5.375% 2016 | 10,420 | 12,167 |
| Fannie Mae 6.25% 2029 | 400 | 574 |
| Fannie Mae 6.625% 2030 | 2,875 | 4,359 |
| Fannie Mae: 7.125% 2030 | 5,400 | 8,448 |
| Tennessee Valley Authority, Series A, 5.50% 2017 | 1,500 | 1,813 |
| Tennessee Valley Authority, Series A, 3.875% 2021 | 4,125 | 4,792 |
| Tennessee Valley Authority 1.875% 2022 | 23,750 | 23,573 |
| Tennessee Valley Authority, 4.65% 2035 | 4,000 | 4,821 |
| Tennessee Valley Authority 5.25% 2039 | 21,250 | 27,933 |
| Tennessee Valley Authority 3.50% 2042 | 13,800 | 13,663 |
| Tennessee Valley Authority, Series 2008, Class A, 4.875% 2048 | 3,200 | 3,958 |
| Tennessee Valley Authority, Series A, 4.625% 2060 | 1,100 | 1,312 |
| CoBank, ACB 7.875% 20184 | 23,615 | 30,294 |
| CoBank, ACB 0.908% 20222,4 | 34,865 | 28,669 |
| Federal Farm Credit Banks, Consolidated Systemwide Designated Bonds, 1.625% 2014 | 33,700 | 34,509 |
| Federal Farm Credit Banks, Consolidated Systemwide Designated Bonds, 2.625% 2014 | 5,000 | 5,151 |
| Federal Farm Credit Banks, Consolidated Systemwide Designated Bonds, 3.00% 2014 | 10,000 | 10,470 |
| Federal Agricultural Mortgage Corp. 5.125% 20174 | 5,000 | 5,919 |
| United States Agency for International Development, Republic of Egypt 4.45% 2015 | 5,000 | 5,516 |
| Private Export Funding Corp., Series W, 5.00% 2016 | 3,400 | 3,926 |
| | | 970,068 |
| | | |
| ASSET-BACKED OBLIGATIONS1 — 0.66% | | |
| Aesop Funding II LLC, Series 2010-2A, Class A, 3.63% 20144 | 12,400 | 12,517 |
| Aesop Funding II LLC, Series 2010-5A, Class A, 3.15% 20174 | 20,000 | 21,166 |
| Hertz Vehicle Financing LLC, Rental Car Asset-backed Notes, Series 2009-2A, Class A-1, 4.26% 20144 | 4,500 | 4,525 |
| Hertz Vehicle Financing LLC, Rental Car Asset-backed Notes, Series 2009-2A, Class A-2, 5.29% 20164 | 17,500 | 19,044 |
| Vega ContainerVessel PLC, Series 2006-1, Class A, XLCA insured, 5.562% 20214 | 23,695 | 22,806 |
| Chase Issuance Trust, Series 2008-4, Class A, 4.65% 2015 | 18,000 | 18,154 |
| AEP Texas Central Transitioning Funding II LLC, Secured Transition Bonds, Series A, Class A-3, 5.09% 2017 | 16,720 | 17,772 |
| CWHEQ Revolving Home Equity Loan Trust, Series 2007-B, Class A, FSA insured, 0.359% 20372 | 17,158 | 13,428 |
| Vanderbilt Mortgage and Finance, Inc., Series 2002-C, Class A-4, 6.57% 2024 | 3,555 | 3,714 |
| Vanderbilt Mortgage and Finance, Inc., Series 2000-C, Class A-4, 7.905% 2026 | 10 | 10 |
| Vanderbilt Mortgage and Finance, Inc., Series 2000-C, Class A-5, 8.195% 2030 | 6,889 | 7,072 |
| Vanderbilt Mortgage and Finance, Inc., Series 2001-C, Class M-1, 6.76% 2032 | 483 | 492 |
| Vanderbilt Mortgage and Finance, Inc., Series 2002-C, Class M-1, 7.82% 2032 | 1,310 | 1,337 |
| MBNA Credit Card Master Note Trust, Series 2006-1, Class C, 0.629% 20152 | 10,000 | 9,998 |
| Flagstar Home Equity Loan Trust, Series 2006-2A, Class A, FSA insured, 0.37% 20192,4 | 10,418 | 8,909 |
| RAMP Trust, Series 2004-RS10, Class A-I-6, 4.55% 2034 | 8,517 | 8,847 |
| Vanderbilt Acquisition Loan Trust, Series 2002-1, Class B-1, 7.30% 2021 | 3 | 3 |
| Vanderbilt Acquisition Loan Trust, Series 2002-1, Class A-4, 6.57% 2027 | 4,609 | 4,866 |
| Vanderbilt Acquisition Loan Trust, Series 2002-1, Class A-5, 7.12% 2032 | 3,000 | 3,314 |
| Lehman ABS Manufactured Housing Contract Trust, Series 2002-A, Class A, 0.659% 20332 | 2,770 | 2,645 |
| Lehman ABS Manufactured Housing Contract Trust, Series 2001-B, Class A-3, 4.35% 2040 | 1,257 | 1,329 |
| Lehman ABS Manufactured Housing Contract Trust, Series 2001-B, Class A-4, 5.27% 2040 | 645 | 697 |
| Lehman ABS Manufactured Housing Contract Trust, Series 2001-B, Class A-5, 5.873% 2040 | 2,117 | 2,321 |
| IndyMac Home Equity Mortgage Loan Asset-backed Trust, Series 2007-H1, Class A-1, FSA insured, 0.37% 20372 | 8,736 | 6,616 |
| First Horizon ABS Trust, Series 2006-HE2, Class A, FSA insured, 0.34% 20262 | 372 | 322 |
| First Horizon ABS Trust, Series 2007-HE1, Class A, FSA insured, 0.34% 20292 | 6,546 | 5,649 |
| Home Equity Asset Trust, Series 2004-7, Class M-1, 1.14% 20352 | 6,500 | 5,969 |
| Conseco Finance Securitizations Corp., Series 2002-2, Class A-2, 6.03% 2033 | 3,706 | 3,858 |
| UCFC Manufactured Housing Contract, Series 1996-2, Class A, MBIA insured, 7.135% 2028 | 3,271 | 3,184 |
| Green Tree Financial Corp., Series 1996-10, Class A-6, 7.30% 2028 | 2 | 2 |
| Green Tree Financial Corp., Series 1997-6, Class A-7, 7.14% 2029 | 2,167 | 2,340 |
| Conseco Finance Home Equity Loan Trust, Series 2002-B, Class M-1, 1.959% 20332 | 808 | 692 |
| Origen Manufactured Housing Contract Trust, Series 2004-B, Class M-1, 5.73% 2035 | 1,447 | 1,540 |
| Origen Manufactured Housing Contract Trust, Series 2004-B, Class M-2, 6.51% 2035 | 1,158 | 1,272 |
| Ally Master Owner Trust, Series 2011-1, Class A2, 2.15% 2016 | 2,450 | 2,491 |
| Hyundai Auto Receivables Trust, Series 2011-A, Class A3, 1.16% 2015 | 1,946 | 1,954 |
| World Omni Auto Receivables Trust, Series 2010-A, Class A-4, 2.21% 2015 | $1,900 | $ 1,918 |
| SLM Student Loan Trust, Series 2003-10, Class A-4, 5.15% 20394 | £1,160 | 1,621 |
| Residential Funding Mortgage Securities II, Inc., Series 2006-HSA3, Class A, FSA insured, 0.34% 20362 | $ 1,138 | 861 |
| Consumers Funding LLC, Series 2001-1, Class A-5, 5.43% 2015 | 603 | 610 |
| | | 225,865 |
| | | |
| MUNICIPALS — 0.46% | | |
| State of California, Various Purpose General Obligation Bonds (Federally Taxable), 7.50% 2034 | 4,240 | 5,903 |
| State of California, Various Purpose General Obligation Bonds (Federally Taxable), 7.30% 2039 | 2,290 | 3,187 |
| State of California, Various Purpose General Obligation Bonds (Federally Taxable), 7.35% 2039 | 1,335 | 1,874 |
| State of California, Various Purpose General Obligation Bonds (Federally Taxable), 7.55% 2039 | 11,680 | 16,830 |
| State of California, Various Purpose General Obligation Bonds (Federally Taxable), 7.60% 2040 | 19,725 | 28,959 |
| State of California, Various Purpose General Obligation Bonds (Federally Taxable), 7.625% 2040 | 6,830 | 9,849 |
| State of Illinois, General Obligation Bonds, Taxable Build America Bonds, Series 2010-3, 5.727% 2020 | 17,000 | 19,381 |
| State of New York, Long Island Power Authority, Electric System General Revenue Refunding Bonds, | | |
| Series 2009-A, 5.75% 2039 | 14,330 | 17,043 |
| State of Illinois, Regional Transportation Authority of Cook, DuPage, Kane, Lake, McHenry and Will Counties, | | |
| General Obligation Revenue Refunding Bonds, Series 2003-A, FGIC-National insured, 6.00% 2033 | 12,120 | 16,429 |
| State of South Dakota, Educational Enhancement Funding Corp., Tobacco Settlement Asset-backed Bonds, | | |
| Series 2002-A, 6.72% 2025 | 11,807 | 12,126 |
| State of Washington, Energy Northwest, Columbia Generating Station Electric Revenue Bonds, Series 2012-E, 2.197% 2019 | 8,000 | 8,179 |
| State of New York, Metropolitan Transportation Authority, Dedicated Tax Fund Bonds (Federally Taxable-Issuer | | |
| Subsidy-Build America Bonds), Series 2009-C, 7.336% 2039 | 5,500 | 7,985 |
| State of Texas, SA Energy Acquisition Public Facility Corp., Gas Supply Revenue Bonds, Series 2007, 5.50% 2023 | 6,000 | 6,937 |
| State of Maryland, Howard Hughes Medical Institute, Taxable Bonds, 3.45% 2014 | 125 | 131 |
| | | 154,813 |
| | | |
| | | |
| Total bonds & notes (cost: $30,121,248,000) | | 31,669,554 |
| | | |
| | | |
| | | |
| Convertible securities — 0.04% | | |
| | | |
| INFORMATION TECHNOLOGY — 0.04% | | |
| Linear Technology Corp., Series A, 3.00% convertible notes 2027 | 11,500 | 12,032 |
| | | |
| | | |
| Total convertible securities (cost: $10,588,000) | | 12,032 |
| | | |
| | | |
| | | |
| Preferred securities — 0.01% | Shares | |
| | | |
| FINANCIALS — 0.01% | | |
| CoBank, ACB, Class E, noncumulative4 | 6,250 | 4,213 |
| | | |
| | | |
| Total preferred securities (cost: $5,820,000) | | 4,213 |
| | | |
| | | |
| | | |
| Common stocks — 0.02% | | |
| | | |
| MATERIALS — 0.01% | | |
| NewPage Holdings Inc.3,10,11 | 45,840 | 4,983 |
| | | |
| | | |
| CONSUMER DISCRETIONARY — 0.01% | | |
| American Media, Inc.3,4,10 | 453,779 | 2,314 |
| | | |
| | | |
| | | Value |
| Common stocks | Shares | (000) |
| | | |
| ENERGY — 0.00% | | |
| General Maritime Corp.3,4,10 | 1,716 | $ 63 |
| | | |
| | | |
| INDUSTRIALS — 0.00% | | |
| Atrium Corp.3,4,10 | 985 | 35 |
| | | |
| | | |
| Total common stocks (cost: $19,023,000) | | 7,395 |
| | | |
| | | |
| | | |
| Warrants — 0.00% | | |
| | | |
| ENERGY — 0.00% | | |
| General Maritime Corp., warrants, expire 20173,4,10 | 2,654 | 20 |
| | | |
| | | |
| Total warrants (cost: $671,000) | | 20 |
| | | |
| | | |
| | Principal amount | |
| Short-term securities — 16.32% | (000) | |
| | | |
| Fannie Mae 0.125%–0.185% due 1/2–7/1/2013 | $1,369,017 | 1,368,787 |
| Freddie Mac 0.10%–0.20% due 1/22–8/20/2013 | 1,271,251 | 1,270,917 |
| U.S. Treasury Bills 0.109%–0.18% due 1/10–11/14/2013 | 1,183,500 | 1,183,090 |
| Federal Home Loan Bank 0.08%–0.21% due 1/7–12/10/2013 | 942,572 | 942,324 |
| Federal Farm Credit Banks 0.17%–0.22% due 3/1–12/2/2013 | 170,000 | 169,923 |
| Variable Funding Capital Company LLC 0.17%–0.18% due 1/11–1/24/20134 | 151,000 | 150,987 |
| Chariot Funding, LLC 0.16% due 1/14/20134 | 50,000 | 49,997 |
| Jupiter Securitization Co., LLC 0.21%–0.25% due 1/3–3/26/20134 | 73,398 | 73,373 |
| Coca-Cola Co. 0.16%–0.18% due 1/25–4/10/20134 | 71,200 | 71,186 |
| Procter & Gamble Co. 0.15% due 1/8–2/25/20134 | 63,300 | 63,293 |
| National Rural Utilities Cooperative Finance Corp. 0.15% due 2/13/2013 | 50,000 | 49,991 |
| Google Inc. 0.10%–0.15% due 1/23–3/6/20134 | 41,700 | 41,695 |
| Regents of the University of California 0.14% due 1/23/2013 | 35,000 | 34,997 |
| Paccar Financial Corp. 0.16%–0.17% due 1/10–1/14/2013 | 30,100 | 30,097 |
| Private Export Funding Corp. 0.21% due 1/8/20134 | 25,000 | 24,999 |
| Emerson Electric Co. 0.16% due 3/19/20134 | 20,000 | 19,994 |
| | | |
| Total short-term securities (cost: $5,544,725,000) | | 5,545,650 |
| | | |
| | | |
| Total investment securities (cost: $35,702,075,000) | | 37,238,864 |
| Other assets less liabilities | | (3,254,779) |
| | | |
| Net assets | | $33,984,085 |
ITEM 7 – Disclosure of Proxy Voting Policies and Procedures for Closed-End Management Investment Companies
Not applicable to this Registrant, insofar as the Registrant is not a closed-end management investment company.
Not applicable to this Registrant, insofar as the Registrant is not a closed-end management investment company.
ITEM 9 – Purchases of Equity Securities by Closed-End Management Investment Company and Affiliated Purchasers
Not applicable to this Registrant, insofar as the Registrant is not a closed-end management investment company.
There have been no material changes to the procedures by which shareholders may recommend nominees to the Registrant’s board of trustees since the Registrant last submitted a proxy statement to its shareholders. The procedures are as follows. The Registrant has a nominating and governance committee comprised solely of persons who are not considered ‘‘interested persons’’ of the Registrant within the meaning of the Investment Company Act of 1940, as amended. The committee periodically reviews such issues as the board’s composition, responsibilities, committees, compensation and other relevant issues, and recommends any appropriate changes to the full board of trustees. While the committee normally is able to identify from its own resources an ample number of qualified candidates, it will consider shareholder suggestions of persons to be considered as nominees to fill future vacancies on the board. Such suggestions must be sent in writing to the nominating and governance committee of the Registrant, c/o the Registrant’s Secretary, and must be accompanied by complete biographical and occupational data on the prospective nominee, along with a written consent of the prospective nominee for consideration of his or her name by the nominating and governance committee.
Pursuant to the requirements of the Securities Exchange Act of 1934 and the Investment Company Act of 1940, the Registrant has duly caused this report to be signed on its behalf by the undersigned, thereunto duly authorized.
Pursuant to the requirements of the Securities Exchange Act of 1934 and the Investment Company Act of 1940, this report has been signed below by the following persons on behalf of the Registrant and in the capacities and on the dates indicated.