UNITED STATES
SECURITIES AND EXCHANGE COMMISSION
Washington, D.C. 20549
FORM N-CSR
CERTIFIED SHAREHOLDER REPORT OF REGISTERED
MANAGEMENT INVESTMENT COMPANIES
Investment Company Act file number | 811-21666 |
|
Hatteras Master Fund, L.P. |
(Exact name of registrant as specified in charter) |
|
8540 Colonnade Center Drive, Suite 401 Raleigh, North Carolina | | 27615 |
(Address of principal executive offices) | | (Zip code) |
|
David B. Perkins 8540 Colonnade Center Drive, Suite 401 Raleigh, North Carolina 27615 |
(Name and address of agent for service) |
|
Registrant’s telephone number, including area code: | (919) 846-2324 | |
|
Date of fiscal year end: | March 31 | |
|
Date of reporting period: | March 31, 2014 | |
| | | | | | | | |
Form N-CSR is to be used by management investment companies to file reports with the Commission not later than 10 days after the transmission to stockholders of any report that is required to be transmitted to stockholders under Rule 30e-1 under the Investment Company Act of 1940 (17 CFR 270.30e-1). The Commission may use the information provided on Form N-CSR in its regulatory, disclosure review, inspection, and policymaking roles.
A registrant is required to disclose the information specified by Form N-CSR, and the Commission will make this information public. A registrant is not required to respond to the collection of information contained in Form N-CSR unless the Form displays a currently valid Office of Management and Budget (“OMB”) control number. Please direct comments concerning the accuracy of the information collection burden estimate and any suggestions for reducing the burden to Secretary, Securities and Exchange Commission, 450 Fifth Street, NW, Washington, DC 20549-0609. The OMB has reviewed this collection of information under the clearance requirements of 44 U.S.C. § 3507.
ITEM 1. REPORTS TO STOCKHOLDERS.
The Report to Shareholders is attached herewith.
ANNUAL REPORT
MARCH 31, 2014
Hatteras Core Alternatives Fund, L.P.
Hatteras Core Alternatives TEI Fund, L.P.
Hatteras Core Alternatives Institutional Fund, L.P.
Hatteras Core Alternatives TEI Institutional Fund, L.P.

MANAGERS DISCUSSION OF FUND PERFORMANCE
Mark W. Yusko
Finishing the fiscal year up 10.5%, The Hatteras Core Alternatives Institutional Fund, L.P. (the "Fund"), performed well ahead of industry benchmarks for the year, with the HFRX Global Hedge Fund Index and the HFRI Fund of Funds reporting returns of 4.6% and 5.9%, respectively over the same period. The Fund outperformance over industry benchmarks was due to a more focused hedge fund book as well as a mature private equity portfolio. The private portfolio returned 13.9%, and hedge funds returned 8.1% for the fiscal year, with overweight allocations to opportunistic equity and private investments which drove performance. The increasingly attractive M&A and IPO environment was the primary driver of attribution for our private strategy whereby valuations and activity acceleration towards the end of the year provided avenues for general partners ("GPs") to exit investments and realize value for investors. A year ago we stated that we were going to continue to concentrate our hedge fund positions with managers we had the most conviction with, and that strategy paid off. The Hedge Fund strategy performed well over the period and significantly outperformed its market indices mentioned above. Over the period, the standard deviation on the Fund was 3.83% (annualized) with a Sharpe ratio of 2.64 compared to the HFRX Global Hedge Fund Index which reported a standard deviation of 3.02% and a Sharpe Ratio of 1.52. With the further concentration of the hedge fund book, although the risk of the Fund was slightly above the benchmark, the higher Sharpe ratio illustrated the ability of our skilled line-up of managers to deliver additional returns associated with any excess risk. In broader
markets, global equities performed well in 2013, with muted levels of performance for the first quarter of 2014 due in part to moderate levels of GDP growth. Domestically, market performance climbed in 2013, albeit a series of hick-ups along the way caused by media rhetoric of impending duress relating to tapering of QE. Beginning in January with the Fiscal Cliff followed by the market's Taper Tantrum in May and the government shutdown in October, the potential for market volatility presented itself several times in 2013; however, markets barely faltered as the S&P 500 TR Index never fell more than 6% during 2013. Globally equity markets generally performed well in 2013, with the MSCI World Index (net) and MSCI EAFE Index (net) returning 26.7% and 22.8%, respectively for 2013. Moving into 2014 the calm waters of 2013 quickly faded away, as global equities fell hard in January with the S&P 500 TR Index, MSCI EAFE Index (net), and MSCI EM Index (net) all dropping in performance, with negative returns of 3.5%, 4.0%, and 6.5%, respectively. February exhibited a bounce back while March was mixed depending on the sector, feeding into the predictions of late that 2014 would exhibit a more volatile state than the docile market conditions of 2013. Fixed Income markets also displayed much more volatility in 2013, with the "taper talk" of the Fed pressing interest rates up in the early part of 2013. Although, the Fed changed course after the markets' negative response to an easing of QE, many fixed income strategies struggled to regain losses for the year with the Barclays US Aggregate and Barclays Long Term US Treasury down -2.0% and -12.7%, respectively as of the end of 2013.
STRATEGY COMMENTARY
Private Investments
Performance from our private investment strategy continued to do well over the year, posting returns of +13.9% for the fiscal year end at a current weight of 42.8%. With an average investment age of around 3 years for the underlying portfolio companies and a called to committed ratio of over 90% for the private investments, the current portfolio has reached a state of maturity whereby managers could be ready to exit investments. The maturity of the portfolio
coupled with an active and attractive (on a valuation basis) exit environment has caused many of our GPs to exit investments at valuations above previous published marks, thus driving both liquidity and performance for the strategy. Distributions outpaced contributions by $32M for the fiscal year — illustrating our GPs actively engaging in the value realization of underlying investments.*
* Distributions include cash distributions from private investment funds, secondary transactions and net transfers between investment strategies
ONE
With a current weight of 42.8% we are excited about the opportunities of investments in the ground working their way towards realization; however, we have chosen to prudently slow
our pace of new investments into the private strategy. As the portfolio matures, we believe the weight of the strategy could naturally move lower, through expected distributions.
Hedge Fund
Our Hedge Fund Strategy was up +8.1% during the fiscal year, outperforming the HFRX Global Hedge Fund Index and the HFRI Fund of Funds which returned 4.6% and 5.9% over the same period. Opportunistic Equity was the clear driver of performance for this strategy, with sector specialist managers in both Healthcare and Tech delivering alpha far above industry averages. Tactical Trading was the largest detractor of performance for the period due to gold exposures that took some significant losses at the beginning of the year and market volatility of our Japanese equities early in 2014. We continue to emphasize the goal of having significant exposure to our Top 20 managers to best reflect our hedge fund strategy.
As stated previously, one of the major goals for the year was to further concentrate the hedge fund portfolio, whereby we could allocate a higher percentage of assets to our favorite managers. Over the period we continued to take this concerted effort to concentrate, and ended the period with approximately 50% of assets concentrated in the top 20 managers. This concentration of the portfolio paid off big in the reflection of attribution for the strategy, with 6 of our top 10 managers providing double digit returns for the fiscal year. Looking ahead, we will continue our focus of a concentrated hedge fund book, with the philosophy to "feed our winners" in our allocation of assets.
Opportunistic Equity
Standing as our largest and best performing hedge fund strategy, Opportunistic Equity ended the year with a 34.1% weight and returned 13.8%. Attribution within the strategy was mainly a result of our higher allocation to top performing managers in the healthcare and tech sectors. With 2014 presenting a rocky start for many players in the tech and healthcare sector, the expertise of our managers shined through as they continued to deliver positive
returns into 2014. Several of our global long/short and international emerging managers also performed well for the period, specifically those with exposures to Chinese Internet plays. Commodity exposure in long/short energy detracted from returns for the period, with exposures to Russia and Japan also hurting performance at the start of 2014 due to volatility spurred by political and geopolitical events in these regions.
Enhanced Fixed Income
Enhanced Fixed Income finished the year at a 11.0% weight and posted slight losses for the year of -0.23%. Underperformance in the strategy was mostly experienced in the first part of the 2013 as fixed income strategies experienced volatility due to "tapering talks" by the Fed. The fear that the Fed would "taper" its QE program caused a lift in interest rates and blew out non-Treasury spreads in a sharp
rate movement in the beginning of 2013. When Chairman Bernanke redacted his previous statement of near-term tapering volatility calmed, however, we are still cautious of this strategy and remain underweight with current exposures evenly split between a few event driven fixed income and structured credit funds.
Absolute Return
Absolute Return performed well for the period and was up 8.9% for the year with a reduction in exposure to 5.8%. Attribution for the strategy was led by our Multi-Strategy managers that continue to deliver alpha through relative value fundamental equity. Over
the period, we reduced our exposures to this strategy by around half, shifting our allocation to more attractive opportunities in our Opportunistic Equity bucket.
Tactical Trading
Tactical Trading, which includes both Global Macro and CTA exposures, struggled for the period, returning -11.1% for the year, and sits at an underweight allocation of 4.5%. Although we have continued to reduce the weight to this strategy, minimizing losses, we are disappointed with these returns. Underperformance in the strategy resulted from early 2013 allocations to gold as well as
exposures to Japanese Equities in the first months of 2014. Negative performance in our Japanese exposures resulted primarily from the market anticipation of a consumption tax hike which finally went into effect; however, we view the market's reaction as a short-term setback and still believe Japan presents an area of opportunity over the next 12 to 24 months.
TWO
Summary
Looking ahead, we believe the portfolio is well positioned for an active and increasingly volatile environment for investors, where investors will see a greater dispersion among asset classes, strategies, and securities. The higher level of scrutiny within markets stands to illustrate the benefits of diversification, active management, and alternative investments. For the private portfolio, the heightened level of activity in IPO and M&A markets has continued in 2014, with 71 companies going public in the first quarter, an increase in exit activity of over 100% from the first quarter of 2013. As investors return to fundamentals and the taper talk discussion evolves our unique combination of private investments and hedge funds offers financial advisors the potential diversification benefits of our hedge funds and a private investment strategy uniquely positioned for potentially capturing today's exit opportunities in a robust M&A and IPO environment.
As always, we appreciate the confidence you have placed in Hatteras and your investment in the Hatteras Core Alternatives Fund. Thank you again, and if you have any questions please do not hesitate to contact us.

Mark W. Yusko
THREE
PERFORMANCE SUMMARY1 (UNAUDITED)
HATTERAS CORE ALTERNATIVES FUND, L.P. (INCEPTION DATE: APRIL 1, 2005)
Year | | Jan | | Feb | | Mar | | Apr | | May | | Jun | | Jul | | Aug | | Sep | | Oct | | Nov | | Dec | | Year2 | |
| | 2014 | | | | 0.60 | % | | | 1.53 | % | | | -0.64 | % | | | | | | | | | | | | | | | | | | | | | | | | | | | | | | | | | | | | | | | 1.50 | % | |
| | 2013 | | | | 1.16 | % | | | -0.03 | % | | | 0.54 | % | | | -0.39 | % | | | 0.59 | % | | | -0.53 | % | | | 0.94 | % | | | -0.50 | % | | | 1.81 | % | | | 1.88 | % | | | 1.50 | % | | | 2.94 | % | | | 10.31 | % | |
| | 2012 | | | | 1.96 | % | | | 0.89 | % | | | -0.18 | % | | | 0.07 | % | | | -0.58 | % | | | 0.01 | % | | | 0.50 | % | | | 0.74 | % | | | 0.64 | % | | | -0.04 | % | | | 0.08 | % | | | 0.94 | % | | | 5.10 | % | |
| | 2011 | | | | 0.41 | % | | | 1.09 | % | | | 0.69 | % | | | 0.83 | % | | | -0.22 | % | | | -0.79 | % | | | 0.19 | % | | | -2.37 | % | | | -3.27 | % | | | 1.02 | % | | | -0.96 | % | | | -0.56 | % | | | -3.97 | % | |
| | 2010 | | | | -0.30 | % | | | 0.06 | % | | | 1.72 | % | | | 0.94 | % | | | -2.63 | % | | | -1.13 | % | | | 0.34 | % | | | -0.11 | % | | | 2.29 | % | | | 1.30 | % | | | 0.28 | % | | | 2.31 | % | | | 5.06 | % | |
| | 2009 | | | | 0.17 | % | | | -0.43 | % | | | -0.50 | % | | | 0.49 | % | | | 3.69 | % | | | 0.79 | % | | | 2.20 | % | | | 1.20 | % | | | 2.39 | % | | | 0.11 | % | | | 0.85 | % | | | 0.95 | % | | | 12.50 | % | |
| | 2008 | | | | -2.89 | % | | | 1.86 | % | | | -2.88 | % | | | 1.57 | % | | | 2.10 | % | | | -0.48 | % | | | -2.84 | % | | | -1.53 | % | | | -8.28 | % | | | -7.54 | % | | | -4.29 | % | | | -1.01 | % | | | -23.79 | % | |
| | 2007 | | | | 0.97 | % | | | 0.67 | % | | | 1.60 | % | | | 1.86 | % | | | 2.01 | % | | | 0.78 | % | | | -0.05 | % | | | -1.85 | % | | | 1.93 | % | | | 2.71 | % | | | -1.72 | % | | | 0.92 | % | | | 10.16 | % | |
| | 2006 | | | | 2.80 | % | | | -0.20 | % | | | 1.74 | % | | | 1.10 | % | | | -1.97 | % | | | -0.75 | % | | | 0.37 | % | | | 0.76 | % | | | 0.26 | % | | | 1.60 | % | | | 2.09 | % | | | 0.93 | % | | | 8.98 | % | |
| | 2005 | | | | | | | | | | | | | | | | -1.54 | % | | | 0.26 | % | | | 1.46 | % | | | 2.16 | % | | | 0.48 | % | | | 1.39 | % | | | -1.46 | % | | | 1.35 | % | | | 1.85 | % | | | 6.04 | % | |
Returns | | Fund | | S&P 5003 | | HFRXGL3 | |
Year-to-date | | | 1.50 | % | | | 1.81 | % | | | 1.11 | % | |
| 1-Year | | | 10.11 | % | | | 21.86 | % | | | 4.63 | % | |
3-Year (annualized) | | | 3.41 | % | | | 14.66 | % | | | 0.46 | % | |
5-Year (annualized) | | | 6.12 | % | | | 21.16 | % | | | 3.82 | % | |
Annualized Since Inception | | | 2.92 | % | | | 7.50 | % | | | 1.08 | % | |
Historical Data
(since inception) | | Fund | | S&P 5003 | | HFRXGL3 | |
Cumulative Return | | | 29.56 | % | | | 91.69 | % | | | 10.15 | % | |
Standard Deviation4 | | | 6.32 | % | | | 15.29 | % | | | 6.24 | % | |
Largest Drawdown5 | | | -24.98 | % | | | -50.95 | % | | | -25.21 | % | |
Drawdown — # of months6 | | | 17 | | | | 16 | | | | 14 | | |
HATTERAS CORE ALTERNATIVES TEI FUND, L.P. (INCEPTION DATE: APRIL 1, 2005)
Year | | Jan | | Feb | | Mar | | Apr | | May | | Jun | | Jul | | Aug | | Sep | | Oct | | Nov | | Dec | | Year2 | |
| | 2014 | | | | 0.59 | % | | | 1.52 | % | | | -0.65 | % | | | | | | | | | | | | | | | | | | | | | | | | | | | | | | | | | | | | | | | 1.46 | % | |
| | 2013 | | | | 1.15 | % | | | -0.04 | % | | | 0.48 | % | | | -0.39 | % | | | 0.59 | % | | | 0.00 | % | | | 0.92 | % | | | -0.52 | % | | | 1.77 | % | | | 1.85 | % | | | 1.47 | % | | | 2.92 | % | | | 10.02 | % | |
| | 2012 | | | | 1.94 | % | | | 0.88 | % | | | -0.20 | % | | | 0.06 | % | | | -0.59 | % | | | 0.00 | % | | | 0.49 | % | | | 0.73 | % | | | 0.63 | % | | | -0.05 | % | | | 0.08 | % | | | 0.93 | % | | | 4.99 | % | |
| | 2011 | | | | 0.41 | % | | | 1.09 | % | | | 0.68 | % | | | 0.83 | % | | | -0.22 | % | | | -0.79 | % | | | 0.19 | % | | | -2.37 | % | | | -3.28 | % | | | 1.01 | % | | | -0.96 | % | | | -0.59 | % | | | -4.02 | % | |
| | 2010 | | | | -0.34 | % | | | 0.06 | % | | | 1.72 | % | | | 0.94 | % | | | -2.63 | % | | | -1.12 | % | | | 0.35 | % | | | -0.12 | % | | | 2.27 | % | | | 1.28 | % | | | 0.26 | % | | | 2.29 | % | | | 4.95 | % | |
| | 2009 | | | | 0.16 | % | | | -0.44 | % | | | -0.50 | % | | | 0.47 | % | | | 3.71 | % | | | 0.79 | % | | | 2.19 | % | | | 1.20 | % | | | 2.39 | % | | | 0.11 | % | | | 0.85 | % | | | 0.95 | % | | | 12.48 | % | |
| | 2008 | | | | -2.95 | % | | | 1.82 | % | | | -2.92 | % | | | 1.53 | % | | | 2.08 | % | | | -0.52 | % | | | -2.88 | % | | | -1.57 | % | | | -8.33 | % | | | -7.56 | % | | | -4.31 | % | | | -0.86 | % | | | -23.98 | % | |
| | 2007 | | | | 0.94 | % | | | 0.64 | % | | | 1.58 | % | | | 1.83 | % | | | 1.99 | % | | | 0.75 | % | | | -0.07 | % | | | -1.88 | % | | | 1.89 | % | | | 2.68 | % | | | -1.74 | % | | | 0.87 | % | | | 9.79 | % | |
| | 2006 | | | | 2.77 | % | | | -0.20 | % | | | 1.72 | % | | | 1.09 | % | | | -1.98 | % | | | -0.75 | % | | | 0.37 | % | | | 0.72 | % | | | 0.23 | % | | | 1.57 | % | | | 2.05 | % | | | 0.90 | % | | | 8.73 | % | |
| | 2005 | | | | | | | | | | | | | | | | -1.54 | % | | | 0.26 | % | | | 1.46 | % | | | 2.16 | % | | | 0.48 | % | | | 1.39 | % | | | -1.46 | % | | | 1.32 | % | | | 1.82 | % | | | 5.97 | % | |
Returns | | Fund | | S&P 5003 | | HFRXGL3 | |
Year-to-date | | | 1.46 | % | | | 1.81 | % | | | 1.11 | % | |
| 1-Year | | | 9.88 | % | | | 21.86 | % | | | 4.63 | % | |
3-Year (annualized) | | | 3.25 | % | | | 14.66 | % | | | 0.46 | % | |
5-Year (annualized) | | | 6.01 | % | | | 21.16 | % | | | 3.82 | % | |
Annualized Since Inception | | | 2.75 | % | | | 7.50 | % | | | 1.08 | % | |
Historical Data
(since inception) | | Fund | | S&P 5003 | | HFRXGL3 | |
Cumulative Return | | | 27.69 | % | | | 91.69 | % | | | 10.15 | % | |
Standard Deviation4 | | | 6.32 | % | | | 15.29 | % | | | 6.24 | % | |
Largest Drawdown5 | | | -25.23 | % | | | -50.95 | % | | | -25.21 | % | |
Drawdown — # of months6 | | | 17 | | | | 16 | | | | 14 | | |
1. Performance results and calculations after the Funds' most recent fiscal year are unaudited. The principal value of the Funds will fluctuate so that an investor's units, when redeemed, may be worth more or less than the original cost. Returns are net of all expenses of the Funds, including the management fee and incentive allocations, and reflect reinvestment of all distributions, if applicable. Returns do not reflect payment of the 2% redemption fee or up-front placement fees, which could be up to 2%, which would reduce returns shown above. Past performance does not guarantee future results and current performance may be lower or higher than the figures shown. The net expense ratio and total expense ratio for the Hatteras Core Alternatives Fund, L.P. are 2.38% and 7.01%, respectively. The net expense ratio and total expense ratio for the Hatteras Core Alternatives TEI Fund, L.P. are 2.59% and 7.22%, respectively. The total expense ratio for both funds includes Acquired Fund Fees and Expenses of 4.63%. Please see the current Prospectus for detailed information regarding the expenses of the Funds.
2. Cumulative Return. Returns are net of all expenses of the Funds, including the management fee and incentive allocations, and reflect reinvestment of all distributions, if applicable. Returns do not reflect payment of placement fees, if applicable, which would reduce returns noted above.
3. S&P 500 Index and HFRX Global Hedge Fund Index (HFRXGL) data are sourced from Bloomberg. The indices are unmanaged portfolios of securities. Their performance results do not reflect the deduction of management fees, incentive compensation, commissions or other expenses. An investor cannot invest directly in an index. The S&P 500 Index consists of 500 stocks chosen for market size, liquidity and industry group representation. It is a market value weighted index, with each stock's weight in the Index proportionate to its market value. HFRXGL is designed to be representative of the overall composition of the hedge fund universe. It is comprised of eight strategies: convertible arbitrage, distressed securities, equity hedge, equity market neutral, event driven, macro, merger arbitrage and relative value arbitrage. The strategies are asset weighted based on the distribution of assets in the hedge fund industry.
4. Measurement of the investment's volatility.
5. The peak to trough decline of an investment.
6. Number of months of a peak to trough decline of an investment.
FOUR
PERFORMANCE SUMMARY1 (UNAUDITED)
HATTERAS CORE ALTERNATIVES INSTITUTIONAL FUND, L.P. (INCEPTION DATE: JANUARY 1, 2007)
Year | | Jan | | Feb | | Mar | | Apr | | May | | Jun | | Jul | | Aug | | Sep | | Oct | | Nov | | Dec | | Year2 | |
| | 2014 | | | | 0.60 | % | | | 1.44 | % | | | -0.52 | % | | | | | | | | | | | | | | | | | | | | | 1.52 | % | |
| | 2013 | | | | 1.23 | % | | | 0.03 | % | | | 0.59 | % | | | -0.32 | % | | | 0.65 | % | | | -0.46 | % | | | 1.00 | % | | | -0.43 | % | | | 1.87 | % | | | 1.94 | % | | | 1.57 | % | | | 2.75 | % | | | 10.87 | % | |
| | 2012 | | | | 2.03 | % | | | 0.96 | % | | | -0.12 | % | | | 0.13 | % | | | -0.52 | % | | | 0.07 | % | | | 0.56 | % | | | 0.80 | % | | | 0.70 | % | | | 0.02 | % | | | 0.15 | % | | | 1.00 | % | | | 5.92 | % | |
| | 2011 | | | | 0.47 | % | | | 1.15 | % | | | 0.75 | % | | | 0.89 | % | | | -0.16 | % | | | -0.72 | % | | | 0.25 | % | | | -2.31 | % | | | -3.20 | % | | | 1.09 | % | | | -0.89 | % | | | -0.50 | % | | | -3.23 | % | |
| | 2010 | | | | -0.24 | % | | | 0.12 | % | | | 1.78 | % | | | 1.01 | % | | | -2.57 | % | | | -1.06 | % | | | 0.41 | % | | | -0.04 | % | | | 2.36 | % | | | 1.36 | % | | | 0.34 | % | | | 2.37 | % | | | 5.89 | % | |
| | 2009 | | | | 0.24 | % | | | -0.36 | % | | | -0.45 | % | | | 0.55 | % | | | 3.75 | % | | | 0.86 | % | | | 2.27 | % | | | 1.27 | % | | | 2.46 | % | | | 0.17 | % | | | 0.91 | % | | | 1.01 | % | | | 13.35 | % | |
| | 2008 | | | | -2.85 | % | | | 1.91 | % | | | -2.81 | % | | | 1.63 | % | | | 2.14 | % | | | -0.42 | % | | | -2.78 | % | | | -1.47 | % | | | -8.22 | % | | | -7.50 | % | | | -4.23 | % | | | -0.94 | % | | | -23.27 | % | |
| | 2007 | | | | 1.12 | % | | | 0.73 | % | | | 1.65 | % | | | 1.89 | % | | | 2.06 | % | | | 0.82 | % | | | 0.00 | % | | | -1.89 | % | | | 2.00 | % | | | 2.75 | % | | | -1.71 | % | | | 0.97 | % | | | 10.76 | % | |
Returns | | Fund | | S&P 5003 | | HFRXGL3 | |
Year-to-date | | | 1.52 | % | | | 1.81 | % | | | 1.11 | % | |
| 1-Year | | | 10.50 | % | | | 21.86 | % | | | 4.63 | % | |
3-Year (annualized) | | | 4.06 | % | | | 14.66 | % | | | 0.46 | % | |
5-Year (annualized) | | | 6.85 | % | | | 21.16 | % | | | 3.82 | % | |
Annualized Since Inception | | | 2.27 | % | | | 6.18 | % | | | -0.40 | % | |
Historical Data
(since inception) | | Fund | | S&P 5003 | | HFRXGL3 | |
Cumulative Return | | | 17.69 | % | | | 54.41 | % | | | -2.87 | % | |
Standard Deviation4 | | | 6.64 | % | | | 16.75 | % | | | 6.58 | % | |
Largest Drawdown5 | | | -24.29 | % | | | -50.95 | % | | | -25.21 | % | |
Drawdown — # of months6 | | | 17 | | | | 16 | | | | 14 | | |
HATTERAS CORE ALTERNATIVES TEI INSTITUTIONAL FUND, L.P. (INCEPTION DATE: FEBRUARY 1, 2007)
Year | | Jan | | Feb | | Mar | | Apr | | May | | Jun | | Jul | | Aug | | Sep | | Oct | | Nov | | Dec | | Year2 | |
| | 2014 | | | | 0.60 | % | | | 1.43 | % | | | -0.52 | % | | | | | | | | | | | | | | | | | | | | | 1.51 | % | |
| | 2013 | | | | 1.10 | % | | | 0.03 | % | | | 0.47 | % | | | -0.29 | % | | | 0.59 | % | | | -0.43 | % | | | 0.90 | % | | | -0.41 | % | | | 1.67 | % | | | 1.73 | % | | | 1.40 | % | | | 2.71 | % | | | 9.84 | % | |
| | 2012 | | | | 2.01 | % | | | 0.94 | % | | | -0.13 | % | | | 0.13 | % | | | -0.52 | % | | | 0.07 | % | | | 0.56 | % | | | 0.80 | % | | | 0.70 | % | | | 0.02 | % | | | 0.14 | % | | | 1.00 | % | | | 5.85 | % | |
| | 2011 | | | | 0.48 | % | | | 1.16 | % | | | 0.69 | % | | | 0.81 | % | | | -0.14 | % | | | -0.65 | % | | | 0.23 | % | | | -2.24 | % | | | -3.21 | % | | | 1.07 | % | | | -0.91 | % | | | -0.51 | % | | | -3.26 | % | |
| | 2010 | | | | -0.23 | % | | | 0.13 | % | | | 1.79 | % | | | 1.01 | % | | | -2.56 | % | | | -1.06 | % | | | 0.42 | % | | | -0.05 | % | | | 2.34 | % | | | 1.35 | % | | | 0.33 | % | | | 2.36 | % | | | 5.88 | % | |
| | 2009 | | | | 0.24 | % | | | -0.36 | % | | | -0.43 | % | | | 0.54 | % | | | 3.74 | % | | | 0.85 | % | | | 2.26 | % | | | 1.27 | % | | | 2.46 | % | | | 0.18 | % | | | 0.92 | % | | | 1.02 | % | | | 13.37 | % | |
| | 2008 | | | | -2.87 | % | | | 1.87 | % | | | -2.83 | % | | | 1.59 | % | | | 2.09 | % | | | -0.44 | % | | | -2.82 | % | | | -1.50 | % | | | -8.26 | % | | | -7.51 | % | | | -4.24 | % | | | -0.91 | % | | | -23.48 | % | |
| | 2007 | | | | | | | | 0.71 | % | | | 1.62 | % | | | 1.87 | % | | | 2.03 | % | | | 0.80 | % | | | -0.04 | % | | | -1.95 | % | | | 2.01 | % | | | 2.72 | % | | | -1.76 | % | | | 0.96 | % | | | 9.23 | % | |
Returns | | Fund | | S&P 5003 | | HFRXGL3 | |
Year-to-date | | | 1.51 | % | | | 1.81 | % | | | 1.11 | % | |
| 1-Year | | | 9.74 | % | | | 21.86 | % | | | 4.63 | % | |
3-Year (annualized) | | | 3.71 | % | | | 14.66 | % | | | 0.46 | % | |
5-Year (annualized) | | | 6.62 | % | | | 21.16 | % | | | 3.82 | % | |
Annualized Since Inception | | | 1.91 | % | | | 6.03 | % | | | -0.61 | % | |
Historical Data
(since inception) | | Fund | | S&P 5003 | | HFRXGL3 | |
Cumulative Return | | | 14.53 | % | | | 52.11 | % | | | -4.31 | % | |
Standard Deviation4 | | | 6.65 | % | | | 16.84 | % | | | 6.60 | % | |
Largest Drawdown5 | | | -24.53 | % | | | -50.95 | % | | | -25.21 | % | |
Drawdown — # of months6 | | | 17 | | | | 16 | | | | 14 | | |
1. Performance results and calculations after the Funds' most recent fiscal year are unaudited. The principal value of the Funds will fluctuate so that an investor's units, when redeemed, may be worth more or less than the original cost. Returns are net of all expenses of the Funds, including the management fee and incentive allocations, and reflect reinvestment of all distributions, if applicable. Returns do not reflect payment of the 2% redemption fee or up-front placement fees, which could be up to 2%, which would reduce returns shown above. Past performance does not guarantee future results and current performance may be lower or higher than the figures shown. The net expense ratio and total expense ratio for the Hatteras Core Alternatives Institutional Fund, L.P. are 1.99% and 6.62%, respectively. The net expense ratio and total expense ratio for the Hatteras Core Alternatives TEI Institutional Fund, L.P. are 2.73% and 7.36%, respectively. The total expense ratio for both funds includes Acquired Fund Fees and Expenses of 4.63%. Please see the current Prospectus for detailed information regarding the expenses of the Funds.
2. Cumulative Return. Returns are net of all expenses of the Funds, including the management fee and incentive allocations, and reflect reinvestment of all distributions, if applicable. Returns do not reflect payment of placement fees, if applicable, which would reduce returns noted above.
3. S&P 500 Index and HFRX Global Hedge Fund Index (HFRXGL) data are sourced from Bloomberg. The indices are unmanaged portfolios of securities. Their performance results do not reflect the deduction of management fees, incentive compensation, commissions or other expenses. An investor cannot invest directly in an index. The S&P 500 Index consists of 500 stocks chosen for market size, liquidity and industry group representation. It is a market value weighted index, with each stock's weight in the Index proportionate to its market value. HFRXGL is designed to be representative of the overall composition of the hedge fund universe. It is comprised of eight strategies: convertible arbitrage, distressed securities, equity hedge, equity market neutral, event driven, macro, merger arbitrage and relative value arbitrage. The strategies are asset weighted based on the distribution of assets in the hedge fund industry.
4. Measurement of the investment's volatility.
5. The peak to trough decline of an investment.
6. Number of months of a peak to trough decline of an investment.
7. Number of months to recover from a drawdown.
FIVE
PERFORMANCE SUMMARY (UNAUDITED)
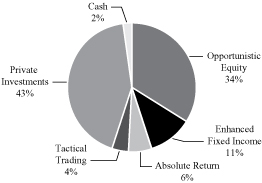
ALLOCATION
Strategies | | Target
Allocation | | Allocation
Actual* | | # of Funds | |
Opportunistic Equity (OE) | | | 30 | % | | | 34 | % | | | 27 | | |
Enhanced Fixed
Income (EFI) | | | 20 | % | | | 11 | % | | | 14 | | |
Absolute Return (AR) | | | 15 | % | | | 6 | % | | | 14 | | |
Tactical Trading (TT) | | | 10 | % | | | 4 | % | | | 6 | | |
Private Investments (PI) | | | 25 | % | | | 43 | % | | | 113 | | |
Cash | | | 0 | % | | | 2 | % | | | 0 | | |
Total | | | 100 | % | | | 100 | % | | | 174 | | |
Portfolio composition will change due to ongoing management of the Fund.
* Percentage of total investments as of March 31, 2014.
STRATEGY ALLOCATION
SIX
TOP 10 HOLDINGS (UNAUDITED)
| | Capital Balance
March 31, 2014 | | Percent of
Partners' Capital | |
Broadfin Healthcare Fund, L.P. | | $ | 51,704,609 | | | | 4.94 | % | |
Citadel Wellington, LLC (Class A) | | | 38,640,676 | | | | 3.69 | % | |
Falcon Edge Global, L.P. | | | 36,857,585 | | | | 3.52 | % | |
Teng Yue Partners Fund, L.P. | | | 33,585,270 | | | | 3.21 | % | |
Glade Brook Global Domestic Fund, L.P. | | | 31,913,484 | | | | 3.05 | % | |
Hound Partners, L.P. | | | 31,370,063 | | | | 3.00 | % | |
Tybourne Equity (US) Fund | | | 30,216,255 | | | | 2.89 | % | |
WisdomTree Japan Hedged Equity Fund | | | 28,976,814 | | | | 2.77 | % | |
Viking Global Equities, L.P. | | | 28,547,341 | | | | 2.73 | % | |
Indaba Capital Partner, L.P. | | | 28,463,801 | | | | 2.72 | % | |
Portfolio composition will change due to ongoing management of the Fund.
SEVEN
DEFINITIONS
Alpha measures excess return relative to the market; often referred to as a measurement of "manager skill".
Barclays Capital Long U.S. Treasury Index includes all publicly issued, U.S. Treasury securities that have a remaining maturity of 10 or more years, are rated investment grade, and have $250 million or more of outstanding face value.
Barclays Capital U.S. Aggregate Bond Index is an unmanaged index of investment-grade, U.S. dollar-denominated fixed-income securities of domestic issuers having a maturity greater than one year.
HFRI Fund of Funds Composite Index is an equal weighted index of over 650 constituent hedge fund of funds that invest over a broad range of strategies.
The HFRX Global Hedge Fund Index is index data, sourced from Hedge Funds Research, Inc., is designed to be representative of the overall composition of the hedge fund universe. It is comprised of all eligible hedge fund strategies; including but not limited to convertible arbitrage, distressed securities, equity hedge, equity market neutral, event driven, macro, merger arbitrage, and relative value arbitrage. The strategies are asset weighted based on the distribution of assets in the hedge fund industry.
MSCI EAFE (Net) Index is a total return index, reported in U.S. dollars, based on share prices and reinvested net dividends of approximately 1,100 companies from 21 countries and is not available for purchase.
MSCI EM (Net) Index captures large and mid cap representation across 21 Emerging Markets (EM) countries*. With 820 constituents, the index covers approximately 85% of the free float-adjusted market capitalization in each country.
MSCI World (Net) Index is a stock market index of 'world' stocks, and is often used as a common benchmark for 'world' or 'global' stock funds. The index includes a collection of stocks of all the developed markets in the world, as defined by MSCI.
Standard & Poor's (S&P) 500 Index is an index of 500 stocks chosen for market size, liquidity, and industry grouping, among other factors. The S&P 500 is designed to be a leading indicator of U.S. equities and is meant to reflect the risk/return characteristics of the large cap universe. Companies included in the index are selected by the S&P Index Committee, a team of analysts and economists at Standard & Poor's. The S&P 500 is a market value weighted index — each stock's weight in the index is proportionate to its market value.
EIGHT
SAFE HARBOR AND FORWARD-LOOKING STATEMENTS DISCLOSURE
Safe Harbor Statement: This presentation shall not constitute an offer to sell or a solicitation of an offer to buy, nor shall there be any sale of, the securities in any state or jurisdiction in which such offer or solicitation or sale would be unlawful prior to registration or qualification under the laws of such state or jurisdiction. Forward-Looking Statements: This presentation contains certain statements that may include "forward-looking statements" within the meaning of Section 27A of the Securities Act of 1933 and Section 21E of the Securities Exchange Act of 1934. All statements, other than statements of historical fact, included herein are "forward-looking statements." Included among "forward-looking statements" are, among other things, statements about our future outlook on opportunities based upon current market conditions. Although the company believes that the expectations reflected in these forward-looking statements are reasonable, they do involve assumptions, risks and uncertainties, and these expectations may prove to be incorrect. Actual results could differ materially from those anticipated in these forward-looking statements as a result of a variety of factors. You should not place undue reliance on these forward-looking statements, which speak only as of the date of this discussion. Other than as required by law, the company does not assume a duty to update these forward-looking statements. Past performance is no guarantee of future results. The illustrations are not intended to predict the performance of any specific investment or security. The past performance figures do not represent performance of any Hatteras security and there can be no assurance that any Hatteras security will achieve the past returns of the illustrative examples. This is not an offering to subscribe for units in any fund and is intended for informational purposes only. An offering can only be made by delivery of the Prospectus to "qualified clients" within the meaning of U.S. securities laws.
Please carefully consider the investment objectives, risks, and charges and expenses of the Funds before investing. Please read the Prospectus carefully before investing as it contains important information on the investment objectives, composition, fees, charges and expenses, risks, suitability, and tax obligations of investing in the Funds. Copies of the Prospectus and performance data current to the most recent month-end may be obtained online at hatterasfunds.com or by contacting Hatteras at 866.388.6292. Past performance does not guarantee future results.
The Hatteras Core Alternatives Fund, L.P.; the Hatteras Core Alternatives TEI Fund, L.P; the Hatteras Core Alternatives Institutional Fund, L.P.; and the Hatteras Core Alternatives TEI Institutional Fund, L.P. (collectively referred to herein as the "Hatteras Core Alternatives Fund" or the "Fund") are Delaware limited partnerships that are registered under the Investment Company Act of 1940 (the "1940 Act"), as amended, as non-diversified, closed-end management investment companies whose
units are registered under the Securities Act of 1933, as amended. The Hatteras Core Alternatives Fund is a fund of alternative investments. As such, the Fund invests in private hedge funds and private equity investments. Hedge funds are speculative investments and are not suitable for all investors, nor do they represent a complete investment program. A hedge fund can be described generally as a private and unregistered investment pool that accepts investors' money and employs hedging and arbitrage techniques using long and short positions, leverage and derivatives, and investments in many markets.
Key Risk Factors: The Fund, through an investment in the Master Fund, will invest substantially all of its assets in underlying funds that are generally not registered as investment companies under the 1940 Act and, therefore, the Fund will not have the benefit of various protections provided under the 1940 Act with respect to an investment in those underlying funds. The Fund can be highly volatile, carry substantial fees, and involve complex tax structures. Investments in the Fund involve a high degree of risk, including loss of entire capital. The underlying funds may engage in speculative investment strategies and practices, such as the use of leverage, short sales, and derivatives transactions, which can increase the risk of investment loss. The Fund provides limited liquidity, and units in the Fund are not transferable. Liquidity will be provided only through repurchase offers made by the Fund from time to time, generally on a quarterly basis upon prior written notice. The success of the Fund is highly dependent on the financial and managerial expertise of its principals and key personnel of the Fund's investment manager. Although the investment manager for the Fund expects to receive detailed information from each underlying fund on a regular basis regarding its valuation, investment performance, and strategy, in most cases the investment managers have little or no means of independently verifying this information. The underlying funds are not required to provide transparency with respect to their respective investments. By investing in the underlying funds indirectly through the Fund, investors will be subject to a dual layer of fees, both at the Fund and underlying fund levels. Certain underlying funds will not provide final Schedule K-1s for any fiscal year before April 15th of the following year. Those funds, however, will endeavor to provide estimates of taxable income or losses with respect to their investments. Please see the Prospectus for a detailed discussion of the specific risks disclosed here and other important risks and considerations.
Securities offered through Hatteras Capital Distributors, LLC, member FINRA/SIPC. Hatteras Capital Distributors, LLC is affiliated with Hatteras Investment Partners, LLC by virtue of common control/ownership. This document is not an offering to subscribe for units of any fund and is intended for informational purposes only.
NINE
[THIS PAGE INTENTIONALLY LEFT BLANK]
HATTERAS FUNDS
Hatteras Core Alternatives Fund, L.P.
(a Delaware Limited Partnership)
Hatteras Core Alternatives TEI Fund, L.P.
(a Delaware Limited Partnership)
Hatteras Core Alternatives Institutional Fund, L.P.
(a Delaware Limited Partnership)
Hatteras Core Alternatives TEI Institutional Fund, L.P.
(a Delaware Limited Partnership)
Financial Statements
As of and for the year ended March 31, 2014
With Report of Independent Registered Public Accounting Firm
HATTERAS FUNDS
As of and for the year ended March 31, 2014
Hatteras Core Alternatives Fund, L.P. (a Delaware Limited Partnership)
Hatteras Core Alternatives TEI Fund, L.P. (a Delaware Limited Partnership)
Hatteras Core Alternatives Institutional Fund, L.P. (a Delaware Limited Partnership)
Hatteras Core Alternatives TEI Institutional Fund, L.P. (a Delaware Limited Partnership)
Table of Contents
| Report of Independent Registered Accounting Firm | | | 1 | | |
| Statements of Assets, Liabilities and Partners' Capital | | | 2 | | |
| Statements of Operations | | | 3 | | |
| Statements of Changes in Partners' Capital | | | 4 | | |
| Statements of Cash Flows | | | 5 | | |
| Notes to Financial Statements | | | 6-15 | | |
| Board of Directors (Unaudited) | | | 16-17 | | |
| Fund Management (Unaudited) | | | 18 | | |
| Other Information (Unaudited) | | | 19-22 | | |
| Financial Statements of Hatteras Master Fund, L.P. | | | 23 | | |
HATTERAS FUNDS
(each a Delaware Limited Partnership)
REPORT OF INDEPENDENT REGISTERED PUBLIC ACCOUNTING FIRM
To each Board of Directors and Partners of Hatteras Core Alternatives Fund, L.P., Hatteras Core Alternatives TEI Fund, L.P., Hatteras Core Alternatives Institutional Fund, L.P., and Hatteras Core Alternatives TEI Institutional Fund, L.P.:
We have audited the accompanying statements of assets, liabilities and partners' capital of Hatteras Core Alternatives Fund, L.P., Hatteras Core Alternatives TEI Fund, L.P., Hatteras Core Alternatives Institutional Fund, L.P., and Hatteras Core Alternatives TEI Institutional Fund, L.P. (each a Delaware Limited Partnership) (collectively the "Feeder Funds") as of March 31, 2014, and the related statements of operations and cash flows for the year then ended, and the statements of changes in partners' capital for each of the two years in the period then ended. These financial statements are the responsibility of the Feeder Funds' management. Our responsibility is to express an opinion on these financial statements based on our audits.
We conducted our audits in accordance with the standards of the Public Company Accounting Oversight Board (United States). Those standards require that we plan and perform the audits to obtain reasonable assurance about whether the financial statements are free of material misstatement. The Feeder Funds are not required to have, nor were we engaged to perform, audits of their internal control over financial reporting. Our audits included consideration of internal control over financial reporting as a basis for designing audit procedures that are appropriate in the circumstances, but not for the purpose of expressing an opinion on the effectiveness of the Feeder Funds' internal control over financial reporting. Accordingly, we express no such opinion. An audit also includes examining, on a test basis, evidence supporting the amounts and disclosures in the financial statements, assessing the accounting principles used and significant estimates made by management, as well as evaluating the overall financial statement presentation. We believe that our audits provide a reasonable basis for our opinion.
In our opinion, such financial statements referred to above present fairly, in all material respects, the financial position of each of the Feeder Funds as of March 31, 2014, the results of their operations and their cash flows for the year then ended, and the changes in their partners' capital for each of the two years in the period then ended, in conformity with accounting principles generally accepted in the United States of America.
As discussed in Note 2 to the Hatteras Master Fund, L.P. financial statements, which are attached herein and should be read in conjunction with this report, the financial statements include investments valued at $1,024,053,691 (92.68% of total assets) as of March 31, 2014, whose fair value have been estimated by management in the absence of readily determinable fair values. Management's estimates are based on information provided by the underlying fund advisers.
/s/ Deloitte & Touche LLP
Philadelphia, Pennsylvania
May 30, 2014
ONE
HATTERAS FUNDS
(each a Delaware Limited Partnership)
STATEMENTS OF ASSETS, LIABILITIES AND PARTNERS' CAPITAL
March 31, 2014
| | | Hatteras
Core Alternatives
Fund, L.P. | | Hatteras
Core Alternatives
TEI
Fund, L.P.* | | Hatteras
Core Alternatives
Institutional
Fund, L.P. | | Hatteras
Core Alternatives
TEI
Institutional
Fund, L.P.* | |
Assets | |
Investment in Hatteras Master Fund, L.P., at
fair value | | $ | 166,947,033 | | | $ | 222,549,790 | | | $ | 179,185,802 | | | $ | 478,391,881 | | |
Cash | | | 200,000 | | | | 255,000 | | | | 200,000 | | | | 255,000 | | |
Receivable for withdrawals from Hatteras
Master Fund, L.P. | | | 8,742,352 | | | | 11,657,555 | | | | 9,401,307 | | | | 25,080,095 | | |
Investment in Hatteras Master Fund, L.P.
paid in advance | | | 100,785 | | | | — | | | | — | | | | — | | |
Prepaid assets | | | 4,360 | | | | 5,794 | | | | 4,666 | | | | 12,529 | | |
Total assets | | $ | 175,994,530 | | | $ | 234,468,139 | | | $ | 188,791,775 | | | $ | 503,739,505 | | |
Liabilities and partners' capital | |
Withdrawals payable | | $ | 8,745,446 | | | $ | 11,657,534 | | | $ | 9,401,307 | | | $ | 25,080,067 | | |
Contributions received in advance | | | 250,000 | | | | 15,000 | | | | — | | | | 50,000 | | |
Servicing fee payable | | | 123,946 | | | | 165,270 | | | | 15,672 | | | | 41,808 | | |
Professional fees payable | | | 50,500 | | | | 31,773 | | | | 50,500 | | | | 30,500 | | |
Accounting and administration fees payable | | | 22,892 | | | | 32,275 | | | | 19,375 | | | | 32,337 | | |
Printing fees payable | | | 25,000 | | | | 25,000 | | | | 25,000 | | | | 25,000 | | |
Custodian fees payable | | | 800 | | | | 1,316 | | | | 800 | | | | 1,316 | | |
Withholding tax payable | | | — | | | | 116,234 | | | | — | | | | 237,409 | | |
Other accrued expenses | | | — | | | | 5,045 | | | | — | | | | 2,885 | | |
Total liabilities | | | 9,218,584 | | | | 12,049,447 | | | | 9,512,654 | | | | 25,501,322 | | |
Partners' capital | | | 166,775,946 | | | | 222,418,692 | | | | 179,279,121 | | | | 478,238,183 | | |
Total liabilities and partners' capital | | $ | 175,994,530 | | | $ | 234,468,139 | | | $ | 188,791,775 | | | $ | 503,739,505 | | |
Components of partners' capital | |
Capital contributions (net) | | $ | 154,090,135 | | | $ | 211,201,196 | | | $ | 163,532,827 | | | $ | 409,928,697 | | |
Accumulated net investment loss | | | (15,208,146 | ) | | | (20,914,687 | ) | | | (91,582 | ) | | | (1,190,697 | ) | |
Accumulated net realized gain (loss) | | | (952,591 | ) | | | 773,091 | | | | (734,289 | ) | | | 13,038,613 | | |
Accumulated net unrealized appreciation
on investments | | | 28,846,548 | | | | 31,359,092 | | | | 16,572,165 | | | | 56,461,570 | | |
Partners' capital | | $ | 166,775,946 | | | $ | 222,418,692 | | | $ | 179,279,121 | | | $ | 478,238,183 | | |
Net asset value per unit | | $ | 102.68 | | | $ | 102.08 | | | $ | 106.86 | | | $ | 105.65 | | |
Maximum offering price per unit** | | $ | 104.74 | | | $ | 104.12 | | | $ | 106.86 | | | $ | 105.65 | | |
Number of authorized units | | | 7,500,000.00 | | | | 7,500,000.00 | | | | 7,500,000.00 | | | | 10,000,000.00 | | |
Number of outstanding units | | | 1,624,178.15 | | | | 2,178,910.44 | | | | 1,677,741.88 | | | | 4,526,662.44 | | |
* Consolidated Statement. See note 1.
** The maximum sales load for the Hatteras Core Alternatives Fund, L.P. and the Hatteras Core Alternatives TEI Fund, L.P. is 2.00%. The remaining funds are not subject to a sales load.
See notes to financial statements.
TWO
HATTERAS FUNDS
(each a Delaware Limited Partnership)
STATEMENTS OF OPERATIONS
For the year ended March 31, 2014
| | | Hatteras
Core Alternatives
Fund, L.P. | | Hatteras
Core Alternatives
TEI
Fund, L.P.* | | Hatteras
Core Alternatives
Institutional
Fund, L.P. | | Hatteras
Core Alternatives
TEI
Institutional
Fund, L.P.* | |
Net investment income allocated from
Hatteras Master Fund, L.P. | |
Investment income | | $ | 6,352,048 | | | $ | 8,466,554 | | | $ | 6,821,130 | | | $ | 18,217,698 | | |
Operating expenses | | | (2,342,506 | ) | | | (3,120,808 | ) | | | (2,515,179 | ) | | | (6,755,397 | ) | |
Performance allocation | | | — | | | | — | | | | (737,135 | ) | | | (5,008,658 | ) | |
Net investment income allocated from
Hatteras Master Fund, L.P. | | | 4,009,542 | | | | 5,345,746 | | | | 3,568,816 | | | | 6,453,643 | | |
Feeder Fund investment income | |
Interest | | | 63 | | | | 74 | | | | 55 | | | | 106 | | |
Total fund investment income | | | 63 | | | | 74 | | | | 55 | | | | 106 | | |
Feeder Fund expenses | |
Servicing fee | | | 1,522,054 | | | | 2,027,244 | | | | 192,089 | | | | 514,236 | | |
Accounting and administration fees | | | 133,025 | | | | 193,845 | | | | 115,107 | | | | 194,055 | | |
Insurance fees | | | 52,314 | | | | 69,554 | | | | 55,729 | | | | 149,488 | | |
Directors' fees | | | 43,125 | | | | 43,125 | | | | 43,125 | | | | 43,125 | | |
Professional fees | | | 71,858 | | | | 49,004 | | | | 67,938 | | | | 59,484 | | |
Printing fees | | | 45,614 | | | | 42,451 | | | | 47,442 | | | | 47,808 | | |
Custodian fees | | | 7,885 | | | | 11,161 | | | | 11,688 | | | | 15,717 | | |
Withholding tax | | | — | | | | 581,172 | | | | — | | | | 1,187,046 | | |
Other expenses | | | 31,731 | | | | 33,381 | | | | 32,486 | | | | 39,172 | | |
Total Feeder Fund expenses | | | 1,907,606 | | | | 3,050,937 | | | | 565,604 | | | | 2,250,131 | | |
Net investment income | | | 2,101,999 | | | | 2,294,883 | | | | 3,003,267 | | | | 4,203,618 | | |
Net realized gain and change in unrealized appreciation on
investments allocated from Hatteras Master Fund, L.P. | |
Net realized gain from investments in Adviser Funds,
securities and foreign exchange transactions | | | 4,193,753 | | | | 5,606,107 | | | | 4,517,464 | | | | 12,061,320 | | |
Net change in unrealized appreciation on investments in
Adviser Funds, securities and foreign exchange
transactions | | | 10,660,433 | | | | 14,219,601 | | | | 11,394,150 | | | | 30,822,744 | | |
Net realized gain and change in unrealized appreciation
on investments allocated from Hatteras Master
Fund, L.P. | | | 14,854,186 | | | | 19,825,708 | | | | 15,911,614 | | | | 42,884,064 | | |
Net increase in partners' capital resulting from operations | | $ | 16,956,185 | | | $ | 22,120,591 | | | $ | 18,914,881 | | | $ | 47,087,682 | | |
* Consolidated Statement. See note 1.
See notes to financial statements.
THREE
HATTERAS FUNDS
(each a Delaware Limited Partnership)
STATEMENTS OF CHANGES IN PARTNERS' CAPITAL
For the year ended March 31, 2013 and the year ended March 31, 2014
| | | Hatteras
Core Alternatives
Fund, L.P. | | Hatteras
Core Alternatives
TEI
Fund, L.P.* | | Hatteras
Core Alternatives
Institutional
Fund, L.P. | | Hatteras
Core Alternatives
TEI
Institutional
Fund, L.P.* | |
| | | Limited
Partners | | Limited
Partners | | Limited
Partners | | Limited
Partners | |
Partners' Capital, at March 31, 2012 | | $ | 234,880,501 | | | $ | 312,203,760 | | | $ | 236,891,562 | | | $ | 624,546,925 | | |
Capital contributions | | | 8,346,000 | | | | 10,697,277 | | | | 12,778,549 | | | | 26,609,863 | | |
Capital withdrawals | | | (66,564,692 | ) | | | (87,225,548 | ) | | | (62,321,857 | ) | | | (145,459,748 | ) | |
Repurchase fees | | | 189,352 | | | | 99,866 | | | | 190,180 | | | | 118,808 | | |
Net investment income/(loss) | | | (367,785 | ) | | | (717,489 | ) | | | 1,339,583 | | | | 2,382,329 | | |
Net realized gain from investments in Adviser Funds,
securities and foreign exchange transactions | | | 5,481,387 | | | | 7,330,608 | | | | 5,841,578 | | | | 15,628,270 | | |
Net change in unrealized appreciation on investments
in Adviser Funds, securities and foreign exchange
transactions | | | 2,989,143 | | | | 3,660,794 | | | | 2,892,592 | | | | 7,728,454 | | |
Partners' Capital, at March 31, 2013** | | $ | 184,953,906 | | | $ | 246,049,268 | | | $ | 197,612,187 | | | $ | 531,554,901 | | |
Capital contributions | | | 945,102 | | | | 2,671,050 | | | | 1,495,233 | | | | 3,553,949 | | |
Capital withdrawals | | | (36,082,341 | ) | | | (48,425,178 | ) | | | (38,743,408 | ) | | | (103,958,885 | ) | |
Withdrawal fees | | | 3,094 | | | | 2,961 | | | | 228 | | | | 536 | | |
Net investment income | | | 2,101,999 | | | | 2,294,883 | | | | 3,003,267 | | | | 4,203,618 | | |
Net realized gain from investments in Adviser Funds,
securities and foreign exchange transactions | | | 4,193,753 | | | | 5,606,107 | | | | 4,517,464 | | | | 12,061,320 | | |
Net change in unrealized appreciation on investments
in Adviser Funds, securities and foreign exchange
transactions | | | 10,660,433 | | | | 14,219,601 | | | | 11,394,150 | | | | 30,822,744 | | |
Partners' Capital, at March 31, 2014*** | | $ | 166,775,946 | | | $ | 222,418,692 | | | $ | 179,279,121 | | | $ | 478,238,183 | | |
* Consolidated Statement. See note 1.
** Including accumulated net investment loss of $17,310,145; $23,209,570; $3,094,849; and $5,394,315, respectively.
*** Including accumulated net investment loss of $15,208,146; $20,914,687; $91,582; and $1,190,697, respectively.
See notes to financial statements.
FOUR
HATTERAS FUNDS
(each a Delaware Limited Partnership)
STATEMENTS OF CASH FLOWS
For the year ended March 31, 2014
| | | Hatteras
Core Alternatives
Fund, L.P. | | Hatteras
Core Alternatives
TEI
Fund, L.P.* | | Hatteras
Core Alternatives
Institutional
Fund, L.P. | | Hatteras
Core Alternatives
TEI
Institutional
Fund, L.P.* | |
Cash flows from operating activities: | |
Net increase in partners' capital resulting from operations | | $ | 16,956,185 | | | $ | 22,120,591 | | | $ | 18,914,881 | | | $ | 47,087,682 | | |
Adjustments to reconcile net increase in partners' capital
resulting from operations to net cash provided by
operating activities: | |
Purchase of interests in Hatteras Master Fund, L.P. | | | (379,742 | ) | | | (1,302,726 | ) | | | (1,095,465 | ) | | | (2,796,681 | ) | |
Proceeds from withdrawals from Hatteras Master Fund, L.P. | | | 37,286,647 | | | | 50,049,324 | | | | 38,948,072 | | | | 105,214,305 | | |
Net investment income allocated from Hatteras Master
Fund, L.P. | | | (4,009,542 | ) | | | (5,345,746 | ) | | | (3,568,816 | ) | | | (6,453,643 | ) | |
Net realized gain from investments in Adviser Funds,
securities and foreign exchange transactions allocated
from Hatteras Master Fund, L.P. | | | (4,193,753 | ) | | | (5,606,107 | ) | | | (4,517,464 | ) | | | (12,061,320 | ) | |
Net change in unrealized appreciation on investments in
Adviser Funds, securities and foreign exchange transactions
allocated from Hatteras Master Fund, L.P. | | | (10,660,433 | ) | | | (14,219,601 | ) | | | (11,394,150 | ) | | | (30,822,744 | ) | |
(Increase)/Decrease in receivable for withdrawals from
Hatteras Master Fund, L.P. | | | 991,655 | | | | 1,289,973 | | | | 998,842 | | | | 2,897,248 | | |
(Increase)/Decrease in investment in Hatteras
Master Fund, L.P. paid in advance | | | 62,616 | | | | 102,229 | | | | 486,857 | | | | 439,525 | | |
(Increase)/Decrease in prepaid assets | | | 37 | | | | 55 | | | | (221 | ) | | | (802 | ) | |
Increase/(Decrease) in servicing fee payable | | | (14,050 | ) | | | (18,280 | ) | | | (1,663 | ) | | | (4,823 | ) | |
Increase/(Decrease) in accounting and administration
fees payable | | | 11,325 | | | | 16,193 | | | | 9,836 | | | | 16,189 | | |
Increase/(Decrease) in professional fees payable | | | 6,848 | | | | 6,106 | | | | 6,280 | | | | 15,990 | | |
Increase/(Decrease) in custodian fees payable | | | — | | | | (84 | ) | | | — | | | | (84 | ) | |
Increase/(Decrease) in printing fees payable | | | 15,000 | | | | 10,000 | | | | 20,000 | | | | (2,599 | ) | |
(Increase)/Decrease in withholding tax payable | | | — | | | | 116,234 | | | | — | | | | 237,409 | | |
Increase/(Decrease) in other accrued expenses | | | (5,000 | ) | | | (3,000 | ) | | | (5,000 | ) | | | (11,786 | ) | |
Net cash provided by operating activities | | | 36,067,793 | | | | 47,215,161 | | | | 38,801,989 | | | | 103,753,866 | | |
Cash flows from financing activities: | |
Capital contributions | | | 850,102 | | | | 2,347,050 | | | | 940,033 | | | | 3,051,759 | | |
Capital withdrawals, net of withdrawal fees | | | (37,067,895 | ) | | | (49,712,211 | ) | | | (39,742,022 | ) | | | (106,855,625 | ) | |
Net cash used in financing activities | | | (36,217,793 | ) | | | (47,365,161 | ) | | | (38,801,989 | ) | | | (103,803,866 | ) | |
Net change in cash | | | (150,000 | ) | | | (150,000 | ) | | | — | | | | (50,000 | ) | |
Cash at beginning of year | | | 350,000 | | | | 405,000 | | | | 200,000 | | | | 305,000 | | |
Cash at end of year | | $ | 200,000 | | | $ | 255,000 | | | $ | 200,000 | | | $ | 255,000 | | |
* Consolidated Statement. See note 1.
See notes to financial statements.
FIVE
HATTERAS FUNDS
(each a Delaware Limited Partnership)
NOTES TO FINANCIAL STATEMENTS
As of and for the year ended March 31, 2014
1. ORGANIZATION
The Hatteras Funds, each a "Feeder Fund" and collectively the "Feeder Funds" are:
Hatteras Core Alternatives Fund, L.P.
Hatteras Core Alternatives TEI Fund, L.P.
Hatteras Core Alternatives Institutional Fund, L.P.
Hatteras Core Alternatives TEI Institutional Fund, L.P.
The Hatteras Core Alternatives TEI Fund, L.P. and the Hatteras Core Alternatives TEI Institutional Fund, L.P. each invest substantially all of their assets in the Hatteras Core Alternatives Offshore Fund, LDC and Hatteras Core Alternatives Offshore Institutional Fund, LDC, (collectively the "Blocker Funds"), respectively. The Blocker Funds are Cayman Islands limited duration companies with the same investment objective as the Feeder Funds. The Blocker Funds serve solely as intermediate entities through which the Hatteras Core Alternatives TEI Fund, L.P. and the Hatteras Core Alternatives TEI Institutional Fund, L.P. invest in Hatteras Master Fund, L.P. (the "Master Fund" and together with the Feeder Funds, the "Funds"). The Blocker Funds enable tax-exempt Limited Partners (as defined below) to invest without receiving certain income in a form that would otherwise be taxable to such tax-exempt Limited Partners regardless of their tax-exempt status. The Hatteras Core Alternatives TEI Fund, L.P. owns 100% of the participating beneficial interests of the Hatteras Core Alternatives Offshore Fund, LDC and the Hatteras Core Alternatives TEI Institutional Fund, L.P. owns 100% of the participating beneficial interests of the Hatteras Core Alternatives Offshore Institutional Fund, LDC. Where these Notes to Financial Statements discuss the Feeder Funds' investment in the Master Fund, for Hatteras Core Alternatives TEI Fund, L.P. and Hatteras Core Alternatives TEI Institutional Fund, L.P., it means their investment in the Master Fund through the applicable Blocker Fund.
The Feeder Funds are organized as Delaware limited partnerships, and are registered under the Securities Act of 1933, as amended, and the Investment Company Act of 1940, as amended, (the "1940 Act") as closed-end, non-diversified, management investment companies. The primary investment objective of the Feeder Funds is to provide capital appreciation consistent with the return characteristic of the alternative investment portfolios of larger endowments. The Feeder Funds' secondary objective is to provide capital appreciation with less volatility than that of the equity markets. To achieve their objectives, the Feeder Funds provide their investors with access to a broad range of investment strategies, asset categories and trading advisers ("Advisers") and by providing overall asset allocation services typically available on a collective basis to larger institutions, through an investment of substantially all of their assets into the Master Fund, which is registered under the 1940 Act. The Feeder Funds are co-managed by Hatteras Investment Partners, LLC ("HIP"), a Delaware limited liability company registered as an investment adviser under the Investment Advisers Act of 1940, as amended (the "Advisers Act"), and Morgan Creek Capital Management, LLC ("MCCM," together with HIP, the "Investment Managers"), a North Carolina limited liability company registered as an investment adviser under the Advisers Act. Investors who acquire units of limited partnership interest in the Feeder Funds ("Units") are the limited partners (each, a "Limited Partner" and together, the "Limited Partners") of the Feeder Funds.
The financial statements of the Master Fund, including the schedule of investments, are included elsewhere in this report and should be read with the Feeder Funds' financial statements. The percentages of the Master Fund's beneficial limited partnership interests owned by the Feeder Funds at March 31, 2014 were:
Hatteras Core Alternatives Fund, L.P. | | | 15.94 | % | |
Hatteras Core Alternatives TEI Fund, L.P. | | | 21.25 | % | |
Hatteras Core Alternatives Institutional Fund, L.P. | | | 17.13 | % | |
Hatteras Core Alternatives TEI Institutional Fund, L.P. | | | 45.68 | % | |
Hatteras Investment Management, LLC, a Delaware limited liability company, serves as the General Partner of each of the Feeder Funds and the Master Fund (the "General Partner"). The General Partner is an affiliate of HIP. The General Partner has appointed a Board of Directors for each Feeder Fund (collectively the "Boards") and, to the fullest extent permitted by applicable law, has irrevocably delegated to the Boards its rights and powers to monitor and oversee the business affairs of the Feeder Funds, including the complete and exclusive authority to oversee and establish policies regarding the management, conduct and operation of the Feeder Funds' business.
2. SIGNIFICANT ACCOUNTING POLICIES
These financial statements have been prepared in accordance with accounting principles generally accepted in the United States of America ("GAAP") and are expressed in United States dollars. The following is a summary of significant accounting and reporting policies used in preparing the financial statements.
a. Investment Valuation
The Feeder Funds do not make direct investments in securities or financial instruments, and invest substantially all of their assets in the Master Fund. The Feeder Funds record their investment in the Master Fund at fair value. Because the full amount of investment cannot be redeemed at least quarterly, each Feeder Fund's investment in the Master Fund would be considered level 3 under Accounting Standards Codification 820 — Fair Value, as described in the notes to the Master Fund's financial statements included elsewhere in this report. Valuation
SIX
HATTERAS FUNDS
(each a Delaware Limited Partnership)
NOTES TO FINANCIAL STATEMENTS (Continued)
As of and for the year ended March 31, 2014
2. SIGNIFICANT ACCOUNTING POLICIES (CONCLUDED)
a. Investment Valuation (concluded)
of securities held by the Master Fund, including the Master Fund's disclosure of investments under the three-tier hierarchy, is also discussed in the notes to the Master Fund's financial statements.
b. Allocations from the Master Fund
The Feeder Funds record their allocated portion of income, expense, realized gains and losses and unrealized appreciation and depreciation from the Master Fund.
c. Feeder Fund Level Income and Expenses
Interest income on any cash or cash equivalents held by the Feeder Funds will be recognized on an accrual basis. Expenses that are specifically attributed to the Feeder Funds are charged to each Feeder Fund. Because the Feeder Funds bear their proportionate share of the management fee of the Master Fund, the Feeder Funds pay no direct management fee to the Investment Managers. The Feeder Funds' specific expenses are recorded on an accrual basis.
d. Tax Basis Reporting
Because the Master Fund invests primarily in investment funds that are treated as partnerships for U.S. Federal tax purposes, the tax character of each of the Feeder Fund's allocated earnings is established dependent upon the tax filings of the investment vehicles operated by the Advisers ("Adviser Funds"). Accordingly, the tax basis of these allocated earnings and the related balances are not available as of the reporting date.
e. Income Taxes
For U.S. Federal income tax purposes, the Feeder Funds are treated as partnerships, and each Limited Partner in each respective Feeder Fund is treated as the owner of its proportionate share of the net assets, income, expenses, and the realized and unrealized gains (losses) of such Feeder Fund. Accordingly, no federal, state or local income taxes have been provided on profits of the Feeder Funds since the Limited Partners are individually liable for the taxes on their share of the Feeder Funds.
The Feeder Funds file tax returns as prescribed by the tax laws of the jurisdictions in which they operate. In the normal course of business, the Feeder Funds are subject to examination by federal, state, local and foreign jurisdictions, where applicable. For returns filed for the years ended December 31, 2010 through December 31, 2013, the Feeder Funds remain subject to examination by the major tax jurisdictions under the statute of limitations.
The Feeder Funds have reviewed any potential tax positions as of March 31, 2014 and have determined that they do not have a liability for any unrecognized tax benefits or expense. The Feeder Funds recognize interest and penalties, if any, related to unrecognized tax benefits as income tax expense in the Statement of Operations. During the year ended March 31, 2014, the Feeder Funds did not incur any material interest or penalties.
f. Cash
Cash includes amounts held in interest bearing demand deposit accounts. Such cash, at times, may exceed federally insured limits. The Feeder Funds have not experienced any losses in such accounts and do not believe they are exposed to any significant credit risk on such accounts.
g. Use of Estimates
The preparation of financial statements in conformity with GAAP requires management to make estimates and assumptions that affect the reported amounts of assets and liabilities and disclosure of contingent assets and liabilities at the date of the financial statements, and the reported amounts of increases and decreases in Limited Partners' capital from operations during the reporting period. Actual results could differ from those estimates.
h. Consolidated Financial Statements
The asset, liability, and equity accounts of the Hatteras Core Alternatives TEI Fund, L.P. and the Hatteras Core Alternatives TEI Institutional Fund, L.P. are consolidated with their respective Blocker Funds as presented in the Statements of Assets, Liabilities, and Partners' Capital, Statements of Operations, Statements of Changes in Partners' Capital, and Statements of Cash Flows. All intercompany accounts and transactions have been eliminated in consolidation.
SEVEN
HATTERAS FUNDS
(each a Delaware Limited Partnership)
NOTES TO FINANCIAL STATEMENTS (Continued)
As of and for the year ended March 31, 2014
3. ALLOCATION OF LIMITED PARTNERS' CAPITAL
Net profits or net losses of the Feeder Funds for each allocation period ("Allocation Period") will be allocated among and credited to or debited against the capital accounts of the Limited Partners. Net profits or net losses will be measured as the net change in the value of the Limited Partners' capital of the Feeder Funds, including any net change in unrealized appreciation or depreciation of investments and realized income and gains or losses and expenses during an Allocation Period, adjusted to exclude any items to be allocated among the capital accounts of the Limited Partners in accordance with the Limited Partners' respective investment percentages.
Allocation Periods generally begin on the first calendar day of each month and end at the close of business on the last day of each month.
The Feeder Funds maintain a separate capital account ("Capital Account") on their books for each Limited Partner. Each Limited Partner's Capital Account will have an opening balance equal to the Limited Partner's initial purchase of the Feeder Fund (i.e., the amount of the investment less any applicable sales load of up to 2 percent of the purchased amount), and thereafter, will be (i) increased by the amount of any additional purchases by such Limited Partner; (ii) decreased for any payments upon repurchase or sale of such Limited Partner's interest or any distributions in respect of such Limited Partner; and (iii) increased or decreased as of the close of each Allocation Period by such Limited Partner's allocable share of the net profits or net losses of the Feeder Fund.
| | | Hatteras
Core Alternatives
Fund, L.P. | | Hatteras
Core Alternatives
TEI
Fund, L.P. | | Hatteras
Core Alternatives
Institutional
Fund, L.P. | | Hatteras
Core Alternatives
TEI
Institutional
Fund, L.P. | |
Beginning Units, April 1, 2012 | | | 2,622,166.10 | | | | 3,493,192.83 | | | | 2,569,519.62 | | | | 6,785,237.10 | | |
Purchases | | | 92,593.95 | | | | 119,103.07 | | | | 137,183.02 | | | | 288,692.00 | | |
Sales | | | (730,980.39 | ) | | | (963,327.82 | ) | | | (662,817.42 | ) | | | (1,551,702.68 | ) | |
Beginning Units, April 1, 2013 | | | 1,983,779.66 | | | | 2,648,968.08 | | | | 2,043,885.22 | | | | 5,522,226.42 | | |
Purchases | | | 9,987.39 | | | | 28,344.94 | | | | 15,316.45 | | | | 36,592.09 | | |
Sales | | | (369,588.90 | ) | | | (498,402.58 | ) | | | (381,459.79 | ) | | | (1,032,156.07 | ) | |
Ending units, March 31, 2014 | | | 1,624,178.15 | | | | 2,178,910.44 | | | | 1,677,741.88 | | | | 4,526,662.44 | | |
4. RELATED PARTY TRANSACTIONS AND OTHER
In consideration for fund services, Hatteras Core Alternatives Fund, L.P., Hatteras Core Alternatives TEI Fund, L.P., Hatteras Core Alternatives Institutional Fund, L.P. and Hatteras Core Alternatives TEI Institutional Fund, L.P. will pay HIP (in such capacity, the "Servicing Agent") a fund servicing fee at the annual rate of 0.85%, 0.85%, 0.10% and 0.10%, respectively, of the month-end partner's capital of the applicable Feeder Fund. The respective Feeder Fund servicing fees payable to the Servicing Agent will be borne by all Limited Partners of the respective Feeder Fund on a pro-rata basis before giving effect to any repurchase of interests in the Master Fund effective as of that date, and will decrease the net profits or increase the net losses of the Master Fund that are credited to its interest holders, including each Feeder Fund.
The performance allocation is calculated at the Master Fund level, and allocated to the Feeder Funds based on each Feeder Fund's ownership interest in the Master Fund. The General Partner is allocated a performance allocation payable annually equal to 10% of the amount by which net new profits of the limited partner interests of the Master Fund exceed the non-cumulative "hurdle amount", which is calculated as of the last day of the preceding calendar year of the Master Fund at a rate equal to the yield-to-maturity of the 90 day U.S. Treasury Bill as reported by the Wall Street Journal for the last business day of the preceding calendar year (the "Performance Allocation"). The Performance Allocation is made on a "peak to peak," or "high watermark" basis, which means that the Performance Allocation is made only with respect to new net profits. If the Master Fund has a net loss in any period followed by a net profit, no Performance Allocation will be made with respect to such subsequent appreciation until such net loss has been recovered. MCCM is a non-voting member ("Member") of HIP. HIP, MCCM and the General Partner have entered into a membership agreement (the "Member Agreement"). Pursuant to the Member Agreement, the General Partner makes distributions to MCCM equal to a percentage of the Performance Allocation the General Partner receives from the Master Fund. For the year ended March 31, 2014, the General Partner of the Master Fund accrued a Performance Allocation in the amount of $5,745,793, of which $737,135 was allocated to the Hatteras Core Alternatives Institutional Fund, L.P., and $5,008,658 was allocated to the Hatteras Core Alternatives TEI Institutional Fund, L.P., which is disclosed in the Statement of Operations.
Hatteras Capital Distributors LLC ("HCD"), an affiliate of HIP, serves as the Feeder Funds' distributor. HCD receives a distribution fee from HIP equal to 0.10% on an annualized basis of the net assets of the Master Fund as of the last day of the month (before giving effect to any repurchase of interests in the Master Fund).
UMB Bank, N.A. serves as custodian of the Feeder Funds' cash balances and provides custodial services for the Feeder Funds. UMB Fund Services, Inc., serves as administrator and accounting agent to the Feeder Funds and provides certain accounting, record keeping and investor related services. The Feeder Funds pay a fee to the custodian and administrator based upon average Limited Partners' capital, subject to certain minimums.
EIGHT
HATTERAS FUNDS
(each a Delaware Limited Partnership)
NOTES TO FINANCIAL STATEMENTS (Continued)
As of and for the year ended March 31, 2014
4. RELATED PARTY TRANSACTIONS AND OTHER (CONCLUDED)
At March 31, 2014, Limited Partners who are affiliated with HIP, MCCM or the General Partner owned $597,651 (0.36% of Partners' Capital) of Hatteras Core Alternatives Fund, L.P., $1,884,816 (1.05% of Partners' Capital) of Hatteras Core Alternatives Institutional Fund, L.P., and $347,278 (0.07% of Partners' Capital) of Hatteras Core Alternatives TEI Institutional Fund, L.P.
On October 1, 2013, RCS Capital Corporation (the "Company") and Scotland Acquisition, LLC, a newly formed wholly-owned subsidiary of RCS Advisory Services, LLC, which is an operating subsidiary of the Company, entered into an asset purchase agreement with certain principals of the HIP and the General Partner (collectively the "Sellers") and David Perkins, as the Sellers' representative. The purchase will result in a change in control of HIP and, therefore, constitute an "assignment" within the meaning of the 1940 Act of i) the existing investment co-management agreement between HIP and The Master Fund, and ii) the existing investment co-management agreement among HIP, MCCM and the Master Fund. The purchase is expected to close in second quarter of 2014.
5. RISK FACTORS
An investment in the Feeder Funds involves significant risks that should be carefully considered prior to investment and should only be considered by persons financially able to maintain their investment and who can afford a loss of a substantial part or all of such investment. The Master Fund intends to invest substantially all of its available capital in securities of private investment companies. These investments will generally be restricted securities that are subject to substantial holding periods or are not traded in public markets at all, so that the Master Fund may not be able to resell some of its Adviser Fund holdings for extended periods, which may be several years. Limited Partners should refer to the Master Fund's financial statements included in this report along with the applicable Feeder Fund's prospectus, as supplemented and corresponding statement of additional information for a more complete list of risk factors. No guarantee or representation is made that the Feeder Funds' investment objective will be met.
6. REPURCHASE OF LIMITED PARTNERS' UNITS
The Board may, from time to time and in its sole discretion, cause the Feeder Funds to repurchase Units from Limited Partners pursuant to written tenders by Limited Partners at such times and on such terms and conditions as established by the Board. In determining whether the Feeder Funds should offer to repurchase interests, the Board will consider, among other things, the recommendation of the Investment Managers. The Feeder Funds generally expect to offer to repurchase Units from Limited Partners on a quarterly basis as of March 31, June 30, September 30 and December 31 of each year. In no event will more than 20% of the Units of a Feeder Fund be repurchased per quarter. The Feeder Funds do not intend to distribute to the Limited Partners any of the Feeder Funds' income, but generally expect to reinvest substantially all income and gains allocable to the Limited Partners. A Limited Partner may, therefore, be allocated taxable income and gains and not receive any cash distribution. Units repurchased prior to the Limited Partner's one year anniversary of its initial investment may be subject to a maximum 2% repurchase fee.
7. INDEMNIFICATION
In the normal course of business, the Feeder Funds enter into contracts that provide general indemnifications. The Feeder Funds' maximum exposure under these agreements is dependent on future claims that may be made against the Feeder Funds, and therefore cannot be established; however, based on experience, the risk of loss from such claims is considered remote.
8. FINANCIAL HIGHLIGHTS
The financial highlights are intended to help an investor understand the Feeder Funds' financial performance. The total returns in the table represent the rate that a Limited Partner would be expected to have earned or lost on an investment in each Feeder Fund.
The ratios and total return amounts are calculated based on each Limited Partner group taken as a whole. The General Partner's interest is excluded from the calculations. An individual Limited Partner's ratios or returns may vary from the table below based on the timing of purchases and sales and performance allocation.
The ratios are calculated by dividing total dollars of income or expenses as applicable by the average of total monthly Limited Partners' capital. The ratios include the Feeder Funds' proportionate share of the Master Fund's income and expenses.
Total return amounts are calculated based on the change in unit value during each accounting period.
NINE
HATTERAS FUNDS
(each a Delaware Limited Partnership)
NOTES TO FINANCIAL STATEMENTS (Continued)
As of and for the year ended March 31, 2014
8. FINANCIAL HIGHLIGHTS (CONTINUED)
The portfolio turnover rate is calculated based on the Master Fund's investment activity, as turnover occurs at the Master Fund level and the Feeder Funds are typically invested 100% in the Master Fund.
| | | Hatteras
Core Alternatives
Fund, L.P. | | Hatteras
Core Alternatives
TEI
Fund, L.P. | | Hatteras
Core Alternatives
Institutional
Fund, L.P. | | Hatteras
Core Alternatives
TEI
Institutional
Fund, L.P. | |
Unit Value, April 1, 2009 | | $ | 76.29 | | | $ | 76.27 | | | $ | 76.71 | | | $ | 76.66 | | |
Income from investment operations: | |
Net investment loss | | | (1.92 | ) | | | (1.56 | ) | | | (0.86 | ) | | | (0.61 | ) | |
Net realized and unrealized gain on
investment transactions | | | 13.37 | | | | 12.98 | | | | 13.06 | | | | 12.81 | | |
Total from investment operations | | | 11.45 | | | | 11.42 | | | | 12.20 | | | | 12.20 | | |
Unit Value, April 1, 2010 | | | 87.74 | | | | 87.69 | | | | 88.91 | | | | 88.86 | | |
Income from investment operations: | |
Net investment income (loss) | | | (0.44 | ) | | | (0.48 | ) | | | (0.10 | ) | | | 0.30 | | |
Net realized and unrealized gain on
investment transactions | | | 5.54 | | | | 5.51 | | | | 6.00 | | | | 5.53 | | |
Total from investment operations | | | 5.10 | | | | 5.03 | | | | 5.90 | | | | 5.83 | | |
Unit Value, April 1, 2011 | | | 92.84 | | | | 92.72 | | | | 94.81 | | | | 94.69 | | |
Income from investment operations: | |
Net investment income (loss) | | | (0.41 | ) | | | (0.40 | ) | | | 0.52 | | | | 0.40 | | |
Net realized and unrealized loss on
investment transactions | | | (2.86 | ) | | | (2.95 | ) | | | (3.14 | ) | | | (3.05 | ) | |
Total from investment operations | | | (3.27 | ) | | | (3.35 | ) | | | (2.62 | ) | | | (2.65 | ) | |
Unit Value, April 1, 2012 | | | 89.57 | | | | 89.37 | | | | 92.19 | | | | 92.04 | | |
Income from investment operations: | |
Net investment income (loss) | | | (2.26 | ) | | | (2.32 | ) | | | 0.21 | | | | 0.17 | | |
Net realized and unrealized gain on
investment transactions | | | 5.92 | | | | 5.83 | | | | 4.28 | | | | 4.05 | | |
Total from investment operations | | | 3.66 | | | | 3.51 | | | | 4.49 | | | | 4.22 | | |
Unit Value, April 1, 2013 | | | 93.23 | | | | 92.88 | | | | 96.68 | | | | 96.26 | | |
Income from investment operations: | |
Net investment income (loss) | | | (0.64 | ) | | | (0.84 | ) | | | 1.46 | | | | 0.71 | | |
Net realized and unrealized gain on
investment transactions | | | 10.09 | | | | 10.04 | | | | 8.72 | | | | 8.68 | | |
Total from investment operations | | | 9.45 | | | | 9.20 | | | | 10.18 | | | | 9.39 | | |
Unit Value, March 31, 2014 | | $ | 102.68 | | | $ | 102.08 | | | $ | 106.86 | | | $ | 105.65 | | |
TEN
HATTERAS FUNDS
(each a Delaware Limited Partnership)
NOTES TO FINANCIAL STATEMENTS (Continued)
As of and for the year ended March 31, 2014
8. FINANCIAL HIGHLIGHTS (CONTINUED)
| | | For the Years Ended March 31, | |
Hatteras Core Alternatives Fund, L.P. | | 2014 | | 2013 | | 2012 | | 2011 | | 2010 | |
Total return before Performance Allocation | | | 10.14 | % | | | 4.09 | % | | | (3.52 | )% | | | 5.81 | % | | | 15.01 | % | |
Performance Allocation | | | 0.00 | % | | | 0.00 | % | | | 0.00 | % | | | 0.00 | % | | | 0.00 | % | |
Total return after Performance Allocation | | | 10.14 | % | | | 4.09 | % | | | (3.52 | )% | | | 5.81 | % | | | 15.01 | % | |
Net investment income (loss)1 | | | 1.18 | % | | | (0.17 | )% | | | (0.29 | )% | | | (0.60 | )% | | | (1.90 | )% | |
Operating expenses, excluding Performance Allocation1,2,3 | | | 2.38 | % | | | 2.30 | % | | | 2.33 | % | | | 2.32 | % | | | 2.35 | % | |
Performance Allocation1 | | | 0.00 | % | | | 0.00 | % | | | 0.00 | % | | | 0.00 | % | | | 0.00 | % | |
Net expenses1 | | | 2.38 | % | | | 2.30 | % | | | 2.33 | % | | | 2.32 | % | | | 2.35 | % | |
Limited Partners' capital, end of year (000's) | | $ | 166,776 | | | $ | 184,954 | | | $ | 234,881 | | | $ | 248,882 | | | $ | 231,314 | | |
Portfolio Turnover Rate (Master Fund) | | | 19.03 | % | | | 25.15 | % | | | 32.68 | % | | | 25.12 | % | | | 23.12 | % | |
1 Ratios include allocations from the Master Fund.
2 Ratios calculated based on total expenses and average partners' capital. If the expense ratio calculation had been performed monthly, as is done for expense cap calculations, the ratios would have been different.
3 For the years ended March 31, 2010-2014, the ratios of other operating expenses to average partners' capital were, 2.29%, 2.22%, 2.25%, 2.22%, and 2.29%, respectively, and the ratios of credit facility fees and interest expense to average partners' capital allocated from the Master Fund were , 0.06%, 0.10%, 0.08%, 0.08%, and 0.09%, respectively.
ELEVEN
HATTERAS FUNDS
(each a Delaware Limited Partnership)
NOTES TO FINANCIAL STATEMENTS (Continued)
As of and for the year ended March 31, 2014
8. FINANCIAL HIGHLIGHTS (CONTINUED)
| | | For the Years Ended March 31, | |
Hatteras Core Alternatives TEI Fund, L.P. | | 2014 | | 2013 | | 2012 | | 2011 | | 2010 | |
Total return before Performance Allocation | | | 9.91 | % | | | 3.93 | % | | | (3.62 | )% | | | 5.74 | % | | | 14.97 | % | |
Performance Allocation | | | 0.00 | % | | | 0.00 | % | | | 0.00 | % | | | 0.00 | % | | | 0.00 | % | |
Total return after Performance Allocation | | | 9.91 | % | | | 3.93 | % | | | (3.62 | )% | | | 5.74 | % | | | 14.97 | % | |
Net investment income (loss)1 | | | 0.96 | % | | | (0.25 | )% | | | (0.39 | )% | | | (0.68 | )% | | | (1.94 | )% | |
Operating expenses, excluding Performance Allocation1,2,3 | | | 2.59 | % | | | 2.38 | % | | | 2.43 | % | | | 2.39 | % | | | 2.39 | % | |
Performance Allocation1 | | | 0.00 | % | | | 0.00 | % | | | 0.00 | % | | | 0.00 | % | | | 0.00 | % | |
Net expenses1 | | | 2.59 | % | | | 2.38 | % | | | 2.43 | % | | | 2.39 | % | | | 2.39 | % | |
Limited Partners' capital, end of year (000's) | | $ | 222,419 | | | $ | 246,049 | | | $ | 312,204 | | | $ | 325,745 | | | $ | 300,576 | | |
Portfolio Turnover Rate (Master Fund) | | | 19.03 | % | | | 25.15 | % | | | 32.68 | % | | | 25.12 | % | | | 23.12 | % | |
1 Ratios include allocations from the Master Fund.
2 Ratios calculated based on total expenses and average partners' capital. If the expense ratio calculation had been performed monthly, as is done for expense cap calculations, the ratios would have been different.
3 For the years ended March 31, 2010-2014, the ratios of other operating expenses to average partners' capital were 2.27%, 2.20%, 2.23%, 2.18%, and 2.26% respectively; the ratios of allocated credit facility fees and interest expense to average partners' capital were 0.06%, 0.10%, 0.08%, 0.08%, and 0.09% respectively; and the ratios of withholding tax to average partner's capital were 0.06%, 0.09%, 0.12%, 0.12%, and 0.24% respectively.
TWELVE
HATTERAS FUNDS
(each a Delaware Limited Partnership)
NOTES TO FINANCIAL STATEMENTS (Continued)
As of and for the year ended March 31, 2014
8. FINANCIAL HIGHLIGHTS (CONTINUED)
| | | For the Years Ended March 31, | |
Hatteras Core Alternatives Institutional Fund, L.P. | | 2014 | | 2013 | | 2012 | | 2011 | | 2010 | |
Total return before Performance Allocation | | | 10.91 | % | | | 4.87 | % | | | (2.77 | )% | | | 6.64 | % | | | 15.90 | % | |
Performance Allocation | | | (0.38 | )% | | | 0.00 | % | | | 0.00 | % | | | 0.00 | % | | | 0.00 | % | |
Total return after Performance Allocation | | | 10.53 | % | | | 4.87 | % | | | (2.77 | )% | | | 6.64 | % | | | 15.90 | % | |
Net investment income income (loss)1 | | | 1.57 | % | | | 0.60 | % | | | 0.50 | % | | | 0.14 | % | | | (1.12 | )% | |
Operating expenses, excluding Performance Allocation1,2,3 | | | 1.61 | % | | | 1.54 | % | | | 1.55 | % | | | 1.53 | % | | | 1.57 | % | |
Performance Allocation1 | | | 0.38 | % | | | 0.00 | % | | | 0.00 | % | | | 0.00 | % | | | 0.00 | % | |
Net expenses1 | | | 1.99 | % | | | 1.54 | % | | | 1.55 | % | | | 1.53 | % | | | 1.57 | % | |
Limited Partners' capital, end of year (000's) | | $ | 179,279 | | | $ | 197,612 | | | $ | 236,892 | | | $ | 238,675 | | | $ | 249,153 | | |
Portfolio Turnover Rate (Master Fund) | | | 19.03 | % | | | 25.15 | % | | | 32.68 | % | | | 25.12 | % | | | 23.12 | % | |
1 Ratios include allocations from the Master Fund.
2 Ratios calculated based on total expenses and average partners' capital. If the expense ratio calculation had been performed monthly, as is done for expense cap calculations, the ratios would have been different.
3 For the years ended March 31, 2010-2014, the ratios of other operating expenses to average partners' capital were 1.51%, 1.43%, 1.47%, 1.46%, and 1.52%, respectively, and the ratios of credit facility fees and interest expense to average partners' capital allocated from the Master Fund were 0.06%, 0.10%, 0.08%, 0.08%, and 0.09% respectively.
THIRTEEN
HATTERAS FUNDS
(each a Delaware Limited Partnership)
NOTES TO FINANCIAL STATEMENTS (Continued)
As of and for the year ended March 31, 2014
8. FINANCIAL HIGHLIGHTS (CONCLUDED)
| | | For the Years Ended March 31, | |
Hatteras Core Alternatives TEI Institutional Fund, L.P. | | 2014 | | 2013 | | 2012 | | 2011 | | 2010 | |
Total return before Performance Allocation | | | 10.73 | % | | | 4.74 | % | | | (2.85 | )% | | | 6.61 | % | | | 15.91 | % | |
Performance Allocation | | | (0.98 | )% | | | (0.16 | )% | | | 0.05 | %4 | | | (0.05 | )% | | | 0.00 | % | |
Total return after Performance Allocation | | | 9.75 | % | | | 4.58 | % | | | (2.80 | )% | | | 6.56 | % | | | 15.91 | % | |
Net investment income income (loss)1 | | | 0.82 | % | | | 0.40 | % | | | 0.46 | % | | | 0.10 | % | | | (1.11 | )% | |
Operating expenses, excluding Performance Allocation1,2,3 | | | 1.75 | % | | | 1.58 | % | | | 1.62 | % | | | 1.56 | % | | | 1.55 | % | |
Performance Allocation1 | | | 0.98 | % | | | 0.16 | % | | | (0.05 | )%4 | | | 0.05 | % | | | 0.00 | % | |
Net expenses1 | | | 2.73 | % | | | 1.74 | % | | | 1.57 | % | | | 1.61 | % | | | 1.55 | % | |
Limited Partners' capital, end of year (000's) | | $ | 478,238 | | | $ | 531,555 | | | $ | 624,547 | | | $ | 659,549 | | | $ | 561,581 | | |
Portfolio Turnover Rate (Master Fund) | | | 19.03 | % | | | 25.15 | % | | | 32.68 | % | | | 25.12 | % | | | 23.12 | % | |
1 Ratios include allocations from the Master Fund.
2 Ratios calculated based on total expenses and average partners' capital. If the expense ratio calculation had been performed monthly, as is done for expense cap calculations, the ratios would have been different.
3 For the years ended March 31, 2010-2014, the ratios of other operating expenses to average partners' capital were 1.44%, 1.38%, 1.42%, 1.39% , and 1.44% respectively; the ratios of allocated credit facility fees and interest expense to average partners' capital were 0.06%, 0.10%, 0.08%, 0.08%, and 0.09% respectively; and the ratios of withholding tax to average partners' capital were 0.05%, 0.08%, 0.12%, 0.11%, and 0.23% respectively.
4 Reverse accrued Performance Allocation from January 1, 2011 to March 31, 2011.
FOURTEEN
HATTERAS FUNDS
(each a Delaware Limited Partnership)
NOTES TO FINANCIAL STATEMENTS (Concluded)
As of and for the year ended March 31, 2014
Management has evaluated the events and transactions through the date the financial statements were issued and determined there were no subsequent events that required adjustment to our disclosure in the financial statements except for the following: effective April 1, 2014 and May 1, 2014, there were additional purchases into the Feeder Funds of the following amounts:
April 1, 2014 | |
Hatteras Core Alternatives Fund, L.P. | | $ | 250,000 | | |
Hatteras Core Alternatives TEI Fund, L.P. | | $ | 15,000 | | |
Hatteras Core Alternatives Institutional Fund, L.P. | | $ | — | | |
Hatteras Core Alternatives TEI Institutional Fund, L.P. | | $ | 50,000 | | |
May 1, 2014 | |
Hatteras Core Alternatives Fund, L.P. | | $ | 200,000 | | |
Hatteras Core Alternatives TEI Fund, L.P. | | $ | 50,000 | | |
Hatteras Core Alternatives Institutional Fund, L.P. | | $ | — | | |
Hatteras Core Alternatives TEI Institutional Fund, L.P. | | $ | 130,000 | | |
HIP recommended to the Boards that a tender offer in an amount of up to approximately 5.00% of partners' capital of each of the Feeder Funds be made for the quarter ending June 30, 2014 to those Limited Partners who elect to tender their Units prior to the expiration of the tender offer period. The Boards approved such recommendation and Limited Partners in the Feeder Funds were notified of the tender offer's expiration date of April 18, 2014, and submitted the following tender requests:
Hatteras Core Alternatives Fund, L.P. | | $ | 8,742,353 | | |
Hatteras Core Alternatives TEI Fund, L.P. | | $ | 11,657,557 | | |
Hatteras Core Alternatives Institutional Fund, L.P. | | $ | 9,401,307 | | |
Hatteras Core Alternatives TEI Institutional Fund, L.P. | | $ | 25,080,092 | | |
*************
FIFTEEN
HATTERAS FUNDS
(each a Delaware Limited Partnership)
BOARD OF DIRECTORS
(Unaudited)
The identity of the Board members (each a "Director") and brief biographical information, as of March 31, 2014, is set forth below. The business address of each Director is care of Hatteras Funds, 8540 Colonnade Center Drive, Suite 401, Raleigh, NC 27615. The term of office of each Director is from the time of such Director's election and qualification until his or her successor shall have been elected and shall have qualified, or until he or she is removed, resigns or is subject to various disabling events such as death or incapacity. A Director may resign upon 90 days' prior written notice to the Board and may be removed either by a vote of a majority of the Board not subject to the removal vote or of Limited Partners holding not less than two-thirds of the total number of votes eligible to be cast by all of the Limited Partners. The Feeder Funds' Statements of Additional Information include information about the Directors and may be obtained without charge by calling 1-888-363-2324.
Name &
Date of Birth | | Position(s) Held
with the Feeder
Funds | | Length of
Time Served | | Principal Occupation(s)
During Past 5 Years
and Other
Directorships
Held by Director | | Number of
Portfolios in Fund
Complex1 Overseen
by Director | |
INTERESTED DIRECTOR | | | | | | | | | |
David B. Perkins2
July 18, 1962 | | President and Chairman of the Board of Directors | | Since Inception | | Mr. Perkins has been Chairman of the Board of Directors and President of the Fund since inception. Mr. Perkins is the Chief Executive Officer of Hatteras and its affiliated entities. He founded the firm in September 2003. Prior to that, he was the co-founder and Managing Partner of CapFinancial Partners, LLC. | | | 20 | | |
INDEPENDENT DIRECTORS | | | | | | | | | |
H. Alexander Holmes
May 4, 1942 | | Director; Audit Committee Member | | Since Inception | | Mr. Holmes founded Holmes Advisory Services, LLC, a financial consultation firm, in 1993. | | | 20 | | |
Steve E. Moss, CPA
February 18, 1953 | | Director; Audit Committee Member | | Since Inception | | Mr. Moss is a principal of Holden, Moss, Knott, Clark & Copley, P.A. and has been a member manager of HMKCT Properties, LLC since January 1996. | | | 20 | | |
Gregory S. Sellers
May 5, 1959 | | Director; Audit Committee Member | | Since Inception | | Mr. Sellers has been the Chief Financial Officer of Imagemark Business Services, Inc., a strategic communications provider of marketing and print communications solutions, since June 2009. From 2003 to June 2009, Mr. Sellers was the Chief Financial Officer and a director of Kings Plush, Inc., a fabric manufacturer. | | | 20 | | |
1 The "Fund Complex" consists of the Funds, Hatteras Global Private Equity Partners Institutional, LLC, Hatteras VC Co-Investment Fund II, LLC, Hatteras GPEP Fund II, LLC, Hatteras Alternative Mutual Funds Trust (consisting of five funds), Underlying Funds Trust (consisting of five funds), and HCIM Trust (consisting of two funds).
2 Mr. Perkins is deemed to be an "interested" Director of the Feeder Funds because of his affiliations with HIP.
SIXTEEN
HATTERAS FUNDS
(each a Delaware Limited Partnership)
BOARD OF DIRECTORS (Concluded)
(Unaudited)
Name &
Date of Birth | | Position(s) Held
with the Feeder
Funds | | Length of
Time Served | | Principal Occupation(s)
During Past 5 Years
and Other
Directorships
Held by Director | | Number of
Portfolios in Fund
Complex1 Overseen
by Director | |
Joseph E. Breslin
November 18, 1953 | | Director | | Since 2013 | | Mr. Breslin is currently a private investor. Mr. Breslin has been a Director of Kinetics Mutual Funds, Inc. (mutual fund) from 2000 to Present (8 portfolios); Trustee, Kinetics Portfolios Trust (mutual fund) from 2000 to Present (8 portfolios). From 2007 to 2009, Mr. Breslin was the Chief Operating Officer of Central Park Credit Holdings, Inc. and prior to that, was the Chief Operating Officer of Aladdin Capital Management LLC, beginning in 2005. | | | 20 | | |
Thomas Mann
February 1, 1950 | | Director | | Since 2013 | | Mr. Mann is currently a private investor. From 2003 until 2012, Mr. Mann was the Managing Director and Group Head Financial Institutions Group, Société Générale, Sales of Capital Market Solutions and Products. Mr. Mann is also a Director of Virtus Global Multi-Sector Income Fund since 2011, Virtus Total Return Fund since 2012, and F-Squared Investments, Inc. since January 2012. | | | 20 | | |
1 The "Fund Complex" consists of the Funds, Hatteras Global Private Equity Partners Institutional, LLC, Hatteras VC Co-Investment Fund II, LLC, Hatteras GPEP Fund II, LLC, Hatteras Alternative Mutual Funds Trust (consisting of five funds), Underlying Funds Trust (consisting of five funds), and HCIM Trust (consisting of two funds).
SEVENTEEN
HATTERAS FUNDS
(each a Delaware Limited Partnership)
FUND MANAGEMENT
(Unaudited)
Set forth below is the name, date of birth, position with each Feeder Fund, length of term of office, and the principal occupation for the last five years, as of March 31, 2014, of each of the persons currently serving as Executive Officers of the Feeder Funds. The business address of each officer is care of Hatteras Funds, 8540 Colonnade Center Drive, Suite 401, Raleigh, NC 27615.
Name &
Date of Birth | | Position(s) Held
with the Feeder
Funds | | Length of
Time Served | | Principal Occupation(s)
During Past 5 Years
and Other
Directorships
Held by Officer | | Number of
Portfolios in Fund
Complex1 Overseen
by Officer | |
OFFICERS | | | | | | | | | |
J. Michael Fields,
July 14, 1973 | | Secretary of each Fund in the Fund Complex | | Since 2008 | | Prior to becoming Secretary of each of the Funds in the Fund Complex, Mr. Fields was the Treasurer of each of the Funds in the Fund Complex. Mr. Fields is Chief Operating Officer of HIP and its affiliates and has been employed by the Hatteras firm since its inception in September 2003. | | | N/A | | |
Andrew P. Chica
September 7, 1975 | | Chief Compliance Officer of each Fund in the Fund Complex | | Since 2008 | | Mr. Chica joined Hatteras in November 2007 and became Chief Compliance Officer of each of the Funds in the Fund Complex and HIP as of January 2008. | | | N/A | | |
Robert Lance Baker
September 17, 1971 | | Treasurer of each Fund in the Fund Complex | | Since 2008 | | Mr. Baker joined Hatteras in March 2008 and became Treasurer of each of the Funds in the Fund Complex in December 2008. Mr. Baker serves as the Chief Financial Officer of HIP and its affiliates. | | | N/A | | |
1 The "Fund Complex" consists of the Funds, Hatteras Global Private Equity Partners Institutional, LLC, Hatteras VC Co-Investment Fund II, LLC, Hatteras GPEP Fund II, LLC, Hatteras Alternative Mutual Funds Trust (consisting of five funds), Underlying Funds Trust (consisting of five funds), and HCIM Trust (consisting of two funds).
EIGHTEEN
HATTERAS FUNDS
(each a Delaware Limited Partnership)
OTHER INFORMATION
(Unaudited)
2014 PROXY RESULTS
A Special Meeting of the Limited Partners was held on January 21, 2014, as reconvened on February 21, 2014, to consider the proposals described below. Each proposal was approved. The results of the voting at the Special Meeting are as follows:
1. Approval of the election of eight nominees to the Board of Directors of each Feeder Fund.
Hatteras Core Alternatives Fund, L.P.
Directors | | Votes For | | Votes Against | | Votes Withheld | |
David B. Perkins | | | 95.87 | % | | | None | | | | 4.13 | % | |
H. Alexander Holmes | | | 95.87 | % | | | None | | | | 4.13 | % | |
Steve E. Moss | | | 95.87 | % | | | None | | | | 4.13 | % | |
Gregory S. Sellers | | | 95.87 | % | | | None | | | | 4.13 | % | |
Joseph E. Breslin | | | 95.80 | % | | | None | | | | 4.20 | % | |
Thomas Mann | | | 95.80 | % | | | None | | | | 4.20 | % | |
Peter M. Budko | | | 95.73 | % | | | None | | | | 4.27 | % | |
Hatteras Core Alternatives TEI Fund, L.P.
Directors | | Votes For | | Votes Against | | Votes Withheld | |
David B. Perkins | | | 97.15 | % | | | None | | | | 2.85 | % | |
H. Alexander Holmes | | | 97.15 | % | | | None | | | | 2.85 | % | |
Steve E. Moss | | | 97.29 | % | | | None | | | | 2.71 | % | |
Gregory S. Sellers | | | 97.29 | % | | | None | | | | 2.71 | % | |
Joseph E. Breslin | | | 97.29 | % | | | None | | | | 2.71 | % | |
Thomas Mann | | | 97.29 | % | | | None | | | | 2.71 | % | |
Peter M. Budko | | | 97.29 | % | | | None | | | | 2.71 | % | |
Hatteras Core Alternatives Institutional Fund, L.P.
Directors | | Votes For | | Votes Against | | Votes Withheld | |
David B. Perkins | | | 99.18 | % | | | None | | | | 0.82 | % | |
H. Alexander Holmes | | | 99.18 | % | | | None | | | | 0.82 | % | |
Steve E. Moss | | | 99.18 | % | | | None | | | | 0.82 | % | |
Gregory S. Sellers | | | 99.18 | % | | | None | | | | 0.82 | % | |
Joseph E. Breslin | | | 99.18 | % | | | None | | | | 0.82 | % | |
Thomas Mann | | | 99.18 | % | | | None | | | | 0.82 | % | |
Peter M. Budko | | | 99.18 | % | | | None | | | | 0.82 | % | |
Hatteras Core Alternatives TEI Institutional Fund, L.P.
Directors | | Votes For | | Votes Against | | Votes Withheld | |
David B. Perkins | | | 98.42 | % | | | None | | | | 1.58 | % | |
H. Alexander Holmes | | | 98.42 | % | | | None | | | | 1.58 | % | |
Steve E. Moss | | | 98.42 | % | | | None | | | | 1.58 | % | |
Gregory S. Sellers | | | 98.42 | % | | | None | | | | 1.58 | % | |
Joseph E. Breslin | | | 98.42 | % | | | None | | | | 1.58 | % | |
Thomas Mann | | | 98.42 | % | | | None | | | | 1.58 | % | |
Peter M. Budko | | | 98.42 | % | | | None | | | | 1.58 | % | |
NINETEEN
HATTERAS FUNDS
(each a Delaware Limited Partnership)
OTHER INFORMATION (Continued)
(Unaudited)
2. Approval of the Investment Advisory Agreement between the Master Fund and Hatteras Funds, LLC.
Hatteras Core Alternatives Fund, L.P.
| | | No. of Shares | | % of
Outstanding
Shares | | % of Shares
Voted | |
Affirmative | | | 1,534,056 | | | | 85.32 | % | | | 96.00 | % | |
Against | | | 32,164 | | | | 1.79 | % | | | 2.01 | % | |
Abstain | | | 31,755 | | | | 1.77 | % | | | 1.99 | % | |
Total | | | 1,597,975 | | | | 88.88 | % | | | 100.00 | % | |
Hatteras Core Alternatives TEI Fund, L.P.
| | | No. of Shares | | % of
Outstanding
Shares | | % of Shares
Voted | |
Affirmative | | | 1,175,509 | | | | 48.73 | % | | | 95.65 | % | |
Against | | | 26,763 | | | | 1.11 | % | | | 2.18 | % | |
Abstain | | | 26,675 | | | | 1.11 | % | | | 2.17 | % | |
Total | | | 1,228,947 | | | | 50.95 | % | | | 100.00 | % | |
Hatteras Core Alternatives Institutional Fund, L.P.
| | | No. of Shares | | % of
Outstanding
Shares | | % of Shares
Voted | |
Affirmative | | | 1,050,125 | | | | 56.55 | % | | | 98.42 | % | |
Against | | | 6,740 | | | | 0.36 | % | | | 0.63 | % | |
Abstain | | | 10,127 | | | | 0.55 | % | | | 0.95 | % | |
Total | | | 1,066,992 | | | | 57.46 | % | | | 100.00 | % | |
Hatteras Core Alternatives TEI Institutional Fund, L.P.
| | | No. of Shares | | % of
Outstanding
Shares | | % of Shares
Voted | |
Affirmative | | | 2,930,059 | | | | 58.44 | % | | | 98.90 | % | |
Against | | | 13,817 | | | | 0.28 | % | | | 0.47 | % | |
Abstain | | | 18,796 | | | | 0.37 | % | | | 0.63 | % | |
Total | | | 2,962,672 | | | | 59.09 | % | | | 100.00 | % | |
3. Approval of the Investment Sub-Advisory Agreement among the Master Fund, Hatteras Funds, LLC and MCCM.
Hatteras Core Alternatives Fund, L.P.
| | | No. of Shares | | % of
Outstanding
Shares | | % of Shares
Voted | |
Affirmative | | | 1,528,059 | | | | 84.98 | % | | | 95.63 | % | |
Against | | | 34,267 | | | | 1.91 | % | | | 2.14 | % | |
Abstain | | | 35,649 | | | | 1.98 | % | | | 2.23 | % | |
Total | | | 1,597,975 | | | | 88.87 | % | | | 100.00 | % | |
TWENTY
HATTERAS FUNDS
(each a Delaware Limited Partnership)
OTHER INFORMATION (Continued)
(Unaudited)
Hatteras Core Alternatives TEI Fund, L.P.
| | | No. of Shares | | % of
Outstanding
Shares | | % of Shares
Voted | |
Affirmative | | | 1,172,090 | | | | 48.59 | % | | | 95.37 | % | |
Against | | | 26,763 | | | | 1.11 | % | | | 2.18 | % | |
Abstain | | | 30,095 | | | | 1.25 | % | | | 2.45 | % | |
Total | | | 1,228,948 | | | | 50.95 | % | | | 100.00 | % | |
Hatteras Core Alternatives Institutional Fund, L.P.
| | | No. of Shares | | % of
Outstanding
Shares | | % of Shares
Voted | |
Affirmative | | | 1,050,125 | | | | 56.55 | % | | | 98.42 | % | |
Against | | | 6,740 | | | | 0.36 | % | | | 0.63 | % | |
Abstain | | | 10,127 | | | | 0.55 | % | | | 0.95 | % | |
Total | | | 1,066,992 | | | | 57.46 | % | | | 100.00 | % | |
Hatteras Core Alternatives TEI Institutional Fund, L.P.
| | | No. of Shares | | % of
Outstanding
Shares | | % of Shares
Voted | |
Affirmative | | | 2,930,059 | | | | 58.44 | % | | | 98.90 | % | |
Against | | | 13,817 | | | | 0.28 | % | | | 0.47 | % | |
Abstain | | | 18,796 | | | | 0.37 | % | | | 0.63 | % | |
Total | | | 2,962,672 | | | | 59.09 | % | | | 100.00 | % | |
4. Approval of the transfer of the General Partner's interest in the Funds to Hatteras Funds, LLC.
Hatteras Core Alternatives Fund, L.P.
| | | No. of Shares | | % of
Outstanding
Shares | | % of Shares
Voted | |
Affirmative | | | 1,523,476 | | | | 84.73 | % | | | 95.34 | % | |
Against | | | 38,850 | | | | 2.16 | % | | | 2.43 | % | |
Abstain | | | 35,649 | | | | 1.98 | % | | | 2.23 | % | |
Total | | | 1,597,975 | | | | 88.87 | % | | | 100.00 | % | |
Hatteras Core Alternatives TEI Fund, L.P.
| | | No. of Shares | | % of
Outstanding
Shares | | % of Shares
Voted | |
Affirmative | | | 1,156,850 | | | | 47.96 | % | | | 94.13 | % | |
Against | | | 27,765 | | | | 1.15 | % | | | 2.26 | % | |
Abstain | | | 44,332 | | | | 1.84 | % | | | 3.61 | % | |
Total | | | 1,228,947 | | | | 50.95 | % | | | 100.00 | % | |
TWENTY-ONE
HATTERAS FUNDS
(each a Delaware Limited Partnership)
OTHER INFORMATION (Concluded)
(Unaudited)
Hatteras Core Alternatives Institutional Fund, L.P.
| | | No. of Shares | | % of
Outstanding
Shares | | % of Shares
Voted | |
Affirmative | | | 1,048,744 | | | | 56.47 | % | | | 98.29 | % | |
Against | | | 6,740 | | | | 0.36 | % | | | 0.63 | % | |
Abstain | | | 11,508 | | | | 0.62 | % | | | 1.08 | % | |
Total | | | 1,066,992 | | | | 57.45 | % | | | 100.00 | % | |
Hatteras Core Alternatives TEI Institutional Fund, L.P.
| | | No. of Shares | | % of
Outstanding
Shares | | % of Shares
Voted | |
Affirmative | | | 2,916,985 | | | | 58.18 | % | | | 98.45 | % | |
Against | | | 13,817 | | | | 0.28 | % | | | 0.47 | % | |
Abstain | | | 31,870 | | | | 0.64 | % | | | 1.08 | % | |
Total | | | 2,962,672 | | | | 59.10 | % | | | 100.00 | % | |
PROXY VOTING
For free information regarding how the Master Fund voted proxies during the period ended June 30, 2013 or to obtain a free copy of the Master Fund's complete proxy voting policies and procedures, call 1-800-504-9070 or visit the SEC's website at http://www.sec.gov
AVAILABILITY OF QUARTERLY PORTFOLIO SCHEDULES
The Feeder Funds file their complete schedule of portfolio holdings, which includes securities held by the Master Fund, with the SEC for the first and third quarters of each fiscal year on Form N-Q. The Feeder Funds' Form N-Q is available, without charge and upon request, on the SEC's website at http://www.sec.gov or may be reviewed and copied at the SEC's Public Reference Room in Washington, DC. Information on the Public Reference Room may be obtained by calling 1-800-SEC-0330.
TWENTY-TWO
HATTERAS MASTER FUND, L.P.
(a Delaware Limited Partnership)
Financial Statements
As of and for the year ended March 31, 2014
With Report of Independent Registered Public Accounting Firm
HATTERAS MASTER FUND, L.P.
(a Delaware Limited Partnership)
As of and for the year ended March 31, 2014
Table of Contents
| Report of Independent Registered Accounting Firm | | | 1 | | |
| Schedule of Investments | | | 2-6 | | |
| Statement of Assets, Liabilities and Partners' Capital | | | 7 | | |
| Statement of Operations | | | 8 | | |
| Statements of Changes in Partners' Capital | | | 9 | | |
| Statement of Cash Flows | | | 10 | | |
| Notes to Financial Statements | | | 11-18 | | |
| Board of Directors (Unaudited) | | | 19-20 | | |
| Fund Management (Unaudited) | | | 21 | | |
| Other Information (Unaudited) | | | 22 | | |
HATTERAS FUNDS
(each a Delaware Limited Partnership)
REPORT OF INDEPENDENT REGISTERED PUBLIC ACCOUNTING FIRM
To the Board of Directors and Partners of Hatteras Master Fund, L.P.:
We have audited the accompanying statement of assets, liabilities and partners' capital of Hatteras Master Fund, L.P. (a Delaware Limited Partnership) (the "Master Fund"), including the schedule of investments, as of March 31, 2014, and the related statements of operations and cash flows for the year then ended, and the statements of changes in partners' capital for each of the two years in the period then ended. These financial statements are the responsibility of the Master Fund's management. Our responsibility is to express an opinion on these financial statements based on our audits.
We conducted our audits in accordance with the standards of the Public Company Accounting Oversight Board (United States). Those standards require that we plan and perform the audit to obtain reasonable assurance about whether the financial statements are free of material misstatement. The Master Fund is not required to have, nor were we engaged to perform, an audit of its internal control over financial reporting. Our audits included consideration of internal control over financial reporting as a basis for designing audit procedures that are appropriate in the circumstances, but not for the purpose of expressing an opinion on the effectiveness of the Master Fund's internal control over financial reporting. Accordingly, we express no such opinion. An audit also includes examining, on a test basis, evidence supporting the amounts and disclosures in the financial statements, assessing the accounting principles used and significant estimates made by management, as well as evaluating the overall financial statement presentation. Our procedures included confirmation of investments owned as of March 31, 2014, by correspondence with underlying fund advisers and custodians. We believe that our audits provide a reasonable basis for our opinion.
In our opinion, such financial statements referred to above present fairly, in all material respects, the financial position of Hatteras Master Fund, L.P. as of March 31, 2014, the results of its operations and its cash flows for the year then ended, and the changes in its partners' capital for each of the two years in the period then ended, in conformity with accounting principles generally accepted in the United States of America.
As discussed in Note 2 to the financial statements, the financial statements include investments valued at $1,024,053,691 (92.68% of total assets) as of March 31, 2014, whose fair value have been estimated by management in the absence of readily determinable fair values. Management's estimates are based on information provided by the underlying fund advisers.
/s/ Deloitte & Touche LLP
Philadelphia, Pennsylvania
May 30, 2014
ONE
HATTERAS MASTER FUND, L.P.
(a Delaware Limited Partnership)
SCHEDULE OF INVESTMENTS
March 31, 2014
INVESTMENT OBJECTIVE AS A PERCENTAGE OF TOTAL PARTNERS' CAPITAL
Percentages are as follows:
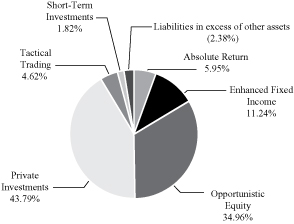
Investments in Adviser Funds and Securities — (100.55%) | | Shares | | Cost | | Fair Value | |
Absolute Return — (5.95%) | |
Citadel Wellington, LLC (Class A)a,b,c | | | | | | $ | 20,078,256 | | | $ | 38,640,676 | | |
D.E. Shaw Composite Fund, LLCa,b,d | | | | | | | 785,773 | | | | 1,142,511 | | |
Eton Park Fund, L.P.a,b, | | | | | | | 3,738,764 | | | | 4,439,695 | | |
Marathon Fund, L.P.a,b,d | | | | | | | 157,738 | | | | 34,315 | | |
Millennium USA, L.P.a,b | | | | | | | 6,247,314 | | | | 7,605,859 | | |
Montrica Global Opportunities Fund, L.P.a,b,d | | | | | | | 282,043 | | | | 218,430 | | |
OZ Asia, Domestic Partners, L.P.a,b,d | | | | | | | 748,997 | | | | 628,418 | | |
Perry Partners, L.P.a,b,d | | | | | | | 150,199 | | | | 251,072 | | |
Pipe Equity Partnersa,b,d | | | | | | | 8,437,378 | | | | 3,380,070 | | |
Pipe Select Fund, LLCa,b,d | | | | | | | 4,393,653 | | | | 4,884,832 | | |
Stark Investments, L.P.a,b,d | | | | | | | 975,975 | | | | 865,498 | | |
Stark Select Asset Fund, LLCa,b,d | | | | | | | 284,412 | | | | 271,533 | | |
Total Absolute Return | | | | | 46,280,502 | | | | 62,362,909 | | |
Enhanced Fixed Income — (11.24%) | |
BDCM Partners I, L.P.a,b,d | | | | | | | 14,400,077 | | | | 15,438,264 | | |
Contrarian Capital Fund I, L.P.a,b | | | | | | | 7,219,629 | | | | 14,393,307 | | |
CPIM Structured Credit Fund 1000, L.P.a,b,d | | | | | | | 13,869 | | | | 12,067 | | |
Drawbridge Special Opportunities Fund, L.P.a,b,d | | | | | | | 369,993 | | | | 598,232 | | |
Fortress VRF Advisors I, LLCa,b,d | | | | | | | 5,600,549 | | | | 743,205 | | |
Halcyon European Structured Opportunities Fund, L.P.a,b,d | | | | | | | 103,648 | | | | 27,168 | | |
Harbinger Capital Partners Fund I, L.P.a,b,d | | | | | | | 4,552,148 | | | | 1,222,938 | | |
Harbinger Class L Holdings (U.S.), LLCa,b,d | | | | | | | 73,101 | | | | 43,473 | | |
Harbinger Class LS Holdings I (U.S.) Trust, Series 2a,b,d | | | 2,458 | | | | 6,226,158 | | | | 187,104 | | |
Harbinger Class PE Holdings (U.S.) Trust, Series 1a,b,d | | | 3 | | | | 903,959 | | | | 453,259 | | |
Harbinger Credit Distressed Blue Line Fund, L.P.a,b,c,d | | | | | | | 12,326,928 | | | | 5,748,865 | | |
Indaba Capital Partner, L.P.a,b | | | | | | | 20,000,000 | | | | 28,463,801 | | |
Marathon Special Opportunities Fund, L.P.a,b,d | | | | | | | 796,620 | | | | 777,129 | | |
Morgan Rio Capital Fund, L.P.a,b | | | | | | | 17,000,000 | | | | 20,900,267 | | |
Prospect Harbor Designated Investments, L.P.b,d | | | | | | | 252,189 | | | | 544,635 | | |
Providence MBS Fund, L.P.a,b | | | | | | | 18,750,000 | | | | 28,042,363 | | |
Strategic Value Restructuring Fund, L.P.a,b,d | | | | | | | 75,624 | | | | 70,403 | | |
Total Enhanced Fixed Income | | | | | 108,664,492 | | | | 117,666,480 | | |
See notes to financial statements.
TWO
HATTERAS MASTER FUND, L.P.
(a Delaware Limited Partnership)
SCHEDULE OF INVESTMENTS (Continued)
March 31, 2014
Opportunistic Equity — (34.96%) | | | | Cost | | Fair Value | |
Ashoka Fund, L.P.a,b | | | | | | $ | 2,457,167 | | | $ | 2,968,151 | | |
Broadfin Healthcare Fund, L.P.a,b,c | | | | | | | 22,000,000 | | | | 51,704,609 | | |
Camcap Resources, L.P.a,b,d | | | | | | | 491,057 | | | | 305,603 | | |
Crosslink Crossover Fund IV, L.P.a,b | | | | | | | 663,304 | | | | 3,498,545 | | |
Crosslink Crossover Fund V, L.P.a,b | | | | | | | 606,025 | | | | 3,630,465 | | |
Crosslink Crossover Fund VI, L.P.a,b | | | | | | | 8,515,359 | | | | 9,832,962 | | |
Falcon Edge Global, L.P.a,b,c | | | | | | | 30,000,000 | | | | 36,857,585 | | |
Gavea Investment Fund II, L.P.a,b,d | | | | | | | 48,211 | | | | 500,187 | | |
Gavea Investment Fund III, L.P.a,b | | | | | | | 2,880,000 | | | | 11,194,548 | | |
Glade Brook Global Domestic Fund, L.P.a,b,c | | | | | | | 25,000,000 | | | | 31,913,484 | | |
Gracie Capital, L.P.a,b,d | | | | | | | 25,745 | | | | 8,884 | | |
Hound Partners, L.P.a,b,c | | | | | | | 24,000,000 | | | | 31,370,063 | | |
Integral Capital Partners VII, L.P.a,b | | | | | | | 838,076 | | | | 1,376,483 | | |
Integral Capital Partners VIII, L.P.a,b | | | | | | | 2,177,590 | | | | 1,796,844 | | |
Passport Long Short Fund, L.P.a,b | | | | | | | 15,000,000 | | | | 16,300,889 | | |
Samlyn Onshore Fund, L.P.a,b,c,d | | | | | | | 410,677 | | | | 416,918 | | |
Sansar Capital Holdings, Ltd.a,b,d | | | | | | | 162,832 | | | | 105,498 | | |
SR Global Fund, L.P. (Japan), Class Ha,b | | | | | | | 24,000,000 | | | | 21,902,787 | | |
Teng Yue Partners Fund, L.P.a,b | | | | | | | 23,000,000 | | | | 33,585,270 | | |
The Raptor Private Holdings, L.P.a,b,d | | | | | | | 235,225 | | | | 191,982 | | |
The Russian Prosperity Funda,b | | | | | | | 15,000,000 | | | | 14,261,904 | | |
Tybourne Equity (US) Funda,b,c | | | | | | | 25,000,000 | | | | 30,216,255 | | |
Valiant Capital Partners, L.P.b,c | | | | | | | 9,472,698 | | | | 14,378,921 | | |
Value Partners Hedge Fund, LLCa,b | | | | | | | 18,107,540 | | | | 18,304,386 | | |
Viking Global Equities, L.P.a,b,c | | | | | | | 17,166,317 | | | | 28,547,341 | | |
WCP Real Estate Strategies Fund, L.P.a,b,d | | | | | | | 1,592,416 | | | | 914,439 | | |
Total Opportunistic Equity | | | | | 268,850,239 | | | | 366,085,003 | | |
Private Investments — (43.79%) | |
Investments in Adviser Funds | |
ABRY Advanced Securities Fund, L.P.b | | | | | | | 892,365 | | | | 930,239 | | |
ABRY Partners VI, L.P.b | | | | | | | 3,531,637 | | | | 4,573,241 | | |
ABRY Partners VII, L.P.a,b | | | | | | | 3,375,635 | | | | 3,851,057 | | |
Accel-KKR Capital Partners III, L.P.b | | | | | | | 5,200,181 | | | | 4,214,088 | | |
Accel-KKR Capital Partners IV, L.P.a,b | | | | | | | 315,717 | | | | 251,942 | | |
Arclight Energy Partners Fund III, L.P.a,b | | | | | | | 1,806,393 | | | | 1,962,227 | | |
Arclight Energy Partners Fund IV, L.P.b | | | | | | | 1,886,331 | | | | 1,375,649 | | |
Arclight Energy Partners Fund V, L.P.a,b | | | | | | | 2,859,853 | | | | 2,963,448 | | |
Arminius Moat, L.P.a,b | | | | | | | 5,615,015 | | | | — | | |
Ascendent Capital Partners I, L.P.a,b | | | | | | | 1,371,205 | | | | 1,453,344 | | |
BDCM Opportunity Fund II, L.P.a,b,d | | | | | | | 4,305,319 | | | | 7,044,621 | | |
Benson Elliot Real Estate Partners II, L.P.a,b | | | | | | | 5,646,534 | | | | 2,488,279 | | |
Cadent Energy Partners II, L.P.b | | | | | | | 6,828,096 | | | | 11,166,453 | | |
Canaan Natural Gas Fund X, L.P.b | | | | | | | 4,523,750 | | | | 3,616,933 | | |
CDH Fund IV, L.P.b | | | | | | | 6,465,087 | | | | 7,540,462 | | |
CDH Venture Partners II, L.P.a,b | | | | | | | 3,846,147 | | | | 4,698,264 | | |
China Special Opportunities Fund III, L.P.a,b | | | | | | | 4,892,680 | | | | 6,326,451 | | |
Claremont Creek Ventures, L.P.a,b | | | | | | | 1,780,416 | | | | 1,813,320 | | |
Claremont Creek Ventures II, L.P.a,b | | | | | | | 2,019,393 | | | | 3,116,157 | | |
Colony Investors VII, L.P.a,b | | | | | | | 2,710,480 | | | | 498,200 | | |
Colony Investors VIII, L.P.a,b | | | | | | | 8,124,892 | | | | 3,072,930 | | |
CX Partners Fund Limiteda,b | | | | | | | 5,764,414 | | | | 4,870,305 | | |
Dace Ventures I, L.P.a,b | | | | | | | 2,294,229 | | | | 1,504,713 | | |
Darwin Private Equity I, L.P.a,b | | | | | | | 5,181,675 | | | | 3,590,860 | | |
See notes to financial statements.
THREE
HATTERAS MASTER FUND, L.P.
(a Delaware Limited Partnership)
SCHEDULE OF INVESTMENTS (Continued)
March 31, 2014
| Private Investments — (43.79%) (continued) | | | | Cost | | Fair Value | |
EMG Investments, LLCb | | | | | | $ | 979,547 | | | $ | 5,594,635 | | |
EnerVest Energy Institutional Fund X-A, L.P.b | | | | | | | 2,177,100 | | | | 1,867,273 | | |
EnerVest Energy Institutional Fund XI-A, L.P.b | | | | | | | 6,918,573 | | | | 10,824,998 | | |
Fairhaven Capital Partners, L.P.a,b | | | | | | | 4,497,819 | | | | 3,258,639 | | |
Falcon Sovereign, L.P.a,b | | | | | | | 4,000,000 | | | | 3,586,196 | | |
Florida Real Estate Value Fund, L.P.a,b | | | | | | | 3,005,118 | | | | 4,140,235 | | |
Forum European Realty Income III, L.P.a,b | | | | | | | 5,998,429 | | | | 5,777,552 | | |
Garrison Opportunity Fund, LLCa,b | | | | | | | 3,929,052 | | | | 8,098,397 | | |
Garrison Opportunity Fund II A, LLCa,b | | | | | | | 3,409,830 | | | | 4,646,028 | | |
Glade Brook Private Investors, LLCa,b | | | | | | | 4,578,033 | | | | 7,786,778 | | |
Glade Brook Private Investors II, LLCa,b | | | | | | | 4,088,000 | | | | 4,000,000 | | |
Great Point Partners I, L.P.a,b | | | | | | | 2,511,935 | | | | 4,156,597 | | |
Greenfield Acquisition Partners V, L.P.b | | | | | | | 4,804,720 | | | | 4,643,294 | | |
GTIS Brazil Real Estate Fund, L.P.a,b | | | | | | | 7,371,948 | | | | 9,562,730 | | |
Halifax Capital Partners II, L.P.b | | | | | | | 1,663,793 | | | | 2,169,880 | | |
Halifax Capital Partners III, L.P.b | | | | | | | 1,246,012 | | | | 1,250,445 | | |
Hancock Park Capital III, L.P.a,b | | | | | | | 904,413 | | | | 1,615,111 | | |
Healthcor Partners Fund, L.P.a,b,c | | | | | | | 3,633,657 | | | | 4,591,556 | | |
Hillcrest Fund, L.P.a,b | | | | | | | 5,427,160 | | | | 4,966,162 | | |
Intervale Capital Fund, L.P.b | | | | | | | 3,883,757 | | | | 5,375,699 | | |
J.C. Flowers III, L.P.b | | | | | | | 3,699,326 | | | | 4,889,746 | | |
LC Fund V, L.P.a,b | | | | | | | 2,737,063 | | | | 2,773,939 | | |
Lighthouse Capital Partners VI, L.P.b | | | | | | | 2,760,888 | | | | 3,078,840 | | |
Merit Energy Partners F-II, L.P.a,b | | | | | | | 1,156,832 | | | | 793,012 | | |
Mid Europa Fund III, L.P.a,b | | | | | | | 4,884,619 | | | | 4,483,969 | | |
Midstream & Resources Follow-On Fund, L.P.b | | | | | | | 2,023,213 | | | | 7,875,970 | | |
Monomoy Capital Partners II, L.P.a,b | | | | | | | 1,670,825 | | | | 1,493,345 | | |
Natural Gas Partners VIII, L.P.a,b | | | | | | | 2,004,669 | | | | 3,701,791 | | |
Natural Gas Partners IX, L.P.a,b | | | | | | | 4,414,191 | | | | 7,502,365 | | |
Natural Gas Partners X, L.P.a,b | | | | | | | 1,639,923 | | | | 1,757,481 | | |
New Horizon Capital III, L.P.b | | | | | | | 6,171,276 | | | | 9,408,689 | | |
NGP Energy Technology Partners, L.P.b | | | | | | | 748,341 | | | | 187,530 | | |
NGP Energy Technology Partners II, L.P.b | | | | | | | 3,899,879 | | | | 3,814,976 | | |
NGP Midstream & Resources, L.P.b | | | | | | | 4,261,042 | | | | 7,766,417 | | |
Northstar Equity Partners III Limiteda,b | | | | | | | 2,935,535 | | | | 2,744,017 | | |
OCM European Principal Opportunties Fund, L.P.a,b | | | | | | | 1,999,150 | | | | 1,365,899 | | |
OCM Mezzanine Fund II, L.P.a,b | | | | | | | 472,661 | | | | 1,359,353 | | |
ORBIS Real Estate Fund I, L.P.a,b | | | | | | | 3,165,320 | | | | 1,623,783 | | |
Orchid Asia IV, L.P.a,b | | | | | | | 3,895,893 | | | | 5,345,786 | | |
Parmenter Realty Fund IV, L.P.b | | | | | | | 2,523,475 | | | | 3,292,123 | | |
Patron Capital III, L.P.b | | | | | | | 4,957,855 | | | | 4,144,477 | | |
Pearlmark Mezzanine Realty Partners III, LLCb | | | | | | | 6,174,274 | | | | 4,721,808 | | |
Pennybacker II, L.P.b | | | | | | | 2,826,724 | | | | 3,277,095 | | |
Phoenix Real Estate Fund PTE Limitedb | | | | | | | 4,769,912 | | | | 5,419,223 | | |
Phoenix Real Estate Fund (T), L.P.a,b | | | | | | | 3,023,601 | | | | 2,563,479 | | |
Pine Brook Capital Partners, L.P.b | | | | | | | 7,326,535 | | | | 8,617,513 | | |
Private Equity Investment Fund V, L.P.a,b | | | | | | | 11,119,175 | | | | 13,394,441 | | |
Private Equity Investors Fund IV, L.P.a,b | | | | | | | 2,684,301 | | | | 2,511,831 | | |
Quantum Energy Partners IV, L.P.b | | | | | | | 5,002,350 | | | | 4,959,865 | | |
Quantum Energy Partners V, L.P.a,b | | | | | | | 7,610,474 | | | | 7,443,603 | | |
Rockwood Capital Real Estate Partners Fund VII, L.P.a,b | | | | | | | 4,814,984 | | | | 2,088,413 | | |
Roundtable Healthcare Management III, L.P.a,b | | | | | | | 4,349,451 | | | | 4,020,848 | | |
Roundtable Healthcare Partners II, L.P.a,b | | | | | | | 1,385,712 | | | | 1,488,590 | | |
Saints Capital VI, L.P.b | | | | | | | 8,102,512 | | | | 7,880,614 | | |
See notes to financial statements.
FOUR
HATTERAS MASTER FUND, L.P.
(a Delaware Limited Partnership)
SCHEDULE OF INVESTMENTS (Continued)
March 31, 2014
| Private Investments — (43.79%) (concluded) | | Shares/
Contracts | | Cost | | Fair Value | |
Sanderling Venture Partners VI Co-Investment Fund, L.P.b | | | | | | $ | 630,987 | | | $ | 889,619 | | |
Sanderling Venture Partners VI, L.P.b | | | | | | | 853,294 | | | | 1,270,946 | | |
SBC Latin America Housing US Fund, L.P.a,b | | | | | | | 2,740,906 | | | | 3,443,821 | | |
Sentient Global Resources Fund III, L.P.b | | | | | | | 12,507,019 | | | | 13,100,025 | | |
Sentient Global Resources Fund IV, L.P.a,b | | | | | | | 3,430,873 | | | | 3,247,480 | | |
Singerman Real Estate Opportunity Fund I, L.P.a,b | | | | | | | 1,150,583 | | | | 1,247,157 | | |
Sovereign Capital III, L.P.a,b | | | | | | | 4,168,597 | | | | 6,085,499 | | |
Square Mile Lodging Opportunity Partners, L.P.b | | | | | | | 937,381 | | | | 1,050,804 | | |
Square Mile Partners III, L.P.b | | | | | | | 4,686,953 | | | | 4,916,592 | | |
Sterling Capital Partners II, L.P.a,b | | | | | | | 1,685,745 | | | | 1,604,249 | | |
Sterling Group Partners III, L.P.a,b | | | | | | | 3,069,952 | | | | 3,154,511 | | |
Strategic Value Global Opportunities Fund I-A, L.P.a,b | | | | | | | 2,765,011 | | | | 1,439,922 | | |
Talara Opportunities II, LPa,b | | | | | | | 578,169 | | | | 567,437 | | |
TDR Capital AS 2013, L.P.a,b | | | | | | | 6,184,080 | | | | 13,962,888 | | |
Tenaya Capital V, L.P.b | | | | | | | 3,350,139 | | | | 5,068,993 | | |
The Column Group, L.P.a,b | | | | | | | 4,040,760 | | | | 3,506,993 | | |
The Energy and Minerals Group Fund II, L.P.b | | | | | | | 3,416,056 | | | | 4,813,496 | | |
The Founders Fund III, L.P.a,b | | | | | | | 5,000,000 | | | | 11,693,876 | | |
The Founders Fund IV, L.P.a,b | | | | | | | 2,355,726 | | | | 3,310,641 | | |
Tiger Global Investments Partners VI, L.P.a,b | | | | | | | 4,865,045 | | | | 5,238,133 | | |
Tiger Global Investments Partners VII, L.P.a,b | | | | | | | 1,935,840 | | | | 1,986,756 | | |
TPF II, L.P.b | | | | | | | 5,471,509 | | | | 3,915,487 | | |
Trivest Fund IV, L.P.b | | | | | | | 3,962,650 | | | | 4,973,366 | | |
Trivest Fund V, L.P.a,b | | | | | | | 1,225,161 | | | | 293,543 | | |
True Ventures III, L.P.a,b | | | | | | | 1,625,000 | | | | 1,796,865 | | |
Urban Oil and Gas Partners A-1, L.P.a,b | | | | | | | 6,275,346 | | | | 4,351,000 | | |
Urban Oil and Gas Partners B-1, L.P.a,b | | | | | | | 1,098,220 | | | | 882,000 | | |
VCFA Private Equity Partners IV, L.P.b | | | | | | | 1,149,502 | | | | 643,061 | | |
VCFA Venture Partners V, L.P.b | | | | | | | 5,494,464 | | | | 4,091,084 | | |
Voyager Capital Fund III, L.P.a,b | | | | | | | 2,318,622 | | | | 3,170,100 | | |
WCP Real Estate Fund I, L.P.a,b | | | | | | | 1,709,933 | | | | 1,401,144 | | |
Westview Capital Partners II, L.P.a,b | | | | | | | 6,590,661 | | | | 8,151,129 | | |
Zero2IPO China Fund II, L.P.a,b | | | | | | | 4,259,480 | | | | 4,457,974 | | |
Total Investments in Adviser Funds | | | | | 409,011,985 | | | | 458,352,810 | | |
Investments in Private Companies | |
Illumitex, Inc., Common Stocka,b | | | 1,331,167 | | | | 1,000,000 | | | | — | | |
Illumitex, Inc., Series A-1 Preferred Stocka,b | | | 2,404,160 | | | | 499,369 | | | | 206,025 | | |
Illumitex, Inc., Series X Preferred Stocka,b | | | 2,404,160 | | | | — | | | | — | | |
Total Investments in Private Companies | | | | | 1,499,369 | | | | 206,025 | | |
Investment in Private Company Call Options | |
Illumitex, Inc., Exercise Price $0.03, 10/24/2022a,b | | | 553,352 | | | | — | | | | — | | |
Total Investment in Private Company Call Options | | | | | — | | | | — | | |
Total Private Investments | | | | | 410,511,354 | | | | 458,558,835 | | |
Tactical Trading — (4.62%) | |
Investments in Adviser Funds | |
Black River Commodity MS Fund, L.P.a,b,d | | | | | | | 379,957 | | | | 331,479 | | |
Drawbridge Global Macro Fund, L.P.a,b,d | | | | | | | 68,576 | | | | 75,731 | | |
Hayman Capital Partners, L.P.a,b | | | | | | | 18,000,000 | | | | 17,122,056 | | |
Ospraie Special Opportunities Fund, L.P.a,b,d | | | | | | | 482,887 | | | | 952,621 | | |
See notes to financial statements.
FIVE
HATTERAS MASTER FUND, L.P.
(a Delaware Limited Partnership)
SCHEDULE OF INVESTMENTS (Concluded)
March 31, 2014
| Tactical Trading — (4.62%) (concluded) | | Shares | | Cost | | Fair Value | |
Touradji Private Equity Onshore Fund, Ltd.b,d | | | | | | $ | 2,671,463 | | | $ | 898,577 | | |
Total Investments in Adviser Funds | | | | | 21,602,883 | | | | 19,380,464 | | |
Investments in Exchange Traded Funds | |
WisdomTree Japan Hedged Equity Fund | | | 612,100 | | | | 27,157,088 | | | | 28,976,814 | | |
Total Investments in Exchange Traded Funds | | | | | 27,157,088 | | | | 28,976,814 | | |
Total Tactical Trading | | | | | 48,759,971 | | | | 48,357,278 | | |
Total Investments in Adviser Funds and Securities (cost $883,066,558) | | | | | | | 1,053,030,505 | | |
Short-Term Investments — (1.82%) | |
Federated Prime Obligations Fund #10, 0.02%e | | | 19,070,899 | | | | 19,070,899 | | | | 19,070,899 | | |
Total Short-Term Investments (cost $19,070,899) | | | | | | | 19,070,899 | | |
Total Investments (cost $902,137,457) (102.38%) | | | | | | | 1,072,101,404 | | |
Liabilities in excess of other assets (-2.38%) | | | | | | | (24,836,387 | ) | |
Partners' capital — (100.00%) | | | | | | $ | 1,047,265,017 | | |
a Non-income producing.
b Adviser Funds and securities that are issued in private placement transactions are restricted as to resale.
c Securities held in custody by US Bank N.A., as collateral for a credit facility. The total cost and fair value of these securities as of March 31, 2014 was $189,088,533 and $274,386,273, respectively.
d The Adviser Fund has imposed gates on or has restricted redemptions from Adviser Funds. The total cost and fair value of these securities as of March 31, 2014 was $72,785,396 and $49,289,961, respectively.
e The rate shown is the annualized 7-day yield as of March 31, 2014.
See notes to financial statements.
SIX
HATTERAS MASTER FUND, L.P.
(a Delaware Limited Partnership)
STATEMENT OF ASSETS, LIABILITIES AND PARTNERS' CAPITAL
March 31, 2014
Assets | |
Investments in Adviser Funds and securities, at fair value (cost $883,066,558) | | $ | 1,053,030,505 | | |
Investments in short-term investments, at fair value (cost $19,070,899) | | | 19,070,899 | | |
Cash | | | 1,849,397 | | |
Receivable from redemption of Adviser Funds and securities | | | 24,241,797 | | |
Investments in Adviser Funds and securities paid in advance | | | 6,685,132 | | |
Dividends and interest receivable | | | 358 | | |
Prepaid assets | | | 479 | | |
Total assets | | $ | 1,104,878,567 | | |
Liabilities and partners' capital | |
Withdrawals payable | | $ | 56,043,100 | | |
Management fee payable | | | 916,478 | | |
Professional fees payable | | | 258,000 | | |
Accounting and administration fees payable | | | 140,762 | | |
Contributions received in advance | | | 100,785 | | |
Risk management fees payable | | | 75,000 | | |
Line of credit fees payable | | | 35,000 | | |
Printing fees payable | | | 25,000 | | |
Custodian fees payable | | | 19,425 | | |
Total liabilities | | | 57,613,550 | | |
Partners' capital | | | 1,047,265,017 | | |
Total liabilities and partners' capital | | $ | 1,104,878,567 | | |
Components of partners' capital | |
Capital contributions (net) | | $ | 849,333,863 | | |
Accumulated net investment loss | | | 21,206,501 | | |
Accumulated net realized gain | | | 6,760,706 | | |
Accumulated net unrealized appreciation on investments | | | 169,963,947 | | |
Partners' capital | | $ | 1,047,265,017 | | |
See notes to financial statements.
SEVEN
HATTERAS MASTER FUND, L.P.
(a Delaware Limited Partnership)
STATEMENT OF OPERATIONS
For the year ended March 31, 2014
Investment income | |
Dividends | | $ | 39,873,996 | | |
Interest | | | 12,302 | | |
Total investment income | | | 39,886,298 | | |
Operating expenses | |
Management fee | | | 11,407,298 | | |
Line of credit fees | | | 969,289 | | |
Accounting and administration fees | | | 863,664 | | |
Professional fees | | | 761,047 | | |
Risk management expense | | | 557,592 | | |
Custodian fees | | | 124,260 | | |
Printing expense | | | 59,439 | | |
Compliance consulting fees | | | 30,000 | | |
Interest expense | | | 20,825 | | |
Insurance expense | | | 5,831 | | |
Other expenses | | | 127,843 | | |
Total operating expenses | | | 14,927,088 | | |
Net investment income | | | 24,959,210 | | |
Net realized gain and change in unrealized appreciation on investments in Adviser Funds, securities and
foreign exchange transactions | |
Net realized gain from investments in Adviser Funds, securities and foreign exchange transactions | | | 26,341,562 | | |
Net change in unrealized appreciation on investments in Adviser Funds, securities and foreign exchange transactions | | | 69,241,260 | | |
Net realized gain and change in unrealized appreciation on investments in Adviser Funds, securities and
foreign exchange transactions | | | 95,582,822 | | |
Net increase in partners' capital resulting from operations | | $ | 120,542,032 | | |
See notes to financial statements.
EIGHT
HATTERAS MASTER FUND, L.P.
(a Delaware Limited Partnership)
STATEMENTS OF CHANGES IN PARTNERS' CAPITAL
For the year ended March 31, 2013 and the year ended March 31, 2014
| | | General
Partner's
Capital | | Limited
Partners'
Capital | | Total Partners'
Capital | |
Partners' Capital, at March 31, 2012 | | $ | — | | | $ | 1,440,698,030 | | | $ | 1,440,698,030 | | |
Capital contributions | | | — | | | | 51,623,316 | | | | 51,623,316 | | |
Capital withdrawals | | | (965,799 | ) | | | (374,965,845 | ) | | | (375,931,644 | ) | |
Net investment income | | | — | | | | 11,642,572 | | | | 11,642,572 | | |
Net realized gain from investments in Adviser Funds, securities and
foreign exchange transactions | | | — | | | | 34,933,051 | | | | 34,933,051 | | |
Net change in unrealized appreciation on investments in Adviser Funds,
securities and foreign exchange transactions | | | — | | | | 17,585,750 | | | | 17,585,750 | | |
Performance allocation | | | 965,799 | | | | (965,799 | ) | | | — | | |
Partners' Capital, at March 31, 2013* | | $ | — | | | $ | 1,180,551,075 | | | $ | 1,180,551,075 | | |
Capital contributions | | | — | | | | 5,574,614 | | | | 5,574,614 | | |
Capital withdrawals | | | (5,745,793 | ) | | | (253,656,911 | ) | | | (259,402,704 | ) | |
Net investment income | | | — | | | | 24,959,210 | | | | 24,959,210 | | |
Net realized gain on investments in Adviser Funds, securities and foreign
exchange transactions | | | — | | | | 26,341,562 | | | | 26,341,562 | | |
Net change in unrealized appreciation on investments in Adviser Funds,
securities and foreign exchange transactions | | | — | | | | 69,241,260 | | | | 69,241,260 | | |
Performance allocation | | | 5,745,793 | | | | (5,745,793 | ) | | | — | | |
Partners' Capital, at March 31, 2014** | | $ | — | | | $ | 1,047,265,017 | | | $ | 1,047,265,017 | | |
* Including accumulated net investment loss of $3,752,709.
** Including accumulated net investment income of $21,206,501.
See notes to financial statements.
NINE
HATTERAS MASTER FUND, L.P.
(a Delaware Limited Partnership)
STATEMENT OF CASH FLOWS
For the year ended March 31, 2014
Cash flows from operating activities: | |
Net increase in partners' capital resulting from operations | | $ | 120,542,032 | | |
Adjustments to reconcile net increase in partners' capital resulting from operations to net cash
provided by operating activities: | |
Purchase of Adviser Funds and securities | | | (211,716,966 | ) | |
Proceeds from redemptions/sales of Adviser Funds and securities | | | 413,549,818 | | |
Net realized gain from investments in Adviser Funds, securities and foreign exchange transactions | | | (26,341,562 | ) | |
Net change in unrealized appreciation on investments in Adviser Funds, securities and foreign
exchange transactions | | | (69,241,260 | ) | |
Net sales of short-term investments | | | 31,532,469 | | |
Increase in investments in Adviser Funds and securities paid in advance | | | (6,302,551 | ) | |
Decrease in receivable from redemption of Adviser Funds and securities | | | 13,269,396 | | |
Decrease in dividends and interest receivable | | | 1,613 | | |
Decrease in prepaid assets | | | 86 | | |
Decrease in management fee payable | | | (122,269 | ) | |
Increase in professional fees payable | | | 29,846 | | |
Decrease in risk management fees payable | | | (25,000 | ) | |
Increase in accounting and administration fees payable | | | 62,851 | | |
Decrease in line of credit fees payable | | | (10,333 | ) | |
Increase in printing fees payable | | | 20,000 | | |
Increase in custodian fees payable | | | 425 | | |
Decrease in other accrued expenses | | | (10,000 | ) | |
Net cash provided by operating activities | | | 265,238,595 | | |
Cash flows from financing activities: | |
Capital contributions | | | 4,483,387 | | |
Capital withdrawals | | | (268,350,646 | ) | |
Net cash used in financing activities | | | (263,867,259 | ) | |
Net change in cash | | | 1,371,336 | | |
Cash at beginning of year | | | 478,061 | | |
Cash at end of year | | $ | 1,849,397 | | |
Supplement Disclosure of Interest Expense Paid | | $ | 20,825 | | |
Supplement Disclosure of Line of Credit Fees Paid | | $ | 979,623 | | |
See notes to financial statements.
TEN
HATTERAS MASTER FUND, L.P.
(a Delaware Limited Partnership)
NOTES TO FINANCIAL STATEMENTS
As of and for the year ended March 31, 2014
1. ORGANIZATION
Hatteras Master Fund, L.P. (the "Master Fund") was organized as a limited partnership under the laws of the State of Delaware on October 29, 2004 and commenced operations on January 1, 2005. The Master Fund is registered under the Investment Company Act of 1940, as amended (the "1940 Act"), as a closed-end, non-diversified management investment company. The Master Fund is co-managed by Hatteras Investment Partners, LLC ("HIP"), a Delaware limited liability company registered as an investment adviser under the Investment Advisers Act of 1940, as amended (the "Advisers Act"), and Morgan Creek Capital Management, LLC ("MCCM", together with HIP, the "Investment Managers"), a North Carolina limited liability company registered as an investment adviser under the Advisers Act. The primary objective of the Master Fund is to provide capital appreciation consistent with the return characteristic of the alternative investment portfolios of larger endowments. The Master Fund's secondary objective is to provide capital appreciation with less volatility than that of the equity markets. To achieve its objectives, the Master Fund provides its limited partners (each, a "Limited Partner" and together, the "Limited Partners") with access to a broad range of investment strategies, asset categories, and trading Advisers ("Advisers") and by providing overall asset allocation services typically available on a collective basis to larger institutions. The Master Fund invests with each Adviser either by becoming a participant in an investment vehicle operated by the Adviser (each an "Adviser Fund", collectively, the "Adviser Funds") which includes exchange traded funds ("ETFs"), hedge funds, and investment funds or by placing assets in an account directly managed by the Adviser.
Hatteras Investment Management LLC, a Delaware limited liability company, serves as the General Partner of the Master Fund (the "General Partner"). The General Partner is an affiliate of HIP. The General Partner has appointed a Board of Directors (the "Board") and, to the fullest extent permitted by applicable law, has irrevocably delegated to the Board its rights and powers to monitor and oversee the business affairs of the Master Fund, including the complete and exclusive authority to oversee and establish policies regarding the management, conduct and operation of the Master Fund's business.
2. SIGNIFICANT ACCOUNTING POLICIES
The following is a summary of significant accounting and reporting policies used in preparing the financial statements.
a. Basis of Accounting
The Master Fund's accounting and reporting policies conform with accounting principles generally accepted within the United States of America ("GAAP").
b. Cash
Cash includes short-term interest bearing deposit accounts. At times, such deposits may be in excess of federally insured limits. The Master Fund has not experienced any losses in such accounts and does not believe it is exposed to any significant credit risk on such accounts.
c. Valuation of Investments
The Master Fund's valuation procedures have been approved by the Master Fund's Board. The valuation procedures are implemented by the Master Fund's Investment Managers and the third party administrator, which report to the Board. For third-party information, the Master Fund's administrator monitors and reviews the methodologies of the various pricing services employed by the Master Fund.
Investments held by the Master Fund include:
• Investments in Adviser Funds — The Master Fund will value interests in the Adviser Funds at fair value, using the net asset value ("NAV") as a practical expedient, as provided by the investment managers of such Adviser Funds. These Adviser Funds value their underlying investments in accordance with policies established by such Advisor Funds, which ordinarily will be the value determined by their respective investment managers, in accordance with the Master Fund's valuation procedures. Investments in Adviser Funds are subject to the terms of the Adviser Funds' offering documents. Valuations of the Adviser Funds may be subject to estimates and are net of management and performance incentive fees or allocations payable to the Adviser Funds' investment managers as required by the Adviser Funds' offering documents. If the Investment Managers determine that the most recent value reported by any Adviser Fund does not represent fair value or if any Adviser Fund fails to report a value to the Master Fund, a fair value determination is made under the Master Fund's valuation procedures under the general supervision of the Board. While these valuations are intended to estimate the value the Master Fund might reasonably expect to receive upon the current sale of the Advisor Funds in the ordinary course of business, such values may differ from the value that the Master Fund would actually realize if the Adviser Funds were sold.
The interests of some Adviser Funds, primarily investments in private equity funds, may be valued less frequently than the calculation of the Master Fund's net asset value. Therefore, the reported performance of the Adviser Fund may lag the reporting period of the Master Fund. The Investment Managers have established procedures for reviewing the effect on the Master Fund's net asset value due to this lag in reported performance of the Adviser Funds.
ELEVEN
HATTERAS MASTER FUND, L.P.
(a Delaware Limited Partnership)
NOTES TO FINANCIAL STATEMENTS (Continued)
As of and for the year ended March 31, 2014
2. SIGNIFICANT ACCOUNTING POLICIES (CONTINUED)
c. Valuation of Investments (continued)
• Investments in Exchange Traded Funds and Mutual Funds — Securities traded on one or more of the U.S. national securities exchanges or the OTC Bulletin Board will be valued at their last sales price. Securities traded on NASDAQ will be valued at the NASDAQ Official Closing Price ("NOCP"), at the close of trading on the exchanges or markets where such securities are traded for the business day as of which such value is being determined.
• Investments in Private Companies — Investments for which observable market prices in active markets do not exist are reported at fair value, as determined in good faith by the Adviser. Fair value is based on the best information available and is determined by reference to information including, but not limited to, the following: projected sales, net earnings, earnings before interest, taxes, depreciation and amortization ("EBITDA"), balance sheets, public or private transactions, valuations for publicly traded comparable companies, recent round of financing in the company's stock, and/or other measures, and consideration of any other pertinent information including the types of securities held and restrictions on disposition. The amount determined to be fair value may incorporate the Adviser's own assumptions (including appropriate risk adjustments for nonperformance and lack of marketability). The methods used to estimate the fair value of private companies include: (1) the market approach (whereby fair value is derived by reference to observable valuation measures for comparable companies or assets — e.g., multiplying a key performance metric of the investee company or asset, such as projected revenue or EBITDA, by a relevant valuation multiple observed in the range of comparable companies or transactions — adjusted by the Adviser for differences between the investment and the referenced comparables and in some instances by reference to option pricing models or other similar methods), (2) the income approach (e.g., the discounted cash flow method), and (3) cost for a period of time after an acquisition (where such amount is determined by the Adviser to be the best indicator of fair value). These valuation methodologies involve a significant degree of judgment. While these valuations are intended to estimate the value the Master Fund might reasonably expect to receive upon the current sale of investments in private companies in the ordinary course of business, such values may differ from the value that the Master Fund would actually realize if the investments in private companies were sold.
• Investments in Options — Options contracts give the Master Fund the right, but not the obligation, to buy or sell the underlying instrument for a specified price upon exercise at any time during the option period. For the year ended March 31, 2014, the Master Fund held options that were granted from one of the Master Fund's Private Companies. Options are valued by the Investment Managers using an option pricing model. At March 31, 2014, the fair value of options held by the Master Fund was $0 as set forth in the Schedule of Investments. For the year ended March 31, 2014, the effect of options on the Master Fund's Statement of Operations was a change in unrealized depreciation in the amount of $8,981. During the year ended March 31, 2014, no other derivatives were held by the Master Fund.
The Master Fund classifies its assets and liabilities that are reported at fair value into three levels based on the lowest level of input that is significant to the fair value measurement. Estimated values may differ from the values that would have been used if a ready market existed or if the investments were liquidated at the valuation date.
The three-tier hierarchy distinguishes between (1) inputs that reflect the assumptions market participants would use in pricing an asset or liability developed based on market data obtained from sources independent of the reporting entity (observable inputs) and (2) inputs that reflect the reporting entity's own assumptions about the assumptions market participants would use in pricing an asset or liability developed based on the best information available in the circumstances (unobservable inputs) and to establish classification of fair value measurements for disclosure purposes. Various inputs are used in determining the value of the Master Fund's investments. The inputs are summarized in the three broad levels listed below:
• Level 1 — quoted prices (unadjusted) in active markets for identical assets and liabilities.
• Level 2 — other significant observable inputs or investments that can be fully redeemed at the net asset value in the "near term" (including quoted prices for similar investments, interest rates, prepayment speeds, credit risk, ability to redeem in the near term, generally within the next calendar quarter, from Adviser Funds, etc.).
• Level 3 — significant unobservable inputs (including the Master Fund's own assumptions in determining the fair value of investments) or investments that cannot be fully redeemed at the net asset value in the "near term", these are investments that generally have one or more of the following characteristics: gated redemptions, suspended redemptions, or have lock-up periods greater than 90 days.
| | | Level 1 | | Level 2 | | Level 3 | | Total | |
Absolute Return | | $ | — | | | $ | 52,079,813 | | | $ | 10,283,096 | | | $ | 62,362,909 | | |
Enhanced Fixed Income | | | — | | | | 85,132,473 | | | | 32,534,007 | | | | 117,666,480 | | |
Opportunistic Equity | | | — | | | | 317,932,724 | | | | 48,152,279 | | | | 366,085,003 | | |
Private Investments | | | | | — | | | | 458,558,835 | | | | 458,558,835 | | |
Tactical Trading | | | 28,976,814 | | | | 17,122,056 | | | | 2,258,408 | | | | 48,357,278 | | |
Short-Term Investment | | | 19,070,899 | | | | — | | | | — | | | | 19,070,899 | | |
Total | | $ | 48,047,713 | | | $ | 472,267,066 | | | $ | 551,786,625 | | | $ | 1,072,101,404 | | |
TWELVE
HATTERAS MASTER FUND, L.P.
(a Delaware Limited Partnership)
NOTES TO FINANCIAL STATEMENTS (Continued)
As of and for the year ended March 31, 2014
2. SIGNIFICANT ACCOUNTING POLICIES (CONTINUED)
c. Valuation of Investments (continued)
The following is a reconciliation of investments in which significant unobservable inputs (Level 3) were used in determining fair value on a recurring basis:
Level 3
Investments | | Balance
as of
March 31,
2013 | | Transfers
out of
Level 3
into
Level 2* | | Net
Realized
Gain
(Loss) | | Change in
Unrealized
Appreciation/
(Depreciation) | | Gross
Purchases | | Proceeds
from
Redemptions/
Gross
Sales | | Balance
as of
March 31,
2014 | |
Absolute Return | | $ | 14,615,157 | | | $ | — | | | $ | (3,324,283 | ) | | $ | 3,399,106 | | | $ | 304,983 | | | $ | (4,711,867 | ) | | $ | 10,283,096 | | |
Enhanced Fixed Income | | | 33,740,954 | | | | — | | | | (1,620,005 | ) | | | 5,558,336 | | | | — | | | | (5,145,278 | ) | | | 32,534,007 | | |
Opportunistic Equity | | | 100,553,665 | | | | (30,081,649 | ) | | | 4,321,250 | | | | (4,059,134 | ) | | | — | | | | (22,581,853 | ) | | | 48,152,279 | | |
Private Investments | | | 422,822,568 | | | | — | | | | 3,974,448 | | | | 24,332,158 | | | | 66,532,179 | | | | (59,102,518 | ) | | | 458,558,835 | | |
Tactical Trading | | | 5,616,938 | | | | — | | | | 622,582 | | | | (1,426,827 | ) | | | 957,067 | | | | (3,511,352 | ) | | | 2,2258,408 | | |
Total Level 3 Investments | | $ | 577,349,282 | | | $ | (30,081,649 | ) | | $ | 3,973,992 | | | $ | 27,803,639 | | | $ | 67,794,229 | | | $ | (95,052,868 | ) | | $ | 551,786,625 | | |
* Transfers are represented by their balance as of April 1, 2013.
Transfers into and out of all Levels are represented by their balances as of the beginning of the reporting period. Transfers into Level 3 usually result from Adviser Funds imposing gates or suspending redemptions; transfers out of Level 3 generally occur when lock-up periods on investments in Adviser Funds are lifted. There were no transfers among Levels 1, 2 or 3 except for a transfer out of Level 3 into Level 2 that resulted from a lock-up period on an investment in an Adviser Fund being lifted, as set forth in the table above.
The net realized gain (loss) and change in unrealized appreciation/(depreciation) in the table above are reflected in the accompanying Statement of Operations. The change in unrealized appreciation/(depreciation) from Level 3 investments held at March 31, 2014 is $29,581,808.
Adviser Funds categorized as Level 3 assets, with a fair value totaling $40,170,336, have imposed gates or suspended redemptions. Gates were imposed or redemptions were suspended for these Adviser Funds during a period ranging from October 2008 to March 2014. It is generally not known when these restrictions will be lifted.
The following is a summary of quantitative information about significant unobservable valuation inputs for Level 3 Fair Value Measurements for investments held as of March 31, 2014:
Type of Level 3 Investment | | Fair Value as of
March 31, 2014 | | Valuation Techniques | | Unobservable Input | |
Adviser Funds | |
Absolute Return | | $ | 10,283,096 | | | NAV as practical expedient* | | | N/A | | |
Enhanced Fixed Income | | | 32,534,007 | | | NAV as practical expedient* | | | N/A | | |
Opportunistic Equity | | | 48,152,279 | | | NAV as practical expedient* | | | N/A | | |
Private Investments | | | 458,352,810 | | | NAV as practical expedient* | | | N/A | | |
Tactical Trading | | | 2,258,408 | | | NAV as practical expedient* | | | N/A | | |
Preferred Stock | |
Private Investments | | | 206,025 | | | Current value method | | Recent round of financing | |
Total Level 3 Investments | | $ | 551,786,625 | | | | | | | | | | |
* Unobservable input.
No adjustments were made to the NAV provided by the investment manager or administrator of the Adviser Funds. Adjustments to the NAV provided by the investment manager or administrator of the Adviser Funds would be considered if the practical expedient NAV was not as of the Master Fund's measurement date; it was probable that the Adviser Fund would be sold at a value materially different than the reported expedient NAV; or it was determined in accordance with the Master Fund's valuation procedures that the Adviser Fund is not being reported at fair value.
The significant unobservable inputs used in the fair value measurement of the Master Fund's Private Investment shares are based on the portfolio company's most recent round of financing and the financial results of privately held entities. If the financial condition of these companies was to deteriorate, or if market comparables were to fall, the value of the stock in these private companies held by the Master Fund would be lower.
THIRTEEN
HATTERAS MASTER FUND, L.P.
(a Delaware Limited Partnership)
NOTES TO FINANCIAL STATEMENTS (Continued)
As of and for the year ended March 31, 2014
2. SIGNIFICANT ACCOUNTING POLICIES (CONTINUED)
c. Valuation of Investments (continued)
Investment Category | | Investment
Strategy | | Fair
Value
(in 000's) | | Unfunded
Commitments
(in 000's) | | Remaining
Life* | | Redemption
Frequency* | | Notice
Period
(in Days)* | | Redemption
Restrictions
Terms* | |
Opportunistic Equity(a) | | Investments in global equity markets and strategies involving specific market sectors, such as financial, technology, public real estate and public energy. | | $ | 366,085 | | | | N/A | | | | N/A | | | Monthly-Annually | | | 5-120 | | | 0-3 years; Up to 6% redemption fee | |
Enhanced Fixed Income(b) | | Investments in non-traditional fixed income securities, including distressed debt strategies. | | $ | 117,667 | | | | N/A | | | | N/A | | | Monthly-Annually | | | 0-185 | | | 0-3 years; Up to 5% redemption fee | |
Absolute Return(c) | | Investments in a variety of securities with the intent of profiting from relative changes in the price of a set of securities, currencies or commodities. | | $ | 62,363 | | | | N/A | | | | N/A | | | Monthly-Annually | | | 0-92 | | | 0-2 years; Up to 6% redemption fee | |
Tactical Trading(d) | | Investments in commodities, currencies, global bonds and international stock indices, with low correlation to the equity markets. | | $ | 48,357 | | | | N/A | | | | N/A | | | Daily Quarterly | | | 0-180 | | | 0-10 years; Up to 3% redemption fee | |
Private Investments(e) | | Investments in Private Equity, Private Real Estate, Private Energy and Natural Resources, generally through private partnerships or direct investments. | | $ | 458,559 | | | $ | 117,853 | | | Up to 10 years with extensions available after the stated termination date | | | N/A | | | | N/A | | | | N/A | | |
* The information summarized in the table above represents the general terms for the specified asset class. Individual Adviser Funds may have terms that are more or less restrictive than those terms indicated for the asset class as a whole. In addition, most Adviser Funds have the flexibility, as provided for in their constituent documents, to modify and waive such terms.
The Master Fund's investments reflect their estimated fair value, which for marketable securities would generally be the last sales price on the primary exchange for such security and for Adviser Funds, would generally be the net asset value as provided by the Adviser Fund or its administrator. For each of the categories below, the fair value of the Adviser Funds has been estimated using the net asset value of the Adviser Funds.
a This category includes Adviser Funds that predominantly invest in all global markets, including the U.S. domestic markets, and predominantly invest in equity securities. While the Opportunistic Equity investment strategy consists of Adviser Funds that trade predominantly in equity securities, certain of the Advisers chosen may additionally invest all or a portion of the Advisers Fund in debt or other instruments.
b This category includes Adviser Funds that invest primarily in high yield debt, distressed securities, structured credit, and opportunistic credit (including, among other things, in emerging markets).
c This category is defined as having a relatively low or negative correlation to the equity markets. In addition, certain strategies within the Absolute Return investment strategy may have less volatility through the use of arbitrage based strategies and hedging tools (e.g., "market" puts and calls, etc.). The Absolute Return investment strategy includes Adviser Funds that invest using Event Driven Arbitrage, Convertible Arbitrage, Merger Arbitrage, Fixed Income Arbitrage, Volatility Arbitrage and Statistical Arbitrage.
d This category includes Adviser Funds who engage in directional trading strategies. Some of the Tactical Trading strategies incorporate equity assets as well as currencies, commodities and debt instruments. Commodity Trading Advisors (CTAs) are included in the Tactical Trading investment strategy. Historically, the Tactical Trading investment strategy has a relatively low correlation to the equity markets. Global Macro/Managed Futures strategies are generally categorized as either discretionary or systematic in nature and may assume aggressive investment postures with respect to position concentrations, use of leverage, portfolio turnover, and the various investment instruments used.
FOURTEEN
HATTERAS MASTER FUND, L.P.
(a Delaware Limited Partnership)
NOTES TO FINANCIAL STATEMENTS (Continued)
As of and for the year ended March 31, 2014
2. SIGNIFICANT ACCOUNTING POLICIES (CONTINUED)
c. Valuation of Investments (concluded)
e This category invests in three sub-strategies (Private Equity, Private Real Estate and Private Energy and Natural Resources). Private Equity investing seeks to generate capital appreciation through investments in private companies in need of capital. Private Equity seeks to profit from, among other things, the inefficiencies inherent in these markets though valuation and due diligence analysis of available business opportunities. Private Real Estate strategy consists generally of investing in Adviser Funds that are private partnerships that make direct investments in (i) existing or newly constructed income-producing properties, including office, industrial, retail, and multi-family residential properties, (ii) raw land, which may be held for development or for the purpose of appreciation, and/or (iii) timber (whether directly or through a REIT or other Adviser Fund). The Private Energy and Natural Resources strategy consists generally of investing in Adviser Funds that are private partnerships that make direct investments in private or (sometimes) publicly traded energy companies.
d. Investment Income
Interest income is recorded when earned. Dividend income is recorded on the ex-dividend date, except that certain dividends from private equity investments are recorded as soon as the information is available to the Master Fund. Investments in short-term investments, mutual funds, private companies and exchange traded funds are recorded on a trade date basis. Investments in Adviser Funds are recorded on a subscription effective date basis, which is generally the first day of the calendar month in which the investment is effective. Realized gains and losses on Adviser Fund and security redemptions are determined on identified cost basis. Return of capital or security distributions received from Adviser Funds and securities are accounted for as a reduction to cost.
e. Foreign Currency
Investment securities and other assets and liabilities denominated in foreign currencies are translated into U.S. dollar amounts at the date of valuation. Purchases and sales of investment securities and income and expense items denominated in foreign currencies are translated into U.S. dollar amounts on the respective dates of such transactions. The company does not isolate that portion of the results of operations resulting from changes in foreign exchange rates on investments from the fluctuations arising from changes in market prices of securities held. Such fluctuations are included with the net realized and unrealized gain or loss from investments. Reported net realized foreign exchange gains or losses arise from sales of foreign currencies, currency gains or losses realized between the trade and settlement dates on securities transactions, and the difference between the amounts of dividends, interest, and foreign withholding taxes recorded on the company's books and the U.S. dollar equivalent of the amounts actually received or paid. Net unrealized foreign exchange gains and losses arise from changes in the fair values of assets and liabilities, other than investments in securities at fiscal period end, resulting from changes in exchange rates.
f. Master Fund Expenses
The Master Fund will bear all expenses incurred, on an accrual basis, in the business of the Master Fund, including, but not limited to, the following: all costs and expenses related to portfolio transactions and positions for the Master Fund's account; legal fees; accounting, auditing, and tax preparation fees; custodial fees; fees for data and software providers; costs of insurance; registration expenses; directors' fees; interest expenses and commitment fees on credit facilities; and expenses of meetings of the Board.
g. Income Taxes
The Master Fund is treated as a partnership for federal income tax purposes and therefore is not subject to U.S. federal income tax. For income tax purposes, the individual partners will be taxed upon their distributive share of each item of the Master Fund's profit and loss.
The Master Fund files tax returns as prescribed by the tax laws of the jurisdiction in which it operates. In the normal course of business, the Master Fund is subject to examination by federal, state, local and foreign jurisdictions, where applicable. For the years ended December 31, 2010 through December 31, 2013 the Master Fund is open to examination by major tax jurisdictions under the statute of limitations.
The Master Fund has reviewed any potential tax positions as of March 31, 2014 and has determined that it does not have a liability for any unrecognized tax benefits or expense. The Master Fund recognizes interest and penalties, if any, related to unrecognized tax benefits as income tax expense in the Statement of Operations. During the period, the Master Fund did not incur any material interest or penalties. Due to the timing of tax information received from the Adviser Funds, tax basis reporting is not available as of the balance sheet date.
h. Use of Estimates
The preparation of financial statements in conformity with GAAP requires the Master Fund to make estimates and assumptions that affect the reported amounts of assets and liabilities and disclosure of contingent assets and liabilities at the date of the financial statements and the reported amounts of increases and decreases in Partners' Capital from operations during the reporting period. Actual results could differ from those estimates.
i. Disclosures about Offsetting Assets and Liabilities
In December 2011, Financial Accounting Standards Board ("FASB") issued Accounting Standards Updated ("ASU") No. 2011-11, "Disclosures about Offsetting Assets and Liabilities" ("ASU 2011-11"). ASU 2011-11 requires an entity to disclose information about offsetting and related
FIFTEEN
HATTERAS MASTER FUND, L.P.
(a Delaware Limited Partnership)
NOTES TO FINANCIAL STATEMENTS (Continued)
As of and for the year ended March 31, 2014
2. SIGNIFICANT ACCOUNTING POLICIES (CONCLUDED)
i. Disclosures about Offsetting Assets and Liabilities (concluded)
arrangements to enable users of its financial statements to understand the effect of those arrangements on its financial position. The guidance requires retrospective application for all comparative periods presented. Management has evaluated the impact on the financial statement disclosures and determined that there is no effect.
j. Recent Accounting Pronouncements
In June 2013, FASB issued ASU No. 2013-08, "Financial Services — Investment Companies (Topic 946): Amendments to the Scope, Measurements and Disclosure Requirements" ("ASU 2013-08"). ASU 2013-08 creates a two-tiered approach to assess whether an entity is an investment company. The guidance will also require an investment company to measure noncontrolling ownership interests in other investment companies at fair value and will require additional disclosures relating to investment company status, any changes thereto and information about financial support provided or contractually required to be provided to any of the investment company's investees. The guidance is effective for financial statements with fiscal years beginning on or after December 15, 2013 and interim periods within those fiscal years. Management has evaluated the impact on the financial statement disclosures and determined that there is no effect.
3. ALLOCATION OF PARTNERS' CAPITAL
Net profits or net losses of the Master Fund for each Allocation Period (as defined below) will be allocated among and credited to or debited against the capital accounts of the Limited Partners. Allocation Periods begin on the day after the last day of the preceding Allocation Period and end at the close of business on (1) the last day of each month; (2) the last day of each taxable year; (3) the day preceding each day on which interests are purchased; (4) the day on which interests are repurchased; (5) the day preceding the day on which a substituted Limited Partner is admitted to the Master Fund; or (6) the day on which any amount is credited to or debited from the capital account of any Limited Partner other than an amount to be credited to or debited from the capital accounts of all Limited Partners in accordance with their respective investment percentages.
4. REPURCHASE OF LIMITED PARTNERS' INTERESTS
The Board may, from time to time and in its sole discretion, cause the Master Fund to repurchase interests from Limited Partners pursuant to written tenders by Limited Partners at such times and on such terms and conditions as established by the Board. In determining whether the Master Fund should offer to repurchase interests, the Board will consider, among other things, the recommendation of the Investment Managers. The Investment Managers generally recommend to the Board that the Master Fund offer to repurchase interests from Limited Partners on a quarterly basis as of the valuation date at the end of each calendar quarter. The Master Fund will not offer repurchases of interests of more than 20% of its net asset value in any quarter. The Master Fund does not intend to distribute to the Limited Partners any of the Master Fund's income, but generally expects to reinvest substantially all income and gains allocable to the Limited Partners.
5. MANAGEMENT FEES, PERFORMANCE ALLOCATION, AND RELATED PARTY TRANSACTIONS
Effective March 28, 2013, upon the approval of the Limited Partners, MCCM became the investment co-manager to the Master Fund along with HIP, the existing investment manager to the Master Fund. The Investment Managers are responsible for providing day-to-day investment management services to the Master Fund, subject to the ultimate supervision of and any policies established by the Board, pursuant to the terms of the investment co-management agreement among the Master Fund, HIP and MCCM (the "MCCM Agreement") and the investment co-management agreement between the Master Fund and HIP (the "HIP Agreement"). Under the MCCM Agreement and HIP Agreement (together, the "Investment Management Agreements"), the Investment Managers are responsible for developing, implementing and supervising the Master Fund's investment program. In consideration for the advisory and other services provided by HIP, the Master Fund pays HIP a management fee (the "Management Fee") equal to 1.00% on an annualized basis of the aggregate value of its partners' capital determined as of the last day of the month (before giving effect to any repurchase of interests in the Master Fund). The Master Fund does not pay MCCM an investment management fee directly. Under the MCCM Agreement, MCCM is entitled to distributions from HIP under the Member Agreement (defined below). MCCM is a non-voting member ("Member") of HIP. HIP, MCCM and the General Partner have entered into a membership agreement (the "Member Agreement"), pursuant to which HIP makes distributions to MCCM equal to a percentage of the Management Fee HIP receives from the Master Fund.
The General Partner is allocated a performance allocation payable annually equal to 10% of the amount by which net new profits of the limited partner interests of the Master Fund exceed the non-cumulative "hurdle amount," which is calculated as of the last day of the preceding calendar year of the Master Fund at a rate equal to the yield-to-maturity of the 90-day U.S. Treasury Bill as reported by the Wall Street Journal for the last business day of the last calendar year ("the Performance Allocation"). The Performance Allocation is made on a "peak to peak", or "high watermark" basis, which means that no Performance Allocation will be made with respect to such subsequent appreciation until such net loss has been recovered. Pursuant to the Member Agreement, the General Partner makes distributions to MCCM equal to a percentage of the Performance Allocation the General Partner receives from the Master Fund. For the year ended March 31, 2014, the General Partner accrued a Performance Allocation in the amount of $5,745,793.
SIXTEEN
HATTERAS MASTER FUND, L.P.
(a Delaware Limited Partnership)
NOTES TO FINANCIAL STATEMENTS (Continued)
As of and for the year ended March 31, 2014
5. MANAGEMENT FEES, PERFORMANCE ALLOCATION, AND RELATED PARTY TRANSACTIONS (CONCLUDED)
Hatteras Capital Distributors LLC ("HCD"), an affiliate of HIP, serves as the Master Fund's private placement agent. HCD receives a distribution fee from HIP equal to 0.10% on an annualized basis of the partner's capital of the Master Fund as of the last day of the month (before giving effect to any repurchase of interests in the Master Fund).
Each member of the Board who is not an "interested person" of the Master Fund ("Independent Director"), as defined by the 1940 Act, receives an annual retainer of $30,000. All Board members are reimbursed by the Master Fund for all reasonable out-of-pocket expenses incurred by them in performing their duties.
On October 1, 2013, RCS Capital Corporation (the "Company") and Scotland Acquisition, LLC, a newly formed wholly-owned subsidiary of RCS Advisory Services, LLC, which is an operating subsidiary of the Company, entered into an asset purchase agreement with certain principals of the HIP and the General Partner (collectively the "Sellers") and David Perkins, as the Sellers' representative. The purchase will result in a change in control of HIP and, therefore, constitute an "assignment" within the meaning of the 1940 Act of i) the existing HIP Agreement between HIP and the Master Fund, and ii) the existing MCCM Agreement among HIP, MCCM and the Master Fund. The purchase is expected to close in second quarter of 2014.
6. ACCOUNTING, ADMINISTRATION, AND CUSTODIAL AGREEMENT
In consideration for accounting, administrative, and recordkeeping services, the Master Fund pays UMB Fund Services, Inc. (the "Administrator") an administration fee based on the month-end partners' capital of the Master Fund. The Administrator also provides regulatory administrative services, transfer agency functions, and shareholder services at an additional cost. For the year ended March 31, 2014, the total accounting and administration fees were $863,664.
UMB Bank, N.A. serves as custodian of the Master Fund's assets and provides custodial services for the Master Fund, except for collateral held for the Master Fund's credit facility, as described below in Note 8.
7. INVESTMENT TRANSACTIONS
Total purchases of Adviser Funds and securities for the year ended March 31, 2014 amounted to $211,716,966. Total proceeds from redemptions/sales of Adviser Funds and securities for the year ended March 31, 2014 amounted to $413,549,818. The cost of investments in Adviser Funds for U.S. federal income tax purposes is adjusted for items of taxable income allocated to the Master Fund from the Adviser Funds. The Master Fund relies upon actual and estimated tax information provided by the Adviser Funds as to the amounts of taxable income allocated to the Master Fund as of March 31, 2014.
The Master Fund invests substantially all of its available capital in securities of private investment companies. These investments will generally be restricted securities that are subject to substantial holding periods or are not traded in public markets at all, so that the Master Fund may not be able to resell some of its securities holdings for extended periods.
8. CREDIT FACILITY
The Master Fund maintains a credit facility (the "Facility") with a maximum borrowing amount of $120,000,000 which is secured by certain interests in Adviser Funds. A fee of 75 basis points per annum is payable monthly in arrears on the unused portion of the facility, while the interest rate charged on borrowings is the 3-month London Interbank Offer Rate plus a spread of 190 basis points. Collateral for the new facility is held by U.S. Bank N.A. as custodian. Interest and fees incurred for the year ended March 31, 2014 are disclosed in the accompanying Statement of Operations. At March 31, 2014, the Master Fund had $35,000 payable on the unused portion of the Facility and did not hold an interest payable balance on the borrowings. The average interest rate, the average daily balance, and the maximum balance outstanding for borrowings under the facility for the year ended March 31, 2014 was 2.17%, $416,924, and $15,000,000, respectively.
9. INDEMNIFICATION
In the normal course of business, the Master Fund enters into contracts that provide general indemnifications. The Master Fund's maximum exposure under these agreements is dependent on future claims that may be made against the Master Fund, and therefore cannot be established; however, based on experience, the risk of loss from such claims is considered remote.
10. COMMITMENTS
As of March 31, 2014, the Master Fund had outstanding investment commitments to Adviser Funds totaling approximately $117,853,408. Five Adviser Funds in the Private Investment Strategy have commitments denominated in Euros, two Adviser Funds have commitments denominated in Pound Sterling, and one Adviser Fund has commitments denominated in Japanese Yen. At March 31, 2014, the unfunded commitments for these Adviser Funds totaled €3,487,689 EUR, £2,847,290 GBP and ¥163,576,270 JPY, respectively. At March 31, 2014, the exchange rate used for the conversion was 1.3769 USD/EUR, 1.6662 USD/GBP and 103.23 JPY/USD. The U.S. Dollar equivalent of these commitments is included in the Master Fund's total unfunded commitment amount.
SEVENTEEN
HATTERAS MASTER FUND, L.P.
(a Delaware Limited Partnership)
NOTES TO FINANCIAL STATEMENTS (Concluded)
As of and for the year ended March 31, 2014
An investment in the Master Fund involves significant risks, including leverage risk, interest rate risk, liquidity risk and economic conditions risk, that should be carefully considered prior to investing and should only be considered by persons financially able to maintain their investment and who can afford a loss of a substantial part or all of such investment. The Master Fund generally does not employ leverage. However, certain Adviser Funds may employ leverage, either synthetically or through borrowed funds, which can enhance returns or increase losses on smaller changes in the value of an underlying investment. Adviser Funds that invest in fixed income securities may be subject to interest rate risk, where changes in interest rates affect the value of the underlying fixed income investment. The Master Fund intends to invest substantially all of its available capital in securities of private investment companies. These investments will generally be restricted securities that are subject to substantial holding periods or are not traded in public markets at all, so that the Master Fund may not be able to resell some of its securities holdings for extended periods, which may be several years. Investments in the Adviser Funds may be restricted from early redemptions or subject to fees for early redemptions as part of contractual obligations agreed to by the Investment Managers on behalf of the Master Fund. Adviser Funds may have initial lock-up periods, the ability to suspend redemptions, or employ the use of side pockets, all of which may affect the Master Fund's liquidity in the respective Adviser Fund.
Adviser Funds generally require the Master Fund to provide advanced notice of its intent to redeem the Master Fund's total or partial interest and may delay or deny a redemption request depending on the Adviser Funds' governing agreements. Interests in the Master Fund provide limited liquidity since Limited Partners will not be able to redeem interests on a daily basis because the Master Fund is a closed-end fund. Therefore, investment in the Master Fund is suitable only for investors who can bear the risks associated with the limited liquidity of interests and should be viewed as a long-term investment. No guarantee or representation is made that the investment objective will be met.
12. FINANCIAL HIGHLIGHTS
The financial highlights are intended to help an investor understand the Master Fund's financial performance. The total returns in the table represent the rate that a typical Limited Partner would be expected to have earned or lost on an investment in the Master Fund.
The ratios and total return amounts are calculated based on the Limited Partner group taken as a whole. An individual Limited Partner's results may vary from those shown below due to the timing of capital transactions and performance allocation.
The ratios are calculated by dividing total dollars of net investment income or expenses, as applicable, by the average of total monthly Limited Partners' capital.
Total return amounts are calculated by geometrically linking returns based on the change in value during each accounting period.
| | | For the Years Ended March 31, | |
| | | 2014 | | 2013 | | 2012 | | 2011 | | 2010 | |
Total return before Performance Allocation | | | 11.28 | % | | | 5.05 | % | | | (2.51 | )% | | | 6.91 | % | | | 16.24 | % | |
Total return after Performance Allocation | | | 10.77 | % | | | 4.98 | % | | | (2.49 | )% | | | 6.89 | % | | | 16.24 | % | |
Partners' capital, end of year (000's) | | $ | 1,047,265 | | | $ | 1,180,551 | | | $ | 1,440,698 | | | $ | 1,528,134 | | | $ | 1,411,169 | | |
Portfolio turnover | | | 19.03 | % | | | 25.15 | % | | | 32.68 | % | | | 25.12 | % | | | 23.12 | % | |
Ratio of net investment income (loss), excluding
Performance Allocation | | | 2.19 | % | | | 0.87 | % | | | 0.76 | % | | | 0.43 | % | | | (0.84 | )% | |
Ratio of other operating expenses to average
partners' capital | | | 1.23 | % | | | 1.19 | % | | | 1.20 | % | | | 1.17 | % | | | 1.23 | % | |
Ratio of credit facility fees and interest
expense to average partners' capital | | | 0.09 | % | | | 0.08 | % | | | 0.08 | % | | | 0.10 | % | | | 0.06 | % | |
Operating expenses, excluding Performance Allocation | | | 1.32 | % | | | 1.27 | % | | | 1.28 | % | | | 1.27 | % | | | 1.29 | % | |
Performance Allocation | | | 0.51 | % | | | 0.07 | % | | | (0.02 | )%1 | | | 0.02 | % | | | 0.00 | % | |
Total operating expenses and Performance Allocation | | | 1.83 | % | | | 1.34 | % | | | 1.26 | % | | | 1.29 | % | | | 1.29 | % | |
1 Reverse accrued Performance Allocation from January 1, 2011 to March 31, 2011.
13. SUBSEQUENT EVENTS
Management has evaluated the events and transactions through the date the financial statements were issued and determined there were no other subsequent events that required adjustment to our disclosure in the financial statements except for the following: effective April 1, 2014 and May 1, 2014, there were additional capital contributions of $315,000 and $380,000, respectively.
HIP recommended to the Board that a tender offer in an amount of up to approximately 5.00% of the partners' capital of the Master Fund be made for the quarter ending March 31, 2014 to those partners who elect to tender their interests prior to the expiration of the tender offer period. The Board approved such recommendation and partners in the Master Fund were notified of the tender offer's expiration date of June 30, 2014, and submitted tender requests totaling approximately $54,881,309.
*************
EIGHTEEN
HATTERAS MASTER FUND, L.P.
(a Delaware Limited Partnership)
BOARD OF DIRECTORS
(Unaudited)
The identity of the Board members (each a "Director") and brief biographical information, as of March 31, 2014, is set forth below. The business address of each Director is care of Hatteras Funds, 8540 Colonnade Center Drive, Suite 401, Raleigh, NC 27615. The term of office of each Director is from the time of such Director's election and qualification until his or her successor shall have been elected and shall have qualified, or until he or she is removed, resigns or is subject to various disabling events such as death or incapacity. A Director may resign upon 90 days' prior written notice to the Board and may be removed either by a vote of a majority of the Board not subject to the removal vote or of Limited Partners holding not less than two-thirds of the total number of votes eligible to be cast by all of the Limited Partners.
Name &
Date of Birth | | Position(s) Held
with the Master
Fund | | Length of
Time Served | | Principal Occupation(s)
During Past 5 years
and Other
Directorships
Held by Director | | Number of
Portfolios in Fund
Complex1 Overseen
by Director | |
INTERESTED DIRECTOR | |
David B. Perkins2
July 18, 1962 | | President and Chairman of the Board of Directors | | Since Inception | | Mr. Perkins has been Chairman of the Board of Directors and President of the Master Fund since inception. Mr. Perkins is the Chief Executive Officer of Hatteras and its affiliated entities. He founded the firm in September 2003. Prior to that, he was the co-founder and Managing Partner of CapFinancial Partners, LLC. | | | 20 | | |
INDEPENDENT DIRECTORS | |
H. Alexander Holmes
May 4, 1942 | | Director; Audit Committee Member | | Since Inception | | Mr. Holmes founded Holmes Advisory Services, LLC, a financial consultation firm, in 1993. | | | 20 | | |
Steve E. Moss, CPA
February 18, 1953 | | Director; Audit Committee Member | | Since Inception | | Mr. Moss is a principal of Holden, Moss, Knott, Clark & Copley, P.A. and has been a member manager of HMKCT Properties, LLC since January 1996. | | | 20 | | |
Gregory S. Sellers
May 5, 1959 | | Director; Audit Committee Member | | Since Inception | | Mr. Sellers has been the Chief Financial Officer of Imagemark Business Services, Inc., a strategic communications provider of marketing and print communications solutions, since June 2009. From 2003 to June 2009, Mr. Sellers was the Chief Financial Officer and a director of Kings Plush, Inc., a fabric manufacturer. | | | 20 | | |
1 The "Fund Complex" consists of the Master Fund, Hatteras Core Alternatives Fund, L.P., Hatteras Core Alternatives TEI Fund, L.P., Hatteras Core Alternatives Institutional Fund, L.P., Hatteras Core Alternatives TEI Institutional Fund, L.P., Hatteras Global Private Equity Partners Institutional, LLC, Hatteras VC Co-Investment Fund II, LLC, Hatteras GPEP Fund II, LLC, Hatteras Alternative Mutual Funds Trust (consisting of five funds), Underlying Funds Trust (consisting of five funds), and HCIM Trust (consisting of two funds).
2 Mr. Perkins is deemed to be an "interested" Director of the Master Fund because of his affiliations with HIP.
NINETEEN
HATTERAS MASTER FUND, L.P.
(a Delaware Limited Partnership)
BOARD OF DIRECTORS (Concluded)
(Unaudited)
Name &
Date of Birth | | Position(s) Held
with the Master
Fund | | Length of
Time Served | | Principal Occupation(s)
During Past 5 years
and Other
Directorships
Held by Director | | Number of
Portfolios in Fund
Complex1 Overseen
by Director | |
Joseph E. Breslin
November 18, 1953 | | Director | | Since 2013 | | Mr. Breslin is currently a private investor. Mr. Breslin has been a Director of Kinetics Mutual Funds, Inc. (mutual fund) from 2000 to Present (8 portfolios); Trustee, Kinetics Portfolios Trust (mutual fund) from 2000 to Present (8 portfolios). From 2007 to 2009, Mr. Breslin was the Chief Operating Officer of Central Park Credit Holdings, Inc. and prior to that, was the Chief Operating Officer of Aladdin Capital Management LLC, beginning in 2005. | | | 20 | | |
Thomas Mann
February 1, 1950 | | Director | | Since 2013 | | Mr. Mann is currently a private investor. From 2003 until 2012, Mr. Mann was the Managing Director and Group Head Financial Institutions Group, Société Générale, Sales of Capital Market Solutions and Products. Mr. Mann is also a Director of Virtus Global Multi-Sector Income Fund since 2011, Virtus Total Return Fund since 2012, and F-Squared Investments, Inc since January 2012. | | | 20 | | |
1 The "Fund Complex" consists of the Master Fund, Hatteras Core Alternatives Fund, L.P., Hatteras Core Alternatives TEI Fund, L.P., Hatteras Core Alternatives Institutional Fund, L.P., Hatteras Core Alternatives TEI Institutional Fund, L.P., Hatteras Global Private Equity Partners Institutional, LLC, Hatteras VC Co-Investment Fund II, LLC, Hatteras GPEP Fund II, LLC, Hatteras Alternative Mutual Funds Trust (consisting of five funds), Underlying Funds Trust (consisting of five funds), and HCIM Trust (consisting of two funds).
TWENTY
HATTERAS MASTER FUND, L.P.
(a Delaware Limited Partnership)
FUND MANAGEMENT
(Unaudited)
Set forth below is the name, date of birth, position with the Master Fund, length of term of office, and the principal occupation for the last five years, as of March 31, 2014, of each of the persons currently serving as Executive Officers of the Master Fund. The business address of each officer is care of Hatteras Funds, 8540 Colonnade Center Drive, Suite 401, Raleigh, NC 27615.
Name &
Date of Birth | | Position(s) Held
with the Master
Fund | | Length of
Time Served | | Principal Occupation(s)
During Past 5 Years
and Other
Directorships
Held by Officer | | Number of
Portfolios in Fund
Complex1 Overseen
by Officer | |
OFFICERS | |
J. Michael Fields
July 14, 1973 | | Secretary of each Fund in the Fund Complex | | Since 2008 | | Prior to becoming Secretary of each of the Funds in the Fund Complex, Mr. Fields was Treasurer of each of the Funds in the Fund Complex. Mr. Fields is Chief Operating Officer of HIP and its affiliates and has been employed by the Hatteras firm since its inception in September 2003. | | | N/A | | |
Andrew P. Chica
September 7, 1975 | | Chief Compliance Officer of each Fund in the Fund Complex | | Since 2008 | | Mr. Chica joined Hatteras in November 2007 and became Chief Compliance Officer of each of the Funds in the Fund Complex and HIP as of January 2008. | | | N/A | | |
Robert Lance Baker
September 17, 1971 | | Treasurer of each Fund in the Fund Complex | | Since 2008 | | Mr. Baker joined Hatteras in March 2008 and became Treasurer of each of the Funds in the Fund Complex in December 2008. Mr. Baker serves as the Chief Financial Officer of HIP and its affiliates. | | | N/A | | |
1 The "Fund Complex" consists of the Master Fund, Hatteras Core Alternatives Fund, L.P., Hatteras Core Alternatives TEI Fund, L.P., Hatteras Core Alternatives Institutional Fund, L.P., Hatteras Core Alternatives TEI Institutional Fund, L.P., Hatteras Global Private Equity Partners Institutional, LLC, Hatteras VC Co-Investment Fund II, LLC, Hatteras GPEP Fund II, LLC, Hatteras Alternative Mutual Funds Trust (consisting of five funds), Underlying Funds Trust (consisting of five funds), and HCIM Trust (consisting of two funds).
TWENTY-ONE
HATTERAS MASTER FUND, L.P.
(a Delaware Limited Partnership)
OTHER INFORMATION
(Unaudited)
PROXY VOTING
A description of the policies and procedures that the Master Fund uses to determine how to vote proxies relating to portfolio securities and the Master Fund's record of actual proxy votes cast during the period ended June 30, 2013 is available at www.sec.gov and by calling 1-800-504-9070 and may be obtained at no additional charge.
AVAILABILITY OF QUARTERLY PORTFOLIO SCHEDULES
The Master Fund files its complete schedule of portfolio holdings with the SEC for the first and third quarters of each fiscal year on Form N-Q. The Master Fund's Form N-Q is available, without charge and upon request, on the SEC's website at http://www.sec.gov or may be reviewed and copied at the SEC's Public Reference Room in Washington, DC. Information on the Public Reference Room may be obtained by calling 1-800-SEC-0330.
TWENTY-TWO
[THIS PAGE INTENTIONALLY LEFT BLANK]
[THIS PAGE INTENTIONALLY LEFT BLANK]
HATTERAS CORE ALTERNATIVES FUNDS
8540 Colonnade Center Drive
Suite 401
Raleigh, NC 27615
INVESTMENT MANAGER AND FUND SERVICING AGENT
Hatteras Investment Partners, LLC
8540 Colonnade Center Drive
Suite 401
Raleigh, NC 27615
INVESTMENT MANAGER
Morgan Creek Capital Management, LLC
301 West Barbee Chapel Road
Suite 200
Chapel Hill, NC 27517
INDEPENDENT REGISTERED PUBLIC ACCOUNTING FIRM
Deloitte & Touche LLP
1700 Market Street, 24th Floor
Philadelphia, PA 19103
FUND COUNSEL
Drinker Biddle & Reath LLP
One Logan Square
Suite 2000
Philadelphia, PA 19103
ADMINISTRATOR AND FUND ACCOUNTANT
UMB Fund Services
223 Wilmington West Chester Pike, Suite 303
Chadds Ford, PA 19317
CUSTODIANS
UMB Bank, N.A.
1010 Grand Boulevard
Kansas City, MO 64106
U.S. Bank, N.A.
1555 North River Center Drive
Milwaukee, WI 53212
DISTRIBUTOR
Hatteras Capital Distributors, LLC
8540 Colonnade Center Drive
Suite 401
Raleigh, NC 27615

HATTERASFUNDS.COM / T: 919.846.2324 / F: 919.846.3433
8540 COLONNADE CENTER DRIVE / SUITE 401 / RALEIGH, NC 27615-3052
ITEM 2. CODE OF ETHICS.
(a) The registrant, as of the end of the period covered by this report, has adopted a code of ethics that applies to the registrant’s principal executive officer, principal financial officer, principal accounting officer or controller, or persons performing similar functions, regardless of whether these individuals are employed by the registrant or a third party.
(c) There have been no amendments, during the period covered by this report, to a provision of the code of ethics that applies to the registrant’s principal executive officer, principal financial officer, principal accounting officer or controller, or persons performing similar functions, regardless of whether these individuals are employed by the registrant or a third party, and that relates to any element of the code of ethics definition enumerated in paragraph (b) of this Item.
(d) The registrant has not granted any waivers, during the period covered by this report, including an implicit waiver, from a provision of the code of ethics that applies to the registrant’s principal executive officer, principal financial officer, principal accounting officer or controller, or persons performing similar functions, regardless of whether these individuals are employed by the registrant or a third party, that relates to one or more of the items set forth in paragraph (b) of this Item.
ITEM 3. AUDIT COMMITTEE FINANCIAL EXPERT.
As of the end of the period covered by the report, the registrant’s board of directors has determined that Messrs. Steve E. Moss, H. Alexander Holmes and Gregory S. Sellers are each qualified to serve as audit committee financial experts serving on its audit committee and that each is “independent,” as defined by Item 3 of Form N-CSR.
ITEM 4. PRINCIPAL ACCOUNTANT FEES AND SERVICES.
Audit Fees
(a) The aggregate fees billed for each of the last two fiscal years for professional services rendered by the principal accountant for the audit of the registrant’s annual financial statements or services that are normally provided by the accountant in connection with statutory and regulatory filings or engagements for those fiscal years are $140,000 for 2013 and $140,000 for 2014.
Audit-Related Fees
(b) The aggregate fees billed in each of the last two fiscal years for assurance and related services by the principal accountant that are reasonably related to the performance of the audit of the registrant’s financial statements and are not reported under paragraph (a) of this Item are $0 for 2013 and $0 for 2014.
Tax Fees
(c) The aggregate fees billed in each of the last two fiscal years for professional services rendered by the principal accountant for tax compliance, tax advice, and tax planning are $0 for 2013 and $0 for 2014.
All Other Fees
(d) The aggregate fees billed in each of the last two fiscal years for products and services provided by the principal accountant, other than the services reported in paragraphs (a) through (c) of this Item are $0 for 2013 and $0 for 2014.
(e)(1) Disclose the audit committee’s pre-approval policies and procedures described in paragraph (c)(7) of Rule 2-01 of Regulation S-X.
The Registrant’s Audit Committee must pre-approve the audit and non-audit services of the Auditors prior to the Auditor’s engagement.
(e)(2) The percentage of services described in each of paragraphs (b) through (d) of this Item that were approved by the audit committee pursuant to paragraph (c)(7)(i)(C) of Rule 2-01 of Regulation S-X are as follows:
(b) 0%
(c) 0%
(d) 0%
(f) The percentage of hours expended on the principal accountant’s engagement to audit the registrant’s financial statements for the most recent fiscal year that were attributed to work performed by persons other than the principal accountant’s full-time, permanent employees was less than fifty percent.
(g) The aggregate non-audit fees billed by the registrant’s accountant for services rendered to the registrant, and rendered to the registrant’s investment adviser (not including any sub-adviser whose role is primarily portfolio management and is subcontracted with or overseen by another investment adviser), and any entity controlling, controlled by, or under common control with the adviser that provides ongoing services to the registrant for each of the last two fiscal years of the registrant was $0.
(h) The registrant’s audit committee of the board of directors has considered whether the provision of non-audit services that were rendered to the registrant’s investment adviser (not including any sub-adviser whose role is primarily portfolio management and is subcontracted with or overseen by another investment adviser), and any entity controlling, controlled by, or under common control with the investment adviser that provides ongoing services to the registrant that were not pre-approved pursuant to paragraph (c)(7)(ii) of Rule 2-01 of Regulation S-X is compatible with maintaining the principal accountant’s independence.
ITEM 5. AUDIT COMMITTEE OF LISTED REGISTRANTS.
Not applicable.
ITEM 6. SCHEDULE OF INVESTMENTS.
Schedule of Investments in securities of unaffiliated issuers as of the close of the reporting period is included as part of the report to shareholders filed under Item 1 of this Form.
ITEM 7. DISCLOSURE OF PROXY VOTING POLICIES AND PROCEDURES FOR CLOSED-END MANAGEMENT INVESTMENT COMPANIES.
The Proxy Voting Policies are attached herewith.
HATTERAS INVESTMENT PARTNERS LLC
(“HIP”)
MORGAN CREEK CAPITAL MANAGEMENT, LLC
(“MCCM”, together with HIP, the “Investment Managers”)HATTERAS MASTER FUND, L.P.
(the “Master Fund”)
HATTERAS CORE ALTERNATIVES FUND, L.P.
HATTERAS CORE ALTERNATIVES TEI FUND, L.P.
HATTERAS CORE ALTERNATIVES INSTITUTIONAL FUND, L.P.
HATTERAS CORE ALTERNATIVES TEI INSTITUTIONAL FUND, L.P.
(collectively, the “Feeder Funds”, together with the Master Fund, the “Funds”)
PROXY VOTING POLICY
This statement sets forth the policy of the Investment Managers with respect to the exercise of corporate actions and proxy voting authority.
The Master Fund invests substantially all of its assets in adviser accounts and securities of private investment funds (“Adviser Funds”), which include, but are not limited to, private partnerships, limited liability companies or similar entities managed by advisers (commonly referred to as “hedge funds,” “private equity funds” or “private funds”). Investments in Adviser Funds do not typically convey traditional voting rights to the holder and the occurrence of corporate governance or other notices for this type of investment is substantially less than that encountered in connection with registered equity securities. On occasion, however, the Investment Managers and/or the Master Fund may receive notices from such Adviser Funds seeking the consent of holders in order to materially change certain rights within the structure of the security itself or change material terms of the Adviser Funds’ limited partnership agreement, limited liability company operating agreement or similar agreement with investors. To the extent that the Master Fund receives notices or proxies from Adviser Funds (or receives proxy statements or similar notices in connection with any other portfolio securities), the Master Fund has delegated proxy voting responsibilities with respect to the Master Fund’s portfolio securities to the Investment Managers, subject to the board of directors’ general oversight and with the direction that proxies should be voted consistent with the Master Fund’s best economic interests. In general, the Investment Managers believe that voting proxies in accordance with the policies described below will be in the best interests of the Funds. If an analyst, trader or partner of the Investment Managers believes that voting in accordance with stated proxy-voting guidelines would not be in the best interests of the Funds, the proxy will be referred to the Investment Managers’ Chief Compliance Officers for a determination of how such proxy should be voted.
The Investment Managers will generally vote to support management recommendations relating to routine matters such as the election of directors (where no corporate governance issues are implicated), the selection of independent auditors, an increase in or reclassification of common stock, the addition or amendment of indemnification provisions in the company’s charter or by-laws, changes in the board of directors and compensation of outside directors. The Investment Managers will generally vote in favor of management or shareholder proposals that the Investment Managers believe will maintain or strengthen the shared interests of shareholders and management, increase shareholder value, maintain or increase shareholder influence over the company’s board of directors and management and maintain or increase the rights of shareholders.
On non-routine matters, the Investment Managers will generally vote in favor of management proposals for mergers or reorganizations, reincorporation plans, fair-price proposals and shareholder rights plans so long as such proposals are in the best economic interests of the Master Fund.
If a proxy includes a matter to which none of the specific policies described above or in the Investment Managers’ stated proxy-voting guidelines is applicable or a matter involving an actual or potential conflict of interest as described below, the proxy will be referred to the Investment Managers’ Chief Compliance Officers for a determination of how such proxy should be voted.
In exercising its voting discretion, the Investment Managers and their employees will seek to avoid any direct or indirect conflict of interest presented by the voting decision. If any substantive aspect or foreseeable result of the matter to be voted on presents an actual or potential conflict of interest involving the Investment Managers (or an affiliate of the Investment Managers), any issuer of a security for which the Investment Managers (or an affiliate of the Investment Managers) acts as sponsor, advisor, manager, custodian, distributor, underwriter, broker or other similar capacity or any person with whom the Investment Managers (or an affiliate of the Investment Managers) has an existing material contract or business relationship not entered into in the ordinary course of business (the Investment Managers and such other persons having an interest in the matter being called “Interested Persons”), the Investment Managers will make written disclosure of the conflict to the independent directors of the Master Fund indicating how the Investment Managers propose to vote on the matter and the reasons for doing so. If the Investment Managers do not receive timely written instructions as to voting or non-voting on the matter from the Master Fund’s Independent Directors, the Investment Managers may take any of the following actions which they deem to be in the best interests of the Feeder Fund: (i) engage an independent third party to determine whether and how the proxy should be voted and vote or refrain from voting on the matter as determined by the third party; (ii) vote on the matter in the manner proposed to the Independent Directors if the vote is against the interests of all Interested Persons; or (iii) refrain from voting on the matter.
The voting rights of members of the Master Fund will be substantially similar to those of the limited partners (the “Partners”) of the Feeder Funds. Whenever a Feeder Fund, as a member of the Master Fund, is requested to vote on matters pertaining to the Master Fund, the Feeder Fund will seek voting instructions from its Partners and will vote its Master Fund interest for or against such matters proportionately to the instructions to vote for or against such matters received from its Partners. In the event that a Feeder Fund does not receive voting instructions from its Partners, the portion of that Fund’s Master Fund interest allocable to such Partners will be voted in the same proportions as the portion with respect to which it has received voting instructions.
The Funds are required to file Form N-PX, with their complete proxy voting record for the twelve months ended June 30, no later than August 31 of each year. Each of the Funds’ Form N-PX filings are available: (i) without charge, upon request, by calling 1-800-390-1560, or (ii) by visiting the SEC’s website at www.sec.gov.
ITEM 8. PORTFOLIO MANAGERS OF CLOSED-END MANAGEMENT INVESTMENT COMPANIES.
(a)(1) Identification of Portfolio Manager(s) or Management Team Members and Description of Role of Portfolio Manager(s) or Management Team Members
The following table provides biographical information about the members of the Investment Committee of HIP and MCCM, (the “Investment Committee), who are primarily responsible for the day-to-day portfolio management of the Master Fund as of June 9, 2014:
Name of Investment
Committee Member | | Title | | Length of
Time of
Service to
the Funds | | Business Experience During the Past 5 Years | | Role of
Investment
Committee
Member |
| | | | | | | | |
Mark W. Yusko | | Chief Investment Officer of the Funds | | Since inception | | Mr. Yusko has been Chief Investment Officer of the Funds since inception and President and Chief Executive Officer of MCCM since July, 2004. Previously, Mr. Yusko served as President and | | Asset allocation; underlying manager selection; and |
| | | | | | Chief Executive Officer for UNC Management Co., LLC from January 1998 through July 2004, where he was responsible for all areas of investment management for the UNC Endowment and Affiliated Foundation Funds. | | portfolio construction. |
| | | | | | | | |
David B. Perkins | | Chief Executive Officer of HIP and President of the Funds | | Since inception | | Mr. Perkins is the Chief Executive Officer of Hatteras and founded Hatteras and its affiliated entities. He founded the firm in September 2003. Prior to that, he was the co-founder and Managing Partner of CapFinancial Partners, LLC. | | Strategic recommendations and portfolio oversight. |
| | | | | | | | |
Joshua E. Parrott | | Director of Portfolio Management of HIP | | Since inception | | Mr. Parrott joined HIP in March 2004 and is currently Director of Portfolio Management. Previously, Mr. Parrott was employed as an Analyst by Dialectic Capital Management in 2003 and as a Financial Advisor at Morgan Stanley from February 1999 to March 2003. | | Portfolio management and portfolio construction. |
| | | | | | | | |
Mike Hennessy | | Managing Director of MCCM | | Since March 28, 2013 | | Mr. Hennessy joined the Master Fund’s portfolio management team in March 2013. Mr. Hennessy is a Co-founder of MCCM and serves as the Director of Investments. | | Portfolio management |
| | | | | | | | |
Josh Tilley | | Principal of MCCM | | Since March 28, 2013 | | Mr. Tilley joined the Master Fund’s portfolio management team in March 2013. Mr. Tilley is a Principal of Investments at MCCM and one of the founding members of MCCM’s investment team. | | Portfolio management |
(a)(2) Other Accounts Managed by Portfolio Manager(s) or Management Team Member and Potential Conflicts of Interest
The following table provides information about portfolios and accounts, other than the Master Fund and the Feeder Funds, for which the members of the Investment Committee are primarily responsible for the day-to-day portfolio management as of March 31, 2014:
Name of
Investment
Committee
Member | | Type of
Accounts | | Total
Number
of
Accounts
Managed | | Total Assets | | Number of
Accounts
Managed for
Which
Advisory
Fee is Based
on
Performance | | Total Assets for Which
Advisory Fee is Based on
Performance | |
| | | | | | | | | | | |
Mark W. Yusko | | Registered Investment Companies | | 2 | | $ | 64,000,000 | | 0 | | $ | 0 | |
| | Other Pooled Investment Vehicles * | | 33 | | $ | 2,100,000,000 | | 28 | | $ | 1,500,000,000 | |
| | Other Accounts | | 14 | | $ | 1,400,000,000 | | 9 | | $ | 500,000,000 | |
| | | | | | | | | | | |
David B. Perkins | | Registered Investment Companies | | 3 | | $ | 38,000,000 | | 2 | | $ | 28,000,000 | |
| | Other Pooled Investment Vehicles * | | 2 | | $ | 17,200,000 | | 1 | | $ | 4,000,000 | |
| | Other Accounts | | 0 | | $ | 0 | | 0 | | $ | 0 | |
| | | | | | | | | | | |
Joshua E. Parrott | | Registered Investment Companies | | 1 | | $ | 25,800,000 | | 0 | | $ | 0 | |
| | Other Pooled Investment Vehicles * | | 0 | | $ | 0 | | 0 | | $ | 0 | |
| | Other Accounts | | 0 | | $ | 0 | | 0 | | $ | 0 | |
| | | | | | | | | | | |
Mike Hennessy | | Registered Investment Companies | | 0 | | $ | 0 | | 0 | | $ | 0 | |
| | Other Pooled Investment Vehicles * | | 0 | | $ | 0 | | 0 | | $ | 0 | |
| | Other Accounts | | 0 | | $ | 0 | | 0 | | $ | 0 | |
| | | | | | | | | | | |
Josh Tilley | | Registered Investment Companies | | 0 | | $ | 0 | | 0 | | $ | 0 | |
| | Other Pooled Investment Vehicles * | | 0 | | $ | 0 | | 0 | | $ | 0 | |
| | Other Accounts | | 0 | | $ | 0 | | 0 | | $ | 0 | |
* The assets in the “Other Pooled Investment Vehicles” section for the designated investment committee member(s) includes committed capital amounts for certain assets.
Potential Conflicts of Interests
Messrs. Yusko, Perkins, Parrott, Hennessy and Tilley are responsible for managing other accounts, including proprietary accounts, separate accounts and other pooled investment vehicles, including unregistered hedge funds and funds of hedge funds. They may manage separate accounts and other pooled investment vehicles which may have materially higher, lower or different fee arrangements than the registrant and may also be subject to performance-based fees. The side-by-side management of these separate accounts and/or pooled investment vehicles may raise potential conflicts of interest relating to cross trading and the allocation of investment opportunities. The Investment Managers has a fiduciary responsibility to manage all client accounts in a fair and equitable manner. It seeks to provide best execution of all securities transactions and to allocate investments to client accounts in a fair and timely manner. To this end, the Investment Managers has developed policies and procedures designed to mitigate and manage the potential conflicts of interest that may arise from side-by-side management.
(a)(3) Compensation Structure of Portfolio Manager(s) or Management Team Members
The compensation of the members of the Investment Committee may include a combination of the following: (i) fixed annual salary; (ii) a variable portion of the Management Fee paid by the Master Fund to HIP; and (iii) a variable portion of any Performance Allocation allocated to the General Partner of the Master Fund. The Performance Allocation is equal to 10% of the excess of the new net profits of the partner interests in the Master Fund (calculated
and accrued monthly and payable annually and calculated separately for each fund that serves as a feeder fund to the Master Fund) over the yield-to-maturity of the 90 day U.S. Treasury Bill as reported by the Wall Street Journal for the last business day of the preceding calendar year.
(a)(4) Disclosure of Securities Ownership
The following table sets forth the dollar range of equity securities beneficially owned by each member of the Investment Committee in the Fund as of March 31, 2014:
Investment Committee
Member | | Dollar Range of Fund Shares
Beneficially Owned |
| | |
Mark W. Yusko | | $500,001 to $1,000,000 |
David B. Perkins | | $500,001 to $1,000,000 |
Joshua E. Parrott | | $10,001 to $50,000 |
Mike Hennessy | | None |
Josh Tilley | | None |
(b) Not applicable.
ITEM 9. PURCHASES OF EQUITY SECURITIES BY CLOSED-END MANAGEMENT INVESTMENT COMPANY AND AFFILIATED PURCHASERS.
Not applicable.
ITEM 10. SUBMISSION OF MATTERS TO A VOTE OF SECURITY HOLDERS.
There have been no material changes to the procedures by which the shareholders may recommend nominees to the registrant’s board of directors, where those changes were implemented after the registrant last provided disclosure in response to the requirements of Item 407(c)(2)(iv) of Regulation S-K (17 CFR 229.407) (as required by Item 22(b)(15) of Schedule 14A (17 CFR 240.14a-101)), or this Item.
ITEM 11. CONTROLS AND PROCEDURES.
(a) The registrant’s principal executive and principal financial officers, or persons performing similar functions, have concluded that the registrant’s disclosure controls and procedures (as defined in Rule 30a-3(c) under the Investment Company Act of 1940, as amended (the “1940 Act”) (17 CFR 270.30a-3(c))) are effective, as of a date within 90 days of the filing date of the report that includes the disclosure required by this paragraph, based on their evaluation of these controls and procedures required by Rule 30a-3(b) under the 1940 Act (17 CFR 270.30a-3(b)) and Rules 13a-15(b) or 15d-15(b) under the Securities Exchange Act of 1934, as amended (17 CFR 240.13a-15(b) or 240.15d-15(b)).
(b) There were no changes in the registrant’s internal control over financial reporting (as defined in Rule 30a-3(d) under the 1940 Act (17 CFR 270.30a-3(d)) that occurred during the registrant’s second fiscal quarter of the period covered by this report that has materially affected, or is reasonably likely to materially affect, the registrant’s internal control over financial reporting.
ITEM 12. EXHIBITS.
(a)(1) Code of ethics, or any amendment thereto, that is the subject of disclosure required by Item 2 is attached hereto.
(a)(2) Certifications pursuant to Rule 30a-2(a) under the 1940 Act and Section 302 of the Sarbanes-Oxley Act of 2002 are attached hereto.
(a)(3) Not applicable.
(b) Not applicable.
SIGNATURES
Pursuant to the requirements of the Securities Exchange Act of 1934 and the Investment Company Act of 1940, the registrant has duly caused this report to be signed on its behalf by the undersigned, thereunto duly authorized.
(registrant) | | Hatteras Master Fund, L.P. | |
| | |
By (Signature and Title)* | /s/ David B. Perkins | |
| David B. Perkins, President | |
| (principal executive officer) | |
| | |
Date | | June 9, 2014 | |
| | | | |
Pursuant to the requirements of the Securities Exchange Act of 1934 and the Investment Company Act of 1940, this report has been signed below by the following persons on behalf of the registrant and in the capacities and on the dates indicated.
By (Signature and Title)* | /s/ David B. Perkins | |
| David B. Perkins, President | |
| (principal executive officer) | |
| | |
Date | | June 9, 2014 | |
| | |
By (Signature and Title)* | /s/ R. Lance Baker | |
| R. Lance Baker, Treasurer | |
| (principal financial officer) | |
| | |
Date | | June 9, 2014 | |
* Print the name and title of each signing officer under his or her signature.