UNITED STATES
SECURITIES AND EXCHANGE COMMISSION
Washington, D.C. 20549
FORM N-CSR
CERTIFIED SHAREHOLDER REPORT OF REGISTERED
MANAGEMENT INVESTMENT COMPANIES
Investment Company Act file number 811-21666
Hatteras Master Fund, L.P.
(Exact name of registrant as specified in charter)
8540 Colonnade Center Drive, Suite 401
Raleigh, North Carolina 27615
(Address of principal executive offices) (Zip code)
David B. Perkins
8540 Colonnade Center Drive, Suite 401
Raleigh, North Carolina 27615
(Name and address of agent for service)
Registrant’s telephone number, including area code: (919) 846-2324
Date of fiscal year end: March 31
Date of reporting period: March 31, 2013
Form N-CSR is to be used by management investment companies to file reports with the Commission not later than 10 days after the transmission to stockholders of any report that is required to be transmitted to stockholders under Rule 30e-1 under the Investment Company Act of 1940 (17 CFR 270.30e-1). The Commission may use the information provided on Form N-CSR in its regulatory, disclosure review, inspection, and policymaking roles.
A registrant is required to disclose the information specified by Form N-CSR, and the Commission will make this information public. A registrant is not required to respond to the collection of information contained in Form N-CSR unless the Form displays a currently valid Office of Management and Budget (“OMB”) control number. Please direct comments concerning the accuracy of the information collection burden estimate and any suggestions for reducing the burden to Secretary, Securities and Exchange Commission, 450 Fifth Street, NW, Washington, DC 20549-0609. The OMB has reviewed this collection of information under the clearance requirements of 44 U.S.C. § 3507.
ITEM 1. REPORTS TO STOCKHOLDERS.
The Report to Shareholders is attached herewith.

LETTERFROMTHE PRESIDENT
Robert L. Worthington, CFA
On behalf of Hatteras Funds, I would like to thank our investors for the confidence you place in us to help manage your investment dollars. We take our fiduciary responsibilities seriously and will continue to put forth our greatest efforts to meet the investment objectives outlined to you and your financial advisors.
This past fiscal year was one characterized by lower volatility and a lack of a true equity market correction like 2010 and 2011, together with a fairly unabated rise in the markets that started in the fourth quarter of 2012. The markets were heavily influenced in the first six months by political headlines from tightly contested pre-election polls, the reelection of President Obama and congressional negotiations over the self-created and looming “fiscal cliff.” Afterwards an improving US economy, together with the positive impact of European Central Bank President Draghi stating to do whatever is necessary to save the Euro contributed to the strong rise in equity and fixed income markets during the latter part of 2012 and first part of 2013. All this while many market indicators signaled a slow growth economy domestically, and a stagnant economy in Europe and much of the developed world. Regardless of these signals, international equities posted strong returns with the ECB’s support lessening European debt crisis worries, China’s GDP growth exceeding expectations and more quantitative easing in Japan. Fixed income markets produced positive returns as strong investor demand pushed corporate yields to near record lows.
The hedge fund industry produced modest returns during the year as many managers positioned portfolios conservatively due to global macro issues.
In the latter part of the year as global macro worries subsided a little, there was a pickup in corporate activity, including mergers and acquisitions, which helped Event Driven strategies produce some of the best returns among hedge fund strategies. Credit strategies and specifically corporate credit strategies were some of the best performers this past year as corporate spreads tightened throughout much of the year due to investors searching for higher yield. However, as a whole, hedged strategies continued to lag the returns of an exuberant S&P 500, which posted significant gains yet again. For alternative strategies, the silver lining of the strong rally in the markets we believe will be the exit opportunities for private equity investments. As companies, flush with cash, look to grow their revenues, purchasing established lines of business could be an easy answer, and therefore provide ample exit opportunity for private equity funds.
Even in these challenging times, ensuring that our portfolio and risk management efforts exceed your expectations is a commitment that never wavers. We appreciate the confidence you have placed in Hatteras and your investment in the Hatteras Core Alternatives Fund. In closing, we feel positive about the future of our organization and we will continue to strive to deliver the risk- adjusted returns outlined in our investment objectives. We thank you for your continued confidence and support.

Robert L. Worthington, CFA
President

MANAGERS DISCUSSIONOF FUND PERFORMANCE
Mark W. Yusko
The Hatteras Core Alternatives Institutional Fund, L.P. (the “Fund”) finished the fiscal year up 4.87%, outperforming its benchmark, the HFRX Global Hedge Fund Index, which finished with a 3.50% return over the same period. The outperformance over the benchmark was driven largely from the Fund’s private investment strategy which was up 11.50% for the year. We continue to believe that our single greatest opportunity today is our maturing Private Investment strategy finding exits in today’s capital markets where valuations have greatly increased and stifling amounts of cash are waiting to be deployed. We believe that in this low GDP growth environment companies will look to take away market share from competitors pushing cash rich companies into the private markets to grow their business through acquisitions and build for the future.
In the broader markets, concerns around Europe manifested during the year but significant injections
of liquidity from the central banks managed to keep equity market valuations elevated despite problems with Greece, Spain, Italy and most recently, Cypress during the year. Domestically, while the year passed without any fiscal cliff related economic blow-up, the underlying fundamental debt problems remain. Economic indicators continue to show growing signs of improvement, but we seem trapped in a global environment of relatively slow growth for the foreseeable future. While central banks helped equity markets across the globe produce mid-teen returns in 2012, a return to a more fundamental market seems inevitable, as the impact of government stimulation on stock prices continues to wane. All of this market intervention and liquidity will come at a price, and as such we are expecting a reflationary environment for commodities in the long-run but this may take time given the continuing “currency war” pressures that have forced recent dollar appreciation and corresponding commodity weakness.
STRATEGY COMMENTARY
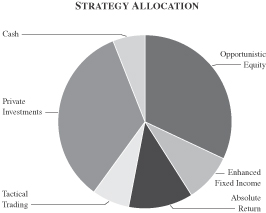
Private Investments
The Private Investment portfolio produced another double digit return for the year, and has an average annual return over 10% for the past three years, further demonstrating the overall maturity of the strategy. As previously mentioned the private investment strategy finished the fiscal year with a return of 11.50%, and a 34% weighting of the overall fund. The story for the year was definitely the robust performance of our Private Energy strategy that
posted significant gains and we are eagerly awaiting the potential for distributions from this sector in the very near future.
We recently conducted an exhaustive study through manager by manager conversations to determine upcoming liquidity events within the Private portfolio for the coming year. We were excited to see that we finished the year with distributions ($84.4M) slightly ahead of capital calls ($80.0M)* and based on our
| * | Distributions include cash distributions from private investment funds, secondary transactions and net transfers between investment strategies. |
ONE
manager conversations, we are anticipating realizations over the next six quarters that we believe may continue to outpace capital calls for the foreseeable future.
Illustrating where we are in our own life cycle is the percentage of capital that has been funded from our commitments. When the level is below 50%, a private equity program is in its “growth phase” and there is a significant distance from an active period for exits. In our experience, when greater than 65% is funded, you are entering a “mature phase” where distributions start to accelerate. Calls exceeding 80% of committed capital suggest a portfolio nearing the realization stage. The Core Alternatives Fund had a total funded ratio of 85.1% at the end of the fiscal year.
Our multi-vintage year program for private investments is entering a maturity phase at a time when capital markets appear increasingly receptive. We believe this confluence of events could be conducive for the Fund to achieve its investment objectives and also to help the Fund maintain its balance with our more liquid Hedge Fund strategy as Private Investment funds potentially exit underlying companies. Barring additional fiscal cliff concerns seizing the markets we believe much of the next year will be dominated by activity from this part of our portfolio. We are excited about the potential in the private portfolio as the private strategy continues to be the Fund’s differentiator in the market.
Hedge Fund Strategies
Our Hedge Fund Strategy was up +2.36% during the fiscal year. Enhanced Fixed Income and Absolute Return were our best performing strategies for the year while Tactical Trading was the biggest detractor.
A prominent focus over the past year was to improve the hedge fund lineup and we took significant steps to concentrate this area of the portfolio. During the
year, we allocated to 14 funds while redeeming 35. With this new emphasis on concentration, we plan to have a much heavier concentration of our managers with the biggest conviction. We hope to have 60% of the total fund assets invested in no more than 30 funds by the end of 2013. As of the fiscal year-end, the thirty largest funds represent 50.6% of the Fund’s assets.
Opportunistic Equity
Opportunistic Equity ended the year with a 34% weight and returned 0.31% for the year. Within the strategy, our best performing sub-strategy was the Financials category as global financials bounced back dramatically after a very difficult 2011. Overall, we had fairly mixed performance from our sector specialists as Healthcare and Financials had decent returns but performance from our Energy specialists significantly detracted due to losses from gold-mining
equity positions. Technology specialists also lagged as the market proved to be a challenging space for the smaller cap names that hedge funds typically specialize. In terms of our geographic focused managers, our Domestic Equity and Developed Asia managers were our best performing funds and averaged double digit returns. Global Long/Short and Emerging Market posted modest gains.
Enhanced Fixed Income
Enhanced Fixed Income finished the year at a 9% weight and posted solid gains for the year, +8.93%. We diversified away dramatically from Enhanced Fixed Income during the course of the year and cut our position nearly in half from the beginning of the year as we were concerned about a growing bond bubble and another credit crisis stemming from Europe and the US fiscal cliff. In retrospect, the dramatic reduction in our Enhanced Fixed Income allocation proved to be ill timed as credit strategies
proved to be some of the best performing of all hedge fund strategies during the year and accordingly, Structured Credit was our best performer within Enhanced Fixed Income. All of the other underlying sub-strategies posted strong gains for the year. We maintain a cautious approach to the space given the recent valuations but we are looking to increasingly concentrate our allocations within Enhanced Fixed Income, particularly with more idiosyncratic niche managers that take more of a relative value approach.
TWO
Absolute Return
Absolute Return was up 5.66% for the year and the allocation increased slightly during the year to a 13% weighting at year-end. Our Multi-Strategy managers delivered consistent positive returns throughout the quarter and the year. These managers are some of most reputable on Wall Street and they have done a
remarkable job utilizing leverage prudently to trade with a market neutral approach while consistently adding alpha. We added some new names to this strategy during the year but as we further concentrate the portfolio we expect to only have a handful of primary positions in this strategy going forward.
Tactical Trading
Tactical Trading, which incorporates managed futures, Commodity Trading Advisors (“CTAs”), global macro and tail risk managers, had the lowest allocation amongst our strategies at 6% and was the worst performing strategy for the Fund during year finishing down -6.15%. Tactical Trading remains a key liquid diversifier for the rest of the Fund’s portfolio while the strategy proved its worth during the market dislocation in May of 2012, the corresponding Central Bank interventions caused significant losses in the credit default swap (CDS) positions within our Tail Risk managers. Our global macro managers did post sizable gains during the year that helped offset some of the pain suffered from Tail Risk positions and the net short discretionary commodity CTAs. While robust risk-on periods drive returns elsewhere in the portfolio, we believe that the potential benefits of negative correlation that Tactical Trading adds will prove to be a prudent allocation if volatility spikes reappear.
In addition to concentrating the overall hedge fund portfolio, we have been looking for better ways to implement our short term views and themes in the Tactical Trading strategy and we will be looking to add more liquid solutions going forward.
As always, we appreciate the confidence you have placed in Hatteras and your investment in the Hatteras Core Alternatives Fund. Thank you again, and if you have any questions please do not hesitate to contact us.

Mark W. Yusko
THREE
PERFORMANCE SUMMARY1 (UNAUDITED)
HATTERAS CORE ALTERNATIVES FUND, L.P. (INCEPTIONDATE: APRIL 1, 2005)
| | | | | | | | | | | | | | | | | | | | | | | | | | |
| Year | | Jan | | Feb | | Mar | | Apr | | May | | Jun | | Jul | | Aug | | Sep | | Oct | | Nov | | Dec | | Year2 |
2013 | | 1.16% | | -0.03% | | 0.54% | | | | | | | | | | | | | | | | | | | | 1.68% |
2012 | | 1.96% | | 0.89% | | -0.18% | | 0.07% | | -0.58% | | 0.01% | | 0.50% | | 0.74% | | 0.64% | | -0.04% | | 0.08% | | 0.94% | | 5.10% |
2011 | | 0.41% | | 1.09% | | 0.69% | | 0.83% | | -0.22% | | -0.79% | | 0.19% | | -2.37% | | -3.27% | | 1.02% | | -0.96% | | -0.56% | | -3.97% |
2010 | | -0.30% | | 0.06% | | 1.72% | | 0.94% | | -2.63% | | -1.13% | | 0.34% | | -0.11% | | 2.29% | | 1.30% | | 0.28% | | 2.31% | | 5.06% |
2009 | | 0.17% | | -0.43% | | -0.50% | | 0.49% | | 3.69% | | 0.79% | | 2.20% | | 1.20% | | 2.39% | | 0.11% | | 0.85% | | 0.95% | | 12.50% |
2008 | | -2.89% | | 1.86% | | -2.88% | | 1.57% | | 2.10% | | -0.48% | | -2.84% | | -1.53% | | -8.28% | | -7.54% | | -4.29% | | -1.01% | | -23.79% |
2007 | | 0.97% | | 0.67% | | 1.60% | | 1.86% | | 2.01% | | 0.78% | | -0.05% | | -1.85% | | 1.93% | | 2.71% | | -1.72% | | 0.92% | | 10.16% |
2006 | | 2.80% | | -0.20% | | 1.74% | | 1.10% | | -1.97% | | -0.75% | | 0.37% | | 0.76% | | 0.26% | | 1.60% | | 2.09% | | 0.93% | | 8.98% |
2005 | | | | | | | | -1.54% | | 0.26% | | 1.46% | | 2.16% | | 0.48% | | 1.39% | | -1.46% | | 1.35% | | 1.85% | | 6.04% |
| | | | | | | | | | | | | | | | | | | | | | | | | | | | |
| | | | | | | | |
| Returns | | Fund | | | S&P 5003 | | | HFRXGL3 | | | | | Historical Data
(since inception) | | Fund | | | S&P 5003 | | | HFRXGL3 | |
Year-to-date | | | 1.68 | % | | | 10.61 | % | | | 3.13 | % | | | | Cumulative Return | | | 17.67 | % | | | 57.31 | % | | | 5.28 | % |
1-Year | | | 4.09 | % | | | 13.96 | % | | | 3.50 | % | | | | Standard Deviation4 | | | 6.52 | % | | | 15.82 | % | | | 6.53 | % |
3-Year (annualized) | | | 2.04 | % | | | 12.67 | % | | | 0.23 | % | | | | Largest Drawdown5 | | | -24.98 | % | | | -50.95 | % | | | -25.21 | % |
5-Year (annualized) | | | -0.77 | % | | | 5.81 | % | | | -1.74 | % | | | | Drawdown — # of months6 | | | 17 | | | | 16 | | | | 14 | |
Annualized Since Inception | | | 2.06 | % | | | 5.83 | % | | | 0.65 | % | | | | | | | | | | | | | | | | |
HATTERAS CORE ALTERNATIVES TEI FUND, L.P. (INCEPTIONDATE: APRIL 1, 2005)
| | | | | | | | | | | | | | | | | | | | | | | | | | |
| Year | | Jan | | Feb | | Mar | | Apr | | May | | Jun | | Jul | | Aug | | Sep | | Oct | | Nov | | Dec | | Year2 |
2013 | | 1.15% | | -0.04% | | 0.48% | | | | | | | | | | | | | | | | | | | | 1.60% |
2012 | | 1.94% | | 0.88% | | -0.20% | | 0.06% | | -0.59% | | 0.00% | | 0.49% | | 0.73% | | 0.63% | | -0.05% | | 0.08% | | 0.93% | | 4.99% |
2011 | | 0.41% | | 1.09% | | 0.68% | | 0.83% | | -0.22% | | -0.79% | | 0.19% | | -2.37% | | -3.28% | | 1.01% | | -0.96% | | -0.59% | | -4.02% |
2010 | | -0.34% | | 0.06% | | 1.72% | | 0.94% | | -2.63% | | -1.12% | | 0.35% | | -0.12% | | 2.27% | | 1.28% | | 0.26% | | 2.29% | | 4.95% |
2009 | | 0.16% | | -0.44% | | -0.50% | | 0.47% | | 3.71% | | 0.79% | | 2.19% | | 1.20% | | 2.39% | | 0.11% | | 0.85% | | 0.95% | | 12.48% |
2008 | | -2.95% | | 1.82% | | -2.92% | | 1.53% | | 2.08% | | -0.52% | | -2.88% | | -1.57% | | -8.33% | | -7.56% | | -4.31% | | -0.86% | | -23.98% |
2007 | | 0.94% | | 0.64% | | 1.58% | | 1.83% | | 1.99% | | 0.75% | | -0.07% | | -1.88% | | 1.89% | | 2.68% | | -1.74% | | 0.87% | | 9.79% |
2006 | | 2.77% | | -0.20% | | 1.72% | | 1.09% | | -1.98% | | -0.75% | | 0.37% | | 0.72% | | 0.23% | | 1.57% | | 2.05% | | 0.90% | | 8.73% |
2005 | | | | | | | | -1.54% | | 0.26% | | 1.46% | | 2.16% | | 0.48% | | 1.39% | | -1.46% | | 1.32% | | 1.82% | | 5.97% |
| | | | | | | | | | | | | | | | | | | | | | | | | | | | |
| | | | | | | | |
| Returns | | Fund | | | S&P 5003 | | | HFRXGL3 | | | | | Historical Data
(since inception) | | Fund | | | S&P 5003 | | | HFRXGL3 | |
Year-to-date | | | 1.60% | | | | 10.61% | | | | 3.13% | | | | | Cumulative Return | | | 16.22% | | | | 57.31% | | | | 5.28% | |
1-Year | | | 3.93% | | | | 13.96% | | | | 3.50% | | | | | Standard Deviation4 | | | 6.53% | | | | 15.82% | | | | 6.53% | |
3-Year (annualized) | | | 1.94% | | | | 12.67% | | | | 0.23% | | | | | Largest Drawdown5 | | | -25.23% | | | | -50.95% | | | | -25.21% | |
5-Year (annualized) | | | -0.86% | | | | 5.81% | | | | -1.74% | | | | | Drawdown — # of months6 | | | 17 | | | | 16 | | | | 14 | |
Annualized Since Inception | | | 1.90% | | | | 5.83% | | | | 0.65% | | | | | | | | | | | | | | | | | |
| 1. | Performance results and calculations after the Funds’ most recent fiscal year are unaudited. The principal value of the Funds will fluctuate so that an investor’s units, when redeemed, may be worth more or less than the original cost. Returns are net of all expenses of the Funds, including the management fee and incentive allocations, and reflect reinvestment of all distributions, if applicable. Returns do not reflect payment of the 2% redemption fee or up-front placement fees, which could be up to 2%, which would reduce returns shown above. Past performance does not guarantee future results and current performance may be lower or higher than the figures shown. The net expense ratio and total expense ratio for the Hatteras Core Alternatives Fund, L.P. are 2.30% and 7.69%, respectively. The next expense ratio and total expense ratio for the Hatteras Core Alternatives TEI Fund, L.P. are 2.38% and 7.79%, respectively. The total expense ratio for both funds includes Acquired Fund Fees and Expenses of 5.36%. The Investment Manager has contractually agreed to waive fees and/or reimburse certain expenses through July 31, 2013 so that the total annual expenses will not exceed 2.35%. Please see the current Prospectus for detailed information regarding the expenses of the Funds. |
| 2. | Cumulative Return. Returns are net of all expenses of the Funds, including the management fee and incentive allocations, and reflect reinvestment of all distributions, if applicable. Returns do not reflect payment of placement fees, if applicable, which would reduce returns noted above. |
| 3. | S&P 500 Index and HFRX Global Hedge Fund Index (HFRXGL) data are sourced from Bloomberg. The indices are unmanaged portfolios of securities. Their performance results do not reflect the deduction of management fees, incentive compensation, commissions or other expenses. An investor cannot invest directly in an index. The S&P 500 Index consists of 500 stocks chosen for market size, liquidity and industry group representation. It is a market value weighted index, with each stock’s weight in the Index proportionate to its market value. HFRXGL is designed to be representative of the overall composition of the hedge fund universe. It is comprised of eight strategies: convertible arbitrage, distressed securities, equity hedge, equity market neutral, event driven, macro, merger arbitrage and relative value arbitrage. The strategies are asset weighted based on the distribution of assets in the hedge fund industry. |
| 4. | Measurement of the investment’s volatility. |
| 5. | The peak to trough decline of an investment. |
| 6. | Number of months of a peak to trough decline of an investment. |
FOUR
PERFORMANCE SUMMARY1 (UNAUDITED)
HATTERAS CORE ALTERNATIVES INSTITUTIONAL FUND, L.P. (INCEPTIONDATE: JANUARY 1, 2007)
| | | | | | | | | | | | | | | | | | | | | | | | | | |
| Year | | Jan | | Feb | | Mar | | Apr | | May | | Jun | | Jul | | Aug | | Sep | | Oct | | Nov | | Dec | | Year2 |
2013 | | 1.23% | | 0.03% | | 0.59% | | | | | | | | | | | | | | | | | | | | 1.85% |
2012 | | 2.03% | | 0.96% | | -0.12% | | 0.13% | | -0.52% | | 0.07% | | 0.56% | | 0.80% | | 0.70% | | 0.02% | | 0.15% | | 1.00% | | 5.92% |
2011 | | 0.47% | | 1.15% | | 0.75% | | 0.89% | | -0.16% | | -0.72% | | 0.25% | | -2.31% | | -3.20% | | 1.09% | | -0.89% | | -0.50% | | -3.23% |
2010 | | -0.24% | | 0.12% | | 1.78% | | 1.01% | | -2.57% | | -1.06% | | 0.41% | | -0.04% | | 2.36% | | 1.36% | | 0.34% | | 2.37% | | 5.89% |
2009 | | 0.24% | | -0.36% | | -0.45% | | 0.55% | | 3.75% | | 0.86% | | 2.27% | | 1.27% | | 2.46% | | 0.17% | | 0.91% | | 1.01% | | 13.35% |
2008 | | -2.85% | | 1.91% | | -2.81% | | 1.63% | | 2.14% | | -0.42% | | -2.78% | | -1.47% | | -8.22% | | -7.50% | | -4.23% | | -0.94% | | -23.27% |
2007 | | 1.12% | | 0.73% | | 1.65% | | 1.89% | | 2.06% | | 0.82% | | 0.00% | | -1.89% | | 2.00% | | 2.75% | | -1.71% | | 0.97% | | 10.76% |
| | | | | | | | | | | | | | | | | | | | | | | | | | | | |
| | | | | | | | |
| Returns | | Fund | | | S&P 5003 | | | HFRXGL3 | | | | | Historical Data
(since inception) | | Fund | | | S&P 5003 | | | HFRXGL3 | |
Year-to-date | | | 1.85% | | | | 10.61% | | | | 3.13% | | | | | Cumulative Return | | | 6.50% | | | | 26.71% | | | | -7.17% | |
1-Year | | | 4.87% | | | | 13.96% | | | | 3.50% | | | | | Standard Deviation4 | | | 6.94% | | | | 17.57% | | | | 6.98% | |
3-Year (annualized) | | | 2.83% | | | | 12.67% | | | | 0.23% | | | | | Largest Drawdown5 | | | -24.29% | | | | -50.95% | | | | -25.21% | |
5-Year (annualized) | | | -0.01% | | | | 5.81% | | | | -1.74% | | | | | Drawdown — # of months6 | | | 17 | | | | 16 | | | | 14 | |
Annualized Since Inception | | | 1.01% | | | | 3.86% | | | | -1.18% | | | | | | | | | | | | | | | | | |
HATTERAS CORE ALTERNATIVES TEI INSTITUTIONAL FUND, L.P. (INCEPTIONDATE: FEBRUARY 1, 2007)
| | | | | | | | | | | | | | | | | | | | | | | | | | |
| Year | | Jan | | Feb | | Mar | | Apr | | May | | Jun | | Jul | | Aug | | Sep | | Oct | | Nov | | Dec | | Year2 |
2013 | | 1.10% | | 0.03% | | 0.47% | | | | | | | | | | | | | | | | | | | | 1.60% |
2012 | | 2.01% | | 0.94% | | -0.13% | | 0.13% | | -0.52% | | 0.07% | | 0.56% | | 0.80% | | 0.70% | | 0.02% | | 0.14% | | 1.00% | | 5.85% |
2011 | | 0.48% | | 1.16% | | 0.69% | | 0.81% | | -0.14% | | -0.65% | | 0.23% | | -2.24% | | -3.21% | | 1.07% | | -0.91% | | -0.51% | | -3.26% |
2010 | | -0.23% | | 0.13% | | 1.79% | | 1.01% | | -2.56% | | -1.06% | | 0.42% | | -0.05% | | 2.34% | | 1.35% | | 0.33% | | 2.36% | | 5.88% |
2009 | | 0.24% | | -0.36% | | -0.43% | | 0.54% | | 3.74% | | 0.85% | | 2.26% | | 1.27% | | 2.46% | | 0.18% | | 0.92% | | 1.02% | | 13.37% |
2008 | | -2.87% | | 1.87% | | -2.83% | | 1.59% | | 2.09% | | -0.44% | | -2.82% | | -1.50% | | -8.26% | | -7.51% | | -4.24% | | -0.91% | | -23.48% |
2007 | | | | 0.71% | | 1.62% | | 1.87% | | 2.03% | | 0.80% | | -0.04% | | -1.95% | | 2.01% | | 2.72% | | -1.76% | | 0.96% | | 9.23% |
| | | | | | | | | | | | | | | | | | | | | | | | | | | | |
| | | | | | | | |
| Returns | | Fund | | | S&P 5003 | | | HFRXGL3 | | | | | Historical Data
(since inception) | | Fund | | | S&P 5003 | | | HFRXGL3 | |
Year-to-date | | | 1.60% | | | | 10.61% | | | | 3.13% | | | | | Cumulative Return | | | 4.38% | | | | 24.82% | | | | -8.54% | |
1-Year | | | 4.58% | | | | 13.96% | | | | 3.50% | | | | | Standard Deviation4 | | | 6.97% | | | | 17.68% | | | | 6.99% | |
3-Year (annualized) | | | 2.70% | | | | 12.67% | | | | 0.23% | | | | | Largest Drawdown5 | | | -24.53% | | | | -50.95% | | | | -25.21% | |
5-Year (annualized) | | | -0.12% | | | | 5.81% | | | | -1.74% | | | | | Drawdown — # of months6 | | | 17 | | | | 16 | | | | 14 | |
Annualized Since Inception | | | 0.70% | | | | 3.66% | | | | -1.44% | | | | | | | | | | | | | | | | | |
| 1. | Performance results and calculations after the Funds’ most recent fiscal year are unaudited. The principal value of the Funds will fluctuate so that an investor’s units, when redeemed, may be worth more or less than the original cost. Returns are net of all expenses of the Funds, including the management fee and incentive allocations, and reflect reinvestment of all distributions, if applicable. Returns do not reflect payment of the 2% redemption fee or up-front placement fees, which could be up to 2%, which would reduce returns shown above. Past performance does not guarantee future results and current performance may be lower or higher than the figures shown. The net expense ratio and total expense ratio for the Hatteras Core Alternatives Institutional Fund, L.P. are 1.54% and 6.91%, respectively. The next expense ratio and total expense ratio for the Hatteras Core Alternatives TEI Institutional Fund, L.P. are 1.74% and 6.98%, respectively. The total expense ratio for both funds includes Acquired Fund Fees and Expenses of 5.36%. The Investment Manager has contractually agreed to waive fees and/or reimburse certain expenses through July 31, 2013 so that total annual expenses will not exceed 1.75%. Please see the current Prospectus for detailed information regarding the expenses of the Funds. |
| 2. | Cumulative Return. Returns are net of all expenses of the Funds, including the management fee and incentive allocations, and reflect reinvestment of all distributions, if applicable. Returns do not reflect payment of placement fees, if applicable, which would reduce returns noted above. |
| 3. | S&P 500 Index and HFRX Global Hedge Fund Index (HFRXGL) data are sourced from Bloomberg. The indices are unmanaged portfolios of securities. Their performance results do not reflect the deduction of management fees, incentive compensation, commissions or other expenses. An investor cannot invest directly in an index. The S&P 500 Index consists of 500 stocks chosen for market size, liquidity and industry group representation. It is a market value weighted index, with each stock’s weight in the Index proportionate to its market value. HFRXGL is designed to be representative of the overall composition of the hedge fund universe. It is comprised of eight strategies: convertible arbitrage, distressed securities, equity hedge, equity market neutral, event driven, macro, merger arbitrage and relative value arbitrage. The strategies are asset weighted based on the distribution of assets in the hedge fund industry. |
| 4. | Measurement of the investment’s volatility. |
| 5. | The peak to trough decline of an investment. |
| 6. | Number of months of a peak to trough decline of an investment. |
| 7. | Number of months to recover from a drawdown. |
FIVE
PERFORMANCE SUMMARY (UNAUDITED)
ALLOCATION
| | | | | | | | | | | | |
| Strategies | | Target
Allocation | | | Allocation
Actual* | | | # of Funds | |
Opportunistic Equity (OE) | | | 30 | % | | | 34 | % | | | 30 | |
Enhanced Fixed Income (EFI) | | | 20 | % | | | 9 | % | | | 16 | |
Absolute Return (AR) | | | 15 | % | | | 13 | % | | | 17 | |
Tactical Trading (TT) | | | 10 | % | | | 6 | % | | | 11 | |
Private Investments (PI) | | | 25 | % | | | 34 | % | | | 106 | |
Cash | | | 0 | % | | | 4 | % | | | 0 | |
Total | | | 100 | % | | | 100 | % | | | 180 | |
| | Portfolio composition will change due to ongoing management of the Fund. |
| * | Percentages are based on portfolio composition as of March 31, 2013 prior to net investor cash flows effective April 1, 2013. |
SIX
PERFORMANCE SUMMARY (UNAUDITED)
CONTRIBUTION
HATTERAS CORE ALTERNATIVES FUND, L.P. (INCEPTIONDATE: APRIL 1, 2005)
| | | | | | | | | | | | | | | | | | | | | | | | | | | | |
| | | | | | | | |
| Strategy Performance1 | | Month% | | | YTD% | | | ITD%3 | | | | | Strategy Contribution2 | | Month% | | | YTD% | | | ITD%3 | |
Opportunistic Equity | | | 1.20 | | | | 2.03 | | | | 14.56 | | | | | Opportunistic Equity | | | 0.42 | | | | 0.68 | | | | 10.53 | |
Enhanced Fixed Income | | | 1.43 | | | | 3.89 | | | | 9.81 | | | | | Enhanced Fixed Income | | | 0.14 | | | | 0.38 | | | | 4.07 | |
Absolute Return | | | 0.10 | | | | 1.12 | | | | 11.55 | | | | | Absolute Return | | | 0.01 | | | | 0.14 | | | | 3.12 | |
Tactical Trading | | | 1.39 | | | | -1.10 | | | | 6.05 | | | | | Tactical Trading | | | 0.09 | | | | -0.09 | | | | -0.19 | |
Private Investments | | | -0.32 | | | | 1.64 | | | | 2.55 | | | | | Private Investments | | | -0.11 | | | | 0.56 | | | | 0.14 | |
HATTERAS CORE ALTERNATIVES TEI FUND, L.P. (INCEPTIONDATE: APRIL 1, 2005)
| | | | | | | | | | | | | | | | | | | | | | | | | | | | |
| | | | | | | | |
| Strategy Performance1 | | Month% | | | YTD% | | | ITD%3 | | | | | Strategy Contribution2 | | Month% | | | YTD% | | | ITD%3 | |
Opportunistic Equity | | | 1.13 | | | | 1.95 | | | | 13.14 | | | | | Opportunistic Equity | | | 0.39 | | | | 0.65 | | | | 10.03 | |
Enhanced Fixed Income | | | 1.36 | | | | 3.81 | | | | 8.46 | | | | | Enhanced Fixed Income | | | 0.13 | | | | 0.38 | | | | 3.93 | |
Absolute Return | | | 0.03 | | | | 1.03 | | | | 10.18 | | | | | Absolute Return | | | 0.00 | | | | 0.13 | | | | 2.92 | |
Tactical Trading | | | 1.32 | | | | -1.18 | | | | 4.75 | | | | | Tactical Trading | | | 0.08 | | | | -0.10 | | | | -0.28 | |
Private Investments | | | -0.38 | | | | 1.56 | | | | 1.29 | | | | | Private Investments | | | -0.14 | | | | 0.53 | | | | -0.38 | |
HATTERAS CORE ALTERNATIVES INSTITUTIONAL FUND, L.P. (INCEPTIONDATE: JANUARY 1, 2007)
| | | | | | | | | | | | | | | | | | | | | | | | | | | | |
| | | | | | | | |
| Strategy Performance1 | | Month% | | | YTD% | | | ITD%3 | | | | | Strategy Contribution2 | | Month% | | | YTD% | | | ITD%3 | |
Opportunistic Equity | | | 1.25 | | | | 2.21 | | | | -3.98 | | | | | Opportunistic Equity | | | 0.43 | | | | 0.74 | | | | -1.41 | |
Enhanced Fixed Income | | | 1.48 | | | | 4.08 | | | | 2.89 | | | | | Enhanced Fixed Income | | | 0.14 | | | | 0.40 | | | | 1.51 | |
Absolute Return | | | 0.15 | | | | 1.30 | | | | 8.96 | | | | | Absolute Return | | | 0.02 | | | | 0.17 | | | | 2.00 | |
Tactical Trading | | | 1.44 | | | | -0.92 | | | | 9.31 | | | | | Tactical Trading | | | 0.09 | | | | -0.08 | | | | 0.04 | |
Private Investments | | | -0.27 | | | | 1.83 | | | | 27.52 | | | | | Private Investments | | | -0.10 | | | | 0.63 | | | | 4.37 | |
HATTERAS CORE ALTERNATIVES TEI INSTITUTIONAL FUND, L.P. (INCEPTIONDATE: FEBRUARY 1, 2007)
| | | | | | | | | | | | | | | | | | | | | | | | | | | | |
| | | | | | | | |
| Strategy Performance1 | | Month% | | | YTD% | | | ITD%3 | | | | | Strategy Contribution2 | | Month% | | | YTD% | | | ITD%3 | |
Opportunistic Equity | | | 1.12 | | | | 1.95 | | | | -5.53 | | | | | Opportunistic Equity | | | 0.39 | | | | 0.65 | | | | -2.12 | |
Enhanced Fixed Income | | | 1.36 | | | | 3.82 | | | | 0.69 | | | | | Enhanced Fixed Income | | | 0.13 | | | | 0.38 | | | | 1.18 | |
Absolute Return | | | 0.02 | | | | 1.04 | | | | 5.76 | | | | | Absolute Return | | | 0.00 | | | | 0.13 | | | | 1.42 | |
Tactical Trading | | | 1.32 | | | | -1.18 | | | | 7.43 | | | | | Tactical Trading | | | 0.08 | | | | -0.09 | | | | -0.08 | |
Private Investments | | | -0.39 | | | | 1.56 | | | | 25.28 | | | | | Private Investments | | | -0.14 | | | | 0.53 | | | | 3.98 | |
| 1. | Strategy Performance: The above illustration offers historical performance for each individual strategy as a composite of the actual underlying advisory funds. The historical performance shown indicates how each strategy (composite) performed on a stand-alone basis, net of all fees. However, none of the (composite) strategies shown above are offered as stand-alone investments. This is not meant to predict or project results into the future, nor is it intended to portray performance of the Fund. |
| 2. | Strategy Contribution: The above illustration attempts to break down the pro rata contribution of the six strategies of the Fund (in other words, their contribution to the Fund’s overall return) by strategy, and is intended to allocate the portion of the (past) performance that is attributable to the particular strategy. It is not meant to predict or project results into the future, nor is it intended to portray performance of the Fund. |
| 3. | ITD = Inception to date. |
SEVEN
TOP 10 HOLDINGS (UNAUDITED)
| | | | | | | | |
| | |
| | | Capital Balance,
March 31, 2013 | | | Percent of
Partners’ Capital | |
| | |
Citadel Wellington Partners LLC (Class A) | | $ | 32,002,386.30 | | | | 2.58 | % |
| | |
Bay Pond Partners, LP | | | 30,081,649.26 | | | | 2.42 | % |
| | |
Hound Partners, LP | | | 29,884,685.00 | | | | 2.41 | % |
| | |
Ashoka Fund, L.P. | | | 28,375,753.18 | | | | 2.29 | % |
| | |
Providence MBS Fund, LP | | | 28,361,189.45 | | | | 2.29 | % |
| | |
Glade Brook Global Domestic Fund, L.P. | | | 27,788,938.43 | | | | 2.24 | % |
| | |
Value Partners Hedge Fund, LLC | | | 27,278,752.21 | | | | 2.20 | % |
| | |
Tybourne Equity (US) Fund | | | 27,242,854.00 | | | | 2.20 | % |
| | |
Millennium USA LP | | | 26,734,845.33 | | | | 2.15 | % |
| | |
Broadfin Healthcare Fund, LP | | | 26,666,226.00 | | | | 2.15 | % |
Portfolio composition will change due to ongoing management of the Fund.
EIGHT
DEFINITIONS
The HFRX Global Hedge Fund Index is index data, sourced from Hedge Funds Research, Inc., is designed to be representative of the overall composition of the hedge fund universe. It is comprised of all eligible hedge fund strategies; including but not limited to convertible arbitrage, distressed securities, equity hedge, equity market neutral, event driven, macro, merger arbitrage, and relative value arbitrage. The strategies are asset weighted based on the distribution of assets in the hedge fund industry.
Standard & Poor’s (S&P) 500 Index is an index of 500 stocks chosen for market size, liquidity, and industry grouping, among other factors. The S&P 500 is designed to be a leading indicator of U.S. equities and is meant to reflect the risk/return characteristics of the large cap universe. Companies included in the index are selected by the S&P Index Committee, a team of analysts and economists at Standard & Poor’s. The S&P 500 is a market value weighted index — each stock’s weight in the index is proportionate to its market value.
NINE
SAFE HARBORAND FORWARD-LOOKING STATEMENTS DISCLOSURE
Safe Harbor Statement: This presentation shall not constitute an offer to sell or a solicitation of an offer to buy, nor shall there be any sale of, the securities in any state or jurisdiction in which such offer or solicitation or sale would be unlawful prior to registration or qualification under the laws of such state or jurisdiction. Forward-Looking Statements: This presentation contains certain statements that may include “forward-looking statements” within the meaning of Section 27A of the Securities Act of 1933 and Section 21E of the Securities Exchange Act of 1934. All statements, other than statements of historical fact, included herein are “forward-looking statements.” Included among “forward-looking statements” are, among other things, statements about our future outlook on opportunities based upon current market conditions. Although the company believes that the expectations reflected in these forward-looking statements are reasonable, they do involve assumptions, risks and uncertainties, and these expectations may prove to be incorrect. Actual results could differ materially from those anticipated in these forward-looking statements as a result of a variety of factors. You should not place undue reliance on these forward-looking statements, which speak only as of the date of this discussion. Other than as required by law, the company does not assume a duty to update these forward-looking statements. Past performance is no guarantee of future results. The illustrations are not intended to predict the performance of any specific investment or security. The past performance figures do not represent performance of any Hatteras security and there can be no assurance that any Hatteras security will achieve the past returns of the illustrative examples. This is not an offering to subscribe for units in any fund and is intended for informational purposes only. An offering can only be made by delivery of the Prospectus to “qualified clients” within the meaning of U.S. securities laws.
Please carefully consider the investment objectives, risks, and charges and expenses of the Funds before investing. Please read the Prospectus carefully before investing as it contains important information on the investment objectives, composition, fees, charges and expenses, risks, suitability, and tax obligations of investing in the Funds. Copies of the Prospectus and performance data current to the most recent month-end may be obtained online at hatterasfunds.com or by contacting Hatteras at 866.388.6292. Past performance does not guarantee future results.
The Hatteras Core Alternatives Fund, L.P.; the Hatteras Core Alternatives TEI Fund, L.P; the Hatteras Core Alternatives Institutional Fund, L.P.; and the Hatteras Core Alternatives TEI Institutional Fund, L.P. (collectively referred to herein as the “Hatteras Core Alternatives Fund” or the “Fund”) are Delaware limited partnerships that are registered under the Investment Company Act of 1940 (the “1940 Act”), as amended, as non-diversified, closed-end management investment companies whose units are registered under the Securities Act of 1933, as amended. The Hatteras Core Alternatives Fund is a fund of alternative investments. As such, the Fund invests in private hedge funds and private equity investments. Hedge funds are speculative investments and are not suitable for all investors, nor do they represent a complete investment program. A hedge fund can be described generally as a private and unregistered investment pool that accepts investors’ money and employs hedging and arbitrage techniques using long and short positions, leverage and derivatives, and investments in many markets.
Key Risk Factors: The Fund, through an investment in the Master Fund, will invest substantially all of its assets in underlying funds that are generally not registered as investment companies under the 1940 Act and, therefore, the Fund will not have the benefit of various protections provided under the 1940 Act with respect to an investment in those underlying funds. The Fund can be highly volatile, carry substantial fees, and involve complex tax structures. Investments in the Fund involve a high degree of risk, including loss of entire capital. The underlying funds may engage in speculative investment strategies and practices, such as the use of leverage, short sales, and derivatives transactions, which can increase the risk of investment loss. The Fund provides limited liquidity, and units in the Fund are not transferable. Liquidity will be provided only through repurchase offers made by the Fund from time to time, generally on a quarterly basis upon prior written notice. The success of the Fund is highly dependent on the financial and managerial expertise of its principals and key personnel of the Fund’s investment manager. Although the investment manager for the Fund expects to receive detailed information from each underlying fund on a regular basis regarding its valuation, investment performance, and strategy, in most cases the investment managers have little or no means of independently verifying this information. The underlying funds are not required to provide
TEN
transparency with respect to their respective investments. By investing in the underlying funds indirectly through the Fund, investors will be subject to a dual layer of fees, both at the Fund and underlying fund levels. Certain underlying funds will not provide final Schedule K-1s for any fiscal year before April 15th of the following year. Those funds, however, will endeavor to provide estimates of taxable income or losses with respect to their investments. Please see the Prospectus for a detailed
discussion of the specific risks disclosed here and other important risks and considerations.
Securities offered through Hatteras Capital Distributors, LLC, member FINRA /SIPC. Hatteras Capital Distributors, LLC is affiliated with Hatteras Investment Partners, LLC by virtue of common control/ownership. This document is not an offering to subscribe for units of any fund and is intended for informational purposes only.
ELEVEN
HATTERAS FUNDS
Hatteras Core Alternatives Fund, L.P. (a Delaware Limited Partnership)
Hatteras Core Alternatives TEI Fund, L.P. (a Delaware Limited Partnership)
Hatteras Core Alternatives Institutional Fund, L.P. (a Delaware Limited Partnership)
Hatteras Core Alternatives TEI Institutional Fund, L.P. (a Delaware Limited Partnership)
Financial Statements
As of and for the year ended March 31, 2013
with Report of Independent Registered Public Accounting Firm
HATTERAS FUNDS
As of and for the year ended March 31, 2013
Hatteras Core Alternatives Fund, L.P. (a Delaware Limited Partnership)
Hatteras Core Alternatives TEI Fund, L.P. (a Delaware Limited Partnership)
Hatteras Core Alternatives Institutional Fund, L.P. (a Delaware Limited Partnership)
Hatteras Core Alternatives TEI Institutional Fund, L.P. (a Delaware Limited Partnership)
Table of Contents
REPORT OF INDEPENDENT REGISTERED PUBLIC ACCOUNTING FIRM
To each Board of Directors and Partners of Hatteras Core Alternatives Fund, L.P., Hatteras Core Alternatives TEI Fund, L.P., Hatteras Core Alternatives Institutional Fund, L.P., and Hatteras Core Alternatives TEI Institutional Fund, L.P.:
We have audited the accompanying statements of assets, liabilities, and partners’ capital of Hatteras Core Alternatives Fund, L.P, Hatteras Core Alternatives TEI Fund, L.P., Hatteras Core Alternatives Institutional Fund, L.P., and Hatteras Core Alternatives TEI Institutional Fund, L.P. (each a Delaware Limited Partnership) (collectively the “Feeder Funds”) as of March 31, 2013, and the related statements of operations and cash flows for the year then ended, and the statements of changes in partners’ capital for each of the two years in the period then ended. These financial statements are the responsibility of the Feeder Funds’ management. Our responsibility is to express an opinion on these financial statements based on our audits.
We conducted our audits in accordance with the standards of the Public Company Accounting Oversight Board (United States). Those standards require that we plan and perform the audits to obtain reasonable assurance about whether the financial statements are free of material misstatement. The Feeder Funds are not required to have, nor were we engaged to perform, audits of their internal control over financial reporting. Our audits included consideration of internal control over financial reporting as a basis for designing audit procedures that are appropriate in the circumstances, but not for the purpose of expressing an opinion on the effectiveness of the Feeder Funds’ internal control over financial reporting. Accordingly, we express no such opinion. An audit also includes examining, on a test basis, evidence supporting the amounts and disclosures in the financial statements, assessing the accounting principles used and significant estimates made by management, as well as evaluating the overall financial statement presentation. We believe that our audits provide a reasonable basis for our opinion.
In our opinion, such financial statements referred to above present fairly, in all material respects, the financial position of each of the Feeder Funds as of March 31, 2013, the results of their operations and their cash flows for the year then ended, and the changes in their partners’ capital for each of the two years in the period then ended, in conformity with accounting principles generally accepted in the United States of America.
As discussed in Note 2 to the Hatteras Master Fund, L.P. financial statements, which are attached herein and should be read in conjunction with this report, the financial statements include investments valued at $1,110,504,519 (88.96% of total assets) as of March 31, 2013, whose fair value have been estimated by management in the absence of readily determinable fair values. Management’s estimates are based on information provided by the underlying fund advisers.
DELOITTE & TOUCHE LLP
Philadelphia, Pennsylvania
May 30, 2013
ONE
HATTERAS FUNDS
(each a Delaware Limited Partnership)
STATEMENTSOF ASSETS, LIABILITIESAND PARTNERS’ CAPITAL
March 31, 2013
| | | | | | | | | | | | | | | | |
| | | Hatteras
Core Alternatives
Fund, L.P. | | | Hatteras
Core Alternatives
TEI
Fund, L.P.* | | | Hatteras
Core Alternatives
Institutional
Fund, L.P. | | | Hatteras
Core Alternatives
TEI
Institutional
Fund, L.P.* | |
Assets | | | | | | | | | | | | | | | | |
Investment in Hatteras Master Fund, L.P., at fair value (cost $173,813,008; $235,350,872; $197,227,809 and $501,121,436, respectively) | | $ | 184,990,210 | | | $ | 246,124,934 | | | $ | 197,557,979 | | | $ | 531,471,798 | |
Cash | | | 350,000 | | | | 405,000 | | | | 200,000 | | | | 305,000 | |
Receivable for withdrawal from Hatteras Master Fund, L.P. | | | 9,734,007 | | | | 12,947,528 | | | | 10,400,149 | | | | 27,977,343 | |
Investment in Hatteras Master Fund, L.P. paid in advance | | | 163,401 | | | | 102,229 | | | | 486,857 | | | | 439,525 | |
Prepaid assets | | | 4,397 | | | | 5,849 | | | | 4,445 | | | | 11,727 | |
Total assets | | $ | 195,242,015 | | | $ | 259,585,540 | | | $ | 208,649,430 | | | $ | 560,205,393 | |
Liabilities and partners’ capital | | | | | | | | | | | | | | | | |
Withdrawals payable | | $ | 9,734,094 | | | $ | 12,947,528 | | | $ | 10,400,149 | | | $ | 27,977,343 | |
Contributions received in advance | | | 345,000 | | | | 339,000 | | | | 555,200 | | | | 552,190 | |
Servicing fee payable | | | 137,996 | | | | 183,550 | | | | 17,335 | | | | 46,631 | |
Professional fees payable | | | 43,652 | | | | 25,667 | | | | 44,220 | | | | 14,510 | |
Accounting and administration fees payable | | | 11,567 | | | | 16,082 | | | | 9,539 | | | | 16,148 | |
Printing fees payable | | | 10,000 | | | | 15,000 | | | | 5,000 | | | | 27,599 | |
Custodian fees payable | | | 800 | | | | 1,400 | | | | 800 | | | | 1,400 | |
Other accrued expenses | | | 5,000 | | | | 8,045 | | | | 5,000 | | | | 14,671 | |
Total liabilities | | | 10,288,109 | | | | 13,536,272 | | | | 11,037,243 | | | | 28,650,492 | |
Partners’ capital | | | 184,953,906 | | | | 246,049,268 | | | | 197,612,187 | | | | 531,554,901 | |
Total liabilities and partners’ capital | | $ | 195,242,015 | | | $ | 259,585,540 | | | $ | 208,649,430 | | | $ | 560,205,393 | |
Components of partners’ capital | | | | | | | | | | | | | | | | |
Capital contributions (net) | | $ | 189,224,280 | | | $ | 256,952,363 | | | $ | 200,780,774 | | | $ | 510,333,097 | |
Accumulated net investment loss | | | (17,310,145 | ) | | | (23,209,570 | ) | | | (3,094,849 | ) | | | (5,394,315 | ) |
Accumulated net realized gain (loss) | | | (5,146,344 | ) | | | (4,833,016 | ) | | | (5,251,753 | ) | | | 977,293 | |
Accumulated net unrealized appreciation on investments | | | 18,186,115 | | | | 17,139,491 | | | | 5,178,015 | | | | 25,638,826 | |
Partners’ capital | | $ | 184,953,906 | | | $ | 246,049,268 | | | $ | 197,612,187 | | | $ | 531,554,901 | |
Net asset value per unit | | $ | 93.23 | | | $ | 92.88 | | | $ | 96.68 | | | $ | 96.26 | |
Maximum offering price per unit** | | $ | 95.09 | | | $ | 94.74 | | | $ | 96.68 | | | $ | 96.26 | |
Number of authorized units | | | 7,500,000.00 | | | | 7,500,000.00 | | | | 7,500,000.00 | | | | 10,000,000.00 | |
Number of outstanding units | | | 1,983,779.66 | | | | 2,648,968.08 | | | | 2,043,885.22 | | | | 5,522,226.42 | |
| * | Consolidated Statement. See note 1. |
| ** | The maximum sales load for the Hatteras Core Alternatives Fund, L.P. and the Hatteras Core Alternatives TEI Fund, L.P. is 2.00%. The remaining funds are not subject to a sales load. |
See notes to financial statements.
TWO
HATTERAS FUNDS
(each a Delaware Limited Partnership)
STATEMENTSOF OPERATIONS
For the year ended March 31, 2013
| | | | | | | | | | | | | | | | |
| | | Hatteras
Core Alternatives
Fund, L.P. | | | Hatteras
Core Alternatives
TEI
Fund, L.P.* | | | Hatteras
Core Alternatives
Institutional
Fund, L.P. | | | Hatteras
Core Alternatives
TEI
Institutional
Fund, L.P.* | |
Net investment income allocated from Hatteras Master Fund, L.P. | | | | | | | | | | | | | | | | |
Investment income | | $ | 4,639,378 | | | $ | 6,095,425 | | | $ | 4,783,945 | | | $ | 12,709,470 | |
Operating expenses | | | (2,768,691 | ) | | | (3,633,647 | ) | | | (2,844,337 | ) | | | (7,560,808 | ) |
Performance allocation | | | — | | | | — | | | | — | | | | (965,799 | ) |
Net investment income allocated from Hatteras Master Fund, L.P. | | | 1,870,687 | | | | 2,461,778 | | | | 1,939,608 | | | | 4,182,863 | |
Feeder Fund investment income | | | | | | | | | | | | | | | | |
Interest | | | 144 | | | | 158 | | | | 137 | | | | 274 | |
Total fund investment income | | | 144 | | | | 158 | | | | 137 | | | | 274 | |
Feeder Fund expenses | | | | | | | | | | | | | | | | |
Servicing fee | | | 1,844,133 | | | | 2,421,160 | | | | 222,847 | | | | 592,430 | |
Accounting and administration fees | | | 140,044 | | | | 200,876 | | | | 120,232 | | | | 209,751 | |
Professional fees | | | 57,631 | | | | 20,400 | | | | 70,632 | | | | 29,326 | |
Insurance fees | | | 52,815 | | | | 70,122 | | | | 52,901 | | | | 139,955 | |
Directors’ fees | | | 37,500 | | | | 37,500 | | | | 37,500 | | | | 37,500 | |
Printing fees | | | 20,499 | | | | 26,230 | | | | 20,938 | | | | 40,000 | |
Custodian fees | | | 5,242 | | | | 8,574 | | | | 6,485 | | | | 9,045 | |
Withholding tax | | | — | | | | 333,262 | | | | — | | | | 659,468 | |
Other expenses | | | 80,752 | | | | 61,301 | | | | 68,627 | | | | 83,333 | |
Total Feeder Fund expenses | | | 2,238,616 | | | | 3,179,425 | | | | 600,162 | | | | 1,800,808 | |
Net investment income/(loss) | | | (367,785 | ) | | | (717,489 | ) | | | 1,339,583 | | | | 2,382,329 | |
Net realized gain and change in unrealized appreciation on investments allocated from Hatteras Master Fund, L.P. | | | | | | | | | | | | | | | | |
Net realized gain from investments in Adviser Funds, securities and foreign exchange transactions | | | 5,481,387 | | | | 7,330,608 | | | | 5,841,578 | | | | 15,628,270 | |
Net change in unrealized appreciation on investments in Adviser Funds, securities and foreign exchange transactions | | | 2,989,143 | | | | 3,660,794 | | | | 2,892,592 | | | | 7,728,454 | |
Net realized gain and change in unrealized appreciation on investments allocated from Hatteras Master Fund, L.P. | | | 8,470,530 | | | | 10,991,402 | | | | 8,734,170 | | | | 23,356,724 | |
Net increase in partners’ capital resulting from operations | | $ | 8,102,745 | | | $ | 10,273,913 | | | $ | 10,073,753 | | | $ | 25,739,053 | |
| * | Consolidated Statement. See note 1. |
See notes to financial statements.
THREE
HATTERAS FUNDS
(each a Delaware Limited Partnership)
STATEMENTSOF CHANGESIN PARTNERS’ CAPITAL
For the year ended March 31, 2012 and the year ended March 31, 2013
| | | | | | | | | | | | | | | | |
| | | Hatteras
Core Alternatives
Fund, L.P. | | | Hatteras
Core Alternatives
TEI
Fund, L.P.* | | | Hatteras
Core Alternatives
Institutional
Fund, L.P. | | | Hatteras
Core Alternatives
TEI
Institutional
Fund, L.P.* | |
| | | Limited
Partners | | | Limited
Partners | | | Limited
Partners | | | Limited
Partners | |
Partners’ Capital, at March 31, 2011 | | $ | 248,882,108 | | | $ | 325,745,330 | | | $ | 238,674,737 | | | $ | 659,549,379 | |
Capital contributions | | | 37,627,191 | | | | 45,202,873 | | | | 52,807,746 | | | | 55,960,615 | |
Capital withdrawals | | | (42,007,165 | ) | | | (45,915,793 | ) | | | (47,422,023 | ) | | | (71,636,476 | ) |
Repurchase fees | | | 57,277 | | | | 5,418 | | | | 36,440 | | | | 16,501 | |
Net investment income/(loss) | | | (724,905 | ) | | | (1,262,773 | ) | | | 1,231,020 | | | | 3,013,883 | |
Net realized gain from investments in Adviser Funds, securities and foreign exchange transactions | | | 3,080,313 | | | | 3,877,391 | | | | 2,883,089 | | | | 7,796,071 | |
Net change in unrealized appreciation on investments in Adviser Funds, securities and foreign exchange contracts | | | (12,034,318 | ) | | | (15,448,686 | ) | | | (11,319,447 | ) | | | (30,153,048 | ) |
Partners’ Capital, at March 31, 2012** | | $ | 234,880,501 | | | $ | 312,203,760 | | | $ | 236,891,562 | | | $ | 624,546,925 | |
Capital contributions | | | 8,346,000 | | | | 10,697,277 | | | | 12,778,549 | | | | 26,609,863 | |
Capital withdrawals | | | (66,564,692 | ) | | | (87,225,548 | ) | | | (62,321,857 | ) | | | (145,459,748 | ) |
Repurchase fees | | | 189,352 | | | | 99,866 | | | | 190,180 | | | | 118,808 | |
Net investment income/(loss) | | | (367,785 | ) | | | (717,489 | ) | | | 1,339,583 | | | | 2,382,329 | |
Net realized gain from investments in Adviser Funds, securities and foreign exchange transactions | | | 5,481,387 | | | | 7,330,608 | | | | 5,841,578 | | | | 15,628,270 | |
Net change in unrealized appreciation on investments in Adviser Funds, securities and foreign exchange contracts | | | 2,989,143 | | | | 3,660,794 | | | | 2,892,592 | | | | 7,728,454 | |
Partners’ Capital, at March 31, 2013*** | | $ | 184,953,906 | | | $ | 246,049,268 | | | $ | 197,612,187 | | | $ | 531,554,901 | |
| * | Consolidated Statement. See note 1. |
| ** | Including accumulated net investment loss of $16,942,360; $22,492,081; $4,434,432; and $7,776,644, respectively. |
| *** | Including accumulated net investment loss of $17,310,145; $23,209,570; $3,094,849; and $5,394,315, respectively. |
See notes to financial statements.
FOUR
HATTERAS FUNDS
(each a Delaware Limited Partnership)
STATEMENTSOF CASHFLOWS
For the year ended March 31, 2013
| | | | | | | | | | | | | | | | |
| | | Hatteras
Core Alternatives
Fund, L.P. | | | Hatteras
Core Alternatives
TEI
Fund, L.P.* | | | Hatteras
Core Alternatives
Institutional
Fund, L.P. | | | Hatteras
Core Alternatives
TEI
Institutional
Fund, L.P.* | |
Cash flows from operating activities: | | | | | | | | | | | | | | | | |
Net increase in partners’ capital resulting from operations | | $ | 8,102,745 | | | $ | 10,273,913 | | | $ | 10,073,753 | | | $ | 25,739,053 | |
Adjustments to reconcile net increase in partners’ capital resulting from operations to net cash provided by operating activities: | | | | | | | | | | | | | | | | |
Purchase of interests in Hatteras Master Fund, L.P. | | | (6,067,031 | ) | | | (7,775,372 | ) | | | (12,262,630 | ) | | | (25,518,283 | ) |
Proceeds from withdrawals from Hatteras Master Fund, L.P. | | | 66,601,470 | | | | 87,595,350 | | | | 62,359,356 | | | | 146,172,438 | |
Net investment income allocated from Hatteras Master Fund, L.P. | | | (1,870,687 | ) | | | (2,461,778 | ) | | | (1,939,608 | ) | | | (4,182,863 | ) |
Net realized gain from investments in Adviser Funds, securities and foreign exchange transactions allocated from Hatteras Master Fund, L.P. | | | (5,481,387 | ) | | | (7,330,608 | ) | | | (5,841,578 | ) | | | (15,628,270 | ) |
Net change in unrealized appreciation on investments in Adviser Funds, securities and foreign exchange transactions allocated from Hatteras Master Fund, L.P. | | | (2,989,143 | ) | | | (3,660,794 | ) | | | (2,892,592 | ) | | | (7,728,454 | ) |
(Increase)/Decrease in receivable for withdrawals from Hatteras Master Fund, L.P. | | | 3,293,348 | | | | (1,361,906 | ) | | | 3,529,984 | | | | (8,824,387 | ) |
(Increase)/Decrease in investment in Hatteras Master Fund, L.P. paid in advance | | | (163,401 | ) | | | (102,229 | ) | | | (486,857 | ) | | | (439,525 | ) |
(Increase)/Decrease in prepaid assets | | | 150 | | | | 105 | | | | (112 | ) | | | (162 | ) |
Increase/(Decrease) in servicing fee payable | | | (37,724 | ) | | | (45,927 | ) | | | (3,568 | ) | | | (7,015 | ) |
Increase/(Decrease) in accounting and administration fees payable | | | (1,345 | ) | | | (1,326 | ) | | | (1,046 | ) | | | (2,843 | ) |
Increase/(Decrease) in professional fees payable | | | (5,248 | ) | | | (10,830 | ) | | | 8,590 | | | | (2,844 | ) |
Increase/(Decrease) in custodian fees payable | | | (838 | ) | | | — | | | | (100 | ) | | | (30 | ) |
Increase/(Decrease) in printing fees payable | | | (31 | ) | | | 1,829 | | | | 3,149 | | | | (4,097 | ) |
Increase/(Decrease) in other accrued expenses | | | 1,620 | | | | (4,034 | ) | | | 51 | | | | 5,704 | |
Net cash provided by operating activities | | | 61,382,498 | | | | 75,116,393 | | | | 52,546,792 | | | | 109,578,422 | |
Cash flows from financing activities: | | | | | | | | | | | | | | | | |
Capital contributions | | | 8,691,000 | | | | 11,036,277 | | | | 13,333,749 | | | | 27,162,053 | |
Capital withdrawals, net of repurchase fees | | | (69,847,153 | ) | | | (85,862,995 | ) | | | (65,822,099 | ) | | | (136,629,535 | ) |
Net cash used in financing activities | | | (61,156,153 | ) | | | (74,826,718 | ) | | | (52,488,350 | ) | | | (109,467,482 | ) |
Net change in cash | | | 226,345 | | | | 289,675 | | | | 58,442 | | | | 110,940 | |
Cash at beginning of year | | | 123,655 | | | | 115,325 | | | | 141,558 | | | | 194,060 | |
Cash at end of year | | $ | 350,000 | | | $ | 405,000 | | | $ | 200,000 | | | $ | 305,000 | |
| * | Consolidated Statement. See note 1. |
See notes to financial statements.
FIVE
HATTERAS FUNDS
(each a Delaware Limited Partnership)
NOTESTO FINANCIAL STATEMENTS
As of and for the year ended March 31, 2013
1. ORGANIZATION
The Hatteras Funds, each a “Feeder Fund” and collectively the “Feeder Funds” are:
Hatteras Core Alternatives Fund, L.P.
Hatteras Core Alternatives TEI Fund, L.P.
Hatteras Core Alternatives Institutional Fund, L.P.
Hatteras Core Alternatives TEI Institutional Fund, L.P.
The Hatteras Core Alternatives TEI Fund, L.P. and the Hatteras Core Alternatives TEI Institutional Fund, L.P. each invest substantially all of their assets in the Hatteras Core Alternatives Offshore Fund, LDC and Hatteras Core Alternatives Offshore Institutional Fund, LDC, (collectively the “Blocker Funds”), respectively. The Blocker Funds are Cayman Islands limited duration companies with the same investment objective as the Feeder Funds. The Blocker Funds serve solely as intermediate entities through which the Hatteras Core Alternatives TEI Fund, L.P. and the Hatteras Core Alternatives TEI Institutional Fund, L.P. invest in Hatteras Master Fund, L.P. (the “Master Fund” and together with the Feeder Funds, the “Funds”). The Blocker Funds enable tax-exempt Limited Partners (as defined below) to invest without receiving certain income in a form that would otherwise be taxable to such tax-exempt Limited Partners regardless of their tax-exempt status. The Hatteras Core Alternatives TEI Fund, L.P. owns 100% of the participating beneficial interests of the Hatteras Core Alternatives Offshore Fund, LDC and the Hatteras Core Alternatives TEI Institutional Fund, L.P. owns 100% of the participating beneficial interests of the Hatteras Core Alternatives Offshore Institutional Fund, LDC. Where these Notes to Financial Statements discuss the Feeder Funds’ investment in the Master Fund, for Hatteras Core Alternatives TEI Fund, L.P. and Hatteras Core Alternatives TEI Institutional Fund, L.P., it means their investment in the Master Fund through the applicable Blocker Fund.
The Feeder Funds are organized as Delaware limited partnerships, and are registered under the Securities Act of 1933, as amended, and the Investment Company Act of 1940, as amended, (the “1940 Act”) as closed-end, diversified, management investment companies. The primary investment objective of the Feeder Funds is to provide capital appreciation consistent with the return characteristic of the alternative investment portfolios of larger endowments. The Feeder Funds’ secondary objective is to provide capital appreciation with less volatility than that of the equity markets. To achieve their objectives, the Feeder Funds provide their investors with access to a broad range of investment strategies, asset categories and trading advisers (“Advisers”) and by providing overall asset allocation services typically available on a collective basis to larger institutions, through an investment of substantially all of their assets into the Master Fund, which is registered under the 1940 Act. The Feeder Funds are co-managed by Hatteras Investment Partners, LLC (“HIP”), a Delaware limited liability company registered as an investment adviser under the Investment Advisers Act of 1940, as amended (the “Advisers Act”), and Morgan Creek Capital Management, LLC (“MCCM,” together with HIP, the “Investment Managers”), a North Carolina limited liability company registered as an investment adviser under the Advisers Act. Investors who acquire units of limited partnership interest in the Feeder Funds (“Units”) are the limited partners (each, a “Limited Partner” and together, the “Limited Partners”) of the Feeder Funds.
The financial statements of the Master Fund, including the schedule of investments, are included elsewhere in this report and should be read with the Feeder Funds’ financial statements. The percentage of the Master Fund’s beneficial limited partnership interests owned by the Feeder Funds at March 31, 2013 were:
| | | | |
Hatteras Core Alternatives Fund, L.P. | | | 15.67 | % |
Hatteras Core Alternatives TEI Fund, L.P. | | | 20.84 | % |
Hatteras Core Alternatives Institutional Fund, L.P. | | | 16.73 | % |
Hatteras Core Alternatives TEI Institutional Fund, L.P. | | | 45.02 | % |
Hatteras Investment Management, LLC, a Delaware limited liability company, serves as the General Partner of each of the Feeder Funds and the Master Fund (the “General Partner”). The General Partner is an affiliate of HIP. The General Partner has appointed a Board of Directors for each Feeder Fund (collectively the “Boards”) and, to the fullest extent permitted by applicable law, has irrevocably delegated to the Boards its rights and powers to
SIX
HATTERAS FUNDS
(each a Delaware Limited Partnership)
NOTESTO FINANCIAL STATEMENTS
As of and for the year ended March 31, 2013 (continued)
1. ORGANIZATION (CONTINUED)
monitor and oversee the business affairs of the Feeder Funds, including the complete and exclusive authority to oversee and establish policies regarding the management, conduct and operation of the Feeder Funds’ business.
2. SIGNIFICANT ACCOUNTING POLICIES
These financial statements have been prepared in accordance with accounting principles generally accepted in the United States of America (“GAAP”) and are expressed in United States dollars. The following is a summary of significant accounting and reporting policies used in preparing the financial statements.
a. Investment Valuation
The Feeder Funds do not make direct investments in securities or financial instruments, and invest substantially all of their assets in the Master Fund. The Feeder Funds record their investment in the Master Fund at fair value. Because the full amount of investment cannot be redeemed at least quarterly, each Feeder Fund’s investment in the Master Fund would be considered level 3 under Accounting Standards Codification 820 — Fair Value, as described in the notes to the Master Fund’s financial statements included elsewhere in this report. Valuation of securities held by the Master Fund, including the Master Fund’s disclosure of investments under the three-tier hierarchy, is also discussed in the notes to the Master Fund’s financial statements.
b. Allocations from the Master Fund
The Feeder Funds record their allocated portion of income, expense, realized gains and losses and unrealized appreciation and depreciation from the Master Fund.
c. Feeder Fund Level Income and Expenses
Interest income on any cash or cash equivalents held by the Feeder Funds will be recognized on an accrual basis. Expenses that are specifically attributed to the Feeder Funds are charged to each Feeder Fund. Because the Feeder Funds bear their proportionate share of the management fee of the Master Fund, the Feeder Funds pay no direct management fee to the Investment Managers. The Feeder Funds’ specific expenses are recorded on an accrual basis.
d. Tax Basis Reporting
Because the Master Fund invests primarily in investment funds that are treated as partnerships for U.S. Federal tax purposes, the tax character of each of the Feeder Fund’s allocated earnings is established dependent upon the tax filings of the investment vehicles operated by the Advisers (“Adviser Funds”). Accordingly, the tax basis of these allocated earnings and the related balances are not available as of the reporting date.
e. Income Taxes
For U.S. Federal income tax purposes, the Feeder Funds are treated as partnerships, and each Limited Partner in each respective Feeder Fund is treated as the owner of its proportionate share of the net assets, income, expenses, and the realized and unrealized gains (losses) of such Feeder Fund. Accordingly, no federal, state or local income taxes have been provided on profits of the Feeder Funds since the Limited Partners are individually liable for the taxes on their share of the Feeder Funds.
The Feeder Funds file tax returns as prescribed by the tax laws of the jurisdictions in which they operate. In the normal course of business, the Feeder Funds are subject to examination by federal, state, local and foreign jurisdictions, where applicable. For returns filed for the years ended December 31, 2009 through December 31, 2012, the Feeder Funds remain subject to examination by the major tax jurisdictions under the statute of limitations.
The Feeder Funds have reviewed any potential tax positions as of March 31, 2013 and have determined that they do not have a liability for any unrecognized tax benefits or expense. The Feeder Funds recognize interest and penalties, if any, related to unrecognized tax benefits as income tax expense in the Statement of Operations. During the year ended March 31, 2013, the Feeder Funds did not incur any material interest or penalties.
SEVEN
HATTERAS FUNDS
(each a Delaware Limited Partnership)
NOTESTO FINANCIAL STATEMENTS
As of and for the year ended March 31, 2013 (continued)
2. SIGNIFICANT ACCOUNTING POLICIES (CONTINUED)
f. Cash
Cash includes amounts held in interest bearing demand deposit accounts. Such cash, at times, may exceed federally insured limits. The Feeder Funds have not experienced any losses in such accounts and do not believe they are exposed to any significant credit risk on such accounts.
g. Use of Estimates
The preparation of financial statements in conformity with GAAP requires management to make estimates and assumptions that affect the reported amounts of assets and liabilities and disclosure of contingent assets and liabilities at the date of the financial statements, and the reported amounts of increases and decreases in Limited Partners’ capital from operations during the reporting period. Actual results could differ from those estimates.
h. Consolidated Financial Statements
The asset, liability, and equity accounts of the Hatteras Core Alternatives TEI Fund, L.P. and the Hatteras Core Alternatives TEI Institutional Fund, L.P. are consolidated with their respective Blocker Funds as presented in the Statements of Assets, Liabilities, and Partners’ Capital, Statements of Operations, Statements of Changes in Partners’ Capital, and Statements of Cash Flows. All significant intercompany accounts and transactions have been eliminated in consolidation.
3. ALLOCATIONOF LIMITED PARTNERS’ CAPITAL
Net profits or net losses of the Feeder Funds for each allocation period (“Allocation Period”) will be allocated among and credited to or debited against the capital accounts of the Limited Partners. Net profits or net losses will be measured as the net change in the value of the Limited Partners’ capital of the Feeder Funds, including any net change in unrealized appreciation or depreciation of investments and realized income and gains or losses and expenses during an Allocation Period, adjusted to exclude any items to be allocated among the capital accounts of the Limited Partners in accordance with the Limited Partners’ respective investment percentages.
Allocation Periods generally begin on the first calendar day of each month and end at the close of business on the last day of each month.
The Feeder Funds maintain a separate capital account (“Capital Account”) on their books for each Limited Partner. Each Limited Partner’s Capital Account will have an opening balance equal to the Limited Partner’s initial purchase of the Feeder Fund (i.e., the amount of the investment less any applicable sales load of up to 2 percent of the purchased amount), and thereafter, will be (i) increased by the amount of any additional purchases by such Limited Partner; (ii) decreased for any payments upon repurchase or sale of such Limited Partner’s interest or any distributions in respect of such Limited Partner; and (iii) increased or decreased as of the close of each Allocation Period by such Limited Partner’s allocable share of the net profits or net losses of the Feeder Fund.
| | | | | | | | | | | | | | | | |
| | | Hatteras Core Alternatives Fund, L.P. | | | Hatteras Core Alternatives TEI
Fund, L.P. | | | Hatteras Core Alternatives
Institutional
Fund, L.P. | | | Hatteras Core Alternatives
TEI Institutional
Fund, L.P. | |
Beginning Units, April 1, 2011 | | | 2,680,763.77 | | | | 3,513,215.38 | | | | 2,517,400.45 | | | | 6,965,196.16 | |
Purchases | | | 410,349.15 | | | | 494,338.34 | | | | 566,263.72 | | | | 595,845.64 | |
Sales | | | (468,946.82 | ) | | | (514,360.89 | ) | | | (514,144.55 | ) | | | (775,804.70 | ) |
Beginning Units, April 1, 2012 | | | 2,622,166.10 | | | | 3,493,192.83 | | | | 2,569,519.62 | | | | 6,785,237.10 | |
Purchases | | | 92,593.95 | | | | 119,103.07 | | | | 137,183.02 | | | | 288,692 | |
Sales | | | (730,980.39 | ) | | | (963,327.82 | ) | | | (662,817.42 | ) | | | (1,551,702.68 | ) |
Ending units, March 31, 2013 | | | 1,983,779.66 | | | | 2,648,968.08 | | | | 2,043,885.22 | | | | 5,522,226.42 | |
EIGHT
HATTERAS FUNDS
(each a Delaware Limited Partnership)
NOTESTO FINANCIAL STATEMENTS
As of and for the year ended March 31, 2013 (continued)
4. RELATED PARTY TRANSACTIONSAND OTHER
In consideration for fund services, Hatteras Core Alternatives Fund, L.P., Hatteras Core Alternatives TEI Fund, L.P., Hatteras Core Alternatives Institutional Fund, L.P. and Hatteras Core Alternatives TEI Institutional Fund, L.P. will pay HIP (in such capacity, the “Servicing Agent”) a fund servicing fee at the annual rate of 0.85%, 0.85%, 0.10% and 0.10%, respectively, of the month-end partner’s capital of the applicable Feeder Fund. The respective Feeder Fund servicing fees payable to the Servicing Agent will be borne by all Limited Partners of the respective Feeder Fund on a pro-rata basis before giving effect to any repurchase of interests in the Master Fund effective as of that date, and will decrease the net profits or increase the net losses of the Master Fund that are credited to its interest holders, including each Feeder Fund.
The Servicing Agent may waive (to all investors on a pro-rata basis) or pay to third parties all or a portion of any such fees in its sole discretion. The Servicing Agent did not waive any of the servicing fees for the year ended March 31, 2013. HIP has contractually agreed to reimburse certain expenses through July 31, 2013, so that the total annual expenses (excluding taxes, interest, brokerage commissions, other transaction-related expenses, any extraordinary expenses of the Feeder Funds, any acquired fund fees and expenses, as well as any performance allocation payable by the Feeder Funds or the Master Fund) for this period will not exceed 2.35% for the Hatteras Core Alternatives Fund, L.P. and Hatteras Core Alternatives TEI Fund, L.P. and 1.75% for the Hatteras Core Alternatives Institutional Fund, L.P. and Hatteras Core Alternatives TEI Institutional Fund, L.P. (the “Expense Limitation”). The agreement automatically renews for a one-year term after the initial period until terminated by HIP or the applicable Feeder Fund. The Feeder Funds will carry forward, for a period not to exceed (3) three years from the date on which a reimbursement is made by HIP, any expenses in excess of the Expense Limitation and repay HIP such amounts, provided the Feeder Fund is able to effect such reimbursement and remain in compliance with the Expense Limitation disclosed in the applicable Feeder Fund’s then effective prospectus. There were no reimbursements from HIP, nor previous reimbursements repaid to HIP, nor expenses available for reimbursement as of and for the year ended March 31, 2013.
The performance allocation is calculated at the Master Fund level, and allocated to the Feeder Funds based on each Feeder Fund’s ownership interest in the Master Fund. The General Partner is allocated a performance allocation payable annually equal to 10% of the amount by which net new profits of the limited partner interests of the Master Fund exceed the non-cumulative “hurdle amount”, which is calculated as of the last day of the preceding calendar year of the Master Fund at a rate equal to the yield-to-maturity of the 90 day U.S. Treasury Bill as reported by the Wall Street Journal for the last business day of the preceding calendar year (the “Performance Allocation”). The Performance Allocation is made on a “peak to peak,” or “high watermark” basis, which means that the Performance Allocation is made only with respect to new net profits. If the Master Fund has a net loss in any period followed by a net profit, no Performance Allocation will be made with respect to such subsequent appreciation until such net loss has been recovered. MCCM is a non-voting member (“Member”) of HIP. HIP, MCCM and the General Partner have entered into a membership agreement (the “Member Agreement”). Pursuant to the Member Agreement, the General Partner makes distributions to MCCM equal to a percentage of the Performance Allocation the General Partner receives from the Master Fund. For the year ended March 31, 2013, the General Partner of the Master Fund accrued a Performance Allocation which was allocated to the Hatteras Core Alternatives TEI Institutional Fund, L.P. in the amount of $965,799, which is disclosed in the Statement of Operations.
Hatteras Capital Distributors LLC (“HCD”), an affiliate of HIP, serves as the Feeder Funds’ distributor. HCD receives a distribution fee from HIP equal to 0.10% on an annualized basis of the net assets of the Master Fund as of the last day of the month (before giving effect to any repurchase of interests in the Master Fund).
UMB Bank, N.A. serves as custodian of the Feeder Funds’ cash balances and provides custodial services for the Feeder Funds. J.D. Clark & Company, a division of UMB Fund Services, Inc., serves as administrator and accounting agent to the Feeder Funds and provides certain accounting, record keeping and investor related services. The Feeder Funds pay a fee to the custodian and administrator based upon average Limited Partners’ capital, subject to certain minimums.
NINE
HATTERAS FUNDS
(each a Delaware Limited Partnership)
NOTESTO FINANCIAL STATEMENTS
As of and for the year ended March 31, 2013 (continued)
4. RELATED PARTY TRANSACTIONSAND OTHER (CONTINUED)
At March 31, 2013, Limited Partners, who are affiliated with HIP, MCCM or the General Partner, owned $544,822 (0.29% of Partners’ Capital) of Hatteras Core Alternatives Fund, L.P., $1,807,422 (0.91% of Partners’ Capital) of Hatteras Core Alternatives Institutional Fund, L.P., and $496,981 (0.09% of Partners’ Capital) of Hatteras Core Alternatives TEI Institutional Fund, L.P.
5. RISK FACTORS
An investment in the Feeder Funds involves significant risks that should be carefully considered prior to investment and should only be considered by persons financially able to maintain their investment and who can afford a loss of a substantial part or all of such investment. The Master Fund intends to invest substantially all of its available capital in securities of private investment companies. These investments will generally be restricted securities that are subject to substantial holding periods or are not traded in public markets at all, so that the Master Fund may not be able to resell some of its Adviser Fund holdings for extended periods, which may be several years. Limited Partners should refer to the Master Fund’s financial statements included in this report along with the applicable Feeder Fund’s prospectus, as supplemented and corresponding statement of additional information for a more complete list of risk factors. No guarantee or representation is made that the Feeder Funds’ investment objective will be met.
6. REPURCHASEOF LIMITED PARTNERS’ UNITS
The Board may, from time to time and in its sole discretion, cause the Feeder Funds to repurchase Units from Limited Partners pursuant to written tenders by Limited Partners at such times and on such terms and conditions as established by the Board. In determining whether the Feeder Funds should offer to repurchase interests, the Board will consider, among other things, the recommendation of the Investment Managers. The Feeder Funds generally expect to offer to repurchase Units from Limited Partners on a quarterly basis as of March 31, June 30, September 30 and December 31 of each year. In no event will more than 20% of the Units of a Feeder Fund be repurchased per quarter. The Feeder Funds do not intend to distribute to the Limited Partners any of the Feeder Funds’ income, but generally expect to reinvest substantially all income and gains allocable to the Limited Partners. A Limited Partner may, therefore, be allocated taxable income and gains and not receive any cash distribution. Units repurchased prior to the Limited Partner’s one year anniversary of its initial investment may be subject to a maximum 2% repurchase fee.
7. INDEMNIFICATION
In the normal course of business, the Feeder Funds enter into contracts that provide general indemnifications. The Feeder Funds’ maximum exposure under these agreements is dependent on future claims that may be made against the Feeder Funds, and therefore cannot be established; however, based on experience, the risk of loss from such claims is considered remote.
8. FINANCIAL HIGHLIGHTS
The financial highlights are intended to help an investor understand the Feeder Funds’ financial performance. The total returns in the table represent the rate that a Limited Partner would be expected to have earned or lost on an investment in each Feeder Fund.
The ratios and total return amounts are calculated based on each Limited Partner group taken as a whole. The General Partner’s interest is excluded from the calculations. An individual Limited Partner’s ratios or returns may vary from the table below based on the timing of purchases and sales and performance allocation.
The ratios are calculated by dividing total dollars of income or expenses as applicable by the average of total monthly Limited Partners’ capital. The ratios include the Feeder Funds’ proportionate share of the Master Fund’s income and expenses.
TEN
HATTERAS FUNDS
(each a Delaware Limited Partnership)
NOTESTO FINANCIAL STATEMENTS
As of and for the year ended March 31, 2013 (continued)
8. FINANCIAL HIGHLIGHTS (CONTINUED)
Total return amounts are calculated based on the change in unit value during each accounting period.
The portfolio turnover rate is calculated based on the Master Fund’s investment activity, as turnover occurs at the Master Fund level and the Feeder Funds are typically invested 100% in the Master Fund.
| | | | | | | | | | | | | | | | |
| | | Hatteras
Core Alternatives
Fund, L.P. | | | Hatteras
Core Alternatives
TEI
Fund, L.P. | | | Hatteras
Core Alternatives
Institutional
Fund, L.P. | | | Hatteras
Core Alternatives
TEI
Institutional
Fund, L.P. | |
Unit Value, July 1, 2008* | | $ | 100.00 | | | $ | 100.00 | | | $ | 100.00 | | | $ | 100.00 | |
Income from investment operations: | | | | | | | | | | | | | | | | |
Net investment loss | | | (1.19 | ) | | | (1.22 | ) | | | (0.79 | ) | | | (0.75 | ) |
Net realized and unrealized loss on investment transactions | | | (22.52 | ) | | | (22.51 | ) | | | (22.50 | ) | | | (22.59 | ) |
Total from investment operations | | | (23.71 | ) | | | (23.73 | ) | | | (23.29 | ) | | | (23.34 | ) |
Unit Value, April 1, 2009 | | | 76.29 | | | | 76.27 | | | | 76.71 | | | | 76.66 | |
Income from investment operations: | | | | | | | | | | | | | | | | |
Net investment loss | | | (1.92 | ) | | | (1.56 | ) | | | (0.86 | ) | | | (0.61 | ) |
Net realized and unrealized gain on investment transactions | | | 13.37 | | | | 12.98 | | | | 13.06 | | | | 12.81 | |
Total from investment operations | | | 11.45 | | | | 11.42 | | | | 12.20 | | | | 12.20 | |
Unit Value, April 1, 2010 | | | 87.74 | | | | 87.69 | | | | 88.91 | | | | 88.86 | |
Income from investment operations: | | | | | | | | | | | | | | | | |
Net investment income (loss) | | | (0.44 | ) | | | (0.48 | ) | | | (0.10 | ) | | | 0.30 | |
Net realized and unrealized gain on investment transactions | | | 5.54 | | | | 5.51 | | | | 6.00 | | | | 5.53 | |
Total from investment operations | | | 5.10 | | | | 5.03 | | | | 5.90 | | | | 5.83 | |
Unit Value, April 1, 2011 | | | 92.84 | | | | 92.72 | | | | 94.81 | | | | 94.69 | |
Income from investment operations: | | | | | | | | | | | | | | | | |
Net investment income (loss) | | | (0.41 | ) | | | (0.40 | ) | | | 0.52 | | | | 0.40 | |
Net realized and unrealized loss on investment transactions | | | (2.86 | ) | | | (2.95 | ) | | | (3.14 | ) | | | (3.05 | ) |
Total from investment operations | | | (3.27 | ) | | | (3.35 | ) | | | (2.62 | ) | | | (2.65 | ) |
Unit Value, April 1, 2012 | | | 89.57 | | | | 89.37 | | | | 92.19 | | | | 92.04 | |
Income from investment operations: | | | | | | | | | | | | | | | | |
Net investment income (loss) | | | (2.26 | ) | | | (2.32 | ) | | | 0.21 | | | | 0.17 | |
Net realized and unrealized gain on investment transactions | | | 5.92 | | | | 5.83 | | | | 4.28 | | | | 4.05 | |
Total from investment operations | | | 3.66 | | | | 3.51 | | | | 4.49 | | | | 4.22 | |
Unit Value, March 31, 2013 | | $ | 93.23 | | | $ | 92.88 | | | $ | 96.68 | | | $ | 96.26 | |
| * | Unit value per unit information presented as of unitization on July 1, 2008. |
ELEVEN
HATTERAS FUNDS
(each a Delaware Limited Partnership)
NOTESTO FINANCIAL STATEMENTS
As of and for the year ended March 31, 2013 (continued)
8. FINANCIAL HIGHLIGHTS (CONTINUED)
| | | | | | | | | | | | | | | | | | | | |
| | | For the Years Ended March 31, | |
| Hatteras Core Alternatives Fund, L.P. | | 2013 | | | 2012 | | | 2011 | | | 2010 | | | 2009 | |
Total return before Performance Allocation | | | 4.09 | % | | | (3.52 | )% | | | 5.81 | % | | | 15.01 | % | | | (21.26 | )% |
Performance Allocation | | | 0.00 | % | | | 0.00 | % | | | 0.00 | % | | | 0.00 | % | | | (0.02 | )% |
Total return after Performance Allocation | | | 4.09 | % | | | (3.52 | )% | | | 5.81 | % | | | 15.01 | % | | | (21.28 | )% |
Net investment loss1 | | | (0.17 | )% | | | (0.29 | )% | | | (0.60 | )% | | | (1.90 | )% | | | (1.92 | )% |
Operating expenses, excluding Performance Allocation1,2,3 | | | 2.30 | % | | | 2.33 | % | | | 2.32 | % | | | 2.35 | % | | | 2.30 | % |
Performance Allocation1 | | | 0.00 | % | | | 0.00 | % | | | 0.00 | % | | | 0.00 | % | | | 0.02 | % |
Net expenses1 | | | 2.30 | % | | | 2.33 | % | | | 2.32 | % | | | 2.35 | % | | | 2.32 | % |
Limited Partners’ capital, end of year (000’s) | | $ | 184,954 | | | $ | 234,881 | | | $ | 248,882 | | | $ | 231,314 | | | $ | 215,165 | |
Portfolio Turnover Rate (Master Fund) | | | 25.15 | % | | | 32.68 | % | | | 25.12 | % | | | 23.12 | % | | | 22.57 | % |
| 1 | Ratios include allocations from the Master Fund. |
| 2 | Ratios calculated based on total expenses and average partner’s capital. If the expense ratio calculation had been performed monthly, as is done for expense cap calculations, the ratios would have been different. |
| 3 | For the years ended March 31, 2009-2013, the ratios of other operating expenses to average partner’s capital were 2.27%, 2.29%, 2.22%, 2.25%, and 2.22%, respectively, and the ratios of credit facility fees and interest expense to average partner’s capital allocated from the Master Fund were 0.03%, 0.06%, 0.10%, 0.08%, and 0.08%, respectively. |
TWELVE
HATTERAS FUNDS
(each a Delaware Limited Partnership)
NOTESTO FINANCIAL STATEMENTS
As of and for the year ended March 31, 2013 (continued)
8. FINANCIAL HIGHLIGHTS (CONTINUED)
| | | | | | | | | | | | | | | | | | | | |
| | | For the Years Ended March 31, | |
| Hatteras Core Alternatives TEI Fund, L.P. | | 2013 | | | 2012 | | | 2011 | | | 2010 | | | 2009 | |
Total return before Performance Allocation | | | 3.93 | % | | | (3.62 | )% | | | 5.74 | % | | | 14.97 | % | | | (21.35 | )% |
Performance Allocation | | | 0.00 | % | | | 0.00 | % | | | 0.00 | % | | | 0.00 | % | | | (0.01 | )% |
Total return after Performance Allocation | | | 3.93 | % | | | (3.62 | )% | | | 5.74 | % | | | 14.97 | % | | | (21.36 | )% |
Net investment loss1 | | | (0.25 | )% | | | (0.39 | )% | | | (0.68 | )% | | | (1.94 | )% | | | (1.99 | )% |
Operating expenses, excluding Performance Allocation1,2,3 | | | 2.38 | % | | | 2.43 | % | | | 2.39 | % | | | 2.39 | % | | | 2.45 | % |
Performance Allocation1 | | | 0.00 | % | | | 0.00 | % | | | 0.00 | % | | | 0.00 | % | | | 0.01 | % |
Net expenses1 | | | 2.38 | % | | | 2.43 | % | | | 2.39 | % | | | 2.39 | % | | | 2.46 | % |
Limited Partners’ capital, end of year (000’s) | | $ | 246,049 | | | $ | 312,204 | | | $ | 325,745 | | | $ | 300,576 | | | $ | 257,504 | |
Portfolio Turnover Rate (Master Fund) | | | 25.15 | % | | | 32.68 | % | | | 25.12 | % | | | 23.12 | % | | | 22.57 | % |
| 1 | Ratios include allocations from the Master Fund. |
| 2 | Ratios calculated based on total expenses and average partner’s capital. If the expense ratio calculation had been performed monthly, as is done for expense cap calculations, the ratios would have been different. |
| 3 | For the years ended March 31, 2009-2013, the ratios of other operating expenses to average partner’s capital were 2.22%, 2.27%, 2.20%, 2.23%, and 2.18%, respectively; the ratios of allocated credit facility fees and interest expense to average partner’s capital were 0.03%, 0.06%, 0.10%, 0.08%, and 0.08%, respectively; and the ratios of withholding tax to average partner’s capital were 0.20%, 0.06%, 0.09%, 0.12%, and 0.12%, respectively. |
THIRTEEN
HATTERAS FUNDS
(each a Delaware Limited Partnership)
NOTESTO FINANCIAL STATEMENTS
As of and for the year ended March 31, 2013 (continued)
8. FINANCIAL HIGHLIGHTS (CONTINUED)
| | | | | | | | | | | | | | | | | | | | |
| | | For the Years Ended March 31, | |
| Hatteras Core Alternatives Institutional Fund, L.P. | | 2013 | | | 2012 | | | 2011 | | | 2010 | | | 2009 | |
Total return before Performance Allocation | | | 4.87 | % | | | (2.77 | )% | | | 6.64 | % | | | 15.90 | % | | | (20.69 | )% |
Performance Allocation | | | 0.00 | % | | | 0.00 | % | | | 0.00 | % | | | 0.00 | % | | | (0.03 | )% |
Total return after Performance Allocation | | | 4.87 | % | | | (2.77 | )% | | | 6.64 | % | | | 15.90 | % | | | (20.72 | )% |
Net investment income (loss)1 | | | 0.60 | % | | | 0.50 | % | | | 0.14 | % | | | (1.12 | )% | | | (1.23 | )% |
Operating expenses, excluding Performance Allocation1,2,3 | | | 1.54 | % | | | 1.55 | % | | | 1.53 | % | | | 1.57 | % | | | 1.59 | % |
Performance Allocation1 | | | 0.00 | % | | | 0.00 | % | | | 0.00 | % | | | 0.00 | % | | | 0.03 | % |
Net expenses1 | | | 1.54 | % | | | 1.55 | % | | | 1.53 | % | | | 1.57 | % | | | 1.62 | % |
Limited Partners’ capital, end of year (000’s) | | $ | 197,612 | | | $ | 236,892 | | | $ | 238,675 | | | $ | 249,153 | | | $ | 202,898 | |
Portfolio Turnover Rate (Master Fund) | | | 25.15 | % | | | 32.68 | % | | | 25.12 | % | | | 23.12 | % | | | 22.57 | % |
| 1 | Ratios include allocations from the Master Fund. |
| 2 | Ratios calculated based on total expenses and average partner’s capital. If the expense ratio calculation had been performed monthly, as is done for expense cap calculations, the ratios would have been different. |
| 3 | For the years ended March 31, 2009-2013, the ratios of other operating expenses to average partner’s capital were 1.56%, 1.51%, 1.43%, 1.47%, and 1.46%, respectively, and the ratios of credit facility fees and interest expense to average partner’s capital allocated from the Master Fund were 0.03%, 0.06%, 0.10%, 0.08%, and 0.08%, respectively. |
FOURTEEN
HATTERAS FUNDS
(each a Delaware Limited Partnership)
NOTESTO FINANCIAL STATEMENTS
As of and for the year ended March 31, 2013 (continued)
8. FINANCIAL HIGHLIGHTS (CONTINUED)
| | | | | | | | | | | | | | | | | | | | |
| | | For the Years Ended March 31, | |
| Hatteras Core Alternatives TEI Institutional Fund, L.P. | | 2013 | | | 2012 | | | 2011 | | | 2010 | | | 2009 | |
Total return before Performance Allocation | | | 4.74 | % | | | (2.85 | )% | | | 6.61 | % | | | 15.91 | % | | | (20.79 | )% |
Performance Allocation | | | (0.16 | )% | | | 0.05 | %4 | | | (0.05 | )% | | | 0.00 | % | | | (0.05 | )% |
Total return after Performance Allocation | | | 4.58 | % | | | (2.80 | )% | | | 6.56 | % | | | 15.91 | % | | | (20.84 | )% |
Net investment income (loss)1 | | | 0.40 | % | | | 0.46 | % | | | 0.10 | % | | | (1.11 | )% | | | (1.35 | )% |
Operating expenses, excluding Performance Allocation1,2,3 | | | 1.58 | % | | | 1.62 | % | | | 1.56 | % | | | 1.55 | % | | | 1.72 | % |
Performance Allocation1 | | | 0.16 | % | | | (0.05 | )%4 | | | 0.05 | % | | | 0.00 | % | | | 0.05 | % |
Net expenses1 | | | 1.74 | % | | | 1.57 | % | | | 1.61 | % | | | 1.55 | % | | | 1.77 | % |
Limited Partners’ capital, end of year (000’s) | | $ | 531,555 | | | $ | 624,547 | | | $ | 659,549 | | | $ | 561,581 | | | $ | 384,901 | |
Portfolio Turnover Rate (Master Fund) | | | 25.15 | % | | | 32.68 | % | | | 25.12 | % | | | 23.12 | % | | | 22.57 | % |
| 1 | Ratios include allocations from the Master Fund. |
| 2 | Ratios calculated based on total expenses and average partner’s capital. If the expense ratio calculation had been performed monthly, as is done for expense cap calculations, the ratios would have been different. |
| 3 | For the years ended March 31, 2009-2013, the ratios of other operating expenses to average partner’s capital were 1.50%, 1.44%, 1.38%, 1.42%, and 1.39%, respectively; the ratios of allocated credit facility fees and interest expense to average partner’s capital were 0.03%, 0.06%, 0.10%, 0.08%, and 0.08%, respectively; and the ratios of withholding tax to average partner’s capital were 0.19%, 0.05%, 0.08%, 0.12%, and 0.11%, respectively. |
| 4 | Reverse accrued Performance Allocation from January 1, 2011 to March 31, 2011. |
FIFTEEN
HATTERAS FUNDS
(each a Delaware Limited Partnership)
NOTESTO FINANCIAL STATEMENTS
As of and for the year ended March 31, 2013 (concluded)
9. SUBSEQUENT EVENTS
Management has evaluated the events and transactions through the date the financial statements were issued and determined there were no subsequent events that required adjustment to our disclosure in the financial statements except the following: effective April 1, 2013 and May 1, 2013, there were additional purchases into the Feeder Funds of the following amounts:
| | | | |
April 1, 2013 | | | | |
Hatteras Core Alternatives Fund, L.P. | | $ | 345,000 | |
Hatteras Core Alternatives TEI Fund, L.P. | | $ | 339,000 | |
Hatteras Core Alternatives Institutional Fund, L.P. | | $ | 555,200 | |
Hatteras Core Alternatives TEI Institutional Fund, L.P. | | $ | 552,190 | |
| |
May 1, 2013 | | | | |
Hatteras Core Alternatives Fund, L.P. | | $ | 350,000 | |
Hatteras Core Alternatives TEI Fund, L.P. | | $ | 230,000 | |
Hatteras Core Alternatives Institutional Fund, L.P. | | $ | 175,000 | |
Hatteras Core Alternatives TEI Institutional Fund, L.P. | | $ | 85,000 | |
HIP recommended to the Boards that a tender offer in an amount of up to approximately 5.00% of partners’ capital of each of the Feeder Funds be made for the quarter ending June 30, 2013 to those Limited Partners who elect to tender their Units prior to the expiration of the tender offer period. The Boards approved such recommendation and Limited Partners in the Feeder Funds were notified of the tender offer’s expiration date of April 19, 2013, and submitted the following tender requests:
| | | | |
Hatteras Core Alternatives Fund, L.P. | | $ | 9,734,094 | |
Hatteras Core Alternatives TEI Fund, L.P. | | $ | 12,946,203 | |
Hatteras Core Alternatives Institutional Fund, L.P. | | $ | 10,398,854 | |
Hatteras Core Alternatives TEI Institutional Fund, L.P. | | $ | 27,977,342 | |
*************
SIXTEEN
HATTERAS FUNDS
(each a Delaware Limited Partnership)
BOARDOF DIRECTORS
(Unaudited)
The identity of the Board members (each a “Director”) and brief biographical information, as of March 31, 2013, is set forth below. The business address of each Director is care of Hatteras Funds, 8540 Colonnade Center Drive, Suite 401, Raleigh, NC 27615. The term of office of each Director is from the time of such Director’s election and qualification until his or her successor shall have been elected and shall have qualified, or until he or she is removed, resigns or is subject to various disabling events such as death or incapacity. A Director may resign upon 90 days’ prior written notice to the Board and may be removed either by a vote of a majority of the Board not subject to the removal vote or of Limited Partners holding not less than two-thirds of the total number of votes eligible to be cast by all of the Limited Partners. The Feeder Funds’ Statements of Additional Information include information about the Directors and may be obtained without charge by calling 1-888-363-2324.
| | | | | | | | |
Name & Date of Birth | | Position(s) Held
with the Feeder
Funds | | Length of
Time Served | | Principal Occupation(s)
During Past 5 Years
and Other
Directorships
Held by Director | | Number of
Portfolios in Fund
Complex1 Overseen
by Director |
INTERESTED DIRECTOR | | | | |
David B. Perkins2 July 18, 1962 | | President and Chairman of the Board of Directors | | Since Inception | | Mr. Perkins has been Chairman of the Board of Directors and President of the Funds since inception. Mr. Perkins is the Chief Executive Officer of Hatteras and its affiliated entities. He founded the firm in September 2003. Prior to that, he was the co-founder and Managing Partner of CapFinancial Partners, LLC. | | 19 |
INDEPENDENT DIRECTORS | | | | |
H. Alexander Holmes May 4, 1942 | | Director; Audit Committee Member | | Since Inception | | Mr. Holmes founded Holmes Advisory Services, LLC, a financial consultation firm, in 1993. | | 19 |
Steve E. Moss, CPA February 18, 1953 | | Director; Audit Committee Member | | Since Inception | | Mr. Moss is a principal of Holden, Moss, Knott, Clark & Copley, P.A. and has been a member manager of HMKCT Properties, LLC since January 1996. | | 19 |
| 1 | The “Fund Complex” consists of the Funds, Hatteras Global Private Equity Partners Institutional, LLC, Hatteras VC Co-Investment Fund II, LLC, Hatteras GPEP Fund II, LLC, Hatteras Alternative Mutual Funds Trust (consisting of five funds), Hatteras Variable Trust, and Underlying Funds Trust (consisting of five funds). |
| 2 | Mr. Perkins is deemed to be an “interested” Director of the Feeder Funds because of his affiliations with HIP. |
SEVENTEEN
HATTERAS FUNDS
(each a Delaware Limited Partnership)
BOARDOF DIRECTORS
(Unaudited) (continued)
| | | | | | | | |
Name & Date of Birth | | Position(s) Held
with the Feeder
Funds | | Length of
Time Served | | Principal Occupation(s)
During Past 5 Years
and Other
Directorships
Held by Director | | Number of
Portfolios in Fund
Complex1 Overseen
by Director |
INDEPENDENT DIRECTORS (CONTINUED) | | | | |
Gregory S. Sellers May 5, 1959 | | Director; Audit Committee Member | | Since Inception | | Mr. Sellers has been the Chief Financial Officer of Imagemark Business Services, Inc., a strategic communications provider of marketing and print communications solutions, since June 2009. From 2003 to June 2009, Mr. Sellers was the Chief Financial Officer and a director of Kings Plush, Inc., a fabric manufacturer. | | 19 |
Daniel K. Wilson June 22, 1948 | | Director; Audit Committee Member | | Since 2009 | | Mr. Wilson was Executive Vice President and Chief Financial Officer of Parksdale Mills, Inc. from 2004 - 2008. Mr. Wilson currently is in private practice as a Certified Public Accountant. | | 19 |
Joseph E. Breslin3 November 18, 1953 | | Director | | Since 2013 | | Mr. Breslin is currently a private investor. Mr Breslin has been a Director of Kinetics Mutual Funds, Inc. (mutual fund) from 2000 to Present (8 portfolios); Trustee, Kinetics Portfolios Trust (mutual fund) from 2000 to Present (8 portfolios). From 2007 to 2009, Mr. Breslin was the Chief Operating Officer of Central Park Credit Holdings, Inc. and prior to that, was the Chief Operating Officer of Aladdin Capital Management LLC, beginning in 2005. | | 19 |
| 1 | The “Fund Complex” consists of the Funds, Hatteras Global Private Equity Partners Institutional, LLC, Hatteras VC Co-Investment Fund II, LLC, Hatteras GPEP Fund II, LLC, Hatteras Alternative Mutual Funds Trust (consisting of five funds), Hatteras Variable Trust, and Underlying Funds Trust (consisting of five funds). |
| 3 | Mr. Breslin and Mr. Mann became Directors effective March 28, 2013. Mr Breslin and Mr. Mann previously served as members of an Advisory Board to each Fund (a body that provided advisory support for the Board without voting authority). Mr. Breslin and Mr. Mann were recommended and approved for appointment to the Advisory Board by the Independent Directors at the quarterly meeting of each Board held on November 30, 2012. |
EIGHTEEN
HATTERAS FUNDS
(each a Delaware Limited Partnership)
BOARDOF DIRECTORS
(Unaudited) (concluded)
| | | | | | | | |
Name & Date of Birth | | Position(s) Held
with the Feeder
Funds | | Length of
Time Served | | Principal Occupation(s)
During Past 5 Years
and Other
Directorships
Held by Director | | Number of
Portfolios in Fund
Complex1 Overseen
by Director |
INDEPENDENT DIRECTORS (CONTINUED) | | | | |
Thomas Mann3 February 1, 1950 | | Director | | Since 2013 | | Mr. Mann is currently a private investor. From 2003 until 2012, Mr. Mann was the Managing Director and Group Head Financial Institutions Group, Société Générale, Sales of Capital Market Solutions and Products. Mr. Mann is also a Director of Virtus Global Multi-Sector Income Fund since 2011, Virtus Total Return Fund since 2012, and F-Squared Investments, Inc. since January 2012. | | 19 |
| 1 | The “Fund Complex” consists of the Funds, Hatteras Global Private Equity Partners Institutional, LLC, Hatteras VC Co-Investment Fund II, LLC, Hatteras GPEP Fund II, LLC, Hatteras Alternative Mutual Funds Trust (consisting of five funds), Hatteras Variable Trust, and Underlying Funds Trust (consisting of five funds). |
| 3 | Mr. Breslin and Mr. Mann became Directors effective March 28, 2013. Mr Breslin and Mr. Mann previously served as members of an Advisory Board to each Fund (a body that provided advisory support for the Board without voting authority). Mr. Breslin and Mr. Mann were recommended and approved for appointment to the Advisory Board by the Independent Directors at the quarterly meeting of each Board held on November 30, 2012. |
NINETEEN
HATTERAS FUNDS
(each a Delaware Limited Partnership)
FUND MANAGEMENT
(Unaudited)
Set forth below is the name, date of birth, position with each Feeder Fund, length of term of office, and the principal occupation for the last five years, as of March 31, 2013, of each of the persons currently serving as Executive Officers of the Feeder Funds. The business address of each officer is care of Hatteras Funds, 8540 Colonnade Center Drive, Suite 401, Raleigh, NC 27615.
| | | | | | | | |
Name & Date of Birth | | Position(s) Held
with the Feeder
Funds | | Length of
Time Served | | Principal Occupation(s)
During Past 5 Years
and Other
Directorships
Held by Officer | | Number of
Portfolios in Fund
Complex1 Overseen
by Officer |
OFFICERS | | | | | | | | |
J. Michael Fields, July 14, 1973 | | Secretary of each Fund in the Fund Complex | | Since 2008 | | Prior to becoming Secretary of each of the Funds in the Fund Complex, Mr. Fields was the Treasurer of each of the Funds in the Fund Complex. Mr. Fields is Chief Operating Officer of HIP and its affiliates and has been employed by the Hatteras firm since its inception in September 2003. | | N/A |
Andrew P. Chica September 7, 1975 | | Chief Compliance Officer of each Fund in the Fund Complex | | Since 2008 | | Mr. Chica joined Hatteras in November 2007 and became Chief Compliance Officer of each of the Funds in the Fund Complex and HIP as of January 2008. | | N/A |
Robert Lance Baker September 17, 1971 | | Treasurer of each Fund in the Fund Complex | | Since 2008 | | Mr. Baker joined Hatteras in March 2008 and became Treasurer of each of the Funds in the Fund Complex in December 2008. Mr. Baker serves as the Chief Financial Officer of HIP and its affiliates. | | N/A |
| 1 | The “Fund Complex” consists of the Funds, Hatteras Global Private Equity Partners Institutional, LLC, Hatteras VC Co-Investment Fund II, LLC, Hatteras GPEP Fund II, LLC, Hatteras Alternative Mutual Funds Trust (consisting of five funds), Hatteras Variable Trust, and Underlying Funds Trust (consisting of five funds). |
TWENTY
HATTERAS FUNDS
(each a Delaware Limited Partnership)
OTHER INFORMATION
(Unaudited)
2013 PROXY RESULTS
A Special Meeting of the Limited Partners was held on February 20, 2013, as reconvened on March 7, 2013 and March 28, 2013, to consider the proposals described below. Each proposal was approved. The results of the voting at the Special Meeting are as follows:
1.A. Approval of the Investment Co-Management Agreement between the Master Fund and HIP.
Hatteras Core Alternatives Fund, L.P.
| | | | | | | | | | | | |
| | | No. of Shares | | | % of
Outstanding
Shares | | | % of Shares
Voted | |
Affirmative | | | 1,003,868 | | | | 48.35 | % | | | 95.72 | % |
Against | | | 16,670 | | | | 0.80 | % | | | 1.59 | % |
Abstain | | | 28,176 | | | | 1.36 | % | | | 2.69 | % |
Total | | | 1,048,714 | | | | 50.51 | % | | | 100.00 | % |
Hatteras Core Alternatives TEI Fund, L.P.
| | | | | | | | | | | | |
| | | No. of Shares | | | % of
Outstanding
Shares | | | % of Shares
Voted | |
Affirmative | | | 1,404,311 | | | | 50.46 | % | | | 95.75 | % |
Against | | | 28,095 | | | | 1.01 | % | | | 1.92 | % |
Abstain | | | 34,298 | | | | 1.23 | % | | | 2.33 | % |
Total | | | 1,466,704 | | | | 52.70 | % | | | 100.00 | % |
Hatteras Core Alternatives Institutional Fund, L.P.
| | | | | | | | | | | | |
| | | No. of Shares | | | % of
Outstanding
Shares | | | % of Shares
Voted | |
Affirmative | | | 1,056,413 | | | | 49.38 | % | | | 97.62 | % |
Against | | | 8,411 | | | | 0.39 | % | | | 0.78 | % |
Abstain | | | 17,268 | | | | 0.81 | % | | | 1.60 | % |
Total | | | 1,082,092 | | | | 50.58 | % | | | 100.00 | % |
Hatteras Core Alternatives TEI Institutional Fund, L.P.
| | | | | | | | | | | | |
| | | No. of Shares | | | % of
Outstanding
Shares | | | % of Shares
Voted | |
Affirmative | | | 3,205,629 | | | | 55.17 | % | | | 99.17 | % |
Against | | | 8,825 | | | | 0.15 | % | | | 0.27 | % |
Abstain | | | 17,909 | | | | 0.31 | % | | | 0.56 | % |
Total | | | 3,232,363 | | | | 55.63 | % | | | 100.00 | % |
TWENTY-ONE
HATTERAS FUNDS
(each a Delaware Limited Partnership)
OTHER INFORMATION
(Unaudited) (continued)
1.B. Approval of the Investment Co-Management Agreement among the Master Fund, HIP and MCCM and the ratifications, on behalf of each Feeder Fund, of distributions made by HIP and the General Partner of the Master Fund, to MCCM.
Hatteras Core Alternatives Fund, L.P.
| | | | | | | | | | | | |
| | | No. of Shares | | | % of
Outstanding
Shares | | | % of Shares
Voted | |
Affirmative | | | 989,728 | | | | 47.67 | % | | | 94.38 | % |
Against | | | 29,742 | | | | 1.43 | % | | | 2.83 | % |
Abstain | | | 29,244 | | | | 1.41 | % | | | 2.79 | % |
Total | | | 1,048,714 | | | | 50.51 | % | | | 100.00 | % |
Hatteras Core Alternatives TEI Fund, L.P.
| | | | | | | | | | | | |
| | | No. of Shares | | | % of
Outstanding
Shares | | | % of Shares
Voted | |
Affirmative | | | 1,401,905 | | | | 50.37 | % | | | 95.58 | % |
Against | | | 30,501 | | | | 1.10 | % | | | 2.08 | % |
Abstain | | | 34,298 | | | | 1.23 | % | | | 2.34 | % |
Total | | | 1,466,704 | | | | 52.70 | % | | | 100.00 | % |
Hatteras Core Alternatives Institutional Fund, L.P.
| | | | | | | | | | | | |
| | | No. of Shares | | | % of
Outstanding
Shares | | | % of Shares
Voted | |
Affirmative | | | 1,056,413 | | | | 49.38 | % | | | 97.62 | % |
Against | | | 8,411 | | | | 0.39 | % | | | 0.78 | % |
Abstain | | | 17,268 | | | | 0.81 | % | | | 1.60 | % |
Total | | | 1,082,092 | | | | 50.58 | % | | | 100.00 | % |
Hatteras Core Alternatives TEI Institutional Fund, L.P.
| | | | | | | | | | | | |
| | | No. of Shares | | | % of
Outstanding
Shares | | | % of Shares
Voted | |
Affirmative | | | 3,186,562 | | | | 54.85 | % | | | 98.58 | % |
Against | | | 14,780 | | | | 0.25 | % | | | 0.46 | % |
Abstain | | | 31,021 | | | | 0.53 | % | | | 0.96 | % |
Total | | | 3,232,363 | | | | 55.63 | % | | | 100.00 | % |
TWENTY-TWO
HATTERAS FUNDS
(each a Delaware Limited Partnership)
OTHER INFORMATION
(Unaudited) (continued)
2. Approval of the election of seven nominees to the Board of Directors of each Feeder Fund.
Hatteras Core Alternatives Fund, L.P.
| | | | | | | | | | | | |
| Directors | | Votes For | | | Votes Against | | | Votes Withheld | |
David B. Perkins | | | 97.51 | % | | | None | | | | 2.49 | % |
H. Alexander Holmes | | | 97.64 | % | | | None | | | | 2.36 | % |
Steve E. Moss | | | 97.81 | % | | | None | | | | 2.19 | % |
Gregory S. Sellers | | | 97.81 | % | | | None | | | | 2.19 | % |
Daniel K. Wilson | | | 97.81 | % | | | None | | | | 2.19 | % |
Joseph E. Breslin | | | 97.58 | % | | | None | | | | 2.42 | % |
Thomas Mann | | | 97.58 | % | | | None | | | | 2.42 | % |
Hatteras Core Alternatives TEI Fund, L.P.
| | | | | | | | | | | | |
| Directors | | Votes For | | | Votes Against | | | Votes Withheld | |
David B. Perkins | | | 96.50 | % | | | None | | | | 3.50 | % |
H. Alexander Holmes | | | 96.47 | % | | | None | | | | 3.53 | % |
Steve E. Moss | | | 96.54 | % | | | None | | | | 3.46 | % |
Gregory S. Sellers | | | 96.48 | % | | | None | | | | 3.52 | % |
Daniel K. Wilson | | | 96.41 | % | | | None | | | | 3.59 | % |
Joseph E. Breslin | | | 96.48 | % | | | None | | | | 3.52 | % |
Thomas Mann | | | 96.39 | % | | | None | | | | 3.61 | % |
Hatteras Core Alternatives Institutional Fund, L.P.
| | | | | | | | | | | | |
| Directors | | Votes For | | | Votes Against | | | Votes Withheld | |
David B. Perkins | | | 98.41 | % | | | None | | | | 1.59 | % |
H. Alexander Holmes | | | 98.41 | % | | | None | | | | 1.59 | % |
Steve E. Moss | | | 98.41 | % | | | None | | | | 1.59 | % |
Gregory S. Sellers | | | 98.41 | % | | | None | | | | 1.59 | % |
Daniel K. Wilson | | | 98.41 | % | | | None | | | | 1.59 | % |
Joseph E. Breslin | | | 98.41 | % | | | None | | | | 1.59 | % |
Thomas Mann | | | 98.41 | % | | | None | | | | 1.59 | % |
Hatteras Core Alternatives TEI Institutional Fund, L.P.
| | | | | | | | | | | | |
| Directors | | Votes For | | | Votes Against | | | Votes Withheld | |
David B. Perkins | | | 99.28 | % | | | None | | | | 0.72 | % |
H. Alexander Holmes | | | 99.32 | % | | | None | | | | 0.68 | % |
Steve E. Moss | | | 99.32 | % | | | None | | | | 0.68 | % |
Gregory S. Sellers | | | 99.32 | % | | | None | | | | 0.68 | % |
Daniel K. Wilson | | | 99.32 | % | | | None | | | | 0.68 | % |
Joseph E. Breslin | | | 99.32 | % | | | None | | | | 0.68 | % |
Thomas Mann | | | 99.32 | % | | | None | | | | 0.68 | % |
TWENTY-THREE
HATTERAS FUNDS
(each a Delaware Limited Partnership)
OTHER INFORMATION
(Unaudited) (concluded)
PROXY VOTING
For free information regarding how the Master Fund voted proxies during the period ended June 30, 2012 or to obtain a free copy of the Master Fund’s complete proxy voting policies and procedures, call 1-800-504-9070 or visit the SEC’s website at http://www.sec.gov
AVAILABILITYOF QUARTERLY PORTFOLIO SCHEDULES
The Feeder Funds file their complete schedule of portfolio holdings, which includes securities held by the Master Fund, with the SEC for the first and third quarters of each fiscal year on Form N-Q. The Feeder Funds’ Form N-Q is available, without charge and upon request, on the SEC’s website at http://www.sec.gov or may be reviewed and copied at the SEC’s Public Reference Room in Washington, DC. Information on the Public Reference Room may be obtained by calling 1-800-SEC-0330.
TWENTY-FOUR
HATTERAS MASTER FUND, L.P.
(a Delaware Limited Partnership)
Financial Statements
As of and for the year ended March 31, 2013
with report of Independent Registered Public Accounting Firm
HATTERAS MASTER FUND, L.P.
(a Delaware Limited Partnership)
As of and for the year ended March 31, 2013
Table of Contents
REPORT OF INDEPENDENT REGISTERED PUBLIC ACCOUNTING FIRM
To the Board of Directors and Partners of Hatteras Master Fund, L.P.:
We have audited the accompanying statement of assets, liabilities, and partners’ capital of Hatteras Master Fund, L.P. (a Delaware Limited Partnership) (the “ Master Fund”), including the schedule of investments, as of March 31, 2013, and the related statements of operations and cash flows for the year then ended, and the statements of changes in partners’ capital for each of the two years in the period then ended. These financial statements are the responsibility of the Master Fund’s management. Our responsibility is to express an opinion on these financial statements based on our audits.
We conducted our audits in accordance with the standards of the Public Company Accounting Oversight Board (United States). Those standards require that we plan and perform the audit to obtain reasonable assurance about whether the financial statements are free of material misstatement. The Master Fund is not required to have, nor were we engaged to perform, an audit of its internal control over financial reporting. Our audits included consideration of internal control over financial reporting as a basis for designing audit procedures that are appropriate in the circumstances, but not for the purpose of expressing an opinion on the effectiveness of the Master Fund’s internal control over financial reporting. Accordingly, we express no such opinion. An audit also includes examining, on a test basis, evidence supporting the amounts and disclosures in the financial statements, assessing the accounting principles used and significant estimates made by management, as well as evaluating the overall financial statement presentation. Our procedures included confirmation of investments owned as of March 31, 2013, by correspondence with underlying fund advisers and custodians. We believe that our audits provide a reasonable basis for our opinion.
In our opinion, such financial statements referred to above present fairly, in all material respects, the financial position of Hatteras Master Fund, L.P. as of March 31, 2013, the results of its operations and its cash flows for the year then ended, the changes in its partners’ capital for each of the two years in the period then ended, in conformity with accounting principles generally accepted in the United States of America.
As discussed in Note 2 to the financial statements, the financial statements include investments valued at $1,110,504,519 (88.96% of total assets) as of March 31, 2013, whose fair value have been estimated by management in the absence of readily determinable fair values. Management’s estimates are based on information provided by the underlying fund advisers.
DELOITTE & TOUCHE LLP
Philadelphia, Pennsylvania
May 30, 2013
ONE
HATTERAS MASTER FUND, L.P.
(a Delaware Limited Partnership)
SCHEDULEOF INVESTMENTS
March 31, 2013
INVESTMENT OBJECTIVE AS A PERCENTAGE OF TOTAL PARTNERS’ CAPITAL
Percentages are as follows:
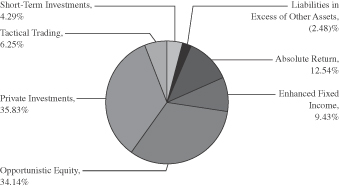
| | | | | | | | | | | | |
| Investments in Adviser Funds and Securities — (102.48%) | | Shares | | | Cost | | | Fair Value | |
Absolute Return — (12.54%) | | | | | | | | | | | | |
Broad Peak Fund, L.P.b,d | | | | | | $ | 290,930 | | | $ | 132,623 | |
Citadel Wellington, LLC (Class A)a,b,c | | | | | | | 20,078,256 | | | | 32,002,386 | |
D.E. Shaw Composite Fund, LLCb | | | | | | | 13,600,721 | | | | 20,280,783 | |
Dorsal Capital Partners, L.P.a,b | | | | | | | 20,000,000 | | | | 20,419,234 | |
Eton Park Fund, L.P.a,b | | | | | | | 9,957,960 | | | | 11,226,442 | |
Marathon Fund, L.P.a,b,d | | | | | | | 4,247,988 | | | | 1,548,922 | |
Millennium USA, L.P.a,b | | | | | | | 25,000,000 | | | | 26,734,845 | |
Montrica Global Opportunities Fund, L.P.a,b,d | | | | | | | 103,661 | | | | 47,733 | |
OZ Asia, Domestic Partners, L.P.a,b,d | | | | | | | 895,851 | | | | 974,430 | |
Perry Partners, L.P.a,b,d | | | | | | | 523,609 | | | | 719,760 | |
Pipe Equity Partnersa,b,d | | | | | | | 10,780,394 | | | | 4,244,576 | |
Pipe Select Fund, LLCa,b,d | | | | | | | 5,448,179 | | | | 6,215,616 | |
Standard Investment Research Hedge Equity Fund, L.P.a,b,c | | | | | | | 18,040,323 | | | | 21,983,308 | |
Stark Investments, L.P.a,b,d | | | | | | | 1,120,860 | | | | 1,167,659 | |
Stark Select Asset Fund, LLCa,b,d | | | | | | | 414,430 | | | | 416,221 | |
Total Absolute Return | | | | | | | 130,503,162 | | | | 148,114,538 | |
| | | |
| Enhanced Fixed Income — (9.43%) | | | | | | | | | |
BDCM Partners I, L.P.a,b,d | | | | | | | 16,753,241 | | | | 16,485,431 | |
Bell Point Credit Opportunities Fund, L.P.a,b | | | | | | | 4,131,196 | | | | 4,983,409 | |
Contrarian Capital Fund I, L.P.a,b | | | | | | | 7,219,629 | | | | 12,392,214 | |
CPIM Structured Credit Fund 1000, L.P.a,b,d | | | | | | | 104,860 | | | | 19,515 | |
Drawbridge Special Opportunities Fund, L.P.a,b,d | | | | | | | 1,325,234 | | | | 1,707,821 | |
Fortress VRF Advisors I, LLCa,b,d | | | | | | | 8,092,619 | | | | 919,758 | |
Halcyon European Structured Opportunities Fund, L.P.a,b,d | | | | | | | 103,648 | | | | 43,411 | |
Harbinger Capital Partners Fund I, L.P.a,b,d | | | | | | | 4,753,912 | | | | 1,582,684 | |
Harbinger Class L Holdings (U.S.), LLCa,b,d | | | | | | | 92,617 | | | | 65,463 | |
Harbinger Class LS Holdings I (U.S.) Trust, Series 1a,b,d | | | 7,035 | | | | 6,502,119 | | | | 1,674,501 | |
Harbinger Class PE Holdings (U.S.) Trust, Series 1a,b,d | | | 3 | | | | 980,839 | | | | 531,440 | |
| | | |
| See notes to financial statements. | | | | | | | | | | | | |
TWO
HATTERAS MASTER FUND, L.P.
(a Delaware Limited Partnership)
SCHEDULEOF INVESTMENTS
March 31, 2013 (continued)
| | | | | | | | | | |
| Enhanced Fixed Income — (9.43%) (continued) | | | | Cost | | | Fair Value | |
Harbinger Credit Distressed Blue Line Fund, L.P.a,b,c,d | | | | $ | 12,326,927 | | | $ | 10,747,926 | |
Indaba Capital Partner, L.P.a,b | | | | | 10,000,000 | | | | 13,409,871 | |
Marathon Special Opportunities Fund, L.P.b,d | | | | | 1,256,461 | | | | 1,228,609 | |
Morgan Rio Capital Fund, L.P.a,b | | | | | 7,000,000 | | | | 10,326,475 | |
Prospect Harbor Credit Partners, L.P.a,b,d | | | | | 666,164 | | | | 944,195 | |
Providence MBS Fund, L.P.a,b | | | | | 18,750,000 | | | | 28,361,189 | |
Senator Global Opportunity Fund, L.P.a,b,c | | | | | 4,136,327 | | | | 5,840,109 | |
Strategic Value Restructuring Fund, L.P.a,b,d | | | | | 79,933 | | | | 86,051 | |
Total Enhanced Fixed Income | | | | | 104,275,726 | | | | 111,350,072 | |
| | | |
Opportunistic Equity — (34.14%) | | | | | | | | | | |
Artis Partners 2X (Institutional), L.P.a,b,c,d | | | | | 2,436,125 | | | | 784,308 | |
Ashoka Fund, L.P.a,b | | | | | 29,000,000 | | | | 28,375,753 | |
Balyasny Atlas Leveraged Fund, L.P.a,b | | | | | 19,457,378 | | | | 20,251,386 | |
Bay Pond Partners, L.P.a,b | | | | | 25,000,000 | | | | 30,081,649 | |
Broadfin Healthcare Fund, L.P.a,b,c | | | | | 22,000,000 | | | | 26,666,226 | |
Camcap Resources, L.P.a,b,d | | | | | 491,057 | | | | 486,135 | |
Crosslink Crossover Fund IV, L.P.a,b,d | | | | | 1,633,805 | | | | 4,281,887 | |
Crosslink Crossover Fund V, L.P.a,b,d | | | | | 734,153 | | | | 3,177,387 | |
Crosslink Crossover Fund VI, L.P.a,b,d | | | | | 8,515,359 | | | | 8,445,646 | |
Empire Capital Partners Enhanced, L.P.a,b | | | | | 25,000,000 | | | | 22,623,192 | |
Falcon Edge Global, L.P.a,b,c | | | | | 25,000,000 | | | | 25,714,751 | |
Gavea Investment Fund II, L.P.a,b,d | | | | | 48,211 | | | | 630,948 | |
Gavea Investment Fund III, L.P.a,b,d | | | | | 12,480,000 | | | | 25,285,581 | |
Glade Brook Global Domestic Fund, L.P.a,b,c | | | | | 25,000,000 | | | | 27,788,938 | |
Gracie Capital, L.P.a,b,d | | | | | 68,232 | | | | 26,464 | |
HFR HE Bristol Master Trusta,b | | | | | 19,000,000 | | | | 9,722,695 | |
Hound Partners, L.P.a,b,c | | | | | 24,000,000 | | | | 29,884,685 | |
Integral Capital Partners VII, L.P.a,b,d | | | | | 914,048 | | | | 1,320,503 | |
Integral Capital Partners VIII, L.P.a,b,d | | | | | 2,490,153 | | | | 1,998,522 | |
J.C. Flowers III Co-Invest BTG, L.P.b | | | | | 257,781 | | | | 526,630 | |
Samlyn Equity, L.P.a,b,c,d | | | | | 1,154,713 | | | | 978,392 | |
Sansar Capital Master Fund, L.P. and Subsidiariesa,b,d | | | | | 162,832 | | | | 150,916 | |
The Raptor Private Holdings, L.P.a,b,d | | | | | 320,173 | | | | 255,337 | |
The Russian Prosperity Funda,b | | | | | 10,000,000 | | | | 10,853,847 | |
Tybourne Equity (US) Funda,b,c | | | | | 25,000,000 | | | | 27,242,854 | |
Valiant Capital Partners, L.P.b,c | | | | | 12,638,556 | | | | 20,339,270 | |
Value Partners Hedge Fund, LLCa,b | | | | | 28,000,000 | | | | 27,278,752 | |
Viking Global Equities, L.P.a,b,c | | | | | 17,166,317 | | | | 24,308,113 | |
Visium Balanced Fund, L.P.a,b,c | | | | | 15,149,117 | | | | 21,009,801 | |
WCP Real Estate Strategies Fund, L.P.a,b,d | | | | | 4,470,744 | | | | 2,568,398 | |
Total Opportunistic Equity | | | | | 357,588,754 | | | | 403,058,966 | |
| | | |
| See notes to financial statements. | | | | | | | | | | |
THREE
HATTERAS MASTER FUND, L.P.
(a Delaware Limited Partnership)
SCHEDULEOF INVESTMENTS
March 31, 2013 (continued)
| | | | | | | | | | |
| Private Investments — (35.83%) | | | | Cost | | | Fair Value | |
Investments in Adviser Funds | | | | | | | | | | |
ABRY Advanced Securities Fund, L.P.b | | | | $ | 3,487,629 | | | $ | 5,214,702 | |
ABRY Partners VI, L.P.b | | | | | 4,241,092 | | | | 5,064,127 | |
ABRY Partners VII, L.P.a,b | | | | | 2,548,666 | | | | 2,663,306 | |
Accel-KKR Capital Partners III, L.P.b | | | �� | | 5,733,322 | | | | 4,951,008 | |
Arclight Energy Partners Fund III, L.P.b | | | | | 2,516,542 | | | | 2,438,466 | |
Arclight Energy Partners Fund IV, L.P.b | | | | | 2,202,356 | | | | 1,493,897 | |
Arclight Energy Partners Fund V, L.P.b | | | | | 1,657,162 | | | | 1,422,130 | |
Arminius Moat, L.P.a,b | | | | | 5,615,015 | | | | 3,052,755 | |
Ascendent Capital Partners I, L.P.b | | | | | 745,470 | | | | 669,334 | |
BDCM Opportunity Fund II, L.P.b | | | | | 4,245,698 | | | | 6,979,665 | |
Benson Elliot Real Estate Partners II, L.P.a,b | | | | | 5,121,388 | | | | 2,461,930 | |
Cadent Energy Partners II, L.P.b | | | | | 6,217,961 | | | | 7,914,279 | |
Canaan Natural Gas Fund X, L.P.b | | | | | 4,523,750 | | | | 1,831,512 | |
CDH Venture Partners II, L.P.b | | | | | 4,013,636 | | | | 3,868,743 | |
CDH Venture Partners IV, L.P.b | | | | | 5,484,089 | | | | 5,437,875 | |
China Special Opportunities Fund III, L.P.a,b | | | | | 3,502,925 | | | | 3,605,687 | |
Claremont Creek Ventures, L.P.a,b | | | | | 1,755,416 | | | | 868,111 | |
Claremont Creek Ventures II, L.P.a,b | | | | | 2,410,625 | | | | 2,960,763 | |
Colony Investors VII, L.P.a,b | | | | | 3,045,480 | | | | 780,700 | |
Colony Investors VIII, L.P.b | | | | | 8,124,892 | | | | 2,641,000 | |
CX Partners Fund Limitedb | | | | | 4,815,797 | | | | 3,796,665 | |
Dace Ventures I, L.P.b | | | | | 2,168,453 | | | | 1,624,488 | |
Darwin Private Equity I, L.P.b | | | | | 4,877,172 | | | | 3,703,409 | |
EMG Investments, LLCb | | | | | 1,476,134 | | | | 2,637,118 | |
EnerVest Energy Institutional Fund X-A, L.P.b | | | | | 2,178,934 | | | | 2,207,091 | |
EnerVest Energy Institutional Fund XI-A, L.P.b | | | | | 6,998,031 | | | | 16,598,308 | |
Fairhaven Capital Partners, L.P.a,b | | | | | 3,971,070 | | | | 3,274,175 | |
Florida Real Estate Value Fund, L.P.b | | | | | 4,227,793 | | | | 4,841,639 | |
Forum European Realty Income III, L.P.a,b | | | | | 6,017,149 | | | | 5,239,351 | |
Garrison Opportunity Fund, LLCa,b | | | | | 5,133,335 | | | | 8,712,966 | |
Garrison Opportunity Fund II A, LLCa,b | | | | | 3,786,425 | | | | 4,525,911 | |
Glade Brook Private Investors, LLCa,b | | | | | 1,500,000 | | | | 1,483,736 | |
Great Point Partners I, L.P.b | | | | | 2,511,935 | | | | 3,673,075 | |
Greenfield Acquisition Partners V, L.P.b | | | | | 6,898,420 | | | | 7,031,729 | |
GTIS Brazil Real Estate Fund, L.P.a,b | | | | | 7,371,948 | | | | 10,491,845 | |
Halifax Capital Partners II, L.P.b | | | | | 2,111,161 | | | | 2,773,907 | |
Halifax Capital Partners III, L.P.b | | | | | 511,476 | | | | 355,762 | |
Hancock Park Capital III, L.P.a,b | | | | | 1,940,643 | | | | 3,872,372 | |
Healthcor Partners Fund, L.P.a,b,c | | | | | 3,600,922 | | | | 4,014,146 | |
Hillcrest Fund, L.P.a,b | | | | | 6,095,566 | | | | 4,858,426 | |
Intervale Capital Fund, L.P.b | | | | | 3,955,739 | | | | 4,929,502 | |
J.C. Flowers III, L.P.b | | | | | 3,214,861 | | | | 3,690,898 | |
LC Fund V, L.P.a,b | | | | | 2,190,084 | | | | 2,271,180 | |
Lighthouse Capital Partners VI, L.P.b | | | | | 4,415,000 | | | | 4,809,610 | |
Merit Energy Partners F-II, L.P.b | | | | | 1,156,832 | | | | 801,827 | |
Mid Europa Fund III, L.P.a,b | | | | | 5,078,526 | | | | 4,768,792 | |
Midstream & Resources Follow-On Fund, L.P.b | | | | | 2,257,676 | | | | 7,324,873 | |
| | | |
| See notes to financial statements. | | | | | | | | | | |
FOUR
HATTERAS MASTER FUND, L.P.
(a Delaware Limited Partnership)
SCHEDULEOF INVESTMENTS
March 31, 2013 (continued)
| | | | | | | | | | |
| Private Investments — (35.83%) (continued) | | | | Cost | | | Fair Value | |
Investments in Adviser Funds (continued) | | | | | | | | | | |
Monomoy Capital Partners II, L.P.a,b | | | | $ | 727,441 | | | $ | 1,248,163 | |
Natural Gas Partners VIII, L.P.a,b | | | | | 3,843,130 | | | | 4,942,133 | |
Natural Gas Partners IX, L.P.b | | | | | 7,820,262 | | | | 9,759,678 | |
Natural Gas Partners X, L.P.a,b | | | | | 785,241 | | | | 811,117 | |
New Horizon Capital III, L.P.b | | | | | 6,854,902 | | | | 8,022,596 | |
NGP Energy Technology Partners, L.P.b | | | | | 831,010 | | | | 259,233 | |
NGP Energy Technology Partners II, L.P.b | | | | | 3,027,003 | | | | 2,794,287 | |
NGP Midstream & Resources, L.P.b | | | | | 4,744,198 | | | | 6,076,995 | |
Northstar Equity Partners III Limiteda,b | | | | | 2,292,156 | | | | 2,073,948 | |
Northwood Real Estate Co-Investors, L.P.b | | | | | 1,732,623 | | | | 2,285,740 | |
Northwood Real Estate Partners, L.P.b | | | | | 4,066,938 | | | | 5,023,139 | |
OCM European Principal Opportunities Fund, L.P.a,b | | | | | 2,467,677 | | | | 4,726,827 | |
OCM Mezzanine Fund II, L.P.a,b | | | | | 472,661 | | | | 1,432,807 | |
ORBIS Real Estate Fund I, L.P.a,b | | | | | 3,211,080 | | | | 1,920,023 | |
Orchid Asia IV, L.P.b | | | | | 4,588,401 | | | | 5,762,137 | |
Parmenter Realty Fund IV, L.P.b | | | | | 2,164,651 | | | | 2,247,817 | |
Patron Capital III, L.P.b | | | | | 4,616,542 | | | | 4,282,301 | |
Pearlmark Mezzanine Realty Partners III, LLCb | | | | | 7,032,922 | | | | 5,786,381 | |
Pennybacker II, L.P.b | | | | | 2,104,474 | | | | 1,946,218 | |
Phoenix Real Estate Fund PTE Limitedb | | | | | 4,820,092 | | | | 5,889,155 | |
Phoenix Real Estate Fund (T), L.P.a,b | | | | | 5,097,647 | | | | 4,289,058 | |
Pine Brook Capital Partners, L.P.b | | | | | 7,056,144 | | | | 7,319,833 | |
Private Equity Investment Fund V, L.P.b | | | | | 10,662,529 | | | | 11,842,648 | |
Private Equity Investors Fund IV, L.P.b | | | | | 2,607,770 | | | | 2,183,663 | |
Quantum Energy Partners IV, L.P.b | | | | | 5,064,034 | | | | 5,174,673 | |
Quantum Energy Partners V, L.P.a,b | | | | | 9,128,727 | | | | 5,187,763 | |
Rockwood Capital Real Estate Partners Fund VII, L.P.b | | | | | 4,973,265 | | | | 2,564,808 | |
Roundtable Healthcare Management III, L.P.a,b | | | | | 1,823,634 | | | | 1,612,867 | |
Roundtable Healthcare Partners II, L.P.b | | | | | 1,644,302 | | | | 2,222,120 | |
Saints Capital VI, L.P.b | | | | | 8,403,253 | | | | 9,683,217 | |
Sanderling Venture Partners VI Co-Investment Fund, L.P.b | | | | | 675,208 | | | | 837,211 | |
Sanderling Venture Partners VI, L.P.a,b | | | | | 880,040 | | | | 1,309,049 | |
SBC Latin America Housing US Fund, L.P.b | | | | | 2,374,906 | | | | 2,337,947 | |
Sentient Global Resources Fund III, L.P.b | | | | | 12,159,594 | | | | 13,540,463 | |
Sentient Global Resources Fund IV, L.P.b | | | | | 2,618,042 | | | | 2,491,380 | |
Singerman Real Estate Opportunity Fund I, L.P.a,b | | | | | 559,096 | | | | 504,877 | |
Sovereign Capital III, L.P.a,b | | | | | 2,793,132 | | | | 2,818,272 | |
Square Mile Lodging Opportunity Partners, L.P.b | | | | | 1,198,855 | | | | 1,348,629 | |
Square Mile Partners III, L.P.b | | | | | 6,189,580 | | | | 6,850,359 | |
Sterling Capital Partners II, L.P.b | | | | | 1,685,746 | | | | 1,969,937 | |
Sterling Group Partners III, L.P.a,b | | | | | 2,901,278 | | | | 3,841,178 | |
Strategic Value Global Opportunities Fund I-A, L.P.b | | | | | 3,098,332 | | | | 1,741,387 | |
Tenaya Capital V, L.P.b | | | | | 3,251,997 | | | | 3,793,630 | |
The Column Group, L.P.a,b | | | | | 3,805,629 | | | | 3,790,132 | |
The Energy and Minerals Group Fund II, L.P.b | | | | | 2,314,997 | | | | 2,611,182 | |
The Founders Fund III, L.P.a,b | | | | | 4,750,000 | | | | 8,055,054 | |
The Founders Fund IV, L.P.a,b | | | | | 1,590,000 | | | | 1,700,444 | |
Tiger Global Investments Partners VI, L.P.b | | | | | 4,701,942 | | | | 4,441,469 | |
| | | |
| See notes to financial statements. | | | | | | | | | | |
FIVE
HATTERAS MASTER FUND, L.P.
(a Delaware Limited Partnership)
SCHEDULEOF INVESTMENTS
March 31, 2013 (continued)
| | | | | | | | | | | | |
| Private Investments — (35.83%) (continued) | | Shares/
Contracts | | | Cost | | | Fair Value | |
Investments in Adviser Funds (continued) | | | | | | | | | | | | |
Tiger Global Investments Partners VII, L.P.a,b | | | | | | $ | 333,000 | | | $ | 289,940 | |
TPF II, L.P.b | | | | | | | 4,586,571 | | | | 4,104,299 | |
Trivest Fund IV, L.P.b | | | | | | | 4,770,765 | | | | 4,903,408 | |
True Ventures III, L.P.a,b | | | | | | | 975,000 | | | | 877,341 | |
Urban Oil and Gas Partners A-1, L.P.b | | | | | | | 6,275,346 | | | | 5,430,084 | |
Urban Oil and Gas Partners B-1, L.P.a,b | | | | | | | 634,483 | | | | 635,511 | |
VCFA Private Equity Partners IV, L.P.b | | | | | | | 1,282,086 | | | | 873,139 | |
VCFA Venture Partners V, L.P.b | | | | | | | 5,945,309 | | | | 6,042,958 | |
Voyager Capital Fund III, L.P.a,b | | | | | | | 2,131,122 | | | | 2,813,430 | |
WCP Real Estate Fund I, L.P.a,b | | | | | | | 1,709,933 | | | | 1,688,658 | |
Westview Capital Partners II, L.P.a,b | | | | | | | 4,928,505 | | | | 5,942,556 | |
Zero2IPO China Fund II, L.P.a,b | | | | | | | 4,168,480 | | | | 4,664,226 | |
Total Investments in Adviser Funds | | | | | | | 397,607,879 | | | | 422,252,286 | |
Investments in Private Companies | | | | | | | | | | | | |
Illumitex, Inc., Common Stocka,b | | | 1,331,167 | | | | 1,000,000 | | | | 39,935 | |
Illumitex, Inc., Series A-1 Preferred Stocka,b | | | 2,404,160 | | | | 499,369 | | | | 521,366 | |
Illumitex, Inc., Series X Preferred Stocka,b | | | 2,404,160 | | | | — | | | | — | |
Pacira Pharmaceuticals, Inc., Common Sharesa,e | | | 4,822 | | | | 142,442 | | | | 139,163 | |
Total Investments in Private Companies | | | | | | | 1,641,811 | | | | 700,464 | |
Investment in Private Company Call Options | | | | | | | | | | | | |
Illumitex, Inc., Exercise Price $0.03, 10/24/2022a,b | | | 553,352 | | | | — | | | | 8,981 | |
Total Investment in Private Company Call Options | | | | | | | — | | | | 8,981 | |
Total Private Investments | | | | | | | 399,249,690 | | | | 422,961,731 | |
| | | |
Tactical Trading — (6.25%) | | | | | | | | | | | | |
Investments in Adviser Funds | | | | | | | | | | | | |
Black River Commodity MS Fund, L.P.a,b,d | | | | | | | 379,957 | | | | 318,530 | |
Brevan Howard, L.P.b,c | | | | | | | 4,330,348 | | | | 5,218,294 | |
D.E. Shaw Oculus Fund, LLCa,b | | | | | | | 7,154,202 | | | | 14,323,143 | |
Drawbridge Global Macro Fund, L.P.a,b,d | | | | | | | 93,996 | | | | 79,316 | |
Ospraie Special Opportunities Fund, L.P.a,b,d | | | | | | | 3,346,238 | | | | 4,452,078 | |
Touradji Private Equity Onshore Fund, LTD.a,b,d | | | | | | | 1,714,396 | | | | 767,014 | |
Total Investments in Adviser Funds | | | | | | | 17,019,137 | | | | 25,158,375 | |
Investments in Exchange Traded Funds | | | | | | | | | | | | |
iShares Russell 1000 Growth Index Fund | | | 72,767 | | | | 4,879,704 | | | | 5,193,381 | |
Market Vectors Gold Miners ETF | | | 222,850 | | | | 9,971,824 | | | | 8,434,873 | |
Market Vectors Junior Gold Miners ETF | | | 501,519 | | | | 9,966,632 | | | | 8,395,428 | |
Market Vectors Oil Service ETF | | | 247,339 | | | | 9,998,358 | | | | 10,613,316 | |
ProShares Short Russell2000a | | | 217,575 | | | | 5,105,772 | | | | 4,671,118 | |
WisdomTree Japan Hedged Equity Fund | | | 262,300 | | | | 9,999,089 | | | | 11,328,737 | |
Total Investments in Exchange Traded Funds | | | | | | | 49,921,379 | | | | 48,636,853 | |
Total Tactical Trading | | | | | | | 66,940,516 | �� | | | 73,795,228 | |
Total Investments in Adviser Funds and Securities
(cost $1,058,557,848) | | | | | | | | | | | 1,159,280,535 | |
| | | |
| See notes to financial statements. | | | | | | | | | | | | |
SIX
HATTERAS MASTER FUND, L.P.
(a Delaware Limited Partnership)
SCHEDULEOF INVESTMENTS
March 31, 2013 (concluded)
| | | | | | | | | | | | |
| Short-Term Investments — (4.29%) | | Shares | | | Cost | | | Fair Value | |
Federated Prime Obligations Fund #10, 0.08%f | | | 50,603,368 | | | $ | 50,603,368 | | | $ | 50,603,368 | |
Total Short-Term Investments (cost $50,603,368) | | | | | | | | | | | 50,603,368 | |
Total Investments (cost $1,109,161,216) (102.48%) | | | | | | | | | | | 1,209,883,903 | |
Liabilities in excess of other assets (-2.48%) | | | | | | | | | | | (29,332,828 | ) |
Partners’ capital — (100.00%) | | | | | | | | | | $ | 1,180,551,075 | |
| b | Adviser Funds and securities that are issued in private placement transactions are restricted as to resale. |
| c | Securities held in custody by US Bank N.A., as collateral for a credit facility. The total cost and fair value of these securities as of March 31, 2013 was $232,057,931 and $284,523,507, respectively. |
| d | The Adviser Fund has imposed gates on or has restricted redemptions from Adviser Funds. The total cost and fair value of these securities as of March 31, 2013 was $117,715,126 and $106,705,896, respectively. |
| e | The Private Investments category includes in-kind distributions from Adviser Funds, in the form of publically traded common stock. |
| f | The rate shown is the annualized 7-day yield as of March 31, 2013. |
See notes to financial statements.
SEVEN
HATTERAS MASTER FUND, L.P.
(a Delaware Limited Partnership)
STATEMENTOF ASSETS, LIABILITIESAND PARTNERS’ CAPITAL
March 31, 2013
| | | | |
Assets | | | | |
Investments in Adviser Funds and securities, at fair value (cost $1,058,557,848) | | $ | 1,159,280,535 | |
Investments in short-term investments, at fair value (cost $50,603,368) | | | 50,603,368 | |
Cash | | | 478,061 | |
Receivable from redemption of Adviser Funds and securities | | | 37,511,193 | |
Investments in Adviser Funds and securities paid in advance | | | 382,581 | |
Dividends and interest receivable | | | 1,971 | |
Prepaid assets | | | 565 | |
Total assets | | $ | 1,248,258,274 | |
Liabilities and partners’ capital | | | | |
Withdrawals payable | | $ | 64,991,042 | |
Contributions received in advance | | | 1,192,012 | |
Management fee payable | | | 1,038,747 | |
Professional fees payable | | | 228,154 | |
Risk management fees payable | | | 100,000 | |
Accounting and administration fees payable | | | 77,911 | |
Line of credit fees payable | | | 45,333 | |
Custodian fees payable | | | 19,000 | |
Printing fees payable | | | 5,000 | |
Other accrued expenses | | | 10,000 | |
Total liabilities | | | 67,707,199 | |
Partners’ capital | | | 1,180,551,075 | |
Total liabilities and partners’ capital | | $ | 1,248,258,274 | |
Components of partners’ capital | | | | |
Capital contributions (net) | | $ | 1,103,161,953 | |
Accumulated net investment loss | | | (3,752,709 | ) |
Accumulated net realized loss | | | (19,580,856 | ) |
Accumulated net unrealized appreciation on investments | | | 100,722,687 | |
Partners’ capital | | $ | 1,180,551,075 | |
See notes to financial statements.
EIGHT
HATTERAS MASTER FUND, L.P.
(a Delaware Limited Partnership)
STATEMENTOF OPERATIONS
For the year ended March 31, 2013
| | | | |
Investment income | | | | |
Dividends | | $ | 28,728,555 | |
Interest | | | 54,976 | |
Total investment income | | | 28,783,531 | |
Operating expenses | | | | |
Management fee | | | 13,443,822 | |
Accounting and administration fees | | | 998,794 | |
Line of credit fees | | | 982,747 | |
Risk management expense | | | 746,944 | |
Professional fees | | | 557,981 | |
Interest expense | | | 137,855 | |
Custodian fees | | | 98,625 | |
Compliance consulting fees | | | 30,000 | |
Printing expense | | | 23,967 | |
Insurance expense | | | 7,576 | |
Other expenses | | | 112,648 | |
Total operating expenses | | | 17,140,959 | |
Net investment income | | | 11,642,572 | |
Net realized gain and change in unrealized appreciation on investments in Adviser Funds, securities and foreign exchange transactions | | | | |
Net realized gain from investments in Adviser Funds, securities and foreign exchange transactions | | | 34,933,051 | |
Net change in unrealized appreciation on investments in Adviser Funds, securities and foreign exchange transactions | | | 17,585,750 | |
Net realized gain and change in unrealized appreciation on investments in Adviser Funds, securities and foreign exchange transactions | | | 52,518,801 | |
Net increase in partners’ capital resulting from operations | | $ | 64,161,373 | |
See notes to financial statements.
NINE
HATTERAS MASTER FUND, L.P.
(a Delaware Limited Partnership)
STATEMENTSOF CHANGESIN PARTNERS’ CAPITAL
For the year ended March 31, 2012 and the year ended March 31, 2013
| | | | | | | | | | | | |
| | | General
Partner’s
Capital | | | Limited
Partners’
Capital | | | Total Partners’
Capital | |
Partners’ capital, at March 31, 2011 | | $ | — | | | $ | 1,528,133,542 | | | $ | 1,528,133,542 | |
Capital contributions | | | 323,877 | | | | 183,493,918 | | | | 183,817,795 | |
Capital withdrawals | | | — | | | | (229,703,817 | ) | | | (229,703,817 | ) |
Net investment income | | | — | | | | 11,470,591 | | | | 11,470,591 | |
Net realized gain from investments in Adviser Funds, securities and foreign exchange transactions | | | — | | | | 18,063,264 | | | | 18,063,264 | |
Net change in unrealized appreciation on investments in Adviser Funds, securities and foreign exchange transactions | | | — | | | | (71,083,345 | ) | | | (71,083,345 | ) |
Reverse accrued performance allocation from January 1, 2011 to March 31, 2011 | | | (323,877 | ) | | | 323,877 | | | | — | |
Partners’ capital, at March 31, 2012* | | $ | — | | | $ | 1,440,698,030 | | | $ | 1,440,698,030 | |
Capital contributions | | | — | | | | 51,623,316 | | | | 51,623,316 | |
Capital withdrawals | | | (965,799 | ) | | | (374,965,845 | ) | | | (375,931,644 | ) |
Net investment income | | | — | | | | 11,642,572 | | | | 11,642,572 | |
Net realized gain on investments in Adviser Funds, securities and foreign exchange transactions | | | — | | | | 34,933,051 | | | | 34,933,051 | |
Net change in unrealized appreciation on investments in Adviser Funds, securities and foreign exchange transactions | | | — | | | | 17,585,750 | | | | 17,585,750 | |
Performance allocation | | | 965,799 | | | | (965,799 | ) | | | — | |
Partners’ capital, at March 31, 2013** | | $ | — | | | $ | 1,180,551,075 | | | $ | 1,180,551,075 | |
| * | Including accumulated net investment loss of $15,395,281. |
| ** | Including accumulated net investment loss of $3,752,709. |
See notes to financial statements.
TEN
HATTERAS MASTER FUND, L.P.
(a Delaware Limited Partnership)
STATEMENTOF CASH FLOWS
For the year ended March 31, 2013
| | | | |
Cash flows from operating activities: | | | | |
Net increase in partners’ capital resulting from operations | | $ | 64,161,373 | |
Adjustments to reconcile net increase in partners’ capital resulting from operations to net cash provided by operating activities: | | | | |
Purchase of Adviser Funds and securities | | | (328,008,805 | ) |
Proceeds from redemptions/sales of Adviser Funds and securities | | | 547,321,810 | |
Net realized gain from investments in Adviser Funds, securities and foreign exchange transactions | | | (34,933,051 | ) |
Net change in unrealized appreciation on investments in Adviser Funds, securities and foreign exchange transactions | | | (17,585,750 | ) |
Net purchases of short-term investments | | | (41,452,525 | ) |
Decrease in investments in Adviser Funds and securities paid in advance | | | 35,383,407 | |
Decrease in receivable from redemption of Adviser Funds and securities | | | 113,790,673 | |
Decrease in dividends and interest receivable | | | 1,200 | |
Decrease in prepaid assets | | | 398 | |
Decrease in management fee payable | | | (212,727 | ) |
Increase in professional fees payable | | | 56,986 | |
Increase in risk management fees payable | | | 250 | |
Decrease in accounting and administration fees payable | | | (14,253 | ) |
Increase in line of credit fees payable | | | 944 | |
Decrease in line of credit interest expense payable | | | (2,634 | ) |
Decrease in printing fees payable | | | (4,962 | ) |
Decrease in custodian fees payable | | | (3,182 | ) |
Increase in other accrued expenses | | | 5,000 | |
Net cash provided by operating activities | | | 338,504,152 | |
Cash flows from financing activities: | | | | |
Capital contributions | | | 52,815,328 | |
Capital withdrawals | | | (370,841,419 | ) |
Net line of credit repayments | | | (20,000,000 | ) |
Net cash used in financing activities | | | (338,026,091 | ) |
Net change in cash | | | 478,061 | |
Cash at beginning of year | | | — | |
Cash at end of year | | $ | 478,061 | |
Supplement Disclosure of Interest Expense Paid | | $ | 140,489 | |
Supplement Disclosure of Line of Credit Fees Paid | | $ | 981,803 | |
See notes to financial statements.
ELEVEN
HATTERAS MASTER FUND, L.P.
(a Delaware Limited Partnership)
NOTESTO FINANCIAL STATEMENTS
As of and for the year ended March 31, 2013
1. ORGANIZATION
Hatteras Master Fund, L.P. (the “Master Fund”) was organized as a limited partnership under the laws of the State of Delaware on October 29, 2004 and commenced operations on January 1, 2005. The Master Fund is registered under the Investment Company Act of 1940, as amended (the “1940 Act”), as a closed-end, diversified management investment company. The Master Fund is co-managed by Hatteras Investment Partners, LLC (“HIP”), a Delaware limited liability company registered as an investment adviser under the Investment Advisers Act of 1940, as amended (the “Advisers Act”), and Morgan Creek Capital Management, LLC (“MCCM”, together with HIP, the “Investment Managers”), a North Carolina limited liability company registered as an investment adviser under the Advisers Act. The primary objective of the Master Fund is to provide capital appreciation consistent with the return characteristic of the alternative investment portfolios of larger endowments. The Master Fund’s secondary objective is to provide capital appreciation with less volatility than that of the equity markets. To achieve its objectives, the Master Fund provides its limited partners (each, a “Limited Partner” and together, the “Limited Partners”) with access to a broad range of investment strategies, asset categories, and trading Advisers (“Advisers”) and by providing overall asset allocation services typically available on a collective basis to larger institutions. The Master Fund invests with each Adviser either by becoming a participant in an investment vehicle operated by the Adviser (an “Adviser Fund”) which includes exchange traded funds (“ETFs”), hedge funds, and investment funds or by placing assets in an account directly managed by the Adviser.
Hatteras Investment Management LLC, a Delaware limited liability company, serves as the General Partner of the Master Fund (the “General Partner”). The General Partner is an affiliate of HIP. The General Partner has appointed a Board of Directors (the “Board”) and, to the fullest extent permitted by applicable law, has irrevocably delegated to the Board its rights and powers to monitor and oversee the business affairs of the Master Fund, including the complete and exclusive authority to oversee and establish policies regarding the management, conduct and operation of the Master Fund’s business.
2. SIGNIFICANT ACCOUNTING POLICIES
The following is a summary of significant accounting and reporting policies used in preparing the financial statements.
a. Basis of Accounting
The Master Fund’s accounting and reporting policies conform with accounting principles generally accepted within the United States of America (“GAAP”).
b. Cash
Cash includes short-term interest bearing deposit accounts. At times, such deposits may be in excess of federally insured limits. The Master Fund has not experienced any losses in such accounts and does not believe it is exposed to any significant credit risk on such accounts.
c. Valuation of Investments
The Master Fund’s valuation procedures have been approved by the Master Fund’s Board. The valuation procedures are implemented by the Master Fund’s Investment Managers and the third party administrator, which report to the Board. For third-party information, the Master Fund’s administrator monitors and reviews the methodologies of the various pricing services employed by the Fund.
Investments held by the Master Fund include:
| | • | | Investments in Adviser Funds — The Master Fund will value interests in the Adviser Funds at fair value, using the net asset value (“NAV”) as a practical expedient, as provided by the investment managers of such Adviser Funds. These Adviser Funds value their underlying investments in accordance with policies established by such Advisor Funds, which ordinarily will be the value determined by their respective investment managers, in accordance with the Master Fund’s valuation procedures. Investments in Adviser Funds are subject to the terms of the Adviser Funds’ offering documents. |
TWELVE
HATTERAS MASTER FUND, L.P.
(a Delaware Limited Partnership)
NOTESTO FINANCIAL STATEMENTS
As of and for the year ended March 31, 2013 (continued)
2. SIGNIFICANT ACCOUNTING POLICIES (CONTINUED)
c. Valuation of Investments (continued)
| | • | | Investments in Adviser Funds (continued) |
Valuations of the Adviser Funds may be subject to estimates and are net of management and performance incentive fees or allocations payable to the Adviser Funds’ investment managers as required by the Adviser Funds’ offering documents. If the Investment Managers determine that the most recent value reported by any Adviser Fund does not represent fair value or if any Adviser Fund fails to report a value to the Master Fund, a fair value determination is made under the Master Fund’s valuation procedures under the general supervision of the Board. Because of the inherent uncertainty in valuation, the estimated values may differ from the values that would have been used had a ready market for the securities existed, and the differences could be material.
The interests of some Adviser Funds, primarily investments in private equity funds, may be valued less frequently than the calculation of the Master Fund’s net asset value. Therefore, the reported performance of the Adviser Fund may lag the reporting period of the Master Fund. The Investment Managers have established procedures for reviewing the effect on the Master Fund’s net asset value due to this lag in reported performance of the Adviser Funds.
| | • | | Investments in Exchange Traded Funds and Mutual Funds — Securities traded on one or more of the U.S. national securities exchanges or the OTC Bulletin Board will be valued at their last sales price. Securities traded on NASDAQ will be valued at the NASDAQ Official Closing Price (“NOCP”), at the close of trading on the exchanges or markets where such securities are traded for the business day as of which such value is being determined. |
| | • | | Investments in Private Companies — Investments for which observable market prices in active markets do not exist are reported at fair value, as determined in good faith by the Adviser. Fair value is based on the best information available and is determined by reference to information including, but not limited to, the following: projected sales, net earnings, earnings before interest, taxes, depreciation and amortization (“EBITDA”), balance sheets, public or private transactions, valuations for publicly traded comparable companies, recent round of financing in the company’s stock, and/or other measures, and consideration of any other pertinent information including the types of securities held and restrictions on disposition. The amount determined to be fair value may incorporate the Adviser’s own assumptions (including appropriate risk adjustments for nonperformance and lack of marketability). The methods used to estimate the fair value of private companies include: (1) the market approach (whereby fair value is derived by reference to observable valuation measures for comparable companies or assets — e.g., multiplying a key performance metric of the investee company or asset, such as projected revenue or EBITDA, by a relevant valuation multiple observed in the range of comparable companies or transactions — adjusted by the Adviser for differences between the investment and the referenced comparables and in some instances by reference to option pricing models or other similar methods), (2) the income approach (e.g., the discounted cash flow method), and (3) cost for a period of time after an acquisition (where such amount is determined by the Adviser to be the best indicator of fair value). These valuation methodologies involve a significant degree of judgment. Due to the absence of readily determinable fair values and the inherent uncertainty of valuations, the estimated fair values for private companies may differ significantly from values that would have been used had a ready market for the securities existed, and the differences could be material. |
| | • | | Investments in Options — Options contracts give the Master Fund the right, but not the obligation, to buy or sell the underlying instrument for a specified price upon exercise at any time during the option period. For the year ended March 31, 2013, the Master Fund was granted options from one of the Master Fund’s Private Companies. Options are valued by the Investment Managers using an option pricing model. At March 31, 2013, the fair value and change in unrealized appreciation of options held by the Master Fund was $8,891. |
THIRTEEN
HATTERAS MASTER FUND, L.P.
(a Delaware Limited Partnership)
NOTESTO FINANCIAL STATEMENTS
As of and for the year ended March 31, 2013 (continued)
2. SIGNIFICANT ACCOUNTING POLICIES (CONTINUED)
c. Valuation of Investments (continued)
The Master Fund classifies its assets and liabilities that are reported at fair value into three levels based on the lowest level of input that is significant to the fair value measurement. Estimated values may differ from the values that would have been used if a ready market existed or if the investments were liquidated at the valuation date.
The three-tier hierarchy distinguishes between (1) inputs that reflect the assumptions market participants would use in pricing an asset or liability developed based on market data obtained from sources independent of the reporting entity (observable inputs) and (2) inputs that reflect the reporting entity’s own assumptions about the assumptions market participants would use in pricing an asset or liability developed based on the best information available in the circumstances (unobservable inputs) and to establish classification of fair value measurements for disclosure purposes. Various inputs are used in determining the value of the Master Fund’s investments. The inputs are summarized in the three broad levels listed below:
| | • | | Level 1 — quoted prices (unadjusted) in active markets for identical assets and liabilities. |
| | • | | Level 2 — other significant observable inputs or investments that can be fully redeemed at the net asset value in the “near term” (including quoted prices for similar investments, interest rates, prepayment speeds, credit risk, ability to redeem in the near term, generally within the next calendar quarter, from Adviser Funds, etc.). |
| | • | | Level 3 — significant unobservable inputs (including the Master Fund’s own assumptions in determining the fair value of investments) or investments that cannot be fully redeemed at the net asset value in the “near term”, these are investments that generally have one or more of the following characteristics: gated redemptions, suspended redemptions, or have lock-up periods greater than 90 days. |
| | | | | | | | | | | | | | | | |
| | | Level 1 | | | Level 2 | | | Level 3 | | | Total | |
Absolute Return | | $ | — | | | $ | 133,499,381 | | | $ | 14,615,157 | | | $ | 148,114,538 | |
Enhanced Fixed Income | | | — | | | | 77,609,118 | | | | 33,740,954 | | | | 111,350,072 | |
Opportunistic Equity | | | — | | | | 302,505,301 | | | | 100,533,665 | | | | 403,058,966 | |
Private Investments* | | | 139,163 | | | | — | | | | 422,822,568 | | | | 422,961,731 | |
Tactical Trading | | | 48,636,853 | | | | 19,541,437 | | | | 5,616,938 | | | | 73,795,228 | |
Short-Term Investment | | | 50,603,368 | | | | — | | | | — | | | | 50,603,368 | |
Total | | $ | 99,379,384 | | | $ | 533,155,237 | | | $ | 577,349,282 | | | $ | 1,209,883,903 | |
| * | The Private Investments category includes in-kind distributions from Adviser Funds, in the form of publically traded common stock. |
The following is a reconciliation of investments in which significant unobservable inputs (Level 3) were used in determining fair value on a recurring basis:
| | | | | | | | | | | | | | | | | | | | | | | | | | | | | | | | |
Level 3 Investments | | Balance
as of March 31,
2012 | | | Transfers
out of
Level 3
into Level 21 | | | Transfers
Between
Investment
Categories1 | | | Net
Realized
Gain
(Loss) | | | Change in
Unrealized
Appreciation/
(Depreciation) | | | Gross Purchases | | | Gross
Sales | | | Balance
as of March 31,
2013 | |
Absolute Return | | $ | 44,732,205 | | | $ | (25,111,137 | ) | | $ | — | | | $ | (1,280,255 | ) | | $ | (406,086 | ) | | $ | 13,001 | | | $ | (3,332,571 | ) | | $ | 14,615,157 | |
Enhanced Fixed Income | | | 91,737,650 | | | | (24,597,368 | ) | | | — | | | | 20,177,184 | | | | (12,282,728 | ) | | | 24,663,847 | | | | (65,957,631 | ) | | | 33,740,954 | |
Opportunistic Equity | | | 182,822,021 | | | | (23,204,600 | ) | | | 1,834,093 | | | | 6,734,122 | | | | (7,658,566 | ) | | | 10,017,425 | | | | (69,990,830 | ) | | | 100,553,665 | |
Private Investments | | | 374,331,767 | | | | — | | | | (1,834,093 | ) | | | (6,219,247 | ) | | | 27,248,639 | | | | 84,543,265 | | | | (55,247,763 | ) | | | 422,822,568 | |
Tactical Trading | | | 6,564,845 | | | | — | | | | — | | | | (763,078 | ) | | | 552,585 | | | | 224,267 | | | | (961,681 | ) | | | 5,616,938 | |
Total Level 3 Investments | | $ | 700,188,488 | | | $ | (72,913,105 | ) | | $ | — | | | $ | 18,648,726 | | | $ | 7,453,844 | | | $ | 119,461,805 | | | $ | (195,490,476 | ) | | $ | 577,349,282 | |
| 1 | Transfers are represented by their balance as of April 1, 2012. |
FOURTEEN
HATTERAS MASTER FUND, L.P.
(a Delaware Limited Partnership)
NOTESTO FINANCIAL STATEMENTS
As of and for the year ended March 31, 2013 (continued)
2. SIGNIFICANT ACCOUNTING POLICIES (CONTINUED)
c. Valuation of Investments (continued)
Transfers into and out of all Levels are represented by their balances as of the beginning of the reporting period. Transfers into Level 3 usually result from Adviser Funds imposing gates or suspending redemptions; transfers out of Level 3 generally occur when lock-up periods on investments in Adviser Funds are lifted. There were no transfers among Levels 1, 2 or 3 except for transfers out of Level 3 into Level 2 that resulted from lock-up periods on investments in Adviser Funds being lifted, as set forth in the table above.
The net realized gain (loss) and change in unrealized appreciation/(depreciation) in the table above are reflected in the accompanying Statement of Operations. The change in unrealized appreciation/(depreciation) from Level 3 investments held at March 31, 2013 is $12,244,716.
Adviser Funds categorized as Level 3 assets, with a fair value totaling $91,186,951, have imposed gates or suspended redemptions. Gates were imposed or redemptions were suspended for these Adviser Funds during a period ranging from October 2008 to March 2013. It is generally not known when these restrictions will be lifted.
The following is a summary of quantitative information about significant unobservable valuation inputs for Level 3 Fair Value Measurements for investments held as of March 31, 2013:
| | | | | | | | |
| Type of Level 3 Investment | | Fair Value as of
March 31, 2013 | | | Valuation Techniques | | Unobservable Input |
Adviser Funds | | | | | | | | |
Absolute Return | | $ | 14,615,157 | | | NAV as practical expedient* | | N/A |
Enhanced Fixed Income | | | 33,740,954 | | | NAV as practical expedient* | | N/A |
Opportunistic Equity | | | 100,553,665 | | | NAV as practical expedient* | | N/A |
Private Investments | | | 422,252,286 | | | NAV as practical expedient* | | N/A |
Tactical Trading | | | 5,616,938 | | | NAV as practical expedient* | | N/A |
Common Stock | | | | | | | | |
Private Investments | | | 39,935 | | | Current value method | | Recent round of
financing |
Options | | | | | | | | |
Private Investments | | | 8,981 | | | Options pricing model | | Private company
financial information |
Preferred Stock | | | | | | | | |
Private Investments | | | 521,366 | | | Current value method | | Recent round of
financing |
Total Level 3 Investments | | $ | 577,349,282 | | | | | |
| | | | | | | | |
No adjustments were made to the NAV provided by the investment manager or administrator of the Adviser Funds. Adjustments to the NAV provided by the investment manager or administrator of the Adviser Funds would be considered if the practical expedient NAV was not as of the Master Fund’s measurement date; it was probable that the Adviser Fund would be sold at a value materially different than the reported expedient NAV; or it was determined in accordance with the Master Fund’s valuation procedures that the Adviser Fund is not being reported at fair value.
The significant unobservable inputs used in the fair value measurement of the Master Fund’s Private Investment shares are based on the portfolio company’s most recent round of financing and the financial results of privately held entities. If the financial condition of these companies was to deteriorate, or if market comparables were to fall, the value of the stock in these private companies held by the Master Fund would be lower.
FIFTEEN
HATTERAS MASTER FUND, L.P.
(a Delaware Limited Partnership)
NOTESTO FINANCIAL STATEMENTS
As of and for the year ended March 31, 2013 (continued)
2. SIGNIFICANT ACCOUNTING POLICIES (CONTINUED)
c. Valuation of Investments (continued)
| | | | | | | | | | | | | | | | | | | | |
| Investment Category | | Investment
Strategy | | Fair
Value (in 000’s) | | | Unfunded
Commitments (in 000’s) | | | Remaining
Life* | | Redemption
Frequency* | | Notice
Period (in Days)* | | | Redemption
Restrictions
Terms* |
Opportunistic Equity a | | Investments in global equity markets and strategies involving specific market sectors, such as financial, technology, public real estate and public energy. | | $ | 403,059 | | | | N/A | | | N/A | | Monthly- Annually | | | 5-120 | | | 0-3 years; Up to 6% redemption fee |
Enhanced Fixed Income b | | Investments in non-traditional fixed income securities, including distressed debt strategies. | | $ | 111,350 | | | | N/A | | | N/A | | Monthly- Rolling 3 years | | | 0-185 | | | 0-3 years; Up to 5% redemption fee |
Absolute Return c | | Investments in a variety of securities with the intent of profiting from relative changes in the price of a set of securities, currencies or commodities. | | $ | 148,115 | | | | N/A | | | N/A | | Monthly-Annually | | | 0-92 | | | 0-2 years; Up to 6% redemption fee |
Tactical Trading d | | Investments in commodities, currencies, global bonds and international stock indices, with low correlation to the equity markets. | | $ | 73,795 | | | | N/A | | | N/A | | Quarterly | | | 0-180 | | | 0-10 years; Up to 3% redemption fee |
Private Investments e | | Investments in Private Equity, Private Real Estate, Private Energy and Natural Resources, generally through private partnerships or direct investments. | | $ | 422,962 | | | $ | 168,280 | | | Up to 10
years with
extensions
available
after the
stated
termination
date | | N/A | | | N/A | | | N/A |
| * | The information summarized in the table above represents the general terms for the specified asset class. Individual Adviser Funds may have terms that are more or less restrictive than those terms indicated for the asset class as a whole. In addition, most Adviser Funds have the flexibility, as provided for in their constituent documents, to modify and waive such terms. |
| | The Master Fund’s investments reflect their estimated fair value, which for marketable securities would generally be the last sales price on the primary exchange for such security and for Adviser Funds, would generally be the net asset value as provided by the Adviser Fund or its administrator. For each of the categories below, the fair value of the Adviser Funds has been estimated using the net asset value of the Adviser Funds. |
| a | This category includes Adviser Funds that predominantly invest in all global markets, including the U.S. domestic markets, and predominantly invest in equity securities. While the Opportunistic Equity investment strategy consists of Adviser Funds that trade predominantly in equity securities, certain of the Advisers chosen may additionally invest all or a portion of the Advisers Fund in debt or other instruments. |
| b | This category includes Adviser Funds that invest primarily in high yield debt, distressed securities, structured credit, and opportunistic credit (including, among other things, in emerging markets). |
SIXTEEN
HATTERAS MASTER FUND, L.P.
(a Delaware Limited Partnership)
NOTESTO FINANCIAL STATEMENTS
As of and for the year ended March 31, 2013 (continued)
2. SIGNIFICANT ACCOUNTING POLICIES (CONTINUED)
c. Valuation of Investments (continued)
| c | This category is defined as having a relatively low or negative correlation to the equity markets. In addition, certain strategies within the Absolute Return investment strategy may have less volatility through the use of arbitrage based strategies and hedging tools (e.g., “market” puts and calls, etc.). The Absolute Return investment strategy includes Adviser Funds that invest using Event Driven Arbitrage, Convertible Arbitrage, Merger Arbitrage, Fixed Income Arbitrage, Volatility Arbitrage and Statistical Arbitrage. |
| d | This category includes Adviser Funds who engage in directional trading strategies. Some of the Tactical Trading strategies incorporate equity assets as well as currencies, commodities and debt instruments. Commodity Trading Advisors (CTAs) are included in the Tactical Trading investment strategy. Historically, the Tactical Trading investment strategy has a relatively low correlation to the equity markets. Global Macro/Managed Futures strategies are generally categorized as either discretionary or systematic in nature and may assume aggressive investment postures with respect to position concentrations, use of leverage, portfolio turnover, and the various investment instruments used. |
| e | This category invests in three sub-strategies (Private Equity, Private Real Estate and Private Energy and Natural Resources). Private Equity investing seeks to generate capital appreciation through investments in private companies in need of capital. Private Equity seeks to profit from, among other things, the inefficiencies inherent in these markets though valuation and due diligence analysis of available business opportunities. Private Real Estate strategy consists generally of investing in Adviser Funds that are private partnerships that make direct investments in (i) existing or newly constructed income-producing properties, including office, industrial, retail, and multi-family residential properties, (ii) raw land, which may be held for development or for the purpose of appreciation, and/or (iii) timber (whether directly or through a REIT or other Adviser Fund). The Private Energy and Natural Resources strategy consists generally of investing in Adviser Funds that are private partnerships that make direct investments in private or (sometimes) publicly traded energy companies. |
d. Investment Income
Interest income is recorded when earned. Dividend income is recorded on the ex-dividend date, except that certain dividends from private equity investments are recorded as soon as the information is available to the Master Fund. Investments in short-term investments, mutual funds, private companies and exchange traded funds are recorded on a trade date basis. Investments in Adviser Funds are recorded on a subscription effective date basis, which is generally the first day of the calendar month in which the investment is effective. Realized gains and losses on Adviser Fund and security redemptions are determined on identified cost basis. Return of capital or security distributions received from Adviser Funds and securities are accounted for as a reduction to cost.
e. Foreign Currency
Investment securities and other assets and liabilities denominated in foreign currencies are translated into U.S. dollar amounts at the date of valuation. Purchases and sales of investment securities and income and expense items denominated in foreign currencies are translated into U.S. dollar amounts on the respective dates of such transactions. The company does not isolate that portion of the results of operations resulting from changes in foreign exchange rates on investments from the fluctuations arising from changes in market prices of securities held. Such fluctuations are included with the net realized and unrealized gain or loss from investments. Reported net realized foreign exchange gains or losses arise from sales of foreign currencies, currency gains or losses realized between the trade and settlement dates on securities transactions, and the difference between the amounts of dividends, interest, and foreign withholding taxes recorded on the company’s books and the U.S. dollar equivalent of the amounts actually received or paid. Net unrealized foreign exchange gains and losses arise from changes in the fair values of assets and liabilities, other than investments in securities at fiscal period end, resulting from changes in exchange rates.
f. Master Fund Expenses
The Master Fund will bear all expenses incurred, on an accrual basis, in the business of the Master Fund, including, but not limited to, the following: all costs and expenses related to portfolio transactions and positions for the Master Fund’s account; legal fees; accounting, auditing, and tax preparation fees; custodial fees; fees for data and software providers; costs of insurance; registration expenses; directors’ fees; interest expenses and commitment fees on credit facilities; and expenses of meetings of the Board.
SEVENTEEN
HATTERAS MASTER FUND, L.P.
(a Delaware Limited Partnership)
NOTESTO FINANCIAL STATEMENTS
As of and for the year ended March 31, 2013 (continued)
2. SIGNIFICANT ACCOUNTING POLICIES (CONTINUED)
g. Income Taxes
The Master Fund is treated as a partnership for federal income tax purposes and therefore is not subject to U.S. federal income tax. For income tax purposes, the individual partners will be taxed upon their distributive share of each item of the Master Fund’s profit and loss.
The Master Fund files tax returns as prescribed by the tax laws of the jurisdiction in which it operates. In the normal course of business, the Master Fund is subject to examination by federal, state, local and foreign jurisdictions, where applicable. For the years ended December 31, 2009 through December 31, 2012 the Master Fund is open to examination by major tax jurisdictions under the statute of limitations.
The Master Fund has reviewed any potential tax positions as of March 31, 2013 and has determined that it does not have a liability for any unrecognized tax benefits or expense. The Master Fund recognizes interest and penalties, if any, related to unrecognized tax benefits as income tax expense in the Statement of Operations. During the period, the Master Fund did not incur any material interest or penalties. Due to the timing of tax information received from the Adviser Funds, tax basis reporting is not available as of the balance sheet date.
h. Use of Estimates
The preparation of financial statements in conformity with GAAP requires the Master Fund to make estimates and assumptions that affect the reported amounts of assets and liabilities and disclosure of contingent assets and liabilities at the date of the financial statements and the reported amounts of increases and decreases in Partner’s Capital from operations during the reporting period. Actual results could differ from those estimates.
i. Recent Accounting Pronouncements
In December 2011, FASB issued ASU No. 2011-11 related to disclosures about offsetting assets and liabilities (“ASU 2011-11”). The amendments in this ASU 2011-11 require an entity to disclose information about offsetting and related arrangements to enable users of its financial statements to understand the effect of those arrangements on its financial position. The ASU 2011-11 is effective for annual reporting periods beginning on or after January 1, 2013, and interim periods within those annual periods. The guidance requires retrospective application for all comparative periods presented. Management does not believe that ASU 2011-11 will have a material impact on the financial statement disclosures.
3. ALLOCATIONOF PARTNERS’ CAPITAL
Net profits or net losses of the Master Fund for each Allocation Period (as defined below) will be allocated among and credited to or debited against the capital accounts of the Limited Partners. Allocation Periods begin on the day after the last day of the preceding Allocation Period and end at the close of business on (1) the last day of each month; (2) the last day of each taxable year; (3) the day preceding each day on which interests are purchased; (4) the day on which interests are repurchased; (5) the day preceding the day on which a substituted Limited Partner is admitted to the Master Fund; or (6) the day on which any amount is credited to or debited from the capital account of any Limited Partner other than an amount to be credited to or debited from the capital accounts of all Limited Partners in accordance with their respective investment percentages.
4. REPURCHASEOF LIMITED PARTNERS’ INTERESTS
The Board may, from time to time and in its sole discretion, cause the Master Fund to repurchase interests from Limited Partners pursuant to written tenders by Limited Partners at such times and on such terms and conditions as established by the Board. In determining whether the Master Fund should offer to repurchase interests, the Board will consider, among other things, the recommendation of the Investment Managers. The Investment Managers generally recommend to the Board that the Master Fund offer to repurchase interests from Limited Partners on a quarterly basis as of the valuation date at the end of each calendar quarter. The Master Fund will not offer repurchases of interests of more than 20% its net asset value in any quarter. The Master Fund does not intend to distribute to the Limited Partners any of the Master Fund’s income, but generally expects to reinvest substantially all income and gains allocable to the Limited Partners.
EIGHTEEN
HATTERAS MASTER FUND, L.P.
(a Delaware Limited Partnership)
NOTESTO FINANCIAL STATEMENTS
As of and for the year ended March 31, 2013 (continued)
5. MANAGEMENT FEES, PERFORMANCE ALLOCATION,AND RELATED PARTY TRANSACTIONS
Effective March 28, 2013, upon the approval of the Limited Partners, MCCM became the investment co-manager to the Master Fund along with HIP, the existing investment manager to the Master Fund. The Investment Managers are responsible for providing day-to-day investment management services to the Master Fund, subject to the ultimate supervision of and any policies established by the Board, pursuant to the terms of the investment co-management agreement among the Master Fund, HIP and MCCM (the “MCCM Agreement”) and the investment co-management agreement between the Master Fund and HIP (the “HIP Agreement”). Under the MCCM Agreement and HIP Agreement (together, the “Investment Management Agreements”), the Investment Managers are responsible for developing, implementing and supervising the Master Fund’s investment program. In consideration for the advisory and other services provided by HIP, the Master Fund pays HIP a management fee (the “Management Fee”) equal to 1.00% on an annualized basis of the aggregate value of its partners’ capital determined as of the last day of the month (before giving effect to any repurchase of interests in the Master Fund). The Master Fund does not pay MCCM an investment management fee directly. Under the MCCM Agreement, MCCM is entitled to distributions from HIP under the Member Agreement (defined below). MCCM is a non-voting member (“Member”) of HIP. HIP, MCCM and the General Partner have entered into a membership agreement (the “Member Agreement”), pursuant to which HIP makes distributions to MCCM equal to a percentage of the Management Fee HIP receives from the Master Fund.
The General Partner is allocated a performance allocation payable annually equal to 10% of the amount by which net new profits of the limited partner interests of the Master Fund exceed the non-cumulative “hurdle amount,” which is calculated as of the last day of the preceding calendar year of the Master Fund at a rate equal to the yield-to-maturity of the 90-day U.S. Treasury Bill as reported by the Wall Street Journal for the last business day of the last calendar year (“the Performance Allocation”). The Performance Allocation is made on a “peak to peak”, or “high watermark” basis, which means that no Performance Allocation will be made with respect to such subsequent appreciation until such net loss has been recovered. Pursuant to the Member Agreement, the General Partner makes distributions to MCCM equal to a percentage of the Performance Allocation the General Partner receives from the Master Fund. For the year ended March 31, 2013, the General Partner accrued a Performance Allocation in the amount of $965,799.
Hatteras Capital Distributors LLC (“HCD”), an affiliate of HIP, serves as the Master Fund’s private placement agent. HCD receives a distribution fee from HIP equal to 0.10% on an annualized basis of the partner’s capital of the Master Fund as of the last day of the month (before giving effect to any repurchase of interests in the Master Fund).
Each member of the Board who is not an “interested person” of the Master Fund (“Independent Director”), as defined by the 1940 Act, receives an annual retainer of $30,000. All Board members are reimbursed by the Master Fund for all reasonable out-of-pocket expenses incurred by them in performing their duties.
6. ACCOUNTING, ADMINISTRATION,AND CUSTODIAL AGREEMENT
In consideration for accounting, administrative, and recordkeeping services, the Master Fund pays J.D. Clark & Company, a division of UMB Fund Services, Inc. (the “Administrator”) an administration fee based on the month-end partners’ capital of the Master Fund. The Administrator also provides regulatory administrative services, transfer agency functions, and shareholder services at an additional cost. For the year ended March 31, 2013, the total accounting and administration fees were $998,794.
UMB Bank, N.A. serves as custodian of the Master Fund’s assets and provides custodial services for the Master Fund, except for collateral held for the Master Fund’s credit facility, as described below in Note 8.
7. INVESTMENT TRANSACTIONS
Total purchases of Adviser Funds and securities for the year ended March 31, 2013 amounted to $328,008,805. Total proceeds from redemptions of Adviser Funds for the year ended March 31, 2013 amounted to $547,321,810. The cost of investments in Adviser Funds for U.S. federal income tax purposes is adjusted for items of taxable
NINETEEN
HATTERAS MASTER FUND, L.P.
(a Delaware Limited Partnership)
NOTESTO FINANCIAL STATEMENTS
As of and for the year ended March 31, 2013 (continued)
7. INVESTMENT TRANSACTIONS (CONTINUED)
income allocated to the Master Fund from the Adviser Funds. The Master Fund relies upon actual and estimated tax information provided by the Adviser Funds as to the amounts of taxable income allocated to the Master Fund as of March 31, 2013.
The Master Fund invests substantially all of its available capital in securities of private investment companies. These investments will generally be restricted securities that are subject to substantial holding periods or are not traded in public markets at all, so that the Master Fund may not be able to resell some of its securities holdings for extended periods.
8. CREDIT FACILITY
The Master Fund maintains a credit facility (the “Facility”) with a maximum borrowing amount of $120,000,000 which is secured by certain interests in Adviser Funds. A fee of 85 basis points per annum is payable monthly in arrears on the unused portion of the facility, while the interest rate charged on borrowings is the 1-month London Interbank Offer Rate plus a spread of 190 basis points. Collateral for the new facility is held by U.S. Bank N.A. as custodian. Interest and fees incurred for the year ended March 31, 2013 are disclosed in the accompanying Statement of Operations. At March 31, 2013, the Master Fund had no payable balance on the unused portion of the Facility and did not hold an interest payable balance on the borrowings. The average interest rate, the average daily balance, and the maximum balance outstanding for borrowings under the facility for the year ended March 31, 2013 was 2.28%, $1,014,019, and $40,300,000, respectively.
9. INDEMNIFICATION
In the normal course of business, the Master Fund enters into contracts that provide general indemnifications. The Master Fund’s maximum exposure under these agreements is dependent on future claims that may be made against the Master Fund, and therefore cannot be established; however, based on experience, the risk of loss from such claims is considered remote.
10. COMMITMENTS
As of March 31, 2013, the Master Fund had outstanding investment commitments to Adviser Funds totaling approximately $168,280,051. Five Adviser Funds in the Private Investment Strategy have commitments denominated in Euros, two Adviser Funds have commitments denominated in Pound Sterling, and one Adviser Fund has commitments denominated in Japanese Yen. At March 31, 2013, the unfunded commitments for these Adviser Funds totaled €4,881,903 EUR, £3,999,618 GBP and ¥95,847,192 JPY, respectively. At March 31, 2013, the exchange rate used for the conversion was 1.2778 USD/EUR, 1.5129 USD/GBP and 94.316 JPY/USD. The U.S. Dollar equivalent of these commitments is included in the Master Fund’s total unfunded commitment amount.
11. RISK FACTORS
An investment in the Master Fund involves significant risks, including leverage risk, interest rate risk, liquidity risk and economic conditions risk, that should be carefully considered prior to investing and should only be considered by persons financially able to maintain their investment and who can afford a loss of a substantial part or all of such investment. The Master Fund generally does not employ leverage. However, certain Adviser Funds may employ leverage, either synthetically or through borrowed funds, which can enhance returns or increase losses on smaller changes in the value of an underlying investment. Adviser Funds that invest in fixed income securities may be subject to interest rate risk, where changes in interest rates affect the value of the underlying fixed income investment. The Master Fund intends to invest substantially all of its available capital in securities of private investment companies. These investments will generally be restricted securities that are subject to substantial holding periods or are not traded in public markets at all, so that the Master Fund may not be able to resell some of its securities holdings for extended periods, which may be several years. Investments in the Adviser Funds may be restricted from early redemptions or subject to fees for early redemptions as part of contractual
TWENTY
HATTERAS MASTER FUND, L.P.
(a Delaware Limited Partnership)
NOTESTO FINANCIAL STATEMENTS
As of and for the year ended March 31, 2013 (continued)
11. RISK FACTORS (CONTINUED)
obligations agreed to by the Investment Managers on behalf of the Master Fund. Adviser Funds may have initial lock-up periods, the ability to suspend redemptions, or employ the use of side pockets, all of which may affect the Master Fund’s liquidity in the respective Adviser Fund.
Adviser Funds generally require the Master Fund to provide advanced notice of its intent to redeem the Master Fund’s total or partial interest and may delay or deny a redemption request depending on the Adviser Funds’ governing agreements. Interests in the Master Fund provide limited liquidity since Limited Partners will not be able to redeem interests on a daily basis because the Master Fund is a closed-end fund. Therefore, investment in the Master Fund is suitable only for investors who can bear the risks associated with the limited liquidity of interests and should be viewed as a long-term investment. No guarantee or representation is made that the investment objective will be met.
12. FINANCIAL HIGHLIGHTS
The financial highlights are intended to help an investor understand the Master Fund’s financial performance. The total returns in the table represent the rate that a typical Limited Partner would be expected to have earned or lost on an investment in the Master Fund.
The ratios and total return amounts are calculated based on the Limited Partner group taken as a whole. An individual Limited Partner’s results may vary from those shown below due to the timing of capital transactions and performance allocation.
The ratios are calculated by dividing total dollars of net investment income or expenses, as applicable, by the average of total monthly Limited Partners’ capital.
Total return amounts are calculated by geometrically linking returns based on the change in value during each accounting period.
| | | | | | | | | | | | | | | | | | | | |
| | | For the Years Ended March 31, | |
| | | 2013 | | | 2012 | | | 2011 | | | 2010 | | | 2009 | |
Total return before Performance Allocation | | | 5.05 | % | | | (2.51 | )% | | | 6.91 | % | | | 16.24 | % | | | (20.45 | )% |
Total return after Performance Allocation | | | 4.98 | % | | | (2.49 | )% | | | 6.89 | % | | | 16.24 | % | | | (20.45 | )% |
Partners’ capital, end of year (000’s) | | $ | 1,180,551 | | | $ | 1,440,698 | | | $ | 1,528,134 | | | $ | 1,411,169 | | | $ | 1,149,124 | |
Portfolio turnover | | | 25.15 | % | | | 32.68 | % | | | 25.12 | % | | | 23.12 | % | | | 22.57 | % |
Ratio of net investment income (loss), excluding Performance Allocation | | | 0.87 | % | | | 0.76 | % | | | 0.43 | % | | | (0.84 | )% | | | (0.90 | )% |
Ratio of other operating expenses to average partner’s capital | | | 1.19 | % | | | 1.20 | % | | | 1.17 | % | | | 1.23 | % | | | 1.22 | % |
Ratio of credit facility fees and interest expense to average partner’s capital | | | 0.08 | % | | | 0.08 | % | | | 0.10 | % | | | 0.06 | % | | | 0.03 | % |
Operating expenses, excluding Performance Allocation | | | 1.27 | % | | | 1.28 | % | | | 1.27 | % | | | 1.29 | % | | | 1.25 | % |
Performance Allocation | | | 0.07 | % | | | (0.02 | )%1 | | | 0.02 | % | | | 0.00 | % | | | 0.00 | % |
Total operating expenses and Performance Allocation | | | 1.34 | % | | | 1.26 | % | | | 1.29 | % | | | 1.29 | % | | | 1.25 | % |
| 1 | Reverse accrued Performance Allocation from January 1, 2011 to March 31, 2011. |
TWENTY-ONE
HATTERAS MASTER FUND, L.P.
(a Delaware Limited Partnership)
NOTESTO FINANCIAL STATEMENTS
As of and for the year ended March 31, 2013 (concluded)
13. SUBSEQUENT EVENTS
Management has evaluated the events and transactions through the date the financial statements were issued and determined there were no other subsequent events that required adjustment to our disclosure in the financial statements except for the following: effective April 1, 2013 and May 1, 2013, there were additional capital contributions of $1,192,012 and $398,442, respectively.
HIP recommended to the Board that a tender offer in an amount of up to approximately 5.00% of the partners’ capital of the Master Fund be made for the quarter ending June 30, 2013 to those partners who elect to tender their interests prior to the expiration of the tender offer period. The Board approved such recommendation and partners in the Master Fund were notified of the tender offer’s expiration date of April 30, 2013, and submitted tender requests totaling approximately $62,056,493.
*************
TWENTY-TWO
HATTERAS MASTER FUND, L.P.
(a Delaware Limited Partnership)
BOARDOF DIRECTORS
(Unaudited)
The identity of the Board members (each a “Director”) and brief biographical information, as of March 31, 2013, is set forth below. The business address of each Director is care of Hatteras Funds, 8540 Colonnade Center Drive, Suite 401, Raleigh, NC 27615. The term of office of each Director is from the time of such Director’s election and qualification until his or her successor shall have been elected and shall have qualified, or until he or she is removed, resigns or is subject to various disabling events such as death or incapacity. A Director may resign upon 90 days’ prior written notice to the Board and may be removed either by a vote of a majority of the Board not subject to the removal vote or of Limited Partners holding not less than two-thirds of the total number of votes eligible to be cast by all of the Limited Partners.
| | | | | | | | |
Name & Date of Birth | | Position(s) Held
with the Master
Fund | | Length of Time Served | | Principal Occupation(s)
During Past 5 Years
and Other
Directorships
Held by Director | | Number of
Portfolios in Fund
Complex1 Overseen
by Director |
INTERESTED DIRECTOR | | | | |
David B. Perkins2 July 18, 1962 | | President and Chairman of the Board of Directors | | Since Inception | | Mr. Perkins has been Chairman of the Board of Directors and President of the Master Fund since inception. Mr. Perkins is the Chief Executive Officer of Hatteras and its affiliated entities. He founded the firm in September 2003. Prior to that, he was the co-founder and Managing Partner of CapFinancial Partners, LLC. | | 19 |
INDEPENDENT DIRECTORS | | | | |
H. Alexander Holmes May 4, 1942 | | Director; Audit Committee Member | | Since Inception | | Mr. Holmes founded Holmes Advisory Services, LLC, a financial consultation firm, in 1993. | | 19 |
Steve E. Moss, CPA February 18, 1953 | | Director; Audit Committee Member | | Since Inception | | Mr. Moss is a principal of Holden, Moss, Knott, Clark & Copley, P.A. and has been a member manager of HMKCT Properties, LLC since January 1996. | | 19 |
| 1 | The “Fund Complex” consists of the Master Fund, Hatteras Core Alternatives Fund, L.P., Hatteras Core Alternatives TEI Fund, L.P., Hatteras Core Alternatives Institutional Fund, L.P., Hatteras Core Alternatives TEI Institutional Fund, L.P., Hatteras Global Private Equity Partners Institutional, LLC, Hatteras VC Co-Investment Fund II, LLC, Hatteras GPEP Fund II, LLC, Hatteras Alternative Mutual Funds Trust (consisting of five funds), Hatteras Variable Trust, and Underlying Funds Trust (consisting of five funds). |
| 2 | Mr. Perkins is deemed to be an “interested” Director of the Master Fund because of his affiliations with HIP. |
TWENTY-THREE
HATTERAS MASTER FUND, L.P.
(a Delaware Limited Partnership)
BOARDOF DIRECTORS
(Unaudited) (continued)
| | | | | | | | |
Name & Date of Birth | | Position(s) Held
with the Master
Fund | | Length of Time Served | | Principal Occupation(s)
During Past 5 Years
and Other
Directorships
Held by Director | | Number of
Portfolios in Fund
Complex1 Overseen
by Director |
INDEPENDENT DIRECTORS (CONTINUED) | | | | |
Gregory S. Sellers May 5, 1959 | | Director; Audit Committee Member | | Since Inception | | Mr. Sellers has been the Chief Financial Officer of Imagemark Business Services, Inc., a strategic communications provider of marketing and print communications solutions, since June 2009. From 2003 to June 2009, Mr. Sellers was the Chief Financial Officer and a director of Kings Plush, Inc., a fabric manufacturer. | | 19 |
Daniel K. Wilson June 22, 1948 | | Director; Audit Committee Member | | Since 2009 | | Mr. Wilson was Executive Vice President and Chief Financial Officer of Parksdale Mills, Inc. from 2004 - 2008. Mr. Wilson currently is in private practice as a Certified Public Accountant. | | 19 |
Joseph E. Breslin3 November 18, 1953 | | Director | | Since 2013 | | Mr. Breslin is currently a private investor. Mr Breslin has been a Director of Kinetics Mutual Funds, Inc. (mutual fund) from 2000 to Present (8 portfolios); Trustee, Kinetics Portfolios Trust (mutual fund) from 2000 to Present (8 portfolios). From 2007 to 2009, Mr. Breslin was the Chief Operating Officer of Central Park Credit Holdings, Inc. and prior to that, was the Chief Operating Officer of Aladdin Capital Management LLC, beginning in 2005. | | 19 |
| 1 | The “Fund Complex” consists of the Master Fund, Hatteras Core Alternatives Fund, L.P., Hatteras Core Alternatives TEI Fund, L.P., Hatteras Core Alternatives Institutional Fund, L.P., Hatteras Core Alternatives TEI Institutional Fund, L.P., Hatteras Global Private Equity Partners Institutional, LLC, Hatteras VC Co-Investment Fund II, LLC, Hatteras GPEP Fund II, LLC, Hatteras Alternative Mutual Funds Trust (consisting of five funds), Hatteras Variable Trust, and Underlying Funds Trust (consisting of five funds). |
| 3 | Mr. Breslin and Mr. Mann became Directors effective March 28, 2013. Mr Breslin and Mr. Mann previously served as members of an Advisory Board to the Master Fund (a body that provided advisory support for the Board without voting authority). Mr. Breslin and Mr. Mann were recommended and approved for appointment to the Advisory Board by the Independent Directors at the quarterly meeting of the Board held on November 30, 2012. |
TWENTY-FOUR
HATTERAS MASTER FUND, L.P.
(a Delaware Limited Partnership)
BOARDOF DIRECTORS
(Unaudited) (concluded)
| | | | | | | | |
Name & Date of Birth | | Position(s) Held
with the Master
Fund | | Length of Time Served | | Principal Occupation(s)
During Past 5 Years
and Other
Directorships
Held by Director | | Number of
Portfolios in Fund
Complex1 Overseen
by Director |
INDEPENDENT DIRECTORS (CONTINUED) | | | | |
Thomas Mann3 February 1, 1950 | | Director | | Since 2013 | | Mr. Mann is currently a private investor. From 2003 until 2012, Mr. Mann was the Managing Director and Group Head Financial Institutions Group, Société Générale, Sales of Capital Market Solutions and Products. Mr. Mann is also a Director of Virtus Global Multi-Sector Income Fund since 2011, Virtus Total Return Fund since 2012, and F-Squared Investments, Inc since January 2012. | | 19 |
| 1 | The “Fund Complex” consists of the Master Fund, Hatteras Core Alternatives Fund, L.P., Hatteras Core Alternatives TEI Fund, L.P., Hatteras Core Alternatives Institutional Fund, L.P., Hatteras Core Alternatives TEI Institutional Fund, L.P., Hatteras Global Private Equity Partners Institutional, LLC, Hatteras VC Co-Investment Fund II, LLC, Hatteras GPEP Fund II, LLC, Hatteras Alternative Mutual Funds Trust (consisting of five funds), Hatteras Variable Trust, and Underlying Funds Trust (consisting of five funds). |
| 3 | Mr. Breslin and Mr. Mann became Directors effective March 28, 2013. Mr Breslin and Mr. Mann previously served as members of an Advisory Board to the Master Fund (a body that provided advisory support for the Board without voting authority). Mr. Breslin and Mr. Mann were recommended and approved for appointment to the Advisory Board by the Independent Directors at the quarterly meeting of the Board held on November 30, 2012. |
TWENTY-FIVE
HATTERAS MASTER FUND, L.P.
(a Delaware Limited Partnership)
FUND MANAGEMENT
(Unaudited)
Set forth below is the name, date of birth, position with the Master Fund, length of term of office, and the principal occupation for the last five years, as of March 31, 2013, of each of the persons currently serving as Executive Officers of the Master Fund. The business address of each officer is care of Hatteras Funds, 8540 Colonnade Center Drive, Suite 401, Raleigh, NC 27615.
| | | | | | | | |
Name & Date of Birth | | Position(s) Held
with the Master
Fund | | Length of
Time Served | | Principal Occupation(s)
During Past 5 Years
and Other
Directorships
Held by Officer | | Number of
Portfolios in Fund
Complex1 Overseen
by Officer |
OFFICERS | | | | |
J. Michael Fields July 14, 1973 | | Secretary of each Fund in the Fund Complex | | Since 2008 | | Prior to becoming Secretary of each of the Funds in the Fund Complex, Mr. Fields was Treasurer of each of the Funds in the Fund Complex. Mr. Fields is Chief Operating Officer of HIP and its affiliates and has been employed by the Hatteras firm since its inception in September 2003. | | N/A |
Andrew P. Chica September 7, 1975 | | Chief Compliance Officer of each Fund in the Fund Complex | | Since 2008 | | Mr. Chica joined Hatteras in November 2007 and became Chief Compliance Officer of each of the Funds in the Fund Complex and HIP as of January 2008. | | N/A |
Robert Lance Baker September 17, 1971 | | Treasurer of each Fund in the Fund Complex | | Since 2008 | | Mr. Baker joined Hatteras in March 2008 and became Treasurer of each of the Funds in the Fund Complex in December 2008. Mr. Baker serves as the Chief Financial Officer of HIP and its affiliates. | | N/A |
| 1 | The “Fund Complex” consists of the Master Fund, Hatteras Core Alternatives Fund, L.P., Hatteras Core Alternatives TEI Fund, L.P., Hatteras Core Alternatives Institutional Fund, L.P., Hatteras Core Alternatives TEI Institutional Fund, L.P., Hatteras Global Private Equity Partners Institutional, LLC, Hatteras VC Co-Investment Fund II, LLC, Hatteras GPEP Fund II, LLC, Hatteras Alternative Mutual Funds Trust (consisting of five funds), Hatteras Variable Trust, and Underlying Funds Trust (consisting of five funds). |
TWENTY-SIX
HATTERAS MASTER FUND, L.P.
(a Delaware Limited Partnership)
OTHER INFORMATION
(Unaudited)
APPROVALOF INVESTMENT CO-MANAGEMENT AGREEMENTS
At a meeting of the Board of the Master Fund held on November 30, 2012, by a unanimous vote, the Board of the Master Fund, including a majority of the Directors who are not “interested persons” within the meaning of Section 2(a)(19) of the 1940 Act, approved the HIP Agreement and MCCM Agreement (hereafter, the “Agreements”).
The directors and legal counsel to the Independent Directors had an opportunity to review the information provided in advance of the special meeting by HIP and MCCM, including information that refreshed the most recent presentations that had been made to the directors in connection with the annual evaluation and approval of the continuance of the existing investment management agreement between the Master Fund and HIP (the “Current Management Agreement”) pursuant to the requirements of Section 15(c) of the 1940 Act. In the course of their review, the directors considered their legal responsibilities with regard to all factors deemed to be relevant to the Master Fund and to the registered investment companies that serve as feeder funds to the Master Fund (the “Feeder Funds” and together with the Master Fund, the “Funds”), including, but not limited to the following: (1) the quality of services provided to the Master Fund since HIP first became investment adviser to the Master Fund; (2) the performance of the Master Fund; (3) the Master Fund’s advisory fee and overall Master Fund and Fund expenses; (4) the fact that the Agreements are not expected to affect the manner in which the Master Fund is advised; (5) the fact that the current portfolio management teams will continue to manage the Master Fund; (6) the fact that the fee structure under the Agreements would be identical to the fee structure under the Current Management Agreement; and (7) other factors deemed relevant, including HIP’s and MCCM’s investment process, how, specifically, HIP and MCCM would work together as investment co-managers, and whether and how partners would benefit from MCCM being an investment co-manager to the Master Fund.
The directors considered whether the Agreements would be in the best interests of the Funds and their partners and the overall fairness of the Agreements. Among other things, the directors reviewed information concerning: (1) the nature, extent and quality of the services provided by HIP and expected to be provided by MCCM; (2) the Feeder Funds’ and Master Fund’s investment performance; (3) the cost of the services provided and the profits realized by HIP, and expected to be realized by MCCM, and their affiliates from their relationship with the Master Fund; (4) the extent to which economies of scale have been or will be realized as the Master Fund grows and the extent to which fee levels reflect the economies of scale, if any, for the benefit of the Feeder Funds’ partners; and (5) ancillary benefits and other factors, such as any benefits that might accrue to HIP through its receipt of the Fund Servicing Fee in its capacity as Servicing Agent of the Feeder Funds or to HIP’s and MCCM’s affiliated broker-dealers. In their deliberations, the directors did not rank the importance of any particular piece of information or factor considered, and it is presumed that each director attributed different weights to the various factors.
NATURE, EXTENTAND QUALITYOF SERVICES
The Board considered information it believed necessary to assess the stability of HIP and MCCM and to assess the ongoing nature and quality of services to be provided to the Master Fund by HIP and MCCM. The Board noted the anticipated long-term nature of the new investment co-management relationship and benefits of having access to the full resources of MCCM. The Board considered that as investment co-manager, MCCM would research, identify, recommend, monitor, evaluate, and meet with potential Advisers as part of its manager due diligence responsibilities and that MCCM’s due diligence process would utilize MCCM’s investment team. The Board discussed MCCM’s due diligence process and the backgrounds of the individuals on MCCM’s team, including recent MCCM hires. The Board determined that MCCM’s services and experience in this area would be a benefit to the partners. In addition, the Board considered the relative responsibilities of HIP and MCCM with respect to management of the Master Fund and determined that it would be in partner’s best interest for HIP and MCCM to serve in the proposed complementary fashion as investment co-managers.
The Board considered information addressing the projected benefits to HIP and MCCM expected to result from the new investment co-management relationship. Management expected that the current management group would remain in-tact. The Board reviewed the likelihood that HIP or MCCM would have any departures of key
TWENTY-SEVEN
HATTERAS MASTER FUND, L.P.
(a Delaware Limited Partnership)
OTHER INFORMATION
(Unaudited) (continued)
management and/or investment personnel and whether compensation and other benefits offered by HIP and MCCM would be adequate to attract and retain high-caliber investment and other relevant professional employees. Management indicated that the current portfolio managers were expected to remain in their current positions.
HIP addressed for the Board its efforts both initially and on an ongoing basis to respond to questions from clients and potential clients regarding the new investment co-management relationship.
INVESTMENT PERFORMANCEOFTHE FUNDS
The directors considered the investment experience of HIP and MCCM. The directors considered the performance of the Master Fund and the Feeder Funds (the “Funds”) as well as historical performance of other accounts managed by HIP and MCCM using investment strategies substantially similar to those of the Funds. The directors also reviewed information previously supplied concerning peer group ranking. The directors and independent counsel asked several questions about the under-performance of the Funds against certain peers. Both HIP and MCCM distinguished performance returns and explained how the Funds’ performance was within the range of performances of comparative funds.
COSTSOF SERVICES PROVIDEDAND PROFITS REALIZEDBY HIPAND MCCM
In connection with the directors’ consideration of the level of the advisory fees, the directors considered a number of factors. With respect to the Master Fund, the Board’s analysis of the Master Fund’s advisory fee and estimated expenses included a discussion and review of data concerning the current fee and expense ratios of the Master Fund compared to a peer group. Management noted that HIP did not manage any institutional separate accounts. The Board also noted HIP’s agreements to waive fees and reimburse other expenses to limit the total expenses of the Funds. They noted that these expense limitations would not be affected by the Agreements. The Board also noted that HIP paid more in service fees than it earned in service fees received from the Funds. The Board also noted that MCCM’s fees will be paid entirely by HIP so that no additional expenses would be borne by partners for the engagement of MCCM as investment co-manager. The directors also considered peer group ranking, noting that the Funds’ advisory fee and expense ratios were within the range of fees and expenses paid by funds in the peer group.
Based on current Fund asset levels, management indicated that HIP is expected to make a small profit margin under the new investment co-management relationship between HIP and MCCM, and MCCM indicated that it is expected to earn a profit with respect to its management of the Funds.
ECONOMIESOF SCALEAND FEE LEVELS REFLECTING THOSE ECONOMIES
The directors considered the extent to which economies of scale were expected to be realized relative to fee levels as the Master Fund’s assets grow, and whether the advisory fee levels reflect these economies of scale for the benefit of partners. Management noted that the current fee waiver and expense limitation agreements continue until at least July 31, 2013. The Board noted that economies of scale are not a consideration at current Fund asset levels.
OTHER BENEFITS
In addition to the above factors, the directors also discussed other benefits received by HIP and expected to be received by MCCM from their management of the Master Fund. The Board noted that HIP receives a Fund Servicing Fee for its services as Servicing Agent to the Feeder Funds under a fund servicing agreement. It was noted that HIP may waive (to all investors on a pro rata basis) or pay to third parties all or a portion of the Fund Servicing Fee in its sole discretion. The Board also noted that a broker-dealer affiliated with HIP, HCD, receives service fees from HIP and sales loads (which may be subject to waivers or reductions) with respect to the Feeder Funds. The full amount of the sales loads may also be subject to waivers or reductions and may be re-allowed by HCD to third parties. MCCM disclosed and the Board considered other ancillary benefits that could accrue to MCCM affiliates.
TWENTY-EIGHT
HATTERAS MASTER FUND, L.P.
(a Delaware Limited Partnership)
OTHER INFORMATION
(Unaudited) (concluded)
GENERAL CONCLUSION
After consideration of all of the foregoing factors, the Board concluded that the Master Fund and its Limited Partners would benefit from the services MCCM would provide as investment co-manager to the Master Fund without increased expense to Limited Partners. The Board determined it would therefore be in the best interest of limited partners of the Feeder Funds for HIP and MCCM to serve as investment co-managers of the Master Fund and for partners to approve the HIP Agreement and MCCM Agreement.
On March 28, 2013, having also been approved by limited partners of the Feeder Funds, the HIP Agreement and MCCM Agreement were approved by the Limited Partners of the Master Fund and the limited partners of the unregistered feeder funds to the Master Fund, the Hatteras Core Alternatives 3c1 Fund, L.P. and the Hatteras Core Alternatives Offshore Fund, LTD.
PROXY VOTING
A description of the policies and procedures that the Master Fund uses to determine how to vote proxies relating to portfolio securities and the Master Fund’s record of actual proxy votes cast during the period ended June 30, 2012 is available at www.sec.gov and by calling 1-800-504-9070 and may be obtained at no additional charge.
AVAILABILITYOF QUARTERLY PORTFOLIO SCHEDULES
The Master Fund files its complete schedule of portfolio holdings with the SEC for the first and third quarters of each fiscal year on Form N-Q. The Master Fund’s Form N-Q is available, without charge and upon request, on the SEC’s website at http://www.sec.gov or may be reviewed and copied at the SEC’s Public Reference Room in Washington, DC. Information on the Public Reference Room may be obtained by calling 1-800-SEC-0330.
TWENTY-NINE
PRIVACY POLICY
(Unaudited)
| | |
| FACTS | | WHAT DOES HATTERAS FUNDS DO WITH YOUR PERSONAL
INFORMATION? |
Why? | | Financial companies choose how they share your personal information. Federal law gives consumers the right to limit some but not all sharing. Federal law also requires us to tell you how we collect, share, and protect your personal information. Please read this notice carefully to understand what we do. |
What? | | The types of personal information we collect and share depend on the product or service you have with us. This information can include: • Social Security number • account balances • account transactions • transaction history • wire transfer instructions • checking account information When you are no longer our customer, we continue to share your information as described in this notice. |
How? | | All financial companies need to share customers’ personal information to run their everyday business. In the section below, we list the reasons financial companies can share their customers’ personal information; the reasons Hatteras Funds chooses to share; and whether you can limit this sharing. |
| | | | |
| Reasons we can share your personal information | | Does Hatteras Funds
share? | | Can you limit this sharing? |
| For our everyday business purposes — such as to process your transactions, maintain your account(s), respond to court orders and legal investigations, or report to credit bureaus | | Yes | | No |
| For our marketing purposes — to offer our products and services to you | | No | | We don’t share |
| For joint marketing with other financial companies | | No | | We don’t share |
| For our affiliates’ everyday business purposes — information about your transactions and experiences | | Yes | | No |
| For our affiliates’ everyday business purposes — information about your creditworthiness | | No | | We don’t share |
| For our affiliates to market to you | | No | | We don’t share |
| For non-affiliates to market to you | | No | | We don’t share |
| | |
| Questions? | | Call 919.846.2324 or go to www.hatterasfunds.com |
THIRTY
PRIVACY POLICY
(Unaudited) (concluded)
| | |
| What we do | | |
| Who is providing this notice? | | Funds advised by Hatteras entities. A complete list is included below. |
| How does Hatteras Funds protect my personal information? | | To protect your personal information from unauthorized access and use, we use security measures that comply with federal law. These measures include computer safeguards and secured files and buildings. |
| How does Hatteras Funds collect my personal information? | | We collect your personal information, for example, when you n open an account n provide account information n give us your contact information n make a wire transfer n tell us where to send the money We also collect your information from others, such as credit bureaus, affiliates, or other companies. |
| Why can’t I limit all sharing? | | Federal law gives you the right to limit only n sharing for affiliates’ everyday business purposes — information about your creditworthiness n affiliates from using your information to market to you n sharing for non-affiliates to market to you State laws and individual companies may give you additional rights to limit sharing. |
| Definitions | | |
| Affiliates | | Companies related by common ownership or control. They can be financial and nonfinancial companies. n Our affiliates include companies with a Hatteras name, such as Hatteras Investment Partners, LLC, Hatteras Capital Investment Management, LLC and Hatteras Alternative Mutual Funds, LLC, registered investment advisers; Hatteras Capital Distributors, LLC, a registered broker-dealer; and unregistered funds managed by Hatteras entities such as Hatteras Core Alternatives 3(c)(1) Fund, L.P., Hatteras Core Alternatives Offshore Fund, Ltd., Hatteras GPEP Fund, L.P. and Hatteras Late Stage VC Fund I, L.P. |
| Non-affiliates | | Companies not related by common ownership or control. They can be financial and nonfinancial companies. n Hatteras Funds doesn’t share with non-affiliates so they can market to you. |
| Joint marketing | | A formal agreement between nonaffiliated financial companies that together market financial products or services to you. n Hatteras Funds doesn’t jointly market. |
| List of funds providing this notice |
| Hatteras Core Alternatives Fund, L.P., Hatteras Core Alternatives TEI Fund, L.P., Hatteras Core Alternatives Institutional Fund, L.P., Hatteras Core Alternatives TEI Institutional Fund, L.P., Hatteras Global Private Equity Partners Institutional, LLC, Hatteras VC Co-Investment Fund II, LLC, Hatteras GPEP Fund II, LLC, Hatteras Alternative Mutual Funds Trust and Underlying Funds Trust. |
THIRTY-ONE
HATTERAS CORE ALTERNATIVES FUNDS
8540 Colonnade Center Drive
Suite 401
Raleigh, NC 27615
INVESTMENT MANAGERAND FUND SERVICING AGENT
Hatteras Investment Partners, LLC
8540 Colonnade Center Drive
Suite 401
Raleigh, NC 27615
INVESTMENT MANAGER
Morgan Creek Capital Management, LLC
301 West Barbee Chapel Road
Suite 200
Chapel Hill, NC 27517
INDEPENDENT REGISTERED PUBLIC ACCOUNTING FIRM
Deloitte & Touche LLP
1700 Market Street, 24th Floor
Philadelphia, PA 19103
FUND COUNSEL
Drinker Biddle & Reath LLP
One Logan Square
Suite 2000
Philadelphia, PA 19103
ADMINISTRATORAND FUND ACCOUNTANT
J.D. Clark & Company
223 Wilmington West Chester Pike, Suite 303
Chadds Ford, PA 19317
CUSTODIANS
UMB Bank, N.A.
1010 Grand Boulevard
Kansas City, MO 64106
U.S. Bank, N.A.
1555 North River Center Drive
Milwaukee, WI 53212
DISTRIBUTOR
Hatteras Capital Distributors, LLC
8540 Colonnade Center Drive
Suite 401
Raleigh, NC 27615
ITEM 2. CODE OF ETHICS.
(a) The registrant, as of the end of the period covered by this report, has adopted a code of ethics that applies to the registrant’s principal executive officer, principal financial officer, principal accounting officer or controller, or persons performing similar functions, regardless of whether these individuals are employed by the registrant or a third party.
(c) There have been no amendments, during the period covered by this report, to a provision of the code of ethics that applies to the registrant’s principal executive officer, principal financial officer, principal accounting officer or controller, or persons performing similar functions, regardless of whether these individuals are employed by the registrant or a third party, and that relates to any element of the code of ethics definition enumerated in paragraph (b) of this Item.
(d) The registrant has not granted any waivers, during the period covered by this report, including an implicit waiver, from a provision of the code of ethics that applies to the registrant’s principal executive officer, principal financial officer, principal accounting officer or controller, or persons performing similar functions, regardless of whether these individuals are employed by the registrant or a third party, that relates to one or more of the items set forth in paragraph (b) of this Item.
ITEM 3. AUDIT COMMITTEE FINANCIAL EXPERT.
As of the end of the period covered by the report, the registrant’s board of directors has determined that Messrs. Steve E. Moss, H. Alexander Holmes, Gregory S. Sellers and Daniel K. Wilson are each qualified to serve as audit committee financial experts serving on its audit committee and that each is “independent,” as defined by Item 3 of Form N-CSR.
ITEM 4. PRINCIPAL ACCOUNTANT FEES AND SERVICES.
Audit Fees
(a) The aggregate fees billed for each of the last two fiscal years for professional services rendered by the principal accountant for the audit of the registrant’s annual financial statements or services that are normally provided by the accountant in connection with statutory and regulatory filings or engagements for those fiscal years are $132,000 for 2012 and $140,000 for 2013.
Audit-Related Fees
(b) The aggregate fees billed in each of the last two fiscal years for assurance and related services by the principal accountant that are reasonably related to the performance of the audit of the registrant’s financial statements and are not reported under paragraph (a) of this Item are $0 for 2012 and $0 for 2013.
Tax Fees
(c) The aggregate fees billed in each of the last two fiscal years for professional services rendered by the principal accountant for tax compliance, tax advice, and tax planning are $0 for 2012 and $0 for 2013.
All Other Fees
(d) The aggregate fees billed in each of the last two fiscal years for products and services provided by the principal accountant, other than the services reported in paragraphs (a) through (c) of this Item are $0 for 2012 and $0 for 2013.
(e)(1) Disclose the audit committee’s pre-approval policies and procedures described in paragraph (c)(7) of Rule 2-01 of Regulation S-X.
The Registrant’s Audit Committee must pre-approve the audit and non-audit services of the Auditors prior to the Auditor’s engagement.
(e)(2) The percentage of services described in each of paragraphs (b) through (d) of this Item that were approved by the audit committee pursuant to paragraph (c)(7)(i)(C) of Rule 2-01 of Regulation S-X are as follows:
(b) 0%
(c) 0%
(d) 0%
(f) The percentage of hours expended on the principal accountant’s engagement to audit the registrant’s financial statements for the most recent fiscal year that were attributed to work performed by persons other than the principal accountant’s full-time, permanent employees was less than fifty percent.
(g) The aggregate non-audit fees billed by the registrant’s accountant for services rendered to the registrant, and rendered to the registrant’s investment adviser (not including any sub-adviser whose role is primarily portfolio management and is subcontracted with or overseen by another investment adviser), and any entity controlling, controlled by, or under common control with the adviser that provides ongoing services to the registrant for each of the last two fiscal years of the registrant was $0.
(h) The registrant’s audit committee of the board of directors has considered whether the provision of non-audit services that were rendered to the registrant’s investment adviser (not including any sub-adviser whose role is primarily portfolio management and is subcontracted with or overseen by another investment adviser), and any entity controlling, controlled by, or under common control with the investment adviser that provides ongoing services to the registrant that were not pre-approved pursuant to paragraph (c)(7)(ii) of Rule 2-01 of Regulation S-X is compatible with maintaining the principal accountant’s independence.
ITEM 5. AUDIT COMMITTEE OF LISTED REGISTRANTS.
Not applicable.
ITEM 6. SCHEDULE OF INVESTMENTS.
Schedule of Investments in securities of unaffiliated issuers as of the close of the reporting period is included as part of the report to shareholders filed under Item 1 of this Form.
ITEM 7. DISCLOSURE OF PROXY VOTING POLICIES AND PROCEDURES FOR CLOSED-END MANAGEMENT INVESTMENT COMPANIES.
The Proxy Voting Policies are attached herewith.
HATTERAS INVESTMENT PARTNERS LLC
(“HIP”)
MORGAN CREEK CAPITAL MANAGEMENT, LLC
(“MCCM”, together with HIP, the “Investment Managers”)
HATTERAS MASTER FUND, L.P.
(the “Master Fund”)
HATTERAS CORE ALTERNATIVES FUND, L.P.
HATTERAS CORE ALTERNATIVES TEI FUND, L.P.
HATTERAS CORE ALTERNATIVES INSTITUTIONAL FUND, L.P.
HATTERAS CORE ALTERNATIVES TEI INSTITUTIONAL FUND, L.P.
(collectively, the “Feeder Funds”, together with the Master Fund, the “Funds”)
PROXY VOTING POLICY
This statement sets forth the policy of the Investment Managers with respect to the exercise of corporate actions and proxy voting authority.
The Master Fund invests substantially all of its assets in adviser accounts and securities of private investment funds (“Adviser Funds”), which include, but are not limited to, private partnerships, limited liability companies or similar entities managed by advisers (commonly referred to as “hedge funds,” “private equity funds” or “private funds”). Investments in Adviser Funds do not typically convey traditional voting rights to the holder and the occurrence of corporate governance or other notices for this type of investment is substantially less than that encountered in connection with registered equity securities. On occasion, however, the Investment Managers and/or the Master Fund may receive notices from such Adviser Funds seeking the consent of holders in order to materially change certain rights within the structure of the security itself or change material terms of the Adviser Funds’ limited partnership agreement, limited liability company operating agreement or similar agreement with investors. To the extent that the Master Fund receives notices or proxies from Adviser Funds (or receives proxy statements or similar notices in connection with any other portfolio securities), the Master Fund has delegated proxy voting responsibilities with respect to the Master Fund’s portfolio securities to the Investment Managers, subject to the board of directors’ general oversight and with the direction that proxies should be voted consistent with the Master Fund’s best economic interests. In general, the Investment Managers believe that voting proxies in accordance with the policies described below will be in the best interests of the Funds. If an analyst, trader or partner of the Investment Managers believes that voting in accordance with stated proxy-voting guidelines would not be in the best interests of the Funds, the proxy will be referred to the Investment Managers’ Chief Compliance Officers for a determination of how such proxy should be voted.
The Investment Managers will generally vote to support management recommendations relating to routine matters such as the election of directors (where no corporate governance issues are implicated), the selection of independent auditors, an increase in or reclassification of common stock, the addition or amendment of indemnification provisions in the company’s charter or by-laws, changes in the board of directors and compensation of outside directors. The Investment Managers will generally vote in favor of management or shareholder proposals that the Investment Managers believe will maintain or strengthen the shared interests of shareholders and management, increase shareholder value, maintain or increase shareholder influence over the company’s board of directors and management and maintain or increase the rights of shareholders.
On non-routine matters, the Investment Managers will generally vote in favor of management proposals for mergers or reorganizations, reincorporation plans, fair-price proposals and shareholder rights plans so long as such proposals are in the best economic interests of the Master Fund.
If a proxy includes a matter to which none of the specific policies described above or in the Investment Managers’ stated proxy-voting guidelines is applicable or a matter involving an actual or potential conflict of interest as described below, the proxy will be referred to the Investment Managers’ Chief Compliance Officers for a determination of how such proxy should be voted.
In exercising its voting discretion, the Investment Managers and their employees will seek to avoid any direct or indirect conflict of interest presented by the voting decision. If any substantive aspect or foreseeable result of the matter to be voted on presents an actual or potential conflict of interest involving the Investment Managers (or an affiliate of the Investment Managers), any issuer of a security for which the Investment Managers (or an affiliate of the Investment Managers) acts as sponsor, advisor, manager, custodian, distributor, underwriter, broker or other similar capacity or any person with whom the Investment Managers (or an affiliate of the Investment Managers) has an existing material contract or business relationship not entered into in the ordinary course of business (the Investment Managers and such other persons having an interest in the matter being called “Interested Persons”), the Investment Managers will make written disclosure of the conflict to the independent directors of the Master Fund indicating how the Investment Managers propose to vote on the matter and the reasons for doing so. If the Investment Managers do not receive timely written instructions as to voting or non-voting on the matter from the Master Fund’s Independent Directors, the Investment Managers may take any of the following actions which they deem to be in the best interests of the Feeder Fund: (i) engage an independent third party to determine whether and how the proxy should be voted and vote or refrain from voting on the matter as determined by the third party; (ii) vote on the matter in the manner proposed to the Independent Directors if the vote is against the interests of all Interested Persons; or (iii) refrain from voting on the matter.
The voting rights of members of the Master Fund will be substantially similar to those of the limited partners (the “Partners”) of the Feeder Funds. Whenever a Feeder Fund, as a member of the Master Fund, is requested to vote on matters pertaining to the Master Fund, the Feeder Fund will seek voting instructions from its Partners and will vote its Master Fund interest for or against such matters proportionately to the instructions to vote for or against such matters received from its Partners. In the event that a Feeder Fund does not receive voting instructions from its Partners, the portion of that Fund’s Master Fund interest allocable to such Partners will be voted in the same proportions as the portion with respect to which it has received voting instructions.
The Funds are required to file Form N-PX, with their complete proxy voting record for the twelve months ended June 30, no later than August 31 of each year. Each of the Funds’ Form N-PX filings are available: (i) without charge, upon request, by calling
1-800-390-1560, or (ii) by visiting the SEC’s website at www.sec.gov.
ITEM 8. PORTFOLIO MANAGERS OF CLOSED-END MANAGEMENT INVESTMENT COMPANIES.
(a)(1) Identification of Portfolio Manager(s) or Management Team Members and Description of Role of Portfolio Manager(s) or Management Team Members
The following table provides biographical information about the members of the Investment Committee of HIP and MCCM, (the “Investment Committee), who are primarily responsible for the day-to-day portfolio management of the Master Fund as of June 10, 2013:
| | | | | | | | |
Name of Investment
Committee Member | | Title | | Length of
Time of
Service to
the Master
Fund | | Business Experience During the Past 5 Years | | Role of Investment Committee Member |
Mark W. Yusko | | Chief Investment Officer of Hatteras Core Alternatives Funds | | Since inception | | Mr. Yusko has been Chief Investment Officer of the Core Alternatives Funds since inception and President and Chief Executive Officer of MCCM since July, 2004. Previously, Mr. Yusko served as President and Chief Executive Officer for UNC Management Co., LLC from January 1998 through July 2004, where he was responsible for all areas of investment management for the UNC Endowment and Affiliated Foundation Funds. | | Asset allocation; underlying manager selection; and portfolio construction. |
| | | | |
David B. Perkins | | Chief Executive Officer of HIP and President of the Master Fund | | Since inception | | Mr. Perkins is the Chief Executive Officer of Hatteras and founded Hatteras and its affiliated entities. He founded the firm in September2003. Prior to that, he was the co-founder and Managing Partner of CapFinancial Partners, LLC. | | Strategic recommendations and portfolio oversight. |
| | | | |
Joshua E. Parrott | | Director of Public Investments of HIP | | Since inception | | Mr. Parrott joined HIP in March 2004 and is currently Director of Public Investments. Previously, Mr. Parrott was employed as an Analyst by Dialectic Capital Management in 2003 and as a Financial Advisor at Morgan Stanley from February 1999 to March 2003. | | Portfolio management and portfolio construction. |
| | | | |
Mike Hennessy | | Managing Director of MCCM | | Since March 28, 2013 | | Mr. Hennessy joined the Fund’s portfolio management team in March 2013. Mr. Hennessy is a Co-founder of MCCM and serves as the Director of Investments. | | Portfolio management |
| | | | |
Josh Tilley | | Principal of MCCM | | Since March 28, 2013 | | Mr. Tilley joined the Fund’s portfolio management team in March 2013. Mr. Tilley is a Principal of Investments at MCCM and one of the founding members of MCCM’s investment team. | | Portfolio management |
(a)(2) Other Accounts Managed by Portfolio Manager(s) or Management Team Member and Potential Conflicts of Interest
The following table provides information about portfolios and accounts, other than the Master Fund and the Feeder Funds, for which the members of the Investment Committee are primarily responsible for the day-to-day portfolio management as of March 31, 2013:
| | | | | | | | | | | | | | | | | | |
Name of Investment Committee Member | | Type of Accounts | | Total
Number
of
Accounts
Managed | | | Total Assets | | | Number of
Accounts
Managed for
Which
Advisory
Fee is Based
on
Performance | | | Total Assets for Which
Advisory Fee is Based on
Performance | |
Mark W. Yusko | | Registered Investment Companies | | | 2 | | | $ | 55,000,000 | | | | 0 | | | $ | 0 | |
| | Other Pooled Investment Vehicles * | | | 29 | | | $ | 1,800,000,000 | | | | 24 | | | $ | 1,800,000,000 | |
| | Other Accounts | | | 16 | | | $ | 1,600,000,000 | | | | 13 | | | $ | 900,000,000 | |
| | | | | |
David B. Perkins | | Registered Investment Companies | | | 3 | | | $ | 29,800,000 | | | | 2 | | | $ | 20,200,000 | |
| | Other Pooled Investment Vehicles * | | | 2 | | | $ | 19,400,000 | | | | 1 | | | $ | 4,000,000 | |
| | Other Accounts | | | 0 | | | $ | 0 | | | | 0 | | | $ | 0 | |
| | | | | |
Joshua E. Parrott | | Registered Investment Companies | | | 0 | | | $ | 0 | | | | 0 | | | $ | 0 | |
| | Other Pooled Investment Vehicles * | | | 0 | | | $ | 0 | | | | 0 | | | $ | 0 | |
| | Other Accounts | | | 0 | | | $ | 0 | | | | 0 | | | $ | 0 | |
| | | | | |
Mike Hennessy | | Registered Investment Companies | | | 0 | | | $ | 0 | | | | 0 | | | $ | 0 | |
| | Other Pooled Investment Vehicles * | | | 0 | | | $ | 0 | | | | 0 | | | $ | 0 | |
| | Other Accounts | | | 0 | | | $ | 0 | | | | 0 | | | $ | 0 | |
| | | | | |
Josh Tilley | | Registered Investment Companies | | | 0 | | | $ | 0 | | | | 0 | | | $ | 0 | |
| | Other Pooled Investment Vehicles * | | | 0 | | | $ | 0 | | | | 0 | | | $ | 0 | |
| | Other Accounts | | | 0 | | | $ | 0 | | | | 0 | | | $ | 0 | |
| * | The assets in the “Other Pooled Investment Vehicles” section for the designated investment committee member(s) includes committed capital amounts for certain assets. |
Potential Conflicts of Interests
Messrs. Yusko, Perkins, Parrott, Hennessy and Tilley are responsible for managing other accounts, including proprietary accounts, separate accounts and other pooled investment vehicles, including unregistered hedge funds and funds of hedge funds. They may manage separate accounts and other pooled investment vehicles which may have materially higher, lower or different fee arrangements than the registrant and may also be subject to performance-based fees. The side-by-side management of these separate accounts and/or pooled investment vehicles may raise potential conflicts of interest relating to cross trading and the allocation of investment opportunities. The Investment Managers has a fiduciary responsibility to manage all client accounts in a fair and equitable manner. It seeks to provide best execution of all securities transactions and to allocate investments to client accounts in a fair and timely manner. To this end, the Investment Managers has developed policies and procedures designed to mitigate and manage the potential conflicts of interest that may arise from side-by-side management.
Messrs. Parrott, Hennessy and Tilley do not manage any other accounts and therefore no material conflicts of interest arise out of their management of the registrant.
(a)(3) Compensation Structure of Portfolio Manager(s) or Management Team Members
The compensation of the members of the Investment Committee may include a combination of the following: (i) fixed annual salary; (ii) a variable portion of the Management Fee paid by the Master Fund to HIP; and (iii) a variable portion of any Performance Allocation allocated to the General Partner of the Master Fund. The Performance Allocation is equal to 10% of the excess of the new net profits of the partner interests in the Master Fund (calculated and accrued monthly and payable annually and calculated separately for each fund that serves as a feeder fund to the Master Fund) over the yield-to-maturity of the 90 day U.S. Treasury Bill as reported by the Wall Street Journal for the last business day of the preceding calendar year.
(a)(4) Disclosure of Securities Ownership
The following table sets forth the dollar range of equity securities beneficially owned by each member of the Investment Committee in the Fund as of March 31, 2013:
| | |
Investment Committee Member | | Dollar Range of Fund Shares
Beneficially Owned |
Mark W. Yusko | | $500,001 to $1,000,000 |
David B. Perkins | | $500,001 to $1,000,000 |
Joshua E. Parrott | | $10,001 to $50,000 |
Mike Hennessy | | None |
Josh Tilley | | None |
ITEM 9. PURCHASES OF EQUITY SECURITIES BY CLOSED-END MANAGEMENT INVESTMENT COMPANY AND AFFILIATED PURCHASERS.
Not applicable.
ITEM 10. SUBMISSION OF MATTERS TO A VOTE OF SECURITY HOLDERS.
There have been no material changes to the procedures by which the shareholders may recommend nominees to the registrant’s board of directors, where those changes were implemented after the registrant last provided disclosure in response to the requirements of Item 407(c)(2)(iv) of Regulation S-K (17 CFR 229.407) (as required by Item 22(b)(15) of Schedule 14A (17 CFR 240.14a-101)), or this Item.
ITEM 11. CONTROLS AND PROCEDURES.
(a) The registrant’s principal executive and principal financial officers, or persons performing similar functions, have concluded that the registrant’s disclosure controls and procedures (as defined in Rule 30a-3(c) under the Investment Company Act of 1940, as amended (the “1940 Act”) (17 CFR 270.30a-3(c))) are effective, as of a date within 90 days of the filing date of the report that includes the disclosure required by this paragraph, based on their evaluation of these controls and procedures required by
Rule 30a-3(b) under the 1940 Act (17 CFR 270.30a-3(b)) and Rules 13a-15(b) or 15d-15(b) under the Securities Exchange Act of 1934, as amended (17 CFR 240.13a-15(b) or 240.15d-15(b)).
(b) There were no changes in the registrant’s internal control over financial reporting (as defined in Rule 30a-3(d) under the 1940 Act (17 CFR 270.30a-3(d)) that occurred during the registrant’s second fiscal quarter of the period covered by this report that has materially affected, or is reasonably likely to materially affect, the registrant’s internal control over financial reporting.
ITEM 12. EXHIBITS.
(a)(1) Code of ethics, or any amendment thereto, that is the subject of disclosure required by Item 2 is attached hereto.
(a)(2) Certifications pursuant to Rule 30a-2(a) under the 1940 Act and Section 302 of the Sarbanes-Oxley Act of 2002 are attached hereto.
(a)(3) Not applicable.
(b) Not applicable.
SIGNATURES
Pursuant to the requirements of the Securities Exchange Act of 1934 and the Investment Company Act of 1940, the registrant has duly caused this report to be signed on its behalf by the undersigned, thereunto duly authorized.
| | |
| (registrant) Hatteras Master Fund, L.P. |
| |
| By (Signature and Title)* | | /s/ David B. Perkins |
| | David B. Perkins, President |
| | (principal executive officer) |
|
| Date June 10, 2013 |
Pursuant to the requirements of the Securities Exchange Act of 1934 and the Investment Company Act of 1940, this report has been signed below by the following persons on behalf of the registrant and in the capacities and on the dates indicated.
| | |
| By (Signature and Title)* | | /s/ David B. Perkins |
| | David B. Perkins, President |
| | (principal executive officer) |
|
| Date June 10, 2013 |
| |
| By (Signature and Title)* | | /s/ R. Lance Baker |
| | R. Lance Baker, Treasurer |
| | (principal financial officer) |
|
| Date June 10, 2013 |
| * | Print the name and title of each signing officer under his or her signature. |