provided a much more stable ride and landed only halfway down the staircase, meaning we would have significantly less work to do to try to get back to the top of the stairs. As we begin the new fiscal year, I’m reminded of a great quote from Duke University’s Coach Krzyzewski. He says that what differentiates the great players from all the rest is that the great players focus on the NEXT play and the rest focus on the LAST play. We learned some valuable lessons last year; we did not perform up to your (or our) expectations, but we have our eyes firmly fixed on the next play and see solid opportunities ahead.
Despite all the jawboning to the contrary, we believe the markets are in a crisis and no one is certain of when it will end. There are some small signs that the pace of decline is slowing (i.e., it is getting worse less quickly), leading some pundits to call an end to the problems. We still believe that there is more turbulence on the horizon. That said, I saw a great quote on a t-shirt of a runner in a recent 5K run for cancer research that I think applies nicely to investing: “Life is not about waiting for the storm to pass, it is about learning to dance in the rain.” If you write the word crisis in Chinese, it is made up of the two symbols Wei and Ji, which translate to Danger and Opportunity. Danger abounds as we are mired in a deep recession, global growth is slowing rapidly, companies are failing, and governments are flailing to prop up declining currencies and trying to stimulate growth. But there are opportunities, possibly some of the best we will see in our careers. As the destruction caused by the unwinding of the credit bubble has rippled through the markets, we have found opportunities to buy assets at what we believe to be attractive valuations. The Hatteras Multi-Strategy Funds (the “Funds”) employ a disciplined approach to asset allocation. We designed the investment management of the Funds to try to identify and utilize skilled managers in the public markets and lock in illiquidity premiums in the private markets. We are excited for the opportunity to continue to focus on the strategies and processes in order to help you achieve your long-term investment goals. We appreciate your support and are grateful for your trust and partnership.
DEFINITIONS
Barclays Capital Aggregate Bond Index (formerly The Lehman Aggregate Bond Index): The Index represents securities that are SEC-registered, taxable, and dollar denominated. It covers the U.S. investment grade fixed rate bond market, with index components for government and corporate securities, mortgage pass-through securities, and asset-backed securities. These major sectors are subdivided into more specific indices that are calculated and reported on a regular basis.
FTSE NAREIT Index: The Index is a comprehensive universe of publicly traded Real Estate Investment Trusts (REITs). To be included, firms must be traded on the NYSE, American Stock Exchange, or NASDAQ; have a minimum valuation of $100 million; and meet minimum share liquidity standards.
Merrill Lynch Convertible Index: The Merrill Lynch All Investment Grade Convertible Index (VXA1) is comprised of approximately 200 issues of only investment-grade convertible bonds and preferreds.
Merrill Lynch High Yield Master II Index: The Index is a commonly used benchmark for high yield corporate bonds. It measures the broad high yield market.
MSCI EAFE Index: The Morgan Stanley Capital International Europe, Australia, Far East Index is a benchmark of foreign stocks. Compiled by Morgan Stanley, the Index is an aggregate of 21 individual country indices that collectively represent many of the major markets of the world, including: Australia, Austria, Belgium, Denmark, Finland, France, Germany, Greece, Hong Kong, Ireland, Italy, Japan, the Netherlands, New Zealand, Norway, Portugal, Singapore, Spain, Sweden, Switzerland, and the United Kingdom. Most international mutual funds measure their performance against this index. It is a market-capitalization weighted index.
MSCI Emerging Markets Index: The Morgan Stanley Capital International Emerging Markets Index is designed to measure equity market performance in global emerging markets. The Index is a float-adjusted market capitalization index. As of May 2005, it consisted of indices in the following 26 emerging economies: Argentina, Brazil, Chile, China, Colombia, Czech Republic, Egypt, Hungary, India, Indonesia, Israel, Jordan, Korea, Malaysia, Mexico, Morocco, Pakistan, Peru, Philippines, Poland, Russia, South Africa, Taiwan, Thailand, Turkey, and Venezuela.
MSCI World Equity Index: The Morgan Stanley World Index, a free float-adjusted market capitalization index that is designed to measure developed-market equity performance throughout the world. The Index includes 23 developed-market country indices: Australia, Austria, Belgium, Canada, Denmark, Finland, France, Germany, Greece, Hong Kong, Ireland, Italy, Japan, the Netherlands, New Zealand, Norway, Portugal, Singapore, Spain, Sweden, Switzerland, the United Kingdom, and the United States.
Standard & Poor’s (S&P) 500 Index: An index of 500 stocks chosen for market size, liquidity, and industry grouping, among other factors. The S&P 500 is designed to be a leading indicator of U.S. equities and is meant to reflect the risk/return characteristics of the large cap universe. Companies included in the index are selected by the S&P Index Committee, a team of analysts and economists at Standard & Poor’s. The S&P 500 is a market value weighted index—each stock’s weight in the index is proportionate to its market value.
The Standard & Poor’s (S&P) GSCI Index: The Index provides investors with a reliable and publicly available benchmark for investment performance in the commodity markets. It is designed to be tradable, readily accessible to market participants, and cost efficient to implement. The Index is widely recognized as the leading measure of general commodity price movements and inflation in the world economy.
The Standard & Poor’s (S&P)/LSTA Leveraged Loan Index: A partnership between Standard & Poor’s and the Loan Syndications and Trading Association, the Index tracks returns in the leveraged loan market, capturing a broad cross-section of the U.S. leveraged loan market including dollar-denominated, U.S.-syndicated loans to overseas issuers.
SIX
RELATIONSHIPS • ALTERNATIVES • RESULTS
SAFE HARBOR AND FORWARD-LOOKING STATEMENTS DISCLOSURE
The opinions expressed in this report are subject to change without notice. This material has been prepared or is distributed solely for informational purposes and is not a solicitation or an offer to buy any security or instrument or to participate in any trading strategy. The opinions discussed in the letter are solely those of Hatteras and may contain certain forward-looking statements about the factors that may affect the performance of the illustrative examples in the future. These statements are based on Hatteras’ predictions and expectations concerning certain future events and their expected impact, such as performance of the economy as a whole and of specific industry sectors, changes in the levels of interest rates, the impact of developing world events, and other factors that may influence the future performance of the illustrative examples. Hatteras believes these forward-looking statements to be reasonable, although they are inherently uncertain and difficult to predict. Actual events may cause adjustments in portfolio management strategies from those currently expected to be employed. It is intended solely for the use of the person to whom it is given and may not be reproduced or distributed to any other person. The information and statistics in this report are from sources believed to be reliable, but are not warranted by Hatteras to be accurate or complete. Past performance does not guarantee future results.
IMPORTANT DISCLOSURES AND RISK FACTORS
This is not an offering to subscribe for units in any fund and is intended for informational purposes only. An offering can only be made by delivery of the Prospectus to “qualified clients” within the meaning of U.S. securities laws. Please carefully consider the investment objectives, risks, and charges and expenses of the Funds (as defined below) before investing. Please read the Prospectus carefully before investing as it contains important information on the investment objectives, composition, fees, charges and expenses, risks, suitability, and tax obligations of investing in the Funds. Copies of the Prospectus and performance data current to the most recent month-end may be obtained online at www.hatterasfunds.com or by contacting Hatteras at 1-866-388-6292. Past performance does not guarantee future results.
The Hatteras Multi-Strategy Fund, L.P.; the Hatteras Multi-Strategy TEI Fund, L.P.; the Hatteras Multi-Strategy Institutional Fund, L.P.; and the Hatteras Multi-Strategy TEI Institutional Fund, L.P. (collectively referred to herein as the “Hatteras Multi-Strategy Funds” or the “Funds”) are Delaware limited partnerships that are registered under the Investment Company Act of 1940 (the “1940 Act”), as amended, as non-diversified, closed-end management investment companies whose units are registered under the Securities Act of 1933, as amended. The Hatteras Multi-Strategy Funds are funds of alternative investments. As such, the Funds invest in private hedge funds and private equity investments. Hedge funds are speculative investments and are not suitable for all investors, nor do they represent a complete investment program. A hedge fund can be described generally as a private and unregistered investment pool that accepts investors’ money and employs hedging and arbitrage techniques using long and short positions, leverage and derivatives, and investments in many markets.
Key Risk Factors: The Funds, through an investment in the Master Fund, will invest substantially all of their assets in underlying funds that are generally not registered as investment companies under the 1940 Act and, therefore, the Funds will not have the benefit of various protections provided under the 1940 Act with respect to an investment in those underlying funds. The Funds can be highly volatile, carry substantial fees, and involve complex tax structures. Investments in the Funds involve a high degree of risk, including loss of entire capital. The underlying funds may engage in speculative investment strategies and practices, such as the use of leverage, short sales, and derivatives transactions, which can increase the risk of investment loss. The Funds provide limited liquidity, and units in the Funds are not transferable. Liquidity will be provided only through repurchase offers made by the Funds from time to time, generally on a quarterly basis upon prior written notice.
The success of the Funds is highly dependent on the financial and managerial expertise of its principals and key personnel of the Funds’ investment managers. Although the investment managers for the Funds expect to receive detailed information from each underlying fund on a regular basis regarding its valuation, investment performance, and strategy, in most cases the investment managers have little or no means of independently verifying this information. The underlying funds are not required to provide transparency with respect to their respective investments. By investing in the underlying funds indirectly through the Funds, investors will be subject to a dual layer of fees, both at the Funds and underlying fund levels.
Please see the Prospectus for a detailed discussion of the specific risks disclosed here and other important risks and considerations.
Securities offered through Hatteras Capital Distributors, LLC, member FINRA/SIPC. Hatteras Capital Distributors, LLC is affiliated with Hatteras Investment Partners, LLC by virtue of common control/ownership. This document is not an offering to subscribe for units of any fund and is intended for informational purposes only.
SEVEN
PERFORMANCE SUMMARY1 (UNAUDITED)
HATTERAS MULTI-STRATEGY FUND, L.P. (inception date: April 1, 2005)
| | | | | | | | | | | | | | | | | | | | | | | | | | | | | | | | | | | | | | | | |
Year | | | Jan | | | Feb | | | Mar | | | Apr | | | May | | | Jun | | | Jul | | | Aug | | | Sep | | | Oct | | | Nov | | | Dec | | | Year2 | |
|
|
|
|
|
|
|
|
|
|
|
|
|
|
|
|
|
|
|
|
|
|
|
|
|
|
|
|
|
|
|
|
|
|
|
|
|
|
|
|
|
2009 | | | 0.17 | % | | -0.42 | % | | -0.50 | % | | | | | | | | | | | | | | | | | | | | | | | | | | | | | -0.74 | % |
|
|
|
|
|
|
|
|
|
|
|
|
|
|
|
|
|
|
|
|
|
|
|
|
|
|
|
|
|
|
|
|
|
|
|
|
|
|
|
|
|
2008 | | | -2.89 | % | | 1.86 | % | | -2.88 | % | | 1.57 | % | | 2.10 | % | | -0.48 | % | | -2.84 | % | | -1.53 | % | | -8.28 | % | | -7.54 | % | | -4.29 | % | | -1.01 | % | | -23.79 | % |
|
|
|
|
|
|
|
|
|
|
|
|
|
|
|
|
|
|
|
|
|
|
|
|
|
|
|
|
|
|
|
|
|
|
|
|
|
|
|
|
|
2007 | | | 0.97 | % | | 0.67 | % | | 1.60 | % | | 1.86 | % | | 2.01 | % | | 0.78 | % | | -0.05 | % | | -1.85 | % | | 1.93 | % | | 2.71 | % | | -1.72 | % | | 0.92 | % | | 10.16 | % |
|
|
|
|
|
|
|
|
|
|
|
|
|
|
|
|
|
|
|
|
|
|
|
|
|
|
|
|
|
|
|
|
|
|
|
|
|
|
|
|
|
2006 | | | 2.80 | % | | -0.20 | % | | 1.74 | % | | 1.10 | % | | -1.97 | % | | -0.75 | % | | 0.37 | % | | 0.76 | % | | 0.26 | % | | 1.60 | % | | 2.09 | % | | 0.93 | % | | 8.98 | % |
|
|
|
|
|
|
|
|
|
|
|
|
|
|
|
|
|
|
|
|
|
|
|
|
|
|
|
|
|
|
|
|
|
|
|
|
|
|
|
|
|
2005 | | | | | | | | | | | | -1.54 | % | | 0.26 | % | | 1.46 | % | | 2.16 | % | | 0.48 | % | | 1.39 | % | | -1.46 | % | | 1.35 | % | | 1.85 | % | | 6.04 | % |
|
|
|
|
|
|
|
|
|
|
|
|
|
|
|
|
|
|
|
|
|
|
|
|
|
|
|
|
|
|
|
|
|
|
|
|
|
|
|
|
|
| | | | | | | | | | | | | |
Standardized Returns | | | Fund | | | S&P 5003 | | | HFRXGL3 | | | 60/404 | |
|
|
|
|
|
|
|
|
|
|
|
|
|
|
Trailing 3 Months | | | -0.74 | % | | -11.01 | % | | 0.68 | % | | -6.46 | % |
|
|
|
|
|
|
|
|
|
|
|
|
|
|
Year-to-date | | | -0.74 | % | | -11.01 | % | | 0.68 | % | | -6.46 | % |
|
|
|
|
|
|
|
|
|
|
|
|
|
|
1-Year | | | -21.26 | % | | -38.09 | % | | -20.52 | % | | -23.35 | % |
|
|
|
|
|
|
|
|
|
|
|
|
|
|
3-Year (annualized) | | | -4.54 | % | | -13.06 | % | | -5.36 | % | | -5.59 | % |
|
|
|
|
|
|
|
|
|
|
|
|
|
|
Annualized Since Inception | | | -0.94 | % | | -7.43 | % | | -2.24 | % | | -2.38 | % |
|
|
|
|
|
|
|
|
|
|
|
|
|
|
| | | | | | | | | | | | | |
Historical Data
(since inception) | | | Fund | | | S&P 5003 | | | HFRXGL3 | | | 60/404 | |
|
|
|
|
|
|
|
|
|
|
|
|
|
|
Cumulative Return | | | -3.71 | % | | -26.57 | % | | -8.66 | % | | -9.18 | % |
|
|
|
|
|
|
|
|
|
|
|
|
|
|
Standard Deviation5 | | | 8.10 | % | | 15.90 | % | | 7.94 | % | | 10.01 | % |
|
|
|
|
|
|
|
|
|
|
|
|
|
|
Largest Drawdown6 | | | -24.98 | % | | -50.95 | % | | -25.21 | % | | -32.54 | % |
|
|
|
|
|
|
|
|
|
|
|
|
|
|
Drawdown—# of months7 | | | 17 | | | 16 | | | 14 | | | 16 | |
|
|
|
|
|
|
|
|
|
|
|
|
|
|
Recovery—# of months8 | | | N.A. | | | N.A. | | | N.A. | | | N.A. | |
|
|
|
|
|
|
|
|
|
|
|
|
|
|
HATTERAS MULTI-STRATEGY TEI FUND, L.P. (inception date: April 1, 2005)
| | | | | | | | | | | | | | | | | | | | | | | | | | | | | | | | | | | | | | | | |
Year | | | Jan | | | Feb | | | Mar | | | Apr | | | May | | | Jun | | | Jul | | | Aug | | | Sep | | | Oct | | | Nov | | | Dec | | | Year2 | |
|
|
|
|
|
|
|
|
|
|
|
|
|
|
|
|
|
|
|
|
|
|
|
|
|
|
|
|
|
|
|
|
|
|
|
|
|
|
|
|
|
2009 | | | 0.16 | % | | -0.42 | % | | -0.50 | % | | | | | | | | | | | | | | | | | | | | | | | | | | | | | -0.75 | % |
|
|
|
|
|
|
|
|
|
|
|
|
|
|
|
|
|
|
|
|
|
|
|
|
|
|
|
|
|
|
|
|
|
|
|
|
|
|
|
|
|
2008 | | | -2.95 | % | | 1.82 | % | | -2.92 | % | | 1.53 | % | | 2.08 | % | | -0.52 | % | | -2.88 | % | | -1.57 | % | | -8.33 | % | | -7.56 | % | | -4.31 | % | | -0.86 | % | | -23.98 | % |
|
|
|
|
|
|
|
|
|
|
|
|
|
|
|
|
|
|
|
|
|
|
|
|
|
|
|
|
|
|
|
|
|
|
|
|
|
|
|
|
|
2007 | | | 0.94 | % | | 0.64 | % | | 1.58 | % | | 1.83 | % | | 1.99 | % | | 0.75 | % | | -0.07 | % | | -1.88 | % | | 1.89 | % | | 2.68 | % | | -1.74 | % | | 0.87 | % | | 9.79 | % |
|
|
|
|
|
|
|
|
|
|
|
|
|
|
|
|
|
|
|
|
|
|
|
|
|
|
|
|
|
|
|
|
|
|
|
|
|
|
|
|
|
2006 | | | 2.77 | % | | -0.20 | % | | 1.72 | % | | 1.09 | % | | -1.98 | % | | -0.75 | % | | 0.37 | % | | 0.72 | % | | 0.23 | % | | 1.57 | % | | 2.05 | % | | 0.90 | % | | 8.73 | % |
|
|
|
|
|
|
|
|
|
|
|
|
|
|
|
|
|
|
|
|
|
|
|
|
|
|
|
|
|
|
|
|
|
|
|
|
|
|
|
|
|
2005 | | | | | | | | | | | | -1.54 | % | | 0.26 | % | | 1.46 | % | | 2.16 | % | | 0.48 | % | | 1.39 | % | | -1.46 | % | | 1.32 | % | | 1.82 | % | | 5.97 | % |
|
|
|
|
|
|
|
|
|
|
|
|
|
|
|
|
|
|
|
|
|
|
|
|
|
|
|
|
|
|
|
|
|
|
|
|
|
|
|
|
|
| | | | | | | | | | | | | |
Standardized Returns | | | Fund | | | S&P 5003 | | | HFRXGL3 | | | 60/404 | |
|
|
|
|
|
|
|
|
|
|
|
|
|
|
Trailing 3 Months | | | -0.75 | % | | -11.01 | % | | 0.68 | % | | -6.46 | % |
|
|
|
|
|
|
|
|
|
|
|
|
|
|
Year-to-date | | | -0.75 | % | | -11.01 | % | | 0.68 | % | | -6.46 | % |
|
|
|
|
|
|
|
|
|
|
|
|
|
|
1-Year | | | -21.35 | % | | -38.09 | % | | -20.52 | % | | -23.35 | % |
|
|
|
|
|
|
|
|
|
|
|
|
|
|
3-Year (annualized) | | | -4.78 | % | | -13.06 | % | | -5.36 | % | | -5.59 | % |
|
|
|
|
|
|
|
|
|
|
|
|
|
|
Annualized Since Inception | | | -1.16 | % | | -7.43 | % | | -2.24 | % | | -2.38 | % |
|
|
|
|
|
|
|
|
|
|
|
|
|
|
| | | | | | | | | | | | | |
Historical Data
(since inception) | | | Fund | | | S&P 5003 | | | HFRXGL3 | | | 60/404 | |
|
|
|
|
|
|
|
|
|
|
|
|
|
|
Cumulative Return | | | -4.55 | % | | -26.57 | % | | -8.66 | % | | -9.18 | % |
|
|
|
|
|
|
|
|
|
|
|
|
|
|
Standard Deviation5 | | | 8.10 | % | | 15.90 | % | | 7.94 | % | | 10.01 | % |
|
|
|
|
|
|
|
|
|
|
|
|
|
|
Largest Drawdown6 | | | -25.22 | % | | -50.95 | % | | -25.21 | % | | -32.54 | % |
|
|
|
|
|
|
|
|
|
|
|
|
|
|
Drawdown—# of months7 | | | 17 | | | 16 | | | 14 | | | 16 | |
|
|
|
|
|
|
|
|
|
|
|
|
|
|
Recovery—# of months8 | | | N.A. | | | N.A. | | | N.A. | | | N.A. | |
|
|
|
|
|
|
|
|
|
|
|
|
|
|
| |
1. | Performance results and calculations after the Funds’ most recent fiscal year are unaudited. The principal value of the Funds will fluctuate so that an investor’s units, when redeemed, may be worth more or less than the original cost. Returns are net of all expenses of the Funds, including the management fee and incentive allocations, and reflect reinvestment of all distributions, if applicable. Returns do not reflect payment of the 5% redemption fee or up-front placement fees, which could be up to 2%, which would reduce returns shown above. Past performance does not guarantee future results and current performance may be lower or higher than the figures shown. The net expense ratio and total expense ratio for the Funds are 2.13% and 8.30%, respectively. The total expense ratio includes Acquired Fund Fees and Expenses of 6.17%. The Investment Manager has contractually agreed to waive fees and/or reimburse certain expenses for one year from the date of the most recent Prospectus so that the total annual expenses will not exceed 2.35%. Please see the current Prospectus for detailed information regarding the expenses of the Funds. |
| |
2. | Cumulative Return. Returns are net of all expenses of the Funds, including the management fee and incentive allocations, and reflect reinvestment of all distributions, if applicable. Returns do not reflect payment of placement fees, if applicable, which would reduce returns noted above. |
| |
3. | S&P 500 Index and HFRX Global Hedge Fund Index (HFRXGL) data are sourced from Bloomberg. The indices are unmanaged portfolios of securities. Their performance results do not reflect the deduction of management fees, incentive compensation, commissions or other expenses. An investor cannot invest directly in an index. The S&P 500 Index consists of 500 stocks chosen for market size, liquidity and industry group representation. It is a market value weighted index, with each stock’s weight in the Index proportionate to its market value. HFRXGL is designed to be representative of the overall composition of the hedge fund universe. It is comprised of eight strategies: convertible arbitrage, distressed securities, equity hedge, equity market neutral, event driven, macro, merger arbitrage and relative value arbitrage. The strategies are asset weighted based on the distribution of assets in the hedge fund industry. |
| |
4. | 60% S&P/40% Barclays Capital Aggregate Bond Index—The Barclays Capital Aggregate Bond Index represents securities that are SEC-registered, taxable and dollar denominated. The index covers the U.S. investment grade fixed rate bond market, with index components for government and corporate securities, mortgage pass-through securities and asset-backed securities. These major sectors are subdivided into more specific indices that are calculated and reported on a regular basis. All blended index data is sourced from Bloomberg and represents a composite that is rebalanced between indices monthly. |
| |
5. | Measurement of the investment’s volatility. |
| |
6. | The peak to trough decline of an investment. |
| |
7. | Number of months of a peak to trough decline of an investment. |
| |
8. | Number of months to recover from a drawdown. |
EIGHT
RELATIONSHIPS • ALTERNATIVES • RESULTS
PERFORMANCE SUMMARY1(UNAUDITED)
HATTERAS MULTI-STRATEGY INSTITUTIONAL FUND, L.P. (inception date: January 1, 2007)
| | | | | | | | | | | | | | | | | | | | | | | | | | | | | | | | | | | | | | | | |
Year | | | Jan | | | Feb | | | Mar | | | Apr | | | May | | | Jun | | | Jul | | | Aug | | | Sep | | | Oct | | | Nov | | | Dec | | | Year2 | |
|
|
|
|
|
|
|
|
|
|
|
|
|
|
|
|
|
|
|
|
|
|
|
|
|
|
|
|
|
|
|
|
|
|
|
|
|
|
|
|
|
2009 | | | 0.24 | % | | -0.33 | % | | -0.45 | % | | | | | | | | | | | | | | | | | | | | | | | | | | | | | -0.54 | % |
|
|
|
|
|
|
|
|
|
|
|
|
|
|
|
|
|
|
|
|
|
|
|
|
|
|
|
|
|
|
|
|
|
|
|
|
|
|
|
|
|
2008 | | | -2.85 | % | | 1.91 | % | | -2.81 | % | | 1.63 | % | | 2.14 | % | | -0.42 | % | | -2.78 | % | | -1.47 | % | | -8.22 | % | | -7.50 | % | | -4.23 | % | | -0.94 | % | | -23.27 | % |
|
|
|
|
|
|
|
|
|
|
|
|
|
|
|
|
|
|
|
|
|
|
|
|
|
|
|
|
|
|
|
|
|
|
|
|
|
|
|
|
|
2007 | | | 1.12 | % | | 0.73 | % | | 1.65 | % | | 1.89 | % | | 2.06 | % | | 0.82 | % | | 0.00 | % | | -1.89 | % | | 2.00 | % | | 2.75 | % | | -1.71 | % | | 0.97 | % | | 10.76 | % |
|
|
|
|
|
|
|
|
|
|
|
|
|
|
|
|
|
|
|
|
|
|
|
|
|
|
|
|
|
|
|
|
|
|
|
|
|
|
|
|
|
| | | | | | | | | | | | | |
Standardized Returns | | | Fund | | | S&P 5003 | | | HFRXGL3 | | | 60/404 | |
|
|
|
|
|
|
|
|
|
|
|
|
|
|
Trailing 3 Months | | | -0.54 | % | | -11.01 | % | | 0.68 | % | | -6.46 | % |
|
|
|
|
|
|
|
|
|
|
|
|
|
|
Year-to-date | | | -0.54 | % | | -11.01 | % | | 0.68 | % | | -6.46 | % |
|
|
|
|
|
|
|
|
|
|
|
|
|
|
1-Year | | | -20.69 | % | | -38.09 | % | | -20.52 | % | | -23.35 | % |
|
|
|
|
|
|
|
|
|
|
|
|
|
|
3-Year (annualized) | | | N.A. | | | N.A. | | | N.A. | | | N.A. | |
|
|
|
|
|
|
|
|
|
|
|
|
|
|
Annualized Since Inception | | | -7.20 | % | | -20.82 | % | | -9.17 | % | | -10.74 | % |
|
|
|
|
|
|
|
|
|
|
|
|
|
|
| | | | | | | | | | | | | |
Historical Data
(since inception) | | | Fund | | | S&P 5003 | | | HFRXGL3 | | | 60/404 | |
|
|
|
|
|
|
|
|
|
|
|
|
|
|
Cumulative Return | | | -15.47 | % | | -40.86 | % | | -19.46 | % | | -22.56 | % |
|
|
|
|
|
|
|
|
|
|
|
|
|
|
Standard Deviation5 | | | 9.67 | % | | 19.52 | % | | 9.49 | % | | 12.39 | % |
|
|
|
|
|
|
|
|
|
|
|
|
|
|
Largest Drawdown6 | | | -24.26 | % | | -50.95 | % | | -25.21 | % | | -32.54 | % |
|
|
|
|
|
|
|
|
|
|
|
|
|
|
Drawdown—# of months7 | | | 17 | | | 16 | | | 14 | | | 16 | |
|
|
|
|
|
|
|
|
|
|
|
|
|
|
Recovery—# of months8 | | | N.A. | | | N.A. | | | N.A. | | | N.A. | |
|
|
|
|
|
|
|
|
|
|
|
|
|
|
HATTERAS MULTI-STRATEGY TEI INSTITUTIONAL FUND, L.P. (inception date: February 1, 2007)
| | | | | | | | | | | | | | | | | | | | | | | | | | | | | | | | | | | | | | | | |
Year | | | Jan | | | Feb | | | Mar | | | Apr | | | May | | | Jun | | | Jul | | | Aug | | | Sep | | | Oct | | | Nov | | | Dec | | | Year2 | |
|
|
|
|
|
|
|
|
|
|
|
|
|
|
|
|
|
|
|
|
|
|
|
|
|
|
|
|
|
|
|
|
|
|
|
|
|
|
|
|
|
2009 | | | 0.24 | % | | -0.32 | % | | -0.43 | % | | | | | | | | | | | | | | | | | | | | | | | | | | | | | -0.52 | % |
|
|
|
|
|
|
|
|
|
|
|
|
|
|
|
|
|
|
|
|
|
|
|
|
|
|
|
|
|
|
|
|
|
|
|
|
|
|
|
|
|
2008 | | | -2.87 | % | | 1.87 | % | | -2.83 | % | | 1.59 | % | | 2.09 | % | | -0.44 | % | | -2.82 | % | | -1.50 | % | | -8.26 | % | | -7.51 | % | | -4.24 | % | | -0.91 | % | | -23.48 | % |
|
|
|
|
|
|
|
|
|
|
|
|
|
|
|
|
|
|
|
|
|
|
|
|
|
|
|
|
|
|
|
|
|
|
|
|
|
|
|
|
|
2007 | | | | | | 0.71 | % | | 1.62 | % | | 1.87 | % | | 2.03 | % | | 0.80 | % | | -0.04 | % | | -1.95 | % | | 2.01 | % | | 2.72 | % | | -1.76 | % | | 0.96 | % | | 9.23 | % |
|
|
|
|
|
|
|
|
|
|
|
|
|
|
|
|
|
|
|
|
|
|
|
|
|
|
|
|
|
|
|
|
|
|
|
|
|
|
|
|
|
| | | | | | | | | | | | | |
Standardized Returns | | | Fund | | | S&P 5003 | | | HFRXGL3 | | | 60/404 | |
|
|
|
|
|
|
|
|
|
|
|
|
|
|
Trailing 3 Months | | | -0.52 | % | | -11.01 | % | | 0.68 | % | | -6.46 | % |
|
|
|
|
|
|
|
|
|
|
|
|
|
|
Year-to-date | | | -0.52 | % | | -11.01 | % | | 0.68 | % | | -6.46 | % |
|
|
|
|
|
|
|
|
|
|
|
|
|
|
1-Year | | | -20.79 | % | | -38.09 | % | | -20.52 | % | | -23.35 | % |
|
|
|
|
|
|
|
|
|
|
|
|
|
|
3-Year (annualized) | | | N.A. | | | N.A. | | | N.A. | | | N.A. | |
|
|
|
|
|
|
|
|
|
|
|
|
|
|
Annualized Since Inception | | | -8.16 | % | | -22.07 | % | | -10.13 | % | | -11.49 | % |
|
|
|
|
|
|
|
|
|
|
|
|
|
|
| | | | | | | | | | | | | |
Historical Data
(since inception) | | | Fund | | | S&P 5003 | | | HFRXGL3 | | | 60/404 | |
|
|
|
|
|
|
|
|
|
|
|
|
|
|
Cumulative Return | | | -16.85 | % | | -41.74 | % | | -20.65 | % | | -23.25 | % |
|
|
|
|
|
|
|
|
|
|
|
|
|
|
Standard Deviation5 | | | 9.79 | % | | 19.77 | % | | 9.55 | % | | 12.58 | % |
|
|
|
|
|
|
|
|
|
|
|
|
|
|
Largest Drawdown6 | | | -24.50 | % | | -50.95 | % | | -25.21 | % | | -32.54 | % |
|
|
|
|
|
|
|
|
|
|
|
|
|
|
Drawdown—# of months7 | | | 17 | | | 16 | | | 14 | | | 16 | |
|
|
|
|
|
|
|
|
|
|
|
|
|
|
Recovery—# of months8 | | | N.A. | | | N.A. | | | N.A. | | | N.A. | |
|
|
|
|
|
|
|
|
|
|
|
|
|
|
| |
1. | Performance results and calculations after the Funds’ most recent fiscal year are unaudited. The principal value of the Funds will fluctuate so that an investor’s units, when redeemed, may be worth more or less than the original cost. Returns are net of all expenses of the Funds, including the management fee and incentive allocations, and reflect reinvestment of all distributions, if applicable. Returns do not reflect payment of the 5% redemption fee or up-front placement fees, which could be up to 2%, which would reduce returns shown above. Past performance does not guarantee future results and current performance may be lower or higher than the figures shown. The net expense ratio and total expense ratio for the Hatteras Multi-Strategy Institutional Fund, L.P. are 1.37% and 7.54%, respectively. The net expense ratio and total expense ratio for the Hatteras Multi-Strategy TEI Institutional Fund, L.P. are 1.40% and 7.57%, respectively. The total expense ratio for both funds includes Acquired Fund Fees and Expenses of 6.17%. The Investment Manager has contractually agreed to waive fees and/or reimburse certain expenses for one year from the date of the most recent Prospectus so that the total annual expenses will not exceed 1.75%. Please see the current Prospectus for detailed information regarding the expenses of the Funds. |
| |
2. | Cumulative Return. Returns are net of all expenses of the Funds, including the management fee and incentive allocations, and reflect reinvestment of all distributions, if applicable. Returns do not reflect payment of placement fees, if applicable, which would reduce returns noted above. |
| |
3. | S&P 500 Index and HFRX Global Hedge Fund Index (HFRXGL) data are sourced from Bloomberg. The indices are unmanaged portfolios of securities. Their performance results do not reflect the deduction of management fees, incentive compensation, commissions or other expenses. An investor cannot invest directly in an index. The S&P 500 Index consists of 500 stocks chosen for market size, liquidity and industry group representation. It is a market value weighted index, with each stock’s weight in the Index proportionate to its market value. HFRXGL is designed to be representative of the overall composition of the hedge fund universe. It is comprised of eight strategies: convertible arbitrage, distressed securities, equity hedge, equity market neutral, event driven, macro, merger arbitrage and relative value arbitrage. The strategies are asset weighted based on the distribution of assets in the hedge fund industry. |
| |
4. | 60% S&P/40% Barclays Capital Aggregate Bond Index—The Barclays Capital Aggregate Bond Index represents securities that are SEC-registered, taxable and dollar denominated. The index covers the U.S. investment grade fixed rate bond market, with index components for government and corporate securities, mortgage pass-through securities and asset-backed securities. These major sectors are subdivided into more specific indices that are calculated and reported on a regular basis. All blended index data is sourced from Bloomberg and represents a composite that is rebalanced between indices monthly. |
| |
5. | Measurement of the investment’s volatility. |
| |
6. | The peak to trough decline of an investment. |
| |
7. | Number of months of a peak to trough decline of an investment. |
| |
8. | Number of months to recover from a drawdown. |
NINE
STRATEGY(UNAUDITED)
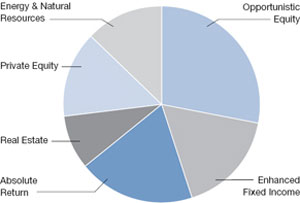
ALLOCATION
| | | | | | | | | | | | | |
Strategies | | Target
Allocation | | Actual
Allocation1 | | # of Funds | |
|
|
|
|
|
|
|
|
Opportunistic Equity (OE) | | | 25 | % | | | 27 | % | | | 25 | | |
|
|
|
|
|
|
|
|
|
|
|
|
|
|
Enhanced Fixed Income (EFI) | | | 25 | % | | | 18 | % | | | 18 | | |
|
|
|
|
|
|
|
|
|
|
|
|
|
|
Absolute Return (AR) | | | 20 | % | | | 18 | % | | | 16 | | |
|
|
|
|
|
|
|
|
|
|
|
|
|
|
Real Estate (RE) | | | 10 | % | | | 9 | % | | | 26 | | |
|
|
|
|
|
|
|
|
|
|
|
|
|
|
Private Equity (PE) | | | 10 | % | | | 14 | % | | | 54 | | |
|
|
|
|
|
|
|
|
|
|
|
|
|
|
Energy & Natural Resources (ENR) | | | 10 | % | | | 14 | % | | | 29 | | |
|
|
|
|
|
|
|
|
|
|
|
|
|
|
Total | | | | | | | | | | | 168 | | |
|
|
|
|
|
|
|
|
|
|
|
|
|
|
STRATEGY ALLOCATION1
CONTRIBUTION
HATTERAS MULTI-STRATEGY FUND, L.P. (inception date: April 1, 2005)
| | | | | | | | | |
Strategy Performance2 | | Fiscal Year | | ITD%4 | |
|
|
|
|
|
|
|
|
|
|
Opportunistic Equity | | | -18.64 | % | | | 6.36 | % | |
|
|
|
|
|
|
|
|
|
|
Enhanced Fixed Income | | | -26.48 | % | | | -19.10 | % | |
|
|
|
|
|
|
|
|
|
|
Absolute Return | | | -15.16 | % | | | -2.47 | % | |
|
|
|
|
|
|
|
|
|
|
Real Estate | | | -32.13 | % | | | -22.75 | % | |
|
|
|
|
|
|
|
|
|
|
Private Equity | | | -12.83 | % | | | -2.51 | % | |
|
|
|
|
|
|
|
|
|
|
Energy & Natural Resources | | | -25.32 | % | | | 7.41 | % | |
|
|
|
|
|
|
|
|
|
|
| | | | | |
Strategy Contribution3 | | Fiscal Year | | ITD%4 | |
|
|
|
|
|
|
|
|
|
|
Opportunistic Equity | | | -5.32 | % | | | 3.58 | % | |
|
|
|
|
|
|
|
|
|
|
Enhanced Fixed Income | | | -5.68 | % | | | -3.96 | % | |
|
|
|
|
|
|
|
|
|
|
Absolute Return | | | -2.81 | % | | | -0.48 | % | |
|
|
|
|
|
|
|
|
|
|
Real Estate | | | -3.38 | % | | | -2.48 | % | |
|
|
|
|
|
|
|
|
|
|
Private Equity | | | -1.67 | % | | | -1.10 | % | |
|
|
|
|
|
|
|
|
|
|
Energy & Natural Resources | | | -3.55 | % | | | 0.74 | % | |
|
|
|
|
|
|
|
|
|
|
| |
1. | Percentages are based on total portfolio investments exclusive of cash, cash equivalents, money market funds, and short-term investments. |
| |
2. | Strategy Performance: The above illustration offers historical performance for each individual strategy as a composite of the actual underlying advisory funds. The historical performance shown indicates how each strategy (composite) performed on a stand-alone basis, net of all fees. However, none of the (composite) strategies shown above are offered as stand-alone investments. This is not meant to predict or project results into the future, nor is it intended to portray performance of the Fund. |
| |
3. | Strategy Contribution: The above illustration attempts to break down the pro rata contribution of the six strategies of the Fund (in other words, their contribution to the Fund’s overall return) by strategy, and is intended to allocate the portion of the (past) performance that is attributable to the particular strategy. It is not meant to predict or project results into the future, nor is it intended to portray performance of the Fund. |
| |
4. | ITD = Inception to date. |
TEN
RELATIONSHIPS • ALTERNATIVES • RESULTS
STRATEGY (UNAUDITED)
HATTERAS MULTI-STRATEGY TEI FUND, L.P. (inception date: April 1, 2005)
| | | | | | | | | |
Strategy Performance2 | | Fiscal Year | | ITD%4 | |
|
|
|
|
|
|
|
Opportunistic Equity | | | -18.73 | % | | | 5.42 | % | |
|
|
|
|
|
|
|
|
|
|
Enhanced Fixed Income | | | -26.55 | % | | | -19.81 | % | |
|
|
|
|
|
|
|
|
|
|
Absolute Return | | | -15.26 | % | | | -3.33 | % | |
|
|
|
|
|
|
|
|
|
|
Real Estate | | | -32.20 | % | | | -23.43 | % | |
|
|
|
|
|
|
|
|
|
|
Private Equity | | | -12.92 | % | | | -3.37 | % | |
|
|
|
|
|
|
|
|
|
|
Energy & Natural Resources | | | -25.41 | % | | | 6.47 | % | |
|
|
|
|
|
|
|
|
|
|
| | | | | | | | | |
Strategy Contribution3 | | Fiscal Year | | ITD%4 | |
|
|
|
|
|
|
|
|
|
|
Opportunistic Equity | | | -5.35 | % | | | 3.34 | % | |
|
|
|
|
|
|
|
|
|
|
Enhanced Fixed Income | | | -5.70 | % | | | -4.11 | % | |
|
|
|
|
|
|
|
|
|
|
Absolute Return | | | -2.83 | % | | | -0.63 | % | |
|
|
|
|
|
|
|
|
|
|
Real Estate | | | -3.39 | % | | | -2.57 | % | |
|
|
|
|
|
|
|
|
|
|
Private Equity | | | -1.68 | % | | | -1.21 | % | |
|
|
|
|
|
|
|
|
|
|
Energy & Natural Resources | | | -3.56 | % | | | 0.63 | % | |
|
|
|
|
|
|
|
|
|
|
HATTERAS MULTI-STRATEGY INSTITUTIONAL FUND, L.P. (inception date: January 1, 2007)
| | | | | | | | | |
Strategy Performance2 | | Fiscal Year | | ITD%4 | |
|
|
|
|
|
|
|
|
|
|
Opportunistic Equity | | | -18.05 | % | | | -13.00 | % | |
|
|
|
|
|
|
|
|
|
|
Enhanced Fixed Income | | | -25.94 | % | | | -27.32 | % | |
|
|
|
|
|
|
|
|
|
|
Absolute Return | | | -14.55 | % | | | -7.48 | % | |
|
|
|
|
|
|
|
|
|
|
Real Estate | | | -31.63 | % | | | -35.64 | % | |
|
|
|
|
|
|
|
|
|
|
Private Equity | | | -12.20 | % | | | -5.55 | % | |
|
|
|
|
|
|
|
|
|
|
Energy & Natural Resources | | | -24.78 | % | | | -13.40 | % | |
|
|
|
|
|
|
|
|
|
|
| | | | | | | | | |
Strategy Contribution3 | | Fiscal Year | | ITD%4 | |
|
|
|
|
|
|
|
|
|
|
Opportunistic Equity | | | -4.84 | % | | | -2.64 | % | |
|
|
|
|
|
|
|
|
|
|
Enhanced Fixed Income | | | -5.38 | % | | | -5.75 | % | |
|
|
|
|
|
|
|
|
|
|
Absolute Return | | | -2.49 | % | | | -0.92 | % | |
|
|
|
|
|
|
|
|
|
|
Real Estate | | | -3.21 | % | | | -3.80 | % | |
|
|
|
|
|
|
|
|
|
|
Private Equity | | | -1.44 | % | | | -0.97 | % | |
|
|
|
|
|
|
|
|
|
|
Energy & Natural Resources | | | -3.33 | % | | | -1.39 | % | |
|
|
|
|
|
|
|
|
|
|
HATTERAS MULTI-STRATEGY TEI INSTITUTIONAL FUND, L.P. (inception date: February 1, 2007)
| | | | | | | | | |
Strategy Performance2 | | Fiscal Year | | ITD%4 | |
|
|
|
|
|
|
|
|
|
|
Opportunistic Equity | | | -18.19 | % | | | -13.15 | % | |
|
|
|
|
|
|
|
|
|
|
Enhanced Fixed Income | | | -26.06 | % | | | -28.05 | % | |
|
|
|
|
|
|
|
|
|
|
Absolute Return | | | -14.70 | % | | | -9.16 | % | |
|
|
|
|
|
|
|
|
|
|
Real Estate | | | -31.74 | % | | | -36.43 | % | |
|
|
|
|
|
|
|
|
|
|
Private Equity | | | -12.34 | % | | | -6.61 | % | |
|
|
|
|
|
|
|
|
|
|
Energy & Natural Resources | | | -24.90 | % | | | -12.77 | % | |
|
|
|
|
|
|
|
|
|
|
| | | | | | | | | |
Strategy Contribution3 | | Fiscal Year | | ITD%4 | |
|
|
|
|
|
|
|
|
|
|
Opportunistic Equity | | | -4.88 | % | | | -2.98 | % | |
|
|
|
|
|
|
|
|
|
|
Enhanced Fixed Income | | | -5.41 | % | | | -6.01 | % | |
|
|
|
|
|
|
|
|
|
|
Absolute Return | | | -2.51 | % | | | -1.39 | % | |
|
|
|
|
|
|
|
|
|
|
Real Estate | | | -3.22 | % | | | -3.90 | % | |
|
|
|
|
|
|
|
|
|
|
Private Equity | | | -1.46 | % | | | -1.17 | % | |
|
|
|
|
|
|
|
|
|
|
Energy & Natural Resources | | | -3.34 | % | | | -1.40 | % | |
|
|
|
|
|
|
|
|
|
|
| |
1. | Percentages are based on total portfolio investments exclusive of cash, cash equivalents, money market funds, and short-term investments. |
| |
2. | Strategy Performance: The above illustration offers historical performance for each individual strategy as a composite of the actual underlying advisory funds. The historical performance shown indicates how each strategy (composite) performed on a stand-alone basis, net of all fees. However, none of the (composite) strategies shown above are offered as stand-alone investments. This is not meant to predict or project results into the future, nor is it intended to portray performance of the Fund. |
| |
3. | Strategy Contribution: The above illustration attempts to break down the pro rata contribution of the six strategies of the Fund (in other words, their contribution to the Fund’s overall return) by strategy, and is intended to allocate the portion of the (past) performance that is attributable to the particular strategy. It is not meant to predict or project results into the future, nor is it intended to portray performance of the Fund. |
| |
4. | ITD = Inception to date. |
ELEVEN
TOP 10 HOLDINGS (UNAUDITED)
| | | | | | | | | | | |
| | Capital Balance,
March 31, 2009 | | Percent of
Partners’ Capital | |
|
|
|
|
|
|
|
|
Paulson Advantage, L.P. | | | $ | 35,471,967 | | | | | 3.09 | % | |
|
|
|
|
|
|
|
|
|
|
|
|
Samlyn Onshore Fund, L.P. | | | | 33,916,341 | | | | | 2.95 | % | |
|
|
|
|
|
|
|
|
|
|
|
|
Southport Energy Plus Partners, L.P. | | | | 32,457,507 | | | | | 2.82 | % | |
|
|
|
|
|
|
|
|
|
|
|
|
Pipe Equity Partners, LLC | | | | 30,770,822 | | | | | 2.68 | % | |
|
|
|
|
|
|
|
|
|
|
|
|
D.E. Shaw Oculus Fund, LLC | | | | 30,525,093 | | | | | 2.66 | % | |
|
|
|
|
|
|
|
|
|
|
|
|
Standard Pacific Asymmetric Opportunities Fund, L.P. | | | | 28,775,206 | | | | | 2.50 | % | |
|
|
|
|
|
|
|
|
|
|
|
|
BDCM Partners I, L.P. | | | | 28,342,769 | | | | | 2.47 | % | |
|
|
|
|
|
|
|
|
|
|
|
|
Touradji Global Resources Fund, L.P. | | | | 26,707,188 | | | | | 2.32 | % | |
|
|
|
|
|
|
|
|
|
|
|
|
Miura Global Partners II, L.P. | | | | 25,916,209 | | | | | 2.26 | % | |
|
|
|
|
|
|
|
|
|
|
|
|
Asian Century Quest Fund (QP), L.P. | | | | 23,937,432 | | | | | 2.08 | % | |
|
|
|
|
|
|
|
|
|
|
|
|
*Top 10 Holdings are exclusive of cash, cash equivalents, money market funds, and short-term investments.
TWELVE

FINANCIAL SECTION
For the Year Ended March 31, 2009
THIRTEEN
THIS PAGE INTENTIONALLY LEFT BLANK.
HATTERAS FUNDS
Hatteras Multi-Strategy Fund, L.P. (a Delaware Limited Partnership)
Hatteras Multi-Strategy TEI Fund, L.P. (a Delaware Limited Partnership)
Hatteras Multi-Strategy Institutional Fund, L.P. (a Delaware Limited Partnership)
Hatteras Multi-Strategy TEI Institutional Fund, L.P. (a Delaware Limited Partnership)
Financial Statements
For the year ended March 31, 2009
with Report of Independent Registered Public Accounting Firm
HATTERAS FUNDS
For the year ended March 31, 2009
Hatteras Multi-Strategy Fund, L.P. (a Delaware Limited Partnership)
Hatteras Multi-Strategy TEI Fund, L.P. (a Delaware Limited Partnership)
Hatteras Multi-Strategy Institutional Fund, L.P. (a Delaware Limited Partnership)
Hatteras Multi-Strategy TEI Institutional Fund, L.P. (a Delaware Limited Partnership)
Table of Contents
| |

| Deloitte & Touche LLP |
1700 Market Street |
Philadelphia, PA 19103-3984 |
USA |
|
Tel: +1 215 246 2300 |
| Fax: +1 215 569 2441 |
| www.deloitte.com |
REPORT OF INDEPENDENT REGISTERED PUBLIC ACCOUNTING FIRM
To the Board of Directors and Partners of Hatteras Multi-Strategy Fund, L.P., Hatteras Multi-Strategy TEI Fund, L.P., Hatteras Multi-Strategy Institutional Fund, L.P., and Hatteras Multi-Strategy TEI Institutional Fund, L.P.:
We have audited the accompanying statements of assets, liabilities, and partners’ capital of Hatteras Multi-Strategy Fund, L.P. (formerly known as Hatteras Multi-Strategy Fund I, L.P.), Hatteras Multi-Strategy TEI Fund, L.P., Hatteras Multi-Strategy Institutional Fund, L.P., and Hatteras Multi-Strategy TEI Institutional Fund, L.P. (all Delaware Limited Partnerships) (collectively the “Feeder Funds”) and the related statements of operations and cash flows for the year then ended, and the statements of changes in partners’ capital for each of the two years in the period then ended. These financial statements are the responsibility of the Feeder Funds’ management. Our responsibility is to express an opinion on these financial statements based on our audits.
We conducted our audits in accordance with the standards of the Public Company Accounting Oversight Board (United States). Those standards require that we plan and perform the audit to obtain reasonable assurance about whether the financial statements are free of material misstatement. The Feeder Funds are not required to have, nor were we engaged to perform, an audit of their internal control over financial reporting. Our audits included consideration of internal control over financial reporting as a basis for designing audit procedures that are appropriate in the circumstances, but not for the purpose of expressing an opinion on the effectiveness of the Feeder Funds’ internal control over financial reporting. Accordingly, we express no such opinion. An audit also includes examining, on a test basis, evidence supporting the amounts and disclosures in the financial statements, assessing the accounting principles used and significant estimates made by management, as well as evaluating the overall financial statement presentation. We believe that our audits provide a reasonable basis for our opinion.
In our opinion, the financial statements referred to above present fairly, in all material respects, the financial position of each of the Feeder Funds as of March 31, 2009, the results of their operations and their cash flows for the year then ended, and the changes in their partners’ capital for each of the two years in the period then ended, in conformity with accounting principles generally accepted in the United States of America.
| |

| |
| |
May 29, 2009 | |
| |
| Member of |
| Deloitte Touche Tohmatsu |
HATTERAS FUNDS
STATEMENTSOF ASSETS, LIABILITIESAND PARTNERS’ CAPITAL March 31, 2009
| | | | | | | | | | | | | |
| | Hatteras
Multi-Strategy
Fund, L.P.** | | Hatteras
Multi-Strategy
TEI
Fund, L.P.*,** | | Hatteras
Multi-Strategy
Institutional
Fund, L.P. | | Hatteras
Multi-Strategy
TEI
Institutional
Fund, L.P.* | |
|
|
|
|
|
|
|
|
|
|
|
|
|
|
Assets | | | | | | | | | | | | | |
Investment in Hatteras Master Fund, L.P., at fair value (cost $234,324,259, $316,594,178, $258,093,854, $480,511,479), respectively | | $ | 215,319,897 | | $ | 257,919,029 | | $ | 202,701,499 | | $ | 384,917,712 | |
Cash and cash equivalents | | | 250,000 | | | 305,000 | | | 150,000 | | | 155,000 | |
Receivable for withdrawals from
Hatteras Master Fund, L.P. | | | 15,133,144 | | | 21,132,022 | | | 13,746,149 | | | 14,121,088 | |
Investment in Hatteras Master Fund, L.P. paid in advance | | | 2,866,239 | | | 3,077,935 | | | 5,184,080 | | | 7,641,135 | |
Interest receivable | | | 30,166 | | | 166 | | | 38 | | | 34 | |
Prepaid assets | | | 41,784 | | | 42,518 | | | 41,911 | | | 40,024 | |
Receivable from affiliate | | | — | | | 124,098 | | | 100,000 | | | 200,000 | |
|
|
|
|
|
|
|
|
|
|
|
|
|
|
Total assets | | $ | 233,641,230 | | $ | 282,600,768 | | $ | 221,923,677 | | $ | 407,074,993 | |
|
|
|
|
|
|
|
|
|
|
|
|
|
|
Liabilities and partners’ capital | | | | | | | | | | | | | |
Withdrawals payable | | $ | 15,127,553 | | $ | 21,151,874 | | $ | 13,679,607 | | $ | 14,108,545 | |
Contributions received in advance | | | 3,074,900 | | | 3,319,900 | | | 5,225,000 | | | 7,702,269 | |
Servicing fee payable | | | 163,212 | | | 197,469 | | | 18,058 | | | 33,246 | |
Professional fees payable | | | 51,351 | | | 31,118 | | | 50,689 | | | 24,577 | |
Accounting and administration fees payable | | | 30,884 | | | 34,811 | | | 27,801 | | | 42,907 | |
Custodian fees payable | | | 350 | | | 2,356 | | | 94 | | | 1,981 | |
Due to affiliates | | | — | | | 200,000 | | | — | | | 100,000 | |
Withholding tax payable | | | — | | | 125,000 | | | — | | | 125,000 | |
Other accrued expenses | | | 28,010 | | | 34,069 | | | 23,941 | | | 35,229 | |
|
|
|
|
|
|
|
|
|
|
|
|
|
|
Total liabilities | | | 18,476,260 | | | 25,096,597 | | | 19,025,190 | | | 22,173,754 | |
|
|
|
|
|
|
|
|
|
|
|
|
|
|
Partners’ capital | | | 215,164,970 | | | 257,504,171 | | | 202,898,487 | | | 384,901,239 | |
|
|
|
|
|
|
|
|
|
|
|
|
|
|
Total liabilities and partners’ capital | | $ | 233,641,230 | | $ | 282,600,768 | | $ | 221,923,677 | | $ | 407,074,993 | |
|
|
|
|
|
|
|
|
|
|
|
|
|
|
Partners’ capital | | | | | | | | | | | | | |
Capital contributions (net) | | | 264,325,527 | | | 324,276,730 | | | 259,245,761 | | | 482,566,034 | |
Accumulated net investment loss | | | (10,387,533 | ) | | (13,514,084 | ) | | (3,417,546 | ) | | (6,018,361 | ) |
Accumulated net realized loss | | | (18,747,378 | ) | | (22,785,574 | ) | | (19,303,158 | ) | | (35,966,821 | ) |
Accumulated net unrealized depreciation on investments | | | (20,025,646 | ) | | (30,472,901 | ) | | (33,626,570 | ) | | (55,679,613 | ) |
|
|
|
|
|
|
|
|
|
|
|
|
|
|
Partners’ capital | | $ | 215,164,970 | | $ | 257,504,171 | | $ | 202,898,487 | | $ | 384,901,239 | |
|
|
|
|
|
|
|
|
|
|
|
|
|
|
Net asset value per share | | $ | 76.29 | | $ | 76.27 | | $ | 76.71 | | $ | 76.66 | |
Maximum offering price per share | | $ | 77.82 | | $ | 77.80 | | $ | 76.71 | | $ | 76.66 | |
Number of authorized units | | | 7,500,000.00 | | | 7,500,000.00 | | | 7,500,000.00 | | | 7,500,000.00 | |
Number of outstanding units | | | 2,820,356.14 | | | 3,376,218.32 | | | 2,645,007.00 | | | 5,020,887.54 | |
| |
* | Consolidated Statement. See note 1. |
| |
** | The maximum sales load for the Hatteras Multi-Strategy Fund, L.P. and the Hatteras Multi-Strategy TEI Fund, L.P. is 2.00%. The remaining funds are not subject to a sales load. |
See notes to financial statements.
TWO
HATTERAS FUNDS
For the year ended March 31, 2009
| | | | | | | | | | | | | |
| | Hatteras
Multi-Strategy
Fund, L.P. | | Hatteras
Multi-Strategy
TEI Fund,
L.P.* | | Hatteras
Multi-Strategy
Institutional
Fund, L.P. | | Hatteras
Multi-Strategy
TEI
Institutional
Fund, L.P.* | |
|
|
|
|
|
|
|
|
|
|
Net investment loss allocated from Hatteras Master Fund, L.P. | | | | | | | | | | | | | |
Dividends | | $ | 878,666 | | $ | 1,086,923 | | $ | 706,952 | | $ | 1,165,073 | |
Expenses | | | (3,096,181 | ) | | (3,806,649 | ) | | (2,588,023 | ) | | (4,405,220 | ) |
|
|
|
|
|
|
|
|
|
|
|
|
|
|
Net investment loss allocated from Hatteras Master Fund, L.P. | | | (2,217,515 | ) | | (2,719,726 | ) | | (1,881,071 | ) | | (3,240,147 | ) |
|
|
|
|
|
|
|
|
|
|
|
|
|
|
Feeder Fund investment income | | | | | | | | | | | | | |
Interest | | | 63,971 | | | 41,179 | | | 12,350 | | | 16,811 | |
Other revenue | | | — | | | 292,146 | | | — | | | 49,503 | |
|
|
|
|
|
|
|
|
|
|
|
|
|
|
Total fund investment income | | | 63,971 | | | 333,325 | | | 12,350 | | | 66,314 | |
|
|
|
|
|
|
|
|
|
|
|
|
|
|
Feeder Fund expenses | | | | | | | | | | | | | |
Servicing fee | | | 2,081,771 | | | 2,552,902 | | | 164,323 | | | 284,663 | |
Accounting and administration fees | | | 186,831 | | | 239,051 | | | 157,958 | | | 236,761 | |
Professional fees | | | 83,704 | | | 36,136 | | | 39,224 | | | 11,994 | |
Registration fees | | | 111,388 | | | 112,413 | | | 161,010 | | | 149,874 | |
Insurance fees | | | 1,032 | | | 1,036 | | | — | | | 1,314 | |
Printing fees | | | — | | | — | | | 72,338 | | | 96,575 | |
Custodian fees | | | — | | | 7,545 | | | — | | | 3,240 | |
Withholding tax | | | — | | | 615,783 | | | — | | | 649,177 | |
Other expenses | | | 175,669 | | | 177,335 | | | 68,207 | | | 79,200 | |
|
|
|
|
|
|
|
|
|
|
|
|
|
|
Total Feeder Fund expenses | | | 2,640,395 | | | 3,742,201 | | | 663,060 | | | 1,512,798 | |
|
|
|
|
|
|
|
|
|
|
|
|
|
|
Net investment loss | | | (4,793,939 | ) | | (6,128,602 | ) | | (2,531,781 | ) | | (4,686,631 | ) |
|
|
|
|
|
|
|
|
|
|
|
|
|
|
Realized loss and change in unrealized appreciation/(depreciation) on investments allocated from Hatteras Master Fund, L.P. | | | | | | | | | | | | | |
Net realized loss from investments in Underlying Funds | | | (21,617,812 | ) | | (26,166,822 | ) | | (20,261,882 | ) | | (37,112,434 | ) |
Net change in unrealized appreciation/(depreciation) on investments in Underlying Funds | | | (37,383,867 | ) | | (43,956,668 | ) | | (31,841,141 | ) | | (51,680,470 | ) |
|
|
|
|
|
|
|
|
|
|
|
|
|
|
Net realized loss and change in unrealized appreciation/(depreciation) on investments in Underlying Funds allocated from Hatteras Master Fund, L.P. | | | (59,001,679 | ) | | (70,123,490 | ) | | (52,103,023 | ) | | (88,792,904 | ) |
|
|
|
|
|
|
|
|
|
|
|
|
|
|
Net decrease in partners’ capital resulting from operations | | $ | (63,795,618 | ) | $ | (76,252,092 | ) | $ | (54,634,804 | ) | $ | (93,479,535 | ) |
|
|
|
|
|
|
|
|
|
|
|
|
|
|
| |
* | Consolidated Statement. See note 1. |
| |
See notes to financial statements. |
THREE
HATTERAS FUNDS
STATEMENTS OF CHANGES IN PARTNERS’ CAPITAL For the years ended March 31, 2008 and 2009
| | | | | | | | | | |
| | Hatteras Multi-Strategy
Fund, L.P. | |
| |
|
|
| | General
Partner | | Limited
Partners | | Total
Partners | |
|
|
|
|
|
|
|
|
Partners’ Capital, at March 31, 2007 | | $ | 300,863 | | $ | 135,996,367 | | $ | 136,297,230 | |
Capital contributions | | | — | | | 129,868,288 | | | 129,868,288 | |
Capital contributions from Topiary Feeder Fund (Note 1) | | | — | | | — | | | — | |
Capital withdrawals | | | (833,342 | ) | | (30,452,180 | ) | | (31,285,522 | ) |
Net investment loss | | | — | | | (3,309,758 | ) | | (3,309,758 | ) |
Net realized gain from investments | | | — | | | 2,168,522 | | | 2,168,522 | |
Net change in unrealized appreciation/(depreciation) on investments | | | — | | | 3,290,645 | | | 3,290,645 | |
Actual Performance Allocation from January 1, 2007 to December 31, 2007 | | | 833,342 | | | (833,342 | ) | | — | |
Reverse accrued Performance Allocation from January 1, 2007 to March 31, 2007 | | | (300,863 | ) | | 300,863 | | | — | |
Accrued Performance Allocation from January 1, 2008 to March 31, 2008 | | | — | | | — | | | — | |
|
|
|
|
|
|
|
|
|
|
|
Partners’ Capital, at March 31, 2008** | | $ | — | | $ | 237,029,405 | | $ | 237,029,405 | |
Capital contributions | | | — | | | 100,849,100 | | | 100,849,100 | |
Capital withdrawals | | | (41,336 | ) | | (59,019,097 | ) | | (59,060,433 | ) |
Withdrawal fees | | | — | | | 142,516 | | | 142,516 | |
Net investment loss | | | — | | | (4,793,939 | ) | | (4,793,939 | ) |
Net realized loss from investments in Underlying Funds | | | — | | | (21,617,812 | ) | | (21,617,812 | ) |
Net change in unrealized appreciation/(depreciation) on investments in Underlying Funds | | | — | | | (37,383,867 | ) | | (37,383,867 | ) |
Performance Allocation | | | 41,336 | | | (41,336 | ) | | — | |
|
|
|
|
|
|
|
|
|
|
|
Partners’ Capital, at March 31, 2009*** | | $ | — | | $ | 215,164,970 | | $ | 215,164,970 | |
|
|
|
|
|
|
|
|
|
|
|
| |
* | Consolidated Statement. See note 1. |
| |
** | Including accumulated net investment loss of $5,593,594, $7,387,482, $885,765 and $1,331,730 respectively. |
| |
*** | Including accumulated net investment loss of $10,387,533, $13,514,084, $3,417,546 and $6,018,361 respectively. |
| |
See notes to financial statements. |
FOUR
| | | | | | | | | | | | | | | | | | | | | | | | | | | | |
| | Hatteras Multi-Strategy
TEI Fund, L.P.* | | Hatteras Multi-Strategy
Institutional Fund, L.P. | | Hatteras Multi-Strategy
TEI Institutional Fund, L.P.* | |
| |
|
|
|
|
|
|
| | General
Partner | | Limited
Partners | | Total
Partners | | General
Partner | | Limited
Partners | | Total
Partners | | General
Partner | | Limited
Partners | | Total
Partners | |
|
|
|
|
|
|
|
|
|
|
|
|
|
|
|
|
|
|
|
|
Partners’ Capital, at March 31, 2007 | | $ | 268,982 | | $ | 129,979,876 | | $ | 130,248,858 | | $ | 16,124 | | $ | 9,418,409 | | $ | 9,434,533 | | $ | 6,107 | | $ | 4,047,170 | | $ | 4,053,277 | |
Capital contributions | | | — | | | 137,707,362 | | | 137,707,362 | | | — | | | 142,965,982 | | | 142,965,982 | | | — | | | 210,188,263 | | | 210,188,263 | |
Capital contributions from Topiary Feeder Fund (Note 1) | | | — | | | 88,340,142 | | | 88,340,142 | | | — | | | — | | | — | | | — | | | — | | | — | |
Capital withdrawals | | | (784,533 | ) | | (49,119,532 | ) | | (49,904,065 | ) | | (147,547 | ) | | (479,354 | ) | | (626,901 | ) | | (128,194 | ) | | (160,251 | ) | | (288,445 | ) |
Net investment loss | | | — | | | (5,002,382 | ) | | (5,002,382 | ) | | — | | | (824,192 | ) | | (824,192 | ) | | — | | | (1,270,232 | ) | | (1,270,232 | ) |
Net realized gain from investments | | | — | | | 2,729,681 | | | 2,729,681 | | | — | | | 916,507 | | | 916,507 | | | — | | | 1,127,563 | | | 1,127,563 | |
Net change in unrealized appreciation/(depreciation) on investments | | | — | | | 645,507 | | | 645,507 | | | — | | | (1,984,318 | ) | | (1,984,318 | ) | | — | | | (4,072,964 | ) | | (4,072,964 | ) |
Actual Performance Allocation from January 1, 2007 to December 31, 2007 | | | 784,533 | | | (784,533 | ) | | — | | | 147,547 | | | (147,547 | ) | | — | | | 128,194 | | | (128,194 | ) | | — | |
Reverse accrued Performance Allocation from January 1, 2007 to March 31, 2007 | | | (268,982 | ) | | 268,982 | | | — | | | (16,124 | ) | | 16,124 | | | — | | | (6,107 | ) | | 6,107 | | | — | |
Accrued Performance Allocation from January 1, 2008 to March 31, 2008 | | | — | | | — | | | — | | | — | | | — | | | — | | | — | | | — | | | — | |
|
|
|
|
|
|
|
|
|
|
|
|
|
|
|
|
|
|
|
|
|
|
|
|
|
|
|
|
|
Partners’ Capital, at March 31, 2008** | | $ | — | | $ | 304,765,103 | | $ | 304,765,103 | | $ | — | | $ | 149,881,611 | | $ | 149,881,611 | | $ | — | | $ | 209,737,462 | | $ | 209,737,462 | |
Capital contributions | | | — | | | 111,736,175 | | | 111,736,175 | | | — | | | 132,797,628 | | | 132,797,628 | | | — | | | 289,128,901 | | | 289,128,901 | |
Capital withdrawals | | | (43,372 | ) | | (82,788,891 | ) | | (82,832,263 | ) | | (68,296 | ) | | (25,181,302 | ) | | (25,249,598 | ) | | (158,881 | ) | | (20,372,604 | ) | | (20,531,485 | ) |
Withdrawal fees | | | — | | | 87,248 | | | 87,248 | | | — | | | 103,650 | | | 103,650 | | | — | | | 45,896 | | | 45,896 | |
Net investment loss | | | — | | | (6,128,602 | ) | | (6,128,602 | ) | | — | | | (2,531,781 | ) | | (2,531,781 | ) | | — | | | (4,686,631 | ) | | (4,686,631 | ) |
Net realized loss from investments in Underlying Funds | | | — | | | (26,166,822 | ) | | (26,166,822 | ) | | — | | | (20,261,882 | ) | | (20,261,882 | ) | | — | | | (37,112,434 | ) | | (37,112,434 | ) |
Net change in unrealized appreciation/(depreciation) on investments in Underlying Funds | | | — | | | (43,956,668 | ) | | (43,956,668 | ) | | — | | | (31,841,141 | ) | | (31,841,141 | ) | | — | | | (51,680,470 | ) | | (51,680,470 | ) |
Performance Allocation | | | 43,372 | | | (43,372 | ) | | — | | | 68,296 | | | (68,296 | ) | | — | | | 158,881 | | | (158,881 | ) | | — | |
|
|
|
|
|
|
|
|
|
|
|
|
|
|
|
|
|
|
|
|
|
|
|
|
|
|
|
|
|
Partners’ Capital, at March 31, 2009*** | | $ | — | | $ | 257,504,171 | | $ | 257,504,171 | | $ | — | | $ | 202,898,487 | | $ | 202,898,487 | | $ | — | | $ | 384,901,239 | | $ | 384,901,239 | |
|
|
|
|
|
|
|
|
|
|
|
|
|
|
|
|
|
|
|
|
|
|
|
|
|
|
|
|
|
FIVE
HATTERAS FUNDS
For the year ended March 31, 2009
| | | | | | | | | | | | | |
| | Hatteras
Multi-Strategy
Fund, L.P. | | Hatteras
Multi-Strategy
TEI Fund, L.P.* | | Hatteras
Multi-Strategy
Institutional
Fund, L.P. | | Hatteras
Multi-Strategy
TEI
Institutional
Fund, L.P.* | |
|
Cash flows from operating activities: | | | | | | | | | | | | | |
Net decrease in partners’ capital resulting from operations | | $ | (63,795,618 | ) | $ | (76,252,092 | ) | $ | (54,634,804 | ) | $ | (93,479,535 | ) |
Adjustments to reconcile net decrease in partners’ capital resulting from operations to net cash provided by (used in) operating activities: | | | | | | | | | | | | | |
Purchases of interests in Hatteras Master Fund, L.P. | | | (94,083,385 | ) | | (107,735,973 | ) | | (131,808,253 | ) | | (288,629,002 | ) |
Proceeds from withdrawals from Hatteras Master Fund, L.P. | | | 58,199,230 | | | 80,775,732 | | | 25,254,821 | | | 21,375,888 | |
Net investment loss allocated from Hatteras Master Fund, L.P. | | | 2,217,515 | | | 2,719,726 | | | 1,881,071 | | | 3,240,147 | |
Net realized loss from investments in Underlying Funds allocated from Hatteras Master Fund, L.P. | | | 21,617,812 | | | 26,166,822 | | | 20,261,882 | | | 37,112,434 | |
Net change in unrealized depreciation/ (appreciation) on investments in Underlying Funds allocated from Hatteras Master Fund, L.P. | | | 37,383,867 | | | 43,956,668 | | | 31,841,141 | | | 51,680,470 | |
(Increase)/Decrease in receivable for withdrawals from Hatteras Master Fund, L.P. | | | (2,133,144 | ) | | 23,867,978 | | | (13,746,149 | ) | | (14,121,088 | ) |
(Increase)/Decrease in investment in Hatteras Master Fund, L.P. paid in advance | | | 3,006,627 | | | 9,054,630 | | | 9,043,258 | | | 28,065,776 | |
Receivable from Investment Affiliates | | | — | | | (124,098 | ) | | (100,000 | ) | | — | |
(Increase)/Decrease in interest receivable | | | (25,691 | ) | | 3,975 | | | 2,744 | | | 5,910 | |
(Increase)/Decrease in prepaid assets | | | (39,676 | ) | | (41,790 | ) | | (12,533 | ) | | (11,188 | ) |
Increase/(Decrease) in due to Affiliates | | | — | | | — | | | — | | | 100,000 | |
Increase/(Decrease) in withholding tax payable | | | — | | | (190,399 | ) | | — | | | (48,557 | ) |
Increase/(Decrease) in servicing fee payable | | | 4,675 | | | (20,174 | ) | | 18,058 | | | 33,246 | |
Increase/(Decrease) in accounting and administration fees payable | | | 16,810 | | | 14,272 | | | 17,084 | | | 26,939 | |
Increase/(Decrease) in professional fees payable | | | 22,590 | | | (8,103 | ) | | (17,937 | ) | | (21,430 | ) |
Increase/(Decrease) in custodian fees payable | | | (36 | ) | | (105 | ) | | — | | | 208 | |
Increase/(Decrease) in other accrued expenses | | | 19,182 | | | (45,453 | ) | | 18,188 | | | 31,516 | |
|
|
|
|
|
|
|
|
|
|
|
|
|
|
Net cash provided by (used in) operating activities | | | (37,589,242 | ) | | 2,141,616 | | | (111,981,429 | ) | | (254,638,266 | ) |
|
|
|
|
|
|
|
|
|
|
|
|
|
|
Cash flows from financing activities: | | | | | | | | | | | | | |
Capital contributions | | | 93,853,520 | | | 102,667,550 | | | 123,515,628 | | | 261,096,720 | |
Capital withdrawals, net of withdrawal fees | | | (60,264,278 | ) | | (104,809,166 | ) | | (11,719,199 | ) | | (6,383,454 | ) |
|
|
|
|
|
|
|
|
|
|
|
|
|
|
Net cash provided by (used in) financing activities | | | 33,589,242 | | | (2,141,616 | ) | | 111,796,429 | | | 254,713,266 | |
|
|
|
|
|
|
|
|
|
|
|
|
|
|
Net change in cash and cash equivalents | | | (4,000,000 | ) | | — | | | (185,000 | ) | | 75,000 | |
Cash and cash equivalents at beginning of year | | | 4,250,000 | | | 305,000 | | | 335,000 | | | 80,000 | |
|
|
|
|
|
|
|
|
|
|
|
|
|
|
Cash and cash equivalents at end of year | | $ | 250,000 | | $ | 305,000 | | $ | 150,000 | | $ | 155,000 | |
|
|
|
|
|
|
|
|
|
|
|
|
|
|
* Consolidated Statement. See note 1.
See notes to financial statements.
SIX
HATTERAS FUNDS
NOTES TO FINANCIAL STATEMENTS March 31, 2009
1. ORGANIZATION
The Hatteras Funds, each a “Feeder Fund” and collectively the “Feeder Funds” are:
| |
| Hatteras Multi-Strategy Fund, L.P. (formerly known as Hatteras Multi-Strategy Fund I, L.P.) |
| Hatteras Multi-Strategy TEI Fund, L.P. |
| Hatteras Multi-Strategy Institutional Fund, L.P. |
| Hatteras Multi-Strategy TEI Institutional Fund, L.P. |
The Hatteras Multi-Strategy TEI Fund, L.P. and the Hatteras Multi-Strategy TEI Institutional Fund, L.P. each invest substantially all of their assets in the Hatteras Multi-Strategy Offshore Fund, LDC, and Hatteras Multi-Strategy Offshore Institutional Fund, LDC, (collectively the “Blocker Funds”), respectively. The Blocker Funds are Cayman Islands limited duration companies with the same investment objective as the Feeder Funds. The Blocker Funds serve solely as intermediate entities through which the Multi-Strategy TEI Fund, L.P. and the Hatteras Multi-Strategy TEI Institutional Fund, L.P. will invest in the Master Fund. The Blocker Funds enable tax-exempt Limited Partners to invest without receiving certain income in a form that would otherwise be taxable to such tax-exempt Limited Partners regardless of their tax-exempt status. The Multi-Strategy TEI Fund, L.P. owns 100% of the beneficial interests of the Hatteras Multi-Strategy Offshore Fund, LDC and the Multi-Strategy TEI Institutional Fund, L.P. owns 100% of the beneficial interests of the Hatteras Multi-Strategy Offshore Institutional Fund, LDC. The Blocker Funds are consolidated with their respective Feeder Fund for financial reporting purposes.
Each of the Feeder Funds are organized as Delaware limited partnerships, and registered under the Securities Act of 1933 and the Investment Company Act of 1940, as amended, (the “1940 Act”) as closed-end, non-diversified, investment companies. The investment objective of the Feeder Funds is to generate consistent long-term appreciation and returns across all market cycles. To achieve their objective, the Feeder Funds provide their investors with access to a broad range of investment strategies and asset categories, trading advisers (“Advisors”) and overall asset allocation services typically available on a collective basis to larger institutions, through an investment of substantially all of their assets into the Hatteras Master Fund, L.P. (the “Master Fund”), which is registered under the 1940 Act as a closed-end, non-diversified management investment company. The Master Fund is managed by Hatteras Investment Partners, LLC (the “Investment Manager”), a Delaware limited liability company registered as an investment adviser under the Investment Advisers Act of 1940, as amended. Investors who acquire interests in the Feeder Funds (“Interests”) are the Limited Partners (each, a “Limited Partner” and together, the “Limited Partners”) of the Feeder Funds.
The percentage of the Master Fund’s beneficial interests owned by the Feeder Funds at March 31, 2009 were:
| | | |
Hatteras Multi-Strategy Fund, L.P. | | 18.74 | % |
Hatteras Multi-Strategy TEI Fund, L.P. | | 22.44 | % |
Hatteras Multi-Strategy Institutional Fund, L.P. | | 17.64 | % |
Hatteras Multi-Strategy TEI Institutional Fund, L.P. | | 33.50 | % |
Hatteras Investment Management, LLC, a Delaware limited liability company, serves as the General Partner of each of the Feeder Funds (“General Partner”). The General Partner is an affiliate of the Investment Manager. The General Partner has appointed a Board of Directors (“the Board”) for each Feeder Fund and, to the fullest extent permitted by applicable law, has irrevocably delegated to the Board its rights and powers to monitor and oversee the business affairs of the Feeder Fund, including the complete and exclusive authority to oversee and establish policies regarding the management, conduct and operation of the Feeder Fund’s business.
SEVEN
HATTERAS FUNDS
NOTESTO FINANCIAL STATEMENTS
March 31, 2009 (continued)
1. ORGANIZATION (CONTINUED)
Effective October 1, 2007, according to the agreement and plan of reorganization (the “TEI Agreement” and, together with the Master Fund Agreement, (as defined in the Master Fund’s financial statements), the “Agreements”) by and between the Hatteras Multi-Strategy TEI Fund, L.P. (the “TEI Fund”) together with the Master Fund, and Topiary Benefit Plan Investor Fund LLC (the “Topiary Feeder Fund”), the Topiary Feeder Fund transferred substantially all of the assets and liabilities valued at approximately $88,340,142 to the TEI Fund in exchange for limited partnership interests, and distributed such limited partnership interests in the Master Fund to the members of the Topiary Feeder Fund in accordance with their respective interests. At March 31, 2009, the TEI Fund’s remaining receivables assumed from the Topiary Feeder Fund were $124,098. The receivable is presented as Receivable from affiliate on the Statement of Assets, Liabilities and Partners’ Capital.
2. SIGNIFICANT ACCOUNTING POLICIES
These financial statements have been prepared in accordance with accounting principles generally accepted in the United States of America (“GAAP”) and are expressed in United States dollars. The following is a summary of significant accounting and reporting policies used in preparing the financial statements.
a. Investment Valuation
The Feeder Funds record their investment in the Master Fund at Fair Value. Valuation of securities held by the Master Fund is discussed in the notes to the Master Fund’s financial statements included elsewhere in this report.
In September 2006, the Financial Accounting Standards Board (“FASB”) issued Statement of Financial Accounting Standards No. 157, Fair Value Measurements (“FAS 157”). The Master Fund adopted FAS 157 effective April 1, 2008. Since the Feeder Funds do not make direct investments in securities or financial instruments, and invests substantially all of their assets in the Master Fund, the additional disclosures required by FAS 157 are included in the notes to the financial statements of the Master Fund, which are included elsewhere in this report.
b. Allocations from the Master Fund
The Feeder Funds record their allocated portion of income, expense, realized gains and losses and unrealized appreciation and depreciation from the Master Fund.
c. Fund Level Income and Expenses
Interest income on any cash or cash equivalents held by the Feeder Funds will be recognized on an accrual basis. Expenses that are specifically attributed to the Feeder Funds are charged to each Feeder Fund. Because the Feeder Funds bear their proportionate share of the management fees of the Master Fund, the Feeder Funds pay no direct management fee to the Investment Manager. Income and expenses are recorded on an accrual basis.
d. Tax Basis Reporting
Because the Master Fund invests primarily in investment funds that are treated as partnerships for U.S. Federal tax purposes, the tax character of each of the Feeder Fund’s allocated earnings is established dependent upon the tax filings of the Underlying Funds. Accordingly, the tax basis of these allocated earnings and the related balances are not available as of the reporting date.
EIGHT
HATTERAS FUNDS
NOTESTO FINANCIAL STATEMENTS
March 31, 2009 (continued)
2. SIGNIFICANT ACCOUNTING POLICIES (CONTINUED)
e. Income Taxes
For U.S. Federal income tax purposes, the Feeder Funds are treated as partnerships, and each Limited Partner in the Feeder Funds is treated as the owner of its proportionate share of the net assets, income, expenses, and the realized and unrealized gains (losses) of the Feeder Fund. Accordingly, no federal, state or local income taxes have been provided on profits of the Feeder Funds since the Limited Partners are individually liable for the taxes on their share of the Feeder Funds. The Blocker Funds are registered as limited duration companies pursuant to the Companies Law of the Cayman Islands. No local income, profits or capital gains taxes are levied in the Cayman Islands at the current time.
The Feeder Funds adopted the provisions of Financial Accounting Standards Board (“FASB”) Interpretation No. 48 (“FIN 48”), Accounting for Uncertainty in Income Taxes, an interpretation of FASB No. 109, on September 30, 2007. The implementation of FIN 48 resulted in no material liability for unrecognized tax benefits and no material change to the beginning net asset value of the Feeder Funds. As of and during the year ended March 31, 2009, the Feeder Funds did not have a liability for any unrecognized tax benefits.
During the year ended March 31, 2009, the Feeder Funds did not incur any material interest or penalties. For returns filed for the years ended December 31, 2005 through December 31, 2008 the Feeder Funds are open to examination by U.S. federal tax authorities and state tax authorities.
f. Cash and Cash Equivalents
Cash and cash equivalents includes amounts held in interest-bearing demand deposit accounts.
Such cash, at times, may exceed federally insured limits. The Feeder Funds have not experienced any losses in such accounts and do not believe they are exposed to any significant credit risk on such accounts.
g. Use of Estimates
The preparation of financial statements in conformity with GAAP requires management to make estimates and assumptions that affect the reported amounts of assets and liabilities and disclosure of contingent assets and liabilities at the date of the financial statements, and the reported amounts of increases and decreases in partners’ capital from operations during the reporting period. Actual results could differ from those estimates.
h. Recently Issued Accounting Pronouncements
In March 2008, the FASB issued Statement of Financial Accounting Standards 161 (“FAS 161”), Disclosures about Derivative Instruments and Hedging Activities—an amendment of FASB Statement No. 133. FAS 161 requires additional discussion about the reporting entity’s derivative instruments and hedging activities, by providing for qualitative disclosures about the objectives and strategies for using derivatives, quantitative data about the fair value of and gains and losses on derivative contracts, and details of credit-risk-related contingent features in their hedged positions. FAS 161 is effective for financial statements issued for fiscal years beginning after November 15, 2008 and interim periods within those years. The General Partner is continuing to evaluate the impact, if any, that adoption of FAS 161 may have on the Feeder Funds’ financial statements.
NINE
|
HATTERAS FUNDS |
|
NOTES TO FINANCIAL STATEMENTS |
March 31, 2009 (continued) |
2. SIGNIFICANT ACCOUNTING POLICIES (CONTINUED)
h. Recently Issued Accounting Pronouncements (continued)
In April 2009, FASB Staff Position FAS 157-4, Determining Fair Value When the Volume and Level for the Asset or Liability Have Significantly Decreased and Identifying Transactions That Are Not Orderly (“FSP 157-4”), was issued and is effective for fiscal years and interim periods ending after June 15, 2009. FSP 157-4 provides additional guidance for estimating fair value in accordance with SFAS 157 when the volume and level of activity for the asset or liability have significantly decreased. FSP 157-4 also includes guidance on identifying circumstances that indicate a transaction is not orderly. The Feeder Funds are currently evaluating the impact the adoption of FSP 157-4 will have on the Feeder Funds’ financial statements and their disclosures.
3. ALLOCATION OF LIMITED PARTNERS’ CAPITAL
Net profits or net losses of the Feeder Funds for each allocation period (“Allocation Period”) will be allocated among and credited to or debited against the capital accounts of the Limited Partners. Net profits or net losses will be measured as the net change in the value of the partners’ capital of the Feeder Funds, including any net change in unrealized appreciation or depreciation of investments and realized income and gains or losses and expenses during an allocation period, adjusted to exclude any items to be allocated among the capital accounts of the Limited Partners in accordance with the Limited Partners’ respective investment percentages.
Allocation Periods begin on the day after the last day of the preceding Allocation Period and end at the close of business on (1) the last day of each month; (2) the last day of each taxable year; (3) the day preceding each day on which interests are purchased; (4) the day on which interests are repurchased; or (5) the day on which any amount is credited to or debited from the capital account of any Limited Partner other than an amount to be credited to or debited from the capital accounts of all Limited Partners in accordance with their respective investment percentages in the Master Fund.
The Feeder Funds maintain a separate capital account (“Capital Account”) on their books for each Limited Partner. Each Limited Partner’s capital account will have an opening balance equal to the Limited Partner’s initial contribution to the capital of the Feeder Fund (i.e., the amount of the investment less any applicable sales load of up to 2 percent of the contribution amount), and thereafter, will be (i) increased by the amount of any additional capital contributions by such Limited Partner; (ii) decreased for any payments upon repurchase or in redemption of such Limited Partner’s interest or any distributions in respect of such Limited Partner; and (iii) increased or decreased as of the close of each Allocation Period by such Limited Partner’s allocable share of the net profits or net losses of the Feeder Fund. Effective July 1, 2008, the Feeder Funds were unitized and a single net asset value per unit was initially established at $100.00 for each of the Feeder Funds.
| | | | | | | | | | | | | |
| | | Hatteras
Multi-Strategy
Fund, L.P. | | | Hatteras
Multi-Strategy
TEI Fund, L.P. | | | Hatteras
Multi-Strategy
Institutional
Fund, L.P. | | | Hatteras
Multi-Strategy
TEI
Institutional
Fund, L.P. | |
|
|
|
|
|
|
|
|
|
|
|
|
|
|
Beginning shares at unitization, July 1, 2008 | | | 2,796,369.71 | | | 3,553,202.78 | | | 2,031,302.02 | | | 3,303,004.12 | |
Purchases | | | 722,367.61 | | | 787,682.91 | | | 935,836.21 | | | 1,981,797.25 | |
Redemptions | | | (698,381.18 | ) | | (964,667.37 | ) | | (322,131.23 | ) | | (263,913.82 | ) |
|
|
|
|
|
|
|
|
|
|
|
|
|
|
Ending shares, March 31, 2009 | | | 2,820,356.14 | | | 3,376,218.32 | | | 2,645,007.00 | | | 5,020,887.54 | |
|
|
|
|
|
|
|
|
|
|
|
|
|
|
TEN
|
HATTERAS FUNDS |
|
NOTES TO FINANCIAL STATEMENTS |
March 31, 2009 (continued) |
4. RELATED PARTY TRANSACTIONS AND OTHER
In consideration for fund services, the Multi-Strategy Fund, Multi-Strategy TEI Fund, the Multi-Strategy Institutional Fund, and the Multi-Strategy TEI Institutional Fund will pay the Investment Manager (in such capacity, the “Servicing Agent”) a fund servicing fee at the annual rate of 0.85%, 0.85%, 0.10%, and 0.10%, respectively, of the partners’ capital of the interests beneficially owned by customers of the Servicing Agent or any service provider who has entered into a service provider agreement with the Servicing Agent. The Feeder Fund servicing fees payable to the Servicing Agent will be borne by all Limited Partners of the Feeder Fund on a pro-rata basis.
The Servicing Agent may waive (to all investors on a pro-rata basis) or pay to third parties all or a portion of any such fees in its sole discretion. The Servicing Agent did not waive any of the servicing fees for the year ended March 31, 2009.
The Investment Manager contractually agreed to reimburse certain expenses through November 3, 2009, so that the total annual expenses (excluding taxes, interest, brokerage commissions, other transaction-related expenses, any extraordinary expenses of the Feeder Funds, any acquired fund fees and expenses, as well as any performance allocation payable by the Feeder Funds or the Master Fund) for this period will not exceed 2.35% for the Multi-Strategy Fund and the Multi-Strategy TEI Fund, and 1.75% for the Multi-Strategy Institutional Fund and the Multi-Strategy TEI Institutional Fund (the “Expense Limitation”). The agreement automatically renews for one-year terms after the initial period until terminated by the Investment Manager or the Feeder Funds. The Feeder Funds will carry forward, for a period not to exceed (3) three years from the date on which a reimbursement is made by the Investment Manager, any expenses in excess of the Expense Limitation and repay the Investment Manager such amounts, provided the Feeder Fund is able to effect such reimbursement and remain in compliance with the Expense Limitation disclosed in the then effective confidential memorandum. There were no reimbursements from the Investment Manager, nor previous reimbursements repaid to the Investment Manager, for the year ending March 31, 2009. At March 31, 2009, there was no carryforward balance subject to repayment to the Investment Manager for any of the Feeder Funds.
Prior to July 1, 2008, the General Partner received an annual performance based allocation (the “Performance Allocation”) with respect to the Capital Account of each Limited Partner. The Performance Allocation was calculated generally as of the end of each calendar year and a final Performance Allocation was determined as of June 30, 2008. The Performance Allocation with respect to a Limited Partner’s Capital Account was equal to 10% of the amount by which the excess, if any, of net profit over net loss allocated to such Limited Partner for the calendar year exceeded (a) any Loss Carryforward Amount for such Limited Partner plus (b) the non-cumulative “hurdle amount” (an annualized return on the Capital Account balance of such Limited Partner as of the last day of the preceding calendar year at a rate equal to the yield to maturity of the 90-day United States Treasury Bill as reported by the Wall Street Journal on the last day of the preceding calendar year). The Performance Allocation with respect to each applicable Limited Partner’s Capital Account was deducted from such Capital Account and allocated to the Capital Account of the General Partner. For the period from April 1, 2008 to June 30, 2008 the General Partner received Performance Allocations from the Feeder Funds of $311,915, which is disclosed on the Statement of Changes in Partners’ Capital.
Effective July 1, 2008, the Performance Allocation is calculated at the Master Fund level, and allocated to the Feeder Funds based on the Feeder Funds’ ownership interest in the Master Fund. The Performance Allocation with respect to the Feeder Funds is equal to 10% of the amount by which the excess, if any, of net profit over net loss allocated to the Feeder Funds for the calendar year exceeds the greater of (a) any Loss Carryforward Amount or (b) the non-cumulative “hurdle amount” (an annualized return on the capital account balance of the Feeder Funds as of the last day of the
ELEVEN
|
HATTERAS FUNDS |
|
NOTES TO FINANCIAL STATEMENTS |
March 31, 2009 (continued) |
4. RELATED PARTY TRANSACTIONS AND OTHER (CONTINUED)
preceding calendar year with a rate equal to the yield to maturity of the 90-day United States Treasury Bill as reported by the Wall Street Journal on the last day of the preceding calendar year). If at the end of any Performance Allocation period, the net losses allocated to the Feeder Funds exceed the net profits so allocated, then a Loss Carryforward Amount shall be established for the Feeder Funds. No Performance Allocation shall be deducted from the Feeder Funds unless the excess of net profits over net losses subsequently allocated exceeds any Loss Carryforward Amount for the Feeder Funds. For the period from July 1, 2008 to March 31, 2009 there was no performance based allocation.
UMB Bank, N.A. serves as custodian of the Feeder Funds’ cash balances and provides custodial services for the Feeder Funds. UMB Fund Services, Inc. serves as administrator and accounting agent to the Feeder Funds and provides certain accounting, record keeping and investor related services. The Feeder Funds pay a monthly fee to the custodian and administrator based upon average partners’ capital, subject to certain minimums.
At March 31, 2009, Limited Partners, who are affiliated with the Investment Manager or the General Partner, owned $865,638 (0.43% of Partners’ Capital) of Hatteras Multi-Strategy Institutional Fund, L.P., and $414,656 (0.11% of Partners’ Capital) of Hatteras Multi-Strategy TEI Institutional Fund, L.P.
5. RISK FACTORS
An investment in the Feeder Funds involves significant risks that should be carefully considered prior to investment and should only be considered by persons financially able to maintain their investment and who can afford a loss of a substantial part or all of such investment. The Master Fund intends to invest substantially all of its available capital in securities of private investment companies. These investments will generally be restricted securities that are subject to substantial holding periods or are not traded in public markets at all, so that the Master Fund may not be able to resell some of its Underlying Fund holdings for extended periods, which may be several years. No guarantee or representation is made that the investment objective will be met.
6. REPURCHASE OF PARTNERS’ INTERESTS
The Board may, from time to time and in its sole discretion, cause the Feeder Funds to repurchase interests from Limited Partners pursuant to written tenders by Limited Partners at such times and on such terms and conditions as established by the Board. In determining whether the Feeder Funds should offer to repurchase interests, the Board will consider the recommendation of the Investment Manager. The Feeder Funds generally expect to offer repurchase interests from Limited Partners on a quarterly basis as of March 31, June 30, September 30 and December 31 of each year. The Feeder Funds do not intend to distribute to the partners any of the Feeder Funds’ income, but generally expect to reinvest substantially all income and gains allocable to the partners. A partner may, therefore, be allocated taxable income and gains and not receive any cash distribution. Limited Partner interests repurchased prior to the Limited Partners one year anniversary of their initial investment are subject to a maximum 5% withdrawal fee.
7. INDEMNIFICATION
In the normal course of business, the Feeder Funds enter into contracts that provide general indemnifications. The Feeder Funds’ maximum exposure under these agreements is dependent on future claims that may be made against the Feeder Funds, and therefore cannot be established; however, based on experience, the risk of loss from such claims is considered remote.
TWELVE
|
HATTERAS FUNDS |
|
NOTES TO FINANCIAL STATEMENTS |
March 31, 2009 (continued) |
8. FINANCIAL HIGHLIGHTS
The financial highlights are intended to help an investor understand the Feeder Funds’ financial performance. The total returns in the table represent the rate that a Limited Partner would be expected to have earned or lost on an investment in each Feeder Fund.
The ratios and total return amounts are calculated based on each Limited Partner group taken as a whole. The General Partner’s interest is excluded from the calculations. An individual Limited Partner’s ratios or returns may vary from the table below based on performance arrangements and the timing of capital transactions.
The ratios are calculated by dividing total dollars of income or expenses as applicable by the average of total monthly Limited Partners’ capital. The ratios include the Feeder Funds’ proportionate share of the Master Fund’s income and expenses.
Total return amounts are calculated by geometrically linking returns based on the change in value during each accounting period.
The portfolio turnover rate is calculated based on the Master Fund’s investment activity, as turnover occurs at the Master Fund level and the Feeder Fund are invested 100% in the Master Fund.
| | | | | | | | | | | | | | | | | | | | | |
| | Hatteras
Multi-Strategy
Fund, L.P. | | Hatteras
Multi-Strategy
TEI Fund, L.P. | | Hatteras
Multi-Strategy
Institutional
Fund, L.P. | | Hatteras
Multi-Strategy
TEI Institutional
Fund, L.P. | |
|
|
|
|
|
|
|
|
|
|
|
|
|
|
|
|
|
|
|
|
|
|
Net Asset Value, July 1, 2008* | | | $ | 100.00 | | | | $ | 100.00 | | | | $ | 100.00 | | | | $ | 100.00 | | |
Income from investment operations: | | | | | | | | | | | | | | | | | | | | | |
Net investment loss | | | | (1.19 | ) | | | | (1.22 | ) | | | | (0.79 | ) | | | | (0.75 | ) | |
Net realized and unrealized gain (loss) on investment transactions | | | | (22.52 | ) | | | | (22.51 | ) | | | | (22.50 | ) | | | | (22.59 | ) | |
|
|
|
|
|
|
|
|
|
|
|
|
|
|
|
|
|
|
|
|
|
|
Net investment loss & Net realized and unrealized gain (loss) on investment transactions | | | | (23.71 | ) | | | | (23.73 | ) | | | | (23.29 | ) | | | | (23.34 | ) | |
|
|
|
|
|
|
|
|
|
|
|
|
|
|
|
|
|
|
|
|
|
|
Net Asset Value, March 31, 2009 | | | $ | 76.29 | | | | $ | 76.27 | | | | $ | 76.71 | | | | $ | 76.66 | | |
|
|
|
|
|
|
|
|
|
|
|
|
|
|
|
|
|
|
|
|
|
|
| |
* | Net asset value per share information presented as of unitization on July 1, 2008. |
THIRTEEN
|
HATTERAS FUNDS |
|
NOTES TO FINANCIAL STATEMENTS |
March 31, 2009 (continued) |
|
8. FINANCIAL HIGHLIGHTS (CONTINUED) |
| | | | | | | | | | | | | | | |
| | | | For the period
from April 1, 2005
(commencement
of operations) to
March 31, 2006 | |
| | For the year/period ended
March 31, | | |
| |
| | |
Hatteras Multi-Strategy Fund, L.P. | | 2009 | | 2008 | | 2007 | | |
|
|
|
|
|
|
|
|
|
|
Total return amortizing organizational expenses and before Performance Allocation1 | | | — | 2 | | — | 2 | | — | 2 | | | 11.72 | % | |
Organization expense | | | — | | | — | | | — | | | | –1.17 | % | |
|
|
|
|
|
|
|
|
|
|
|
|
|
|
|
|
Total return before Performance Allocation | | | –21.26 | % | | 2.91 | % | | 8.27 | % | | | 10.55 | % | |
Performance Allocation4 | | | –0.02 | % | | –0.37 | % | | –0.58 | % | | | –0.09 | % | |
|
|
|
|
|
|
|
|
|
|
|
|
|
|
|
|
Total return after amortizing organizational expenses and Performance Allocation | | | –21.28 | % | | 2.54 | % | | 7.69 | % | | | 10.46 | % | |
|
|
|
|
|
|
|
|
|
|
|
|
|
|
|
|
Net investment loss before Performance Allocation | | | –1.92 | % | | –1.66 | % | | –1.94 | % | | | –2.79 | % | |
|
|
|
|
|
|
|
|
|
|
|
|
|
|
|
|
Ratio of other operating expenses to average net assets3, 5 | | | 2.27 | % | | 2.25 | % | | 2.48 | % | | | 3.58 | % | |
Ratio of bank borrowing expense to average net assets allocated from the Master Fund | | | 0.03 | % | | 0.05 | % | | 0.03 | % | | | 0.00 | % | |
|
|
|
|
|
|
|
|
|
|
|
|
|
|
|
|
Operating expenses, excluding reimbursement from Investment Manager and Performance Allocation | | | 2.30 | % | | 2.30 | % | | 2.51 | % | | | 3.58 | % | |
Performance Allocation4 | | | 0.02 | % | | 0.26 | % | | 0.61 | % | | | 1.25 | % | |
|
|
|
|
|
|
|
|
|
|
|
|
|
|
|
|
Total expenses and Performance Allocation before reimbursement from Investment Manager | | | 2.32 | % | | 2.56 | % | | 3.12 | % | | | 4.82 | % | |
Reimbursement from Investment Manager | | | 0.00 | % | | 0.00 | % | | –0.03 | % | | | –0.45 | % | |
|
|
|
|
|
|
|
|
|
|
|
|
|
|
|
|
Net expenses | | | 2.32 | % | | 2.56 | % | | 3.09 | % | | | 4.37 | % | |
|
|
|
|
|
|
|
|
|
|
|
|
|
|
|
|
Limited Partners’ capital, end of year (000’s) | | $ | 215,165 | | $ | 237,029 | | $ | 135,996 | | | $ | 42,122 | | |
Portfolio Turnover Rate (Master Fund) | | | 22.57 | % | | 9.54 | % | | 14.03 | % | | | 19.35 | % | |
| |
1 | Return is indicative of amortizing expenses over 60 months for tax purposes. |
| |
2 | Organizational costs were fully expensed as of March 31, 2006. |
| |
3 | 2008 Ratio includes repayment to investment manager for prior reimbursements in the amount of 0.09%. |
| |
4 | Performance allocation ratio is not annualized. |
| |
5 | Ratios calculated based on total expenses and average net assets. If the expense ratio calculation had been performed monthly, as is done for expense cap calculations, the ratios would have been different. |
FOURTEEN
|
HATTERAS FUNDS |
|
NOTES TO FINANCIAL STATEMENTS |
March 31, 2009 (continued) |
|
8. FINANCIAL HIGHLIGHTS (CONTINUED) |
| | | | | | | | | | | | | | | |
| | | | For the period
from April 1, 2005
(commencement
of operations) to
March 31, 2006 | |
| | For the year/period ended
March 31, | | |
| |
| | |
Hatteras Multi-Strategy TEI Fund, L.P. | | 2009 | | 2008 | | 2007 | | |
|
|
|
|
|
|
|
|
|
|
Total return amortizing organizational expenses and before Performance Allocation1 | | | — | 2 | | — | 2 | | — | 2 | | | 11.50 | % | |
Organization expense | | | — | | | — | | | — | | | | –0.35 | %1 | |
|
|
|
|
|
|
|
|
|
|
|
|
|
|
|
|
Total return before Performance Allocation | | | –21.35 | % | | 2.39 | % | | 8.01 | % | | | 11.15 | % | |
Performance Allocation4 | | | –0.01 | % | | –0.26 | % | | –0.55 | % | | | –1.15 | % | |
|
|
|
|
|
|
|
|
|
|
|
|
|
|
|
|
Total return after amortizing organizational expenses and Performance Allocation | | | –21.36 | % | | 2.13 | % | | 7.46 | % | | | 10.00 | % | |
|
|
|
|
|
|
|
|
|
|
|
|
|
|
|
|
Net investment loss before Performance Allocation | | | –1.99 | % | | –2.14 | % | | –2.24 | % | | | –3.49 | % | |
|
|
|
|
|
|
|
|
|
|
|
|
|
|
|
|
Ratio of other operating expenses to average net assets3,5 | | | 2.22 | % | | 2.31 | % | | 2.52 | % | | | 4.64 | % | |
Ratio of allocated bank borrowing expense to average net assets | | | 0.03 | % | | 0.05 | % | | 0.03 | % | | | 0.00 | % | |
Ratio of withholding tax to average net assets | | | 0.20 | % | | 0.41 | % | | 0.32 | % | | | 0.08 | % | |
|
|
|
|
|
|
|
|
|
|
|
|
|
|
|
|
Operating expenses, excluding reimbursement from Investment Manager and Performance Allocation | | | 2.45 | % | | 2.77 | % | | 2.87 | % | | | 4.72 | % | |
Performance Allocation4 | | | 0.01 | % | | 0.22 | % | | 0.62 | % | | | 1.21 | % | |
|
|
|
|
|
|
|
|
|
|
|
|
|
|
|
|
Total expenses and Performance Allocation before reimbursement from Investment Manager3 | | | 2.46 | % | | 2.99 | % | | 3.49 | % | | | 5.93 | % | |
Reimbursement from Investment Manager | | | 0.00 | % | | 0.00 | % | | –0.08 | % | | | –0.87 | % | |
|
|
|
|
|
|
|
|
|
|
|
|
|
|
|
|
Net expenses | | | 2.46 | % | | 2.99 | % | | 3.41 | % | | | 5.06 | % | |
|
|
|
|
|
|
|
|
|
|
|
|
|
|
|
|
Limited Partners’ capital, end of year (000’s) | | $ | 257,504 | | $ | 304,765 | | $ | 129,980 | | | $ | 32,175 | | |
Portfolio Turnover Rate (Master Fund) | | | 22.57 | % | | 9.54 | % | | 14.03 | % | | | 19.35 | % | |
| |
1 | Return is indicative of amortizing expenses over 60 months for tax purposes. |
| |
2 | Organizational costs were fully expensed as of March 31, 2006. |
| |
3 | 2008 Ratio includes repayment to investment manager for prior reimbursements in the amount of 0.06%. |
| |
4 | Performance allocation ratio is not annualized. |
| |
5 | Ratios calculated based on total expenses and average net assets. If the expense ratio calculation had been performed monthly, as is done for expense cap calculations, the ratios would have been different. |
FIFTEEN
|
HATTERAS FUNDS |
|
NOTES TO FINANCIAL STATEMENTS |
March 31, 2009 (continued) |
|
8. FINANCIAL HIGHLIGHTS (CONTINUED) |
| | | | | | | | | | | | |
| | | | For the period
from January 1, 2007
(commencement
of operations) to
March 31, 2007 | |
| | For the year/period
ended March 31, | | |
| |
| | |
Hatteras Multi-Strategy Institutional Fund, L.P. | | 2009 | | 2008 | | |
|
|
|
|
|
|
|
|
Total return amortizing organizational expenses and before Performance Allocation | | | — | 3 | | — | 3 | | | 3.79 | %2 | |
Organization expense | | | — | | | — | | | | –1.38 | % | |
|
|
|
|
|
|
|
|
|
|
|
|
|
Total return before Performance Allocation | | | –20.69 | % | | 3.37 | % | | | 2.41 | % | |
Performance Allocation5 | | | –0.03 | % | | –0.15 | % | | | –0.17 | % | |
|
|
|
|
|
|
|
|
|
|
|
|
|
Total return after amortizing organizational expenses and Performance Allocation | | | –20.72 | % | | 3.22 | % | | | 2.24 | % | |
|
|
|
|
|
|
|
|
|
|
|
|
|
Net investment loss before Performance Allocation | | | –1.23 | % | | –1.11 | % | | | –5.37 | %1 | |
|
|
|
|
|
|
|
|
|
|
|
|
|
Ratio of operating expenses to average net assets | | | 1.56 | % | | 1.72 | % | | | 7.60 | %1 | |
Ratio of allocated bank borrowing expense to average net assets | | | 0.03 | % | | 0.05 | % | | | 0.01 | % | |
|
|
|
|
|
|
|
|
|
|
|
|
|
Operating expenses, excluding reimbursement from Investment Manager and Performance Allocation4 | | | 1.59 | % | | 1.77 | % | | | 7.61 | % | |
Performance Allocation5 | | | 0.03 | % | | 0.18 | % | | | 0.35 | % | |
|
|
|
|
|
|
|
|
|
|
|
|
|
Total expenses and Performance Allocation before reimbursement from Investment Manager | | | 1.62 | % | | 1.95 | % | | | 7.96 | % | |
Reimbursement from Investment Manager | | | 0.00 | % | | –0.02 | % | | | –1.12 | % | |
|
|
|
|
|
|
|
|
|
|
|
|
|
Net expenses | | | 1.62 | % | | 1.93 | % | | | 6.84 | % | |
|
|
|
|
|
|
|
|
|
|
|
|
|
Limited Partners’ capital, end of year (000’s) | | $ | 202,898 | | $ | 149,882 | | | $ | 9,418 | | |
Portfolio Turnover Rate (Master Fund) | | | 22.57 | % | | 9.54 | % | | | 14.03 | % | |
| |
1 | Net investment loss and expense ratios are annualized, except for organizational expenses and Performance Allocation. |
| |
2 | Total return is not annualized and is indicative of amortizing organizational expenses over 60 months for tax purposes. |
| |
3 | Organizational costs were fully expensed as of March 31, 2007. |
| |
4 | 2008 Ratio includes repayment to investment manager for prior reimbursements in the amount of 0.09%. |
| |
5 | Performance allocation ratio is not annualized. |
SIXTEEN
|
HATTERAS FUNDS |
|
NOTES TO FINANCIAL STATEMENTS |
March 31, 2009 (continued) |
|
8. FINANCIAL HIGHLIGHTS (CONTINUED) |
| | | | | | | | | | | | |
| | | | For the period
from January 1, 2007
(commencement
of operations) to
March 31, 2007 | |
| | For the year/period
ended March 31, | | |
| |
| | |
Hatteras Multi-Strategy TEI Institutional Fund, L.P. | | 2009 | | 2008 | | |
|
|
|
|
|
|
|
|
Total return amortizing organizational expenses and before Performance Allocation | | | — | 3 | | — | 3 | | | 2.51 | %2 | |
Organization expense | | | — | | | — | | | | –2.07 | % | |
|
|
|
|
|
|
|
|
|
|
|
|
|
Total return before Performance Allocation | | | –20.79 | % | | 3.09 | % | | | 0.44 | % | |
Performance Allocation5 | | | –0.05 | % | | –0.09 | % | | | –0.15 | % | |
|
|
|
|
|
|
|
|
|
|
|
|
|
Total return after amortizing organizational expenses and Performance Allocation | | | –20.84 | % | | 3.00 | % | | | 0.29 | % | |
|
|
|
|
|
|
|
|
|
|
|
|
|
Net investment loss before Performance Allocation | | | –1.35 | % | | –1.44 | % | | | –10.38 | %1 | |
|
|
|
|
|
|
|
|
|
|
|
|
|
Ratio of the operating expenses to average net assets | | | 1.50 | % | | 1.67 | % | | | 12.74 | %1 | |
Ratio of allocated bank borrowing expense to average net assets | | | 0.03 | % | | 0.05 | % | | | 0.01 | % | |
Ratio of withholding tax to average net assets | | | 0.19 | % | | 0.36 | % | | | 0.25 | % | |
|
|
|
|
|
|
|
|
|
|
|
|
|
Operating expenses, excluding reimbursement from Investment Manager and Performance Allocation4 | | | 1.72 | % | | 2.08 | % | | | 13.00 | % | |
Performance Allocation5 | | | 0.05 | % | | 0.14 | % | | | 0.59 | % | |
|
|
|
|
|
|
|
|
|
|
|
|
|
Total expenses and Performance Allocation before reimbursement from Investment Manager | | | 1.77 | % | | 2.22 | % | | | 13.59 | % | |
Reimbursement from Investment Manager | | | 0.00 | % | | –0.03 | % | | | –1.42 | % | |
|
|
|
|
|
|
|
|
|
|
|
|
|
Net expenses | | | 1.77 | % | | 2.19 | % | | | 12.17 | % | |
|
|
|
|
|
|
|
|
|
|
|
|
|
Limited Partners’ capital, end of year (000’s) | | $ | 384,901 | | $ | 209,737 | | | $ | 4,047 | | |
Portfolio Turnover Rate (Master Fund) | | | 22.57 | % | | 9.54 | % | | | 14.03 | % | |
| |
1 | Net investment loss and expense ratios are annualized, except for organizational expenses and Performance Allocation. |
| |
2 | Total return is not annualized and is indicative of amortizing organizational expenses over 60 months for tax purposes. |
| |
3 | Organizational costs were fully expensed as of March 31, 2007. |
| |
4 | 2008 Ratio includes repayment to investment manager for prior reimbursements in the amount of 0.07%. |
| |
5 | Performance allocation ratio is not annualized. |
SEVENTEEN
|
HATTERAS FUNDS |
|
NOTES TO FINANCIAL STATEMENTS |
March 31, 2009 (concluded) |
|
9. SUBSEQUENT EVENTS |
Effective April 1, 2009 and May 1, 2009, there were additional capital contributions to the Feeder Funds of the following amounts:
| | | | |
April 1, 2009 | | | | |
Hatteras Multi-Strategy Fund, L.P. | | $ | 3,074,900 | |
Hatteras Multi-Strategy TEI Fund, L.P. | | $ | 3,319,900 | |
Hatteras Multi-Strategy Institutional Fund, L.P. | | $ | 5,225,000 | |
Hatteras Multi-Strategy TEI Institutional Fund, L.P. | | $ | 7,702,269 | |
| | | | |
May 1, 2009 | | | | |
Hatteras Multi-Strategy Fund, L.P. | | $ | 2,327,000 | |
Hatteras Multi-Strategy TEI Fund, L.P. | | $ | 2,633,700 | |
Hatteras Multi-Strategy Institutional Fund, L.P. | | $ | 5,534,597 | |
Hatteras Multi-Strategy TEI Institutional Fund, L.P. | | $ | 7,410,058 | |
In addition, since April 1, 2009, the Board accepted the following tender requests which will be effective as of June 30, 2009:
| | | | |
Hatteras Multi-Strategy Fund, L.P. | | $ | 15,346,639 | |
Hatteras Multi-Strategy TEI Fund, L.P. | | $ | 10,845,743 | |
Hatteras Multi-Strategy Institutional Fund, L.P. | | $ | 14,028,886 | |
Hatteras Multi-Strategy TEI Institutional Fund, L.P. | | $ | 15,762,925 | |
EIGHTEEN
HATTERAS FUNDS
(unaudited)
The identity of the Board Members and brief biographical information is set forth below.
| | | | | | | | |
Name, Address & Age | | Position(s)
Held with
the Fund | | Length of
Time Served | | Principal Occupation(s) During
Past 5 Years and Other
Directorships Held by Director | | Number of Portfolios in
Fund Complex’ Overseen
by Director or Officer |
|
|
|
|
|
|
|
|
|
INTERESTED DIRECTORS | | |
|
|
|
David B. Perkins*, 46
8540 Colonnade
Center Drive, Suite 401
Raleigh, NC 27615 | | President and Chairman of the Board of Directors of each fund in the Fund Complex | | Since Inception | | Mr. Perkins has been Chairman and President of each fund in the Fund Complex since inception. Mr. Perkins became the President and Managing Principal of the Investment Manager in September 2003 and became the Co-founder and Managing Partner of CapFinancial Partners, LLC in April 2003. Prior to that, he was Managing Partner at Wachovia Securities Financial Network, Inc. from June 2002 to September 2003 and Managing Principal of CapTrust Financial Advisors, LLC from October 1997 to June 2002. | | 5 |
|
|
|
|
|
|
|
|
|
INDEPENDENT DIRECTORS | | | |
|
|
|
|
|
|
|
|
|
Steve E. Moss, 53
918 Meadow Lane
Henderson, NC 27536 | | Director; Audit Committee Member of each fund in the Fund Complex | | Since December 2004 | | Mr. Moss is a principal of Holden, Moss, Knott, Clark, Copley & Hoyle, P.A. and has been a member manager of HMKCT Properties, LLC since January 1996. Mr. Moss has been a Director and Member of the Audit Committee of each fund in the Fund Complex since December 2004. | | 5 |
|
|
|
|
|
|
|
|
|
H. Alexander Holmes, 66
3408 Landor Road
Raleigh, NC 27609 | | Director; Audit Committee Member of each fund in the Fund Complex | | Since December 2004 | | Mr. Holmes founded Holmes Advisory Services, LLC, a financial consultation firm, in 1993. Mr. Holmes has been a Director and Member of the Audit Committee of the Fund since December 2004. | | 5 |
NINETEEN
HATTERAS FUNDS
BOARD OF DIRECTORS
(unaudited) (continued)
| | | | | | | | |
Name, Address & Age | | Position(s)
Held with
the Fund | | Length of
Time Served | | Principal Occupation(s) During
Past 5 Years and Other
Directorships Held by Director | | Number of Portfolios in
Fund Complex’ Overseen
by Director or Officer |
|
|
|
|
|
|
|
|
|
INDEPENDENT DIRECTORS (continued) | |
|
|
|
|
|
|
|
|
|
Gregory S. Sellers, 47
2643 Steeplechase Road
Gastonia, NC 28056 | | Director; Audit Committee Member of each fund in the Fund Complex | | Since December 2004 | | Mr. Sellers became the Chief Financial Officer and a director of Kings Plush, Inc., a fabric manufacturer, in April 2003. Prior to that, he was the Vice President of Finance at Parksdale Mills, Inc., a cotton and cotton blend yarns producer, from January 1991 to April 2003. Mr. Sellers has been a Director and Member of the Audit Committee of each fund in the Fund Complex since December 2004. | | 5 |
|
|
|
|
|
|
|
|
|
Art Lottes, 56**
4813 Wynneford Way
Raleigh, NC 27615 | | Director; Audit Committee Member of each fund in the Fund Complex | | Since November 2007 | | Mr. Lottes was the President of CARQUEST Corporation, an automotive aftermarket company until December 2005. Mr. Lottes was a Board member of CARQUEST and General Parts until December 2005. | | 5 |
|
|
|
|
|
|
|
|
|
| |
* | Mr. Perkins is deemed to be an Interested Director of the Fund because of his affiliations with the Investment Manager. |
| |
** | Mr. Lottes resigned from the Board effective April 30, 2009. |
TWENTY
HATTERAS FUNDS
(unaudited)
Set forth below is the name, age, position with the Master Fund, length of term of office, and the principal occupation for the last five years of each of the persons currently serving as Executive Officers of the Master Fund. Unless otherwise noted, the business address of each officer is 8540 Colonnade Center Drive, Suite 401, Raleigh, NC 27615.
| | | | | | | | |
Name, Address & Age | | Position(s)
Held with
the Fund | | Length of
Time Served | | Principal Occupation(s) During
Past 5 Years and Other
Directorships Held by Director | | Number of Portfolios in
Fund Complex’ Overseen
by Director or Officer |
|
|
|
|
|
|
|
|
|
OFFICERS | | | | | | | | |
|
|
|
|
|
|
|
|
|
J. Michael Fields, 35
8540 Colonnade
Center Drive,
Suite 401
Raleigh, NC 27615 | | Secretary of each fund in the Fund Complex | | Since Inception | | Mr. Fields was previously Treasurer of the Funds from inception until December 2008. Mr. Fields became a Director of the Investment Manager in September 2003. Prior to joining the Investment Manager, Mr. Fields was employed by CapTrust Financial Advisors from August 2002 to September 2003. Prior to joining CapTrust, Mr. Fields was employed by Morgan Stanley in Atlanta, Georgia from January 2000 to August 2002. | | N/A |
|
|
|
|
|
|
|
|
|
Andrew P. Chica, 33
8540 Colonnade
Center Drive,
Suite 401
Raleigh, NC 27615 | | Chief Compliance Officer of each fund in the Fund Complex | | Since 2008 | | Mr. Chica joined Hatteras in November 2007 and became Chief Compliance Officer of each of the funds in the Fund Complex and the Investment Manager as of January 2008. Prior to joining Hatteras, Mr. Chica was the Compliance Manager for UMB Fund Services, Inc. from December 2004 to November 2007. From April 2000 to December 2004, Mr. Chica served as an Assistant Vice President and Compliance Officer with U.S. Bancorp Fund Services, LLC. | | N/A |
TWENTY-ONE
HATTERAS FUNDS
FUND MANAGEMENT
(unaudited) (continued)
| | | | | | | | |
Name, Address & Age | | Position(s)
Held with
the Fund | | Length of
Time Served | | Principal Occupation(s) During
Past 5 Years and Other
Directorships Held by Director | | Number of Portfolios in
Fund Complex’ Overseen
by Director or Officer |
|
|
|
|
|
|
|
|
|
OFFICERS (continued) | | | | | | | | |
|
|
|
|
|
|
|
|
|
Robert L. Baker, 37
8540 Colonnade
Center Drive,
Suite 401
Raleigh, NC 27615 | | Treasurer of each fund in the Fund Complex | | Since 2008 | | Mr. Baker joined Hatteras in March 2008 and became Treasurer of each of the funds in the Fund Complex in December 2008. Mr. Baker serves as the Chief Financial Officer of the Investment Manager. Prior to joining Hatteras, Mr. Baker worked for Smith Breeden Associates, an investment advisor located in Durham, NC. At Smith Breeden, Mr. Baker served as Vice President of Portfolio Accounting, Performance Reporting, and Fund Administration. Prior to working for Smith Breeden, Mr. Baker worked for BDO Seidman, LLP in Greensboro, NC. | | N/A |
|
|
|
|
|
|
|
|
|
TWENTY-TWO
HATTERAS FUNDS
(unaudited)
2008 Proxy Results
A Special Meeting of the Limited Partners of the Master Fund was held on June 25, 2008 to consider the proposals described below. Each proposal was approved. The results of the voting at the Special Meeting are as follows:
| |
1. | Approval of amendments to the Master Fund’s limited partnership agreement to include a performance allocation equal to 10% of the amount by which net new profits in the Master Fund exceed the non-cumulative hurdle amount which is calculated as of the last day of preceding calendar year of the Master Fund at a rate equal to the yield-to-maturity of the 90 day U.S. Treasury Bill as reported by The Wall Street Journal for the last business day of the preceding calendar year. |
| | | | | | | | | |
Hatteras Multi-Strategy Fund, L.P. | | No. of Shares | | % of Outstanding Shares | | % of Shares Voted | |
|
Affirmative | | 128,653,222.230 | | 49.146 | % | | 87.819 | % | |
Against | | 12,590,190.720 | | 4.810 | % | | 8.594 | % | |
Abstain | | 5,255,284.890 | | 2.008 | % | | 3.587 | % | |
|
|
|
|
|
|
|
|
|
|
Total | | 146,498,697.840 | | 55.964 | % | | 100.000 | % | |
| | | | | | | |
Hatteras Multi-Strategy TEI Fund, L.P. | | No. of Shares | | % of Outstanding Shares | | % of Shares Voted | |
|
|
|
|
|
|
|
|
Affirmative | | 175,924,564.060 | | 49.087 | % | | 93.086 | % | |
Against | | 5,787,098.450 | | 1.615 | % | | 3.062 | % | |
Abstain | | 7,279,648.080 | | 2.031 | % | | 3.852 | % | |
|
|
|
|
|
|
|
|
|
|
Total | | 188,991,310.590 | | 52.733 | % | | 100.000 | % | |
| | | | | | | |
Hatteras Multi-Strategy Institutional Fund, L.P. | | No. of Shares | | % of Outstanding Shares | | % of Shares Voted | |
|
|
|
|
|
|
|
|
Affirmative | | 71,395,930.670 | | 46.187 | % | | 82.663 | % | |
Against | | 11,122,442.090 | | 7.196 | % | | 12.878 | % | |
Abstain | | 3,851,516.630 | | 2.491 | % | | 4.459 | % | |
|
|
|
|
|
|
|
|
|
|
Total | | 86,369,889.390 | | 55.874 | % | | 100.000 | % | |
| | | | | | | |
Hatteras Multi-Strategy TEI Institutional Fund, L.P. | | No. of Shares | | % of Outstanding Shares | | % of Shares Voted | |
|
|
|
|
|
|
|
|
Affirmative | | 101,422,194.300 | | 46.868 | % | | 83.385 | % | |
Against | | 10,934,765.310 | | 5.053 | % | | 8.990 | % | |
Abstain | | 9,274,810.350 | | 4.286 | % | | 7.625 | % | |
|
|
|
|
|
|
|
|
|
|
Total | | 121,631,769.960 | | 56.207 | % | | 100.000 | % | |
| | | | | | | | | |
2. To transact such other business as may properly come before the Special Meeting or any adjournment thereof. |
| | | | | | | |
Hatteras Multi-Strategy Fund, L.P. | | No. of Shares | | % of Outstanding Shares | | % of Shares Voted | |
|
|
|
|
|
|
|
|
Affirmative | | 119,908,813.150 | | 45.806 | % | | 81.850 | % | |
Against | | 26,589,884.690 | | 10.158 | % | | 18.150 | % | |
|
|
|
|
|
|
|
|
|
|
Total | | 146,498,697.840 | | 55.964 | % | | 100.000 | % | |
TWENTY-THREE
HATTERAS FUNDS
OTHERINFORMATION
(unaudited) (continued)
| | | | | | | | | |
Hatteras Multi-Strategy TEI Fund, L.P. | | No. of Shares | | % of Outstanding Shares | | % of Shares Voted | |
|
|
|
|
|
|
|
|
Affirmative | | 178,000,535.170 | | 49.667 | % | | 94.185 | % | |
Against | | 10,990,775.420 | | 3.066 | % | | 5.815 | % | |
|
|
|
|
|
|
|
|
|
|
Total | | 188,991,310.590 | | 52.733 | % | | 100.000 | % | |
| | | | | | | |
Hatteras Multi-Strategy Institutional Fund, L.P. | | No. of Shares | | % of Outstanding Shares | | % of Shares Voted | |
|
|
|
|
|
|
|
|
Affirmative | | 68,659,530.290 | | 44.417 | % | | 79.495 | % | |
Against | | 17,710,359.100 | | 11.457 | % | | 20.505 | % | |
|
|
|
|
|
|
|
|
|
|
Total | | 86,369,889.390 | | 55.874 | % | | 100.000 | % | |
| | | | | | | |
Hatteras Multi-Strategy TEI Institutional Fund, L.P. | | No. of Shares | | % of Outstanding Shares | | % of Shares Voted | |
|
|
|
|
|
|
|
|
Affirmative | | 97,056,714.190 | | 44.851 | % | | 79.796 | % | |
Against | | 24,575,055.770 | | 11.356 | % | | 20.204 | % | |
|
|
|
|
|
|
|
|
|
|
Total | | 121,631,769.960 | | 56.207 | % | | 100.000 | % | |
Proxy Voting
For free information regarding how the Fund voted proxies during the period ended June 30, 2008 or to obtain a free copy of the Fund’s complete proxy voting policies and procedures, call 1-800-504-9070 or visit the SEC’s website at http://www.sec.gov.
Availability of Quarterly Portfolio Schedules
The Fund files its complete schedule of portfolio holdings with the SEC for the first and third quarters of each fiscal year on Form N-Q. The Fund’s Form N-Q is available, without charge and upon request, on the SEC’s website at http://www.sec.gov or may be reviewed and copied at the SEC’s Public Reference Room in Washington, DC. Information on the Public Reference Room may be obtained by calling 1-800-SEC-0330.
TWENTY-FOUR
HATTERAS FUNDS
Hatteras Master Fund, L.P. (a Delaware Limited Partnership)
Financial Statements
For the year ended March 31, 2009
with Report of Independent Registered Public Accounting Firm
HATTERAS FUNDS
For the year ended March 31, 2009
Hatteras Master Fund, L.P. (a Delaware Limited Partnership)
Table of Contents
| |
| Deloitte & Touche LLP |
1700 Market Street |
Philadelphia, PA 19103-3984 |
USA |
|
| Tel: +1 215 246 2300 |
| Fax: +1 215 569 2441 |
| www.deloitte.com |
REPORT OF INDEPENDENT REGISTERED PUBLIC ACCOUNTING FIRM
To the Board of Directors and Partners of Hatteras Master Fund, L.P.:
We have audited the accompanying statement of assets, liabilities, and partners’ capital of Hatteras Master Fund, L.P. (a Delaware Limited Partnership) (the “Master Fund”), including the schedule of investments, as of March 31, 2009, and the related statements of operations and cash flows for the year then ended, and the statements of changes in partners’ capital for each of the two years in the period then ended. These financial statements are the responsibility of the Master Fund’s management. Our responsibility is to express an opinion on these financial statements based on our audits.
We conducted our audits in accordance with the standards of the Public Company Accounting Oversight Board (United States). Those standards require that we plan and perform the audit to obtain reasonable assurance about whether the financial statements are free of material misstatement. The Master Fund is not required to have, nor were we engaged to perform, an audit of its internal control over financial reporting. Our audits included consideration of internal control over financial reporting as a basis for designing audit procedures that are appropriate in the circumstances, but not for the purpose of expressing an opinion on the effectiveness of the Master Fund’s internal control over financial reporting. Accordingly, we express no such opinion. An audit also includes examining, on a test basis, evidence supporting the amounts and disclosures in the financial statements, assessing the accounting principles used and significant estimates made by management, as well as evaluating the overall financial statement presentation. Our procedures included confirmation of investments owned as of March 31, 2009, by correspondence with the Underlying Fund Advisors and custodian. We believe that our audits provide a reasonable basis for our opinion.
In our opinion, the financial statements referred to above present fairly, in all material respects, the financial position of Hatteras Master Fund, L.P. as of March 31, 2009, the results of its operations and its cash flows for the year then ended, and the changes in its partners’ capital for each of the two years in the period then ended, in conformity with accounting principles generally accepted in the United States of America.
As discussed in Note 2 to the financial statements, the financial statements include investments valued at $1,074,675,464 (85.99% of total assets) as of March 31, 2009, whose fair values have been estimated by management in the absence of readily determinable fair values. Management’s estimates are based on information provided by the Underlying Fund Advisors.
| |
| |
| |
May 29, 2009 | |
| |
| Member of |
| Deloitte Touche Tohmatsu |
HATTERAS MASTER FUND, L.P. (A DELAWARE LIMITED PARTNERSHIP)
SCHEDULEOF INVESTMENTS
March 31, 2009
INVESTMENT OBJECTIVEAS A PERCENTAGE OF TOTAL PARTNERS’ CAPITAL
Percentages are as follows:
(unaudited)
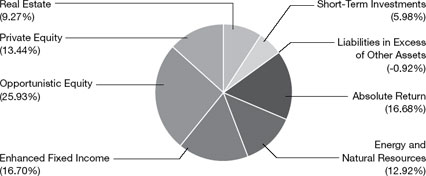
| | | | | | | |
Investments in Underlying Funds (94.94%) | | Cost | | Fair Value | |
|
|
|
|
|
|
|
|
Absolute Return (16.68%)e | | | | | | | |
Black River Commodity Multi Strategy Fund, L.P.a, b | | $ | 477,335 | | $ | 533,653 | |
Broad Peak Fund, L.P.a, b | | | 12,000,000 | | | 11,461,326 | |
Citadel Derivatives Group Investors, LLCa, b | | | 3,413,210 | | | 5,619,450 | |
Citadel Wellington Partners, LLCa, b, f | | | 29,747,987 | | | 18,149,592 | |
Courage Special Situations Fund, L.P.a, b | | | 4,827,675 | | | 4,346,937 | |
D.E. Shaw Composite Fund, LLCa, b, f | | | 23,000,000 | | | 23,116,592 | |
Eton Park Fund, L.P.a, b | | | 19,000,000 | | | 19,147,937 | |
JANA Partners Qualified, L.P.a, b | | | 92,329 | | | 8,388 | |
Marathon Fund, L.P.a, b | | | 11,121,137 | | | 7,640,040 | |
Montrica Global Opportunities Fund, L.P.a, b | | | 14,583,827 | | | 10,978,614 | |
Paulson Advantage, L.P.a, b | | | 28,000,000 | | | 35,471,967 | |
OZ Asia Domestic Partners, L.P.a, b | | | 2,417,711 | | | 2,006,132 | |
Paulson Partners Enhanced, L.P.a, b | | | 7,000,000 | | | 12,498,426 | |
Perry Partners, L.P.a, b | | | 10,404,723 | | | 7,631,072 | |
Stark Investments, L.P.a, b, f | | | 12,000,000 | | | 9,468,766 | |
Waterstone Market Neutral Fund, L.P.a, b | | | 18,000,000 | | | 23,639,666 | |
|
|
|
|
|
|
|
|
Total Absolute Return (16.68%) | | | | | | 191,718,558 | |
|
|
|
|
|
|
|
|
See notes to financial statements.
TWO
|
HATTERAS MASTER FUND, L.P. (A DELAWARE LIMITED PARTNERSHIP) |
|
SCHEDULE OF INVESTMENTS |
|
March 31, 2009 (continued) |
| | | | | | | |
Energy and Natural Resources (12.92%)e | | Cost | | Fair Value | |
|
|
|
|
| |
Investment in Limited Partnership Interests | | | | | | | |
Arclight Energy Partners Fund III, L.P.b | | $ | 4,370,803 | | $ | 4,216,178 | |
Arclight Energy Partners Fund IV, L.P.a, b | | | 2,892,019 | | | 2,703,477 | |
Cadent Energy Partners II, L.P.a, b | | | 2,375,766 | | | 1,387,974 | |
Camcap Resources, L.P.a, b | | | 875,867 | | | 433,485 | |
Canaan Natural Gas Fund X, L.P.a, b | | | 2,197,250 | | | 2,189,987 | |
Centennial Energy Partners, L.P.a, b | | | 15,000,000 | | | 4,197,601 | |
Chilton Global Natural Resources Partners, L.P.a, b | | | 24,000,000 | | | 17,873,692 | |
EnerVest Energy Institutional Fund X-A, L.P.b | | | 2,178,934 | | | 2,240,128 | |
EnerVest Energy Institutional Fund XI-A, L.P.b | | | 4,167,434 | | | 3,230,720 | |
Intervale Capital Fund, L.P.a, b | | | 1,653,242 | | | 2,206,542 | |
Merit Energy Partners F-II, L.P.b | | | 468,811 | | | 484,327 | |
Natural Gas Partners IX, L.P.b | | | 1,907,899 | | | 1,332,292 | |
Natural Gas Partners VIII, L.P.b | | | 3,466,812 | | | 3,600,494 | |
NGP Energy Technology Partners II, L.P.a, b | | | 305,310 | | | 201,756 | |
NGP Energy Technology Partners, L.P.a, b | | | 855,565 | | | 949,347 | |
NGP Midstream & Resources, L.P.b | | | 3,210,294 | | | 3,220,897 | |
Ospraie Special Opportunities Fund, L.P.a, b | | | 5,000,000 | | | 4,379,049 | |
Pine Brook Capital Partners, L.P.a, b | | | 2,290,068 | | | 1,908,685 | |
Quantum Energy Partners IV, L.P.a, b | | | 2,111,806 | | | 2,030,463 | |
Quantum Energy Partners V, L.P.a, b | | | 1,708,634 | | | 1,223,618 | |
Sentient Global Resources Fund III, L.P.a, b | | | 4,143,635 | | | 3,860,094 | |
Southport Energy Plus Partners, L.P.a, b | | | 23,083,819 | | | 32,457,507 | |
Touradji Global Resources Fund, L.P.a, b | | | 24,435,332 | | | 26,707,188 | |
Touradji Global Resources Holdings LLCa, b | | | 3,434,008 | | | 3,434,008 | |
TPF II L.P.a, b | | | 6,298,169 | | | 5,720,964 | |
|
|
|
|
|
|
| |
Total Investment in Limited Partnership Interests | | | | | | 132,190,473 | |
|
|
|
|
|
|
| |
| | | | | | | |
Investment in Exchange Traded Funds | | | | | | | |
ETF—SPDR S&P Oil & Gas Exploration & Productionc | | | 4,999,255 | | | 4,669,630 | |
ETF—Market Vectors Gold Minersc | | | 4,998,858 | | | 5,624,200 | |
Mutual Fund—Ridgeworth Seix Floating Ic | | | 3,000,000 | | | 3,026,354 | |
Mutual Fund—TCW Total Return Bond Ic | | | 3,000,000 | | | 2,993,440 | |
|
|
|
|
|
|
| |
Total Investment in Exchange Traded Funds | | | | | | 16,313,624 | |
|
|
|
|
|
|
| |
Total Energy and Natural Resources (12.92%) | | | | | | 148,504,097 | |
|
|
|
|
|
|
| |
See notes to financial statements.
THREE
|
HATTERAS MASTER FUND, L.P. (A DELAWARE LIMITED PARTNERSHIP) |
|
SCHEDULE OF INVESTMENTS |
|
March 31, 2009 (continued) |
| | | | | | | |
Enhanced Fixed Income (16.70%)e | | Cost | | Fair Value | |
|
|
|
|
| |
Anchorage Crossover Credit Fund II, L.P.a, b | | $ | 14,477,220 | | $ | 14,934,164 | |
Anchorage Short Credit Fund II, L.P.a, b | | | 10,000,000 | | | 8,858,608 | |
BDCM Partners I, L.P.a, b, f | | | 31,500,000 | | | 28,342,769 | |
Contrarian Capital Fund I, L.P.a, b | | | 15,880,064 | | | 13,303,052 | |
CPIM Structured Credit Fund 1000, L.P.a, b, f | | | 1,042,483 | | | 235,637 | |
D.B. Zwirn Special Opportunities Fund, L.P.a, b, f | | | 8,092,619 | | | 6,940,859 | |
Drawbridge Special Opportunities Fund, L.P.a, b | | | 17,000,000 | | | 13,873,646 | |
Halcyon European Structured Opportunities Fund L.P.a, b, f | | | 11,182,481 | | | 3,779,043 | |
Harbinger Capital Partners Fund I, L.P.a, b, f | | | 14,567,661 | | | 10,809,521 | |
Lazard Emerging Income Plus, LTDb | | | 10,506,794 | | | 8,900,351 | |
Marathon Special Opportunities Fund, L.P.a, b | | | 14,937,116 | | | 10,880,747 | |
McDonnell Loan Opportunity Funda, b | | | 10,000,000 | | | 2,380,831 | |
Ore Hill Fund II, L.P.a, b, f | | | 5,065,195 | | | 3,434,051 | |
Prospect Harbor Credit Partners, L.P.a, b, f | | | 20,000,000 | | | 7,025,958 | |
Standard Pacific Asymmetric Opportunities Fund, L.P.a, b | | | 23,000,000 | | | 28,775,206 | |
Strategic Value Restructuring Fund, L.P.a, b | | | 15,428,312 | | | 12,627,519 | |
The Rohaytyn Group Local Currency Opportunity Partners, L.P.a, b | | | 18,000,000 | | | 16,757,193 | |
Venor Capital Partners, L.P.a, b | | | 76,779 | | | 31,179 | |
|
|
|
|
|
|
| |
Total Enhanced Fixed Income (16.70%) | | | | | | 191,890,334 | |
|
|
|
|
|
|
| |
| | | | | | | |
Opportunistic Equity (25.93%)e | | | | | | | |
Algebris Global Financials Fund, L.P.a, b | | | 18,035,735 | | | 15,549,716 | |
Artis Technology Qualified 2X (Institutional), L.P.a, b | | | 10,500,000 | | | 12,544,902 | |
Asian Century Quest Fund (QP) L.P.a, b | | | 25,000,000 | | | 23,937,432 | |
Boyer Allan Greater China Fund, L.P.a, b | | | 5,000,000 | | | 4,731,000 | |
Criterion Horizons Fund, L.P.a, b | | | 7,035,000 | | | 5,971,067 | |
CRM Windridge Partners, L.P.a, b | | | 14,522,017 | | | 15,573,921 | |
D.E. Shaw Oculus Fund LLCa, b, f | | | 25,000,000 | | | 30,525,093 | |
Drawbridge Global Macro Fund, L.P.a, b | | | 66,537 | | | 55,509 | |
GMO Mean Reversion Fund, L.P.a, b | | | 6,770,065 | | | 10,420,577 | |
Gracie Capital L.P.a, b, f | | | 398,023 | | | 200,714 | |
Gradient Europe Fund, L.P.a, b | | | 13,500,000 | | | 3,695,573 | |
Great Point Biomedical Value Fund, L.P.a, b | | | 15,500,000 | | | 11,376,025 | |
HealthCor, L.P.a, b | | | 17,000,000 | | | 22,559,074 | |
JANA Nirvana Fund LPa, b | | | 4,315,800 | | | 4,023,124 | |
Miura Global Partners II, L.P.a, b | | | 26,000,000 | | | 25,916,209 | |
Penta Asia Domestic Partners, L.P.a, b | | | 27,000,000 | | | 13,354,515 | |
Samlyn Onshore Fund, L.P.a, b | | | 28,000,000 | | | 33,916,341 | |
| |
See notes to financial statements. | (Continued) |
FOUR
|
HATTERAS MASTER FUND, L.P. (A DELAWARE LIMITED PARTNERSHIP) |
|
SCHEDULE OF INVESTMENTS |
|
March 31, 2009 (continued) |
| | | | | | | |
Opportunistic Equity (25.93%) (continued)e | | Cost | | Fair Value | |
|
|
|
|
| |
Sansar Capital Holdings, LTDa, b, f | | $ | 633,100 | | $ | 552,758 | |
Sansar Capital, L.P.a, b, f | | | 12,984,300 | | | 7,259,639 | |
SCP Ocean Fund, L.P.a, b | | | 9,002,947 | | | 11,790,738 | |
SR Global Fund, L.P. (Class C) Internationala, b | | | 7,457,674 | | | 8,921,808 | |
SR Global Fund, L.P. (Class G) Emerginga, b | | | 12,281,970 | | | 12,245,911 | |
The Raptor Private Holdings, LPa, b | | | 1,549,293 | | | 1,549,293 | |
Viking Global Equities, L.P.a, b | | | 11,500,000 | | | 13,361,834 | |
Visium Balanced Fund, LPa, b | | | 7,307,739 | | | 7,885,073 | |
|
|
|
|
|
|
| |
Total Opportunistic Equity (25.93%) | | | | | | 297,917,846 | |
|
|
|
|
|
|
| |
| | | | | | | |
Private Equity (13.44%)e | | Cost | | Fair Value | |
|
|
|
|
| |
ABRY Advanced Securities Fund, L.P.a, b | | $ | 2,427,670 | | $ | 1,615,736 | |
ABRY Partners VI L.P.a, b | | | 1,680,178 | | | 1,704,996 | |
Accel-KKR Capital Partners III, L.P.a, b | | | 1,298,109 | | | 1,165,558 | |
Actis Umbrella Fund, L.P.b | | | 2,103,273 | | | 889,000 | |
BDCM Opportunity Fund II, L.P.a, b | | | 1,468,707 | | | 1,428,795 | |
Brazos Equity Fund II, L.P.b | | | 2,937,681 | | | 2,561,633 | |
Brazos Equity Fund III, L.P.b, d | | | 160,121 | | | 0 | |
Carlyle Japan International Partners II, L.P.a, b | | | 522,970 | | | 443,799 | |
Carlyle Partners V, L.P.a, b | | | 3,220,537 | | | 2,590,900 | |
CDH Venture Partners II, L.P.a, b | | | 1,583,327 | | | 1,390,642 | |
CJIP II Co-Invest, L.P.a, b | | | 107,197 | | | 106,207 | |
Claremont Creek Ventures II, L.P.a, b | | | 154,375 | | | 130,837 | |
Claremont Creek Ventures, L.P.a, b | | | 1,040,416 | | | 1,071,589 | |
Crosslink Crossover Fund IV, L.P.a, b | | | 3,818,586 | | | 4,916,560 | |
Crosslink Crossover Fund V, L.P.a, b | | | 10,584,676 | | | 8,846,880 | |
Dace Ventures I, L.P.a, b | | | 1,176,333 | | | 939,181 | |
Darwin Private Equity I, L.P.b | | | 1,615,675 | | | 846,528 | |
Encore Consumer Capital Fund, L.P.b | | | 2,481,262 | | | 1,989,687 | |
Exponent Private Equity Partners II, L.P.a, b | | | 2,351,737 | | | 1,141,987 | |
Fairhaven Capital Partners, L.P.a, b | | | 1,212,601 | | | 931,144 | |
Gavea Investment Fund II A, L.P.a, b | | | 5,000,000 | | | 3,314,929 | |
Gavea Investment Fund III A, L.P.a, b | | | 10,000,000 | | | 7,825,520 | |
Great Point Partners I, L.P.b | | | 1,324,455 | | | 1,315,942 | |
Halifax Fund II, L.P.b | | | 1,244,608 | | | 1,505,489 | |
Hancock Park Capital III, L.P.b | | | 3,000,000 | | | 2,383,785 | |
Healthcor Partners Fund, L.P.a, b | | | 1,496,430 | | | 1,257,777 | |
| |
See notes to financial statements. | (Continued) |
FIVE
|
HATTERAS MASTER FUND, L.P. (A DELAWARE LIMITED PARTNERSHIP) |
|
SCHEDULE OF INVESTMENTS |
|
March 31, 2009 (continued) |
| | | | | | | |
Private Equity (13.44%) (continued)e | | Cost | | Fair Value | |
|
|
|
|
| |
Hillcrest Partners Fund, L.P.a, b | | $ | 461,514 | | $ | 42,118 | |
Hony Capital Fund 2008, L.P.a, b | | | 708,280 | | | 597,666 | |
Integral Capital Partners VII, L.P.a, b | | | 6,000,000 | | | 5,104,929 | |
Integral Capital Partners VIII, L.P.a, b | | | 10,000,000 | | | 6,338,270 | |
Tenaya Capital V, L.P.a, b | | | 1,290,018 | | | 1,021,169 | |
Lighthouse Capital Partners VI, L.P.a, b | | | 3,875,000 | | | 3,848,708 | |
Mid Europa Fund III, L.P.a, b | | | 1,559,897 | | | 1,316,630 | |
New Horizon Capital III, L.P.a, b | | | 94,925 | | | 40,000 | |
OCM European Principal Opportunities Fund, L.P.a, b | | | 3,720,307 | | | 5,170,413 | |
OCM Mezzanine Fund II, L.P.b | | | 3,960,161 | | | 3,164,569 | |
Orchid Asia IV, L.P.a, b | | | 1,884,404 | | | 1,657,980 | |
Pipe Equity Partners, LLCa, b | | | 33,824,693 | | | 30,770,822 | |
Private Equity Investment Fund IV, L.P.b | | | 3,306,039 | | | 3,480,827 | |
RoundTable Healthcare Partners II, L.P.a, b | | | 1,403,378 | | | 1,270,723 | |
Saints Capital VI, L.P.a, b | | | 3,395,092 | | | 3,381,888 | |
Sanderling Venture Partners VI Co—Investment Fund, L.P.a, b | | | 616,178 | | | 619,281 | |
Sanderling Venture Partners VI, L.P.a, b | | | 695,017 | | | 1,197,521 | |
Sentinel Capital Partners IV, LPa, b | | | 207,127 | | | 126,151 | |
Sterling Capital Partners III, L.P.a, b | | | 1,758,975 | | | 1,320,791 | |
Sterling Capital Partners Venture Fund II, L.P.b | | | 1,635,846 | | | 1,522,443 | |
Strategic Value Global Opportunities Fund I-A, L.P.a, b | | | 3,627,465 | | | 3,370,158 | |
The Column Group, L.P.b | | | 767,320 | | | 477,574 | |
Trivest Fund IV, L.P.a, b | | | 1,963,205 | | | 1,626,399 | |
Valiant Capital Partners, L.P.a, b | | | 16,018,914 | | | 18,909,990 | |
VCFA Private Equity Partners IV, L.P.b | | | 1,294,278 | | | 1,387,130 | |
VCFA Venture Partners V, L.P.b | | | 3,404,320 | | | 3,218,756 | |
Voyager Capital Fund III, LPb | | | 849,872 | | | 744,575 | |
Zero2IPO China Fund II, L.P.a, b | | | 500,000 | | | 395,522 | |
|
|
|
|
|
|
| |
Total Private Equity (13.44%) | | | | | | 154,438,104 | |
|
|
|
|
|
|
| |
| | | | | | | |
Real Estate (9.27%)e | | Cost | | Fair Value | |
|
|
|
|
| |
Arminius Moat, L.P.a, b | | $ | 5,014,467 | | $ | 4,773,683 | |
Benson Elliot Real Estate Partners II, L.P.a, b | | | 3,127,809 | | | 2,051,506 | |
Carlyle Distressed RMBS Partners L.P.a, b | | | 18,501,274 | | | 18,485,190 | |
Colony Investors VII, L.P.b | | | 2,829,420 | | | 1,168,100 | |
Colony Investors VIII, L.P.a, b | | | 6,657,510 | | | 1,889,600 | |
DaVinci Corporate Opportunity Partners, L.P.a, b, d | | | 3,809,466 | | | 0 | |
Forum European Realty Income III, L.P.b | | | 1,427,526 | | | 898,939 | |
| |
See notes to financial statements. | (Continued) |
SIX
|
HATTERAS MASTER FUND, L.P. (A DELAWARE LIMITED PARTNERSHIP) |
|
SCHEDULE OF INVESTMENTS |
|
March 31, 2009 (continued) |
| | | | | | | |
Real Estate (9.27%) (continued)e | | Cost | | Fair Value | |
|
|
|
|
|
|
Greenfield Acquisition Partners V, L.P.a, b | | $ | 2,141,818 | | $ | 1,809,323 | |
GTIS Brazil Real Estate Fund, L.P.a, b | | | 1,126,776 | | | 757,244 | |
ING Clarion Global, L.P.a, b | | | 9,283,925 | | | 8,929,515 | |
JREIT Enhanced LLCa, b | | | 10,000,000 | | | 5,122,129 | |
New City Asia Partners (T), L.P.a, b | | | 6,328,715 | | | 5,474,587 | |
Northwood Real Estate Co-Investors, L.P.a, b | | | 148,167 | | | 109,546 | |
Northwood Real Estate Partners, L.P.a, b | | | 666,974 | | | 344,880 | |
Oak Hill REIT Plus, L.P.a, b | | | 7,471,061 | | | 9,823,117 | |
ORBIS Real Estate Fund Ia, b | | | 3,056,897 | | | 2,372,303 | |
Patron Capital L.P. IIIa, b | | | 1,295,711 | | | 850,403 | |
Phoenix Asia Real Estate Investments II, L.P.a, b | | | 5,715,595 | | | 5,928,800 | |
Rockwood Capital Real Estate Partners Fund VII, L.P.a, b | | | 3,650,678 | | | 1,243,208 | |
Security Capital Preferred Growth, Inc.b | | | 1,371,234 | | | 226,362 | |
Square Mile Partners III, L.P.a, b | | | 2,503,830 | | | 2,132,992 | |
TCW Special Mortgage Credits Fund L.P.a, b | | | 20,230,904 | | | 17,367,702 | |
Transwestern Mezzanine Realty Partners II, LLCb | | | 1,843,736 | | | 722,700 | |
Transwestern Mezzanine Realty Partners III, LLCb | | | 1,442,374 | | | 984,600 | |
WCP Real Estate Fund I, L.P.a, b | | | 4,863,515 | | | 4,720,722 | |
WCP Real Estate Strategies Fund, L.P.a, b, f | | | 11,000,000 | | | 8,332,998 | |
|
|
|
|
|
|
|
|
Total Real Estate (9.27%) | | | | | | 106,520,149 | |
|
|
|
|
|
|
|
|
Total investments in Underlying Funds (Cost $1,209,974,979) (94.94%) | | | | | | 1,090,989,088 | |
|
|
|
|
|
|
|
|
Short-Term Investments (5.98%) | | | | | | | |
Federated Prime Obligations Fund #10 | | | 68,703,875 | | | 68,703,875 | |
|
|
|
|
|
|
|
|
Total Short-Term Investments (Cost $68,703,875) (5.98%) | | | | | | 68,703,875 | |
|
|
|
|
|
|
|
|
Total Investments (Cost $1,278,678,854) (100.92%) | | | | | | 1,159,692,963 | |
|
|
|
|
|
|
|
|
Liabilities in excess of other assets (-0.92%) | | | | | | (10,568,938 | ) |
|
|
|
|
|
|
|
|
Partners’ capital—100.00% | | | | | $ | 1,149,124,025 | |
|
|
|
|
|
|
|
|
| |
a | Non-income producing. |
| |
b | Underlying Funds are issued in private placement transactions and as such are restricted as to resale. |
| |
c | Securities held in custody by Deutsche Bank N.A. (The total cost and fair value of these securities was $15,998,113 and $16,313,624, respectively.) |
| |
d | Cost includes amounts due to Underlying Fund Advisor. |
| |
e | Sector classifications are unaudited by Deloitte & Touche LLP. |
| |
f | The Underlying Fund Advisor has imposed gates on or has restricted redemptions from Underlying Funds. |
| |
| Total cost and fair value of restricted underlying funds as of March 31, 2009 was $1,193,976,866 and $1,074,675,464, respectively. |
See notes to financial statements.
SEVEN
HATTERAS MASTER FUND, L.P. (A DELAWARE LIMITED PARTNERSHIP)
STATEMENTOFASSETS, LIABILITIESANDPARTNERS’ CAPITAL
March 31, 2009
| | | | |
Assets | | | | |
Investments in Underlying Funds, at fair value (cost $1,209,974,979) | | $ | 1,090,989,088 | |
Investments in short-term investments, at fair value (cost $68,703,875) | | | 68,703,875 | |
Cash | | | 37,358 | |
Receivable from redemption of Underlying Funds | | | 72,793,639 | |
Investments in Underlying Funds paid in advance | | | 16,887,261 | |
Withholding tax refund receivable | | | 175,445 | |
Dividends and interest receivable | | | 53,841 | |
Prepaid assets | | | 1,495 | |
|
|
|
|
|
Total assets | | $ | 1,249,642,002 | |
|
|
|
|
|
Liabilities and partners’ capital | | | | |
Contributions received in advance | | $ | 18,769,390 | |
Withdrawals payable | | | 79,542,376 | |
Due to Underlying Fund Advisors | | | 509,731 | |
Management fee payable | | | 1,024,507 | |
Professional fees payable | | | 338,887 | |
Accounting and administration fees payable | | | 142,818 | |
Risk management fees payable | | | 87,386 | |
Line of credit fees payable | | | 54,305 | |
Custodian fees payable | | | 10,027 | |
Printing fees payable | | | 2,170 | |
Other expenses payable | | | 36,380 | |
|
|
|
|
|
Total liabilities | | | 100,517,977 | |
|
|
|
|
|
Partners’ capital | | | 1,149,124,025 | |
|
|
|
|
|
Total liabilities and partners’ capital | | $ | 1,249,642,002 | |
|
|
|
|
|
Partners’ capital | | | | |
Capital contributions (net) | | | 1,394,650,781 | |
Accumulated net investment loss | | | (22,160,474 | ) |
Accumulated net realized loss | | | (104,380,391 | ) |
Accumulated net unrealized depreciation on investments | | | (118,985,891 | ) |
|
|
|
|
|
Partners’ capital | | $ | 1,149,124,025 | |
|
|
|
|
|
See notes to financial statements.
EIGHT
HATTERAS MASTER FUND, L.P. (A DELAWARE LIMITED PARTNERSHIP)
STATEMENTOFOPERATIONS
For the year ended March 31, 2009
| | | | |
Investment income | | | | |
Dividends | | $ | 4,285,118 | |
|
|
|
|
|
Total investment income | | | 4,285,118 | |
|
|
|
|
|
Operating expenses | | | | |
Management fee | | | 12,596,565 | |
Accounting and administration fees | | | 869,657 | |
Professional fees | | | 617,428 | |
Risk management expense | | | 544,947 | |
Line of credit fees | | | 194,822 | |
Insurance expense | | | 151,359 | |
Interest expense | | | 127,078 | |
Board of directors’ fees | | | 120,000 | |
Custodian fees | | | 86,520 | |
Compliance consulting fees | | | 30,000 | |
Printing fees | | | 14,685 | |
Other expenses | | | 82,600 | |
|
|
|
|
|
Total operating expenses | | | 15,435,661 | |
|
|
|
|
|
Net investment loss | | | (11,150,543 | ) |
|
|
|
|
|
Realized loss and change in unrealized appreciation/(depreciation) on investments in Underlying Funds | | | | |
Net realized loss from investments in Underlying Funds | | | (114,954,996 | ) |
Net change in unrealized appreciation/(depreciation) on investments in Underlying Funds | | | (182,068,211 | ) |
|
|
|
|
|
Net realized loss and change in unrealized appreciation/(depreciation) on investments in Underlying Funds | | | (297,023,207 | ) |
|
|
|
|
|
Net decrease in partners’ capital resulting from operations | | $ | (308,173,750 | ) |
|
|
|
|
|
See notes to financial statements.
NINE
HATTERAS MASTER FUND, L.P. (A DELAWARE LIMITED PARTNERSHIP)
STATEMENTOFCHANGESIN PARTNERS’ CAPITAL
For the years ended March 31, 2008 and 2009
| | | | |
| | | | |
| | Limited
Partners’
Capital* | |
|
|
|
|
Partners’ Capital, at March 31, 2007 | | $ | 432,119,739 | |
Capital contributions | | | 698,439,845 | |
Capital withdrawals | | | (86,361,449 | ) |
Net investment loss | | | (5,470,969 | ) |
Net realized gain from investments in Underlying Funds | | | 8,474,227 | |
Net increase in unrealized appreciation/(depreciation) on investments in Underlying Funds | | | 3,383,998 | |
|
|
|
|
|
Partners’ Capital, at March 31, 2008** | | $ | 1,050,585,391 | |
Capital contributions | | | 624,585,138 | |
Capital withdrawals | | | (217,872,754 | ) |
Net investment loss | | | (11,150,543 | ) |
Net realized loss from investments in Underlying Funds | | | (114,954,996 | ) |
Net change in unrealized appreciation/(depreciation) on investments in Underlying Funds | | | (182,068,211 | ) |
|
|
|
|
|
Partners’ Capital, at March 31, 2009*** | | $ | 1,149,124,025 | |
|
|
|
|
|
| |
* | As the General Partner does not own an interest in the Master Fund, the Limited Partners’ capital represents total capital of the Master Fund. |
| |
** | Including accumulated net investment loss of $11,009,931. |
| |
*** | Including accumulated net investment loss of $22,160,474. |
See notes to financial statements.
TEN
HATTERAS MASTER FUND, L.P. (A DELAWARE LIMITED PARTNERSHIP)
STATEMENTOF CASH FLOWS
For the year ended March 31, 2009
| | | | |
Cash flows from operating activities: | | | | |
Net decrease in partners’ capital resulting from operations | | $ | (308,173,750 | ) |
Adjustments to reconcile net decrease in partners’ capital resulting from operations to net cash used in operating activities: | | | | |
Purchases of Underlying Funds | | | (592,965,490 | ) |
Proceeds from redemptions of Underlying Funds | | | 291,327,912 | |
Net realized loss from investments in Underlying Funds | | | 114,954,996 | |
Net change in unrealized appreciation on investments in Underlying Funds | | | 182,068,211 | |
Decrease in investments in Underlying Funds paid in advance | | | 24,447,413 | |
Net (purchases) sales of short-term investments | | | (68,703,875 | ) |
Increase in receivable from redemption of Underlying Funds | | | (54,967,736 | ) |
Increase in withholding tax refund receivable | | | (153,714 | ) |
Increase in dividends and interest receivable | | | (23,231 | ) |
Decrease in prepaid assets | | | 12,987 | |
Decrease in other assets | | | 13,922 | |
Increase in due to the Underlying Fund Advisors | | | 509,731 | |
Increase in management fee payable | | | 99,417 | |
Increase in professional fees payable | | | 61,640 | |
Increase in accounting and administration fees payable | | | 63,382 | |
Decrease in custodian fees payable | | | (28,516 | ) |
Increase in topiary directors’ fees payable | | | (18,024 | ) |
Increase in printing fees payable | | | 1,340 | |
Increase in line of credit fees payable | | | 54,305 | |
Increase in other expenses payable | | | 36,380 | |
Increase in risk management fees payable | | | 19,605 | |
|
|
|
|
|
Net cash used in operating activities | | | (411,363,095 | ) |
|
|
|
|
|
Cash flows from financing activities: | | | | |
Capital contributions | | | 574,220,097 | |
Capital withdrawals | | | (197,230,378 | ) |
Line of credit borrowings | | | 109,000,000 | |
Line of credit repayments | | | (109,000,000 | ) |
|
|
|
|
|
Net cash provided by financing activities | | | 376,989,719 | |
|
|
|
|
|
Net change in cash and cash equivalents | | | (34,373,376 | ) |
Cash and cash equivalents at beginning of year | | | 34,410,734 | |
|
|
|
|
|
Cash and cash equivalents at end of year | | $ | 37,358 | |
|
|
|
|
|
Supplemental Disclosure of Interest Paid | | $ | 127,078 | |
|
|
|
|
|
See notes to financial statements.
ELEVEN
HATTERAS MASTER FUND, L.P. (A DELAWARE LIMITED PARTNERSHIP)
NOTESTO FINANCIAL STATEMENTS
March 31, 2009
1. ORGANIZATION
Hatteras Master Fund, L.P. (the “Master Fund”) was organized as a limited partnership under the laws of the State of Delaware on October 29, 2004 and commenced operations on January 1, 2005. The Master Fund is registered under the Investment Company Act of 1940, as amended (the “1940 Act”), as a closed-end, non-diversified management investment company. The Master Fund is managed by Hatteras Investment Partners, LLC (the “Investment Manager”), a Delaware limited liability company registered as an investment adviser under the Investment Advisers Act of 1940, as amended. The objective of the Master Fund is to generate consistent long-term appreciation and returns across all market cycles. To achieve its objective, the Master Fund will provide its limited partners (each, a “Limited Partner” and together, the “Limited Partners”) with access to a broad range of investment strategies and asset categories, trading advisors (“Advisors”) and overall asset allocation services typically available on a collective basis to larger institutions. Generally, the Investment Manager intends to select Advisors that collectively employ widely diversified investment strategies and engage in such techniques as opportunistic equity, enhanced fixed income, absolute return, private equity, real estate and energy/natural resources. However, the Investment Manager may also retain Advisors who utilize other strategies. The Master Fund invests with each Advisor either by becoming a participant in an investment vehicle operated by the Advisor (an “Underlying Fund”) or directly in exchange traded funds.
Hatteras Investment Management LLC, a Delaware limited liability company, serves as the General Partner of the Master Fund (the “General Partner”). The General Partner is an affiliate of the Investment Manager. The General Partner has appointed a Board of Directors (the “Board”) and, to the fullest extent permitted by applicable law, has irrevocably delegated to the Board its rights and powers to monitor and oversee the business affairs of the Master Fund, including the complete and exclusive authority to oversee and establish policies regarding the management, conduct and operation of the Master Fund’s business.
Effective October 1, 2007, according to a reorganization plan (the “Master Fund Agreement”) approved by the Board and the board of directors of the Topiary Master Fund for Benefit Plan Investors (the “Topiary Master Fund”) by and between the Master Fund and the Topiary Master Fund, the Topiary Master Fund transferred to the Master Fund substantially all of the Topiary Master Fund’s assets and liabilities valued at approximately $89,739,000 in exchange for limited partnership interests in the Master Fund (such transaction referred to as the “Master Fund Reorganization”).
Effective October 1, 2007, according to the agreement and plan of reorganization (the “TEI Agreement”) and, together with the Master Fund Agreement, (the “Agreements”) by and between the Hatteras Multi-Strategy TEI Fund, L.P. (the “TEI Fund”) and, together with the Master Fund, (the “Hatteras Funds”) and Topiary Benefit Plan Investor Fund LLC (the “Topiary Feeder Fund”), the Topiary Feeder Fund transferred substantially all of its assets and liabilities to the TEI Fund in exchange for limited partnership interests in the TEI Fund, and distributed such limited partnership interests in the Master Fund to the members of the Topiary Feeder Fund in accordance with their respective interests (such transaction referred to as the “Feeder Fund Reorganization” and, together with the Master Fund Reorganization, the “Reorganizations”).
TWELVE
HATTERAS MASTER FUND, L.P. (A DELAWARE LIMITED PARTNERSHIP)
NOTES TO FINANCIAL STATEMENTS
March 31, 2009 (continued)
2. SIGNIFICANT ACCOUNTING POLICIES
The following is a summary of significant accounting and reporting policies used in preparing the financial statements.
a. Basis of Accounting
The Master Fund’s accounting and reporting policies conform with generally accepted accounting principles within the United States (“U.S. GAAP”).
b. Cash
Cash includes short-term interest bearing deposit accounts. At times, such deposits may be in excess of federally insured limits. The Master Fund has not experienced any losses in such accounts and does not believe it is exposed to any significant credit risk on such accounts.
c. Valuation of Investments
Investments held by the Master Fund include:
| | |
| • | Investments in Underlying Funds—The Master Fund will value interests in the Underlying Funds at fair value, which ordinarily will be the value determined by their respective investment managers, in accordance with procedures established by the Board. Investments in Underlying Funds are subject to the terms of the Underlying Funds’ offering documents. Valuations of the Underlying Funds may be subject to estimates and are net of management and performance incentive fees or allocations payable by the Underlying Funds’ as required by the Underlying Funds’ offering documents. If the Investment Manager determines that the most recent value reported by the Underlying Fund does not represent fair value or if the Underlying Fund fails to report a value to the Master Fund, a fair value determination is made under procedures established by and under the general supervision of the Board. Because of the inherent uncertainty in valuation, the estimated values may differ from the values that would have been used had a ready market for the securities existed, and the differences could be material. |
| | |
| | The interests of some Underlying Funds, primarily investments in private equity funds, may be valued less frequently than the calculation of the Master Fund’s net asset value. Therefore, the reported performance of the Underlying Fund may lag the reporting period of the Master Fund. In accordance with Accounting Principles Board (APB) Opinion No. 18, The Equity Method of Accounting for Investments in Common Stock, the Investment Manager has established procedures for reviewing the effect on the Master Fund’s net asset value due to this lag in reported performance of the Underlying Funds. |
| | |
| • | Investments in Exchange Traded Funds—Securities traded on one or more of the U.S. national securities exchanges or the OTC Bulletin Board will be valued at their last sales price. Securities traded on NASDAQ will be valued at the NASDAQ Official Closing Price (“NOCP”), at the close of trading on the exchanges or markets where such securities are traded for the business day as of which such value is being determined. |
THIRTEEN
HATTERAS MASTER FUND, L.P. (A DELAWARE LIMITED PARTNERSHIP)
NOTES TO FINANCIAL STATEMENTS
March 31, 2009 (continued)
2. SIGNIFICANT ACCOUNTING POLICIES (CONTINUED)
c. Valuation of Investments (continued)
In September 2006, the Financial Accounting Standards Board (“FASB”) issued Statement of Financial Accounting Standards No. 157 (“FAS 157”), Fair Value Measurements. FAS 157 establish the definition of fair values and provides for a new framework for measuring fair value. It also expands disclosure about the use of fair value to measure assets and liabilities. Also, in October 2008, the FASB issued FSP FAS 157-3, Determining the Fair Value of a Financial Asset When the Market for that Asset is Not Active (“FSP FAS 157-3”), which clarifies the application of FAS 157 in a market that is not active. Management has adopted FAS 157 for the Master Fund’s financial statements for the year ended March 31, 2009. The adoption of FAS 157 did not have an impact on the Master Fund’s capital.
As required by FAS 157, investments are classified in their entirety based on the lowest level of input that is significant to the fair value measurement. Estimated values may differ from the values that would have been used if a ready market existed or if the investments were liquidated at the valuation date. FAS 157 established a three-tier hierarchy to distinguish between (1) inputs that reflect the assumptions market participants would use in pricing an asset or liability developed based on market data obtained from sources independent of the reporting entity (observable inputs) and (2) inputs that reflect the reporting entity’s own assumptions about the assumptions market participants would use in pricing an asset or liability developed based on the best information available in the circumstances (unobservable inputs) and to establish classification of fair value measurements for disclosure purposes. Various inputs are used in determining the value of the Master Fund’s investments. The inputs are summarized in the three broad levels listed below:
Valuation of Investments
| | |
| • | Level 1—quoted prices (unadjusted) in active markets for identical investments |
| | |
| • | Level 2—other significant observable inputs (including quoted prices for similar investments, interest rates, pre-payment speeds, credit risk, etc.) |
| | |
| • | Level 3—significant unobservable inputs (including theMaster Fund’s own assumptions in determining the fair value of investments) |
The following is a summary of the inputs used as of March 31, 2009 in valuing the Master Fund’s investments carried at fair value:
| | | | | | | |
Valuation Inputs | | Investments | | Short-Term
Investments | |
|
|
|
|
|
|
|
|
Level 1—Quoted Prices | | $ | 16,313,624 | | $ | 68,703,875 | |
Level 2—Other Significant Observable Inputs | | | — | | | — | |
Level 3—Significant Unobservable Inputs | | | 1,074,675,464 | | | — | |
|
|
|
|
|
|
|
|
Total | | $ | 1,090,989,088 | | $ | 68,703,875 | |
|
|
|
|
|
|
|
|
FOURTEEN
HATTERAS MASTER FUND, L.P. (A DELAWARE LIMITED PARTNERSHIP)
NOTES TO FINANCIAL STATEMENTS
March 31, 2009 (continued)
2. SIGNIFICANT ACCOUNTING POLICIES (CONTINUED)
c. Valuation of Investments (continued)
The following is a reconciliation of investments in which significant unobservable inputs (Level 3) were used in determining fair value:
| | | | |
| | Investments | |
|
|
|
|
|
Balance as of April 1, 2008 | | $ | 1,086,374,717 | |
Net realized gain (loss) | | | (114,954,996 | ) |
Net change in unrealized appreciation/depreciation | | | (182,383,722 | ) |
Net purchases (sales) | | | 285,639,465 | |
Net transfers in or out of Level 3 | | | — | |
|
|
|
|
|
Balance as of March 31, 2009 | | $ | 1,074,675,464 | |
|
|
|
|
|
The realized gain (loss) and net change in unrealized appreciation/depreciation disclosed in the table above are included as a component of net realized loss from investments in Underlying Funds and net change in unrealized appreciation on investments in Underlying Funds, respectively, in the Statement of Operations. The amount of the net change in unrealized appreciation/depreciation for the year ended March 31, 2009 relating to investments in Level 3 assets still held at March 31, 2009 is $(191,422,843), which is included as a component of net change in unrealized appreciation on investments in Underlying Funds in the Statement of Operations.
d. Investment Income
Dividend income is recorded on the ex-dividend date, except that certain dividends from private equity investments are recorded as soon as the information is available to the Master Fund.
The Underlying Funds generally do not make regular cash distributions of income and gains and are therefore considered non-income producing securities. Disbursements, other than dividends, received from Underlying Funds are accounted for as a reduction to cost.
e. Fund Expenses
The Master Fund will bear all expenses incurred, on an accrual basis, in the business of the Master Fund, including, but not limited to, the following: all costs and expenses related to portfolio transactions and positions for the Master Fund’s account; legal fees; accounting, auditing, and tax preparation fees; custodial fees; fees for data and software providers; costs of insurance; registration expenses; directors’ fees; interest expenses and commitment fees on credit facilities; and expenses of meetings of the Board.
f. Income Taxes
The Master Fund is treated as a partnership for federal income tax purposes and therefore is not subject to U.S. federal income tax. For income tax purposes, the individual partners will be taxed upon their distributive share of each item of the Master Fund’s profit and loss.
FIFTEEN
HATTERAS MASTER FUND, L.P. (A DELAWARE LIMITED PARTNERSHIP)
NOTES TO FINANCIAL STATEMENTS
March 31, 2009 (continued)
2 SIGNIFICANT ACCOUNTING POLICIES (CONTINUED)
f. Income Taxes (continued)
The Master Fund has adopted the provisions of Financial Accounting Standards Board (“FASB”) Interpretation No. 48 (“FIN 48”), Accounting for Uncertainty in Income Taxes, an interpretation of FASB No. 109. For the year ended March 31, 2009, the Master Fund did not have a liability for any unrecognized tax benefits. The Master Fund recognizes interest and penalties, if any, related to unrecognized tax benefits as income tax expense in the Statement of Operations. During 2009, the Master Fund did not have a liability for any unrecognized tax benefits. The Master Fund recognizes interest and penalties, if any, related to unrecognized tax benefits as income tax expense in the Statement of Operations. During the period, the Master Fund did not incur any material interest or penalties. For the years ended December 31, 2005 through December 31, 2008 the Master Fund is open to examination by U.S. federal tax authorities and state tax authorities.
g. Use of Estimates
The preparation of financial statements in conformity with U.S. GAAP requires the Master Fund to make estimates and assumptions that affect the reported amounts of assets and liabilities and disclosure of contingent assets and liabilities at the date of the financial statements and the reported amounts of increases and decreases in Partners’ Capital from operations during the reporting period. Actual results could differ from those estimates.
h. Recently Issued Accounting Pronouncements
In March 2008, the FASB issued Statement of Financial Accounting Standards 161 (“FAS 161”), Disclosures about Derivative Instruments and Hedging Activities—an amendment of FASB Statement No. 133. FAS 161 requires additional discussion about the reporting entity’s derivative instruments and hedging activities, by providing for qualitative disclosures about the objectives and strategies for using derivatives, quantitative data about the fair value of and gains and losses on derivative contracts, and details of credit-risk-related contingent features in their hedged positions. FAS 161 is effective for financial statements issued for fiscal years beginning after November 15, 2008 and interim periods within those years. The General Partner is continuing to evaluate the impact, if any, that adoption of FAS 161 may have on the financial statements.
In April 2009, FASB Staff Position FAS 157-4, Determining Fair Value When the Volume and Level for the Asset or Liability Have Significantly Decreased and Identifying Transactions That Are Not Orderly (“FSP 157-4”), was issued and is effective for fiscal years and interim periods ending after June 15, 2009. FSP 157-4 provides additional guidance for estimating fair value in accordance with SFAS 157 when the volume and level of activity for the asset or liability have significantly decreased. FSP 157-4 also includes guidance on identifying circumstances that indicate a transaction is not orderly. The Master Fund is currently evaluating the impact the adoption of FSP 157-4 will have on the Master Fund’s financial statements and their disclosures.
SIXTEEN
HATTERAS MASTER FUND, L.P. (A DELAWARE LIMITED PARTNERSHIP)
NOTES TO FINANCIAL STATEMENTS
March 31, 2009 (continued)
3. ALLOCATION OF PARTNERS’ CAPITAL
Net profits or net losses of the Master Fund for each Allocation Period (as defined below) will be allocated among and credited to or debited against the capital accounts of the Limited Partners. Allocation Periods begin on the day after the last day of the preceding Allocation Period and end at the close of business on (1) the last day of each month, (2) the last day of each taxable year; (3) the day preceding each day on which interests are purchased, (4) the day on which interests are repurchased, or (5) the day on which any amount is credited to or debited from the capital account of any Limited Partner other than an amount to be credited to or debited from the capital accounts of all Limited Partners in accordance with their respective investment percentages.
4. REPURCHASE OF PARTNERS’ INTERESTS
The Board may, from time to time and in its sole discretion, cause the Master Fund to repurchase interests from Limited Partners pursuant to written tenders by Limited Partners at such times and on such terms and conditions as established by the Board. In determining whether the Master Fund should offer to repurchase interests, the Board will consider the recommendation of the Investment Manager. The Investment Manager generally recommends to the Board that the Master Fund offer to repurchase interests from Limited Partners, up to 5% of the net asset value of the Master Fund, on a quarterly basis as of the valuation date at the end of each calendar quarter. The Master Fund does not intend to distribute to the partners any of the Master Fund’s income, but generally expects to reinvest substantially all income and gains allocable to the partners.
5. MANAGEMENT FEES, PERFORMANCE ALLOCATION, AND RELATED PARTY TRANSACTIONS
The Investment Manager is responsible for providing day-to-day investment management services to the Master Fund, subject to the ultimate supervision of and subject to any policies established by the Board, pursuant to the terms of an investment management agreement with the Master Fund (the “Investment Management Agreement”). Under the Investment Management Agreement, the Investment Manager is responsible for developing, implementing and supervising the Master Fund’s investment program.
In consideration for such services, the Master Fund pays the Investment Manager a monthly management fee equal to 1/12th of 1.00% (1.00% on an annualized basis) of the aggregate value of its partners’ capital determined as of the last day of the month (before repurchase of interests).
Effective July 1, 2008, the General Partner receives an annual performance-based allocation (the “Performance Allocation”) with respect to the capital account of each Limited Partner. The Performance Allocation is generally calculated as of the end of each calendar year. The Performance Allocation with respect to a Limited Partner’s capital account is equal to 10% of the amount by which the excess, if any, of net profit over net loss allocated to such Limited Partner for the calendar year exceeds the greater of (a) any Loss Carryforward Amount (as defined below) or (b) the non-cumulative “hurdle amount” (an annualized return on the capital account balance of such Limited Partner as of the last day of the preceding calendar year at a rate equal to the yield to maturity of the 90-day United States Treasury Bill as reported by the Wall Street Journal on the last day of the preceding calendar year). If at the end of any Performance Allocation period, the net losses allocated to a Limited Partners’ capital account exceed the net profits so allocated, then a Loss Carryforward Amount shall be established for that Limited Partner. No Performance Allocation shall be deducted from the capital account of any Limited Partner unless the excess of net profits over net losses subsequently allocated exceeds any Loss Carryforward Amount for that Limited Partner. For the period from July 1, 2008 to March 31, 2009, there was no performance-based allocation.
SEVENTEEN
HATTERAS MASTER FUND, L.P. (A DELAWARE LIMITED PARTNERSHIP)
NOTES TO FINANCIAL STATEMENTS
March 31, 2009 (continued)
5. MANAGEMENT FEES, PERFORMANCE ALLOCATION, AND RELATED PARTY TRANSACTIONS(CONTINUED)
Hatteras Capital Distributors LLC, an affiliate of the Investment Manager, serves as the Master Fund’s registered distributor.
Each member of the Board who is not an “interested person” of the Master Fund (the “Independent Board”), as defined by the 1940 Act, receives an annual retainer of $30,000. All Board members are reimbursed by the Master Fund for all reasonable out-of-pocket expenses incurred by them in performing their duties.
6. ACCOUNTING, ADMINISTRATION, AND CUSTODIAL AGREEMENT
In consideration for accounting, administrative, and recordkeeping services, the Master Fund pays UMB Fund Services, Inc. (the “Administrator”) a monthly administration fee based on the month-end Net Asset Value of the Master Fund. The Administrator also provides regulatory administrative services, transfer agency functions, and shareholder services at an additional cost. For the year ended March 31, 2009, the total administration fee was $869,657.
UMB Bank, N.A. serves as custodian of the Master Fund’s assets and provides custodial services for the Master Fund.
7. INVESTMENT TRANSACTIONS
Total purchases of Underlying Funds for the year ended March 31, 2009 amounted to $592,965,490. Total proceeds from redemptions of Underlying Funds for the year ended March 31, 2009 amounted to $291,327,912. The cost of investments in Underlying Funds for U.S. federal income tax purposes is adjusted for items of taxable income allocated to the Master Fund from the Underlying Funds. The Master Fund relies upon actual and estimated tax information provided by the Underlying Funds as to the amounts of taxable income allocated to the Master Fund as of March 31, 2009.
The Master Fund invests substantially all of its available capital in securities of private investment companies. These investments will generally be restricted securities that are subject to substantial holding periods or are not traded in public markets at all, so that the Master Fund may not be able to resell some of its securities holdings for extended periods.
8. LINE OF CREDIT
The Master Fund maintains a $40,000,000 unsecured, uncommitted revolving credit facility (“Facility”), for the purpose of financing short timing differences between the redemption of investments or receipt of partnership capital and the withdrawal of partnership capital accounts, investing in Underlying Funds, or as general working capital. The Facility can be terminated on demand by the lender. The facility was reduced from $50,000,000 to its current maximum amount on February 1, 2009. The facility was increased from $30,000,000 to $50,000,000 on April 15, 2008. A fee of 65 basis points per annum is payable quarterly in arrears on the unused portion of the Facility. The interest rate charged on borrowings is, at the Borrower’s option, (a) the London Interbank Offer Rate plus a spread of 375 basis points, or (b) a Base Rate, as determined by the Lender, plus 200 basis points. Interest and fees incurred for the year ended March 31, 2009 are disclosed in the accompanying Statement of Operations. At March 31, 2009, the Master Fund had no borrowings, fees or interest payable outstanding under the Facility. The average interest rate, the average daily balance, and the maximum balance outstanding for borrowings under the Facility for the year ended March 31, 2009 was 4.79%, $1,847,458, and $35,000,000, respectively.
EIGHTEEN
HATTERAS MASTER FUND, L.P. (A DELAWARE LIMITED PARTNERSHIP)
NOTES TO FINANCIAL STATEMENTS
March 31, 2009 (continued)
9. INDEMNIFICATION
In the normal course of business, the Master Fund enters into contracts that provide general indemnifications. The Master Fund’s maximum exposure under these agreements is dependent on future claims that may be made against the Master Fund, and therefore cannot be established; however, based on experience, the risk of loss from such claims is considered remote.
10. COMMITMENTS
As of March 31, 2009, the Master Fund had outstanding investment commitments to Underlying Funds totaling approximately $368,940,000.
11. RISK FACTORS
An investment in the Master Fund involves significant risks, including leverage risk, liquidity risk, interest rate risk and economic conditions risk, that should be carefully considered prior to investing and should only be considered by persons financially able to maintain their investment and who can afford a loss of a substantial part or all of such investment. The Master Fund intends to invest substantially all of its available capital in securities of private investment companies. These investments will generally be restricted securities that are subject to substantial holding periods or are not traded in public markets at all, so that the Master Fund may not be able to resell some of its securities holdings for extended periods, which may be several years. Investments in the Underlying Funds may be restricted from early redemptions or subject to fees for early redemptions as part of contractual obligations agreed to by the Advisor on behalf of the Master Fund. Underlying Funds may have initial lock-up periods, the ability to suspend redemptions, or employ the use of side pockets, all of which may affect the Master Fund’s liquidity in the Underlying Fund.
Underlying Funds generally require the Advisor to provide advanced notice of its intent to redeem the Master Fund’s total or partial interest and may delay or deny a redemption request depending on the Underlying Funds’ governing agreements. Interests in the Master Fund provide limited liquidity since Partners will not be able to redeem interests on a daily basis because the Master Fund is a closed-end fund. Therefore investment in the Master Fund is suitable only for investors who can bear the risks associated with the limited liquidity of interests and should be viewed as a long-term investment. No guarantee or representation is made that the investment objective will be met.
The Master Fund or its Underlying Fund holdings may be a party to litigation matters and claims from time to time in the ordinary course of their operations. While the results of such litigation and claims cannot be predicted with certainty, management believes that the final outcome of such matters will not have a material adverse impact on the Master Fund’s financial statements.
NINETEEN
HATTERAS MASTER FUND, L.P. (A DELAWARE LIMITED PARTNERSHIP)
NOTESTO FINANCIAL STATEMENTS
March 31, 2009 (concluded)
12. FINANCIAL HIGHLIGHTS
The financial highlights are intended to help an investor understand the Master Fund’s financial performance for the past period. The total returns in the table represent the rate that a typical Limited Partner would be expected to have earned or lost on an investment in the Master Fund.
The ratios and total return amounts are calculated based on the Limited Partner group taken as a whole. An individual Limited Partner’s results may vary from those shown below due to the timing of capital transactions.
The ratios are calculated by dividing total dollars of net investment income or expenses, as applicable, by the average of total monthly limited partners’ capital. The ratios do not reflect the Master Fund’s proportionate share of income and expenses from Underlying Funds. The ratios are annualized for periods of less than a year.
Total return amounts are calculated by geometrically linking returns based on the change in value during each accounting period. The total return amounts have not been annualized for periods of less than a year.
| | | | | | | | | | | | | | | | |
| | For the year ended March 31, |
| |
|
| | | 2009 | | | 2008 | | | 2007 | | | 2006 | | | 2005 | |
|
|
|
|
|
|
|
|
|
|
|
|
|
|
|
|
|
Total return amortizing organizational expenses* | | | — | ** | | — | ** | | — | ** | | — | ** | | 0.23 | % |
Total return | | | –20.45 | % | | 3.74 | % | | 9.31 | % | | 13.79 | % | | 0.17 | % |
Partners’ capital, end of period (000’s) | | $ | 1,149,124 | | $ | 1,050,585 | | $ | 432,120 | | $ | 213,521 | | $ | 116,827 | |
Portfolio turnover | | | 22.57 | % | | 9.54 | % | | 14.03 | % | | 19.35 | % | | 3.72 | % |
Annualized ratios: | | | | | | | | | | | | | | | | |
Net investment loss | | | –0.90 | % | | –0.72 | % | | –0.96 | % | | –1.23 | % | | –1.43 | % |
Total operating expenses | | | 1.25 | % | | 1.32 | % | | 1.39 | % | | 1.52 | % | | 1.50 | % |
| |
* | Return is indicative of amortizing organizational expenses over 60 months for tax purposes. |
| |
** | Organizational costs were fully expensed as of March 31, 2005. |
13. SUBSEQUENT EVENTS
Effective April 1, 2009 and May 1, 2009, there were additional capital contributions of $18,769,390 and $17,460,552 respectively. In addition, since April 1, 2009, the Board accepted tender requests which will be effective as of June 30, 2009 totaling approximately $68,000,000.
TWENTY
HATTERAS MASTER FUND, L.P. (A DELAWARE LIMITED PARTNERSHIP)
BOARD OF DIRECTORS
(unaudited)
The identity of the Board Members and brief biographical information is set forth below.
| | | | | | | | | |
Name, Address & Age | | Position(s)
Held with
the Fund | | Length of
Time Served | | Principal Occupation(s) During
Past 5 Years and Other
Directorships Held by Director | | Number of Portfolios in
Fund Complex’ Overseen
by Director or Officer | |
|
|
|
|
|
|
|
|
|
|
INTERESTED DIRECTORS | | | |
|
|
|
|
|
|
|
|
|
|
David B. Perkins*, 46
8540 Colonnade
Center Drive, Suite 401
Raleigh, NC 27615 | | President and Chairman of the Board of Directors of each fund in the Fund Complex | | Since Inception | | Mr. Perkins has been Chairman and President of each fund in the Fund Complex since inception. Mr. Perkins became the President and Managing Principal of the Investment Manager in September 2003 and became the Co-founder and Managing Partner of CapFinancial Partners, LLC in April 2003. Prior to that, he was Managing Partner at Wachovia Securities Financial Network, Inc. from June 2002 to September 2003 and Managing Principal of CapTrust Financial Advisors, LLC from October 1997 to June 2002. | | 5 | |
|
|
|
|
|
|
|
|
|
|
INDEPENDENT DIRECTORS | | | | |
|
|
|
|
|
|
|
|
|
|
Steve E. Moss, 53
918 Meadow Lane
Henderson, NC 27536 | | Director; Audit Committee Member of each fund in the Fund Complex | | Since December 2004 | | Mr. Moss is a principal of Holden, Moss, Knott, Clark, Copley & Hoyle, P.A. and has been a member manager of HMKCT Properties, LLC since January 1996. Mr. Moss has been a Director and Member of the Audit Committee of each fund in the Fund Complex since December 2004. | | 5 | |
TWENTY-ONE
HATTERAS MASTER FUND, L.P. (A DELAWARE LIMITED PARTNERSHIP)
BOARD OF DIRECTORS
(unaudited) (continued)
| | | | | | | | | |
Name, Address & Age | | Position(s)
Held with
the Fund | | Length of
Time Served | | Principal Occupation(s) During
Past 5 Years and Other
Directorships Held by Director | | Number of Portfolios in
Fund Complex’ Overseen
by Director or Officer | |
|
|
|
|
|
|
|
|
|
|
INDEPENDENT DIRECTORS (continued) | | | | |
|
|
|
|
|
|
|
|
|
|
H. Alexander Holmes, 66
3408 Landor Road
Raleigh, NC 27609 | | Director; Audit Committee Member of each fund in the Fund Complex | | Since December 2004 | | Mr. Holmes founded Holmes Advisory Services, LLC, a financial consultation firm, in 1993. Mr. Holmes has been a Director and Member of the Audit Committee of the Fund since December 2004. | | 5 | |
|
|
|
|
|
|
|
|
|
|
Gregory S. Sellers, 47
2643 Steeplechase Road
Gastonia, NC 28056 | | Director; Audit Committee Member of each fund in the Fund Complex | | Since December 2004 | | Mr. Sellers became the Chief Financial Officer and a director of Kings Plush, Inc., a fabric manufacturer, in April 2003. Prior to that, he was the Vice President of Finance at Parksdale Mills, Inc., a cotton and cotton blend yarns producer, from January 1991 to April 2003. Mr. Sellers has been a Director and Member of the Audit Committee of each fund in the Fund Complex since December 2004. | | 5 | |
|
|
|
|
|
|
|
|
|
|
Art Lottes, 56**
4813 Wynneford Way
Raleigh, NC 27615 | | Director; Audit Committee Member of each fund in the Fund Complex | | Since November 2007 | | Mr. Lottes was the President of CARQUEST Corporation, an automotive aftermarket company until December 2005. Mr. Lottes was a Board member of CARQUEST and General Parts until December 2005. | | 5 | |
|
|
|
|
|
|
|
|
|
|
| |
* | Mr. Perkins is deemed to be an Interested Director of the Fund because of his affiliations with the Investment Manager. |
| |
** | Mr. Lottes resigned from the Board effective April 30, 2009. |
TWENTY-TWO
HATTERAS MASTER FUND, L.P. (A DELAWARE LIMITED PARTNERSHIP)
FUND MANAGEMENT
(unaudited)
Set forth below is the name, age, position with the Master Fund, length of term of office, and the principal occupation for the last five years of each of the persons currently serving as Executive Officers of the Master Fund. Unless otherwise noted, the business address of each officer is 8540 Colonnade Center Drive, Suite 401, Raleigh, NC 27615.
| | | | | | | | | |
Name, Address & Age | | Position(s)
Held with
the Fund | | Length of
Time Served | | Principal Occupation(s) During
Past 5 Years and Other
Directorships Held by Director | | Number of Portfolios in
Fund Complex’ Overseen
by Director or Officer | |
|
|
|
|
|
|
|
|
|
|
OFFICERS | | | | | | | | | |
|
|
|
|
|
|
|
|
|
|
J. Michael Fields, 35
8540 Colonnade
Center Drive,
Suite 401
Raleigh, NC 27615 | | Secretary of each fund in the Fund Complex | | Since Inception | | Mr. Fields was previously Treasurer of the Funds from inception until December 2008. Mr. Fields became a Director of the Investment Manager in September 2003. Prior to joining the Investment Manager, Mr. Fields was employed by CapTrust Financial Advisors from August 2002 to September 2003. Prior to joining CapTrust, Mr. Fields was employed by Morgan Stanley in Atlanta, Georgia from January 2000 to August 2002. | | N/A | |
|
|
|
|
|
|
|
|
|
|
Andrew P. Chica, 33
8540 Colonnade
Center Drive,
Suite 401
Raleigh, NC 27615 | | Chief Compliance Officer of each fund in the Fund Complex | | Since 2008 | | Mr. Chica joined Hatteras in November 2007 and became Chief Compliance Officer of each of the funds in the Fund Complex and the Investment Manager as of January 2008. Prior to joining Hatteras, Mr. Chica was the Compliance Manager for UMB Fund Services, Inc. from December 2004 to November 2007. From April 2000 to December 2004, Mr. Chica served as an Assistant Vice President and Compliance Officer with U.S. Bancorp Fund Services, LLC. | | N/A | |
TWENTY-THREE
HATTERAS MASTER FUND, L.P. (A DELAWARE LIMITED PARTNERSHIP)
FUNDMANAGEMENT
(unaudited) (continued)
| | | | | | | | | |
Name, Address & Age | | Position(s)
Held with
the Fund | | Length of
Time Served | | Principal Occupation(s) During
Past 5 Years and Other
Directorships Held by Director | | Number of Portfolios in
Fund Complex’ Overseen
by Director or Officer | |
|
|
|
|
|
|
|
|
|
|
OFFICERS (continued) | | | | | | | | | |
|
|
|
|
|
|
|
|
|
|
Robert L. Baker, 37
8540 Colonnade
Center Drive,
Suite 401
Raleigh, NC 27615 | | Treasurer of each fund in the Fund Complex | | Since 2008 | | Mr. Baker joined Hatteras in March 2008 and became Treasurer of each of the funds in the Fund Complex in December 2008. Mr. Baker serves as the Chief Financial Officer of the Investment Manager. Prior to joining Hatteras, Mr. Baker worked for Smith Breeden Associates, an investment advisor located in Durham, NC. At Smith Breeden, Mr. Baker served as Vice President of Portfolio Accounting, Performance Reporting, and Fund Administration. Prior to working for Smith Breeden, Mr. Baker worked for BDO Seidman, LLP in Greensboro, NC. | | N/A | |
|
|
|
|
|
|
|
|
|
|
TWENTY-FOUR
HATTERAS MASTER FUND, L.P. (A DELAWARE LIMITED PARTNERSHIP)
OTHER INFORMATION
(unaudited)
ANNUAL RENEWALOF INVESTMENT MANAGEMENT AGREEMENT
At a meeting of the Board of the Master Fund held on February 24, 2009, by a unanimous vote, the Board of the Master Fund, including a majority of the Directors who are not “interested persons” within the meaning of Section 2(a)(19) of the 1940 Act, approved the continuation of the Investment Management Agreement (the “Agreement”).
In advance of the meeting, the Independent Directors requested and received extensive materials from the Investment Manager to assist them in considering the renewal of the Agreement. The materials provided by the Investment Manager contained information including detailed comparative information relating to the performance, advisory fees and other expenses of the Master Fund and the Limited Partners of the Master Fund managed by the Investment Manager (collectively, the “Funds”). The materials also included comparisons of the performance of each of the Master Fund’s investment sectors versus a relevant benchmark.
The Board engaged in a detailed discussion of the materials with management of the Investment Manager. The Independent Directors then met separately with independent counsel to the Independent Directors for a full review of the materials. Following this session, the full Board reconvened and after further discussion determined that the information presented provided a sufficient basis upon which to approve the continuation of the Agreement.
Discussion of Factors Considered
| | |
(a) | The nature and quality of the advisory services to be rendered, including: |
| | |
| (i) | an analysis of the performance of the Master Fund relative to its stated objectives; whether the adviser been successful in reaching its goals; |
| | |
| (ii) | a study of the Master Fund’s performance compared to relevant market indices and to similar funds (i.e., similar investment objectives and same approximate size), evaluating both the long-term and short-term performance record of the Master Fund; and |
| | |
| (iii) | a consideration of the quality of any other services provided for or to the Master Fund in addition to the provision of investment advice. |
| | |
(b) | The experience and qualifications of the personnel providing such services, including: |
| | |
| (i) | familiarity with the number, background and general qualifications of the personnel in the adviser’s investment management group; |
| | |
| (ii) | allocation of responsibility for the Master Fund; percentage of time devoted to the Master Fund; and |
| | |
| (iii) | the process by which investment decisions are made by the adviser’s personnel; criteria for securities selection and the controls used by the adviser to ensure that the criteria are met. |
TWENTY-FIVE
HATTERAS MASTER FUND, L.P. (A DELAWARE LIMITED PARTNERSHIP)
OTHER INFORMATION
(unaudited) (continued)
ANNUAL RENEWALOF INVESTMENT MANAGEMENT AGREEMENT(CONTINUED)
Discussion of Factors Considered (continued)
| | |
(c) | The fee structures, the existence of any fee waivers, and the Master Fund’s expense ratios in relation to those of other investment companies having comparable investment policies and limitations, including: |
| |
| (i) | consideration of whether the fee schedule, including any “breakpoints,” reflects economies of scale of managing a larger fund; and |
| | |
| (ii) | comparisons of expense ratios which reflect relative costs to the Master Fund of the relationships of the Master Fund with its adviser; consideration of whether a low expense ratio is attributable to non-advisory expenses; a review of comparative information setting forth a percentage breakdown of advisory and non-advisory expenses related to net assets; consideration of whether the expense ratio resulted from reimbursing or reducing fees to maintain a certain limitation. |
| | |
(d) | The fees charged by the adviser and other investment advisers to similar clients (minimal weight accorded this factor), including: |
| |
| (i) | consideration of the type and quality of services provided by, and the client-related expenses borne by, the adviser. |
| | |
(e) | The direct and indirect costs which may be incurred by the adviser and its affiliates in performing services for the Master Fund and the basis of determining and allocating these costs, including: |
| |
| (i) | consideration of, among other things, the extent to which management personnel and office space for Master Fund operations are provided, as well as investment advice, the extent to which other client advisory fees support the same personnel and office facilities. |
| | |
(f) | Possible economies of scale arising from the Master Fund’s size and/or anticipated growth, including: |
| |
| (i) | investigation of the extent to which economies of scale exist and whether such economies are reflected appropriately in the advisory fees as the Master Fund grows larger; and |
| | |
| (ii) | consideration of the total of all assets managed by the adviser, as well as the total number of investment companies and other clients serviced by the adviser. |
| | |
(g) | Other possible benefits to the adviser and its affiliates arising from its relationship with the Master Fund, including: |
| | |
| (i) | consideration of the adviser’s expenses and profits from the Master Fund, as compared to the expenses and profits derived from the adviser’s other clients, in determining the fairness of the advisory contract, i.e., whether the Master Fund is charged higher fees than other clients of the adviser for similar services; and |
| | |
| (ii) | consideration of collateral benefits to the adviser of compensation received by the adviser and its affiliates. |
| | |
(h) | Possible alternative fee structures or bases for determining fees, including: |
| | |
| (i) | consideration of alternatives—flat percentage of net assets; or breakpoints in the advisory fee schedule reflecting economies of scale. |
TWENTY-SIX
HATTERAS MASTER FUND, L.P. (A DELAWARE LIMITED PARTNERSHIP)
OTHER INFORMATION
(unaudited) (continued)
Conclusion
After receiving full disclosure of relevant information of the type described above, The Board of Directors of the Master Fund concluded that the compensation and other terms of the investment advisory agreement is in the best interests of the Master Fund’s partners.
Proxy Voting
A description of the policies and procedures that the Master Fund uses to determine how to vote proxies relating to portfolio securities and shareholders record of actual proxy votes cast is available at www.sec.gov and may be obtained at no additional charge.
Availability of Quarterly Portfolio Schedules
The Fund files its complete schedule of portfolio holdings with the SEC for the first and third quarters of each fiscal year on Form N-Q. The Fund’s Form N-Q is available, without charge and upon request, on the SEC’s website at http://www.sec.gov or may be reviewed and copied at the SEC’s Public Reference Room in Washington, DC. Information on the Public Reference Room may be obtained by calling 1-800-SEC-0330.
TWENTY-SEVEN
THIS PAGE INTENTIONALLY LEFT BLANK.
|
HATTERAS MULTI-STRATEGY FUNDS 8540 Colonnade Center Drive
Suite 401
Raleigh, NC 27615
INVESTMENT ADVISOR AND FUND SERVICING AGENT Hatteras Investment Partners, LLC
8540 Colonnade Center Drive
Suite 401
Raleigh, NC 27615
INDEPENDENT REGISTERED PUBLIC ACCOUNTING FIRM Deloitte & Touche LLP
1700 Market Street, 25th Floor
Philadelphia, PA 19103
FUND COUNSEL Drinker Biddle & Reath LLP
One Logan Square
18th & Cherry Streets
Philadelphia, PA 19103-6996
ADMINISTRATOR AND FUND ACCOUNTANT UMB Fund Services, Inc.
1400 North Providence Road, Suite 200
Media, PA 19063-2043
CUSTODIAN UMB Bank, N.A.
1010 Grand Boulevard
Kansas City, MO 64106
DISTRIBUTOR Hatteras Capital Distributors, LLC
8540 Colonnade Center Drive
Suite 401
Raleigh, NC 27615
|
| | | | |

| | | | |
| 8540 Colonnade Center Drive, Suite 401 | Tel 866.388.6292 | www.hatterasfunds.com |
| Raleigh, NC 27615 | Fax 919.846.3433 | |
| | | | |
ITEM 2. CODE OF ETHICS.
(a) The registrant, as of the end of the period covered by this report, has adopted a code of ethics that applies to the registrant's principal executive officer, principal financial officer, principal accounting officer or controller, or persons performing similar functions, regardless of whether these individuals are employed by the registrant or a third party.
(c) There have been no amendments, during the period covered by this report, to a provision of the code of ethics that applies to the registrant's principal executive officer, principal financial officer, principal accounting officer or controller, or persons performing similar functions, regardless of whether these individuals are employed by the registrant or a third party, and that relates to any element of the code of ethics description.
(d) The registrant has not granted any waivers, during the period covered by this report, including an implicit waiver, from a provision of the code of ethics that applies to the registrant's principal executive officer, principal financial officer, principal accounting officer or controller, or persons performing similar functions, regardless of whether these individuals are employed by the registrant or a third party, that relates to one or more of the items set forth in paragraph (b) of this item's instructions.
ITEM 3. AUDIT COMMITTEE FINANCIAL EXPERT.
As of the end of the period covered by the report, the registrant's board of directors has determined that Messrs. Steve E. Moss, H. Alexander Holmes and Gregory S. Sellers are each qualified to serve as audit committee financial experts serving on its audit committee and that each is "independent," as defined by Item 3 of Form N-CSR.
ITEM 4. PRINCIPAL ACCOUNTANT FEES AND SERVICES.
Audit Fees
(a) The aggregate fees billed for each of the last two fiscal years for professional services rendered by the principal accountant for the audit of the registrant's annual financial statements or services that are normally provided by the accountant in connection with statutory and regulatory filings or engagements for those fiscal years are $77,000 for 2008 and $126,500 for 2009.
Audit-Related Fees
(b) The aggregate fees billed in each of the last two fiscal years for assurance and related services by the principal accountant that are reasonably related to the performance of the audit of the registrant's financial statements and are not reported under paragraph (a) of this Item are $500 for 2008 and $0 for 2009. The fees listed in item 4 (b) are related to out-of-pocket expenses in relation to the annual audit of the registrant.
Tax Fees
(c) The aggregate fees billed in each of the last two fiscal years for professional services rendered by the principal accountant for tax compliance, tax advice, and tax planning are $0 for 2008 and $0 for 2009.
All Other Fees
(d) The aggregate fees billed in each of the last two fiscal years for products and services provided by the principal accountant, other than the services reported in paragraphs (a) through (c) of this Item are $12,095 for 2008 and $3000 for 2009.
(e)(1) Disclose the audit committee's pre-approval policies and procedures described in paragraph (c)(7) of Rule 2-01 of Regulation S-X.
The Registrant's Audit Committee must pre-approve the audit and non-audit services of the Auditors prior to the Auditor's engagement.
(e)(2) The percentage of services described in each of paragraphs (b) through (d) of this Item that were approved by the audit committee pursuant to paragraph (c)(7)(i)(C) of Rule 2-01 of Regulation S-X are as follows:
(f) The percentage of hours expended on the principal accountant's engagement to audit the registrant's financial statements for the most recent fiscal year that were attributed to work performed by persons other than the principal accountant's full-time, permanent employees was less than fifty percent.
(g) The aggregate non-audit fees billed by the registrant's accountant for services rendered to the registrant, and rendered to the registrant's investment adviser (not including any sub-adviser whose role is primarily portfolio management and is subcontracted with or overseen by another investment adviser), and any entity controlling, controlled by, or under common control with the adviser that provides ongoing services to the registrant for each of the last two fiscal years of the registrant was $0.
(h) The registrant's audit committee of the board of directors has considered whether the provision of non-audit services that were rendered to the registrant's investment adviser (not including any sub-adviser whose role is primarily portfolio management and is subcontracted with or overseen by another investment adviser), and any entity controlling, controlled by, or under common control with the investment adviser that provides ongoing services to the registrant that were not pre-approved pursuant to paragraph (c)(7)(ii) of Rule 2-01 of Regulation S-X is compatible with maintaining the principal accountant's independence.
ITEM 5. AUDIT COMMITTEE OF LISTED REGISTRANTS.
Not applicable.
ITEM 6. SCHEDULE OF INVESTMENTS.
Schedule of Investments in securities of unaffiliated issuers as of the close of the reporting period is included as part of the report to shareholders filed under Item 1 of this form.
ITEM 7. DISCLOSURE OF PROXY VOTING POLICIES AND PROCEDURES FOR CLOSED-END MANAGEMENT INVESTMENT COMPANIES.
The Proxy Voting Policies are attached herewith.
HATTERAS INVESTMENT PARTNERS LLC
HATTERAS MASTER FUND, L.P.
HATTERAS MULTI-STRATEGY FUND, L.P.
HATTERAS MULTI-STRATEGY TEI FUND, L.P.
HATTERAS MULTI-STRATEGY INSTITUTIONAL FUND, L.P.
HATTERAS MULTI-STRATEGY TEI INSTITUTIONAL FUND, L.P.
PROXY VOTING POLICY
This statement sets forth the policy of Hatteras Investment Partners, LLC ("Hatteras") with respect to the exercise of corporate actions and proxy voting authority of client accounts.
The Funds and other advisory clients of Hatteras invest, directly or indirectly, substantially all of their assets in securities of pooled investment vehicles or separate accounts, which are private partnerships, limited liability companies or similar entities managed by third-party investment managers (collectively, "Advisor Funds"). These securities do not typically convey traditional voting rights to the holder and the occurrence of corporate governance or other notices for this type of investment is substantially less than that encountered in connection with registered equity securities. To the extent that we or our clients receive notices or proxies from Advisor Funds (or receive proxy statements or similar notices in connection with any other portfolio securities), Hatteras has proxy voting responsibilities.
With respect to proxies issued by Hatteras Master Fund, L.P. (the "Master Fund"), the feeder funds which invest in the Master Fund have delegated proxy voting authority to Hatteras. Hatteras will vote proxies in a manner that it deems to be in the best interests of the Funds. In general, the Investment Manager believes that voting proxies in accordance with the policies described below will be in the best interests of its clients. If an analyst, trader or partner of the Hatteras believes that voting in accordance with stated proxy-voting guidelines would not be in the best interests of a client, the proxy will be referred to Hatteras' Chief Compliance Officer for a determination of how such proxy should be voted.
Hatteras will generally vote to support management recommendations relating to routine matters such as the election of directors (where no corporate governance issues are implicated), the selection of independent auditors, an increase in or reclassification of common stock, the addition or amendment of indemnification provisions in the company's charter or by-laws, changes in the board of directors and compensation of outside directors. Hatteras will generally vote in favor of management or shareholder proposals that Hatteras believes will maintain or strengthen the shared interests of shareholders and management, increase shareholder value, maintain or increase shareholder influence over the company's board of directors and management and maintain or increase the rights of shareholders.
On non-routine matters, Hatteras will generally vote in favor of management proposals for mergers or reorganizations, reincorporation plans, fair-price proposals and shareholder rights plans so long as such proposals are in the best economic interests of Hatteras' clients.
If a proxy includes a matter to which none of the specific policies described above or in Hatteras' stated proxy-voting guidelines is applicable or a matter involving an actual or potential conflict of interest as described below, the proxy will be referred to Hatteras' Chief Compliance Officer for a determination of how such proxy should be voted.
In exercising its voting discretion, Hatteras and its employees will seek to avoid any direct or indirect conflict of interest presented by the voting decision. If any substantive aspect or foreseeable result of the matter to be voted on by Hatteras Master Fund, L.P., Hatteras Multi-Strategy Fund, L.P., Hatteras Multi-Strategy TEI Fund, L.P., Hatteras Multi-Strategy Institutional Fund, L.P. or Hatteras Multi-Strategy TEI Institutional Fund, L.P. (the "Registered Funds") presents an actual or potential conflict of interest involving Hatteras (or an affiliate of Hatteras), any issuer of a security for which Hatteras (or an affiliate of Hatteras) acts as sponsor, advisor, manager, custodian, distributor, underwriter, broker or other similar capacity or any person with whom Hatteras (or an affiliate of Hatteras) has an existing material contract or business relationship not entered into in the ordinary course of business (Hatteras and such other persons having an interest in the matter being called "Interested Persons"), Hatteras will make written disclosure of the conflict to the Independent Directors of the applicable Fund(s) indicating how Hatteras proposes to vote on the matter and its reasons for doing so. If the Investment Manager does not receive timely written instructions as to voting or non-voting on the matter from the applicable Registered Fund's Independent Directors, Hatteras may take any of the following actions which it deems to be in the best interests of the Fund: (1) engage an independent third party to determine whether and how the proxy should be voted and vote or refrain from voting on the matter as determined by the third party; (2) vote on the matter in the manner proposed to the Independent Directors if the vote is against the interests of all Interested Persons; or (3) refrain from voting on the matter.
The Registered Fund each are required to file Form N-PX, with its complete proxy voting record for the twelve months ended June 30, no later than August 31 of each year. Each of the Registered Fund's Form N-PX filing is available: (1) without charge, upon request, by calling (800) 504-9070; or (2) by visiting the SEC's website at www.sec.gov.
ITEM 8. PORTFOLIO MANAGERS OF CLOSED-END MANAGEMENT INVESTMENT COMPANIES.
(a)(1) Identification of Portfolio Manager(s) or Management Team Members and Description of Role of Portfolio Manager(s) or Management Team Members
The following table provides biographical information about the members of the Investment Committee of Hatteras Investment Partners LLC (the "Investment Manager"), who are primarily responsible for the day-to-day portfolio management of the Master Fund as of March 31, 2009:
Name of Investment Committee Member | Title | Length of Time of Service to the Fund | Business Experience During the Past 5 Years | Role of Investment Committee Member |
| | | | |
Mark W. Yusko | Principal and co-founder of the Investment Manager | Since January 2004 (inception) | Mr. Yusko became a Principal and co-founder of the Investment Manager in September 2003 and President and Chief Executive Officer of Morgan Creek Capital Management, LLC in July, 2004. Previously, Mr. Yusko served as President and Chief Executive Officer for UNC Management Co., LLC from January 1998 through July 2004, where he was responsible for all areas of investment management for the UNC Endowment and Affiliated Foundation Funds. | Asset allocation; underlying manager selection; and portfolio construction |
| | | | |
David B. Perkins | President and Managing Principal of the Investment Manager | Since January 2004 (inception) | Mr. Perkins became the President and Managing Principal of the Investment Manager in September 2003 and co-founder and Managing Partner of CapFinancial Partners, LLC in April 2003. Previously, Mr. Perkins was Managing Partner at Wachovia Securities Financial Network, Inc. from June 2002 to September 2003 and was Managing Principal of CapTrust Financial Advisors, LLC from October 1997 to June 2002. | Systems analyst; and strategic recommendations and portfolio oversight |
| | | | |
Joshua E. Parrott | Director of Risk Management of the Investment Manager | Since March 2004 | Mr. Parrott joined the Investment Manager as an Analyst in March 2004 and became the Director of Risk Management in January 2005. Previously, Mr. Parrott was employed as an Analyst by Dialectic Capital Management in 2003 and as a Financial Advisor at Morgan Stanley from February 1999 to March 2003. | Risk management; underlying manager due diligence; operational due diligence; and performance analysis |
(a)(2) Other Accounts Managed by Portfolio Manager(s) or Management Team Member and Potential Conflicts of Interest
The following table provides information about portfolios and accounts, other than the Master Fund, for which the members of the Investment Committee of the Investment Manager are primarily responsible for the day-to-day portfolio management as of March 31, 2009:
Name of Investment Committee Member | Type of Accounts | Total Number of Accounts Managed | Total Assets | Number of Accounts Managed for Which Advisory Fee is Based on Performance | Total Assets for Which Advisory Fee is Based on Performance |
| | | | | |
Mark W. Yusko | Registered Investment Companies | 8 | $5,000,000,000 | 0 | $0 |
| Other Pooled Investment Vehicles | 16 | $2,400,000,000 | 16 | $2,400,000,000 |
| Other Accounts | 20 | $1,500,000,000 | 20 | $1,500,000,000 |
| | | | | |
David B. Perkins | Registered Investment Companies | 0 | $0 | 0 | $0 |
| Other Pooled Investment Vehicles | 1 | $28,500,000 | 0 | $0 |
| Other Accounts | 0 | $0 | 0 | $0 |
| | | | | |
Joshua E. Parrott | Registered Investment Companies | 0 | $0 | 0 | $0 |
| Other Pooled Investment Vehicles | 0 | $0 | 0 | $0 |
| Other Accounts | 0 | $0 | 0 | $0 |
| Potential Conflicts of Interests |
Mr. Yusko is responsible for managing other accounts, including proprietary accounts, separate accounts and other pooled investment vehicles, including unregistered hedge funds and funds of hedge funds. Mr. Perkins is responsible for managing another investment vehicle. Mr. Yusko may manage separate accounts and Messrs. Yusko and Perkins may manage other pooled investment vehicles which may have materially higher, lower or different fee arrangements than the registrant and may also be subject to performance-based fees. The side-by-side management of these separate accounts and/or pooled investment vehicles may raise potential conflicts of interest relating to cross trading and the allocation of investment opportunities. The Investment Manager has a fiduciary responsibility to manage all client accounts in a fair and equitable manner. It seeks to provide best execution of all securities transactions and to allocate investments to client accounts in a fair and timely manner. To this end, the Investment Manager has developed policies and procedures designed to mitigate and manage the potential conflicts of interest that may arise from side-by-side management.
Mr. Parrott does not manage any other accounts and therefore no material conflicts of interest arise out of his management of the registrant.
(a)(3) Compensation Structure of Portfolio Manager(s) or Management Team Members
The compensation of the members of the Investment Committee of the Investment Manager includes a combination of the following: (i) fixed annual salary; (ii) a variable portion of the management fee paid by the Master Fund to the Investment Manager; and (iii) a variable portion of any incentive compensation paid by the registrant, or any other feeder fund, to the Investment Manager or its affiliates. The portions of the management fee and incentive fee paid to a member of the Investment Committee are based on the pre-tax performance of the registrant as compared to a benchmark. The Investment Manager uses the yield-to-maturity of the 90 day U.S. Treasury Bill as reported by the Wall Street Journal for the last business day of the preceding calendar year as a benchmark for the registrant 's pre-tax performance when determining the variable components of the compensation of members of the Investment Committee.
(a)(4) Disclosure of Securities Ownership |
The following table sets forth the dollar range of equity securities beneficially owned by each member of the Investment Committee of the Investment Manager indirectly in the Master Fund as of March 31, 2009:
Investment Committee Member | Dollar Range of Fund Shares Beneficially Owned |
| |
Mark W. Yusko | $100,001 to $500,000 |
David B. Perkins | Over $1,000,000 |
Joshua E. Parrott | $10,001 to $50,000 |
ITEM 9. PURCHASES OF EQUITY SECURITIES BY CLOSED-END MANAGEMENT INVESTMENT COMPANY AND AFFILIATED PURCHASERS.
Not applicable.
ITEM 10. SUBMISSION OF MATTERS TO A VOTE OF SECURITY HOLDERS.
There have been no material changes to the procedures by which the shareholders may recommend nominees to the registrant's board of directors, where those changes were implemented after the registrant last provided disclosure in response to the requirements of Item 407(c)(2)(iv) of Regulation S-K (17CFR 229.407), or this Item.
ITEM 11. CONTROLS AND PROCEDURES.
(a) The registrant's principal executive and principal financial officers, or persons performing similar functions, have concluded that the registrant's disclosure controls and procedures (as defined in Rule 30a-3(c) under the Investment Company Act of 1940, as amended (the "1940 Act") (17 CFR 270.30a-3(c))) are effective, as of a date within 90 days of the filing date of the report that includes the disclosure required by this paragraph, based on their evaluation of these controls and procedures required by Rule 30a-3(b) under the 1940 Act (17 CFR 270.30a-3(b)) and Rules 13a-15(b) or 15d-15(b) under the Securities Exchange Act of 1934, as amended (17 CFR 240.13a-15(b) or 240.15d-15(b)).
(b) There were no changes in the registrant's internal control over financial reporting (as defined in Rule 30a-3(d) under the 1940 Act (17 CFR 270.30a-3(d)) that occurred during the registrant's second fiscal quarter of the period covered by this report that has materially affected, or is reasonably likely to materially affect, the registrant's internal control over financial reporting.
ITEM 12. EXHIBITS.
(a)(1) Code of ethics, or any amendment thereto, that is the subject of disclosure required by Item 2 is attached hereto.
(a)(2) Certifications pursuant to Rule 30a-2(a) under the 1940 Act and Section 302 of the Sarbanes-Oxley Act of 2002 are attached hereto.
(a)(3) Not applicable.
(b) Not applicable.
SIGNATURES
Pursuant to the requirements of the Securities Exchange Act of 1934 and the Investment Company Act of 1940, the registrant has duly caused this report to be signed on its behalf by the undersigned, thereunto duly authorized.
(registrant) | Hatteras Master Fund, L.P. |
| |
By (Signature and Title)* | /s/ David B. Perkins |
| David B. Perkins, President & |
| Chief Executive Officer |
| (principal executive officer) |
| |
Date | June 8, 2009 |
Pursuant to the requirements of the Securities Exchange Act of 1934 and the Investment Company Act of 1940, this report has been signed below by the following persons on behalf of the registrant and in the capacities and on the dates indicated.
By (Signature and Title)* | /s/ David B. Perkins |
| David B. Perkins, President & |
| Chief Executive Officer |
| (principal executive officer) |
| |
Date | June 8, 2009 |
| |
By (Signature and Title)* | /s/ R. Lance Baker |
| R. Lance Baker, Chief Financial Officer |
| (principal financial officer) |
| |
Date | June 8, 2009 |
* Print the name and title of each signing officer under his or her signature.