UNITED STATES
SECURITIES AND EXCHANGE COMMISSION
WASHINGTON, D.C. 20549
FORM N-CSR
CERTIFIED SHAREHOLDER REPORT OF REGISTERED MANAGEMENT INVESTMENT COMPANIES
Investment Company Act file number 811-21686
Oppenheimer Portfolio Series
(Exact name of registrant as specified in charter)
6803 South Tucson Way, Centennial, Colorado 80112-3924
(Address of principal executive offices) (Zip code)
Robert G. Zack, Esq.
OppenheimerFunds, Inc.
Two World Financial Center, New York, New York 10281-1008
(Name and address of agent for service)
Registrant’s telephone number, including area code: (303) 768-3200
Date of fiscal year end: January 31
Date of reporting period: 01/31/2011
| | |
| Item 1. | | Reports to Stockholders. |
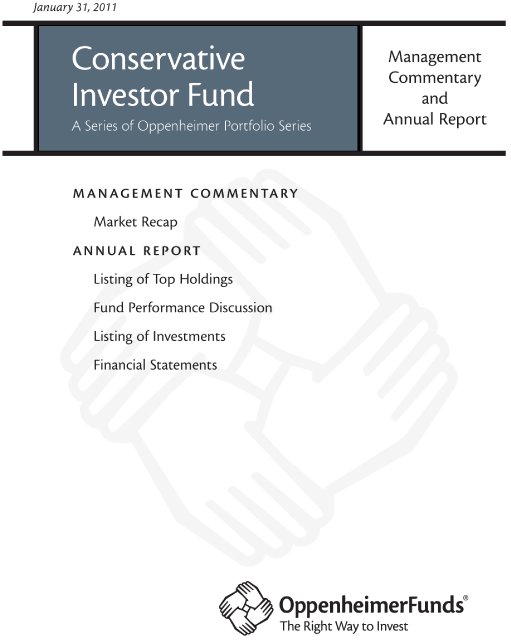
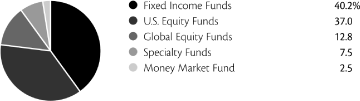
TOP HOLDINGS AND ALLOCATIONS
Asset Class Allocation
Portfolio holdings and allocations are subject to change. Percentages are as of January 31, 2011, and are based on the total market value of investments.
| | | | | |
| Top Ten Holdings | | | | |
| |
| Oppenheimer Core Bond Fund, Cl. Y | | | 26.3 | % |
| Oppenheimer Limited-Term Government Fund, Cl. Y | | | 18.5 | |
| Oppenheimer Value Fund, Cl. Y | | | 10.9 | |
| Oppenheimer International Bond Fund, Cl. Y | | | 9.1 | |
| Oppenheimer Capital Appreciation Fund, Cl. Y | | | 8.1 | |
| Oppenheimer Champion Income Fund, Cl. Y | | | 4.7 | |
| Oppenheimer Commodity Strategy Total Return Fund, Cl. Y | | | 4.6 | |
| Oppenheimer Institutional Money Market Fund, Cl. E | | | 4.3 | |
| Oppenheimer Main Street Small- & Mid-Cap Fund, Cl. Y | | | 3.3 | |
| Oppenheimer Master Inflation Protected Securities Fund, LLC | | | 2.8 | |
Portfolio holdings and allocations are subject to change. Percentages are as of January 31, 2011, and are based on net assets. For more current Top 10 Fund holdings, please visit www.oppenheimerfunds.com.
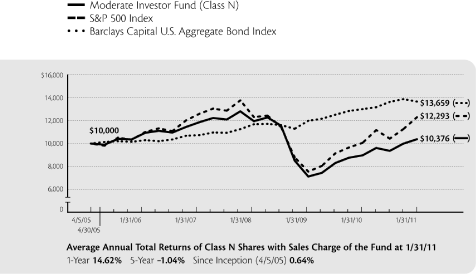
7 | CONSERVATIVE INVESTOR FUND
FUND PERFORMANCE DISCUSSION
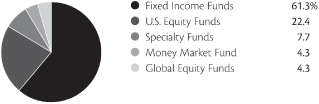
How has the Fund performed? Below is a discussion by OppenheimerFunds, Inc. of the Fund’s performance during its fiscal year ended January 31, 2011, followed by a graphical comparison of the Fund’s performance to appropriate broad-based market indices.
Management’s Discussion of Fund Performance. During the 12-month reporting period ended January 31, 2011, Conservative Investor Fund’s Class A shares (without sales charge) returned 12.91%. In comparison, the Fund outperformed the Barclays Capital U.S. Aggregate Bond Index (the “Index”), which returned 5.06%. The Fund underperformed the S&P 500 Index, which returned 22.20%, as a result of its large allocation to underlying fixed-income funds in a period when equities outperformed bonds.
During the reporting period, the Fund’s largest underlying fixed-income funds all contributed positively to performance. The Fund’s top holding, Oppenheimer Core Bond Fund’s Class Y shares, contributed strongly to the relative outperformance versus the Index. At period end, this underlying fund constituted approximately 26% of the Fund’s assets. This underlying fund significantly outperformed the Index in a number of areas, including mortgage-backed securities (MBS), commercial mortgage-backed securities (CMBS) and certain investment grade and high yield investments. During the period, MBS guaranteed by government-sponsored enterprises (GSEs), also referred to as agency MBS, and MBS originated by private entities, otherwise known as non-agency MBS, both contributed to this underlying fund’s outperformance.
With respect to investment grade securities, an overweight to financials and a tilt towards lower-rated, investment grade corporate debt, especially BBB-rated securities, contributed to this underlying fund’s performance. High yield, non-investment grade securities also performed well for this underlying fund, as its allocations to BB-rated bonds added to its outperformance. In addition, asset-backed securities (ABS) contributed to this underlying fund’s performance. During the period, this underlying fund had minimal exposure to U.S. Treasury securities, which contributed to its relative outperformance, as most other categories of the Index performed better. This underlying fund’s lack of significant direct exposure to Treasuries fared especially well in December, when they encountered a steep sell-off.
The Fund’s second largest holding, Oppenheimer Limited-Term Government Fund’s Class Y shares, at period end accounted for approximately 18.5% of the Fund’s assets. During the reporting period, since U.S. Treasury securities did not perform as well as other areas of the fixed-income market, this underlying fund’s exposure to them detracted from relative results versus the Index. Treasuries experienced a sell-off in December as the market favored higher-yielding fixed-income securities. This underlying fund significantly outperformed its own benchmark, the Barclays Capital U.S. 1-3 Year Government Bond Index, which returned 1.83% during the period, primarily due to its exposure to both non-agency MBS and agency MBS, as well as CMBS and ABS.
8 | CONSERVATIVE INVESTOR FUND
The Fund’s third largest fixed-income holding at period end, Oppenheimer International Bond Fund’s Class Y shares, outperformed the Index and accounted for approximately 9% of the Fund’s assets at period end. We attribute this underlying fund’s strong performance primarily to its emphasis on emerging market bonds over securities from developed markets. In addition, this underlying fund successfully avoided the brunt of weakness stemming from the European sovereign debt crisis through underweight positions in Greece, Ireland and Spain during the reporting period. During the period, this underlying fund’s Class Y shares outperformed its own benchmark, the Citigroup Non-U.S. Dollar World Government Bond Index, which returned 5.54%. At period end, the Fund had approximately 5% of its assets allocated to Oppenheimer Champion Income Fund’s Class Y shares, which also produced positive results during the period.
Within the equity component, the Fund had its largest allocations to Oppenheimer Value Fund’s Class Y shares and Oppenheimer Capital Appreciation Fund’s Class Y shares, which together comprised approximately 19% of the Fund’s assets. These underlying funds produced double-digit absolute returns, as equities generally rallied during the period. Oppenheimer Value Fund’s Class Y shares outperformed both the S&P 500 Index as well as its own benchmark, the Russell 1000 Value Index, which returned 21.54% during the period. While producing strong absolute returns, Oppenheimer Capital Appreciation Fund’s Class Y shares underperformed the S&P 500 Index as well as its benchmark, the Russell 1000 Growth Index, which returned 25.14%. This underlying fund underperformed largely as a result of weaker relative stock selection within the materials, financials and consumer discretionary sectors. During the reporting period, we also initiated a position in Oppenheimer Main Street Small- & Mid-Cap Fund’s Class Y shares to increase our exposure to smaller cap stocks. This underlying fund, which accounted for approximately 3% of the Fund’s assets at period end, produced strong absolute returns while held in the portfolio. The combined allocation of approximately 12% to global equity and specialty funds also added to Fund performance. Overall for the period, global equities had solid performance. Asset classes such as commodities and real estate also performed strongly.
At period end, underlying fixed-income funds, including a small allocation to Oppenheimer Institutional Money Market Fund, consisted of approximately 65.6% of the Fund’s assets. Underlying equity funds accounted for approximately 26.7% of the Fund’s assets, with 22.4% allocated to U.S. equity funds and 4.3% allocated to four global equity funds—Oppenheimer International Growth Fund, Oppenheimer Quest International Value Fund, Oppenheimer Developing Markets Fund and Oppenheimer International Small Company Fund. An additional 7.7% of the Fund’s assets at period end
9 | CONSERVATIVE INVESTOR FUND
FUND PERFORMANCE DISCUSSION
were allocated to specialty funds, specifically Oppenheimer Gold & Special Minerals Fund, Oppenheimer Real Estate Fund and Oppenheimer Commodity Strategy Total Return Fund. Allocations to Oppenheimer Main Street Fund and Oppenheimer Global Fund were eliminated in June 2010 in an attempt to reduce overlap with some of our underlying holdings.
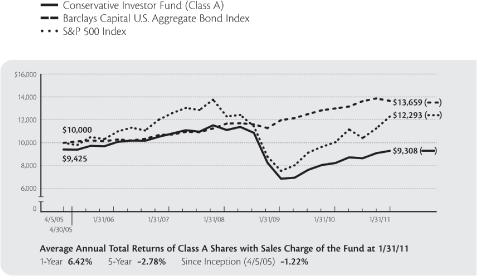
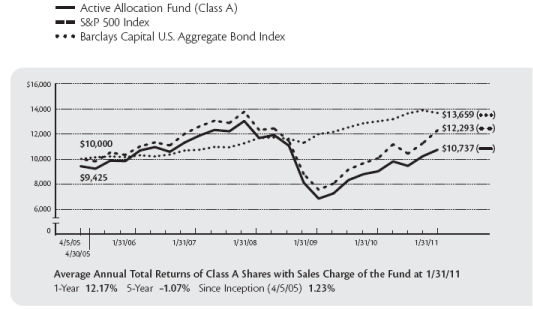
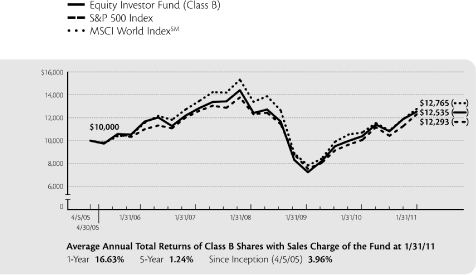
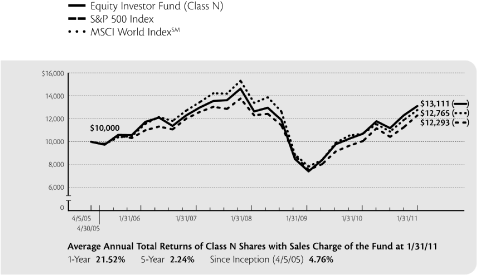
Comparing the Fund’s Performance to the Market. The graphs that follow show the performance of a hypothetical $10,000 investment in each Class of shares of the Fund held until January 31, 2011. Performance is measured from the inception of the Classes on April 5, 2005. The Fund’s performance reflects the deduction of the maximum initial sales charge on Class A shares, the applicable contingent deferred sales charge on Class B, Class C and Class N shares, and reinvestments of all dividends and capital gains distributions. Past performance cannot guarantee future results.
The Fund’s performance is compared to the performance of the Barclays Capital U.S. Aggregate Bond Index and the S&P 500 Index. The Barclays Capital U.S. Aggregate Bond Index is an unmanaged, broad-based index of investment grade corporate debt. The S&P 500 Index is an unmanaged index of equity securities that is a measure of the general domestic stock market. Index performance reflects the reinvestment of income but does not consider the effect of transaction costs, and none of the data in the graphs shows the effect of taxes. The Fund’s performance reflects the effects of the Fund’s business and operating expenses. While index comparisons may be useful to provide a benchmark for the Fund’s performance, it must be noted that the Fund’s investments are not limited to the investments comprising the indices.
10 | CONSERVATIVE INVESTOR FUND
Class A Shares
Comparison of Change in Value of $10,000 Hypothetical Investments in:
The performance data quoted represents past performance, which does not guarantee future results. The investment return and principal value of an investment in the Fund will fluctuate so that an investor’s shares, when redeemed, may be worth more or less than their original cost. Current performance may be lower or higher than the performance quoted. For performance data current to the most recent month end, visit us at www.oppenheimerfunds.com, or call us at 1.800.525.7048. Fund returns include changes in share price, reinvested distributions, and the applicable sales charge: for Class A shares, the current maximum initial sales charge of 5.75%; for Class B shares, the contingent deferred sales charge of 5% (1-year) and 2% (5-year); and for Class C and N shares, the 1% contingent deferred sales charge for the 1-year period. There is no sales charge for Class Y shares. See page 16 of further information.
11 | CONSERVATIVE INVESTOR FUND
FUND PERFORMANCE DISCUSSION
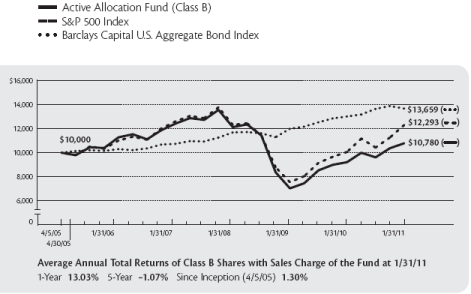
Class B Shares
Comparison of Change in Value of $10,000 Hypothetical Investments in:
12 | CONSERVATIVE INVESTOR FUND
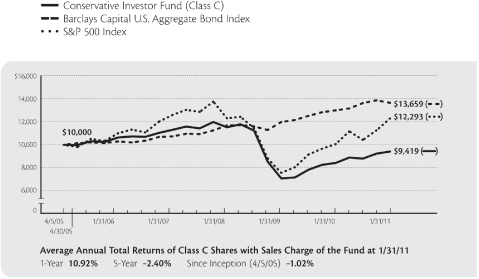
Class C Shares
Comparison of Change in Value of $10,000 Hypothetical Investments in:
The performance data quoted represents past performance, which does not guarantee future results. The investment return and principal value of an investment in the Fund will fluctuate so that an investor’s shares, when redeemed, may be worth more or less than their original cost. Current performance may be lower or higher than the performance quoted. For performance data current to the most recent month end, visit us at www.oppenheimerfunds.com, or call us at 1.800.525.7048. Fund returns include changes in share price, reinvested distributions, and the applicable sales charge: for Class A shares, the current maximum initial sales charge of 5.75%; for Class B shares, the contingent deferred sales charge of 5% (1-year) and 2% (5-year); and for Class C and N shares, the 1% contingent deferred sales charge for the 1-year period. There is no sales charge for Class Y shares. See page 16 of further information.
13 | CONSERVATIVE INVESTOR FUND
FUND PERFORMANCE DISCUSSION
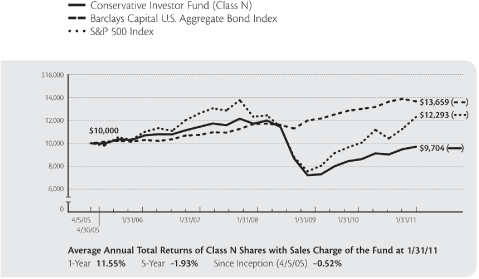
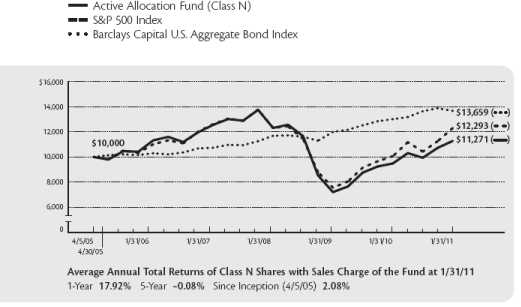
Class N Shares
Comparison of Change in Value of $10,000 Hypothetical Investments in:
14 | CONSERVATIVE INVESTOR FUND
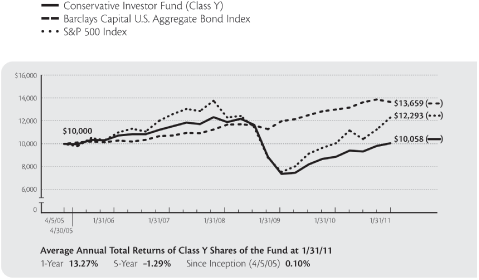
Class Y Shares
Comparison of Change in Value of $10,000 Hypothetical Investments in:
The performance data quoted represents past performance, which does not guarantee future results. The investment return and principal value of an investment in the Fund will fluctuate so that an investor’s shares, when redeemed, may be worth more or less than their original cost. Current performance may be lower or higher than the performance quoted. For performance data current to the most recent month end, visit us at www.oppenheimerfunds.com, or call us at 1.800.525.7048. Fund returns include changes in share price, reinvested distributions, and the applicable sales charge: for Class A shares, the current maximum initial sales charge of 5.75%; for Class B shares, the contingent deferred sales charge of 5% (1-year) and 2% (5-year); and for Class C and N shares, the 1% contingent deferred sales charge for the 1-year period. There is no sales charge for Class Y shares. See page 16 for further information.
15 | CONSERVATIVE INVESTOR FUND
NOTES
Total returns and the ending account values in the graphs include changes in share price and reinvestment of dividends and capital gains distributions in a hypothetical investment for the periods shown. The Fund’s total returns shown do not reflect the deduction of income taxes on an individual’s investment. Taxes may reduce your actual investment returns on income or gains paid by the Fund or any gains you may realize if you sell your shares.
Investors should consider the Fund’s investment objectives, risks, expenses and other charges carefully before investing. The Fund’s prospectus and, if available, the Fund’s summary prospectus contain this and other information about the Fund, and may be obtained by asking your financial advisor, calling us at 1.800.525.7048 or visiting our website at www.oppenheimerfunds.com. Read the prospectus and, if available, the summary prospectus carefully before investing.
The Fund’s investment strategy and focus can change over time. The mention of specific fund holdings does not constitute a recommendation by OppenheimerFunds, Inc.
Class A shares of the Fund were first publicly offered on 4/5/05. Unless otherwise noted, Class A returns include the maximum initial sales charge of 5.75%.
Class B shares of the Fund were first publicly offered on 4/5/05. Unless otherwise noted, Class B returns include the applicable contingent deferred sales charge of 5% (1-year) and 2% (5-year). Class B shares are subject to an annual 0.75% asset-based sales charge.
Class C shares of the Fund were first publicly offered on 4/5/05. Unless otherwise noted, Class C returns include the contingent deferred sales charge of 1% for the 1-year period. Class C shares are subject to an annual 0.75% asset-based sales charge.
Class N shares of the Fund were first publicly offered on 4/5/05. Class N shares are offered only through retirement plans. Unless otherwise noted, Class N returns include the contingent deferred sales charge of 1% for the 1-year period. Class N shares are subject to an annual 0.25% asset-based sales charge.
Class Y shares of the Fund were first publicly offered on 4/5/05. Class Y shares are offered only to fee-based clients of dealers that have a special agreement with the Distributor, to certain institutional investors under a special agreement with the Distributor, and to present or former officers, directors, trustees or employees (and their eligible family members) of the Fund, the Manager, its affiliates, its parent company and the subsidiaries of its parent company, and retirement plans established for the benefit of such individuals.
An explanation of the calculation of performance is in the Fund’s Statement of Additional Information.
16 | CONSERVATIVE INVESTOR FUND
FUND EXPENSES
Fund Expenses. As a shareholder of the Fund, you incur two types of costs: (1) transaction costs, which may include sales charges (loads) on purchase payments, contingent deferred sales charges on redemptions; and (2) ongoing costs, including distribution and service fees; and other Fund expenses. These examples are intended to help you understand your ongoing costs (in dollars) of investing in the Fund and to compare these costs with the ongoing costs of investing in other mutual funds.
The examples are based on an investment of $1,000.00 invested at the beginning of the period and held for the entire 6-month period ended January 31, 2011.
Actual Expenses. The first section of the table provides information about actual account values and actual expenses. You may use the information in this section for the class of shares you hold, together with the amount you invested, to estimate the expense that you paid over the period. Simply divide your account value by $1,000.00 (for example, an $8,600.00 account value divided by $1,000.00 = 8.60), then multiply the result by the number in the first section under the heading entitled “Expenses Paid During Period” to estimate the expenses you paid on your account during this period.
Hypothetical Example for Comparison Purposes. The second section of the table provides information about hypothetical account values and hypothetical expenses based on the Fund’s actual expense ratio for each class of shares, and an assumed rate of return of 5% per year for each class before expenses, which is not the actual return. The hypothetical account values and expenses may not be used to estimate the actual ending account balance or expenses you paid for the period. You may use this information to compare the ongoing costs of investing in the Fund and other funds. To do so, compare this 5% hypothetical example for the class of shares you hold with the 5% hypothetical examples that appear in the shareholder reports of the other funds.
Please note that the expenses shown in the table are meant to highlight your ongoing costs only and do not reflect any transactional costs, such as front-end or contingent deferred sales charges (loads), or a $12.00 fee imposed annually on accounts valued at less than $500.00 (subject to exceptions described in the Statement of Additional Information). Therefore, the “hypothetical” section of the table is useful in comparing ongoing costs only, and will not help you determine the relative total costs of owning different funds. In addition, if these transactional costs were included, your costs would have been higher.
17 | CONSERVATIVE INVESTOR FUND
FUND EXPENSES Continued
| | | | | | | | | | | | | |
| | | Beginning | | | Ending | | | Expenses | |
| | | Account | | | Account | | | Paid During | |
| | | Value | | | Value | | | 6 Months Ended | |
| | | August 1, 2010 | | | January 31, 2011 | | | January 31, 2011 | |
| |
| Actual |
| Class A | | $ | 1,000.00 | | | $ | 1,075.30 | | | $ | 2.57 | |
| Class B | | | 1,000.00 | | | | 1,071.00 | | | | 7.23 | |
| Class C | | | 1,000.00 | | | | 1,070.90 | | | | 6.60 | |
| Class N | | | 1,000.00 | | | | 1,074.40 | | | | 4.14 | |
| Class Y | | | 1,000.00 | | | | 1,076.10 | | | | 0.79 | |
| | | | | | | | | | | | | |
| Hypothetical |
| (5% return before expenses) |
| Class A | | | 1,000.00 | | | | 1,022.74 | | | | 2.50 | |
| Class B | | | 1,000.00 | | | | 1,018.25 | | | | 7.04 | |
| Class C | | | 1,000.00 | | | | 1,018.85 | | | | 6.43 | |
| Class N | | | 1,000.00 | | | | 1,021.22 | | | | 4.03 | |
| Class Y | | | 1,000.00 | | | | 1,024.45 | | | | 0.77 | |
Expenses are equal to the Fund’s annualized expense ratio for that class, multiplied by the average account value over the period, multiplied by 184/365 (to reflect the one-half year period). Those annualized expense ratios, excluding the indirect expenses incurred through the Fund’s investments in the underlying funds, based on the 6-month period ended January 31, 2011 are as follows:
| | | | | |
| Class | | Expense Ratios | |
| |
| Class A | | | 0.49 | % |
| Class B | | | 1.38 | |
| Class C | | | 1.26 | |
| Class N | | | 0.79 | |
| Class Y | | | 0.15 | |
The expense ratios reflect voluntary waivers or reimbursements of expenses by the Fund’s Manager, Transfer Agent and Distributor. Some of these undertakings may be modified or terminated at any time; some may not be modified or terminated until after one year from the date of the current prospectus, as indicated therein. The “Financial Highlights” tables in the Fund’s financial statements, included in this report, also show the gross expense ratios, without such waivers or reimbursements and reduction to custodian expenses, if applicable.
18 | CONSERVATIVE INVESTOR FUND
STATEMENT OF INVESTMENTS January 31, 2011
| | | | | | | | | |
| | | Shares | | | Value | |
| |
Investment Companies—100.0%1 | | | | | | | | |
Fixed Income Funds—61.3% | | | | | | | | |
| Oppenheimer Champion Income Fund, Cl. Y | | | 9,694,715 | | | $ | 19,195,536 | |
| Oppenheimer Core Bond Fund, Cl. Y | | | 16,655,896 | | | | 107,763,648 | |
| Oppenheimer International Bond Fund, Cl. Y | | | 5,795,205 | | | | 37,437,021 | |
| Oppenheimer Limited-Term Government Fund, Cl. Y | | | 8,068,477 | | | | 75,762,994 | |
| Oppenheimer Master Inflation Protected Securities Fund, LLC | | | 1,125,630 | | | | 11,535,495 | |
| | | | | | | | |
| | | | | | | | 251,694,694 | |
| | | | | | | | | |
Global Equity Funds—4.3% | | | | | | | | |
| Oppenheimer Developing Markets Fund, Cl. Y | | | 79,979 | | | | 2,732,079 | |
| Oppenheimer International Growth Fund, Cl. Y | | | 331,533 | | | | 9,319,389 | |
| Oppenheimer International Small Company Fund, Cl. Y | | | 43,961 | | | | 1,028,244 | |
| Oppenheimer Quest International Value Fund, Cl. Y | | | 269,948 | | | | 4,575,616 | |
| | | | | | | | |
| | | | | | | | 17,655,328 | |
| | | | | | | | | |
Money Market Fund—4.3% | | | | | | | | |
Oppenheimer Institutional Money Market Fund, Cl. E, 0.20%2 | | | 17,727,951 | | | | 17,727,951 | |
Specialty Funds—7.7% | | | | | | | | |
| Oppenheimer Commodity Strategy Total Return Fund, Cl. Y | | | 4,975,974 | | | | 18,759,423 | |
| Oppenheimer Gold & Special Minerals Fund, Cl. Y | | | 94,293 | | | | 4,125,311 | |
| Oppenheimer Real Estate Fund, Cl. Y | | | 444,056 | | | | 8,659,101 | |
| | | | | | | | |
| | | | | | | | 31,543,835 | |
| | | | | | | | | |
U.S. Equity Funds—22.4% | | | | | | | | |
Oppenheimer Capital Appreciation Fund, Cl. Y3 | | | 725,316 | | | | 33,422,545 | |
| Oppenheimer Main Street Small- & Mid-Cap Fund, Cl. Y | | | 621,030 | | | | 13,426,676 | |
| Oppenheimer Value Fund, Cl. Y | | | 1,971,265 | | | | 44,925,133 | |
| | | | | | | | |
| | | | | | | | 91,774,354 | |
| | | | | | | | | |
Total Investments, at Value (Cost $406,831,196) | | | 100.0 | % | | | 410,396,162 | |
Other Assets Net of Liabilities | | | 0.0 | | | | 39,993 | |
| | | |
| | | | | | | | | |
Net Assets | | | 100.0 | % | | $ | 410,436,155 | |
| | | |
19 | CONSERVATIVE INVESTOR FUND
STATEMENT OF INVESTMENTS Continued
Footnotes to Statement of Investments
1. Is or was an affiliate, as defined in the Investment Company Act of 1940, at or during the period ended January 31, 2011, by virtue of the Fund owning at least 5% of the voting securities of the issuer or as a result of the Fund and the issuer having the same investment adviser. Transactions during the period in which the issuer was an affiliate are as follows:
| | | | | | | | | | | | | | | | | |
| | | Shares | | | Gross | | | Gross | | | Shares | |
| | | January 31, 2010 | | | Additions | | | Reductions | | | January 31, 2011 | |
| |
| Oppenheimer Capital Appreciation Fund, Cl.Y | | | 467,034 | | | | 328,070 | | | | 69,788 | | | | 725,316 | |
| Oppenheimer Champion Income Fund, Cl.Y | | | 13,191,935 | | | | 2,547,948 | | | | 6,045,168 | | | | 9,694,715 | |
| Oppenheimer Commodity Strategy Total Return Fund, Cl.Y | | | 5,164,765 | | | | 853,707 | | | | 1,042,498 | | | | 4,975,974 | |
| Oppenheimer Core Bond Fund, Cl.Y | | | 17,165,564 | | | | 3,349,827 | | | | 3,859,495 | | | | 16,655,896 | |
| Oppenheimer Developing Markets Fund, Cl.Y | | | — | | | | 83,697 | | | | 3,718 | | | | 79,979 | |
| Oppenheimer Global Fund, Cl.Y | | | 361,108 | | | | 21,929 | | | | 383,037 | | | | — | |
| Oppenheimer Gold & Special Minerals Fund, Cl.A | | | — | | | | 93,042 | | | | 93,042 | | | | — | |
| Oppenheimer Gold & Special Minerals Fund, Cl.Y | | | — | | | | 96,990 | | | | 2,697 | | | | 94,293 | |
| Oppenheimer Institutional Money Market Fund, Cl. E | | | 368,365 | | | | 51,444,044 | | | | 34,084,458 | | | | 17,727,951 | |
| Oppenheimer International Bond Fund, Cl.Y | | | 4,126,247 | | | | 2,438,780 | | | | 769,822 | | | | 5,795,205 | |
| Oppenheimer International Growth Fund, Cl.Y | | | — | | | | 357,016 | | | | 25,483 | | | | 331,533 | |
| Oppenheimer International Small Company Fund, Cl.Y | | | — | | | | 45,789 | | | | 1,828 | | | | 43,961 | |
| Oppenheimer Limited-Term Government Fund, Cl.Y | | | 7,462,861 | | | | 1,839,000 | | | | 1,233,384 | | | | 8,068,477 | |
| Oppenheimer Main Street Fund, Cl.Y | | | 679,045 | | | | 40,988 | | | | 720,033 | | | | — | |
| Oppenheimer Main Street Small- & Mid-Cap Fund, Cl.Y(formerly Oppenheimer Main Street Small Cap Fund, Cl.Y) | | | — | | | | 651,818 | | | | 30,788 | | | | 621,030 | |
| Oppenheimer Master Inflation Protected Securities Fund, LLC | | | — | | | | 1,223,255 | | | | 97,625 | | | | 1,125,630 | |
| Oppenheimer Quest International Value Fund, Cl.Y | | | — | | | | 282,631 | | | | 12,683 | | | | 269,948 | |
| Oppenheimer Real Estate Fund, Cl.Y | | | 1,466,960 | | | | 121,116 | | | | 1,144,020 | | | | 444,056 | |
| Oppenheimer Value Fund, Cl.Y | | | 970,883 | | | | 1,294,346 | | | | 293,964 | | | | 1,971,265 | |
| | | | | | | | | | | | | |
| | | | | | | | | | | Realized | |
| | | Value | | | Income | | | Gain (Loss) | |
| |
| Oppenheimer Capital Appreciation Fund, Cl.Y | | $ | 33,422,545 | | | $ | — | | | $ | (414,850 | ) |
| Oppenheimer Champion Income Fund, Cl.Y | | | 19,195,536 | | | | 1,587,025 | | | | (19,085,461 | ) |
| Oppenheimer Commodity Strategy Total Return Fund, Cl.Y | | | 18,759,423 | | | | 332,258 | | | | (4,120,921 | ) |
| Oppenheimer Core Bond Fund, Cl.Y | | | 107,763,648 | | | | 5,646,444 | | | | (11,409,562 | ) |
| Oppenheimer Developing Markets Fund, Cl.Y | | | 2,732,079 | | | | 11,408 | | | | 67 | |
| Oppenheimer Global Fund, Cl.Y | | | — | | | | — | | | | (2,457,187 | ) |
| Oppenheimer Gold & Special Minerals Fund, Cl. A | | | — | | | | — | | | | 475,250 | |
| Oppenheimer Gold & Special Minerals Fund, Cl.Y | | | 4,125,311 | | | | 395,229 | | | | (1,490 | ) |
| Oppenheimer Institutional Money Market Fund, Cl. E | | | 17,727,951 | | | | 24,704 | | | | — | |
20 | CONSERVATIVE INVESTOR FUND
| | | | | | | | | | | | | |
| | | | | | | | | | | Realized | |
| | | Value | | | Income | | | Gain (Loss) | |
| |
| Oppenheimer International Bond Fund, Cl.Y | | $ | 37,437,021 | | | $ | 1,494,560 | | | $ | 4,085 | |
| Oppenheimer International Growth Fund, Cl.Y | | | 9,319,389 | | | | 90,283 | | | | 11,065 | |
| Oppenheimer International Small Company Fund, Cl.Y | | | 1,028,244 | | | | 90,569 | | | | (93 | ) |
| Oppenheimer Limited — Term Government Fund, Cl.Y | | | 75,762,994 | | | | 2,233,963 | | | | (122,989 | ) |
| Oppenheimer Main Street Fund, Cl.Y | | | — | | | | — | | | | (3,485,235 | ) |
| Oppenheimer Main Street Small- & Mid-Cap Fund, Cl.Y (formerly Oppenheimer Main Street Small Cap Fund, Cl.Y) | | | 13,426,676 | | | | 46,564 | | | | (2,936 | ) |
| Oppenheimer Master Inflation Protected Securities Fund, LLC | | | 11,535,495 | | | | 103,987 | a | | | 27,836 | a |
| Oppenheimer Quest International Value Fund, Cl.Y | | | 4,575,616 | | | | 123,354 | | | | (568 | ) |
| Oppenheimer Real Estate Fund, Cl.Y | | | 8,659,101 | | | | 146,726 | | | | (2,696,960 | ) |
| Oppenheimer Value Fund, Cl.Y | | | 44,925,133 | | | | 518,281 | | | | (1,000,013 | ) |
| | | |
| | | $ | 410,396,162 | | | $ | 12,845,355 | | | $ | (44,279,962 | ) |
| | | |
a. Represents the amount allocated to the Fund from Oppenheimer Master Inflation Protected Securities Fund, LLC.
2. Rate shown is the 7-day yield as of January 31, 2011.
3. Non-income producing security.
Valuation Inputs
Various data inputs are used in determining the value of each of the Fund’s investments as of the reporting period end. These data inputs are categorized in the following hierarchy under applicable financial accounting standards:
| | 1) | | Level 1—unadjusted quoted prices in active markets for identical assets or liabilities (including securities actively traded on a securities exchange) |
| |
| | 2) | | Level 2—inputs other than unadjusted quoted prices that are observable for the asset or liability (such as unadjusted quoted prices for similar assets and market corroborated inputs such as interest rates, prepayment speeds, credit risks, etc.) |
| |
| | 3) | | Level 3—significant unobservable inputs (including the Manager’s own judgments about assumptions that market participants would use in pricing the asset or liability). |
The table below categorizes amounts that are included in the Fund’s Statement of Assets and Liabilities as of
January 31, 2011 based on valuation input level:
| | | | | | | | | | | | | | | | | |
| | | | | | | | | | | Level 3— | | | | |
| | | Level 1— | | | Level 2— | | | Significant | | | | |
| | | Unadjusted | | | Other Significant | | | Unobservable | | | | |
| | | Quoted Prices | | | Observable Inputs | | | Inputs | | | Value | |
| |
Assets Table | | | | | | | | | | | | | | | | |
Investments, at Value: | | | | | | | | | | | | | | | | |
| Investment Companies | | $ | 410,396,162 | | | $ | — | | | $ | — | | | $ | 410,396,162 | |
| | | |
| Total Assets | | $ | 410,396,162 | | | $ | — | | | $ | — | | | $ | 410,396,162 | |
| | | |
Currency contracts and forwards, if any, are reported at their unrealized appreciation/depreciation at measurement date, which represents the change in the contract’s value from trade date. Futures, if any, are reported at their variation margin at measurement date, which represents the amount due to/from the Fund at that date. All additional assets and liabilities included in the above table are reported at their market value at measurement date.
See the accompanying Notes for further discussion of the methods used in determining value of the Fund’s investments, and a summary of changes to the valuation methodologies, if any, during the reporting period.
See accompanying Notes to Financial Statements.
21 | CONSERVATIVE INVESTOR FUND
STATEMENT OF ASSETS AND LIABILITIES January 31, 2011
| | | | | |
|
Assets | | | | |
| Investments, at value—see accompanying statement of investments— affiliated companies (cost $406,831,196) | | $ | 410,396,162 | |
| Cash | | | 700,226 | |
| Receivables and other assets: | | | | |
| Dividends | | | 901,519 | |
| Shares of beneficial interest sold | | | 627,020 | |
| Investments sold | | | 61,565 | |
| Other | | | 19,454 | |
| | | | |
| Total assets | | | 412,705,946 | |
| | | | | |
Liabilities | | | | |
| Payables and other liabilities: | | | | |
| Shares of beneficial interest redeemed | | | 1,107,956 | |
| Investments purchased | | | 902,238 | |
| Distribution and service plan fees | | | 82,840 | |
| Transfer and shareholder servicing agent fees | | | 69,239 | |
| Shareholder communications | | | 39,276 | |
| Trustees’ compensation | | | 27,549 | |
| Other | | | 40,693 | |
| | | | |
| Total liabilities | | | 2,269,791 | |
| | | | | |
Net Assets | | $ | 410,436,155 | |
| | | | |
| | | | | |
Composition of Net Assets | | | | |
| Par value of shares of beneficial interest | | $ | 50,708 | |
| Additional paid-in capital | | | 520,706,380 | |
| Accumulated net investment income | | | 788,184 | |
| Accumulated net realized loss on investments | | | (114,674,083 | ) |
| Net unrealized appreciation on investments | | | 3,564,966 | |
| | | | |
| | | | | |
Net Assets | | $ | 410,436,155 | |
| | | | |
22 | CONSERVATIVE INVESTOR FUND
| | | | | |
|
Net Asset Value Per Share | | | | |
| | | | | |
| Class A Shares: | | | | |
| Net asset value and redemption price per share (based on net assets of $216,714,969 and 26,678,278 shares of beneficial interest outstanding) | | $ | 8.12 | |
| | | | | |
| Maximum offering price per share (net asset value plus sales charge of 5.75% of offering price) | | $ | 8.62 | |
| | | | | |
| Class B Shares: | | | | |
| Net asset value, redemption price (excludes applicable contingent deferred sales charge) and offering price per share (based on net assets of $31,469,748 and 3,900,232 shares of beneficial interest outstanding) | | $ | 8.07 | |
| | | | | |
| Class C Shares: | | | | |
| Net asset value, redemption price (excludes applicable contingent deferred sales charge) and offering price per share (based on net assets of $105,918,547 and 13,167,590 shares of beneficial interest outstanding) | | $ | 8.04 | |
| | | | | |
| Class N Shares: | | | | |
| Net asset value, redemption price (excludes applicable contingent deferred sales charge) and offering price per share (based on net assets of $54,286,304 and 6,711,032 shares of beneficial interest outstanding) | | $ | 8.09 | |
| | | | | |
| Class Y Shares: | | | | |
| Net asset value, redemption price and offering price per share (based on net assets of $2,046,587 and 251,293 shares of beneficial interest outstanding) | | $ | 8.14 | |
See accompanying Notes to Financial Statements.
23 | CONSERVATIVE INVESTOR FUND
STATEMENT OF OPERATIONS For the Year Ended January 31, 2011
| | | | | |
|
Allocation of Income and Expenses from Master Fund1 | | | | |
| Net investment income allocated from Oppenheimer Master Inflation | | | | |
| Protected Securities Fund, LLC: | | | | |
| Interest | | $ | 103,987 | |
| Expenses | | | (42,410 | ) |
| | | | |
| | | | | |
| Net investment income allocated from Oppenheimer Master Inflation | | | | |
| Protected Securities Fund, LLC | | | 61,577 | |
| | | | | |
Investment Income | | | | |
| Dividends from affiliated companies | | | 12,741,368 | |
| Interest | | | 278 | |
| Other income | | | 6,628 | |
| | | | |
| Total investment income | | | 12,748,274 | |
| | | | | |
Expenses | | | | |
| Distribution and service plan fees: | | | | |
| Class A | | | 472,940 | |
| Class B | | | 296,405 | |
| Class C | | | 977,637 | |
| Class N | | | 273,675 | |
| Transfer and shareholder servicing agent fees: | | | | |
| Class A | | | 376,321 | |
| Class B | | | 88,593 | |
| Class C | | | 214,947 | |
| Class N | | | 153,219 | |
| Class Y | | | 1,500 | |
| Shareholder communications: | | | | |
| Class A | | | 35,944 | |
| Class B | | | 13,010 | |
| Class C | | | 21,726 | |
| Class N | | | 3,731 | |
| Class Y | | | 52 | |
| Trustees’ compensation | | | 6,212 | |
| Custodian fees and expenses | | | 5,543 | |
| Administration service fees | | | 1,500 | |
| Other | | | 59,989 | |
| | | | |
| Total expenses | | | 3,002,944 | |
| Less waivers and reimbursements of expenses | | | (17,306 | ) |
| | | | |
| Net expenses | | | 2,985,638 | |
| | | | | |
Net Investment Income | | | 9,824,213 | |
24 | CONSERVATIVE INVESTOR FUND
| | | | | |
|
Realized and Unrealized Gain (Loss) | | | | |
| �� |
| Net realized gain (loss) on: | | | | |
| Investments from affiliated companies | | $ | (44,307,798 | ) |
| Distributions received from affiliated companies | | | 439,574 | |
| Net realized gain allocated from Oppenheimer Master Inflation Protected Securities Fund, LLC | | | 27,836 | |
| | | | |
| Total net realized loss | | | (43,840,388 | ) |
| Net change in unrealized appreciation/depreciation on investments | | | 78,403,845 | |
| Net change in unrealized appreciation/deprecation allocated from Oppenheimer Master Inflation Protected Securities Fund, LLC | | | 168,304 | |
| | | | |
| Total net change in unrealized appreciation/depreciation | | | 78,572,149 | |
Net Increase in Net Assets Resulting from Operations | | $ | 44,555,974 | |
| | | | |
| | |
| 1. | | The Fund invests in an affiliated mutual fund that expects to be treated as a partnership for tax purposes. See Note 1 of the accompanying Notes. |
See accompanying Notes to Financial Statements.
25 | CONSERVATIVE INVESTOR FUND
STATEMENTS OF CHANGES IN NET ASSETS
| | | | | | | | | |
| Year Ended January 31, | | 2011 | | | 2010 | |
| |
Operations | | | | | | | | |
| |
| Net investment income | | $ | 9,824,213 | | | $ | 2,993,675 | |
| Net realized loss | | | (43,840,388 | ) | | | (47,031,891 | ) |
| Net change in unrealized appreciation/depreciation | | | 78,572,149 | | | | 96,404,998 | |
| | | |
| Net increase in net assets resulting from operations | | | 44,555,974 | | | | 52,366,782 | |
| | | | | | | | | |
Dividends and/or Distributions to Shareholders | | | | | | | | |
| |
| Dividends from net investment income: | | | | | | | | |
| Class A | | | (5,747,875 | ) | | | (1,706,377 | ) |
| Class B | | | (587,310 | ) | | | (53,748 | ) |
| Class C | | | (2,087,133 | ) | | | (268,094 | ) |
| Class N | | | (1,282,696 | ) | | | (390,721 | ) |
| Class Y | | | (62,164 | ) | | | (11,393 | ) |
| | | |
| | | | (9,767,178 | ) | | | (2,430,333 | ) |
| | | | | | | | | |
Beneficial Interest Transactions | | | | | | | | |
| |
| Net increase (decrease) in net assets resulting from beneficial interest transactions: | | | | | | | | |
| Class A | | | 34,100,638 | | | | 1,895,362 | |
| Class B | | | (175,475 | ) | | | (1,314,106 | ) |
| Class C | | | 9,970,534 | | | | 766,304 | |
| Class N | | | (5,783,789 | ) | | | (572,470 | ) |
| Class Y | | | 944,271 | | | | 401,139 | |
| | | |
| | | | 39,056,179 | | | | 1,176,229 | |
| | | | | | | | | |
Net Assets | | | | | | | | |
| |
| Total increase | | | 73,844,975 | | | | 51,112,678 | |
| Beginning of period | | | 336,591,180 | | | | 285,478,502 | |
| | | |
| End of period (including accumulated net investment income of $788,184 and $731,210, respectively) | | $ | 410,436,155 | | | $ | 336,591,180 | |
| | | |
See accompanying Notes to Financial Statements.
26 | CONSERVATIVE INVESTOR FUND
FINANCIAL HIGHLIGHTS
| | | | | | | | | | | | | | | | | | | | | |
| Class A Year Ended January 31, | | 2011 | | | 2010 | | | 2009 | | | 2008 | | | 2007 | |
| |
Per Share Operating Data | | | | | | | | | | | | | | | | | | | | |
| |
| Net asset value, beginning of period | | $ | 7.39 | | | $ | 6.23 | | | $ | 10.75 | | | $ | 10.93 | | | $ | 10.53 | |
| |
| Income (loss) from investment operations: | | | | | | | | | | | | | | | | | | | | |
Net investment income1 | | | .23 | | | | .10 | | | | .13 | | | | .55 | | | | .46 | |
| Net realized and unrealized gain (loss) | | | .72 | | | | 1.14 | | | | (4.21 | ) | | | (.24 | ) | | | .29 | |
| | | |
| Total from investment operations | | | .95 | | | | 1.24 | | | | (4.08 | ) | | | .31 | | | | .75 | |
| |
| Dividends and/or distributions to shareholders: | | | | | | | | | | | | | | | | | | | | |
| Dividends from net investment income | | | (.22 | ) | | | (.08 | ) | | | (.13 | ) | | | (.43 | ) | | | (.33 | ) |
| Distributions from net realized gain | | | — | | | | — | | | | (.11 | ) | | | (.06 | ) | | | (.02 | ) |
| Tax return of capital distribution | | | — | | | | — | | | | (.20 | ) | | | — | | | | — | |
| | | |
| Total dividends and/or distributions to shareholders | | | (.22 | ) | | | (.08 | ) | | | (.44 | ) | | | (.49 | ) | | | (.35 | ) |
| |
| Net asset value, end of period | | $ | 8.12 | | | $ | 7.39 | | | $ | 6.23 | | | $ | 10.75 | | | $ | 10.93 | |
| | | |
Total Return, at Net Asset Value2 | | | 12.91 | % | | | 19.86 | % | | | (38.15 | )% | | | 2.81 | % | | | 7.11 | % |
| | | | | | | | | | | | | | | | | | | | | |
Ratios/Supplemental Data | | | | | | | | | | | | | | | | | | | | |
| |
| Net assets, end of period (in thousands) | | $ | 216,715 | | | $ | 164,988 | | | $ | 138,965 | | | $ | 199,125 | | | $ | 110,378 | |
| |
| Average net assets (in thousands) | | $ | 191,109 | | | $ | 146,527 | | | $ | 196,986 | | | $ | 154,289 | | | $ | 76,542 | |
| |
Ratios to average net assets:3 | | | | | | | | | | | | | | | | | | | | |
| Net investment income | | | 2.94 | %4 | | | 1.50 | % | | | 1.42 | % | | | 4.93 | % | | | 4.24 | % |
Total expenses5 | | | 0.49 | %4 | | | 0.50 | % | | | 0.40 | % | | | 0.35 | % | | | 0.38 | % |
| Expenses after payments, waivers and/or reimbursements and reduction to custodian expenses | | | 0.49 | %4 | | | 0.50 | % | | | 0.40 | % | | | 0.35 | % | | | 0.38 | % |
| |
| Portfolio turnover rate | | | 36 | % | | | 21 | % | | | 14 | % | | | 10 | % | | | 5 | % |
| | |
| 1. | | Per share amounts calculated based on the average shares outstanding during the period. |
| |
| 2. | | Assumes an initial investment on the business day before the first day of the fiscal period, with all dividends and distributions reinvested in additional shares on the reinvestment date, and redemption at the net asset value calculated on the last business day of the fiscal period. Sales charges are not reflected in the total returns. Total returns are not annualized for periods less than one full year. Returns do not reflect the deduction of taxes that a shareholder would pay on fund distributions or the redemption of fund shares. |
| |
| 3. | | Annualized for periods less than one full year. |
| |
| 4. | | Includes the Fund’s share of the allocated expenses and/or net investment income from Oppenheimer Master Inflation Protected Securities Fund, LLC. |
| |
| 5. | | Total expenses including all underlying fund expenses were as follows: |
| | | | | |
|
| Year Ended January 31, 2011 | | | 1.10 | % |
| Year Ended January 31, 2010 | | | 1.10 | % |
| Year Ended January 31, 2009 | | | 0.95 | % |
| Year Ended January 31, 2008 | | | 0.91 | % |
| Year Ended January 31, 2007 | | | 0.98 | % |
See accompanying Notes to Financial Statements.
27 | CONSERVATIVE INVESTOR FUND
FINANCIAL HIGHLIGHTS Continued
| | | | | | | | | | | | | | | | | | | | | |
| Class B Year Ended January 31, | | 2011 | | | 2010 | | | 2009 | | | 2008 | | | 2007 | |
| |
Per Share Operating Data | | | | | | | | | | | | | | | | | | | | |
| |
| Net asset value, beginning of period | | $ | 7.35 | | | $ | 6.20 | | | $ | 10.67 | | | $ | 10.87 | | | $ | 10.49 | |
| Income (loss) from investment operations: | | | | | | | | | | | | | | | | | | | | |
Net investment income1 | | | .16 | | | | .05 | | | | .06 | | | | .44 | | | | .36 | |
| Net realized and unrealized gain (loss) | | | .71 | | | | 1.11 | | | | (4.16 | ) | | | (.22 | ) | | | .30 | |
| | | |
| Total from investment operations | | | .87 | | | | 1.16 | | | | (4.10 | ) | | | .22 | | | | .66 | |
| Dividends and/or distributions to shareholders: | | | | | | | | | | | | | | | | | | | | |
| Dividends from net investment income | | | (.15 | ) | | | (.01 | ) | | | (.06 | ) | | | (.36 | ) | | | (.26 | ) |
| Distributions from net realized gain | | | — | | | | — | | | | (.11 | ) | | | (.06 | ) | | | (.02 | ) |
| Tax return of capital distribution | | | — | | | | — | | | | (.20 | ) | | | — | | | | — | |
| | | |
| Total dividends and/or distributions to shareholders | | | (.15 | ) | | | (.01 | ) | | | (.37 | ) | | | (.42 | ) | | | (.28 | ) |
| |
| Net asset value, end of period | | $ | 8.07 | | | $ | 7.35 | | | $ | 6.20 | | | $ | 10.67 | | | $ | 10.87 | |
| | | |
| |
Total Return, at Net Asset Value2 | | | 11.90 | % | | | 18.77 | % | | | (38.61 | )% | | | 1.93 | % | | | 6.28 | % |
| |
Ratios/Supplemental Data | | | | | | | | | | | | | | | | | | | | |
| |
| Net assets, end of period (in thousands) | | $ | 31,470 | | | $ | 28,860 | | | $ | 25,821 | | | $ | 35,068 | | | $ | 21,991 | |
| |
| Average net assets (in thousands) | | $ | 29,729 | | | $ | 26,346 | | | $ | 35,491 | | | $ | 27,664 | | | $ | 15,882 | |
| |
Ratios to average net assets:3 | | | | | | | | | | | | | | | | | | | | |
| Net investment income | | | 2.07 | %4 | | | 0.72 | % | | | 0.62 | % | | | 4.01 | % | | | 3.36 | % |
Total expenses5 | | | 1.37 | %4 | | | 1.45 | % | | | 1.25 | % | | | 1.18 | % | | | 1.23 | % |
| Expenses after payments, waivers and/or reimbursements and reduction to custodian expenses | | | 1.36 | %4 | | | 1.40 | % | | | 1.25 | % | | | 1.18 | % | | | 1.23 | % |
| |
| Portfolio turnover rate | | | 36 | % | | | 21 | % | | | 14 | % | | | 10 | % | | | 5 | % |
| | |
| 1. | | Per share amounts calculated based on the average shares outstanding during the period. |
| |
| 2. | | Assumes an initial investment on the business day before the first day of the fiscal period, with all dividends and distributions reinvested in additional shares on the reinvestment date, and redemption at the net asset value calculated on the last business day of the fiscal period. Sales charges are not reflected in the total returns. Total returns are not annualized for periods less than one full year. Returns do not reflect the deduction of taxes that a shareholder would pay on fund distributions or the redemption of fund shares. |
| |
| 3. | | Annualized for periods less than one full year. |
| |
| 4. | | Includes the Fund’s share of the allocated expenses and/or net investment income from Oppenheimer Master Inflation Protected Securities Fund, LLC. |
| |
| 5. | | Total expenses including all underlying fund expenses were as follows: |
| | | | | |
|
| Year Ended January 31, 2011 | | | 1.98 | % |
| Year Ended January 31, 2010 | | | 2.05 | % |
| Year Ended January 31, 2009 | | | 1.80 | % |
| Year Ended January 31, 2008 | | | 1.74 | % |
| Year Ended January 31, 2007 | | | 1.83 | % |
See accompanying Notes to Financial Statements.
28 | CONSERVATIVE INVESTOR FUND
| | | | | | | | | | | | | | | | | | | | | |
| Class C Year Ended January 31, | | 2011 | | | 2010 | | | 2009 | | | 2008 | | | 2007 | |
| |
Per Share Operating Data | | | | | | | | | | | | | | | | | | | | |
| |
| Net asset value, beginning of period | | $ | 7.33 | | | $ | 6.18 | | | $ | 10.64 | | | $ | 10.85 | | | $ | 10.48 | |
| |
| Income (loss) from investment operations: | | | | | | | | | | | | | | | | | | | | |
Net investment income1 | | | .17 | | | | .03 | | | | .06 | | | | .46 | | | | .37 | |
| Net realized and unrealized gain (loss) | | | .70 | | | | 1.14 | | | | (4.15 | ) | | | (.24 | ) | | | .29 | |
| | | |
| Total from investment operations | | | .87 | | | | 1.17 | | | | (4.09 | ) | | | .22 | | | | .66 | |
| |
| Dividends and/or distributions to shareholders: | | | | | | | | | | | | | | | | | | | | |
| Dividends from net investment income | | | (.16 | ) | | | (.02 | ) | | | (.06 | ) | | | (.37 | ) | | | (.27 | ) |
| Distributions from net realized gain | | | — | | | | — | | | | (.11 | ) | | | (.06 | ) | | | (.02 | ) |
| Tax return of capital distribution | | | — | | | | — | | | | (.20 | ) | | | — | | | | — | |
| | | |
| Total dividends and/or distributions to shareholders | | | (.16 | ) | | | (.02 | ) | | | (.37 | ) | | | (.43 | ) | | | (.29 | ) |
| |
| Net asset value, end of period | | $ | 8.04 | | | $ | 7.33 | | | $ | 6.18 | | | $ | 10.64 | | | $ | 10.85 | |
| | | |
| | | | | | | | | | | | | | | | | | | | | |
Total Return, at Net Asset Value2 | | | 11.92 | % | | | 18.98 | % | | | (38.62 | )% | | | 1.94 | % | | | 6.28 | % |
| | | | | | | | | | | | | | | | | | | | | |
Ratios/Supplemental Data | | | | | | | | | | | | | | | | | | | | |
| |
| Net assets, end of period (in thousands) | | $ | 105,918 | | | $ | 86,890 | | | $ | 73,346 | | | $ | 98,955 | | | $ | 50,876 | |
| |
| Average net assets (in thousands) | | $ | 97,991 | | | $ | 77,652 | | | $ | 100,987 | | | $ | 74,109 | | | $ | 35,277 | |
| |
Ratios to average net assets:3 | | | | | | | | | | | | | | | | | | | | |
| Net investment income | | | 2.15 | %4 | | | 0.50 | % | | | 0.65 | % | | | 4.15 | % | | | 3.46 | % |
Total expenses5 | | | 1.27 | %4 | | | 1.35 | % | | | 1.21 | % | | | 1.15 | % | | | 1.19 | % |
| Expenses after payments, waivers and/or reimbursements and reduction to custodian expenses | | | 1.27 | %4 | | | 1.35 | % | | | 1.21 | % | | | 1.15 | % | | | 1.19 | % |
| |
| Portfolio turnover rate | | | 36 | % | | | 21 | % | | | 14 | % | | | 10 | % | | | 5 | % |
| | |
| 1. | | Per share amounts calculated based on the average shares outstanding during the period. |
| |
| 2. | | Assumes an initial investment on the business day before the first day of the fiscal period, with all dividends and distributions reinvested in additional shares on the reinvestment date, and redemption at the net asset value calculated on the last business day of the fiscal period. Sales charges are not reflected in the total returns. Total returns are not annualized for periods less than one full year. Returns do not reflect the deduction of taxes that a shareholder would pay on fund distributions or the redemption of fund shares. |
| |
| 3. | | Annualized for periods less than one full year. |
| |
| 4. | | Includes the Fund’s share of the allocated expenses and/or net investment income from Oppenheimer Master Inflation Protected Securities Fund, LLC. |
| |
| 5. | | Total expenses including all underlying fund expenses were as follows: |
| | | | | |
|
| Year Ended January 31, 2011 | | | 1.88 | % |
| Year Ended January 31, 2010 | | | 1.95 | % |
| Year Ended January 31, 2009 | | | 1.76 | % |
| Year Ended January 31, 2008 | | | 1.71 | % |
| Year Ended January 31, 2007 | | | 1.79 | % |
See accompanying Notes to Financial Statements.
29 | CONSERVATIVE INVESTOR FUND
FINANCIAL HIGHLIGHTS Continued
| | | | | | | | | | | | | | | | | | | | | |
| Class N Year Ended January 31, | | 2011 | | | 2010 | | | 2009 | | | 2008 | | | 2007 | |
| |
Per Share Operating Data | | | | | | | | | | | | | | | | | | | | |
| |
| Net asset value, beginning of period | | $ | 7.36 | | | $ | 6.20 | | | $ | 10.70 | | | $ | 10.90 | | | $ | 10.51 | |
| |
| Income (loss) from investment operations: | | | | | | | | | | | | | | | | | | | | |
Net investment income1 | | | .20 | | | | .03 | | | | .10 | | | | .53 | | | | .44 | |
| Net realized and unrealized gain (loss) | | | .72 | | | | 1.18 | | | | (4.19 | ) | | | (.26 | ) | | | .28 | |
| | | |
| Total from investment operations | | | .92 | | | | 1.21 | | | | (4.09 | ) | | | .27 | | | | .72 | |
| |
| Dividends and/or distributions to shareholders: | | | | | | | | | | | | | | | | | | | | |
| Dividends from net investment income | | | (.19 | ) | | | (.05 | ) | | | (.10 | ) | | | (.41 | ) | | | (.31 | ) |
| Distributions from net realized gain | | | — | | | | — | | | | (.11 | ) | | | (.06 | ) | | | (.02 | ) |
| Tax return of capital distribution | | | — | | | | — | | | | (.20 | ) | | | — | | | | — | |
| | | |
| Total dividends and/or distributions to shareholders | | | (.19 | ) | | | (.05 | ) | | | (.41 | ) | | | (.47 | ) | | | (.33 | ) |
| |
| |
| Net asset value, end of period | | $ | 8.09 | | | $ | 7.36 | | | $ | 6.20 | | | $ | 10.70 | | | $ | 10.90 | |
| | | |
| | | | | | | | | | | | | | | | | | | | | |
Total Return, at Net Asset Value2 | | | 12.55 | % | | | 19.55 | % | | | (38.40 | )% | | | 2.43 | % | | | 6.84 | % |
| | | | | | | | | | | | | | | | | | | | | |
Ratios/Supplemental Data | | | | | | | | | | | | | | | | | | | | |
| |
| Net assets, end of period (in thousands) | | $ | 54,286 | | | $ | 54,890 | | | $ | 46,872 | | | $ | 58,762 | | | $ | 21,277 | |
| |
| Average net assets (in thousands) | | $ | 54,933 | | | $ | 50,202 | | | $ | 59,625 | | | $ | 37,891 | | | $ | 13,671 | |
| |
Ratios to average net assets:3 | | | | | | | | | | | | | | | | | | | | |
| Net investment income | | | 2.63 | %4 | | | 0.45 | % | | | 1.09 | % | | | 4.74 | % | | | 4.08 | % |
Total expenses5 | | | 0.81 | %4 | | | 0.96 | % | | | 0.76 | % | | | 0.66 | % | | | 0.66 | % |
| Expenses after payments, waivers and/or reimbursements and reduction to custodian expenses | | | 0.79 | %4 | | | 0.88 | % | | | 0.76 | % | | | 0.66 | % | | | 0.66 | % |
| |
| Portfolio turnover rate | | | 36 | % | | | 21 | % | | | 14 | % | | | 10 | % | | | 5 | % |
| | |
| 1. | | Per share amounts calculated based on the average shares outstanding during the period. |
| |
| 2. | | Assumes an initial investment on the business day before the first day of the fiscal period, with all dividends and distributions reinvested in additional shares on the reinvestment date, and redemption at the net asset value calculated on the last business day of the fiscal period. Sales charges are not reflected in the total returns. Total returns are not annualized for periods less than one full year. Returns do not reflect the deduction of taxes that a shareholder would pay on fund distributions or the redemption of fund shares. |
| |
| 3. | | Annualized for periods less than one full year. |
| |
| 4. | | Includes the Fund’s share of the allocated expenses and/or net investment income from Oppenheimer Master Inflation Protected Securities Fund, LLC. |
| |
| 5. | | Total expenses including all underlying fund expenses were as follows: |
| | | | | |
|
| Year Ended January 31, 2011 | | | 1.42 | % |
| Year Ended January 31, 2010 | | | 1.56 | % |
| Year Ended January 31, 2009 | | | 1.31 | % |
| Year Ended January 31, 2008 | | | 1.22 | % |
| Year Ended January 31, 2007 | | | 1.26 | % |
See accompanying Notes to Financial Statements.
30 | CONSERVATIVE INVESTOR FUND
| | | | | | | | | | | | | | | | | | | | | |
| Class Y Year Ended January 31, | | 2011 | | | 2010 | | | 2009 | | | 2008 | | | 2007 | |
| |
Per Share Operating Data | | | | | | | | | | | | | | | | | | | | |
| Net asset value, beginning of period | | $ | 7.41 | | | $ | 6.25 | | | $ | 10.79 | | | $ | 10.96 | | | $ | 10.54 | |
| |
| Income (loss) from investment operations: | | | | | | | | | | | | | | | | | | | | |
Net investment income (loss)1 | | | .26 | | | | (.05 | ) | | | .18 | | | | .64 | | | | .49 | |
| Net realized and unrealized gain (loss) | | | .72 | | | | 1.31 | | | | (4.25 | ) | | | (.29 | ) | | | .30 | |
| | | |
| Total from investment operations | | | .98 | | | | 1.26 | | | | (4.07 | ) | | | .35 | | | | .79 | |
| |
| Dividends and/or distributions to shareholders: | | | | | | | | | | | | | | | | | | | | |
| Dividends from net investment income | | | (.25 | ) | | | (.10 | ) | | | (.16 | ) | | | (.46 | ) | | | (.35 | ) |
| Distributions from net realized gain | | | — | | | | — | | | | (.11 | ) | | | (.06 | ) | | | (.02 | ) |
| Tax return of capital distribution | | | — | | | | — | | | | (.20 | ) | | | — | | | | — | |
| | | |
| Total dividends and/or distributions to shareholders | | | (.25 | ) | | | (.10 | ) | | | (.47 | ) | | | (.52 | ) | | | (.37 | ) |
| |
| Net asset value, end of period | | $ | 8.14 | | | $ | 7.41 | | | $ | 6.25 | | | $ | 10.79 | | | $ | 10.96 | |
| | | |
| | | | | | | | | | | | | | | | | | | | | |
Total Return, at Net Asset Value2 | | | 13.27 | % | | | 20.17 | % | | | (37.92 | )% | | | 3.15 | % | | | 7.50 | % |
| | | | | | | | | | | | | | | | | | | | | |
Ratios/Supplemental Data | | | | | | | | | | | | | | | | | | | | |
| Net assets, end of period (in thousands) | | $ | 2,047 | | | $ | 963 | | | $ | 475 | | | $ | 604 | | | $ | 135 | |
| |
| Average net assets (in thousands) | | $ | 1,398 | | | $ | 609 | | | $ | 732 | | | $ | 385 | | | $ | 127 | |
| |
Ratios to average net assets:3 | | | | | | | | | | | | | | | | | | | | |
| Net investment income (loss) | | | 3.31 | %4 | | | (0.74 | )% | | | 1.95 | % | | | 5.70 | % | | | 4.57 | % |
Total expenses5 | | | 0.14 | %4 | | | 0.22 | % | | | 0.09 | % | | | 0.01 | % | | | 0.06 | % |
| Expenses after payments, waivers and/or reimbursements and reduction to custodian expenses | | | 0.14 | %4 | | | 0.14 | % | | | 0.09 | % | | | 0.01 | % | | | 0.06 | % |
| |
| Portfolio turnover rate | | | 36 | % | | | 21 | % | | | 14 | % | | | 10 | % | | | 5 | % |
| | |
| 1. | | Per share amounts calculated based on the average shares outstanding during the period. |
| |
| 2. | | Assumes an initial investment on the business day before the first day of the fiscal period, with all dividends and distributions reinvested in additional shares on the reinvestment date, and redemption at the net asset value calculated on the last business day of the fiscal period. Sales charges are not reflected in the total returns. Total returns are not annualized for periods less than one full year. Returns do not reflect the deduction of taxes that a shareholder would pay on fund distributions or the redemption of fund shares. |
| |
| 3. | | Annualized for periods less than one full year. |
| |
| 4. | | Includes the Fund’s share of the allocated expenses and/or net investment income from Oppenheimer Master Inflation Protected Securities Fund, LLC. |
| |
| 5. | | Total expenses including all underlying fund expenses were as follows: |
| | | | | |
|
| Year Ended January 31, 2011 | | | 0.75 | % |
| Year Ended January 31, 2010 | | | 0.82 | % |
| Year Ended January 31, 2009 | | | 0.64 | % |
| Year Ended January 31, 2008 | | | 0.57 | % |
| Year Ended January 31, 2007 | | | 0.66 | % |
See accompanying Notes to Financial Statements.
31 | CONSERVATIVE INVESTOR FUND
NOTES TO FINANCIAL STATEMENTS
1. Significant Accounting Policies
Oppenheimer Portfolio Series (the “Trust”) is registered under the Investment Company Act of 1940, as amended, as an open-end management investment company. Conservative Investor Fund (the “Fund”) is a series of the Trust whose investment objective is to seek current income with a secondary objective of long-term growth of capital. The Fund normally invests in a portfolio consisting of a target weighted allocation in Class Y shares of other Oppenheimer funds. The Fund’s investment adviser is OppenheimerFunds, Inc. (the “Manager”).
The Fund offers Class A, Class B, Class C, Class N and Class Y shares. Class A shares are sold at their offering price, which is normally net asset value plus a front-end sales charge. Class B, Class C and Class N shares are sold without a front-end sales charge but may be subject to a contingent deferred sales charge (“CDSC”). Class N shares are sold only through retirement plans. Retirement plans that offer Class N shares may impose charges on those accounts. Class Y shares are sold to certain institutional investors or intermediaries without either a front-end sales charge or a CDSC, however, the intermediaries may impose charges on their accountholders who beneficially own Y shares. All classes of shares have identical rights and voting privileges with respect to the Fund in general and exclusive voting rights on matters that affect that class alone. Earnings, net assets and net asset value per share may differ due to each class having its own expenses, such as transfer and shareholder servicing agent fees and shareholder communications, directly attributable to that class. Class A, B, C and N have separate distribution and/or service plans under which they pay fees. Class Y shares do not pay such fees. Class B shares will automatically convert to Class A shares 72 months after the date of purchase.
The following is a summary of significant accounting policies consistently followed by the Fund.
Securities Valuation. The Fund calculates the net asset value of its shares based upon the net asset value of the applicable Underlying Fund. For each Underlying Fund, the net asset value per share for a class of shares is determined as of the close of the New York Stock Exchange (the “Exchange”), normally 4:00 P.M. Eastern time, on each day the Exchange is open for trading by dividing the value of the Underlying Fund’s net assets attributable to that class by the number of outstanding shares of that class on that day.
To determine their net asset values, the Underlying Funds’ assets are valued primarily on the basis of current market quotations. In the absence of a readily available unadjusted quoted market price, including for assets whose values have been materially affected by what the Manager identifies as a significant event occurring before the Underlying Fund’s assets are valued but after the close of their respective exchanges, the Manager, acting through its internal valuation committee, in good faith determines the fair valuation of that Underlying Fund’s assets using consistently applied procedures under the supervision of the Board of Trustees. The methodologies used for valuing assets are not necessarily an indication of the risks associated with investing in those Underlying Funds.
Each investment asset or liability of the Fund is assigned a level at measurement date based on the significance and source of the inputs to its valuation. Unadjusted quoted prices in active markets for identical assets or liabilities are classified as “Level 1,” inputs
32 | CONSERVATIVE INVESTOR FUND
other than unadjusted quoted prices for an asset that are observable are classified as “Level 2” and significant unobservable inputs, including the Manager’s judgment about the assumptions that a market participant would use in pricing an asset or liability, are classified as “Level 3.” The inputs used for valuing assets and liabilities are not necessarily an indication of the risks associated with investing in those assets or liabilities. A table summarizing the Fund’s investments under these levels of classification is included following the Statement of Investments.
The Fund classifies each of its investments in the Underlying Funds as Level 1, without consideration as to the classification level of the specific investments held by the Underlying Funds.
There have been no significant changes to the fair valuation methodologies of the Fund during the period.
Risks of Investing in the Underlying Funds. Each of the Underlying Funds in which the Fund invests has its own investment risks, and those risks can affect the value of the Fund’s investments and therefore the value of the Fund’s shares. To the extent that the Fund invests more of its assets in one Underlying Fund than in another, the Fund will have greater exposure to the risks of that Underlying Fund.
Investment in Oppenheimer Institutional Money Market Fund. The Fund is permitted to invest daily available cash balances in an affiliated money market fund. The Fund may invest the available cash in Class E shares of Oppenheimer Institutional Money Market Fund (“IMMF”) to seek current income while preserving liquidity. IMMF is a registered open-end management investment company, regulated as a money market fund under the Investment Company Act of 1940, as amended. The Manager is also the investment adviser of IMMF. When applicable, the Fund’s investment in IMMF is included in the Statement of Investments. As a shareholder, the Fund is subject to its proportional share of IMMF’s Class E expenses, including its management fee.
Investment in Oppenheimer Master Fund. The Fund is permitted to invest in entities sponsored and/or advised by the Manager or an affiliate. Certain of these entities in which the Fund invests are mutual funds registered under the Investment Company Act of 1940 that expect to be treated as partnerships for tax purposes, specifically Oppenheimer Master Inflation Protected Securities Fund, LLC (the “Master Fund”). The Master Fund has its own investment risks, and those risks can affect the value of the Fund’s investments and therefore the value of the Fund’s shares. To the extent that the Fund invests more of its assets in the Master Fund, the Fund will have greater exposure to the risks of the Master Fund.
The investment objective of the Master Fund is to seek total return. The Fund’s investment in the Master Fund is included in the Statement of Investments. The Fund recognizes income and gain/(loss) on its investment in the Master Fund according to its allocated pro-rata share, based on its relative proportion of total outstanding Master Fund shares held, of the total net income earned and the net gain/(loss) realized on investments sold by the Master Fund. As a shareholder, the Fund is subject to its proportional share of the Master Fund’s expenses, including its management fee.
33 | CONSERVATIVE INVESTOR FUND
NOTES TO FINANCIAL STATEMENTS Continued
1. Significant Accounting Policies Continued
Allocation of Income, Expenses, Gains and Losses. Income, expenses (other than those attributable to a specific class), gains and losses are allocated on a daily basis to each class of shares based upon the relative proportion of net assets represented by such class. Operating expenses directly attributable to a specific class are charged against the operations of that class.
Federal Taxes. The Fund intends to comply with provisions of the Internal Revenue Code applicable to regulated investment companies and to distribute substantially all of its investment company taxable income, including any net realized gain on investments not offset by capital loss carryforwards, if any, to shareholders. Therefore, no federal income or excise tax provision is required. The Fund files income tax returns in U.S. federal and applicable state jurisdictions. The statute of limitations on the Fund’s tax return filings generally remain open for the three preceding fiscal reporting period ends.
The tax components of capital shown in the following table represent distribution requirements the Fund must satisfy under the income tax regulations, losses the Fund may be able to offset against income and gains realized in future years and unrealized appreciation or depreciation of securities and other investments for federal income tax purposes.
| | | | | | | | | | | | | |
| | | | | | | | | | | Net Unrealized | |
| | | | | | | | | | | Depreciation | |
| | | | | | | | | | | Based on Cost of | |
| | | | | | | | | | | Securities and | |
| Undistributed | | Undistributed | | | Accumulated | | | Other Investments | |
| Net Investment | | Long-Term | | | Loss | | | for Federal Income | |
| Income | | Gain | | | Carryforward1,2,3 | | | Tax Purposes | |
| |
| $815,017 | | $ | — | | | $ | 58,773,591 | | | $ | 52,369,941 | |
1. As of January 31, 2011, the Fund had $58,773,591 of net capital loss carryforwards available to offset future realized capital gains, if any, and thereby reduce future taxable gain distributions. As of January 31, 2011, details of the capital loss carryforwards were as follows:
| | | | | |
| Expiring | | | | |
| |
| 2018 | | $ | 14,489,934 | |
| 2019 | | | 44,283,657 | |
| | | | |
| Total | | $ | 58,773,591 | |
| | | | |
2. During the fiscal year ended January 31, 2011, the Fund did not utilize any capital loss carryforward.
3. During the fiscal year ended January 31, 2010, the Fund did not utilize any capital loss carryforward.
Net investment income (loss) and net realized gain (loss) may differ for financial statement and tax purposes. The character of dividends and distributions made during the fiscal year from net investment income or net realized gains may differ from their ultimate characterization for federal income tax purposes. Also, due to timing of dividends and distributions, the fiscal year in which amounts are distributed may differ from the fiscal year in which the income or net realized gain was recorded by the Fund.
34 | CONSERVATIVE INVESTOR FUND
Accordingly, the following amounts have been reclassified for January 31, 2011. Net assets of the Fund were unaffected by the reclassifications.
| | | | | |
| | | Reduction | |
| Increase to | | to Accumulated Net | |
| Paid-in Capital | | Investment Income | |
| |
| $61 | | $ | 61 | |
The tax character of distributions paid during the years ended January 31, 2011 and January 31, 2010 was as follows:
| | | | | | | | | |
| | | Year Ended | | | Year Ended | |
| | | January 31, 2011 | | | January 31, 2010 | |
| |
| Distributions paid from: | | | | | | | | |
| Ordinary income | | $ | 9,767,239 | | | $ | 2,430,152 | |
The aggregate cost of securities and other investments and the composition of unrealized appreciation and depreciation of securities and other investments for federal income tax purposes as of January 31, 2011 are noted in the following table. The primary difference between book and tax appreciation or depreciation of securities and other investments, if applicable, is attributable to the tax deferral of losses or tax realization of financial statement unrealized gain or loss.
| | | | | |
|
| Federal tax cost of securities | | $ | 462,766,103 | |
| | | | |
| Gross unrealized appreciation | | $ | 24,556,784 | |
| Gross unrealized depreciation | | | (76,926,725 | ) |
| | | | |
| Net unrealized depreciation | | $ | (52,369,941 | ) |
| | | | |
Trustees’ Compensation. The Fund has adopted an unfunded retirement plan (the “Plan”) for the Fund’s independent trustees. Benefits are based on years of service and fees paid to each trustee during their period of service. The Plan was frozen with respect to adding new participants effective December 31, 2006 (the “Freeze Date”) and existing Plan Participants as of the Freeze Date will continue to receive accrued benefits under the Plan. Active independent trustees as of the Freeze Date have each elected a distribution method with respect to their benefits under the Plan. During the year ended January 31, 2011, the Fund’s projected benefit obligations, payments to retired trustees and accumulated liability were as follows:
| | | | | |
|
| Projected Benefit Obligations Increased | | $ | 101 | |
| Payments Made to Retired Trustees | | | 1,858 | |
| Accumulated Liability as of January 31, 2011 | | | 13,932 | |
The Board of Trustees has adopted a compensation deferral plan for independent trustees that enables trustees to elect to defer receipt of all or a portion of the annual compensation they are entitled to receive from the Fund. For purposes of determining the amount owed to the Trustee under the plan, deferred amounts are treated as though equal dollar amounts had been invested in shares of the Fund or in other Oppenheimer funds selected by the Trustee. The Fund purchases shares of the funds selected for deferral by the Trustee in amounts equal to his or her deemed investment,
35 | CONSERVATIVE INVESTOR FUND
NOTES TO FINANCIAL STATEMENTS Continued
1. Significant Accounting Policies Continued
resulting in a Fund asset equal to the deferred compensation liability. Such assets are included as a component of “Other” within the asset section of the Statement of Assets and Liabilities. Deferral of trustees’ fees under the plan will not affect the net assets of the Fund, and will not materially affect the Fund’s assets, liabilities or net investment income per share. Amounts will be deferred until distributed in accordance with the compensation deferral plan.
Dividends and Distributions to Shareholders. Dividends and distributions to shareholders, which are determined in accordance with income tax regulations and may differ from U.S. generally accepted accounting principles, are recorded on the ex-dividend date. Income and capital gain distributions, if any, are declared and paid annually or at other times as deemed necessary by the Manager.
Investment Income. Dividend distributions received from the Underlying Funds are recorded on the ex-dividend date. Upon receipt of notification from an Underlying Fund, and subsequent to the ex-dividend date, some of the dividend income originally recorded by the Fund may be reclassified as a tax return of capital by reducing the cost basis of the Underlying Fund and/or increasing the realized gain on sales of investments in the Underlying Fund.
Custodian Fees. “Custodian fees and expenses” in the Statement of Operations may include interest expense incurred by the Fund on any cash overdrafts of its custodian account during the period. Such cash overdrafts may result from the effects of failed trades in portfolio securities and from cash outflows resulting from unanticipated shareholder redemption activity. The Fund pays interest to its custodian on such cash overdraft at a rate equal to the 1 Month LIBOR Rate plus 2.00%. The “Reduction to custodian expenses” line item, if applicable, represents earnings on cash balances maintained by the Fund during the period. Such interest expense and other custodian fees may be paid with these earnings.
Security Transactions. Security transactions are recorded on the trade date. Realized gains and losses on securities sold are determined on the basis of identified cost.
Indemnifications. The Fund’s organizational documents provide current and former trustees and officers with a limited indemnification against liabilities arising in connection with the performance of their duties to the Fund. In the normal course of business, the Fund may also enter into contracts that provide general indemnifications. The Fund’s maximum exposure under these arrangements is unknown as this would be dependent on future claims that may be made against the Fund. The risk of material loss from such claims is considered remote.
Other. The preparation of financial statements in conformity with accounting principles generally accepted in the United States of America requires management to make estimates and assumptions that affect the reported amounts of assets and liabilities and
36 | CONSERVATIVE INVESTOR FUND
disclosure of contingent assets and liabilities at the date of the financial statements and the reported amounts of increases and decreases in net assets from operations during the reporting period. Actual results could differ from those estimates.
2. Shares of Beneficial Interest
The Fund has authorized an unlimited number of $0.001 par value shares of beneficial interest of each class. Transactions in shares of beneficial interest were as follows:
| | | | | | | | | | | | | | | | | |
| | | Year Ended January 31, 2011 | | | Year Ended January 31, 2010 | |
| | | Shares | | | Amount | | | Shares | | | Amount | |
Class A | | | | | | | | | | | | | | | | |
| Sold | | | 10,985,203 | | | $ | 85,713,088 | | | | 8,550,982 | | | $ | 58,122,878 | |
| Dividends and/or | | | | | | | | | | | | | | | | |
| distributions reinvested | | | 676,636 | | | | 5,461,606 | | | | 213,721 | | | | 1,594,373 | |
| Redeemed | | | (7,298,815 | ) | | | (57,074,056 | ) | | | (8,748,325 | ) | | | (57,821,889 | ) |
| | | |
| Net increase | | | 4,363,024 | | | $ | 34,100,638 | | | | 16,378 | | | $ | 1,895,362 | |
| | | |
| | | | | | | | | | | | | | | | | |
Class B | | | | | | | | | | | | | | | | |
| Sold | | | 1,056,883 | | | $ | 8,193,051 | | | | 1,529,708 | | | $ | 10,290,774 | |
| Dividends and/or | | | | | | | | | | | | | | | | |
| distributions reinvested | | | 69,321 | | | | 555,955 | | | | 7,038 | | | | 52,144 | |
| Redeemed | | | (1,153,949 | ) | | | (8,924,481 | ) | | | (1,776,292 | ) | | | (11,657,024 | ) |
| | | |
| Net decrease | | | (27,745 | ) | | $ | (175,475 | ) | | | (239,546 | ) | | $ | (1,314,106 | ) |
| | | |
| | | | | | | | | | | | | | | | | |
Class C | | | | | | | | | | | | | | | | |
| Sold | | | 4,588,839 | | | $ | 35,360,610 | | | | 5,326,969 | | | $ | 35,510,868 | |
| Dividends and/or | | | | | | | | | | | | | | | | |
| distributions reinvested | | | 248,510 | | | | 1,988,073 | | | | 33,654 | | | | 249,159 | |
| Redeemed | | | (3,529,884 | ) | | | (27,378,149 | ) | | | (5,363,793 | ) | | | (34,993,723 | ) |
| | | |
| Net increase (decrease) | | | 1,307,465 | | | $ | 9,970,534 | | | | (3,170 | ) | | $ | 766,304 | |
| | | |
| | | | | | | | | | | | | | | | | |
Class N | | | | | | | | | | | | | | | | |
| Sold | | | 2,439,740 | | | $ | 18,936,108 | | | | 3,310,518 | | | $ | 22,171,491 | |
| Dividends and/or | | | | | | | | | | | | | | | | |
| distributions reinvested | | | 136,435 | | | | 1,095,707 | | | | 45,133 | | | | 334,888 | |
| Redeemed | | | (3,324,875 | ) | | | (25,815,604 | ) | | | (3,450,117 | ) | | | (23,078,849 | ) |
| | | |
| Net decrease | | | (748,700 | ) | | $ | (5,783,789 | ) | | | (94,466 | ) | | $ | (572,470 | ) |
| | | |
| | | | | | | | | | | | | | | | | |
Class Y | | | | | | | | | | | | | | | | |
| Sold | | | 241,221 | | | $ | 1,882,522 | | | | 103,489 | | | $ | 729,170 | |
| Dividends and/or | | | | | | | | | | | | | | | | |
| distributions reinvested | | | 7,578 | | | | 61,306 | | | | 1,524 | | | | 11,383 | |
| Redeemed | | | (127,331 | ) | | | (999,557 | ) | | | (51,203 | ) | | | (339,414 | ) |
| | | |
| Net increase | | | 121,468 | | | $ | 944,271 | | | | 53,810 | | | $ | 401,139 | |
| | | |
37 | CONSERVATIVE INVESTOR FUND
NOTES TO FINANCIAL STATEMENTS Continued
3. Purchases and Sales of Securities
The aggregate cost of purchases and proceeds from sales of securities, other than short-term obligations and investments in IMMF, for the year ended January 31, 2011, were as follows:
| | | | | | | | | |
| | | Purchases | | | Sales | |
| |
| Investment securities | | $ | 151,541,164 | | | $ | 129,532,265 | |
4. Fees and Other Transactions with Affiliates
Management Fees. Under the investment advisory agreement, the Manager does not charge a management fee, but rather collects indirect management fees from the Fund’s investments in the Underlying Funds and in IMMF. The weighted indirect management fees collected from the Fund’s investment in the Underlying Funds and in IMMF, as a percent of average daily net assets of the Fund for the year ended January 31, 2011 was 0.52%. This amount is gross of any waivers or reimbursements of management fees implemented at the Underlying Fund level.
Administration Service Fees. The Fund pays the Manager a fee of $1,500 per year for preparing and filing the Fund’s tax returns.
Transfer Agent Fees. OppenheimerFunds Services (“OFS”), a division of the Manager, acts as the transfer and shareholder servicing agent for the Fund. The Fund pays OFS a per account fee. For the year ended January 31, 2011, the Fund paid $824,630 to OFS for services to the Fund.
Additionally, Class Y shares are subject to minimum fees of $10,000 annually for assets of $10 million or more. The Class Y shares are subject to the minimum fees in the event that the per account fee does not equal or exceed the applicable minimum fees. OFS may voluntarily waive the minimum fees.
Distribution and Service Plan (12b-1) Fees. Under its General Distributor’s Agreement with the Fund, OppenheimerFunds Distributor, Inc. (the “Distributor”) acts as the Fund’s principal underwriter in the continuous public offering of the Fund’s classes of shares.
Service Plan for Class A Shares. The Fund has adopted a Service Plan (the “Plan”) for Class A shares under Rule 12b-1 of the Investment Company Act of 1940. Under the Plan, the Fund reimburses the Distributor for a portion of its costs incurred for services provided to accounts that hold Class A shares. Reimbursement is made periodically at an annual rate of up to 0.25% of the daily net assets of Class A shares of the Fund. The Distributor currently uses all of those fees to pay dealers, brokers, banks and other financial institutions periodically for providing personal service and maintenance of accounts of their customers that hold Class A shares. Any unreimbursed expenses the Distributor incurs with respect to Class A shares in any fiscal year cannot be recovered in subsequent periods. Fees incurred by the Fund under the Plan are detailed in the Statement of Operations.
Distribution and Service Plans for Class B, Class C and Class N Shares. The Fund has adopted Distribution and Service Plans (the “Plans”) for Class B, Class C and Class N shares under Rule 12b-1 of the Investment Company Act of 1940 to compensate the Distributor
38 | CONSERVATIVE INVESTOR FUND
for its services in connection with the distribution of those shares and servicing accounts. Under the Plans, the Fund pays the Distributor an annual asset-based sales charge of 0.75% on Class B and Class C shares daily net assets and 0.25% on Class N shares daily net assets. The Distributor also receives a service fee of 0.25% per year under each plan. If either the Class B, Class C or Class N plan is terminated by the Fund or by the shareholders of a class, the Board of Trustees and its independent trustees must determine whether the Distributor shall be entitled to payment from the Fund of all or a portion of the service fee and/or asset-based sales charge in respect to shares sold prior to the effective date of such termination. Fees incurred by the Fund under the Plans are detailed in the Statement of Operations. The Distributor determines its uncompensated expenses under the Plans at calendar quarter ends. The Distributor’s aggregate uncompensated expenses under the Plans at December 31, 2010 were as follows:
| | | | | |
| Class B | | $ | 323,444 | |
| Class C | | | 1,232,204 | |
| Class N | | | 1,042,595 | |
Sales Charges. Front-end sales charges and contingent deferred sales charges (“CDSC”) do not represent expenses of the Fund. They are deducted from the proceeds of sales of Fund shares prior to investment or from redemption proceeds prior to remittance, as applicable. The sales charges retained by the Distributor from the sale of shares and the CDSC retained by the Distributor on the redemption of shares is shown in the following table for the period indicated.
| | | | | | | | | | | | | | | | | | | | | |
| | | | | | | Class A | | | Class B | | | Class C | | | Class N | |
| | | Class A | | | Contingent | | | Contingent | | | Contingent | | | Contingent | |
| | | Front-End | | | Deferred | | | Deferred | | | Deferred | | | Deferred | |
| | | Sales Charges | | | Sales Charges | | | Sales Charges | | | Sales Charges | | | Sales Charges | |
| | | Retained by | | | Retained by | | | Retained by | | | Retained by | | | Retained by | |
| Year Ended | | Distributor | | | Distributor | | | Distributor | | | Distributor | | | Distributor | |
| |
| January 31, 2011 | | $ | 257,928 | | | $ | 6,588 | | | $ | 92,249 | | | $ | 23,297 | | | $ | 2,088 | |
Waivers and Reimbursements of Expenses. The Manager has voluntarily agreed to waive fees and/or reimburse the Fund for certain expenses so that “Total expenses”, (the combined direct (Fund level) and indirect (Underlying Fund level) expenses), will not exceed the annual rate of 1.25%, 2.00%, 2.00%, 1.50% and 1.00%, for Class A, Class B, Class C, Class N and Class Y, respectively. During the year ended January 31, 2011, the Manager waived fees and/or reimbursed the Fund $1,939 and $8,229 for Class B and Class N shares, respectively. The expense limitations do not include extraordinary expenses and other expenses not incurred in the ordinary course of the Fund’s business. This limitation will be applied after giving effect to any reimbursements by the Distributor of 12b-1 fees paid by the Fund with respect to investments in Class A shares of any Underlying Funds that do not offer Class Y shares. Notwithstanding the foregoing limits, the Manager is not required to waive or reimburse Fund expenses in excess of the amount of indirect management fees earned from investments in the Underlying Funds and IMMF.
39 | CONSERVATIVE INVESTOR FUND
NOTES TO FINANCIAL STATEMENTS Continued
4. Fees and Other Transactions with Affiliates Continued
The Distributor reimbursed Fund expenses in an amount equal to the distribution and service plan fees incurred through the Fund’s investment in the Class A shares of Oppenheimer Gold & Special Minerals Fund which, for the year ended January 31, 2011 was $2,251.
OFS has voluntarily agreed to limit transfer and shareholder servicing agent fees for all classes to 0.35% of average annual net assets per class.
During the year ended January 31, 2011, OFS waived transfer and shareholder servicing agent fees as follows:
Some of these undertakings may be modified or terminated at any time; some may not be modified or terminated until after one year from the date of the current prospectus, as indicated therein.
5. Pending Litigation
Since 2009, a number of lawsuits have been pending in federal courts against the Manager, the Distributor, and certain mutual funds (“Defendant Funds”) advised by the Manager and distributed by the Distributor (but not including the Fund). The lawsuits naming the Defendant Funds also name as defendants certain officers and current and former trustees of the respective Defendant Funds. The plaintiffs seek class action status on behalf of purchasers of shares of the respective Defendant Fund during a particular time period. The lawsuits raise claims under federal securities laws alleging that, among other things, the disclosure documents of the respective Defendant Fund contained misrepresentations and omissions, that such Defendant Fund’s investment policies were not followed, and that such Defendant Fund and the other defendants violated federal securities laws and regulations. The plaintiffs seek unspecified damages, equitable relief and an award of attorneys’ fees and litigation expenses.
In 2009, what are claimed to be derivative lawsuits were filed in state court against the Manager and a subsidiary (but not against the Fund), on behalf of the New Mexico Education Plan Trust. These lawsuits allege breach of contract, breach of fiduciary duty, negligence and violation of state securities laws, and seek compensatory damages, equitable relief and an award of attorneys’ fees and litigation expenses.
Other lawsuits have been filed since 2008 in various state and federal courts, against the Manager and certain of its affiliates. Those lawsuits were filed by investors who made investments through an affiliate of the Manager, and relate to the alleged investment fraud perpetrated by Bernard Madoff and his firm (“Madoff”). Those suits allege a variety of claims, including breach of fiduciary duty, fraud, negligent misrepresentation, unjust enrichment, and violation of federal and state securities laws and regulations, among others. They seek unspecified damages, equitable relief and an award of attorneys’ fees and litigation expenses.
40 | CONSERVATIVE INVESTOR FUND
None of the suits have named the Distributor, any of the Oppenheimer mutual funds or any of their independent Trustees or Directors as defendants. None of the Oppenheimer funds invested in any funds or accounts managed by Madoff.
The Manager believes that the lawsuits described above are without legal merit and is defending against them vigorously. The Defendant Funds’ Boards of Trustees have also engaged counsel to defend the suits brought against those Funds and the present and former Independent Trustees named in those suits. While it is premature to render any opinion as to the outcome in these lawsuits, or whether any costs that the Defendant Funds may bear in defending the suits might not be reimbursed by insurance, the Manager believes that these suits should not impair the ability of the Manager or the Distributor to perform their respective duties to the Fund, and that the outcome of all of the suits together should not have any material effect on the operations of any of the Oppenheimer funds.
6. Subsequent Event
The Regulated Investment Company Modernization Act of 2010 (the “Act”) was signed into law on December 22, 2010. The Act makes changes to a number of tax rules impacting the Fund. Under the Act, future capital losses generated by a fund may be carried over indefinitely, but these losses must be used prior to the utilization of any pre-enactment capital losses. Since pre-enactment capital losses may only be carried forward for eight years, there may be a greater likelihood that all or a portion of a fund’s pre-enactment capital losses will expire unused. In general, the provisions of the Act will be effective for the Fund’s fiscal year ending 2012. Specific information regarding the impact of the Act on the Fund will be contained within the “Federal Taxes” section of the financial statement notes for the fiscal year ending 2012.
41 | CONSERVATIVE INVESTOR FUND
REPORT OF INDEPENDENT REGISTERED PUBLIC ACCOUNTING FIRM
The Board of Trustees and Shareholders of Oppenheimer Portfolio Series:
We have audited the accompanying statement of assets and liabilities of Conservative Investor Fund (one of portfolios constituting the Oppenheimer Portfolio Series), including the statement of investments, as of January 31, 2011, the related statement of operations for the year then ended, the statements of changes in net assets for each of the years in the two-year period then ended, and the financial highlights for each of the years in the five-year period then ended. These financial statements and financial highlights are the responsibility of the Fund’s management. Our responsibility is to express an opinion on these financial statements and financial highlights based on our audits.
We conducted our audits in accordance with the standards of the Public Company Accounting Oversight Board (United States). Those standards require that we plan and perform the audit to obtain reasonable assurance about whether the financial statements and financial highlights are free of material misstatement. An audit includes examining, on a test basis, evidence supporting the amounts and disclosures in the financial statements. Our procedures included confirmation of securities owned as of January 31, 2011, by correspondence with the transfer agent of the underlying Funds. An audit also includes assessing the accounting principles used and significant estimates made by management, as well as evaluating the overall financial statement presentation. We believe that our audits provide a reasonable basis for our opinion.
In our opinion, the financial statements and financial highlights referred to above present fairly, in all material respects, the financial position of Conservative Investor Fund as of January 31, 2011, the results of its operations for the year then ended, the changes in its net assets for each of the years in the two-year period then ended, and the financial highlights for each of the years in the five-year period then ended, in conformity with U.S. generally accepted accounting principles.
KPMG llp
Denver, Colorado
March 16, 2011
42 | CONSERVATIVE INVESTOR FUND
FEDERAL INCOME TAX INFORMATION Unaudited
In early 2011, if applicable, shareholders of record received information regarding all dividends and distributions paid to them by the Fund during calendar year 2010. Regulations of the U.S. Treasury Department require the Fund to report this information to the Internal Revenue Service.
Dividends, if any, paid by the Fund during the fiscal year ended January 31, 2011 which are not designated as capital gain distributions should be multiplied by the maximum amount allowable but not less than 5.87% to arrive at the amount eligible for the corporate dividend-received deduction.
A portion, if any, of the dividends paid by the Fund during the fiscal year ended January 31, 2011 which are not designated as capital gain distributions are eligible for lower individual income tax rates to the extent that the Fund has received qualified dividend income as stipulated by recent tax legislation. The maximum amount allowable but not less than $759,907 of the Fund’s fiscal year taxable income may be eligible for the lower individual income tax rates. In early 2011, shareholders of record received information regarding the percentage of distributions that are eligible for lower individual income tax rates.
The foregoing information is presented to assist shareholders in reporting distributions received from the Fund to the Internal Revenue Service. Because of the complexity of the federal regulations which may affect your individual tax return and the many variations in state and local tax regulations, we recommend that you consult your tax advisor for specific guidance.
43 | CONSERVATIVE INVESTOR FUND
BOARD APPROVAL OF THE FUND’S INVESTMENT ADVISORY AGREEMENT Unaudited
Each year, the Board of Trustees (the “Board”), including a majority of the independent Trustees, is required to determine whether to renew the Fund’s investment advisory agreement (the “Agreement”). The Investment Company Act of 1940, as amended, requires that the Board request and evaluate, and that the Manager provide, such information as may be reasonably necessary to evaluate the terms of the Agreement. The Board employs an independent consultant to prepare a report that provides information, including comparative information, that the Board requests for that purpose. In addition, the Board receives information throughout the year regarding Fund services, fees, expenses and performance.
The Manager and the independent consultant provided information to the Board on the following factors: (i) the nature, quality and extent of the Manager’s services, (ii) the investment performance of the Fund and the Manager, (iii) the fees and expenses of the Fund, including comparative expense information, (iv) the profitability of the Manager and its affiliates, including an analysis of the cost of providing services, (v) whether economies of scale are realized as the Fund grows and whether fee levels reflect these economies of scale for Fund investors and (vi) other benefits to the Manager from its relationship with the Fund. The Board was aware that there are alternatives to retaining the Manager.
Outlined below is a summary of the principal information considered by the Board as well as the Board’s conclusions.
Nature, Quality and Extent of Services. The Board considered information about the nature, quality and extent of the services provided to the Fund and information regarding the Manager’s key personnel who provide such services. The Manager’s duties include providing the Fund with the services of the portfolio managers and the Manager’s asset allocation team, who provide research, analysis and other advisory services in regard to the Fund’s investments; oversight of third-party service providers; monitoring compliance with applicable Fund policies and procedures and adherence to the Fund’s investment restrictions. The Manager is responsible for providing certain administrative services to the Fund as well. Those services include providing and supervising all administrative and clerical personnel who are necessary in order to provide effective corporate administration for the Fund; compiling and maintaining records with respect to the Fund’s operations; preparing and filing reports required by the Securities and Exchange Commission; preparing periodic reports regarding the operations of the Fund for its shareholders; preparing proxy materials for shareholder meetings; and preparing the registration statements required by Federal and state securities laws for the sale of the Fund’s shares. The Manager also provides the Fund with office space, facilities and equipment.
44 | CONSERVATIVE INVESTOR FUND
The Board also considered the quality of the services provided and the quality of the Manager’s resources that are available to the Fund. The Board took account of the fact that the Manager has had over fifty years of experience as an investment adviser and that its assets under management rank it among the top mutual fund managers in the United States. The Board evaluated the Manager’s advisory, administrative, accounting, legal and compliance services, and information the Board has received regarding the experience and professional qualifications of the Manager’s key personnel and the size and functions of its staff. In its evaluation of the quality of the portfolio management services provided, the Board considered the experience of Alan Gilston, Caleb Wong and effective June 2010, Krishna Memani, the portfolio managers for the Fund, and the experience of the portfolio managers and the investment performance of the investment companies in which the Fund may invest (the “Underlying Funds”). The Board members also considered the totality of their experiences with the Manager as directors or trustees of the Fund and other funds advised by the Manager. The Board considered information regarding the quality of services provided by affiliates of the Manager, which its members have become knowledgeable about in connection with the renewal of the Fund’s service agreements. The Board concluded, in light of the Manager’s experience, reputation, personnel, operations and resources, that the Fund benefits from the services provided under the Agreement.
Investment Performance of the Manager and the Fund. Throughout the year, the Manager provided information on the investment performance of the Fund and the Manager, including comparative performance information. The Board also reviewed information, prepared by the Manager and by the independent consultant, comparing the Fund’s historical performance to relevant market indices and to the performance of other retail front-end load and no-load mixed-asset target allocation conservative fund of funds (including both fund of funds advised by the Manager and fund of funds advised by other investment advisers). The Board noted that the Fund’s one-year and three-year performance was below its peer group median.
Costs of Services by the Manager. The Board reviewed the fees paid to the Manager and its affiliates and the other expenses borne by the Fund. The Board noted that the Fund does not pay a direct management fee but that the Fund indirectly bears its share of the management fees of the Underlying Funds. The Board also considered the comparability of the fees charged and the services provided to the Fund to the fees and services for other clients or accounts advised by the Manager. The independent consultant provided comparative data in regard to the fees and expenses of the Fund and other retail front-end load mixed-asset target allocation conservative fund of funds with comparable asset levels and distribution features. The Board noted that the Fund’s total expenses were
45 | CONSERVATIVE INVESTOR FUND
BOARD APPROVAL OF THE FUND’S INVESTMENT ADVISORY AGREEMENT Unaudited / Continued
lower than its peer group median and average. The Board also noted that the Manager has voluntarily agreed to waive fees and /or reimburse the Fund for certain expenses so that the “Total Expenses”, as a percentage of average net assets, (the combined direct (Fund level) and indirect (Underlying Fund level) expenses), will not exceed the annual rate of 1.25% for Class A, 2.00% for Class B and Class C, 1.50% for Class N and 1.00% for Class Y. The Manager may modify or terminate this undertaking at any time without notice to shareholders.
Economies of Scale and Profits Realized by the Manager. The Board considered information regarding the Manager’s costs in serving as the Fund’s investment adviser, including the costs associated with the personnel and systems necessary to manage the Fund, and information regarding the Manager’s profitability from its relationship with the Fund. The Board reviewed whether the Manager may realize economies of scale in managing and supporting the Fund and the Underlying Funds, and the extent to which those economies of scale would benefit the Fund’s shareholders.
Other Benefits to the Manager. In addition to considering the profits realized by the Manager, the Board considered information that was provided regarding the direct and indirect benefits the Manager receives as a result of its relationship with the Fund, including compensation paid to the Manager’s affiliates. The Board also considered that the Manager must be able to pay and retain experienced professional personnel at competitive rates to provide quality services to the Fund.
Conclusions. These factors were also considered by the independent Trustees meeting separately from the full Board, assisted by experienced counsel to the Fund and to the independent Trustees. Fund counsel and the independent Trustees’ counsel are independent of the Manager within the meaning and intent of the Securities and Exchange Commission Rules.
Based on its review of the information it received and its evaluations described above, the Board, including a majority of the independent Trustees, decided to continue the Agreement through September 30, 2011. In arriving at this decision, the Board did not single out any factor or factors as being more important than others, but considered all of the above information, and considered the terms and conditions of the Agreement, in light of all of the surrounding circumstances.
46 | CONSERVATIVE INVESTOR FUND
PORTFOLIO PROXY VOTING POLICIES AND PROCEDURES; UPDATES TO STATEMENTS OF INVESTMENTS Unaudited
The Fund has adopted Portfolio Proxy Voting Policies and Procedures under which the Fund votes proxies relating to securities (“portfolio proxies”) held by the Fund. A description of the Fund’s Portfolio Proxy Voting Policies and Procedures is available (i) without charge, upon request, by calling the Fund toll-free at 1.800.525.7048, (ii) on the Fund’s website at www.oppenheimerfunds.com, and (iii) on the SEC’s website at www.sec.gov. In addition, the Fund is required to file Form N-PX, with its complete proxy voting record for the 12 months ended June 30th, no later than August 31st of each year. The Fund’s voting record is available (i) without charge, upon request, by calling the Fund toll-free at 1.800.525.7048, and (ii) in the Form N-PX filing on the SEC’s website at www.sec.gov.
The Fund files its complete schedule of portfolio holdings with the SEC for the first quarter and the third quarter of each fiscal year on Form N-Q. The Fund’s Form N-Q filings are available on the SEC’s website at www.sec.gov. Those forms may be reviewed and copied at the SEC’s Public Reference Room in Washington D.C. Information on the operation of the Public Reference Room may be obtained by calling 1-800-SEC-0330.
Householding—Delivery of Shareholder Documents
This is to inform you about OppenheimerFunds’ “householding” policy. If more than one member of your household maintains an account in a particular fund, OppenheimerFunds will mail only one copy of the fund’s prospectus (or, if available, the fund’s summary prospectus), annual and semiannual report and privacy policy. The consolidation of these mailings, called householding, benefits your fund through reduced mailing expense, and benefits you by reducing the volume of mail you receive from OppenheimerFunds. Householding does not affect the delivery of your account statements.
Please note that we will continue to household these mailings for as long as you remain an OppenheimerFunds shareholder, unless you request otherwise. If you prefer to receive multiple copies of these materials, please call us at 1.800.CALL-OPP (225-5677). You may also notify us in writing or via email. We will begin sending you individual copies of the prospectus (or, if available, the summary prospectus), reports and privacy policy within 30 days of receiving your request to stop householding.
47 | CONSERVATIVE INVESTOR FUND
TRUSTEES AND OFFICERS Unaudited
| | | |
| Name, Position(s) Held with the | | Principal Occupation(s) During the Past 5 Years; Other Trusteeships/Directorships |
| Fund, Length of Service, Age | | Held; Number of Portfolios in the Fund Complex Currently Overseen |
| | | |
INDEPENDENT
TRUSTEES | | The address of each Trustee in the chart below is 6803 S. Tucson Way, Centennial, Colorado 80112-3924. Each Trustee serves for an indefinite term, or until his or her resignation, retirement, death or removal. |
| | | |
Brian F. Wruble,
Chairman of the Board of
Trustees (since 2007) and
Trustee (since 2005)
Age: 67 | | Chairman (since August 2007) and Trustee (since August 1991) of the Board of Trustees of The Jackson Laboratory (non-profit); Director of Special Value Opportunities Fund, LLC (registered investment company) (affiliate of the Manager’s parent company) (since September 2004); Member of Zurich Financial Investment Management Advisory Council (insurance) (since 2004); Treasurer (since 2007) and Trustee of the Institute for Advanced Study (non-profit educational institute) (since May 1992); General Partner of Odyssey Partners, L.P. (hedge fund) (September 1995-December 2007); Special Limited Partner of Odyssey Investment Partners, LLC (private equity investment) (January 1999- September 2004). Oversees 59 portfolios in the OppenheimerFunds complex. Mr. Wruble has served on the Boards of certain Oppenheimer funds since April 2001, during which time he has become familiar with the Fund’s (and other Oppenheimer funds’) financial, accounting, regulatory and investment matters and has contributed to the Boards’ deliberations. |
| | | |
David K. Downes,
Trustee (since 2007)
Age: 71 | | Director of THL Credit Inc. (since June 2009); Independent Chairman GSK Employee Benefit Trust (since April 2006); Trustee of Employee Trusts (since January 2006); Chief Executive Officer and Board Member of Community Capital Management (investment management company) (since January 2004); President of The Community Reinvestment Act Qualified Investment Fund (investment management company) (since 2004); Director of Internet Capital Group (information technology company) (since October 2003); Director of Correctnet (January 2006-2007); Independent Chairman of the Board of Trustees of Quaker Investment Trust (registered investment company) (2004-2007); Chief Operating Officer and Chief Financial Officer of Lincoln National Investment Companies, Inc. (subsidiary of Lincoln National Corporation, a publicly traded company) and Delaware Investments U.S., Inc. (investment management subsidiary of Lincoln National Corporation) (1993-2003); President, Chief Executive Officer and Trustee of Delaware Investment Family of Funds (1993-2003); President and Board Member of Lincoln National Convertible Securities Funds, Inc. and the Lincoln National Income Funds, TDC (1993-2003); Chairman and Chief Executive Officer of Retirement Financial Services, Inc. (registered transfer agent and investment adviser and subsidiary of Delaware Investments U.S., Inc.) (1993-2003); President and Chief Executive Officer of Delaware Service Company, Inc. (1995-2003); Chief Administrative Officer, Chief Financial Officer, Vice Chairman and Director of Equitable Capital Management Corporation (investment subsidiary of Equitable Life Assurance Society) (1985-1992); Corporate Controller of Merrill Lynch Company (financial services holding company) (1977-1985); held the following positions at the Colonial Penn Group, Inc. (insurance company): Corporate Budget Director (1974-1977), Assistant Treasurer (1972-1974) and Director of Corporate Taxes (1969-1972); held the following positions at Price Waterhouse Company (financial services firm): Tax Manager (1967-1969), Tax Senior (1965-1967) and Staff Accountant (1963-1965); United States Marine Corps (1957-1959). Oversees 59 portfolios in the OppenheimerFunds complex. Mr. Downes has served on the Boards of certain Oppenheimer funds since December 2005, during which time he has become familiar with the Fund’s (and other Oppenheimer funds’) financial, accounting, regulatory and investment matters and has contributed to the Boards’ deliberations. |
48 | CONSERVATIVE INVESTOR FUND
| | | |
|
Matthew P. Fink,
Trustee (since 2005)
Age: 70 | | Trustee of the Committee for Economic Development (policy research foundation) (since 2005); Director of ICI Education Foundation (education foundation) (October 1991-August 2006); President of the Investment Company Institute (trade association) (October 1991-June 2004); Director of ICI Mutual Insurance Company (insurance company) (October 1991-June 2004). Oversees 59 portfolios in the OppenheimerFunds complex. Mr. Fink has served on the Boards of certain Oppenheimer funds since January 2005, during which time he has become familiar with the Fund’s (and other Oppenheimer funds’) financial, accounting, regulatory and investment matters and has contributed to the Boards’ deliberations. |
| | | |
Phillip A. Griffiths,
Trustee (since 2005)
Age: 72 | | Fellow of the Carnegie Corporation (since 2007); Distinguished Presidential Fellow for International Affairs (since 2002) and Member (since 1979) of the National Academy of Sciences; Council on Foreign Relations (since 2002); Director of GSI Lumonics Inc. (precision technology products company) (since 2001); Senior Advisor of The Andrew W. Mellon Foundation (since 2001); Chair of Science Initiative Group (since 1999); Member of the American Philosophical Society (since 1996); Trustee of Woodward Academy (since 1983); Foreign Associate of Third World Academy of Sciences (since 2002); Director of the Institute for Advanced Study (1991-2004); Director of Bankers Trust New York Corporation (1994-1999); Provost at Duke University (1983-1991). Oversees 59 portfolios in the OppenheimerFunds complex. Mr. Griffiths has served on the Boards of certain Oppenheimer funds since June 1999, during which time he has become familiar with the Fund’s (and other Oppenheimer funds’) financial, accounting, regulatory and investment matters and has contributed to the Boards’ deliberations. |
| | | |
Mary F. Miller,
Trustee (since 2005)
Age: 68 | | Trustee of International House (not-for-profit) (since June 2007); Trustee of the American Symphony Orchestra (not-for-profit) (since October 1998); and Senior Vice President and General Auditor of American Express Company (financial services company) (July 1998-February 2003). Oversees 59 portfolios in the OppenheimerFunds complex. Ms. Miller has served on the Boards of certain Oppenheimer funds since August 2004, during which time she has become familiar with the Fund’s (and other Oppenheimer funds’) financial, accounting, regulatory and investment matters and has contributed to the Boards’ deliberations. |
| | | |
Joel W. Motley,
Trustee (since 2005)
Age: 58 | | Managing Director of Public Capital Advisors, LLC (privately-held financial advisor) (since January 2006); Managing Director of Carmona Motley, Inc. (privately-held financial advisor) (since January 2002); Director of Columbia Equity Financial Corp. (privately-held financial advisor) (2002-2007); Managing Director of Carmona Motley Hoffman Inc. (privately-held financial advisor) (January 1998-December 2001); Member of the Finance and Budget Committee of the Council on Foreign Relations, Chairman of the Investment Committee of the Episcopal Church of America,Member of the Investment Committee and Board of Human Rights Watch and Member of the Investment Committee and Board of Historic Hudson Valley. Oversees 59 portfolios in the OppenheimerFunds complex. Mr.Motley has served on the Boards of certain Oppenheimer funds since October 2002, during which time he has become familiar with the Fund’s (and other Oppenheimer funds’) financial, accounting, regulatory and investment matters and has contributed to the Boards’ deliberations. |
| | | |
Mary Ann Tynan,
Trustee (since 2008)
Age: 65 | | Vice Chair of Board of Trustees of Brigham and Women’s/Faulkner Hospitals (non-profit hospital) (since 2000); Chair of Board of Directors of Faulkner Hospital (non-profit hospital) (since 1990); Member of Audit and Compliance Committee of Partners Health Care System (non-profit) (since 2004); Board of Trustees of Middlesex School (educational institution) (since 1994); Board of |
49 | CONSERVATIVE INVESTOR FUND
TRUSTEES AND OFFICERS Unaudited / Continued
| | | |
|
Mary Ann Tynan,
Continued | | Directors of Idealswork, Inc. (financial services provider) (since 2003); Partner, Senior Vice President and Director of Regulatory Affairs of Wellington Management Company, LLP (global investment manager) (1976-2002); Vice President and Corporate Secretary, John Hancock Advisers, Inc. (mutual fund investment adviser) (1970-1976). Oversees 59 portfolios in the OppenheimerFunds complex. Ms. Tynan has served on the Boards of certain Oppenheimer funds since October 2008, during which time she has become familiar with the Fund’s (and other Oppenheimer funds’) financial, accounting, regulatory and investment matters and has contributed to the Boards’ deliberations. |
| | | |
Joseph M. Wikler,
Trustee (since 2005)
Age: 69 | | Director of C-TASC (bio-statistics services) (since 2007); Director of the following medical device companies: Medintec (since 1992) and Cathco (since 1996); Member of the Investment Committee of the Associated Jewish Charities of Baltimore (since 1994); Director of Lakes Environmental Association (environmental protection organization) (1996-2008); Director of Fortis/Hartford mutual funds (1994-December 2001). Oversees 59 portfolios in the OppenheimerFunds complex. Mr. Wikler has served on the Boards of certain Oppenheimer funds since August 2005, during which time he has become familiar with the Fund’s (and other Oppenheimer funds’) financial, accounting, regulatory and investment matters and has contributed to the Boards’ deliberations. |
| | | |
Peter I. Wold,
Trustee (since 2005)
Age: 63 | | Director of Arch Coal, Inc. (since 2010); Director and Chairman of Wyoming Enhanced Oil Recovery Institute Commission (enhanced oil recovery study) (since 2004); President of Wold Oil Properties, Inc. (oil and gas exploration and production company) (since 1994); Vice President of American Talc Company, Inc. (talc mining and milling) (since 1999); Managing Member of Hole-in-the- Wall Ranch (cattle ranching) (since 1979); Director and Chairman of the Denver Branch of the Federal Reserve Bank of Kansas City (1993-1999); and Director of PacifiCorp. (electric utility) (1995-1999). Oversees 59 portfolios in the OppenheimerFunds complex. Mr.Wold has served on the Boards of certain Oppenheimer funds since August 2005, during which time he has become familiar with the Fund’s (and other Oppenheimer funds’) financial, accounting, regulatory and investment matters and has contributed to the Boards’ deliberations. |
| | | |
OFFICERS OF THE FUND | | The addresses of the Officers in the chart below are as follows: for Messrs. Gilston, Memani, Glavin, Gabinet, Keffer and Zack, Two World Financial Center, 225 Liberty Street, New York, New York 10281-1008, for Messrs. Vandehey and Wixted, 6803 S. Tucson Way, Centennial, Colorado 80112-3924. Each Officer serves for an indefinite term or until his or her resignation, retirement, death or removal. |
| | | |
Alan C. Gilston,
Vice President and Portfolio
Manager (since 2009)
Age: 52 | | Vice President of the Manager (since September 1997); a member of the Funds’ portfolio management team and a member of the Manager’s Asset Allocation Committee (since February 2009); a member of the Manager’s Risk Management Team during various periods. A portfolio manager and officer of 11 portfolios in the OppenheimerFunds complex. |
| | | |
Krishna Memani,
Vice President and Portfolio
Manager (since 2010)
Age: 50 | | Director of Fixed Income (since October 2010), Senior Vice President and Head of the Investment Grade Fixed Income Team of the Manager (since March 2009). Prior to joining the Manager, Managing Director and Head of the U.S. and European Credit Analyst Team at Deutsche Bank Securities (June 2006-January 2009); Chief Credit Strategist at Credit Suisse Securities (August 2002-March 2006); a Managing Director and Senior Portfolio Manager at Putnam Investments (September 1998-June 2002). A portfolio manager and an officer of 22 portfolios in the OppenheimerFunds complex. |
50 | CONSERVATIVE INVESTOR FUND
| | | |
|
William F. Glavin, Jr.,
President and Principal
Executive Officer (since 2009)
Age: 52 | | Chairman of the Manager (since December 2009); Chief Executive Officer and Director of the Manager (since January 2009); President of the Manager (since May 2009); Director of Oppenheimer Acquisition Corp. (“OAC”) (the Manager’s parent holding company) (since June 2009); Executive Vice President (March 2006-February 2009) and Chief Operating Officer (July 2007-February 2009) of Massachusetts Mutual Life Insurance Company (OAC’s parent company); Director (May 2004-March 2006) and Chief Operating Officer and Chief Compliance Officer (May 2004-January 2005), President (January 2005-March 2006) and Chief Executive Officer (June 2005-March 2006) of Babson Capital Management LLC; Director (March 2005-March 2006), President (May 2003- March 2006) and Chief Compliance Officer (July 2005-March 2006) of Babson Capital Securities, Inc. (a broker-dealer); President (May 2003-March 2006) of Babson Investment Company, Inc.; Director (May 2004-August 2006) of Babson Capital Europe Limited; Director (May 2004-October 2006) of Babson Capital Guernsey Limited; Director (May 2004-March 2006) of Babson Capital Management LLC; Non-Executive Director (March 2005-March 2007) of Baring Asset Management Limited; Director (February 2005-June 2006) Baring Pension Trustees Limited; Director and Treasurer (December 2003-November 2006) of Charter Oak Capital Management, Inc.; Director (May 2006-September 2006) of C.M. Benefit Insurance Company; Director (May 2008-June 2009) and Executive Vice President (June 2007-July 2009) of C.M. Life Insurance Company; President (March 2006-May 2007) of MassMutual Assignment Company; Director (January 2005-December 2006), Deputy Chairman (March 2005-December 2006) and President (February 2005-March 2005) of MassMutual Holdings (Bermuda) Limited; Director (May 2008-June 2009) and Executive Vice President (June 2007-July 2009) of MML Bay State Life Insurance Company; Chief Executive Officer and President (April 2007-January 2009) of MML Distributors, LLC; and Chairman (March 2006-December 2008) and Chief Executive Officer (May 2007-December 2008) of MML Investors Services, Inc. Oversees 66 portfolios as a Trustee/Director and 94 portfolios as an officer in the OppenheimerFunds complex. |
| | | |
Arthur S. Gabinet,
Secretary (since 2011)
Age: 52 | | Executive Vice President (since May 2010) and General Counsel (since January 2011) of the Manager; General Counsel of the Distributor (since January 2011); General Counsel of Centennial Asset Management Corporation (since January 2011); Executive Vice President and General Counsel of HarbourView Asset Management Corporation (since January 2011); Assistant Secretary (since January 2011) and Director (since January 2011) of OppenheimerFunds International Ltd. and OppenheimerFunds plc; Vice President and Director of Oppenheimer Partnership Holdings, Inc. (since January 2011); Director of Oppenheimer Real Asset Management, Inc. (since January 2011); Executive Vice President and General Counsel of Shareholder Financial Services, Inc. and Shareholder Services, Inc. (since January 2011); Executive Vice President and General Counsel of OFI Private Investments, Inc. (since January 2011); Vice President of OppenheimerFunds Legacy Program (since January 2011); Executive Vice President and General Counsel of OFI Institutional Asset Management, Inc. (since January 2011); General Counsel, Asset Management of the Manager (May 2010-December 2010); Principal, The Vanguard Group (November 2005-April 2010); District Administrator, U.S. Securities and Exchange Commission (January 2003-October 2005). An officer of 96 portfolios in the OppenheimerFunds complex. |
| | | |
Thomas W. Keffer,
Vice President and Chief
Business Officer (since 2009)
Age: 55 | | Senior Vice President of the Manager (since March 1997); Director of Investment Brand Management of the Manager (since November 1997); Senior Vice President of OppenheimerFunds Distributor, Inc. (since December 1997). An officer of 96 portfolios in the OppenheimerFunds complex. |
51 | CONSERVATIVE INVESTOR FUND
TRUSTEES AND OFFICERS Unaudited / Continued
| | | |
|
Mark S. Vandehey,
Vice President and Chief
Compliance Officer
(since 2005)
Age: 60 | | Senior Vice President and Chief Compliance Officer of the Manager (since March 2004); Chief Compliance Officer of OppenheimerFunds Distributor, Inc., Centennial Asset Management and Shareholder Services, Inc. (since March 2004); Vice President of OppenheimerFunds Distributor, Inc., Centennial Asset Management Corporation and Shareholder Services, Inc. (since June 1983). An officer of 96 portfolios in the OppenheimerFunds complex. |
| | | |
Brian W. Wixted,
Treasurer and Principal
Financial & Accounting
Officer (since 2005)
Age: 51 | | Senior Vice President of the Manager (since March 1999); Treasurer of the Manager and the following: HarbourView Asset Management Corporation, Shareholder Financial Services, Inc., Shareholder Services, Inc., Oppenheimer Real Asset Management, Inc. and Oppenheimer Partnership Holdings, Inc. (March 1999-June 2008), OFI Private Investments, Inc. (March 2000-June 2008), OppenheimerFunds International Ltd. and OppenheimerFunds plc (since May 2000), OFI Institutional Asset Management, Inc. (since November 2000), and OppenheimerFunds Legacy Program (charitable trust program established by the Manager) (since June 2003); Treasurer and Chief Financial Officer of OFI Trust Company (trust company subsidiary of the Manager) (since May 2000); Assistant Treasurer of OAC (March 1999-June 2008). An officer of 96 portfolios in the OppenheimerFunds complex. |
| | | |
Robert G. Zack,
Vice President (since 2005)
Age: 62 | | Executive Vice President (since January 2004) and General Counsel-Corporate (since March 2002) of the Manager; General Counsel of the Distributor (since December 2001); General Counsel of Centennial Asset Management Corporation (since December 2001); Senior Vice President and General Counsel of HarbourView Asset Management Corporation (since December 2001); Secretary and General Counsel of OAC (since November 2001); Assistant Secretary (since September 1997) and Director (since November 2001) of OppenheimerFunds International Ltd. and OppenheimerFunds plc; Vice President and Director of Oppenheimer Partnership Holdings, Inc. (since December 2002); Director of Oppenheimer Real Asset Management, Inc. (since November 2001); Senior Vice President, General Counsel and Director of Shareholder Financial Services, Inc. and Shareholder Services, Inc. (since December 2001); Senior Vice President, General Counsel and Director of OFI Private Investments, Inc. and OFI Trust Company (since November 2001); Vice President of OppenheimerFunds Legacy Program (since June 2003); Senior Vice President and General Counsel of OFI Institutional Asset Management, Inc. (since November 2001). An officer of 96 portfolios in the OppenheimerFunds complex. |
| | | |
Manager | | OppenheimerFunds, Inc. |
| | | |
Distributor | | OppenheimerFunds Distributor, Inc. |
| | | |
Transfer and Shareholder Servicing Agent | | OppenheimerFunds Services |
| | | |
Independent
Registered Public
Accounting Firm | | KPMG llp |
| | | |
Legal Counsel | | Kramer Levin Naftalis & Frankel LLP |
| | | |
| | | ©2011 OppenheimerFunds, Inc. All rights reserved. |
The Fund’s Statement of Additional Information contains additional information about the Fund’s Trustees and Officers and is available without charge upon request, by calling 1.800.525.7048.
52 | CONSERVATIVE INVESTOR FUND
PRIVACY POLICY NOTICE
As an Oppenheimer fund shareholder, you are entitled to know how we protect your personal information and how we limit its disclosure.
Information Sources
We obtain nonpublic personal information about our shareholders from the following sources:
| • | | Applications or other forms |
| |
| • | | When you create a user ID and password for online account access |
| |
| • | | When you enroll in eDocs Direct, our electronic document delivery service |
| |
| • | | Your transactions with us, our affiliates or others |
| |
| • | | A software program on our website, often referred to as a “cookie,” which indicates which parts of our site you’ve visited |
| |
| • | | When you set up challenge questions to reset your password online |
If you visit www.oppenheimerfunds.com and do not log on to the secure account information areas, we do not obtain any personal information about you. When you do log on to a secure area, we do obtain your user ID and password to identify you. We also use this information to provide you with products and services you have requested, to inform you about products and services that you may be interested in and assist you in other ways.
We do not collect personal information through our website unless you willingly provide it to us, either directly by email or in those areas of the website that request information. In order to update your personal information (including your mailing address, email address and phone number) you must first log on and visit your user profile.
If you have set your browser to warn you before accepting cookies, you will receive the warning message with each cookie. You can refuse cookies by turning them off in your browser. However, doing so may limit your access to certain sections of our website.
We use cookies to help us improve and manage our website. For example, cookies help us recognize new versus repeat visitors to the site, track the pages visited, and enable some special features on the website. This data helps us provide a better service for our website visitors.
Protection of Information
We do not disclose any non-public personal information (such as names on a customer list) about current or former customers to anyone, except as permitted by law.
Disclosure of Information
We send your financial advisor (as designated by you) copies of confirmations, account statements and other documents reporting activity in your fund accounts. We may also use details about you and your investments to help us, our financial service affiliates, or firms that jointly market their financial products and services with ours, to better serve your investment needs or suggest financial services or educational material that may be of interest to you. If this requires us to provide you with an opportunity to “opt in” or “opt out” of such information sharing with a firm not affiliated with us, you will receive notification on how to do so, before any such sharing takes place.
Right of Refusal
We will not disclose your personal information to unaffiliated third parties (except as permitted by law), unless we first offer you a reasonable opportunity to refuse or “opt out” of such disclosure.
53 | CONSERVATIVE INVESTOR FUND
PRIVACY POLICY NOTICE
Internet Security and Encryption
In general, the email services provided by our website are encrypted and provide a secure and private means of communication with us. To protect your own privacy, confidential and/or personal information should only be communicated via email when you are advised that you are using a secure website.
As a security measure, we do not include personal or account information in non-secure emails, and we advise you not to send such information to us in non-secure emails. Instead, you may take advantage of the secure features of our website to encrypt your email correspondence. To do this, you will need to use a browser that supports Secure Sockets Layer (SSL) protocol.
We do not guarantee or warrant that any part of our website, including files available for download, are free of viruses or other harmful code. It is your responsibility to take appropriate precautions, such as use of an anti-virus software package, to protect your computer hardware and software.
| • | | All transactions, including redemptions, exchanges and purchases, are secured by SSL and 128-bit encryption. SSL is used to establish a secure connection between your PC and OppenheimerFunds’ server. It transmits information in an encrypted and scrambled format. |
| |
| • | | Encryption is achieved through an electronic scrambling technology that uses a “key” to code and then decode the data. Encryption acts like the cable converter box you may have on your television set. It scrambles data with a secret code so that no one can make sense of it while it is being transmitted. When the data reaches its destination, the same software unscrambles the data. |
| |
| • | | You can exit the secure area by either closing your browser, or for added security, you can use the Log Out button before you close your browser. |
Other Security Measures
We maintain physical, electronic and procedural safeguards to protect your personal account information. Our employees and agents have access to that information only so that they may offer you products or provide services, for example, when responding to your account questions.
How You Can Help
You can also do your part to keep your account information private and to prevent unauthorized transactions. If you obtain a user ID and password for your account, do not allow it to be used by anyone else. Also, take special precautions when accessing your account on a computer used by others.
Who We Are
This joint notice describes the privacy policies of the Oppenheimer funds, OppenheimerFunds Distributor, Inc., the trustee of OppenheimerFunds Individual Retirement Accounts (IRAs) and the custodian of the OppenheimerFunds 403(b)(7) tax sheltered custodial accounts. It applies to all Oppenheimer fund accounts you presently have, or may open in the future, using your Social Security number—whether or not you remain a shareholder of our funds. This notice was last updated January 16, 2004. In the event it is updated or changed, we will post an updated notice on our website at www.oppenheimerfunds.com. If you have any questions about these privacy policies, write to us at P.O. Box 5270, Denver, CO 80217-5270, email us by clicking on the Contact Us section of our website at www.oppenheimerfunds.com or call us at 1.800.525.7048.
54 | CONSERVATIVE INVESTOR FUND
TOP HOLDINGS AND ALLOCATIONS
Asset Class Allocation
Portfolio holdings and allocations are subject to change. Percentages are as of January 31, 2011, and are based on the total market value of investments.
| | | | | |
| Top Ten Holdings | | | | |
| |
| Oppenheimer Value Fund, Cl. Y | | | 18.4 | % |
| Oppenheimer Core Bond Fund, Cl. Y | | | 15.7 | |
| Oppenheimer Capital Appreciation Fund, Cl. Y | | | 13.3 | |
| Oppenheimer Limited-Term Government Fund, Cl. Y | | | 11.2 | |
| Oppenheimer International Bond Fund, Cl. Y | | | 7.7 | |
| Oppenheimer International Growth Fund, Cl. Y | | | 6.8 | |
| Oppenheimer Main Street Small- & Mid-Cap Fund, Cl. Y | | | 5.3 | |
| Oppenheimer Commodity Strategy Total Return Fund, Cl. Y | | | 4.5 | |
| Oppenheimer Quest International Value Fund, Cl. Y | | | 3.4 | |
| Oppenheimer Champion Income Fund, Cl. Y | | | 2.8 | |
Portfolio holdings and allocations are subject to change. Percentages are as of January 31, 2011, and are based on net assets. For more current Top 10 Fund holdings, please visit www.oppenheimerfunds.com.
7 | MODERATE INVESTOR FUND
FUND PERFORMANCE DISCUSSION
How has the Fund performed? Below is a discussion by OppenheimerFunds, Inc. of the Fund’s performance during its fiscal year ended January 31, 2011, followed by a graphical comparison of the Fund’s performance to appropriate broad-based market indices.
Management’s Discussion of Fund Performance. For the 12-month period ended January 31, 2011, Moderate Investor Fund’s Class A shares (without sales charge) returned 15.94%. In comparison, the Fund outperformed the Barclays Capital U.S. Aggregate Bond Index, which returned 5.06%. The Fund underperformed the S&P 500 Index, which returned 22.20%, as a result of its large allocation to underlying fixed-income funds in a period when equities outperformed bonds.
Within the equity component, the Fund had its largest allocations to Oppenheimer Value Fund’s Class Y shares and Oppenheimer Capital Appreciation Fund’s Class Y shares, which together comprised approximately 32% of the Fund’s assets. These underlying domestic equity funds produced double-digit absolute returns, as equities generally rallied during the period. Oppenheimer Value Fund’s Class Y shares outperformed both the S&P 500 Index as well as its own benchmark, the Russell 1000 Value Index, which returned 21.54% during the period. While producing solid absolute returns, Oppenheimer Capital Appreciation Fund’s Class Y shares underperformed the S&P 500 Index as well as its benchmark, the Russell 1000 Growth Index, which returned 25.14%. This underlying fund underperformed largely as a result of weaker relative stock selection within the materials, financials and consumer discretionary sectors. During the reporting period, we also initiated a position in Oppenheimer Main Street Small- & Mid-Cap Fund’s Class Y shares to increase our exposure to smaller capitalization stocks. This underlying fund, which accounted for approximately 5% of the Fund’s assets at period end, produced strong absolute returns while held in the portfolio.
The approximate 13% allocation to global equity funds also added to Fund performance. The Fund’s largest allocation within this space was to Oppenheimer International Growth Fund’s Class Y shares, a position we established in June 2010, which accounted for approximately 7% of the Fund’s assets at period end. This underlying fund outperformed its own benchmark, the MSCI EAFE Index, as well as the S&P 500 Index during the time it was held by the Fund. Oppenheimer Quest International Value Fund, another new position we established in June 2010 and the Fund’s second largest global equity holding at period end, also outperformed the S&P 500 Index during the time it was held by the Fund and performed in line with the MSCI EAFE Index. The timing of these newly established positions worked to the Fund’s advantage as the performance of European stocks, and other global regions in which these underlying funds invest, generally outperformed relative to the S&P 500 Index.
8 | MODERATE INVESTOR FUND
On the fixed-income side, the Fund’s largest holding was Oppenheimer Core Bond Fund’s Class Y shares, which contributed positively to performance. At period end, this underlying fund constituted approximately 16% of the Fund’s assets. This underlying fund significantly outperformed the Barclays Capital U.S. Aggregate Bond Index in a number of areas, including mortgage-backed securities (MBS), commercial mortgage-backed securities (CMBS) and certain investment grade and high yield investments. In addition, asset-backed securities (ABS) contributed to this underlying fund’s performance. During the period, this underlying fund had minimal exposure to U.S. Treasury securities, which contributed to its relative outperformance, as most other categories of the Barclays Capital U.S. Aggregate Bond Index performed better.
The Fund’s second largest fixed-income holding, Oppenheimer Limited-Term Government Fund’s Class Y shares, at period end accounted for approximately 11% of the Fund’s assets. During the reporting period, since U.S. Treasury securities did not perform as well as other areas of the fixed-income market, this underlying fund’s exposure to them detracted from relative results versus the Barclays Capital U.S. Aggregate Bond Index. Treasuries experienced a sell-off in December as the market favored higher-yielding fixed-income securities. This underlying fund significantly outperformed its own benchmark, the Barclays Capital U.S. 1-3 Year Government Bond Index, which returned 1.83% during the period, primarily due to its exposure to both non-agency MBS and agency MBS, as well as CMBS and ABS.
Lastly, the Fund’s third largest fixed-income holding at period end, Oppenheimer International Bond Fund’s Class Y shares, outperformed the Barclays Capital U.S. Aggregate Bond Index and accounted for approximately 8% of the Fund’s assets at period end. We attribute this underlying fund’s strong performance primarily to its emphasis on emerging market bonds over securities from developed markets. In addition, this underlying fund successfully avoided the brunt of weakness stemming from the European sovereign debt crisis through underweight positions in Greece, Ireland and Spain during the reporting period. During the period, this underlying fund’s Class Y shares outperformed its own benchmark, the Citigroup Non-U.S. Dollar World Government Bond Index, which returned 5.54%.
At period end, underlying fixed-income funds, including a small allocation to Oppenheimer Institutional Money Market Fund, consisted of approximately 43% of the Fund’s assets. Underlying equity funds accounted for approximately 50% of the Fund’s assets, with 37% allocated to U.S. equity funds and 13% allocated to four global equity funds—Oppenheimer International Growth Fund, Oppenheimer Quest International Value Fund, Oppenheimer Developing Markets Fund and Oppenheimer International Small Company Fund. During the
9 | MODERATE INVESTOR FUND
FUND PERFORMANCE DISCUSSION
period, an approximate 8% allocation to specialty funds also added to Fund performance, as asset classes such as commodities and real estate generally produced strong results during the period. The Fund had exposure to underlying specialty funds through Oppenheimer Gold & Special Minerals Fund, Oppenheimer Real Estate Fund and Oppenheimer Commodity Strategy Total Return Fund. Allocations to Oppenheimer Main Street Fund, Oppenheimer Main Street Select Fund (formerly Oppenheimer Main Street Opportunity Fund) and Oppenheimer Global Fund were eliminated in June 2010 in an attempt to reduce overlap with some of our other underlying funds.
Comparing the Fund’s Performance to the Market. The graphs that follow show the performance of a hypothetical $10,000 investment in each Class of shares of the Fund held until January 31, 2011. Performance is measured from the inception of the Classes on April 5, 2005. The Fund’s performance reflects the deduction of the maximum initial sales charge on Class A shares, the applicable contingent deferred sales charge on Class B, Class C and Class N shares, and reinvestments of all dividends and capital gains distributions. Past performance cannot guarantee future results.
The Fund’s performance is compared to the performance of the S&P 500 Index and the Barclays Capital U.S. Aggregate Bond Index. The S&P 500 Index is an unmanaged index of equity securities that is a measure of the general domestic stock market. The Barclays Capital U.S. Aggregate Bond Index is an unmanaged, broad-based index of investment grade corporate debt. Index performance reflects the reinvestment of income but does not consider the effect of transaction costs, and none of the data in the graphs shows the effect of taxes. The Fund’s performance reflects the effects of the Fund’s business and operating expenses. While index comparisons may be useful to provide a benchmark for the Fund’s performance, it must be noted that the Fund’s investments are not limited to the investments comprising the indices.
10 | MODERATE INVESTOR FUND
Class A Shares
Comparison of Change in Value of $10,000 Hypothetical Investments in:
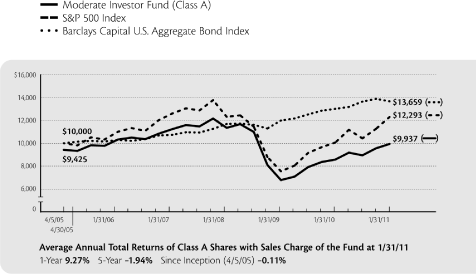
The performance data quoted represents past performance, which does not guarantee future results. The investment return and principal value of an investment in the Fund will fluctuate so that an investor’s shares, when redeemed, may be worth more or less than their original cost. Current performance may be lower or higher than the performance quoted. For performance data current to the most recent month end, visit us at www.oppenheimerfunds.com, or call us at 1.800.525.7048. Fund returns include changes in share price, reinvested distributions, and the applicable sales charge: for Class A shares, the current maximum initial sales charge of 5.75%; for Class B shares, the contingent deferred sales charge of 5% (1-year) and 2% (5-year); and for Class C and N shares, the 1% contingent deferred sales charge for the 1-year period. There is no sales charge for Class Y shares. See page 16 for further information.
11 | MODERATE INVESTOR FUND
FUND PERFORMANCE DISCUSSION
Class B Shares
Comparison of Change in Value of $10,000 Hypothetical Investments in:
12 | MODERATE INVESTOR FUND
Class C Shares
Comparison of Change in Value of $10,000 Hypothetical Investments in:
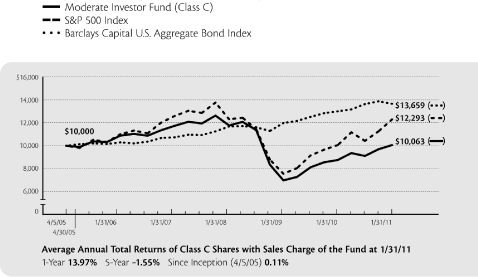
The performance data quoted represents past performance, which does not guarantee future results. The investment return and principal value of an investment in the Fund will fluctuate so that an investor’s shares, when redeemed, may be worth more or less than their original cost. Current performance may be lower or higher than the performance quoted. For performance data current to the most recent month end, visit us at www.oppenheimerfunds.com, or call us at 1.800.525.7048. Fund returns include changes in share price, reinvested distributions, and the applicable sales charge: for Class A shares, the current maximum initial sales charge of 5.75%; for Class B shares, the contingent deferred sales charge of 5% (1-year) and 2% (5-year); and for Class C and N shares, the 1% contingent deferred sales charge for the 1-year period. There is no sales charge for Class Y shares. See page 16 for further information.
13 | MODERATE INVESTOR FUND
FUND PERFORMANCE DISCUSSION
Class N Shares
Comparison of Change in Value of $10,000 Hypothetical Investments in:
14 | MODERATE INVESTOR FUND
Class Y Shares
Comparison of Change in Value of $10,000 Hypothetical Investments in:
The performance data quoted represents past performance, which does not guarantee future results. The investment return and principal value of an investment in the Fund will fluctuate so that an investor’s shares, when redeemed, may be worth more or less than their original cost. Current performance may be lower or higher than the performance quoted. For performance data current to the most recent month end, visit us at www.oppenheimerfunds.com, or call us at 1.800.525.7048. Fund returns include changes in share price, reinvested distributions, and the applicable sales charge: for Class A shares, the current maximum initial sales charge of 5.75%; for Class B shares, the contingent deferred sales charge of 5% (1-year) and 2% (5-year); and for Class C and N shares, the 1% contingent deferred sales charge for the 1-year period. There is no sales charge for Class Y shares. See page 16 for further information.
15 | MODERATE INVESTOR FUND
NOTES
Total returns and the ending account values in the graphs include changes in share price and reinvestment of dividends and capital gains distributions in a hypothetical investment for the periods shown. The Fund’s total returns shown do not reflect the deduction of income taxes on an individual’s investment. Taxes may reduce your actual investment returns on income or gains paid by the Fund or any gains you may realize if you sell your shares.
Investors should consider the Fund’s investment objectives, risks, expenses and other charges carefully before investing. The Fund’s prospectus and, if available, the Fund’s summary prospectus contain this and other information about the Fund, and may be obtained by asking your financial advisor, calling us at 1.800.525.7048 or visiting our website at www.oppenheimerfunds.com. Read the prospectus and, if available, the summary prospectus carefully before investing.
The Fund’s investment strategy and focus can change over time. The mention of specific fund holdings does not constitute a recommendation by OppenheimerFunds, Inc.
Class A shares of the Fund were first publicly offered on 4/5/05. Unless otherwise noted, Class A returns include the maximum initial sales charge of 5.75%.
Class B shares of the Fund were first publicly offered on 4/5/05. Unless otherwise noted, Class B returns include the applicable contingent deferred sales charge of 5% (1-year) and 2% (5-year). Class B shares are subject to an annual 0.75% asset-based sales charge.
Class C shares of the Fund were first publicly offered on 4/5/05. Unless otherwise noted, Class C returns include the contingent deferred sales charge of 1% for the 1-year period. Class C shares are subject to an annual 0.75% asset-based sales charge.
Class N shares of the Fund were first publicly offered on 4/5/05. Class N shares are offered only through retirement plans. Unless otherwise noted, Class N returns include the contingent deferred sales charge of 1% for the 1-year period. Class N shares are subject to an annual 0.25% asset-based sales charge.
Class Y shares of the Fund were first publicly offered on 4/5/05. Class Y shares are offered only to fee-based clients of dealers that have a special agreement with the Distributor, to certain institutional investors under a special agreement with the Distributor, and to present or former officers, directors, trustees or employees (and their eligible family members) of the Fund, the Manager, its affiliates, its parent company and the subsidiaries of its parent company, and retirement plans established for the benefit of such individuals.
An explanation of the calculation of performance is in the Fund’s Statement of Additional Information.
16 | MODERATE INVESTOR FUND
FUND EXPENSES
Fund Expenses. As a shareholder of the Fund, you incur two types of costs: (1) transaction costs, which may include sales charges (loads) on purchase payments, contingent deferred sales charges on redemptions; and (2) ongoing costs, including distribution and service fees; and other Fund expenses. These examples are intended to help you understand your ongoing costs (in dollars) of investing in the Fund and to compare these costs with the ongoing costs of investing in other mutual funds.
The examples are based on an investment of $1,000.00 invested at the beginning of the period and held for the entire 6-month period ended January 31, 2011.
Actual Expenses. The first section of the table provides information about actual account values and actual expenses. You may use the information in this section for the class of shares you hold, together with the amount you invested, to estimate the expense that you paid over the period. Simply divide your account value by $1,000.00 (for example, an $8,600.00 account value divided by $1,000.00 = 8.60), then multiply the result by the number in the first section under the heading entitled “Expenses Paid During Period” to estimate the expenses you paid on your account during this period.
Hypothetical Example for Comparison Purposes. The second section of the table provides information about hypothetical account values and hypothetical expenses based on the Fund’s actual expense ratio for each class of shares, and an assumed rate of return of 5% per year for each class before expenses, which is not the actual return. The hypothetical account values and expenses may not be used to estimate the actual ending account balance or expenses you paid for the period. You may use this information to compare the ongoing costs of investing in the Fund and other funds. To do so, compare this 5% hypothetical example for the class of shares you hold with the 5% hypothetical examples that appear in the shareholder reports of the other funds.
Please note that the expenses shown in the table are meant to highlight your ongoing costs only and do not reflect any transactional costs, such as front-end or contingent deferred sales charges (loads), or a $12.00 fee imposed annually on accounts valued at less than $500.00 (subject to exceptions described in the Statement of Additional Information). Therefore, the “hypothetical” section of the table is useful in comparing ongoing costs only, and will not help you determine the relative total costs of owning different funds. In addition, if these transactional costs were included, your costs would have been higher.
17 | MODERATE INVESTOR FUND
FUND EXPENSES Continued
| | | | | | | | | | | | | |
| | | Beginning | | Ending | | Expenses |
| | | Account | | Account | | Paid During |
| | | Value | | Value | | 6 Months Ended |
| | | August 1, 2010 | | January 31, 2011 | | January 31, 2011 |
| |
| Actual |
| Class A | | $ | 1,000.00 | | | $ | 1,110.50 | | | $ | 2.45 | |
| Class B | | | 1,000.00 | | | | 1,104.50 | | | | 7.18 | |
| Class C | | | 1,000.00 | | | | 1,104.70 | | | | 6.60 | |
| Class N | | | 1,000.00 | | | | 1,108.60 | | | | 3.83 | |
| Class Y | | | 1,000.00 | | | | 1,111.60 | | | | 0.48 | |
Hypothetical
(5% return before expenses) | | | | | | | | | | | | |
| Class A | | | 1,000.00 | | | | 1,022.89 | | | | 2.35 | |
| Class B | | | 1,000.00 | | | | 1,018.40 | | | | 6.89 | |
| Class C | | | 1,000.00 | | | | 1,018.95 | | | | 6.33 | |
| Class N | | | 1,000.00 | | | | 1,021.58 | | | | 3.68 | |
| Class Y | | | 1,000.00 | | | | 1,024.75 | | | | 0.46 | |
Expenses are equal to the Fund’s annualized expense ratio for that class, multiplied by the average account value over the period, multiplied by 184/365 (to reflect the one-half year period). Those annualized expense ratios, excluding the indirect expenses incurred through the Fund’s investments in the underlying funds, based on the 6-month period ended January 31, 2011 are as follows:
| | | | | |
| Class | | Expense Ratios |
| |
| Class A | | | 0.46 | % |
| Class B | | | 1.35 | |
| Class C | | | 1.24 | |
| Class N | | | 0.72 | |
| Class Y | | | 0.09 | |
The expense ratios reflect voluntary waivers or reimbursements of expenses by the Fund’s Manager and Distributor. Some of these undertakings may be modified or terminated at any time; some may not be modified or terminated until after one year from the date of the current prospectus, as indicated therein. The “Financial Highlights” tables in the Fund’s financial statements, included in this report, also show the gross expense ratios, without such waivers or reimbursements and reduction to custodian expenses, if applicable.
18 | MODERATE INVESTOR FUND
STATEMENT OF INVESTMENTS January 31, 2011
| | | | | | | | | |
| | | Shares | | | Value | |
| |
Investment Companies—100.1%1 | | | | | | | | |
Fixed Income Funds—40.2% | | | | | | | | |
| Oppenheimer Champion Income Fund, Cl. Y | | | 14,308,867 | | | $ | 28,331,556 | |
| Oppenheimer Core Bond Fund, Cl. Y | | | 24,439,590 | | | | 158,124,151 | |
| Oppenheimer International Bond Fund, Cl. Y | | | 12,079,581 | | | | 78,034,095 | |
| Oppenheimer Limited-Term Government Fund, Cl. Y | | | 12,012,357 | | | | 112,796,035 | |
| Oppenheimer Master Inflation Protected Securities Fund, LLC | | | 2,675,110 | | | | 27,414,611 | |
| | | | | | | | |
| | | | | | | | 404,700,448 | |
| | | | | | | | | |
Global Equity Funds—12.8% | | | | | | | | |
| Oppenheimer Developing Markets Fund, Cl. Y | | | 570,332 | | | | 19,482,549 | |
| Oppenheimer International Growth Fund, Cl. Y | | | 2,421,961 | | | | 68,081,329 | |
| Oppenheimer International Small Company Fund, Cl. Y | | | 313,221 | | | | 7,326,230 | |
| Oppenheimer Quest International Value Fund, Cl. Y | | | 2,000,952 | | | | 33,916,139 | |
| | | | | | | | |
| | | | | | | | 128,806,247 | |
| | | | | | | | | |
Money Market Fund—2.5% | | | | | | | | |
Oppenheimer Institutional Money Market Fund, Cl. E, 0.20%2 | | | 25,423,580 | | | | 25,423,580 | |
Specialty Funds—7.5% | | | | | | | | |
| Oppenheimer Commodity Strategy Total Return Fund, Cl. Y | | | 11,909,155 | | | | 44,897,513 | |
| Oppenheimer Gold & Special Minerals Fund, Cl. Y | | | 224,095 | | | | 9,804,157 | |
| Oppenheimer Real Estate Fund, Cl. Y | | | 1,092,550 | | | | 21,304,728 | |
| | | | | | | | |
| | | | | | | | 76,006,398 | |
| | | | | | | | | |
U.S. Equity Funds—37.1% | | | | | | | | |
Oppenheimer Capital Appreciation Fund, Cl. Y3 | | | 2,910,692 | | | | 134,124,665 | |
| Oppenheimer Main Street Small- & Mid-Cap Fund, Cl. Y | | | 2,470,478 | | | | 53,411,727 | |
| Oppenheimer Value Fund, Cl. Y | | | 8,149,679 | | | | 185,731,181 | |
| | | | | | | | |
| | | | | | | | 373,267,573 | |
| | | | | | | | | |
Total Investments, at Value (Cost $982,457,850) | | | 100.1 | % | | | 1,008,204,246 | |
Liabilities in Excess of Other Assets | | | (0.1 | ) | | | (1,124,403 | ) |
| | | |
Net Assets | | | 100.0 | % | | $ | 1,007,079,843 | |
| | | |
19 | MODERATE INVESTOR FUND
STATEMENT OF INVESTMENTS Continued
| | |
| Footnotes to Statement of Investments |
| |
| 1. | | Is or was an affiliate, as defined in the Investment Company Act of 1940, at or during the period ended January 31, 2011, by virtue of the Fund owning at least 5% of the voting securities of the issuer or as a result of the Fund and the issuer having the same investment adviser. Transactions during the period in which the issuer was an affiliate are as follows: |
| | | | | | | | | | | | | | | | | |
| | | Shares | | | | | | | | | | | Shares | |
| | | January 31, | | | Gross | | | Gross | | | January 31, | |
| | | 2010 | | | Additions | | | Reductions | | | 2011 | |
| |
| Oppenheimer Capital Appreciation Fund, Cl. Y | | | 2,132,559 | | | | 938,790 | | | | 160,657 | | | | 2,910,692 | |
| Oppenheimer Champion Income Fund, Cl. Y | | | 21,403,362 | | | | 2,650,262 | | | | 9,744,757 | | | | 14,308,867 | |
| Oppenheimer Commodity Strategy | | | | | | | | | | | | | | | | |
| Total Return Fund, Cl. Y | | | 11,766,716 | | | | 1,056,549 | | | | 914,110 | | | | 11,909,155 | |
| Oppenheimer Core Bond Fund, Cl. Y | | | 28,037,122 | | | | 3,318,633 | | | | 6,916,165 | | | | 24,439,590 | |
| Oppenheimer Developing Markets Fund, Cl. Y | | | — | | | | 588,606 | | | | 18,274 | | | | 570,332 | |
| Oppenheimer Global Fund, Cl. Y | | | 1,649,738 | | | | 46,222 | | | | 1,695,960 | | | | — | |
| Oppenheimer Gold & Special Minerals Fund, Cl. A | | | — | | | | 221,353 | | | | 221,353 | | | | — | |
| Oppenheimer Gold & Special Minerals Fund, Cl. Y | | | — | | | | 228,178 | | | | 4,083 | | | | 224,095 | |
| Oppenheimer Institutional Money Market Fund, Cl. E | | | 322,480 | | | | 73,767,264 | | | | 48,666,164 | | | | 25,423,580 | |
| Oppenheimer International Bond Fund, Cl. Y | | | 9,062,811 | | | | 4,176,276 | | | | 1,159,506 | | | | 12,079,581 | |
| Oppenheimer International Growth Fund, Cl. Y | | | — | | | | 2,579,524 | | | | 157,563 | | | | 2,421,961 | |
| Oppenheimer International Small | | | | | | | | | | | | | | | | |
| Company Fund, Cl. Y | | | — | | | | 322,220 | | | | 8,999 | | | | 313,221 | |
| Oppenheimer Limited-Term Government Fund, Cl. Y | | | 12,037,400 | | | | 2,134,585 | | | | 2,159,628 | | | | 12,012,357 | |
| Oppenheimer Main Street Fund, Cl. Y | | | 3,101,627 | | | | 87,066 | | | | 3,188,693 | | | | — | |
| Oppenheimer Main Street Select Fund, Cl. Y (formerly | | | | | | | | | | | | | | | | |
| Oppenheimer Main Street Opportunity Fund, Cl. Y) | | | 3,933,354 | | | | 110,188 | | | | 4,043,542 | | | | — | |
| Oppenheimer Main Street Small- & Mid-Cap Fund, Cl. Y | | | | | | | | | | | | | | | | |
| (formerly Oppenheimer Main Street Small Cap Fund, Cl. Y) | | | — | | | | 2,557,080 | | | | 86,602 | | | | 2,470,478 | |
| Oppenheimer Master Inflation Protected | | | | | | | | | | | | | | | | |
| Securities Fund, LLC | | | — | | | | 2,835,003 | | | | 159,893 | | | | 2,675,110 | |
| Oppenheimer Quest International Value Fund, Cl. Y | | | — | | | | 2,065,492 | | | | 64,540 | | | | 2,000,952 | |
| Oppenheimer Real Estate Fund, Cl. Y | | | 3,357,821 | | | | 142,313 | | | | 2,407,584 | | | | 1,092,550 | |
| Oppenheimer Value Fund, Cl. Y | | | 4,436,789 | | | | 4,353,853 | | | | 640,963 | | | | 8,149,679 | |
| | | | | | | | | | | | | |
| | | | | | | | | | | Realized | |
| | | Value | | | Income | | | Gain (Loss) | |
| |
| Oppenheimer Capital Appreciation Fund, Cl. Y | | $ | 134,124,665 | | | $ | — | | | $ | (1,440,951 | ) |
| Oppenheimer Champion Income Fund, Cl. Y | | | 28,331,556 | | | | 2,434,476 | | | | (62,062,428 | ) |
| Oppenheimer Commodity Strategy Total Return Fund, Cl. Y | | | 44,897,513 | | | | 789,646 | | | | (4,034,313 | ) |
| Oppenheimer Core Bond Fund, Cl. Y | | | 158,124,151 | | | | 8,628,874 | | | | (20,632,526 | ) |
| Oppenheimer Developing Markets Fund, Cl. Y | | | 19,482,549 | | | | 80,659 | | | | 10,265 | |
| Oppenheimer Global Fund, Cl. Y | | | — | | | | — | | | | (16,612,612 | ) |
| Oppenheimer Gold & Special Minerals Fund, Cl. A | | | — | | | | — | | | | 1,137,067 | |
| Oppenheimer Gold & Special Minerals Fund, Cl. Y | | | 9,804,157 | | | | 930,543 | | | | 981 | |
| Oppenheimer Institutional Money Market Fund, Cl. E | | | 25,423,580 | | | | 35,115 | | | | — | |
| Oppenheimer International Bond Fund, Cl. Y | | | 78,034,095 | | | | 3,154,656 | | | | 108,363 | |
| Oppenheimer International Growth Fund, Cl. Y | | | 68,081,329 | | | | 652,950 | | | | 263,204 | |
| Oppenheimer International Small Company Fund, Cl. Y | | | 7,326,230 | | | | 640,048 | | | | 3,637 | |
| Oppenheimer Limited-Term Government Fund, Cl. Y | | | 112,796,035 | | | | 3,410,708 | | | | (304,098 | ) |
| Oppenheimer Main Street Fund, Cl. Y | | | — | | | | — | | | | (21,994,770 | ) |
20 | MODERATE INVESTOR FUND
| | | | | | | | | | | | | |
| | | | | | | | | | | Realized | |
| | | Value | | | Income | | | Gain (Loss) | |
| |
| Oppenheimer Main Street Select Fund, Cl. Y | | | | | | | | | | | | |
| (formerly Oppenheimer Main Street Opportunity Fund, Cl. Y) | | $ | — | | | $ | — | | | $ | (8,015,625 | ) |
| Oppenheimer Main Street Small- & Mid-Cap Fund, Cl. Y | | | | | | | | | | | | |
| (formerly Oppenheimer Main Street Small Cap Fund, Cl. Y) | | | 53,411,727 | | | | 183,552 | | | | (25,030 | ) |
| Oppenheimer Master Inflation Protected Securities Fund, LLC | | | 27,414,611 | | | | 247,892 | a | | | 75,406 | a |
| Oppenheimer Quest International Value Fund, Cl. Y | | | 33,916,139 | | | | 905,410 | | | | 8,870 | |
| Oppenheimer Real Estate Fund, Cl. Y | | | 21,304,728 | | | | 350,245 | | | | (8,985,114 | ) |
| Oppenheimer Value Fund, Cl. Y | | | 185,731,181 | | | | 2,062,451 | | | | (3,242,928 | ) |
| | | |
| | | $ | 1,008,204,246 | | | $ | 24,507,225 | | | $ | (145,742,602 | ) |
| | | |
| | a. | | Represents the amount allocated to the Fund from Oppenheimer Master Inflation Protected Securities Fund, LLC. |
| 2. | | Rate shown is the 7-day yield as of January 31, 2011. |
| |
| 3. | | Non-income producing security. |
Valuation Inputs
Various data inputs are used in determining the value of each of the Fund’s investments as of the reporting period end. These data inputs are categorized in the following hierarchy under applicable financial accounting standards:
| | 1) | | Level 1—unadjusted quoted prices in active markets for identical assets or liabilities (including securities actively traded on a securities exchange) |
| |
| | 2) | | Level 2—inputs other than unadjusted quoted prices that are observable for the asset or liability (such as unadjusted quoted prices for similar assets and market corroborated inputs such as interest rates, prepayment speeds, credit risks, etc.) |
| |
| | 3) | | Level 3—significant unobservable inputs (including the Manager’s own judgments about assumptions that market participants would use in pricing the asset or liability). |
The table below categorizes amounts that are included in the Fund’s Statement of Assets and Liabilities as of January 31, 2011 based on valuation input level:
| | | | | | | | | | | | | | | | | |
| | | | | | | | | | | Level 3– | | | | |
| | | Level 1– | | | Level 2– | | | Significant | | | | |
| | | Unadjusted | | | Other Significant | | | Unobservable | | | | |
| | | Quoted Prices | | | Observable Inputs | | | Inputs | | | Value | |
| |
Assets Table | | | | | | | | | | | | | | | | |
Investments, at Value: | | | | | | | | | | | | | | | | |
| Investment Companies | | $ | 1,008,204,246 | | | $ | — | | | $ | — | | | $ | 1,008,204,246 | |
| | | |
| Total Assets | | $ | 1,008,204,246 | | | $ | — | | | $ | — | | | $ | 1,008,204,246 | |
| | | |
Currency contracts and forwards, if any, are reported at their unrealized appreciation/depreciation at measurement date, which represents the change in the contract’s value from trade date. Futures, if any, are reported at their variation margin at measurement date, which represents the amount due to/from the Fund at that date. All additional assets and liabilities included in the above table are reported at their market value at measurement date.
See the accompanying Notes for further discussion of the methods used in determining value of the Fund’s investments, and a summary of changes to the valuation methodologies, if any, during the reporting period.
See accompanying Notes to Financial Statements.
21 | MODERATE INVESTOR FUND
STATEMENT OF ASSETS AND LIABILITIES January 31, 2011
| | | | | |
|
Assets | | | | |
| Investments, at value—see accompanying statement of investments—affiliated companies (cost $982,457,850) | | $ | 1,008,204,246 | |
| Cash | | | 656,086 | |
| Receivables and other assets: | | | | |
| Dividends | | | 1,397,266 | |
| Shares of beneficial interest sold | | | 1,217,604 | |
| Investments sold | | | 60,501 | |
| Other | | | 42,896 | |
| | | | |
| Total assets | | | 1,011,578,599 | |
| | | | | |
Liabilities | | | | |
| Payables and other liabilities: | | | | |
| Shares of beneficial interest redeemed | | | 2,531,035 | |
| Investments purchased | | | 1,398,972 | |
| Distribution and service plan fees | | | 204,455 | |
| Transfer and shareholder servicing agent fees | | | 148,127 | |
| Shareholder communications | | | 93,822 | |
| Trustees’ compensation | | | 72,048 | |
| Other | | | 50,297 | |
| | | | |
| Total liabilities | | | 4,498,756 | |
| | | | | |
Net Assets | | $ | 1,007,079,843 | |
| | | | |
| | | | | |
Composition of Net Assets | | | | |
| Par value of shares of beneficial interest | | $ | 115,533 | |
| Additional paid-in capital | | | 1,224,399,801 | |
| Accumulated net investment income | | | 5,780,091 | |
| Accumulated net realized loss on investments | | | (248,961,978 | ) |
| Net unrealized appreciation on investments | | | 25,746,396 | |
| | | | |
Net Assets | | $ | 1,007,079,843 | |
| | | | |
22 | MODERATE INVESTOR FUND
| | | | | |
|
Net Asset Value Per Share | | | | |
| |
| Class A Shares: | | | | |
| Net asset value and redemption price per share (based on net assets of $542,308,420 and 61,857,831 shares of beneficial interest outstanding) | | $ | 8.77 | |
| Maximum offering price per share (net asset value plus sales charge of 5.75% of offering price) | | $ | 9.31 | |
| |
| Class B Shares: | | | | |
| Net asset value, redemption price (excludes applicable contingent deferred sales charge) and offering price per share (based on net assets of $118,397,842 and 13,685,894 shares of beneficial interest outstanding) | | $ | 8.65 | |
| |
| Class C Shares: | | | | |
| Net asset value, redemption price (excludes applicable contingent deferred sales charge) and offering price per share (based on net assets of $230,367,912 and 26,683,583 shares of beneficial interest outstanding) | | $ | 8.63 | |
| |
| Class N Shares: | | | | |
| Net asset value, redemption price (excludes applicable contingent deferred sales charge) and offering price per share (based on net assets of $109,374,930 and 12,552,914 shares of beneficial interest outstanding) | | $ | 8.71 | |
| |
| Class Y Shares: | | | | |
| Net asset value, redemption price and offering price per share (based on net assets of $6,630,739 and 753,243 shares of beneficial interest outstanding) | | $ | 8.80 | |
See accompanying Notes to Financial Statements.
23 | MODERATE INVESTOR FUND
STATEMENT OF OPERATIONS For the Year Ended January 31, 2011
| | | | | |
|
Allocation of Income and Expenses from Master Fund1 | | | | |
| Net investment income allocated from Oppenheimer Master Inflation Protected Securities Fund, LLC: | | | | |
| Interest | | $ | 247,892 | |
| Expenses | | | (101,097 | ) |
| | | | |
| Net investment income allocated from Oppenheimer Master Inflation Protected Securities Fund, LLC | | | 146,795 | |
| | | | | |
Investment Income | | | | |
| Dividends from affiliated companies | | | 24,259,333 | |
| Interest | | | 583 | |
| Other income | | | 22,776 | |
| | | | |
| Total investment income | | | 24,282,692 | |
| | | | | |
Expenses | | | | |
| Distribution and service plan fees: | | | | |
| Class A | | | 1,215,829 | |
| Class B | | | 1,108,295 | |
| Class C | | | 2,093,415 | |
| Class N | | | 506,234 | |
| Transfer and shareholder servicing agent fees: | | | | |
| Class A | | | 880,966 | |
| Class B | | | 321,105 | |
| Class C | | | 434,677 | |
| Class N | | | 208,768 | |
| Class Y | | | 2,564 | |
| Shareholder communications: | | | | |
| Class A | | | 92,729 | |
| Class B | | | 38,728 | |
| Class C | | | 38,724 | |
| Class N | | | 5,984 | |
| Class Y | | | 61 | |
| Trustees’ compensation | | | 15,568 | |
| Custodian fees and expenses | | | 10,390 | |
| Administration service fees | | | 1,500 | |
| Other | | | 84,161 | |
| | | | |
| Total expenses | | | 7,059,698 | |
| Less waivers and reimbursements of expenses | | | (6,099 | ) |
| | | | |
| Net expenses | | | 7,053,599 | |
| | | | | |
Net Investment Income | | | 17,375,888 | |
24 | MODERATE INVESTOR FUND
| | | | | |
|
Realized and Unrealized Gain (Loss) | | | | |
| Net realized gain (loss) on: | | | | |
| Investments from affiliated companies | | $ | (145,818,008 | ) |
| Distributions received from affiliated companies | | | 933,478 | |
| Net realized gain allocated from Oppenheimer Master Inflation Protected Securities Fund, LLC | | | 75,406 | |
| | | | |
| Total net realized loss | | | (144,809,124 | ) |
| | | | | |
| Net change in unrealized appreciation/depreciation on investments | | | 260,546,599 | |
| Net change in unrealized appreciation/depreciation allocated from Oppenheimer Master Inflation Protected Securities Fund, LLC | | | 414,223 | |
| | | | |
| Total net change in unrealized appreciation/depreciation | | | 260,960,822 | |
| | | | | |
Net Increase in Net Assets Resulting from Operations | | $ | 133,527,586 | |
| | | | |
| | |
| 1. | | The Fund invests in an affiliated mutual fund that expects to be treated as a partnership for tax purposes. See Note 1 of the accompanying Notes. |
See accompanying Notes to Financial Statements.
25 | MODERATE INVESTOR FUND
STATEMENTS OF CHANGES IN NET ASSETS
| | | | | | | | | |
| Year Ended January 31, | | 2011 | | | 2010 | |
| |
Operations | | | | | | | | |
| Net investment income | | $ | 17,375,888 | | | $ | 5,934,277 | |
| Net realized loss | | | (144,809,124 | ) | | | (73,588,459 | ) |
| Net change in unrealized appreciation/depreciation | | | 260,960,822 | | | | 238,409,967 | |
| | | |
| Net increase in net assets resulting from operations | | | 133,527,586 | | | | 170,755,785 | |
| | | | | | | | | |
Dividends and/or Distributions to Shareholders | | | | | | | | |
| Dividends from net investment income: | | | | | | | | |
| Class A | | | (10,733,291 | ) | | | (500,127 | ) |
| Class B | | | (1,457,394 | ) | | | — | |
| Class C | | | (3,098,012 | ) | | | — | |
| Class N | | | (1,937,813 | ) | | | — | |
| Class Y | | | (151,542 | ) | | | (10,990 | ) |
| | | |
| | | | (17,378,052 | ) | | | (511,117 | ) |
| | | | | | | | | |
Beneficial Interest Transactions | | | | | | | | |
| Net increase (decrease) in net assets resulting from beneficial interest transactions: | | | | | | | | |
| Class A | | | 30,088,734 | | | | 7,182,665 | |
| Class B | | | (1,570,605 | ) | | | (1,944,755 | ) |
| Class C | | | 9,857,330 | | | | (2,345,081 | ) |
| Class N | | | 2,876,664 | | | | 1,465,965 | |
| Class Y | | | 3,303,944 | | | | 275,292 | |
| | | |
| | | | 44,556,067 | | | | 4,634,086 | |
| | | | | | | | | |
Net Assets | | | | | | | | |
| Total increase | | | 160,705,601 | | | | 174,878,754 | |
| Beginning of period | | | 846,374,242 | | | | 671,495,488 | |
| | | |
| End of period (including accumulated net investment income of $5,780,091 and $5,782,255, respectively) | | $ | 1,007,079,843 | | | $ | 846,374,242 | |
| | | |
See accompanying Notes to Financial Statements.
26 | MODERATE INVESTOR FUND
FINANCIAL HIGHLIGHTS
| | | | | | | | | | | | | | | | | | | | | |
| Class A Year Ended January 31, | | 2011 | | | 2010 | | | 2009 | | | 2008 | | | 2007 | |
| |
Per Share Operating Data | | | | | | | | | | | | | | | | | | | | |
| Net asset value, beginning of period | | $ | 7.72 | | | $ | 6.12 | | | $ | 11.01 | | | $ | 11.42 | | | $ | 10.78 | |
| |
| Income (loss) from investment operations: | | | | | | | | | | | | | | | | | | | | |
Net investment income1 | | | .18 | | | | .07 | | | | .13 | | | | .54 | | | | .39 | |
| Net realized and unrealized gain (loss) | | | 1.05 | | | | 1.54 | | | | (4.53 | ) | | | (.41 | ) | | | .55 | |
| | | |
| Total from investment operations | | | 1.23 | | | | 1.61 | | | | (4.40 | ) | | | .13 | | | | .94 | |
| |
| Dividends and/or distributions to shareholders: | | | | | | | | | | | | | | | | | | | | |
| Dividends from net investment income | | | (.18 | ) | | | (.01 | ) | | | (.13 | ) | | | (.45 | ) | | | (.27 | ) |
| Distributions from net realized gain | | | — | | | | — | | | | (.25 | ) | | | (.09 | ) | | | (.03 | ) |
| Tax return of capital distribution | | | — | | | | — | | | | (.11 | ) | | | — | | | | — | |
| | | |
| Total dividends and/or distributions to shareholders | | | (.18 | ) | | | (.01 | ) | | | (.49 | ) | | | (.54 | ) | | | (.30 | ) |
| |
| Net asset value, end of period | | $ | 8.77 | | | $ | 7.72 | | | $ | 6.12 | | | $ | 11.01 | | | $ | 11.42 | |
| | | |
| | | | | | | | | | | | | | | | | | | | | |
Total Return, at Net Asset Value2 | | | 15.94 | % | | | 26.28 | % | | | (40.17 | )% | | | 1.01 | % | | | 8.73 | % |
| | | | | | | | | | | | | | | | | | | | | |
Ratios/Supplemental Data | | | | | | | | | | | | | | | | | | | | |
| Net assets, end of period (in thousands) | | $ | 542,308 | | | $ | 450,074 | | | $ | 351,987 | | | $ | 497,377 | | | $ | 313,311 | |
| |
| Average net assets (in thousands) | | $ | 491,634 | | | $ | 403,150 | | | $ | 486,485 | | | $ | 423,981 | | | $ | 206,672 | |
| |
Ratios to average net assets:3 | | | | | | | | | | | | | | | | | | | | |
| Net investment income | | | 2.20 | %4 | | | 1.04 | % | | | 1.36 | % | | | 4.59 | % | | | 3.57 | % |
Total expenses5 | | | 0.47 | %4 | | | 0.51 | % | | | 0.42 | % | | | 0.37 | % | | | 0.40 | % |
| Expenses after payments, waivers and/or reimbursements and reduction to custodian expenses | | | 0.47 | %4 | | | 0.51 | % | | | 0.42 | % | | | 0.37 | % | | | 0.40 | % |
| |
| Portfolio turnover rate | | | 43 | % | | | 13 | % | | | 9 | % | | | 3 | % | | | 4 | % |
| | |
| 1. | | Per share amounts calculated based on the average shares outstanding during the period. |
| |
| 2. | | Assumes an initial investment on the business day before the first day of the fiscal period, with all dividends and distributions reinvested in additional shares on the reinvestment date, and redemption at the net asset value calculated on the last business day of the fiscal period. Sales charges are not reflected in the total returns. Total returns are not annualized for periods less than one full year. Returns do not reflect the deduction of taxes that a shareholder would pay on fund distributions or the redemption of fund shares. |
| |
| 3. | | Annualized for periods less than one full year. |
| |
| 4. | | Includes the Fund’s share of the allocated expenses and/or net investment income from Oppenheimer Master Inflation Protected Securities Fund, LLC. |
| |
| 5. | | Total expenses including all underlying fund expenses were as follows: |
| | | | | |
|
| Year Ended January 31, 2011 | | | 1.12 | % |
| Year Ended January 31, 2010 | | | 1.15 | % |
| Year Ended January 31, 2009 | | | 1.00 | % |
| Year Ended January 31, 2008 | | | 0.95 | % |
| Year Ended January 31, 2007 | | | 1.01 | % |
See accompanying Notes to Financial Statements.
27 | MODERATE INVESTOR FUND
FINANCIAL HIGHLIGHTS Continued
| | | | | | | | | | | | | | | | | | | | | |
| Class B Year Ended January 31, | | 2011 | | | 2010 | | | 2009 | | | 2008 | | | 2007 | |
| |
Per Share Operating Data | | | | | | | | | | | | | | | | | | | | |
| Net asset value, beginning of period | | $ | 7.62 | | | $ | 6.09 | | | $ | 10.92 | | | $ | 11.34 | | | $ | 10.74 | |
| |
| Income (loss) from investment operations: | | | | | | | | | | | | | | | | | | | | |
Net investment income1 | | | .11 | | | | .03 | | | | .05 | | | | .42 | | | | .30 | |
| Net realized and unrealized gain (loss) | | | 1.03 | | | | 1.50 | | | | (4.47 | ) | | | (.39 | ) | | | .54 | |
| | | |
| Total from investment operations | | | 1.14 | | | | 1.53 | | | | (4.42 | ) | | | .03 | | | | .84 | |
| |
| Dividends and/or distributions to shareholders: | | | | | | | | | | | | | | | | | | | | |
| Dividends from net investment income | | | (.11 | ) | | | — | | | | (.05 | ) | | | (.36 | ) | | | (.21 | ) |
| Distributions from net realized gain | | | — | | | | — | | | | (.25 | ) | | | (.09 | ) | | | (.03 | ) |
| Tax return of capital distribution | | | — | | | | — | | | | (.11 | ) | | | — | | | | — | |
| | | |
| Total dividends and/or distributions to shareholders | | | (.11 | ) | | | — | | | | (.41 | ) | | | (.45 | ) | | | (.24 | ) |
| |
| Net asset value, end of period | | $ | 8.65 | | | $ | 7.62 | | | $ | 6.09 | | | $ | 10.92 | | | $ | 11.34 | |
| | | |
| | | | | | | | | | | | | | | | | | | | | |
Total Return, at Net Asset Value2 | | | 14.94 | % | | | 25.12 | % | | | (40.64 | )% | | | 0.18 | % | | | 7.80 | % |
| | | | | | | | | | | | | | | | | | | | | |
Ratios/Supplemental Data | | | | | | | | | | | | | | | | | | | | |
| Net assets, end of period (in thousands) | | $ | 118,398 | | | $ | 105,937 | | | $ | 86,709 | | | $ | 132,233 | | | $ | 101,929 | |
| |
| Average net assets (in thousands) | | $ | 111,116 | | | $ | 96,884 | | | $ | 123,999 | | | $ | 121,584 | | | $ | 70,066 | |
| |
Ratios to average net assets:3 | | | | | | | | | | | | | | | | | | | | |
| Net investment income | | | 1.32 | %4 | | | 0.43 | % | | | 0.49 | % | | | 3.61 | % | | | 2.73 | % |
Total expenses5 | | | 1.34 | %4 | | | 1.41 | % | | | 1.26 | % | | | 1.18 | % | | | 1.21 | % |
| Expenses after payments, waivers and/or reimbursements and reduction to custodian expenses | | | 1.34 | %4 | | | 1.40 | % | | | 1.26 | % | | | 1.18 | % | | | 1.21 | % |
| |
| Portfolio turnover rate | | | 43 | % | | | 13 | % | | | 9 | % | | | 3 | % | | | 4 | % |
| | |
| 1. | | Per share amounts calculated based on the average shares outstanding during the period. |
| |
| 2. | | Assumes an initial investment on the business day before the first day of the fiscal period, with all dividends and distributions reinvested in additional shares on the reinvestment date, and redemption at the net asset value calculated on the last business day of the fiscal period. Sales charges are not reflected in the total returns. Total returns are not annualized for periods less than one full year. Returns do not reflect the deduction of taxes that a shareholder would pay on fund distributions or the redemption of fund shares. |
| |
| 3. | | Annualized for periods less than one full year. |
| |
| 4. | | Includes the Fund’s share of the allocated expenses and/or net investment income from Oppenheimer Master Inflation Protected Securities Fund, LLC. |
| |
| 5. | | Total expenses including all underlying fund expenses were as follows: |
| | | | | |
|
| Year Ended January 31, 2011 | | | 1.99 | % |
| Year Ended January 31, 2010 | | | 2.05 | % |
| Year Ended January 31, 2009 | | | 1.84 | % |
| Year Ended January 31, 2008 | | | 1.76 | % |
| Year Ended January 31, 2007 | | | 1.82 | % |
See accompanying Notes to Financial Statements.
28 | MODERATE INVESTOR FUND
| | | | | | | | | | | | | | | | | | | | | |
| Class C Year Ended January 31, | | 2011 | | | 2010 | | | 2009 | | | 2008 | | | 2007 | |
| |
Per Share Operating Data | | | | | | | | | | | | | | | | | | | | |
| Net asset value, beginning of period | | $ | 7.61 | | | $ | 6.07 | | | $ | 10.90 | | | $ | 11.33 | | | $ | 10.73 | |
| |
| Income (loss) from investment operations: | | | | | | | | | | | | | | | | | | | | |
Net investment income1 | | | .12 | | | | .03 | | | | .05 | | | | .45 | | | | .30 | |
| Net realized and unrealized gain (loss) | | | 1.02 | | | | 1.51 | | | | (4.46 | ) | | | (.41 | ) | | | .54 | |
| | | |
| Total from investment operations | | | 1.14 | | | | 1.54 | | | | (4.41 | ) | | | .04 | | | | .84 | |
| |
| Dividends and/or distributions to shareholders: | | | | | | | | | | | | | | | | | | | | |
| Dividends from net investment income | | | (.12 | ) | | | — | | | | (.06 | ) | | | (.38 | ) | | | (.21 | ) |
| Distributions from net realized gain | | | — | | | | — | | | | (.25 | ) | | | (.09 | ) | | | (.03 | ) |
| Tax return of capital distribution | | | — | | | | — | | | | (.11 | ) | | | — | | | | — | |
| | | |
| Total dividends and/or distributions to shareholders | | | (.12 | ) | | | — | | | | (.42 | ) | | | (.47 | ) | | | (.24 | ) |
| |
| Net asset value, end of period | | $ | 8.63 | | | $ | 7.61 | | | $ | 6.07 | | | $ | 10.90 | | | $ | 11.33 | |
| | | |
| | | | | | | | | | | | | | | | | | | | | |
Total Return, at Net Asset Value2 | | | 14.97 | % | | | 25.37 | % | | | (40.66 | )% | | | 0.24 | % | | | 7.85 | % |
| | | | | | | | | | | | | | | | | | | | | |
Ratios/Supplemental Data | | | | | | | | | | | | | | | | | | | | |
| Net assets, end of period (in thousands) | | $ | 230,368 | | | $ | 194,113 | | | $ | 158,155 | | | $ | 231,792 | | | $ | 142,351 | |
| |
| Average net assets (in thousands) | | $ | 209,895 | | | $ | 175,655 | | | $ | 223,472 | | | $ | 193,641 | | | $ | 95,773 | |
| |
Ratios to average net assets:3 | | | | | | | | | | | | | | | | | | | | |
| Net investment income | | | 1.42 | %4 | | | 0.45 | % | | | 0.56 | % | | | 3.88 | % | | | 2.78 | % |
Total expenses5 | | | 1.25 | %4 | | | 1.30 | % | | | 1.20 | % | | | 1.14 | % | | | 1.16 | % |
| Expenses after payments, waivers and/or reimbursements and reduction to custodian expenses | | | 1.25 | %4 | | | 1.30 | % | | | 1.20 | % | | | 1.14 | % | | | 1.16 | % |
| |
| Portfolio turnover rate | | | 43 | % | | | 13 | % | | | 9 | % | | | 3 | % | | | 4 | % |
| | |
| 1. | | Per share amounts calculated based on the average shares outstanding during the period. |
| |
| 2. | | Assumes an initial investment on the business day before the first day of the fiscal period, with all dividends and distributions reinvested in additional shares on the reinvestment date, and redemption at the net asset value calculated on the last business day of the fiscal period. Sales charges are not reflected in the total returns. Total returns are not annualized for periods less than one full year. Returns do not reflect the deduction of taxes that a shareholder would pay on fund distributions or the redemption of fund shares. |
| |
| 3. | | Annualized for periods less than one full year. |
| |
| 4. | | Includes the Fund’s share of the allocated expenses and/or net investment income from Oppenheimer Master Inflation Protected Securities Fund, LLC. |
| |
| 5. | | Total expenses including all underlying fund expenses were as follows: |
| | | | | |
|
| Year Ended January 31, 2011 | | | 1.90 | % |
| Year Ended January 31, 2010 | | | 1.94 | % |
| Year Ended January 31, 2009 | | | 1.78 | % |
| Year Ended January 31, 2008 | | | 1.72 | % |
| Year Ended January 31, 2007 | | | 1.77 | % |
See accompanying Notes to Financial Statements.
29 | MODERATE INVESTOR FUND
FINANCIAL HIGHLIGHTS Continued
| | | | | | | | | | | | | | | | | | | | | |
| Class N Year Ended January 31, | | 2011 | | | 2010 | | | 2009 | | | 2008 | | | 2007 | |
| |
Per Share Operating Data | | | | | | | | | | | | | | | | | | | | |
| Net asset value, beginning of period | | $ | 7.67 | | | $ | 6.09 | | | $ | 10.96 | | | $ | 11.38 | | | $ | 10.76 | |
| |
| Income (loss) from investment operations: | | | | | | | | | | | | | | | | | | | | |
Net investment income1 | | | .16 | | | | .04 | | | | .11 | | | | .51 | | | | .40 | |
| Net realized and unrealized gain (loss) | | | 1.04 | | | | 1.54 | | | | (4.51 | ) | | | (.41 | ) | | | .51 | |
| | | |
| Total from investment operations | | | 1.20 | | | | 1.58 | | | | (4.40 | ) | | | .10 | | | | .91 | |
| |
| Dividends and/or distributions to shareholders: | | | | | | | | | | | | | | | | | | | | |
| Dividends from net investment income | | | (.16 | ) | | | — | | | | (.11 | ) | | | (.43 | ) | | | (.26 | ) |
| Distributions from net realized gain | | | — | | | | — | | | | (.25 | ) | | | (.09 | ) | | | (.03 | ) |
| Tax return of capital distribution | | | — | | | | — | | | | (.11 | ) | | | — | | | | — | |
| | | |
| Total dividends and/or distributions to shareholders | | | (.16 | ) | | | — | | | | (.47 | ) | | | (.52 | ) | | | (.29 | ) |
| |
| Net asset value, end of period | | $ | 8.71 | | | $ | 7.67 | | | $ | 6.09 | | | $ | 10.96 | | | $ | 11.38 | |
| | | |
| | | | | | | | | | | | | | | | | | | | | |
Total Return, at Net Asset Value2 | | | 15.62 | % | | | 25.94 | % | | | (40.36 | )% | | | 0.72 | % | | | 8.47 | % |
| | | | | | | | | | | | | | | | | | | | | |
Ratios/Supplemental Data | | | | | | | | | | | | | | | | | | | | |
| Net assets, end of period (in thousands) | | $ | 109,375 | | | $ | 93,550 | | | $ | 72,712 | | | $ | 96,080 | | | $ | 51,620 | |
| |
| Average net assets (in thousands) | | $ | 101,701 | | | $ | 85,066 | | | $ | 96,842 | | | $ | 73,754 | | | $ | 27,110 | |
| |
Ratios to average net assets:3 | | | | | | | | | | | | | | | | | | | | |
| Net investment income | | | 1.93 | %4 | | | 0.61 | % | | | 1.13 | % | | | 4.36 | % | | | 3.58 | % |
Total expenses5 | | | 0.73 | %4 | | | 0.78 | % | | | 0.69 | % | | | 0.64 | % | | | 0.65 | % |
| Expenses after payments, waivers and/or reimbursements and reduction to custodian expenses | | | 0.73 | %4 | | | 0.78 | % | | | 0.69 | % | | | 0.64 | % | | | 0.65 | % |
| |
| Portfolio turnover rate | | | 43 | % | | | 13 | % | | | 9 | % | | | 3 | % | | | 4 | % |
| | |
| 1. | | Per share amounts calculated based on the average shares outstanding during the period. |
| |
| 2. | | Assumes an initial investment on the business day before the first day of the fiscal period, with all dividends and distributions reinvested in additional shares on the reinvestment date, and redemption at the net asset value calculated on the last business day of the fiscal period. Sales charges are not reflected in the total returns. Total returns are not annualized for periods less than one full year. Returns do not reflect the deduction of taxes that a shareholder would pay on fund distributions or the redemption of fund shares. |
| |
| 3. | | Annualized for periods less than one full year. |
| |
| 4. | | Includes the Fund’s share of the allocated expenses and/or net investment income from Oppenheimer Master Inflation Protected Securities Fund, LLC. |
| |
| 5. | | Total expenses including all underlying fund expenses were as follows: |
| | | | | |
|
| Year Ended January 31, 2011 | | | 1.38 | % |
| Year Ended January 31, 2010 | | | 1.42 | % |
| Year Ended January 31, 2009 | | | 1.27 | % |
| Year Ended January 31, 2008 | | | 1.22 | % |
| Year Ended January 31, 2007 | | | 1.26 | % |
See accompanying Notes to Financial Statements.
30 | MODERATE INVESTOR FUND
| | | | | | | | | | | | | | | | | | | | | |
| Class Y Year Ended January 31, | | 2011 | | | 2010 | | | 2009 | | | 2008 | | | 2007 | |
| |
Per Share Operating Data | | | | | | | | | | | | | | | | | | | | |
| Net asset value, beginning of period | | $ | 7.75 | | | $ | 6.14 | | | $ | 11.05 | | | $ | 11.45 | | | $ | 10.79 | |
| |
| Income (loss) from investment operations: | | | | | | | | | | | | | | | | | | | | |
Net investment income1 | | | .22 | | | | .05 | | | | .18 | | | | .55 | | | | .56 | |
| Net realized and unrealized gain (loss) | | | 1.04 | | | | 1.60 | | | | (4.57 | ) | | | (.38 | ) | | | .43 | |
| | | |
| Total from investment operations | | | 1.26 | | | | 1.65 | | | | (4.39 | ) | | | .17 | | | | .99 | |
| |
| Dividends and/or distributions to shareholders: | | | | | | | | | | | | | | | | | | | | |
| Dividends from net investment income | | | (.21 | ) | | | (.04 | ) | | | (.16 | ) | | | (.48 | ) | | | (.30 | ) |
| Distributions from net realized gain | | | — | | | | — | | | | (.25 | ) | | | (.09 | ) | | | (.03 | ) |
| Tax return of capital distribution | | | — | | | | — | | | | (.11 | ) | | | — | | | | — | |
| | | |
| Total dividends and/or distributions to shareholders | | | (.21 | ) | | | (.04 | ) | | | (.52 | ) | | | (.57 | ) | | | (.33 | ) |
| |
| Net asset value, end of period | | $ | 8.80 | | | $ | 7.75 | | | $ | 6.14 | | | $ | 11.05 | | | $ | 11.45 | |
| | | |
| | | | | | | | | | | | | | | | | | | | | |
Total Return, at Net Asset Value2 | | | 16.32 | % | | | 26.81 | % | | | (39.90 | )% | | | 1.39 | % | | | 9.18 | % |
| | | | | | | | | | | | | | | | | | | | | |
Ratios/Supplemental Data | | | | | | | | | | | | | | | | | | | | |
| Net assets, end of period (in thousands) | | $ | 6,631 | | | $ | 2,700 | | | $ | 1,932 | | | $ | 1,860 | | | $ | 1,172 | |
| |
| Average net assets (in thousands) | | $ | 4,695 | | | $ | 2,137 | | | $ | 2,296 | | | $ | 1,315 | | | $ | 335 | |
| |
Ratios to average net assets:3 | | | | | | | | | | | | | | | | | | | | |
| Net investment income | | | 2.68 | %4 | | | 0.72 | % | | | 1.91 | % | | | 4.67 | % | | | 5.06 | % |
Total expenses5 | | | 0.08 | %4 | | | 0.09 | % | | | 0.05 | % | | | 0.02 | % | | | 0.00 | % |
| Expenses after payments, waivers and/or reimbursements and reduction to custodian expenses | | | 0.08 | %4 | | | 0.09 | % | | | 0.05 | % | | | 0.02 | % | | | 0.00 | % |
| |
| Portfolio turnover rate | | | 43 | % | | | 13 | % | | | 9 | % | | | 3 | % | | | 4 | % |
| | |
| 1. | | Per share amounts calculated based on the average shares outstanding during the period. |
| |
| 2. | | Assumes an initial investment on the business day before the first day of the fiscal period, with all dividends and distributions reinvested in additional shares on the reinvestment date, and redemption at the net asset value calculated on the last business day of the fiscal period. Sales charges are not reflected in the total returns. Total returns are not annualized for periods less than one full year. Returns do not reflect the deduction of taxes that a shareholder would pay on fund distributions or the redemption of fund shares. |
| |
| 3. | | Annualized for periods less than one full year. |
| |
| 4. | | Includes the Fund’s share of the allocated expenses and/or net investment income from Oppenheimer Master Inflation Protected Securities Fund, LLC. |
| |
| 5. | | Total expenses including all underlying fund expenses were as follows: |
| | | | | |
|
| Year Ended January 31, 2011 | | | 0.73 | % |
| Year Ended January 31, 2010 | | | 0.73 | % |
| Year Ended January 31, 2009 | | | 0.63 | % |
| Year Ended January 31, 2008 | | | 0.60 | % |
| Year Ended January 31, 2007 | | | 0.61 | % |
See accompanying Notes to Financial Statements.
31 | MODERATE INVESTOR FUND
NOTES TO FINANCIAL STATEMENTS
1. Significant Accounting Policies
Oppenheimer Portfolio Series (the “Trust”) is registered under the Investment Company Act of 1940, as amended, as an open-end management investment company. Moderate Investor Fund (the “Fund”) is a series of the Trust whose investment objective is to seek long term growth of capital and current income. The Fund normally invests in a diversified portfolio of Oppenheimer mutual funds (individually, an “Underlying Fund” and collectively, the “Underlying Funds”). The Fund’s investment adviser is OppenheimerFunds, Inc. (the “Manager”).
The Fund offers Class A, Class B, Class C, Class N and Class Y shares. Class A shares are sold at their offering price, which is normally net asset value plus a front-end sales charge. Class B, Class C and Class N shares are sold without a front-end sales charge but may be subject to a contingent deferred sales charge (“CDSC”). Class N shares are sold only through retirement plans. Retirement plans that offer Class N shares may impose charges on those accounts. Class Y shares are sold to certain institutional investors or intermediaries without either a front-end sales charge or a CDSC, however, the intermediaries may impose charges on their accountholders who beneficially own Y shares. All classes of shares have identical rights and voting privileges with respect to the Fund in general and exclusive voting rights on matters that affect that class alone. Earnings, net assets and net asset value per share may differ due to each class having its own expenses, such as transfer and shareholder servicing agent fees and shareholder communications, directly attributable to that class. Class A, B, C and N have separate distribution and/or service plans under which they pay fees. Class Y shares do not pay such fees. Class B shares will automatically convert to Class A shares 72 months after the date of purchase.
The following is a summary of significant accounting policies consistently followed by the Fund.
Securities Valuation. The Fund calculates the net asset value of its shares based upon the net asset value of the applicable Underlying Fund. For each Underlying Fund, the net asset value per share for a class of shares is determined as of the close of the New York Stock Exchange (the “Exchange”), normally 4:00 P.M. Eastern time, on each day the Exchange is open for trading by dividing the value of the Underlying Fund’s net assets attributable to that class by the number of outstanding shares of that class on that day.
To determine their net asset values, the Underlying Funds’ assets are valued primarily on the basis of current market quotations. In the absence of a readily available unadjusted quoted market price, including for assets whose values have been materially affected by what the Manager identifies as a significant event occurring before the Underlying Fund’s assets are valued but after the close of their respective exchanges, the Manager, acting through its internal valuation committee, in good faith determines the fair valuation of that Underlying Fund’s assets using consistently applied procedures under the supervision of the Board of Trustees. The methodologies used for valuing assets are not necessarily an indication of the risks associated with investing in those Underlying Funds.
32 | MODERATE INVESTOR FUND
Each investment asset or liability of the Fund is assigned a level at measurement date based on the significance and source of the inputs to its valuation. Unadjusted quoted prices in active markets for identical assets or liabilities are classified as “Level 1,” inputs other than unadjusted quoted prices for an asset that are observable are classified as “Level 2” and significant unobservable inputs, including the Manager’s judgment about the assumptions that a market participant would use in pricing an asset or liability, are classified as “Level 3.” The inputs used for valuing assets and liabilities are not necessarily an indication of the risks associated with investing in those assets or liabilities. A table summarizing the Fund’s investments under these levels of classification is included following the Statement of Investments.
The Fund classifies each of its investments in the Underlying Funds as Level 1, without consideration as to the classification level of the specific investments held by the Underlying Funds.
There have been no significant changes to the fair valuation methodologies of the Fund during the period.
Risks of Investing in the Underlying Funds. Each of the Underlying Funds in which the Fund invests has its own investment risks, and those risks can affect the value of the Fund’s investments and therefore the value of the Fund’s shares. To the extent that the Fund invests more of its assets in one Underlying Fund than in another, the Fund will have greater exposure to the risks of that Underlying Fund.
Investment in Oppenheimer Institutional Money Market Fund. The Fund is permitted to invest daily available cash balances in an affiliated money market fund. The Fund may invest the available cash in Class E shares of Oppenheimer Institutional Money Market Fund (“IMMF”) to seek current income while preserving liquidity. IMMF is a registered open-end management investment company, regulated as a money market fund under the Investment Company Act of 1940, as amended. The Manager is also the investment adviser of IMMF. When applicable, the Fund’s investment in IMMF is included in the Statement of Investments. As a shareholder, the Fund is subject to its proportional share of IMMF’s Class E expenses, including its management fee.
Investment in Oppenheimer Master Fund. The Fund is permitted to invest in entities sponsored and/or advised by the Manager or an affiliate. Certain of these entities in which the Fund invests are mutual funds registered under the Investment Company Act of 1940 that expect to be treated as partnerships for tax purposes, specifically Oppenheimer Master Inflation Protected Securities Fund, LLC (the “Master Fund”). The Master Fund has its own investment risks, and those risks can affect the value of the Fund’s investments and therefore the value of the Fund’s shares. To the extent that the Fund invests more of its assets in the Master Fund, the Fund will have greater exposure to the risks of the Master Fund.
The investment objective of the Master Fund is to seek total return. The Fund’s investment in the Master Fund is included in the Statement of Investments. The Fund
33 | MODERATE INVESTOR FUND
NOTES TO FINANCIAL STATEMENTS Continued
1. Significant Accounting Policies Continued
recognizes income and gain/(loss) on its investment in the Master Fund according to its allocated pro-rata share, based on its relative proportion of total outstanding Master Fund shares held, of the total net income earned and the net gain/(loss) realized on investments sold by the Master Fund. As a shareholder, the Fund is subject to its proportional share of the Master Fund’s expenses, including its management fee.
Allocation of Income, Expenses, Gains and Losses. Income, expenses (other than those attributable to a specific class), gains and losses are allocated on a daily basis to each class of shares based upon the relative proportion of net assets represented by such class. Operating expenses directly attributable to a specific class are charged against the operations of that class.
Federal Taxes. The Fund intends to comply with provisions of the Internal Revenue Code applicable to regulated investment companies and to distribute substantially all of its investment company taxable income, including any net realized gain on investments not offset by capital loss carryforwards, if any, to shareholders. Therefore, no federal income or excise tax provision is required. The Fund files income tax returns in U.S. federal and applicable state jurisdictions. The statute of limitations on the Fund’s tax return filings generally remain open for the three preceding fiscal reporting period ends.
The tax components of capital shown in the following table represent distribution requirements the Fund must satisfy under the income tax regulations, losses the Fund may be able to offset against income and gains realized in future years and unrealized appreciation or depreciation of securities and other investments for federal income tax purposes.
| | | | | | | | | | | | | |
| | | | | | | | | | | Net Unrealized | |
| | | | | | | | | | | Depreciation | |
| | | | | | | | | | | Based on Cost of | |
| | | | | | | | | | | Securities and Other | |
| Undistributed | | Undistributed | | | Accumulated | | | Investments for | |
| Net Investment | | Long-Term | | | Loss | | | Federal Income | |
| Income | | Gain | | | Carryforward1,2,3 | | | Tax Purposes | |
| |
| $5,850,387 | | $ | — | | | $ | 171,454,566 | | | $ | 51,852,624 | |
| | |
| 1. | | As of January 31, 2011, the Fund had $171,454,566 of net capital loss carryforwards available to offset future realized capital gains, if any, and thereby reduce future taxable gain distributions. As of January 31, 2011, details of the capital loss carryforwards were as follows: |
| | | | | |
| Expiring | | | | |
| |
| 2018 | | $ | 28,839,447 | |
| 2019 | | | 142,615,119 | |
| | | | |
| Total | | $ | 171,454,566 | |
| | | | |
| 2. | | During the fiscal year ended January 31, 2011, the Fund did not utilize any capital loss carryforward. |
| |
| 3. | | During the fiscal year ended January 31, 2010, the Fund did not utilize any capital loss carryforward. |
34 | MODERATE INVESTOR FUND
Net investment income (loss) and net realized gain (loss) may differ for financial statement and tax purposes. The character of dividends and distributions made during the fiscal year from net investment income or net realized gains may differ from their ultimate characterization for federal income tax purposes. Also, due to timing of dividends and distributions, the fiscal year in which amounts are distributed may differ from the fiscal year in which the income or net realized gain was recorded by the Fund.
The tax character of distributions paid during the years ended January 31, 2011 and January 31, 2010 was as follows:
| | | | | | | | | |
| | | Year Ended | | | Year Ended | |
| | | January 31, 2011 | | | January 31, 2010 | |
| |
| Distributions paid from: | | | | | | | | |
| Ordinary income | | $ | 17,378,052 | | | $ | 512,704 | |
The aggregate cost of securities and other investments and the composition of unrealized appreciation and depreciation of securities and other investments for federal income tax purposes as of January 31, 2011 are noted in the following table. The primary difference between book and tax appreciation or depreciation of securities and other investments, if applicable, is attributable to the tax deferral of losses or tax realization of financial statement unrealized gain or loss.
| | | | | |
|
| Federal tax cost of securities | | $ | 1,060,056,870 | |
| | | | |
| Gross unrealized appreciation | | $ | 69,672,200 | |
| Gross unrealized depreciation | | | (121,524,824 | ) |
| | | | |
| Net unrealized depreciation | | $ | (51,852,624 | ) |
| | | | |
Trustees’ Compensation. The Fund has adopted an unfunded retirement plan (the “Plan”) for the Fund’s independent trustees. Benefits are based on years of service and fees paid to each trustee during their period of service. The Plan was frozen with respect to adding new participants effective December 31, 2006 (the “Freeze Date”) and existing Plan Participants as of the Freeze Date will continue to receive accrued benefits under the Plan. Active independent trustees as of the Freeze Date have each elected a distribution method with respect to their benefits under the Plan. During the year ended January 31, 2011, the Fund’s projected benefit obligations, payments to retired trustees and accumulated liability were as follows:
| | | | | |
|
| Projected Benefit Obligations Increased | | $ | 253 | |
| Payments Made to Retired Trustees | | | 4,973 | |
| Accumulated Liability as of January 31, 2011 | | | 37,277 | |
The Board of Trustees has adopted a compensation deferral plan for independent trustees that enables trustees to elect to defer receipt of all or a portion of the annual compensation they are entitled to receive from the Fund. For purposes of determining the amount owed to the Trustee under the plan, deferred amounts are treated as though equal dollar amounts had been invested in shares of the Fund or in other Oppenheimer funds selected
35 | MODERATE INVESTOR FUND
NOTES TO FINANCIAL STATEMENTS Continued
1. Significant Accounting Policies Continued
by the Trustee. The Fund purchases shares of the funds selected for deferral by the Trustee in amounts equal to his or her deemed investment, resulting in a Fund asset equal to the deferred compensation liability. Such assets are included as a component of “Other” within the asset section of the Statement of Assets and Liabilities. Deferral of trustees’ fees under the plan will not affect the net assets of the Fund, and will not materially affect the Fund’s assets, liabilities or net investment income per share. Amounts will be deferred until distributed in accordance with the compensation deferral plan.
Dividends and Distributions to Shareholders. Dividends and distributions to shareholders, which are determined in accordance with income tax regulations and may differ from U.S. generally accepted accounting principles, are recorded on the ex-dividend date. Income and capital gain distributions, if any, are declared and paid annually or at other times as deemed necessary by the Manager.
Investment Income. Dividend distributions received from the Underlying Funds are recorded on the ex-dividend date. Upon receipt of notification from an Underlying Fund, and subsequent to the ex-dividend date, some of the dividend income originally recorded by the Fund may be reclassified as a tax return of capital by reducing the cost basis of the Underlying Fund and/or increasing the realized gain on sales of investments in the Underlying Fund.
Custodian Fees. “Custodian fees and expenses” in the Statement of Operations may include interest expense incurred by the Fund on any cash overdrafts of its custodian account during the period. Such cash overdrafts may result from the effects of failed trades in portfolio securities and from cash outflows resulting from unanticipated shareholder redemption activity. The Fund pays interest to its custodian on such cash overdraft at a rate equal to the 1 Month LIBOR Rate plus 2.00%. The “Reduction to custodian expenses” line item, if applicable, represents earnings on cash balances maintained by the Fund during the period. Such interest expense and other custodian fees may be paid with these earnings.
Security Transactions. Security transactions are recorded on the trade date. Realized gains and losses on securities sold are determined on the basis of identified cost.
Indemnifications. The Fund’s organizational documents provide current and former trustees and officers with a limited indemnification against liabilities arising in connection with the performance of their duties to the Fund. In the normal course of business, the Fund may also enter into contracts that provide general indemnifications. The Fund’s maximum exposure under these arrangements is unknown as this would be dependent on future claims that may be made against the Fund. The risk of material loss from such claims is considered remote.
36 | MODERATE INVESTOR FUND
Other. The preparation of financial statements in conformity with accounting principles generally accepted in the United States of America requires management to make estimates and assumptions that affect the reported amounts of assets and liabilities and disclosure of contingent assets and liabilities at the date of the financial statements and the reported amounts of increases and decreases in net assets from operations during the reporting period. Actual results could differ from those estimates.
2. Shares of Beneficial Interest
The Fund has authorized an unlimited number of $0.001 par value shares of beneficial interest of each class. Transactions in shares of beneficial interest were as follows:
| | | | | | | | | | | | | | | | | |
| | | Year Ended January 31, 2011 | | | Year Ended January 31, 2010 | |
| | | Shares | | | Amount | | | Shares | | | Amount | |
| |
Class A | | | | | | | | | | | | | | | | |
| Sold | | | 17,009,766 | | | $ | 140,102,843 | | | | 17,143,278 | | | $ | 118,587,531 | |
| Dividends and/or distributions reinvested | | | 1,192,639 | | | | 10,375,957 | | | | 60,831 | | | | 477,320 | |
| Redeemed | | | (14,676,234 | ) | | | (120,390,066 | ) | | | (16,398,623 | ) | | | (111,882,186 | ) |
| | | |
| Net increase | | | 3,526,171 | | | $ | 30,088,734 | | | | 805,486 | | | $ | 7,182,665 | |
| | | |
| | | | | | | | | | | | | | | | | |
Class B | | | | | | | | | | | | | | | | |
| Sold | | | 2,747,129 | | | $ | 22,215,167 | | | | 3,603,022 | | | $ | 24,641,823 | |
| Dividends and/or distributions reinvested | | | 166,082 | | | | 1,426,645 | | | | — | | | | — | |
| Redeemed | | | (3,130,165 | ) | | | (25,212,417 | ) | | | (3,939,040 | ) | | | (26,586,578 | ) |
| | | |
| Net decrease | | | (216,954 | ) | | $ | (1,570,605 | ) | | | (336,018 | ) | | $ | (1,944,755 | ) |
| | | |
| | | | | | | | | | | | | | | | | |
Class C | | | | | | | | | | | | | | | | |
| Sold | | | 7,205,462 | | | $ | 58,567,346 | | | | 8,103,186 | | | $ | 55,242,942 | |
| Dividends and/or distributions reinvested | | | 349,942 | | | | 2,999,007 | | | | — | | | | — | |
| Redeemed | | | (6,391,189 | ) | | | (51,709,023 | ) | | | (8,622,965 | ) | | | (57,588,023 | ) |
| | | |
| Net increase (decrease) | | | 1,164,215 | | | $ | 9,857,330 | | | | (519,779 | ) | | $ | (2,345,081 | ) |
| | | |
| | | | | | | | | | | | | | | | | |
Class N | | | | | | | | | | | | | | | | |
| Sold | | | 3,969,297 | | | $ | 32,614,214 | | | | 4,587,876 | | | $ | 31,183,577 | |
| Dividends and/or distributions reinvested | | | 202,295 | | | | 1,749,854 | | | | — | | | | — | |
| Redeemed | | | (3,814,677 | ) | | | (31,487,404 | ) | | | (4,324,663 | ) | | | (29,717,612 | ) |
| | | |
| Net increase | | | 356,915 | | | $ | 2,876,664 | | | | 263,213 | | | $ | 1,465,965 | |
| | | |
| | | | | | | | | | | | | | | | | |
Class Y | | | | | | | | | | | | | | | | |
| Sold | | | 558,836 | | | $ | 4,576,221 | | | | 242,353 | | | $ | 1,692,437 | |
| Dividends and/or distributions reinvested | | | 17,048 | | | | 148,832 | | | | 1,392 | | | | 10,986 | |
| Redeemed | | | (171,128 | ) | | | (1,421,109 | ) | | | (210,015 | ) | | | (1,428,131 | ) |
| | | |
| Net increase | | | 404,756 | | | $ | 3,303,944 | | | | 33,730 | | | $ | 275,292 | |
| | | |
37 | MODERATE INVESTOR FUND
NOTES TO FINANCIAL STATEMENTS Continued
3. Purchases and Sales of Securities
The aggregate cost of purchases and proceeds from sales of securities, other than short-term obligations and investments in IMMF, for the year ended January 31, 2011, were as follows:
| | | | | | | | | |
| | | Purchases | | | Sales | |
| |
| Investment securities | | $ | 412,144,343 | | | $ | 390,448,987 | |
4. Fees and Other Transactions with Affiliates
Management Fees. Under the investment advisory agreement, the Manager does not charge a management fee, but rather collects indirect management fees from the Fund’s investments in the Underlying Funds and in IMMF. The weighted indirect management fees collected from the Fund’s investment in the Underlying Funds and in IMMF, as a percent of average daily net assets of the Fund for the year ended January 31, 2011 was 0.55%. This amount is gross of any waivers or reimbursements of management fees implemented at the Underlying Fund level.
Administration Service Fees. The Fund pays the Manager a fee of $1,500 per year for preparing and filing the Fund’s tax returns.
Transfer Agent Fees. OppenheimerFunds Services (“OFS”), a division of the Manager, acts as the transfer and shareholder servicing agent for the Fund. The Fund pays OFS a per account fee. For the year ended January 31, 2011, the Fund paid $1,849,571 to OFS for services to the Fund.
Additionally, Class Y shares are subject to minimum fees of $10,000 annually for assets of $10 million or more. The Class Y shares are subject to the minimum fees in the event that the per account fee does not equal or exceed the applicable minimum fees. OFS may voluntarily waive the minimum fees.
Distribution and Service Plan (12b-1) Fees. Under its General Distributor’s Agreement with the Fund, OppenheimerFunds Distributor, Inc. (the “Distributor”) acts as the Fund’s principal underwriter in the continuous public offering of the Fund’s classes of shares.
Service Plan for Class A Shares. The Fund has adopted a Service Plan (the “Plan”) for Class A shares under Rule 12b-1 of the Investment Company Act of 1940. Under the Plan, the Fund reimburses the Distributor for a portion of its costs incurred for services provided to accounts that hold Class A shares. Reimbursement is made periodically at an annual rate of up to 0.25% of the daily net assets of Class A shares of the Fund. The Distributor currently uses all of those fees to pay dealers, brokers, banks and other financial institutions periodically for providing personal service and maintenance of accounts of their customers that hold Class A shares. Any unreimbursed expenses the Distributor incurs with respect to Class A shares in any fiscal year cannot be recovered in subsequent periods. Fees incurred by the Fund under the Plan are detailed in the Statement of Operations.
38 | MODERATE INVESTOR FUND
Distribution and Service Plans for Class B, Class C and Class N Shares. The Fund has adopted Distribution and Service Plans (the “Plans”) for Class B, Class C and Class N shares under Rule 12b-1 of the Investment Company Act of 1940 to compensate the Distributor for its services in connection with the distribution of those shares and servicing accounts. Under the Plans, the Fund pays the Distributor an annual asset-based sales charge of 0.75% on Class B and Class C shares daily net assets and 0.25% on Class N shares daily net assets. The Distributor also receives a service fee of 0.25% per year under each plan. If either the Class B, Class C or Class N plan is terminated by the Fund or by the shareholders of a class, the Board of Trustees and its independent trustees must determine whether the Distributor shall be entitled to payment from the Fund of all or a portion of the service fee and/or asset-based sales charge in respect to shares sold prior to the effective date of such termination. Fees incurred by the Fund under the Plans are detailed in the Statement of Operations. The Distributor determines its uncompensated expenses under the Plans at calendar quarter ends. The Distributor’s aggregate uncompensated expenses under the Plans at December 31, 2010 were as follows:
| | | | | |
|
| Class B | | $ | 1,703,115 | |
| Class C | | | 2,805,327 | |
| Class N | | | 1,552,500 | |
Sales Charges. Front-end sales charges and contingent deferred sales charges (“CDSC”) do not represent expenses of the Fund. They are deducted from the proceeds of sales of Fund shares prior to investment or from redemption proceeds prior to remittance, as applicable. The sales charges retained by the Distributor from the sale of shares and the CDSC retained by the Distributor on the redemption of shares is shown in the following table for the period indicated.
| | | | | | | | | | | | | | | | | | | | | |
| | | | | | | Class A | | | Class B | | | Class C | | | Class N | |
| | | Class A | | | Contingent | | | Contingent | | | Contingent | | | Contingent | |
| | | Front-End | | | Deferred | | | Deferred | | | Deferred | | | Deferred | |
| | | Sales Charges | | | Sales Charges | | | Sales Charges | | | Sales Charges | | | Sales Charges | |
| | | Retained by | | | Retained by | | | Retained by | | | Retained by | | | Retained by | |
| Year Ended | | Distributor | | | Distributor | | | Distributor | | | Distributor | | | Distributor | |
| |
| January 31, 2011 | | $ | 748,129 | | | $ | 1,847 | | | $ | 285,437 | | | $ | 27,906 | | | $ | 5,520 | |
Waivers and Reimbursements of Expenses. The Manager has voluntarily agreed to waive fees and/or reimburse the Fund for certain expenses so that “Total expenses,” (the combined direct (Fund level) and indirect (Underlying Fund level) expenses), as a percentage of daily net assets, will not exceed the annual rate of 1.30%, 2.05%, 2.05%, 1.55% and 1.05%, for Class A, Class B, Class C, Class N and Class Y, respectively. During the year ended January 31, 2011, the Manager waived fees and/or reimbursed the Fund $623 for Class B shares. The expense limitations do not include extraordinary expenses and other expenses not incurred in the ordinary course of the Fund’s business. This limitation will be applied after giving effect to any reimbursements by the Distributor of 12b-1 fees paid by the Fund with respect to investments in Class A shares of any Underlying Funds that do not offer Class Y shares. Notwithstanding the foregoing limits, the Manager is not required to waive or
39 | MODERATE INVESTOR FUND
NOTES TO FINANCIAL STATEMENTS Continued
4. Fees and Other Transactions with Affiliates Continued
reimburse Fund expenses in excess of the amount of indirect management fees earned from investments in the Underlying Funds and IMMF.
The Distributor reimbursed Fund expenses in an amount equal to the distribution and service plan fees incurred through the Fund’s investment in the Class A shares of Oppenheimer Gold & Special Minerals Fund which, for the year ended January 31, 2011 was $5,476.
OFS has voluntarily agreed to limit transfer and shareholder servicing agent fees for all classes to 0.35% of average annual net assets per class.
Some of these undertakings may be modified or terminated at any time; some may not be modified or terminated until after one year from the date of the current prospectus, as indicated therein.
5. Pending Litigation
Since 2009, a number of lawsuits have been pending in federal courts against the Manager, the Distributor, and certain mutual funds (“Defendant Funds”) advised by the Manager and distributed by the Distributor (but not including the Fund). The lawsuits naming the Defendant Funds also name as defendants certain officers and current and former trustees of the respective Defendant Funds. The plaintiffs seek class action status on behalf of purchasers of shares of the respective Defendant Fund during a particular time period. The lawsuits raise claims under federal securities laws alleging that, among other things, the disclosure documents of the respective Defendant Fund contained misrepresentations and omissions, that such Defendant Fund’s investment policies were not followed, and that such Defendant Fund and the other defendants violated federal securities laws and regulations. The plaintiffs seek unspecified damages, equitable relief and an award of attorneys’ fees and litigation expenses.
In 2009, what are claimed to be derivative lawsuits were filed in state court against the Manager and a subsidiary (but not against the Fund), on behalf of the New Mexico Education Plan Trust. These lawsuits allege breach of contract, breach of fiduciary duty, negligence and violation of state securities laws, and seek compensatory damages, equitable relief and an award of attorneys’ fees and litigation expenses.
Other lawsuits have been filed since 2008 in various state and federal courts, against the Manager and certain of its affiliates. Those lawsuits were filed by investors who made investments through an affiliate of the Manager, and relate to the alleged investment fraud perpetrated by Bernard Madoff and his firm (“Madoff ”). Those suits allege a variety of claims, including breach of fiduciary duty, fraud, negligent misrepresentation, unjust enrichment, and violation of federal and state securities laws and regulations, among others. They seek unspecified damages, equitable relief and an award of attorneys’ fees and litigation expenses. None of the suits have named the Distributor, any of the Oppenheimer mutual funds or any of their independent Trustees or Directors as defendants. None of the Oppenheimer funds invested in any funds or accounts managed by Madoff.
40 | MODERATE INVESTOR FUND
The Manager believes that the lawsuits described above are without legal merit and is defending against them vigorously. The Defendant Funds’ Boards of Trustees have also engaged counsel to defend the suits brought against those Funds and the present and former Independent Trustees named in those suits. While it is premature to render any opinion as to the outcome in these lawsuits, or whether any costs that the Defendant Funds may bear in defending the suits might not be reimbursed by insurance, the Manager believes that these suits should not impair the ability of the Manager or the Distributor to perform their respective duties to the Fund, and that the outcome of all of the suits together should not have any material effect on the operations of any of the Oppenheimer funds.
6. Subsequent Event
The Regulated Investment Company Modernization Act of 2010 (the “Act”) was signed into law on December 22, 2010. The Act makes changes to a number of tax rules impacting the Fund. Under the Act, future capital losses generated by a fund may be carried over indefinitely, but these losses must be used prior to the utilization of any pre-enactment capital losses. Since pre-enactment capital losses may only be carried forward for eight years, there may be a greater likelihood that all or a portion of a fund’s pre-enactment capital losses will expire unused. In general, the provisions of the Act will be effective for the Fund’s fiscal year ending 2012. Specific information regarding the impact of the Act on the Fund will be contained within the “Federal Taxes” section of the financial statement notes for the fiscal year ending 2012.
41 | MODERATE INVESTOR FUND
REPORT OF INDEPENDENT REGISTERED PUBLIC ACCOUNTING FIRM
The Board of Trustees and Shareholders of Oppenheimer Portfolio Series:
We have audited the accompanying statement of assets and liabilities of Moderate Investor Fund (one of the portfolios constituting the Oppenheimer Portfolio Series), including the statement of investments, as of January 31, 2011, the related statement of operations for the year then ended, the statements of changes in net assets for each of the years in the two-year period then ended, and the financial highlights for each of the years in the five-year period then ended. These financial statements and financial highlights are the responsibility of the Fund’s management. Our responsibility is to express an opinion on these financial statements and financial highlights based on our audits.
We conducted our audits in accordance with the standards of the Public Company Accounting Oversight Board (United States). Those standards require that we plan and perform the audit to obtain reasonable assurance about whether the financial statements and financial highlights are free of material misstatement. An audit includes examining, on a test basis, evidence supporting the amounts and disclosures in the financial statements. Our procedures included confirmation of securities owned as of January 31, 2011, by correspondence with the transfer agent of the underlying funds. An audit also includes assessing the accounting principles used and significant estimates made by management, as well as evaluating the overall financial statement presentation. We believe that our audits provide a reasonable basis for our opinion.
In our opinion, the financial statements and financial highlights referred to above present fairly, in all material respects, the financial position of Moderate Investor Fund as of January 31, 2011, the results of its operations for the year then ended, the changes in its net assets for each of the years in the two-year period then ended, and the financial highlights for each of the years in the five-year period then ended, in conformity with U.S. generally accepted accounting principles.
KPMG llp
Denver, Colorado
March 16, 2011
42 | MODERATE INVESTOR FUND
FEDERAL INCOME TAX INFORMATION Unaudited
In early 2011, if applicable, shareholders of record received information regarding all dividends and distributions paid to them by the Fund during calendar year 2010. Regulations of the U.S. Treasury Department require the Fund to report this information to the Internal Revenue Service.
Dividends, if any, paid by the Fund during the fiscal year ended January 31, 2011 which are not designated as capital gain distributions should be multiplied by the maximum amount allowable but not less than 13.08% to arrive at the amount eligible for the corporate dividend-received deduction.
A portion, if any, of the dividends paid by the Fund during the fiscal year ended January 31, 2011 which are not designated as capital gain distributions are eligible for lower individual income tax rates to the extent that the Fund has received qualified dividend income as stipulated by recent tax legislation. The maximum amount allowable but not less than $3,550,497 of the Fund’s fiscal year taxable income may be eligible for the lower individual income tax rates. In early 2011, shareholders of record received information regarding the percentage of distributions that are eligible for lower individual income tax rates.
The foregoing information is presented to assist shareholders in reporting distributions received from the Fund to the Internal Revenue Service. Because of the complexity of the federal regulations which may affect your individual tax return and the many variations in state and local tax regulations, we recommend that you consult your tax advisor for specific guidance.
43 | MODERATE INVESTOR FUND
BOARD APPROVAL OF THE FUND’S INVESTMENT ADVISORY AGREEMENT Unaudited
Each year, the Board of Trustees (the “Board”), including a majority of the independent Trustees, is required to determine whether to renew the Fund’s investment advisory agreement (the “Agreement”). The Investment Company Act of 1940, as amended, requires that the Board request and evaluate, and that the Manager provide, such information as may be reasonably necessary to evaluate the terms of the Agreement. The Board employs an independent consultant to prepare a report that provides information, including comparative information, that the Board requests for that purpose. In addition, the Board receives information throughout the year regarding Fund services, fees, expenses and performance.
The Manager and the independent consultant provided information to the Board on the following factors: (i) the nature, quality and extent of the Manager’s services, (ii) the investment performance of the Fund and the Manager, (iii) the fees and expenses of the Fund, including comparative expense information, (iv) the profitability of the Manager and its affiliates, including an analysis of the cost of providing services, (v) whether economies of scale are realized as the Fund grows and whether fee levels reflect these economies of scale for Fund investors and (vi) other benefits to the Manager from its relationship with the Fund. The Board was aware that there are alternatives to retaining the Manager.
Outlined below is a summary of the principal information considered by the Board as well as the Board’s conclusions.
Nature, Quality and Extent of Services. The Board considered information about the nature, quality and extent of the services provided to the Fund and information regarding the Manager’s key personnel who provide such services. The Manager’s duties include providing the Fund with the services of the portfolio managers and the Manager’s asset allocation team, who provide research, analysis and other advisory services in regard to the Fund’s investments; oversight of third-party service providers; monitoring compliance with applicable Fund policies and procedures and adherence to the Fund’s investment restrictions. The Manager is responsible for providing certain administrative services to the Fund as well. Those services include providing and supervising all administrative and clerical personnel who are necessary in order to provide effective corporate administration for the Fund; compiling and maintaining records with respect to the Fund’s operations; preparing and filing reports required by the Securities and Exchange Commission; preparing periodic reports regarding the operations of the Fund for its shareholders; preparing proxy materials for shareholder meetings; and preparing the registration statements required by Federal and state securities laws for the sale of the Fund’s shares. The Manager also provides the Fund with office space, facilities and equipment.
44 | MODERATE INVESTOR FUND
The Board also considered the quality of the services provided and the quality of the Manager’s resources that are available to the Fund. The Board took account of the fact that the Manager has had over fifty years of experience as an investment adviser and that its assets under management rank it among the top mutual fund managers in the United States. The Board evaluated the Manager’s advisory, administrative, accounting, legal and compliance services, and information the Board has received regarding the experience and professional qualifications of the Manager’s key personnel and the size and functions of its staff. In its evaluation of the quality of the portfolio management services provided, the Board considered the experience of Alan Gilston and effective June 2010, Krishna Memani the portfolio managers for the Fund, and the experience of the portfolio managers and the investment performance of the investment companies in which the Fund may invest (the “Underlying Funds”). The Board members also considered the totality of their experiences with the Manager as directors or trustees of the Fund and other funds advised by the Manager. The Board considered information regarding the quality of services provided by affiliates of the Manager, which its members have become knowledgeable about in connection with the renewal of the Fund’s service agreements. The Board concluded, in light of the Manager’s experience, reputation, personnel, operations and resources, that the Fund benefits from the services provided under the Agreement.
Investment Performance of the Manager and the Fund. Throughout the year, the Manager provided information on the investment performance of the Fund and the Manager, including comparative performance information. The Board also reviewed information, prepared by the Manager and by the independent consultant, comparing the Fund’s historical performance to relevant market indices and to the performance of other retail front-end load and no-load mixed-asset target allocation moderate fund of funds (including both fund of funds advised by the Manager and fund of funds advised by other investment advisers). The Board noted that the Fund’s one-year and three-year performance was below its peer group median.
Costs of Services by the Manager. The Board reviewed the fees paid to the Manager and its affiliates and the other expenses borne by the Fund. The Board noted that the Fund does not pay a direct management fee but that the Fund indirectly bears its share of the management fees of the Underlying Funds. The Board also considered the comparability of the fees charged and the services provided to the Fund to the fees and services for other clients or accounts advised by the Manager. The independent consultant provided comparative data in regard to the fees and expenses of the Fund and other retail front-end load mixed-asset target allocation moderate fund of funds with comparable asset levels
45 | MODERATE INVESTOR FUND
BOARD APPROVAL OF THE FUND’S INVESTMENT ADVISORY AGREEMENT Unaudited / Continued
and distribution features. The Board noted that the Fund’s total expenses were competitive with its peer group median and lower than its peer group average. The Board also noted that the Manager has voluntarily agreed to waive fees and /or reimburse the Fund for certain expenses so that the “Total Expenses”, as a percentage of average net assets, (the combined direct (Fund level) and indirect (Underlying Fund level) expenses), will not exceed the annual rate of 1.30% for Class A, 2.05% for Class B and Class C, 1.55% for Class N and 1.05% for Class Y. This limitation will be applied after giving effect to any reimbursements by the Distributor of 12b-1 fees paid by the Fund with respect to investments in Class A shares of any Underlying Funds that do not offer Class Y shares. The expense limitations do not include extraordinary expenses and other expenses not incurred in the ordinary course of the Fund’s business.
Economies of Scale and Profits Realized by the Manager. The Board considered information regarding the Manager’s costs in serving as the Fund’s investment adviser, including the costs associated with the personnel and systems necessary to manage the Fund, and information regarding the Manager’s profitability from its relationship with the Fund. The Board reviewed whether the Manager may realize economies of scale in managing and supporting the Fund and the Underlying Funds, and the extent to which those economies of scale would benefit the Fund’s shareholders.
Other Benefits to the Manager. In addition to considering the profits realized by the Manager, the Board considered information that was provided regarding the direct and indirect benefits the Manager receives as a result of its relationship with the Fund, including compensation paid to the Manager’s affiliates. The Board also considered that the Manager must be able to pay and retain experienced professional personnel at competitive rates to provide quality services to the Fund.
Conclusions. These factors were also considered by the independent Trustees meeting separately from the full Board, assisted by experienced counsel to the Fund and to the independent Trustees. Fund counsel and the independent Trustees’ counsel are independent of the Manager within the meaning and intent of the Securities and Exchange Commission Rules.
Based on its review of the information it received and its evaluations described above, the Board, including a majority of the independent Trustees, decided to continue the Agreement through September 30, 2011. In arriving at this decision, the Board did not single out any factor or factors as being more important than others, but considered all of the above information, and considered the terms and conditions of the Agreement, in light of all of the surrounding circumstances.
46 | MODERATE INVESTOR FUND
PORTFOLIO PROXY VOTING POLICIES AND PROCEDURES; UPDATES TO STATEMENTS OF INVESTMENTS Unaudited
The Fund has adopted Portfolio Proxy Voting Policies and Procedures under which the Fund votes proxies relating to securities (“portfolio proxies”) held by the Fund. A description of the Fund’s Portfolio Proxy Voting Policies and Procedures is available (i) without charge, upon request, by calling the Fund toll-free at 1.800.525.7048, (ii) on the Fund’s website at www.oppenheimerfunds.com, and (iii) on the SEC’s website at www.sec.gov. In addition, the Fund is required to file Form N-PX, with its complete proxy voting record for the 12 months ended June 30th, no later than August 31st of each year. The Fund’s voting record is available (i) without charge, upon request, by calling the Fund toll-free at 1.800.525.7048, and (ii) in the
Form N-PX filing on the SEC’s website at www.sec.gov.
The Fund files its complete schedule of portfolio holdings with the SEC for the first quarter and the third quarter of each fiscal year on Form N-Q. The Fund’s Form N-Q filings are available on the SEC’s website at www.sec.gov. Those forms may be reviewed and copied at the SEC’s Public Reference Room in Washington, D.C. Information on the operation of the Public Reference Room may be obtained by calling 1-800-SEC-0330.
Householding—Delivery of Shareholder Documents
This is to inform you about OppenheimerFunds’ “householding” policy. If more than one member of your household maintains an account in a particular fund, OppenheimerFunds will mail only one copy of the fund’s prospectus (or, if available, the fund’s summary prospectus), annual and semiannual report and privacy policy. The consolidation of these mailings, called householding, benefits your fund through reduced mailing expense, and benefits you by reducing the volume of mail you receive from OppenheimerFunds. Householding does not affect the delivery of your account statements.
Please note that we will continue to household these mailings for as long as you remain an OppenheimerFunds shareholder, unless you request otherwise. If you prefer to receive multiple copies of these materials, please call us at 1.800.CALL-OPP (225-5677). You may also notify us in writing or via email. We will begin sending you individual copies of the prospectus (or, if available, the summary prospectus), reports and privacy policy within 30 days of receiving your request to stop householding.
47 | MODERATE INVESTOR FUND
TRUSTEES AND OFFICERS Unaudited
| | | |
| Name, Position(s) Held with the | | Principal Occupation(s) During the Past 5 Years; Other Trusteeships/Directorships |
| Fund, Length of Service, Age | | Held; Number of Portfolios in the Fund Complex Currently Overseen |
INDEPENDENT
TRUSTEES | | The address of each Trustee in the chart below is 6803 S. Tucson Way, Centennial, Colorado 80112-3924. Each Trustee serves for an indefinite term, or until his or her resignation, retirement, death or removal. |
| | | |
Brian F. Wruble,
Chairman of the Board of Trustees (since 2007) and Trustee (since 2005)
Age: 67 | | Chairman (since August 2007) and Trustee (since August 1991) of the Board of Trustees of The Jackson Laboratory (non-profit); Director of Special Value Opportunities Fund, LLC (registered investment company) (affiliate of the Manager’s parent company) (since September 2004); Member of Zurich Financial Investment Management Advisory Council (insurance) (since 2004); Treasurer (since 2007) and Trustee of the Institute for Advanced Study (non-profit educational institute) (since May 1992); General Partner of Odyssey Partners, L.P. (hedge fund) (September 1995-December 2007); Special Limited Partner of Odyssey Investment Partners, LLC (private equity investment) (January 1999-September 2004). Oversees 59 portfolios in the OppenheimerFunds complex. Mr. Wruble has served on the Boards of certain Oppenheimer funds since April 2001, during which time he has become familiar with the Fund’s (and other Oppenheimer funds’) financial, accounting, regulatory and investment matters and has contributed to the Boards’ deliberations. |
| | | |
David K. Downes,
Trustee (since 2007)
Age: 71 | | Director of THL Credit Inc. (since June 2009); Independent Chairman GSK Employee Benefit Trust (since April 2006); Trustee of Employee Trusts (since January 2006); Chief Executive Officer and Board Member of Community Capital Management (investment management company) (since January 2004); President of The Community Reinvestment Act Qualified Investment Fund (investment management company) (since 2004); Director of Internet Capital Group (information technology company) (since October 2003); Director of Correctnet (January 2006-2007); Independent Chairman of the Board of Trustees of Quaker Investment Trust (registered investment company) (2004-2007); Chief Operating Officer and Chief Financial Officer of Lincoln National Investment Companies, Inc. (subsidiary of Lincoln National Corporation, a publicly traded company) and Delaware Investments U.S., Inc. (investment management subsidiary of Lincoln National Corporation) (1993-2003); President, Chief Executive Officer and Trustee of Delaware Investment Family of Funds (1993-2003); President and Board Member of Lincoln National Convertible Securities Funds, Inc. and the Lincoln National Income Funds, TDC (1993-2003); Chairman and Chief Executive Officer of Retirement Financial Services, Inc. (registered transfer agent and investment adviser and subsidiary of Delaware Investments U.S., Inc.) (1993-2003); President and Chief Executive Officer of Delaware Service Company, Inc. (1995-2003); Chief Administrative Officer, Chief Financial Officer, Vice Chairman and Director of Equitable Capital Management Corporation (investment subsidiary of Equitable Life Assurance Society) (1985-1992); Corporate Controller of Merrill Lynch Company (financial services holding company) (1977-1985); held the following positions at the Colonial Penn Group, Inc. (insurance company): Corporate Budget Director (1974-1977), Assistant Treasurer (1972-1974) and Director of Corporate Taxes (1969-1972); held the following positions at Price Waterhouse Company (financial services firm): Tax Manager (1967-1969), Tax Senior (1965-1967) and Staff Accountant (1963-1965); United States Marine Corps (1957-1959). Oversees 59 portfolios in the OppenheimerFunds complex. Mr. Downes has served on the Boards of certain Oppenheimer funds since December 2005, during which time he has become familiar with the Fund’s (and other Oppenheimer funds’) financial, accounting, regulatory and investment matters and has contributed to the Boards’ deliberations. |
48 | MODERATE INVESTOR FUND
| | | |
| Name, Position(s) Held with the | | Principal Occupation(s) During the Past 5 Years; Other Trusteeships/Directorships |
| Fund, Length of Service, Age | | Held; Number of Portfolios in the Fund Complex Currently Overseen |
Matthew P. Fink,
Trustee (since 2005)
Age: 70 | | Trustee of the Committee for Economic Development (policy research foundation) (since 2005); Director of ICI Education Foundation (education foundation) (October 1991-August 2006); President of the Investment Company Institute (trade association) (October 1991-June 2004); Director of ICI Mutual Insurance Company (insurance company) (October 1991-June 2004). Oversees 59 portfolios in the OppenheimerFunds complex. Mr. Fink has served on the Boards of certain Oppenheimer funds since January 2005, during which time he has become familiar with the Fund’s (and other Oppenheimer funds’) financial, accounting, regulatory and investment matters and has contributed to the Boards’ deliberations. |
| | | |
Phillip A. Griffiths,
Trustee (since 2005)
Age: 72 | | Fellow of the Carnegie Corporation (since 2007); Distinguished Presidential Fellow for International Affairs (since 2002) and Member (since 1979) of the National Academy of Sciences; Council on Foreign Relations (since 2002); Director of GSI Lumonics Inc. (precision technology products company) (since 2001); Senior Advisor of The Andrew W. Mellon Foundation (since 2001); Chair of Science Initiative Group (since 1999); Member of the American Philosophical Society (since 1996); Trustee of Woodward Academy (since 1983); Foreign Associate of Third World Academy of Sciences (since 2002); Director of the Institute for Advanced Study (1991-2004); Director of Bankers Trust New York Corporation (1994-1999); Provost at Duke University (1983-1991). Oversees 59 portfolios in the OppenheimerFunds complex. Mr. Griffiths has served on the Boards of certain Oppenheimer funds since June 1999, during which time he has become familiar with the Fund’s (and other Oppenheimer funds’) financial, accounting, regulatory and investment matters and has contributed to the Boards’ deliberations. |
| | | |
Mary F. Miller,
Trustee (since 2005)
Age: 68 | | Trustee of International House (not-for-profit) (since June 2007); Trustee of the American Symphony Orchestra (not-for-profit) (since October 1998); and Senior Vice President and General Auditor of American Express Company (financial services company) (July 1998-February 2003). Oversees 59 portfolios in the OppenheimerFunds complex. Ms. Miller has served on the Boards of certain Oppenheimer funds since August 2004, during which time she has become familiar with the Fund’s (and other Oppenheimer funds’) financial, accounting, regulatory and investment matters and has contributed to the Boards’ deliberations. |
| | | |
Joel W. Motley,
Trustee (since 2005)
Age: 58 | | Managing Director of Public Capital Advisors, LLC (privately-held financial advisor) (since January 2006); Managing Director of Carmona Motley, Inc. (privately-held financial advisor) (since January 2002); Director of Columbia Equity Financial Corp. (privately-held financial advisor) (2002-2007); Managing Director of Carmona Motley Hoffman Inc. (privately-held financial advisor) (January 1998-December 2001); Member of the Finance and Budget Committee of the Council on Foreign Relations, Chairman of the Investment Committee of the Episcopal Church of America, Member of the Investment Committee and Board of Human Rights Watch and Member of the Investment Committee and Board of Historic Hudson Valley. Oversees 59 portfolios in the OppenheimerFunds complex. Mr. Motley has served on the Boards of certain Oppenheimer funds since October 2002, during which time he has become familiar with the Fund’s (and other Oppenheimer funds’) financial, accounting, regulatory and investment matters and has contributed to the Boards’ deliberations. |
| | | |
Mary Ann Tynan,
Trustee (since 2008)
Age: 65 | | Vice Chair of Board of Trustees of Brigham and Women’s/Faulkner Hospitals (non-profit hospital) (since 2000); Chair of Board of Directors of Faulkner Hospital (non-profit hospital) (since 1990); Member of Audit and Compliance Committee of Partners Health Care System (non-profit) (since 2004); Board of Trustees of |
49 | MODERATE INVESTOR FUND
TRUSTEES AND OFFICERS Unaudited / Continued
| | | |
| Name, Position(s) Held with the | | Principal Occupation(s) During the Past 5 Years; Other Trusteeships/Directorships |
| Fund, Length of Service, Age | | Held; Number of Portfolios in the Fund Complex Currently Overseen |
Mary Ann Tynan,
Continued | | Middlesex School (educational institution) (since 1994); Board of Directors of Idealswork, Inc. (financial services provider) (since 2003); Partner, Senior Vice President and Director of Regulatory Affairs of Wellington Management Company, LLP (global investment manager) (1976-2002); Vice President and Corporate Secretary, John Hancock Advisers, Inc. (mutual fund investment adviser) (1970- 1976). Oversees 59 portfolios in the OppenheimerFunds complex. Ms. Tynan has served on the Boards of certain Oppenheimer funds since October 2008, during which time she has become familiar with the Fund’s (and other Oppenheimer funds’) financial, accounting, regulatory and investment matters and has contributed to the Boards’ deliberations. |
| | | |
Joseph M. Wikler,
Trustee (since 2005)
Age: 69 | | Director of C-TASC (bio-statistics services) (since 2007); Director of the following medical device companies: Medintec (since 1992) and Cathco (since 1996); Member of the Investment Committee of the Associated Jewish Charities of Baltimore (since 1994); Director of Lakes Environmental Association (environmental protection organization) (1996-2008); Director of Fortis/Hartford mutual funds (1994-December 2001). Oversees 59 portfolios in the OppenheimerFunds complex. Mr. Wikler has served on the Boards of certain Oppenheimer funds since August 2005, during which time he has become familiar with the Fund’s (and other Oppenheimer funds’) financial, accounting, regulatory and investment matters and has contributed to the Boards’ deliberations. |
| | | |
Peter I. Wold,
Trustee (since 2005)
Age: 63 | | Director of Arch Coal, Inc. (since 2010); Director and Chairman of Wyoming Enhanced Oil Recovery Institute Commission (enhanced oil recovery study) (since 2004); President of Wold Oil Properties, Inc. (oil and gas exploration and production company) (since 1994); Vice President of American Talc Company, Inc. (talc mining and milling) (since 1999); Managing Member of Hole-in-the-Wall Ranch (cattle ranching) (since 1979); Director and Chairman of the Denver Branch of the Federal Reserve Bank of Kansas City (1993-1999); and Director of PacifiCorp. (electric utility) (1995-1999). Oversees 59 portfolios in the OppenheimerFunds complex. Mr. Wold has served on the Boards of certain Oppenheimer funds since August 2005, during which time he has become familiar with the Fund’s (and other Oppenheimer funds’) financial, accounting, regulatory and investment matters and has contributed to the Boards’ deliberations. |
| | | |
OTHER OFFICERS
OF THE FUND | | The addresses of the Officers in the chart below are as follows: for Messrs. Gilston, Memani, Glavin, Gabinet, Keffer and Zack, Two World Financial Center, 225 Liberty Street, New York, New York 10281-1008, for Messrs. Vandehey and Wixted, 6803 S. Tucson Way, Centennial, Colorado 80112-3924. Each Officer serves for an indefinite term or until his or her resignation, retirement, death or removal. |
| | �� | |
Alan C. Gilston,
Vice President and Portfolio Manager (since 2009)
Age: 52 | | Vice President of the Manager (since September 1997); a member of the Funds’ portfolio management team and a member of the Manager’s Asset Allocation Committee (since February 2009); a member of the Manager’s Risk Management Team during various periods. A portfolio manager and officer of 11 portfolios in the OppenheimerFunds complex. |
| | | |
Krishna Memani,
Vice President and Portfolio Manager (since 2010)
Age: 50 | | Director of Fixed Income (since October 2010), Senior Vice President and Head of the Investment Grade Fixed Income Team of the Manager (since March 2009). Prior to joining the Manager, Managing Director and Head of the U.S. and European Credit Analyst Team at Deutsche Bank Securities (June 2006-January 2009); Chief Credit Strategist at Credit Suisse Securities (August 2002-March 2006); a Managing Director and Senior Portfolio Manager at Putnam Investments (September 1998-June 2002). A portfolio manager and an officer of 22 portfolios in the OppenheimerFunds complex. |
50 | MODERATE INVESTOR FUND
| | | |
| Name, Position(s) Held with the | | Principal Occupation(s) During the Past 5 Years; Other Trusteeships/Directorships |
| Fund, Length of Service, Age | | Held; Number of Portfolios in the Fund Complex Currently Overseen |
William F. Glavin, Jr.,
President and Principal Executive Officer (since 2009)
Age: 52 | | Chairman of the Manager (since December 2009); Chief Executive Officer and Director of the Manager (since January 2009); President of the Manager (since May 2009); Director of Oppenheimer Acquisition Corp. (“OAC”) (the Manager’s parent holding company) (since June 2009); Executive Vice President (March 2006-February 2009) and Chief Operating Officer (July 2007-February 2009) of Massachusetts Mutual Life Insurance Company (OAC’s parent company); Director (May 2004-March 2006) and Chief Operating Officer and Chief Compliance Officer (May 2004-January 2005), President (January 2005- March 2006) and Chief Executive Officer (June 2005-March 2006) of Babson Capital Management LLC; Director (March 2005-March 2006), President (May 2003-March 2006) and Chief Compliance Officer (July 2005-March 2006) of Babson Capital Securities, Inc. (a broker-dealer); President (May 2003-March 2006) of Babson Investment Company, Inc.; Director (May 2004-August 2006) of Babson Capital Europe Limited; Director (May 2004-October 2006) of Babson Capital Guernsey Limited; Director (May 2004-March 2006) of Babson Capital Management LLC; Non-Executive Director (March 2005-March 2007) of Baring Asset Management Limited; Director (February 2005-June 2006) Baring Pension Trustees Limited; Director and Treasurer (December 2003- November 2006) of Charter Oak Capital Management, Inc.; Director (May 2006- September 2006) of C.M. Benefit Insurance Company; Director (May 2008- June 2009) and Executive Vice President (June 2007-July 2009) of C.M. Life Insurance Company; President (March 2006-May 2007) of MassMutual Assignment Company; Director (January 2005-December 2006), Deputy Chairman (March 2005-December 2006) and President (February 2005-March 2005) of MassMutual Holdings (Bermuda) Limited; Director (May 2008-June 2009) and Executive Vice President (June 2007-July 2009) of MML Bay State Life Insurance Company; Chief Executive Officer and President (April 2007-January 2009) of MML Distributors, LLC; and Chairman (March 2006-December 2008) and Chief Executive Officer (May 2007-December 2008) of MML Investors Services, Inc. Oversees 66 portfolios as a Trustee/Director and 94 portfolios as an officer in the OppenheimerFunds complex. |
| | | |
Arthur S. Gabinet,
Secretary (since 2010)
Age: 52 | | Executive Vice President (since May 2010) and General Counsel (since January 2011) of the Manager; General Counsel of the Distributor (since January 2011); General Counsel of Centennial Asset Management Corporation (since January 2011); Executive Vice President and General Counsel of HarbourView Asset Management Corporation (since January 2011); Assistant Secretary (since January 2011) and Director (since January 2011) of OppenheimerFunds International Ltd. and OppenheimerFunds plc; Vice President and Director of Oppenheimer Partnership Holdings, Inc. (since January 2011); Director of Oppenheimer Real Asset Management, Inc. (since January 2011); Executive Vice President and General Counsel of Shareholder Financial Services, Inc. and Shareholder Services, Inc. (since January 2011); Executive Vice President and General Counsel of OFI Private Investments, Inc. (since January 2011); Vice President of OppenheimerFunds Legacy Program (since January 2011); Executive Vice President and General Counsel of OFI Institutional Asset Management, Inc. (since January 2011); General Counsel, Asset Management of the Manager (May 2010-December 2010); Principal, The Vanguard Group (November 2005-April 2010); District Administrator, U.S. Securities and Exchange Commission (January 2003-October 2005). An officer of 96 portfolios in the OppenheimerFunds complex. |
| | | |
Thomas W. Keffer,
Vice President and Chief Business Officer (since 2009)
Age: 55 | | Senior Vice President of the Manager (since March 1997); Director of Investment Brand Management of the Manager (since November 1997); Senior Vice President of OppenheimerFunds Distributor, Inc. (since December 1997). An officer of 96 portfolios in the OppenheimerFunds complex. |
51 | MODERATE INVESTOR FUND
TRUSTEES AND OFFICERS Unaudited / Continued
| | | |
| Name, Position(s) Held with the | | Principal Occupation(s) During the Past 5 Years; Other Trusteeships/Directorships |
| Fund, Length of Service, Age | | Held; Number of Portfolios in the Fund Complex Currently Overseen |
Mark S. Vandehey,
Vice President and Chief Compliance Officer (since 2005)
Age: 60 | | Senior Vice President and Chief Compliance Officer of the Manager (since March 2004); Chief Compliance Officer of OppenheimerFunds Distributor, Inc., Centennial Asset Management and Shareholder Services, Inc. (since March 2004); Vice President of OppenheimerFunds Distributor, Inc., Centennial Asset Management Corporation and Shareholder Services, Inc. (since June 1983). An officer of 96 portfolios in the OppenheimerFunds complex. |
| | | |
Brian W. Wixted,
Treasurer and Principal Financial & Accounting Officer (since 2005)
Age: 51 | | Senior Vice President of the Manager (since March 1999); Treasurer of the Manager and the following: HarbourView Asset Management Corporation, Shareholder Financial Services, Inc., Shareholder Services, Inc., Oppenheimer Real Asset Management, Inc. and Oppenheimer Partnership Holdings, Inc. (March 1999-June 2008), OFI Private Investments, Inc. (March 2000-June 2008), OppenheimerFunds International Ltd. and OppenheimerFunds plc (since May 2000), OFI Institutional Asset Management, Inc. (since November 2000), and OppenheimerFunds Legacy Program (charitable trust program established by the Manager) (since June 2003); Treasurer and Chief Financial Officer of OFI Trust Company (trust company subsidiary of the Manager) (since May 2000); Assistant Treasurer of OAC (March 1999-June 2008). An officer of 96 portfolios in the OppenheimerFunds complex. |
| | | |
Robert G. Zack,
Vice President (since 2005)
Age: 62 | | Executive Vice President (since January 2004) and General Counsel-Corporate (since March 2002) of the Manager; General Counsel of the Distributor (since December 2001); General Counsel of Centennial Asset Management Corporation (since December 2001); Senior Vice President and General Counsel of HarbourView Asset Management Corporation (since December 2001); Secretary and General Counsel of OAC (since November 2001); Assistant Secretary (since September 1997) and Director (since November 2001) of OppenheimerFunds International Ltd. and OppenheimerFunds plc; Vice President and Director of Oppenheimer Partnership Holdings, Inc. (since December 2002); Director of Oppenheimer Real Asset Management, Inc. (since November 2001); Senior Vice President, General Counsel and Director of Shareholder Financial Services, Inc. and Shareholder Services, Inc. (since December 2001); Senior Vice President, General Counsel and Director of OFI Private Investments, Inc. and OFI Trust Company (since November 2001); Vice President of OppenheimerFunds Legacy Program (since June 2003); Senior Vice President and General Counsel of OFI Institutional Asset Management, Inc. (since November 2001). An officer of 96 portfolios in the OppenheimerFunds complex. |
The Fund’s Statement of Additional Information contains additional information about the Fund’s Trustees and Officers and is available without charge upon request, by calling 1.800.525.7048.
52 | MODERATE INVESTOR FUND
MODERATE INVESTOR FUND
| | | |
| A Series of Oppenheimer Portfolio Series | | |
| |
Manager | | OppenheimerFunds, Inc. |
| | | |
Distributor | | OppenheimerFunds Distributor, Inc. |
| | | |
Transfer and Shareholder Servicing Agent | | OppenheimerFunds Services |
| | | |
Independent Registered Public Accounting Firm | | KPMG llp |
| | | |
Counsel | | Kramer Levin Naftalis & Frankel LLP |
©2011 OppenheimerFunds, Inc. All rights reserved.
53 | MODERATE INVESTOR FUND
PRIVACY POLICY NOTICE
As an Oppenheimer fund shareholder, you are entitled to know how we protect your personal information and how we limit its disclosure.
Information Sources
We obtain nonpublic personal information about our shareholders from the following sources:
| • | | Applications or other forms |
| |
| • | | When you create a user ID and password for online account access |
| |
| • | | When you enroll in eDocs Direct, our electronic document delivery service |
| |
| • | | Your transactions with us, our affiliates or others |
| |
| • | | A software program on our website, often referred to as a “cookie,” which indicates which parts of our site you’ve visited |
| |
| • | | When you set up challenge questions to reset your password online |
If you visit www.oppenheimerfunds.com and do not log on to the secure account information areas, we do not obtain any personal information about you. When you do log on to a secure area, we do obtain your user ID and password to identify you. We also use this information to provide you with products and services you have requested, to inform you about products and services that you may be interested in and assist you in other ways.
We do not collect personal information through our website unless you willingly provide it to us, either directly by email or in those areas of the website that request information. In order to update your personal information (including your mailing address, email address and phone number) you must first log on and visit your user profile.
If you have set your browser to warn you before accepting cookies, you will receive the warning message with each cookie. You can refuse cookies by turning them off in your browser. However, doing so may limit your access to certain sections of our website.
We use cookies to help us improve and manage our website. For example, cookies help us recognize new versus repeat visitors to the site, track the pages visited, and enable some special features on the website. This data helps us provide a better service for our website visitors.
Protection of Information
We do not disclose any non-public personal information (such as names on a customer list) about current or former customers to anyone, except as permitted by law.
Disclosure of Information
We send your financial advisor (as designated by you) copies of confirmations, account statements and other documents reporting activity in your fund accounts. We may also use details about you and your investments to help us, our financial service affiliates, or firms that jointly market their financial products and services with ours, to better serve your investment needs or suggest financial services or educational material that may be of interest to you. If this requires us to provide you with an opportunity to “opt in” or “opt out” of such information sharing with a firm not affiliated with us, you will receive notification on how to do so, before any such sharing takes place.
Right of Refusal
We will not disclose your personal information to unaffiliated third parties (except as permitted by law), unless we first offer you a reasonable opportunity to refuse or “opt out” of such disclosure.
54 | MODERATE INVESTOR FUND
Internet Security and Encryption
In general, the email services provided by our website are encrypted and provide a secure and private means of communication with us. To protect your own privacy, confidential and/or personal information should only be communicated via email when you are advised that you are using a secure website.
As a security measure, we do not include personal or account information in non-secure emails, and we advise you not to send such information to us in non-secure emails. Instead, you may take advantage of the secure features of our website to encrypt your email correspondence. To do this, you will need to use a browser that supports Secure Sockets Layer (SSL) protocol.
We do not guarantee or warrant that any part of our website, including files available for download, are free of viruses or other harmful code. It is your responsibility to take appropriate precautions, such as use of an anti-virus software package, to protect your computer hardware and software.
| • | | All transactions, including redemptions, exchanges and purchases, are secured by SSL and 128-bit encryption. SSL is used to establish a secure connection between your PC and OppenheimerFunds’ server. It transmits information in an encrypted and scrambled format. |
| |
| • | | Encryption is achieved through an electronic scrambling technology that uses a “key” to code and then decode the data. Encryption acts like the cable converter box you may have on your television set. It scrambles data with a secret code so that no one can make sense of it while it is being transmitted. When the data reaches its destination, the same software unscrambles the data. |
| |
| • | | You can exit the secure area by either closing your browser, or for added security, you can use the Log Out button before you close your browser. |
Other Security Measures
We maintain physical, electronic and procedural safeguards to protect your personal account information. Our employees and agents have access to that information only so that they may offer you products or provide services, for example, when responding to your account questions.
How You Can Help
You can also do your part to keep your account information private and to prevent unauthorized transactions. If you obtain a user ID and password for your account, do not allow it to be used by anyone else. Also, take special precautions when accessing your account on a computer used by others.
Who We Are
This joint notice describes the privacy policies of the Oppenheimer funds, OppenheimerFunds Distributor, Inc., the trustee of OppenheimerFunds Individual Retirement Accounts (IRAs) and the custodian of the OppenheimerFunds 403(b)(7) tax sheltered custodial accounts. It applies to all Oppenheimer fund accounts you presently have, or may open in the future, using your Social Security number—whether or not you remain a shareholder of our funds. This notice was last updated January 16, 2004. In the event it is updated or changed, we will post an updated notice on our website at www.oppenheimerfunds.com. If you have any questions about these privacy policies, write to us at P.O. Box 5270, Denver, CO 80217-5270, email us by clicking on the Contact Us section of our website at www.oppenheimerfunds.com or call us at 1.800.525.7048.
55 | MODERATE INVESTOR FUND
January 31, 2011
| | | | Listing of Top Holdings |
| |
| | | | Fund Performance Discussion |
| |
| | | | Listing of Investments |
| |
| | | | Financial Statements |
TOP HOLDINGS AND ALLOCATIONS
Asset Class Allocation
Portfolio holdings and allocations are subject to change. Percentages are as of January 31, 2011, and are based on the total market value of investments.
Top Ten Holdings
| | | | | |
|
| Oppenheimer Value Fund, Cl. Y | | | 21.8 | % |
| Oppenheimer Capital Appreciation Fund, Cl. Y | | | 15.5 | |
| Oppenheimer International Growth Fund, Cl. Y | | | 13.0 | |
| Oppenheimer Core Bond Fund, Cl. Y | | | 8.6 | |
| Oppenheimer Quest International Value Fund, Cl. Y | | | 6.3 | |
| Oppenheimer Main Street Small- & Mid-Cap Fund, Cl. Y | | | 5.4 | |
| Oppenheimer Limited-Term Government Fund, Cl. Y | | | 5.3 | |
| Oppenheimer International Bond Fund, Cl. Y | | | 4.6 | |
| Oppenheimer Developing Markets Fund, Cl. Y | | | 3.7 | |
| Oppenheimer Institutional Money Market Fund, Cl. E | | | 3.3 | |
Portfolio holdings and allocations are subject to change. Percentages are as of January 31, 2011, and are based on net assets. For more current Top 10 Fund holdings, please visit www.oppenheimerfunds.com.
7 | ACTIVE ALLOCATION FUND
FUND PERFORMANCE DISCUSSION
How has the Fund performed? Below is a discussion by OppenheimerFunds, Inc., of the Fund’s performance during its fiscal year ended January 31, 2011, followed by a graphical comparison of the Fund’s performance to appropriate broad-based market indices.
Management’s Discussion of Fund Performance. During the reporting period, Active Allocation Fund’s Class A shares (without sales charge) returned 19.01%. In comparison, the Fund outperformed the Barclays Capital U.S. Aggregate Bond Index, which returned 5.06%. The Fund underperformed the S&P 500 Index, which returned 22.20%, primarily as a result of its allocation to underlying fixed-income funds in a period when equities outperformed bonds.
Within the equity component, the Fund had its largest allocations to Oppenheimer Value Fund’s Class Y shares and Oppenheimer Capital Appreciation Fund’s Class Y shares, which together comprised approximately 37% of the Fund’s assets. These underlying domestic equity funds produced double-digit absolute returns, as equities generally rallied during the period. Oppenheimer Value Fund’s Class Y shares outperformed both the S&P 500 Index as well as its own benchmark, the Russell 1000 Value Index, which returned 21.54% during the period. While producing solid absolute returns, Oppenheimer Capital Appreciation Fund’s Class Y shares underperformed the S&P 500 Index as well as its benchmark, the Russell 1000 Growth Index, which returned 25.14%. This underlying fund underperformed largely as a result of weaker relative stock selection within the materials, financials and consumer discretionary sectors. During the reporting period, Oppenheimer Main Street Small- & Mid-Cap Fund’s Class Y shares produced strong absolute returns, and accounted for approximately 5% of the Fund’s assets at period end.
The approximate 25% allocation to global equity funds also added to Fund performance. The Fund’s largest allocation within this space was to Oppenheimer International Growth Fund’s Class Y shares. This underlying fund outperformed its own benchmark, the MSCI EAFE Index, as well as the S&P 500 Index during the reporting period. Oppenheimer Quest International Value Fund, a position we established in June 2010 and the Fund’s second largest global equity holding at period end, also out-performed the S&P 500 Index during the time it was held by the Fund and performed in line with the MSCI EAFE Index. The Fund benefited from increasing its allocations to these underlying funds as the performance of European stocks and a few other global regions in which these underlying funds invest subsequently produced strong performance results.
On the fixed-income side, the Fund’s largest holding was Oppenheimer Core Bond Fund’s Class Y shares, which contributed positively to performance. At period end, this underlying
8 | ACTIVE ALLOCATION FUND
fund constituted approximately 9% of the Fund’s assets. This underlying fund significantly outperformed the Barclays Capital U.S. Aggregate Bond Index in a number of areas, including mortgage-backed securities (MBS), commercial mortgage-backed securities (CMBS) and certain investment grade and high yield investments. In addition, asset-backed securities (ABS) contributed to this underlying fund’s performance. During the period, this underlying fund had minimal exposure to U.S. Treasury securities, which contributed to its relative outperformance, as most other categories of the Barclays Capital U.S. Aggregate Bond Index performed better.
The Fund’s second and third largest fixed-income holdings, Oppenheimer Limited-Term Government Fund’s Class Y shares and Oppenheimer International Bond Fund’s Class Y shares, together accounted for approximately 10% of the Fund’s assets at period end. During the reporting period, since U.S. Treasury securities did not perform as well as other areas of the fixed-income market, Oppenheimer Limited-Term Government Fund’s exposure to them detracted from relative results versus the Barclays Capital U.S. Aggregate Bond Index. Treasuries experienced a sell-off in December as the market favored higher-yielding fixed-income securities. This underlying fund significantly outperformed its own benchmark, the Barclays Capital U.S. 1-3 Year Government Bond Index, which returned 1.83% during the period, primarily due to its exposure to both non-agency MBS and agency MBS, as well as CMBS and ABS. Oppenheimer International Bond Fund’s Class Y shares outperformed the Barclays Capital U.S. Aggregate Bond Index during the period. We attribute this underlying fund’s strong performance primarily to its emphasis on emerging market bonds over securities from developed markets. In addition, this underlying fund successfully avoided the brunt of weakness stemming from the European sovereign debt crisis through underweight positions in Greece, Ireland and Spain during the reporting period. During the period, this underlying fund’s Class Y shares outperformed its own benchmark, the Citigroup Non-U.S. Dollar World Government Bond Index, which returned 5.54%.
On a stand-alone basis, the tactical (actively managed) component of the Fund returned 23.45% over the one-year period. The tactical component received large positive contributions from a number of key tilts, the most significant of which being an underweight to fixed-income securities. This underweight benefited the tactical component as equities generally outperformed fixed-income as an asset class over the period. In particular, the tactical component was underweight U.S. Treasuries, which underperformed relative to equities and higher-yielding fixed income securities. At the same time, the tactical component held tilts in emerging markets and global small-caps primarily through positions in Oppenheimer Developing Markets Fund and Oppenheimer International Small Company Fund. Additionally, the tactical component benefited from its commodities tilt, which was
9 | ACTIVE ALLOCATION FUND
FUND PERFORMANCE DISCUSSION
expressed through its exposure to Oppenheimer Commodity Strategy Total Return Fund and positions in commodity-linked equity markets. Finally, the tactical component experienced positive contributions from its positioning relative to the U.S. dollar. In 2010, the U.S. dollar had rallied in the first half of the year but subsequently sold off thereafter. In both situations, the tactical component of the Fund was positioned to benefit from these changes in the U.S. dollar’s value.
In terms of the Fund’s underlying holdings at period end, fixed-income funds, including a small allocation to Oppenheimer Institutional Money Market Fund, consisted of approximately 27% of the Fund’s assets. Underlying equity funds accounted for approximately 68% of the Fund’s assets, with 43% allocated to U.S. equity funds and 25% allocated to four global equity funds — Oppenheimer International Growth Fund, Oppenheimer Quest International Value Fund, Oppenheimer Developing Markets Fund and Oppenheimer International Small Company Fund. During the period, an approximate 4% allocation to specialty funds also added to Fund performance, as asset classes such as commodities and real estate generally produced strong results during the period. The Fund had exposure to underlying specialty funds through Oppenheimer Gold & Special Minerals Fund, Oppenheimer Real Estate Fund and Oppenheimer Commodity Strategy Total Return Fund. Allocations to Oppenheimer Main Street Fund and Oppenheimer Global Fund were eliminated during the period in an attempt to reduce overlap with some of our other underlying funds.
Comparing the Fund’s Performance to the Market. The graphs that follow show the performance of a hypothetical $10,000 investment in each Class of shares of the Fund held until January 31, 2011. Performance is measured from the inception of the Classes on April 5, 2005. The Fund’s performance reflects the deduction of the maximum initial sales charge on Class A shares, the applicable contingent deferred sales charge on Class B, Class C and Class N shares, and reinvestments of all dividends and capital gains distributions. Past performance cannot guarantee future results.
The Fund’s performance is compared to the performance of the S&P 500 Index and the Barclays Capital U.S. Aggregate Bond Index. The S&P 500 Index is an unmanaged index of equity securities that is a measure of the general domestic stock market. The Barclays Capital U.S. Aggregate Bond Index is an unmanaged, broad-based index of investment grade corporate debt. Index performance reflects the reinvestment of income but does not consider the effect of transaction costs, and none of the data in the graphs shows the effect of taxes. The Fund’s performance reflects the effects of the Fund’s business and operating expenses. While index comparisons may be useful to provide a benchmark for the Fund’s performance, it must be noted that the Fund’s investments are not limited to the investments comprising the indices.
10 | ACTIVE ALLOCATION FUND
Class A Shares
Comparison of Change in Value of $10,000 Hypothetical Investments in:
The performance data quoted represents past performance, which does not guarantee future results. The investment return and principal value of an investment in the Fund will fluctuate so that an investor’s shares, when redeemed, may be worth more or less than their original cost. Current performance may be lower or higher than the performance quoted. For performance data current to the most recent month end, visit us at www.oppenheimerfunds.com, or call us at 1.800.525.7048. Fund returns include changes in share price, reinvested distributions, and the applicable sales charge: for Class A shares, the current maximum initial sales charge of 5.75%; for Class B shares, the contingent deferred sales charge of 5% (1-year) and 2% (5-year); and for Class C and N shares, the 1% contingent deferred sales charge for the 1-year period. There is no sales charge for Class Y shares. See page 16 for further information.
11 | ACTIVE ALLOCATION FUND
FUND PERFORMANCE DISCUSSION
Class B Shares
Comparison of Change in Value of $10,000 Hypothetical Investments in:
12 | ACTIVE ALLOCATION FUND
Class C Shares
Comparison of Change in Value of $10,000 Hypothetical Investments in:
The performance data quoted represents past performance, which does not guarantee future results. The investment return and principal value of an investment in the Fund will fluctuate so that an investor’s shares, when redeemed, may be worth more or less than their original cost. Current performance may be lower or higher than the performance quoted. For performance data current to the most recent month end, visit us at www.oppenheimerfunds.com, or call us at 1.800.525.7048. Fund returns include changes in share price, reinvested distributions, and the applicable sales charge: for Class A shares, the current maximum initial sales charge of 5.75%; for Class B shares, the contingent deferred sales charge of 5% (1-year) and 2% (5-year); and for Class C and N shares, the 1% contingent deferred sales charge for the 1-year period. There is no sales charge for Class Y shares. See page 16 for further information.
13 | ACTIVE ALLOCATION FUND
FUND PERFORMANCE DISCUSSION
Class N Shares
Comparison of Change in Value of $10,000 Hypothetical Investments in:
14 | ACTIVE ALLOCATION FUND
Class Y Shares
Comparison of Change in Value of $10,000 Hypothetical Investments in:
The performance data quoted represents past performance, which does not guarantee future results. The investment return and principal value of an investment in the Fund will fluctuate so that an investor’s shares, when redeemed, may be worth more or less than their original cost. Current performance may be lower or higher than the performance quoted. For performance data current to the most recent month end, visit us at www.oppenheimerfunds.com, or call us at 1.800.525.7048. Fund returns include changes in share price, reinvested distributions, and the applicable sales charge: for Class A shares, the current maximum initial sales charge of 5.75%; for Class B shares, the contingent deferred sales charge of 5% (1-year) and 2% (5-year); and for Class C and N shares, the 1% contingent deferred sales charge for the 1-year period. There is no sales charge for Class Y shares. See page 16 for further information.
15 | ACTIVE ALLOCATION FUND
NOTES
Total returns and the ending account values in the graphs include changes in share price and reinvestment of dividends and capital gains distributions in a hypothetical investment for the periods shown. The Fund’s total returns shown do not reflect the deduction of income taxes on an individual’s investment. Taxes may reduce your actual investment returns on income or gains paid by the Fund or any gains you may realize if you sell your shares.
Investors should consider the Fund’s investment objectives, risks, expenses and other charges carefully before investing. The Fund’s prospectus and, if available, the Fund’s summary prospectus contain this and other information about the Fund, and may be obtained by asking your financial advisor, calling us at 1.800.525.7048 or visiting our website at www.oppenheimerfunds.com. Read the prospectus and, if available, the summary prospectus carefully before investing.
The Fund’s investment strategy and focus can change over time. The mention of specific fund holdings does not constitute a recommendation by OppenheimerFunds, Inc.
Class A shares of the Fund were first publicly offered on 4/5/05. Unless otherwise noted, Class A returns include the maximum initial sales charge of 5.75%.
Class B shares of the Fund were first publicly offered on 4/5/05. Unless otherwise noted, Class B returns include the applicable contingent deferred sales charge of 5% (1-year) and 2% (5-year). Class B shares are subject to an annual 0.75% asset-based sales charge.
Class C shares of the Fund were first publicly offered on 4/5/05. Unless otherwise noted, Class C returns include the contingent deferred sales charge of 1% for the 1-year period. Class C shares are subject to an annual 0.75% asset-based sales charge.
Class N shares of the Fund were first publicly offered on 4/5/05. Class N shares are offered only through retirement plans. Unless otherwise noted, Class N returns include the contingent deferred sales charge of 1% for the 1-year period. Class N shares are subject to an annual 0.25% asset-based sales charge.
Class Y shares of the Fund were first publicly offered on 4/5/05. Class Y shares are offered only to fee-based clients of dealers that have a special agreement with the Distributor, to certain institutional investors under a special agreement with the Distributor, and to present or former officers, directors, trustees or employees (and their eligible family members) of the Fund, the Manager, its affiliates, its parent company and the subsidiaries of its parent company, and retirement plans established for the benefit of such individuals.
An explanation of the calculation of performance is in the Fund’s Statement of Additional Information.
16 | ACTIVE ALLOCATION FUND
FUND EXPENSES
Fund Expenses. As a shareholder of the Fund, you incur two types of costs: (1) transaction costs, which may include sales charges (loads) on purchase payments, contingent deferred sales charges on redemptions; and (2) ongoing costs, including distribution and service fees; and other Fund expenses. These examples are intended to help you understand your ongoing costs (in dollars) of investing in the Fund and to compare these costs with the ongoing costs of investing in other mutual funds.
The examples are based on an investment of $1,000.00 invested at the beginning of the period and held for the entire 6-month period ended January 31, 2011.
Actual Expenses. The first section of the table provides information about actual account values and actual expenses. You may use the information in this section for the class of shares you hold, together with the amount you invested, to estimate the expense that you paid over the period. Simply divide your account value by $1,000.00 (for example, an $8,600.00 account value divided by $1,000.00 = 8.60), then multiply the result by the number in the first section under the heading entitled “Expenses Paid During Period” to estimate the expenses you paid on your account during this period.
Hypothetical Example for Comparison Purposes. The second section of the table provides information about hypothetical account values and hypothetical expenses based on the Fund’s actual expense ratio for each class of shares, and an assumed rate of return of 5% per year for each class before expenses, which is not the actual return. The hypothetical account values and expenses may not be used to estimate the actual ending account balance or expenses you paid for the period. You may use this information to compare the ongoing costs of investing in the Fund and other funds. To do so, compare this 5% hypothetical example for the class of shares you hold with the 5% hypothetical examples that appear in the shareholder reports of the other funds.
Please note that the expenses shown in the table are meant to highlight your ongoing costs only and do not reflect any transactional costs, such as front-end or contingent deferred sales charges (loads), or a $12.00 fee imposed annually on accounts valued at less than $500.00 (subject to exceptions described in the Statement of Additional Information). Therefore, the “hypothetical” section of the table is useful in comparing ongoing costs only, and will not help you determine the relative total costs of owning different funds. In addition, if these transactional costs were included, your costs would have been higher.
17 | ACTIVE ALLOCATION FUND
FUND EXPENSES Continued
| | | | | | | | | | | | | |
| | | Beginning | | Ending | | Expenses |
| | | Account | | Account | | Paid During |
| | | Value | | Value | | 6 Months Ended |
| Actual | | August 1, 2010 | | January 31, 2011 | | January 31, 2011 |
| Class A | | $ | 1,000.00 | | | $ | 1,136.00 | | | $ | 2.96 | |
| Class B | | | 1,000.00 | | | | 1,131.20 | | | | 7.60 | |
| Class C | | | 1,000.00 | | | | 1,131.00 | | | | 7.06 | |
| Class N | | | 1,000.00 | | | | 1,134.80 | | | | 3.99 | |
| Class Y | | | 1,000.00 | | | | 1,137.40 | | | | 1.08 | |
| | | | | | | | | | | | | |
Hypothetical
(5% return before expenses) | | | | | | | | | | | | |
| Class A | | | 1,000.00 | | | | 1,022.43 | | | | 2.81 | |
| Class B | | | 1,000.00 | | | | 1,018.10 | | | | 7.20 | |
| Class C | | | 1,000.00 | | | | 1,018.60 | | | | 6.69 | |
| Class N | | | 1,000.00 | | | | 1,021.48 | | | | 3.78 | |
| Class Y | | | 1,000.00 | | | | 1,024.20 | | | | 1.02 | |
Expenses are equal to the Fund’s annualized expense ratio for that class, multiplied by the average account value over the period, multiplied by 184/365 (to reflect the one-half year period). Those annualized expense ratios, excluding the indirect expenses incurred through the Fund’s investments in the underlying funds, based on the 6-month period ended January 31, 2011 are as follows:
| | | | | |
| Class | | Expense Ratios |
| Class A | | | 0.55 | % |
| Class B | | | 1.41 | |
| Class C | | | 1.31 | |
| Class N | | | 0.74 | |
| Class Y | | | 0.20 | |
The expense ratios reflect voluntary waivers or reimbursements of expenses by the Fund’s Manager and Distributor. Some of these undertakings may be modified or terminated at any time; some may not be modified or terminated until after one year from the date of the current prospectus, as indicated therein. The “Financial Highlights” tables in the Fund’s financial statements, included in this report, also show the gross expense ratios, without such waivers or reimbursements and reduction to custodian expenses, if applicable.
18 | ACTIVE ALLOCATION FUND
STATEMENT OF INVESTMENTS January 31, 2011
| | | | | | | | | |
| | | Shares | | | Value | |
| |
Investment Companies—99.6%1 | | | | | | | | |
Fixed Income Funds—23.6% | | | | | | | | |
| Oppenheimer Champion Income Fund, Cl. Y | | | 26,776,794 | | | $ | 53,018,051 | |
| Oppenheimer Core Bond Fund, Cl. Y | | | 29,075,766 | | | | 188,120,205 | |
| Oppenheimer International Bond Fund, Cl. Y | | | 15,636,130 | | | | 101,009,398 | |
| Oppenheimer Limited-Term Government Fund, Cl. Y | | | 12,379,957 | | | | 116,247,796 | |
| Oppenheimer Master Inflation Protected Securities Fund, LLC | | | 2,717,972 | | | | 27,854,049 | |
| Oppenheimer Master Loan Fund, LLC | | | 2,818,244 | | | | 33,205,636 | |
| | | | | | | | |
| | | | | | | | 519,455,135 | |
| | | | | | | | | |
Global Equity Funds—24.9% | | | | | | | | |
| Oppenheimer Developing Markets Fund, Cl. Y | | | 2,406,718 | | | | 82,213,491 | |
| Oppenheimer International Growth Fund, Cl. Y | | | 10,190,003 | | | | 286,440,973 | |
| Oppenheimer International Small Company Fund, Cl. Y | | | 1,743,889 | | | | 40,789,567 | |
| Oppenheimer Quest International Value Fund, Cl. Y | | | 8,153,829 | | | | 138,207,402 | |
| | | | | | | | |
| | | | | | | | 547,651,433 | |
| | | | | | | | | |
Money Market Fund—3.3% | | | | | | | | |
Oppenheimer Institutional Money Market Fund, Cl. E, 0.20%2 | | | 72,831,509 | | | | 72,831,509 | |
Specialty Funds—4.2% | | | | | | | | |
| Oppenheimer Commodity Strategy Total Return Fund, Cl. Y | | | 14,528,635 | | | | 54,772,953 | |
| Oppenheimer Gold & Special Minerals Fund, Cl. Y | | | 230,249 | | | | 10,073,403 | |
| Oppenheimer Real Estate Fund, Cl. Y | | | 1,345,471 | | | | 26,236,682 | |
| | | | | | | | |
| | | | | | | | 91,083,038 | |
| | | | | | | | | |
U.S. Equity Funds—43.6% | | | | | | | | |
Oppenheimer Capital Appreciation Fund, Cl. Y3 | | | 7,413,905 | | | | 341,632,761 | |
Oppenheimer Discovery Fund, Cl. Y3 | | | 279,642 | | | | 16,977,084 | |
| Oppenheimer Main Street Small- & Mid-Cap Fund, Cl. Y | | | 5,524,327 | | | | 119,435,951 | |
| Oppenheimer Value Fund, Cl. Y | | | 21,047,063 | | | | 479,662,571 | |
| | | | | | | | |
| | | | | | | | 957,708,367 | |
| | | | | | | | |
| Total Investment Companies (Cost $1,939,566,394) | | | | | | | 2,188,729,482 | |
| | | | | | | | | |
| |
U.S. Government Obligations—0.5% | | | | | | | | |
U.S. Treasury Bills, 0.165%, 3/3/114,5 (Cost $11,998,400) | | | 12,000,000 | | | | 11,998,400 | |
Total Investments, at Value (Cost $1,951,564,794) | | | 100.1 | % | | | 2,200,727,882 | |
Liabilities in Excess of Other Assets | | | (0.1 | ) | | | (2,683,070 | ) |
| | | |
Net Assets | | | 100.0 | % | | $ | 2,198,044,812 | |
| | | |
19 | ACTIVE ALLOCATION FUND
STATEMENT OF INVESTMENTS Continued
Footnotes to Statement of Investments
| | |
| 1. | | Is or was an affiliate, as defined in the Investment Company Act of 1940, at or during the period ended January 31, 2011, by virtue of the Fund owning at least 5% of the voting securities of the issuer or as a result of the Fund and the issuer having the same investment adviser. Transactions during the period in which the issuer was an affiliate are as follows: |
| | | | | | | | | | | | | | | | | |
| | | Shares | | | Gross | | | Gross | | | Shares | |
| | | January 31, 2010 | | | Additions | | | Reductions | | | January 31, 2011 | |
| |
| Oppenheimer Capital Appreciation Fund, Cl. Y | | | 5,800,866 | | | | 3,004,677 | | | | 1,391,638 | | | | 7,413,905 | |
| Oppenheimer Champion Income Fund, Cl. Y | | | 53,381,908 | | | | 16,391,926 | | | | 42,997,040 | | | | 26,776,794 | |
| Oppenheimer Commodity Strategy Total Return Fund, Cl. Y | | | 29,213,381 | | | | 886,576 | | | | 15,571,322 | | | | 14,528,635 | |
| Oppenheimer Core Bond Fund, Cl. Y | | | 34,522,291 | | | | 3,681,335 | | | | 9,127,860 | | | | 29,075,766 | |
| Oppenheimer Developing Markets Fund, Cl. Y | | | 3,527,318 | | | | 780,870 | | | | 1,901,470 | | | | 2,406,718 | |
| Oppenheimer Discovery Fund, Cl. Y | | | 708,254 | | | | 285,694 | | | | 714,306 | | | | 279,642 | |
| Oppenheimer Global Fund, Cl. Y | | | 2,746,831 | | | | 313,643 | | | | 3,060,474 | | | | — | |
| Oppenheimer Gold & Special Minerals Fund, Cl. A | | | — | | | | 582,499 | | | | 582,499 | | | | — | |
| Oppenheimer Gold & Special Minerals Fund, Cl. Y | | | — | | | | 611,698 | | | | 381,449 | | | | 230,249 | |
| Oppenheimer Institutional Money Market Fund, Cl. E | | | 434,897 | | | | 329,614,855 | | | | 257,218,243 | | | | 72,831,509 | |
| Oppenheimer International Bond Fund, Cl. Y | | | 12,095,699 | | | | 6,484,148 | | | | 2,943,717 | | | | 15,636,130 | |
| Oppenheimer International Growth Fund, Cl. Y | | | 6,529,838 | | | | 4,866,401 | | | | 1,206,236 | | | | 10,190,003 | |
| Oppenheimer International Small Company Fund, Cl. Y | | | 62 | | | | 1,920,438 | | | | 176,611 | | | | 1,743,889 | |
| Oppenheimer Limited-Term Government Fund, Cl. Y | | | — | | | | 13,067,091 | | | | 687,134 | | | | 12,379,957 | |
| Oppenheimer Main Street Fund, Cl. Y | | | 8,107,326 | | | | 44,398 | | | | 8,151,724 | | | | — | |
Oppenheimer Main Street Small- & Mid-Cap Fund, Cl. Y
(formerly Oppenheimer Main Street Small Cap Fund, Cl. Y) | | | 9,753,662 | | | | 197,752 | | | | 4,427,087 | | | | 5,524,327 | |
| Oppenheimer Master Inflation Protected Securities Fund, LLC | | | — | | | | 2,908,340 | | | | 190,368 | | | | 2,717,972 | |
| Oppenheimer Master Loan Fund, LLC | | | — | | | | 3,001,732 | | | | 183,488 | | | | 2,818,244 | |
| Oppenheimer Quest International Value Fund, Cl. Y | | | — | | | | 9,870,575 | | | | 1,716,746 | | | | 8,153,829 | |
| Oppenheimer Real Estate Fund, Cl. Y | | | 5,568,421 | | | | 81,086 | | | | 4,304,036 | | | | 1,345,471 | |
| Oppenheimer Small- & Mid- Cap Value Fund, Cl. Y | | | 752,844 | | | | 1,903 | | | | 754,747 | | | | — | |
| Oppenheimer U.S. Government Trust, Cl. Y | | | 13,906,608 | | | | 316,051 | | | | 14,222,659 | | | | — | |
| Oppenheimer Value Fund, Cl. Y | | | 11,376,212 | | | | 11,858,252 | | | | 2,187,401 | | | | 21,047,063 | |
| | | | | | | | | | | | | |
| | | | | | | | | | | Realized | |
| | | Value | | | Income | | | Gain (Loss) | |
| |
| Oppenheimer Capital Appreciation Fund, Cl. Y | | $ | 341,632,761 | | | $ | — | | | $ | 3,633,139 | |
| Oppenheimer Champion Income Fund, Cl. Y | | | 53,018,051 | | | | 5,410,886 | | | | (53,969,204 | ) |
| Oppenheimer Commodity Strategy Total Return Fund, Cl. Y | | | 54,772,953 | | | | 977,866 | | | | (13,326,194 | ) |
| Oppenheimer Core Bond Fund, Cl. Y | | | 188,120,205 | | | | 10,622,830 | | | | (19,011,421 | ) |
| Oppenheimer Developing Markets Fund, Cl. Y | | | 82,213,491 | | | | 441,876 | | | | 13,629,147 | |
| Oppenheimer Discovery Fund, Cl. Y | | | 16,977,084 | | | | — | | | | 653,344 | |
| Oppenheimer Global Fund, Cl. Y | | | — | | | | — | | | | (26,762,216 | ) |
| Oppenheimer Gold & Special Minerals Fund, Cl. A | | | — | | | | — | | | | 1,928,405 | |
| Oppenheimer Gold & Special Minerals Fund, Cl. Y | | | 10,073,403 | | | | 2,498,174 | | | | (42,040 | ) |
| Oppenheimer Institutional Money Market Fund, Cl. E | | | 72,831,509 | | | | 132,373 | | | | — | |
| Oppenheimer International Bond Fund, Cl. Y | | | 101,009,398 | | | | 4,487,237 | | | | 3,207 | |
| Oppenheimer International Growth Fund, Cl. Y | | | 286,440,973 | | | | 2,691,127 | | | | 976,651 | |
| Oppenheimer International Small Company Fund, Cl. Y | | | 40,789,567 | | | | 3,646,518 | | | | 550,629 | |
| Oppenheimer Limited-Term Government Fund, Cl. Y | | | 116,247,796 | | | | 2,127,009 | | | | 1,007 | |
| Oppenheimer Main Street Fund, Cl. Y | | | — | | | | — | | | | (57,895,128 | ) |
20 | ACTIVE ALLOCATION FUND
| | | | | | | | | | | | | |
| | | | | | | | | | | Realized | |
| | | Value | | | Income | | | Gain (Loss) | |
| |
Oppenheimer Main Street Small- & Mid-Cap Fund, Cl. Y
(formerly Oppenheimer Main Street Small Cap Fund, Cl. Y) | | $ | 119,435,951 | | | $ | — | | | $ | (5,026,855 | ) |
| Oppenheimer Master Inflation Protected Securities Fund, LLC | | | 27,854,049 | | | | 258,988 | a | | | 83,922 | a |
| Oppenheimer Master Loan Fund, LLC | | | 33,205,636 | | | | 1,540,260 | b | | | 37,664 | b |
| Oppenheimer Quest International Value Fund, Cl. Y | | | 138,207,402 | | | | 3,725,028 | | | | 336,850 | |
| Oppenheimer Real Estate Fund, Cl. Y | | | 26,236,682 | | | | 495,253 | | | | (7,518,398 | ) |
| Oppenheimer Small- & Mid- Cap Value Fund, Cl. Y | | | — | | | | 478,874 | | | | 2,632,994 | |
| Oppenheimer U.S. Government Trust,Cl. Y | | | — | | | | 2,168,998 | | | | 9,916,295 | |
| Oppenheimer Value Fund, Cl. Y | | | 479,662,571 | | | | 4,903,733 | | | | (11,691,765 | ) |
| | | |
| | | $ | 2,188,729,482 | | | $ | 46,607,030 | | | $ | (160,859,967 | ) |
| | | |
| | |
| a. | | Represents the amount allocated to the Fund from Oppenheimer Master Inflation Protected Securities Fund, LLC. |
| |
| b. | | Represents the amount allocated to the Fund from Oppenheimer Master Loan Fund, LLC. |
| |
| 2. | | Rate shown is the 7-day yield as of January 31, 2011. |
| |
| 3. | | Non-income producing security. |
| |
| 4. | | All or a portion of the security position is held in collateralized accounts to cover initial margin requirements on open futures contracts and written options on futures, if applicable. The aggregate market value of such securities is $2,549,702. See Note 5 of the accompanying Notes. |
| |
| 5. | | All or a portion of the security position is held in collateral accounts to cover the Fund’s obligations under certain derivative contracts. The aggregate market value of such securities is $319,963. See Note 5 of the accompanying Notes. |
Valuation Inputs
Various data inputs are used in determining the value of each of the Fund’s investments as of the reporting period end. These data inputs are categorized in the following hierarchy under applicable financial accounting standards:
| | 1) | | Level 1—unadjusted quoted prices in active markets for identical assets or liabilities (including securities actively traded on a securities exchange) |
| |
| | 2) | | Level 2—inputs other than unadjusted quoted prices that are observable for the asset or liability (such as unadjusted quoted prices for similar assets and market corroborated inputs such as interest rates, prepayment speeds, credit risks, etc.) |
| |
| | 3) | | Level 3—significant unobservable inputs (including the Manager’s own judgments about assumptions that market participants would use in pricing the asset or liability). |
The table below categorizes amounts that are included in the Fund’s Statement of Assets and Liabilities as of January 31, 2011 based on valuation input level:
21 | ACTIVE ALLOCATION FUND
STATEMENT OF INVESTMENTS Continued
Footnotes to Statement of Investments Continued
| | | | | | | | | | | | | | | | | |
| | | | | | | | | | | Level 3— | | | | |
| | | Level 1— | | | Level 2— | | | Significant | | | | |
| | | Unadjusted | | | Other Significant | | | Unobservable | | | | |
| | | Quoted Prices | | | Observable Inputs | | | Inputs | | | Value | |
| |
Assets Table | | | | | | | | | | | | | | | | |
Investments, at Value: | | | | | | | | | | | | | | | | |
| Investment Companies | | $ | 2,188,729,482 | | | $ | — | | | $ | — | | | $ | 2,188,729,482 | |
| U.S. Government Obligations | | | — | | | | 11,998,400 | | | | — | | | | 11,998,400 | |
| | | |
| Total Investments, at Value | | | 2,188,729,482 | | | | 11,998,400 | | | | — | | | | 2,200,727,882 | |
Other Financial Instruments: | | | | | | | | | | | | | | | | |
| Appreciated swaps, at value | | | — | | | | 1,319,548 | | | | — | | | | 1,319,548 | |
| Futures margins | | | 154,778 | | | | — | | | | — | | | | 154,778 | |
| Foreign currency exchange contracts | | | — | | | | 412,936 | | | | — | | | | 412,936 | |
| | | |
| Total Assets | | $ | 2,188,884,260 | | | $ | 13,730,884 | | | $ | — | | | $ | 2,202,615,144 | |
| | | |
Liabilities Table | | | | | | | | | | | | | | | | |
Other Financial Instruments: | | | | | | | | | | | | | | | | |
| Depreciated swaps, at value | | $ | — | | | $ | (256,276 | ) | | $ | — | | | $ | (256,276 | ) |
| Futures margins | | | (176 | ) | | | — | | | | — | | | | (176 | ) |
| Foreign currency exchange contracts | | | — | | | | (423,086 | ) | | | — | | | | (423,086 | ) |
| | | |
| Total Liabilities | | $ | (176 | ) | | $ | (679,362 | ) | | $ | — | | | $ | (679,538 | ) |
| | | |
Currency contracts and forwards, if any, are reported at their unrealized appreciation/depreciation at measurement date, which represents the change in the contract’s value from trade date. Futures, if any, are reported at their variation margin at measurement date, which represents the amount due to/from the Fund at that date. All additional assets and liabilities included in the above table are reported at their market value at measurement date.
See the accompanying Notes for further discussion of the methods used in determining value of the Fund’s investments, and a summary of changes to the valuation methodologies, if any, during the reporting period.
Foreign Currency Exchange Contracts as of January 31, 2011 are as follows:
| | | | | | | | | | | | | | | | | | | | | | | | | |
| Counterparty/ | | | | | | Contract | | | | | | | | | | | | | | |
| Contract | | | | | | Amount | | | Expiration | | | | | | | Unrealized | | | Unrealized | |
| Description | | Buy/Sell | | | (000’s) | | | Date | | | Value | | | Appreciation | | | Depreciation | |
| |
Citigroup: | | | | | | | | | | | | | | | | | | | | | | | | |
| Czech Koruna (CZK) | | Sell | | 61,510 | CZK | | | 3/7/11 | | | $ | 3,479,620 | | | $ | — | | | $ | 167,467 | |
| Hong Kong Dollar (HKD) | | Sell | | 17,000 | HKD | | | 3/7/11 | | | | 2,181,291 | | | | 8,161 | | | | — | |
| Hungarian Forint (HUF) | | Sell | | 455,210 | HUF | | | 3/7/11 | | | | 2,273,593 | | | | — | | | | 80,127 | |
| Mexican Nuevo Peso (MXN) | | Sell | | 26,820 | MXN | | | 3/7/11 | | | | 2,204,627 | | | | — | | | | 17,115 | |
| New Turkish Lira (TRY) | | Sell | | 4,090 | TRY | | | 3/7/11 | | | | 2,537,228 | | | | 86,922 | | | | — | |
| Polish Zloty (PLZ) | | Sell | | 16,170 | PLZ | | | 3/7/11 | | | | 5,616,472 | | | | — | | | | 142,538 | |
| Singapore Dollar (SGD) | | Sell | | 3,650 | SGD | | | 3/7/11 | | | | 2,853,231 | | | | — | | | | 13,073 | |
| South African Rand (ZAR) | | Sell | | 7,250 | ZAR | | | 3/7/11 | | | | 1,003,187 | | | | 74,399 | | | | — | |
| | |
| | | | | | | | | | | | | | | | | | | | 169,482 | | | | 420,320 | |
Nomura Securities: | | | | | | | | | | | | | | | | | | | | | | | | |
| British Pound Sterling (GBP) | | Buy | | 1,190 | GBP | | | 3/7/11 | | | | 1,905,718 | | | | 48,247 | | | | — | |
| Euro (EUR) | | Buy | | 7,220 | EUR | | | 3/7/11 | | | | 9,880,981 | | | | 195,207 | | | | — | |
| Japanese Yen(JPY) | | Buy | | 849,000 | JPY | | | 3/7/11 | | | | 10,345,844 | | | | — | | | | 2,766 | |
| | |
| | | | | | | | | | | | | | | | | | | | 243,454 | | | | 2,766 | |
| | |
| Total unrealized appreciation and depreciation | | | | | | | | | | $ | 412,936 | | | $ | 423,086 | |
| | |
22 | ACTIVE ALLOCATION FUND
Futures Contracts as of January 31, 2011 are as follows:
| | | | | | | | | | | | | | | | | | | | | |
| | | | | | | | | | | | | | | | | | | Unrealized | |
| | | | | | | Number of | | | Expiration | | | | | | | Appreciation | |
| Contract Description | | Buy/Sell | | | Contracts | | | Date | | | Value | | | (Depreciation) | |
| |
| Euro-Bundesobligation | | Buy | | | 49 | | | | 3/8/11 | | | $ | 8,301,514 | | | $ | (138,370 | ) |
| Japan (Government of) Mini Bonds, 10 yr. | | Buy | | | 65 | | | | 3/9/11 | | | | 11,086,745 | | | | (29,445 | ) |
| United Kingdom Long Gilt | | Buy | | | 11 | | | | 3/29/11 | | | | 2,067,390 | | | | (27,808 | ) |
| U.S. Treasury Long Bonds, 20 yr. | | Sell | | | 177 | | | | 3/22/11 | | | | 21,350,625 | | | | 233,474 | |
| | | | | | | | | | | | | | | | | | | | |
| | | | | | | | | | | | | | | | | | | $ | 37,851 | |
| | | | | | | | | | | | | | | | | | | | |
Interest Rate Swap Contracts as of January 31, 2011 are as follows:
| | | | | | | | | | | | | | | | | | | | | |
| | | Notional | | | | | | | | | | | | | |
| Interest Rate/ | | Amount | | | Paid by | | | Received by | | | Termination | | | | |
| Swap Counterparty | | (000’s) | | | the Fund | | | the Fund | | | Date | | | Value | |
| |
| Six-Month EUR EURIBOR | | | | | | | | | | | | | | | | |
| | | | | | | | | | | Six-Month | | | | | | | | |
| Barclays Bank plc | | 16,000 | EUR | | | 3.428 | % | | EUR EURIBOR | | | 1/28/21 | | | $ | (56,276 | ) |
| Six-Month USD BBA LIBOR | | | | | | | | | | | | | | | | |
| | | | | | | Six-Month | | | | | | | | | | | | |
| | | | | | | USD BBA | | | | | | | | | | | | |
| Barclays Bank plc | | | 21,900 | | | LIBOR | | | 3.483 | % | | | 1/28/21 | | | | 151,263 | |
| | | | | | | | | | | | | | | | | | | | |
| Total Interest Rate Swaps | | | | | | | | | | | | | | | | | | $ | 94,987 | |
| | | | | | | | | | | | | | | | | | | | |
Notional amount is reported in U.S. Dollars (USD), except for those denoted in the following currency:
Abbreviations/Definitions are as follows:
| | | |
|
| BBA LIBOR | | British Bankers’ Association London-Interbank Offered Rate |
| EURIBOR | | Euro Interbank Offered Rate |
23 | ACTIVE ALLOCATION FUND
STATEMENT OF INVESTMENTS Continued
Footnotes to Statement of Investments Continued
Total Return Swap Contracts as of January 31, 2011 are as follows:
| | | | | | | | | | | | | | | | | | | | | |
| | | Notional | | | | | | | | | | | | | |
| Reference Entity/ | | Amount | | | Paid by | | | Received by | | | Termination | | | | |
| Swap Counterparty | | (000’s) | | | the Fund | | | the Fund | | | Date | | | Value | |
| |
Basket of securities replicating the GS Theme/Strategic International Growth Index | | | | | | | | | | | | | | | | | | | | |
| | | | | | | One-Month USD | | | | | | | | | | | | |
| | | | | | | BBA LIBOR plus 35 | | | | | | | | | | | | |
| | | | | | | basis points and if | | | | | | | | | | | | |
| | | | | | | negative, the absolute | | If positive, the Total | | | | | | | | |
| | | | | | | value of the Total | | Return of a basket | | | | | | | | |
| | | | | | | Return of a basket of | | of securities | | | | | | | | |
| | | | | | | securities replicating | | replicating the GS | | | | | | | | |
| | | | | | | the GS Theme/Strategic | | Theme/Strategic | | | | | | | | |
| Goldman Sachs | | | | | | International | | International | | | | | | | | |
| Group, Inc. (The) | | $ | 17,029 | | | Growth Index | | Growth Index | | | 1/27/12 | | | $ | 134,893 | |
| |
MSCI Daily TR Net EAFE USD Index: | | | | | | | | | | | | | | | | | | | | |
| | | | | | | One-Month USD | | | | | | | | | | | | |
| | | | | | | BBA LIBOR minus 4 | | | | | | | | | | | | |
| | | | | | | basis points and if | | | | | | | | | | | | |
| | | | | | | negative, the absolute | | | | | | | | | | | | |
| | | | | | | value of the Total | | If positive, the Total | | | | | | | | |
| | | | | | | Return of the MSCI | | Return of the MSCI | | | | | | | | |
| | | | | | | Daily Net EAFE | | Daily Net EAFE | | | | | | | | |
| UBS AG | | | 26,094 | | | USD Index | | USD Index | | | 1/10/12 | | | | 782,874 | |
| | | | | | | One-Month USD | | | | | | | | | | | | |
| | | | | | | BBALIBOR plus 15 basis | | | | | | | | | | | | |
| | | | | | | points and if negative, | | | | | | | | | | | | |
| | | | | | | the absolute value of | | If positive, the Total | | | | | | | | |
| | | | | | | the Total Return of the | | Return of the | | | | | | | | |
| | | | | | | MSCI Daily Net | | MSCI Daily Net | | | | | | | | |
| UBS AG | | | 21,349 | | | EAFE USD Index | | EAFE USD Index | | | 1/25/12 | | | | 97,997 | |
| | | | | | | | | | | | | | | | | | | | |
| Reference Entity Total | | | | | | | | | | | | | 880,871 | |
| |
MSCI World Commodity Producers USD Index | | | | | | | | | | | | | | | | | | | | |
| | | | | | | One-Month USD | | | | | | | | | | | | |
| | | | | | | BBA LIBOR plus 45 | | | | | | | | | | | | |
| | | | | | | basis points and if | | | | | | | | | | | | |
| | | | | | | negative, the absolute | | If positive, the Total | | | | | | | | |
| | | | | | | value of the MSCI | | Return of the MSCI | | | | | | | | |
| | | | | | | World Commodity | | World Commodity | | | | | | | | |
| Morgan Stanley | | | 8,340 | | | Producers USD Index | | Producers USD Index | | | 11/15/11 | | | | 152,521 | |
24 | ACTIVE ALLOCATION FUND
| | | | | | | | | | | | | | | | | | | | | |
| | | Notional | | | | | | | | | | | | | |
| Reference Entity/ | | Amount | | | Paid by | | | Received by | | | Termination | | | | |
| Swap Counterparty | | (000’s) | | | the Fund | | | the Fund | | | Date | | | Value | |
| |
S&P 100 Index | | | | | | | | | | | | | | | | | | | | |
| | | | | | | | | | | One-Month USD | | | | | | | | |
| | | | | | | | | | | BBA LIBOR plus 5 | | | | | | | | |
| | | | | | | | | | | basis points and if | | | | | | | | |
| | | | | | | | | | | negative, the absolute | | | | | | | | |
| | | | | | | If positive, the | | value of the Total | | | | | | | | |
| Goldman Sachs Group, | | | | | | Total Return of the | | Return of the | | | | | | | | |
| Inc. (The) | | $ | 26,404 | | | S&P 100 Index | | S&P 100 Index | | | 1/10/12 | | | $ | (200,000 | ) |
| | | | | | | | | | | | | | | | | | | | |
| Total of Total Return Swaps | | | | | | | | | | | | | | | | | | $ | 968,285 | |
| | | | | | | | | | | | | | | | | | | | |
Abbreviations are as follows:
| | | |
|
| BBA LIBOR | | British Bankers’ Association London-Interbank Offered Rate |
| EAFE | | Europe, Australasia, Far East |
| GS | | Goldman Sachs |
| MSCI | | Morgan Stanley Capital International |
| S&P | | Standard & Poor’s |
| TR | | Total Return |
The following table aggregates, as of period end, the amount receivable from/(payable to) each counterparty with whom the Fund has entered into a swap agreement. Swaps are individually disclosed in the preceding tables.
Swap Summary as of January 31, 2011 is as follows:
| | | | | | | | | | | | | |
| | | | | | | Notional | | | | |
| | | Swap Type from | | | Amount | | | | |
| Swap Counterparty | | Fund Perspective | | | (000’s) | | | Value | |
| |
| Barclays Bank plc: | | | | | | | | | | | | |
| | | Interest Rate | | 16,000 | EUR | | $ | (56,276 | ) |
| | | Interest Rate | | | 21,900 | | | | 151,263 | |
| | | | | | | | | | | | |
| | | | | | | | | | | | 94,987 | |
| Goldman Sachs Group, Inc. (The) | | Total Return | | | 43,433 | | | | (65,107 | ) |
| Morgan Stanley | | Total Return | | | 8,340 | | | | 152,521 | |
| UBS AG | | Total Return | | | 47,443 | | | | 880,871 | |
| | | | | | | | | | | | |
| Total Swaps | | | | | | | | $ | 1,063,272 | |
| | | | | | | | | | | | |
Notional amount is reported in U.S. Dollars (USD), except for those denoted in the following currency:
See accompanying Notes to Financial Statements.
25 | ACTIVE ALLOCATION FUND
STATEMENT OF ASSETS AND LIABILITIES January 31, 2011
| | | | | |
|
| |
Assets | | | | |
| Investments, at value—see accompanying statement of investments: | | | | |
| Unaffiliated companies (cost $11,998,400) | | $ | 11,998,400 | |
| Affiliated companies (cost $1,939,566,394) | | | 2,188,729,482 | |
| | | | |
| | | | 2,200,727,882 | |
| |
| Cash | | | 804,639 | |
| |
| Unrealized appreciation on foreign currency exchange contracts | | | 412,936 | |
| |
| Appreciated swaps, at value (upfront payments $0) | | | 1,319,548 | |
| |
| Receivables and other assets: | | | | |
| Dividends | | | 1,793,890 | |
| Shares of beneficial interest sold | | | 808,409 | |
| Investments sold | | | 291,663 | |
| Futures margins | | | 154,778 | |
| Other | | | 106,554 | |
| | | | |
| Total assets | | | 2,206,420,299 | |
| | | | | |
| |
Liabilities | | | | |
| Unrealized depreciation on foreign currency exchange contracts | | | 423,086 | |
| |
| Depreciated swaps, at value (upfront payments $0) | | | 256,276 | |
| |
| Payables and other liabilities: | | | | |
| Shares of beneficial interest redeemed | | | 3,439,637 | |
| Investments purchased | | | 1,810,381 | |
| Closed foreign currency contracts | | | 1,176,365 | |
| Distribution and service plan fees | | | 441,170 | |
| Transfer and shareholder servicing agent fees | | | 308,765 | |
| Shareholder communications | | | 257,535 | |
| Trustees’ compensation | | | 197,278 | |
| Futures margins | | | 176 | |
| Other | | | 64,818 | |
| | | | |
| Total liabilities | | | 8,375,487 | |
| |
Net Assets | | $ | 2,198,044,812 | |
| | | | |
| | | | | |
| |
Composition of Net Assets | | | | |
| Par value of shares of beneficial interest | | $ | 229,188 | |
| |
| Additional paid-in capital | | | 2,716,231,608 | |
| |
| Accumulated net investment income | | | 36,629,661 | |
| |
| Accumulated net realized loss on investments and foreign currency transactions | | | (805,299,706 | ) |
| |
| Net unrealized appreciation on investments and translation of assets and liabilities denominated in foreign currencies | | | 250,254,061 | |
| | | | |
Net Assets | | $ | 2,198,044,812 | |
| | | | |
26 | ACTIVE ALLOCATION FUND
| | | | | |
|
| |
Net Asset Value Per Share | | | | |
| Class A Shares: | | | | |
| Net asset value and redemption price per share (based on net assets of $1,201,750,464 and 124,362,590 shares of beneficial interest outstanding) | | $ | 9.66 | |
| Maximum offering price per share (net asset value plus sales charge of 5.75% of offering price) | | $ | 10.25 | |
| |
| Class B Shares: | | | | |
| Net asset value, redemption price (excludes applicable contingent deferred sales charge) and offering price per share (based on net assets of $343,068,688 and 36,156,289 shares of beneficial interest outstanding) | | $ | 9.49 | |
| |
| Class C Shares: | | | | |
| Net asset value, redemption price (excludes applicable contingent deferred sales charge) and offering price per share (based on net assets of $492,493,463 and 51,957,164 shares of beneficial interest outstanding) | | $ | 9.48 | |
| |
| Class N Shares: | | | | |
| Net asset value, redemption price (excludes applicable contingent deferred sales charge) and offering price per share (based on net assets of $148,609,213 and 15,470,542 shares of beneficial interest outstanding) | | $ | 9.61 | |
| |
| Class Y Shares: | | | | |
| Net asset value, redemption price and offering price per share (based on net assets of $12,122,984 and 1,241,849 shares of beneficial interest outstanding) | | $ | 9.76 | |
See accompanying Notes to Financial Statements.
27 | ACTIVE ALLOCATION FUND
STATEMENT OF OPERATIONS For the Year Ended January 31, 2011
| | | | | |
|
| |
Allocation of Income and Expenses from Master Funds1 | | | | |
| Net investment income allocated from Oppenheimer Master Inflation Protected Securities Fund, LLC: | | | | |
| Interest | | $ | 258,988 | |
| Expenses | | | (105,621 | ) |
| | | | |
| Net investment income allocated from Oppenheimer Master Inflation Protected Securities Fund, LLC | | | 153,367 | |
| |
| Net investment income allocated from Oppenheimer Master Loan Fund, LLC: | | | | |
| Interest | | | 1,538,353 | |
| Dividends | | | 1,907 | |
Expenses2 | | | (59,697 | ) |
| | | | |
| Net investment income allocated from Oppenheimer Master Loan Fund, LLC | | | 1,480,563 | |
| | | | |
| Total allocation of net investment income from master funds | | | 1,633,930 | |
| |
Investment Income | | | | |
| Interest | | | 15,633 | |
| |
| Dividends from affiliated companies | | | 44,807,782 | |
| |
| Other income | | | 49,391 | |
| | | | |
| Total investment income | | | 44,872,806 | |
| |
Expenses | | | | |
| Distribution and service plan fees: | | | | |
| Class A | | | 2,784,908 | |
| Class B | | | 3,220,885 | |
| Class C | | | 4,607,298 | |
| Class N | | | 704,431 | |
| |
| Transfer and shareholder servicing agent fees: | | | | |
| Class A | | | 2,062,243 | |
| Class B | | | 905,019 | |
| Class C | | | 877,127 | |
| Class N | | | 186,773 | |
| Class Y | | | 6,697 | |
| |
| Shareholder communications: | | | | |
| Class A | | | 212,154 | |
| Class B | | | 98,856 | |
| Class C | | | 77,919 | |
| Class N | | | 8,872 | |
| Class Y | | | 160 | |
| |
| Asset allocation fees | | | 2,058,056 | |
| |
| Trustees’ compensation | | | 35,980 | |
| |
| Custodian fees and expenses | | | 22,523 | |
| |
| Administration service fees | | | 1,500 | |
| |
| Other | | | 158,141 | |
| | | | |
| Total expenses | | | 18,029,542 | |
| Less waivers and reimbursements of expenses | | | (17,741 | ) |
| | | | |
| Net expenses | | | 18,011,801 | |
| |
Net Investment Income | | | 28,494,935 | |
28 | ACTIVE ALLOCATION FUND
| | | | | |
|
| |
Realized and Unrealized Gain (Loss) | | | | |
| Net realized gain (loss) on: | | | | |
| Investments: | | | | |
| Unaffiliated companies | | $ | 1,048,554 | |
| Affiliated companies | | | (160,981,553 | ) |
| Distributions received from affiliated companies | | | 1,558,552 | |
| Closing and expiration of futures contracts | | | 126,079 | |
| Foreign currency transactions | | | 1,919,394 | |
| Swap contracts | | | 4,639,956 | |
| |
| Net realized gain allocated from: | | | | |
| Oppenheimer Master Inflation Protected Securities Fund, LLC | | | 83,922 | |
| Oppenheimer Master Loan Fund, LLC | | | 37,664 | |
| | | | |
| Total realized loss | | | (151,567,432 | ) |
| |
| Net change in unrealized appreciation/depreciation on: | | | | |
| Investments | | | 471,786,289 | |
| Translation of assets and liabilities denominated in foreign currencies | | | (10,150 | ) |
| Futures contracts | | | 1,108,182 | |
| Swap contracts | | | 1,661,724 | |
| |
| Net change in unrealized appreciation/deprecation allocated from: | | | | |
| Oppenheimer Master Inflation Protected Securities Fund, LLC | | | 448,157 | |
| Oppenheimer Master Loan Fund, LLC | | | 1,143,577 | |
| | | | |
| Total change in unrealized appreciation/depreciation | | | 476,137,779 | |
| |
Net Increase in Net Assets Resulting from Operations | | $ | 353,065,282 | |
| | | | |
| | |
| 1. | | The Fund invests in certain affiliated mutual funds that expect to be treated as partnerships for tax purposes. See Note 1 of the accompanying Notes. |
| |
| 2. | | Net of expense waivers and/or reimbursements of $812. |
See accompanying Notes to Financial Statements.
29 | ACTIVE ALLOCATION FUND
STATEMENTS OF CHANGES IN NET ASSETS
| | | | | | | | | |
| Year Ended January 31, | | 2011 | | | 2010 | |
| |
Operations | | | | | | | | |
| Net investment income | | $ | 28,494,935 | | | $ | 5,317,251 | |
| |
| Net realized loss | | | (151,567,432 | ) | | | (309,836,374 | ) |
| |
| Net change in unrealized appreciation/depreciation | | | 476,137,779 | | | | 785,962,480 | |
| | | |
| Net increase in net assets resulting from operations | | | 353,065,282 | | | | 481,443,357 | |
| | | | | | | | | |
Dividends and/or Distributions to Shareholders | | | | | | | | |
| Dividends from net investment income: | | | | | | | | |
| Class A | | | (10,688,244 | ) | | | (11,384,280 | ) |
| Class B | | | (422,379 | ) | | | (942,877 | ) |
| Class C | | | (1,066,886 | ) | | | (1,723,620 | ) |
| Class N | | | (1,071,692 | ) | | | (1,244,659 | ) |
| Class Y | | | (150,325 | ) | | | (47,386 | ) |
| | | |
| | | | (13,399,526 | ) | | | (15,342,822 | ) |
| | | | | | | | | |
Beneficial Interest Transactions | | | | | | | | |
| Net increase (decrease) in net assets resulting from | | | | | | | | |
| beneficial interest transactions: | | | | | | | | |
| Class A | | | (54,138,768 | ) | | | (49,729,606 | ) |
| Class B | | | (22,430,688 | ) | | | (21,375,156 | ) |
| Class C | | | (25,510,343 | ) | | | (34,239,711 | ) |
| Class N | | | (8,975,568 | ) | | | (2,641,340 | ) |
| Class Y | | | 6,966,799 | | | | 63,408 | |
| | | |
| | | | (104,088,568 | ) | | | (107,922,405 | ) |
| | | | | | | | | |
Net Assets | | | | | | | | |
| Total increase | | | 235,577,188 | | | | 358,178,130 | |
| |
| Beginning of period | | | 1,962,467,624 | | | | 1,604,289,494 | |
| | | |
| End of period (including accumulated net investment income of $36,629,661 and $13,747,384, respectively) | | $ | 2,198,044,812 | | | $ | 1,962,467,624 | |
| | | |
See accompanying Notes to Financial Statements.
30 | ACTIVE ALLOCATION FUND
FINANCIAL HIGHLIGHTS
Class A
| | | | | | | | | | | | | | | | | | | | | |
| Year Ended January 31, | | 2011 | | | 2010 | | | 2009 | | | 2008 | | | 2007 | |
| |
Per Share Operating Data | | | | | | | | | | | | | | | | | | | | |
| Net asset value, beginning of period | | $ | 8.19 | | | $ | 6.28 | | | $ | 11.28 | | | $ | 12.05 | | | $ | 11.10 | |
| |
| Income (loss) from investment operations: | | | | | | | | | | | | | | | | | | | | |
Net investment income1 | | | .15 | | | | .04 | | | | .10 | | | | .44 | | | | .35 | |
| Net realized and unrealized gain (loss) | | | 1.41 | | | | 1.96 | | | | (4.74 | ) | | | (.61 | ) | | | .89 | |
| | | |
| Total from investment operations | | | 1.56 | | | | 2.00 | | | | (4.64 | ) | | | (.17 | ) | | | 1.24 | |
| |
| Dividends and/or distributions to shareholders: | | | | | | | | | | | | | | | | | | | | |
| Dividends from net investment income | | | (.09 | ) | | | (.09 | ) | | | — | | | | (.43 | ) | | | (.24 | ) |
| Distributions from net realized gain | | | — | | | | — | | | | (.36 | ) | | | (.17 | ) | | | (.05 | ) |
| | | |
| Total dividends and/or distributions to shareholders | | | (.09 | ) | | | (.09 | ) | | | (.36 | ) | | | (.60 | ) | | | (.29 | ) |
| |
| Net asset value, end of period | | $ | 9.66 | | | $ | 8.19 | | | $ | 6.28 | | | $ | 11.28 | | | $ | 12.05 | |
| | | |
| | | | | | | | | | | | | | | | | | | | | |
Total Return, at Net Asset Value2 | | | 19.01 | % | | | 31.77 | % | | | (41.33 | )% | | | (1.69 | )% | | | 11.14 | % |
| | | | | | | | | | | | | | | | | | | | | |
Ratios/Supplemental Data | | | | | | | | | | | | | | | | | | | | |
| Net assets, end of period (in thousands) | | $ | 1,201,751 | | | $ | 1,070,411 | | | $ | 868,187 | | | $ | 1,396,770 | | | $ | 956,520 | |
| |
| Average net assets (in thousands) | | $ | 1,124,399 | | | $ | 983,645 | | | $ | 1,267,124 | | | $ | 1,267,499 | | | $ | 605,517 | |
| |
Ratios to average net assets:3 Net investment income | | | 1.70 | %4 | | | 0.59 | % | | | 1.00 | % | | | 3.54 | % | | | 3.10 | % |
Total expenses5 | | | 0.57 | %4 | | | 0.61 | % | | | 0.53 | % | | | 0.48 | % | | | 0.51 | % |
| Expenses after payments, waivers and/or reimbursements and reduction to custodian expenses | | | 0.57 | %4 | | | 0.60 | % | | | 0.53 | % | | | 0.48 | % | | | 0.50 | % |
| |
| Portfolio turnover rate | | | 54 | % | | | 31 | % | | | 28 | % | | | 18 | % | | | 40 | % |
| | |
| 1. | | Per share amounts calculated based on the average shares outstanding during the period. |
| |
| 2. | | Assumes an initial investment on the business day before the first day of the fiscal period, with all dividends and distributions reinvested in additional shares on the reinvestment date, and redemption at the net asset value calculated on the last business day of the fiscal period. Sales charges are not reflected in the total returns. Total returns are not annualized for periods less than one full year. Returns do not reflect the deduction of taxes that a shareholder would pay on fund distributions or the redemption of fund shares. |
| |
| 3. | | Annualized for periods less than one full year. |
| |
| 4. | | Includes the Fund’s share of the allocated expenses and/or net investment income from the Master Funds. |
| |
| 5. | | Total expenses including all underlying fund expenses were as follows: |
| | | | | |
|
| Year Ended January 31, 2011 | | | 1.27 | % |
| Year Ended January 31, 2010 | | | 1.30 | % |
| Year Ended January 31, 2009 | | | 1.15 | % |
| Year Ended January 31, 2008 | | | 1.11 | % |
| Year Ended January 31, 2007 | | | 1.16 | % |
See accompanying Notes to Financial Statements.
31 | ACTIVE ALLOCATION FUND
FINANCIAL HIGHLIGHTS Continued
Class B
| | | | | | | | | | | | | | | | | | | | | |
| Year Ended January 31, | | 2011 | | | 2010 | | | 2009 | | | 2008 | | | 2007 | |
| |
Per Share Operating Data | | | | | | | | | | | | | | | | | | | | |
| Net asset value, beginning of period | | $ | 8.05 | | | $ | 6.17 | | | $ | 11.20 | | | $ | 11.97 | | | $ | 11.07 | |
| |
| Income (loss) from investment operations: | | | | | | | | | | | | | | | | | | | | |
Net investment income (loss)1 | | | .07 | | | | (.01 | ) | | | .01 | | | | .33 | | | | .26 | |
| Net realized and unrealized gain (loss) | | | 1.38 | | | | 1.91 | | | | (4.68 | ) | | | (.59 | ) | | | .86 | |
| | | |
| Total from investment operations | | | 1.45 | | | | 1.90 | | | | (4.67 | ) | | | (.26 | ) | | | 1.12 | |
| |
| Dividends and/or distributions to shareholders: | | | | | | | | | | | | | | | | | | | | |
| Dividends from net investment income | | | (.01 | ) | | | (.02 | ) | | | — | | | | (.34 | ) | | | (.17 | ) |
| Distributions from net realized gain | | | — | | | | — | | | | (.36 | ) | | | (.17 | ) | | | (.05 | ) |
| | | |
| Total dividends and/or distributions to shareholders | | | (.01 | ) | | | (.02 | ) | | | (.36 | ) | | | (.51 | ) | | | (.22 | ) |
| |
| Net asset value, end of period | | $ | 9.49 | | | $ | 8.05 | | | $ | 6.17 | | | $ | 11.20 | | | $ | 11.97 | |
| | | |
| | | | | | | | | | | | | | | | | | | | | |
Total Return, at Net Asset Value2 | | | 18.03 | % | | | 30.85 | % | | | (41.90 | )% | | | (2.40 | )% | | | 10.15 | % |
| | | | | | | | | | | | | | | | | | | | | |
Ratios/Supplemental Data | | | | | | | | | | | | | | | | | | | | |
| Net assets, end of period (in thousands) | | $ | 343,069 | | | $ | 312,190 | | | $ | 258,625 | | | $ | 449,130 | | | $ | 349,024 | |
| |
| Average net assets (in thousands) | | $ | 322,814 | | | $ | 291,118 | | | $ | 389,957 | | | $ | 433,217 | | | $ | 229,365 | |
| |
Ratios to average net assets:3 | | | | | | | | | | | | | | | | | | | | |
| Net investment income (loss) | | | 0.84 | %4 | | | (0.18 | )% | | | 0.15 | % | | | 2.64 | % | | | 2.26 | % |
Total expenses5 | | | 1.43 | %4 | | | 1.49 | % | | | 1.35 | % | | | 1.27 | % | | | 1.29 | % |
| Expenses after payments, waivers and/or reimbursements and reduction to custodian expenses | | | 1.43 | %4 | | | 1.48 | % | | | 1.35 | % | | | 1.27 | % | | | 1.29 | % |
| |
| Portfolio turnover rate | | | 54 | % | | | 31 | % | | | 28 | % | | | 18 | % | | | 40 | % |
| | |
| 1. | | Per share amounts calculated based on the average shares outstanding during the period. |
| |
| 2. | | Assumes an initial investment on the business day before the first day of the fiscal period, with all dividends and distributions reinvested in additional shares on the reinvestment date, and redemption at the net asset value calculated on the last business day of the fiscal period. Sales charges are not reflected in the total returns. Total returns are not annualized for periods less than one full year. Returns do not reflect the deduction of taxes that a shareholder would pay on fund distributions or the redemption of fund shares. |
| |
| 3. | | Annualized for periods less than one full year. |
| |
| 4. | | Includes the Fund’s share of the allocated expenses and/or net investment income from the Master Funds. |
| |
| 5. | | Total expenses including all underlying fund expenses were as follows: |
| | | | | |
|
| Year Ended January 31, 2011 | | | 2.13 | % |
| Year Ended January 31, 2010 | | | 2.18 | % |
| Year Ended January 31, 2009 | | | 1.97 | % |
| Year Ended January 31, 2008 | | | 1.90 | % |
| Year Ended January 31, 2007 | | | 1.94 | % |
See accompanying Notes to Financial Statements.
32 | ACTIVE ALLOCATION FUND
Class C
| | | | | | | | | | | | | | | | | | | | | |
| Year Ended January 31, | | 2011 | | | 2010 | | | 2009 | | | 2008 | | | 2007 | |
| |
Per Share Operating Data | | | | | | | | | | | | | | | | | | | | |
| Net asset value, beginning of period | | $ | 8.04 | | | $ | 6.17 | | | $ | 11.18 | | | $ | 11.96 | | | $ | 11.06 | |
| |
| Income (loss) from investment operations: | | | | | | | | | | | | | | | | | | | | |
Net investment income (loss)1 | | | .08 | | | | (.01 | ) | | | .02 | | | | .34 | | | | .27 | |
| Net realized and unrealized gain (loss) | | | 1.38 | | | | 1.91 | | | | (4.67 | ) | | | (.60 | ) | | | .86 | |
| | | |
| Total from investment operations | | | 1.46 | | | | 1.90 | | | | (4.65 | ) | | | (.26 | ) | | | 1.13 | |
| |
| Dividends and/or distributions to shareholders: | | | | | | | | | | | | | | | | | | | | |
| Dividends from net investment income | | | (.02 | ) | | | (.03 | ) | | | — | | | | (.35 | ) | | | (.18 | ) |
| Distributions from net realized gain | | | — | | | | — | | | | (.36 | ) | | | (.17 | ) | | | (.05 | ) |
| | | |
| Total dividends and/or distributions to shareholders | | | (.02 | ) | | | (.03 | ) | | | (.36 | ) | | | (.52 | ) | | | (.23 | ) |
| |
| Net asset value, end of period | | $ | 9.48 | | | $ | 8.04 | | | $ | 6.17 | | | $ | 11.18 | | | $ | 11.96 | |
| | | |
| | | | | | | | | | | | | | | | | | | | | |
Total Return, at Net Asset Value2 | | | 18.17 | % | | | 30.80 | % | | | (41.79 | )% | | | (2.41 | )% | | | 10.21 | % |
| | | | | | | | | | | | | | | | | | | | | |
Ratios/Supplemental Data | | | | | | | | | | | | | | | | | | | | |
| Net assets, end of period (in thousands) | | $ | 492,493 | | | $ | 442,036 | | | $ | 369,953 | | | $ | 630,990 | | | $ | 433,213 | |
| |
| Average net assets (in thousands) | | $ | 461,832 | | | $ | 413,626 | | | $ | 560,138 | | | $ | 577,347 | | | $ | 272,038 | |
| |
Ratios to average net assets:3 | | | | | | | | | | | | | | | | | | | | |
| Net investment income (loss) | | | 0.94 | %4 | | | (0.07 | )% | | | 0.20 | % | | | 2.77 | % | | | 2.34 | % |
Total expenses5 | | | 1.32 | %4 | | | 1.38 | % | | | 1.30 | % | | | 1.24 | % | | | 1.27 | % |
| Expenses after payments, waivers and/or reimbursements and reduction to custodian expenses | | | 1.32 | %4 | | | 1.37 | % | | | 1.30 | % | | | 1.24 | % | | | 1.26 | % |
| |
| Portfolio turnover rate | | | 54 | % | | | 31 | % | | | 28 | % | | | 18 | % | | | 40 | % |
| | |
| 1. | | Per share amounts calculated based on the average shares outstanding during the period. |
| |
| 2. | | Assumes an initial investment on the business day before the first day of the fiscal period, with all dividends and distributions reinvested in additional shares on the reinvestment date, and redemption at the net asset value calculated on the last business day of the fiscal period. Sales charges are not reflected in the total returns. Total returns are not annualized for periods less than one full year. Returns do not reflect the deduction of taxes that a shareholder would pay on fund distributions or the redemption of fund shares. |
| |
| 3. | | Annualized for periods less than one full year. |
| |
| 4. | | Includes the Fund’s share of the allocated expenses and/or net investment income from the Master Funds. |
| |
| 5. | | Total expenses including all underlying fund expenses were as follows: |
| | | | | |
|
| Year Ended January 31, 2011 | | | 2.02 | % |
| Year Ended January 31, 2010 | | | 2.07 | % |
| Year Ended January 31, 2009 | | | 1.92 | % |
| Year Ended January 31, 2008 | | | 1.87 | % |
| Year Ended January 31, 2007 | | | 1.92 | % |
See accompanying Notes to Financial Statements.
33 | ACTIVE ALLOCATION FUND
FINANCIAL HIGHLIGHTS Continued
Class N
| | | | | | | | | | | | | | | | | | | | | |
| Year Ended January 31, | | 2011 | | | 2010 | | | 2009 | | | 2008 | | | 2007 | |
| |
Per Share Operating Data | | | | | | | | | | | | | | | | | | | | |
| Net asset value, beginning of period | | $ | 8.14 | | | $ | 6.24 | | | $ | 11.24 | | | $ | 12.02 | | | $ | 11.09 | |
| |
| Income (loss) from investment operations: | | | | | | | | | | | | | | | | | | | | |
Net investment income1 | | | .13 | | | | .02 | | | | .08 | | | | .41 | | | | .35 | |
| Net realized and unrealized gain (loss) | | | 1.41 | | | | 1.96 | | | | (4.72 | ) | | | (.61 | ) | | | .86 | |
| | | |
| Total from investment operations | | | 1.54 | | | | 1.98 | | | | (4.64 | ) | | | (.20 | ) | | | 1.21 | |
| |
| Dividends and/or distributions to shareholders: | | | | | | | | | | | | | | | | | | | | |
| Dividends from net investment income | | | (.07 | ) | | | (.08 | ) | | | — | | | | (.41 | ) | | | (.23 | ) |
| Distributions from net realized gain | | | — | | | | — | | | | (.36 | ) | | | (.17 | ) | | | (.05 | ) |
| | | |
| Total dividends and/or distributions to shareholders | | | (.07 | ) | | | (.08 | ) | | | (.36 | ) | | | (.58 | ) | | | (.28 | ) |
| |
| Net asset value, end of period | | $ | 9.61 | | | $ | 8.14 | | | $ | 6.24 | | | $ | 11.24 | | | $ | 12.02 | |
| | | |
| | | | | | | | | | | | | | | | | | | | | |
Total Return, at Net Asset Value2 | | | 18.92 | % | | | 31.62 | % | | | (41.47 | )% | | | (1.95 | )% | | | 10.88 | % |
| | | | | | | | | | | | | | | | | | | | | |
Ratios/Supplemental Data | | | | | | | | | | | | | | | | | | | | |
| Net assets, end of period (in thousands) | | $ | 148,609 | | | $ | 134,276 | | | $ | 104,818 | | | $ | 161,530 | | | $ | 109,146 | |
| |
| Average net assets (in thousands) | | $ | 141,119 | | | $ | 123,718 | | | $ | 149,553 | | | $ | 145,988 | | | $ | 62,929 | |
| |
Ratios to average net assets:3 | | | | | | | | | | | | | | | | | | | | |
| Net investment income | | | 1.51 | %4 | | | 0.27 | % | | | 0.82 | % | | | 3.31 | % | | | 3.07 | % |
Total expenses5 | | | 0.76 | %4 | | | 0.79 | % | | | 0.74 | % | | | 0.70 | % | | | 0.70 | % |
| Expenses after payments, waivers and/or reimbursements and reduction to custodian expenses | | | 0.76 | %4 | | | 0.78 | % | | | 0.74 | % | | | 0.69 | % | | | 0.70 | % |
| |
| Portfolio turnover rate | | | 54 | % | | | 31 | % | | | 28 | % | | | 18 | % | | | 40 | % |
| | |
| 1. | | Per share amounts calculated based on the average shares outstanding during the period. |
| |
| 2. | | Assumes an initial investment on the business day before the first day of the fiscal period, with all dividends and distributions reinvested in additional shares on the reinvestment date, and redemption at the net asset value calculated on the last business day of the fiscal period. Sales charges are not reflected in the total returns. Total returns are not annualized for periods less than one full year. Returns do not reflect the deduction of taxes that a shareholder would pay on fund distributions or the redemption of fund shares. |
| |
| 3. | | Annualized for periods less than one full year. |
| |
| 4. | | Includes the Fund’s share of the allocated expenses and/or net investment income from the Master Funds. |
| |
| 5. | | Total expenses including all underlying fund expenses were as follows: |
| | | | | |
|
| Year Ended January 31, 2011 | | | 1.46 | % |
| Year Ended January 31, 2010 | | | 1.48 | % |
| Year Ended January 31, 2009 | | | 1.36 | % |
| Year Ended January 31, 2008 | | | 1.33 | % |
| Year Ended January 31, 2007 | | | 1.35 | % |
See accompanying Notes to Financial Statements.
34 | ACTIVE ALLOCATION FUND
Class Y
| | | | | | | | | | | | | | | | | | | | | |
| Year Ended January 31, | | 2011 | | | 2010 | | | 2009 | | | 2008 | | | 2007 | |
| |
Per Share Operating Data | | | | | | | | | | | | | | | | | | | | |
| Net asset value, beginning of period | | $ | 8.27 | | | $ | 6.33 | | | $ | 11.33 | | | $ | 12.10 | | | $ | 11.13 | |
| |
| Income (loss) from investment operations: | | | | | | | | | | | | | | | | | | | | |
Net investment income1 | | | .20 | | | | .06 | | | | .15 | | | | .50 | | | | .44 | |
| Net realized and unrealized gain (loss) | | | 1.41 | | | | 2.00 | | | | (4.79 | ) | | | (.63 | ) | | | .85 | |
| | | |
| Total from investment operations | | | 1.61 | | | | 2.06 | | | | (4.64 | ) | | | (.13 | ) | | | 1.29 | |
| |
| Dividends and/or distributions to shareholders: | | | | | | | | | | | | | | | | | | | | |
| Dividends from net investment income | | | (.12 | ) | | | (.12 | ) | | | — | | | | (.47 | ) | | | (.27 | ) |
| Distributions from net realized gain | | | — | | | | — | | | | (.36 | ) | | | (.17 | ) | | | (.05 | ) |
| | | |
| Total dividends and/or distributions to shareholders | | | (.12 | ) | | | (.12 | ) | | | (.36 | ) | | | (.64 | ) | | | (.32 | ) |
| |
| Net asset value, end of period | | $ | 9.76 | | | $ | 8.27 | | | $ | 6.33 | | | $ | 11.33 | | | $ | 12.10 | |
| | | |
| | | | | | | | | | | | | | | | | | | | | |
Total Return, at Net Asset Value2 | | | 19.51 | % | | | 32.47 | % | | | (41.15 | )% | | | (1.38 | )% | | | 11.56 | % |
| | | | | | | | | | | | | | | | | | | | | |
Ratios/Supplemental Data | | | | | | | | | | | | | | | | | | | | |
| Net assets, end of period (in thousands) | | $ | 12,123 | | | $ | 3,555 | | | $ | 2,706 | | | $ | 3,789 | | | $ | 2,783 | |
| |
| Average net assets (in thousands) | | $ | 8,568 | | | $ | 3,138 | | | $ | 3,724 | | | $ | 3,663 | | | $ | 1,317 | |
| |
Ratios to average net assets:3 | | | | | | | | | | | | | | | | | | | | |
| Net investment income | | | 2.26 | %4 | | | 0.77 | % | | | 1.56 | % | | | 3.98 | % | | | 3.79 | % |
Total expenses5 | | | 0.20 | %4 | | | 0.19 | % | | | 0.15 | % | | | 0.13 | % | | | 0.11 | % |
| Expenses after payments, waivers and/or reimbursements and reduction to custodian expenses | | | 0.20 | %4 | | | 0.18 | % | | | 0.15 | % | | | 0.13 | % | | | 0.11 | % |
| |
| Portfolio turnover rate | | | 54 | % | | | 31 | % | | | 28 | % | | | 18 | % | | | 40 | % |
| | |
| 1. | | Per share amounts calculated based on the average shares outstanding during the period. |
| |
| 2. | | Assumes an initial investment on the business day before the first day of the fiscal period, with all dividends and distributions reinvested in additional shares on the reinvestment date, and redemption at the net asset value calculated on the last business day of the fiscal period. Sales charges are not reflected in the total returns. Total returns are not annualized for periods less than one full year. Returns do not reflect the deduction of taxes that a shareholder would pay on fund distributions or the redemption of fund shares. |
| |
| 3. | | Annualized for periods less than one full year. |
| |
| 4. | | Includes the Fund’s share of the allocated expenses and/or net investment income from the Master Funds. |
| |
| 5. | | Total expenses including all underlying fund expenses were as follows: |
| | | | | |
|
| Year Ended January 31, 2011 | | | 0.90 | % |
| Year Ended January 31, 2010 | | | 0.88 | % |
| Year Ended January 31, 2009 | | | 0.77 | % |
| Year Ended January 31, 2008 | | | 0.76 | % |
| Year Ended January 31, 2007 | | | 0.76 | % |
See accompanying Notes to Financial Statements.
35 | ACTIVE ALLOCATION FUND
NOTES TO FINANCIAL STATEMENTS
1. Significant Accounting Policies
Oppenheimer Portfolio Series (the “Trust”) is registered under the Investment Company Act of 1940, as amended, as an open-end management investment company. Active Allocation Fund (the “Fund”) is a series of the Trust whose investment objective is to seek long-term growth of capital with a secondary objective of current income. The Fund normally invests in a diversified portfolio of Oppenheimer mutual funds (individually, an “Underlying Fund” and collectively, the “Underlying Funds”). The Fund’s investment adviser is OppenheimerFunds, Inc. (the “Manager”).
The Fund offers Class A, Class B, Class C, Class N and Class Y shares. Class A shares are sold at their offering price, which is normally net asset value plus a front-end sales charge. Class B, Class C and Class N shares are sold without a front-end sales charge but may be subject to a contingent deferred sales charge (“CDSC”). Class N shares are sold only through retirement plans. Retirement plans that offer Class N shares may impose charges on those accounts. Class Y shares are sold to certain institutional investors or intermediaries without either a front-end sales charge or a CDSC, however, the intermediaries may impose charges on their accountholders who beneficially own Y shares. All classes of shares have identical rights and voting privileges with respect to the Fund in general and exclusive voting rights on matters that affect that class alone. Earnings, net assets and net asset value per share may differ due to each class having its own expenses, such as transfer and shareholder servicing agent fees and shareholder communications, directly attributable to that class. Class A, B, C and N have separate distribution and/or service plans under which they pay fees. Class Y shares do not pay such fees. Class B shares will automatically convert to Class A shares 72 months after the date of purchase.
The following is a summary of significant accounting policies consistently followed by the Fund.
Securities Valuation. The Fund calculates the net asset value of its shares based upon the net asset value of the applicable Underlying Fund. For each Underlying Fund, the net asset value per share for a class of shares is determined as of the close of the New York Stock Exchange (the “Exchange”), normally 4:00 P.M. Eastern time, on each day the Exchange is open for trading by dividing the value of the Underlying Fund’s net assets attributable to that class by the number of outstanding shares of that class on that day.
To determine their net asset values, the Underlying Funds’ assets are valued primarily on the basis of current market quotations. In the absence of a readily available unadjusted quoted market price, including for assets whose values have been materially affected by what the Manager identifies as a significant event occurring before the Underlying Fund’s assets are valued but after the close of their respective exchanges, the Manager, acting through its internal valuation committee, in good faith determines the fair valuation of that Underlying Fund’s assets using consistently applied procedures under the supervision of the Board of Trustees. The methodologies used for valuing assets are not necessarily an indication of the risks associated with investing in those Underlying Funds.
Each investment asset or liability of the Fund is assigned a level at measurement date based on the significance and source of the inputs to its valuation. Unadjusted quoted
36 | ACTIVE ALLOCATION FUND
prices in active markets for identical assets or liabilities are classified as “Level 1,” inputs other than unadjusted quoted prices for an asset that are observable are classified as “Level 2” and significant unobservable inputs, including the Manager’s judgment about the assumptions that a market participant would use in pricing an asset or liability, are classified as “Level 3.” The inputs used for valuing assets and liabilities are not necessarily an indication of the risks associated with investing in those assets or liabilities. A table summarizing the Fund’s investments under these levels of classification is included following the Statement of Investments.
The Fund classifies each of its investments in the Underlying Funds as Level 1, without consideration as to the classification level of the specific investments held by the Underlying Funds.
There have been no significant changes to the fair valuation methodologies of the Fund during the period.
Risks of Investing in the Underlying Funds. Each of the Underlying Funds in which the Fund invests has its own investment risks, and those risks can affect the value of the Fund’s investments and therefore the value of the Fund’s shares. To the extent that the Fund invests more of its assets in one Underlying Fund than in another, the Fund will have greater exposure to the risks of that Underlying Fund.
Investment in Oppenheimer Institutional Money Market Fund. The Fund is permitted to invest daily available cash balances in an affiliated money market fund. The Fund may invest the available cash in Class E shares of Oppenheimer Institutional Money Market Fund (“IMMF”) to seek current income while preserving liquidity. IMMF is a registered open-end management investment company, regulated as a money market fund under the Investment Company Act of 1940, as amended. The Manager is also the investment adviser of IMMF. When applicable, the Fund’s investment in IMMF is included in the Statement of Investments. As a shareholder, the Fund is subject to its proportional share of IMMF’s Class E expenses, including its management fee.
Investment in Oppenheimer Master Funds. The Fund is permitted to invest in entities sponsored and/or advised by the Manager or an affiliate. Certain of these entities in which the Fund invests are mutual funds registered under the Investment Company Act of 1940 that expect to be treated as partnerships for tax purposes, specifically Oppenheimer Master Loan Fund, LLC and Oppenheimer Master Inflation Protected Securities Fund, LLC (the “Master Funds”). Each Master Fund has its own investment risks, and those risks can affect the value of the Fund’s investments and therefore the value of the Fund’s shares. To the extent that the Fund invests more of its assets in one Master Fund than in another, the Fund will have greater exposure to the risks of that Master Fund.
The investment objective of Oppenheimer Master Loan Fund, LLC is to seek as high a level of current income and preservation of capital as is consistent with investing primarily in loans and other debt securities. The investment objective of Oppenheimer Master Inflation Protected Securities Fund, LLC is to seek total return. The Fund’s investments in the Master Funds are included in the Statement of Investments. The Fund recognizes income and gain/(loss) on its investments in each Master Fund according to its allocated
37 | ACTIVE ALLOCATION FUND
NOTES TO FINANCIAL STATEMENTS Continued
1. Significant Accounting Policies Continued
pro-rata share, based on its relative proportion of total outstanding Master Fund shares held, of the total net income earned and the net gain/(loss) realized on investments sold by the Master Funds. As a shareholder, the Fund is subject to its proportional share of the Master Funds’ expenses, including their management fee. The Manager will waive fees and/or reimburse Fund expenses in an amount equal to the indirect management fees incurred through the Fund’s investment in the Master Funds.
Foreign Currency Translation. The Fund’s accounting records are maintained in U.S. dollars. The values of securities denominated in foreign currencies and amounts related to the purchase and sale of foreign securities and foreign investment income are translated into U.S. dollars as of the close of the Exchange, normally 4:00 P.M. Eastern time, on each day the Exchange is open for trading. Foreign exchange rates may be valued primarily using a reliable bank, dealer or service authorized by the Board of Trustees.
Reported net realized gains and losses from foreign currency transactions arise from sales of portfolio securities, sales and maturities of short-term securities, sales of foreign currencies, exchange rate fluctuations between the trade and settlement dates on securities transactions, and the difference between the amounts of dividends, interest, and foreign withholding taxes recorded on the Fund’s books and the U.S. dollar equivalent of the amounts actually received or paid. Net unrealized appreciation and depreciation on the translation of assets and liabilities denominated in foreign currencies arise from changes in the values of assets and liabilities, including investments in securities at fiscal period end, resulting from changes in exchange rates.
The effect of changes in foreign currency exchange rates on investments is separately identified from the fluctuations arising from changes in market values of securities held and reported with all other foreign currency gains and losses in the Fund’s Statement of Operations.
Allocation of Income, Expenses, Gains and Losses. Income, expenses (other than those attributable to a specific class), gains and losses are allocated on a daily basis to each class of shares based upon the relative proportion of net assets represented by such class. Operating expenses directly attributable to a specific class are charged against the operations of that class.
Federal Taxes. The Fund intends to comply with provisions of the Internal Revenue Code applicable to regulated investment companies and to distribute substantially all of its investment company taxable income, including any net realized gain on investments not offset by capital loss carryforwards, if any, to shareholders. Therefore, no federal income or excise tax provision is required. The Fund files income tax returns in U.S. federal and applicable state jurisdictions. The statute of limitations on the Fund’s tax return filings generally remain open for the three preceding fiscal reporting period ends.
The tax components of capital shown in the following table represent distribution requirements the Fund must satisfy under the income tax regulations, losses the Fund may be able
38 | ACTIVE ALLOCATION FUND
to offset against income and gains realized in future years and unrealized appreciation or depreciation of securities and other investments for federal income tax purposes.
| | | | | | | | | | | | | |
| | | | | | | | | | | Net Unrealized | |
| | | | | | | | | | | Appreciation | |
| | | | | | | | | | | Based on Cost | |
| | | | | | | | | | | of Securities and | |
| Undistributed | | Undistributed | | | | | | | Other Investments | |
| Net Investment | | Long-Term | | | Accumulated Loss | | | for Federal Income | |
| Income | | Gain | | | Carryforward1,2,3 | | | Tax Purposes | |
| $36,851,192 | | $ | — | | | $ | 696,388,800 | | | $ | 141,315,939 | |
| | |
| 1. | | As of January 31, 2011, the Fund had $696,388,800 of net capital loss carryforwards available to offset future realized capital gains, if any, and thereby reduce future taxable gain distributions. As of January 31, 2011, details of the capital loss carryforwards were as follows: |
| | | | | |
| Expiring | |
| 2017 | | $ | 68,767,077 | |
| 2018 | | | 406,518,784 | |
| 2019 | | | 221,102,939 | |
| | | | |
| Total | | $ | 696,388,800 | |
| | | | |
| | |
| 2. | | During the fiscal year ended January 31, 2011, the Fund did not utilize any capital loss carryforward. |
| |
| 3. | | During the fiscal year ended January 31, 2010, the Fund did not utilize any capital loss carryforward. |
Net investment income (loss) and net realized gain (loss) may differ for financial statement and tax purposes. The character of dividends and distributions made during the fiscal year from net investment income or net realized gains may differ from their ultimate characterization for federal income tax purposes. Also, due to timing of dividends and distributions, the fiscal year in which amounts are distributed may differ from the fiscal year in which the income or net realized gain was recorded by the Fund.
Accordingly, the following amounts have been reclassified for January 31, 2011. Net assets of the Fund were unaffected by the reclassifications.
| | | | | |
| Increase | | Increase | |
| to Accumulated | | to Accumulated | |
| Net Investment | | Net Realized | |
| Income | | Loss on Investments | |
| $7,786,868 | | $ | 7,786,868 | |
The tax character of distributions paid during the years ended January 31, 2011 and January 31, 2010 was as follows:
| | | | | | | | | |
| | | Year Ended | | | Year Ended | |
| | | January 31, 2011 | | | January 31, 2010 | |
| Distributions paid from: | | | | | | | | |
| Ordinary income | | $ | 13,399,526 | | | $ | 15,342,350 | |
The aggregate cost of securities and other investments and the composition of unrealized appreciation and depreciation of securities and other investments for federal income tax purposes as of January 31, 2011 are noted in the following table. The primary difference between book and tax appreciation or depreciation of securities and other investments,
39 | ACTIVE ALLOCATION FUND
NOTES TO FINANCIAL STATEMENTS Continued
1. Significant Accounting Policies Continued
if applicable, is attributable to the tax deferral of losses or tax realization of financial statement unrealized gain or loss.
| | | | | |
|
| Federal tax cost of securities | | $ | 2,059,332,479 | |
| Federal tax cost of other investments | | | 1,231,054 | |
| | | | |
| Total federal tax cost | | $ | 2,060,563,533 | |
| | | | |
| | | | | |
| Gross unrealized appreciation | | $ | 173,582,310 | |
| Gross unrealized depreciation | | | (32,266,371 | ) |
| | | | |
| Net unrealized appreciation | | $ | 141,315,939 | |
| | | | |
Trustees’ Compensation. The Fund has adopted an unfunded retirement plan (the “Plan”) for the Fund’s independent trustees. Benefits are based on years of service and fees paid to each trustee during their period of service. The Plan was frozen with respect to adding new participants effective December 31, 2006 (the “Freeze Date”) and existing Plan Participants as of the Freeze Date will continue to receive accrued benefits under the Plan. Active independent trustees as of the Freeze Date have each elected a distribution method with respect to their benefits under the Plan. During the year ended January 31, 2011, the Fund’s projected benefit obligations, payments to retired trustees and accumulated liability were as follows:
| | | | | |
|
| Projected Benefit Obligations Increased | | $ | 604 | |
| Payments Made to Retired Trustees | | | 14,035 | |
| Accumulated Liability as of January 31, 2011 | | | 105,215 | |
The Board of Trustees has adopted a compensation deferral plan for independent trustees that enables trustees to elect to defer receipt of all or a portion of the annual compensation they are entitled to receive from the Fund. For purposes of determining the amount owed to the Trustee under the plan, deferred amounts are treated as though equal dollar amounts had been invested in shares of the Fund or in other Oppenheimer funds selected by the Trustee. The Fund purchases shares of the funds selected for deferral by the Trustee in amounts equal to his or her deemed investment, resulting in a Fund asset equal to the deferred compensation liability. Such assets are included as a component of “Other” within the asset section of the Statement of Assets and Liabilities. Deferral of trustees’ fees under the plan will not affect the net assets of the Fund, and will not materially affect the Fund’s assets, liabilities or net investment income per share. Amounts will be deferred until distributed in accordance with the compensation deferral plan.
Dividends and Distributions to Shareholders. Dividends and distributions to shareholders, which are determined in accordance with income tax regulations and may differ from U.S. generally accepted accounting principles, are recorded on the ex-dividend date. Income and capital gain distributions, if any, are declared and paid annually or at other times as deemed necessary by the Manager.
Investment Income. Dividend distributions received from the Underlying Funds are recorded on the ex-dividend date. Upon receipt of notification from an Underlying
40 | ACTIVE ALLOCATION FUND
Fund, and subsequent to the ex-dividend date, some of the dividend income originally recorded by the Fund may be reclassified as a tax return of capital by reducing the cost basis of the Underlying Fund and/or increasing the realized gain on sales of investments in the Underlying Fund.
Custodian Fees. “Custodian fees and expenses” in the Statement of Operations may include interest expense incurred by the Fund on any cash overdrafts of its custodian account during the period. Such cash overdrafts may result from the effects of failed trades in portfolio securities and from cash outflows resulting from unanticipated shareholder redemption activity. The Fund pays interest to its custodian on such cash overdraft at a rate equal to the 1 Month LIBOR Rate plus 2.00%. The “Reduction to custodian expenses” line item, if applicable, represents earnings on cash balances maintained by the Fund during the period. Such interest expense and other custodian fees may be paid with these earnings.
Security Transactions. Security transactions are recorded on the trade date. Realized gains and losses on securities sold are determined on the basis of identified cost.
Indemnifications. The Fund’s organizational documents provide current and former trustees and officers with a limited indemnification against liabilities arising in connection with the performance of their duties to the Fund. In the normal course of business, the Fund may also enter into contracts that provide general indemnifications. The Fund’s maximum exposure under these arrangements is unknown as this would be dependent on future claims that may be made against the Fund. The risk of material loss from such claims is considered remote.
Other. The preparation of financial statements in conformity with accounting principles generally accepted in the United States of America requires management to make estimates and assumptions that affect the reported amounts of assets and liabilities and disclosure of contingent assets and liabilities at the date of the financial statements and the reported amounts of increases and decreases in net assets from operations during the reporting period. Actual results could differ from those estimates.
2. Shares of Beneficial Interest
The Fund has authorized an unlimited number of $0.001 par value shares of beneficial interest of each class. Transactions in shares of beneficial interest were as follows:
| | | | | | | | | | | | | | | | | |
| | | Year Ended January 31, 2011 | | | Year Ended January 31, 2010 | |
| | | Shares | | | Amount | | | Shares | | | Amount | |
| |
Class A | | | | | | | | | | | | | | | | |
| Sold | | | 20,680,372 | | | $ | 182,346,554 | | | | 25,261,114 | | | $ | 184,233,892 | |
| Dividends and/or distributions reinvested | | | 1,086,399 | | | | 10,418,802 | | | | 1,308,892 | | | | 11,045,567 | |
| Redeemed | | | (28,094,311 | ) | | | (246,904,124 | ) | | | (34,221,296 | ) | | | (245,009,065 | ) |
| | | |
| Net decrease | | | (6,327,540 | ) | | $ | (54,138,768 | ) | | | (7,651,290 | ) | | $ | (49,729,606 | ) |
| | | |
41 | ACTIVE ALLOCATION FUND
NOTES TO FINANCIAL STATEMENTS Continued
2. Shares of Beneficial Interest Continued
| | | | | | | | | | | | | | | | | |
| | | Year Ended January 31, 2011 | | | Year Ended January 31, 2010 | |
| | | Shares | | | Amount | | | Shares | | | Amount | |
| |
Class B | | | | | | | | | | | | | | | | |
| Sold | | | 5,105,731 | | | $ | 44,161,730 | | | | 6,992,966 | | | $ | 49,591,508 | |
| Dividends and/or distributions reinvested | | | 43,802 | | | | 413,065 | | | | 110,355 | | | | 917,294 | |
| Redeemed | | | (7,780,657 | ) | | | (67,005,483 | ) | | | (10,201,129 | ) | | | (71,883,958 | ) |
| | | |
| Net decrease | | | (2,631,124 | ) | | $ | (22,430,688 | ) | | | (3,097,808 | ) | | $ | (21,375,156 | ) |
| | | |
| | | | | | | | | | | | | | | | | |
| |
Class C | | | | | | | | | | | | | | | | |
| Sold | | | 9,322,497 | | | $ | 80,903,331 | | | | 12,093,003 | | | $ | 86,048,789 | |
| Dividends and/or distributions reinvested | | | 109,914 | | | | 1,035,387 | | | | 200,618 | | | | 1,663,225 | |
| Redeemed | | | (12,453,633 | ) | | | (107,449,061 | ) | | | (17,300,364 | ) | | | (121,951,725 | ) |
| | | |
| Net decrease | | | (3,021,222 | ) | | $ | (25,510,343 | ) | | | (5,006,743 | ) | | $ | (34,239,711 | ) |
| | | |
| | | | | | | | | | | | | | | | | |
| |
Class N | | | | | | | | | | | | | | | | |
| Sold | | | 3,257,951 | | | $ | 28,590,286 | | | | 4,699,462 | | | $ | 33,440,354 | |
| Dividends and/or distributions reinvested | | | 103,367 | | | | 985,944 | | | | 136,466 | | | | 1,146,314 | |
| Redeemed | | | (4,380,319 | ) | | | (38,551,798 | ) | | | (5,138,933 | ) | | | (37,228,008 | ) |
| | | |
| Net decrease | | | (1,019,001 | ) | | $ | (8,975,568 | ) | | | (303,005 | ) | | $ | (2,641,340 | ) |
| | | |
| | | | | | | | | | | | | | | | | |
| |
Class Y | | | | | | | | | | | | | | | | |
| Sold | | | 1,062,280 | | | $ | 9,172,315 | | | | 193,982 | | | $ | 1,467,954 | |
| Dividends and/or distributions reinvested | | | 15,312 | | | | 148,375 | | | | 5,493 | | | | 46,800 | |
| Redeemed | | | (265,547 | ) | | | (2,353,891 | ) | | | (197,063 | ) | | | (1,451,346 | ) |
| | | |
| Net increase | | | 812,045 | | | $ | 6,966,799 | | | | 2,412 | | | $ | 63,408 | |
| | | |
3. Purchases and Sales of Securities
The aggregate cost of purchases and proceeds from sales of securities, other than short-term obligations and investments in IMMF, for the year ended January 31, 2011, were as follows:
| | | | | | | | | |
| | | Purchases | | | Sales | |
| |
| Investment securities | | $ | 1,069,874,547 | | | $ | 1,225,527,559 | |
4. Fees and Other Transactions with Affiliates
Management Fees. Under the investment advisory agreement, the Manager does not charge a management fee, but rather collects indirect management fees from the Fund’s investments in the Underlying Funds and in IMMF. The weighted indirect management fees collected from the Fund’s investment in the Underlying Funds and in IMMF, as a percent of average daily net assets of the Fund for the year ended January 31, 2011 was 0.57%. This amount is gross of any waivers or reimbursements of management fees
42 | ACTIVE ALLOCATION FUND
implemented at the Underlying Fund level. In addition, the Fund pays the Manager an asset allocation fee equal to an annual rate of 0.10% of the first $3 billion of the daily net assets of the Fund and 0.08% of the daily net assets in excess of $3 billion.
Administration Service Fees. The Fund pays the Manager a fee of $1,500 per year for preparing and filing the Fund’s tax returns.
Transfer Agent Fees. OppenheimerFunds Services (“OFS”), a division of the Manager, acts as the transfer and shareholder servicing agent for the Fund. The Fund pays OFS a per account fee. For the year ended January 31, 2011, the Fund paid $4,063,449 to OFS for services to the Fund.
Additionally, Class Y shares are subject to minimum fees of $10,000 annually for assets of $10 million or more. The Class Y shares are subject to the minimum fees in the event that the per account fee does not equal or exceed the applicable minimum fees. OFS may voluntarily waive the minimum fees.
Distribution and Service Plan (12b-1) Fees. Under its General Distributor’s Agreement with the Fund, OppenheimerFunds Distributor, Inc. (the “Distributor”) acts as the Fund’s principal underwriter in the continuous public offering of the Fund’s classes of shares.
Service Plan for Class A Shares. The Fund has adopted a Service Plan (the “Plan”) for Class A shares under Rule 12b-1 of the Investment Company Act of 1940. Under the Plan, the Fund reimburses the Distributor for a portion of its costs incurred for services provided to accounts that hold Class A shares. Reimbursement is made periodically at an annual rate of up to 0.25% of the daily net assets of Class A shares of the Fund. The Distributor currently uses all of those fees to pay dealers, brokers, banks and other financial institutions periodically for providing personal service and maintenance of accounts of their customers that hold Class A shares. Any unreimbursed expenses the Distributor incurs with respect to Class A shares in any fiscal year cannot be recovered in subsequent periods. Fees incurred by the Fund under the Plan are detailed in the Statement of Operations.
Distribution and Service Plans for Class B, Class C and Class N Shares. The Fund has adopted Distribution and Service Plans (the “Plans”) for Class B, Class C and Class N shares under Rule 12b-1 of the Investment Company Act of 1940 to compensate the Distributor for its services in connection with the distribution of those shares and servicing accounts. Under the Plans, the Fund pays the Distributor an annual asset-based sales charge of 0.75% on Class B and Class C shares daily net assets and 0.25% on Class N shares daily net assets. The Distributor also receives a service fee of 0.25% per year under each plan. If either the Class B, Class C or Class N plan is terminated by the Fund or by the shareholders of a class, the Board of Trustees and its independent trustees must determine whether the Distributor shall be entitled to payment from the Fund of all or a portion of the service fee and/or asset-based sales charge in respect to shares sold prior to the effective date of such termination. Fees incurred by the Fund under the Plans are detailed in the Statement of Operations. The Distributor determines its uncompensated
43 | ACTIVE ALLOCATION FUND
NOTES TO FINANCIAL STATEMENTS Continued
4. Fees and Other Transactions with Affiliates Continued
expenses under the Plans at calendar quarter ends. The Distributor’s aggregate uncompensated expenses under the Plans at December 31, 2010 were as follows:
| | | | | |
|
| Class B | | $ | 5,101,937 | |
| Class C | | | 6,248,311 | |
| Class N | | | 1,898,006 | |
Sales Charges. Front-end sales charges and contingent deferred sales charges (“CDSC”) do not represent expenses of the Fund. They are deducted from the proceeds of sales of Fund shares prior to investment or from redemption proceeds prior to remittance, as applicable. The sales charges retained by the Distributor from the sale of shares and the CDSC retained by the Distributor on the redemption of shares is shown in the following table for the period indicated.
| | | | | | | | | | | | | | | | | | | | | |
| | | | | | | Class A | | | Class B | | | Class C | | | Class N | |
| | | Class A | | | Contingent | | | Contingent | | | Contingent | | | Contingent | |
| | | Front-End | | | Deferred | | | Deferred | | | Deferred | | | Deferred | |
| | | Sales Charges | | | Sales Charges | | | Sales Charges | | | Sales Charges | | | Sales Charges | |
| | | Retained by | | | Retained by | | | Retained by | | | Retained by | | | Retained by | |
| Year Ended | | Distributor | | | Distributor | | | Distributor | | | Distributor | | | Distributor | |
| |
| January 31, 2011 | | $ | 1,179,670 | | | $ | 4,280 | | | $ | 697,923 | | | $ | 49,368 | | | $ | 7,552 | |
Waivers and Reimbursements of Expenses. The Manager has voluntarily agreed to waive fees and/or reimburse the Fund for certain expenses so that the “Total expenses,” (the combined direct (Fund level) and indirect (Underlying Fund level) expenses), as a percentage of daily net assets, will not exceed the annual rate of 1.45%, 2.20%, 2.20%, 1.70% and 1.20%, for Class A, Class B, Class C, Class N and Class Y, respectively. During the year ended January 31, 2011, the Manager waived fees and/or reimbursed the Fund $5,348 for Class B shares. The expense limitations do not include extraordinary expenses and other expenses not incurred in the ordinary course of the Fund’s business. This limitation will be applied after giving effect to any reimbursements by the Distributor of 12b-1 fees paid by the Fund with respect to investments in Class A shares of any Underlying Funds that do not offer Class Y shares. Notwithstanding the foregoing limits, the Manager is not required to waive or reimburse Fund expenses in excess of the amount of indirect management fees earned from investments in the Underlying Funds and IMMF.
The Distributor reimbursed Fund expenses in an amount equal to the distribution and service plan fees incurred through the Fund’s investment in the Class A shares of Oppenheimer Gold & Special Minerals Fund which, for the year ended January 31, 2011 was $12,393.
OFS has voluntarily agreed to limit transfer and shareholder servicing agent fees for all classes to 0.35% of average annual net assets per class.
Some of these undertakings may be modified or terminated at any time; some may not be modified or terminated until after one year from the date of the current prospectus, as indicated therein.
44 | ACTIVE ALLOCATION FUND
5. Risk Exposures and the Use of Derivative Instruments
The Fund’s investment objectives not only permit the Fund to purchase investment securities, they also allow the Fund to enter into various types of derivatives contracts, including, but not limited to, futures contracts, forward foreign currency exchange contracts, credit default swaps, interest rate swaps, total return swaps, and purchased and written options. In doing so, the Fund will employ strategies in differing combinations to permit it to increase, decrease, or change the level or types of exposure to market risk factors. Central to those strategies are features inherent to derivatives that make them more attractive for this purpose than equity and debt securities: they require little or no initial cash investment, they can focus exposure on only certain selected risk factors, and they may not require the ultimate receipt or delivery of the underlying security (or securities) to the contract. This may allow the Fund to pursue its objectives more quickly and efficiently than if it were to make direct purchases or sales of securities capable of effecting a similar response to market factors.
Market Risk Factors. In accordance with its investment objectives, the Fund may use derivatives to increase or decrease its exposure to one or more of the following market risk factors:
Commodity Risk. Commodity risk relates to the change in value of commodities or commodity indexes as they relate to increases or decreases in the commodities market. Commodities are physical assets that have tangible properties. Examples of these types of assets are crude oil, heating oil, metals, livestock, and agricultural products.
Credit Risk. Credit risk relates to the ability of the issuer to meet interest and principal payments, or both, as they come due. In general, lower-grade, higher-yield bonds are subject to credit risk to a greater extent than lower-yield, higher-quality bonds.
Equity Risk. Equity risk relates to the change in value of equity securities as they relate to increases or decreases in the general market.
Foreign Exchange Rate Risk. Foreign exchange rate risk relates to the change in the U.S. dollar value of a security held that is denominated in a foreign currency. The U.S. dollar value of a foreign currency denominated security will decrease as the dollar appreciates against the currency, while the U.S. dollar value will increase as the dollar depreciates against the currency.
Interest Rate Risk. Interest rate risk refers to the fluctuations in value of fixed-income securities resulting from the inverse relationship between price and yield. For example, an increase in general interest rates will tend to reduce the market value of already issued fixed-income investments, and a decline in general interest rates will tend to increase their value. In addition, debt securities with longer maturities, which tend to have higher yields, are subject to potentially greater fluctuations in value from changes in interest rates than obligations with shorter maturities.
Volatility Risk. Volatility risk refers to the magnitude of the movement, but not the direction of the movement, in a financial instrument’s price over a defined time period. Large increases or decreases in a financial instrument’s price over a relative
45 | ACTIVE ALLOCATION FUND
NOTES TO FINANCIAL STATEMENTS Continued
5. Risk Exposures and the Use of Derivative Instruments Continued
time period typically indicate greater volatility risk, while small increases or decreases in its price typically indicate lower volatility risk.
The Fund’s actual exposures to these market risk factors during the period are discussed in further detail, by derivative type, below.
Risks of Investing in Derivatives. The Fund’s use of derivatives can result in losses due to unanticipated changes in the market risk factors and the overall market. In instances where the Fund is using derivatives to decrease, or hedge, exposures to market risk factors for securities held by the Fund, there are also risks that those derivatives may not perform as expected resulting in losses for the combined or hedged positions.
Derivatives may have little or no initial cash investment relative to their market value exposure and therefore can produce significant gains or losses in excess of their cost. This use of embedded leverage allows the Fund to increase its market value exposure relative to its net assets and can substantially increase the volatility of the Fund’s performance.
Additional associated risks from investing in derivatives also exist and potentially could have significant effects on the valuation of the derivative and the Fund. Typically, the associated risks are not the risks that the Fund is attempting to increase or decrease exposure to, per its investment objectives, but are the additional risks from investing in derivatives. Examples of these associated risks are liquidity risk, which is the risk that the Fund will not be able to sell the derivative in the open market in a timely manner, and counterparty credit risk, which is the risk that the counterparty will not fulfill its obligation to the Fund. Associated risks can be different for each type of derivative and are discussed by each derivative type in the notes that follow.
Counterparty Credit Risk. Certain derivative positions are subject to counterparty credit risk, which is the risk that the counterparty will not fulfill its obligation to the Fund. The Fund’s derivative counterparties are financial institutions who are subject to market conditions that may weaken their financial position. The Fund intends to enter into financial transactions with counterparties that the Manager believes to be creditworthy at the time of the transaction. As of January 31, 2011, the maximum amount of loss that the Fund would incur if the counterparties to its derivative transactions failed to perform would be $1,732,484, which represents gross payments to be received by the Fund on these derivative contracts were they to be unwound as of period end. To reduce this risk the Fund has entered into master netting arrangements, established within the Fund’s International Swap and Derivatives Association, Inc. master agreements, which allow the Fund to net unrealized appreciation and depreciation for certain positions in swaps, over-the-counter options, swaptions, and forward currency exchange contracts for each individual counterparty. The amount of loss that the Fund would incur taking into account these master netting arrangements would be $1,128,379 as of January 31, 2011. In addition, the Fund may require that certain counterparties post cash and/or securities in collateral accounts to cover their net payment obligations for those derivative contracts subject to International Swap and Derivatives Association, Inc. master
46 | ACTIVE ALLOCATION FUND
agreements. If the counterparty fails to perform under these contracts and agreements, the cash and/or securities will be made available to the Fund.
As of January 31, 2011 the Fund has not required certain counterparties to post collateral.
Credit Related Contingent Features. The Fund’s agreements with derivative counterparties have several credit related contingent features that if triggered would allow its derivatives counterparties to close out and demand payment or additional collateral to cover their exposure from the Fund. Credit related contingent features are established between the Fund and its derivatives counterparties to reduce the risk that the Fund will not fulfill its payment obligations to its counterparties. These triggering features include, but are not limited to, a percentage decrease in the Fund’s net assets and or a percentage decrease in the Fund’s Net Asset Value or NAV. The contingent features are established within the Fund’s International Swap and Derivatives Association, Inc. master agreements which govern certain positions in swaps, over-the-counter options and swaptions, and forward currency exchange contracts for each individual counterparty. As of January 31, 2011, the aggregate fair value of derivative instruments with credit related contingent features in a net liability position was $1,037,139 for which the Fund has posted collateral of $319,963. If a contingent feature would have been triggered as of January 31, 2011, the Fund could have been required to pay this amount in cash to its counterparties. If the Fund fails to perform under these contracts and agreements, the cash and/or securities posted as collateral will be made available to the counterparty. Cash posted as collateral for these contracts, if any, is reported on the Statement of Assets and Liabilities; securities posted as collateral, if any, are reported on the Statement of Investments.
Valuations of derivative instruments as of January 31, 2011 are as follows:
| | | | | | | | | | | | | |
| | | Asset Derivatives | | | Liability Derivatives | |
| | | Statement of | | | | | | Statement of | | | |
| Derivatives Not | | Assets and | | | | | | Assets and | | | |
| Accounted for as | | Liabilities | | | | | | Liabilities | | | |
| Hedging Instruments | | Location | | Value | | | Location | | Value | |
| |
| Equity contracts | | Appreciated swaps, at value | | $ | 1,168,285 | | | Depreciated swaps, at value | | $ | 200,000 | |
| Interest rate contracts | | Appreciated swaps, at value | | | 151,263 | | | Depreciated swaps, at value | | | 56,276 | |
| Interest rate contracts | | Futures margins | | | 154,778 | * | | Futures margins | | | 176 | * |
| Foreign exchange contracts | | Unrealized appreciation on foreign currency exchange contracts | | | 412,936 | | | Unrealized depreciation on foreign currency exchange contracts | | | 423,086 | |
| | | | | | | | | | | |
| Total | | | | $ | 1,887,262 | | | | | $ | 679,538 | |
| | | | | | | | | | | |
| | |
| * | | Includes only the current day’s variation margin. Prior variation margin movements have been reflected in cash on the Statement of Assets and Liabilities upon receipt or payment. |
47 | ACTIVE ALLOCATION FUND
NOTES TO FINANCIAL STATEMENTS Continued
5. Risk Exposures and the Use of Derivative Instruments Continued
The effect of derivative instruments on the Statement of Operations is as follows:
| | | | | | | | | | | | | | | | | |
| Amount of Realized Gain or (Loss) Recognized on Derivatives | |
| Derivatives Not | | Closing and | | | Foreign | | | | | | | |
| Accounted for as | | expiration of | | | currency | | | Swap | | | | |
| Hedging Instruments | | futures contracts | | | transactions | | | contracts | | | Total | |
| |
| Credit contracts | | $ | — | | | $ | — | | | $ | 1,368,133 | | | $ | 1,368,133 | |
| Equity contracts | | | 1,195,510 | | | | — | | | | 3,271,823 | | | | 4,467,333 | |
| Foreign exchange contracts | | | — | | | | 1,922,982 | | | | — | | | | 1,922,982 | |
| Interest rate contracts | | | (1,069,431 | ) | | | — | | | | — | | | | (1,069,431 | ) |
| | | |
| Total | | $ | 126,079 | | | $ | 1,922,982 | | | $ | 4,639,956 | | | $ | 6,689,017 | |
| | | |
| | | | | | | | | | | | | | | | | |
| Amount of Change in Unrealized Gain or (Loss) Recognized on Derivatives | |
| | | | | | | Translation | | | | | | | |
| | | | | | | of assets | | | | | | | |
| | | | | | | and liabilities | | | | | | | |
| Derivatives Not | | | | | | denominated | | | | | | | |
| Accounted for as | | Futures | | | in foreign | | | Swap | | | | |
| Hedging Instruments | | contracts | | | currencies | | | contracts | | | Total | |
| |
| Credit contracts | | $ | — | | | $ | — | | | $ | 258,934 | | | $ | 258,934 | |
| Equity contracts | | | 933,680 | | | | — | | | | 1,307,803 | | | | 2,241,483 | |
| Foreign exchange contracts | | | — | | | | (10,150 | ) | | | — | | | | (10,150 | ) |
| Interest rate contracts | | | 174,502 | | | | — | | | | 94,987 | | | | 269,489 | |
| | | |
| Total | | $ | 1,108,182 | | | $ | (10,150 | ) | | $ | 1,661,724 | | | $ | 2,759,756 | |
| | | |
Foreign Currency Exchange Contracts
The Fund may enter into foreign currency exchange contracts (“forward contracts”) for the purchase or sale of a foreign currency at a negotiated rate at a future date.
Forward contracts are reported on a schedule following the Statement of Investments. Forward contracts will be valued daily based upon the closing prices of the forward currency rates determined at the close of the Exchange as provided by a bank, dealer or pricing service. The resulting unrealized appreciation (depreciation) is reported in the Statement of Assets and Liabilities as a receivable or payable and in the Statement of Operations within the change in unrealized appreciation (depreciation). At contract close, the difference between the original cost of the contract and the value at the close date is recorded as a realized gain (loss) in the Statement of Operations.
The Fund has purchased and sold certain forward foreign currency exchange contracts of different currencies in order to acquire currencies to pay for related foreign securities purchase transactions, or to convert foreign currencies to U.S. dollars from related foreign securities sale transactions. These foreign currency exchange contracts are negotiated at the current spot exchange rate with settlement typically within two business days thereafter.
The Fund has entered into forward foreign currency exchange contracts with the obligation to purchase specified foreign currencies in the future at a currently negotiated forward rate in order to take a positive investment perspective on the related currency. These forward foreign currency exchange contracts seek to increase exposure to foreign exchange rate risk.
48 | ACTIVE ALLOCATION FUND
The Fund has entered into forward foreign currency exchange contracts with the obligation to purchase specified foreign currencies in the future at a currently negotiated forward rate in order to decrease exposure to foreign exchange rate risk associated with foreign currency denominated securities held by the Fund.
The Fund has entered into forward foreign currency exchange contracts with the obligation to sell specified foreign currencies in the future at a currently negotiated forward rate in order to take a negative investment perspective on the related currency. These forward foreign currency exchange contracts seek to increase exposure to foreign exchange rate risk.
The Fund has entered into forward foreign currency exchange contracts with the obligation to sell specified foreign currencies in the future at a currently negotiated forward rate in order to decrease exposure to foreign exchange rate risk associated with foreign currency denominated securities held by the Fund.
During the year ended January 31, 2011, the Fund had average contract amounts on forward foreign currency contracts to buy and sell of $3,718,617 and $32,253,413, respectively.
Additional associated risk to the Fund includes counterparty credit risk. Counterparty credit risk arises from the possibility that the counterparty will default.
Futures Contracts
A futures contract is a commitment to buy or sell a specific amount of a financial instrument at a negotiated price on a stipulated future date. The Fund may buy and sell futures contracts and may also buy or write put or call options on these futures contracts.
Futures contracts traded on a commodities or futures exchange will be valued at the final settlement price or official closing price on the principal exchange as reported by such principal exchange at its trading session ending at, or most recently prior to, the time when the Fund’s assets are valued.
Upon entering into a futures contract, the Fund is required to deposit either cash or securities (initial margin) in an amount equal to a certain percentage of the contract value. Subsequent payments (variation margin) are made or received by the Fund each day. The variation margin payments are equal to the daily changes in the contract value and are recorded as unrealized gains and losses.
Futures contracts are reported on a schedule following the Statement of Investments. Securities held in collateralized accounts to cover initial margin requirements on open futures contracts are noted in the Statement of Investments. Cash held by the broker to cover initial margin requirements on open futures contracts and the receivable and/or payable for the daily mark to market for the variation margin are noted in the Statement of Assets and Liabilities. The net change in unrealized appreciation and depreciation is reported in the Statement of Operations. Realized gains (losses) are reported in the Statement of Operations at the closing or expiration of futures contracts.
The Fund has purchased futures contracts on various bonds and notes to increase exposure to interest rate risk.
The Fund has sold futures contracts on various bonds and notes to decrease exposure to interest rate risk.
49 | ACTIVE ALLOCATION FUND
NOTES TO FINANCIAL STATEMENTS Continued
5. Risk Exposures and the Use of Derivative Instruments Continued
The Fund has purchased futures contracts on various equity indexes to increase exposure to equity risk.
The Fund has sold futures contracts on various equity indexes to decrease exposure to equity risk.
During the year ended January 31, 2011, the Fund had an average market value of $14,712,148 and $27,036,939 on futures contracts purchased and sold, respectively.
Additional associated risks of entering into futures contracts (and related options) include the possibility that there may be an illiquid market where the Fund is unable to liquidate the contract or enter into an offsetting position and, if used for hedging purposes, the risk that the price of the contract will correlate imperfectly with the prices of the Fund’s securities.
Swap Contracts
The Fund may enter into swap contract agreements with a counterparty to exchange a series of cash flows based on either specified reference rates, or the occurrence of a credit event, over a specified period. Such contracts may include interest rate, equity, debt, index, total return, credit and currency swaps.
Swaps are marked to market daily using primarily quotations from pricing services, counterparties and brokers. Swap contracts are reported on a schedule following the Statement of Investments. The values of swap contracts are aggregated by positive and negative values and disclosed separately on the Statement of Assets and Liabilities by contracts in unrealized appreciation and depreciation positions. Upfront payments paid or received, if any, affect the value of the respective swap. Therefore, to determine the unrealized appreciation (depreciation) on swaps, upfront payments paid should be subtracted from, while upfront payments received should be added to, the value of contracts reported as an asset on the Statement of Assets and Liabilities. Conversely, upfront payments paid should be added to, while upfront payments received should be subtracted from the value of contracts reported as a liability. The unrealized appreciation (depreciation) related to the change in the valuation of the notional amount of the swap is combined with the accrued interest due to (owed by) the Fund at termination or settlement. The net change in this amount during the period is included on the Statement of Operations. The Fund also records any periodic payments received from (paid to) the counterparty, including at termination, under such contracts as realized gain (loss) on the Statement of Operations.
Swap contract agreements are exposed to the market risk factor of the specific underlying reference asset. Swap contracts are typically more attractively priced compared to similar investments in related cash securities because they isolate the risk to one market risk factor and eliminate the other market risk factors. Investments in cash securities (for instance bonds) have exposure to multiple risk factors (credit and interest rate risk). Because swaps require little or no initial cash investment, they can expose the Fund to substantial risk in the isolated market risk factor.
| | | Credit Default Swap Contracts. A credit default swap is a bilateral contract that enables an investor to buy or sell protection on a debt security against a defined-issuer credit event, such as the issuer’s failure to make timely payments of interest |
50 | ACTIVE ALLOCATION FUND
or principal on the debt security, bankruptcy or restructuring. The Fund may enter into credit default swaps either by buying or selling protection on a single security or a basket of securities (the “reference asset”).
The buyer of protection pays a periodic fee to the seller of protection based on the notional amount of debt securities underlying the swap contract. The seller of protection agrees to compensate the buyer of protection for future potential losses as a result of a credit event on the reference asset. The contract effectively transfers the credit event risk of the reference asset from the buyer of protection to the seller of protection.
The ongoing value of the contract will fluctuate throughout the term of the contract based primarily on the credit risk of the reference asset. If the credit quality of the reference asset improves relative to the credit quality at contract initiation, the buyer of protection may have an unrealized loss greater than the anticipated periodic fee owed. This unrealized loss would be the result of current credit protection being cheaper than the cost of credit protection at contract initiation. If the buyer elects to terminate the contract prior to its maturity, and there has been no credit event, this unrealized loss will become realized. If the contract is held to maturity, and there has been no credit event, the realized loss will be equal to the periodic fee paid over the life of the contract.
If there is a credit event, the buyer of protection can exercise its rights under the contract and receive a payment from the seller of protection equal to the notional amount of the reference asset less the market value of the reference asset. Upon exercise of the contract the difference between the value of the underlying reference asset and the notional amount is recorded as realized gain (loss) and is included on the Statement of Operations.
The Fund has sold credit protection through credit default swaps to increase exposure to the credit risk of individual securities and/or, indexes that are either unavailable or considered to be less attractive in the bond market.
The Fund has purchased credit protection through credit default swaps to decrease exposure to the credit risk of individual securities and/or, indexes.
For the year ended January 31, 2011, the Fund had average notional amounts of $1,515,462 and $13,974,615 on credit default swaps to buy protection and credit default swaps to sell protection, respectively.
Additional associated risks to the Fund include counterparty credit risk and liquidity risk.
As of January 31, 2011, the Fund had no such credit default swaps outstanding.
Interest Rate Swap Contracts. An interest rate swap is an agreement between counterparties to exchange periodic payments based on interest rates. One cash flow stream will typically be a floating rate payment based upon a specified interest rate while the other is typically a fixed interest rate.
The Fund has entered into interest rate swaps in which it pays a floating interest rate and receives a fixed interest rate in order to increase exposure to interest rate risk. Typically, if relative interest rates rise, payments made by the Fund under a swap agreement will be greater than the payments received by the Fund.
51 | ACTIVE ALLOCATION FUND
NOTES TO FINANCIAL STATEMENTS Continued
| 5. | | Risk Exposures and the Use of Derivative Instruments Continued |
The Fund has entered into interest rate swaps in which it pays a fixed interest rate and receives a floating interest rate in order to decrease exposure to interest rate risk. Typically, if relative interest rates rise, payments received by the Fund under the swap agreement will be greater than the payments made by the Fund.
For the year ended January 31, 2011, the Fund, had average notional amounts of $1,685,108 and $1,684,615 on interest rate swaps which pay a fixed rate and interest rate swaps which receive a fixed rate, respectively.
Additional associated risks to the Fund include counter party credit risk and liquidity risk.
Total Return Swap Contracts. A total return swap is an agreement between counterparties to exchange periodic payments based on asset or non-asset references. One cash flow is typically based on a non-asset reference (such as an interest rate or index) and the other on the total return of a reference asset (such as a security or a basket of securities). The total return of the reference asset typically includes appreciation or depreciation on the reference asset, plus any interest or dividend payments.
Total return swap contracts are exposed to the market risk factor of the specific underlying financial instrument or index. Total return swaps are less standard in structure than other types of swaps and can isolate and/or, include multiple types of market risk factors including equity risk, credit risk, and interest rate risk.
The Fund has entered into total return swaps on various equity securities or indexes to increase exposure to equity risk. These equity risk related total return swaps require the Fund to pay a floating reference interest rate, or an amount equal to the negative price movement of securities or an index multiplied by the notional amount of the contract. The Fund will receive payments equal to the positive price movement of the same securities or index multiplied by the notional amount of the contract.
The Fund has entered into total return swaps on various equity securities or indexes to decrease exposure to equity risk. These equity risk related total return swaps require the Fund to pay an amount equal to the positive price movement of securities or an index multiplied by the notional amount of the contract. The Fund will receive payments of a floating reference interest rate or an amount equal to the negative price movement of the same securities or index multiplied by the notional amount of the contract.
For the year ended January 31, 2011 the Fund had average notional amounts of $67,083,485 and $22,133,537 on total return swaps which are long the reference asset and total return swaps which are short the reference asset, respectively.
Additional associated risks to the Fund include counterparty credit risk and liquidity risk.
6. Pending Litigation
Since 2009, a number of lawsuits have been pending in federal courts against the Manager, the Distributor, and certain mutual funds (“Defendant Funds”) advised by the Manager and distributed by the Distributor (but not including the Fund). The lawsuits naming the Defendant Funds also name as defendants certain officers and current and
52 | ACTIVE ALLOCATION FUND
former trustees of the respective Defendant Funds. The plaintiffs seek class action status on behalf of purchasers of shares of the respective Defendant Fund during a particular time period. The lawsuits raise claims under federal securities laws alleging that, among other things, the disclosure documents of the respective Defendant Fund contained misrepresentations and omissions, that such Defendant Fund’s investment policies were not followed, and that such Defendant Fund and the other defendants violated federal securities laws and regulations. The plaintiffs seek unspecified damages, equitable relief and an award of attorneys’ fees and litigation expenses.
In 2009, what are claimed to be derivative lawsuits were filed in state court against the Manager and a subsidiary (but not against the Fund), on behalf of the New Mexico Education Plan Trust. These lawsuits allege breach of contract, breach of fiduciary duty, negligence and violation of state securities laws, and seek compensatory damages, equitable relief and an award of attorneys’ fees and litigation expenses.
Other lawsuits have been filed since 2008 in various state and federal courts, against the Manager and certain of its affiliates. Those lawsuits were filed by investors who made investments through an affiliate of the Manager, and relate to the alleged investment fraud perpetrated by Bernard Madoff and his firm (“Madoff”). Those suits allege a variety of claims, including breach of fiduciary duty, fraud, negligent misrepresentation, unjust enrichment, and violation of federal and state securities laws and regulations, among others. They seek unspecified damages, equitable relief and an award of attorneys’ fees and litigation expenses. None of the suits have named the Distributor, any of the Oppenheimer mutual funds or any of their independent Trustees or Directors as defendants. None of the Oppenheimer funds invested in any funds or accounts managed by Madoff.
The Manager believes that the lawsuits described above are without legal merit and is defending against them vigorously. The Defendant Funds’ Boards of Trustees have also engaged counsel to defend the suits brought against those Funds and the present and former Independent Trustees named in those suits. While it is premature to render any opinion as to the outcome in these lawsuits, or whether any costs that the Defendant Funds may bear in defending the suits might not be reimbursed by insurance, the Manager believes that these suits should not impair the ability of the Manager or the Distributor to perform their respective duties to the Fund, and that the outcome of all of the suits together should not have any material effect on the operations of any of the Oppenheimer funds.
7. Subsequent Event
The Regulated Investment Company Modernization Act of 2010 (the “Act”) was signed into law on December 22, 2010. The Act makes changes to a number of tax rules impacting the Fund. Under the Act, future capital losses generated by a fund may be carried over indefinitely, but these losses must be used prior to the utilization of any pre-enactment capital losses. Since pre-enactment capital losses may only be carried forward for eight years, there may be a greater likelihood that all or a portion of a fund’s pre-enactment capital losses will expire unused. In general, the provisions of the Act will be effective for the Fund’s fiscal year ending 2012. Specific information regarding the impact of the Act on the Fund will be contained within the “Federal Taxes” section of the financial statement notes for the fiscal year ending 2012.
53 | ACTIVE ALLOCATION FUND
REPORT OF INDEPENDENT REGISTERED PUBLIC ACCOUNTING FIRM
The Board of Trustees and Shareholders of Oppenheimer Portfolio Series:
We have audited the accompanying statement of assets and liabilities of Active Allocation Fund (one of the portfolios constituting the Oppenheimer Portfolio Series), including the statement of investments, as of January 31, 2011, the related statement of operations for the year then ended, the statements of changes in net assets for each of the years in the two-year period then ended, and the financial highlights for each of the years in the five-year period then ended. These financial statements and financial highlights are the responsibility of the Fund’s management. Our responsibility is to express an opinion on these financial statements and financial highlights based on our audits.
We conducted our audits in accordance with the standards of the Public Company Accounting Oversight Board (United States). Those standards require that we plan and perform the audit to obtain reasonable assurance about whether the financial statements and financial highlights are free of material misstatement. An audit includes examining, on a test basis, evidence supporting the amounts and disclosures in the financial statements. Our procedures included confirmation of securities owned as of January 31, 2011, by correspondence with the custodian and transfer agent of the underlying funds. An audit also includes assessing the accounting principles used and significant estimates made by management, as well as evaluating the overall financial statement presentation. We believe that our audits provide a reasonable basis for our opinion.
In our opinion, the financial statements and financial highlights referred to above present fairly, in all material respects, the financial position of Active Allocation Fund as of January 31, 2011, the results of its operations for the year then ended, the changes in its net assets for each of the years in the two-year period then ended, and the financial highlights for each of the years in the five-year period then ended, in conformity with U.S. generally accepted accounting principles.
KPMG LLP
Denver, Colorado
March 16, 2011
54 | ACTIVE ALLOCATION FUND
FEDERAL INCOME TAX INFORMATION Unaudited
In early 2011, if applicable, shareholders of record received information regarding all dividends and distributions paid to them by the Fund during calendar year 2010. Regulations of the U.S. Treasury Department require the Fund to report this information to the Internal Revenue Service.
Dividends, if any, paid by the Fund during the fiscal year ended January 31, 2011 which are not designated as capital gain distributions should be multiplied by the maximum amount allowable but not less than 14.71% to arrive at the amount eligible for the corporate dividend-received deduction.
A portion, if any, of the dividends paid by the Fund during the fiscal year ended January 31, 2011 which are not designated as capital gain distributions are eligible for lower individual income tax rates to the extent that the Fund has received qualified dividend income as stipulated by recent tax legislation. The maximum amount allowable but not less than $10,838,647 of the Fund’s fiscal year taxable income may be eligible for the lower individual income tax rates. In early 2011, shareholders of record received information regarding the percentage of distributions that are eligible for lower individual income tax rates.
Recent tax legislation allows a regulated investment company to designate distributions not designated as capital gain distributions, as either interest related dividends or short-term capital gain dividends, both of which are exempt from the U.S. withholding tax applicable to non U.S. taxpayers. For the fiscal year ended January 31, 2011, the maximum amount allowable but not less than $348,772 or 2.60% of the ordinary distributions paid by the Fund qualifies as an interest related dividend.
The foregoing information is presented to assist shareholders in reporting distributions received from the Fund to the Internal Revenue Service. Because of the complexity of the federal regulations which may affect your individual tax return and the many variations in state and local tax regulations, we recommend that you consult your tax advisor for specific guidance.
55 | ACTIVE ALLOCATION FUND
BOARD APPROVAL OF THE FUND’S INVESTMENT ADVISORY AGREEMENT Unaudited
Each year, the Board of Trustees (the “Board”), including a majority of the independent Trustees, is required to determine whether to renew the Fund’s investment advisory agreement (the “Agreement”). The Investment Company Act of 1940, as amended, requires that the Board request and evaluate, and that the Manager provide, such information as may be reasonably necessary to evaluate the terms of the Agreement. The Board employs an independent consultant to prepare a report that provides information, including comparative information, that the Board requests for that purpose. In addition, the Board receives information throughout the year regarding Fund services, fees, expenses and performance.
The Manager and the independent consultant provided information to the Board on the following factors: (i) the nature, quality and extent of the Manager’s services, (ii) the investment performance of the Fund and the Manager, (iii) the fees and expenses of the Fund, including comparative expense information, (iv) the profitability of the Manager and its affiliates, including an analysis of the cost of providing services, (v) whether economies of scale are realized as the Fund grows and whether fee levels reflect these economies of scale for Fund investors and (vi) other benefits to the Manager from its relationship with the Fund. The Board was aware that there are alternatives to retaining the Manager.
Outlined below is a summary of the principal information considered by the Board as well as the Board’s conclusions.
Nature, Quality and Extent of Services. The Board considered information about the nature, quality and extent of the services provided to the Fund and information regarding the Manager’s key personnel who provide such services. The Manager’s duties include providing the Fund with the services of the portfolio managers and the Manager’s asset allocation team, who provide research, analysis and other advisory services in regard to the Fund’s investments; oversight of third-party service providers; monitoring compliance with applicable Fund policies and procedures and adherence to the Fund’s investment restrictions. The Manager is responsible for providing certain administrative services to the Fund as well. Those services include providing and supervising all administrative and clerical personnel who are necessary in order to provide effective corporate administration for the Fund; compiling and maintaining records with respect to the Fund’s operations; preparing and filing reports required by the Securities and Exchange Commission; preparing periodic reports regarding the operations of the Fund for its shareholders; preparing proxy materials for shareholder meetings; and preparing the registration statements required by Federal and state securities laws for the sale of the Fund’s shares. The Manager also provides the Fund with office space, facilities and equipment.
56 | ACTIVE ALLOCATION FUND
The Board also considered the quality of the services provided and the quality of the Manager’s resources that are available to the Fund. The Board took account of the fact that the Manager has had over fifty years of experience as an investment adviser and that its assets under management rank it among the top mutual fund managers in the United States. The Board evaluated the Manager’s advisory, administrative, accounting, legal and compliance services, and information the Board has received regarding the experience and professional qualifications of the Manager’s key personnel and the size and functions of its staff. In its evaluation of the quality of the portfolio management services provided, the Board considered the experience of Alan Gilston, Caleb Wong and effective June 2010, Krishna Memani, the portfolio managers for the Fund, and the experience of the portfolio managers and the investment performance of the investment companies in which the Fund may invest (the “Underlying Funds”). The Board members also considered the totality of their experiences with the Manager as directors or trustees of the Fund and other funds advised by the Manager. The Board considered information regarding the quality of services provided by affiliates of the Manager, which its members have become knowledgeable about in connection with the renewal of the Fund’s service agreements. The Board concluded, in light of the Manager’s experience, reputation, personnel, operations and resources, that the Fund benefits from the services provided under the Agreement.
Investment Performance of the Manager and the Fund. Throughout the year, the Manager provided information on the investment performance of the Fund and the Manager, including comparative performance information. The Board also reviewed information, prepared by the Manager and by the independent consultant, comparing the Fund’s historical performance to relevant market indices and to the performance of other retail front-end load and no-load mixed-asset target allocation growth fund of funds (including both fund of funds advised by the Manager and fund of funds advised by other investment advisers). The Board noted that the Fund’s one-year performance was better than its peer group median although its three-year performance was below its peer group median.
Costs of Services by the Manager. The Board reviewed the fees paid to the Manager and its affiliates and the other expenses borne by the Fund. The Board noted that the Fund does not pay a direct management fee but that the Fund indirectly bears its share of the management fees of the Underlying Funds. In addition, the Portfolio pays the Manager an asset allocation fee. The Board also considered the comparability of the fees charged and the services provided to the Fund to the fees and services for other clients or accounts advised by the Manager. The independent consultant provided comparative data in regard to the fees and expenses of the Fund and other retail front-end load mixed-asset target allocation growth fund of funds with comparable asset levels and distribution features.
57 | ACTIVE ALLOCATION FUND
BOARD APPROVAL OF THE FUND’S INVESTMENT ADVISORY AGREEMENT Unaudited / Continued
The Board noted that the Fund’s total expenses were competitive with its peer group median and average. The Board also noted that the Manager has voluntarily agreed to waive fees and/or reimburse the Fund for certain expenses so that the “Total Expenses”, as a percentage of average net assets, (the combined direct (Fund level) and indirect (Underlying Fund level) expenses), will not exceed the annual rate of 1.45% for Class A, 2.20% for Class B and Class C, 1.70% For Class N and 1.20% for Class Y. The Manager may modify or terminate this undertaking at any time without notice to shareholders.
Economies of Scale and Profits Realized by the Manager. The Board considered information regarding the Manager’s costs in serving as the Fund’s investment adviser, including the costs associated with the personnel and systems necessary to manage the Fund, and information regarding the Manager’s profitability from its relationship with the Fund. The Board reviewed whether the Manager may realize economies of scale in managing and supporting the Fund and the Underlying Funds, and the extent to which those economies of scale would benefit the Fund’s shareholders.
Other Benefits to the Manager. In addition to considering the profits realized by the Manager, the Board considered information that was provided regarding the direct and indirect benefits the Manager receives as a result of its relationship with the Fund, including compensation paid to the Manager’s affiliates. The Board also considered that the Manager must be able to pay and retain experienced professional personnel at competitive rates to provide quality services to the Fund.
Conclusions. These factors were also considered by the independent Trustees meeting separately from the full Board, assisted by experienced counsel to the Fund and to the independent Trustees. Fund counsel and the independent Trustees’ counsel are independent of the Manager within the meaning and intent of the Securities and Exchange Commission Rules.
Based on its review of the information it received and its evaluations described above, the Board, including a majority of the independent Trustees, decided to continue the Agreement through September 30, 2011. In arriving at this decision, the Board did not single out any factor or factors as being more important than others, but considered all of the above information, and considered the terms and conditions of the Agreement, in light of all of the surrounding circumstances.
58 | ACTIVE ALLOCATION FUND
PORTFOLIO PROXY VOTING POLICIES AND PROCEDURES; UPDATES TO STATEMENTS OF INVESTMENTS Unaudited
The Fund has adopted Portfolio Proxy Voting Policies and Procedures under which the Fund votes proxies relating to securities (“portfolio proxies”) held by the Fund. A description of the Fund’s Portfolio Proxy Voting Policies and Procedures is available (i) without charge, upon request, by calling the Fund toll-free at 1.800.525.7048, (ii) on the Fund’s website at www.oppenheimerfunds.com, and (iii) on the SEC’s website at www.sec.gov. In addition, the Fund is required to file Form N-PX, with its complete proxy voting record for the 12 months ended June 30th, no later than August 31st of each year. The Fund’s voting record is available (i) without charge, upon request, by calling the Fund toll-free at 1.800.525.7048, and (ii) in the Form N-PX filing on the SEC’s website at www.sec.gov.
The Fund files its complete schedule of portfolio holdings with the SEC for the first quarter and the third quarter of each fiscal year on Form N-Q. The Fund’s Form N-Q filings are available on the SEC’s website at www.sec.gov. Those forms may be reviewed and copied at the SEC’s Public Reference Room in Washington, D.C. Information on the operation of the Public Reference Room may be obtained by calling 1-800-SEC-0330.
Householding—Delivery of Shareholder Documents
This is to inform you about OppenheimerFunds’ “householding” policy. If more than one member of your household maintains an account in a particular fund, OppenheimerFunds will mail only one copy of the fund’s prospectus (or, if available, the fund’s summary prospectus), annual and semiannual report and privacy policy. The consolidation of these mailings, called householding, benefits your fund through reduced mailing expense, and benefits you by reducing the volume of mail you receive from OppenheimerFunds. Householding does not affect the delivery of your account statements.
Please note that we will continue to household these mailings for as long as you remain an OppenheimerFunds shareholder, unless you request otherwise. If you prefer to receive multiple copies of these materials, please call us at 1.800.CALL-OPP (225-5677). You may also notify us in writing or via email. We will begin sending you individual copies of the prospectus (or, if available, the summary prospectus), reports and privacy policy within 30 days of receiving your request to stop householding.
59 | ACTIVE ALLOCATION FUND
TRUSTEES AND OFFICERS Unaudited / Continued
| | | |
|
Name, Position(s) Held with the
Fund, Length of Service, Age | | Principal Occupation(s) During the Past 5 Years; Other Trusteeships/Directorships Held; Number of Portfolios in the Fund Complex Currently Overseen |
| | | |
INDEPENDENT
TRUSTEES | | The address of each Trustee in the chart below is 6803 S. Tucson Way, Centennial, Colorado 80112-3924. Each Trustee serves for an indefinite term, or until his or her resignation, retirement, death or removal. |
| | | |
Brian F. Wruble,
Chairman of the Board of
Trustees (since 2007) and
Trustee (since 2005)
Age: 67 | | Chairman (since August 2007) and Trustee (since August 1991) of the Board of Trustees of The Jackson Laboratory (non-profit); Director of Special Value Opportunities Fund, LLC (registered investment company) (affiliate of the Manager’s parent company) (since September 2004); Member of Zurich Financial Investment Management Advisory Council (insurance) (since 2004); Treasurer (since 2007) and Trustee of the Institute for Advanced Study (non-profit educational institute) (since May 1992); General Partner of Odyssey Partners, L.P. (hedge fund) (September 1995-December 2007); Special Limited Partner of Odyssey Investment Partners, LLC (private equity investment) (January 1999-September 2004). Oversees 59 portfolios in the OppenheimerFunds complex. Mr. Wruble has served on the Boards of certain Oppenheimer funds since April 2001, during which time he has become familiar with the Fund’s (and other Oppenheimer funds’) financial, accounting, regulatory and investment matters and has contributed to the Boards’ deliberations. |
| | | |
David K. Downes,
Trustee (since 2007)
Age: 71 | | Director of THL Credit Inc. (since June 2009); Independent Chairman GSK Employee Benefit Trust (since April 2006); Trustee of Employee Trusts (since January 2006); Chief Executive Officer and Board Member of Community Capital Management (investment management company) (since January 2004); President of The Community Reinvestment Act Qualified Investment Fund (investment management company) (since 2004); Director of Internet Capital Group (information technology company) (since October 2003); Director of Correctnet (January 2006-2007); Independent Chairman of the Board of Trustees of Quaker Investment Trust (registered investment company) (2004-2007); Chief Operating Officer and Chief Financial Officer of Lincoln National Investment Companies, Inc. (subsidiary of Lincoln National Corporation, a publicly traded company) and Delaware Investments U.S., Inc. (investment management subsidiary of Lincoln National Corporation) (1993-2003); President, Chief Executive Officer and Trustee of Delaware Investment Family of Funds (1993-2003); President and Board Member of Lincoln National Convertible Securities Funds, Inc. and the Lincoln National Income Funds, TDC (1993-2003); Chairman and Chief Executive Officer of Retirement Financial Services, Inc. (registered transfer agent and investment adviser and subsidiary of Delaware Investments U.S., Inc.) (1993-2003); President and Chief Executive Officer of Delaware Service Company, Inc. (1995-2003); Chief Administrative Officer, Chief Financial Officer, Vice Chairman and Director of Equitable Capital Management Corporation (investment subsidiary of Equitable Life Assurance Society) (1985-1992); Corporate Controller of Merrill Lynch Company (financial services holding company) (1977-1985); held the following positions at the Colonial Penn Group, Inc. (insurance company): Corporate Budget Director (1974-1977), Assistant Treasurer (1972-1974) and Director of Corporate Taxes (1969-1972); held the following positions at Price Waterhouse Company (financial services firm): Tax Manager (1967-1969), Tax Senior (1965-1967) and Staff Accountant (1963-1965); United States Marine Corps (1957-1959). Oversees 59 portfolios in the OppenheimerFunds complex. Mr. Downes has served on the Boards of certain Oppenheimer funds since December 2005, during which time he has become familiar with the Fund’s (and other Oppenheimer funds’) financial, accounting, regulatory and investment matters and has contributed to the Boards’ deliberations. |
60 | ACTIVE ALLOCATION FUND
| | | |
Name, Position(s) Held with the
Fund, Length of Service, Age | | Principal Occupation(s) During the Past 5 Years; Other Trusteeships/Directorships Held; Number of Portfolios in the Fund Complex Currently Overseen |
| | | |
|
Matthew P. Fink,
Trustee (since 2005)
Age: 70 | | Trustee of the Committee for Economic Development (policy research foundation) (since 2005); Director of ICI Education Foundation (education foundation) (October 1991-August 2006); President of the Investment Company Institute (trade association) (October 1991-June 2004); Director of ICI Mutual Insurance Company (insurance company) (October 1991-June 2004). Oversees 59 portfolios in the OppenheimerFunds complex. Mr. Fink has served on the Boards of certain Oppenheimer funds since January 2005, during which time he has become familiar with the Fund’s (and other Oppenheimer funds’) financial, accounting, regulatory and investment matters and has contributed to the Boards’ deliberations. |
| | | |
Phillip A. Griffiths,
Trustee (since 2005)
Age: 72 | | Fellow of the Carnegie Corporation (since 2007); Distinguished Presidential Fellow for International Affairs (since 2002) and Member (since 1979) of the National Academy of Sciences; Council on Foreign Relations (since 2002); Director of GSI Lumonics Inc. (precision technology products company) (since 2001); Senior Advisor of The Andrew W. Mellon Foundation (since 2001); Chair of Science Initiative Group (since 1999); Member of the American Philosophical Society (since 1996); Trustee of Woodward Academy (since 1983); Foreign Associate of Third World Academy of Sciences (since 2002); Director of the Institute for Advanced Study (1991-2004); Director of Bankers Trust New York Corporation (1994-1999); Provost at Duke University (1983-1991). Oversees 59 portfolios in the OppenheimerFunds complex. Mr. Griffiths has served on the Boards of certain Oppenheimer funds since June 1999, during which time he has become familiar with the Fund’s (and other Oppenheimer funds’) financial, accounting, regulatory and investment matters and has contributed to the Boards’ deliberations. |
| | | |
Mary F. Miller,
Trustee (since 2005)
Age: 68 | | Trustee of International House (not-for-profit) (since June 2007); Trustee of the American Symphony Orchestra (not-for-profit) (since October 1998); and Senior Vice President and General Auditor of American Express Company (financial services company) (July 1998-February 2003). Oversees 59 portfolios in the OppenheimerFunds complex. Ms. Miller has served on the Boards of certain Oppenheimer funds since August 2004, during which time she has become familiar with the Fund’s (and other Oppenheimer funds’) financial, accounting, regulatory and investment matters and has contributed to the Boards’ deliberations. |
| | | |
Joel W. Motley,
Trustee (since 2005)
Age: 58 | | Managing Director of Public Capital Advisors, LLC (privately-held financial advisor) (since January 2006); Managing Director of Carmona Motley, Inc. (privately-held financial advisor) (since January 2002); Director of Columbia Equity Financial Corp. (privately-held financial advisor) (2002-2007); Managing Director of Carmona Motley Hoffman Inc. (privately-held financial advisor) (January 1998-December 2001); Member of the Finance and Budget Committee of the Council on Foreign Relations, Chairman of the Investment Committee of the Episcopal Church of America, Member of the Investment Committee and Board of Human Rights Watch and Member of the Investment Committee and Board of Historic Hudson Valley. Oversees 59 portfolios in the OppenheimerFunds complex. Mr. Motley has served on the Boards of certain Oppenheimer funds since October 2002, during which time he has become familiar with the Fund’s (and other Oppenheimer funds’) financial, accounting, regulatory and investment matters and has contributed to the Boards’ deliberations. |
| | | |
Mary Ann Tynan,
Trustee (since 2008)
Age: 65 | | Vice Chair of Board of Trustees of Brigham and Women’s/Faulkner Hospitals (non-profit hospital) (since 2000); Chair of Board of Directors of Faulkner Hospital (non-profit hospital) (since 1990); Member of Audit and Compliance Committee of Partners Health Care System (non-profit) (since 2004); Board of Trustees of Middlesex School (educational institution) (since 1994); Board of Directors of |
61 | ACTIVE ALLOCATION FUND
TRUSTEES AND OFFICERS Unaudited / Continued
| | | |
Name, Position(s) Held with the
Fund, Length of Service, Age | | Principal Occupation(s) During the Past 5 Years; Other Trusteeships/Directorships Held; Number of Portfolios in the Fund Complex Currently Overseen |
| | | |
|
Mary Ann Tynan,
Continued | | Idealswork, Inc. (financial services provider) (since 2003); Partner, Senior Vice President and Director of Regulatory Affairs of Wellington Management Company, LLP (global investment manager) (1976-2002); Vice President and Corporate Secretary, John Hancock Advisers, Inc. (mutual fund investment adviser) (1970-1976). Oversees 59 portfolios in the OppenheimerFunds complex. Ms. Tynan has served on the Boards of certain Oppenheimer funds since October 2008, during which time she has become familiar with the Fund’s (and other Oppenheimer funds’) financial, accounting, regulatory and investment matters and has contributed to the Boards’ deliberations. |
| | | |
Joseph M. Wikler,
Trustee (since 2005)
Age: 69 | | Director of C-TASC (bio-statistics services) (since 2007); Director of the following medical device companies: Medintec (since 1992) and Cathco (since 1996); Member of the Investment Committee of the Associated Jewish Charities of Baltimore (since 1994); Director of Lakes Environmental Association (environmental protection organization) (1996-2008); Director of Fortis/Hartford mutual funds (1994-December 2001). Oversees 59 portfolios in the OppenheimerFunds complex. Mr. Wikler has served on the Boards of certain Oppenheimer funds since August 2005, during which time he has become familiar with the Fund’s (and other Oppenheimer funds’) financial, accounting, regulatory and investment matters and has contributed to the Boards’ deliberations. |
| | | |
Peter I. Wold,
Trustee (since 2005)
Age: 63 | | Director of Arch Coal, Inc. (since 2010); Director and Chairman of Wyoming Enhanced Oil Recovery Institute Commission (enhanced oil recovery study) (since 2004); President of Wold Oil Properties, Inc. (oil and gas exploration and production company) (since 1994); Vice President of American Talc Company, Inc. (talc mining and milling) (since 1999); Managing Member of Hole-in-the-Wall Ranch (cattle ranching) (since 1979); Director and Chairman of the Denver Branch of the Federal Reserve Bank of Kansas City (1993-1999); and Director of PacifiCorp. (electric utility) (1995-1999). Oversees 59 portfolios in the OppenheimerFunds complex. Mr. Wold has served on the Boards of certain Oppenheimer funds since August 2005, during which time he has become familiar with the Fund’s (and other Oppenheimer funds’) financial, accounting, regulatory and investment matters and has contributed to the Boards’ deliberations. |
| | | |
OFFICERS OF THE FUND | | The addresses of the Officers in the chart below are as follows: for Messrs. Gilston, Memani, Wong, Glavin, Gabinet, Keffer and Zack, Two World Financial Center, 225 Liberty Street, New York, New York 10281-1008, for Messrs. Vandehey and Wixted, 6803 S. Tucson Way, Centennial, Colorado 80112-3924. Each Officer serves for an indefinite term or until his or her resignation, retirement, death or removal. |
| | | |
Alan C. Gilston,
Vice President and Portfolio
Manager (since 2009)
Age: 52 | | Vice President of the Manager (since September 1997); a member of the Funds’ portfolio management team and a member of the Manager’s Asset Allocation Committee (since February 2009); a member of the Manager’s Risk Management Team during various periods. A portfolio manager and officer of 11 portfolios in the OppenheimerFunds complex. |
| | | |
Krishna Memani,
Vice President and Portfolio
Manager (since 2010)
Age: 50 | | Director of Fixed Income (since October 2010), Senior Vice President and Head of the Investment Grade Fixed Income Team of the Manager (since March 2009). Prior to joining the Manager, Managing Director and Head of the U.S. and European Credit Analyst Team at Deutsche Bank Securities (June 2006-January 2009); Chief Credit Strategist at Credit Suisse Securities (August 2002-March 2006); a Managing Director and Senior Portfolio Manager at Putnam Investments (September 1998-June 2002). A portfolio manager and an officer of 22 portfolios in the OppenheimerFunds complex. |
62 | ACTIVE ALLOCATION FUND
| | | |
Name, Position(s) Held with the
Fund, Length of Service, Age | | Principal Occupation(s) During the Past 5 Years; Other Trusteeships/Directorships Held; Number of Portfolios in the Fund Complex Currently Overseen |
| | | |
|
Caleb Wong,
Vice President (since 2004)
and Portfolio Manager
(since 2005)
Age: 45 | | Vice President of the Manager (since June 1999); worked in fixed-income quantitative research and risk management for the Manager (since July 1996). A portfolio manager and officer of 5 portfolios in the OppenheimerFunds complex. |
| | | |
William F. Glavin, Jr.,
President and Principal
Executive Officer (since 2009)
Age: 52 | | Chairman of the Manager (since December 2009); Chief Executive Officer and Director of the Manager (since January 2009); President of the Manager (since May 2009); Director of Oppenheimer Acquisition Corp. (“OAC”) (the Manager’s parent holding company) (since June 2009); Executive Vice President (March 2006-February 2009) and Chief Operating Officer (July 2007-February 2009) of Massachusetts Mutual Life Insurance Company (OAC’s parent company); Director (May 2004-March 2006) and Chief Operating Officer and Chief Compliance Officer (May 2004-January 2005), President (January 2005-March 2006) and Chief Executive Officer (June 2005-March 2006) of Babson Capital Management LLC; Director (March 2005-March 2006), President (May 2003-March 2006) and Chief Compliance Officer (July 2005-March 2006) of Babson Capital Securities, Inc. (a broker-dealer); President (May 2003-March 2006) of Babson Investment Company, Inc.; Director (May 2004-August 2006) of Babson Capital Europe Limited; Director (May 2004-October 2006) of Babson Capital Guernsey Limited; Director (May 2004-March 2006) of Babson Capital Management LLC; Non-Executive Director (March 2005-March 2007) of Baring Asset Management Limited; Director (February 2005-June 2006) Baring Pension Trustees Limited; Director and Treasurer (December 2003-November 2006) of Charter Oak Capital Management, Inc.; Director (May 2006- September 2006) of C.M. Benefit Insurance Company; Director (May 2008-June 2009) and Executive Vice President (June 2007-July 2009) of C.M. Life Insurance Company; President (March 2006-May 2007) of MassMutual Assignment Company; Director (January 2005-December 2006), Deputy Chairman (March 2005-December 2006) and President (February 2005-March 2005) of MassMutual Holdings (Bermuda) Limited; Director (May 2008-June 2009) and Executive Vice President (June 2007-July 2009) of MML Bay State Life Insurance Company; Chief Executive Officer and President (April 2007-January 2009) of MML Distributors, LLC; and Chairman (March 2006-December 2008) and Chief Executive Officer (May 2007-December 2008) of MML Investors Services, Inc. Oversees 66 portfolios as a Trustee/Director and 94 portfolios as an officer in the OppenheimerFunds complex. |
| | | |
Arthur S. Gabinet,
Secretary (since 2011)
Age: 52 | | Executive Vice President (since May 2010) and General Counsel (since January 2011) of the Manager; General Counsel of the Distributor (since January 2011); General Counsel of Centennial Asset Management Corporation (since January 2011); Executive Vice President and General Counsel of HarbourView Asset Management Corporation (since January 2011); Assistant Secretary (since January 2011) and Director (since January 2011) of OppenheimerFunds International Ltd. and OppenheimerFunds plc; Vice President and Director of Oppenheimer Partnership Holdings, Inc. (since January 2011); Director of Oppenheimer Real Asset Management, Inc. (since January 2011); Executive Vice President and General Counsel of Shareholder Financial Services, Inc. and Shareholder Services, Inc. (since January 2011); Executive Vice President and General Counsel of OFI Private Investments, Inc. (since January 2011); Vice President of OppenheimerFunds Legacy Program (since January 2011); Executive Vice President and General Counsel of OFI Institutional Asset Management, Inc. (since January 2011); General Counsel, Asset Management of the Manager (May 2010-December 2010); Principal, The Vanguard Group (November 2005-April 2010); District Administrator, U.S. Securities and Exchange Commission (January 2003-October 2005). An officer of 96 portfolios in the OppenheimerFunds complex. |
63 | ACTIVE ALLOCATION FUND
TRUSTEES AND OFFICERS Unaudited / Continued
| | | |
Name, Position(s) Held with the
Fund, Length of Service, Age | | Principal Occupation(s) During the Past 5 Years; Other Trusteeships/Directorships Held; Number of Portfolios in the Fund Complex Currently Overseen |
| | | |
|
Thomas W. Keffer,
Vice President and Chief
Business Officer (since 2009)
Age: 55 | | Senior Vice President of the Manager (since March 1997); Director of Investment Brand Management of the Manager (since November 1997); Senior Vice President of OppenheimerFunds Distributor, Inc. (since December 1997). An officer of 96 portfolios in the OppenheimerFunds complex. |
| | | |
Mark S. Vandehey,
Vice President and Chief
Compliance Officer
(since 2005)
Age: 60 | | Senior Vice President and Chief Compliance Officer of the Manager (since March 2004); Chief Compliance Officer of OppenheimerFunds Distributor, Inc., Centennial Asset Management and Shareholder Services, Inc. (since March 2004); Vice President of OppenheimerFunds Distributor, Inc., Centennial Asset Management Corporation and Shareholder Services, Inc. (since June 1983). An officer of 96 portfolios in the OppenheimerFunds complex. |
| | | |
Brian W. Wixted,
Treasurer and Principal
Financial & Accounting
Officer (since 2005)
Age: 51 | | Senior Vice President of the Manager (since March 1999); Treasurer of the Manager and the following: HarbourView Asset Management Corporation, Shareholder Financial Services, Inc., Shareholder Services, Inc., Oppenheimer Real Asset Management, Inc. and Oppenheimer Partnership Holdings, Inc. (March 1999-June 2008), OFI Private Investments, Inc. (March 2000-June 2008), OppenheimerFunds International Ltd. and OppenheimerFunds plc (since May 2000), OFI Institutional Asset Management, Inc. (since November 2000), and OppenheimerFunds Legacy Program (charitable trust program established by the Manager) (since June 2003); Treasurer and Chief Financial Officer of OFI Trust Company (trust company subsidiary of the Manager) (since May 2000); Assistant Treasurer of OAC (March 1999-June 2008). An officer of 96 portfolios in the OppenheimerFunds complex. |
| | | |
Robert G. Zack,
Vice President
(since 2005)
Age: 62 | | Executive Vice President (since January 2004) and General Counsel-Corporate (since March 2002) of the Manager; General Counsel of the Distributor (since December 2001); General Counsel of Centennial Asset Management Corporation (since December 2001); Senior Vice President and General Counsel of HarbourView Asset Management Corporation (since December 2001); Secretary and General Counsel of OAC (since November 2001); Assistant Secretary (since September 1997) and Director (since November 2001) of OppenheimerFunds International Ltd. and OppenheimerFunds plc; Vice President and Director of Oppenheimer Partnership Holdings, Inc. (since December 2002); Director of Oppenheimer Real Asset Management, Inc. (since November 2001); Senior Vice President, General Counsel and Director of Shareholder Financial Services, Inc. and Shareholder Services, Inc. (since December 2001); Senior Vice President, General Counsel and Director of OFI Private Investments, Inc. and OFI Trust Company (since November 2001); Vice President of OppenheimerFunds Legacy Program (since June 2003); Senior Vice President and General Counsel of OFI Institutional Asset Management, Inc. (since November 2001). An officer of 96 portfolios in the OppenheimerFunds complex. |
The Fund’s Statement of Additional Information contains additional information about the Fund’s Trustees and Officers and is available without charge upon request, by calling 1.800.525.7048.
64 | ACTIVE ALLOCATION FUND
ACTIVE ALLOCATION FUND
A Series of Oppenheimer Portfolio Series
| | | |
|
Manager | | OppenheimerFunds, Inc. |
| | | |
Distributor | | OppenheimerFunds Distributor, Inc. |
| | | |
Transfer and Shareholder Servicing Agent | | OppenheimerFunds Services |
| | | |
Independent Registered Public Accounting Firm | | KPMG LLP |
| | | |
Legal Counsel | | Kramer Levin Naftalis & Frankel LLP |
©2011 OppenheimerFunds, Inc. All rights reserved.
65 | ACTIVE ALLOCATION FUND
PRIVACY POLICY NOTICE
As an Oppenheimer fund shareholder, you are entitled to know how we protect your personal information and how we limit its disclosure.
Information Sources
We obtain nonpublic personal information about our shareholders from the following sources:
| • | | Applications or other forms |
| |
| • | | When you create a user ID and password for online account access |
| |
| • | | When you enroll in eDocs Direct, our electronic document delivery service |
| |
| • | | Your transactions with us, our affiliates or others |
| |
| • | | A software program on our website, often referred to as a “cookie,” which indicates which parts of our site you’ve visited |
| |
| • | | When you set up challenge questions to reset your password online |
If you visit www.oppenheimerfunds.com and do not log on to the secure account information areas, we do not obtain any personal information about you. When you do log on to a secure area, we do obtain your user ID and password to identify you. We also use this information to provide you with products and services you have requested, to inform you about products and services that you may be interested in and assist you in other ways.
We do not collect personal information through our website unless you willingly provide it to us, either directly by email or in those areas of the website that request information. In order to update your personal information (including your mailing address, email address and phone number) you must first log on and visit your user profile.
If you have set your browser to warn you before accepting cookies, you will receive the warning message with each cookie. You can refuse cookies by turning them off in your browser. However, doing so may limit your access to certain sections of our website.
We use cookies to help us improve and manage our website. For example, cookies help us recognize new versus repeat visitors to the site, track the pages visited, and enable some special features on the website. This data helps us provide a better service for our website visitors.
Protection of Information
We do not disclose any non-public personal information (such as names on a customer list) about current or former customers to anyone, except as permitted by law.
Disclosure of Information
We send your financial advisor (as designated by you) copies of confirmations, account statements and other documents reporting activity in your fund accounts. We may also use details about you and your investments to help us, our financial service affiliates, or firms that jointly market their financial products and services with ours, to better serve your investment needs or suggest financial services or educational material that may be of interest to you. If this requires us to provide you with an opportunity to “opt in” or “opt out” of such information sharing with a firm not affiliated with us, you will receive notification on how to do so, before any such sharing takes place.
Right of Refusal
We will not disclose your personal information to unaffiliated third parties (except as permitted by law), unless we first offer you a reasonable opportunity to refuse or “opt out” of such disclosure.
66 | ACTIVE ALLOCATION FUND
Internet Security and Encryption
In general, the email services provided by our website are encrypted and provide a secure and private means of communication with us. To protect your own privacy, confidential and/or personal information should only be communicated via email when you are advised that you are using a secure website.
As a security measure, we do not include personal or account information in non-secure emails, and we advise you not to send such information to us in non-secure emails. Instead, you may take advantage of the secure features of our website to encrypt your email correspondence. To do this, you will need to use a browser that supports Secure Sockets Layer (SSL) protocol.
We do not guarantee or warrant that any part of our website, including files available for download, are free of viruses or other harmful code. It is your responsibility to take appropriate precautions, such as use of an anti-virus software package, to protect your computer hardware and software.
| • | | All transactions, including redemptions, exchanges and purchases, are secured by SSL and 128-bit encryption. SSL is used to establish a secure connection between your PC and OppenheimerFunds’ server. It transmits information in an encrypted and scrambled format. |
| |
| • | | Encryption is achieved through an electronic scrambling technology that uses a “key” to code and then decode the data. Encryption acts like the cable converter box you may have on your television set. It scrambles data with a secret code so that no one can make sense of it while it is being transmitted. When the data reaches its destination, the same software unscrambles the data. |
| |
| • | | You can exit the secure area by either closing your browser, or for added security, you can use the Log Out button before you close your browser. |
Other Security Measures
We maintain physical, electronic and procedural safeguards to protect your personal account information. Our employees and agents have access to that information only so that they may offer you products or provide services, for example, when responding to your account questions.
How You Can Help
You can also do your part to keep your account information private and to prevent unauthorized transactions. If you obtain a user ID and password for your account, do not allow it to be used by any-one else. Also, take special precautions when accessing your account on a computer used by others.
Who We Are
This joint notice describes the privacy policies of the Oppenheimer funds, OppenheimerFunds Distributor, Inc., the trustee of OppenheimerFunds Individual Retirement Accounts (IRAs) and the custodian of the OppenheimerFunds 403(b)(7) tax sheltered custodial accounts. It applies to all Oppenheimer fund accounts you presently have, or may open in the future, using your Social Security number—whether or not you remain a shareholder of our funds. This notice was last updated January 16, 2004. In the event it is updated or changed, we will post an updated notice on our website at www.oppenheimerfunds.com. If you have any questions about these privacy policies, write to us at P.O. Box 5270, Denver, CO 80217-5270, email us by clicking on the Contact Us section of our website at www.oppenheimerfunds.com or call us at 1.800.525.7048.
67 | ACTIVE ALLOCATION FUND
| January 31, 2011 Equity Management Commentary Investor Fund and A Series of Oppenheimer Portfolio Series Annual Report M A N A G E M E N T C O M M E N TA R Y Market Recap A N N U A L R E P O RT Listing of Top Holdings Fund Performance Discussion Listing of Investments Financial Statements |
TOP HOLDINGS AND ALLOCATIONS
Asset Class Allocation
Portfolio holdings and allocations are subject to change. Percentages are as of January 31, 2011, and are based on the total market value of investments.
6 | EQUITY INVESTOR FUND
FUND PERFORMANCE DISCUSSION
How has the Fund performed? Below is a discussion by OppenheimerFunds, Inc. of the Fund’s performance during its fiscal year ended January 31, 2011, followed by a graphical comparison of the Fund’s performance to appropriate broad-based market indices.
Management’s Discussion of Fund Performance. During the reporting period, the Fund’s Class A shares (without sales charge) returned 22.76%. In comparison, the S&P 500 Index and the MSCI World Index returned 22.20% and 19.22%, respectively, during the same period. The Fund produced strong results in a period where domestic and global equities generally rallied.
At period end, the Fund had approximately 54% of its assets allocated to domestic equity underlying funds. Approximately 47% of the Fund’s assets were allocated to its two largest domestic equity holdings, Oppenheimer Value Fund’s Class Y shares and Oppenheimer Capital Appreciation Fund’s Class Y shares. These underlying domestic equity funds produced double-digit absolute returns, as domestic equities generally rallied during the period. Oppenheimer Value Fund’s Class Y shares outperformed both the S&P 500 Index as well as its own benchmark, the Russell 1000 Value Index, which returned 21.54% during the period. While producing solid absolute returns, Oppenheimer Capital Appreciation Fund’s Class Y shares underperformed the S&P 500 Index as well as its benchmark, the Russell 1000 Growth Index, which returned 25.14%. This underlying fund underperformed largely as a result of weaker relative stock selection within the materials, financials and consumer discretionary sectors. During the reporting period, the Fund’s exposure to Oppenheimer Main Street Small- & Mid-Cap Fund’s Class Y shares contributed positively to results. This underlying fund performed well on an absolute basis, but underperformed the 31.36% return of its benchmark, the Russell 2000 Index. Within this underlying fund’s investment universe, more speculative stocks generally outperformed higher-quality stocks in which this underlying fund typically invests, resulting in its relative underperformance. This underlying fund accounted for roughly 8% of the Fund’s assets at period end.
The Fund’s approximate 46% allocation to global equity funds also significantly added to Fund performance. The Fund’s largest allocation within this space was to Oppenheimer International Growth Fund’s Class Y shares, a position we established in June 2010, which accounted for approximately 24% of the Fund’s assets at period end. This underlying fund outperformed its own benchmark, the MSCI EAFE Index, as well as the S&P 500 Index during the time it was held by the Fund. Oppenheimer Quest International Value Fund, another new position we established in June 2010 and the Fund’s second largest global equity holding at period end with an allocation of approximately 12% of the Fund’s assets, also outperformed the S&P 500 Index during the time it was held by the Fund and performed in line with the MSCI EAFE Index. The timing of these newly established
7 | EQUITY INVESTOR FUND
FUND PERFORMANCE DISCUSSION
positions worked to the Fund’s advantage as the performance of European stocks, and other global regions in which these underlying funds invest, generally outperformed relative to the S&P 500 Index. The Fund’s approximate 7% position in Oppenheimer Developing Markets Fund’s Class Y shares also was a positive contributor to performance. This underlying fund substantially outperformed the S&P 500 Index for the period as well as its own benchmark, the MSCI Emerging Markets Index, which returned 22.81%. During the period, emerging market equities continued to enjoy a strong run up in prices.
Allocations to Oppenheimer Global Fund, Oppenheimer Global Opportunities Fund, Oppenheimer Main Street Fund and Oppenheimer Main Street Select Fund (formerly Oppenheimer Main Street Opportunity Fund) were eliminated in June 2010 in an attempt to reduce overlap with some of our other underlying holdings. During the four months of the reporting period that they were held by the Fund, these underlying funds detracted from overall Fund performance, as the first portion of the reporting period was a turbulent one for most equity classes, due to market pessimism over the European sovereign debt crisis.
Comparing the Fund’s Performance to the Market. The graphs that follow show the performance of a hypothetical $10,000 investment in each Class of shares of the Fund held from inception of the Classes on April 5, 2005 until January 31, 2011. The Fund’s performance reflects the deduction of the maximum initial sales charge on Class A shares, the applicable contingent deferred sales charge on Class B, Class C and Class N shares, and reinvestments of all dividends and capital gains distributions. Past performance cannot guarantee future results.
The Fund’s performance is compared to the performance of the S&P 500 Index and the MSCI World IndexSM. The S&P 500 Index is an unmanaged index of equity securities that is a measure of the general domestic stock market. The MSCI World Index is an unmanaged index of issuers listed on the stock exchanges of a select number of foreign countries and the U.S. Index performance reflects the reinvestment of income but does not consider the effect of transaction costs, and none of the data in the graphs shows the effect of taxes. The Fund’s performance reflects the effects of the Fund’s business and operating expenses. While index comparisons may be useful to provide a benchmark for the Fund’s performance, it must be noted that the Fund’s investments are not limited to the investments comprising the indices.
8 | EQUITY INVESTOR FUND
Class A Shares
Comparison of Change in Value of $10,000 Hypothetical Investments in:
The performance data quoted represents past performance, which does not guarantee future results. The investment return and principal value of an investment in the Fund will fluctuate so that an investor’s shares, when redeemed, may be worth more or less than their original cost. Current performance may be lower or higher than the performance quoted. For performance data current to the most recent month end, visit us at www.oppenheimerfunds.com, or call us at 1.800.525.7048. Fund returns include changes in share price, reinvested distributions, and the applicable sales charge: for Class A shares, the current maximum initial sales charge of 5.75%; for Class B shares, the contingent deferred sales charge of 5% (1-year) and 2% (5-year); and for Class C and N shares, the 1% contingent deferred sales charge for the 1-year period. There is no sales charge for Class Y shares. See page 14 for further information.
9 | EQUITY INVESTOR FUND
FUND PERFORMANCE DISCUSSION
Class B Shares
Comparison of Change in Value of $10,000 Hypothetical Investments in:
10 | EQUITY INVESTOR FUND
Class C Shares
Comparison of Change in Value of $10,000 Hypothetical Investments in:
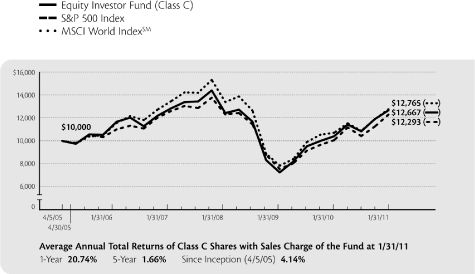
The performance data quoted represents past performance, which does not guarantee future results. The investment return and principal value of an investment in the Fund will fluctuate so that an investor’s shares, when redeemed, may be worth more or less than their original cost. Current performance may be lower or higher than the performance quoted. For performance data current to the most recent month end, visit us at www.oppenheimerfunds.com, or call us at 1.800.525.7048. Fund returns include changes in share price, reinvested distributions, and the applicable sales charge: for Class A shares, the current maximum initial sales charge of 5.75%; for Class B shares, the contingent deferred sales charge of 5% (1-year) and 2% (5-year); and for Class C and N shares, the 1% contingent deferred sales charge for the 1-year period. There is no sales charge for Class Y shares. See page 14 for further information.
11 | EQUITY INVESTOR FUND
FUND PERFORMANCE DISCUSSION
Class N Shares
Comparison of Change in Value of $10,000 Hypothetical Investments in:
12 | EQUITY INVESTOR FUND
Class Y Shares
Comparison of Change in Value of $10,000 Hypothetical Investments in:
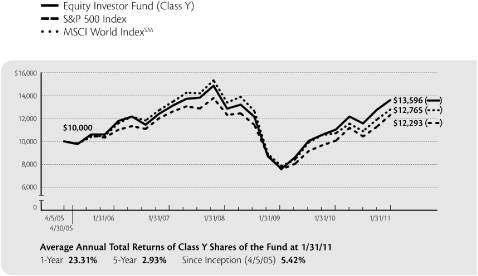
The performance data quoted represents past performance, which does not guarantee future results. The investment return and principal value of an investment in the Fund will fluctuate so that an investor’s shares, when redeemed, may be worth more or less than their original cost. Current performance may be lower or higher than the performance quoted. For performance data current to the most recent month end, visit us at www.oppenheimerfunds.com, or call us at 1.800.525.7048. Fund returns include changes in share price, reinvested distributions, and the applicable sales charge: for Class A shares, the current maximum initial sales charge of 5.75%; for Class B shares, the contingent deferred sales charge of 5% (1-year) and 2% (5-year); and for Class C and N shares, the 1% contingent deferred sales charge for the 1-year period. There is no sales charge for Class Y shares. See page 14 for further information.
13 | EQUITY INVESTOR FUND
NOTES
Total returns and the ending account values in the graphs include changes in share price and reinvestment of dividends and capital gains distributions in a hypothetical investment for the periods shown. The Fund’s total returns shown do not reflect the deduction of income taxes on an individual’s investment. Taxes may reduce your actual investment returns on income or gains paid by the Fund or any gains you may realize if you sell your shares.
Investors should consider the Fund’s investment objectives, risks, expenses and other charges carefully before investing. The Fund’s prospectus and, if available, the Fund’s summary prospectus contain this and other information about the Fund, and may be obtained by asking your financial advisor, calling us at 1.800.525.7048 or visiting our website at www.oppenheimerfunds.com. Read the prospectus and, if available, the summary prospectus carefully before investing.
The Fund’s investment strategy and focus can change over time. The mention of specific fund holdings does not constitute a recommendation by OppenheimerFunds, Inc.
Class A shares of the Fund were first publicly offered on 4/5/05. Unless otherwise noted, Class A returns include the maximum initial sales charge of 5.75%.
Class B shares of the Fund were first publicly offered on 4/5/05. Unless otherwise noted, Class B returns include the applicable contingent deferred sales charge of 5% (1-year) and 2% (5-year). Class B shares are subject to an annual 0.75% asset-based sales charge.
Class C shares of the Fund were first publicly offered on 4/5/05. Unless otherwise noted, Class C returns include the contingent deferred sales charge of 1% for the 1-year period. Class C shares are subject to an annual 0.75% asset-based sales charge.
Class N shares of the Fund were first publicly offered on 4/5/05. Class N shares are offered only through retirement plans. Unless otherwise noted, Class N returns include the contingent deferred sales charge of 1% for the 1-year period. Class N shares are subject to an annual 0.25% asset-based sales charge.
Class Y shares of the Fund were first publicly offered on 4/5/05. Class Y shares are offered only to fee-based clients of dealers that have a special agreement with the Distributor, to certain institutional investors under a special agreement with the Distributor, and to present or former officers, directors, trustees or employees (and their eligible family members) of the Fund, the Manager, its affiliates, its parent company and the subsidiaries of its parent company, and retirement plans established for the benefit of such individuals.
An explanation of the calculation of performance is in the Fund’s Statement of Additional Information.
14 | EQUITY INVESTOR FUND
FUND EXPENSES
Fund Expenses. As a shareholder of the Fund, you incur two types of costs: (1) transaction costs, which may include sales charges (loads) on purchase payments, contingent deferred sales charges on redemptions; and (2) ongoing costs, including distribution and service fees; and other Fund expenses. These examples are intended to help you understand your ongoing costs (in dollars) of investing in the Fund and to compare these costs with the ongoing costs of investing in other mutual funds.
The examples are based on an investment of $1,000.00 invested at the beginning of the period and held for the entire 6-month period ended January 31, 2011.
Actual Expenses. The first section of the table provides information about actual account values and actual expenses. You may use the information in this section for the class of shares you hold, together with the amount you invested, to estimate the expense that you paid over the period. Simply divide your account value by $1,000.00 (for example, an $8,600.00 account value divided by $1,000.00 = 8.60), then multiply the result by the number in the first section under the heading entitled “Expenses Paid During Period” to estimate the expenses you paid on your account during this period.
Hypothetical Example for Comparison Purposes. The second section of the table provides information about hypothetical account values and hypothetical expenses based on the Fund’s actual expense ratio for each class of shares, and an assumed rate of return of 5% per year for each class before expenses, which is not the actual return. The hypothetical account values and expenses may not be used to estimate the actual ending account balance or expenses you paid for the period. You may use this information to compare the ongoing costs of investing in the Fund and other funds. To do so, compare this 5% hypothetical example for the class of shares you hold with the 5% hypothetical examples that appear in the shareholder reports of the other funds.
Please note that the expenses shown in the table are meant to highlight your ongoing costs only and do not reflect any transactional costs, such as front-end or contingent deferred sales charges (loads), or a $12.00 fee imposed annually on accounts valued at less than $500.00 (subject to exceptions described in the Statement of Additional Information). Therefore, the “hypothetical” section of the table is useful in comparing ongoing costs only, and will not help you determine the relative total costs of owning different funds. In addition, if these transactional costs were included, your costs would have been higher.
15 | EQUITY INVESTOR FUND
FUND EXPENSES Continued
| | | | | | | | | | | | | |
| | | Beginning | | Ending | | Expenses |
| | | Account | | Account | | Paid During |
| | | Value | | Value | | 6 Months Ended |
| | | August 1, 2010 | | January 31, 2011 | | January 31, 2011 |
| |
| Actual | | | | | | |
| Class A | | $ | 1,000.00 | | | $ | 1,174.80 | | | $ | 2.80 | |
| Class B | | | 1,000.00 | | | | 1,168.10 | | | | 7.40 | |
| Class C | | | 1,000.00 | | | | 1,169.20 | | | | 6.85 | |
| Class N | | | 1,000.00 | | | | 1,172.30 | | | | 3.78 | |
| Class Y | | | 1,000.00 | | | | 1,176.60 | | | | 0.44 | |
| |
Hypothetical
(5% return before expenses) | | | | | | | | | | | | |
| |
| Class A | | | 1,000.00 | | | | 1,022.63 | | | | 2.60 | |
| Class B | | | 1,000.00 | | | | 1,018.40 | | | | 6.89 | |
| Class C | | | 1,000.00 | | | | 1,018.90 | | | | 6.38 | |
| Class N | | | 1,000.00 | | | | 1,021.73 | | | | 3.52 | |
| Class Y | | | 1,000.00 | | | | 1,024.80 | | | | 0.41 | |
Expenses are equal to the Fund’s annualized expense ratio for that class, multiplied by the average account value over the period, multiplied by 184/365 (to reflect the one-half year period). Those annualized expense ratios, excluding the indirect expenses incurred through the Fund’s investments in the underlying funds, based on the 6-month period ended January 31, 2011 are as follows:
| | | | | |
| Class | | Expense Ratios |
| |
| Class A | | | 0.51 | % |
| Class B | | | 1.35 | |
| Class C | | | 1.25 | |
| Class N | | | 0.69 | |
| Class Y | | | 0.08 | |
16 | EQUITY INVESTOR FUND
STATEMENT OF INVESTMENTS January 31, 2011
| | | | | | | | | |
| | | Shares | | | Value | |
| |
Investment Companies—100.1%1 | | | | | | | | |
Global Equity Funds—45.7% | | | | | | | | |
| Oppenheimer Developing Markets Fund, Cl. Y | | | 1,370,825 | | | $ | 46,827,374 | |
| Oppenheimer International Growth Fund, Cl. Y | | | 5,912,909 | | | | 166,211,873 | |
| Oppenheimer International Small Company Fund, Cl. Y | | | 742,074 | | | | 17,357,104 | |
| Oppenheimer Quest International Value Fund, Cl. Y | | | 4,736,562 | | | | 80,284,723 | |
| | | | | | | | |
| | | | | | | | 310,681,074 | |
| | | | | | | | | |
U.S. Equity Funds—54.4% | | | | | | | | |
Oppenheimer Capital Appreciation Fund, Cl. Y2 | | | 2,844,629 | | | | 131,080,516 | |
| Oppenheimer Main Street Small- & Mid-Cap Fund, Cl. Y | | | 2,414,831 | | | | 52,208,655 | |
| Oppenheimer Value Fund, Cl. Y | | | 8,176,152 | | | | 186,334,507 | |
| | | | | | | | |
| | | | | | | | 369,623,678 | |
| | | | | | | | | |
Total Investments, at Value (Cost $587,198,508) | | | 100.1 | % | | | 680,304,752 | |
Liabilities in Excess of Other Assets | | | (0.1 | ) | | | (360,221 | ) |
| | | |
| |
Net Assets | | | 100.0 | % | | $ | 679,944,531 | |
| | | |
Footnotes to Statement of Investments
1. Is or was an affiliate, as defined in the Investment Company Act of 1940, at or during the period ended January 31, 2011, by virtue of the Fund owning at least 5% of the voting securities of the issuer or as a result of the Fund and the issuer having the same investment adviser. Transactions during the period in which the issuer was an affiliate are as follows:
| | | | | | | | | | | | | | | | | |
| | | Shares | | | | | | | | | | | Shares | |
| | | January 31, | | | Gross | | | Gross | | | January 31, | |
| | | 2010 | | | Additions | | | Reductions | | | 2011 | |
| |
| Oppenheimer Capital Appreciation Fund, Cl. Y | | | 2,749,314 | | | | 254,364 | | | | 159,049 | | | | 2,844,629 | |
| Oppenheimer Developing Markets Fund, Cl. Y | | | 2,064,082 | | | | 111,205 | | | | 804,462 | | | | 1,370,825 | |
| Oppenheimer Global Fund, Cl. Y | | | 2,127,522 | | | | 57,677 | | | | 2,185,199 | | | | — | |
| Oppenheimer Global Opportunities Fund, Cl. Y | | | 1,172,488 | | | | 28,344 | | | | 1,200,832 | | | | — | |
| Oppenheimer Institutional Money Market Fund, Cl. E | | | 284,387 | | | | 26,614,455 | | | | 26,898,842 | | | | — | |
| Oppenheimer International Growth Fund, Cl. Y | | | — | | | | 6,150,199 | | | | 237,290 | | | | 5,912,909 | |
| Oppenheimer International Small Company Fund, Cl. Y | | | — | | | | 768,113 | | | | 26,039 | | | | 742,074 | |
| Oppenheimer Main Street Fund, Cl. Y | | | 2,997,887 | | | | 81,336 | | | | 3,079,223 | | | | — | |
| Oppenheimer Main Street Select Fund, Cl. Y (formerly Oppenheimer Main Street Opportunity Fund, Cl. Y) | | | 2,547,450 | | | | 68,606 | | | | 2,616,056 | | | | — | |
| Oppenheimer Main Street Small- & Mid-Cap Fund, Cl. Y (formerly Oppenheimer Main Street Small Cap Fund, Cl. Y) | | | 3,223,098 | | | | 189,718 | | | | 997,985 | | | | 2,414,831 | |
| Oppenheimer Quest International Value Fund, Cl. Y | | | — | | | | 4,923,199 | | | | 186,637 | | | | 4,736,562 | |
| Oppenheimer Value Fund, Cl. Y | | | 4,286,846 | | | | 4,289,481 | | | | 400,175 | | | | 8,176,152 | |
17 | EQUITY INVESTOR FUND
STATEMENT OF INVESTMENTS Continued
Footnotes to Statement of Investments Continued
| | | | | | | | | | | | | |
| | | | | | | | | | | Realized |
| | | Value | | | Income | | | Gain (Loss) |
| |
| Oppenheimer Capital Appreciation Fund, Cl. Y | | $ | 131,080,516 | | | $ | — | | | $ | (1,718,725 | ) |
| Oppenheimer Developing Markets Fund, Cl. Y | | | 46,827,374 | | | | 195,704 | | | | (5,657,080 | ) |
| Oppenheimer Global Fund, Cl. Y | | | — | | | | — | | | | (24,548,757 | ) |
| Oppenheimer Global Opportunities Fund, Cl. Y | | | — | | | | — | | | | (1,792,647 | ) |
| Oppenheimer Institutional Money Market Fund, Cl. E | | | — | | | | 1,279 | | | | — | |
| Oppenheimer International Growth Fund, Cl. Y | | | 166,211,873 | | | | 1,609,196 | | | | 40,435 | |
| Oppenheimer International Small Company Fund, Cl. Y | | | 17,357,104 | | | | 1,527,072 | | | | 6,528 | |
| Oppenheimer Main Street Fund, Cl. Y | | | — | | | | — | | | | (22,588,116 | ) |
| Oppenheimer Main Street Select Fund, Cl. Y (formerly Oppenheimer Main Street Opportunity Fund, Cl. Y) | | | — | | | | — | | | | (2,246,728 | ) |
| Oppenheimer Main Street Small- & Mid-Cap Fund, Cl. Y (formerly Oppenheimer Main Street Small Cap Fund, Cl. Y) | | | 52,208,655 | | | | 180,877 | | | | (5,428,032 | ) |
| Oppenheimer Quest International Value Fund, Cl. Y | | | 80,284,723 | | | | 2,162,918 | | | | 15,274 | |
| Oppenheimer Value Fund, Cl. Y | | | 186,334,507 | | | | 2,028,971 | | | | (3,318,042 | ) |
| | | |
| | | $ | 680,304,752 | | | $ | 7,706,017 | | | $ | (67,235,890 | ) |
| | | |
2. Non-income producing security.
Valuation Inputs
Various data inputs are used in determining the value of each of the Fund’s investments as of the reporting period end. These data inputs are categorized in the following hierarchy under applicable financial accounting standards:
| | 1) | | Level 1—unadjusted quoted prices in active markets for identical assets or liabilities (including securities actively traded on a securities exchange) |
| |
| | 2) | | Level 2—inputs other than unadjusted quoted prices that are observable for the asset or liability (such as unadjusted quoted prices for similar assets and market corroborated inputs such as interest rates, prepayment speeds, credit risks, etc.) |
| |
| | 3) | | Level 3—significant unobservable inputs (including the Manager’s own judgments about assumptions that market participants would use in pricing the asset or liability). |
The table below categorizes amounts that are included in the Fund’s Statement of Assets and Liabilities as of January 31, 2011 based on valuation input level:
| | | | | | | | | | | | | | | | | |
| | | | | | | | | | | Level 3– | | | | |
| | | Level 1– | | | Level 2– | | | Significant | | | | |
| | | Unadjusted | | | Other Significant | | | Unobservable | | | | |
| | | Quoted Prices | | | Observable Inputs | | | Inputs | | | Value | |
| |
Assets Table | | | | | | | | | | | | | | | | |
Investments, at Value: | | | | | | | | | | | | | | | | |
| Investment Companies | | $ | 680,304,752 | | | $ | — | | | $ | — | | | $ | 680,304,752 | |
| | | |
| Total Assets | | $ | 680,304,752 | | | $ | — | | | $ | — | | | $ | 680,304,752 | |
| | | |
Currency contracts and forwards, if any, are reported at their unrealized appreciation/depreciation at measurement date, which represents the change in the contract’s value from trade date. Futures, if any, are reported at their variation margin at measurement date, which represents the amount due to/from the Fund at that date. All additional assets and liabilities included in the above table are reported at their market value at measurement date.
See the accompanying Notes for further discussion of the methods used in determining value of the Fund’s investments, and a summary of changes to the valuation methodologies, if any, during the reporting period.
See accompanying Notes to Financial Statements.
18 | EQUITY INVESTOR FUND
STATEMENT OF ASSETS AND LIABILITIES January 31, 2011
| | | | | |
|
Assets | | | | |
| Investments, at value—see accompanying statement of investments—affiliated companies (cost $587,198,508) | | $ | 680,304,752 | |
| Cash | | | 565,993 | |
| Receivables and other assets: | | | | |
| Shares of beneficial interest sold | | | 628,685 | |
| Other | | | 26,219 | |
| | | | |
| Total assets | | | 681,525,649 | |
| | | | | |
Liabilities | | | | |
| |
| Payables and other liabilities: | | | | |
| Shares of beneficial interest redeemed | | | 1,166,894 | |
| Distribution and service plan fees | | | 143,158 | |
| Transfer and shareholder servicing agent fees | | | 110,512 | |
| Shareholder communications | | | 68,248 | |
| Trustees’ compensation | | | 39,593 | |
| Investments purchased | | | 9,367 | |
| Other | | | 43,346 | |
| | | | |
| Total liabilities | | | 1,581,118 | |
| | | | | |
Net Assets | | $ | 679,944,531 | |
| | | | |
| | | | | |
Composition of Net Assets | | | | |
| Par value of shares of beneficial interest | | $ | 61,393 | |
| Additional paid-in capital | | | 692,222,774 | |
| Accumulated net investment income | | | 2,832,437 | |
| Accumulated net realized loss on investments | | | (108,278,317 | ) |
| Net unrealized appreciation on investments | | | 93,106,244 | |
| | | | |
Net Assets | | $ | 679,944,531 | |
| | | | |
19 | EQUITY INVESTOR FUND
STATEMENT OF ASSETS AND LIABILITIES Continued
| | | | | |
|
Net Asset Value Per Share | | | | |
| Class A Shares: | | | | |
| Net asset value and redemption price per share (based on net assets of $352,321,058 and 31,552,121 shares of beneficial interest outstanding) | | $ | 11.17 | |
| Maximum offering price per share (net asset value plus sales charge of 5.75% of offering price) | | $ | 11.85 | |
| Class B Shares: | | | | |
| Net asset value, redemption price (excludes applicable contingent deferred sales charge) and offering price per share (based on net assets of $92,952,566 and 8,516,566 shares of beneficial interest outstanding) | | $ | 10.91 | |
| Class C Shares: | | | | |
| Net asset value, redemption price (excludes applicable contingent deferred sales charge) and offering price per share (based on net assets of $144,758,853 and 13,256,178 shares of beneficial interest outstanding) | | $ | 10.92 | |
| Class N Shares: | | | | |
| Net asset value, redemption price (excludes applicable contingent deferred sales charge) and offering price per share (based on net assets of $75,332,722 and 6,767,805 shares of beneficial interest outstanding) | | $ | 11.13 | |
| Class Y Shares: | | | | |
| Net asset value, redemption price and offering price per share (based on net assets of $14,579,332 and 1,300,473 shares of beneficial interest outstanding) | | $ | 11.21 | |
See accompanying Notes to Financial Statements.
20 | EQUITY INVESTOR FUND
STATEMENT OF OPERATIONS For the Year Ended January 31, 2011
| | | | | |
|
Investment Income | | | | |
| Dividends from affiliated companies | | $ | 7,706,017 | |
| Interest | | | 424 | |
| Other income | | | 18,030 | |
| | | | |
| Total investment income | | | 7,724,471 | |
| | | | | |
Expenses | | | | |
| Distribution and service plan fees: | | | | |
| Class A | | | 778,167 | |
| Class B | | | 833,587 | |
| Class C | | | 1,296,549 | |
| Class N | | | 339,996 | |
| Transfer and shareholder servicing agent fees: | | | | |
| Class A | | | 698,326 | |
| Class B | | | 250,752 | |
| Class C | | | 296,017 | |
| Class N | | | 118,946 | |
| Class Y | | | 4,132 | |
| Shareholder communications: | | | | |
| Class A | | | 79,395 | |
| Class B | | | 32,094 | |
| Class C | | | 28,877 | |
| Class N | | | 4,733 | |
| Class Y | | | 100 | |
| Trustees’ compensation | | | 10,036 | |
| Custodian fees and expenses | | | 4,808 | |
| Administration service fees | | | 1,500 | |
| Other | | | 73,950 | |
| | | | |
| Total expenses | | | 4,851,965 | |
| | | | | |
Net Investment Income | | | 2,872,506 | |
| | | | | |
Realized and Unrealized Gain (Loss) | | | | |
| Net realized loss on investments from affiliated companies | | | (67,235,890 | ) |
| Net change in unrealized appreciation/depreciation on investments | | | 187,321,500 | |
| | | | | |
Net Increase in Net Assets Resulting from Operations | | $ | 122,958,116 | |
| | | | |
See accompanying Notes to Financial Statements.
21 | EQUITY INVESTOR FUND
STATEMENTS OF CHANGES IN NET ASSETS
| | | | | | | | | |
| Year Ended January 31, | | 2011 | | | 2010 | |
| |
Operations | | | | | | | | |
| Net investment income | | $ | 2,872,506 | | | $ | 989,416 | |
| Net realized loss | | | (67,235,890 | ) | | | (31,192,099 | ) |
| Net change in unrealized appreciation/depreciation | | | 187,321,500 | | | | 189,841,524 | |
| | | |
| Net increase in net assets resulting from operations | | | 122,958,116 | | | | 159,638,841 | |
| | | | | | | | | |
Dividends and/or Distributions to Shareholders | | | | | | | | |
| Dividends from net investment income: | | | | | | | | |
| Class A | | | (803,852 | ) | | | (1,415,394 | ) |
| Class B | | | — | | | | — | |
| Class C | | | — | | | | — | |
| Class N | | | (46,017 | ) | | | (197,717 | ) |
| Class Y | | | (91,918 | ) | | | (38,688 | ) |
| | | |
| | | | (941,787 | ) | | | (1,651,799 | ) |
| Distributions from net realized gain: | | | | | | | | |
| Class A | | | — | | | | (5,254,584 | ) |
| Class B | | | — | | | | (1,446,173 | ) |
| Class C | | | — | | | | (2,231,372 | ) |
| Class N | | | — | | | | (1,096,397 | ) |
| Class Y | | | — | | | | (77,561 | ) |
| | | |
| | | | — | | | | (10,106,087 | ) |
| | | | | | | | | |
Beneficial Interest Transactions | | | | | | | | |
| Net increase (decrease) in net assets resulting from beneficial interest transactions: | | | | | | | | |
| Class A | | | 1,855,158 | | | | 29,701,827 | |
| Class B | | | (30,920 | ) | | | 4,104,962 | |
| Class C | | | 201,024 | | | | 8,628,643 | |
| Class N | | | 90,949 | | | | 4,842,644 | |
| Class Y | | | 8,167,950 | | | | 1,591,328 | |
| | | |
| | | | 10,284,161 | | | | 48,869,404 | |
| | | | | | | | | |
Net Assets | | | | | | | | |
| Total increase | | | 132,300,490 | | | | 196,750,359 | |
| Beginning of period | | | 547,644,041 | | | | 350,893,682 | |
| | | |
| |
| End of period (including accumulated net investment income of $2,832,437 and $901,465, respectively) | | $ | 679,944,531 | | | $ | 547,644,041 | |
| | | |
See accompanying Notes to Financial Statements.
22 | EQUITY INVESTOR FUND
FINANCIAL HIGHLIGHTS
| | | | | | | | | | | | | | | | | | | | | |
| Class A Year Ended January 31, | | 2011 | | | 2010 | | | 2009 | | | 2008 | | | 2007 | |
| |
Per Share Operating Data | | | | | | | | | | | | | | | | | | | | |
| Net asset value, beginning of period | | $ | 9.12 | | | $ | 6.46 | | | $ | 11.83 | | | $ | 12.63 | | | $ | 11.60 | |
| |
| Income (loss) from investment operations: | | | | | | | | | | | | | | | | | | | | |
Net investment income1 | | | .08 | | | | .04 | | | | .08 | | | | .38 | | | | .25 | |
| Net realized and unrealized gain (loss) | | | 2.00 | | | | 2.84 | | | | (4.91 | ) | | | (.65 | ) | | | 1.00 | |
| | | |
| Total from investment operations | | | 2.08 | | | | 2.88 | | | | (4.83 | ) | | | (.27 | ) | | | 1.25 | |
| |
| Dividends and/or distributions to shareholders: | | | | | | | | | | | | | | | | | | | | |
| Dividends from net investment income | | | (.03 | ) | | | (.05 | ) | | | (.03 | ) | | | (.33 | ) | | | (.18 | ) |
| Distributions from net realized gain | | | — | | | | (.17 | ) | | | (.51 | ) | | | (.20 | ) | | | (.04 | ) |
| | | |
| Total dividends and distributions to shareholders | | | (.03 | ) | | | (.22 | ) | | | (.54 | ) | | | (.53 | ) | | | (.22 | ) |
| |
| | | | | | | | | | | | | | | | | | | | | |
| Net asset value, end of period | | $ | 11.17 | | | $ | 9.12 | | | $ | 6.46 | | | $ | 11.83 | | | $ | 12.63 | |
| | | |
| | | | | | | | | | | | | | | | | | | | | |
Total Return, at Net Asset Value2 | | | 22.76 | % | | | 44.42 | % | | | (41.14 | )% | | | (2.45 | )% | | | 10.85 | % |
| | | | | | | | | | | | | | | | | | | | | |
Ratios/Supplemental Data | | | | | | | | | | | | | | | | | | | | |
| Net assets, end of period (in thousands) | | $ | 352,321 | | | $ | 286,580 | | | $ | 180,042 | | | $ | 262,208 | | | $ | 173,539 | |
| |
| Average net assets (in thousands) | | $ | 314,559 | | | $ | 244,278 | | | $ | 245,247 | | | $ | 239,348 | | | $ | 109,318 | |
| |
Ratios to average net assets:3 | | | | | | | | | | | | | | | | | | | | |
| Net investment income | | | 0.76 | % | | | 0.52 | % | | | 0.77 | % | | | 2.87 | % | | | 2.07 | % |
Total expenses4 | | | 0.51 | % | | | 0.58 | % | | | 0.54 | % | | | 0.45 | % | | | 0.50 | % |
| Expenses after payments, waivers and/or reimbursements and reduction to custodian expenses | | | 0.51 | % | | | 0.58 | % | | | 0.54 | % | | | 0.45 | % | | | 0.50 | % |
| |
| Portfolio turnover rate | | | 54 | % | | | 11 | % | | | 5 | % | | | 2 | % | | | 2 | % |
| | |
| 1. | | Per share amounts calculated based on the average shares outstanding during the period. |
| |
| 2. | | Assumes an initial investment on the business day before the first day of the fiscal period, with all dividends and distributions reinvested in additional shares on the reinvestment date, and redemption at the net asset value calculated on the last business day of the fiscal period. Sales charges are not reflected in the total returns. Total returns are not annualized for periods less than one full year. Returns do not reflect the deduction of taxes that a shareholder would pay on fund distributions or the redemption of fund shares. |
| |
| 3. | | Annualized for periods less than one full year. |
| |
| 4. | | Total expenses including all underlying fund expenses were as follows: |
| | | | | |
|
| Year Ended January 31, 2011 | | | 1.26 | % |
| Year Ended January 31, 2010 | | | 1.30 | % |
| Year Ended January 31, 2009 | | | 1.18 | % |
| Year Ended January 31, 2008 | | | 1.08 | % |
| Year Ended January 31, 2007 | | | 1.15 | % |
See accompanying Notes to Financial Statements.
23 | EQUITY INVESTOR FUND
FINANCIAL HIGHLIGHTS Continued
| | | | | | | | | | | | | | | | | | | | | |
| Class B Year Ended January 31, | | 2011 | | | 2010 | | | 2009 | | | 2008 | | | 2007 | |
| |
Per Share Operating Data | | | | | | | | | | | | | | | | | | | | |
| Net asset value, beginning of period | | $ | 8.97 | | | $ | 6.38 | | | $ | 11.73 | | | $ | 12.54 | | | $ | 11.55 | |
| |
| Income (loss) from investment operations: | | | | | | | | | | | | | | | | | | | | |
Net investment income (loss)1 | | | (.01 | ) | | | (.03 | ) | | | (.01 | ) | | | .26 | | | | .14 | |
| Net realized and unrealized gain (loss) | | | 1.95 | | | | 2.79 | | | | (4.83 | ) | | | (.63 | ) | | | 1.01 | |
| | | |
| Total from investment operations | | | 1.94 | | | | 2.76 | | | | (4.84 | ) | | | (.37 | ) | | | 1.15 | |
| |
| Dividends and/or distributions to shareholders: | | | | | | | | | | | | | | | | | | | | |
| Dividends from net investment income | | | — | | | | — | | | | — | | | | (.24 | ) | | | (.12 | ) |
| Distributions from net realized gain | | | — | | | | (.17 | ) | | | (.51 | ) | | | (.20 | ) | | | (.04 | ) |
| | | |
| Total dividends and distributions to shareholders | | | — | | | | (.17 | ) | | | (.51 | ) | | | (.44 | ) | | | (.16 | ) |
| |
| | | | | | | | | | | | | | | | | | | | | |
| Net asset value, end of period | | $ | 10.91 | | | $ | 8.97 | | | $ | 6.38 | | | $ | 11.73 | | | $ | 12.54 | |
| | | |
| | | | | | | | | | | | | | | | | | | | | |
Total Return, at Net Asset Value2 | | | 21.63 | % | | | 43.19 | % | | | (41.58 | )% | | | (3.23 | )% | | | 9.97 | % |
| | | | | | | | | | | | | | | | | | | | | |
Ratios/Supplemental Data | | | | | | | | | | | | | | | | | | | | |
| Net assets, end of period (in thousands) | | $ | 92,953 | | | $ | 76,495 | | | $ | 51,358 | | | $ | 79,187 | | | $ | 59,406 | |
| |
| Average net assets (in thousands) | | $ | 83,498 | | | $ | 66,935 | | | $ | 71,695 | | | $ | 75,204 | | | $ | 38,569 | |
| |
Ratios to average net assets:3 | | | | | | | | | | | | | | | | | | | | |
| Net investment income (loss) | | | (0.08 | )% | | | (0.33 | )% | | | (0.07 | )% | | | 1.98 | % | | | 1.19 | % |
Total expenses4 | | | 1.35 | % | | | 1.45 | % | | | 1.36 | % | | | 1.25 | % | | | 1.31 | % |
| Expenses after payments, waivers and/or reimbursements and reduction to custodian expenses | | | 1.35 | % | | | 1.41 | % | | | 1.36 | % | | | 1.25 | % | | | 1.31 | % |
| |
| Portfolio turnover rate | | | 54 | % | | | 11 | % | | | 5 | % | | | 2 | % | | | 2 | % |
| | |
| 1. | | Per share amounts calculated based on the average shares outstanding during the period. |
| |
| 2. | | Assumes an initial investment on the business day before the first day of the fiscal period, with all dividends and distributions reinvested in additional shares on the reinvestment date, and redemption at the net asset value calculated on the last business day of the fiscal period. Sales charges are not reflected in the total returns. Total returns are not annualized for periods less than one full year. Returns do not reflect the deduction of taxes that a shareholder would pay on fund distributions or the redemption of fund shares. |
| |
| 3. | | Annualized for periods less than one full year. |
| |
| 4. | | Total expenses including all underlying fund expenses were as follows: |
| | | | | |
|
| Year Ended January 31, 2011 | | | 2.10 | % |
| Year Ended January 31, 2010 | | | 2.17 | % |
| Year Ended January 31, 2009 | | | 2.00 | % |
| Year Ended January 31, 2008 | | | 1.88 | % |
| Year Ended January 31, 2007 | | | 1.96 | % |
See accompanying Notes to Financial Statements.
24 | EQUITY INVESTOR FUND
| | | | | | | | | | | | | | | | | | | | | |
| Class C Year Ended January 31, | | 2011 | | | 2010 | | | 2009 | | | 2008 | | | 2007 | |
| |
Per Share Operating Data | | | | | | | | | | | | | | | | | | | | |
| Net asset value, beginning of period | | $ | 8.97 | | | $ | 6.37 | | | $ | 11.72 | | | $ | 12.53 | | | $ | 11.54 | |
| |
| Income (loss) from investment operations: | | | | | | | | | | | | | | | | | | | | |
Net investment income (loss)1 | | | — | 2 | | | (.02 | ) | | | — | 2 | | | .28 | | | | .14 | |
| Net realized and unrealized gain (loss) | | | 1.95 | | | | 2.79 | | | | (4.84 | ) | | | (.64 | ) | | | 1.01 | |
| | | |
| Total from investment operations | | | 1.95 | | | | 2.77 | | | | (4.84 | ) | | | (.36 | ) | | | 1.15 | |
| |
| Dividends and/or distributions to shareholders: | | | | | | | | | | | | | | | | | | | | |
| Dividends from net investment income | | | — | | | | — | | | | — | | | | (.25 | ) | | | (.12 | ) |
| Distributions from net realized gain | | | — | | | | (.17 | ) | | | (.51 | ) | | | (.20 | ) | | | (.04 | ) |
| | | |
| Total dividends and distributions to shareholders | | | — | | | | (.17 | ) | | | (.51 | ) | | | (.45 | ) | | | (.16 | ) |
| |
| | | | | | | | | | | | | | | | | | | | | |
| Net asset value, end of period | | $ | 10.92 | | | $ | 8.97 | | | $ | 6.37 | | | $ | 11.72 | | | $ | 12.53 | |
| | | |
| | | | | | | | | | | | | | | | | | | | | |
Total Return, at Net Asset Value3 | | | 21.74 | % | | | 43.41 | % | | | (41.62 | )% | | | (3.15 | )% | | | 10.00 | % |
| | | | | | | | | | | | | | | | | | | | | |
Ratios/Supplemental Data | | | | | | | | | | | | | | | | | | | | |
| Net assets, end of period (in thousands) | | $ | 144,759 | | | $ | 118,730 | | | $ | 77,667 | | | $ | 110,383 | | | $ | 70,691 | |
| |
| Average net assets (in thousands) | | $ | 129,727 | | | $ | 102,982 | | | $ | 103,851 | | | $ | 98,098 | | | $ | 45,312 | |
| |
Ratios to average net assets:4 | | | | | | | | | | | | | | | | | | | | |
| Net investment income (loss) | | | 0.00 | %5 | | | (0.26 | )% | | | 0.01 | % | | | 2.15 | % | | | 1.23 | % |
Total expenses6 | | | 1.26 | % | | | 1.35 | % | | | 1.31 | % | | | 1.23 | % | | | 1.29 | % |
| Expenses after payments, waivers and/or reimbursements and reduction to custodian expenses | | | 1.26 | % | | | 1.34 | % | | | 1.31 | % | | | 1.23 | % | | | 1.29 | % |
| |
| Portfolio turnover rate | | | 54 | % | | | 11 | % | | | 5 | % | | | 2 | % | | | 2 | % |
| | |
| 1. | | Per share amounts calculated based on the average shares outstanding during the period. |
| |
| 2. | | Less than $0.005 per share. |
| |
| 3. | | Assumes an initial investment on the business day before the first day of the fiscal period, with all dividends and distributions reinvested in additional shares on the reinvestment date, and redemption at the net asset value calculated on the last business day of the fiscal period. Sales charges are not reflected in the total returns. Total returns are not annualized for periods less than one full year. Returns do not reflect the deduction of taxes that a shareholder would pay on fund distributions or the redemption of fund shares. |
| |
| 4. | | Annualized for periods less than one full year. |
| |
| 5. | | Less than 0.005%. |
| |
| 6. | | Total expenses including all underlying fund expenses were as follows: |
| | | | | |
|
| Year Ended January 31, 2011 | | | 2.01 | % |
| Year Ended January 31, 2010 | | | 2.07 | % |
| Year Ended January 31, 2009 | | | 1.95 | % |
| Year Ended January 31, 2008 | | | 1.86 | % |
| Year Ended January 31, 2007 | | | 1.94 | % |
See accompanying Notes to Financial Statements.
25 | EQUITY INVESTOR FUND
FINANCIAL HIGHLIGHTS Continued
| | | | | | | | | | | | | | | | | | | | | |
| Class N Year Ended January 31, | | 2011 | | | 2010 | | | 2009 | | | 2008 | | | 2007 | |
| |
Per Share Operating Data | | | | | | | | | | | | | | | | | | | | |
| Net asset value, beginning of period | | $ | 9.09 | | | $ | 6.44 | | | $ | 11.80 | | | $ | 12.60 | | | $ | 11.59 | |
| |
| Income (loss) from investment operations: | | | | | | | | | | | | | | | | | | | | |
Net investment income1 | | | .06 | | | | .03 | | | | .06 | | | | .35 | | | | .29 | |
| Net realized and unrealized gain (loss) | | | 1.99 | | | | 2.82 | | | | (4.90 | ) | | | (.65 | ) | | | .94 | |
| | | |
| Total from investment operations | | | 2.05 | | | | 2.85 | | | | (4.84 | ) | | | (.30 | ) | | | 1.23 | |
| |
| Dividends and/or distributions to shareholders: | | | | | | | | | | | | | | | | | | | | |
| Dividends from net investment income | | | (.01 | ) | | | (.03 | ) | | | (.01 | ) | | | (.30 | ) | | | (.18 | ) |
| Distributions from net realized gain | | | — | | | | (.17 | ) | | | (.51 | ) | | | (.20 | ) | | | (.04 | ) |
| | | |
| Total dividends and distributions to shareholders | | | (.01 | ) | | | (.20 | ) | | | (.52 | ) | | | (.50 | ) | | | (.22 | ) |
| |
| | | | | | | | | | | | | | | | | | | | | |
| Net asset value, end of period | | $ | 11.13 | | | $ | 9.09 | | | $ | 6.44 | | | $ | 11.80 | | | $ | 12.60 | |
| | | |
| | | | | | | | | | | | | | | | | | | | | |
Total Return, at Net Asset Value2 | | | 22.52 | % | | | 44.18 | % | | | (41.30 | )% | | | (2.63 | )% | | | 10.67 | % |
| | | | | | | | | | | | | | | | | | | | | |
Ratios/Supplemental Data | | | | | | | | | | | | | | | | | | | | |
| Net assets, end of period (in thousands) | | $ | 75,333 | | | $ | 61,344 | | | $ | 39,757 | | | $ | 54,336 | | | $ | 35,652 | |
| |
| Average net assets (in thousands) | | $ | 68,038 | | | $ | 52,200 | | | $ | 52,669 | | | $ | 48,745 | | | $ | 18,874 | |
| |
Ratios to average net assets:3 | | | | | | | | | | | | | | | | | | | | |
| Net investment income | | | 0.57 | % | | | 0.31 | % | | | 0.59 | % | | | 2.67 | % | | | 2.47 | % |
Total expenses4 | | | 0.70 | % | | | 0.76 | % | | | 0.72 | % | | | 0.68 | % | | | 0.69 | % |
| Expenses after payments, waivers and/or reimbursements and reduction to custodian expenses | | | 0.70 | % | | | 0.76 | % | | | 0.72 | % | | | 0.68 | % | | | 0.69 | % |
| |
| Portfolio turnover rate | | | 54 | % | | | 11 | % | | | 5 | % | | | 2 | % | | | 2 | % |
| | |
| 1. | | Per share amounts calculated based on the average shares outstanding during the period. |
| |
| 2. | | Assumes an initial investment on the business day before the first day of the fiscal period, with all dividends and distributions reinvested in additional shares on the reinvestment date, and redemption at the net asset value calculated on the last business day of the fiscal period. Sales charges are not reflected in the total returns. Total returns are not annualized for periods less than one full year. Returns do not reflect the deduction of taxes that a shareholder would pay on fund distributions or the redemption of fund shares. |
| |
| 3. | | Annualized for periods less than one full year. |
| |
| 4. | | Total expenses including all underlying fund expenses were as follows: |
| | | | | |
|
| Year Ended January 31, 2011 | | | 1.45 | % |
| Year Ended January 31, 2010 | | | 1.48 | % |
| Year Ended January 31, 2009 | | | 1.36 | % |
| Year Ended January 31, 2008 | | | 1.31 | % |
| Year Ended January 31, 2007 | | | 1.34 | % |
See accompanying Notes to Financial Statements.
26 | EQUITY INVESTOR FUND
| | | | | | | | | | | | | | | | | | | | | |
| Class Y Year Ended January 31, | | 2011 | | | 2010 | | | 2009 | | | 2008 | | | 2007 | |
| |
Per Share Operating Data | | | | | | | | | | | | | | | | | | | | |
| Net asset value, beginning of period | | $ | 9.15 | | | $ | 6.48 | | | $ | 11.88 | | | $ | 12.67 | | | $ | 11.61 | |
| |
| Income (loss) from investment operations: | | | | | | | | | | | | | | | | | | | | |
Net investment income1 | | | .19 | | | | .10 | | | | .15 | | | | .43 | | | | .29 | |
| Net realized and unrealized gain (loss) | | | 1.94 | | | | 2.83 | | | | (4.96 | ) | | | (.64 | ) | | | 1.03 | |
| | | |
| Total from investment operations | | | 2.13 | | | | 2.93 | | | | (4.81 | ) | | | (.21 | ) | | | 1.32 | |
| |
| Dividends and/or distributions to shareholders: | | | | | | | | | | | | | | | | | | | | |
| Dividends from net investment income | | | (.07 | ) | | | (.09 | ) | | | (.08 | ) | | | (.38 | ) | | | (.22 | ) |
| Distributions from net realized gain | | | — | | | | (.17 | ) | | | (.51 | ) | | | (.20 | ) | | | (.04 | ) |
| | | |
| Total dividends and distributions to shareholders | | | (.07 | ) | | | (.26 | ) | | | (.59 | ) | | | (.58 | ) | | | (.26 | ) |
| |
| | | | | | | | | | | | | | | | | | | | | |
| Net asset value, end of period | | $ | 11.21 | | | $ | 9.15 | | | $ | 6.48 | | | $ | 11.88 | | | $ | 12.67 | |
| | | |
| | | | | | | | | | | | | | | | | | | | | |
Total Return, at Net Asset Value2 | | | 23.31 | % | | | 45.03 | % | | | (40.84 | )% | | | (2.00 | )% | | | 11.42 | % |
| | | | | | | | | | | | | | | | | | | | | |
Ratios/Supplemental Data | | | | | | | | | | | | | | | | | | | | |
| Net assets, end of period (in thousands) | | $ | 14,579 | | | $ | 4,495 | | | $ | 2,070 | | | $ | 2,530 | | | $ | 2,021 | |
| |
| Average net assets (in thousands) | | $ | 8,034 | | | $ | 3,087 | | | $ | 2,596 | | | $ | 2,508 | | | $ | 1,267 | |
| |
Ratios to average net assets:3 | | | | | | | | | | | | | | | | | | | | |
| Net investment income | | | 1.91 | % | | | 1.23 | % | | | 1.49 | % | | | 3.25 | % | | | 2.46 | % |
Total expenses4 | | | 0.07 | % | | | 0.07 | % | | | 0.03 | % | | | 0.02 | % | | | 0.03 | % |
| Expenses after payments, waivers and/or reimbursements and reduction to custodian expenses | | | 0.07 | % | | | 0.07 | % | | | 0.03 | % | | | 0.02 | % | | | 0.03 | % |
| |
| Portfolio turnover rate | | | 54 | % | | | 11 | % | | | 5 | % | | | 2 | % | | | 2 | % |
| | |
| 1. | | Per share amounts calculated based on the average shares outstanding during the period. |
| |
| 2. | | Assumes an initial investment on the business day before the first day of the fiscal period, with all dividends and distributions reinvested in additional shares on the reinvestment date, and redemption at the net asset value calculated on the last business day of the fiscal period. Sales charges are not reflected in the total returns. Total returns are not annualized for periods less than one full year. Returns do not reflect the deduction of taxes that a shareholder would pay on fund distributions or the redemption of fund shares. |
| |
| 3. | | Annualized for periods less than one full year. |
| |
| 4. | | Total expenses including all underlying fund expenses were as follows: |
| | | | | |
|
| Year Ended January 31, 2011 | | | 0.82 | % |
| Year Ended January 31, 2010 | | | 0.79 | % |
| Year Ended January 31, 2009 | | | 0.67 | % |
| Year Ended January 31, 2008 | | | 0.65 | % |
| Year Ended January 31, 2007 | | | 0.68 | % |
See accompanying Notes to Financial Statements.
27 | EQUITY INVESTOR FUND
NOTES TO FINANCIAL STATEMENTS
1. Significant Accounting Policies
Oppenheimer Portfolio Series (the “Trust”) is registered under the Investment Company Act of 1940, as amended, as an open-end management investment company. Equity Investor Fund (the “Fund”) is a series of the Trust whose investment objective is to seek long term growth of capital. The Fund normally invests in a diversified portfolio of Oppenheimer mutual funds (individually, an “Underlying Fund” and collectively, the “Underlying Funds”). The Fund’s investment adviser is OppenheimerFunds, Inc. (the “Manager”).
The Fund offers Class A, Class B, Class C, Class N and Class Y shares. Class A shares are sold at their offering price, which is normally net asset value plus a front-end sales charge. Class B, Class C and Class N shares are sold without a front-end sales charge but may be subject to a contingent deferred sales charge (“CDSC”). Class N shares are sold only through retirement plans. Retirement plans that offer Class N shares may impose charges on those accounts. Class Y shares are sold to certain institutional investors or intermediaries without either a front-end sales charge or a CDSC, however, the intermediaries may impose charges on their accountholders who beneficially own Y shares. All classes of shares have identical rights and voting privileges with respect to the Fund in general and exclusive voting rights on matters that affect that class alone. Earnings, net assets and net asset value per share may differ due to each class having its own expenses, such as transfer and shareholder servicing agent fees and shareholder communications, directly attributable to that class. Class A, B, C and N have separate distribution and/or service plans under which they pay fees. Class Y shares do not pay such fees. Class B shares will automatically convert to Class A shares 72 months after the date of purchase.
The following is a summary of significant accounting policies consistently followed by the Fund.
Securities Valuation. The Fund calculates the net asset value of its shares based upon the net asset value of the applicable Underlying Fund. For each Underlying Fund, the net asset value per share for a class of shares is determined as of the close of the New York Stock Exchange (the “Exchange”), normally 4:00 P.M. Eastern time, on each day the Exchange is open for trading by dividing the value of the Underlying Fund’s net assets attributable to that class by the number of outstanding shares of that class on that day.
To determine their net asset values, the Underlying Funds’ assets are valued primarily on the basis of current market quotations. In the absence of a readily available unadjusted quoted market price, including for assets whose values have been materially affected by what the Manager identifies as a significant event occurring before the Underlying Fund’s assets are valued but after the close of their respective exchanges, the Manager, acting through its internal valuation committee, in good faith determines the fair valuation of that Underlying Fund’s assets using consistently applied procedures under the supervision of the Board of Trustees. The methodologies used for valuing assets are not necessarily an indication of the risks associated with investing in those Underlying Funds.
28 | EQUITY INVESTOR FUND
Each investment asset or liability of the Fund is assigned a level at measurement date based on the significance and source of the inputs to its valuation. Unadjusted quoted prices in active markets for identical assets or liabilities are classified as “Level 1,” inputs other than unadjusted quoted prices for an asset that are observable are classified as “Level 2” and significant unobservable inputs, including the Manager’s judgment about the assumptions that a market participant would use in pricing an asset or liability, are classified as “Level 3.” The inputs used for valuing assets and liabilities are not necessarily an indication of the risks associated with investing in those assets or liabilities. A table summarizing the Fund’s investments under these levels of classification is included following the Statement of Investments.
The Fund classifies each of its investments in the Underlying Funds as Level 1, without consideration as to the classification level of the specific investments held by the Underlying Funds.
There have been no significant changes to the fair valuation methodologies of the Fund during the period.
Risks of Investing in the Underlying Funds. Each of the Underlying Funds in which the Fund invests has its own investment risks, and those risks can affect the value of the Fund’s investments and therefore the value of the Fund’s shares. To the extent that the Fund invests more of its assets in one Underlying Fund than in another, the Fund will have greater exposure to the risks of that Underlying Fund.
Investment in Oppenheimer Institutional Money Market Fund. The Fund is permitted to invest daily available cash balances in an affiliated money market fund. The Fund may invest the available cash in Class E shares of Oppenheimer Institutional Money Market Fund (“IMMF”) to seek current income while preserving liquidity. IMMF is a registered open-end management investment company, regulated as a money market fund under the Investment Company Act of 1940, as amended. The Manager is also the investment adviser of IMMF. When applicable, the Fund’s investment in IMMF is included in the Statement of Investments. As a shareholder, the Fund is subject to its proportional share of IMMF’s Class E expenses, including its management fee.
Allocation of Income, Expenses, Gains and Losses. Income, expenses (other than those attributable to a specific class), gains and losses are allocated on a daily basis to each class of shares based upon the relative proportion of net assets represented by such class. Operating expenses directly attributable to a specific class are charged against the operations of that class.
Federal Taxes. The Fund intends to comply with provisions of the Internal Revenue Code applicable to regulated investment companies and to distribute substantially all of its investment company taxable income, including any net realized gain on investments not offset by capital loss carryforwards, if any, to shareholders. Therefore, no federal income or excise tax provision is required. The Fund files income tax returns in U.S. federal and applicable state jurisdictions. The statute of limitations on the Fund’s tax return filings generally remain open for the three preceding fiscal reporting period ends.
29 | EQUITY INVESTOR FUND
NOTES TO FINANCIAL STATEMENTS Continued
1. Significant Accounting Policies Continued
The tax components of capital shown in the following table represent distribution requirements the Fund must satisfy under the income tax regulations, losses the Fund may be able to offset against income and gains realized in future years and unrealized appreciation or depreciation of securities and other investments for federal income tax purposes.
| | | | | | | | | | | | | |
| | | | | | | | | | | Net Unrealized | |
| | | | | | | | | | | Appreciation | |
| | | | | | | | | | | Based on Cost of | |
| | | | | | | | | | | Securities and Other | |
| Undistributed | | Undistributed | | | Accumulated | | | Investments for | |
| Net Investment | | Long-Term | | | Loss | | | Federal Income | |
| Income | | Gain | | | Carryforward1,2,3 | | | Tax Purposes | |
| |
| $2,871,161 | | $ | — | | | $ | 90,792,812 | | | $ | 75,620,739 | |
| | |
| 1. | | As of January 31, 2011, the Fund had $90,792,812 of net capital loss carryforwards available to offset future realized capital gains, if any, and thereby reduce future taxable gain distributions. As of January 31, 2011, details of the capital loss carryforwards were as follows: |
| | | | | |
| Expiring | | | | |
| |
| 2018 | | $ | 14,379,045 | |
| 2019 | | | 76,413,767 | |
| | | | |
| Total | | $ | 90,792,812 | |
| | | | |
| 2. | | During the fiscal year ended January 31, 2011, the Fund did not utilize any capital loss carryforward. |
| |
| 3. | | During the fiscal year ended January 31, 2010, the Fund did not utilize any capital loss carryforward. |
Net investment income (loss) and net realized gain (loss) may differ for financial statement and tax purposes. The character of dividends and distributions made during the fiscal year from net investment income or net realized gains may differ from their ultimate characterization for federal income tax purposes. Also, due to timing of dividends and distributions, the fiscal year in which amounts are distributed may differ from the fiscal year in which the income or net realized gain was recorded by the Fund.
Accordingly, the following amounts have been reclassified for January 31, 2011. Net assets of the Fund were unaffected by the reclassifications.
| | | | | |
| | | Increase to | |
| | | Accumulated | |
| Reduction to | | Net Investment | |
| Paid-in Capital | | Income | |
| |
| $253 | | $ | 253 | |
The tax character of distributions paid during the years ended January 31, 2011 and January 31, 2010 was as follows:
| | | | | | | | | |
| | | Year Ended | | | Year Ended | |
| | | January 31, 2011 | | | January 31, 2010 | |
| |
| Distributions paid from: | | | | | | | | |
| Ordinary income | | $ | 941,534 | | | $ | 1,651,771 | |
| Long-term capital gain | | | — | | | | 10,106,087 | |
| | | | | | | |
| Total | | $ | 941,534 | | | $ | 11,757,858 | |
| | | | | | | |
30 | EQUITY INVESTOR FUND
The aggregate cost of securities and other investments and the composition of unrealized appreciation and depreciation of securities and other investments for federal income tax purposes as of January 31, 2011 are noted in the following table. The primary difference between book and tax appreciation or depreciation of securities and other investments, if applicable, is attributable to the tax deferral of losses or tax realization of financial statement unrealized gain or loss.
| | | | | |
|
| Federal tax cost of securities | | $ | 604,684,013 | |
| | | | |
| | | | | |
| Gross unrealized appreciation | | $ | 75,620,739 | |
| Gross unrealized depreciation | | | — | |
| | | | |
| Net unrealized appreciation | | $ | 75,620,739 | |
| | | | |
Trustees’ Compensation. The Fund has adopted an unfunded retirement plan (the “Plan”) for the Fund’s independent trustees. Benefits are based on years of service and fees paid to each trustee during their period of service. The Plan was frozen with respect to adding new participants effective December 31, 2006 (the “Freeze Date”) and existing Plan Participants as of the Freeze Date will continue to receive accrued benefits under the Plan. Active independent trustees as of the Freeze Date have each elected a distribution method with respect to their benefits under the Plan. During the year ended January 31, 2011, the Fund’s projected benefit obligations, payments to retired trustees and accumulated liability were as follows:
| | | | | |
|
| Projected Benefit Obligations Increased | | $ | 150 | |
| Payments Made to Retired Trustees | | | 2,704 | |
| Accumulated Liability as of January 31, 2011 | | | 20,271 | |
The Board of Trustees has adopted a compensation deferral plan for independent trustees that enables trustees to elect to defer receipt of all or a portion of the annual compensation they are entitled to receive from the Fund. For purposes of determining the amount owed to the Trustee under the plan, deferred amounts are treated as though equal dollar amounts had been invested in shares of the Fund or in other Oppenheimer funds selected by the Trustee. The Fund purchases shares of the funds selected for deferral by the Trustee in amounts equal to his or her deemed investment, resulting in a Fund asset equal to the deferred compensation liability. Such assets are included as a component of “Other” within the asset section of the Statement of Assets and Liabilities. Deferral of trustees’ fees under the plan will not affect the net assets of the Fund, and will not materially affect the Fund’s assets, liabilities or net investment income per share. Amounts will be deferred until distributed in accordance with the compensation deferral plan.
31 | EQUITY INVESTOR FUND
NOTES TO FINANCIAL STATEMENTS Continued
1. Significant Accounting Policies Continued
Dividends and Distributions to Shareholders. Dividends and distributions to shareholders, which are determined in accordance with income tax regulations and may differ from U.S. generally accepted accounting principles, are recorded on the ex-dividend date. Income and capital gain distributions, if any, are declared and paid annually or at other times as deemed necessary by the Manager.
Investment Income. Dividend distributions received from the Underlying Funds are recorded on the ex-dividend date. Upon receipt of notification from an Underlying Fund, and subsequent to the ex-dividend date, some of the dividend income originally recorded by the Fund may be reclassified as a tax return of capital by reducing the cost basis of the Underlying Fund and/or increasing the realized gain on sales of investments in the Underlying Fund.
Custodian Fees. “Custodian fees and expenses” in the Statement of Operations may include interest expense incurred by the Fund on any cash overdrafts of its custodian account during the period. Such cash overdrafts may result from the effects of failed trades in portfolio securities and from cash outflows resulting from unanticipated shareholder redemption activity. The Fund pays interest to its custodian on such cash overdraft at a rate equal to the 1 Month LIBOR Rate plus 2.00%. The “Reduction to custodian expenses” line item, if applicable, represents earnings on cash balances maintained by the Fund during the period. Such interest expense and other custodian fees may be paid with these earnings.
Security Transactions. Security transactions are recorded on the trade date. Realized gains and losses on securities sold are determined on the basis of identified cost.
Indemnifications. The Fund’s organizational documents provide current and former trustees and officers with a limited indemnification against liabilities arising in connection with the performance of their duties to the Fund. In the normal course of business, the Fund may also enter into contracts that provide general indemnifications. The Fund’s maximum exposure under these arrangements is unknown as this would be dependent on future claims that may be made against the Fund. The risk of material loss from such claims is considered remote.
Other. The preparation of financial statements in conformity with accounting principles generally accepted in the United States of America requires management to make estimates and assumptions that affect the reported amounts of assets and liabilities and disclosure of contingent assets and liabilities at the date of the financial statements and the reported amounts of increases and decreases in net assets from operations during the reporting period. Actual results could differ from those estimates.
32 | EQUITY INVESTOR FUND
2. Shares of Beneficial Interest
The Fund has authorized an unlimited number of $0.001 par value shares of beneficial interest of each class. Transactions in shares of beneficial interest were as follows:
| | | | | | | | | | | | | | | | | |
| | | Year Ended January 31, 2011 | | | Year Ended January 31, 2010 | |
| | | Shares | | | Amount | | | Shares | | | Amount | |
| |
Class A | | | | | | | | | | | | | | | | |
| Sold | | | 7,009,203 | | | $ | 69,579,876 | | | | 9,294,329 | | | $ | 75,215,517 | |
| Dividends and/or distributions reinvested | | | 70,727 | | | | 783,237 | | | | 683,481 | | | | 6,493,315 | |
| Redeemed | | | (6,947,193 | ) | | | (68,507,955 | ) | | | (6,426,456 | ) | | | (52,007,005 | ) |
| | | |
| Net increase | | | 132,737 | | | $ | 1,855,158 | | | | 3,551,354 | | | $ | 29,701,827 | |
| | | |
| | | | | | | | | | | | | | | | | |
Class B | | | | | | | | | | | | | | | | |
| Sold | | | 1,602,199 | | | $ | 15,633,495 | | | | 2,042,368 | | | $ | 16,159,548 | |
| Dividends and/or distributions reinvested | | | — | | | | — | | | | 152,226 | | | | 1,421,781 | |
| Redeemed | | | (1,613,649 | ) | | | (15,664,415 | ) | | | (1,719,644 | ) | | | (13,476,367 | ) |
| | | |
| Net increase (decrease) | | | (11,450 | ) | | $ | (30,920 | ) | | | 474,950 | | | $ | 4,104,962 | |
| | | |
| | | | | | | | | | | | | | | | | |
Class C | | | | | | | | | | | | | | | | |
| Sold | | | 3,154,226 | | | $ | 30,855,110 | | | | 4,049,309 | | | $ | 31,989,806 | |
| Dividends and/or distributions reinvested | | | — | | | | — | | | | 233,807 | | | | 2,183,507 | |
| Redeemed | | | (3,138,766 | ) | | | (30,654,086 | ) | | | (3,231,711 | ) | | | (25,544,670 | ) |
| | | |
| Net increase | | | 15,460 | | | $ | 201,024 | | | | 1,051,405 | | | $ | 8,628,643 | |
| | | |
| | | | | | | | | | | | | | | | | |
Class N | | | | | | | | | | | | | | | | |
| Sold | | | 1,932,298 | | | $ | 19,265,934 | | | | 2,434,609 | | | $ | 19,781,223 | |
| Dividends and/or distributions reinvested | | | 3,696 | | | | 40,802 | | | | 119,104 | | | | 1,127,917 | |
| Redeemed | | | (1,913,378 | ) | | | (19,215,787 | ) | | | (1,978,220 | ) | | | (16,066,496 | ) |
| | | |
| Net increase | | | 22,616 | | | $ | 90,949 | | | | 575,493 | | | $ | 4,842,644 | |
| | | |
| | | | | | | | | | | | | | | | | |
Class Y | | | | | | | | | | | | | | | | |
| Sold | | | 1,000,875 | | | $ | 10,045,844 | | | | 250,671 | | | $ | 2,212,228 | |
| Dividends and/or distributions reinvested | | | 8,163 | | | | 90,689 | | | | 12,062 | | | | 114,954 | |
| Redeemed | | | (199,605 | ) | | | (1,968,583 | ) | | | (91,215 | ) | | | (735,854 | ) |
| | | |
| Net increase | | | 809,433 | | | $ | 8,167,950 | | | | 171,518 | | | $ | 1,591,328 | |
| | | |
3. Purchases and Sales of Securities
The aggregate cost of purchases and proceeds from sales of securities, other than short-term obligations and investments in IMMF, for the year ended January 31, 2011, were as follows:
| | | | | | | | | |
| | | Purchases | | | Sales | |
| |
| Investment securities | | $ | 334,845,561 | | | $ | 321,896,513 | |
33 | EQUITY INVESTOR FUND
NOTES TO FINANCIAL STATEMENTS Continued
4. Fees and Other Transactions with Affiliates
Management Fees. Under the investment advisory agreement, the Manager does not charge a management fee, but rather collects indirect management fees from the Fund’s investments in the Underlying Funds and in IMMF. The weighted indirect management fees collected from the Fund’s investment in the Underlying Funds and in IMMF, as a percent of average daily net assets of the Fund for the year ended January 31, 2011 was 0.60%. This amount is gross of any waivers or reimbursements of management fees implemented at the Underlying Fund level.
Administration Service Fees. The Fund pays the Manager a fee of $1,500 per year for preparing and filing the Fund’s tax returns.
Transfer Agent Fees. OppenheimerFunds Services (“OFS”), a division of the Manager, acts as the transfer and shareholder servicing agent for the Fund. The Fund pays OFS a per account fee. For the year ended January 31, 2011, the Fund paid $1,369,109 to OFS for services to the Fund.
Additionally, Class Y shares are subject to minimum fees of $10,000 annually for assets of $10 million or more. The Class Y shares are subject to the minimum fees in the event that the per account fee does not equal or exceed the applicable minimum fees. OFS may voluntarily waive the minimum fees.
Distribution and Service Plan (12b-1) Fees. Under its General Distributor’s Agreement with the Fund, OppenheimerFunds Distributor, Inc. (the “Distributor”) acts as the Fund’s principal underwriter in the continuous public offering of the Fund’s classes of shares.
Service Plan for Class A Shares. The Fund has adopted a Service Plan (the “Plan”) for Class A shares under Rule 12b-1 of the Investment Company Act of 1940. Under the Plan, the Fund reimburses the Distributor for a portion of its costs incurred for services provided to accounts that hold Class A shares. Reimbursement is made periodically at an annual rate of up to 0.25% of the daily net assets of Class A shares of the Fund. The Distributor currently uses all of those fees to pay dealers, brokers, banks and other financial institutions periodically for providing personal service and maintenance of accounts of their customers that hold Class A shares. Any unreimbursed expenses the Distributor incurs with respect to Class A shares in any fiscal year cannot be recovered in subsequent periods. Fees incurred by the Fund under the Plan are detailed in the Statement of Operations.
Distribution and Service Plans for Class B, Class C and Class N Shares. The Fund has adopted Distribution and Service Plans (the “Plans”) for Class B, Class C and Class N shares under Rule 12b-1 of the Investment Company Act of 1940 to compensate the Distributor for its services in connection with the distribution of those shares and servicing accounts. Under the Plans, the Fund pays the Distributor an annual
34 | EQUITY INVESTOR FUND
asset-based sales charge of 0.75% on Class B and Class C shares daily net assets and 0.25% on Class N shares daily net assets. The Distributor also receives a service fee of 0.25% per year under each plan. If either the Class B, Class C or Class N plan is terminated by the Fund or by the shareholders of a class, the Board of Trustees and its independent trustees must determine whether the Distributor shall be entitled to payment from the Fund of all or a portion of the service fee and/or asset-based sales charge in respect to shares sold prior to the effective date of such termination. Fees incurred by the Fund under the Plans are detailed in the Statement of Operations. The Distributor determines its uncompensated expenses under the Plans at calendar quarter ends. The Distributor’s aggregate uncompensated expenses under the Plans at December 31, 2010 were as follows:
| | | | | |
|
| Class B | | $ | 1,399,042 | |
| Class C | | | 1,468,454 | |
| Class N | | | 786,276 | |
Sales Charges. Front-end sales charges and contingent deferred sales charges (“CDSC”) do not represent expenses of the Fund. They are deducted from the proceeds of sales of Fund shares prior to investment or from redemption proceeds prior to remittance, as applicable. The sales charges retained by the Distributor from the sale of shares and the CDSC retained by the Distributor on the redemption of shares is shown in the following table for the period indicated.
| | | | | | | | | | | | | | | | | | | | | |
| | | | | | | Class A | | | Class B | | | Class C | | | Class N | |
| | | | | | | Contingent | | | Contingent | | | Contingent | | | Contingent | |
| | | Class A | | | Deferred Sales | | | Deferred Sales | | | Deferred Sales | | | Deferred Sales | |
| | | Front-End Sales | | | Charges | | | Charges | | | Charges | | | Charges | |
| | | Charges Retained | | | Retained by | | | Retained by | | | Retained by | | | Retained by | |
| Year Ended | | by Distributor | | | Distributor | | | Distributor | | | Distributor | | | Distributor | |
| |
| January 31, 2011 | | $ | 429,898 | | | $ | 714 | | | $ | 171,850 | | | $ | 15,478 | | | $ | 2,315 | |
Waivers and Reimbursements of Expenses. The Manager has voluntarily agreed to waive fees and/or reimburse the Fund for certain expenses so that “Total expenses”, (the combined direct (Fund level) and indirect (Underlying Fund level) expenses), will not exceed the annual rate of 1.45%, 2.20%, 2.20%, 1.70% and 1.20%, for Class A, Class B, Class C, Class N and Class Y, respectively. The expense limitations do not include extraordinary expenses and other expenses not incurred in the ordinary course of the Fund’s business. Notwithstanding the foregoing limits, the Manager is not required to waive or reimburse Fund expenses in excess of the amount of indirect management fees earned from investments in the Underlying Funds and IMMF.
OFS has voluntarily agreed to limit transfer and shareholder servicing agent fees for all classes to 0.35% of average annual net assets per class.
Some of these undertakings may be modified or terminated at any time; some may not be modified or terminated until after one year from the date of the current prospectus, as indicated therein.
35 | EQUITY INVESTOR FUND
NOTES TO FINANCIAL STATEMENTS Continued
5. Pending Litigation
Since 2009, a number of lawsuits have been pending in federal courts against the Manager, the Distributor, and certain mutual funds (“Defendant Funds”) advised by the Manager and distributed by the Distributor (but not including the Fund). The lawsuits naming the Defendant Funds also name as defendants certain officers and current and former trustees of the respective Defendant Funds. The plaintiffs seek class action status on behalf of purchasers of shares of the respective Defendant Fund during a particular time period. The lawsuits raise claims under federal securities laws alleging that, among other things, the disclosure documents of the respective Defendant Fund contained misrepresentations and omissions, that such Defendant Fund’s investment policies were not followed, and that such Defendant Fund and the other defendants violated federal securities laws and regulations. The plaintiffs seek unspecified damages, equitable relief and an award of attorneys’ fees and litigation expenses.
In 2009, what are claimed to be derivative lawsuits were filed in state court against the Manager and a subsidiary (but not against the Fund), on behalf of the New Mexico Education Plan Trust. These lawsuits allege breach of contract, breach of fiduciary duty, negligence and violation of state securities laws, and seek compensatory damages, equitable relief and an award of attorneys’ fees and litigation expenses.
Other lawsuits have been filed since 2008 in various state and federal courts, against the Manager and certain of its affiliates. Those lawsuits were filed by investors who made investments through an affiliate of the Manager, and relate to the alleged investment fraud perpetrated by Bernard Madoff and his firm (“Madoff”). Those suits allege a variety of claims, including breach of fiduciary duty, fraud, negligent misrepresentation, unjust enrichment, and violation of federal and state securities laws and regulations, among others. They seek unspecified damages, equitable relief and an award of attorneys’ fees and litigation expenses. None of the suits have named the Distributor, any of the Oppenheimer mutual funds or any of their independent Trustees or Directors as defendants. None of the Oppenheimer funds invested in any funds or accounts managed by Madoff.
The Manager believes that the lawsuits described above are without legal merit and is defending against them vigorously. The Defendant Funds’ Boards of Trustees have also engaged counsel to defend the suits brought against those Funds and the present and former Independent Trustees named in those suits. While it is premature to render any opinion as to the outcome in these lawsuits, or whether any costs that the Defendant Funds may bear in defending the suits might not be reimbursed by insurance, the Manager believes that these suits should not impair the ability of the Manager or the Distributor to perform their respective duties to the Fund, and that the outcome of all of the suits together should not have any material effect on the operations of any of the Oppenheimer funds.
36 | EQUITY INVESTOR FUND
6. Subsequent Event
The Regulated Investment Company Modernization Act of 2010 (the “Act”) was signed into law on December 22, 2010. The Act makes changes to a number of tax rules impacting the Fund. Under the Act, future capital losses generated by a fund may be carried over indefinitely, but these losses must be used prior to the utilization of any pre-enactment capital losses. Since pre-enactment capital losses may only be carried forward for eight years, there may be a greater likelihood that all or a portion of a fund’s pre-enactment capital losses will expire unused. In general, the provisions of the Act will be effective for the Fund’s fiscal year ending 2012. Specific information regarding the impact of the Act on the Fund will be contained within the “Federal Taxes” section of the financial statement notes for the fiscal year ending 2012.
37 | EQUITY INVESTOR FUND
REPORT OF INDEPENDENT REGISTERED PUBLIC ACCOUNTING FIRM
The Board of Trustees and Shareholders of Oppenheimer Portfolio Series:
We have audited the accompanying statement of assets and liabilities of Equity Investor Fund (one of the portfolios constituting the Oppenheimer Portfolio series), including the statement of investments, as of January 31, 2011, the related statement of operations for the year then ended, the statements of changes in net assets for each of the years in the two-year period then ended, and the financial highlights for each of the years in the five-year period then ended. These financial statements and financial highlights are the responsibility of the Fund’s management. Our responsibility is to express an opinion on these financial statements and financial highlights based on our audits.
We conducted our audits in accordance with the standards of the Public Company Accounting Oversight Board (United States). Those standards require that we plan and perform the audit to obtain reasonable assurance about whether the financial statements and financial highlights are free of material misstatement. An audit includes examining, on a test basis, evidence supporting the amounts and disclosures in the financial statements. Our procedures included confirmation of securities owned as of January 31, 2011, by correspondence with the transfer agent of the underlying funds. An audit also includes assessing the accounting principles used and significant estimates made by management, as well as evaluating the overall financial statement presentation. We believe that our audits provide a reasonable basis for our opinion.
In our opinion, the financial statements and financial highlights referred to above present fairly, in all material respects, the financial position of Equity Investor Fund as of January 31, 2011, the results of its operations for the year then ended, the changes in its net assets for each of the years in the two-year period then ended, and the financial highlights for each of the years in the five-year period then ended, in conformity with U.S. generally accepted accounting principles.
KPMG llp
Denver, Colorado
March 16, 2011
38 | EQUITY INVESTOR FUND
FEDERAL INCOME TAX INFORMATION Unaudited
In early 2011, if applicable, shareholders of record received information regarding all dividends and distributions paid to them by the Fund during calendar year 2010. Regulations of the U.S. Treasury Department require the Fund to report this information to the Internal Revenue Service.
Dividends, if any, paid by the Fund during the fiscal year ended January 31, 2011 which are not designated as capital gain distributions should be multiplied by the maximum amount allowable but not less than 76.85% to arrive at the amount eligible for the corporate dividend-received deduction.
A portion, if any, of the dividends paid by the Fund during the fiscal year ended January 31, 2011 which are not designated as capital gain distributions are eligible for lower individual income tax rates to the extent that the Fund has received qualified dividend income as stipulated by recent tax legislation. The maximum amount allowable but not less than $5,255,440 of the Fund’s fiscal year taxable income may be eligible for the lower individual income tax rates. In early 2011, shareholders of record received information regarding the percentage of distributions that are eligible for lower individual income tax rates.
Recent tax legislation allows a regulated investment company to designate distributions not designated as capital gain distributions, as either interest related dividends or short-term capital gain dividends, both of which are exempt from the U.S. withholding tax applicable to non U.S. taxpayers. For the fiscal year ended January 31, 2011, the maximum amount allowable but not less than $158 or 0.02% of the ordinary distributions paid by the Fund qualifies as an interest related dividend.
The foregoing information is presented to assist shareholders in reporting distributions received from the Fund to the Internal Revenue Service. Because of the complexity of the federal regulations which may affect your individual tax return and the many variations in state and local tax regulations, we recommend that you consult your tax advisor for specific guidance.
39 | EQUITY INVESTOR FUND
BOARD APPROVAL OF THE FUND’S INVESTMENT ADVISORY AGREEMENT Unaudited
Each year, the Board of Trustees (the “Board”), including a majority of the independent Trustees, is required to determine whether to renew the Fund’s investment advisory agreement (the “Agreement”). The Investment Company Act of 1940, as amended, requires that the Board request and evaluate, and that the Manager provide, such information as may be reasonably necessary to evaluate the terms of the Agreement. The Board employs an independent consultant to prepare a report that provides information, including comparative information, that the Board requests for that purpose. In addition, the Board receives information throughout the year regarding Fund services, fees, expenses and performance.
The Manager and the independent consultant provided information to the Board on the following factors: (i) the nature, quality and extent of the Manager’s services, (ii) the investment performance of the Fund and the Manager, (iii) the fees and expenses of the Fund, including comparative expense information, (iv) the profitability of the Manager and its affiliates, including an analysis of the cost of providing services, (v) whether economies of scale are realized as the Fund grows and whether fee levels reflect these economies of scale for Fund investors and (vi) other benefits to the Manager from its relationship with the Fund. The Board was aware that there are alternatives to retaining the Manager.
Outlined below is a summary of the principal information considered by the Board as well as the Board’s conclusions.
Nature, Quality and Extent of Services. The Board considered information about the nature, quality and extent of the services provided to the Fund and information regarding the Manager’s key personnel who provide such services. The Manager’s duties include providing the Fund with the services of the portfolio manager and the Manager’s asset allocation team, who provide research, analysis and other advisory services in regard to the Fund’s investments; oversight of third-party service providers; monitoring compliance with applicable Fund policies and procedures and adherence to the Fund’s investment restrictions. The Manager is responsible for providing certain administrative services to the Fund as well. Those services include providing and supervising all administrative and clerical personnel who are necessary in order to provide effective corporate administration for the Fund; compiling and maintaining records with respect to the Fund’s operations; preparing and filing reports required by the Securities and Exchange Commission; preparing periodic reports regarding the operations of the Fund for its shareholders; preparing proxy materials for shareholder meetings; and preparing the registration statements required by Federal and state securities laws for the sale of the Fund’s shares. The Manager also provides the Fund with office space, facilities and equipment.
40 | EQUITY INVESTOR FUND
The Board also considered the quality of the services provided and the quality of the Manager’s resources that are available to the Fund. The Board took account of the fact that the Manager has had over fifty years of experience as an investment adviser and that its assets under management rank it among the top mutual fund managers in the United States. The Board evaluated the Manager’s advisory, administrative, accounting, legal and compliance services, and information the Board has received regarding the experience and professional qualifications of the Manager’s key personnel and the size and functions of its staff. In its evaluation of the quality of the portfolio management services provided, the Board considered the experience of Alan Gilston, the portfolio manager for the Fund, and the experience of the portfolio managers and the investment performance of the investment companies in which the Fund may invest (the “Underlying Funds”). The Board members also considered the totality of their experiences with the Manager as directors or trustees of the Fund and other funds advised by the Manager. The Board considered information regarding the quality of services provided by affiliates of the Manager, which its members have become knowledgeable about in connection with the renewal of the Fund’s service agreements. The Board concluded, in light of the Manager’s experience, reputation, personnel, operations and resources, that the Fund benefits from the services provided under the Agreement.
Investment Performance of the Manager and the Fund. Throughout the year, the Manager provided information on the investment performance of the Fund and the Manager, including comparative performance information. The Board also reviewed information, prepared by the Manager and by the independent consultant, comparing the Fund’s historical performance to relevant market indices and to the performance of other retail front-end load and no-load global multi-cap core fund of funds (including both fund of funds advised by the Manager and fund of funds advised by other investment advisers). The Board noted that the Fund’s one-year and three-year performance was better than its peer group median.
Costs of Services by the Manager. The Board reviewed the fees paid to the Manager and its affiliates and the other expenses borne by the Fund. The Board noted that the Fund does not pay a direct management fee but that the Fund indirectly bears its share of the management fees of the Underlying Funds. The Board also considered the comparability of the fees charged and the services provided to the Fund to the fees and services for other clients or accounts advised by the Manager. The independent consultant provided comparative data in regard to the fees and expenses of the Fund and other retail front-end load global multi-cap core and international multi-cap core fund of funds with comparable asset levels and distribution features. The Board noted that the
41 | EQUITY INVESTOR FUND
BOARD APPROVAL OF THE FUND’S INVESTMENT ADVISORY AGREEMENT Unaudited / Continued
Fund’s total expenses were lower than its peer group median and average. The Board also noted that the Manager has voluntarily agreed to waive fees and /or reimburse the Fund for certain expenses so that the “Total Expenses”, as a percentage of average net assets, (the combined direct (Fund level) and indirect (Underlying Fund level) expenses), will not exceed the annual rate of 1.45% for Class A, 2.20% for Class B and Class C, 1.70% For Class N and 1.20% for Class Y. The Manager may modify or terminate this undertaking at any time without notice to shareholders.
Economies of Scale and Profits Realized by the Manager. The Board considered information regarding the Manager’s costs in serving as the Fund’s investment adviser, including the costs associated with the personnel and systems necessary to manage the Fund, and information regarding the Manager’s profitability from its relationship with the Fund. The Board reviewed whether the Manager may realize economies of scale in managing and supporting the Fund and the Underlying Funds, and the extent to which those economies of scale would benefit the Fund’s shareholders.
Other Benefits to the Manager. In addition to considering the profits realized by the Manager, the Board considered information that was provided regarding the direct and indirect benefits the Manager receives as a result of its relationship with the Fund, including compensation paid to the Manager’s affiliates. The Board also considered that the Manager must be able to pay and retain experienced professional personnel at competitive rates to provide quality services to the Fund.
Conclusions. These factors were also considered by the independent Trustees meeting separately from the full Board, assisted by experienced counsel to the Fund and to the independent Trustees. Fund counsel and the independent Trustees’ counsel are independent of the Manager within the meaning and intent of the Securities and Exchange Commission Rules.
Based on its review of the information it received and its evaluations described above, the Board, including a majority of the independent Trustees, decided to continue the Agreement through September 30, 2011. In arriving at this decision, the Board did not single out any factor or factors as being more important than others, but considered all of the above information, and considered the terms and conditions of the Agreement, in light of all of the surrounding circumstances.
42 | EQUITY INVESTOR FUND
PORTFOLIO PROXY VOTING POLICIES AND PROCEDURES; UPDATES TO STATEMENTS OF INVESTMENTS Unaudited
The Fund has adopted Portfolio Proxy Voting Policies and Procedures under which the Fund votes proxies relating to securities (“portfolio proxies”) held by the Fund. A description of the Fund’s Portfolio Proxy Voting Policies and Procedures is available (i) without charge, upon request, by calling the Fund toll-free at 1.800.525.7048, (ii) on the Fund’s website at www.oppenheimerfunds.com, and (iii) on the SEC’s website at www.sec.gov. In addition, the Fund is required to file Form N-PX, with its complete proxy voting record for the 12 months ended June 30th, no later than August 31st of each year. The Fund’s voting record is available (i) without charge, upon request, by calling the Fund toll-free at 1.800.525.7048, and (ii) in the Form N-PX filing on the SEC’s website at www.sec.gov.
The Fund files its complete schedule of portfolio holdings with the SEC for the first quarter and the third quarter of each fiscal year on Form N-Q. The Fund’s Form N-Q filings are available on the SEC’s website at www.sec.gov. Those forms may be reviewed and copied at the SEC’s Public Reference Room in Washington, D.C. Information on the operation of the Public Reference Room may be obtained by calling 1-800-SEC-0330.
Householding—Delivery of Shareholder Documents
This is to inform you about OppenheimerFunds’ “householding” policy. If more than one member of your household maintains an account in a particular fund, OppenheimerFunds will mail only one copy of the fund’s prospectus (or, if available, the fund’s summary prospectus), annual and semiannual report and privacy policy. The consolidation of these mailings, called householding, benefits your fund through reduced mailing expense, and benefits you by reducing the volume of mail you receive from OppenheimerFunds. Householding does not affect the delivery of your account statements.
Please note that we will continue to household these mailings for as long as you remain an OppenheimerFunds shareholder, unless you request otherwise. If you prefer to receive multiple copies of these materials, please call us at 1.800.CALL-OPP (225-5677). You may also notify us in writing or via email. We will begin sending you individual copies of the prospectus (or, if available, the summary prospectus), reports and privacy policy within 30 days of receiving your request to stop householding.
43 | EQUITY INVESTOR FUND
TRUSTEES AND OFFICERS Unaudited
| | | |
| Name, Position(s) Held with the Fund, Length of Service, Age | | Principal Occupation(s) During the Past 5 Years; Other Trusteeships/Directorships Held; Number of Portfolios in the Fund Complex Currently Overseen |
| |
INDEPENDENT
TRUSTEES | | The address of each Trustee in the chart below is 6803 S. Tucson Way, Centennial, Colorado 80112-3924. Each Trustee serves for an indefinite term, or until his or her resignation, retirement, death or removal. |
| | | |
Brian F. Wruble,
Chairman of the Board of Trustees (since 2007) and Trustee (since 2005)
Age: 67 | | Chairman (since August 2007) and Trustee (since August 1991) of the Board of Trustees of The Jackson Laboratory (non-profit); Director of Special Value Opportunities Fund, LLC (registered investment company) (affiliate of the Manager’s parent company) (since September 2004); Member of Zurich Financial Investment Management Advisory Council (insurance) (since 2004); Treasurer (since 2007) and Trustee of the Institute for Advanced Study (non-profit educational institute) (since May 1992); General Partner of Odyssey Partners, L.P. (hedge fund) (September 1995-December 2007); Special Limited Partner of Odyssey Investment Partners, LLC (private equity investment) (January 1999-September 2004). Oversees 59 portfolios in the OppenheimerFunds complex. Mr. Wruble has served on the Boards of certain Oppenheimer funds since April 2001, during which time he has become familiar with the Fund’s (and other Oppenheimer funds’) financial, accounting, regulatory and investment matters and has contributed to the Boards’ deliberations. |
| | | |
David K. Downes,
Trustee (since 2007)
Age: 71 | | Director of THL Credit Inc. (since June 2009); Independent Chairman GSK Employee Benefit Trust (since April 2006); Trustee of Employee Trusts (since January 2006); Chief Executive Officer and Board Member of Community Capital Management (investment management company) (since January 2004); President of The Community Reinvestment Act Qualified Investment Fund (investment management company) (since 2004); Director of Internet Capital Group (information technology company) (since October 2003); Director of Correctnet (January 2006-2007); Independent Chairman of the Board of Trustees of Quaker Investment Trust (registered investment company) (2004-2007); Chief Operating Officer and Chief Financial Officer of Lincoln National Investment Companies, Inc. (subsidiary of Lincoln National Corporation, a publicly traded company) and Delaware Investments U.S., Inc. (investment management subsidiary of Lincoln National Corporation) (1993-2003); President, Chief Executive Officer and Trustee of Delaware Investment Family of Funds (1993-2003); President and Board Member of Lincoln National Convertible Securities Funds, Inc. and the Lincoln National Income Funds, TDC (1993-2003); Chairman and Chief Executive Officer of Retirement Financial Services, Inc. (registered transfer agent and investment adviser and subsidiary of Delaware Investments U.S., Inc.) (1993-2003); President and Chief Executive Officer of Delaware Service Company, Inc. (1995-2003); Chief Administrative Officer, Chief Financial Officer, Vice Chairman and Director of Equitable Capital Management Corporation (investment subsidiary of Equitable Life Assurance Society) (1985-1992); Corporate Controller of Merrill Lynch Company (financial services holding company) (1977-1985); held the following positions at the Colonial Penn Group, Inc. (insurance company): Corporate Budget Director (1974-1977), Assistant Treasurer (1972-1974) and Director of Corporate Taxes (1969-1972); held the following positions at Price Waterhouse Company (financial services firm): Tax Manager (1967-1969), Tax Senior (1965-1967) and Staff Accountant (1963-1965); United States Marine Corps (1957-1959). Oversees 59 portfolios in the OppenheimerFunds complex. Mr. Downes has served on the Boards of certain Oppenheimer funds since December 2005, during which time he has become familiar with the Fund’s (and other Oppenheimer funds’) financial, accounting, regulatory and investment matters and has contributed to the Boards’ deliberations. |
44 | EQUITY INVESTOR FUND
| | | |
| Name, Position(s) Held with the Fund, Length of Service, Age | | Principal Occupation(s) During the Past 5 Years; Other Trusteeships/Directorships Held; Number of Portfolios in the Fund Complex Currently Overseen |
| |
Matthew P. Fink,
Trustee (since 2005)
Age: 70 | | Trustee of the Committee for Economic Development (policy research foundation) (since 2005); Director of ICI Education Foundation (education foundation) (October 1991-August 2006); President of the Investment Company Institute (trade association) (October 1991-June 2004); Director of ICI Mutual Insurance Company (insurance company) (October 1991-June 2004). Oversees 59 portfolios in the OppenheimerFunds complex. Mr. Fink has served on the Boards of certain Oppenheimer funds since January 2005, during which time he has become familiar with the Fund’s (and other Oppenheimer funds’) financial, accounting, regulatory and investment matters and has contributed to the Boards’ deliberations. |
| | | |
Phillip A. Griffiths,
Trustee (since 2005)
Age: 72 | | Fellow of the Carnegie Corporation (since 2007); Distinguished Presidential Fellow for International Affairs (since 2002) and Member (since 1979) of the National Academy of Sciences; Council on Foreign Relations (since 2002); Director of GSI Lumonics Inc. (precision technology products company) (since 2001); Senior Advisor of The Andrew W. Mellon Foundation (since 2001); Chair of Science Initiative Group (since 1999); Member of the American Philosophical Society (since 1996); Trustee of Woodward Academy (since 1983); Foreign Associate of Third World Academy of Sciences (since 2002); Director of the Institute for Advanced Study (1991-2004); Director of Bankers Trust New York Corporation (1994-1999); Provost at Duke University (1983-1991). Oversees 59 portfolios in the OppenheimerFunds complex. Mr. Griffiths has served on the Boards of certain Oppenheimer funds since June 1999, during which time he has become familiar with the Fund’s (and other Oppenheimer funds’) financial, accounting, regulatory and investment matters and has contributed to the Boards’ deliberations. |
| | | |
Mary F. Miller,
Trustee (since 2005)
Age: 68 | | Trustee of International House (not-for-profit) (since June 2007); Trustee of the American Symphony Orchestra (not-for-profit) (since October 1998); and Senior Vice President and General Auditor of American Express Company (financial services company) (July 1998-February 2003). Oversees 59 portfolios in the OppenheimerFunds complex. Ms. Miller has served on the Boards of certain Oppenheimer funds since August 2004, during which time she has become familiar with the Fund’s (and other Oppenheimer funds’) financial, accounting, regulatory and investment matters and has contributed to the Boards’ deliberations. |
| | | |
Joel W. Motley,
Trustee (since 2005)
Age: 58 | | Managing Director of Public Capital Advisors, LLC (privately-held financial advisor) (since January 2006); Managing Director of Carmona Motley, Inc. (privately-held financial advisor) (since January 2002); Director of Columbia Equity Financial Corp. (privately-held financial advisor) (2002-2007); Managing Director of Carmona Motley Hoffman Inc. (privately-held financial advisor) (January 1998- December 2001); Member of the Finance and Budget Committee of the Council on Foreign Relations, Chairman of the Investment Committee of the Episcopal Church of America, Member of the Investment Committee and Board of Human Rights Watch and Member of the Investment Committee and Board of Historic Hudson Valley. Oversees 59 portfolios in the OppenheimerFunds complex. Mr. Motley has served on the Boards of certain Oppenheimer funds since October 2002, during which time he has become familiar with the Fund’s (and other Oppenheimer funds’) financial, accounting, regulatory and investment matters and has contributed to the Boards’ deliberations. |
| | | |
Mary Ann Tynan,
Trustee (since 2008)
Age: 65 | | Vice Chair of Board of Trustees of Brigham and Women’s/Faulkner Hospitals (non-profit hospital) (since 2000); Chair of Board of Directors of Faulkner Hospital (non-profit hospital) (since 1990); Member of Audit and Compliance Committee of Partners Health Care System (non-profit) (since 2004); Board of Trustees of Middlesex School (educational institution) (since 1994); Board of Directors of Idealswork, Inc. (financial services provider) (since 2003); Partner, |
45 | EQUITY INVESTOR FUND
TRUSTEES AND OFFICERS Unaudited / Continued
| | | |
| Name, Position(s) Held with the Fund, Length of Service, Age | | Principal Occupation(s) During the Past 5 Years; Other Trusteeships/Directorships Held; Number of Portfolios in the Fund Complex Currently Overseen |
| |
Mary Ann Tynan,
Continued | | Senior Vice President and Director of Regulatory Affairs of Wellington Management Company, LLP (global investment manager) (1976-2002); Vice President and Corporate Secretary, John Hancock Advisers, Inc. (mutual fund investment adviser) (1970-1976). Oversees 59 portfolios in the OppenheimerFunds complex. Ms. Tynan has served on the Boards of certain Oppenheimer funds since October 2008, during which time she has become familiar with the Fund’s (and other Oppenheimer funds’) financial, accounting, regulatory and investment matters and has contributed to the Boards’ deliberations. |
| | | |
Joseph M. Wikler,
Trustee (sin2005)
Age: 69 | | Director of C-TASC (bio-statistics services) (since 2007); Director of the following medical device companies: Medintec (since 1992) and Cathco (since 1996); Member of the Investment Committee of the Associated Jewish Charities of Baltimore (since 1994); Director of Lakes Environmental Association (environmental protection organization) (1996-2008); Director of Fortis/Hartford mutual funds (1994-December 2001). Oversees 59 portfolios in the OppenheimerFunds complex. Mr. Wikler has served on the Boards of certain Oppenheimer funds since August 2005, during which time he has become familiar with the Fund’s (and other Oppenheimer funds’) financial, accounting, regulatory and investment matters and has contributed to the Boards’ deliberations. |
| | | |
Peter I. Wold,
Trustee (since 2005)
Age: 63 | | Director of Arch Coal, Inc. (since 2010); Director and Chairman of Wyoming Enhanced Oil Recovery Institute Commission (enhanced oil recovery study) (since 2004); President of Wold Oil Properties, Inc. (oil and gas exploration and production company) (since 1994); Vice President of American Talc Company, Inc. (talc mining and milling) (since 1999); Managing Member of Hole-in-the- Wall Ranch (cattle ranching) (since 1979); Director and Chairman of the Denver Branch of the Federal Reserve Bank of Kansas City (1993-1999); and Director of PacifiCorp. (electric utility) (1995-1999). Oversees 59 portfolios in the OppenheimerFunds complex. Mr. Wold has served on the Boards of certain Oppenheimer funds since August 2005, during which time he has become familiar with the Fund’s (and other Oppenheimer funds’) financial, accounting, regulatory and investment matters and has contributed to the Boards’ deliberations. |
| | | |
OFFICERS OF THE FUND | | The addresses of the Officers in the chart below are as follows: for Messrs. Gilston, Glavin, Gabinet, Keffer and Zack, Two World Financial Center, 225 Liberty Street, New York, New York 10281-1008, for Messrs.��Vandehey and Wixted, 6803 S. Tucson Way, Centennial, Colorado 80112-3924. Each Officer serves for an indefinite term or until his or her resignation, retirement, death or removal. |
| | | |
Alan C. Gilston,
Vice President and
Portfolio Manager
(since 2009)
Age: 52 | | Vice President of the Manager (since September 1997); a member of the Funds’ portfolio management team and a member of the Manager’s Asset Allocation Committee (since February 2009); a member of the Manager’s Risk Management Team during various periods. A portfolio manager and officer of 11 portfolios in the OppenheimerFunds complex. |
| | | |
William F. Glavin, Jr.,
President and Principal
Executive Officer
(since 2009)
Age: 52 | | Chairman of the Manager (since December 2009); Chief Executive Officer and Director of the Manager (since January 2009); President of the Manager (since May 2009); Director of Oppenheimer Acquisition Corp. (“OAC”) (the Manager’s parent holding company) (since June 2009); Executive Vice President (March 2006-February 2009) and Chief Operating Officer (July 2007-February 2009) of Massachusetts Mutual Life Insurance Company (OAC’s parent company); Director (May 2004-March 2006) and Chief Operating Officer and Chief Compliance Officer (May 2004-January 2005), President (January 2005-March 2006) and Chief Executive Officer (June 2005-March 2006) of Babson Capital |
46 | EQUITY INVESTOR FUND
| | | |
| Name, Position(s) Held with the Fund, Length of Service, Age | | Principal Occupation(s) During the Past 5 Years; Other Trusteeships/Directorships Held; Number of Portfolios in the Fund Complex Currently Overseen |
| |
William F. Glavin, Jr.,
Continued | | Management LLC; Director (March 2005-March 2006), President (May 2003- March 2006) and Chief Compliance Officer (July 2005-March 2006) of Babson Capital Securities, Inc. (a broker-dealer); President (May 2003-March 2006) of Babson Investment Company, Inc.; Director (May 2004-August 2006) of Babson Capital Europe Limited; Director (May 2004-October 2006) of Babson Capital Guernsey Limited; Director (May 2004-March 2006) of Babson Capital Management LLC; Non-Executive Director (March 2005-March 2007) of Baring Asset Management Limited; Director (February 2005-June 2006) Baring Pension Trustees Limited; Director and Treasurer (December 2003-November 2006) of Charter Oak Capital Management, Inc.; Director (May 2006-September 2006) of C.M. Benefit Insurance Company; Director (May 2008-June 2009) and Executive Vice President (June 2007-July 2009) of C.M. Life Insurance Company; President (March 2006-May 2007) of MassMutual Assignment Company; Director (January 2005-December 2006), Deputy Chairman (March 2005-December 2006) and President (February 2005-March 2005) of MassMutual Holdings (Bermuda) Limited; Director (May 2008-June 2009) and Executive Vice President (June 2007- July 2009) of MML Bay State Life Insurance Company; Chief Executive Officer and President (April 2007-January 2009) of MML Distributors, LLC; and Chairman (March 2006-December 2008) and Chief Executive Officer (May 2007-December 2008) of MML Investors Services, Inc. Oversees 66 portfolios as a Trustee/Director and 94 portfolios as an officer in the OppenheimerFunds complex. |
| | | |
Arthur S. Gabinet,
Secretary (since 2011)
Age: 52 | | Executive Vice President (since May 2010) and General Counsel (since January 2011) of the Manager; General Counsel of the Distributor (since January 2011); General Counsel of Centennial Asset Management Corporation (since January 2011); Executive Vice President and General Counsel of HarbourView Asset Management Corporation (since January 2011); Assistant Secretary (since January 2011) and Director (since January 2011) of OppenheimerFunds International Ltd. and OppenheimerFunds plc; Vice President and Director of Oppenheimer Partnership Holdings, Inc. (since January 2011); Director of Oppenheimer Real Asset Management, Inc. (since January 2011); Executive Vice President and General Counsel of Shareholder Financial Services, Inc. and Shareholder Services, Inc. (since January 2011); Executive Vice President and General Counsel of OFI Private Investments, Inc. (since January 2011); Vice President of OppenheimerFunds Legacy Program (since January 2011); Executive Vice President and General Counsel of OFI Institutional Asset Management, Inc. (since January 2011); General Counsel, Asset Management of the Manager (May 2010-December 2010); Principal, The Vanguard Group (November 2005-April 2010); District Administrator, U.S. Securities and Exchange Commission (January 2003-October 2005). An officer of 96 portfolios in the OppenheimerFunds complex. |
| | | |
Thomas W. Keffer,
Vice President and
Chief Business Officer
(since 2009)
Age: 55 | | Senior Vice President of the Manager (since March 1997); Director of Investment Brand Management of the Manager (since November 1997); Senior Vice President of OppenheimerFunds Distributor, Inc. (since December 1997). An officer of 96 portfolios in the OppenheimerFunds complex. |
| | | |
Mark S. Vandehey,
Vice President and Chief
Compliance Officer
(since 2005)
Age: 60 | | Senior Vice President and Chief Compliance Officer of the Manager (since March 2004); Chief Compliance Officer of OppenheimerFunds Distributor, Inc., Centennial Asset Management and Shareholder Services, Inc. (since March 2004); Vice President of OppenheimerFunds Distributor, Inc., Centennial Asset Management Corporation and Shareholder Services, Inc. (since June 1983). An officer of 96 portfolios in the OppenheimerFunds complex. |
47 | EQUITY INVESTOR FUND
TRUSTEES AND OFFICERS Unaudited / Continued
| | | |
| Name, Position(s) Held with the Fund, Length of Service, Age | | Principal Occupation(s) During the Past 5 Years; Other Trusteeships/Directorships Held; Number of Portfolios in the Fund Complex Currently Overseen |
| |
Brian W. Wixted,
Treasurer and Principal Financial & Accounting Officer (since 2005)
Age: 51 | | Senior Vice President of the Manager (since March 1999); Treasurer of the Manager and the following: HarbourView Asset Management Corporation, Shareholder Financial Services, Inc., Shareholder Services, Inc., Oppenheimer Real Asset Management, Inc. and Oppenheimer Partnership Holdings, Inc. (March 1999-June 2008), OFI Private Investments, Inc. (March 2000-June 2008), OppenheimerFunds International Ltd. and OppenheimerFunds plc (since May 2000), OFI Institutional Asset Management, Inc. (since November 2000), and OppenheimerFunds Legacy Program (charitable trust program established by the Manager) (since June 2003); Treasurer and Chief Financial Officer of OFI Trust Company (trust company subsidiary of the Manager) (since May 2000); Assistant Treasurer of OAC (March 1999-June 2008). An officer of 96 portfolios in the OppenheimerFunds complex. |
| | | |
Robert G. Zack,
Vice President and Secretary (since 2005)
Age: 62 | | Executive Vice President (since January 2004) and General Counsel-Corporate (since March 2002) of the Manager; General Counsel of the Distributor (since December 2001); General Counsel of Centennial Asset Management Corporation (since December 2001); Senior Vice President and General Counsel of HarbourView Asset Management Corporation (since December 2001); Secretary and General Counsel of OAC (since November 2001); Assistant Secretary (since September 1997) and Director (since November 2001) of OppenheimerFunds International Ltd. and OppenheimerFunds plc; Vice President and Director of Oppenheimer Partnership Holdings, Inc. (since December 2002); Director of Oppenheimer Real Asset Management, Inc. (since November 2001); Senior Vice President, General Counsel and Director of Shareholder Financial Services, Inc. and Shareholder Services, Inc. (since December 2001); Senior Vice President, General Counsel and Director of OFI Private Investments, Inc. and OFI Trust Company (since November 2001); Vice President of OppenheimerFunds Legacy Program (since June 2003); Senior Vice President and General Counsel of OFI Institutional Asset Management, Inc. (since November 2001). An officer of 96 portfolios in the OppenheimerFunds complex. |
| | | |
Manager | | OppenheimerFunds, Inc. |
| | | |
Distributor | | OppenheimerFunds Distributor, Inc. |
| | | |
Transfer and Shareholder Servicing Agent | | OppenheimerFunds Services |
| | | |
Independent
Registered Public
Accounting Firm | | KPMG llp |
| | | |
Legal Counsel | | Kramer Levin Naftalis & Frankel LLP |
©2011 OppenheimerFunds, Inc. All rights reserved.
The Fund’s Statement of Additional Information contains additional information about the Fund’s Trustees and Officers and is available without charge upon request, by calling 1.800.525.7048.
48 | EQUITY INVESTOR FUND
PRIVACY POLICY NOTICE
As an Oppenheimer fund shareholder, you are entitled to know how we protect your personal information and how we limit its disclosure.
Information Sources
We obtain nonpublic personal information about our shareholders from the following sources:
| • | | Applications or other forms |
| |
| • | | When you create a user ID and password for online account access |
| |
| • | | When you enroll in eDocs Direct, our electronic document delivery service |
| |
| • | | Your transactions with us, our affiliates or others |
| |
| • | | A software program on our website, often referred to as a “cookie,” which indicates which parts of our site you’ve visited |
| |
| • | | When you set up challenge questions to reset your password online |
If you visit www.oppenheimerfunds.com and do not log on to the secure account information areas, we do not obtain any personal information about you. When you do log on to a secure area, we do obtain your user ID and password to identify you. We also use this information to provide you with products and services you have requested, to inform you about products and services that you may be interested in and assist you in other ways.
We do not collect personal information through our website unless you willingly provide it to us, either directly by email or in those areas of the website that request information. In order to update your personal information (including your mailing address, email address and phone number) you must first log on and visit your user profile.
If you have set your browser to warn you before accepting cookies, you will receive the warning message with each cookie. You can refuse cookies by turning them off in your browser. However, doing so may limit your access to certain sections of our website.
We use cookies to help us improve and manage our website. For example, cookies help us recognize new versus repeat visitors to the site, track the pages visited, and enable some special features on the website. This data helps us provide a better service for our website visitors.
Protection of Information
We do not disclose any non-public personal information (such as names on a customer list) about current or former customers to anyone, except as permitted by law.
Disclosure of Information
We send your financial advisor (as designated by you) copies of confirmations, account statements and other documents reporting activity in your fund accounts. We may also use details about you and your investments to help us, our financial service affiliates, or firms that jointly market their financial products and services with ours, to better serve your investment needs or suggest financial services or educational material that may be of interest to you. If this requires us to provide you with an opportunity to “opt in” or “opt out” of such information sharing with a firm not affiliated with us, you will receive notification on how to do so, before any such sharing takes place.
Right of Refusal
We will not disclose your personal information to unaffiliated third parties (except as permitted by law), unless we first offer you a reasonable opportunity to refuse or “opt out” of such disclosure.
49 | EQUITY INVESTOR FUND
PRIVACY POLICY NOTICE
Internet Security and Encryption
In general, the email services provided by our website are encrypted and provide a secure and private means of communication with us. To protect your own privacy, confidential and/or personal information should only be communicated via email when you are advised that you are using a secure website.
As a security measure, we do not include personal or account information in non-secure emails, and we advise you not to send such information to us in non-secure emails. Instead, you may take advantage of the secure features of our website to encrypt your email correspondence. To do this, you will need to use a browser that supports Secure Sockets Layer (SSL) protocol.
We do not guarantee or warrant that any part of our website, including files available for download, are free of viruses or other harmful code. It is your responsibility to take appropriate precautions, such as use of an anti-virus software package, to protect your computer hardware and software.
| • | | All transactions, including redemptions, exchanges and purchases, are secured by SSL and 128-bit encryption. SSL is used to establish a secure connection between your PC and OppenheimerFunds’ server. It transmits information in an encrypted and scrambled format. |
| |
| • | | Encryption is achieved through an electronic scrambling technology that uses a “key” to code and then decode the data. Encryption acts like the cable converter box you may have on your television set. It scrambles data with a secret code so that no one can make sense of it while it is being transmitted. When the data reaches its destination, the same software unscrambles the data. |
| |
| • | | You can exit the secure area by either closing your browser, or for added security, you can use the Log Out button before you close your browser. |
Other Security Measures
We maintain physical, electronic and procedural safeguards to protect your personal account information. Our employees and agents have access to that information only so that they may offer you products or provide services, for example, when responding to your account questions.
How You Can Help
You can also do your part to keep your account information private and to prevent unauthorized transactions. If you obtain a user ID and password for your account, do not allow it to be used by anyone else. Also, take special precautions when accessing your account on a computer used by others.
Who We Are
This joint notice describes the privacy policies of the Oppenheimer funds, OppenheimerFunds Distributor, Inc., the trustee of OppenheimerFunds Individual Retirement Accounts (IRAs) and the custodian of the OppenheimerFunds 403(b)(7) tax sheltered custodial accounts. It applies to all Oppenheimer fund accounts you presently have, or may open in the future, using your Social Security number — whether or not you remain a shareholder of our funds. This notice was last updated January 16, 2004. In the event it is updated or changed, we will post an updated notice on our website at www.oppenheimerfunds.com. If you have any questions about these privacy policies, write to us at P.O. Box 5270, Denver, CO 80217-5270, email us by clicking on the Contact Us section of our website at www.oppenheimerfunds.com or call us at 1.800.525.7048.
50 | EQUITY INVESTOR FUND
Item 2. Code of Ethics.
The registrant has adopted a code of ethics that applies to the registrant’s principal executive officer, principal financial officer, principal accounting officer or controller or persons performing similar functions.
Item 3. Audit Committee Financial Expert.
The Board of Trustees of the registrant has determined that David Downes, the Board’s Audit Committee Chairman, is an audit committee financial expert and that Mr. Downes is “independent” for purposes of this Item 3.
Item 4. Principal Accountant Fees and Services.
(a) Audit Fees
The principal accountant for the audit of the registrant’s annual financial statements billed $75,300 in fiscal 2011 and $75,300 in fiscal 2010.
(b) Audit-Related Fees
The principal accountant for the audit of the registrant’s annual financial statements billed no such fees during the last two fiscal years.
The principal accountant for the audit of the registrant’s annual financial statements billed $342,900 in fiscal 2011 and $269,540 in fiscal 2010 to the registrant’s investment adviser or any entity controlling, controlled by, or under common control with the adviser that provides ongoing services to the registrant.
Such services include: internal control reviews, audit of capital accumulation plan and professional services for FIN 45 and FAS 157.
(c) Tax Fees
The principal accountant for the audit of the registrant’s annual financial statements billed $32,400 in fiscal 2011 and $35,500 in fiscal 2010.
The principal accountant for the audit of the registrant’s annual financial statements billed no such fees to the registrant during the last two fiscal years to the registrant’s investment adviser or any entity controlling, controlled by, or under common control with the adviser that provides ongoing services to the registrant.
Such services include: tax compliance, tax planning and tax advice. Tax compliance generally involves preparation of original and amended tax returns, claims for a refund and tax payment-
planning services. Tax planning and tax advice includes assistance with tax audits and appeals, tax advice related to mergers and acquisitions and requests for rulings or technical advice from taxing authorities.
(d) All Other Fees
The principal accountant for the audit of the registrant’s annual financial statements billed no such fees during the last two fiscal years.
The principal accountant for the audit of the registrant’s annual financial statements billed no such fees during the last two fiscal years to the registrant’s investment adviser or any entity controlling, controlled by, or under common control with the adviser that provides ongoing services to the registrant.
| (e) | | (1) During its regularly scheduled periodic meetings, the registrant’s audit committee will pre-approve all audit, audit-related, tax and other services to be provided by the principal accountants of the registrant. |
| |
| | | The audit committee has delegated pre-approval authority to its Chairman for any subsequent new engagements that arise between regularly scheduled meeting dates provided that any fees such pre-approved are presented to the audit committee at its next regularly scheduled meeting. |
| |
| | | Under applicable laws, pre-approval of non-audit services maybe waived provided that: 1) the aggregate amount of all such services provided constitutes no more than five percent of the total amount of fees paid by the registrant to it principal accountant during the fiscal year in which services are provided 2) such services were not recognized by the registrant at the time of engagement as non-audit services and 3) such services are promptly brought to the attention of the audit committee of the registrant and approved prior to the completion of the audit. |
| |
| | | (2) 100% |
| |
| (f) | | Not applicable as less than 50%. |
| |
| (g) | | The principal accountant for the audit of the registrant’s annual financial statements billed $375,300 in fiscal 2011 and $305,040 in fiscal 2010 to the registrant and the registrant’s investment adviser or any entity controlling, controlled by, or under common control with the adviser that provides ongoing services to the registrant related to non-audit fees. Those billings did not include any prohibited non-audit services as defined by the Securities Exchange Act of 1934. |
| |
| (h) | | The registrant’s audit committee of the board of trustees has considered whether the provision of non-audit services that were rendered to the registrant’s investment adviser, and any entity controlling, controlled by, or under common control with the investment |
| | | adviser that provides ongoing services to the registrant that were not pre-approved pursuant to paragraph (c)(7)(ii) of Rule 2-01 of Regulation S-X is compatible with maintaining the principal accountant’s independence. No such services were rendered. |
Item 5. Audit Committee of Listed Registrants
Not applicable.
Item 6. Schedule of Investments.
a) Not applicable. The complete schedule of investments is included in Item 1 of this Form N-CSR.
b) Not applicable.
Item 7. Disclosure of Proxy Voting Policies and Procedures for Closed-End Management Investment Companies.
Not applicable.
Item 8. Portfolio Managers of Closed-End Management Investment Companies.
Not applicable.
Item 9. Purchases of Equity Securities by Closed-End Management Investment Company and Affiliated Purchasers.
Not applicable.
Item 10. Submission of Matters to a Vote of Security Holders.
The Fund’s Governance Committee Provisions with Respect to Nominations of Directors/Trustees to the Respective Boards
| 1. | | The Fund’s Governance Committee (the “Committee”) will evaluate potential Board candidates to assess their qualifications. The Committee shall have the authority, upon approval of the Board, to retain an executive search firm to assist in this effort. The Committee may consider recommendations by business and personal contacts of current Board members and by executive search firms which the Committee may engage from time to time and may also consider shareholder recommendations. The Committee may consider the advice and recommendation of the Funds’ investment manager and its affiliates in making the selection. |
| |
| 2. | | The Committee shall screen candidates for Board membership. The Committee has not established specific qualifications that it believes must be met by a trustee nominee. In |
| | | evaluating trustee nominees, the Committee considers, among other things, an individual’s background, skills, and experience; whether the individual is an “interested person” as defined in the Investment Company Act of 1940; and whether the individual would be deemed an “audit committee financial expert” within the meaning of applicable SEC rules. The Committee also considers whether the individual’s background, skills, and experience will complement the background, skills, and experience of other nominees and will contribute to the Board. There are no differences in the manner in which the Committee evaluates nominees for trustees based on whether the nominee is recommended by a shareholder. |
| |
| 3. | | The Committee may consider nominations from shareholders for the Board at such times as the Committee meets to consider new nominees for the Board. The Committee shall have the sole discretion to determine the candidates to present to the Board and, in such cases where required, to shareholders. Recommendations for trustee nominees should, at a minimum, be accompanied by the following: |
| | • | | the name, address, and business, educational, and/or other pertinent background of the person being recommended; |
| |
| | • | | a statement concerning whether the person is an “interested person” as defined in the Investment Company Act of 1940; |
| |
| | • | | any other information that the Funds would be required to include in a proxy statement concerning the person if he or she was nominated; and |
| |
| | • | | the name and address of the person submitting the recommendation and, if that person is a shareholder, the period for which that person held Fund shares. |
| | | The recommendation also can include any additional information which the person submitting it believes would assist the Committee in evaluating the recommendation. |
| |
| 4. | | Shareholders should note that a person who owns securities issued by Massachusetts Mutual Life Insurance Company (the parent company of the Funds’ investment adviser) would be deemed an “interested person” under the Investment Company Act of 1940. In addition, certain other relationships with Massachusetts Mutual Life Insurance Company or its subsidiaries, with registered broker-dealers, or with the Funds’ outside legal counsel may cause a person to be deemed an “interested person.” |
| |
| 5. | | Before the Committee decides to nominate an individual as a trustee, Committee members and other directors customarily interview the individual in person. In addition, the individual customarily is asked to complete a detailed questionnaire which is designed to elicit information which must be disclosed under SEC and stock exchange rules and to determine whether the individual is subject to any statutory disqualification from serving as a trustee of a registered investment company. |
Item 11. Controls and Procedures.
Based on their evaluation of the registrant’s disclosure controls and procedures (as defined in rule 30a-3(c) under the Investment Company Act of 1940 (17 CFR 270.30a-3(c)) as of 01/31/2011, the registrant’s principal executive officer and principal financial officer found the registrant’s disclosure controls and procedures to provide reasonable assurances that information required to be disclosed by the registrant in the reports that it files under the Securities Exchange Act of 1934 (a) is accumulated and communicated to registrant’s management, including its principal executive officer and principal financial officer, to allow timely decisions regarding required disclosure, and (b) is recorded, processed, summarized and reported, within the time periods specified in the rules and forms adopted by the U.S. Securities and Exchange Commission.
There have been no changes in the registrant’s internal controls over financial reporting that occurred during the registrant’s second fiscal quarter of the period covered by this report that have materially affected, or are reasonably likely to materially affect, the registrant’s internal control over financial reporting.
Item 12. Exhibits.
| (a) | | (1) Exhibit attached hereto. |
| |
| | (2) Exhibits attached hereto. |
| |
| | (3) Not applicable. |
| |
| (b) | | Exhibit attached hereto. |
SIGNATURES
Pursuant to the requirements of the Securities Exchange Act of 1934 and the Investment Company Act of 1940, the registrant has duly caused this report to be signed on its behalf by the undersigned, thereunto duly authorized.
Oppenheimer Portfolio Series
| | | | | |
| | | |
| | By: | /s/ William F. Glavin, Jr. | |
| | | William F. Glavin, Jr. | |
| | | Principal Executive Officer | |
Date: 03/07/2011
Pursuant to the requirements of the Securities Exchange Act of 1934 and the Investment Company Act of 1940, this report has been signed below by the following persons on behalf of the registrant and in the capacities and on the dates indicated.
| | | | | |
| | | |
| | By: | /s/ William F. Glavin, Jr. | |
| | | William F. Glavin, Jr. | |
| | | Principal Executive Officer | |
Date: 03/07/2011
| | | | | |
| | | |
| | By: | /s/ Brian W. Wixted | |
| | | Brian W. Wixted | |
| | | Principal Financial Officer | |