UNITED STATES
SECURITIES AND EXCHANGE COMMISSION
WASHINGTON, D.C. 20549
FORM N-CSR
CERTIFIED SHAREHOLDER REPORT OF REGISTERED
MANAGEMENT INVESTMENT COMPANIES
Investment Company Act file number 811-21686
Oppenheimer Portfolio Series
(Exact name of registrant as specified in charter)
6803 South Tucson Way, Centennial, Colorado 80112-3924
(Address of principal executive offices) (Zip code)
Arthur S. Gabinet
OFI Global Asset Management, Inc.
Two World Financial Center, New York, New York 10281-1008
(Name and address of agent for service)
Registrant’s telephone number, including area code: (303) 768-3200
Date of fiscal year end: January 31
Date of reporting period: 1/31/2014
Item 1. Reports to Stockholders.
2 OPPENHEIMER PORTFOLIO SERIES CONSERVATIVE INVESTOR FUND
Class A Shares
AVERAGE ANNUAL TOTAL RETURNS AT 1/31/14
Class A Shares of the Fund | ||||||||||
| Without Sales Charge | With Sales Charge | Barclays U.S. Aggregate Bond Index | S&P 500 Index | |||||||
1-Year | 3.75 % | -2.22 % | 0.12 % | 21.52 % | ||||||
| ||||||||||
5-Year | 9.29 | 8.00 | 4.93 | 19.19 | ||||||
| ||||||||||
Since Inception (4/5/05) | 1.47 | 0.79 | 4.88 | 7.00 | ||||||
| ||||||||||
Performance data quoted represents past performance, which does not guarantee future results. The investment return and principal value of an investment in the Fund will fluctuate so that an investor’s shares, when redeemed, may be worth more or less than their original cost. Fund returns include changes in share price, reinvested distributions, and a 5.75% maximum applicable sales charge except where “without sales charge” is indicated. Current performance may be lower or higher than the performance quoted. Returns do not consider capital gains or income taxes on an individual’s investment. For performance data current to the most recent month-end, visit oppenheimerfunds.com or call 1.800.CALL OPP (225.5677).
3 OPPENHEIMER PORTFOLIO SERIES CONSERVATIVE INVESTOR FUND
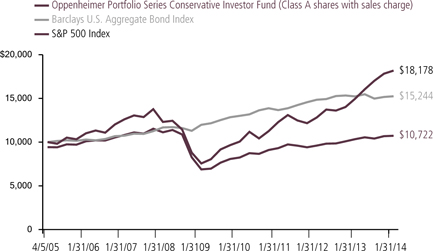
During the one-year reporting period ended January 31, 2014, the Fund’s Class A shares (without sales charge) produced a total return of 3.75%. During a period in which equities outperformed fixed-income securities, the Fund outperformed the Barclays U.S. Aggregate Bond Index’s return of 0.12%, but underperformed the S&P 500 Index’s return of 21.52%.
MARKET OVERVIEW
Accommodative monetary policies on the part of central banks in the U.S., Europe and Japan, combined with an improving economic outlook, resulted in a rally among equities and higher-yielding bonds over the first four months of 2013. At the same time, yields of U.S. government securities remained near historical lows due to the Federal Reserve’s (the “Fed’s”) massive bond buying program. These developments drove financial markets higher through the early spring of 2013. At
that time, economic data appeared to confirm that the United States, Europe and Japan had engineered a sustained economic rebound, but investors responded negatively to disappointing economic data from China, India, Brazil, and other emerging markets. The ensuing “flight to quality” toward traditional safe havens produced sharp dislocations in emerging equity, fixed- income and currency markets. In late May,
COMPARISON OF CHANGE IN VALUE OF $10,000 HYPOTHETICAL INVESTMENTS IN:
1 The Fund is invested in Class I shares of all underlying funds discussed in this Fund Performance Discussion, except for Oppenheimer Master Loan Fund, LLC and Master Inflation Protected Securities Fund, LLC, which do not offer Class I shares.
4 OPPENHEIMER PORTFOLIO SERIES CONSERVATIVE INVESTOR FUND
remarks by Fed chairman Ben Bernanke were widely interpreted as a signal that U.S. monetary policymakers would begin to back away from their quantitative easing program sooner than expected, sparking heightened volatility in financial markets throughout the world. However, market conditions generally stabilized over the summer of 2013. In October, the U.S. Congress managed to reach a bipartisan agreement to raise the national debt ceiling, and did so well ahead of the potential default deadline. While the Fed refrained from reducing its monthly bond purchases in September, in December the Central Bank announced that it would reduce its monthly bond purchases by $10 billion, from $85 billion to $75 billion, starting in January 2014. The Fed also continued to hold short-term interest rates at very low levels throughout the reporting period. Against this backdrop, equities generally performed well over 2013, with fixed-income producing muted results. While concerns that ongoing downturns in the emerging markets might dampen the U.S. economic recovery resulted in renewed volatility in stock and bond markets over January 2014, corporate earnings growth generally remained strong, and the unemployment rate fell.
FUND REVIEW
The Fund had its largest allocation to underlying fixed-income funds at period end. The Fund’s largest holding, Oppenheimer Core Bond Fund, benefited performance this reporting period. During
the reporting period, the underlying fund maintained limited exposure to government bonds and favored corporate bonds, mortgage-backed securities (“MBS”) and structured products. This positioning benefited the underlying fund’s performance during the period, as higher-yielding fixed income sectors outperformed the performance of U.S. Treasuries. The underlying fund outperformed its benchmarks, the Barclays Credit Index, Barclays U.S. Aggregate Bond Index and the Citigroup Broad Investment Grade Bond Index. The Fund’s next largest underlying fixed-income funds were Oppenheimer Limited-Term Government Fund, Oppenheimer International Bond Fund and Oppenheimer Master Loan Fund, LLC. Oppenheimer Limited-Term Government Fund produced a muted return during the reporting period, as U.S. Government bonds lagged higher-yielding fixed-income sectors and equities. An allocation to MBS did benefit the underlying fund this reporting period. Relative to its benchmarks, the underlying fund outperformed the Barclays U.S. Government Bond Index, but underperformed the Barclays U.S. 1-3 Year Government Bond Index. Oppenheimer International Bond Fund produced a negative return this reporting period. As it has for some time, the underlying fund had a large allocation to emerging market debt. Specifically, the underlying fund’s position in emerging market local currency debt hurt its performance when volatility in the emerging markets climbed amid reactions to the potential for reduced levels of global
5 OPPENHEIMER PORTFOLIO SERIES CONSERVATIVE INVESTOR FUND
liquidity. Meanwhile, an allocation into European credit was additive to performance. The underlying fund did outperform its Reference Index, which is a customized weighted index comprised of 50% of the Citigroup Non-U.S. Dollar World Government Bond Index, 30% of the JPMorgan Government Bond Index - Emerging Markets Global Diversified, and 20% of the JPMorgan Emerging Markets Bond Index Global Diversified. Oppenheimer Master Loan Fund, LLC, which invests primarily in senior loans, benefited as senior floating-rate bank loans performed well during the reporting period. The underlying fund outperformed its benchmark, the Credit Suisse Leveraged Loan Index.
The largest underlying domestic equity holdings of the Fund were Oppenheimer Value Fund and Oppenheimer Capital Appreciation Fund. These two underlying funds provided the strongest contribution to the Fund’s return on an absolute basis this period. Oppenheimer Value Fund and Oppenheimer Capital Appreciation Fund received their best absolute results from securities in the financials sector and health care sector, respectively. However, they underperformed their benchmarks, the S&P 500 Index and the Russell 1000 Value Index (for Oppenheimer Value Fund), and the S&P 500 Index and the Russell 1000 Growth Index (for Oppenheimer Capital Appreciation Fund). The Fund had a smaller allocation to Oppenheimer Main Street Small- & Mid-Cap Fund, which also
performed positively. The underlying fund’s absolute performance was driven by certain stocks within the health care sector. However, on a relative basis, the underlying fund underperformed its benchmark, the Russell 2500 Index.
The Fund’s largest foreign equity funds at period end and its strongest contributors to performance in the space were Oppenheimer International Growth Fund and Oppenheimer International Value Fund. Oppenheimer International Growth Fund’s performance was driven largely by holdings in the information technology sector. Oppenheimer International Value Fund received its best absolute performance from stocks in the consumer discretionary sector this reporting period. Both of these underlying funds outperformed their benchmarks, the MSCI All Country World ex-U.S. Index and the MSCI EAFE Index.
The Fund’s smaller allocation to alternative funds had a slight negative effect on performance this reporting period. Oppenheimer Gold & Special Minerals Fund, Oppenheimer Master Inflation Protected Securities Fund, LLC, and Oppenheimer Commodity Strategy Total Return Fund produced negative returns this period. Gold stocks and gold bullion remained out of favor among investors over the reporting period, mainly due to their preference for companies that are more leveraged to recovering U.S. and global economies. Although Oppenheimer Gold & Special Minerals Fund underperformed its
6 OPPENHEIMER PORTFOLIO SERIES CONSERVATIVE INVESTOR FUND
benchmark, the MSCI World Index, it performed in line with other gold and precious metals indices, such as the Philadelphia Gold & Silver Index. Oppenheimer Master Inflation Protected Securities Fund, LLC, invests primarily in Treasury Inflation-Protected Securities (TIPS), whose performance is closely correlated to U.S. inflation rates. Inflation continued to be tame as the Consumer Price Index (“CPI”) annual inflation rate was 1.6% before seasonal adjustment for the one-year period ended January 31, 2014, according to data from the Bureau of Labor Statistics at period end. This underlying fund performed in line with its benchmark, the Barclays U.S. Treasury Inflation Protected Securities Index, during the reporting period. Oppenheimer Commodity Strategy Total Return Fund was hurt as a variety of factors pressured commodity prices throughout the year, including the Fed’s taper talk starting in the spring, the relative stability of the U.S. dollar, a rising equity market, low inflation, a change in China’s growth priorities and fears about slowing emerging market demand. The underlying fund outperformed its benchmark, the Dow Jones-UBS Commodity Index Total Return, during the reporting period.
Oppenheimer Global Multi Strategies Fund and Oppenheimer Real Estate Fund were underlying alternative funds that produced positive absolute results for the Fund this reporting period. Oppenheimer Global Multi Strategies Fund seeks to offer the benefit of
hedge fund-like strategies (Global Macro, Equity Market Neutral, Volatility, Fixed Income Alternative) with the transparency, pricing and daily liquidity of a mutual fund. The underlying fund’s Global Macro strategy, which involves tactical positioning in broad asset and/or sector classes, helped drive its performance. Relative to its benchmarks, the underlying fund outperformed the Barclays Global Aggregate Bond Index, but underperformed the S&P 500 Index. Oppenheimer Real Estate Fund performed well early in the reporting period as the economic outlook continued to improve, and fears surrounded the fiscal cliff drama in Washington abated. While the Fed’s discussion of tapering did result in volatility for the underlying fund this period, it maintained a positive return for the overall reporting period. The underlying fund outperformed its benchmark, the FTSE NAREIT Equity REIT Index, during the reporting period.
 |  | |
Mark Hamilton2 Portfolio Manager | ||
2. Mark Hamilton became a Portfolio Manager in August 2013. | ||
7 OPPENHEIMER PORTFOLIO SERIES CONSERVATIVE INVESTOR FUND
| [ | ||||
ASSET CLASS ALLOCATION
Domestic Fixed Income Funds | 42.1% | |||
Domestic Equity Funds | 23.4 | |||
Alternative Funds | 17.3 | |||
Foreign Fixed Income Fund | 10.7 | |||
Foreign Equity Funds | 5.3 | |||
Money Market Fund | 1.2 |
Portfolio holdings and allocations are subject to change. Percentages are as of January 31, 2014, and are based on the total market value of investments.
TOP TEN HOLDINGS
Oppenheimer Core Bond Fund, Cl. I | 25.5% | |||
Oppenheimer Limited-Term Government Fund, Cl. I | 11.6 | |||
Oppenheimer Value Fund, Cl. I | 10.8 | |||
Oppenheimer International Bond Fund, Cl. I | 10.7 | |||
Oppenheimer Capital Appreciation Fund, Cl. I | 9.2 | |||
Oppenheimer Master Inflation Protected Securities Fund, LLC | 6.8 | |||
Oppenheimer Master Loan Fund, LLC | 5.0 | |||
Oppenheimer Main Street Small- & Mid-Cap Fund, Cl. I | 3.5 | |||
Oppenheimer Real Estate Fund, Cl. I | 2.7 | |||
Oppenheimer Global Multi Strategies Fund, Cl. I | 2.7 |
Portfolio holdings and allocations are subject to change. Percentages are as of January 31, 2014, and are based on net assets. For more current Top 10 Fund holdings, please visit oppenheimerfunds.com.
8 OPPENHEIMER PORTFOLIO SERIES CONSERVATIVE INVESTOR FUND
Share Class Performance
AVERAGE ANNUAL TOTAL RETURNS WITHOUT SALES CHARGE AS OF 1/31/14
| Inception Date | 1-Year | 5-Year | Since Inception | |||||
Class A (OACIX) | 4/5/05 | 3.75% | 9.29% | 1.47% | ||||
| ||||||||
Class B (OBCIX) | 4/5/05 | 2.90% | 8.34% | 0.89% | ||||
| ||||||||
Class C (OCCIX) | 4/5/05 | 2.89% | 8.43% | 0.66% | ||||
| ||||||||
Class N (ONCIX) | 4/5/05 | 3.40% | 8.97% | 1.17% | ||||
| ||||||||
Class Y (OYCIX) | 4/5/05 | 4.01% | 9.60% | 1.78% | ||||
| ||||||||
AVERAGE ANNUAL TOTAL RETURNS WITH SALES CHARGE AS OF 1/31/14
| ||||||||
| Inception Date | 1-Year | 5-Year | Since Inception | |||||
Class A (OACIX) | 4/5/05 | -2.22% | 8.00% | 0.79% | ||||
| ||||||||
Class B (OBCIX) | 4/5/05 | -2.10% | 8.05% | 0.89% | ||||
| ||||||||
Class C (OCCIX) | 4/5/05 | 1.89% | 8.43% | 0.66% | ||||
| ||||||||
Class N (ONCIX) | 4/5/05 | 2.40% | 8.97% | 1.17% | ||||
| ||||||||
Class Y (OYCIX) | 4/5/05 | 4.01% | 9.60% | 1.78% | ||||
| ||||||||
Performance data quoted represents past performance, which does not guarantee future results. The investment return and principal value of an investment in the Fund will fluctuate so that an investor’s shares, when redeemed, may be worth more or less than their original cost. Current performance may be lower or higher than the performance quoted. Returns do not consider capital gains or income taxes on an individual’s investment. For performance data current to the most recent month-end, visit oppenheimerfunds.com or call 1.800.CALL OPP (225.5677). Fund returns include changes in share price, reinvested distributions, and the applicable sales charge: for Class A shares, the current maximum initial sales charge of 5.75%; for Class B shares, the contingent deferred sales charge of 5% (1-year) and 2% (5-year); and for Class C and N shares, the contingent deferred sales charge of 1% for the 1-year period. There is no sales charge for Class Y shares. Because Class B shares convert to Class A shares 72 months after purchase, the 10-year return for Class B shares uses Class A performance for the period after conversion.
The Fund’s performance is compared to the performance of the Barclays U.S. Aggregate Bond Index and the S&P 500 Index. The Barclays U.S. Aggregate Bond Index is an unmanaged, broad-based index of investment grade corporate debt. The S&P 500 Index is an unmanaged index of large-capitalization equity securities that is a measure of the general domestic stock market. The indices are unmanaged and cannot be purchased directly by investors. Index performance includes reinvestment of income, but does not reflect transaction costs, fees, expenses or taxes. Index performance is shown for illustrative purposes only as a benchmark for the Fund’s performance, and does not predict or depict performance of the Fund. The Fund’s performance reflects the effects of the Fund’s business and operating expenses.
The Fund’s investment strategy and focus can change over time. The mention of specific fund holdings does not constitute a recommendation by OppenheimerFunds, Inc. or its affiliates.
Before investing in any of the Oppenheimer funds, investors should carefully consider a fund’s investment objectives, risks, charges and expenses. Fund
9 OPPENHEIMER PORTFOLIO SERIES CONSERVATIVE INVESTOR FUND
prospectuses and summary prospectuses contain this and other information about the funds, and may be obtained by asking your financial advisor, visiting oppenheimerfunds.com, or calling 1.800.CALL OPP (225.5677). Read prospectuses and summary prospectuses carefully before investing.
Shares of Oppenheimer funds are not deposits or obligations of any bank, are not guaranteed by any bank, are not insured by the FDIC or any other agency, and involve investment risks, including the possible loss of the principal amount invested.
10 OPPENHEIMER PORTFOLIO SERIES CONSERVATIVE INVESTOR FUND
Fund Expenses. As a shareholder of the Fund, you incur two types of costs: (1) transaction costs, which may include sales charges (loads) on purchase payments, contingent deferred sales charges on redemptions; and (2) ongoing costs, including management fees; distribution and service fees; and other Fund expenses. These examples are intended to help you understand your ongoing costs (in dollars) of investing in the Fund and to compare these costs with the ongoing costs of investing in other mutual funds.
The examples are based on an investment of $1,000.00 invested at the beginning of the period and held for the entire 6-month period ended January 31, 2014.
Actual Expenses. The first section of the table provides information about actual account values and actual expenses. You may use the information in this section for the class of shares you hold, together with the amount you invested, to estimate the expense that you paid over the period. Simply divide your account value by $1,000.00 (for example, an $8,600.00 account value divided by $1,000.00 = 8.60), then multiply the result by the number in the first section under the heading entitled “Expenses Paid During Period” to estimate the expenses you paid on your account during this period.
Hypothetical Example for Comparison Purposes. The second section of the table provides information about hypothetical account values and hypothetical expenses based on the Fund’s actual expense ratio for each class of shares, and an assumed rate of return of 5% per year for each class before expenses, which is not the actual return. The hypothetical account values and expenses may not be used to estimate the actual ending account balance or expenses you paid for the period. You may use this information to compare the ongoing costs of investing in the Fund and other funds. To do so, compare this 5% hypothetical example for the class of shares you hold with the 5% hypothetical examples that appear in the shareholder reports of the other funds.
Please note that the expenses shown in the table are meant to highlight your ongoing costs only and do not reflect any transactional costs, such as front-end or contingent deferred sales charges (loads), or a $12.00 fee imposed annually on accounts valued at less than $500.00 (subject to exceptions described in the Statement of Additional Information). Therefore, the “hypothetical” section of the table is useful in comparing ongoing costs only, and will not help you determine the relative total costs of owning different funds. In addition, if these transactional costs were included, your costs would have been higher.
11 OPPENHEIMER PORTFOLIO SERIES CONSERVATIVE INVESTOR FUND
| Actual | Beginning Account Value | Ending Account Value January 31, 2014 | Expenses Paid During 6 Months Ended January 31, 2014 | |||||||||
| ||||||||||||
Class A | $ | 1,000.00 | $ | 1,030.30 | $ | 2.25 | ||||||
| ||||||||||||
Class B | 1,000.00 | 1,026.60 | 6.20 | |||||||||
| ||||||||||||
Class C | 1,000.00 | 1,025.30 | 6.14 | |||||||||
| ||||||||||||
Class N | 1,000.00 | 1,029.20 | 3.54 | |||||||||
| ||||||||||||
Class Y | 1,000.00 | 1,031.70 | 0.87 | |||||||||
Hypothetical (5% return before expenses) | ||||||||||||
| ||||||||||||
Class A | 1,000.00 | 1,022.99 | 2.25 | |||||||||
| ||||||||||||
Class B | 1,000.00 | 1,019.11 | 6.18 | |||||||||
| ||||||||||||
Class C | 1,000.00 | 1,019.16 | 6.13 | |||||||||
| ||||||||||||
Class N | 1,000.00 | 1,021.73 | 3.52 | |||||||||
| ||||||||||||
Class Y | 1,000.00 | 1,024.35 | 0.87 | |||||||||
Expenses are equal to the Fund’s annualized expense ratio for that class, multiplied by the average account value over the period, multiplied by 184/365 (to reflect the one-half year period). Those annualized expense ratios, excluding indirect expenses from affiliated funds, based on the 6-month period ended January 31, 2014 are as follows:
| Class | Expense Ratios | |||||
| ||||||
Class A | 0.44% | |||||
| ||||||
Class B | 1.21 | |||||
| ||||||
Class C | 1.20 | |||||
| ||||||
Class N | 0.69 | |||||
| ||||||
Class Y | 0.17 | |||||
The expense ratios reflect voluntary and/or contractual waivers and/or reimbursements of expenses by the Fund’s Manager and Transfer Agent. Some of these undertakings may be modified or terminated at any time, as indicated in the Fund’s prospectus. The “Financial Highlights” tables in the Fund’s financial statements, included in this report, also show the gross expense ratios, without such waivers or reimbursements and reduction to custodian expenses, if applicable.
12 OPPENHEIMER PORTFOLIO SERIES CONSERVATIVE INVESTOR FUND
| STATEMENTOF INVESTMENTS January 31, 2014 | ||||
| Shares | Value | |||||||
| ||||||||
Investment Companies—100.1%1 | ||||||||
| ||||||||
Alternative Funds—17.3% | ||||||||
Oppenheimer Commodity Strategy Total Return Fund, Cl. I2 | 3,900,433 | $ | 11,623,289 | |||||
| ||||||||
Oppenheimer Currency Opportunities Fund, Cl. I2 | 703,120 | 9,548,366 | ||||||
| ||||||||
Oppenheimer Global Multi Strategies Fund, Cl. I2 | 561,059 | 14,694,129 | ||||||
| ||||||||
Oppenheimer Gold & Special Minerals Fund, Cl. I2 | 427,561 | 7,499,412 | ||||||
| ||||||||
Oppenheimer Master Inflation Protected Securities Fund, LLC | 3,285,100 | 37,510,370 | ||||||
| ||||||||
Oppenheimer Real Estate Fund, Cl. I | 611,102 | 14,703,106 | ||||||
|
| |||||||
| 95,578,672 | ||||||||
| ||||||||
Domestic Equity Funds—23.5% | ||||||||
Oppenheimer Capital Appreciation Fund, Cl. I | 836,423 | 50,946,502 | ||||||
| ||||||||
Oppenheimer Main Street Small- & Mid-Cap Fund, Cl. I | 616,057 | 19,399,649 | ||||||
| ||||||||
Oppenheimer Value Fund, Cl. I | 2,051,888 | 59,504,748 | ||||||
|
| |||||||
| 129,850,899 | ||||||||
| ||||||||
Domestic Fixed Income Funds—42.1% | ||||||||
Oppenheimer Core Bond Fund, Cl. I | 20,779,782 | 141,094,718 | ||||||
| ||||||||
Oppenheimer Limited-Term Government Fund, Cl. I | 7,015,394 | 63,980,397 | ||||||
| ||||||||
Oppenheimer Master Loan Fund, LLC | 1,948,059 | 27,775,267 | ||||||
|
| |||||||
| 232,850,382 | ||||||||
| ||||||||
Foreign Equity Funds—5.3% | ||||||||
Oppenheimer Developing Markets Fund, Cl. I | 111,683 | 3,867,567 | ||||||
| ||||||||
Oppenheimer International Growth Fund, Cl. I | 339,038 | 12,232,479 | ||||||
| ||||||||
Oppenheimer International Small Company Fund, Cl. I | 97,886 | 3,131,372 | ||||||
| ||||||||
Oppenheimer International Value Fund, Cl. I | 556,717 | 10,276,995 | ||||||
|
| |||||||
| 29,508,413 | ||||||||
| ||||||||
Foreign Fixed Income Fund—10.7% | ||||||||
Oppenheimer International Bond Fund, Cl. I | 9,873,734 | 59,143,665 | ||||||
| ||||||||
Money Market Funds—1.2% | ||||||||
Oppenheimer Institutional Money Market Fund, Cl. E, 0.08%3 | 6,710,370 | 6,710,370 | ||||||
| ||||||||
Total Investments, at Value (Cost $497,691,105) | 100.1% | 553,642,401 | ||||||
| ||||||||
Liabilities in Excess of Other Assets | (0.1) | (628,568) | ||||||
|
| |||||||
Net Assets | 100.0% | $ | 553,013,833 | |||||
|
| |||||||
Footnotes to Statement of Investments
1. Is or was an affiliate, as defined in the Investment Company Act of 1940, at or during the period ended January 31, 2014, by virtue of the Fund owning at least 5% of the voting securities of the issuer or as a result of the Fund and the issuer having the same investment adviser. Transactions during the period in which the issuer was an affiliate are as follows:
13 OPPENHEIMER PORTFOLIO SERIES CONSERVATIVE INVESTOR FUND
| Footnotes to Statement of Investments Continued | ||||
| Shares January 31, 2013 | Gross Additions | Gross Reductions | Shares January 31, 2014 | |||||||||||||
| ||||||||||||||||
Oppenheimer Capital Appreciation Fund, Cl. I | — | 940,846 a | 104,423 | 836,423 | ||||||||||||
Oppenheimer Capital Appreciation Fund, Cl. Y | 869,717 | 24,306 | 894,023 a | — | ||||||||||||
Oppenheimer Commodity Strategy Total Return Fund, Cl. I | — | 4,249,587 a | 349,154 | 3,900,433 | ||||||||||||
Oppenheimer Commodity Strategy Total Return Fund, Cl. Y | 3,866,450 | 94,486 | 3,960,936 a | — | ||||||||||||
Oppenheimer Core Bond Fund, Cl. I | — | 22,507,696 a | 1,727,914 | 20,779,782 | ||||||||||||
Oppenheimer Core Bond Fund, Cl. Y | 20,169,133 | 683,573 | 20,852,706 a | — | ||||||||||||
Oppenheimer Currency Opportunities Fund, Cl. I | — | 767,617 a | 64,497 | 703,120 | ||||||||||||
Oppenheimer Currency Opportunities Fund, Cl. Y | 702,052 | 17,984 | 720,036 a | — | ||||||||||||
Oppenheimer Developing Markets Fund, Cl. I | — | 121,160 a | 9,477 | 111,683 | ||||||||||||
Oppenheimer Developing Markets Fund, Cl. Y | 114,396 | 2,765 | 117,161 a | — | ||||||||||||
Oppenheimer Global Multi Strategies Fund, Cl. I | — | 610,403 a | 49,344 | 561,059 | ||||||||||||
Oppenheimer Global Multi Strategies Fund, Cl. Y | 562,792 | 13,965 | 576,757 a | — | ||||||||||||
Oppenheimer Gold & Special Minerals Fund, Cl. I | — | 473,598 a | 46,037 | 427,561 | ||||||||||||
Oppenheimer Gold & Special Minerals Fund, Cl. Y | 334,915 | 10,868 | 345,783 a | — | ||||||||||||
Oppenheimer Institutional Money Market Fund, Cl. E | 6,890,360 | 510,325 | 690,315 | 6,710,370 | ||||||||||||
Oppenheimer International Bond Fund, Cl. I | — | 10,712,099 a | 838,365 | 9,873,734 | ||||||||||||
Oppenheimer International Bond Fund, Cl. Y | 9,420,862 | 319,820 | 9,740,682 a | — | ||||||||||||
Oppenheimer International Growth Fund, Cl. I | — | 416,197 a | 77,159 | 339,038 | ||||||||||||
Oppenheimer International Growth Fund, Cl. Y | 398,202 | 7,498 | 405,700 a | — | ||||||||||||
Oppenheimer International Small Company Fund, Cl. I | — | 113,678 a | 15,792 | 97,886 | ||||||||||||
Oppenheimer International Small Company Fund, Cl. Y | 108,702 | 3,038 | 111,740 a | — | ||||||||||||
Oppenheimer International Value Fund, Cl. I | — | 603,742 a | 47,025 | 556,717 | ||||||||||||
Oppenheimer International Value Fund, Cl. Y | 568,028 | 12,420 | 580,448 a | — | ||||||||||||
14 OPPENHEIMER PORTFOLIO SERIES CONSERVATIVE INVESTOR FUND
| STATEMENT OF INVESTMENTS Continued | ||||
| Footnotes to Statement of Investments Continued | ||||
| Shares January 31, 2013 | Gross Additions | Gross Reductions | Shares January 31, 2014 | |||||||||||||
| ||||||||||||||||
Oppenheimer Limited-Term Government Fund, Cl. I | — | 7,568,069 a | 552,675 | 7,015,394 | ||||||||||||
Oppenheimer Limited-Term Government Fund, Cl. Y | 7,002,021 | 254,464 | 7,256,485 a | — | ||||||||||||
Oppenheimer Main Street Small- & Mid-Cap Fund, Cl. I | — | 713,967 a | 97,910 | 616,057 | ||||||||||||
Oppenheimer Main Street Small- & Mid-Cap Fund, Cl. Y | 681,929 | 15,129 | 697,058 a | — | ||||||||||||
Oppenheimer Master Inflation Protected Securities Fund, LLC | 3,064,139 | 699,132 | 478,171 | 3,285,100 | ||||||||||||
Oppenheimer Master Loan Fund, LLC | 2,009,400 | 139,519 | 200,860 | 1,948,059 | ||||||||||||
Oppenheimer Real Estate Fund, Cl. I | — | 662,483 a | 51,381 | 611,102 | ||||||||||||
Oppenheimer Real Estate Fund, Cl. Y | 620,396 | 15,551 | 635,947 a | — | ||||||||||||
Oppenheimer Value Fund, Cl. I | — | 2,436,173 a | 384,285 | 2,051,888 | ||||||||||||
Oppenheimer Value Fund, Cl. Y | 2,321,998 | 57,703 | 2,379,701 a | — | ||||||||||||
| Value | Income | Realized Gain (Loss) | ||||||||||||||
| ||||||||||||||||
Oppenheimer Capital Appreciation Fund, Cl. I |
| $ | 50,946,502 | $ | 229,268 | $ | 757,040 | |||||||||
Oppenheimer Capital Appreciation Fund, Cl. Y |
| — | — | 5,508 | ||||||||||||
Oppenheimer Commodity Strategy Total Return Fund, Cl. I |
| 11,623,289 | — | (117,379) | ||||||||||||
Oppenheimer Commodity Strategy Total Return Fund, Cl. Y |
| — | — | (7,161) | ||||||||||||
Oppenheimer Core Bond Fund, Cl. I |
| 141,094,718 | 4,371,934 | (3,870,125) | ||||||||||||
Oppenheimer Core Bond Fund, Cl. Y |
| — | 1,738,022 | (729,724) | ||||||||||||
Oppenheimer Currency Opportunities Fund, Cl. I | 9,548,366 | — | (38,424) | |||||||||||||
Oppenheimer Currency Opportunities Fund, Cl. Y |
| — | — | (1,733) | ||||||||||||
Oppenheimer Developing Markets Fund, Cl. I |
| 3,867,567 | 23,503 | (1,171) | ||||||||||||
Oppenheimer Developing Markets Fund, Cl. Y |
| — | — | (200) | ||||||||||||
Oppenheimer Global Multi Strategies Fund, Cl. I |
| 14,694,129 | — | (8,923) | ||||||||||||
Oppenheimer Global Multi Strategies Fund, Cl. Y |
| — | — | 1,057 | ||||||||||||
Oppenheimer Gold & Special Minerals Fund, Cl. I |
| 7,499,412 | — | (1,258,697) | ||||||||||||
Oppenheimer Gold & Special Minerals Fund, Cl. Y |
| — | — | (173,387) | ||||||||||||
Oppenheimer Institutional Money Market Fund, Cl. E |
| 6,710,370 | 7,605 | — | ||||||||||||
Oppenheimer International Bond Fund, Cl. I |
| 59,143,665 | 1,053,704 | (356,835) | ||||||||||||
Oppenheimer International Bond Fund, Cl. Y |
| — | 390,826 | (2,356) | ||||||||||||
Oppenheimer International Growth Fund, Cl. I |
| 12,232,479 | 139,637 | 739,715 | ||||||||||||
Oppenheimer International Growth Fund, Cl. Y |
| — | — | 4,469 | ||||||||||||
Oppenheimer International Small Company Fund, Cl. I |
| 3,131,372 | 32,188 | 74,970 | ||||||||||||
Oppenheimer International Small Company Fund, Cl. Y |
| — | — | 637 | ||||||||||||
15 OPPENHEIMER PORTFOLIO SERIES CONSERVATIVE INVESTOR FUND
| Footnotes to Statement of Investments Continued | ||||
| Value | Income | Realized Gain (Loss) | ||||||||||
| ||||||||||||
Oppenheimer International Value Fund, Cl. I | $ | 10,276,995 | $ | 227,672 | $ | 71,668 | ||||||
Oppenheimer International Value Fund, Cl. Y | — | — | 2,384 | |||||||||
Oppenheimer Limited-Term Government Fund, Cl. I | 63,980,397 | 1,002,912 | (119,232) | |||||||||
Oppenheimer Limited-Term Government Fund, Cl. Y | — | 487,859 | (17,591) | |||||||||
Oppenheimer Main Street Small- & Mid-Cap Fund, Cl. I | 19,399,649 | 96,246 | 787,957 | |||||||||
Oppenheimer Main Street Small- & Mid-Cap Fund, Cl. Y | — | — | 20,813 | |||||||||
Oppenheimer Master Inflation Protected Securities Fund, LLC | 37,510,370 | 521,561 b | (267,712)b | |||||||||
Oppenheimer Master Loan Fund, LLC | 27,775,267 | 1,838,827 c | 20,099 c | |||||||||
Oppenheimer Real Estate Fund, Cl. I | 14,703,106 | 243,710 | (22,970) | |||||||||
Oppenheimer Real Estate Fund, Cl. Y | — | 40,919 | 3,388 | |||||||||
Oppenheimer Value Fund, Cl. I | 59,504,748 | 988,710 | 1,919,410 | |||||||||
Oppenheimer Value Fund, Cl. Y | — | — | 15,147 | |||||||||
|
| |||||||||||
Total | $ | 553,642,401 | $ | 13,435,103 | $ | (2,569,358) | ||||||
|
| |||||||||||
| a. | The Fund elected to invest in Class I shares of the Underlying Funds as they became available to investors. |
| b. | Represents the amount allocated to the Fund from Oppenheimer Master Inflation Protected Securities Fund, LLC. |
| c. | Represents the amount allocated to the Fund from Oppenheimer Master Loan Fund, LLC. |
2. Non-income producing security.
3. Rate shown is the 7-day yield as of January 31, 2014.
See accompanying Notes to Financial Statements.
16 OPPENHEIMER PORTFOLIO SERIES CONSERVATIVE INVESTOR FUND
ASSETS AND LIABILITIES January 31, 2014 | ||||
| ||||
Assets | ||||
Investments, at value—see accompanying statement of investments—affiliated companies (cost $497,691,105) | $ | 553,642,401 | ||
| ||||
Cash | 338,870 | |||
| ||||
Receivables and other assets: | ||||
Dividends | 781,817 | |||
Shares of beneficial interest sold | 674,586 | |||
Other | 33,749 | |||
|
| |||
Total assets | 555,471,423 | |||
| ||||
Liabilities | ||||
Payables and other liabilities: | ||||
Shares of beneficial interest redeemed | 1,127,498 | |||
Investments purchased | 1,024,554 | |||
Distribution and service plan fees | 124,528 | |||
Transfer and shareholder servicing agent fees | 106,985 | |||
Trustees’ compensation | 38,814 | |||
Shareholder communications | 12,534 | |||
Other | 22,677 | |||
|
| |||
Total liabilities | 2,457,590 | |||
| ||||
Net Assets | $ | 553,013,833 | ||
|
| |||
| ||||
Composition of Net Assets | ||||
Par value of shares of beneficial interest | $ | 63,526 | ||
| ||||
Additional paid-in capital | 626,953,167 | |||
| ||||
Accumulated net investment income | 2,528,955 | |||
| ||||
Accumulated net realized loss on investments | (132,483,111) | |||
| ||||
Net unrealized appreciation on investments | 55,951,296 | |||
|
| |||
Net Assets | $ | 553,013,833 | ||
|
| |||
17 OPPENHEIMER PORTFOLIO SERIES CONSERVATIVE INVESTOR FUND
| ||||
Net Asset Value Per Share | ||||
Class A Shares: | ||||
Net asset value and redemption price per share (based on net assets of $328,791,955 and 37,628,406 shares of beneficial interest outstanding) | $ | 8.74 | ||
Maximum offering price per share (net asset value plus sales charge of 5.75% of offering price) | $ | 9.27 | ||
| ||||
Class B Shares: | ||||
Net asset value, redemption price (excludes applicable contingent deferred sales charge) and offering price per share (based on net assets of $23,456,869 and 2,696,217 shares of beneficial interest outstanding) | $ | 8.70 | ||
| ||||
Class C Shares: | ||||
Net asset value, redemption price (excludes applicable contingent deferred sales charge) and offering price per share (based on net assets of $153,972,803 and 17,835,662 shares of beneficial interest outstanding) | $ | 8.63 | ||
| ||||
Class N Shares: | ||||
Net asset value, redemption price (excludes applicable contingent deferred sales charge) and offering price per share (based on net assets of $43,246,574 and 4,961,418 shares of beneficial interest outstanding) | $ | 8.72 | ||
| ||||
Class Y Shares: | ||||
Net asset value, redemption price and offering price per share (based on net assets of $3,545,632 and 404,378 shares of beneficial interest outstanding) | $ | 8.77 | ||
See accompanying Notes to Financial Statements.
18 OPPENHEIMER PORTFOLIO SERIES CONSERVATIVE INVESTOR FUND
| STATEMENT OF OPERATIONS For the Year Ended January 31, 2014 | ||||||
| ||||
Allocation of Income and Expenses from Master Funds1 | ||||
Net investment income allocated from Oppenheimer Master Inflation Protected Securities Fund, LLC: | ||||
Interest | $ | 521,488 | ||
Dividends | 73 | |||
Net Expenses | (176,885) | |||
|
| |||
Net investment income allocated from Oppenheimer Master Inflation Protected Securities Fund, LLC | 344,676 | |||
| ||||
Net investment income allocated from Oppenheimer Master Loan Fund, LLC: | ||||
Interest | 1,768,431 | |||
Dividends | 70,396 | |||
Net Expenses | (101,245) | |||
|
| |||
Net investment income allocated from Oppenheimer Master Loan Fund, LLC | 1,737,582 | |||
|
| |||
Total allocation of net investment income from master funds | 2,082,258 | |||
|
| |||
Investment Income | ||||
Dividends from affiliated companies | 11,074,715 | |||
| ||||
Interest | 399 | |||
| ||||
Other income | 8,980 | |||
|
| |||
Total investment income | 11,084,094 | |||
|
| |||
Expenses | ||||
Distribution and service plan fees: | ||||
Class A | 795,757 | |||
Class B | 268,093 | |||
Class C | 1,547,265 | |||
Class N | 236,897 | |||
| ||||
Transfer and shareholder servicing agent fees: | ||||
Class A | 647,501 | |||
Class B | 58,662 | |||
Class C | 322,605 | |||
Class N | 104,614 | |||
Class Y | 6,177 | |||
| ||||
Shareholder communications: | ||||
Class A | 47,927 | |||
Class B | 8,573 | |||
Class C | 22,086 | |||
Class N | 4,224 | |||
Class Y | 301 | |||
| ||||
Trustees’ compensation | 11,046 | |||
| ||||
Custodian fees and expenses | 7,042 | |||
| ||||
Other | 21,201 | |||
|
| |||
Total expenses | 4,109,971 | |||
Less waivers and reimbursements of expenses | (603,566) | |||
|
| |||
Net expenses | 3,506,405 | |||
|
| |||
| ||||
Net Investment Income | 9,659,947 | |||
1. The Fund invests in certain affiliated mutual funds that expect to be treated as partnerships for tax purposes. See Note 1 of the accompanying Notes.
19 OPPENHEIMER PORTFOLIO SERIES CONSERVATIVE INVESTOR FUND
| ||||
Realized and Unrealized Gain (Loss) | ||||
Net realized gain (loss) on: | ||||
Investments from: | ||||
Affiliated companies | $ | (2,321,745) | ||
Distributions received from affiliated companies | 3,118,309 | |||
| ||||
Net realized gain (loss) allocated from: | ||||
Oppenheimer Master Inflation Protected Securities Fund, LLC | (267,712) | |||
Oppenheimer Master Loan Fund, LLC | 20,099 | |||
|
| |||
Net realized gain | 548,951 | |||
| ||||
Net change in unrealized appreciation/depreciation on investments | 10,274,157 | |||
| ||||
Net change in unrealized appreciation/depreciation allocated from: | ||||
Oppenheimer Master Inflation Protected Securities Fund, LLC | (2,343,943) | |||
Oppenheimer Master Loan Fund, LLC | 199,613 | |||
|
| |||
Net change in unrealized appreciation/depreciation | 8,129,827 | |||
| ||||
Net Increase in Net Assets Resulting from Operations | $ | 18,338,725 | ||
|
| |||
See accompanying Notes to Financial Statements.
20 OPPENHEIMER PORTFOLIO SERIES CONSERVATIVE INVESTOR FUND
| STATEMENTSOF CHANGES IN NET ASSETS | ||||||
| Year Ended January 31, 2014 | Year Ended January 31, 2013 | |||||||
| ||||||||
Operations | ||||||||
Net investment income | $ | 9,659,947 | $ | 9,712,859 | ||||
| ||||||||
Net realized gain (loss) | 548,951 | (4,856,710) | ||||||
| ||||||||
Net change in unrealized appreciation/depreciation | 8,129,827 | 29,133,030 | ||||||
|
| |||||||
Net increase in net assets resulting from operations | 18,338,725 | 33,989,179 | ||||||
|
|
|
| |||||
| ||||||||
Dividends and/or Distributions to Shareholders | ||||||||
Dividends from net investment income: | ||||||||
Class A | (5,588,157) | (6,318,393) | ||||||
Class B | (185,497) | (363,613) | ||||||
Class C | (1,509,237) | (2,174,217) | ||||||
Class N | (602,136) | (848,451) | ||||||
Class Y | (68,071) | (67,676) | ||||||
|
| |||||||
| (7,953,098) | (9,772,350) | |||||||
|
|
|
| |||||
| ||||||||
Beneficial Interest Transactions | ||||||||
Net increase (decrease) in net assets resulting from beneficial interest transactions: | ||||||||
Class A | 9,965,997 | 61,197,662 | ||||||
Class B | (7,609,283) | (2,578,474) | ||||||
Class C | (2,042,144) | 27,123,279 | ||||||
Class N | (8,191,114) | 1,013,039 | ||||||
Class Y | 594,930 | (276,059) | ||||||
|
| |||||||
| (7,281,614) | 86,479,447 | |||||||
|
|
|
| |||||
| ||||||||
Net Assets | ||||||||
Total increase | 3,104,013 | 110,696,276 | ||||||
| ||||||||
Beginning of period | 549,909,820 | 439,213,544 | ||||||
|
| |||||||
End of period (including accumulated net investment income of $2,528,955 and $845,499,respectively) | $ | 553,013,833 | $ | �� 549,909,820 | ||||
|
| |||||||
See accompanying Notes to Financial Statements.
21 OPPENHEIMER PORTFOLIO SERIES CONSERVATIVE INVESTOR FUND
| FINANCIAL HIGHLIGHTS | ||||
| Class A | Year Ended January 31, 2014 | Year Ended January 31, 2013 | Year Ended January 31, 2012 | Year Ended January 31, 2011 | Year Ended January 31, 2010 | |||||||||||||||
| ||||||||||||||||||||
Per Share Operating Data | ||||||||||||||||||||
Net asset value, beginning of period | $ | 8.57 | $ | 8.13 | $ | 8.12 | $ | 7.39 | $ | 6.23 | ||||||||||
| ||||||||||||||||||||
Income (loss) from investment operations: | ||||||||||||||||||||
Net investment income1 | 0.18 | 0.20 | 0.25 | 0.23 | 0.10 | |||||||||||||||
Net realized and unrealized gain | 0.14 | 0.42 | 0.002 | 0.72 | 1.14 | |||||||||||||||
|
| |||||||||||||||||||
Total from investment operations | 0.32 | 0.62 | 0.25 | 0.95 | 1.24 | |||||||||||||||
| ||||||||||||||||||||
Dividends and/or distributions to shareholders: | ||||||||||||||||||||
Dividends from net investment income | (0.15) | (0.18) | (0.24) | (0.22) | (0.08) | |||||||||||||||
| ||||||||||||||||||||
Net asset value, end of period | $ | 8.74 | $ | 8.57 | $ | 8.13 | $ | 8.12 | $ | 7.39 | ||||||||||
|
| |||||||||||||||||||
| ||||||||||||||||||||
Total Return, at Net Asset Value3 | 3.75% | 7.62% | 3.17% | 12.91% | 19.86% | |||||||||||||||
| ||||||||||||||||||||
Ratios/Supplemental Data | ||||||||||||||||||||
Net assets, end of period (in thousands) | $ | 328,792 | $ | 312,860 | $ | 238,435 | $ | 216,715 | $ | 164,988 | ||||||||||
| ||||||||||||||||||||
Average net assets (in thousands) | $ | 321,008 | $ | 263,955 | $ | 228,718 | $ | 191,109 | $ | 146,527 | ||||||||||
| ||||||||||||||||||||
Ratios to average net assets:4 | ||||||||||||||||||||
Net investment income | 2.04%5 | 2.33% | 5 | 3.05% | 5 | 2.94% | 5 | 1.50% | ||||||||||||
Total expenses6 | 0.52%5 | 0.49% | 5 | 0.48% | 5 | 0.49% | 5 | 0.50% | ||||||||||||
Expenses after payments, waivers and/or reimbursements and reduction to custodian expenses | 0.41%5 | 0.41% | 5 | 0.48% | 5 | 0.49% | 5 | 0.50% | ||||||||||||
| ||||||||||||||||||||
Portfolio turnover rate | 12% | 27% | 12% | 36% | 21% | |||||||||||||||
1. Per share amounts calculated based on the average shares outstanding during the period.
2. Less than $0.005 per share.
3. Assumes an initial investment on the business day before the first day of the fiscal period, with all dividends and distributions reinvested in additional shares on the reinvestment date, and redemption at the net asset value calculated on the last business day of the fiscal period. Sales charges are not reflected in the total returns. Total returns are not annualized for periods less than one full year. Returns do not reflect the deduction of taxes that a shareholder would pay on fund distributions or the redemption of fund shares.
4. Annualized for periods less than one full year.
5. Includes the Fund’s share of the allocated expenses and/or net investment income from the Master Funds.
6. Total expenses including indirect expenses from affiliated fund were as follows:
Year Ended January 31, 2014 | 1.08 | % | ||||
Year Ended January 31, 2013 | 1.08 | % | ||||
Year Ended January 31, 2012 | 1.10 | % | ||||
Year Ended January 31, 2011 | 1.10 | % | ||||
Year Ended January 31, 2010 | 1.10 | % |
See accompanying Notes to Financial Statements.
22 OPPENHEIMER PORTFOLIO SERIES CONSERVATIVE INVESTOR FUND
| FINANCIAL HIGHLIGHTS Continued | ||||
| Class B | Year Ended January 31, 2014 | Year Ended January 31, 2013 | Year Ended January 31, 2012 | Year Ended January 31, 2011 | Year Ended January 31, 2010 | |||||||||||||||
| ||||||||||||||||||||
Per Share Operating Data | ||||||||||||||||||||
Net asset value, beginning of period | $ | 8.52 | $ | 8.07 | $ | 8.07 | $ | 7.35 | $ | 6.20 | ||||||||||
| ||||||||||||||||||||
Income (loss) from investment operations: | ||||||||||||||||||||
Net investment income1 | 0.10 | 0.12 | 0.18 | 0.16 | 0.05 | |||||||||||||||
Net realized and unrealized gain (loss) | 0.15 | 0.43 | (0.01) | 0.71 | 1.11 | |||||||||||||||
|
| |||||||||||||||||||
Total from investment operations | 0.25 | 0.55 | 0.17 | 0.87 | 1.16 | |||||||||||||||
| ||||||||||||||||||||
Dividends and/or distributions to shareholders: | ||||||||||||||||||||
Dividends from net investment income | (0.07) | (0.10) | (0.17) | (0.15) | (0.01) | |||||||||||||||
| ||||||||||||||||||||
Net asset value, end of period | $ | 8.70 | $ | 8.52 | $ | 8.07 | $ | 8.07 | $ | 7.35 | ||||||||||
|
| |||||||||||||||||||
| ||||||||||||||||||||
Total Return, at Net Asset Value2 | 2.90% | 6.84% | 2.15% | 11.90% | 18.77% | |||||||||||||||
| ||||||||||||||||||||
Ratios/Supplemental Data | ||||||||||||||||||||
Net assets, end of period (in thousands) | $ | 23,457 | $ | 30,526 | $ | 31,443 | $ | 31,470 | $ | 28,860 | ||||||||||
| ||||||||||||||||||||
Average net assets (in thousands) | $ | 26,741 | $ | 30,910 | $ | 30,889 | $ | 29,729 | $ | 26,346 | ||||||||||
| ||||||||||||||||||||
Ratios to average net assets:3 | ||||||||||||||||||||
Net investment income | 1.16%4 | 1.47%4 | 2.16%4 | 2.07%4 | 0.72% | |||||||||||||||
Total expenses5 | 1.31%4 | 1.31%4 | 1.34%4 | 1.37%4 | 1.45% | |||||||||||||||
Expenses after payments, waivers and/or reimbursements and reduction to custodian expenses | 1.20%4 | 1.23%4 | 1.34%4 | 1.36%4 | 1.40% | |||||||||||||||
| ||||||||||||||||||||
Portfolio turnover rate | 12% | 27% | 12% | 36% | 21% | |||||||||||||||
1. Per share amounts calculated based on the average shares outstanding during the period.
2. Assumes an initial investment on the business day before the first day of the fiscal period, with all dividends and distributions reinvested in additional shares on the reinvestment date, and redemption at the net asset value calculated on the last business day of the fiscal period. Sales charges are not reflected in the total returns. Total returns are not annualized for periods less than one full year. Returns do not reflect the deduction of taxes that a shareholder would pay on fund distributions or the redemption of fund shares.
3. Annualized for periods less than one full year.
4. Includes the Fund’s share of the allocated expenses and/or net investment income from the Master Funds.
5. Total expenses including indirect expenses from affiliated fund were as follows:
Year Ended January 31, 2014 | 1.87 | % | ||||
Year Ended January 31, 2013 | 1.90 | % | ||||
Year Ended January 31, 2012 | 1.96 | % | ||||
Year Ended January 31, 2011 | 1.98 | % | ||||
Year Ended January 31, 2010 | 2.05 | % |
See accompanying Notes to Financial Statements.
23 OPPENHEIMER PORTFOLIO SERIES CONSERVATIVE INVESTOR FUND
| Class C | Year Ended January 31, 2014 | Year Ended January 31, 2013 | Year Ended January 31, 2012 | Year Ended January 31, 2011 | Year Ended January 31, 2010 | |||||||||||||||
| ||||||||||||||||||||
Per Share Operating Data | ||||||||||||||||||||
Net asset value, beginning of period | $ | 8.47 | $ | 8.04 | $ | 8.04 | $ | 7.33 | $ | 6.18 | ||||||||||
| ||||||||||||||||||||
Income (loss) from investment operations: | ||||||||||||||||||||
Net investment income1 | 0.11 | 0.13 | 0.19 | 0.17 | 0.03 | |||||||||||||||
Net realized and unrealized gain (loss) | 0.14 | 0.42 | (0.01) | 0.70 | 1.14 | |||||||||||||||
|
| |||||||||||||||||||
Total from investment operations | 0.25 | 0.55 | 0.18 | 0.87 | 1.17 | |||||||||||||||
| ||||||||||||||||||||
Dividends and/or distributions to shareholders: | ||||||||||||||||||||
Dividends from net investment income | (0.09) | (0.12) | (0.18) | (0.16) | (0.02) | |||||||||||||||
| ||||||||||||||||||||
Net asset value, end of period | $ | 8.63 | $ | 8.47 | $ | 8.04 | $ | 8 .04 | $ | 7.33 | ||||||||||
|
| |||||||||||||||||||
| ||||||||||||||||||||
Total Return, at Net Asset Value2 | 2 .89% | 6 .90% | 2 .34% | 11 .92% | 18.98% | |||||||||||||||
| ||||||||||||||||||||
Ratios/Supplemental Data | ||||||||||||||||||||
Net assets, end of period (in thousands) | $ | 153,973 | $ | 153,128 | $ | 119,266 | $ | 105,918 | $ | 86,890 | ||||||||||
| ||||||||||||||||||||
Average net assets (in thousands) | $ | 154,195 | $ | 131,124 | $ | 112,026 | $ | 97,991 | $ | 77,652 | ||||||||||
| ||||||||||||||||||||
Ratios to average net assets:3 | ||||||||||||||||||||
Net investment income | 1.26%4 | 1.59%4 | 2.29%4 | 2.15%4 | 0.50% | |||||||||||||||
Total expenses5 | 1.28%4 | 1.23%4 | 1.24%4 | 1.27%4 | 1.35% | |||||||||||||||
Expenses after payments, waivers and/or reimbursements and reduction to custodian expenses | 1.17%4 | 1.15%4 | 1.24%4 | 1.27%4 | 1.35% | |||||||||||||||
| ||||||||||||||||||||
Portfolio turnover rate | 12% | 27% | 12% | 36% | 21% | |||||||||||||||
1. Per share amounts calculated based on the average shares outstanding during the period.
2. Assumes an initial investment on the business day before the first day of the fiscal period, with all dividends and distributions reinvested in additional shares on the reinvestment date, and redemption at the net asset value calculated on the last business day of the fiscal period. Sales charges are not reflected in the total returns. Total returns are not annualized for periods less than one full year. Returns do not reflect the deduction of taxes that a shareholder would pay on fund distributions or the redemption of fund shares.
3. Annualized for periods less than one full year.
4. Includes the Fund’s share of the allocated expenses and/or net investment income from the Master Funds.
5. Total expenses including indirect expenses from affiliated fund were as follows:
Year Ended January 31, 2014 | 1.84 | % | ||||
Year Ended January 31, 2013 | 1.82 | % | ||||
Year Ended January 31, 2012 | 1.86 | % | ||||
Year Ended January 31, 2011 | 1.88 | % | ||||
Year Ended January 31, 2010 | 1.95 | % |
See accompanying Notes to Financial Statements.
24 OPPENHEIMER PORTFOLIO SERIES CONSERVATIVE INVESTOR FUND
| FINANCIAL HIGHLIGHTS Continued | ||||
| Class N | Year Ended January 31, 2014 | Year Ended January 31, 2013 | Year Ended January 31, 2012 | Year Ended January 31, 2011 | Year Ended January 31, 2010 | |||||||||||||||
| ||||||||||||||||||||
Per Share Operating Data | ||||||||||||||||||||
Net asset value, beginning of period | $ | 8.55 | $ | 8.10 | $ | 8.09 | $ | 7.36 | $ | 6.20 | ||||||||||
| ||||||||||||||||||||
Income (loss) from investment operations: | ||||||||||||||||||||
Net investment income1 | 0.15 | 0.17 | 0.22 | 0.20 | 0.03 | |||||||||||||||
Net realized and unrealized gain | 0.14 | 0.43 | 0.002 | 0.72 | 1.18 | |||||||||||||||
|
| |||||||||||||||||||
Total from investment operations | 0.29 | 0.60 | 0.22 | 0.92 | 1.21 | |||||||||||||||
| ||||||||||||||||||||
Dividends and/or distributions to shareholders: | ||||||||||||||||||||
Dividends from net investment income | (0.12) | (0.15) | (0.21) | (0.19) | (0.05) | |||||||||||||||
| ||||||||||||||||||||
Net asset value, end of period | $ | 8.72 | $ | 8 .55 | $ | 8 .10 | $ | 8.09 | $ | 7.36 | ||||||||||
|
| |||||||||||||||||||
| ||||||||||||||||||||
Total Return, at Net Asset Value3 | 3.40% | 7.40% | 2.80% | 12.55% | 19.55% | |||||||||||||||
| ||||||||||||||||||||
Ratios/Supplemental Data | ||||||||||||||||||||
Net assets, end of period (in thousands) | $ | 43,246 | $ | 50,510 | $ | 47,055 | $ | 54,286 | $ | 54,890 | ||||||||||
| ||||||||||||||||||||
Average net assets (in thousands) | $ | 47,223 | $ | 46,844 | $ | 50,465 | $ | 54,933 | $ | 50,202 | ||||||||||
| ||||||||||||||||||||
Ratios to average net assets:4 | ||||||||||||||||||||
Net investment income | 1.69% | 5 | 2.00% | 5 | 2.69% | 5 | 2.63% | 5 | 0.45% | |||||||||||
Total expenses6 | 0.79% | 5 | 0.80% | 5 | 0.77% | 5 | 0.81% | 5 | 0.96% | |||||||||||
Expenses after payments, waivers and/or reimbursements and reduction to custodian expenses | 0.68% | 5 | 0.72% | 5 | 0.77% | 5 | 0.79% | 5 | 0.88% | |||||||||||
| ||||||||||||||||||||
Portfolio turnover rate | 12% | 27% | 12% | 36% | 21% | |||||||||||||||
1. Per share amounts calculated based on the average shares outstanding during the period.
2. Less than $0.005 per share.
3. Assumes an initial investment on the business day before the first day of the fiscal period, with all dividends and distributions reinvested in additional shares on the reinvestment date, and redemption at the net asset value calculated on the last business day of the fiscal period. Sales charges are not reflected in the total returns. Total returns are not annualized for periods less than one full year. Returns do not reflect the deduction of taxes that a shareholder would pay on fund distributions or the redemption of fund shares.
4. Annualized for periods less than one full year.
5. Includes the Fund’s share of the allocated expenses and/or net investment income from the Master Funds.
6. Total expenses including indirect expenses from affiliated fund were as follows:
Year Ended January 31, 2014 | 1.35 | % | ||||
Year Ended January 31, 2013 | 1.39 | % | ||||
Year Ended January 31, 2012 | 1.39 | % | ||||
Year Ended January 31, 2011 | 1.42 | % | ||||
Year Ended January 31, 2010 | 1.56 | % |
See accompanying Notes to Financial Statements.
25 OPPENHEIMER PORTFOLIO SERIES CONSERVATIVE INVESTOR FUND
| Class Y | Year Ended January 31, 2014 | Year Ended January 31, 2013 | Year Ended January 31, 2012 | Year Ended January 31, 2011 | Year Ended January 31, 2010 | |||||||||||||||
| ||||||||||||||||||||
Per Share Operating Data | ||||||||||||||||||||
Net asset value, beginning of period | $ | 8.60 | $ | 8.15 | $ | 8.14 | $ | 7.41 | $ | 6.25 | ||||||||||
| ||||||||||||||||||||
Income (loss) from investment operations: | ||||||||||||||||||||
Net investment income (loss)1 | 0.21 | 0.22 | 0.28 | 0 .26 | (0.05) | |||||||||||||||
Net realized and unrealized gain | 0.14 | 0.43 | 0.002 | 0 .72 | 1.31 | |||||||||||||||
|
| |||||||||||||||||||
Total from investment operations | 0.35 | 0.65 | 0.28 | 0 .98 | 1 .26 | |||||||||||||||
| ||||||||||||||||||||
Dividends and/or distributions to shareholders: | ||||||||||||||||||||
Dividends from net investment income | (0.18) | (0.20) | (0.27) | (0.25) | (0.10) | |||||||||||||||
| ||||||||||||||||||||
Net asset value, end of period | $ | 8.77 | $ | 8.60 | $ | 8.15 | $ | 8.14 | $ | 7.41 | ||||||||||
|
| |||||||||||||||||||
| ||||||||||||||||||||
Total Return, at Net Asset Value3 | 4.01% | 7.96% | 3.47% | 13.27% | 20.17% | |||||||||||||||
| ||||||||||||||||||||
Ratios/Supplemental Data | ||||||||||||||||||||
Net assets, end of period (in thousands) | $ | 3,546 | $ | 2,886 | $ | 3,015 | $ | 2,047 | $ | 963 | ||||||||||
| ||||||||||||||||||||
Average net assets (in thousands) | $ | 3,099 | $ | 2,922 | $ | 2,522 | $ | 1,398 | $ | 609 | ||||||||||
| ||||||||||||||||||||
Ratios to average net assets:4 | ||||||||||||||||||||
Net investment income (loss) | 2.37%5 | 2.58%5 | 3.42%5 | 3.31%5 | (0.74)% | |||||||||||||||
Total expenses6 | 0.27%5 | 0.21%5 | 0.17%5 | 0.14%5 | 0.22% | |||||||||||||||
Expenses after payments, waivers and/or reimbursements and reduction to custodian expenses | 0.16%5 | 0.13%5 | 0.17%5 | 0.14%5 | 0.14% | |||||||||||||||
| ||||||||||||||||||||
Portfolio turnover rate | 12% | 27% | 12% | 36% | 21% | |||||||||||||||
1. Per share amounts calculated based on the average shares outstanding during the period.
2. Less than $0.005 per share.
3. Assumes an initial investment on the business day before the first day of the fiscal period, with all dividends and distributions reinvested in additional shares on the reinvestment date, and redemption at the net asset value calculated on the last business day of the fiscal period. Sales charges are not reflected in the total returns. Total returns are not annualized for periods less than one full year. Returns do not reflect the deduction of taxes that a shareholder would pay on fund distributions or the redemption of fund shares.
4. Annualized for periods less than one full year.
5. Includes the Fund’s share of the allocated expenses and/or net investment income from the Master Funds.
6. Total expenses including indirect expenses from affiliated fund were as follows:
Year Ended January 31, 2014 | 0.83% | |||||
Year Ended January 31, 2013 | 0.80% | |||||
Year Ended January 31, 2012 | 0.79% | |||||
Year Ended January 31, 2011 | 0.75% | |||||
Year Ended January 31, 2010 | 0.82% |
See accompanying Notes to Financial Statements.
24 OPPENHEIMER PORTFOLIO SERIES CONSERVATIVE INVESTOR FUND
| NOTES TO FINANCIAL STATEMENTS January 31, 2014 | ||||
1. Significant Accounting Policies
Oppenheimer Portfolio Series (the “Trust”) is registered under the Investment Company Act of 1940, as amended, as a diversified open-end management investment company. Conservative Investor Fund (the “Fund”) is a series of the Trust whose investment objective is to seek current income with a secondary objective of long-term growth of capital. The Fund normally invests in a diversified portfolio of Oppenheimer mutual funds (individually, an “Underlying Fund” and collectively, the “Underlying Funds”). The Fund’s investment adviser is OFI Global Asset Management, Inc. (“OFI Global” or the “Manager”), a wholly-owned subsidiary of OppenheimerFunds, Inc. (“OFI” or the “Sub-Adviser”). The Manager has entered into a sub-advisory agreement with OFI.
The Fund offers Class A, Class C, Class N and Class Y shares, and previously offered Class B shares for new purchase through June 29, 2012. Subsequent to that date, no new purchases of Class B shares are permitted, however reinvestment of dividend and/or capital gain distributions and exchanges of Class B shares into and from other Oppenheimer funds will be allowed. Class A shares are sold at their offering price, which is normally net asset value plus a front-end sales charge. Class C and Class N shares are sold, and Class B shares were sold, without a front-end sales charge but may be subject to a contingent deferred sales charge (“CDSC”). Class N shares are sold only through retirement plans. Retirement plans that offer Class N shares may impose charges on those accounts. Class Y shares are sold to certain institutional investors or intermediaries without either a front-end sales charge or a CDSC, however, the intermediaries may impose charges on their accountholders who beneficially own Class Y shares. All classes of shares have identical rights and voting privileges with respect to the Fund in general and exclusive voting rights on matters that affect that class alone. Earnings, net assets and net asset value per share may differ due to each class having its own expenses, such as transfer and shareholder servicing agent fees and shareholder communications, directly attributable to that class. Class A, B, C and N shares have separate distribution and/or service plans under which they pay fees. Class Y shares do not pay such fees. Class B shares will automatically convert to Class A shares 72 months after the date of purchase.
The following is a summary of significant accounting policies consistently followed by the Fund.
Risks of Investing in the Underlying Funds. Each of the Underlying Funds in which the Fund invests has its own investment risks, and those risks can affect the value of the Fund’s investments and therefore the value of the Fund’s shares. To the extent that the Fund invests more of its assets in one Underlying Fund than in another, the Fund will have greater exposure to the risks of that Underlying Fund.
Investment in Oppenheimer Institutional Money Market Fund. The Fund is permitted to invest daily available cash balances in an affiliated money market fund. The Fund may invest the available cash in Class E shares of Oppenheimer Institutional Money Market Fund (“IMMF”) to seek current income while preserving liquidity. IMMF is a registered open-end management investment company, regulated as a money market fund under the Investment Company Act of 1940, as amended. The Manager is the investment adviser of IMMF, and the
27 OPPENHEIMER PORTFOLIO SERIES CONSERVATIVE INVESTOR FUND
| ||||
| 1. Significant Accounting Policies (Continued) | ||||
Sub-Adviser provides investment and related advisory services to IMMF. When applicable, the Fund’s investment in IMMF is included in the Statement of Investments. Shares of IMMF are valued at their net asset value per share. As a shareholder, the Fund is subject to its proportional share of IMMF’s Class E expenses, including its management fee.
Investment in Oppenheimer Master Funds. The Fund is permitted to invest in entities sponsored and/or advised by the Manager or an affiliate. Certain of these entities in which the Fund invests are mutual funds registered under the Investment Company Act of 1940 that expect to be treated as partnerships for tax purposes, specifically Oppenheimer Master Loan Fund, LLC and Oppenheimer Master Inflation Protected Securities Fund, LLC (the “Master Funds”). Each Master Fund has its own investment risks, and those risks can affect the value of the Fund’s investments and therefore the value of the Fund’s shares. To the extent that the Fund invests more of its assets in one Master Fund than in another, the Fund will have greater exposure to the risks of that Master Fund.
The investment objective of Oppenheimer Master Loan Fund, LLC is to seek income. The investment objective of Oppenheimer Master Inflation Protected Securities Fund, LLC is to seek total return. The Fund’s investments in the Master Funds are included in the Statement of Investments. The Fund recognizes income and gain/(loss) on its investments in each Master Fund according to its allocated pro-rata share, based on its relative proportion of total outstanding Master Fund shares held, of the total net income earned and the net gain/(loss) realized on investments sold by the Master Funds. As a shareholder, the Fund is subject to its proportional share of the Master Funds’ expenses, including their management fee. The Manager will waive fees and/or reimburse Fund expenses in an amount equal to the indirect management fees incurred through the Fund’s investment in the Master Funds.
Allocation of Income, Expenses, Gains and Losses. Income, expenses (other than those attributable to a specific class), gains and losses are allocated on a daily basis to each class of shares based upon the relative proportion of net assets represented by such class. Operating expenses directly attributable to a specific class are charged against the operations of that class.
Federal Taxes. The Fund intends to comply with provisions of the Internal Revenue Code applicable to regulated investment companies and to distribute substantially all of its investment company taxable income, including any net realized gain on investments not offset by capital loss carryforwards, if any, to shareholders. Therefore, no federal income or excise tax provision is required. The Fund files income tax returns in U.S. federal and applicable state jurisdictions. The statute of limitations on the Fund’s tax return filings generally remain open for the three preceding fiscal reporting period ends.
The tax components of capital shown in the following table represent distribution requirements the Fund must satisfy under the income tax regulations, losses the Fund may be able to offset against income and gains realized in future years and unrealized appreciation or depreciation of securities and other investments for federal income tax purposes.
28 OPPENHEIMER PORTFOLIO SERIES CONSERVATIVE INVESTOR FUND
| NOTESTO FINANCIAL STATEMENTS Continued | ||||
| ||||
| 1. Significant Accounting Policies (Continued) | ||||
Undistributed Net Investment Income | Undistributed Long-Term Gain | Accumulated Loss Carryforward1,2,3 | Net Unrealized Appreciation Based on cost of Securities and Other Investments for Federal Income Tax Purposes | |||||||||
| ||||||||||||
$1,766,163 | $— | $78,181,598 | $2,471,179 | |||||||||
1. As of January 31, 2014, the Fund had $78,181,598 of net capital loss carryforwards available to offset future realized capital gains, if any, and thereby reduce future taxable gain distributions. Details of the capital loss carryforwards are included in the table below. Capital loss carryovers with no expiration, if any, must be utilized prior to those with expiration dates.
| Expiring | ||||
| ||||
2018 | $ | 15,654,819 | ||
2019 | 44,255,962 | |||
No expiration | 18,270,817 | |||
|
| |||
Total | $ | 78,181,598 | ||
|
| |||
2. During the fiscal year ended January 31, 2014, the Fund utilized $4,663,623 of capital loss carryforward to offset capital gains realized in that fiscal year.
3. During the fiscal year ended January 31, 2013, the Fund did not utilize any capital loss carryforward.
Net investment income (loss) and net realized gain (loss) may differ for financial statement and tax purposes. The character of dividends and distributions made during the fiscal year from net investment income or net realized gains may differ from their ultimate characterization for federal income tax purposes. Also, due to timing of dividends and distributions, the fiscal year in which amounts are distributed may differ from the fiscal year in which the income or net realized gain was recorded by the Fund.
Accordingly, the following amounts have been reclassified for January 31, 2014. Net assets of the Fund were unaffected by the reclassifications.
Increase to Paid-in Capital | Reduction to Accumulated | |||
| ||||
$23,393 | $23,393 | |||
The tax character of distributions paid during the years ended January 31, 2014 and January 31, 2013 was as follows:
| Year Ended January 31, 2014 | Year Ended January 31, 2013 | |||||||
| ||||||||
Distributions paid from: | ||||||||
Ordinary income | $ | 7,953,098 | $ | 9,772,350 | ||||
29 OPPENHEIMER PORTFOLIO SERIES CONSERVATIVE INVESTOR FUND
| ||||
| 1. Significant Accounting Policies (Continued) | ||||
The aggregate cost of securities and other investments and the composition of unrealized appreciation and depreciation of securities and other investments for federal income tax purposes as of January 31, 2014 are noted in the following table. The primary difference between book and tax appreciation or depreciation of securities and other investments, if applicable, is attributable to the tax deferral of losses or tax realization of financial statement unrealized gain or loss.
Federal tax cost of securities | $ | 551,171,222 | ||
|
| |||
Gross unrealized appreciation | $ | 13,325,206 | ||
Gross unrealized depreciation | (10,854,027) | |||
|
| |||
Net unrealized appreciation | $ | 2,471,179 | ||
|
| |||
Trustees’ Compensation. The Fund has adopted an unfunded retirement plan (the “Plan”) for the Fund’s independent trustees. Benefits are based on years of service and fees paid to each trustee during their period of service. The Plan was frozen with respect to adding new participants effective December 31, 2006 (the “Freeze Date”) and existing Plan Participants as of the Freeze Date will continue to receive accrued benefits under the Plan. Active independent trustees as of the Freeze Date have each elected a distribution method with respect to their benefits under the Plan. During the year ended January 31, 2014, the Fund’s projected benefit obligations, payments to retired trustees and accumulated liability were as follows:
Projected Benefit Obligations Increased | $ | 1,461 | ||
Payments Made to Retired Trustees | 1,769 | |||
Accumulated Liability as of January 31, 2014 | 13,899 |
The Board of Trustees has adopted a compensation deferral plan for independent trustees that enables trustees to elect to defer receipt of all or a portion of the annual compensation they are entitled to receive from the Fund. For purposes of determining the amount owed to the Trustee under the plan, deferred amounts are treated as though equal dollar amounts had been invested in shares of the Fund or in other Oppenheimer funds selected by the Trustee. The Fund purchases shares of the funds selected for deferral by the Trustee in amounts equal to his or her deemed investment, resulting in a Fund asset equal to the deferred compensation liability. Such assets are included as a component of “Other” within the asset section of the Statement of Assets and Liabilities. Deferral of trustees’ fees under the plan will not affect the net assets of the Fund, and will not materially affect the Fund’s assets, liabilities or net investment income per share. Amounts will be deferred until distributed in accordance with the compensation deferral plan.
Dividends and Distributions to Shareholders. Dividends and distributions to shareholders, which are determined in accordance with income tax regulations and may differ from U.S. generally accepted accounting principles, are recorded on the ex-dividend date. Income and capital gain distributions, if any, are declared and paid annually or at other times as deemed necessary by the Manager.
30 OPPENHEIMER PORTFOLIO SERIES CONSERVATIVE INVESTOR FUND
| NOTESTO FINANCIAL STATEMENTS Continued | ||||
| ||||
| 1. Significant Accounting Policies (Continued) | ||||
Investment Income. Dividend distributions received from the Underlying Funds are recorded on the ex-dividend date. Upon receipt of notification from an Underlying Fund, and subsequent to the ex-dividend date, some of the dividend income originally recorded by the Fund may be reclassified as a tax return of capital by reducing the cost basis of the Underlying Fund and/or increasing the realized gain on sales of investments in the Underlying Fund.
Custodian Fees. “Custodian fees and expenses” in the Statement of Operations may include interest expense incurred by the Fund on any cash overdrafts of its custodian account during the period. Such cash overdrafts may result from the effects of failed trades in portfolio securities and from cash outflows resulting from unanticipated shareholder redemption activity. The Fund pays interest to its custodian on such cash overdraft at a rate equal to the 1 Month LIBOR Rate plus 2.00%. The “Reduction to custodian expenses” line item, if applicable, represents earnings on cash balances maintained by the Fund during the period. Such interest expense and other custodian fees may be paid with these earnings.
Security Transactions. Security transactions are recorded on the trade date. Realized gains and losses on securities sold are determined on the basis of identified cost.
Indemnifications. The Fund’s organizational documents provide current and former trustees and officers with a limited indemnification against liabilities arising in connection with the performance of their duties to the Fund. In the normal course of business, the Fund may also enter into contracts that provide general indemnifications. The Fund’s maximum exposure under these arrangements is unknown as this would be dependent on future claims that may be made against the Fund. The risk of material loss from such claims is considered remote.
Other. The preparation of financial statements in conformity with accounting principles generally accepted in the United States of America requires management to make estimates and assumptions that affect the reported amounts of assets and liabilities and disclosure of contingent assets and liabilities at the date of the financial statements and the reported amounts of increases and decreases in net assets from operations during the reporting period. Actual results could differ from those estimates.
2. Securities Valuation
The Fund calculates the net asset value of its shares based upon the net asset value of the applicable Underlying Fund. For each Underlying Fund, the net asset value per share for a class of shares is determined as of the close of the New York Stock Exchange (the “Exchange”), normally 4:00 P.M. Eastern time, on each day the Exchange is open for trading by dividing the value of the Underlying Fund’s net assets attributable to that class by the number of outstanding shares of that class on that day.
The Fund’s Board has adopted procedures for the valuation of the Fund’s securities and has delegated the day-to-day responsibility for valuation determinations under those procedures to the Manager. The Manager has established a Valuation Committee which is responsible for
31 OPPENHEIMER PORTFOLIO SERIES CONSERVATIVE INVESTOR FUND
| ||||
| 2. Securities Valuation (Continued) | ||||
determining a “fair valuation” for any security for which market quotations are not “readily available.” The Valuation Committee’s fair valuation determinations are subject to review, approval and ratification by the Fund’s Board at its next regularly scheduled meeting covering the calendar quarter in which the fair valuation was determined.
Valuations Methods and Inputs
To determine their net asset values, the Underlying Funds’ assets are valued primarily on the basis of current market quotations as generally supplied by third party portfolio pricing services or by dealers. Such market quotations are typically based on unadjusted quoted prices in active markets for identical securities or other observable market inputs.
If a market value or price cannot be determined for a security using the methodologies described above, or if, in the “good faith” opinion of the Manager, the market value or price obtained does not constitute a “readily available market quotation,” or a significant event has occurred that would materially affect the value of the security the security is fair valued either (i) by a standardized fair valuation methodology applicable to the security type or the significant event as previously approved by the Valuation Committee and the Fund’s Board or (ii) as determined in good faith by the Manager’s Valuation Committee. The Valuation Committee considers all relevant facts that are reasonably available, through either public information or information available to the Manager, when determining the fair value of a security. Fair value determinations by the Manager are subject to review, approval and ratification by the Fund’s Board at its next regularly scheduled meeting covering the calendar quarter in which the fair valuation was determined. The methodologies used for valuing securities are not necessarily an indication of the risks associated with investing in those Underlying Funds.
To assess the continuing appropriateness of security valuations, the Manager, or its third party service provider who is subject to oversight by the Manager, regularly compares prior day prices, prices on comparable securities, and sale prices to the current day prices and challenges those prices exceeding certain tolerance levels with the third party pricing service or broker source. For those securities valued by fair valuations, whether through a standardized fair valuation methodology or a fair valuation determination, the Valuation Committee reviews and affirms the reasonableness of the valuations based on such methodologies and fair valuation determinations on a regular basis after considering all relevant information that is reasonably available.
Classifications
Each investment asset or liability of the Fund is assigned a level at measurement date based on the significance and source of the inputs to its valuation. Various data inputs are used in determining the value of each of the Fund’s investments as of the reporting period end. These data inputs are categorized in the following hierarchy under applicable financial accounting standards:
32 OPPENHEIMER PORTFOLIO SERIES CONSERVATIVE INVESTOR FUND
| NOTESTO FINANCIAL STATEMENTS Continued | ||||
| ||||
| 2. Securities Valuation (Continued) | ||||
1) Level 1-unadjusted quoted prices in active markets for identical assets or liabilities (including securities actively traded on a securities exchange)
2) Level 2-inputs other than unadjusted quoted prices that are observable for the asset or liability (such as unadjusted quoted prices for similar assets and market corroborated inputs such as interest rates, prepayment speeds, credit risks, etc.)
3) Level 3-significant unobservable inputs (including the Manager’s own judgments about assumptions that market participants would use in pricing the asset or liability).
The inputs used for valuing securities are not necessarily an indication of the risks associated with investing in those securities.
The Fund classifies each of its investments in those Underlying Funds which are publicly offered and reported on an exchange as Level 1, and those Underlying Funds which are not publicly offered as Level 2, without consideration as to the classification level of the specific investments held by the Underlying Funds.
The table below categorizes amounts that are included in the Fund’s Statement of Assets and Liabilities as of January 31, 2014 based on valuation input level:
| Level 1— Unadjusted Quoted Prices | Level 2— Other Significant Observable Inputs | Level 3— Significant Unobservable Inputs | Value | |||||||||||||
| ||||||||||||||||
Assets Table | ||||||||||||||||
Investments, at Value: | ||||||||||||||||
Investment Companies | $ | 488,356,764 | $ | 65,285,637 | $ | — | $ | 553,642,401 | ||||||||
|
| |||||||||||||||
Total Assets | $ | 488,356,764 | $ | 65,285,637 | $ | — | $ | 553,642,401 | ||||||||
|
| |||||||||||||||
3. Shares of Beneficial Interest
The Fund has authorized an unlimited number of $0.001 par value shares of beneficial interest of each class. Transactions in shares of beneficial interest were as follows:
| Year Ended January 31, 2014 | Year Ended January 31, 2013 | |||||||||||||||
| Shares | Amount | Shares | Amount | |||||||||||||
| ||||||||||||||||
Class A | ||||||||||||||||
Sold | 11,937,768 | $ | 103,749,675 | 10,917,193 | $ | 91,878,805 | ||||||||||
Dividends and/or distributions reinvested | 618,995 | 5,440,640 | 722,467 | 6,104,847 | ||||||||||||
Acquisition—Note 6 | — | — | 3,117,781 | 26,844,097 | ||||||||||||
Redeemed | (11,424,745) | (99,224,318) | (7,598,277) | (63,630,087) | ||||||||||||
|
| |||||||||||||||
Net increase | 1,132,018 | $ | 9,965,997 | 7,159,164 | $ | 61,197,662 | ||||||||||
|
| |||||||||||||||
33 OPPENHEIMER PORTFOLIO SERIES CONSERVATIVE INVESTOR FUND
| ||||
| 3. Shares of Beneficial Interest (Continued) | ||||
| Year Ended January 31, 2014 | Year Ended January 31, 2013 | |||||||||||||||
| Shares | Amount | Shares | Amount | |||||||||||||
| ||||||||||||||||
Class B | ||||||||||||||||
Sold | 221,309 | $ | 1,906,720 | 563,233 | $ | 4,648,151 | ||||||||||
Dividends and/or distributions reinvested | 20,465 | 179,278 | 41,232 | 346,758 | ||||||||||||
Acquisition—Note 6 | — | — | 174,449 | 1,484,562 | ||||||||||||
Redeemed | (1,127,778) | (9,695,281 | ) | (1,090,962) | (9,057,945) | |||||||||||
|
| |||||||||||||||
Net decrease | (886,004) | $ | (7,609,283 | ) | (312,048) | $ | (2,578,474) | |||||||||
|
| |||||||||||||||
| ||||||||||||||||
Class C | �� | |||||||||||||||
Sold | 4,926,144 | $ | 42,183,947 | 6,404,347 | $ | 53,136,741 | ||||||||||
Dividends and/or distributions reinvested | 170,436 | 1,481,086 | 253,104 | 2,115,946 | ||||||||||||
Acquisition—Note 6 | — | — | 913,077 | 7,742,894 | ||||||||||||
Redeemed | (5,336,498) | (45,707,177 | ) | (4,325,075) | (35,872,302) | |||||||||||
|
| |||||||||||||||
Net increase (decrease) | (239,918) | $ | (2,042,144 | ) | 3,245,453 | $ | 27,123,279 | |||||||||
|
| |||||||||||||||
| ||||||||||||||||
Class N | ||||||||||||||||
Sold | 1,383,365 | $ | 11,957,384 | 1,874,393 | $ | 15,702,416 | ||||||||||
Dividends and/or distributions reinvested | 66,201 | 580,586 | 93,652 | 789,486 | ||||||||||||
Acquisition—Note 6 | — | — | 521,073 | 4,460,382 | ||||||||||||
Redeemed | (2,399,012) | (20,729,084 | ) | (2,387,770) | (19,939,245) | |||||||||||
|
| |||||||||||||||
Net increase (decrease) | (949,446) | $ | (8,191,114 | ) | 101,348 | $ | 1,013,039 | |||||||||
|
| |||||||||||||||
| ||||||||||||||||
Class Y | ||||||||||||||||
Sold | 256,114 | $ | 2,236,938 | 156,477 | $ | 1,320,324 | ||||||||||
Dividends and/or distributions reinvested | 7,583 | 66,884 | 7,899 | 66,988 | ||||||||||||
Acquisition—Note 6 | — | — | 157 | 1,361 | ||||||||||||
Redeemed | (194,787) | (1,708,892 | ) | (198,991) | (1,664,732) | |||||||||||
|
| |||||||||||||||
Net increase (decrease) | 68,910 | $ | 594,930 | (34,458) | $ | (276,059) | ||||||||||
|
| |||||||||||||||
4. Purchases and Sales of Securities
The aggregate cost of purchases and proceeds from sales of securities, other than short-term obligations and investments in IMMF, for the year ended January 31, 2014 were as follows:
| Purchases | Sales | |||||||||
| ||||||||||
Investment securities | $ | 64,546,401 | $ | 67,902,077 | ||||||
5. Fees and Other Transactions with Affiliates
Management Fees. Under the investment advisory agreement, the Manager does not charge a management fee, but rather collects indirect management fees from the Fund’s investments in the Underlying Funds. The weighted indirect management fees collected from the Fund’s investment in the Underlying Funds, as a percent of average daily net assets of the
34 OPPENHEIMER PORTFOLIO SERIES CONSERVATIVE INVESTOR FUND
| NOTESTO FINANCIAL STATEMENTS Continued | ||||
| ||||
| 5. Fees and Other Transactions with Affiliates (Continued) | ||||
Fund for the year ended January 31, 2014 was 0.52%. This amount is gross of any waivers or reimbursements of management fees implemented at the Underlying Fund level.
Sub-Adviser Fees. The Manager has retained the Sub-Adviser to provide the day-to-day portfolio management of the Fund. Under the Sub-Advisory Agreement, the Manager pays the Sub-Adviser an annual fee in monthly installments, equal to a percentage of the investment management fee collected by the Manager from the Fund, which shall be calculated after any investment management fee waivers. The fee paid to the Sub-Adviser is paid by the Manager, not by the Fund.
Transfer Agent Fees. OFI Global (the “Transfer Agent”) serves as the transfer and shareholder servicing agent for the Fund. Fees incurred by the Fund with respect to these services are detailed in the Statement of Operations.
Sub-Transfer Agent Fees. The Transfer Agent has retained Shareholder Services, Inc., a wholly-owned subsidiary of OFI (the “Sub-Transfer Agent”), to provide the day-to-day transfer agent and shareholder servicing of the Fund. Under the Sub-Transfer Agency Agreement, the Transfer Agent pays the Sub-Transfer Agent an annual fee in monthly installments, equal to a percentage of the transfer agent fee collected by the Transfer Agent from the Fund, which shall be calculated after any applicable fee waivers. The fee paid to the Sub-Transfer Agent is paid by the Transfer Agent, not by the Fund.
Distribution and Service Plan (12b-1) Fees. Under its General Distributor’s Agreement with the Fund, OppenheimerFunds Distributor, Inc. (the “Distributor”) acts as the Fund’s principal underwriter in the continuous public offering of the Fund’s classes of shares.
Service Plan for Class A Shares. The Fund has adopted a Service Plan (the “Plan”) for Class A shares under Rule 12b-1 of the Investment Company Act of 1940. Under the Plan, the Fund reimburses the Distributor for a portion of its costs incurred for services provided to accounts that hold Class A shares. Reimbursement is made periodically at an annual rate of up to 0.25% of the daily net assets of Class A shares of the Fund. The Distributor currently uses all of those fees to pay dealers, brokers, banks and other financial institutions periodically for providing personal service and maintenance of accounts of their customers that hold Class A shares. Any unreimbursed expenses the Distributor incurs with respect to Class A shares in any fiscal year cannot be recovered in subsequent periods. Fees incurred by the Fund under the Plan are detailed in the Statement of Operations.
Distribution and Service Plans for Class B, Class C and Class N Shares. The Fund has adopted Distribution and Service Plans (the “Plans”) for Class B, Class C and Class N shares under Rule 12b-1 of the Investment Company Act of 1940 to compensate the Distributor for its services in connection with the distribution of those shares and servicing accounts. Under the Plans, the Fund pays the Distributor an annual asset-based sales charge of 0.75% on Class B and Class C shares daily net assets and 0.25% on Class N shares daily
35 OPPENHEIMER PORTFOLIO SERIES CONSERVATIVE INVESTOR FUND
| ||||
| 5. Fees and Other Transactions with Affiliates (Continued) | ||||
net assets. The Distributor also receives a service fee of 0.25% per year under each plan. If either the Class B, Class C or Class N plan is terminated by the Fund or by the shareholders of a class, the Board of Trustees and its independent trustees must determine whether the Distributor shall be entitled to payment from the Fund of all or a portion of the service fee and/or asset-based sales charge in respect to shares sold prior to the effective date of such termination. Fees incurred by the Fund under the Plans are detailed in the Statement of Operations. The Distributor determines its uncompensated expenses under the Plans at calendar quarter ends. The Distributor’s aggregate uncompensated expenses under the Plans at December 31, 2013 were as follows:
Class C | $ | 1,904,267 | ||
Class N | 1,403,471 |
Sales Charges. Front-end sales charges and contingent deferred sales charges (“CDSC”) do not represent expenses of the Fund. They are deducted from the proceeds of sales of Fund shares prior to investment or from redemption proceeds prior to remittance, as applicable. The sales charges retained by the Distributor from the sale of shares and the CDSC retained by the Distributor on the redemption of shares is shown in the following table for the period indicated.
| Year Ended | Class A Front-End Sales Charges Retained by Distributor | Class A Contingent Deferred Sales Charges Retained by Distributor | Class B Contingent Deferred Sales Charges Retained by Distributor | Class C Contingent Deferred Sales Charges Retained by Distributor | Class N Contingent Deferred Sales Charges Retained by Distributor | |||||||||||||||
| ||||||||||||||||||||
January 31, 2014 | $226,244 | $1,026 | $43,813 | $19,883 | $2,168 | |||||||||||||||
Waivers and Reimbursements of Expenses. The Manager has voluntarily agreed to waive fees and/or reimburse the Fund for certain expenses in order to limit “Expenses after payments, waivers and/or reimbursements and reduction to custodian expenses”, (the combined direct (Fund level) and indirect (Underlying Fund level) expenses), will not exceed the annual rate of 1.25%, 2.00%, 2.00%, 1.50% and 1.00%, for Class A, Class B, Class C, Class N and Class Y, respectively. The expense limitations do not include extraordinary expenses and other expenses not incurred in the ordinary course of the Fund’s business. Notwithstanding the foregoing limits, the Manager is not required to waive or reimburse Fund expenses in excess of the amount of indirect management fees earned from investments in the Underlying Funds.
The Manager has also contractually agreed to waive fees and/or reimburse certain Fund expenses at an annual rate of 0.10% as calculated on the daily net assets of the Fund. This waiver and/or reimbursement is applied after (and in addition to) any other applicable waiver and/or expense reimbursements that may apply. During the year ended January 31, 2014, the manager waived fees and/or reimbursed the Fund $555,289.
The Transfer Agent has contractually agreed to limit transfer and shareholder servicing agent fees for all classes to 0.35% of average annual net assets per class.
36 OPPENHEIMER PORTFOLIO SERIES CONSERVATIVE INVESTOR FUND
| NOTESTO FINANCIAL STATEMENTS Continued | ||||
| ||||
| 5. Fees and Other Transactions with Affiliates (Continued) | ||||
During the year ended January 31, 2014, the Transfer Agent waived $48,277 of fees.
Some of these undertakings may be modified or terminated at any time; some may not be modified or terminated until after one year from the date of the current prospectus, as indicated therein.
6. Acquisition of Oppenheimer Transition 2010 Fund
On October 18, 2012, the Fund acquired all of the net assets of Oppenheimer Transition 2010 Fund at fair market value, pursuant to an Agreement and Plan of Reorganization approved by the Oppenheimer Transition 2010 Fund shareholders on September 14, 2012. The exchange qualified as a tax-free reorganization for federal income tax purposes. The purpose of the acquisition is to combine two funds with similar investment objectives, strategies, and risks to allow shareholders to benefit from greater asset growth potential, as well as lowered expenses.
The transaction qualified as a tax-free reorganization, (the “merger”) for federal income tax purposes allowing the Fund to use the original cost basis of the investments received to calculate subsequent gains and losses for tax reporting purposes.
Details of the merger are shown in the following table:
Exchange Ratio to One Share of the Oppenheimer Transition 2010 Fund | Shares of Beneficial Interest Issued by the Fund | Value of Issued Shares of Beneficial Interest | Combined Net Assets on October 18, 20121 | |||||||||||||
Class A | 0.9814917538 | 3,117,781 | $26,844,097 | $295,973,170 | ||||||||||||
Class B | 0.9803823737 | 174,499 | $ 1,484,562 | $ 31,640,386 | ||||||||||||
Class C | 0.9818136792 | 913,077 | $ 7,742,894 | $139,565,990 | ||||||||||||
Class N | 0.9979530374 | 521,073 | $ 4,460,383 | $ 49,602,160 | ||||||||||||
Class Y | 1.0166089017 | 157 | $ 1,361 | $ 2,983,124 | ||||||||||||
1. The net assets acquired included net unrealized appreciation of $6,427,036 and an unused capital loss carryforward of $1,360,437, potential utilization subject to tax limitations.
7. Pending Litigation
Since 2009, seven class action lawsuits have been pending in the U.S. District Court for the District of Colorado against OppenheimerFunds, Inc. (“OFI”), OppenheimerFunds Distributor, Inc., the Fund’s principal underwriter and distributor (the “Distributor”), and certain funds (but not including the Fund) advised by OFI Global Asset Management, Inc. and distributed by the Distributor (the “Defendant Funds”). The lawsuits also name as defendants certain officers and current and former trustees of the respective Defendant Funds. The lawsuits raise claims under federal securities law and allege, among other things, that the disclosure documents of the respective Defendant Funds contained misrepresentations and omissions and that the respective Defendant Funds’ investment policies were not followed. The plaintiffs in these actions seek unspecified damages, equitable relief and awards of attorneys’ fees and
37 OPPENHEIMER PORTFOLIO SERIES CONSERVATIVE INVESTOR FUND
| ||||
| 7. Pending Litigation (Continued) | ||||
litigation expenses. The Defendant Funds’ Boards of Trustees have also engaged counsel to represent the Funds and the present and former Independent Trustees named in those suits. On March 5, 2014, the parties in six of these lawsuits executed stipulations and agreements of settlement resolving those actions. The settlements are subject to a variety of contingencies, including approval by the court. The settlements do not resolve a seventh outstanding lawsuit relating to Oppenheimer California Municipal Fund.
Other class action and individual lawsuits have been filed since 2008 in various state and federal courts against OFI and certain of its affiliates by investors seeking to recover investments they allegedly lost as a result of the “Ponzi” scheme run by Bernard L. Madoff and his firm, Bernard L. Madoff Investment Securities, LLC (“BLMIS”). Plaintiffs in these suits allege that they suffered losses as a result of their investments in several funds managed by an affiliate of OFI and assert a variety of claims, including breach of fiduciary duty, fraud, negligent misrepresentation, unjust enrichment, and violation of federal and state securities laws and regulations, among others. They seek unspecified damages, equitable relief and awards of attorneys’ fees and litigation expenses. Neither the Distributor, nor any of the Oppenheimer mutual funds, their independent trustees or directors are named as defendants in these lawsuits. None of the Oppenheimer mutual funds invested in any funds or accounts managed by Madoff or BLMIS. On February 28, 2011, a stipulation of partial settlement of three groups of consolidated putative class action lawsuits relating to these matters was filed in the U.S. District Court for the Southern District of New York. On August 19, 2011, the court entered an order and final judgment approving the settlement as fair, reasonable and adequate. In September 2011, certain parties filed notices of appeal from the court’s order approving the settlement. The settlement does not resolve other outstanding lawsuits against OFI and its affiliates relating to BLMIS.
On April 16, 2010, a lawsuit was filed in New York state court against (i) OFI, (ii) an affiliate of OFI and (iii) AAArdvark IV Funding Limited (“AAArdvark IV”), an entity advised by OFI’s affiliate, in connection with investments made by the plaintiffs in AAArdvark IV. Plaintiffs alleged breach of contract and common law fraud claims against the defendants and sought compensatory damages, costs and disbursements, including attorney fees. On April 11, 2013, the court granted defendants’ motion for summary judgment, dismissing plaintiffs’ fraud claim with prejudice and dismissing their contract claim without prejudice, and granted plaintiffs leave to replead their contract claim to assert a cause of action for specific performance within 30 days. On May 9, 2013, plaintiffs filed a notice of appeal from the court’s dismissal order. On January 7, 2014, the appellate court affirmed the trial court’s dismissal order. On July 15, 2011, a lawsuit was filed in New York state court against OFI, an affiliate of OFI and AAArdvark Funding Limited (“AAArdvark I”), an entity advised by OFI’s affiliate, in connection with investments made by the plaintiffs in AAArdvark I. The complaint alleges breach of contract and common law fraud claims against the defendants and seeks compensatory damages, costs and disbursements, including attorney fees. On November 9, 2011, a lawsuit was filed in New York state court against OFI, an affiliate of OFI and AAArdvark XS Funding Limited (“AAArdvark XS”), an entity advised by OFI’s affiliate, in
38 OPPENHEIMER PORTFOLIO SERIES CONSERVATIVE INVESTOR FUND
| NOTESTO FINANCIAL STATEMENTS Continued | ||||
| ||||
| 7. Pending Litigation (Continued) | ||||
connection with investments made by the plaintiffs in AAArdvark XS. The complaint alleged breach of contract against the defendants and sought compensatory damages, costs and disbursements, including attorney fees. On November 8, 2013, the parties filed a stipulation of discontinuance dismissing the lawsuit with prejudice.
OFI believes the lawsuits and appeals described above are without legal merit and, with the exception of actions it has settled, is defending against them vigorously. While it is premature to render any opinion as to the outcome in these lawsuits, or whether any costs that the Defendant Funds may bear in defending the suits might not be reimbursed by insurance, OFI believes that these suits should not impair the ability of OFI or the Distributor to perform their respective duties to the Fund, and that the outcome of all of the suits together should not have any material effect on the operations of any of the Oppenheimer mutual funds.
39 OPPENHEIMER PORTFOLIO SERIES CONSERVATIVE INVESTOR FUND
REPORTOF INDEPENDENT REGISTERED PUBLIC ACCOUNTING FIRM | ||||
The Board of Trustees and Shareholders of Oppenheimer Portfolio Series:
We have audited the accompanying statement of assets and liabilities of Conservative Investor Fund (a series of Oppenheimer Portfolio Series), including the statement of investments, as of January 31, 2014, and the related statement of operations for the year then ended, the statements of changes in net assets for each of the years in the two-year period then ended, and the financial highlights for each of the years in the five-year period then ended. These financial statements and financial highlights are the responsibility of the Fund’s management. Our responsibility is to express an opinion on these financial statements and financial highlights based on our audits.
We conducted our audits in accordance with the standards of the Public Company Accounting Oversight Board (United States). Those standards require that we plan and perform the audit to obtain reasonable assurance about whether the financial statements and financial highlights are free of material misstatement. An audit includes examining, on a test basis, evidence supporting the amounts and disclosures in the financial statements. Our procedures included confirmation of securities owned as of January 31, 2014, by correspondence with the custodian, transfer agent and brokers, or by other appropriate auditing procedures where replies from brokers were not received. An audit also includes assessing the accounting principles used and significant estimates made by management, as well as evaluating the overall financial statement presentation. We believe that our audits provide a reasonable basis for our opinion.
In our opinion, the financial statements and financial highlights referred to above present fairly, in all material respects, the financial position of Conservative Investor Fund as of January 31, 2014, the results of its operations for the year then ended, the changes in its net assets for each of the years in the two-year period then ended, and the financial highlights for each of the years in the five-year period then ended, in conformity with U.S. generally accepted accounting principles.
KPMG LLP
Denver, Colorado
March 24, 2014
40 OPPENHEIMER PORTFOLIO SERIES CONSERVATIVE INVESTOR FUND
| FEDERAL INCOME TAX INFORMATION Unaudited | ||||
In early 2014, if applicable, shareholders of record received information regarding all dividends and distributions paid to them by the Fund during calendar year 2013.
Dividends, if any, paid by the Fund during the fiscal year ended January 31, 2014 which are not designated as capital gain distributions should be multiplied by the maximum amount allowable but not less than 14.73% to arrive at the amount eligible for the corporate dividend-received deduction.
A portion, if any, of the dividends paid by the Fund during the fiscal year ended January 31, 2014 which are not designated as capital gain distributions are eligible for lower individual income tax rates to the extent that the Fund has received qualified dividend income as stipulated by recent tax legislation. The maximum amount allowable but not less than $1,714,211 of the Fund’s fiscal year taxable income may be eligible for the lower individual income tax rates. In early 2014, shareholders of record received information regarding the percentage of distributions that are eligible for lower individual income tax rates.
Recent tax legislation allows a regulated investment company to designate distributions not designated as capital gain distributions, as either interest related dividends or short-term capital gain dividends, both of which are exempt from the U.S. withholding tax applicable to non U.S. taxpayers. For the fiscal year ended January 31, 2014, the maximum amount allowable but not less than $6,600,701 of the ordinary distributions to be paid by the Fund qualifies as an interest related dividend.
The Fund has elected the application of Section 853 of the Internal Revenue Code to permit shareholders to take a federal income tax credit or deduction, at their option, on a per share basis. The maximum amount allowable but not less than $34,144 of foreign income taxes were paid by the Fund during the fiscal year ended January 31, 2014. A separate notice will be mailed to each shareholder, which will reflect the proportionate share of such foreign taxes which must be treated by shareholders as gross income for federal income tax purposes.
Gross income of the maximum amount allowable but not less than $333,189 was derived from sources within foreign countries or possessions of the United States.
The foregoing information is presented to assist shareholders in reporting distributions received from the Fund to the Internal Revenue Service. Because of the complexity of the federal regulations which may affect your individual tax return and the many variations in state and local tax regulations, we recommend that you consult your tax advisor for specific guidance.
41 OPPENHEIMER PORTFOLIO SERIES CONSERVATIVE INVESTOR FUND
BOARDAPPROVALOFTHE FUND’S INVESTMENT ADVISORY AND SUB-ADVISORY AGREEMENTS Unaudited | ||||
The Fund has entered into an investment advisory agreement with OFI Global Asset Management, Inc. (“OFI Global” or the “Adviser”), a wholly-owned subsidiary of OppenheimerFunds, Inc. (“OFI” or the “Sub-Adviser”) (“OFI Global” and “OFI” together the “Managers”) and OFI Global has entered into a sub-advisory agreement with OFI whereby OFI provides investment sub-advisory services to the Fund (collectively, the “Agreements”). Each year, the Board of Trustees (the “Board”), including a majority of the independent Trustees, is required to determine whether to renew the Agreements. The Investment Company Act of 1940, as amended, requires that the Board request and evaluate, and that the Managers provide, such information as may be reasonably necessary to evaluate the terms of the Agreements. The Board employs an independent consultant to prepare a report that provides information, including comparative information that the Board requests for that purpose. In addition to in-person meetings focused on this evaluation, the Board receives information throughout the year regarding Fund services, fees, expenses and performance.
The Adviser, Sub-Adviser and the independent consultant provided information to the Board on the following factors: (i) the nature, quality and extent of the Managers’ services, (ii) the investment performance of the Fund and the Managers, (iii) the fees and expenses of the Fund, including comparative expense information, (iv) the profitability of the Managers and their affiliates, including an analysis of the cost of providing services, (v) whether economies of scale are realized as the Fund grows and whether fee levels reflect these economies of scale for Fund investors and (vi) other benefits to the Managers from their relationship with the Fund. The Board was aware that there are alternatives to retaining the Managers.
Outlined below is a summary of the principal information considered by the Board as well as the Board’s conclusions.
Nature, Quality and Extent of Services. The Board considered information about the nature, quality and extent of the services provided to the Fund and information regarding the Managers’ key personnel who provide such services. The Sub-Adviser’s duties include providing the Fund with the services of the portfolio manager and the Sub-Adviser’s investment team, who provide research, analysis and other advisory services in regard to the Fund’s investments; securities trading services; oversight of third-party service providers; monitoring compliance with applicable Fund policies and procedures and adherence to the Fund’s investment restrictions; and risk management. The Managers are responsible for providing certain administrative services to the Fund as well. Those services include providing and supervising all administrative and clerical personnel who are necessary in order to provide effective corporate administration for the Fund; compiling and maintaining records with respect to the Fund’s operations; preparing and filing reports required by the Securities and Exchange Commission; preparing periodic reports regarding the operations of the Fund for its shareholders; preparing proxy materials for shareholder meetings; and preparing the registration statements required by Federal and state securities laws for the sale of the Fund’s shares. The Managers also provide the Fund with office space, facilities and equipment.
The Board also considered the quality of the services provided and the quality of the Managers’ resources that are available to the Fund. The Board took account of the fact that the Sub-Adviser has had over fifty years of experience as an investment adviser and that its assets under management rank it among the top mutual fund managers in the United States. The Board evaluated the Sub-Adviser’s advisory, administrative, accounting, legal, compliance
42 OPPENHEIMER PORTFOLIO SERIES CONSERVATIVE INVESTOR FUND
BOARDAPPROVALOFTHE FUND’S INVESTMENT ADVISORY AND SUB-ADVISORY AGREEMENTS Unaudited / Continued | ||||
services and risk management, and information the Board has received regarding the experience and professional qualifications of the Managers’ key personnel and the size and functions of its staff. In its evaluation of the quality of the portfolio management services provided, the Board considered the experience of Mark Hamilton, the portfolio manager for the Fund, and the experience of the portfolio managers and the investment performance of the investment companies in which the Fund invests (the “Underlying Funds”). The Board members also considered the totality of their experiences with the Managers as directors or trustees of the Fund and other funds advised by the Managers. The Board considered information regarding the quality of services provided by affiliates of the Managers, which its members have become knowledgeable about in connection with the renewal of the Fund’s service agreements. The Board concluded, in light of the Managers’ experience, reputation, personnel, operations and resources that the Fund benefits from the services provided under the Agreement.
Investment Performance of the Fund, the Adviser and the Sub-Adviser. Throughout the year, the Adviser and the Sub-Adviser provided information on the investment performance of the Fund, the Adviser and the Sub-Adviser, including comparative performance information. The Board also reviewed information, prepared by the Adviser, the Sub-Adviser and the independent consultant, comparing the Fund’s historical performance to its benchmarks and to the performance of other retail conservative allocation funds. The Board noted that the Fund’s three-year performance was better than its category median although its one-year and five-year performance was below its category median.
Costs of Services by the Adviser. The Board reviewed the fees paid to the Adviser and the other expenses borne by the Fund. The Board also considered the comparability of the fees charged and the services provided to the Fund to the fees and services for other clients or accounts advised by the Adviser. The independent consultant provided comparative data in regard to the fees and expenses of the Fund and other retail front-end load conservative allocation funds with comparable asset levels and distribution features. The Adviser has voluntarily agreed to waive fees and/or reimburse the Fund for certain expenses in order to limit annual fund operating expenses after any fee waiver and/or expense reimbursement (including the combined direct (Fund level) and indirect (Underlying Fund level) expenses, but excluding (i) interest, taxes, dividends tied to short sales, brokerage commissions, and other expenditures which are capitalized in accordance with generally accepted accounting principles; (ii) certain other expenses attributable to, and incurred as a result of, a Fund’s investments; and (iii) other extraordinary expenses (including litigation expenses) not incurred in the ordinary course of the Fund’s business) to annual rates of 1.25% for Class A shares, 2.00% for Class B shares, 2.00% for Class C shares, 1.50% for Class N shares, and 1.00% for Class Y shares, as calculated on the daily net assets of the Fund. This fee waiver and/or expense reimbursement may be amended or withdrawn at any time without prior notice to shareholders. The Adviser has also agreed to contractually waive fees and/or reimburse certain Fund expenses at an annual rate of 0.10% as calculated on the daily net assets of the Fund. This contractual fee waiver and/or expense reimbursement may not be amended or withdrawn for one year from the date of the prospectus, unless approved by the Board. The Board noted that the Fund was charged no actual management fees, exclusive of Underlying Fund management fees, while certain peer group funds did charge
43 OPPENHEIMER PORTFOLIO SERIES CONSERVATIVE INVESTOR FUND
direct management fees. The Fund’s total expenses were lower than its peer group median and its category median.
Economies of Scale and Profits Realized by the Adviser and Sub-Adviser. The Board considered information regarding OFI Global’s costs in serving as the Fund’s investment adviser, including the costs associated with the personnel and systems necessary to manage the Fund, and information regarding the Managers’ profitability from their relationship with the Fund. The Board reviewed whether the Managers may realize economies of scale in managing and supporting the Fund.
Other Benefits to the Managers. In addition to considering the profits realized by the Managers, the Board considered information that was provided regarding the direct and indirect benefits the Managers receive as a result of their relationship with the Fund, including compensation paid to the Managers’ affiliates. The Board also considered that the Managers must be able to pay and retain experienced professional personnel at competitive rates to provide quality services to the Fund.
Conclusions. These factors were also considered by the independent Trustees meeting separately from the full Board, assisted by experienced counsel to the Fund and to the independent Trustees. Fund counsel and the independent Trustees’ counsel are independent of the Managers within the meaning and intent of the Securities and Exchange Commission Rules.
Based on its review of the information it received and its evaluations described above, the Board, including a majority of the independent Trustees, decided to continue the Agreements through September 30, 2014. In arriving at its decision, the Board did not identify any factor or factors as being more important than others, but considered all of the above information, and considered the terms and conditions of the Agreements, including the management fees, in light of all the surrounding circumstances.
44 OPPENHEIMER PORTFOLIO SERIES CONSERVATIVE INVESTOR FUND
| PORTFOLIO PROXY VOTING POLICIESAND PROCEDURES; UPDATES TO STATEMENTS OF INVESTMENTS Unaudited | ||||
The Fund has adopted Portfolio Proxy Voting Policies and Procedures under which the Fund votes proxies relating to securities (“portfolio proxies”) held by the Fund. A description of the Fund’s Portfolio Proxy Voting Policies and Procedures is available (i) without charge, upon request, by calling the Fund toll-free at 1.800.CALL OPP (225.5677), (ii) on the Fund’s website at oppenheimerfunds.com, and (iii) on the SEC’s website at www.sec.gov. In addition, the Fund is required to file Form N-PX, with its complete proxy voting record for the 12 months ended June 30th, no later than August 31st of each year. The Fund’s voting record is available (i) without charge, upon request, by calling the Fund toll-free at 1.800.CALL OPP (225.5677), and (ii) in the Form N-PX filing on the SEC’s website at www.sec.gov.
The Fund files its complete schedule of portfolio holdings with the SEC for the first quarter and the third quarter of each fiscal year on Form N-Q. The Fund’s Form N-Q filings are available on the SEC’s website at www.sec.gov. Those forms may be reviewed and copied at the SEC’s Public Reference Room in Washington, D.C. Information on the operation of the Public Reference Room may be obtained by calling 1-800-SEC-0330.
Householding—Delivery of Shareholder Documents
This is to inform you about OppenheimerFunds’ “householding” policy. If more than one member of your household maintains an account in a particular fund, OppenheimerFunds will mail only one copy of the fund’s prospectus (or, if available, the fund’s summary prospectus), annual and semiannual report and privacy policy. The consolidation of these mailings, called householding, benefits your fund through reduced mailing expense, and benefits you by reducing the volume of mail you receive from OppenheimerFunds. Householding does not affect the delivery of your account statements.
Please note that we will continue to household these mailings for as long as you remain an OppenheimerFunds shareholder, unless you request otherwise. If you prefer to receive multiple copies of these materials, please call us at 1.800.CALL-OPP (225-5677). You may also notify us in writing or via email. We will begin sending you individual copies of the prospectus (or, if available, the summary prospectus), reports and privacy policy within 30 days of receiving your request to stop householding.
45 �� OPPENHEIMER PORTFOLIO SERIES CONSERVATIVE INVESTOR FUND
| TRUSTEES AND OFFICERS Unaudited | ||||
| ||
Name, Position(s) Held with the Fund, Length of Service, Year of Birth |
Principal Occupation(s) During the Past 5 Years; Other Trusteeships/Directorships Held; Number of Portfolios in the Fund Complex Currently Overseen | |
INDEPENDENT TRUSTEES | The address of each Trustee in the chart below is 6803 S. Tucson Way, Centennial, Colorado 80112-3924. Each Trustee serves for an indefinite term, or until his or her resignation, retirement, death or removal. | |
Brian F. Wruble, Chairman of the Board of Trustees (since 2007) and Trustee (since 2005) Year of Birth: 1943 | Director of Community Foundation of the Florida Keys (non-profit) (since July 2012); Chairman Emeritus and Non-Voting Trustee of The Jackson Laboratory (non-profit) (since August 2011); Director of Special Value Opportunities Fund, LLC (registered investment company) (affiliate of the Sub-Adviser’s parent company) (since September 2004); Member of Zurich Insurance Advisory Council (insurance) (since 2004); Treasurer (since 2007) and Trustee of the Institute for Advanced Study (non-profit educational institute) (since May 1992); Chairman (August 2007-August 2011) and Trustee (since August 1991) of the Board of Trustees of The Jackson Laboratory (non-profit); General Partner of Odyssey Partners, L.P. (hedge fund) (September 1995-December 2007); Special Limited Partner of Odyssey Investment Partners, LLC (private equity investment) (January 1999-September 2004). Oversees 51 portfolios in the OppenheimerFunds complex. Mr. Wruble has served on the Boards of certain Oppenheimer funds since April 2001, during which time he has become familiar with the Fund’s (and other Oppenheimer funds’) financial, accounting, regulatory and investment matters and has contributed to the Boards’ deliberations. | |
David K. Downes, Trustee (since 2007) Year of Birth: 1940 | Director of THL Credit Inc. (since June 2009); Trustee of Employee Trusts (since January 2006); Chief Executive Officer and Board Member of Community Capital Management (investment management company) (since January 2004); President of The Community Reinvestment Act Qualified Investment Fund (investment management company) (since 2004); Director of Internet Capital Group (information technology company) (since October 2003); formerly, Independent Chairman GSK Employee Benefit Trust (April 2006- June 2013); Director of Correctnet (January 2006-2007); Independent Chairman of the Board of Trustees of Quaker Investment Trust (registered investment company) (2004-2007); Chief Operating Officer and Chief Financial Officer of Lincoln National Investment Companies, Inc. (subsidiary of Lincoln National Corporation, a publicly traded company) and Delaware Investments U.S., Inc. (investment management subsidiary of Lincoln National Corporation) (1993-2003); President, Chief Executive Officer and Trustee of Delaware Investment Family of Funds (1993-2003); President and Board Member of Lincoln National Convertible Securities Funds, Inc. and the Lincoln National Income Funds, TDC (1993-2003); Chairman and Chief Executive Officer of Retirement Financial Services, Inc. (registered transfer agent and investment adviser and subsidiary of Delaware Investments U.S., Inc.) (1993-2003); President and Chief Executive Officer of Delaware Service Company, Inc. (1995-2003); Chief Administrative Officer, Chief Financial Officer, Vice Chairman and Director of Equitable Capital Management Corporation (investment subsidiary of Equitable Life Assurance Society) (1985-1992); Corporate Controller of Merrill Lynch Company (financial services holding company) (1977-1985); held the following positions at the Colonial Penn Group, Inc. (insurance company): Corporate Budget Director (1974-1977), Assistant Treasurer (1972-1974) and Director of Corporate Taxes (1969-1972); held the following positions at Price Waterhouse Company | |
46 OPPENHEIMER PORTFOLIO SERIES CONSERVATIVE INVESTOR FUND
| TRUSTEES AND OFFICERS Unaudited / Continued | ||||
David K. Downes, Continued | (financial services firm): Tax Manager (1967-1969), Tax Senior (1965-1967) and Staff Accountant (1963-1965); United States Marine Corps (1957-1959). Oversees 51 portfolios in the OppenheimerFunds complex. Mr. Downes has served on the Boards of certain Oppenheimer funds since December 2005, during which time he has become familiar with the Fund’s (and other Oppenheimer funds’) financial, accounting, regulatory and investment matters and has contributed to the Boards’ deliberations. | |
Matthew P. Fink, Trustee (since 2005) Year of Birth: 1941 | Trustee of the Committee for Economic Development (policy research foundation) (2005-2011); Director of ICI Education Foundation (education foundation) (October 1991-August 2006); President of the Investment Company Institute (trade association) (October 1991-June 2004); Director of ICI Mutual Insurance Company (insurance company) (October 1991-June 2004); Author of The Rise of Mutual Funds: An Insider’s View published by Oxford University Press (second edition 2010). Oversees 51 portfolios in the OppenheimerFunds complex. Mr. Fink has served on the Boards of certain Oppenheimer funds since January 2005, during which time he has become familiar with the Fund’s (and other Oppenheimer funds’) financial, accounting, regulatory and investment matters and has contributed to the Boards’ deliberations. | |
Edmund P. Giambastiani, Jr., Trustee (since 2013) Year of Birth: 1948 | Advisory Board Member of the Maxwell School of Citizenship and Public Affairs of Syracuse University (since April 2012); Director of Mercury Defense Systems Inc. (information technology) (August 2011-February 2013); Trustee of the U.S. Naval Academy Foundation (since November 2010); Advisory Board Member of the Massachusetts Institute of Technology Lincoln Laboratory (federally-funded research development center) (since May 2010); Director of The Boeing Company (aerospace and defense) (since October 2009); Trustee of MITRE Corporation (federally-funded research development center) (since September 2008); Independent Director of QinetiQ Group Plc (defense technology and security) (February 2008-August 2011); Director of Monster Worldwide, Inc. (on-line career services) (since January 2008, Lead Director since June 2011); Chairman of Alenia North America, Inc. (military and defense products) (January 2008-October 2009); Director of SRA International, Inc. (information technology and services) (January 2008-July 2011); President of Giambastiani Group LLC (national security and energy consulting) (since October 2007); United States Navy, career nuclear submarine officer (June 1970-October 2007), Vice Chairman of the Joint Chiefs of Staff (2005-October 2007), NATO Supreme Allied Commander Transformation (2003-2005), Commander, U.S. Joint Forces Command (2002-2005). Since his retirement from the U.S. Navy in October 2007, Admiral Giambastiani has also served on numerous U.S. Government advisory boards, investigations and task forces for the Secretaries of Defense, State and Interior and the Central Intelligence Agency. Oversees 51 portfolios in the OppenheimerFunds complex. Admiral Giambastiani has served on the Boards of certain Oppenheimer funds since February 2013, including as an Advisory Board Member for certain Oppenheimer funds, during which time he has become familiar with the Fund’s (and other Oppenheimer funds’) financial, accounting, regulatory and investment matters and has contributed to the Boards’ deliberations. For purposes of this report, Admiral Giambastiani is identified as a Trustee. | |
Mary F. Miller, Trustee (since 2005) Year of Birth: 1942 | Trustee of International House (not-for-profit) (since June 2007); Trustee of the American Symphony Orchestra (not-for-profit) (October 1998-November 2011); and Senior Vice President and General Auditor of American Express Company | |
47 OPPENHEIMER PORTFOLIO SERIES CONSERVATIVE INVESTOR FUND
Mary F. Miller, Continued | (financial services company) (July 1998-February 2003). Oversees 51 portfolios in the OppenheimerFunds complex. Ms. Miller has served on the Boards of certain Oppenheimer funds since August 2004, during which time she has become familiar with the Fund’s (and other Oppenheimer funds’) financial, accounting, regulatory and investment matters and has contributed to the Boards’ deliberations. | |
Joel W. Motley, Trustee (since 2005) Year of Birth: 1952 | Member of the Vestry of Trinity Wall Street (since April 2012); Director of Southern Africa Legal Services Foundation (since March 2012); Board Member of Pulitzer Center for Crisis Reporting (non-profit journalism) (since December 2010); Managing Director of Public Capital Advisors, LLC (privately-held financial advisor) (since January 2006); Managing Director of Carmona Motley, Inc. (privately-held financial advisor) (since January 2002); Director of Columbia Equity Financial Corp. (privately-held financial advisor) (2002-2007); Managing Director of Carmona Motley Hoffman Inc. (privately-held financial advisor) (January 1998-December 2001); Member of the Finance and Budget Committee of the Council on Foreign Relations, Member of the Investment Committee and Board of Human Rights Watch and Member of the Investment Committee and Board of Historic Hudson Valley. Oversees 51 portfolios in the OppenheimerFunds complex. Mr. Motley has served on the Boards of certain Oppenheimer funds since October 2002, during which time he has become familiar with the Fund’s (and other Oppenheimer funds’) financial, accounting, regulatory and investment matters and has contributed to the Boards’ deliberations. | |
Joanne Pace, Trustee (since 2012) Year of Birth: 1958 | Board Director of Horizon Blue Cross Blue Shield of New Jersey (since November 2012); Advisory Board Director of The Alberleen Group LLC (since March 2012); Advisory Board Director of The Agile Trading Group LLC (since March 2012); Advisory Council Member of 100 Women in Hedge Funds (non-profit) (since December 2012); Advisory Council Member of Morgan Stanley Children’s Hospital (non-profit) (since May 2012); Board Director of The Komera Project (non-profit) (since April 2012); New York Advisory Board Director of Peace First (non-profit) (since March 2010); Senior Advisor of SECOR Asset Management, LP (2010-2011); Managing Director and Chief Operating Officer of Morgan Stanley Investment Management (2006-2010); Partner and Chief Operating Officer of FrontPoint Partners, LLC (hedge fund) (2005-2006); held the following positions at Credit Suisse: Managing Director (2003-2005); Global Head of Human Resources and member of Executive Board and Operating Committee (2004-2005), Global Head of Operations and Product Control (2003-2004); held the following positions at Morgan Stanley: Managing Director (1997-2003), Controller and Principal Accounting Officer (1999-2003); Chief Financial Officer (temporary assignment) for the Oversight Committee, Long Term Capital Management (1998-1999). Lead Independent Director and Chair of the Audit and Nominating Committee of The Global Chartist Fund, LLC of Oppenheimer Asset Management (2011-2012); Board Director of Managed Funds Association (2008-2010); Board Director of Morgan Stanley Foundation (2007-2010) and Investment Committee Chair (2008-2010). Oversees 51 portfolios in the OppenheimerFunds complex. Ms. Pace has served on the Boards of certain Oppenheimer funds since November 2012, including as an Advisory Board Member for certain Oppenheimer funds, during which time she has become familiar with the Fund’s (and other Oppenheimer | |
48 OPPENHEIMER PORTFOLIO SERIES CONSERVATIVE INVESTOR FUND
| TRUSTEES AND OFFICERS Unaudited / Continued | ||||
Joanne Pace, Continued | funds’) financial, accounting, regulatory and investment matters and has contributed to the Board’s deliberations. For purposes of this report, Ms. Pace is identified as a Trustee. | |
Joseph M. Wikler, Trustee (since 2005) Year of Birth: 1941 | Director of C-TASC (bio-statistics services) (2007-2012); formerly, Director of the following medical device companies: Medintec (1992-2011) and Cathco (1996-2011); Member of the Investment Committee of the Associated Jewish Charities of Baltimore (since 1994); Director of Lakes Environmental Association (environmental protection organization) (1996-2008); Director of Fortis/Hartford mutual funds (1994-December 2001). Oversees 51 portfolios in the OppenheimerFunds complex. Mr. Wikler has served on the Boards of certain Oppenheimer funds since August 2005, during which time he has become familiar with the Fund’s (and other Oppenheimer funds’) financial, accounting, regulatory and investment matters and has contributed to the Boards’ deliberations. | |
Peter I. Wold, Trustee (since 2005) Year of Birth: 1948 | Director of Arch Coal, Inc. (since 2010); President of Wold Oil Properties, Inc. (oil and gas exploration and production company) (since 1994); Vice President of American Talc Company, Inc. (talc mining and milling) (since 1999); Managing Member of Hole-in-the-Wall Ranch (cattle ranching) (since 1979); Director and Chairman of Wyoming Enhanced Oil Recovery Institute Commission (enhanced oil recovery study) (2004-2012); Director and Chairman of the Denver Branch of the Federal Reserve Bank of Kansas City (1993-1999); and Director of PacifiCorp. (electric utility) (1995-1999). Oversees 51 portfolios in the OppenheimerFunds complex. Mr. Wold has served on the Boards of certain Oppenheimer funds since August 2005, during which time he has become familiar with the Fund’s (and other Oppenheimer funds’) financial, accounting, regulatory and investment matters and has contributed to the Boards’ deliberations. | |
| ||
INTERESTED TRUSTEE AND OFFICER | Mr. Glavin is an “Interested Trustee” because he is affiliated with the Manager and the Sub-Adviser by virtue of his positions as an officer and director of the Manager and a director of the Sub-Adviser, and as a shareholder of the Sub-Adviser’s parent company. Both as a Trustee and as an officer, he serves for an indefinite term, or until his resignation, retirement, death or removal. Mr. Glavin’s address is Two World Financial Center, 225 Liberty Street, 11th Floor, New York, New York 10281-1008. | |
William F. Glavin, Jr., Trustee (since 2013), President and Principal Executive Officer (since 2009) Year of Birth: 1958 | Director, Chairman and Chief Executive Officer of the Manager (since January 2013); President of the Manager (January 2013-May 2013); Chairman of the Sub-Adviser (December 2009-December 2012); Chief Executive Officer (January 2009-December 2012) and Director of the Sub-Adviser (since January 2009); President of the Sub-Adviser (May 2009-December 2012); Management Director (since June 2009), President (since December 2009) and Chief Executive Officer (since January 2011) of Oppenheimer Acquisition Corp. (“OAC”) (the Sub-Adviser’s parent holding company); Director of Oppenheimer Real Asset Management, Inc. (since March 2010); Executive Vice President (March 2006-February 2009) and Chief Operating Officer (July 2007-February 2009) of Massachusetts Mutual Life Insurance Company (OAC’s parent company); Director (May 2004-March 2006) and Chief Operating Officer and Chief Compliance Officer (May 2004-January 2005), President (January 2005-March 2006) and Chief Executive Officer (June 2005-March 2006) of Babson | |
49 OPPENHEIMER PORTFOLIO SERIES CONSERVATIVE INVESTOR FUND
William F. Glavin, Jr., Continued | Capital Management LLC; Director (March 2005-March 2006), President (May 2003-March 2006) and Chief Compliance Officer (July 2005-March 2006) of Babson Capital Securities, Inc. (a broker-dealer); President (May 2003-March 2006) of Babson Investment Company, Inc.; Director (May 2004-August 2006) of Babson Capital Europe Limited; Director (May 2004-October 2006) of Babson Capital Guernsey Limited; Director (May 2004-March 2006) of Babson Capital Management LLC; Non-Executive Director (March 2005-March 2007) of Baring Asset Management Limited; Director (February 2005-June 2006) Baring Pension Trustees Limited; Director and Treasurer (December 2003-November 2006) of Charter Oak Capital Management, Inc.; Director (May 2006-September 2006) of C.M. Benefit Insurance Company; Director (May 2008-June 2009) and Executive Vice President (June 2007-July 2009) of C.M. Life Insurance Company; President (March 2006-May 2007) of MassMutual Assignment Company; Director (January 2005-December 2006), Deputy Chairman (March 2005-December 2006) and President (February 2005-March 2005) of MassMutual Holdings (Bermuda) Limited; Director (May 2008-June 2009) and Executive Vice President (June 2007-July 2009) of MML Bay State Life Insurance Company; Chief Executive Officer and President (April 2007-January 2009) of MML Distributors, LLC; and Chairman (March 2006-December 2008) and Chief Executive Officer (May 2007-December 2008) of MML Investors Services, Inc. An officer of 90 portfolios in the OppenheimerFunds complex. | |
| ||
OTHER OFFICERS OF THE FUND | The addresses of the Officers in the chart below are as follows: for Messrs. Hamilton, Gabinet and Ms. Nasta, Two World Financial Center, 225 Liberty Street, New York, New York 10281-1008, for Messrs. Vandehey and Wixted, 6803 S. Tucson Way, Centennial, Colorado 80112-3924. Each Officer serves for an indefinite term or until his or her resignation, retirement, death or removal. | |
Mark Hamilton, Vice President (since 2013) Year of Birth: 1965 | Chief Investment Officer, Asset Allocation of the Sub-Adviser (since April 2013) and a Senior Vice President of the Sub-Adviser (since April 2013). Mr. Hamilton served at AllianceBernstein L.P. (from 1994-2013), as an Investment Director of Dynamic Asset Allocation (from 2010-2013), Head of North American Blend Team (from 2009-2010), and Senior Portfolio Manager of Blend Strategies (from 2006-2010). A portfolio manager and officer of other portfolios in the OppenheimerFunds complex. | |
Arthur S. Gabinet, Secretary and Chief Legal Officer (since 2011) Year of Birth: 1958 | Executive Vice President, Secretary and General Counsel of the Manager (since January 2013); General Counsel OFI SteelPath, Inc. (since January 2013); Executive Vice President (May 2010-December 2012) and General Counsel (since January 2011) of the Sub-Adviser; General Counsel of the Distributor (since January 2011); General Counsel of Centennial Asset Management Corporation (January 2011-December 2012); Executive Vice President (January 2011-December 2012) and General Counsel of HarbourView Asset Management Corporation (since January 2011); Assistant Secretary (since January 2011) and Director (since January 2011) of OppenheimerFunds International Ltd. and OppenheimerFunds plc; Director of Oppenheimer Real Asset Management, Inc. (January 2011-December 2012) and General Counsel (since January 2011); Executive Vice President (January 2011-December 2011) and General Counsel of Shareholder Financial Services, Inc. and Shareholder Services, Inc. (since January 2011); Executive Vice President (January 2011-December 2012) and General Counsel of OFI Private Investments Inc. (since | |
50 OPPENHEIMER PORTFOLIO SERIES CONSERVATIVE INVESTOR FUND
| TRUSTEES AND OFFICERS Unaudited / Continued | ||||
Arthur S. Gabinet, Continued | January 2011); Vice President of OppenheimerFunds Legacy Program (January 2011-December 2011); Executive Vice President (January 2011-December 2012) and General Counsel of OFI Institutional Asset Management, Inc. (since January 2011); General Counsel, Asset Management of the Sub-Adviser (May 2010-December 2010); Principal, The Vanguard Group (November 2005-April 2010); District Administrator, U.S. Securities and Exchange Commission (January 2003-October 2005). An officer of 90 portfolios in the OppenheimerFunds complex. | |
Christina Nasta, Vice President and Chief Business Officer (since 2011) Year of Birth: 1973 | Senior Vice President of OppenheimerFunds Distributor, Inc. (since January 2013); Senior Vice President of the Sub-Adviser (July 2010-December 2012); Vice President of the Sub-Adviser (January 2003-July 2010); Vice President of OppenheimerFunds Distributor, Inc. (January 2003-July 2010). An officer of 90 portfolios in the OppenheimerFunds complex. | |
Mark S. Vandehey, Vice President and Chief Compliance Officer (since 2005) Year of Birth: 1950 | Senior Vice President and Chief Compliance Officer of the Manager (since January 2013); Chief Compliance Officer of OFI SteelPath, Inc. (since January 2013); Senior Vice President of the Sub-Adviser (March 2004-December 2012); Chief Compliance Officer of the Sub-Adviser, OppenheimerFunds Distributor, Inc., OFI Trust Company, OFI Institutional Asset Management, Inc., Oppenheimer Real Asset Management, Inc., OFI Private Investments, Inc., Harborview Asset Management Corporation, Trinity Investment Management Corporation, and Shareholder Services, Inc. (since March 2004); Vice President of OppenheimerFunds Distributor, Inc., Centennial Asset Management Corporation and Shareholder Services, Inc. (June 1983-December 2012). An officer of 90 portfolios in the OppenheimerFunds complex. | |
Brian W. Wixted, Treasurer and Principal Financial & Accounting Officer (since 2005) Year of Birth: 1959 | Senior Vice President of the Manager (since January 2013); Treasurer of the Sub-Adviser, HarbourView Asset Management Corporation, Shareholder Financial Services, Inc., Shareholder Services, Inc., and Oppenheimer Real Asset Management, Inc. (March 1999-June 2008), OFI Private Investments, Inc. (March 2000-June 2008), OppenheimerFunds International Ltd. and OppenheimerFunds plc (since May 2000), OFI Institutional Asset Management, Inc. (November 2000-June 2008), and OppenheimerFunds Legacy Program (charitable trust program established by the Sub-Adviser) (June 2003-December 2011); Treasurer and Chief Financial Officer of OFI Trust Company (since May 2000); Assistant Treasurer of Oppenheimer Acquisition Corporation (March 1999-June 2008). An officer of 90 portfolios in the OppenheimerFunds complex. | |
The Fund’s Statement of Additional Information contains additional information about the Fund’s Trustees and Trustees and is available without charge upon request, by calling 1.800.CALL-OPP (225-5677). | ||
51 OPPENHEIMER PORTFOLIO SERIES CONSERVATIVE INVESTOR FUND
| OPPENHEIMER PORTFOLIO SERIES CONSERVATIVE INVESTOR FUND | ||||
| Manager | OFI Global Asset Management, Inc. | |||
| Sub-Adviser | OppenheimerFunds, Inc. | |||
| Distributor | OppenheimerFunds Distributor, Inc. | |||
| Transfer and Shareholder Servicing Agent | OFI Global Asset Management, Inc. | |||
| Sub-Transfer Agent | Shareholder Services, Inc. | |||
| DBA OppenheimerFunds Services | ||||
| Independent Registered Public Accounting Firm | KPMGLLP | |||
| Legal Counsel | Kramer Levin Naftalis & Frankel LLP | |||
| © 2014 OppenheimerFunds, Inc. All rights reserved. | ||||
52 OPPENHEIMER PORTFOLIO SERIES CONSERVATIVE INVESTOR FUND
| PRIVACY POLICY NOTICE | ||||
As an Oppenheimer fund shareholder, you are entitled to know how we protect your personal information and how we limit its disclosure.
Information Sources
We obtain nonpublic personal information about our shareholders from the following sources:
| — | Applications or other forms |
| — | When you create a user ID and password for online account access |
| — | When you enroll in eDocs Direct, our electronic document delivery service |
| — | Your transactions with us, our affiliates or others |
| — | A software program on our website, often referred to as a “cookie,” which indicates which parts of our site you’ve visited |
| — | When you set up challenge questions to reset your password online |
If you visit oppenheimerfunds.com and do not log on to the secure account information areas, we do not obtain any personal information about you. When you do log on to a secure area, we do obtain your user ID and password to identify you. We also use this information to provide you with products and services you have requested, to inform you about products and services that you may be interested in and assist you in other ways.
We do not collect personal information through our website unless you willingly provide it to us, either directly by email or in those areas of the website that request information. In order to update your personal information (including your mailing address, email address and phone number) you must first log on and visit your user profile.
If you have set your browser to warn you before accepting cookies, you will receive the warning message with each cookie. You can refuse cookies by turning them off in your browser. However, doing so may limit your access to certain sections of our website.
We use cookies to help us improve and manage our website. For example, cookies help us recognize new versus repeat visitors to the site, track the pages visited, and enable some special features on the website. This data helps us provide a better service for our website visitors.
Protection of Information
We do not disclose any non-public personal information (such as names on a customer list) about current or former customers to anyone, except as permitted by law.
Disclosure of Information
We send your financial advisor (as designated by you) copies of confirmations, account statements and other documents reporting activity in your fund accounts. We may also use details about you and your investments to help us, our financial service affiliates, or firms that jointly market their financial products and services with ours, to better serve your investment needs or suggest financial services or educational material that may be of interest to you. If this requires us to provide you with an opportunity to “opt in” or “opt out” of such information sharing with a firm not affiliated with us, you will receive notification on how to do so, before any such sharing takes place.
Right of Refusal
We will not disclose your personal information to unaffiliated third parties (except as permitted by law), unless we first offer you a reasonable opportunity to refuse or “opt out” of such disclosure.
53 OPPENHEIMER PORTFOLIO SERIES CONSERVATIVE INVESTOR FUND
Internet Security and Encryption
In general, the email services provided by our website are encrypted and provide a secure and private means of communication with us. To protect your own privacy, confidential and/or personal information should only be communicated via email when you are advised that you are using a secure website.
As a security measure, we do not include personal or account information in non-secure emails, and we advise you not to send such information to us in non-secure emails. Instead, you may take advantage of the secure features of our website to encrypt your email correspondence. To do this, you will need to use a browser that supports Secure Sockets Layer (SSL) protocol.
We do not guarantee or warrant that any part of our website, including files available for download, are free of viruses or other harmful code. It is your responsibility to take appropriate precautions, such as use of an anti-virus software package, to protect your computer hardware and software.
| — | All transactions, including redemptions, exchanges and purchases, are secured by SSL and 128-bit encryption. SSL is used to establish a secure connection between your PC and OppenheimerFunds’ server. It transmits information in an encrypted and scrambled format. |
| — | Encryption is achieved through an electronic scrambling technology that uses a “key” to code and then decode the data. Encryption acts like the cable converter box you may have on your television set. It scrambles data with a secret code so that no one can make sense of it while it is being transmitted. When the data reaches its destination, the same software unscrambles the data. |
| — | You can exit the secure area by either closing your browser, or for added security, you can use the Log Out button before you close your browser. |
Other Security Measures
We maintain physical, electronic and procedural safeguards to protect your personal account information. Our employees and agents have access to that information only so that they may offer you products or provide services, for example, when responding to your account questions.
How You Can Help
You can also do your part to keep your account information private and to prevent unauthorized transactions. If you obtain a user ID and password for your account, do not allow it to be used by anyone else. Also, take special precautions when accessing your account on a computer used by others.
Who We Are
This joint notice describes the privacy policies of the Oppenheimer funds, OppenheimerFunds, Inc., and each of its investment adviser subsidiaries, OppenheimerFunds Distributor, Inc. and OFI Global Trust Co. It applies to all Oppenheimer fund accounts you presently have, or may open in the future, using your Social Security number—whether or not you remain a shareholder of our funds. This notice was last updated November 2013. In the event it is updated or changed, we will post an updated notice on our website at oppenheimerfunds.com. If you have any questions about these privacy policies, write to us at P.O. Box 5270, Denver, CO 80217-5270, email us by clicking on the Contact Us section of our website at oppenheimerfunds.com or call us at 1.800.CALL OPP (225.5677).
54 OPPENHEIMER PORTFOLIO SERIES CONSERVATIVE INVESTOR FUND


Table of Contents
| 3 | ||||
| 7 | ||||
| 10 | ||||
| 12 | ||||
| 15 | ||||
| 17 | ||||
| 19 | ||||
| 20 | ||||
| 25 | ||||
| 39 | ||||
| 40 | ||||
| Board approval of the Fund’s Investment Advisory and Sub-Advisory Agreements | 41 | |||
| Portfolio Proxy Voting Policies and Procedures; Updates to Statement of Investments | 44 | |||
| 45 | ||||
| 52 | ||||
Class A Shares
AVERAGE ANNUAL TOTAL RETURNS AT 1/31/14
| Class A Shares of the Fund | ||||||||||||||||
Without Sales Charge | With Sales Charge | Barclays U.S. Aggregate Bond Index | S&P 500 Index | |||||||||||||
1-Year | 10.00 | % | 3.68 | % | 0.12 | % | 21.52 | % | ||||||||
5-Year | 12.51 | 11.19 | 4.93 | 19.19 | ||||||||||||
Since Inception (4/5/05) | 3.00 | 2.32 | 4.88 | 7.00 | ||||||||||||
Performance data quoted represents past performance, which does not guarantee future results. The investment return and principal value of an investment in the Fund will fluctuate so that an investor’s shares, when redeemed, may be worth more or less than their original cost. Fund returns include changes in share price, reinvested distributions, and a 5.75% maximum applicable sales charge except where “without sales charge” is indicated. Current performance may be lower or higher than the performance quoted. Returns do not consider capital gains or income taxes on an individual’s investment. For performance data current to the most recent month-end, visit oppenheimerfunds.com or call 1.800.CALL OPP (225.5677).
2 OPPENHEIMER PORTFOLIO SERIES MODERATE INVESTOR FUND
During the one-year reporting period ended January 31, 2014, the Fund’s Class A shares (without sales charge) produced a total return of 10.00%. During a period in which equities outperformed fixed-income securities, the Fund outperformed the Barclays U.S. Aggregate Bond Index’s return of 0.12%, but underperformed the S&P 500 Index’s return of 21.52%.
MARKET OVERVIEW
Accommodative monetary policies on the part of central banks in the U.S., Europe and Japan, combined with an improving economic outlook, resulted in a rally among equities and higher-yielding bonds over the first four months of 2013. At the same time, yields of U.S. government securities remained near historical lows due to the Federal Reserve’s (the “Fed’s”) massive bond buying program. These developments drove financial markets
higher through the early spring of 2013. At that time, economic data appeared to confirm that the United States, Europe and Japan had engineered a sustained economic rebound, but investors responded negatively to disappointing economic data from China, India, Brazil, and other emerging markets. The ensuing “flight to quality” toward traditional safe havens produced sharp dislocations in emerging equity, fixed-income
COMPARISON OF CHANGE IN VALUE OF $10,000 HYPOTHETICAL INVESTMENTS IN:
1 The Fund is invested in Class I shares of all underlying funds discussed in this Fund Performance Discussion, except for Oppenheimer Master Loan Fund, LLC and Master Inflation Protected Securities Fund, LLC, which do not offer Class I shares.
3 OPPENHEIMER PORTFOLIO SERIES MODERATE INVESTOR FUND
and currency markets. In late May, remarks by Fed chairman Ben Bernanke were widely interpreted as a signal that U.S. monetary policymakers would begin to back away from their quantitative easing program sooner than expected, sparking heightened volatility in financial markets throughout the world. However, market conditions generally stabilized over the summer of 2013. In October, the U.S. Congress managed to reach a bipartisan agreement to raise the national debt ceiling, and did so well ahead of the potential default deadline. While the Fed refrained from reducing its monthly bond purchases in September, in December the Central Bank announced that it would reduce its monthly bond purchases by $10 billion, from $85 billion to $75 billion, starting in January 2014. The Fed also continued to hold short-term interest rates at very low levels throughout the reporting period. Against this backdrop, equities generally performed well over 2013, with fixed-income producing muted results. While concerns that ongoing downturns in the emerging markets might dampen the U.S. economic recovery resulted in renewed volatility in stock and bond markets over January 2014, corporate earnings growth generally remained strong, and the unemployment rate fell.
FUND REVIEW
The largest underlying domestic equity holdings of the Fund were Oppenheimer Value Fund and Oppenheimer Capital Appreciation Fund. These two underlying funds provided the strongest contribution to the Fund’s return on an absolute basis this
period. Oppenheimer Value Fund and Oppenheimer Capital Appreciation Fund received their best absolute results from securities in the financials sector and health care sector, respectively. However, they underperformed their benchmarks, the S&P 500 Index and the Russell 1000 Value Index (for Oppenheimer Value Fund), and the S&P 500 Index and the Russell 1000 Growth Index (for Oppenheimer Capital Appreciation Fund). The Fund had a smaller allocation to Oppenheimer Main Street Small- & Mid-Cap Fund, which also performed positively. The underlying fund’s absolute performance was driven by certain stocks within the health care sector. However, on a relative basis, the underlying fund underperformed its benchmark, the Russell 2500 Index.
The Fund’s largest foreign equity funds at period end and its strongest contributors to performance in the space were Oppenheimer International Growth Fund and Oppenheimer International Value Fund. Oppenheimer International Growth Fund’s performance was driven largely by holdings in the information technology sector. Oppenheimer International Value Fund received its best absolute performance from stocks in the consumer discretionary sector this reporting period. Both of these underlying funds outperformed their benchmarks, the MSCI All Country World ex-U.S. Index and the MSCI EAFE Index.
The Fund’s largest underlying fixed-income holding, Oppenheimer Core Bond Fund, produced positive results this reporting
4 OPPENHEIMER PORTFOLIO SERIES MODERATE INVESTOR FUND
period. During the reporting period, the underlying fund maintained limited exposure to government bonds and favored corporate bonds, mortgage-backed securities (“MBS”) and structured products. This positioning benefited the underlying fund’s performance during the period, as higher-yielding fixed income sectors outperformed the performance of U.S. Treasuries. The underlying fund outperformed its benchmarks, the Barclays Credit Index, Barclays U.S. Aggregate Bond Index and the Citigroup Broad Investment Grade Bond Index. The Fund’s next largest underlying fixed-income funds were Oppenheimer Limited-Term Government Fund, Oppenheimer International Bond Fund and Oppenheimer Master Loan Fund, LLC. Oppenheimer Limited-Term Government Fund produced a muted return during the reporting period, as U.S. Government bonds lagged higher-yielding fixed-income sectors and equities. An allocation to MBS did benefit the Fund this reporting period. Relative to its benchmarks, the underlying fund outperformed the Barclays U.S. Government Bond Index, but underperformed the Barclays U.S. 1-3 Year Government Bond Index. Oppenheimer International Bond Fund produced a negative return this reporting period. As it has for some time, the underlying fund had a large allocation to emerging market debt. Specifically, the underlying fund’s position in emerging market local currency debt hurt its performance when volatility in the emerging markets climbed amid reactions to the potential for reduced levels of global liquidity.
Meanwhile, an allocation into European credit was additive to performance. The underlying fund did outperform its Reference Index, which is a customized weighted index comprised of 50% of the Citigroup Non-U.S. Dollar World Government Bond Index, 30% of the JPMorgan Government Bond Index - Emerging Markets Global Diversified, and 20% of the JPMorgan Emerging Markets Bond Index Global Diversified. Oppenheimer Master Loan Fund, LLC, which invests primarily in senior loans, benefited as senior floating-rate bank loans performed well during the reporting period. The underlying fund outperformed its benchmark, the Credit Suisse Leveraged Loan Index.
The Fund’s smaller allocation to alternative funds had a slight negative effect on performance this reporting period. Oppenheimer Gold & Special Minerals Fund, Oppenheimer Master Inflation Protected Securities Fund, LLC, and Oppenheimer Commodity Strategy Total Return Fund produced negative returns this period. Gold stocks and gold bullion remained out of favor among investors over the reporting period, mainly due to their preference for companies that are more leveraged to recovering U.S. and global economies. Although Oppenheimer Gold & Special Minerals Fund underperformed its benchmark, the MSCI World Index, it performed in line with other gold and precious metals indices, such as the Philadelphia Gold & Silver Index. Oppenheimer Master Inflation Protected Securities Fund, LLC, invests primarily in Treasury Inflation-Protected Securities (TIPS),
5 OPPENHEIMER PORTFOLIO SERIES MODERATE INVESTOR FUND
whose performance is closely correlated to U.S. inflation rates. Inflation continued to be tame as the Consumer Price Index (“CPI”) annual inflation rate was 1.6% before seasonal adjustment for the one-year period ended January 31, 2014, according to data from the Bureau of Labor Statistics at period end. This underlying fund performed in line with its benchmark, the Barclays U.S. Treasury Inflation Protected Securities Index, during the reporting period. Oppenheimer Commodity Strategy Total Return Fund was hurt as a variety of factors pressured commodity prices throughout the year, including the Fed’s taper talk starting in the spring, the relative stability of the U.S. dollar, a rising equity market, low inflation, a change in China’s growth priorities and fears about slowing emerging market demand. The underlying fund outperformed its benchmark, the Dow Jones-UBS Commodity Index Total Return, during the reporting period.
Oppenheimer Global Multi Strategies Fund and Oppenheimer Real Estate Fund were underlying alternative funds that produced positive absolute results for the Fund this reporting period. Oppenheimer Global Multi Strategies Fund seeks to offer the benefit of hedge fund-like strategies (Global Macro, Equity Market Neutral, Volatility, Fixed Income Alternative) with the transparency, pricing and daily liquidity of a mutual fund. The underlying fund’s Global Macro strategy, which involves tactical positioning in broad asset and/or sector classes, helped drive its performance. Relative to its benchmarks, the underlying fund outperformed the Barclays Global Aggregate Bond Index, but underperformed the S&P 500 Index.
Oppenheimer Real Estate Fund performed well early in the reporting period as the economic outlook continued to improve, and fears surrounded the fiscal cliff drama in Washington abated. While the Fed’s discussion of tapering did result in volatility for the underlying fund this period, it maintained a positive return for the overall reporting period. The underlying fund outperformed its benchmark, the FTSE NAREIT Equity REIT Index, during the reporting period.

2. Mark Hamilton became a Portfolio Manager in August 2013.
6 OPPENHEIMER PORTFOLIO SERIES MODERATE INVESTOR FUND
ASSET CLASS ALLOCATION
| ||
Domestic Equity Funds | 42.4% | |
| ||
Domestic Fixed Income Funds | 24.3 | |
| ||
Foreign Equity Funds | 17.5 | |
| ||
Alternative Funds | 8.9 | |
| ||
Foreign Fixed Income Fund | 6.2 | |
| ||
Money Market Fund | 0.7 | |
| ||
Portfolio holdings and allocations are subject to change. Percentages are as of January 31, 2014, and are based on the total market value of investments.
TOP TEN HOLDINGS
| ||
Oppenheimer Value Fund, Cl. I | 19.3% | |
| ||
Oppenheimer Capital Appreciation Fund, Cl. I | 16.8 | |
| ||
Oppenheimer Core Bond Fund, Cl. I | 14.7 | |
| ||
Oppenheimer International Growth Fund, Cl. I | 7.2 | |
| ||
Oppenheimer Limited-Term Government Fund, Cl. I | 6.7 | |
| ||
Oppenheimer Main Street Small- & Mid-Cap Fund, Cl. I | 6.3 | |
Oppenheimer International Bond Fund, CI. I | 6.2 | |
Oppenheimer International Value Fund, Cl. I | 6.0 | |
| ||
Oppenheimer Master Inflation Protected Securities Fund, LLC | 3.7 | |
| ||
Oppenheimer Master Loan Fund, LLC | 2.9 | |
| ||
Portfolio holdings and allocations are subject to change. Percentages are as of January 31, 2014, and are based on net assets. For more current Top 10 Fund holdings, please visit oppenheimerfunds.com.
7 OPPENHEIMER PORTFOLIO SERIES MODERATE INVESTOR FUND
Share Class Performance
AVERAGE ANNUAL TOTAL RETURNS WITHOUT SALES CHARGE AS OF 1/31/14
| Inception Date | 1-Year | 5-Year | Since Inception | |||||
Class A (OAMIX) | 4/5/05 | 10.00% | 12.51% | 3.00% | ||||
Class B (OBMIX) | 4/5/05 | 9.07% | 11.55% | 2.41% | ||||
Class C (OCMIX) | 4/5/05 | 9.11% | 11.66% | 2.20% | ||||
Class N (ONMIX) | 4/5/05 | 9.76% | 12.23% | 2.73% | ||||
Class Y (OYMIX) | 4/5/05 | 10.29% | 12.84% | 3.34% |
AVERAGE ANNUAL TOTAL RETURNS WITH SALES CHARGE AS OF 1/31/14
| Inception Date | 1-Year | 5-Year | Since Inception | |||||
Class A (OAMIX) | 4/5/05 | 3.68% | 11.19% | 2.32% | ||||
Class B (OBMIX) | 4/5/05 | 4.07% | 11.29% | 2.41% | ||||
Class C (OCMIX) | 4/5/05 | 8.11% | 11.66% | 2.20% | ||||
Class N (ONMIX) | 4/5/05 | 8.76% | 12.23% | 2.73% | ||||
Class Y (OYMIX) | 4/5/05 | 10.29% | 12.84% | 3.34% |
Performance data quoted represents past performance, which does not guarantee future results. The investment return and principal value of an investment in the Fund will fluctuate so that an investor’s shares, when redeemed, may be worth more or less than their original cost. Current performance may be lower or higher than the performance quoted. Returns do not consider capital gains or income taxes on an individual’s investment. For performance data current to the most recent month-end, visit oppenheimerfunds.com or call 1.800.CALL OPP (225.5677). Fund returns include changes in share price, reinvested distributions, and the applicable sales charge: for Class A shares, the current maximum initial sales charge of 5.75%; for Class B shares, the contingent deferred sales charge of 5% (1-year) and 2% (5-year); and for Class C and N shares, the contingent deferred sales charge of 1% for the 1-year period. There is no sales charge for Class Y shares. Because Class B shares convert to Class A shares 72 months after purchase, the 10-year return for Class B shares uses Class A performance for the period after conversion.
The Fund’s performance is compared to the performance of the S&P 500 Index and the Barclays U.S. Aggregate Bond Index. The S&P 500 Index is an unmanaged index of large-capitalization equity securities that is a measure of the general domestic stock market. The Barclays U.S. Aggregate Bond Index is an unmanaged, broad-based index of investment grade corporate debt. The indices are unmanaged and cannot be purchased directly by investors. Index performance includes reinvestment of income, but does not reflect transaction costs, fees, expenses or taxes. Index performance is shown for illustrative purposes only as a benchmark for the Fund’s performance, and does not predict or depict performance of the Fund. The Fund’s performance reflects the effects of the Fund’s business and operating expenses.
The Fund’s investment strategy and focus can change over time. The mention of specific fund holdings does not constitute a recommendation by OppenheimerFunds, Inc. or its affiliates.
8 OPPENHEIMER PORTFOLIO SERIES MODERATE INVESTOR FUND
Before investing in any of the Oppenheimer funds, investors should carefully consider a fund’s investment objectives, risks, charges and expenses. Fund prospectuses and summary prospectuses contain this and other information about the funds, and may be obtained by asking your financial advisor, visiting oppenheimerfunds.com, or calling 1.800.CALL OPP (225.5677). Read prospectuses and summary prospectuses carefully before investing.
Shares of Oppenheimer funds are not deposits or obligations of any bank, are not guaranteed by any bank, are not insured by the FDIC or any other agency, and involve investment risks, including the possible loss of the principal amount invested.
9 OPPENHEIMER PORTFOLIO SERIES MODERATE INVESTOR FUND
Fund Expenses. As a shareholder of the Fund, you incur two types of costs: (1) transaction costs, which may include sales charges (loads) on purchase payments, contingent deferred sales charges on redemptions; and (2) ongoing costs, including management fees; distribution and service fees; and other Fund expenses. These examples are intended to help you understand your ongoing costs (in dollars) of investing in the Fund and to compare these costs with the ongoing costs of investing in other mutual funds.
The examples are based on an investment of $1,000.00 invested at the beginning of the period and held for the entire 6-month period ended January 31, 2014.
Actual Expenses. The first section of the table provides information about actual account values and actual expenses. You may use the information in this section for the class of shares you hold, together with the amount you invested, to estimate the expense that you paid over the period. Simply divide your account value by $1,000.00 (for example, an $8,600.00 account value divided by $1,000.00 = 8.60), then multiply the result by the number in the first section under the heading entitled “Expenses Paid During Period” to estimate the expenses you paid on your account during this period.
Hypothetical Example for Comparison Purposes. The second section of the table provides information about hypothetical account values and hypothetical expenses based on the Fund’s actual expense ratio for each class of shares, and an assumed rate of return of 5% per year for each class before expenses, which is not the actual return. The hypothetical account values and expenses may not be used to estimate the actual ending account balance or expenses you paid for the period. You may use this information to compare the ongoing costs of investing in the Fund and other funds. To do so, compare this 5% hypothetical example for the class of shares you hold with the 5% hypothetical examples that appear in the shareholder reports of the other funds.
Please note that the expenses shown in the table are meant to highlight your ongoing costs only and do not reflect any transactional costs, such as front-end or contingent deferred sales charges (loads), or a $12.00 fee imposed annually on accounts valued at less than $500.00 (subject to exceptions described in the Statement of Additional Information). Therefore, the “hypothetical” section of the table is useful in comparing ongoing costs only, and will not help you determine the relative total costs of owning different funds. In addition, if these transactional costs were included, your costs would have been higher.
10 OPPENHEIMER PORTFOLIO SERIES MODERATE INVESTOR FUND
| Actual | Beginning Value | Ending Account Value | Expenses Paid During 6 Months Ended January 31, 2014 | |||||||||
Class A | $ | 1,000.00 | $ | 1,048.80 | $ | 2.33 | ||||||
Class B | 1,000.00 | 1,044.70 | 6.25 | |||||||||
Class C | 1,000.00 | 1,043.70 | 6.20 | |||||||||
Class N | 1,000.00 | 1,047.30 | 3.62 | |||||||||
Class Y | 1,000.00 | 1,049.70 | 0.41 | |||||||||
Hypothetical (5% return before expenses) | ||||||||||||
Class A | 1,000.00 | 1,022.94 | 2.30 | |||||||||
Class B | 1,000.00 | 1,019.11 | 6.18 | |||||||||
Class C | 1,000.00 | 1,019.16 | 6.13 | |||||||||
Class N | 1,000.00 | 1,021.68 | 3.57 | |||||||||
Class Y | 1,000.00 | 1,024.80 | 0.41 | |||||||||
Expenses are equal to the Fund’s annualized expense ratio for that class, multiplied by the average account value over the period, multiplied by 184/365 (to reflect the one-half year period). Those annualized expense ratios, excluding indirect expenses from affiliated funds, based on the 6-month period ended January 31, 2014 are as follows:
| Class | Expense Ratios | |||
Class A | 0.45% | |||
Class B | 1.21 | |||
Class C | 1.20 | |||
Class N | 0.70 | |||
Class Y | 0.08 | |||
The expense ratios reflect voluntary and/or contractual waivers and/or reimbursements of expenses by the Fund’s Manager and Transfer Agent. Some of these undertakings may be modified or terminated at any time, as indicated in the Fund’s prospectus. The “Financial Highlights” tables in the Fund’s financial statements, included in this report, also show the gross expense ratios, without such waivers or reimbursements and reduction to custodian expenses, if applicable.
11 OPPENHEIMER PORTFOLIO SERIES MODERATE INVESTOR FUND
| STATEMENT OF INVESTMENTS January 31, 2014 |
| Shares | Value | |||||||
Investment Companies—100.1%1 | ||||||||
Alternative Funds—8.9% | ||||||||
Oppenheimer Commodity Strategy Total Return Fund, Cl. I2 | 4,913,769 | $ | 14,643,033 | |||||
Oppenheimer Currency Opportunities Fund, Cl. I2 | 869,893 | 11,813,150 | ||||||
Oppenheimer Global Multi Strategies Fund, Cl. I2 | 693,686 | 18,167,648 | ||||||
Oppenheimer Gold & Special Minerals Fund, Cl. I2 | 543,721 | 9,536,861 | ||||||
Oppenheimer Master Inflation Protected Securities Fund, LLC | 4,800,467 | 54,813,336 | ||||||
Oppenheimer Real Estate Fund, Cl. I | 868,254 | 20,890,192 | ||||||
| 129,864,220 | ||||||||
| ||||||||
Domestic Equity Funds—42.4% | ||||||||
Oppenheimer Capital Appreciation Fund, Cl. I | 4,035,693 | 245,814,049 | ||||||
Oppenheimer Main Street Small- & Mid-Cap Fund, Cl. I | 2,940,433 | 92,594,238 | ||||||
Oppenheimer Value Fund, Cl. I | 9,766,275 | 283,221,982 | ||||||
| 621,630,269 | ||||||||
| ||||||||
Domestic Fixed Income Funds—24.3% | ||||||||
Oppenheimer Core Bond Fund, Cl. I | 31,779,925 | 215,785,691 | ||||||
Oppenheimer Limited-Term Government Fund, Cl. I | 10,694,011 | 97,529,377 | ||||||
Oppenheimer Master Loan Fund, LLC | 3,018,491 | 43,037,397 | ||||||
| 356,352,465 | ||||||||
| ||||||||
Foreign Equity Funds—17.6% | ||||||||
Oppenheimer Developing Markets Fund, Cl. I | 1,004,989 | 34,802,768 | ||||||
Oppenheimer International Growth Fund, Cl. I | 2,913,139 | 105,106,060 | ||||||
Oppenheimer International Small Company Fund, Cl. I | 932,237 | 29,822,260 | ||||||
Oppenheimer International Value Fund, Cl. I | 4,740,077 | 87,501,815 | ||||||
| 257,232,903 | ||||||||
| ||||||||
Foreign Fixed Income Fund—6.2% | ||||||||
Oppenheimer International Bond Fund, Cl. I | 15,068,612 | 90,260,986 | ||||||
| ||||||||
Money Market Fund—0.7% | ||||||||
Oppenheimer Institutional Money Market Fund, Cl. E, 0.08%3 | 10,210,831 | 10,210,831 | ||||||
| ||||||||
Total Investments, at Value (Cost $1,185,818,325) | 100.1% | 1,465,551,674 | ||||||
Liabilities in Excess of Other Assets | (0.1) | (1,418,494) | ||||||
|
| |||||||
Net Assets | 100.0% | $ | 1,464,133,180 | |||||
|
| |||||||
12 OPPENHEIMER PORTFOLIO SERIES MODERATE INVESTOR FUND
| STATEMENT OF INVESTMENTS Continued |
Footnotes to Statement of Investments
1. Is or was an affiliate, as defined in the Investment Company Act of 1940, at or during the period ended January 31, 2014, by virtue of the Fund owning at least 5% of the voting securities of the issuer or as a result of the Fund and the issuer having the same investment adviser. Transactions during the period in which the issuer was an affiliate are as follows:
|
| Shares January 31, 2013 |
| | Gross Additions | |
| Gross Reductions |
|
| Shares January 31, 2014 |
| |||||
| Oppenheimer Capital Appreciation Fund, Cl. I | — | 4,153,768 | a | 118,075 | 4,035,693 | |||||||||||
| Oppenheimer Capital Appreciation Fund, Cl. Y | 3,853,530 | 71,189 | 3,924,719 | a | — | |||||||||||
| Oppenheimer Commodity Strategy Total Return Fund, Cl. I | — | 5,045,305 | a | 131,536 | 4,913,769 | |||||||||||
| Oppenheimer Commodity Strategy Total Return Fund, Cl. Y | 4,499,948 | 68,806 | 4,568,754 | a | — | |||||||||||
| Oppenheimer Core Bond Fund, Cl. I | — | 32,568,642 | a | 788,717 | 31,779,925 | |||||||||||
| Oppenheimer Core Bond Fund, Cl. Y | 28,674,201 | 718,297 | 29,392,498 | a | — | |||||||||||
| Oppenheimer Currency Opportunities Fund, Cl. I | — | 894,136 | a | 24,243 | 869,893 | |||||||||||
| Oppenheimer Currency Opportunities Fund, Cl. Y | 819,742 | 13,149 | 832,891 | a | — | |||||||||||
| Oppenheimer Developing Markets Fund, Cl. I | — | 1,031,071 | a | 26,082 | 1,004,989 | |||||||||||
| Oppenheimer Developing Markets Fund, Cl. Y | 983,443 | 14,795 | 998,238 | a | — | |||||||||||
| Oppenheimer Global Multi Strategies Fund, Cl. I | — | 712,334 | a | 18,648 | 693,686 | |||||||||||
| Oppenheimer Global Multi Strategies Fund, Cl. Y | 656,707 | 10,282 | 666,989 | a | — | |||||||||||
| Oppenheimer Gold & Special Minerals Fund, Cl. I | — | 561,097 | a | 17,376 | 543,721 | |||||||||||
| Oppenheimer Gold & Special Minerals Fund, Cl. Y | 381,746 | 7,646 | 389,392 | a | — | |||||||||||
| Oppenheimer Institutional Money Market Fund, Cl. E | 9,727,111 | 853,897 | 370,177 | 10,210,831 | ||||||||||||
| Oppenheimer International Bond Fund, Cl. I | — | 15,450,607 | a | 381,995 | 15,068,612 | |||||||||||
| Oppenheimer International Bond Fund, Cl. Y | 13,300,939 | 334,928 | 13,635,867 | a | — | |||||||||||
| Oppenheimer International Growth Fund, Cl. I | — | 3,224,491 | a | 311,352 | 2,913,139 | |||||||||||
| Oppenheimer International Growth Fund, Cl. Y | 3,098,571 | 40,002 | 3,138,573 | a | — | |||||||||||
| Oppenheimer International Small Company Fund, Cl. I | — | 986,390 | a | 54,153 | 932,237 | |||||||||||
| Oppenheimer International Small Company Fund, Cl. Y | 950,650 | 16,506 | 967,156 | a | — | |||||||||||
| Oppenheimer International Value Fund, Cl. I | — | 5,027,999 | a | 287,922 | 4,740,077 | |||||||||||
| Oppenheimer International Value Fund, Cl. Y | 4,769,271 | 66,710 | 4,835,981 | a | — | |||||||||||
| Oppenheimer Limited-Term Government Fund, Cl. I | — | 10,922,962 | a | 228,951 | 10,694,011 | |||||||||||
| Oppenheimer Limited-Term Government Fund, Cl. Y | 9,890,738 | 253,172 | 10,143,910 | a | — | |||||||||||
| Oppenheimer Main Street Small- & Mid-Cap Fund, Cl. I | — | 3,092,024 | a | 151,591 | 2,940,433 | |||||||||||
| Oppenheimer Main Street Small- & Mid-Cap Fund, Cl. Y | 2,973,583 | 43,740 | 3,017,323 | a | — | |||||||||||
| Oppenheimer Master Inflation Protected Securities Fund, LLC | 3,854,304 | 1,299,336 | 353,173 | 4,800,467 | ||||||||||||
| Oppenheimer Master Loan Fund, LLC | 2,944,494 | 183,314 | 109,317 | 3,018,491 | ||||||||||||
| Oppenheimer Real Estate Fund, Cl. I | — | 887,511 | a | 19,257 | 868,254 | |||||||||||
| Oppenheimer Real Estate Fund, Cl. Y | 842,840 | 12,577 | 855,417 | a | — | |||||||||||
| Oppenheimer Value Fund, Cl. I | — | 10,584,685 | a | 818,410 | 9,766,275 | |||||||||||
| Oppenheimer Value Fund, Cl. Y | 10,136,394 | 168,872 | 10,305,266 | a | — |
13 OPPENHEIMER PORTFOLIO SERIES MODERATE INVESTOR FUND
| STATEMENT OF INVESTMENTS Continued |
| Value | Income | | Realized Gain (Loss) | | ||||||||
| Oppenheimer Capital Appreciation Fund, Cl. I | $ | 245,814,049 | $ | 1,099,065 | $ | 180,380 | ||||||
| Oppenheimer Capital Appreciation Fund, Cl. Y | — | — | 37,479 | |||||||||
| Oppenheimer Commodity Strategy Total Return Fund, Cl. I | 14,643,033 | — | (40,719 | ) | ||||||||
| Oppenheimer Commodity Strategy Total Return Fund, Cl. Y | — | — | (5,413 | ) | ||||||||
| Oppenheimer Core Bond Fund, Cl. I | 215,785,691 | 6,499,294 | (1,838,740 | ) | ||||||||
| Oppenheimer Core Bond Fund, Cl. Y | — | 2,473,992 | (686,185 | ) | ||||||||
| Oppenheimer Currency Opportunities Fund, Cl. I | 11,813,150 | — | (14,337 | ) | ||||||||
| Oppenheimer Currency Opportunities Fund, Cl. Y | — | — | (1,473 | ) | ||||||||
| Oppenheimer Developing Markets Fund, Cl. I | 34,802,768 | 210,049 | (17,334 | ) | ||||||||
| Oppenheimer Developing Markets Fund, Cl. Y | — | — | (5,196 | ) | ||||||||
| Oppenheimer Global Multi Strategies Fund, Cl. I | 18,167,648 | — | (4,256 | ) | ||||||||
| Oppenheimer Global Multi Strategies Fund, Cl. Y | — | — | 780 | |||||||||
| Oppenheimer Gold & Special Minerals Fund, Cl. I | 9,536,861 | — | (474,969 | ) | ||||||||
| Oppenheimer Gold & Special Minerals Fund, Cl. Y | — | — | (128,552 | ) | ||||||||
| Oppenheimer Institutional Money Market Fund, Cl. E | 10,210,831 | 10,993 | — | |||||||||
| Oppenheimer International Bond Fund, Cl. I | 90,260,986 | 1,645,954 | (130,615 | ) | ||||||||
| Oppenheimer International Bond Fund, Cl. Y | — | 477,950 | (4,882 | ) | ||||||||
| Oppenheimer International Growth Fund, Cl. I | 105,106,060 | 1,195,098 | 2,939,325 | |||||||||
| Oppenheimer International Growth Fund, Cl. Y | — | — | 41,343 | |||||||||
| Oppenheimer International Small Company Fund, Cl. I | 29,822,260 | 305,472 | 217,113 | |||||||||
| Oppenheimer International Small Company Fund, Cl. Y | — | — | 6,463 | |||||||||
| Oppenheimer International Value Fund, Cl. I | 87,501,815 | 1,930,715 | 504,932 | |||||||||
| Oppenheimer International Value Fund, Cl. Y | — | — | 13,509 | |||||||||
| Oppenheimer Limited-Term Government Fund, Cl. I | 97,529,377 | 1,500,553 | (60,754 | ) | ||||||||
| Oppenheimer Limited-Term Government Fund, Cl. Y | — | 689,155 | (23,751 | ) | ||||||||
| Oppenheimer Main Street Small- & Mid-Cap Fund, Cl. I | 92,594,238 | 456,976 | 418,365 | |||||||||
| Oppenheimer Main Street Small- & Mid-Cap Fund, Cl. Y | — | — | 11,769 | |||||||||
| Oppenheimer Master Inflation Protected Securities Fund, LLC | 54,813,336 | 654,731 | b | 82,497 | b | |||||||
| Oppenheimer Master Loan Fund, LLC | 43,037,397 | 2,749,837 | c | 16,750 | c | |||||||
| Oppenheimer Real Estate Fund, Cl. I | 20,890,192 | 334,979 | (12,452 | ) | ||||||||
| Oppenheimer Real Estate Fund, Cl. Y | — | 55,837 | 4,698 | |||||||||
| Oppenheimer Value Fund, Cl. I | 283,221,982 | 4,665,308 | 2,807,283 | |||||||||
| Oppenheimer Value Fund, Cl. Y | — | — | 58,238 | |||||||||
|
| |||||||||||
| Total | $ | 1,465,551,674 | $ | 26,955,958 | $ | 3,891,296 | ||||||
|
| |||||||||||
a. The Fund elected to invest in Class I Shares of the Underlying Funds as they became available to investors.
b. Represents the amount allocated to the Fund from Oppenheimer Master Inflation Protected Securities Fund, LLC.
c. Represents the amount allocated to the Fund from Oppenheimer Master Loan Fund, LLC.
2. Non-income producing security.
3. Rate shown is the 7-day yield as of January 31, 2014.
See accompanying Notes to Financial Statements.
14 OPPENHEIMER PORTFOLIO SERIES MODERATE INVESTOR FUND
| STATEMENT OF ASSETS AND LIABILITIES January 31, 2014 |
Assets | ||||
Investments, at value—see accompanying statement of investments—affiliated companies | ||||
(cost $1,185,818,325) | $ | 1,465,551,674 | ||
Cash | 227,707 | |||
Receivables and other assets: | ||||
Shares of beneficial interest sold | 1,549,895 | |||
Dividends | 1,195,654 | |||
Other | 79,944 | |||
|
| |||
Total assets
|
| 1,468,604,874
|
| |
Liabilities | ||||
Payables and other liabilities: | ||||
Shares of beneficial interest redeemed | 2,106,322 | |||
Investments purchased | 1,597,716 | |||
Distribution and service plan fees | 332,982 | |||
Transfer and shareholder servicing agent fees | 286,306 | |||
Trustees’ compensation | 101,314 | |||
Shareholder communications | 20,245 | |||
Other | 26,809 | |||
|
| |||
Total liabilities
|
| 4,471,694
|
| |
Net Assets | $ | 1,464,133,180 | ||
|
| |||
| ||||
Composition of Net Assets | ||||
Par value of shares of beneficial interest | $ | 143,988 | ||
Additional paid-in capital | 1,463,131,403 | |||
Accumulated net investment income | 8,046,857 | |||
Accumulated net realized loss on investments | (286,922,417 | ) | ||
Net unrealized appreciation on investments | 279,733,349 | |||
|
| |||
Net Assets | $ | 1,464,133,180 | ||
|
|
15 OPPENHEIMER PORTFOLIO SERIES MODERATE INVESTOR FUND
| STATEMENT OF ASSETS AND LIABILITIES Continued |
Net Asset Value Per Share | ||||
Class A Shares: | ||||
| Net asset value and redemption price per share (based on net assets of $888,533,076 and 86,880,945 shares of beneficial interest outstanding) | $ | 10.23 | ||
Maximum offering price per share (net asset value plus sales charge of 5.75% of offering price) | $ | 10.85 | ||
| ||||
Class B Shares: | ||||
| Net asset value, redemption price (excludes applicable contingent deferred sales charge) and offering price per share (based on net assets of $95,619,921 and 9,465,537 shares of beneficial interest outstanding) | $ | 10.10 | ||
| ||||
Class C Shares: | ||||
| Net asset value, redemption price (excludes applicable contingent deferred sales charge) and offering price per share (based on net assets of $359,724,760 and 35,824,042 shares of beneficial interest outstanding) | $ | 10.04 | ||
| ||||
Class N Shares: | ||||
| Net asset value, redemption price (excludes applicable contingent deferred sales charge) and offering price per share (based on net assets of $110,232,472 and 10,842,904 shares of beneficial interest outstanding) | $ | 10.17 | ||
| ||||
Class Y Shares: | ||||
| Net asset value, redemption price and offering price per share (based on net assets of $10,022,951 and 974,858 shares of beneficial interest outstanding) | $ | 10.28 | ||
See accompanying Notes to Financial Statements.
16 OPPENHEIMER PORTFOLIO SERIES MODERATE INVESTOR FUND
| STATEMENT OF OPERATIONS For the Year Ended January 31, 2014 |
Allocation of Income and Expenses from Master Funds1 | ||||||
| Net investment income allocated from Oppenheimer Master Inflation Protected Securities Fund, LLC: | ||||||
Interest | $ | 654,624 | ||||
Dividends | 107 | |||||
Net expenses | (236,516) | |||||
|
| |||||
Net investment income allocated from Oppenheimer Master Inflation Protected Securities Fund, LLC | 418,215 | |||||
| ||||||
Net investment income allocated from Oppenheimer Master Loan Fund, LLC: | ||||||
Interest | 2,640,823 | |||||
Dividends | 109,014 | |||||
Net expenses | (155,174) | |||||
|
| |||||
Net investment income allocated from Oppenheimer Master Loan Fund, LLC | 2,594,663 | |||||
|
| |||||
Total allocation of net investment income from master funds | 3,012,878 | |||||
| ||||||
Investment Income | ||||||
Dividends from affiliated companies | 23,551,390 | |||||
| ||||||
Interest | 990 | |||||
| ||||||
Other income | 134,271 | |||||
|
| |||||
Total investment income | 23,686,651 | |||||
| ||||||
Expenses | ||||||
Distribution and service plan fees: | ||||||
Class A | 2,039,553 | |||||
Class B | 1,032,473 | |||||
Class C | 3,369,747 | |||||
Class N | 561,573 | |||||
| ||||||
Transfer and shareholder servicing agent fees: | ||||||
Class A | 1,635,827 | |||||
Class B | 221,899 | |||||
Class C | 671,425 | |||||
Class N | 217,107 | |||||
Class Y | 10,127 | �� | ||||
| ||||||
Shareholder communications: | ||||||
Class A | 106,832 | |||||
Class B | 21,415 | |||||
Class C | 38,523 | |||||
Class N | 6,428 | |||||
Class Y | 243 | |||||
| ||||||
Trustees’ compensation | 28,235 | |||||
| ||||||
Custodian fees and expenses | 11,713 | |||||
| ||||||
Other | 55,386 | |||||
|
|
| ||||
Total expenses | 10,028,506 | |||||
Less waivers and reimbursements of expenses | (1,088,290) | |||||
|
| |||||
Net expenses | 8,940,216 | |||||
| ||||||
Net Investment Income | 17,759,313 | |||||
17 OPPENHEIMER PORTFOLIO SERIES MODERATE INVESTOR FUND
| STATEMENT OF OPERATIONS Continued |
| ||||||
Realized and Unrealized Gain (Loss) | ||||||
Net realized gain on: | ||||||
Investments from affiliated companies | $ | 3,792,049 | ||||
Distributions received from affiliated companies | 11,444,488 | |||||
| ||||||
Net realized gain (loss) allocated from: | ||||||
Oppenheimer Master Inflation Protected Securities Fund, LLC | 82,497 | |||||
Oppenheimer Master Loan Fund, LLC | 16,750 | |||||
|
| |||||
Net realized gain | 15,335,784 | |||||
| ||||||
Net change in unrealized appreciation/depreciation on investments | 97,588,113 | |||||
| ||||||
Net change in unrealized appreciation/depreciation allocated from: | ||||||
Oppenheimer Master Inflation Protected Securities Fund, LLC | (3,207,118) | |||||
Oppenheimer Master Loan Fund, LLC | 295,766 | |||||
|
| |||||
Net change in unrealized appreciation/depreciation | 94,676,761 | |||||
| ||||||
Net Increase in Net Assets Resulting from Operations | $ | 127,771,858 | ||||
|
| |||||
1. The Fund invests in certain affiliated mutual funds that expect to be treated as partnerships for tax purposes. See Note 1 of the accompanying Notes.
See accompanying Notes to Financial Statements.
18 OPPENHEIMER PORTFOLIO SERIES MODERATE INVESTOR FUND
| STATEMENTSOF CHANGES IN NET ASSETS | ||
| Year Ended January 31, 2014 | Year Ended January 31, 2013 | |||||||
| ||||||||
Operations | ||||||||
Net investment income | $ | 17,759,313 | $ | 18,280,480 | ||||
| ||||||||
Net realized gain (loss) | 15,335,784 | (9,892,690) | ||||||
| ||||||||
Net change in unrealized appreciation/depreciation | 94,676,761 | 97,314,645 | ||||||
|
| |||||||
Net increase in net assets resulting from operations | 127,771,858 | 105,702,435 | ||||||
| ||||||||
Dividends and/or Distributions to Shareholders | ||||||||
Dividends from net investment income: | ||||||||
Class A | (11,523,535) | (12,406,395) | ||||||
Class B | (429,700) | (969,425) | ||||||
Class C | (2,285,768) | (3,348,984) | ||||||
Class N | (1,145,246) | (1,649,609) | ||||||
Class Y | (158,644) | (141,642) | ||||||
|
| |||||||
| (15,542,893) | (18,516,055) | |||||||
| ||||||||
Beneficial Interest Transactions | ||||||||
Net increase (decrease) in net assets resulting from beneficial interest transactions: | ||||||||
Class A | 58,667,082 | 175,927,690 | ||||||
Class B | (25,652,640) | (4,625,145) | ||||||
Class C | 19,240,036 | 61,642,794 | ||||||
Class N | (14,610,224) | 12,551,091 | ||||||
Class Y | 752,179 | (1,722,935) | ||||||
|
| |||||||
| 38,396,433 | 243,773,495 | |||||||
| ||||||||
Net Assets | ||||||||
Total increase | 150,625,398 | 330,959,875 | ||||||
| ||||||||
Beginning of period | 1,313,507,782 | 982,547,907 | ||||||
|
| |||||||
End of period (including accumulated net investment income of $8,046,857 and $5,937,730, respectively) | $ | 1,464,133,180 | $ | 1,313,507,782 | ||||
|
| |||||||
See accompanying Notes to Financial Statements.
19 OPPENHEIMER PORTFOLIO SERIES MODERATE INVESTOR FUND
| FINANCIAL HIGHLIGHTS | ||
| Class A | Year Ended January 31, 2014 | Year Ended January 31, 2013 | Year Ended January 31, 2012 | Year Ended January 31, 2011 | Year Ended January 31, 2010 | |||||||||||||||
| ||||||||||||||||||||
Per Share Operating Data | ||||||||||||||||||||
Net asset value, beginning of period | $ | 9.42 | $ | 8.67 | $ | 8.77 | $ | 7.72 | $ | 6.12 | ||||||||||
| ||||||||||||||||||||
Income (loss) from investment operations: | ||||||||||||||||||||
Net investment income1 | 0.15 | 0.18 | 0.21 | 0.18 | 0.07 | |||||||||||||||
Net realized and unrealized gain (loss) | 0.80 | 0.73 | (0.10) | 1.05 | 1.54 | |||||||||||||||
|
| |||||||||||||||||||
Total from investment operations | 0.95 | 0.91 | 0.11 | 1.23 | 1.61 | |||||||||||||||
| ||||||||||||||||||||
Dividends and/or distributions to shareholders: | ||||||||||||||||||||
Dividends from net investment income | (0.14) | (0.16) | (0.21) | (0.18) | (0.01) | |||||||||||||||
| ||||||||||||||||||||
Net asset value, end of period | $ | 10.23 | $ | 9.42 | $ | 8.67 | $ | 8.77 | $ | 7.72 | ||||||||||
|
| |||||||||||||||||||
| ||||||||||||||||||||
Total Return, at Net Asset Value2 | 10.00% | 10.51% | 1.31% | 15.94% | 26.28% | |||||||||||||||
| ||||||||||||||||||||
Ratios/Supplemental Data | ||||||||||||||||||||
Net assets, end of period (in thousands) | $ | 888,533 | $ | 763,081 | $ | 538,032 | $ | 542,308 | $ | 450,074 | ||||||||||
| ||||||||||||||||||||
Average net assets (in thousands) | $ | 830,952 | $ | 606,831 | $ | 539,801 | $ | 491,634 | $ | 403,150 | ||||||||||
| ||||||||||||||||||||
Ratios to average net assets:3 | ||||||||||||||||||||
Net investment income | 1.56% | 4 | 2.00% | 4 | 2.38% | 4 | 2.20% | 4 | 1.04% | |||||||||||
Total expenses5 | 0.49% | 4 | 0.45% | 4 | 0.45% | 4 | 0.47% | 4 | 0.51% | |||||||||||
Expenses after payments, waivers and/or reimbursements and reduction to custodian expenses | 0.41% | 4 | 0.39% | 4 | 0.45% | 4 | 0.47% | 4 | 0.51% | |||||||||||
| ||||||||||||||||||||
Portfolio turnover rate | 6% | 23% | 12% | 43% | 13% | |||||||||||||||
1. Per share amounts calculated based on the average shares outstanding during the period.
2. Assumes an initial investment on the business day before the first day of the fiscal period, with all dividends and distributions reinvested in additional shares on the reinvestment date, and redemption at the net asset value calculated on the last business day of the fiscal period. Sales charges are not reflected in the total returns. Total returns are not annualized for periods less than one full year. Returns do not reflect the deduction of taxes that a shareholder would pay on fund distributions or the redemption of fund shares.
3. Annualized for periods less than one full year.
4. Includes the Fund’s share of the allocated expenses and/or net investment income from Master Funds.
5. Total expenses including indirect expenses from affiliated fund were as follows:
Year Ended January 31, 2014 | 1.11 | % | ||
Year Ended January 31, 2013 | 1.09 | % | ||
Year Ended January 31, 2012 | 1.11 | % | ||
Year Ended January 31, 2011 | 1.12 | % | ||
Year Ended January 31, 2010 | 1.15 | % |
See accompanying Notes to Financial Statements.
20 OPPENHEIMER PORTFOLIO SERIES MODERATE INVESTOR FUND
| FINANCIAL HIGHLIGHTS Continued |
| Class B | Year Ended January 31, 2014 | Year Ended January 31, 2013 | Year Ended January 31, 2012 | Year Ended January 31, 2011 | Year Ended January 31, 2010 | |||||||||||||||
| ||||||||||||||||||||
Per Share Operating Data | ||||||||||||||||||||
Net asset value, beginning of period | $ | 9.30 | $ | 8.56 | $ | 8.65 | $ | 7.62 | $ | 6.09 | ||||||||||
| ||||||||||||||||||||
Income (loss) from investment operations: | ||||||||||||||||||||
Net investment income1 | 0.06 | 0.09 | 0.13 | 0.11 | 0.03 | |||||||||||||||
Net realized and unrealized gain (loss) | 0.78 | 0.73 | (0.09) | 1.03 | 1.50 | |||||||||||||||
|
| |||||||||||||||||||
Total from investment operations | 0.84 | 0.82 | 0.04 | 1.14 | 1.53 | |||||||||||||||
| ||||||||||||||||||||
Dividends and/or distributions to shareholders: | ||||||||||||||||||||
Dividends from net investment income | (0.04) | (0.08) | (0.13) | (0.11) | 0.00 | |||||||||||||||
| ||||||||||||||||||||
Net asset value, end of period | $ | 10.10 | $ | 9.30 | $ | 8.56 | $ | 8.65 | $ | 7.62 | ||||||||||
|
| |||||||||||||||||||
| ||||||||||||||||||||
Total Return, at Net Asset Value2 | 9.07% | 9.59% | 0.49% | 14.94% | 25.12% | |||||||||||||||
| ||||||||||||||||||||
Ratios/Supplemental Data | ||||||||||||||||||||
Net assets, end of period (in thousands) | $ | 95,620 | $ | 112,666 | $ | 108,665 | $ | 118,398 | $ | 105,937 | ||||||||||
| ||||||||||||||||||||
Average net assets (in thousands) | $ | 102,915 | $ | 106,286 | $ | 113,632 | $ | 111,116 | $ | 96,884 | ||||||||||
| ||||||||||||||||||||
Ratios to average net assets:3 | ||||||||||||||||||||
Net investment income | 0.62% | 4 | 1.07% | 4 | 1.48% | 4 | 1.32% | 4 | 0.43% | |||||||||||
Total expenses5 | 1.27% | 4 | 1.29% | 4 | 1.32% | 4 | 1.34% | 4 | 1.41% | |||||||||||
Expenses after payments, waivers and/or reimbursements and reduction to custodian expenses | 1.19% | 4 | 1.23% | 4 | 1.32% | 4 | 1.34% | 4 | 1.40% | |||||||||||
| ||||||||||||||||||||
Portfolio turnover rate | 6% | 23% | 12% | 43% | 13% | |||||||||||||||
1. Per share amounts calculated based on the average shares outstanding during the period.
2. Assumes an initial investment on the business day before the first day of the fiscal period, with all dividends and distributions reinvested in additional shares on the reinvestment date, and redemption at the net asset value calculated on the last business day of the fiscal period. Sales charges are not reflected in the total returns. Total returns are not annualized for periods less than one full year. Returns do not reflect the deduction of taxes that a shareholder would pay on fund distributions or the redemption of fund shares.
3. Annualized for periods less than one full year.
4. Includes the Fund’s share of the allocated expenses and/or net investment income from Master Funds.
5. Total expenses including indirect expenses from affiliated fund were as follows:
Year Ended January 31, 2014 | 1.89 | % | ||
Year Ended January 31, 2013 | 1.93 | % | ||
Year Ended January 31, 2012 | 1.98 | % | ||
Year Ended January 31, 2011 | 1.99 | % | ||
Year Ended January 31, 2010 | 2.05 | % |
See accompanying Notes to Financial Statements.
21 OPPENHEIMER PORTFOLIO SERIES MODERATE INVESTOR FUND
| FINANCIAL HIGHLIGHTS Continued |
| Class C | Year Ended January 31, 2014 | Year Ended January 31, 2013 | Year Ended January 31, 2012 | Year Ended January 31, 2011 | Year Ended January 31, 2010 | |||||||||||||||
| ||||||||||||||||||||
Per Share Operating Data | ||||||||||||||||||||
Net asset value, beginning of period | $ | 9.26 | $ | 8.54 | $ | 8.63 | $ | 7.61 | $ | 6.07 | ||||||||||
| ||||||||||||||||||||
Income (loss) from investment operations: | ||||||||||||||||||||
Net investment income1 | 0.08 | 0.11 | 0.14 | 0.12 | 0.03 | |||||||||||||||
Net realized and unrealized gain (loss) | 0.76 | 0.71 | (0.09) | 1.02 | 1.51 | |||||||||||||||
|
| |||||||||||||||||||
Total from investment operations | 0.84 | 0.82 | 0.05 | 1.14 | 1.54 | |||||||||||||||
| ||||||||||||||||||||
Dividends and/or distributions to shareholders: | ||||||||||||||||||||
Dividends from net investment income | (0.06) | (0.10) | (0.14) | (0.12) | 0.00 | |||||||||||||||
| ||||||||||||||||||||
Net asset value, end of period | $ | 10.04 | $ | 9.26 | $ | 8.54 | $ | 8.63 | $ | 7.61 | ||||||||||
|
| |||||||||||||||||||
| ||||||||||||||||||||
Total Return, at Net Asset Value2 | 9.11% | 9.63% | 0.65% | 14.97% | 25.37% | |||||||||||||||
| ||||||||||||||||||||
Ratios/Supplemental Data | ||||||||||||||||||||
Net assets, end of period (in thousands) | $ | 359,725 | $ | 313,572 | $ | 231,079 | $ | 230,368 | $ | 194,113 | ||||||||||
| ||||||||||||||||||||
Average net assets (in thousands) | $ | 336,609 | $ | 257,063 | $ | 231,140 | $ | 209,895 | $ | 175,655 | ||||||||||
| ||||||||||||||||||||
Ratios to average net assets:3 | ||||||||||||||||||||
Net investment income | 0.79% | 4 | 1.22% | 4 | 1.61% | 4 | 1.42% | 4 | 0.45% | |||||||||||
Total expenses5 | 1.25% | 4 | 1.21% | 4 | 1.22% | 4 | 1.25% | 4 | 1.30% | |||||||||||
Expenses after payments, waivers and/or reimbursements and reduction to custodian expenses | 1.17% | 4 | 1.15% | 4 | 1.22% | 4 | 1.25% | 4 | 1.30% | |||||||||||
| ||||||||||||||||||||
Portfolio turnover rate | 6% | 23% | 12% | 43% | 13% | |||||||||||||||
1. Per share amounts calculated based on the average shares outstanding during the period.
2. Assumes an initial investment on the business day before the first day of the fiscal period, with all dividends and distributions reinvested in additional shares on the reinvestment date, and redemption at the net asset value calculated on the last business day of the fiscal period. Sales charges are not reflected in the total returns. Total returns are not annualized for periods less than one full year. Returns do not reflect the deduction of taxes that a shareholder would pay on fund distributions or the redemption of fund shares.
3. Annualized for periods less than one full year.
4. Includes the Fund’s share of the allocated expenses and/or net investment income from Master Funds.
5. Total expenses including indirect expenses from affiliated fund were as follows:
Year Ended January 31, 2014 | 1.87 | % | ||
Year Ended January 31, 2013 | 1.85 | % | ||
Year Ended January 31, 2012 | 1.88 | % | ||
Year Ended January 31, 2011 | 1.90 | % | ||
Year Ended January 31, 2010 | 1.94 | % |
See accompanying Notes to Financial Statements.
22 OPPENHEIMER PORTFOLIO SERIES MODERATE INVESTOR FUND
| FINANCIAL HIGHLIGHTS Continued |
| Class N | Year Ended | Year Ended January 31, 2013 | Year Ended January 31, 2012 | Year Ended January 31, 2011 | Year Ended January 31, 2010 | |||||||||||||||
| ||||||||||||||||||||
Per Share Operating Data | ||||||||||||||||||||
Net asset value, beginning of period | $ | 9.36 | $ | 8.62 | $ | 8.71 | $ | 7.67 | $ | 6.09 | ||||||||||
| ||||||||||||||||||||
Income (loss) from investment operations: | ||||||||||||||||||||
Net investment income1 | 0.12 | 0.15 | 0.18 | 0.16 | 0.04 | |||||||||||||||
Net realized and unrealized gain (loss) | 0.80 | 0.72 | (0.09) | 1.04 | 1.54 | |||||||||||||||
|
| |||||||||||||||||||
Total from investment operations | 0.92 | 0.87 | 0.09 | 1.20 | 1.58 | |||||||||||||||
| ||||||||||||||||||||
Dividends and/or distributions to shareholders: | ||||||||||||||||||||
Dividends from net investment income | (0.11) | (0.13) | (0.18) | (0.16) | 0.00 | |||||||||||||||
| ||||||||||||||||||||
Net asset value, end of period | $ | 10.17 | $ | 9.36 | $ | 8.62 | $ | 8.71 | $ | 7.67 | ||||||||||
|
| |||||||||||||||||||
| ||||||||||||||||||||
Total Return, at Net Asset Value2 | 9.76% | 10.17% | 1.12% | 15.62% | 25.94% | |||||||||||||||
| ||||||||||||||||||||
Ratios/Supplemental Data | ||||||||||||||||||||
Net assets, end of period (in thousands) | $ | 110,232 | $ | 115,659 | $ | 95,267 | $ | 109,375 | $ | 93,550 | ||||||||||
| ||||||||||||||||||||
Average net assets (in thousands) | $ | 111,927 | $ | 99,577 | $ | 105,816 | $ | 101,701 | $ | 85,066 | ||||||||||
| ||||||||||||||||||||
Ratios to average net assets:3 | ||||||||||||||||||||
Net investment income | 1.21% | 4 | 1.71% | 4 | 2.08% | 4 | 1.93% | 4 | 0.61% | |||||||||||
Total expenses5 | 0.74% | 4 | 0.71% | 4 | 0.72% | 4 | 0.73% | 4 | 0.78% | |||||||||||
Expenses after payments, waivers and/or reimbursements and reduction to custodian expenses | 0.66% | 4 | 0.65% | 4 | 0.72% | 4 | 0.73% | 4 | 0.78% | |||||||||||
| ||||||||||||||||||||
Portfolio turnover rate | 6% | 23% | 12% | 43% | 13% | |||||||||||||||
1. Per share amounts calculated based on the average shares outstanding during the period.
2. Assumes an initial investment on the business day before the first day of the fiscal period, with all dividends and distributions reinvested in additional shares on the reinvestment date, and redemption at the net asset value calculated on the last business day of the fiscal period. Sales charges are not reflected in the total returns. Total returns are not annualized for periods less than one full year. Returns do not reflect the deduction of taxes that a shareholder would pay on fund distributions or the redemption of fund shares.
3. Annualized for periods less than one full year.
4. Includes the Fund’s share of the allocated expenses and/or net investment income from Master Funds.
5. Total expenses including indirect expenses from affiliated fund were as follows:
Year Ended January 31, 2014 | 1.36 | % | ||
Year Ended January 31, 2013 | 1.35 | % | ||
Year Ended January 31, 2012 | 1.38 | % | ||
Year Ended January 31, 2011 | 1.38 | % | ||
Year Ended January 31, 2010 | 1.42 | % |
See accompanying Notes to Financial Statements.
23 OPPENHEIMER PORTFOLIO SERIES MODERATE INVESTOR FUND
| FINANCIAL HIGHLIGHTS Continued |
| Class Y | Year Ended January 31, 2014 | Year Ended January 31, 2013 | Year Ended January 31, 2012 | Year Ended January 31, 2011 | Year Ended January 31, 2010 | |||||||||||||||
| ||||||||||||||||||||
Per Share Operating Data | ||||||||||||||||||||
Net asset value, beginning of period | $ | 9.47 | $ | 8.70 | $ | 8.80 | $ | 7.75 | $ | 6.14 | ||||||||||
| ||||||||||||||||||||
Income (loss) from investment operations: | ||||||||||||||||||||
Net investment income1 | 0.19 | 0.18 | 0.24 | 0.22 | 0.05 | |||||||||||||||
Net realized and unrealized gain (loss) | 0.79 | 0.75 | (0.11) | 1.04 | 1.60 | |||||||||||||||
|
| |||||||||||||||||||
Total from investment operations | 0.98 | 0.93 | 0.13 | 1.26 | 1.65 | |||||||||||||||
| ||||||||||||||||||||
Dividends and/or distributions to shareholders: | ||||||||||||||||||||
Dividends from net investment income | (0.17) | (0.16) | (0.23) | (0.21) | (0.04) | |||||||||||||||
| ||||||||||||||||||||
Net asset value, end of period | $ | 10.28 | $ | 9.47 | $ | 8.70 | $ | 8.80 | $ | 7.75 | ||||||||||
|
| |||||||||||||||||||
| ||||||||||||||||||||
Total Return, at Net Asset Value2 | 10.29% | 10.72% | 1.57% | 16.32% | 26.81% | |||||||||||||||
| ||||||||||||||||||||
Ratios/Supplemental Data | ||||||||||||||||||||
Net assets, end of period (in thousands) | $ | 10,023 | $ | 8,530 | $ | 9,505 | $ | 6,631 | $ | 2,700 | ||||||||||
| ||||||||||||||||||||
Average net assets (in thousands) | $ | 9,064 | $ | 8,449 | $ | 8,314 | $ | 4,695 | $ | 2,137 | ||||||||||
| ||||||||||||||||||||
Ratios to average net assets:3 | ||||||||||||||||||||
Net investment income | 1.93% | 4 | 2.01% | 4 | 2.71% | 4 | 2.68% | 4 | 0.72% | |||||||||||
Total expenses5 | 0.15% | 4 | 0.31% | 4 | 0.25% | 4 | 0.08% | 4 | 0.09% | |||||||||||
Expenses after payments, waivers and/or reimbursements and reduction to custodian expenses | 0.07% | 4 | 0.24% | 4 | 0.25% | 4 | 0.08% | 4 | 0.09% | |||||||||||
| ||||||||||||||||||||
Portfolio turnover rate | 6% | 23% | 12% | 43% | 13% | |||||||||||||||
1. Per share amounts calculated based on the average shares outstanding during the period.
2. Assumes an initial investment on the business day before the first day of the fiscal period, with all dividends and distributions reinvested in additional shares on the reinvestment date, and redemption at the net asset value calculated on the last business day of the fiscal period. Sales charges are not reflected in the total returns. Total returns are not annualized for periods less than one full year. Returns do not reflect the deduction of taxes that a shareholder would pay on fund distributions or the redemption of fund shares.
3. Annualized for periods less than one full year.
4. Includes the Fund’s share of the allocated expenses and/or net investment income from Master Funds.
5. Total expenses including indirect expenses from affiliated fund were as follows:
Year Ended January 31, 2014 | 0.77 | % | ||
Year Ended January 31, 2013 | 0.95 | % | ||
Year Ended January 31, 2012 | 0.91 | % | ||
Year Ended January 31, 2011 | 0.73 | % | ||
Year Ended January 31, 2010 | 0.73 | % |
See accompanying Notes to Financial Statements.
24 OPPENHEIMER PORTFOLIO SERIES MODERATE INVESTOR FUND
| NOTES TO FINANCIAL STATEMENTS January 31, 2014 |
1. Significant Accounting Policies
Oppenheimer Portfolio Series (the “Trust”) is registered under the Investment Company Act of 1940, as amended, as a diversified open-end management investment company. Moderate Investor Fund (the “Fund”) is a series of the Trust whose investment objective is to seek long-term growth of capital and current income. The Fund normally invests in a diversified portfolio of Oppenheimer mutual funds (individually, an “Underlying Fund” and collectively, the “Underlying Funds”). The Fund’s investment adviser is OFI Global Asset Management, Inc. (“OFI Global” or the “Manager”), a wholly-owned subsidiary of OppenheimerFunds, Inc. (“OFI” or the “Sub-Adviser”). The Manager has entered into a sub-advisory agreement with OFI.
The Fund offers Class A, Class C, Class N and Class Y shares, and previously offered Class B shares for new purchase through June 29, 2012. Subsequent to that date, no new purchases of Class B shares are permitted, however reinvestment of dividend and/or capital gain distributions and exchanges of Class B shares into and from other Oppenheimer funds will be allowed. Class A shares are sold at their offering price, which is normally net asset value plus a front-end sales charge. Class C and Class N shares are sold, and Class B shares were sold, without a front-end sales charge but may be subject to a contingent deferred sales charge (“CDSC”). Class N shares are sold only through retirement plans. Retirement plans that offer Class N shares may impose charges on those accounts. Class Y shares are sold to certain institutional investors or intermediaries without either a front-end sales charge or a CDSC, however, the intermediaries may impose charges on their accountholders who beneficially own Class Y shares. All classes of shares have identical rights and voting privileges with respect to the Fund in general and exclusive voting rights on matters that affect that class alone. Earnings, net assets and net asset value per share may differ due to each class having its own expenses, such as transfer and shareholder servicing agent fees and shareholder communications, directly attributable to that class. Class A, B, C and N shares have separate distribution and/or service plans under which they pay fees. Class Y shares do not pay such fees. Class B shares will automatically convert to Class A shares 72 months after the date of purchase.
The following is a summary of significant accounting policies consistently followed by the Fund.
Risks of Investing in the Underlying Funds. Each of the Underlying Funds in which the Fund invests has its own investment risks, and those risks can affect the value of the Fund’s investments and therefore the value of the Fund’s shares. To the extent that the Fund invests more of its assets in one Underlying Fund than in another, the Fund will have greater exposure to the risks of that Underlying Fund.
Investment in Oppenheimer Institutional Money Market Fund. The Fund is permitted to invest daily available cash balances in an affiliated money market fund. The Fund may invest the available cash in Class E shares of Oppenheimer Institutional Money Market Fund (“IMMF”) to seek current income while preserving liquidity. IMMF is a registered open-end management investment company, regulated as a money market fund under the Investment Company Act of 1940, as amended. The Manager is the investment adviser of IMMF, and the
25 OPPENHEIMER PORTFOLIO SERIES MODERATE INVESTOR FUND
| NOTES TO FINANCIAL STATEMENTS Continued |
1. Significant Accounting Policies (Continued)
Sub-Adviser provides investment and related advisory services to IMMF. When applicable, the Fund’s investment in IMMF is included in the Statement of Investments. Shares of IMMF are valued at their net asset value per share. As a shareholder, the Fund is subject to its proportional share of IMMF’s Class E expenses, including its management fee.
Investment in Oppenheimer Master Funds. The Fund is permitted to invest in entities sponsored and/or advised by the Manager or an affiliate. Certain of these entities in which the Fund invests are mutual funds registered under the Investment Company Act of 1940 that expect to be treated as partnerships for tax purposes, specifically Oppenheimer Master Loan Fund, LLC and Oppenheimer Master Inflation Protected Securities Fund, LLC (the “Master Funds”). Each Master Fund has its own investment risks, and those risks can affect the value of the Fund’s investments and therefore the value of the Fund’s shares. To the extent that the Fund invests more of its assets in one Master Fund than in another, the Fund will have greater exposure to the risks of that Master Fund.
The investment objective of Oppenheimer Master Loan Fund, LLC is to seek income. The investment objective of Oppenheimer Master Inflation Protected Securities Fund, LLC is to seek total return. The Fund’s investments in the Master Funds are included in the Statement of Investments. The Fund recognizes income and gain/(loss) on its investments in each Master Fund according to its allocated pro-rata share, based on its relative proportion of total outstanding Master Fund shares held, of the total net income earned and the net gain/(loss) realized on investments sold by the Master Funds. As a shareholder, the Fund is subject to its proportional share of the Master Funds’ expenses, including their management fee. The Manager will waive fees and/or reimburse Fund expenses in an amount equal to the indirect management fees incurred through the Fund’s investment in the Master Funds.
Allocation of Income, Expenses, Gains and Losses. Income, expenses (other than those attributable to a specific class), gains and losses are allocated on a daily basis to each class of shares based upon the relative proportion of net assets represented by such class. Operating expenses directly attributable to a specific class are charged against the operations of that class.
Federal Taxes. The Fund intends to comply with provisions of the Internal Revenue Code applicable to regulated investment companies and to distribute substantially all of its investment company taxable income, including any net realized gain on investments not offset by capital loss carryforwards, if any, to shareholders. Therefore, no federal income or excise tax provision is required. The Fund files income tax returns in U.S. federal and applicable state jurisdictions. The statute of limitations on the Fund’s tax return filings generally remain open for the three preceding fiscal reporting period ends.
26 OPPENHEIMER PORTFOLIO SERIES MODERATE INVESTOR FUND
| NOTES TO FINANCIAL STATEMENTS Continued |
1. Significant Accounting Policies (Continued)
The tax components of capital shown in the following table represent distribution requirements the Fund must satisfy under the income tax regulations, losses the Fund may be able to offset against income and gains realized in future years and unrealized appreciation or depreciation of securities and other investments for federal income tax purposes.
| Undistributed Net Investment Income | Undistributed Long-Term Gain | Accumulated Loss Carryforward1,2,3 | Net Unrealized Appreciation Based on cost of Securities and Other Investments for Federal Income Tax Purposes | |||||||||
$7,022,059 | $— | $215,107,467 | $209,096,517 | |||||||||
1. As of January 31, 2014, the Fund had $215,107,467 of net capital loss carryforwards available to offset future realized capital gains, if any, and thereby reduce future taxable gain distributions. Details of the capital loss carryforwards are included in the table below. Capital loss carryovers with no expiration, if any, must be utilized prior to those with expiration dates.
| Expiring | ||||
2017 | $ | 1,226,854 | ||
2018 | 32,374,275 | |||
2019 | 142,546,959 | |||
No expiration | 38,959,379 | |||
|
| |||
Total | $ | 215,107,467 | ||
|
| |||
2. During the fiscal year ended January 31, 2014, the Fund utilized $17,988,389 of capital loss carryforward to offset capital gains realized in that fiscal year.
3. During the fiscal year ended January 31, 2013, the Fund did not utilize any capital loss carryforward.
Net investment income (loss) and net realized gain (loss) may differ for financial statement and tax purposes. The character of dividends and distributions made during the fiscal year from net investment income or net realized gains may differ from their ultimate characterization for federal income tax purposes. Also, due to timing of dividends and distributions, the fiscal year in which amounts are distributed may differ from the fiscal year in which the income or net realized gain was recorded by the Fund.
Accordingly, the following amounts have been reclassified for January 31, 2014. Net assets of the Fund were unaffected by the reclassifications.
| Increase to Paid-in Capital | Reduction to Accumulated Net Investment Income | |||
$107,293 | $ | 107,293 | ||
The tax character of distributions paid during the years ended January 31, 2014 and January 31, 2013 was as follows:
27 OPPENHEIMER PORTFOLIO SERIES MODERATE INVESTOR FUND
| NOTES TO FINANCIAL STATEMENTS Continued |
1. Significant Accounting Policies (Continued)
| Year Ended January 31, 2014 | Year Ended January 31, 2013 | |||||||
Distributions paid from: | ||||||||
Ordinary income | $ | 15,542,893 | $ | 18,516,055 | ||||
The aggregate cost of securities and other investments and the composition of unrealized appreciation and depreciation of securities and other investments for federal income tax purposes as of January 31, 2014 are noted in the following table. The primary difference between book and tax appreciation or depreciation of securities and other investments, if applicable, is attributable to the tax deferral of losses or tax realization of financial statement unrealized gain or loss.
Federal tax cost of securities | $ | 1,256,455,157 | ||
|
| |||
Gross unrealized appreciation | $ | 224,524,706 | ||
Gross unrealized depreciation | (15,428,189 | ) | ||
|
| |||
Net unrealized appreciation | $ | 209,096,517 | ||
|
| |||
Trustees’ Compensation. The Fund has adopted an unfunded retirement plan (the “Plan”) for the Fund’s independent trustees. Benefits are based on years of service and fees paid to each trustee during their period of service. The Plan was frozen with respect to adding new participants effective December 31, 2006 (the “Freeze Date”) and existing Plan Participants as of the Freeze Date will continue to receive accrued benefits under the Plan. Active independent trustees as of the Freeze Date have each elected a distribution method with respect to their benefits under the Plan. During the year ended January 31, 2014, the Fund’s projected benefit obligations, payments to retired trustees and accumulated liability were as follows:
Projected Benefit Obligations Increased | $ | 3,864 | ||
Payments Made to Retired Trustees | 4,667 | |||
Accumulated Liability as of January 31, 2014 | 36,682 |
The Board of Trustees has adopted a compensation deferral plan for independent trustees that enables trustees to elect to defer receipt of all or a portion of the annual compensation they are entitled to receive from the Fund. For purposes of determining the amount owed to the Trustee under the plan, deferred amounts are treated as though equal dollar amounts had been invested in shares of the Fund or in other Oppenheimer funds selected by the Trustee. The Fund purchases shares of the funds selected for deferral by the Trustee in amounts equal to his or her deemed investment, resulting in a Fund asset equal to the deferred compensation liability. Such assets are included as a component of “Other” within the asset section of the Statement of Assets and Liabilities. Deferral of trustees’ fees under the plan will not affect the net assets of the Fund, and will not materially affect the Fund’s assets, liabilities or net investment income per share. Amounts will be deferred until distributed in accordance with the compensation deferral plan.
28 OPPENHEIMER PORTFOLIO SERIES MODERATE INVESTOR FUND
| NOTES TO FINANCIAL STATEMENTS Continued |
1. Significant Accounting Policies (Continued)
Dividends and Distributions to Shareholders. Dividends and distributions to shareholders, which are determined in accordance with income tax regulations and may differ from U.S. generally accepted accounting principles, are recorded on the ex-dividend date. Income and capital gain distributions, if any, are declared and paid annually or at other times as deemed necessary by the Manager.
Investment Income. Dividend distributions received from the Underlying Funds are recorded on the ex-dividend date. Upon receipt of notification from an Underlying Fund, and subsequent to the ex-dividend date, some of the dividend income originally recorded by the Fund may be reclassified as a tax return of capital by reducing the cost basis of the Underlying Fund and/or increasing the realized gain on sales of investments in the Underlying Fund.
Custodian Fees. “Custodian fees and expenses” in the Statement of Operations may include interest expense incurred by the Fund on any cash overdrafts of its custodian account during the period. Such cash overdrafts may result from the effects of failed trades in portfolio securities and from cash outflows resulting from unanticipated shareholder redemption activity. The Fund pays interest to its custodian on such cash overdraft at a rate equal to the 1 Month LIBOR Rate plus 2.00%. The “Reduction to custodian expenses” line item, if applicable, represents earnings on cash balances maintained by the Fund during the period. Such interest expense and other custodian fees may be paid with these earnings.
Security Transactions. Security transactions are recorded on the trade date. Realized gains and losses on securities sold are determined on the basis of identified cost.
Indemnifications. The Fund’s organizational documents provide current and former trustees and officers with a limited indemnification against liabilities arising in connection with the performance of their duties to the Fund. In the normal course of business, the Fund may also enter into contracts that provide general indemnifications. The Fund’s maximum exposure under these arrangements is unknown as this would be dependent on future claims that may be made against the Fund. The risk of material loss from such claims is considered remote.
Other. The preparation of financial statements in conformity with accounting principles generally accepted in the United States of America requires management to make estimates and assumptions that affect the reported amounts of assets and liabilities and disclosure of contingent assets and liabilities at the date of the financial statements and the reported amounts of increases and decreases in net assets from operations during the reporting period. Actual results could differ from those estimates.
2. Securities Valuation
The Fund calculates the net asset value of its shares based upon the net asset value of the applicable Underlying Fund. For each Underlying Fund, the net asset value per share for a class of shares is determined as of the close of the New York Stock Exchange (the
29 OPPENHEIMER PORTFOLIO SERIES MODERATE INVESTOR FUND
| NOTES TO FINANCIAL STATEMENTS Continued |
2. Securities Valuation (Continued)
“Exchange”), normally 4:00 P.M. Eastern time, on each day the Exchange is open for trading by dividing the value of the Underlying Fund’s net assets attributable to that class by the number of outstanding shares of that class on that day.
The Fund’s Board has adopted procedures for the valuation of the Fund’s securities and has delegated the day-to-day responsibility for valuation determinations under those procedures to the Manager. The Manager has established a Valuation Committee which is responsible for determining a “fair valuation” for any security for which market quotations are not “readily available.” The Valuation Committee’s fair valuation determinations are subject to review, approval and ratification by the Fund’s Board at its next regularly scheduled meeting covering the calendar quarter in which the fair valuation was determined.
Valuations Methods and Inputs
To determine their net asset values, the Underlying Funds’ assets are valued primarily on the basis of current market quotations as generally supplied by third party portfolio pricing services or by dealers. Such market quotations are typically based on unadjusted quoted prices in active markets for identical securities or other observable market inputs.
If a market value or price cannot be determined for a security using the methodologies described above, or if, in the “good faith” opinion of the Manager, the market value or price obtained does not constitute a “readily available market quotation,” or a significant event has occurred that would materially affect the value of the security the security is fair valued either (i) by a standardized fair valuation methodology applicable to the security type or the significant event as previously approved by the Valuation Committee and the Fund’s Board or (ii) as determined in good faith by the Manager’s Valuation Committee. The Valuation Committee considers all relevant facts that are reasonably available, through either public information or information available to the Manager, when determining the fair value of a security. Fair value determinations by the Manager are subject to review, approval and ratification by the Fund’s Board at its next regularly scheduled meeting covering the calendar quarter in which the fair valuation was determined. The methodologies used for valuing securities are not necessarily an indication of the risks associated with investing in those Underlying Funds.
To assess the continuing appropriateness of security valuations, the Manager, or its third party service provider who is subject to oversight by the Manager, regularly compares prior day prices, prices on comparable securities, and sale prices to the current day prices and challenges those prices exceeding certain tolerance levels with the third party pricing service or broker source. For those securities valued by fair valuations, whether through a standardized fair valuation methodology or a fair valuation determination, the Valuation Committee reviews and affirms the reasonableness of the valuations based on such methodologies and fair valuation determinations on a regular basis after considering all relevant information that is reasonably available.
30 OPPENHEIMER PORTFOLIO SERIES MODERATE INVESTOR FUND
| NOTES TO FINANCIAL STATEMENTS Continued |
2. Securities Valuation (Continued)
Classifications
Each investment asset or liability of the Fund is assigned a level at measurement date based on the significance and source of the inputs to its valuation. Various data inputs are used in determining the value of each of the Fund’s investments as of the reporting period end. These data inputs are categorized in the following hierarchy under applicable financial accounting standards:
1) Level 1-unadjusted quoted prices in active markets for identical assets or liabilities (including securities actively traded on a securities exchange)
2) Level 2-inputs other than unadjusted quoted prices that are observable for the asset or liability (such as unadjusted quoted prices for similar assets and market corroborated inputs such as interest rates, prepayment speeds, credit risks, etc.)
3) Level 3-significant unobservable inputs (including the Manager’s own judgments about assumptions that market participants would use in pricing the asset or liability).
The inputs used for valuing securities are not necessarily an indication of the risks associated with investing in those securities.
The Fund classifies each of its investments in those Underlying Funds which are publicly offered and reported on an exchange as Level 1, and those Underlying Funds which are not publicly offered as Level 2, without consideration as to the classification level of the specific investments held by the Underlying Funds.
The table below categorizes amounts that are included in the Fund’s Statement of Assets and Liabilities as of January 31, 2014 based on valuation input level:
| Level 1— Unadjusted Quoted Prices | Level 2— Other Significant Observable Inputs | Level 3— Significant Unobservable Inputs | Value | |||||||||||||
Assets Table | ||||||||||||||||
Investments, at Value: | ||||||||||||||||
Investment Companies | $ | 1,367,700,941 | $ | 97,850,733 | $ | — | $ | 1,465,551,674 | ||||||||
|
| |||||||||||||||
Total Assets | $ | 1,367,700,941 | $ | 97,850,733 | $ | — | $ | 1,465,551,674 | ||||||||
|
| |||||||||||||||
3. Shares of Beneficial Interest
The Fund has authorized an unlimited number of $0.001 par value shares of beneficial interest of each class. Transactions in shares of beneficial interest were as follows:
| Year Ended January 31, 2014 | Year Ended January 31, 2013 | |||||||||||||||
| Shares | Amount | Shares | Amount | |||||||||||||
| ||||||||||||||||
Class A | ||||||||||||||||
Sold | 20,306,975 | $ | 201,309,488 | 16,296,584 | $ | 147,201,167 | ||||||||||
Dividends and/or distributions reinvested | 1,085,305 | 11,341,500 | 1,328,760 | 12,184,660 | ||||||||||||
Acquisition—Note 6 | — | — | 16,456,752 | 152,427,413 | ||||||||||||
Redeemed | (15,529,250 | ) | (153,983,906 | ) | (15,108,304 | ) | (135,885,550 | ) | ||||||||
|
| |||||||||||||||
Net increase | 5,863,030 | $ | 58,667,082 | 18,973,792 | $ | 175,927,690 | ||||||||||
|
| |||||||||||||||
31 OPPENHEIMER PORTFOLIO SERIES MODERATE INVESTOR FUND
| NOTES TO FINANCIAL STATEMENTS Continued |
3. Shares of Beneficial Interest (Continued)
| Year Ended January 31, 2014 | Year Ended January 31, 2013 | |||||||||||||||
| Shares | Amount | Shares | Amount | |||||||||||||
| ||||||||||||||||
Class B | ||||||||||||||||
Sold | 464,729 | $ | 4,535,135 | 1,008,088 | $ | 8,820,245 | ||||||||||
Dividends and/or distributions reinvested | 41,223 | 425,828 | 106,086 | 960,033 | ||||||||||||
Acquisition—Note 6 | — | — | 1,982,261 | 18,029,367 | ||||||||||||
Redeemed | (3,159,022) | (30,613,603) | (3,670,406) | (32,434,790) | ||||||||||||
|
| |||||||||||||||
Net decrease | (2,653,070) | $ | (25,652,640) | (573,971) | $ | (4,625,145) | ||||||||||
|
| |||||||||||||||
| ||||||||||||||||
Class C | ||||||||||||||||
Sold | 8,557,626 | $ | 83,252,725 | 7,655,809 | $ | 67,787,880 | ||||||||||
Dividends and/or distributions reinvested | 219,068 | 2,249,790 | 363,813 | 3,281,594 | ||||||||||||
Acquisition—Note 6 | — | — | 6,444,221 | 58,463,415 | ||||||||||||
Redeemed | (6,825,872) | (66,262,479) | (7,656,615) | (67,890,095) | ||||||||||||
|
| |||||||||||||||
Net increase | 1,950,822 | $ | 19,240,036 | 6,807,228 | $ | 61,642,794 | ||||||||||
|
| |||||||||||||||
| ||||||||||||||||
Class N | ||||||||||||||||
Sold | 2,409,704 | $ | 23,822,012 | 2,641,166 | $ | 23,652,002 | ||||||||||
Dividends and/or distributions reinvested | 104,224 | 1,082,890 | 169,693 | 1,545,904 | ||||||||||||
Acquisition—Note 6 | — | — | 3,465,554 | 31,843,296 | ||||||||||||
Redeemed | (4,026,419) | (39,515,126) | (4,971,946) | (44,490,111) | ||||||||||||
|
| |||||||||||||||
Net increase (decrease) | (1,512,491) | $ | (14,610,224) | 1,304,467 | $ | 12,551,091 | ||||||||||
|
| |||||||||||||||
| ||||||||||||||||
Class Y | ||||||||||||||||
Sold | 258,188 | $ | 2,576,079 | 280,875 | $ | 2,533,855 | ||||||||||
Dividends and/or distributions reinvested | 14,782 | 155,207 | 15,084 | 138,922 | ||||||||||||
Acquisition—Note 6 | — | — | 16,937 | 157,230 | ||||||||||||
Redeemed | (199,204) | (1,979,107) | (504,004) | (4,552,942) | ||||||||||||
|
| |||||||||||||||
Net increase (decrease) | 73,766 | $ | 752,179 | (191,108) | $ | (1,722,935) | ||||||||||
|
| |||||||||||||||
4. Purchases and Sales of Securities
The aggregate cost of purchases and proceeds from sales of securities, other than short-term obligations and investments in IMMF, for the year ended January 31, 2014 were as follows:
| Purchases | Sales | |||||||
| ||||||||
Investment securities | $ | 136,506,224 | $ | 84,886,395 | ||||
5. Fees and Other Transactions with Affiliates
Management Fees. Under the investment advisory agreement, the Manager does not charge a management fee, but rather collects indirect management fees from the Fund’s investments in the Underlying Funds. The weighted indirect management fees collected from the Fund’s investment in the Underlying Funds, as a percent of average daily net assets of the
32 OPPENHEIMER PORTFOLIO SERIES MODERATE INVESTOR FUND
| NOTES TO FINANCIAL STATEMENTS Continued |
5. Fees and Other Transactions with Affiliates (Continued)
Fund for the year ended January 31, 2014 was 0.55%. This amount is gross of any waivers or reimbursements of management fees implemented at the Underlying Fund level.
Sub-Adviser Fees. The Manager has retained the Sub-Adviser to provide the day-to-day portfolio management of the Fund. Under the Sub-Advisory Agreement, the Manager pays the Sub-Adviser an annual fee in monthly installments, equal to a percentage of the investment management fee collected by the Manager from the Fund, which shall be calculated after any investment management fee waivers. The fee paid to the Sub-Adviser is paid by the Manager, not by the Fund.
Transfer Agent Fees. OFI Global (the “Transfer Agent”) serves as the transfer and shareholder servicing agent for the Fund. Fees incurred by the Fund with respect to these services are detailed in the Statement of Operations.
Sub-Transfer Agent Fees. The Transfer Agent has retained Shareholder Services, Inc., a wholly-owned subsidiary of OFI (the “Sub-Transfer Agent”), to provide the day-to-day transfer agent and shareholder servicing of the Fund. Under the Sub-Transfer Agency Agreement, the Transfer Agent pays the Sub-Transfer Agent an annual fee in monthly installments, equal to a percentage of the transfer agent fee collected by the Transfer Agent from the Fund, which shall be calculated after any applicable fee waivers. The fee paid to the Sub-Transfer Agent is paid by the Transfer Agent, not by the Fund.
Distribution and Service Plan (12b-1) Fees. Under its General Distributor’s Agreement with the Fund, OppenheimerFunds Distributor, Inc. (the “Distributor”) acts as the Fund’s principal underwriter in the continuous public offering of the Fund’s classes of shares.
Service Plan for Class A Shares. The Fund has adopted a Service Plan (the “Plan”) for Class A shares under Rule 12b-1 of the Investment Company Act of 1940. Under the Plan, the Fund reimburses the Distributor for a portion of its costs incurred for services provided to accounts that hold Class A shares. Reimbursement is made periodically at an annual rate of up to 0.25% of the daily net assets of Class A shares of the Fund. The Distributor currently uses all of those fees to pay dealers, brokers, banks and other financial institutions periodically for providing personal service and maintenance of accounts of their customers that hold Class A shares. Any unreimbursed expenses the Distributor incurs with respect to Class A shares in any fiscal year cannot be recovered in subsequent periods. Fees incurred by the Fund under the Plan are detailed in the Statement of Operations.
Distribution and Service Plans for Class B, Class C and Class N Shares. The Fund has adopted Distribution and Service Plans (the “Plans”) for Class B, Class C and Class N shares under Rule 12b-1 of the Investment Company Act of 1940 to compensate the Distributor for its services in connection with the distribution of those shares and servicing accounts. Under the Plans, the Fund pays the Distributor an annual asset-based sales charge
33 OPPENHEIMER PORTFOLIO SERIES MODERATE INVESTOR FUND
| NOTES TO FINANCIAL STATEMENTS Continued |
5. Fees and Other Transactions with Affiliates (Continued)
of 0.75% on Class B and Class C shares daily net assets and 0.25% on Class N shares daily net assets. The Distributor also receives a service fee of 0.25% per year under each plan. If either the Class B, Class C or Class N plan is terminated by the Fund or by the shareholders of a class, the Board of Trustees and its independent trustees must determine whether the Distributor shall be entitled to payment from the Fund of all or a portion of the service fee and/or asset-based sales charge in respect to shares sold prior to the effective date of such termination. Fees incurred by the Fund under the Plans are detailed in the Statement of Operations. The Distributor determines its uncompensated expenses under the Plans at calendar quarter ends. The Distributor’s aggregate uncompensated expenses under the Plans at December 31, 2013 were as follows:
Class C | $ | 4,508,699 | ||
Class N | 2,677,700 |
Sales Charges. Front-end sales charges and contingent deferred sales charges (“CDSC”) do not represent expenses of the Fund. They are deducted from the proceeds of sales of Fund shares prior to investment or from redemption proceeds prior to remittance, as applicable. The sales charges retained by the Distributor from the sale of shares and the CDSC retained by the Distributor on the redemption of shares is shown in the following table for the period indicated.
| Year Ended | Class A Front-End Sales Charges Retained by Distributor | Class A Contingent Deferred Sales Charges Retained by Distributor | Class B Contingent Deferred Sales Charges Retained by Distributor | Class C Contingent Deferred Sales Charges Retained by Distributor | Class N Contingent Deferred Sales Charges Retained by Distributor | |||||||||||||||
| ||||||||||||||||||||
January 31, 2014 | $ | 953,811 | $ | 3,639 | $ | 139,279 | $ | 35,031 | $ | 3,212 | ||||||||||
Waivers and Reimbursements of Expenses. The Manager has voluntarily agreed to waive fees and/or reimburse the Fund for certain expenses in order to limit “Expenses after payments, waivers and/or reimbursements and reduction to custodian expenses”, (the combined direct (Fund level) and indirect (Underlying Fund level) expenses), will not exceed the annual rate of 1.30%, 2.05%, 2.05%, 1.55% and 1.05%, for Class A, Class B, Class C, Class N and Class Y, respectively. The expense limitations do not include extraordinary expenses and other expenses not incurred in the ordinary course of the Fund’s business. Notwithstanding the foregoing limits, the Manager is not required to waive or reimburse Fund expenses in excess of the amount of indirect management fees earned from investments in the Underlying Funds.
The Manager has also contractually agreed to waive fees and/or reimburse certain Fund expenses at an annual rate of 0.07% as calculated on the daily net assets of the Fund. This waiver and/or reimbursement is applied after (and in addition to) any other applicable waiver and/or expense reimbursements that may apply. During the year ended January 31, 2014, the Manager waived fees and/or reimbursed the Fund $979,416.
34 OPPENHEIMER PORTFOLIO SERIES MODERATE INVESTOR FUND
| NOTES TO FINANCIAL STATEMENTS Continued |
5. Fees and Other Transactions with Affiliates (Continued)
The Transfer Agent has contractually agreed to limit transfer and shareholder servicing agent fees for all classes to 0.35% of average annual net assets per class.
During the year ended January 31, 2014, the Transfer Agent waived $108,874 of fees.
Some of these undertakings may be modified or terminated at any time; some may not be modified or terminated until after one year from the date of the current prospectus, as indicated therein.
6. Acquisitions
Acquisition of Oppenheimer Transition 2020 Fund
On October 4, 2012, the Fund acquired all of the net assets of Oppenheimer Transition 2020 Fund at fair market value, pursuant to an Agreement and Plan of Reorganization approved by the Oppenheimer Transition 2020 Fund shareholders on September 14, 2012. The purpose of the acquisition is to combine two funds with similar investment objectives, strategies, and risks to allow shareholders to benefit from greater asset growth potential, as well as lowered expenses.
The transaction qualified as a tax-free reorganization, (the “merger”) for federal income tax purposes allowing the Fund to use the original cost basis of the investments received to calculate subsequent gains and losses for tax reporting purposes.
Details of the merger are shown in the following table:
Exchange Ratio to One Share of the Oppenheimer Transition 2020 Fund | Shares of Beneficial Interest Issued by the Fund | Value of Issued Shares of Beneficial Interest | Combined Net Assets on October 4, 20121 | |||||||||||||
| ||||||||||||||||
Class A | 0.9750920259 | 7,063,083 | $ | 65,545,407 | $ | 647,245,747 | ||||||||||
Class B | 0.9787271131 | 976,250 | $ | 8,893,637 | $ | 108,135,541 | ||||||||||
Class C | 0.9802696370 | 3,069,779 | $ | 27,904,289 | $ | 274,966,711 | ||||||||||
Class N | 0.9843000000 | 1,477,058 | $ | 13,603,702 | $ | 103,516,308 | ||||||||||
Class Y | 0.9941203863 | 4,344 | $ | 40,487 | $ | 8,267,304 | ||||||||||
1. The net assets acquired included net unrealized appreciation of $21,076,759 and an unused capital loss carryforward of $3,386,214, potential utilization subject to tax limitations.
Acquisition of Oppenheimer Transition 2015 Fund
On October 18, 2012, the Fund acquired all of the net assets of Oppenheimer Transition 2015 Fund at fair market value, pursuant to an Agreement and Plan of Reorganization approved by the Oppenheimer Transition 2015 Fund shareholders on September 14, 2012. The purpose of the acquisition is to combine two funds with similar investment objectives, strategies, and risks to allow shareholders to benefit from greater asset growth potential, as well as lowered expenses.
35 OPPENHEIMER PORTFOLIO SERIES MODERATE INVESTOR FUND
| NOTES TO FINANCIAL STATEMENTS Continued |
6. Acquisitions (Continued)
The transaction qualified as a tax-free reorganization, (the “merger”) for federal income tax purposes allowing the Fund to use the original cost basis of the investments received to calculate subsequent gains and losses for tax reporting purposes.
Details of the merger are shown in the following table:
Exchange Ratio to One Share of the Oppenheimer Transition 2015 Fund | Shares of Beneficial Interest Issued by the Fund | Value of Issued Shares of Beneficial Interest | Combined Net Assets on October 18, 20121 | |||||||||||||
| ||||||||||||||||
Class A | 0.9383371767 | 4,539,648 | $ | 42,127,935 | $ | 689,671,721 | ||||||||||
Class B | 0.9401819978 | 591,333 | $ | 5,387,040 | $ | 113,219,587 | ||||||||||
Class C | 0.9406639164 | 1,737,979 | $ | 15,798,228 | $ | 291,270,023 | ||||||||||
Class N | 0.9453147666 | 924,874 | $ | 8,518,087 | $ | 111,605,926 | ||||||||||
Class Y | 0.9493839228 | 1,863 | $ | 17,380 | $ | 8,280,990 | ||||||||||
1. The net assets acquired included net unrealized appreciation of $12,004,188 and an unused capital loss carryforward of $1,976,880, potential utilization subject to tax limitations.
Acquisition of Oppenheimer Transition 2025 Fund
On November 1, 2012, the Fund acquired all of the net assets of Oppenheimer Transition 2025 Fund at fair market value, pursuant to an Agreement and Plan of Reorganization approved by the Oppenheimer Transition 2025 Fund shareholders on September 14, 2012. The purpose of the acquisition is to combine two funds with similar investment objectives, strategies, and risks to allow shareholders to benefit from greater asset growth potential, as well as lowered expenses.
The transaction qualified as a tax-free reorganization, (the “merger”) for federal income tax purposes allowing the Fund to use the original cost basis of the investments received to calculate subsequent gains and losses for tax reporting purposes.
Details of the merger are shown in the following table:
Exchange Ratio to One Share of the Oppenheimer Transition 2025 Fund | Shares of Beneficial Interest Issued by the Fund | Value of Issued Shares of Beneficial Interest | Combined Net Assets on November 1, 20121 | |||||||||||||
| ||||||||||||||||
Class A | 1.0329587852 | 4,854,021 | $ | 44,754,071 | $ | 729,649,167 | ||||||||||
Class B | 1.0341061947 | 414,678 | $ | 3,748,690 | $ | 115,831,553 | ||||||||||
Class C | 1.0383041020 | 1,636,463 | $ | 14,760,898 | $ | 302,158,853 | ||||||||||
Class N | 1.0385114880 | 1,063,622 | $ | 9,721,507 | $ | 119,773,629 | ||||||||||
Class Y | 1.0318239741 | 10,730 | $ | 99,363 | $ | 8,327,985 | ||||||||||
1. The net assets acquired included net unrealized appreciation of $13,226,014.
36 OPPENHEIMER PORTFOLIO SERIES MODERATE INVESTOR FUND
| NOTES TO FINANCIAL STATEMENTS Continued |
7. Pending Litigation
Since 2009, seven class action lawsuits have been pending in the U.S. District Court for the District of Colorado against OppenheimerFunds, Inc. (“OFI”), OppenheimerFunds Distributor, Inc., the Fund’s principal underwriter and distributor (the “Distributor”), and certain funds (but not including the Fund) advised by OFI Global Asset Management, Inc. and distributed by the Distributor (the “Defendant Funds”). The lawsuits also name as defendants certain officers and current and former trustees of the respective Defendant Funds. The lawsuits raise claims under federal securities law and allege, among other things, that the disclosure documents of the respective Defendant Funds contained misrepresentations and omissions and that the respective Defendant Funds’ investment policies were not followed. The plaintiffs in these actions seek unspecified damages, equitable relief and awards of attorneys’ fees and litigation expenses. The Defendant Funds’ Boards of Trustees have also engaged counsel to represent the Funds and the present and former Independent Trustees named in those suits. On March 5, 2014, the parties in six of these lawsuits executed stipulations and agreements of settlement resolving those actions. The settlements are subject to a variety of contingencies, including approval by the court. The settlements do not resolve a seventh outstanding lawsuit relating to Oppenheimer California Municipal Fund.
Other class action and individual lawsuits have been filed since 2008 in various state and federal courts against OFI and certain of its affiliates by investors seeking to recover investments they allegedly lost as a result of the “Ponzi” scheme run by Bernard L. Madoff and his firm, Bernard L. Madoff Investment Securities, LLC (“BLMIS”). Plaintiffs in these suits allege that they suffered losses as a result of their investments in several funds managed by an affiliate of OFI and assert a variety of claims, including breach of fiduciary duty, fraud, negligent misrepresentation, unjust enrichment, and violation of federal and state securities laws and regulations, among others. They seek unspecified damages, equitable relief and awards of attorneys’ fees and litigation expenses. Neither the Distributor, nor any of the Oppenheimer mutual funds, their independent trustees or directors are named as defendants in these lawsuits. None of the Oppenheimer mutual funds invested in any funds or accounts managed by Madoff or BLMIS. On February 28, 2011, a stipulation of partial settlement of three groups of consolidated putative class action lawsuits relating to these matters was filed in the U.S. District Court for the Southern District of New York. On August 19, 2011, the court entered an order and final judgment approving the settlement as fair, reasonable and adequate. In September 2011, certain parties filed notices of appeal from the court’s order approving the settlement. The settlement does not resolve other outstanding lawsuits against OFI and its affiliates relating to BLMIS.
On April 16, 2010, a lawsuit was filed in New York state court against (i) OFI, (ii) an affiliate of OFI and (iii) AAArdvark IV Funding Limited (“AAArdvark IV”), an entity advised by OFI’s affiliate, in connection with investments made by the plaintiffs in AAArdvark IV. Plaintiffs alleged breach of contract and common law fraud claims against the defendants and sought compensatory damages, costs and disbursements, including attorney fees. On April 11, 2013, the court granted defendants’ motion for summary judgment, dismissing plaintiffs’
37 OPPENHEIMER PORTFOLIO SERIES MODERATE INVESTOR FUND
| NOTES TO FINANCIAL STATEMENTS Continued |
7. Pending Litigation (Continued)
fraud claim with prejudice and dismissing their contract claim without prejudice, and granted plaintiffs leave to replead their contract claim to assert a cause of action for specific performance within 30 days. On May 9, 2013, plaintiffs filed a notice of appeal from the court’s dismissal order. On January 7, 2014, the appellate court affirmed the trial court’s dismissal order. On July 15, 2011, a lawsuit was filed in New York state court against OFI, an affiliate of OFI and AAArdvark Funding Limited (“AAArdvark I”), an entity advised by OFI’s affiliate, in connection with investments made by the plaintiffs in AAArdvark I. The complaint alleges breach of contract and common law fraud claims against the defendants and seeks compensatory damages, costs and disbursements, including attorney fees. On November 9, 2011, a lawsuit was filed in New York state court against OFI, an affiliate of OFI and AAArdvark XS Funding Limited (“AAArdvark XS”), an entity advised by OFI’s affiliate, in connection with investments made by the plaintiffs in AAArdvark XS. The complaint alleged breach of contract against the defendants and sought compensatory damages, costs and disbursements, including attorney fees. On November 8, 2013, the parties filed a stipulation of discontinuance dismissing the lawsuit with prejudice.
OFI believes the lawsuits and appeals described above are without legal merit and, with the exception of actions it has settled, is defending against them vigorously. While it is premature to render any opinion as to the outcome in these lawsuits, or whether any costs that the Defendant Funds may bear in defending the suits might not be reimbursed by insurance, OFI believes that these suits should not impair the ability of OFI or the Distributor to perform their respective duties to the Fund, and that the outcome of all of the suits together should not have any material effect on the operations of any of the Oppenheimer mutual funds.
38 OPPENHEIMER PORTFOLIO SERIES MODERATE INVESTOR FUND
REPORTOF INDEPENDENT REGISTERED PUBLIC
ACCOUNTING FIRM |
The Board of Trustees and Shareholders of Oppenheimer Portfolio Series:
We have audited the accompanying statement of assets and liabilities of Moderate Investor Fund (a series of Oppenheimer Portfolio Series), including the statement of investments, as of January 31, 2014, and the related statement of operations for the year then ended, the statements of changes in net assets for each of the years in the two-year period then ended, and the financial highlights for each of the years in the five-year period then ended. These financial statements and financial highlights are the responsibility of the Fund’s management. Our responsibility is to express an opinion on these financial statements and financial highlights based on our audits.
We conducted our audits in accordance with the standards of the Public Company Accounting Oversight Board (United States). Those standards require that we plan and perform the audit to obtain reasonable assurance about whether the financial statements and financial highlights are free of material misstatement. An audit includes examining, on a test basis, evidence supporting the amounts and disclosures in the financial statements. Our procedures included confirmation of securities owned as of January 31, 2014, by correspondence with the custodian, transfer agent and brokers, or by other appropriate auditing procedures where replies from brokers were not received. An audit also includes assessing the accounting principles used and significant estimates made by management, as well as evaluating the overall financial statement presentation. We believe that our audits provide a reasonable basis for our opinion.
In our opinion, the financial statements and financial highlights referred to above present fairly, in all material respects, the financial position of Moderate Investor Fund as of January 31, 2014, the results of its operations for the year then ended, the changes in its net assets for each of the years in the two-year period then ended, and the financial highlights for each of the years in the five-year period then ended, in conformity with U.S. generally accepted accounting principles.
KPMG LLP
Denver, Colorado
March 24, 2014
39 OPPENHEIMER PORTFOLIO SERIES MODERATE INVESTOR FUND
|
In early 2014, if applicable, shareholders of record received information regarding all dividends and distributions paid to them by the Fund during calendar year 2013.
Dividends, if any, paid by the Fund during the fiscal year ended January 31, 2014 which are not designated as capital gain distributions should be multiplied by the maximum amount allowable but not less than 36.22% to arrive at the amount eligible for the corporate dividend-received deduction.
A portion, if any, of the dividends paid by the Fund during the fiscal year ended January 31, 2014 which are not designated as capital gain distributions are eligible for lower individual income tax rates to the extent that the Fund has received qualified dividend income as stipulated by recent tax legislation. The maximum amount allowable but not less than $9,463,224 of the Fund’s fiscal year taxable income may be eligible for the lower individual income tax rates. In early 2014, shareholders of record received information regarding the percentage of distributions that are eligible for lower individual income tax rates.
Recent tax legislation allows a regulated investment company to designate distributions not designated as capital gain distributions, as either interest related dividends or short-term capital gain dividends, both of which are exempt from the U.S. withholding tax applicable to non U.S. taxpayers. For the fiscal year ended January 31, 2014, the maximum amount allowable but not less than $8,874,727 of the ordinary distributions to be paid by the Fund qualifies as an interest related dividend.
The Fund has elected the application of Section 853 of the Internal Revenue Code to permit shareholders to take a federal income tax credit or deduction, at their option, on a per share basis. The maximum amount allowable but not less than $295,301 of foreign income taxes were paid by the Fund during the fiscal year ended January 31, 2014. A separate notice will be mailed to each shareholder, which will reflect the proportionate share of such foreign taxes which must be treated by shareholders as gross income for federal income tax purposes.
Gross income of the maximum amount allowable but not less than $2,870,057 was derived from sources within foreign countries or possessions of the United States.
The foregoing information is presented to assist shareholders in reporting distributions received from the Fund to the Internal Revenue Service. Because of the complexity of the federal regulations which may affect your individual tax return and the many variations in state and local tax regulations, we recommend that you consult your tax advisor for specific guidance.
40 OPPENHEIMER PORTFOLIO SERIES MODERATE INVESTOR FUND
| BOARD APPROVAL OF THE FUND’S INVESTMENT ADVISORY AND SUB-ADVISORY AGREEMENTS Unaudited |
The Fund has entered into an investment advisory agreement with OFI Global Asset Management, Inc. (“OFI Global” or the “Adviser”), a wholly-owned subsidiary of OppenheimerFunds, Inc. (“OFI” or the “Sub-Adviser”) (“OFI Global” and “OFI” together the “Managers”) and OFI Global has entered into a sub-advisory agreement with OFI whereby OFI provides investment sub-advisory services to the Fund (collectively, the “Agreements”). Each year, the Board of Trustees (the “Board”), including a majority of the independent Trustees, is required to determine whether to renew the Agreements. The Investment Company Act of 1940, as amended, requires that the Board request and evaluate, and that the Managers provide, such information as may be reasonably necessary to evaluate the terms of the Agreements. The Board employs an independent consultant to prepare a report that provides information, including comparative information that the Board requests for that purpose. In addition to in-person meetings focused on this evaluation, the Board receives information throughout the year regarding Fund services, fees, expenses and performance.
The Adviser, Sub-Adviser and the independent consultant provided information to the Board on the following factors: (i) the nature, quality and extent of the Managers’ services, (ii) the investment performance of the Fund and the Managers, (iii) the fees and expenses of the Fund, including comparative expense information, (iv) the profitability of the Managers and their affiliates, including an analysis of the cost of providing services, (v) whether economies of scale are realized as the Fund grows and whether fee levels reflect these economies of scale for Fund investors and (vi) other benefits to the Managers from their relationship with the Fund. The Board was aware that there are alternatives to retaining the Managers.
Outlined below is a summary of the principal information considered by the Board as well as the Board’s conclusions.
Nature, Quality and Extent of Services. The Board considered information about the nature, quality and extent of the services provided to the Fund and information regarding the Managers’ key personnel who provide such services. The Sub-Adviser’s duties include providing the Fund with the services of the portfolio manager and the Sub-Adviser’s investment team, who provide research, analysis and other advisory services in regard to the Fund’s investments; securities trading services; oversight of third-party service providers; monitoring compliance with applicable Fund policies and procedures and adherence to the Fund’s investment restrictions; and risk management. The Managers are responsible for providing certain administrative services to the Fund as well. Those services include providing and supervising all administrative and clerical personnel who are necessary in order to provide effective corporate administration for the Fund; compiling and maintaining records with respect to the Fund’s operations; preparing and filing reports required by the Securities and Exchange Commission; preparing periodic reports regarding the operations of the Fund for its shareholders; preparing proxy materials for shareholder meetings; and preparing the registration statements required by Federal and state securities laws for the sale of the Fund’s shares. The Managers also provide the Fund with office space, facilities and equipment.
The Board also considered the quality of the services provided and the quality of the Managers’ resources that are available to the Fund. The Board took account of the fact that the Sub-Adviser has had over fifty years of experience as an investment adviser and that its assets under management rank it among the top mutual fund managers in the United States. The Board evaluated the Sub-Adviser’s advisory, administrative, accounting, legal, compliance
41 OPPENHEIMER PORTFOLIO SERIES MODERATE INVESTOR FUND
| BOARD APPROVAL OF THE FUND’S INVESTMENT ADVISORY AND SUB-ADVISORY AGREEMENTS Unaudited / Continued |
services and risk management, and information the Board has received regarding the experience and professional qualifications of the Managers’ key personnel and the size and functions of its staff. In its evaluation of the quality of the portfolio management services provided, the Board considered the experience of Mark Hamilton, the portfolio manager for the Fund, and the experience of the portfolio managers and the investment performance of the investment companies in which the Fund invests (the “Underlying Funds”). The Board members also considered the totality of their experiences with the Managers as directors or trustees of the Fund and other funds advised by the Managers. The Board considered information regarding the quality of services provided by affiliates of the Managers, which its members have become knowledgeable about in connection with the renewal of the Fund’s service agreements. The Board concluded, in light of the Managers’ experience, reputation, personnel, operations and resources that the Fund benefits from the services provided under the Agreement.
Investment Performance of the Fund, the Adviser and the Sub-Adviser. Throughout the year, the Adviser and the Sub-Adviser provided information on the investment performance of the Fund, the Adviser and the Sub-Adviser, including comparative performance information. The Board also reviewed information, prepared by the Adviser, the Sub-Adviser and the independent consultant, comparing the Fund’s historical performance to its benchmarks and to the performance of other retail moderate allocation funds. The Board noted that the Fund’s three-year performance was better than its category median, although its one-year and five-year performance was below its category median.
Costs of Services by the Adviser. The Board reviewed the fees paid to the Adviser and the other expenses borne by the Fund. The Board also considered the comparability of the fees charged and the services provided to the Fund to the fees and services for other clients or accounts advised by the Adviser. The independent consultant provided comparative data in regard to the fees and expenses of the Fund and other retail front-end load moderate allocation funds with comparable asset levels and distribution features. The Adviser has voluntarily agreed to waive fees and/or reimburse the Fund for certain expenses in order to limit annual fund operating expenses after any fee waiver and/or expense reimbursement (including the combined direct (Fund level) and indirect (Underlying Fund level) expenses, but excluding (i) interest, taxes, dividends tied to short sales, brokerage commissions, and other expenditures which are capitalized in accordance with generally accepted accounting principles; (ii) certain other expenses attributable to, and incurred as a result of, a Fund’s investments; and (iii) other extraordinary expenses (including litigation expenses) not incurred in the ordinary course of the Fund’s business) to annual rates of 1.30% for Class A shares, 2.05% for Class B shares, 2.05% for Class C shares, 1.55% for Class N shares, and 1.05% for Class Y shares, as calculated on the daily net assets of the Fund. This fee waiver and/or expense reimbursement may be amended or withdrawn at any time without prior notice to shareholders. The Adviser has also contractually agreed to waive fees and/or reimburse certain Fund expenses at an annual rate of 0.07% as calculated on the daily net assets of the Fund. This waiver and/or reimbursement is applied after (and in addition to) any other applicable waivers and/or reimbursements. This fee waiver and/or expense reimbursement may not be amended or withdrawn until one year from the date of the Fund’s prospectus. The Board noted that the Fund was charged no actual management fees,
42 OPPENHEIMER PORTFOLIO SERIES MODERATE INVESTOR FUND
| BOARD APPROVAL OF THE FUND’S INVESTMENT ADVISORY AND SUB-ADVISORY AGREEMENTS Unaudited / Continued |
exclusive of Underlying Fund management fees, while certain peer group funds did charge direct management fees. The Fund’s total expenses were lower than its peer group median and its category median.
Economies of Scale and Profits Realized by the Adviser and Sub-Adviser. The Board considered information regarding OFI Global’s costs in serving as the Fund’s investment adviser, including the costs associated with the personnel and systems necessary to manage the Fund, and information regarding the Managers’ profitability from their relationship with the Fund. The Board reviewed whether the Managers may realize economies of scale in managing and supporting the Fund and whether those economies of scale benefit the Fund’s shareholders at the current level of Fund assets in relation to its management fee.
Other Benefits to the Managers. In addition to considering the profits realized by the Managers, the Board considered information that was provided regarding the direct and indirect benefits the Managers receive as a result of their relationship with the Fund, including compensation paid to the Managers’ affiliates. The Board also considered that the Managers must be able to pay and retain experienced professional personnel at competitive rates to provide quality services to the Fund.
Conclusions. These factors were also considered by the independent Trustees meeting separately from the full Board, assisted by experienced counsel to the Fund and to the independent Trustees. Fund counsel and the independent Trustees’ counsel are independent of the Managers within the meaning and intent of the Securities and Exchange Commission Rules.
Based on its review of the information it received and its evaluations described above, the Board, including a majority of the independent Trustees, decided to continue the Agreements through September 30, 2014. In arriving at its decision, the Board did not identify any factor or factors as being more important than others, but considered all of the above information, and considered the terms and conditions of the Agreements, including the management fees, in light of all the surrounding circumstances.
43 OPPENHEIMER PORTFOLIO SERIES MODERATE INVESTOR FUND
PORTFOLIO PROXY VOTING POLICIESAND PROCEDURES;
UPDATES TO STATEMENTS OF INVESTMENTS Unaudited |
The Fund has adopted Portfolio Proxy Voting Policies and Procedures under which the Fund votes proxies relating to securities (“portfolio proxies”) held by the Fund. A description of the Fund’s Portfolio Proxy Voting Policies and Procedures is available (i) without charge, upon request, by calling the Fund toll-free at 1.800.CALL OPP (225.5677), (ii) on the Fund’s website at oppenheimerfunds.com, and (iii) on the SEC’s website at www.sec.gov. In addition, the Fund is required to file Form N-PX, with its complete proxy voting record for the 12 months ended June 30th, no later than August 31st of each year. The Fund’s voting record is available (i) without charge, upon request, by calling the Fund toll-free at 1.800.CALL OPP (225.5677), and (ii) in the Form N-PX filing on the SEC’s website at www.sec.gov.
The Fund files its complete schedule of portfolio holdings with the SEC for the first quarter and the third quarter of each fiscal year on Form N-Q. The Fund’s Form N-Q filings are available on the SEC’s website at www.sec.gov. Those forms may be reviewed and copied at the SEC’s Public Reference Room in Washington, D.C. Information on the operation of the Public Reference Room may be obtained by calling 1-800-SEC-0330.
Householding—Delivery of Shareholder Documents
This is to inform you about OppenheimerFunds’ “householding” policy. If more than one member of your household maintains an account in a particular fund, OppenheimerFunds will mail only one copy of the fund’s prospectus (or, if available, the fund’s summary prospectus), annual and semiannual report and privacy policy. The consolidation of these mailings, called householding, benefits your fund through reduced mailing expense, and benefits you by reducing the volume of mail you receive from OppenheimerFunds. Householding does not affect the delivery of your account statements.
Please note that we will continue to household these mailings for as long as you remain an OppenheimerFunds shareholder, unless you request otherwise. If you prefer to receive multiple copies of these materials, please call us at 1.800.CALL-OPP (225-5677). You may also notify us in writing or via email. We will begin sending you individual copies of the prospectus (or, if available, the summary prospectus), reports and privacy policy within 30 days of receiving your request to stop householding.
44 OPPENHEIMER PORTFOLIO SERIES MODERATE INVESTOR FUND
| TRUSTEES AND OFFICERS Unaudited | ||||
| ||||
| Name, Position(s) Held with the Fund, Length of Service, Year of Birth | Principal Occupation(s) During the Past 5 Years; Other Trusteeships/Directorships Held; Number of Portfolios in the Fund Complex Currently Overseen | |
| INDEPENDENT TRUSTEES | The address of each Trustee in the chart below is 6803 S. Tucson Way, Centennial, Colorado 80112-3924. Each Trustee serves for an indefinite term, or until his or her resignation, retirement, death or removal. | |
Brian F. Wruble, Chairman of the Board of Trustees (since 2007) and Trustee (since 2005) Year of Birth: 1943 | Director of Community Foundation of the Florida Keys (non-profit) (since July 2012); Chairman Emeritus and Non-Voting Trustee of The Jackson Laboratory (non-profit) (since August 2011); Director of Special Value Opportunities Fund, LLC (registered investment company) (affiliate of the Sub-Adviser’s parent company) (since September 2004); Member of Zurich Insurance Advisory Council (insurance) (since 2004); Treasurer (since 2007) and Trustee of the Institute for Advanced Study (non-profit educational institute) (since May 1992); Chairman (August 2007-August 2011) and Trustee (since August 1991) of the Board of Trustees of The Jackson Laboratory (non-profit); General Partner of Odyssey Partners, L.P. (hedge fund) (September 1995-December 2007); Special Limited Partner of Odyssey Investment Partners, LLC (private equity investment) (January 1999-September 2004). Oversees 51 portfolios in the OppenheimerFunds complex. Mr. Wruble has served on the Boards of certain Oppenheimer funds since April 2001, during which time he has become familiar with the Fund’s (and other Oppenheimer funds’) financial, accounting, regulatory and investment matters and has contributed to the Boards’ deliberations. | |
David K. Downes, Trustee (since 2007) Year of Birth: 1940 | Director of THL Credit Inc. (since June 2009); Trustee of Employee Trusts (since January 2006); Chief Executive Officer and Board Member of Community Capital Management (investment management company) (since January 2004); President of The Community Reinvestment Act Qualified Investment Fund (investment management company) (since 2004); Director of Internet Capital Group (information technology company) (since October 2003); formerly, Independent Chairman GSK Employee Benefit Trust (April 2006- June 2013); Director of Correctnet (January 2006-2007); Independent Chairman of the Board of Trustees of Quaker Investment Trust (registered investment company) (2004-2007); Chief Operating Officer and Chief Financial Officer of Lincoln National Investment Companies, Inc. (subsidiary of Lincoln National Corporation, a publicly traded company) and Delaware Investments U.S., Inc. (investment management subsidiary of Lincoln National Corporation) (1993-2003); President, Chief Executive Officer and Trustee of Delaware Investment Family of Funds (1993-2003); President and Board Member of Lincoln National Convertible Securities Funds, Inc. and the Lincoln National Income Funds, TDC (1993-2003); Chairman and Chief Executive Officer of Retirement Financial Services, Inc. (registered transfer agent and investment adviser and subsidiary of Delaware Investments U.S., Inc.) (1993-2003); President and Chief Executive Officer of Delaware Service Company, Inc. (1995-2003); Chief Administrative Officer, Chief Financial Officer, Vice Chairman and Director of Equitable Capital Management Corporation (investment subsidiary of Equitable Life Assurance Society) (1985-1992); Corporate Controller of Merrill Lynch Company (financial services holding company) (1977-1985); held the following positions at the Colonial Penn Group, Inc. (insurance company): Corporate Budget Director (1974-1977), Assistant Treasurer (1972-1974) and Director of Corporate Taxes (1969-1972); held the following positions at Price Waterhouse Company | |
45 OPPENHEIMER PORTFOLIO SERIES MODERATE INVESTOR FUND
| TRUSTEES AND OFFICERS Unaudited / Continued |
David K. Downes, Continued | (financial services firm): Tax Manager (1967-1969), Tax Senior (1965-1967) and Staff Accountant (1963-1965); United States Marine Corps (1957-1959). Oversees 51 portfolios in the OppenheimerFunds complex. Mr. Downes has served on the Boards of certain Oppenheimer funds since December 2005, during which time he has become familiar with the Fund’s (and other Oppenheimer funds’) financial, accounting, regulatory and investment matters and has contributed to the Boards’ deliberations. | |
Matthew P. Fink, Trustee (since 2005) Year of Birth: 1941 | Trustee of the Committee for Economic Development (policy research foundation) (2005-2011); Director of ICI Education Foundation (education foundation) (October 1991-August 2006); President of the Investment Company Institute (trade association) (October 1991-June 2004); Director of ICI Mutual Insurance Company (insurance company) (October 1991-June 2004); Author of The Rise of Mutual Funds: An Insider’s View published by Oxford University Press (second edition 2010). Oversees 51 portfolios in the OppenheimerFunds complex. Mr. Fink has served on the Boards of certain Oppenheimer funds since January 2005, during which time he has become familiar with the Fund’s (and other Oppenheimer funds’) financial, accounting, regulatory and investment matters and has contributed to the Boards’ deliberations. | |
Edmund P. Giambastiani, Jr., Trustee (since 2013) Year of Birth: 1948 | Advisory Board Member of the Maxwell School of Citizenship and Public Affairs of Syracuse University (since April 2012); Director of Mercury Defense Systems Inc. (information technology) (August 2011-February 2013); Trustee of the U.S. Naval Academy Foundation (since November 2010); Advisory Board Member of the Massachusetts Institute of Technology Lincoln Laboratory (federally-funded research development center) (since May 2010); Director of The Boeing Company (aerospace and defense) (since October 2009); Trustee of MITRE Corporation (federally-funded research development center) (since September 2008); Independent Director of QinetiQ Group Plc (defense technology and security) (February 2008-August 2011); Director of Monster Worldwide, Inc. (on-line career services) (since January 2008, Lead Director since June 2011); Chairman of Alenia North America, Inc. (military and defense products) (January 2008-October 2009); Director of SRA International, Inc. (information technology and services) (January 2008-July 2011); President of Giambastiani Group LLC (national security and energy consulting) (since October 2007); United States Navy, career nuclear submarine officer (June 1970-October 2007), Vice Chairman of the Joint Chiefs of Staff (2005-October 2007), NATO Supreme Allied Commander Transformation (2003-2005), Commander, U.S. Joint Forces Command (2002-2005). Since his retirement from the U.S. Navy in October 2007, Admiral Giambastiani has also served on numerous U.S. Government advisory boards, investigations and task forces for the Secretaries of Defense, State and Interior and the Central Intelligence Agency. Oversees 51 portfolios in the OppenheimerFunds complex. Admiral Giambastiani has served on the Boards of certain Oppenheimer funds since February 2013, including as an Advisory Board Member for certain Oppenheimer funds, during which time he has become familiar with the Fund’s (and other Oppenheimer funds’) financial, accounting, regulatory and investment matters and has contributed to the Boards’ deliberations. For purposes of this report, Admiral Giambastiani is identified as a Trustee. | |
46 OPPENHEIMER PORTFOLIO SERIES MODERATE INVESTOR FUND
| TRUSTEES AND OFFICERS Unaudited / Continued |
Mary F. Miller, Trustee (since 2005) Year of Birth: 1942 | Trustee of International House (not-for-profit) (since June 2007); Trustee of the American Symphony Orchestra (not-for-profit) (October 1998-November 2011); and Senior Vice President and General Auditor of American Express Company (financial services company) (July 1998-February 2003). Oversees 51 portfolios in the OppenheimerFunds complex. Ms. Miller has served on the Boards of certain Oppenheimer funds since August 2004, during which time she has become familiar with the Fund’s (and other Oppenheimer funds’) financial, accounting, regulatory and investment matters and has contributed to the Boards’ deliberations. | |
Joel W. Motley, Trustee (since 2005) Year of Birth: 1952 | Member of the Vestry of Trinity Wall Street (since April 2012); Director of Southern Africa Legal Services Foundation (since March 2012); Board Member of Pulitzer Center for Crisis Reporting (non-profit journalism) (since December 2010); Managing Director of Public Capital Advisors, LLC (privately-held financial advisor) (since January 2006); Managing Director of Carmona Motley, Inc. (privately-held financial advisor) (since January 2002); Director of Columbia Equity Financial Corp. (privately-held financial advisor) (2002-2007); Managing Director of Carmona Motley Hoffman Inc. (privately-held financial advisor) (January 1998-December 2001); Member of the Finance and Budget Committee of the Council on Foreign Relations, Member of the Investment Committee and Board of Human Rights Watch and Member of the Investment Committee and Board of Historic Hudson Valley. Oversees 51 portfolios in the OppenheimerFunds complex. Mr. Motley has served on the Boards of certain Oppenheimer funds since October 2002, during which time he has become familiar with the Fund’s (and other Oppenheimer funds’) financial, accounting, regulatory and investment matters and has contributed to the Boards’ deliberations. | |
Joanne Pace, Trustee (since 2012) Year of Birth: 1958 | Board Director of Horizon Blue Cross Blue Shield of New Jersey (since November 2012); Advisory Board Director of The Alberleen Group LLC (since March 2012); Advisory Board Director of The Agile Trading Group LLC (since March 2012); Advisory Council Member of 100 Women in Hedge Funds (non-profit) (since December 2012); Advisory Council Member of Morgan Stanley Children’s Hospital (non-profit) (since May 2012); Board Director of The Komera Project (non-profit) (since April 2012); New York Advisory Board Director of Peace First (non-profit) (since March 2010); Senior Advisor of SECOR Asset Management, LP (2010-2011); Managing Director and Chief Operating Officer of Morgan Stanley Investment Management (2006-2010); Partner and Chief Operating Officer of FrontPoint Partners, LLC (hedge fund) (2005-2006); held the following positions at Credit Suisse: Managing Director (2003-2005); Global Head of Human Resources and member of Executive Board and Operating Committee (2004-2005), Global Head of Operations and Product Control (2003-2004); held the following positions at Morgan Stanley: Managing Director (1997-2003), Controller and Principal Accounting Officer (1999-2003); Chief Financial Officer (temporary assignment) for the Oversight Committee, Long Term Capital Management (1998-1999). Lead Independent Director and Chair of the Audit and Nominating Committee of The Global Chartist Fund, LLC of Oppenheimer Asset Management (2011-2012); Board Director of Managed Funds Association (2008-2010); Board Director of Morgan Stanley Foundation (2007-2010) and Investment Committee Chair (2008-2010). Oversees 51 portfolios in the OppenheimerFunds complex. Ms. Pace has served on the Boards of certain Oppenheimer funds since November 2012, including as an Advisory Board Member for certain Oppenheimer funds, during which time she has become familiar with the Fund’s (and other Oppenheimer | |
47 OPPENHEIMER PORTFOLIO SERIES MODERATE INVESTOR FUND
| TRUSTEES AND OFFICERS Unaudited / Continued |
Joanne Pace, Continued | funds’) financial, accounting, regulatory and investment matters and has contributed to the Board’s deliberations. For purposes of this report, Ms. Pace is identified as a Trustee. | |
Joseph M. Wikler, Trustee (since 2005) Year of Birth: 1941 | Director of C-TASC (bio-statistics services) (2007-2012); formerly, Director of the following medical device companies: Medintec (1992-2011) and Cathco (1996-2011); Member of the Investment Committee of the Associated Jewish Charities of Baltimore (since 1994); Director of Lakes Environmental Association (environmental protection organization) (1996-2008); Director of Fortis/Hartford mutual funds (1994-December 2001). Oversees 51 portfolios in the OppenheimerFunds complex. Mr. Wikler has served on the Boards of certain Oppenheimer funds since August 2005, during which time he has become familiar with the Fund’s (and other Oppenheimer funds’) financial, accounting, regulatory and investment matters and has contributed to the Boards’ deliberations. | |
Peter I. Wold, Trustee (since 2005) Year of Birth: 1948 | Director of Arch Coal, Inc. (since 2010); President of Wold Oil Properties, Inc. (oil and gas exploration and production company) (since 1994); Vice President of American Talc Company, Inc. (talc mining and milling) (since 1999); Managing Member of Hole-in-the-Wall Ranch (cattle ranching) (since 1979); Director and Chairman of Wyoming Enhanced Oil Recovery Institute Commission (enhanced oil recovery study) (2004-2012); Director and Chairman of the Denver Branch of the Federal Reserve Bank of Kansas City (1993-1999); and Director of PacifiCorp. (electric utility) (1995-1999). Oversees 51 portfolios in the OppenheimerFunds complex. Mr. Wold has served on the Boards of certain Oppenheimer funds since August 2005, during which time he has become familiar with the Fund’s (and other Oppenheimer funds’) financial, accounting, regulatory and investment matters and has contributed to the Boards’ deliberations. | |
| ||
| INTERESTED TRUSTEE AND OFFICER | Mr. Glavin is an “Interested Trustee” because he is affiliated with the Manager and the Sub-Adviser by virtue of his positions as an officer and director of the Manager and a director of the Sub-Adviser, and as a shareholder of the Sub-Adviser’s parent company. Both as a Trustee and as an officer, he serves for an indefinite term, or until his resignation, retirement, death or removal. Mr. Glavin’s address is Two World Financial Center, 225 Liberty Street, 11th Floor, New York, New York 10281-1008. | |
William F. Glavin, Jr., Trustee (since 2013), President and Principal Executive Officer (since 2009) Year of Birth: 1958 | Director, Chairman and Chief Executive Officer of the Manager (since January 2013); President of the Manager (January 2013-May 2013); Chairman of the Sub-Adviser (December 2009-December 2012); Chief Executive Officer (January 2009-December 2012) and Director of the Sub-Adviser (since January 2009); President of the Sub-Adviser (May 2009-December 2012); Management Director (since June 2009), President (since December 2009) and Chief Executive Officer (since January 2011) of Oppenheimer Acquisition Corp. (“OAC”) (the Sub-Adviser’s parent holding company); Director of Oppenheimer Real Asset Management, Inc. (since March 2010); Executive Vice President (March 2006-February 2009) and Chief Operating Officer (July 2007-February 2009) of Massachusetts Mutual Life Insurance Company (OAC’s parent company); Director (May 2004-March 2006) and Chief Operating Officer and Chief Compliance Officer (May 2004-January 2005), President (January 2005-March 2006) and Chief Executive Officer (June 2005-March 2006) of Babson | |
48 OPPENHEIMER PORTFOLIO SERIES MODERATE INVESTOR FUND
| TRUSTEES AND OFFICERS Unaudited / Continued |
William F. Glavin, Jr., Continued | Capital Management LLC; Director (March 2005-March 2006), President (May 2003-March 2006) and Chief Compliance Officer (July 2005-March 2006) of Babson Capital Securities, Inc. (a broker-dealer); President (May 2003-March 2006) of Babson Investment Company, Inc.; Director (May 2004-August 2006) of Babson Capital Europe Limited; Director (May 2004-October 2006) of Babson Capital Guernsey Limited; Director (May 2004-March 2006) of Babson Capital Management LLC; Non-Executive Director (March 2005-March 2007) of Baring Asset Management Limited; Director (February 2005-June 2006) Baring Pension Trustees Limited; Director and Treasurer (December 2003-November 2006) of Charter Oak Capital Management, Inc.; Director (May 2006-September 2006) of C.M. Benefit Insurance Company; Director (May 2008-June 2009) and Executive Vice President (June 2007-July 2009) of C.M. Life Insurance Company; President (March 2006-May 2007) of MassMutual Assignment Company; Director (January 2005-December 2006), Deputy Chairman (March 2005-December 2006) and President (February 2005-March 2005) of MassMutual Holdings (Bermuda) Limited; Director (May 2008-June 2009) and Executive Vice President (June 2007-July 2009) of MML Bay State Life Insurance Company; Chief Executive Officer and President (April 2007-January 2009) of MML Distributors, LLC; and Chairman (March 2006-December 2008) and Chief Executive Officer (May 2007-December 2008) of MML Investors Services, Inc. An officer of 90 portfolios in the OppenheimerFunds complex.
| |
| ||
OTHER OFFICERS OF THE
| The addresses of the Officers in the chart below are as follows: for Messrs. Hamilton, Gabinet and Ms. Nasta, Two World Financial Center, 225 Liberty Street, New York, New York 10281-1008, for Messrs. Vandehey and Wixted, 6803 S. Tucson Way, Centennial, Colorado 80112-3924. Each Officer serves for an indefinite term or until his or her resignation, retirement, death or removal. | |
| ||
Mark Hamilton, Vice President (since 2013) Year of Birth: 1965 | Chief Investment Officer, Asset Allocation of the Sub-Adviser (since April 2013) and a Senior Vice President of the Sub-Adviser (since April 2013). Mr. Hamilton served at AllianceBernstein L.P. (from 1994-2013), as an Investment Director of Dynamic Asset Allocation (from 2010-2013), Head of North American Blend Team (from 2009-2010), and Senior Portfolio Manager of Blend Strategies (from 2006-2010). A portfolio manager and officer of other portfolios in the OppenheimerFunds complex. | |
Arthur S. Gabinet, Secretary and Chief Legal Officer | Executive Vice President, Secretary and General Counsel of the Manager (since January 2013); General Counsel OFI SteelPath, Inc. (since January 2013); Executive Vice President (May 2010-December 2012) and General Counsel (since January 2011) of the Sub-Adviser; General Counsel of the Distributor (since January 2011); General Counsel of Centennial Asset Management Corporation (January 2011-December 2012); Executive Vice President (January 2011-December 2012) and General Counsel of HarbourView Asset Management Corporation (since January 2011); Assistant Secretary (since January 2011) and Director (since January 2011) of OppenheimerFunds International Ltd. and OppenheimerFunds plc; Director of Oppenheimer Real Asset Management, Inc. (January 2011-December 2012) and General Counsel (since January 2011); Executive Vice President (January 2011-December 2011) and General Counsel of Shareholder Financial Services, Inc. and Shareholder Services, Inc. (since January 2011); Executive Vice President (January 2011-December 2012) and General Counsel of OFI Private Investments Inc. (since January 2011); Vice President of OppenheimerFunds Legacy Program (January 2011-December 2011); Executive Vice President (January 2011-December | |
49 OPPENHEIMER PORTFOLIO SERIES MODERATE INVESTOR FUND
| TRUSTEES AND OFFICERS Unaudited / Continued |
Arthur S. Gabinet, Continued | 2012) and General Counsel of OFI Institutional Asset Management, Inc. (since January 2011); General Counsel, Asset Management of the Sub-Adviser (May 2010-December 2010); Principal, The Vanguard Group (November 2005-April 2010); District Administrator, U.S. Securities and Exchange Commission (January 2003-October 2005). An officer of 90 portfolios in the OppenheimerFunds complex. | |
Christina M. Nasta, Vice President and Chief Business Year of Birth: 1973 | Senior Vice President of OppenheimerFunds Distributor, Inc. (since January 2013); Senior Vice President of the Sub-Adviser (July 2010-December 2012); Vice President of the Sub-Adviser (January 2003-July 2010); Vice President of OppenheimerFunds Distributor, Inc. (January 2003-July 2010). An officer of 90 portfolios in the OppenheimerFunds complex. | |
Mark S. Vandehey, Vice President and Chief Year of Birth: 1950 | Senior Vice President and Chief Compliance Officer of the Manager (since January 2013); Chief Compliance Officer of OFI SteelPath, Inc. (since January 2013); Senior Vice President of the Sub-Adviser (March 2004-December 2012); Chief Compliance Officer of the Sub-Adviser, OppenheimerFunds Distributor, Inc., OFI Trust Company, OFI Institutional Asset Management, Inc., Oppenheimer Real Asset Management, Inc., OFI Private Investments, Inc., Harborview Asset Management Corporation, Trinity Investment Management Corporation, and Shareholder Services, Inc. (since March 2004); Vice President of OppenheimerFunds Distributor, Inc., Centennial Asset Management Corporation and Shareholder Services, Inc. (June 1983-December 2012). An officer of 90 portfolios in the OppenheimerFunds complex. | |
Brian W. Wixted, Treasurer and Principal Financial Year of Birth: 1959 | Senior Vice President of the Manager (since January 2013); Treasurer of the Sub-Adviser, HarbourView Asset Management Corporation, Shareholder Financial Services, Inc., Shareholder Services, Inc., and Oppenheimer Real Asset Management, Inc. (March 1999-June 2008), OFI Private Investments, Inc. (March 2000-June 2008), OppenheimerFunds International Ltd. and OppenheimerFunds plc (since May 2000), OFI Institutional Asset Management, Inc. (November 2000-June 2008), and OppenheimerFunds Legacy Program (charitable trust program established by the Sub-Adviser) (June 2003-December 2011); Treasurer and Chief Financial Officer of OFI Trust Company (since May 2000); Assistant Treasurer of Oppenheimer Acquisition Corporation (March 1999-June 2008). An officer of 90 portfolios in the OppenheimerFunds complex. | |
The Fund’s Statement of Additional Information contains additional information about the Fund’s Trustees and Officers and is available without charge upon request, by calling 1.800.CALL-OPP (225-5677).
50 OPPENHEIMER PORTFOLIO SERIES MODERATE INVESTOR FUND
OPPENHEIMER PORTFOLIO SERIES MODERATE INVESTOR FUND | ||
| Manager | OFI Global Asset Management, Inc. | |||
| Sub-Adviser | OppenheimerFunds, Inc. | |||
| Distributor | OppenheimerFunds Distributor, Inc. | |||
| Transfer and Shareholder Servicing Agent | OFI Global Asset Management, Inc. | |||
| Sub-Transfer Agent | Shareholder Services, Inc. | |||
| DBA OppenheimerFunds Services | ||||
Independent Registered Public Accounting Firm | KPMG LLP | |||
| Legal Counsel | Kramer Levin Naftalis & Frankel LLP | |||
© 2014 OppenheimerFunds, Inc. All rights reserved.
51 OPPENHEIMER PORTFOLIO SERIES MODERATE INVESTOR FUND
| PRIVACY POLICY NOTICE |
As an Oppenheimer fund shareholder, you are entitled to know how we protect your personal information and how we limit its disclosure.
Information Sources
We obtain nonpublic personal information about our shareholders from the following sources:
| • | Applications or other forms |
| • | When you create a user ID and password for online account access |
| • | When you enroll in eDocs Direct, our electronic document delivery service |
| • | Your transactions with us, our affiliates or others |
| • | A software program on our website, often referred to as a “cookie,” which indicates which parts of our site you’ve visited |
| • | When you set up challenge questions to reset your password online |
If you visit oppenheimerfunds.com and do not log on to the secure account information areas, we do not obtain any personal information about you. When you do log on to a secure area, we do obtain your user ID and password to identify you. We also use this information to provide you with products and services you have requested, to inform you about products and services that you may be interested in and assist you in other ways.
We do not collect personal information through our website unless you willingly provide it to us, either directly by email or in those areas of the website that request information. In order to update your personal information (including your mailing address, email address and phone number) you must first log on and visit your user profile.
If you have set your browser to warn you before accepting cookies, you will receive the warning message with each cookie. You can refuse cookies by turning them off in your browser. However, doing so may limit your access to certain sections of our website.
We use cookies to help us improve and manage our website. For example, cookies help us recognize new versus repeat visitors to the site, track the pages visited, and enable some special features on the website. This data helps us provide a better service for our website visitors.
Protection of Information
We do not disclose any non-public personal information (such as names on a customer list) about current or former customers to anyone, except as permitted by law.
Disclosure of Information
We send your financial advisor (as designated by you) copies of confirmations, account statements and other documents reporting activity in your fund accounts. We may also use details about you and your investments to help us, our financial service affiliates, or firms that jointly market their financial products and services with ours, to better serve your investment needs or suggest financial services or educational material that may be of interest to you. If this requires us to provide you with an opportunity to “opt in” or “opt out” of such information sharing with a firm not affiliated with us, you will receive notification on how to do so, before any such sharing takes place.
Right of Refusal
We will not disclose your personal information to unaffiliated third parties (except as permitted by law), unless we first offer you a reasonable opportunity to refuse or “opt out” of such disclosure.
52 OPPENHEIMER PORTFOLIO SERIES MODERATE INVESTOR FUND
| PRIVACY POLICY NOTICE Continued |
Internet Security and Encryption
In general, the email services provided by our website are encrypted and provide a secure and private means of communication with us. To protect your own privacy, confidential and/or personal information should only be communicated via email when you are advised that you are using a secure website.
As a security measure, we do not include personal or account information in non-secure emails, and we advise you not to send such information to us in non-secure emails. Instead, you may take advantage of the secure features of our website to encrypt your email correspondence. To do this, you will need to use a browser that supports Secure Sockets Layer (SSL) protocol.
We do not guarantee or warrant that any part of our website, including files available for download, are free of viruses or other harmful code. It is your responsibility to take appropriate precautions, such as use of an anti-virus software package, to protect your computer hardware and software.
| • | All transactions, including redemptions, exchanges and purchases, are secured by SSL and 128-bit encryption. SSL is used to establish a secure connection between your PC and OppenheimerFunds’ server. It transmits information in an encrypted and scrambled format. |
| • | Encryption is achieved through an electronic scrambling technology that uses a “key” to code and then decode the data. Encryption acts like the cable converter box you may have on your television set. It scrambles data with a secret code so that no one can make sense of it while it is being transmitted. When the data reaches its destination, the same software unscrambles the data. |
| • | You can exit the secure area by either closing your browser, or for added security, you can use the Log Out button before you close your browser. |
Other Security Measures
We maintain physical, electronic and procedural safeguards to protect your personal account information. Our employees and agents have access to that information only so that they may offer you products or provide services, for example, when responding to your account questions.
How You Can Help
You can also do your part to keep your account information private and to prevent unauthorized transactions. If you obtain a user ID and password for your account, do not allow it to be used by anyone else. Also, take special precautions when accessing your account on a computer used by others.
Who We Are
This joint notice describes the privacy policies of the Oppenheimer funds, OppenheimerFunds, Inc., and each of its investment adviser subsidiaries, OppenheimerFunds Distributor, Inc. and OFI Global Trust Co. It applies to all Oppenheimer fund accounts you presently have, or may open in the future, using your Social Security number—whether or not you remain a shareholder of our funds. This notice was last updated November 2013. In the event it is updated or changed, we will post an updated notice on our website at oppenheimerfunds.com. If you have any questions about these privacy policies, write to us at P.O. Box 5270, Denver, CO 80217-5270, email us by clicking on the Contact Us section of our website at oppenheimerfunds.com or call us at 1.800.CALL OPP (225.5677).
53 OPPENHEIMER PORTFOLIO SERIES MODERATE INVESTOR FUND

Class A Shares
AVERAGE ANNUAL TOTAL RETURNS AT 1/31/14
| Class A Shares of the Fund | ||||||||
Without Sales Charge | With Sales Charge | S&P 500 Index | Barclays U.S. Aggregate Bond Index | |||||
| 1-Year | 13.73% | 7.19% | 21.52% | 0.12% | ||||
| 5-Year | 14.51 | 13.16 | 19.19 | 4.93 | ||||
| Since Inception (4/5/05) | 4.14 | 3.44 | 7.00 | 4.88 | ||||
Performance data quoted represents past performance, which does not guarantee future results. The investment return and principal value of an investment in the Fund will fluctuate so that an investor’s shares, when redeemed, may be worth more or less than their original cost. Fund returns include changes in share price, reinvested distributions, and a 5.75% maximum applicable sales charge except where “without sales charge” is indicated. Current performance may be lower or higher than the performance quoted. Returns do not consider capital gains or income taxes on an individual’s investment. For performance data current to the most recent month-end, visit oppenheimerfunds.com or call 1.800.CALL OPP (225.5677).
2 OPPENHEIMER PORTFOLIO SERIES ACTIVE ALLOCATION FUND
During the one-year reporting period ended January 31, 2014, the Fund’s Class A shares (without sales charge) produced a total return of 13.73%. During a period in which equities outperformed fixed-income securities, the Fund outperformed the Barclays U.S. Aggregate Bond Index’s return of 0.12%, but underperformed the S&P 500 Index’s return of 21.52%.
MARKET OVERVIEW
Accommodative monetary policies on the part of central banks in the U.S., Europe and Japan, combined with an improving economic outlook, resulted in a rally among equities and higher-yielding bonds over the first four months of 2013. At the same time, yields of U.S. government securities remained near historical lows due to the Federal Reserve’s (the “Fed’s”) massive bond buying program. These developments drove financial markets higher through the
early spring of 2013. At that time, economic data appeared to confirm that the United States, Europe and Japan had engineered a sustained economic rebound, but investors responded negatively to disappointing economic data from China, India, Brazil, and other emerging markets. The ensuing “flight to quality” toward traditional safe havens produced sharp dislocations in emerging equity, fixed-income and currency markets. In late May, remarks by Fed
COMPARISON OF CHANGE IN VALUE OF $10,000 HYPOTHETICAL INVESTMENTS IN:
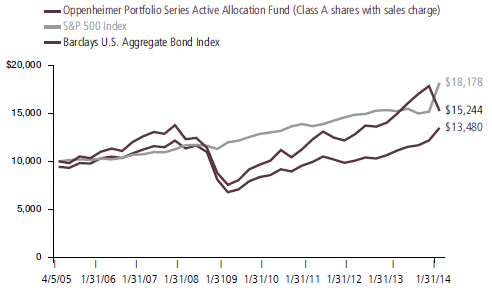
1 The Fund is invested in Class I shares of all underlying funds discussed in this Fund Performance Discussion, except for Oppenheimer Master Loan Fund, LLC, Oppenheimer Master Inflation Protected Securities Fund, LLC and Oppenheimer Master Event-Linked Bond Fund, LLC, which do not offer Class I shares.
3 OPPENHEIMER PORTFOLIO SERIES ACTIVE ALLOCATION FUND
chairman Ben Bernanke were widely interpreted as a signal that U.S. monetary policymakers would begin to back away from their quantitative easing program sooner than expected, sparking heightened volatility in financial markets throughout the world. However, market conditions generally stabilized over the summer of 2013. In October, the U.S. Congress managed to reach a bipartisan agreement to raise the national debt ceiling, and did so well ahead of the potential default deadline. While the Fed refrained from reducing its monthly bond purchases in September, in December the Central Bank announced that it would reduce its monthly bond purchases by $10 billion, from $85 billion to $75 billion, starting in January 2014. The Fed also continued to hold short-term interest rates at very low levels throughout the reporting period.
Against this backdrop, equities generally performed well over 2013, with fixed-income producing muted results. While concerns that ongoing downturns in the emerging markets might dampen the U.S. economic recovery resulted in renewed volatility in stock and bond markets over January 2014, corporate earnings growth generally remained strong, and the unemployment rate fell.
FUND REVIEW
At period end, the Fund had roughly 20% of its assets invested in an “active allocation” that seeks to take advantage of short- to
mid-term market conditions, and 80% invested in a “static allocation.” Both allocations are comprised of Oppenheimer funds.
The active allocation portion of the Fund produced positive performance over the reporting period as its positioning exploited the lagging returns in fixed income funds, the strong returns in equities, and the underperformance by gold. The component continued to maintain little exposure to fixed income funds, as it had small allocations to Oppenheimer Core Bond Fund, Treasury Inflation-Protected Securities (“TIPS”) via Oppenheimer Master Inflation Protected Securities Fund, LLC, and Oppenheimer Limited-Term Government Fund. Certain assets of these underlying funds – government and investment grade bonds – did produce positive returns, but very small in comparison to equities this reporting period.
At the same time, the active allocation maintained a tactical overweight to equities with large allocations towards small cap and large cap value funds, including Oppenheimer Main Street Small- & Mid-Cap Fund and Oppenheimer Value Fund. These underlying funds had a positive impact to the performance of the Fund. The active allocation also decreased its allocation to Oppenheimer Developing Markets Fund during the reporting period. Emerging market
4 OPPENHEIMER PORTFOLIO SERIES ACTIVE ALLOCATION FUND
equities had a difficult year with several issues impacting the performance of the asset class. These issues included the Fed’s tapering of quantitative easing, negative sentiment around the sustainability of China’s growth, and broad growth disappointment throughout emerging market economies. Although the underlying fund produced a negative absolute return in this environment, it outperformed its benchmark, the MSCI Emerging Markets Index.
On the alternative side, the active allocation continued to maintain a position in catastrophe bonds through an investment in Oppenheimer Master Event-Linked Bond Fund, LLC. Catastrophe bonds performed positively and generally outpaced most fixed income asset classes during the period. The active allocation also reduced its exposure to Oppenheimer Gold & Special Minerals Fund. While the underlying fund produced negative absolute returns this reporting period, reducing our allocation softened the negative impact on this portion of the Fund. Gold stocks and gold bullion remained out of favor among investors over the reporting period, mainly due to their preference for companies that are more leveraged to recovering U.S. and other economies. Although Oppenheimer Gold & Special Minerals Fund underperformed its benchmark, the MSCI World Index, it performed in line with other gold and precious metals indices, such as the Philadelphia Gold & Silver Index.
The static allocation of the Fund also produced a positive absolute return this reporting period. The static allocation had its largest allocation to domestic equity funds, with Oppenheimer Value Fund and Oppenheimer Capital Appreciation Fund being its top two holdings at period end. These two underlying funds provided the strongest contribution to the static allocation’s return on an absolute basis this period. Oppenheimer Value Fund and Oppenheimer Capital Appreciation Fund received their best absolute results from securities in the financials sector and health care sector, respectively. However, they underperformed their benchmarks, the S&P 500 Index and the Russell 1000 Value Index (for Oppenheimer Value Fund), and the S&P 500 Index and the Russell 1000 Growth Index (for Oppenheimer Capital Appreciation Fund). The static allocation had a smaller allocation to Oppenheimer Main Street Small- & Mid-Cap Fund, which also performed positively. The underlying fund’s absolute performance was driven by certain stocks within the health care sector. However, on a relative basis, the underlying fund underperformed its benchmark, the Russell 2500 Index.
The static allocation also received positive contributions to return from its investment in foreign equity funds. Its largest foreign equity funds at period end and its strongest contributors to performance in the space were Oppenheimer International Growth
5 OPPENHEIMER PORTFOLIO SERIES ACTIVE ALLOCATION FUND
Fund and Oppenheimer International Value Fund. Oppenheimer International Growth Fund’s performance was driven largely by holdings in the information technology sector. Oppenheimer International Value Fund received its best absolute performance from stocks in the consumer discretionary sector this reporting period. Both of these underlying funds outperformed their benchmarks, the MSCI All Country World ex-U.S. Index and the MSCI EAFE Index.
The static allocation’s exposure to underlying fixed-income funds produced positive absolute results. Oppenheimer Core Bond Fund was the static allocation’s largest fixed-income investment and produced positive absolute results this reporting period. During the reporting period, the underlying fund maintained limited exposure to government bonds and favored corporate bonds, mortgage-backed securities (“MBS”) and structured products. This positioning benefited the underlying fund’s performance during the period, as higher-yielding fixed income sectors outperformed the performance of U.S. Treasuries. The underlying fund outperformed its benchmarks, the Barclays Credit Index, Barclays U.S. Aggregate Bond Index and the Citigroup Broad Investment Grade Bond Index. The static allocation’s next largest underlying fixed-income funds were Oppenheimer Limited-Term Government Fund and Oppenheimer International Bond Fund. Oppenheimer Limited-Term Government Fund
produced a muted return during the reporting period, as U.S. Government bonds lagged higher-yielding fixed-income sectors and equities. An allocation to MBS did benefit the underlying fund this reporting period. Relative to its benchmarks, the underlying fund outperformed the Barclays U.S. Government Bond Index, but underperformed the Barclays U.S. 1-3 Year Government Bond Index. Oppenheimer International Bond Fund produced a negative return this reporting period. As it has for some time, the underlying fund had a large allocation to emerging market debt. Specifically, the underlying fund’s position in emerging market local currency debt hurt its performance when volatility in the emerging markets climbed amid reactions to the potential for reduced levels of global liquidity. Meanwhile, an allocation into European credit was additive to performance. The underlying fund did outperform its Reference Index, which is a customized weighted index comprised of 50% of the Citigroup Non-U.S. Dollar World Government Bond Index, 30% of the JPMorgan Government Bond Index—Emerging Markets Global Diversified, and 20% of the JPMorgan Emerging Markets Bond Index Global Diversified.
The static allocation’s smaller investment in alternative funds had a slight negative effect on performance this reporting period. Oppenheimer Gold & Special Minerals Fund, Oppenheimer Master Inflation Protected Securities Fund, LLC, and Oppenheimer
6 OPPENHEIMER PORTFOLIO SERIES ACTIVE ALLOCATION FUND
Commodity Strategy Total Return Fund produced negative returns this period. Oppenheimer Global Multi Strategies Fund and Oppenheimer Real Estate Fund were
underlying alternative funds that produced positive absolute results for the Fund this reporting period.
|  | |
Mark Hamilton2 Portfolio Manager |

2. Mark Hamilton became a Portfolio Manager in August 2013.
|  | |
Caleb Wong Portfolio Manager |

7 OPPENHEIMER PORTFOLIO SERIES ACTIVE ALLOCATION FUND
ASSET CLASS ALLOCATION
| Domestic Equity Funds | 48.7 | % | ||
| Foreign Equity Funds | 31.0 | |||
| Domestic Fixed Income Funds | 12.0 | |||
| Alternative Funds | 4.9 | |||
| Foreign Fixed Income Fund | 2.8 | |||
| Money Market Fund | 0.6 | |||
| Portfolio holdings and allocations are subject to change. Percentages are as of January 31, 2014, and are based on the total market value of investments. | ||||
TOP TEN HOLDINGS
| Oppenheimer Value Fund, Cl. I | 22.0 | % | ||
Oppenheimer Capital Appreciation Fund, Cl. I | 19.3 | |||
Oppenheimer International Growth Fund, Cl. I | 12.5 | |||
Oppenheimer International Value Fund, Cl. I | 10.8 | |||
Oppenheimer Main Street Small- & Mid-Cap Fund, Cl. I | 7.4 | |||
Oppenheimer Core Bond Fund, Cl. I | 7.0 | |||
Oppenheimer International Small Company Fund, Cl. I | 3.9 | |||
Oppenheimer Developing Markets Fund, Cl. I | 3.8 | |||
Oppenheimer Limited-Term Government Fund, Cl. I | 2.9 | |||
Oppenheimer International Bond Fund, Cl. I | 2.8 | |||
| Portfolio holdings and allocations are subject to change. Percentages are as of January 31, 2014, and are based on net assets. For more current Top 10 Fund holdings, please visit oppenheimerfunds.com. | ||||
8 OPPENHEIMER PORTFOLIO SERIES ACTIVE ALLOCATION FUND
Share Class Performance
AVERAGE ANNUAL TOTAL RETURNS WITHOUT SALES CHARGE AS OF 1/31/14
| Inception Date | 1-Year | 5-Year | Since Inception | |||||||||||
| Class A (OAAAX) | 4/5/05 | 13.73% | 14.51% | 4.14% | ||||||||||
| Class B (OAABX) | 4/5/05 | 12.83% | 13.59% | 3.56% | ||||||||||
| Class C (OAACX) | 4/5/05 | 12.93% | 13.65% | 3.35% | ||||||||||
| Class N (OAANX) | 4/5/05 | 13.42% | 14.29% | 3.93% | ||||||||||
| Class Y (OAAYX) | 4/5/05 | 14.07% | 14.94% | 4.52% | ||||||||||
AVERAGE ANNUAL TOTAL RETURNS WITH SALES CHARGE AS OF 1/31/14
| Inception Date | 1-Year | 5-Year | Since Inception | |||||||||||
| Class A (OAAAX) | 4/5/05 | 7.19% | 13.16% | 3.44% | ||||||||||
| Class B (OAABX) | 4/5/05 | 7.83% | 13.34% | 3.56% | ||||||||||
| Class C (OAACX) | 4/5/05 | 11.93% | 13.65% | 3.35% | ||||||||||
| Class N (OAANX) | 4/5/05 | 12.42% | 14.29% | 3.93% | ||||||||||
| Class Y (OAAYX) | 4/5/05 | 14.07% | 14.94% | 4.52% | ||||||||||
Performance data quoted represents past performance, which does not guarantee future results. The investment return and principal value of an investment in the Fund will fluctuate so that an investor’s shares, when redeemed, may be worth more or less than their original cost. Current performance may be lower or higher than the performance quoted. Returns do not consider capital gains or income taxes on an individual’s investment. For performance data current to the most recent month-end, visit oppenheimerfunds.com or call 1.800.CALL OPP (225.5677). Fund returns include changes in share price, reinvested distributions, and the applicable sales charge: for Class A shares, the current maximum initial sales charge of 5.75%; for Class B shares, the contingent deferred sales charge of 5% (1-year) and 2% (5-year); and for Class C and N shares, the contingent deferred sales charge of 1% for the 1-year period. There is no sales charge for Class Y shares. Because Class B shares convert to Class A shares 72 months after purchase, the 10-year return for Class B shares uses Class A performance for the period after conversion.
The Fund’s performance is compared to the performance of the S&P 500 Index and the Barclays U.S. Aggregate Bond Index. The S&P 500 Index is an unmanaged index of large-capitalization equity securities that is a measure of the general domestic stock market. The Barclays U.S. Aggregate Bond Index is an unmanaged, broad-based index of investment grade corporate debt. The indices are unmanaged and cannot be purchased directly by investors. Index performance includes reinvestment of income, but does not reflect transaction costs, fees, expenses or taxes. Index performance is shown for illustrative purposes only as a benchmark for the Fund’s performance, and does not predict or depict performance of the Fund. The Fund’s performance reflects the effects of the Fund’s business and operating expenses.
The Fund’s investment strategy and focus can change over time. The mention of specific fund holdings does not constitute a recommendation by OppenheimerFunds, Inc. or its affiliates.
9 OPPENHEIMER PORTFOLIO SERIES ACTIVE ALLOCATION FUND
Before investing in any of the Oppenheimer funds, investors should carefully consider a fund’s investment objectives, risks, charges and expenses. Fund prospectuses and summary prospectuses contain this and other information about the funds, and may be obtained by asking your financial advisor, visiting oppenheimerfunds.com, or calling 1.800.CALL OPP (225.5677). Read prospectuses and summary prospectuses carefully before investing.
Shares of Oppenheimer funds are not deposits or obligations of any bank, are not guaranteed by any bank, are not insured by the FDIC or any other agency, and involve investment risks, including the possible loss of the principal amount invested.
10 OPPENHEIMER PORTFOLIO SERIES ACTIVE ALLOCATION FUND
Fund Expenses. As a shareholder of the Fund, you incur two types of costs: (1) transaction costs, which may include sales charges (loads) on purchase payments, contingent deferred sales charges on redemptions; and (2) ongoing costs, including management fees; distribution and service fees; and other Fund expenses. These examples are intended to help you understand your ongoing costs (in dollars) of investing in the Fund and to compare these costs with the ongoing costs of investing in other mutual funds.
The examples are based on an investment of $1,000.00 invested at the beginning of the period and held for the entire 6-month period ended January 31, 2014.
Actual Expenses. The first section of the table provides information about actual account values and actual expenses. You may use the information in this section for the class of shares you hold, together with the amount you invested, to estimate the expense that you paid over the period. Simply divide your account value by $1,000.00 (for example, an $8,600.00 account value divided by $1,000.00 = 8.60), then multiply the result by the number in the first section under the heading entitled “Expenses Paid During Period” to estimate the expenses you paid on your account during this period.
Hypothetical Example for Comparison Purposes. The second section of the table provides information about hypothetical account values and hypothetical expenses based on the Fund’s actual expense ratio for each class of shares, and an assumed rate of return of 5% per year for each class before expenses, which is not the actual return. The hypothetical account values and expenses may not be used to estimate the actual ending account balance or expenses you paid for the period. You may use this information to compare the ongoing costs of investing in the Fund and other funds. To do so, compare this 5% hypothetical example for the class of shares you hold with the 5% hypothetical examples that appear in the shareholder reports of the other funds.
Please note that the expenses shown in the table are meant to highlight your ongoing costs only and do not reflect any transactional costs, such as front-end or contingent deferred sales charges (loads), or a $12.00 fee imposed annually on accounts valued at less than $500.00 (subject to exceptions described in the Statement of Additional Information). Therefore, the “hypothetical” section of the table is useful in comparing ongoing costs only, and will not help you determine the relative total costs of owning different funds. In addition, if these transactional costs were included, your costs would have been higher.
11 OPPENHEIMER PORTFOLIO SERIES ACTIVE ALLOCATION FUND
| Actual | Beginning Account Value August 1, 2013 | Ending Account Value January 31, 2014 | Expenses Paid During 6 Months Ended January 31, 2014 | |||||||||
| Class A | $ | 1,000.00 | $ | 1,059.90 | $ | 2.91 | ||||||
| Class B | 1,000.00 | 1,055.90 | 6.86 | |||||||||
| Class C | 1,000.00 | 1,055.90 | 6.86 | |||||||||
| Class N | 1,000.00 | 1,058.50 | 4.21 | |||||||||
| Class Y | 1,000.00 | 1,061.00 | 1.56 | |||||||||
Hypothetical (5% return before expenses) | ||||||||||||
| Class A | 1,000.00 | 1,022.38 | 2.86 | |||||||||
| Class B | 1,000.00 | 1,018.55 | 6.74 | |||||||||
| Class C | 1,000.00 | 1,018.55 | 6.74 | |||||||||
| Class N | 1,000.00 | 1,021.12 | 4.13 | |||||||||
| Class Y | 1,000.00 | 1,023.69 | 1.53 | |||||||||
Expenses are equal to the Fund’s annualized expense ratio for that class, multiplied by the average account value over the period, multiplied by 184/365 (to reflect the one-half year period). Those annualized expense ratios, excluding indirect expenses from affiliated funds, based on the 6-month period ended January 31, 2014 are as follows:
| Class | Expense Ratios | |||
| Class A | 0.56% | |||
| Class B | 1.32 | |||
| Class C | 1.32 | |||
| Class N | 0.81 | |||
| Class Y | 0.30 | |||
The expense ratios reflect voluntary and/or contractual waivers and/or reimbursements of expenses by the Fund’s Manager and Transfer Agent. Some of these undertakings may be modified or terminated at any time, as indicated in the Fund’s prospectus. The “Financial Highlights” tables in the Fund’s financial statements, included in this report, also show the gross expense ratios, without such waivers or reimbursements and reduction to custodian expenses, if applicable.
12 OPPENHEIMER PORTFOLIO SERIES ACTIVE ALLOCATION FUND
| STATEMENTOF INVESTMENTS January 31, 2014 | ||||
| Shares | Value | |||||||
| Investment Companies—100.0%1 | ||||||||
| Alternative Funds—4.9% | ||||||||
| Oppenheimer Commodity Strategy Total Return Fund, Cl. I2 | 3,425,410 | $ | 10,207,722 | |||||
| Oppenheimer Currency Opportunities Fund, Cl. I2 | 445,112 | 6,044,616 | ||||||
| Oppenheimer Global Multi Strategies Fund, Cl. I2 | 456,414 | 11,953,487 | ||||||
| Oppenheimer Gold & Special Minerals Fund, Cl. I2 | 305,376 | 5,356,300 | ||||||
| Oppenheimer Master Event-Linked Bond Fund, LLC | 1,928,964 | 26,790,946 | ||||||
| Oppenheimer Master Inflation Protected Securities Fund, LLC | 3,714,678 | 42,415,436 | ||||||
| Oppenheimer Real Estate Fund, Cl. I | 508,869 | 12,243,385 | ||||||
| 115,011,892 | ||||||||
| Domestic Equity Funds—48.7% | ||||||||
| Oppenheimer Capital Appreciation Fund, Cl. I | 7,498,202 | 456,715,463 | ||||||
| Oppenheimer Main Street Small- & Mid-Cap Fund, Cl. I | 5,568,892 | 175,364,422 | ||||||
| Oppenheimer Value Fund, Cl. I | 17,952,293 | 520,616,485 | ||||||
| 1,152,696,370 | ||||||||
| Domestic Fixed Income Funds—12.0% | ||||||||
| Oppenheimer Core Bond Fund, Cl. I | 24,311,077 | 165,072,213 | ||||||
| Oppenheimer Limited-Term Government Fund, Cl. I | 7,413,800 | 67,613,855 | ||||||
| Oppenheimer Master Loan Fund, LLC | 3,542,255 | 50,505,173 | ||||||
| 283,191,241 | ||||||||
| Foreign Equity Funds—31.0% | ||||||||
| Oppenheimer Developing Markets Fund, Cl. I | 2,604,302 | 90,186,962 | ||||||
| Oppenheimer International Growth Fund, Cl. I | 8,191,094 | 295,534,668 | ||||||
| Oppenheimer International Small Company Fund, Cl. I | 2,876,973 | 92,034,367 | ||||||
| Oppenheimer International Value Fund, Cl. I | 13,907,048 | 256,724,107 | ||||||
| 734,480,104 | ||||||||
| Foreign Fixed Income Fund—2.8% | ||||||||
| Oppenheimer International Bond Fund, Cl. I | 11,154,152 | 66,813,373 | ||||||
| Money Market Fund—0.6% | ||||||||
| Oppenheimer Institutional Money Market Fund, Cl. E, 0.08%3 | 14,190,166 | 14,190,166 | ||||||
| Total Investments, at Value (Cost $1,688,473,494) | 100.0% | 2,366,383,146 | ||||||
| Assets in Excess of Other Liabilities | 0.0 | 884,199 | ||||||
| Net Assets | 100.0% | $ | 2,367,267,345 | |||||
13 OPPENHEIMER PORTFOLIO SERIES ACTIVE ALLOCATION FUND
| STATEMENTOF INVESTMENTS Continued | ||||
Footnotes to Statement of Investments
1. Is or was an affiliate, as defined in the Investment Company Act of 1940, at or during the period ended January 31, 2014, by virtue of the Fund owning at least 5% of the voting securities of the issuer or as a result of the Fund and the issuer having the same investment adviser. Transactions during the period in which the issuer was an affiliate are as follows:
| Shares | Gross | Gross | Shares | |||||||||||||
| January 31, 2013 | Additions | Reductions | January 31, 2014 | |||||||||||||
Oppenheimer Capital Appreciation Fund, Cl. I | — | 7,826,541 | a | 328,339 | 7,498,202 | |||||||||||
Oppenheimer Capital Appreciation Fund, Cl. Y | 7,450,084 | 250,379 | 7,700,463 | a | — | |||||||||||
Oppenheimer Commodity Strategy Total Return Fund, Cl. I | — | 3,997,038 | a | 571,628 | 3,425,410 | |||||||||||
Oppenheimer Commodity Strategy Total Return Fund, Cl. Y | 3,738,891 | 193,302 | 3,932,193 | a | — | |||||||||||
Oppenheimer Core Bond Fund, Cl. I | — | 26,278,077 | a | 1,967,000 | 24,311,077 | |||||||||||
Oppenheimer Core Bond Fund, Cl. Y | 24,190,664 | 488,739 | 24,679,403 | a | — | |||||||||||
Oppenheimer Currency Opportunities Fund, Cl. I | — | 467,743 | a | 22,631 | 445,112 | |||||||||||
Oppenheimer Currency Opportunities Fund, Cl. Y | 476,056 | 1,058 | 477,114 | a | — | |||||||||||
Oppenheimer Developing Markets Fund, Cl. I | — | 3,151,712 | a | 547,410 | 2,604,302 | |||||||||||
Oppenheimer Developing Markets Fund, Cl. Y | 3,339,277 | 92,001 | 3,431,278 | a | — | |||||||||||
Oppenheimer Global Multi Strategies Fund, Cl. I | — | 478,430 | a | 22,016 | 456,414 | |||||||||||
Oppenheimer Global Multi Strategies Fund, Cl. Y | 473,899 | 6,394 | 480,293 | a | — | |||||||||||
Oppenheimer Gold & Special Minerals Fund, Cl. I | — | 323,918 | a | 18,542 | 305,376 | |||||||||||
Oppenheimer Gold & Special Minerals Fund, Cl. Y | 352,799 | 22,848 | 375,647 | a | — | |||||||||||
Oppenheimer Institutional Money Market Fund, Cl. E | 18,021,906 | 62,599,080 | 66,430,820 | 14,190,166 | ||||||||||||
Oppenheimer International Bond Fund, Cl. I | — | 13,713,371 | a | 2,559,219 | 11,154,152 | |||||||||||
Oppenheimer International Bond Fund, Cl. Y | 13,347,143 | 467,279 | 13,814,422 | a | — | |||||||||||
Oppenheimer International Growth Fund, Cl. I | — | 8,965,967 | a | 774,873 | 8,191,094 | |||||||||||
Oppenheimer International Growth Fund, Cl. Y | 8,705,717 | 210,057 | 8,915,774 | a | — | |||||||||||
Oppenheimer International Small Company Fund, Cl. I | — | 3,099,826 | a | 222,853 | 2,876,973 | |||||||||||
Oppenheimer International Small Company Fund, Cl. Y | 3,156,506 | 24,130 | 3,180,636 | a | — | |||||||||||
Oppenheimer International Value Fund, Cl. I | — | 14,632,297 | a | 725,249 | 13,907,048 | |||||||||||
14 OPPENHEIMER PORTFOLIO SERIES ACTIVE ALLOCATION FUND
Footnotes to Statement of Investments Continued
| Shares | Gross | Gross | Shares | |||||||||||||
| January 31, 2013 | Additions | Reductions | January 31, 2014 | |||||||||||||
Oppenheimer International Value Fund, Cl. Y | 13,613,221 | 569,663 | 14,182,884 | a | — | |||||||||||
Oppenheimer Limited-Term Government Fund, Cl. I | — | 7,690,147 | a | 276,347 | 7,413,800 | |||||||||||
Oppenheimer Limited-Term Government Fund, Cl. Y | 7,257,341 | 64,242 | 7,321,583 | a | — | |||||||||||
Oppenheimer Main Street Small- & Mid-Cap Fund, Cl. I | — | 5,968,915 | a | 400,023 | 5,568,892 | |||||||||||
Oppenheimer Main Street Small- & Mid-Cap Fund, Cl. Y | 5,920,571 | 138,052 | 6,058,623 | a | — | |||||||||||
Oppenheimer Master Event- Linked Bond Fund, LLC | 1,893,304 | 360,530 | 324,870 | 1,928,964 | ||||||||||||
Oppenheimer Master Inflation Protected Securities Fund, LLC | 2,774,316 | 1,388,247 | 447,885 | 3,714,678 | ||||||||||||
Oppenheimer Master Loan Fund, LLC | 2,144,879 | 1,550,093 | 152,717 | 3,542,255 | ||||||||||||
Oppenheimer Real Estate Fund, Cl. I | — | 603,435 | a | 94,566 | 508,869 | |||||||||||
Oppenheimer Real Estate Fund, Cl. Y | 581,971 | 6,771 | 588,742 | a | — | |||||||||||
Oppenheimer Value Fund, Cl. I | — | 19,298,949 | a | 1,346,656 | 17,952,293 | |||||||||||
Oppenheimer Value Fund, Cl. Y | 19,269,244 | 270,647 | 19,539,891 | a | — | |||||||||||
| Value | Income | Realized Gain (Loss) | ||||||||||||||
| Oppenheimer Capital Appreciation Fund, Cl. I | $ | 456,715,463 | $ | 2,075,810 | $ | 1,217,798 | ||||||||||
| Oppenheimer Capital Appreciation Fund, Cl. Y | — | — | 603,475 | |||||||||||||
| Oppenheimer Commodity Strategy Total Return Fund, Cl. I | 10,207,722 | — | (18,680 | ) | ||||||||||||
| Oppenheimer Commodity Strategy Total Return Fund, Cl. Y | — | — | 6,106 | |||||||||||||
| Oppenheimer Core Bond Fund, Cl. I | 165,072,213 | 4,860,674 | (1,601,204 | ) | ||||||||||||
| Oppenheimer Core Bond Fund, Cl. Y | — | 2,032,150 | (534,859 | ) | ||||||||||||
| Oppenheimer Currency Opportunities Fund, Cl. I | 6,044,616 | — | (13,547 | ) | ||||||||||||
| Oppenheimer Currency Opportunities Fund, Cl. Y | — | — | (1,878 | ) | ||||||||||||
| Oppenheimer Developing Markets Fund, Cl. I | 90,186,962 | 617,989 | 1,824,650 | |||||||||||||
| Oppenheimer Developing Markets Fund, Cl. Y | — | — | 89,696 | |||||||||||||
| Oppenheimer Global Multi Strategies Fund, Cl. I | 11,953,487 | — | (3,757 | ) | ||||||||||||
| Oppenheimer Global Multi Strategies Fund, Cl. Y | — | — | 4,664 | |||||||||||||
| Oppenheimer Gold & Special Minerals Fund, Cl. I | 5,356,300 | — | (451,652 | ) | ||||||||||||
| Oppenheimer Gold & Special Minerals Fund, Cl. Y | — | — | (1,134,045 | ) | ||||||||||||
| Oppenheimer Institutional Money Market Fund, Cl. E | 14,190,166 | 15,846 | — | |||||||||||||
| Oppenheimer International Bond Fund, Cl. I | 66,813,373 | 1,444,715 | (580,529 | ) | ||||||||||||
| Oppenheimer International Bond Fund, Cl. Y | — | 477,003 | 157,441 | |||||||||||||
| Oppenheimer International Growth Fund, Cl. I | 295,534,668 | 3,445,252 | 6,415,461 | |||||||||||||
| Oppenheimer International Growth Fund, Cl. Y | — | — | 1,354,567 | |||||||||||||
15 OPPENHEIMER PORTFOLIO SERIES ACTIVE ALLOCATION FUND
| STATEMENT OF INVESTMENTS Continued | ||||
Footnotes to Statement of Investments Continued
| Value | Income | Realized Gain (Loss) | ||||||||||||
Oppenheimer International Small Company Fund, Cl. I | $ | 92,034,367 | $ | 977,402 | $ | 1,396,601 | ||||||||
Oppenheimer International Small Company Fund, Cl. Y | — | — | 222,147 | |||||||||||
| Oppenheimer International Value Fund, Cl. I | 256,724,107 | 5,750,540 | 1,084,746 | |||||||||||
| Oppenheimer International Value Fund, Cl. Y | — | — | 302,485 | |||||||||||
| Oppenheimer Limited-Term Government Fund, Cl. I | 67,613,855 | 1,060,383 | (61,291) | |||||||||||
| Oppenheimer Limited-Term Government Fund, Cl. Y | — | 497,786 | (25,268) | |||||||||||
Oppenheimer Main Street Small- & Mid-Cap Fund, Cl. I | 175,364,422 | 890,850 | 2,283,239 | |||||||||||
Oppenheimer Main Street Small- & Mid-Cap Fund, Cl. Y | — | — | 418,014 | |||||||||||
| Oppenheimer Master Event-Linked Bond Fund, LLC | 26,790,946 | 2,056,967 b | 106,343 b | |||||||||||
Oppenheimer Master Inflation Protected Securities Fund, LLC | 42,415,436 | 480,210 c | 278,225 c | |||||||||||
| Oppenheimer Master Loan Fund, LLC | 50,505,173 | 2,003,667 d | 325,459 d | |||||||||||
| Oppenheimer Real Estate Fund, Cl. I | 12,243,385 | 211,901 | 606,228 | |||||||||||
| Oppenheimer Real Estate Fund, Cl. Y | — | 38,444 | 189,351 | |||||||||||
| Oppenheimer Value Fund, Cl. I | 520,616,485 | 8,680,431 | 4,598,314 | |||||||||||
| Oppenheimer Value Fund, Cl. Y | — | — | 1,014,014 | |||||||||||
| Total | $ | 2,366,383,146 | $ | 37,618,020 | $ | 20,072,314 | ||||||||
| a. | The Fund elected to invest in Class I Shares of the Underlying Funds as they became available to investors. |
| b. | Represents the amount allocated to the Fund from Oppenheimer Master Event-Linked Bond Fund, LLC. |
| c. | Represents the amount allocated to the Fund from Oppenheimer Master Inflation Protected Securities Fund, LLC. |
| d. | Represents the amount allocated to the Fund from Oppenheimer Master Loan Fund, LLC. |
| 2. | Non-income producing security. |
| 3. | Rate shown is the 7-day yield as of January 31, 2014. |
See accompanying Notes to Financial Statements.
16 OPPENHEIMER PORTFOLIO SERIES ACTIVE ALLOCATION FUND
STATEMENTOF ASSETS AND LIABILITIES January 31, 2014 | ||||
| Assets | ||||
| Investments, at value—see accompanying statement of investments—affiliated companies | ||||
| (cost $1,688,473,494) | $ | 2,366,383,146 | ||
| Cash | 4,373,936 | |||
| Receivables and other assets: | ||||
| Dividends | 906,297 | |||
| Shares of beneficial interest sold | 662,753 | |||
| Investments sold | 327,067 | |||
| Other | 161,422 | |||
| Total assets | 2,372,814,621 | |||
| Liabilities | ||||
| Payables and other liabilities: | ||||
| Shares of beneficial interest redeemed | 3,317,744 | |||
| Investments purchased | 906,594 | |||
| Distribution and service plan fees | 546,380 | |||
| Transfer and shareholder servicing agent fees | 468,252 | |||
| Trustees’ compensation | 247,953 | |||
| Shareholder communications | 33,061 | |||
| Other | 27,292 | |||
| Total liabilities | 5,547,276 | |||
| Net Assets | $ | 2,367,267,345 | ||
| Composition of Net Assets | ||||
| Par value of shares of beneficial interest | $ | 206,844 | ||
| Additional paid-in capital | 2,470,252,145 | |||
| Accumulated net investment income | 19,723,256 | |||
| Accumulated net realized loss on investments | (800,824,552 | ) | ||
| Net unrealized appreciation on investments | 677,909,652 | |||
| Net Assets | $ | 2,367,267,345 |
ASSETS AND LIABILITIES January 31, 2014
17 OPPENHEIMER PORTFOLIO SERIES ACTIVE ALLOCATION FUND
STATEMENTOF ASSETS AND LIABILITIES Continued | ||||
| Net Asset Value Per Share | ||||
| Class A Shares: | ||||
| Net asset value and redemption price per share (based on net assets of $1,496,909,131 and 129,972,737 shares of beneficial interest outstanding) | $ | 11.52 | ||
| Maximum offering price per share (net asset value plus sales charge of 5.75% of offering price) | $ | 12.22 | ||
| Class B Shares: | ||||
| Net asset value, redemption price (excludes applicable contingent deferred sales charge) and offering price per share (based on net assets of $197,213,590 and 17,394,840 shares of beneficial interest outstanding) | $ | 11.34 | ||
| Class C Shares: | ||||
| Net asset value, redemption price (excludes applicable contingent deferred sales charge) and offering price per share (based on net assets of $535,716,309 and 47,489,692 shares of beneficial interest outstanding) | $ | 11.28 | ||
| Class N Shares: | ||||
| Net asset value, redemption price (excludes applicable contingent deferred sales charge) and offering price per share (based on net assets of $128,012,067 and 11,178,631 shares of beneficial interest outstanding) | $ | 11.45 | ||
| Class Y Shares: | ||||
| Net asset value, redemption price and offering price per share (based on net assets of $9,416,248 and 808,169 shares of beneficial interest outstanding) | $ | 11.65 | ||
See accompanying Notes to Financial Statements.
18 OPPENHEIMER PORTFOLIO SERIES ACTIVE ALLOCATION FUND
STATEMENTOF OPERATIONS For the Year Ended January 31, 2014 | ||||
| Allocation of Income and Expenses from Master Funds1 | ||||
| Net investment income allocated from Oppenheimer Master Event-Linked Bond Fund, LLC: | ||||
| Interest | $ | 2,056,047 | ||
| Dividends | 920 | |||
| Net Expenses | (109,242) | |||
| Net investment income allocated from Oppenheimer Master Event-Linked Bond Fund, LLC | 1,947,725 | |||
| Net investment income allocated from Oppenheimer Master Inflation Protected Securities Fund, LLC: | ||||
| Interest | 480,131 | |||
| Dividends | 79 | |||
| Net Expenses | (173,186) | |||
| Net investment income allocated from Oppenheimer Master Inflation Protected Securities Fund, LLC | 307,024 | |||
| Net investment income allocated from Oppenheimer Master Loan Fund, LLC: | ||||
| Interest | 1,930,270 | |||
| Dividends | 73,397 | |||
| Net Expenses | (111,482) | |||
| Net investment income allocated from Oppenheimer Master Loan Fund, LLC | 1,892,185 | |||
| Total allocation of net investment income from master funds | 4,146,934 | |||
| Investment Income | ||||
| Dividends—affiliated companies | 33,077,176 | |||
| Interest | 1,351 | |||
| Other income | 45,614 | |||
| Total investment income | 33,124,141 | |||
| Expenses | ||||
| Distribution and service plan fees: | ||||
| Class A | 3,507,819 | |||
| Class B | 2,209,045 | |||
| Class C | 5,192,091 | |||
| Class N | 670,444 | |||
| Transfer and shareholder servicing agent fees: | ||||
| Class A | 2,853,003 | |||
| Class B | 487,298 | |||
| Class C | 1,021,997 | |||
| Class N | 236,750 | |||
| Class Y | 14,404 | |||
| Shareholder communications: | ||||
| Class A | 196,722 | |||
| Class B | 49,661 | |||
| Class C | 57,808 | |||
| Class N | 7,736 | |||
| Class Y | 393 |
1. The Fund invests in certain affiliated mutual funds that expect to be treated as partnerships for tax purposes. See Note 1 of the accompanying Notes.
19 OPPENHEIMER PORTFOLIO SERIES ACTIVE ALLOCATION FUND
| STATEMENTOF OPERATIONS Continued | ||||
| Expenses Continued | ||||
| Asset allocation fees | $ | 2,310,071 | ||
| Trustees’ compensation | 51,178 | |||
| Custodian fees and expenses | 36,558 | |||
| Other | 27,177 | |||
| Total expenses | 18,930,155 | |||
| Less waivers and reimbursements of expenses | (1,113,020 | ) | ||
| Net expenses | 17,817,135 | |||
| Net Investment Income | 19,453,940 | |||
| Realized and Unrealized Gain (Loss) | ||||
| Net realized gain on: | ||||
| Investments from affiliated companies | 19,362,287 | |||
| Distributions received from affiliate companies | 20,339,166 | |||
| Net realized gain allocated from: | ||||
| Oppenheimer Master Event-Linked Bond Fund, LLC | 106,343 | |||
| Oppenheimer Master Inflation Protected Securities Fund, LLC | 278,225 | |||
| Oppenheimer Master Loan Fund, LLC | 325,459 | |||
| Net realized gain | 40,411,480 | |||
| Net change in unrealized appreciation/depreciation on investments | 229,823,155 | |||
| Net change in unrealized appreciation/depreciation allocated from: | ||||
| Oppenheimer Master Event-Linked Bond Fund, LLC | 696,456 | |||
| Oppenheimer Master Inflation Protected Securities Fund, LLC | (2,669,806 | ) | ||
| Oppenheimer Master Loan Fund, LLC | (208,985 | ) | ||
| Net change in unrealized appreciation/depreciation | 227,640,820 | |||
| Net Increase in Net Assets Resulting from Operations | $ | 287,506,240 |
See accompanying Notes to Financial Statements.
20 OPPENHEIMER PORTFOLIO SERIES ACTIVE ALLOCATION FUND
| STATEMENTSOF CHANGES IN NET ASSETS | ||||
| Year Ended | Year Ended | |||||||
| January 31, 2014 | January 31, 2013 | |||||||
| Operations | ||||||||
| Net investment income | $ | 19,453,940 | $ | 24,962,481 | ||||
| Net realized gain | 40,411,480 | 9,262,695 | ||||||
| Net change in unrealized appreciation/depreciation | 227,640,820 | 197,122,465 | ||||||
| Net increase in net assets resulting from operations | 287,506,240 | 231,347,641 | ||||||
| Dividends and/or Distributions to Shareholders | ||||||||
| Dividends from net investment income: | ||||||||
| Class A | (21,135,894 | ) | (18,481,089 | ) | ||||
| Class B | (1,036,414 | ) | (1,382,783 | ) | ||||
| Class C | (3,940,923 | ) | (3,889,448 | ) | ||||
| Class N | (1,518,140 | ) | (1,737,810 | ) | ||||
| Class Y | (154,574 | ) | (128,807 | ) | ||||
| (27,785,945 | ) | (25,619,937 | ) | |||||
| Beneficial Interest Transactions | ||||||||
| Net increase (decrease) in net assets resulting from beneficial interest transactions: | ||||||||
| Class A | 28,898,164 | 91,103,432 | ||||||
| Class B | (78,631,046 | ) | (62,712,194 | ) | ||||
| Class C | (15,121,265 | ) | 14,311,392 | |||||
| Class N | (25,349,890 | ) | 2,960,836 | |||||
| Class Y | 666,695 | (5,050,129 | ) | |||||
| (89,537,342 | ) | 40,613,337 | ||||||
| Net Assets | ||||||||
| Total increase | 170,182,953 | 246,341,041 | ||||||
| Beginning of period | 2,197,084,392 | 1,950,743,351 | ||||||
| End of period (including accumulated net investment income of | ||||||||
| $19,723,256 and $27,914,077, respectively) | $ | 2,367,267,345 | $ | 2,197,084,392 | ||||
See accompanying Notes to Financial Statements.
21 OPPENHEIMER PORTFOLIO SERIES ACTIVE ALLOCATION FUND
| FINANCIAL HIGHLIGHTS | ||||
| Class A | Year Ended January 31, 2014 | Year Ended January 31, 2013 | Year Ended January 31, 2012 | Year Ended January 31, 2011 | Year Ended January 31, 2010 | |||||||||||||||
| Per Share Operating Data | ||||||||||||||||||||
| Net asset value, beginning of period | $ | 10.27 | $ | 9.25 | $ | 9.66 | $ | 8.19 | $ | 6.28 | ||||||||||
| Income (loss) from investment operations: | ||||||||||||||||||||
| Net investment income1 | 0.13 | 0.15 | 0.16 | 0.15 | 0.04 | |||||||||||||||
| Net realized and unrealized gain (loss) | 1.28 | 1.02 | (0.36) | 1.41 | 1.96 | |||||||||||||||
| Total from investment operations | 1.41 | 1.17 | (0.20) | 1.56 | 2.00 | |||||||||||||||
| Dividends and/or distributions to shareholders: | ||||||||||||||||||||
| Dividends from net investment income | (0.16) | (0.15) | (0.21) | (0.09) | (0.09) | |||||||||||||||
| Net asset value, end of period | $ | 11.52 | $ | 10.27 | $ | 9.25 | $ | 9.66 | $ | 8.19 | ||||||||||
| Total Return, at Net Asset Value2 | 13.73% | 12.67% | (2.02)% | 19.01% | 31.77% | |||||||||||||||
| Ratios/Supplemental Data | ||||||||||||||||||||
| Net assets, end of period (in thousands) | $ | 1,496,909 | $ | 1,308,798 | $ | 1,097,812 | $ | 1,201,751 | $ | 1,070,411 | ||||||||||
| Average net assets (in thousands) | $ | 1,416,982 | $ | 1,153,465 | $ | 1,147,826 | $ | 1,124,399 | $ | 983,645 | ||||||||||
| Ratios to average net assets:3 | ||||||||||||||||||||
| Net investment income | 1.14% | 4 | 1.56% | 4 | 1.63% | 4 | 1.70% | 4 | 0.59% | |||||||||||
| Total expenses5 | 0.59% | 4 | 0.56% | 4 | 0.55% | 4 | 0.57% | 4 | 0.61% | |||||||||||
| Expenses after payments, waivers and/or reimbursements and reduction to custodian expenses | 0.54% | 4 | 0.52% | 4 | 0.55% | 4 | 0.57% | 4 | 0.60% | |||||||||||
| Portfolio turnover rate | 9% | 28%6 | 21% | 6 | 54% | 31% | ||||||||||||||
1. Per share amounts calculated based on the average shares outstanding during the period.
2. Assumes an initial investment on the business day before the first day of the fiscal period, with all dividends and distributions reinvested in additional shares on the reinvestment date, and redemption at the net asset value calculated on the last business day of the fiscal period. Sales charges are not reflected in the total returns. Total returns are not annualized for periods less than one full year. Returns do not reflect the deduction of taxes that a shareholder would pay on fund distributions or the redemption of fund shares.
3. Annualized for periods less than one full year.
4. Includes the Fund’s share of the allocated expenses and/or net investment income from the Master Funds.
5. Total expenses including indirect expenses from affiliated fund were as follows:
| Year Ended January 31, 2014 | 1.26 | % | ||
| Year Ended January 31, 2013 | 1.24 | % | ||
| Year Ended January 31, 2012 | 1.25 | % | ||
| Year Ended January 31, 2011 | 1.27 | % | ||
| Year Ended January 31, 2010 | 1.30 | % |
6. The portfolio turnover rate excludes purchase and sale transactions of To Be Announced (TBA) mortgage-related securities as follows:
| Purchase Transactions | Sale Transactions | |||||||||
| Year Ended January 31, 2013 | $113,842,157 | $114,874,878 | ||||||||
| Year Ended January 31, 2012 | $38,216,147 | $38,258,011 | ||||||||
See accompanying Notes to Financial Statements.
22 OPPENHEIMER PORTFOLIO SERIES ACTIVE ALLOCATION FUND
| Class B | Year Ended January 31, 2014 | Year Ended January 31, 2013 | Year Ended January 31, 2012 | Year Ended January 31, 2011 | Year Ended January 31, 2010 | |||||||||||||||
| Per Share Operating Data | ||||||||||||||||||||
| Net asset value, beginning of period | $ | 10 .10 | $ | 9 .09 | $ | 9 .49 | $ | 8 .05 | $ | 6 .17 | ||||||||||
| Income (loss) from investment operations: | ||||||||||||||||||||
| Net investment income (loss)1 | 0 .01 | 0 .06 | 0 .07 | 0 .07 | (0 .01 | ) | ||||||||||||||
| Net realized and unrealized gain (loss) | 1 .29 | 1 .00 | (0 .35 | ) | 1 .38 | 1 .91 | ||||||||||||||
| Total from investment operations | 1 .30 | 1 .06 | (0 .28 | ) | 1 .45 | 1 .90 | ||||||||||||||
| Dividends and/or distributions to shareholders: | ||||||||||||||||||||
| Dividends from net investment income | (0 .06 | ) | (0 .05 | ) | (0 .12 | ) | (0 .01 | ) | (0 .02 | ) | ||||||||||
| Net asset value, end of period | $ | 11 .34 | $ | 10 .10 | $ | 9 .09 | $ | 9 .49 | $ | 8 .05 | ||||||||||
| Total Return, at Net Asset Value2 | 12 .83 | % | 11 .73 | % | (2 .90 | )% | 18 .03 | % | 30 .85 | % | ||||||||||
| Ratios/Supplemental Data | ||||||||||||||||||||
| Net assets, end of period (in thousands) | $ | 197,214 | $ | 249,959 | $ | 286,036 | $ | 343,069 | $ | 312,190 | ||||||||||
| Average net assets (in thousands) | $ | 220,028 | $ | 259,073 | $ | 315,211 | $ | 322,814 | $ | 291,118 | ||||||||||
| Ratios to average net assets:3 | ||||||||||||||||||||
| Net investment income (loss) | 0 .14% | 4 | 0 .61%4 | 0 .74% | 4 | 0 .84% | 4 | (0 .18)% | ||||||||||||
| Total expenses5 | 1 .37% | 4 | 1 .40%4 | 1 .40% | 4 | 1 .43% | 4 | 1 .49% | ||||||||||||
| Expenses after payments, waivers and/or reimbursements and reduction to custodian expenses | 1 .32% | 4 | 1 .36%4 | 1 .40% | 4 | 1 .43% | 4 | 1 .48% | ||||||||||||
| Portfolio turnover rate | 9% | 28%6 | 21% | 6 | 54% | 31% | ||||||||||||||
1. Per share amounts calculated based on the average shares outstanding during the period.
2. Assumes an initial investment on the business day before the first day of the fiscal period, with all dividends and distributions reinvested in additional shares on the reinvestment date, and redemption at the net asset value calculated on the last business day of the fiscal period. Sales charges are not reflected in the total returns. Total returns are not annualized for periods less than one full year. Returns do not reflect the deduction of taxes that a shareholder would pay on fund distributions or the redemption of fund shares.
3. Annualized for periods less than one full year.
4. Includes the Fund’s share of the allocated expenses and/or net investment income from the Master Funds.
5. Total expenses including indirect expenses from affiliated fund were as follows:
| Year Ended January 31, 2014 | 2.04 | % | ||
| Year Ended January 31, 2013 | 2.08 | % | ||
| Year Ended January 31, 2012 | 2.10 | % | ||
| Year Ended January 31, 2011 | 2.13 | % | ||
| Year Ended January 31, 2010 | 2.18 | % |
6. The portfolio turnover rate excludes purchase and sale transactions of To Be Announced (TBA) mortgage-related securities as follows:
| Purchase Transactions | Sale Transactions | |||||||||
| Year Ended January 31, 2013 | $113,842,157 | $114,874,878 | ||||||||
| Year Ended January 31, 2012 | $38,216,147 | $38,258,011 | ||||||||
See accompanying Notes to Financial Statements.
23 OPPENHEIMER PORTFOLIO SERIES ACTIVE ALLOCATION FUND
| FINANCIAL HIGHLIGHTS Continued | ||||
| Class C | Year Ended January 31, 2014 | Year Ended January 31, 2013 | Year Ended January 31, 2012 | Year Ended January 31, 2011 | Year Ended January 31, 2010 | |||||||||||||||
| Per Share Operating Data | ||||||||||||||||||||
| Net asset value, beginning of period | $ | 10.06 | $ | 9.08 | $ | 9.48 | $ | 8.04 | $ | 6.17 | ||||||||||
| Income (loss) from investment operations: | ||||||||||||||||||||
| Net investment income (loss)1 | 0.04 | 0.08 | 0.08 | 0.08 | (0.01) | |||||||||||||||
| Net realized and unrealized gain (loss) | 1.26 | 0.98 | (0.35) | 1.38 | 1.91 | |||||||||||||||
| Total from investment operations | 1.30 | 1.06 | (0.27) | 1.46 | 1.90 | |||||||||||||||
| Dividends and/or distributions to shareholders: | ||||||||||||||||||||
| Dividends from net investment income | (0.08) | (0.08) | (0.13) | (0.02) | (0.03) | |||||||||||||||
| Net asset value, end of period | $ | 11.28 | $ | 10.06 | $ | 9 .08 | $ | 9 .48 | $ | 8 .04 | ||||||||||
| Total Return, at Net Asset Value2 | 12.93% | 11.70% | (2.76)% | 18.17% | 30.80% | |||||||||||||||
| Ratios/Supplemental Data | ||||||||||||||||||||
| Net assets, end of period (in thousands) | $ | 535,716 | $ | 492,455 | $ | 432,564 | $ | 492,493 | $ | 442,036 | ||||||||||
| Average net assets (in thousands) | $ | 518,457 | $ | 445,399 | $ | 463,116 | $ | 461,832 | $ | 413,626 | ||||||||||
| Ratios to average net assets:3 | ||||||||||||||||||||
| Net investment income (loss) | 0.35% | 4 | 0.79% | 4 | 0.86% | 4 | 0.94% | 4 | (0.07)% | |||||||||||
| Total expenses5 | 1.33% | 4 | 1.30% | 4 | 1.30% | 4 | 1.32% | 4 | 1.38% | |||||||||||
| Expenses after payments, waivers and/or reimbursements and reduction to custodian expenses | 1.28% | 4 | 1.26% | 4 | 1.30% | 4 | 1.32% | 4 | 1.37% | |||||||||||
| Portfolio turnover rate | 9% | 28% | 6 | 21% | 6 | 54% | 31% | |||||||||||||
1. Per share amounts calculated based on the average shares outstanding during the period.
2. Assumes an initial investment on the business day before the first day of the fiscal period, with all dividends and distributions reinvested in additional shares on the reinvestment date, and redemption at the net asset value calculated on the last business day of the fiscal period. Sales charges are not reflected in the total returns. Total returns are not annualized for periods less than one full year. Returns do not reflect the deduction of taxes that a shareholder would pay on fund distributions or the redemption of fund shares.
3. Annualized for periods less than one full year.
4. Includes the Fund’s share of the allocated expenses and/or net investment income from the Master Funds.
5. Total expenses including indirect expenses from affiliated fund were as follows:
| Year Ended January 31, 2014 | 2.00 | % | ||
| Year Ended January 31, 2013 | 1.98 | % | ||
| Year Ended January 31, 2012 | 2.00 | % | ||
| Year Ended January 31, 2011 | 2.02 | % | ||
| Year Ended January 31, 2010 | 2.07 | % |
6. The portfolio turnover rate excludes purchase and sale transactions of To Be Announced (TBA) mortgage-related securities as follows:
| Purchase Transactions | Sale Transactions | |||||||||
| Year Ended January 31, 2013 | $113,842,157 | $114,874,878 | ||||||||
| Year Ended January 31, 2012 | $38,216,147 | $38,258,011 | ||||||||
See accompanying Notes to Financial Statements.
24 OPPENHEIMER PORTFOLIO SERIES ACTIVE ALLOCATION FUND
| Class N | Year Ended January 31, 2014 | Year Ended January 31, 2013 | Year Ended January 31, 2012 | Year Ended January 31, 2011 | Year Ended January 31, 2010 | |||||||||||||||
| Per Share Operating Data | ||||||||||||||||||||
| Net asset value, beginning of period | $ | 10.21 | $ | 9.20 | $ | 9 .61 | $ | 8.14 | $ | 6.24 | ||||||||||
| Income (loss) from investment operations: | ||||||||||||||||||||
| Net investment income1 | 0.09 | 0.13 | 0.13 | 0.13 | 0.02 | |||||||||||||||
| Net realized and unrealized gain (loss) | 1.28 | 1.01 | (0.36) | 1.41 | 1.96 | |||||||||||||||
| Total from investment operations | 1.37 | 1.14 | (0.23 | ) | 1.54 | 1.98 | ||||||||||||||
| Dividends and/or distributions to shareholders: | ||||||||||||||||||||
| Dividends from net investment income | (0.13 | ) | (0.13 | ) | (0.18 | ) | (0.07 | ) | (0.08 | ) | ||||||||||
| Net asset value, end of period | $ | 11.45 | $ | 10.21 | $ | 9.20 | $ | 9.61 | $ | 8.14 | ||||||||||
| Total Return, at Net Asset Value2 | 13.42 | % | 12.42 | % | (2.27 | )% | 18.92 | % | 31.62 | % | ||||||||||
| Ratios/Supplemental Data | ||||||||||||||||||||
| Net assets, end of period (in thousands) | $ | 128,012 | $ | 138,042 | $ | 122,589 | $ | 148,609 | $ | 134,276 | ||||||||||
| Average net assets (in thousands) | $ | 133,527 | $ | 122,558 | $ | 136,771 | $ | 141,119 | $ | 123,718 | ||||||||||
| Ratios to average net assets:3 | ||||||||||||||||||||
| Net investment income | 0.78% | 4 | 1.37% | 4 | 1.39% | 4 | 1.51% | 4 | 0.27% | |||||||||||
| Total expenses5 | 0.81% | 4 | 0.77% | 4 | 0.75% | 4 | 0.76% | 4 | 0.79% | |||||||||||
| Expenses after payments, waivers and/or reimbursements and reduction to custodian expenses | 0.76% | 4 | 0.73% | 4 | 0.75% | 4 | 0.76% | 4 | 0.78% | |||||||||||
| Portfolio turnover rate | 9% | 28% | 6 | 21% | 6 | 54% | 31% | |||||||||||||
1. Per share amounts calculated based on the average shares outstanding during the period.
2. Assumes an initial investment on the business day before the first day of the fiscal period, with all dividends and distributions reinvested in additional shares on the reinvestment date, and redemption at the net asset value calculated on the last business day of the fiscal period. Sales charges are not reflected in the total returns. Total returns are not annualized for periods less than one full year. Returns do not reflect the deduction of taxes that a shareholder would pay on fund distributions or the redemption of fund shares.
3. Annualized for periods less than one full year.
4. Includes the Fund’s share of the allocated expenses and/or net investment income from the Master Funds.
5. Total expenses including indirect expenses from affiliated fund were as follows:
| Year Ended January 31, 2014 | 1.48 | % | ||
| Year Ended January 31, 2013 | 1.45 | % | ||
| Year Ended January 31, 2012 | 1.45 | % | ||
| Year Ended January 31, 2011 | 1.46 | % | ||
| Year Ended January 31, 2010 | 1.48 | % |
6. The portfolio turnover rate excludes purchase and sale transactions of To Be Announced (TBA) mortgage-related securities as follows:
| Purchase Transactions | Sale Transactions | |||||||||
| Year Ended January 31, 2013 | $113,842,157 | $114,874,878 | ||||||||
| Year Ended January 31, 2012 | $38,216,147 | $38,258,011 | ||||||||
See accompanying Notes to Financial Statements.
25 OPPENHEIMER PORTFOLIO SERIES ACTIVE ALLOCATION FUND
| FINANCIAL HIGHLIGHTS Continued | ||||
| Class Y | Year Ended January 31, 2014 | Year Ended January 31, 2013 | Year Ended January 31, 2012 | Year Ended January 31, 2011 | Year Ended January 31, 2010 | |||||||||||||||
| Per Share Operating Data | ||||||||||||||||||||
| Net asset value, beginning of period | $ | 10 .38 | $ | 9 .35 | $ | 9 .76 | $ | 8 .27 | $ | 6 .33 | ||||||||||
| Income (loss) from investment operations: | ||||||||||||||||||||
| Net investment income1 | 0 .17 | 0 .16 | 0 .19 | 0 .20 | 0 .06 | |||||||||||||||
| Net realized and unrealized gain (loss) | 1 .30 | 1 .04 | (0 .36 | ) | 1 .41 | 2 .00 | ||||||||||||||
| Total from investment operations | 1 .47 | 1 .20 | (0 .17 | ) | 1 .61 | 2 .06 | ||||||||||||||
| Dividends and/or distributions to shareholders: | ||||||||||||||||||||
| Dividends from net investment income | (0 .20 | ) | (0 .17 | ) | (0 .24 | ) | (0 .12 | ) | (0 .12 | ) | ||||||||||
| Net asset value, end of period | $ | 11.65 | $ | 10.38 | $ | 9.35 | $ | 9.76 | $ | 8.27 | ||||||||||
| Total Return, at Net Asset Value2 | 14.07% | 12.92% | (1.63)% | 19.51% | 32.47% | |||||||||||||||
| Ratios/Supplemental Data | ||||||||||||||||||||
| Net assets, end of period (in thousands) | $ | 9,416 | $ | 7,830 | $ | 11,742 | $ | 12,123 | $ | 3,555 | ||||||||||
| Average net assets (in thousands) | $ | 8,437 | $ | 11,661 | $ | 12,392 | $ | 8,568 | $ | 3,138 | ||||||||||
| Ratios to average net assets:3 | ||||||||||||||||||||
| Net investment income | 1.48% | 4 | 1.69% | 4 | 2.02% | 4 | 2.26% | 4 | 0.77% | |||||||||||
| Total expenses5 | 0.30% | 4 | 0.21% | 4 | 0.20% | 4 | 0.20% | 4 | 0.19% | |||||||||||
| Expenses after payments, waivers and/or reimbursements and reduction to custodian expenses | 0.25% | 4 | 0.17% | 4 | 0.20% | 4 | 0.20% | 4 | 0.18% | |||||||||||
| Portfolio turnover rate | 9% | 28% | 6 | 21% | 6 | 54% | 31% | |||||||||||||
1. Per share amounts calculated based on the average shares outstanding during the period.
2. Assumes an initial investment on the business day before the first day of the fiscal period, with all dividends and distributions reinvested in additional shares on the reinvestment date, and redemption at the net asset value calculated on the last business day of the fiscal period. Sales charges are not reflected in the total returns. Total returns are not annualized for periods less than one full year. Returns do not reflect the deduction of taxes that a shareholder would pay on fund distributions or the redemption of fund shares.
3. Annualized for periods less than one full year.
4. Includes the Fund’s share of the allocated expenses and/or net investment income from the Master Funds.
5. Total expenses including indirect expenses from affiliated fund were as follows:
| Year Ended January 31, 2014 | 0.97 | % | ||
| Year Ended January 31, 2013 | 0.89 | % | ||
| Year Ended January 31, 2012 | 0.90 | % | ||
| Year Ended January 31, 2011 | 0.90 | % | ||
| Year Ended January 31, 2010 | 0.88 | % |
6. The portfolio turnover rate excludes purchase and sale transactions of To Be Announced (TBA) mortgage-related securities as follows:
| Purchase Transactions | Sale Transactions | |||||||||
| Year Ended January 31, 2013 | $113,842,157 | $114,874,878 | ||||||||
| Year Ended January 31, 2012 | $38,216,147 | $38,258,011 | ||||||||
See accompanying Notes to Financial Statements.
26 OPPENHEIMER PORTFOLIO SERIES ACTIVE ALLOCATION FUND
| NOTES TO FINANCIAL STATEMENTS January 31, 2014 | ||||
1. Significant Accounting Policies
Oppenheimer Portfolio Series (the “Trust”) is registered under the Investment Company Act of 1940, as amended, as a diversified open-end management investment company. Active Allocation Fund (the “Fund”) is a series of the Trust whose investment objective is to seek long-term growth of capital with a secondary objective of current income. The Fund normally invests in a diversified portfolio of Oppenheimer mutual funds (individually, an “Underlying Fund” and collectively, the “Underlying Funds”). The Fund’s investment adviser is OFI Global Asset Management, Inc. (“OFI Global” or the “Manager”), a wholly-owned subsidiary of OppenheimerFunds, Inc. (“OFI” or the “Sub-Adviser”). The Manager has entered into a sub-advisory agreement with OFI.
The Fund offers Class A, Class C, Class N and Class Y shares, and previously offered Class B shares for new purchase through June 29, 2012. Subsequent to that date, no new purchases of Class B shares are permitted, however reinvestment of dividend and/or capital gain distributions and exchanges of Class B shares into and from other Oppenheimer funds will be allowed. Class A shares are sold at their offering price, which is normally net asset value plus a front-end sales charge. Class C and Class N shares are sold, and Class B shares were sold, without a front-end sales charge but may be subject to a contingent deferred sales charge (“CDSC”). Class N shares are sold only through retirement plans. Retirement plans that offer Class N shares may impose charges on those accounts. Class Y shares are sold to certain institutional investors or intermediaries without either a front-end sales charge or a CDSC, however, the intermediaries may impose charges on their accountholders who beneficially own Class Y shares. All classes of shares have identical rights and voting privileges with respect to the Fund in general and exclusive voting rights on matters that affect that class alone. Earnings, net assets and net asset value per share may differ due to each class having its own expenses, such as transfer and shareholder servicing agent fees and shareholder communications, directly attributable to that class. Class A, B, C and N shares have separate distribution and/or service plans under which they pay fees. Class Y shares do not pay such fees. Class B shares will automatically convert to Class A shares 72 months after the date of purchase.
The following is a summary of significant accounting policies consistently followed by the Fund.
Risks of Investing in the Underlying Funds. Each of the Underlying Funds in which the Fund invests has its own investment risks, and those risks can affect the value of the Fund’s investments and therefore the value of the Fund’s shares. To the extent that the Fund invests more of its assets in one Underlying Fund than in another, the Fund will have greater exposure to the risks of that Underlying Fund.
Investment in Oppenheimer Institutional Money Market Fund. The Fund is permitted to invest daily available cash balances in an affiliated money market fund. The Fund may invest the available cash in Class E shares of Oppenheimer Institutional Money Market Fund (“IMMF”) to seek current income while preserving liquidity. IMMF is a registered open-end management investment company, regulated as a money market fund under the Investment Company Act of 1940, as amended. The Manager is the investment adviser of IMMF, and the
27 OPPENHEIMER PORTFOLIO SERIES ACTIVE ALLOCATION FUND
| NOTES TO FINANCIAL STATEMENTS | ||||
1. Significant Accounting Policies (Continued)
Sub-Adviser provides investment and related advisory services to IMMF. When applicable, the Fund’s investment in IMMF is included in the Statement of Investments. Shares of IMMF are valued at their net asset value per share. As a shareholder, the Fund is subject to its proportional share of IMMF’s Class E expenses, including its management fee.
Investment in Oppenheimer Master Funds. The Fund is permitted to invest in entities sponsored and/or advised by the Manager or an affiliate. Certain of these entities in which the Fund invests are mutual funds registered under the Investment Company Act of 1940 that expect to be treated as partnerships for tax purposes, specifically Oppenheimer Master Loan Fund, LLC, Oppenheimer Master Event-Linked Bond Fund, LLC and Oppenheimer Master Inflation Protected Securities Fund, LLC (the “Master Funds”). Each Master Fund has its own investment risks, and those risks can affect the value of the Fund’s investments and therefore the value of the Fund’s shares. To the extent that the Fund invests more of its assets in one Master Fund than in another, the Fund will have greater exposure to the risks of that Master Fund.
The investment objective of Oppenheimer Master Loan Fund, LLC is to seek income. The investment objective of Oppenheimer Master Event-Linked Bond Fund, LLC is to seek total return. The investment objective of Oppenheimer Master Inflation Protected Securities Fund, LLC is to seek total return. The Fund’s investments in the Master Funds are included in the Statement of Investments. The Fund recognizes income and gain/(loss) on its investments in each Master Fund according to its allocated pro-rata share, based on its relative proportion of total outstanding Master Fund shares held, of the total net income earned and the net gain/(loss) realized on investments sold by the Master Funds. As a shareholder, the Fund is subject to its proportional share of the Master Funds’ expenses, including their management fee. The Manager will waive fees and/or reimburse Fund expenses in an amount equal to the indirect management fees incurred through the Fund’s investment in the Master Funds.
Allocation of Income, Expenses, Gains and Losses. Income, expenses (other than those attributable to a specific class), gains and losses are allocated on a daily basis to each class of shares based upon the relative proportion of net assets represented by such class. Operating expenses directly attributable to a specific class are charged against the operations of that class.
Federal Taxes. The Fund intends to comply with provisions of the Internal Revenue Code applicable to regulated investment companies and to distribute substantially all of its investment company taxable income, including any net realized gain on investments not offset by capital loss carryforwards, if any, to shareholders. Therefore, no federal income or excise tax provision is required. The Fund files income tax returns in U.S. federal and
28 OPPENHEIMER PORTFOLIO SERIES ACTIVE ALLOCATION FUND
1. Significant Accounting Policies (Continued)
applicable state jurisdictions. The statute of limitations on the Fund’s tax return filings generally remain open for the three preceding fiscal reporting period ends.
The tax components of capital shown in the following table represent distribution requirements the Fund must satisfy under the income tax regulations, losses the Fund may be able to offset against income and gains realized in future years and unrealized appreciation or depreciation of securities and other investments for federal income tax purposes.
Undistributed Net Investment Income | Undistributed Long-Term Gain | Accumulated Loss Carryforward1,2,3 | Net Unrealized Appreciation Based on cost of Securities and Other Investments for Federal Income Tax Purposes | |||||||||
| $19,049,238 | $— | $700,398,331 | $578,505,299 | |||||||||
1. As of January 31, 2014, the Fund had $700,398,331 of net capital loss carryforwards available to offset future realized capital gains, if any, and thereby reduce future taxable gain distributions. Details of the capital loss carryforwards are included in the table below. Capital loss carryovers with no expiration, if any, must be utilized prior to those with expiration dates.
| Expiring | ||||
| 2017 | $ | 68,767,077 | ||
| 2018 | 410,568,137 | |||
| 2019 | 221,029,215 | |||
| No expiration | 33,902 | |||
| Total | $ | 700,398,331 | ||
2. During the fiscal year ended January 31, 2014, the Fund utilized $42,846,696 of capital loss carryforward to offset capital gains realized in that fiscal year.
3. During the fiscal year ended January 31, 2013, the Fund did not utilize any capital loss carryforward.
Net investment income (loss) and net realized gain (loss) may differ for financial statement and tax purposes. The character of dividends and distributions made during the fiscal year from net investment income or net realized gains may differ from their ultimate characterization for federal income tax purposes. Also, due to timing of dividends and distributions, the fiscal year in which amounts are distributed may differ from the fiscal year in which the income or net realized gain was recorded by the Fund.
Accordingly, the following amounts have been reclassified for January 31, 2014. Net assets of the Fund were unaffected by the reclassifications.
Increase to Paid-in Capital | Increase to Accumulated Net Investment Income | Increase to Accumulated Net Realized Loss on Investments | ||||||
| $51,104 | $141,184 | $192,288 | ||||||
29 OPPENHEIMER PORTFOLIO SERIES ACTIVE ALLOCATION FUND
| NOTES TO FINANCIAL STATEMENTS Continued | ||||
1. Significant Accounting Policies (Continued)
The tax character of distributions paid during the years ended January 31, 2014 and January 31, 2013 was as follows:
| Year Ended January 31, 2014 | Year Ended January 31, 2013 | |||||||
| Distributions paid from: | ||||||||
| Ordinary income | $ | 27,785,945 | $ | 25,619,937 | ||||
The aggregate cost of securities and other investments and the composition of unrealized appreciation and depreciation of securities and other investments for federal income tax purposes as of January 31, 2014 are noted in the following table. The primary difference between book and tax appreciation or depreciation of securities and other investments, if applicable, is attributable to the tax deferral of losses or tax realization of financial statement unrealized gain or loss.
| Federal tax cost of securities | $ | 1,787,877,847 | ||
| Gross unrealized appreciation | $ | 595,532,349 | ||
| Gross unrealized depreciation | (17,027,050 | ) | ||
| Net unrealized appreciation | $ | 578,505,299 |
Trustees’ Compensation. The Fund has adopted an unfunded retirement plan (the “Plan”) for the Fund’s independent trustees. Benefits are based on years of service and fees paid to each trustee during their period of service. The Plan was frozen with respect to adding new participants effective December 31, 2006 (the “Freeze Date”) and existing Plan Participants as of the Freeze Date will continue to receive accrued benefits under the Plan. Active independent trustees as of the Freeze Date have each elected a distribution method with respect to their benefits under the Plan. During the year ended January 31, 2014, the Fund’s projected benefit obligations, payments to retired trustees and accumulated liability were as follows:
| Projected Benefit Obligations Increased | $ | 10,907 | ||
| Payments Made to Retired Trustees | 13,246 | |||
| Accumulated Liability as of January 31, 2014 | 104,121 |
The Board of Trustees has adopted a compensation deferral plan for independent trustees that enables trustees to elect to defer receipt of all or a portion of the annual compensation they are entitled to receive from the Fund. For purposes of determining the amount owed to the Trustee under the plan, deferred amounts are treated as though equal dollar amounts had been invested in shares of the Fund or in other Oppenheimer funds selected by the Trustee. The Fund purchases shares of the funds selected for deferral by the Trustee in amounts equal to his or her deemed investment, resulting in a Fund asset equal to the deferred compensation liability. Such assets are included as a component of “Other” within the asset section of the Statement of Assets and Liabilities. Deferral of trustees’ fees under the plan will not affect the net assets of the Fund, and will not materially affect the Fund’s assets, liabilities or net investment income per share. Amounts will be deferred until distributed in accordance with the compensation deferral plan.
30 OPPENHEIMER PORTFOLIO SERIES ACTIVE ALLOCATION FUND
1. Significant Accounting Policies (Continued)
Dividends and Distributions to Shareholders. Dividends and distributions to shareholders, which are determined in accordance with income tax regulations and may differ from U.S. generally accepted accounting principles, are recorded on the ex-dividend date. Income and capital gain distributions, if any, are declared and paid annually or at other times as deemed necessary by the Manager.
Investment Income. Dividend distributions received from the Underlying Funds are recorded on the ex-dividend date. Upon receipt of notification from an Underlying Fund, and subsequent to the ex-dividend date, some of the dividend income originally recorded by the Fund may be reclassified as a tax return of capital by reducing the cost basis of the Underlying Fund and/or increasing the realized gain on sales of investments in the Underlying Fund.
Custodian Fees. “Custodian fees and expenses” in the Statement of Operations may include interest expense incurred by the Fund on any cash overdrafts of its custodian account during the period. Such cash overdrafts may result from the effects of failed trades in portfolio securities and from cash outflows resulting from unanticipated shareholder redemption activity. The Fund pays interest to its custodian on such cash overdraft at a rate equal to the 1 Month LIBOR Rate plus 2.00%. The “Reduction to custodian expenses” line item, if applicable, represents earnings on cash balances maintained by the Fund during the period. Such interest expense and other custodian fees may be paid with these earnings.
Security Transactions. Security transactions are recorded on the trade date. Realized gains and losses on securities sold are determined on the basis of identified cost.
Indemnifications. The Fund’s organizational documents provide current and former trustees and officers with a limited indemnification against liabilities arising in connection with the performance of their duties to the Fund. In the normal course of business, the Fund may also enter into contracts that provide general indemnifications. The Fund’s maximum exposure under these arrangements is unknown as this would be dependent on future claims that may be made against the Fund. The risk of material loss from such claims is considered remote.
Other. The preparation of financial statements in conformity with accounting principles generally accepted in the United States of America requires management to make estimates and assumptions that affect the reported amounts of assets and liabilities and disclosure of contingent assets and liabilities at the date of the financial statements and the reported amounts of increases and decreases in net assets from operations during the reporting period. Actual results could differ from those estimates.
2. Securities Valuation
The Fund calculates the net asset value of its shares based upon the net asset value of the applicable Underlying Fund. For each Underlying Fund, the net asset value per share for a class of shares is determined as of the close of the New York Stock Exchange (the “Exchange”), normally 4:00 P.M. Eastern time, on each day the Exchange is open for trading by dividing the value of the Underlying Fund’s net assets attributable to that class by the number of outstanding shares of that class on that day.
31 OPPENHEIMER PORTFOLIO SERIES ACTIVE ALLOCATION FUND
| NOTES TO FINANCIAL STATEMENTS Continued | ||||
2. Securities Valuation (Continued)
The Fund’s Board has adopted procedures for the valuation of the Fund’s securities and has delegated the day-to-day responsibility for valuation determinations under those procedures to the Manager. The Manager has established a Valuation Committee which is responsible for determining a “fair valuation” for any security for which market quotations are not “readily available.” The Valuation Committee’s fair valuation determinations are subject to review, approval and ratification by the Fund’s Board at its next regularly scheduled meeting covering the calendar quarter in which the fair valuation was determined.
Valuations Methods and Inputs
To determine their net asset values, the Underlying Funds’ assets are valued primarily on the basis of current market quotations as generally supplied by third party portfolio pricing services or by dealers. Such market quotations are typically based on unadjusted quoted prices in active markets for identical securities or other observable market inputs.
If a market value or price cannot be determined for a security using the methodologies described above, or if, in the “good faith” opinion of the Manager, the market value or price obtained does not constitute a “readily available market quotation,” or a significant event has occurred that would materially affect the value of the security the security is fair valued either (i) by a standardized fair valuation methodology applicable to the security type or the significant event as previously approved by the Valuation Committee and the Fund’s Board or (ii) as determined in good faith by the Manager’s Valuation Committee. The Valuation Committee considers all relevant facts that are reasonably available, through either public information or information available to the Manager, when determining the fair value of a security. Fair value determinations by the Manager are subject to review, approval and ratification by the Fund’s Board at its next regularly scheduled meeting covering the calendar quarter in which the fair valuation was determined. The methodologies used for valuing securities are not necessarily an indication of the risks associated with investing in those Underlying Funds.
To assess the continuing appropriateness of security valuations, the Manager, or its third party service provider who is subject to oversight by the Manager, regularly compares prior day prices, prices on comparable securities, and sale prices to the current day prices and challenges those prices exceeding certain tolerance levels with the third party pricing service or broker source. For those securities valued by fair valuations, whether through a standardized fair valuation methodology or a fair valuation determination, the Valuation Committee reviews and affirms the reasonableness of the valuations based on such methodologies and fair valuation determinations on a regular basis after considering all relevant information that is reasonably available.
32 OPPENHEIMER PORTFOLIO SERIES ACTIVE ALLOCATION FUND
2. Securities Valuation (Continued)
Classifications
Each investment asset or liability of the Fund is assigned a level at measurement date based on the significance and source of the inputs to its valuation. Various data inputs are used in determining the value of each of the Fund’s investments as of the reporting period end. These data inputs are categorized in the following hierarchy under applicable financial accounting standards:
1) Level 1-unadjusted quoted prices in active markets for identical assets or liabilities (including securities actively traded on a securities exchange)
2) Level 2-inputs other than unadjusted quoted prices that are observable for the asset or liability (such as unadjusted quoted prices for similar assets and market corroborated inputs such as interest rates, prepayment speeds, credit risks, etc.)
3) Level 3-significant unobservable inputs (including the Manager’s own judgments about assumptions that market participants would use in pricing the asset or liability).
The inputs used for valuing securities are not necessarily an indication of the risks associated with investing in those securities.
The Fund classifies each of its investments in those Underlying Funds which are publicly offered and reported on an exchange as Level 1, and those Underlying Funds which are not publicly offered as Level 2, without consideration as to the classification level of the specific investments held by the Underlying Funds.
The table below categorizes amounts that are included in the Fund’s Statement of Assets and Liabilities as of January 31, 2014 based on valuation input level:
| Level 1— Unadjusted Quoted Prices | Level 2— Other Significant Observable Inputs | Level 3— Significant Unobservable Inputs | Value | |||||||||||||
| Assets Table | ||||||||||||||||
| Investments, at Value: | ||||||||||||||||
| Investment Companies | $ | 2,246,671,591 | $ | 119,711,555 | $ | — | $ | 2,366,383,146 | ||||||||
| Total Assets | $ | 2,246,671,591 | $ | 119,711,555 | $ | — | $ | 2,366,383,146 | ||||||||
3. Shares of Beneficial Interest
The Fund has authorized an unlimited number of $0.001 par value shares of beneficial interest of each class. Transactions in shares of beneficial interest were as follows:
| Year Ended January 31, 2014 | Year Ended January 31, 2013 | |||||||||||||||
| Shares | Amount | Shares | Amount | |||||||||||||
| Class A | ||||||||||||||||
| Sold | 22,989,515 | $ | 253,299,078 | 20,527,734 | $ | 198,706,652 | ||||||||||
| Dividends and/or distributions reinvested | 1,749,872 | 20,806,209 | 1,830,015 | 18,135,444 | ||||||||||||
| Acquisition—Note 6 | — | — | 13,078,223 | 130,650,086 | ||||||||||||
| Redeemed | (22,255,988) | (245,207,123) | (26,593,547) | (256,388,750) | ||||||||||||
| Net increase | 2,483,399 | $ | 28,898,164 | 8,842,425 | $ | 91,103,432 | ||||||||||
33 OPPENHEIMER PORTFOLIO SERIES ACTIVE ALLOCATION FUND
| NOTES TO FINANCIAL STATEMENTS Continued | ||||
3. Shares of Beneficial Interest (Continued)
| Year Ended January 31, 2014 | Year Ended January 31, 2013 | |||||||||||||||
| Shares | Amount | Shares | Amount | |||||||||||||
| Class B | ||||||||||||||||
| Sold | 208,354 | $ | 2,272,454 | 1,428,397 | $ | 13,312,623 | ||||||||||
| Dividends and/or distributions reinvested | 87,572 | 1,026,348 | 140,049 | 1,366,889 | ||||||||||||
| Acquisition—Note 6 | — | — | 1,910,666 | 18,644,796 | ||||||||||||
| Redeemed | (7,658,860 | ) | (81,929,848 | ) | (10,178,448 | ) | (96,036,502 | ) | ||||||||
| Net decrease | (7,362,934 | ) | $ | (78,631,046 | ) | (6,699,336 | ) | $ | (62,712,194 | ) | ||||||
| Class C | ||||||||||||||||
| Sold | 7,476,895 | $ | 80,831,099 | 6,956,186 | $ | 65,928,450 | ||||||||||
| Dividends and/or distributions reinvested | 333,890 | 3,893,061 | 392,303 | 3,817,108 | ||||||||||||
| Acquisition—Note 6 | — | — | 6,315,461 | 61,542,709 | ||||||||||||
| Redeemed | (9,253,403 | ) | (99,845,425 | ) | (12,376,480 | ) | (116,976,875 | ) | ||||||||
| Net increase (decrease) | (1,442,618 | ) | $ | (15,121,265 | ) | 1,287,470 | $ | 14,311,392 | ||||||||
| Class N | ||||||||||||||||
| Sold | 1,740,002 | $ | 18,988,954 | 1,967,146 | $ | 18,949,540 | ||||||||||
| Dividends and/or distributions reinvested | 122,625 | 1,450,646 | 167,305 | 1,649,625 | ||||||||||||
| Acquisition—Note 6 | — | — | 3,071,774 | 30,453,920 | ||||||||||||
| Redeemed | (4,209,854 | ) | (45,789,490 | ) | (5,003,304 | ) | (48,092,249 | ) | ||||||||
| Net increase (decrease) | (2,347,227 | ) | $ | (25,349,890 | ) | 202,921 | $ | 2,960,836 | ||||||||
| Class Y | ||||||||||||||||
| Sold | 323,991 | $ | 3,675,139 | 258,440 | $ | 2,521,536 | ||||||||||
| Dividends and/or distributions reinvested | 12,442 | 149,674 | 12,550 | 125,749 | ||||||||||||
| Acquisition—Note 6 | — | — | 37,003 | 373,520 | ||||||||||||
| Redeemed | (282,496 | ) | (3,158,118 | ) | (810,107 | ) | (8,070,934 | ) | ||||||||
| Net increase (decrease) | 53,937 | $ | 666,695 | (502,114 | ) | $ | (5,050,129 | ) | ||||||||
4. Purchases and Sales of Securities
The aggregate cost of purchases and proceeds from sales of securities, other than short-term obligations and investments in IMMF, for the year ended January 31, 2014 were as follows:
| Purchases | Sales | |||||||
| Investment securities | $ | 201,852,936 | $ | 278,600,444 | ||||
5. Fees and Other Transactions with Affiliates
Management Fees. Under the investment advisory agreement, the Manager does not charge a management fee, but rather collects indirect management fees from the Fund’s investments in the Underlying Funds. The weighted indirect management fees collected from the Fund’s investment in the Underlying Funds, as a percent of average daily net assets of the
34 OPPENHEIMER PORTFOLIO SERIES ACTIVE ALLOCATION FUND
5. Fees and Other Transactions with Affiliates (Continued)
Fund for the year ended January 31, 2014 was 0.57%. This amount is gross of any waivers or reimbursements of management fees implemented at the Underlying Fund level. In addition, the Fund pays the Manager an asset allocation fee equal to an annual rate of 0.10% of the first $3 billion of the daily net assets of the Fund and 0.08% of the daily net assets in excess of $3 billion.
Sub-Adviser Fees. The Manager has retained the Sub-Adviser to provide the day-to-day portfolio management of the Fund. Under the Sub-Advisory Agreement, the Manager pays the Sub-Adviser an annual fee in monthly installments, equal to a percentage of the investment management fee collected by the Manager from the Fund, which shall be calculated after any investment management fee waivers. The fee paid to the Sub-Adviser is paid by the Manager, not by the Fund.
Transfer Agent Fees. OFI Global (the “Transfer Agent”) serves as the transfer and shareholder servicing agent for the Fund. Fees incurred by the Fund with respect to these services are detailed in the Statement of Operations.
Sub-Transfer Agent Fees. The Transfer Agent has retained Shareholder Services, Inc., a wholly-owned subsidiary of OFI (the “Sub-Transfer Agent”), to provide the day-to-day transfer agent and shareholder servicing of the Fund. Under the Sub-Transfer Agency Agreement, the Transfer Agent pays the Sub-Transfer Agent an annual fee in monthly installments, equal to a percentage of the transfer agent fee collected by the Transfer Agent from the Fund, which shall be calculated after any applicable fee waivers. The fee paid to the Sub-Transfer Agent is paid by the Transfer Agent, not by the Fund.
Distribution and Service Plan (12b-1) Fees. Under its General Distributor’s Agreement with the Fund, OppenheimerFunds Distributor, Inc. (the “Distributor”) acts as the Fund’s principal underwriter in the continuous public offering of the Fund’s classes of shares.
Service Plan for Class A Shares. The Fund has adopted a Service Plan (the “Plan”) for Class A shares under Rule 12b-1 of the Investment Company Act of 1940. Under the Plan, the Fund reimburses the Distributor for a portion of its costs incurred for services provided to accounts that hold Class A shares. Reimbursement is made periodically at an annual rate of up to 0.25% of the daily net assets of Class A shares of the Fund. The Distributor currently uses all of those fees to pay dealers, brokers, banks and other financial institutions periodically for providing personal service and maintenance of accounts of their customers that hold Class A shares. Any unreimbursed expenses the Distributor incurs with respect to Class A shares in any fiscal year cannot be recovered in subsequent periods. Fees incurred by the Fund under the Plan are detailed in the Statement of Operations.
Distribution and Service Plans for Class B, Class C and Class N Shares. The Fund has adopted Distribution and Service Plans (the “Plans”) for Class B, Class C and Class N shares under Rule 12b-1 of the Investment Company Act of 1940 to compensate the
35 OPPENHEIMER PORTFOLIO SERIES ACTIVE ALLOCATION FUND
| NOTES TO FINANCIAL STATEMENTS Continued | ||||
5. Fees and Other Transactions with Affiliates (Continued)
Distributor for its services in connection with the distribution of those shares and servicing accounts. Under the Plans, the Fund pays the Distributor an annual asset-based sales charge of 0.75% on Class B and Class C shares daily net assets and 0.25% on Class N shares daily net assets. The Distributor also receives a service fee of 0.25% per year under each plan. If either the Class B, Class C or Class N plan is terminated by the Fund or by the shareholders of a class, the Board of Trustees and its independent trustees must determine whether the Distributor shall be entitled to payment from the Fund of all or a portion of the service fee and/or asset-based sales charge in respect to shares sold prior to the effective date of such termination. Fees incurred by the Fund under the Plans are detailed in the Statement of Operations. The Distributor determines its uncompensated expenses under the Plans at calendar quarter ends. The Distributor’s aggregate uncompensated expenses under the Plans at December 31, 2013 were as follows:
| Class C | $ | 8,275,759 | ||
| Class N | 2,751,083 |
Sales Charges. Front-end sales charges and contingent deferred sales charges (“CDSC”) do not represent expenses of the Fund. They are deducted from the proceeds of sales of Fund shares prior to investment or from redemption proceeds prior to remittance, as applicable. The sales charges retained by the Distributor from the sale of shares and the CDSC retained by the Distributor on the redemption of shares is shown in the following table for the period indicated.
| Year Ended | Class A Front-End Sales Charges Retained by Distributor | Class A Contingent Deferred Sales Charges Retained by Distributor | Class B Contingent Deferred Sales Charges Retained by Distributor | Class C Contingent Deferred Sales Charges Retained by Distributor | Class N Contingent Deferred Sales Charges Retained by Distributor | |||||||||||||||
| January 31, 2014 | $1,286,504 | $492 | $264,697 | $15,693 | $2,042 | |||||||||||||||
Waivers and Reimbursements of Expenses. The Manager has voluntarily agreed to waive fees and/or reimburse the Fund for certain expenses in order to limit “Expenses after payments, waivers and/or reimbursements and reduction to custodian expenses”, (the combined direct (Fund level) and indirect (Underlying Fund level) expenses), will not exceed the annual rate of 1.45%, 2.20%, 2.20%, 1.70% and 1.20%, for Class A, Class B, Class C, Class N and Class Y, respectively. The expense limitations do not include extraordinary expenses and other expenses not incurred in the ordinary course of the Fund’s business. Notwithstanding the foregoing limits, the Manager is not required to waive or reimburse Fund expenses in excess of the amount of indirect management fees earned from investments in the Underlying Funds.
The Manager has also contractually agreed to waive fees and/or reimburse certain Fund expenses at an annual rate of 0.04% as calculated on the daily net assets of the Fund. This waiver and/or reimbursement is applied after (and in addition to) any other applicable waiver and/or expense reimbursements that may apply. During the year ended January 31, 2014, the Manager waived fees and/or reimbursed the Fund $924,085.
36 OPPENHEIMER PORTFOLIO SERIES ACTIVE ALLOCATION FUND
5. Fees and Other Transactions with Affiliates (Continued)
The Transfer Agent has contractually agreed to limit transfer and shareholder servicing agent fees for all classes to 0.35% of average annual net assets per class.
During the year ended January 31, 2014, the Transfer Agent waived $188,935 of fees.
Some of these undertakings may be modified or terminated at any time; some may not be modified or terminated until after one year from the date of the current prospectus, as indicated therein.
6. Acquisitions
Acquisition of Oppenheimer Transition 2030 Fund
On October 18, 2012, the Fund acquired all of the net assets of Oppenheimer Transition 2030 Fund at fair market value, pursuant to an Agreement and Plan of Reorganization approved by the Oppenheimer Transition 2030 Fund shareholders on September 14, 2012. The purpose of the acquisition is to combine two funds with similar investment objectives, strategies, and risks to allow shareholders to benefit from greater asset growth potential, as well as lowered expenses.
The transaction qualified as a tax-free reorganization, (the “merger”) for federal income tax purposes allowing the Fund to use the original cost basis of the investments received to calculate subsequent gains and losses for tax reporting purposes.
Details of the merger are shown in the following table:
Exchange to One Share of the Oppenheimer Transition 2030 Fund | Shares of Beneficial Interest Issued by the Fund | Value of Issued Shares of Beneficial Interest | Combined Net Assets on October 18, 20121 | |||||||||||||
| Class A | 0.9395791000 | 7,818,745 | $ | 78,187,450 | $ | 1,255,222,892 | ||||||||||
| Class B | 0.9436008188 | 1,230,461 | $ | 12,021,603 | $ | 260,981,500 | ||||||||||
| Class C | 0.9451652664 | 3,228,596 | $ | 31,511,096 | $ | 487,282,000 | ||||||||||
| Class N | 0.9474834844 | 1,488,049 | $ | 14,776,323 | $ | 138,859,915 | ||||||||||
| Class Y | 0.9458763834 | 10,090 | $ | 102,106 | $ | 12,949,696 | ||||||||||
1. The net assets acquired included net unrealized appreciation of $28,904,573 and unused capital loss carry forward of $4,099,865, potential utilization subject to tax limitations.
Acquisition of Oppenheimer Transition 2040 Fund
On October 4, 2012, the Fund acquired all of the net assets of Oppenheimer Transition 2040 Fund at fair market value, pursuant to an Agreement and Plan of Reorganization approved by the Oppenheimer Transition 2040 Fund shareholders on September 14, 2012. The purpose of the acquisition is to combine two funds with similar investment objectives, strategies, and risks to allow shareholders to benefit from greater asset growth potential, as well as lowered expenses.
37 OPPENHEIMER PORTFOLIO SERIES ACTIVE ALLOCATION FUND
| NOTESTO FINANCIAL STATEMENTS Continued | ||||
6. Acquisitions (Continued)
The transaction qualified as a tax-free reorganization, (the “merger”) for federal income tax purposes allowing the Fund to use the original cost basis of the investments received to calculate subsequent gains and losses for tax reporting purposes.
Details of the merger are shown in the following table:
Exchange Ratio to One Share of the Oppenheimer Transition 2040 Fund | Shares of Beneficial Interest Issued by the Fund | Value of Issued Shares of Beneficial Interest | Combined Net Assets on October 4, 20121 | |||||||||||||
| Class A | 0.9983032000 | 3,791,217 | $ | 37,912,174 | $ | 1,181,020,721 | ||||||||||
| Class B | 1.0033591607 | 431,245 | $ | 4,213,263 | $ | 250,122,064 | ||||||||||
| Class C | 1.0037503074 | 2,018,060 | $ | 19,696,267 | $ | 456,520,488 | ||||||||||
| Class N | 1.0012887210 | 1,041,527 | $ | 10,342,364 | $ | 125,462,257 | ||||||||||
| Class Y | 1.0089237154 | 15,042 | $ | 152,225 | �� | $ | 12,907,734 | |||||||||
| 1. | The net assets acquired included net unrealized appreciation of $14,360,344. |
Acquisition of Oppenheimer Transition 2050 Fund
On November 1, 2012, the Fund acquired all of the net assets of Oppenheimer Transition 2050 Fund at fair market value, pursuant to an Agreement and Plan of Reorganization approved by the Oppenheimer Transition 2050 Fund shareholders on September 14, 2012. The purpose of the acquisition is to combine two funds with similar investment objectives, strategies, and risks to allow shareholders to benefit from greater asset growth potential, as well as lowered expenses.
The transaction qualified as a tax-free reorganization, (the “merger”) for federal income tax purposes allowing the Fund to use the original cost basis of the investments received to calculate subsequent gains and losses for tax reporting purposes.
Details of the merger are shown in the following table:
Exchange Ratio to One Share of the Oppenheimer Transition 2050 Fund | Shares of Beneficial Interest Issued by the Fund | Value of Issued Shares of Beneficial Interest | Combined Net Assets on November 1, 20121 | |||||||||||||
| Class A | 1.0134151362 | 1,468,261 | $ | 14,550,462 | $ | 1,255,491,143 | ||||||||||
| Class B | 1.0166800620 | 248,960 | $ | 2,409,930 | $ | 260,149,892 | ||||||||||
| Class C | 1.0197178904 | 1,068,805 | $ | 10,335,346 | $ | 491,890,027 | ||||||||||
| Class N | 1.0169311992 | 542,198 | $ | 5,335,233 | $ | 141,546,107 | ||||||||||
| Class Y | 1.0048489084 | 11,871 | $ | 119,189 | $ | 12,911,815 | ||||||||||
| 1. | The net assets acquired included net unrealized appreciation of $6,787,445. |
7. Pending Litigation
Since 2009, seven class action lawsuits have been pending in the U.S. District Court for the District of Colorado against OppenheimerFunds, Inc. (“OFI”), OppenheimerFunds Distributor, Inc., the Fund’s principal underwriter and distributor (the “Distributor”), and certain funds
38 OPPENHEIMER PORTFOLIO SERIES ACTIVE ALLOCATION FUND
7. Pending Litigation (Continued)
(but not including the Fund) advised by OFI Global Asset Management, Inc. and distributed by the Distributor (the “Defendant Funds”). The lawsuits also name as defendants certain officers and current and former trustees of the respective Defendant Funds. The lawsuits raise claims under federal securities law and allege, among other things, that the disclosure documents of the respective Defendant Funds contained misrepresentations and omissions and that the respective Defendant Funds’ investment policies were not followed. The plaintiffs in these actions seek unspecified damages, equitable relief and awards of attorneys’ fees and litigation expenses. The Defendant Funds’ Boards of Trustees have also engaged counsel to represent the Funds and the present and former Independent Trustees named in those suits. On March 5, 2014, the parties in six of these lawsuits executed stipulations and agreements of settlement resolving those actions. The settlements are subject to a variety of contingencies, including approval by the court. The settlements do not resolve a seventh outstanding lawsuit relating to Oppenheimer California Municipal Fund.
Other class action and individual lawsuits have been filed since 2008 in various state and federal courts against OFI and certain of its affiliates by investors seeking to recover investments they allegedly lost as a result of the “Ponzi” scheme run by Bernard L. Madoff and his firm, Bernard L. Madoff Investment Securities, LLC (“BLMIS”). Plaintiffs in these suits allege that they suffered losses as a result of their investments in several funds managed by an affiliate of OFI and assert a variety of claims, including breach of fiduciary duty, fraud, negligent misrepresentation, unjust enrichment, and violation of federal and state securities laws and regulations, among others. They seek unspecified damages, equitable relief and awards of attorneys’ fees and litigation expenses. Neither the Distributor, nor any of the Oppenheimer mutual funds, their independent trustees or directors are named as defendants in these lawsuits. None of the Oppenheimer mutual funds invested in any funds or accounts managed by Madoff or BLMIS. On February 28, 2011, a stipulation of partial settlement of three groups of consolidated putative class action lawsuits relating to these matters was filed in the U.S. District Court for the Southern District of New York. On August 19, 2011, the court entered an order and final judgment approving the settlement as fair, reasonable and adequate. In September 2011, certain parties filed notices of appeal from the court’s order approving the settlement. The settlement does not resolve other outstanding lawsuits against OFI and its affiliates relating to BLMIS.
On April 16, 2010, a lawsuit was filed in New York state court against (i) OFI, (ii) an affiliate of OFI and (iii) AAArdvark IV Funding Limited (“AAArdvark IV”), an entity advised by OFI’s affiliate, in connection with investments made by the plaintiffs in AAArdvark IV. Plaintiffs alleged breach of contract and common law fraud claims against the defendants and sought compensatory damages, costs and disbursements, including attorney fees. On April 11, 2013, the court granted defendants’ motion for summary judgment, dismissing plaintiffs’ fraud claim with prejudice and dismissing their contract claim without prejudice, and granted plaintiffs leave to replead their contract claim to assert a cause of action for specific performance within 30 days. On May 9, 2013, plaintiffs filed a notice of appeal from the court’s dismissal order. On January 7, 2014, the appellate court affirmed the trial court’s dismissal order. On July 15, 2011, a lawsuit was filed in New York state court against OFI, an affiliate of OFI and AAArdvark Funding Limited (“AAArdvark I”), an entity advised by OFI’s
39 OPPENHEIMER PORTFOLIO SERIES ACTIVE ALLOCATION FUND
| NOTESTO FINANCIAL STATEMENTS Continued | ||||
7. Pending Litigation (Continued)
affiliate, in connection with investments made by the plaintiffs in AAArdvark I. The complaint alleges breach of contract and common law fraud claims against the defendants and seeks compensatory damages, costs and disbursements, including attorney fees. On November 9, 2011, a lawsuit was filed in New York state court against OFI, an affiliate of OFI and AAArdvark XS Funding Limited (“AAArdvark XS”), an entity advised by OFI’s affiliate, in connection with investments made by the plaintiffs in AAArdvark XS. The complaint alleged breach of contract against the defendants and sought compensatory damages, costs and disbursements, including attorney fees. On November 8, 2013, the parties filed a stipulation of discontinuance dismissing the lawsuit with prejudice.
OFI believes the lawsuits and appeals described above are without legal merit and, with the exception of actions it has settled, is defending against them vigorously. While it is premature to render any opinion as to the outcome in these lawsuits, or whether any costs that the Defendant Funds may bear in defending the suits might not be reimbursed by insurance, OFI believes that these suits should not impair the ability of OFI or the Distributor to perform their respective duties to the Fund, and that the outcome of all of the suits together should not have any material effect on the operations of any of the Oppenheimer mutual funds.
40 OPPENHEIMER PORTFOLIO SERIES ACTIVE ALLOCATION FUND
| REPORT OF INDEPENDENT PUBLIC ACCOUNTING FIRM | ||||
The Board of Trustees and Shareholders of Oppenheimer Portfolio Series:
We have audited the accompanying statement of assets and liabilities of Active Allocation Fund (a series of Oppenheimer Portfolio Series), including the statement of investments, as of January 31, 2014, and the related statement of operations for the year then ended, the statements of changes in net assets for each of the years in the two-year period then ended, and the financial highlights for each of the years in the five-year period then ended. These financial statements and financial highlights are the responsibility of the Fund’s management. Our responsibility is to express an opinion on these financial statements and financial highlights based on our audits.
We conducted our audits in accordance with the standards of the Public Company Accounting Oversight Board (United States). Those standards require that we plan and perform the audit to obtain reasonable assurance about whether the financial statements and financial highlights are free of material misstatement. An audit includes examining, on a test basis, evidence supporting the amounts and disclosures in the financial statements. Our procedures included confirmation of securities owned as of January 31, 2014, by correspondence with the custodian, transfer agent and brokers, or by other appropriate auditing procedures where replies from brokers were not received. An audit also includes assessing the accounting principles used and significant estimates made by management, as well as evaluating the overall financial statement presentation. We believe that our audits provide a reasonable basis for our opinion.
In our opinion, the financial statements and financial highlights referred to above present fairly, in all material respects, the financial position of Active Allocation Fund as of January 31, 2014, the results of its operations for the year then ended, the changes in its net assets for each of the years in the two-year period then ended, and the financial highlights for each of the years in the five-year period then ended, in conformity with U.S. generally accepted accounting principles.
KPMG LLP
Denver, Colorado
March 24, 2014
41 OPPENHEIMER PORTFOLIO SERIES ACTIVE ALLOCATION FUND
| FEDERAL INCOME TAX INFORMATION Unaudited | ||||
In early 2014, if applicable, shareholders of record received information regarding all dividends and distributions paid to them by the Fund during calendar year 2013.
Dividends, if any, paid by the Fund during the fiscal year ended January 31, 2014 which are not designated as capital gain distributions should be multiplied by the maximum amount allowable but not less than 58.65% to arrive at the amount eligible for the corporate dividend-received deduction.
A portion, if any, of the dividends paid by the Fund during the fiscal year ended January 31, 2014 which are not designated as capital gain distributions are eligible for lower individual income tax rates to the extent that the Fund has received qualified dividend income as stipulated by recent tax legislation. The maximum amount allowable but not less than $21,525,017 of the Fund’s fiscal year taxable income may be eligible for the lower individual income tax rates. In early 2014, shareholders of record received information regarding the percentage of distributions that are eligible for lower individual income tax rates.
Recent tax legislation allows a regulated investment company to designate distributions not designated as capital gain distributions, as either interest related dividends or short-term capital gain dividends, both of which are exempt from the U.S. withholding tax applicable to non U.S. taxpayers. For the fiscal year ended January 31, 2014, the maximum amount allowable but not less than $6,565,050 of the ordinary distributions to be paid by the Fund qualifies as an interest related dividend.
The Fund has elected the application of Section 853 of the Internal Revenue Code to permit shareholders to take a federal income tax credit or deduction, at their option, on a per share basis. The maximum amount allowable but not less than $872,264 of foreign income taxes were paid by the Fund during the fiscal year ended January 31, 2014. A separate notice will be mailed to each shareholder, which will reflect the proportionate share of such foreign taxes which must be treated by shareholders as gross income for federal income tax purposes.
Gross income of the maximum amount allowable but not less than $8,486,230 was derived from sources within foreign countries or possessions of the United States.
The foregoing information is presented to assist shareholders in reporting distributions received from the Fund to the Internal Revenue Service. Because of the complexity of the federal regulations which may affect your individual tax return and the many variations in state and local tax regulations, we recommend that you consult your tax advisor for specific guidance.
42 OPPENHEIMER PORTFOLIO SERIES ACTIVE ALLOCATION FUND
| BOARD APPROVAL OF THE FUND’S INVESTMENT ADVISORY AND SUB-ADVISORY AGREEMENTS Unaudited | ||||
The Fund has entered into an investment advisory agreement with OFI Global Asset Management, Inc. (“OFI Global” or the “Adviser”), a wholly-owned subsidiary of OppenheimerFunds, Inc. (“OFI” or the “Sub-Adviser”) (“OFI Global” and “OFI” together the “Managers”) and OFI Global has entered into a sub-advisory agreement with OFI whereby OFI provides investment sub-advisory services to the Fund (collectively, the “Agreements”). Each year, the Board of Trustees (the “Board”), including a majority of the independent Trustees, is required to determine whether to renew the Agreements. The Investment Company Act of 1940, as amended, requires that the Board request and evaluate, and that the Managers provide, such information as may be reasonably necessary to evaluate the terms of the Agreements. The Board employs an independent consultant to prepare a report that provides information, including comparative information that the Board requests for that purpose. In addition to in-person meetings focused on this evaluation, the Board receives information throughout the year regarding Fund services, fees, expenses and performance.
The Adviser, Sub-Adviser and the independent consultant provided information to the Board on the following factors: (i) the nature, quality and extent of the Managers’ services, (ii) the investment performance of the Fund and the Managers, (iii) the fees and expenses of the Fund, including comparative expense information, (iv) the profitability of the Managers and their affiliates, including an analysis of the cost of providing services, (v) whether economies of scale are realized as the Fund grows and whether fee levels reflect these economies of scale for Fund investors and (vi) other benefits to the Managers from their relationship with the Fund. The Board was aware that there are alternatives to retaining the Managers.
Outlined below is a summary of the principal information considered by the Board as well as the Board’s conclusions.
Nature, Quality and Extent of Services. The Board considered information about the nature, quality and extent of the services provided to the Fund and information regarding the Managers’ key personnel who provide such services. The Sub-Adviser’s duties include providing the Fund with the services of the portfolio managers and the Sub-Adviser’s investment team, who provide research, analysis and other advisory services in regard to the Fund’s investments; securities trading services; oversight of third-party service providers; monitoring compliance with applicable Fund policies and procedures and adherence to the Fund’s investment restrictions; and risk management. The Managers are responsible for providing certain administrative services to the Fund as well. Those services include providing and supervising all administrative and clerical personnel who are necessary in order to provide effective corporate administration for the Fund; compiling and maintaining records with respect to the Fund’s operations; preparing and filing reports required by the Securities and Exchange Commission; preparing periodic reports regarding the operations of the Fund for its shareholders; preparing proxy materials for shareholder meetings; and preparing the registration statements required by Federal and state securities laws for the sale of the Fund’s shares. The Managers also provide the Fund with office space, facilities and equipment.
The Board also considered the quality of the services provided and the quality of the Managers’ resources that are available to the Fund. The Board took account of the fact that the Sub-Adviser has had over fifty years of experience as an investment adviser and that its assets under management rank it among the top mutual fund managers in the United States. The Board evaluated the Sub-Adviser’s advisory, administrative, accounting, legal, compliance
43 OPPENHEIMER PORTFOLIO SERIES ACTIVE ALLOCATION FUND
| BOARD APPROVAL OF THE FUND’S INVESTMENT ADVISORY AND SUB-ADVISORY AGREEMENTS Unaudited/Continued | ||||
services and risk management, and information the Board has received regarding the experience and professional qualifications of the Managers’ key personnel and the size and functions of its staff. In its evaluation of the quality of the portfolio management services provided, the Board considered the experience of Mark Hamilton and Caleb Wong, the portfolio managers for the Fund, and the experience of the portfolio managers and the investment performance of the investment companies in which the Fund invests (the “Underlying Funds”). The Board members also considered the totality of their experiences with the Managers as directors or trustees of the Fund and other funds advised by the Managers. The Board considered information regarding the quality of services provided by affiliates of the Managers, which its members have become knowledgeable about in connection with the renewal of the Fund’s service agreements. The Board concluded, in light of the Managers’ experience, reputation, personnel, operations and resources that the Fund benefits from the services provided under the Agreement.
Investment Performance of the Fund, the Adviser and the Sub-Adviser. Throughout the year, the Adviser and the Sub-Adviser provided information on the investment performance of the Fund, the Adviser and the Sub-Adviser, including comparative performance information. The Board also reviewed information, prepared by the Adviser, the Sub-Adviser and the independent consultant, comparing the Fund’s historical performance to its benchmarks and to the performance of other retail aggressive allocation funds. The Board noted that the Fund’s one-year, three-year and five-year performance was below its category median.
Costs of Services by the Adviser. The Board reviewed the fees paid to the Adviser and the other expenses borne by the Fund. The Board also considered the comparability of the fees charged and the services provided to the Fund to the fees and services for other clients or accounts advised by the Adviser. The independent consultant provided comparative data in regard to the fees and expenses of the Fund and other retail front-end load aggressive allocation funds with comparable asset levels and distribution features. After discussions with the Board, the Adviser has voluntarily agreed to waive fees and/or reimburse the Fund for certain expenses in order to limit “Total Annual Fund Operating Expenses After Fee Waiver and/or Expense Reimbursement” (including the combined direct (Fund level) and indirect (underlying Fund level) expenses, but excluding (i) interest, taxes, dividends tied to short sales, brokerage commissions, and other expenditures which are capitalized in accordance with the generally accepted accounting principles; (ii) certain other expenses attributable to, and incurred as a result of, a Fund’s investments; and (iii) other extraordinary expenses (including litigation expenses) not incurred in the ordinary course of the Fund’s business to annual rates of 1.45% for Class A shares, 2.20% for Class B shares and Class C shares, 1.70% for Class N shares, and 1.20% for Class Y shares as calculated on the daily net assets of the Fund. This waiver and/or reimbursement may be amended or withdrawn at any time without prior notice to shareholders. The Adviser has also contractually agreed to waive fees and/or reimburse certain Fund expenses at an annual rate of 0.04% as calculated on the daily net assets of the Fund. This waiver and/or reimbursement is applied after (and in addition to) any other applicable waivers and/or expense reimbursements that may apply, and may not be amended or withdrawn for one year from the date of the Fund’s prospectus, unless approved by the Board. The Board noted that the Fund’s contractual management fee and total expenses were lower than its peer group median and its category median.
44 OPPENHEIMER PORTFOLIO SERIES ACTIVE ALLOCATION FUND
Economies of Scale and Profits Realized by the Adviser and Sub-Adviser. The Board considered information regarding the Managers’ costs in serving as the Fund’s investment adviser and sub-adviser, including the costs associated with the personnel and systems necessary to manage the Fund, and information regarding the Managers’ profitability from their relationship with the Fund. The Board reviewed whether the Managers may realize economies of scale in managing and supporting the Fund. The Board noted that the Fund currently has management fee breakpoints, which are intended to share with Fund shareholders economies of scale that may exist as the Fund’s assets grow.
Other Benefits to the Managers. In addition to considering the profits realized by the Managers, the Board considered information that was provided regarding the direct and indirect benefits the Managers receive as a result of their relationship with the Fund, including compensation paid to the Managers’ affiliates. The Board also considered that the Managers must be able to pay and retain experienced professional personnel at competitive rates to provide quality services to the Fund.
Conclusions. These factors were also considered by the independent Trustees meeting separately from the full Board, assisted by experienced counsel to the Fund and to the independent Trustees. Fund counsel and the independent Trustees’ counsel are independent of the Managers within the meaning and intent of the Securities and Exchange Commission Rules.
Based on its review of the information it received and its evaluations described above, the Board, including a majority of the independent Trustees, decided to continue the Agreements through September 30, 2014. In arriving at its decision, the Board did not identify any factor or factors as being more important than others, but considered all of the above information, and considered the terms and conditions of the Agreements, including the management fees, in light of all the surrounding circumstances.
45 OPPENHEIMER PORTFOLIO SERIES ACTIVE ALLOCATION FUND
PORTFOLIO PROXY VOTING POLICIES AND PROCEDURES; UPDATES TO STATEMENTS OF INVESTMENTS Unaudited | ||||
The Fund has adopted Portfolio Proxy Voting Policies and Procedures under which the Fund votes proxies relating to securities (“portfolio proxies”) held by the Fund. A description of the Fund’s Portfolio Proxy Voting Policies and Procedures is available (i) without charge, upon request, by calling the Fund toll-free at 1.800.CALL OPP (225.5677), (ii) on the Fund’s website at oppenheimerfunds.com, and (iii) on the SEC’s website at www.sec.gov. In addition, the Fund is required to file Form N-PX, with its complete proxy voting record for the 12 months ended June 30th, no later than August 31st of each year. The Fund’s voting record is available (i) without charge, upon request, by calling the Fund toll-free at 1.800.CALL OPP (225.5677), and (ii) in the Form N-PX filing on the SEC’s website at www.sec.gov.
The Fund files its complete schedule of portfolio holdings with the SEC for the first quarter and the third quarter of each fiscal year on Form N-Q. The Fund’s Form N-Q filings are available on the SEC’s website at www.sec.gov. Those forms may be reviewed and copied at the SEC’s Public Reference Room in Washington, D.C. Information on the operation of the Public Reference Room may be obtained by calling 1-800-SEC-0330.
Householding—Delivery of Shareholder Documents
This is to inform you about OppenheimerFunds’ “householding” policy. If more than one member of your household maintains an account in a particular fund, OppenheimerFunds will mail only one copy of the fund’s prospectus (or, if available, the fund’s summary prospectus), annual and semiannual report and privacy policy. The consolidation of these mailings, called householding, benefits your fund through reduced mailing expense, and benefits you by reducing the volume of mail you receive from OppenheimerFunds. Householding does not affect the delivery of your account statements.
Please note that we will continue to household these mailings for as long as you remain an OppenheimerFunds shareholder, unless you request otherwise. If you prefer to receive multiple copies of these materials, please call us at 1.800.CALL-OPP (225-5677). You may also notify us in writing or via email. We will begin sending you individual copies of the prospectus (or, if available, the summary prospectus), reports and privacy policy within 30 days of receiving your request to stop householding.
46 OPPENHEIMER PORTFOLIO SERIES ACTIVE ALLOCATION FUND
| TRUSTEES AND OFFICERS Unaudited | ||||
Name, Position(s) Held with the Fund, Length of Service, Year of Birth | Principal Occupation(s) During the Past 5 Years; Other Trusteeships/Directorships Held; Number of Portfolios in the Fund Complex Currently Overseen | |
INDEPENDENT TRUSTEES | The address of each Trustee in the chart below is 6803 S. Tucson Way, Centennial, Colorado 80112-3924. Each Trustee serves for an indefinite term, or until his or her resignation, retirement, death or removal. | |
Brian F. Wruble, Chairman of the Board of Trustees (since 2007) and Trustee (since 2005) Year of Birth: 1943 | Director of Community Foundation of the Florida Keys (non-profit) (since July 2012); Chairman Emeritus and Non-Voting Trustee of The Jackson Laboratory (non-profit) (since August 2011); Director of Special Value Opportunities Fund, LLC (registered investment company) (affiliate of the Sub-Adviser’s parent company) (since September 2004); Member of Zurich Insurance Advisory Council (insurance) (since 2004); Treasurer (since 2007) and Trustee of the Institute for Advanced Study (non-profit educational institute) (since May 1992); Chairman (August 2007-August 2011) and Trustee (since August 1991) of the Board of Trustees of The Jackson Laboratory (non-profit); General Partner of Odyssey Partners, L.P. (hedge fund) (September 1995-December 2007); Special Limited Partner of Odyssey Investment Partners, LLC (private equity investment) (January 1999-September 2004). Oversees 51 portfolios in the OppenheimerFunds complex. Mr. Wruble has served on the Boards of certain Oppenheimer funds since April 2001, during which time he has become familiar with the Fund’s (and other Oppenheimer funds’) financial, accounting, regulatory and investment matters and has contributed to the Boards’ deliberations. | |
David K. Downes, Trustee (since 2007) Year of Birth: 1940 | Director of THL Credit Inc. (since June 2009); Trustee of Employee Trusts (since January 2006); Chief Executive Officer and Board Member of Community Capital Management (investment management company) (since January 2004); President of The Community Reinvestment Act Qualified Investment Fund (investment management company) (since 2004); Director of Internet Capital Group (information technology company) (since October 2003); formerly, Independent Chairman GSK Employee Benefit Trust (April 2006- June 2013); Director of Correctnet (January 2006-2007); Independent Chairman of the Board of Trustees of Quaker Investment Trust (registered investment company) (2004-2007); Chief Operating Officer and Chief Financial Officer of Lincoln National Investment Companies, Inc. (subsidiary of Lincoln National Corporation, a publicly traded company) and Delaware Investments U.S., Inc. (investment management subsidiary of Lincoln National Corporation) (1993-2003); President, Chief Executive Officer and Trustee of Delaware Investment Family of Funds (1993-2003); President and Board Member of Lincoln National Convertible Securities Funds, Inc. and the Lincoln National Income Funds, TDC (1993-2003); Chairman and Chief Executive Officer of Retirement Financial Services, Inc. (registered transfer agent and investment adviser and subsidiary of Delaware Investments U.S., Inc.) (1993-2003); President and Chief Executive Officer of Delaware Service Company, Inc. (1995-2003); Chief Administrative Officer, Chief Financial Officer, Vice Chairman and Director of Equitable Capital Management Corporation (investment subsidiary of Equitable Life Assurance Society) (1985-1992); Corporate Controller of Merrill Lynch Company (financial services holding company) (1977-1985); held the following positions at the Colonial Penn Group, Inc. (insurance company): Corporate Budget Director (1974-1977), Assistant Treasurer (1972-1974) and Director of | |
47 OPPENHEIMER PORTFOLIO SERIES ACTIVE ALLOCATION FUND
| TRUSTEES AND OFFICERS Unaudited / Continued | ||||
David K. Downes, Continued | Corporate Taxes (1969-1972); held the following positions at Price Waterhouse Company (financial services firm): Tax Manager (1967-1969), Tax Senior (1965-1967) and Staff Accountant (1963-1965); United States Marine Corps (1957-1959). Oversees 51 portfolios in the OppenheimerFunds complex. Mr. Downes has served on the Boards of certain Oppenheimer funds since December 2005, during which time he has become familiar with the Fund’s (and other Oppenheimer funds’) financial, accounting, regulatory and investment matters and has contributed to the Boards’ deliberations. | |
Matthew P. Fink, Trustee (since 2005) Year of Birth: 1941 | Trustee of the Committee for Economic Development (policy research foundation) (2005-2011); Director of ICI Education Foundation (education foundation) (October 1991-August 2006); President of the Investment Company Institute (trade association) (October 1991-June 2004); Director of ICI Mutual Insurance Company (insurance company) (October 1991-June 2004); Author of The Rise of Mutual Funds: An Insider’s View published by Oxford University Press (second edition 2010). Oversees 51 portfolios in the OppenheimerFunds complex. Mr. Fink has served on the Boards of certain Oppenheimer funds since January 2005, during which time he has become familiar with the Fund’s (and other Oppenheimer funds’) financial, accounting, regulatory and investment matters and has contributed to the Boards’ deliberations. | |
Edmund P. Giambastiani, Jr., Trustee (since 2013) Year of Birth: 1948 | Advisory Board Member of the Maxwell School of Citizenship and Public Affairs of Syracuse University (since April 2012); Director of Mercury Defense Systems Inc. (information technology) (August 2011-February 2013); Trustee of the U.S. Naval Academy Foundation (since November 2010); Advisory Board Member of the Massachusetts Institute of Technology Lincoln Laboratory (federally-funded research development center) (since May 2010); Director of The Boeing Company (aerospace and defense) (since October 2009); Trustee of MITRE Corporation (federally-funded research development center) (since September 2008); Independent Director of QinetiQ Group Plc (defense technology and security) (February 2008-August 2011); Director of Monster Worldwide, Inc. (on-line career services) (since January 2008, Lead Director since June 2011); Chairman of Alenia North America, Inc. (military and defense products) (January 2008-October 2009); Director of SRA International, Inc. (information technology and services) (January 2008-July 2011); President of Giambastiani Group LLC (national security and energy consulting) (since October 2007); United States Navy, career nuclear submarine officer (June 1970-October 2007), Vice Chairman of the Joint Chiefs of Staff (2005-October 2007), NATO Supreme Allied Commander Transformation (2003-2005), Commander, U.S. Joint Forces Command (2002-2005). Since his retirement from the U.S. Navy in October 2007, Admiral Giambastiani has also served on numerous U.S. Government advisory boards, investigations and task forces for the Secretaries of Defense, State and Interior and the Central Intelligence Agency. Oversees 51 portfolios in the OppenheimerFunds complex. Admiral Giambastiani has served on the Boards of certain Oppenheimer funds since February 2013, including as an Advisory Board Member for certain Oppenheimer funds, during which time he has become familiar with the Fund’s (and other Oppenheimer funds’) financial, accounting, regulatory and investment matters and has contributed to the Boards’ deliberations. For purposes of this report, Admiral Giambastiani is identified as a Trustee. | |
48 OPPENHEIMER PORTFOLIO SERIES ACTIVE ALLOCATION FUND
Mary F. Miller, Trustee (since 2005) Year of Birth: 1942 | Trustee of International House (not-for-profit) (since June 2007); Trustee of the American Symphony Orchestra (not-for-profit) (October 1998-November 2011); and Senior Vice President and General Auditor of American Express Company (financial services company) (July 1998-February 2003). Oversees 51 portfolios in the OppenheimerFunds complex. Ms. Miller has served on the Boards of certain Oppenheimer funds since August 2004, during which time she has become familiar with the Fund’s (and other Oppenheimer funds’) financial, accounting, regulatory and investment matters and has contributed to the Boards’ deliberations. | |
Joel W. Motley, Trustee (since 2005) Year of Birth: 1952 | Member of the Vestry of Trinity Wall Street (since April 2012); Director of Southern Africa Legal Services Foundation (since March 2012); Board Member of Pulitzer Center for Crisis Reporting (non-profit journalism) (since December 2010); Managing Director of Public Capital Advisors, LLC (privately-held financial advisor) (since January 2006); Managing Director of Carmona Motley, Inc. (privately-held financial advisor) (since January 2002); Director of Columbia Equity Financial Corp. (privately-held financial advisor) (2002-2007); Managing Director of Carmona Motley Hoffman Inc. (privately-held financial advisor) (January 1998-December 2001); Member of the Finance and Budget Committee of the Council on Foreign Relations, Member of the Investment Committee and Board of Human Rights Watch and Member of the Investment Committee and Board of Historic Hudson Valley. Oversees 51 portfolios in the OppenheimerFunds complex. Mr. Motley has served on the Boards of certain Oppenheimer funds since October 2002, during which time he has become familiar with the Fund’s (and other Oppenheimer funds’) financial, accounting, regulatory and investment matters and has contributed to the Boards’ deliberations. | |
Joanne Pace, Trustee (since 2012) Year of Birth: 1958 | Board Director of Horizon Blue Cross Blue Shield of New Jersey (since November 2012); Advisory Board Director of The Alberleen Group LLC (since March 2012); Advisory Board Director of The Agile Trading Group LLC (since March 2012); Advisory Council Member of 100 Women in Hedge Funds (non-profit) (since December 2012); Advisory Council Member of Morgan Stanley Children’s Hospital (non-profit) (since May 2012); Board Director of The Komera Project (non-profit) (since April 2012); New York Advisory Board Director of Peace First (non-profit) (since March 2010); Senior Advisor of SECOR Asset Management, LP (2010-2011); Managing Director and Chief Operating Officer of Morgan Stanley Investment Management (2006-2010); Partner and Chief Operating Officer of FrontPoint Partners, LLC (hedge fund) (2005-2006); held the following positions at Credit Suisse: Managing Director (2003-2005); Global Head of Human Resources and member of Executive Board and Operating Committee (2004-2005), Global Head of Operations and Product Control (2003-2004); held the following positions at Morgan Stanley: Managing Director (1997-2003), Controller and Principal Accounting Officer (1999-2003); Chief Financial Officer (temporary assignment) for the Oversight Committee, Long Term Capital Management (1998-1999). Lead Independent Director and Chair of the Audit and Nominating Committee of The Global Chartist Fund, LLC of Oppenheimer Asset Management (2011-2012); Board Director of Managed Funds Association (2008-2010); Board Director of Morgan Stanley Foundation (2007-2010) and Investment Committee Chair (2008-2010). Oversees 51 portfolios in the OppenheimerFunds complex. Ms. Pace has served on the Boards of certain Oppenheimer funds since November 2012, including as an Advisory Board Member for certain Oppenheimer funds, during which time she has become familiar with the Fund’s (and other | |
49 OPPENHEIMER PORTFOLIO SERIES ACTIVE ALLOCATION FUND
| TRUSTEES AND OFFICERS Unaudited / Continued | ||||
Joanne Pace, Continued | Oppenheimer funds’) financial, accounting, regulatory and investment matters and has contributed to the Board’s deliberations. For purposes of this report, Ms. Pace is identified as a Trustee. | |
Joseph M. Wikler, Trustee (since 2005) Year of Birth: 1941 | Director of C-TASC (bio-statistics services) (2007-2012); formerly, Director of the following medical device companies: Medintec (1992-2011) and Cathco (1996-2011); Member of the Investment Committee of the Associated Jewish Charities of Baltimore (since 1994); Director of Lakes Environmental Association (environmental protection organization) (1996-2008); Director of Fortis/Hartford mutual funds (1994-December 2001). Oversees 51 portfolios in the OppenheimerFunds complex. Mr. Wikler has served on the Boards of certain Oppenheimer funds since August 2005, during which time he has become familiar with the Fund’s (and other Oppenheimer funds’) financial, accounting, regulatory and investment matters and has contributed to the Boards’ deliberations. | |
Peter I. Wold, Trustee (since 2005) Year of Birth: 1948 | Director of Arch Coal, Inc. (since 2010); President of Wold Oil Properties, Inc. (oil and gas exploration and production company) (since 1994); Vice President of American Talc Company, Inc. (talc mining and milling) (since 1999); Managing Member of Hole-in-the-Wall Ranch (cattle ranching) (since 1979); Director and Chairman of Wyoming Enhanced Oil Recovery Institute Commission (enhanced oil recovery study) (2004-2012); Director and Chairman of the Denver Branch of the Federal Reserve Bank of Kansas City (1993-1999); and Director of PacifiCorp. (electric utility) (1995-1999). Oversees 51 portfolios in the OppenheimerFunds complex. Mr. Wold has served on the Boards of certain Oppenheimer funds since August 2005, during which time he has become familiar with the Fund’s (and other Oppenheimer funds’) financial, accounting, regulatory and investment matters and has contributed to the Boards’ deliberations.
| |
INTERESTED TRUSTEE AND OFFICER | Mr. Glavin is an “Interested Trustee” because he is affiliated with the Manager and the Sub-Adviser by virtue of his positions as an officer and director of the Manager and a director of the Sub-Adviser, and as a shareholder of the Sub-Adviser’s parent company. Both as a Trustee and as an officer, he serves for an indefinite term, or until his resignation, retirement, death or removal. Mr. Glavin’s address is Two World Financial Center, 225 Liberty Street, 11th Floor, New York, New York 10281-1008. | |
William F. Glavin, Jr., Trustee (since 2013), President and Principal Executive Officer (since 2009) Year of Birth: 1958 | Director, Chairman and Chief Executive Officer of the Manager (since January 2013); President of the Manager (January 2013-May 2013); Chairman of the Sub-Adviser (December 2009-December 2012); Chief Executive Officer (January 2009-December 2012) and Director of the Sub-Adviser (since January 2009); President of the Sub-Adviser (May 2009-December 2012); Management Director (since June 2009), President (since December 2009) and Chief Executive Officer (since January 2011) of Oppenheimer Acquisition Corp. (“OAC”) (the Sub-Adviser’s parent holding company); Director of Oppenheimer Real Asset Management, Inc. (since March 2010); Executive Vice President (March 2006-February 2009) and Chief Operating Officer (July 2007-February 2009) of Massachusetts Mutual Life Insurance Company (OAC’s parent company); Director (May 2004-March 2006) and Chief Operating Officer and Chief Compliance Officer (May 2004-January 2005), President (January 2005-March 2006) and Chief Executive Officer (June 2005-March 2006) of Babson Capital Management LLC; Director (March 2005-March 2006), President (May | |
50 OPPENHEIMER PORTFOLIO SERIES ACTIVE ALLOCATION FUND
William F. Glavin, Jr., Continued | 2003-March 2006) and Chief Compliance Officer (July 2005-March 2006) of Babson Capital Securities, Inc. (a broker-dealer); President (May 2003-March 2006) of Babson Investment Company, Inc.; Director (May 2004-August 2006) of Babson Capital Europe Limited; Director (May 2004-October 2006) of Babson Capital Guernsey Limited; Director (May 2004-March 2006) of Babson Capital Management LLC; Non-Executive Director (March 2005-March 2007) of Baring Asset Management Limited; Director (February 2005-June 2006) Baring Pension Trustees Limited; Director and Treasurer (December 2003-November 2006) of Charter Oak Capital Management, Inc.; Director (May 2006-September 2006) of C.M. Benefit Insurance Company; Director (May 2008-June 2009) and Executive Vice President (June 2007-July 2009) of C.M. Life Insurance Company; President (March 2006-May 2007) of MassMutual Assignment Company; Director (January 2005-December 2006), Deputy Chairman (March 2005-December 2006) and President (February 2005-March 2005) of MassMutual Holdings (Bermuda) Limited; Director (May 2008-June 2009) and Executive Vice President (June 2007-July 2009) of MML Bay State Life Insurance Company; Chief Executive Officer and President (April 2007-January 2009) of MML Distributors, LLC; and Chairman (March 2006-December 2008) and Chief Executive Officer (May 2007-December 2008) of MML Investors Services, Inc. An officer of 90 portfolios in the OppenheimerFunds complex.
| |
OTHER OFFICERS OF THE FUND | The addresses of the Officers in the chart below are as follows: for Messrs. Hamilton, Wong, Gabinet and Ms. Nasta, Two World Financial Center, 225 Liberty Street, New York, New York 10281-1008, for Messrs. Vandehey and Wixted, 6803 S. Tucson Way, Centennial, Colorado 80112-3924. Each Officer serves for an indefinite term or until his or her resignation, retirement, death or removal. | |
Mark Hamilton, Vice President (since 2013) Year of Birth: 1965 | Chief Investment Officer, Asset Allocation of the Sub-Adviser (since April 2013) and a Senior Vice President of the Sub-Adviser (since April 2013). Mr. Hamilton served at AllianceBernstein L.P. (from 1994-2013), as an Investment Director of Dynamic Asset Allocation (from 2010-2013), Head of North American Blend Team (from 2009-2010), and Senior Portfolio Manager of Blend Strategies (from 2006-2010). A portfolio manager and officer of other portfolios in the OppenheimerFunds complex. | |
Caleb Wong, Vice President (since 2005) Year of Birth: 1965 | Vice President of the Sub-Adviser (since June 1999); Senior Portfolio Manager of the Sub-Adviser (since January 2005); Head of fixed income quantitative research and risk management of the Sub-Adviser (1997-1999) and worked in fixed-income quantitative research and risk management for the Sub-Adviser (since July 1996). A portfolio manager and officer of other portfolios in the OppenheimerFunds complex. | |
Arthur S. Gabinet, Secretary and Chief Legal Officer (since 2011) Year of Birth: 1958 | Executive Vice President, Secretary and General Counsel of the Manager (since January 2013); General Counsel OFI SteelPath, Inc. (since January 2013); Executive Vice President (May 2010-December 2012) and General Counsel (since January 2011) of the Sub-Adviser; General Counsel of the Distributor (since January 2011); General Counsel of Centennial Asset Management Corporation (January 2011-December 2012); Executive Vice President (January 2011-December 2012) and General Counsel of HarbourView Asset Management Corporation (since January 2011); Assistant Secretary (since January 2011) and Director (since January 2011) of OppenheimerFunds | |
51 OPPENHEIMER PORTFOLIO SERIES ACTIVE ALLOCATION FUND
| TRUSTEES AND OFFICERS Unaudited / Continued | ||||
Arthur S. Gabinet, Continued | International Ltd. and OppenheimerFunds plc; Director of Oppenheimer Real Asset Management, Inc. (January 2011-December 2012) and General Counsel (since January 2011); Executive Vice President (January 2011-December 2011) and General Counsel of Shareholder Financial Services, Inc. and Shareholder Services, Inc. (since January 2011); Executive Vice President (January 2011-December 2012) and General Counsel of OFI Private Investments Inc. (since January 2011); Vice President of OppenheimerFunds Legacy Program (January 2011-December 2011); Executive Vice President (January 2011-December 2012) and General Counsel of OFI Institutional Asset Management, Inc. (since January 2011); General Counsel, Asset Management of the Sub-Adviser (May 2010-December 2010); Principal, The Vanguard Group (November 2005-April 2010); District Administrator, U.S. Securities and Exchange Commission (January 2003-October 2005). An officer of 90 portfolios in the OppenheimerFunds complex. | |
Christina M. Nasta, Vice President and Chief Business Officer (since 2011) Year of Birth: 1973 | Senior Vice President of OppenheimerFunds Distributor, Inc. (since January 2013); Senior Vice President of the Sub-Adviser (July 2010-December 2012); Vice President of the Sub-Adviser (January 2003-July 2010); Vice President of OppenheimerFunds Distributor, Inc. (January 2003-July 2010). An officer of 90 portfolios in the OppenheimerFunds complex. | |
Mark S. Vandehey, Vice President and Chief Compliance Officer (since 2005) Year of Birth: 1950 | Senior Vice President and Chief Compliance Officer of the Manager (since January 2013); Chief Compliance Officer of OFI SteelPath, Inc. (since January 2013); Senior Vice President of the Sub-Adviser (March 2004-December 2012); Chief Compliance Officer of the Sub-Adviser, OppenheimerFunds Distributor, Inc., OFI Trust Company, OFI Institutional Asset Management, Inc., Oppenheimer Real Asset Management, Inc., OFI Private Investments, Inc., Harborview Asset Management Corporation, Trinity Investment Management Corporation, and Shareholder Services, Inc. (since March 2004); Vice President of OppenheimerFunds Distributor, Inc., Centennial Asset Management Corporation and Shareholder Services, Inc. (June 1983-December 2012). An officer of 90 portfolios in the OppenheimerFunds complex. | |
Brian W. Wixted, Treasurer and Principal Financial & Accounting Officer (since 2005) Year of Birth: 1959 | Senior Vice President of the Manager (since January 2013); Treasurer of the Sub-Adviser, HarbourView Asset Management Corporation, Shareholder Financial Services, Inc., Shareholder Services, Inc., and Oppenheimer Real Asset Management, Inc. (March 1999-June 2008), OFI Private Investments, Inc. (March 2000-June 2008), OppenheimerFunds International Ltd. and OppenheimerFunds plc (since May 2000), OFI Institutional Asset Management, Inc. (November 2000-June 2008), and OppenheimerFunds Legacy Program (charitable trust program established by the Sub-Adviser) (June 2003-December 2011); Treasurer and Chief Financial Officer of OFI Trust Company (since May 2000); Assistant Treasurer of Oppenheimer Acquisition Corporation (March 1999-June 2008). An officer of 90 portfolios in the OppenheimerFunds complex. | |
The Fund’s Statement of Additional Information contains additional information about the Fund’s Trustees and Officers and is available without charge upon request, by calling 1.800.CALL-OPP (225-5677).
52 OPPENHEIMER PORTFOLIO SERIES ACTIVE ALLOCATION FUND
| OPPENHEIMER PORTFOLIO SERIES ACTIVE ALLOCATION FUND | ||||
| Manager | OFI Global Asset Management, Inc. | |
| Sub-Adviser | OppenheimerFunds, Inc. | |
| Distributor | OppenheimerFunds Distributor, Inc. | |
| Transfer and Shareholder Servicing Agent | OFI Global Asset Management, Inc. | |
| Sub-Transfer Agent | Shareholder Services, Inc. | |
DBA OppenheimerFunds Services | ||
| Independent Registered Public Accounting Firm | KPMG LLP | |
| Legal Counsel | Kramer Levin Naftalis & Frankel LLP | |
© 2014 OppenheimerFunds, Inc. All rights reserved.
53 OPPENHEIMER PORTFOLIO SERIES ACTIVE ALLOCATION FUND
| PRIVACY POLICY NOTICE | ||||
As an Oppenheimer fund shareholder, you are entitled to know how we protect your personal information and how we limit its disclosure.
Information Sources
We obtain nonpublic personal information about our shareholders from the following sources:
| l | Applications or other forms |
| l | When you create a user ID and password for online account access |
| l | When you enroll in eDocs Direct, our electronic document delivery service |
| l | Your transactions with us, our affiliates or others |
| l | A software program on our website, often referred to as a “cookie,” which indicates which parts of our site you’ve visited |
| l | When you set up challenge questions to reset your password online |
If you visit oppenheimerfunds.com and do not log on to the secure account information areas, we do not obtain any personal information about you. When you do log on to a secure area, we do obtain your user ID and password to identify you. We also use this information to provide you with products and services you have requested, to inform you about products and services that you may be interested in and assist you in other ways.
We do not collect personal information through our website unless you willingly provide it to us, either directly by email or in those areas of the website that request information. In order to update your personal information (including your mailing address, email address and phone number) you must first log on and visit your user profile.
If you have set your browser to warn you before accepting cookies, you will receive the warning message with each cookie. You can refuse cookies by turning them off in your browser. However, doing so may limit your access to certain sections of our website.
We use cookies to help us improve and manage our website. For example, cookies help us recognize new versus repeat visitors to the site, track the pages visited, and enable some special features on the website. This data helps us provide a better service for our website visitors.
Protection of Information
We do not disclose any non-public personal information (such as names on a customer list) about current or former customers to anyone, except as permitted by law.
Disclosure of Information
We send your financial advisor (as designated by you) copies of confirmations, account statements and other documents reporting activity in your fund accounts. We may also use details about you and your investments to help us, our financial service affiliates, or firms that jointly market their financial products and services with ours, to better serve your investment needs or suggest financial services or educational material that may be of interest to you. If this requires us to provide you with an opportunity to “opt in” or “opt out” of such information sharing with a firm not affiliated with us, you will receive notification on how to do so, before any such sharing takes place.
Right of Refusal
We will not disclose your personal information to unaffiliated third parties (except as permitted by law), unless we first offer you a reasonable opportunity to refuse or “opt out” of such disclosure.
54 OPPENHEIMER PORTFOLIO SERIES ACTIVE ALLOCATION FUND
Internet Security and Encryption
In general, the email services provided by our website are encrypted and provide a secure and private means of communication with us. To protect your own privacy, confidential and/or personal information should only be communicated via email when you are advised that you are using a secure website.
As a security measure, we do not include personal or account information in non-secure emails, and we advise you not to send such information to us in non-secure emails. Instead, you may take advantage of the secure features of our website to encrypt your email correspondence. To do this, you will need to use a browser that supports Secure Sockets Layer (SSL) protocol.
We do not guarantee or warrant that any part of our website, including files available for download, are free of viruses or other harmful code. It is your responsibility to take appropriate precautions, such as use of an anti-virus software package, to protect your computer hardware and software.
| l | All transactions, including redemptions, exchanges and purchases, are secured by SSL and 128-bit encryption. SSL is used to establish a secure connection between your PC and OppenheimerFunds’ server. It transmits information in an encrypted and scrambled format. |
| l | Encryption is achieved through an electronic scrambling technology that uses a “key” to code and then decode the data. Encryption acts like the cable converter box you may have on your television set. It scrambles data with a secret code so that no one can make sense of it while it is being transmitted. When the data reaches its destination, the same software unscrambles the data. |
| l | You can exit the secure area by either closing your browser, or for added security, you can use the Log Out button before you close your browser. |
Other Security Measures
We maintain physical, electronic and procedural safeguards to protect your personal account information. Our employees and agents have access to that information only so that they may offer you products or provide services, for example, when responding to your account questions.
How You Can Help
You can also do your part to keep your account information private and to prevent unauthorized transactions. If you obtain a user ID and password for your account, do not allow it to be used by anyone else. Also, take special precautions when accessing your account on a computer used by others.
Who We Are
This joint notice describes the privacy policies of the Oppenheimer funds, OppenheimerFunds, Inc., and each of its investment adviser subsidiaries, OppenheimerFunds Distributor, Inc. and OFI Global Trust Co. It applies to all Oppenheimer fund accounts you presently have, or may open in the future, using your Social Security number—whether or not you remain a shareholder of our funds. This notice was last updated November 2013. In the event it is updated or changed, we will post an updated notice on our website at oppenheimerfunds.com. If you have any questions about these privacy policies, write to us at P.O. Box 5270, Denver, CO 80217-5270, email us by clicking on the Contact Us section of our website at oppenheimerfunds.com or call us at 1.800.CALL OPP (225.5677).
55 OPPENHEIMER PORTFOLIO SERIES ACTIVE ALLOCATION FUND


| 3 | ||||||
| 6 | ||||||
| 9 | ||||||
| 11 | ||||||
| 13 | ||||||
| 15 | ||||||
| 16 | ||||||
| 17 | ||||||
| 22 | ||||||
| 33 | ||||||
| 34 | ||||||
| Board Approval of the Fund’s Investment and Sub-Advisory Agreements | 35 | |||||
| Portfolio Proxy Voting Policies and Procedures; Updates to Statement of Investments | 38 | |||||
| 39 | ||||||
| 46 | ||||||
Class A Shares
AVERAGE ANNUAL TOTAL RETURNS AT 1/31/14
Class A Shares of the Fund | ||||||||
| Without Sales Charge | With Sales Charge | S&P 500 Index | MSCI World Index | |||||
1-Year | 16.95 % | 10.23 % | 21.52 % | 16.07 % | ||||
| ||||||||
5-Year | 18.32 | 16.93 | 19.19 | 16.27 | ||||
| ||||||||
Since Inception (4/5/05) | 6.43 | 5.72 | 7.00 | 5.98 | ||||
| ||||||||
Performance data quoted represents past performance, which does not guarantee future results. The investment return and principal value of an investment in the Fund will fluctuate so that an investor’s shares, when redeemed, may be worth more or less than their original cost. Fund returns include changes in share price, reinvested distributions, and a 5.75% maximum applicable sales charge except where “without sales charge” is indicated. Current performance may be lower or higher than the performance quoted. Returns do not consider capital gains or income taxes on an individual’s investment. For performance data current to the most recent month-end, visit oppenheimerfunds.com or call 1.800.CALL OPP (225.5677).
2 OPPENHEIMER PORTFOLIO SERIES EQUITY INVESTOR FUND
During the one-year reporting period ended January 31, 2014, the Fund’s Class A shares (without sales charge) produced a total return of 16.95%. During a period in which domestic equities outperformed foreign equities, the Fund outperformed the MSCI World Index, which returned 16.07%, but underperformed the S&P 500 Index, which returned 21.52%.
MARKET OVERVIEW
Accommodative monetary policies on the part of central banks in the U.S., Europe and Japan, combined with an improving economic outlook, resulted in a rally among equities and higher-yielding bonds over the first four months of 2013. At the same time, yields of U.S. government securities remained near historical lows due to the Federal Reserve’s (the “Fed’s”) massive bond buying program. These developments drove financial markets higher through the early spring of 2013. At that time, economic data appeared to confirm
that the United States, Europe and Japan had engineered a sustained economic rebound, but investors responded negatively to disappointing economic data from China, India, Brazil, and other emerging markets. The ensuing “flight to quality” toward traditional safe havens produced sharp dislocations in emerging equity, fixed-income and currency markets. In late May, remarks by Fed chairman Ben Bernanke were widely interpreted as a signal that U.S. monetary
COMPARISON OF CHANGE IN VALUE OF $10,000 HYPOTHETICAL INVESTMENTS IN:
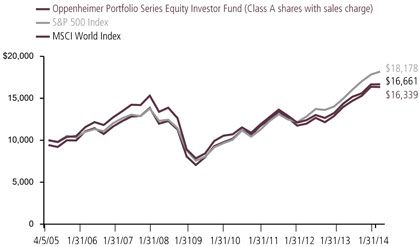
1 The Fund is invested in Class I shares of all underlying funds discussed in this Fund Performance Discussion.
3 OPPENHEIMER PORTFOLIO SERIES EQUITY INVESTOR FUND
policymakers would begin to back away from their quantitative easing program sooner than expected, sparking heightened volatility in financial markets throughout the world. However, market conditions generally stabilized over the summer of 2013. In October, the U.S. Congress managed to reach a bipartisan agreement to raise the national debt ceiling, and did so well ahead of the potential default deadline. While the Fed refrained from reducing its monthly bond purchases in September, in December the Central Bank announced that it would reduce its monthly bond purchases by $10 billion, from $85 billion to $75 billion, starting in January 2014. The Fed also continued to hold short-term interest rates at very low levels throughout the reporting period.
Against this backdrop, equities generally performed well over 2013, with fixed-income producing muted results. While concerns that ongoing downturns in the emerging markets might dampen the U.S. economic recovery resulted in renewed volatility in stock and bond markets over January 2014, corporate earnings growth generally remained strong, and the unemployment rate fell.
FUND REVIEW
During the reporting period, Oppenheimer Value Fund and Oppenheimer Capital Appreciation Fund were the Fund’s top domestic equity holdings and provided the strongest contribution to the Fund’s return on an absolute basis. Oppenheimer Value Fund and Oppenheimer Capital Appreciation Fund received their best absolute results from securities in the financials sector and health
care sector, respectively. However, they underperformed their benchmarks, the S&P 500 Index and the Russell 1000 Value Index (for Oppenheimer Value Fund), and the S&P 500 Index and the Russell 1000 Growth Index (for Oppenheimer Capital Appreciation Fund). An investment in Oppenheimer Main Street Small- & Mid-Cap Fund also performed positively. The underlying fund’s absolute performance was driven by certain stocks within the health care sector. However, on a relative basis, the underlying fund underperformed its benchmark, the Russell 2500 Index.
The Fund’s two largest foreign equity holdings, Oppenheimer International Growth Fund and Oppenheimer International Value Fund, produced positive results this reporting period. Oppenheimer International Growth Fund’s performance was driven largely by holdings in the information technology sector. Oppenheimer International Value Fund received its best absolute performance from stocks in the consumer discretionary sector this reporting period. Both of these underlying funds outperformed their benchmarks, the MSCI All Country World ex-U.S. Index and the MSCI EAFE Index. Also benefiting the Fund’s performance was an investment in Oppenheimer International Small Company Fund, which had a strong reporting period and outperformed its benchmarks, the MSCI All Country World Ex U.S. Small Cap Index and the MSCI EAFE Index. The underlying fund received its best contribution to return from investments in the
4 OPPENHEIMER PORTFOLIO SERIES EQUITY INVESTOR FUND
health care and consumer discretionary sectors.
Detracting slightly from performance this reporting period was the Fund’s investment in Oppenheimer Developing Markets Fund. Emerging market equities had a difficult year with several issues impacting the performance of the asset class. These issues
included the Fed’s tapering of quantitative easing, negative sentiment around the sustainability of China’s growth, and broad growth disappointment throughout emerging market economies. Although the underlying fund produced a negative absolute return in this environment, it outperformed its benchmark, the MSCI Emerging Markets Index.
 |  | |
Mark Hamilton2 Portfolio Manager |
2. Mark Hamilton became a Portfolio Manager in August 2013.
5 OPPENHEIMER PORTFOLIO SERIES EQUITY INVESTOR FUND
ASSET CLASS ALLOCATION
| ||
Foreign Equity Funds | 53.8% | |
| ||
Domestic Equity Funds | 46.2 | |
| ||
Portfolio holdings and allocations are subject to change. Percentages are as of January 31, 2014, and are based on the total market value of investments.
TOP HOLDINGS
| ||
Oppenheimer International Growth Fund, Cl. I | 21.5% | |
| ||
Oppenheimer Value Fund, Cl. I | 20.9 | |
| ||
Oppenheimer International Value Fund, Cl. I | 18.8 | |
| ||
Oppenheimer Capital Appreciation Fund, Cl. I | 18.3 | |
| ||
Oppenheimer Developing Markets Fund, Cl. I | 7.2 | |
| ||
| Oppenheimer Main Street Small- & Mid-Cap Fund, Cl. I | 7.1 | |
| ||
| Oppenheimer International Small Company Fund, Cl. I | 6.3 | |
| ||
Portfolio holdings and allocations are subject to change. Percentages are as of January 31, 2014, and are based on net assets. For more current Top 10 Fund holdings, please visit oppenheimerfunds.com.
6 OPPENHEIMER PORTFOLIO SERIES EQUITY INVESTOR FUND
Share Class Performance
AVERAGE ANNUAL TOTAL RETURNS WITHOUT SALES CHARGE AS OF 1/31/14
| Inception Date | 1-Year | 5-Year | Since Inception | |||||
Class A (OAAIX) | 4/5/05 | 16.95% | 18.32% | 6.43% | ||||
Class B (OBAIX) | 4/5/05 | 15.99% | 17.33% | 5.85% | ||||
Class C (OCAIX) | 4/5/05 | 16.11% | 17.43% | 5.62% | ||||
Class N (ONAIX) | 4/5/05 | 16.68% | 18.07% | 6.22% | ||||
Class Y (OYAIX) | 4/5/05 | 17.27% | 18.78% | 6.87% |
AVERAGE ANNUAL TOTAL RETURNS WITH SALES CHARGE AS OF 1/31/14
| Inception Date | 1-Year | 5-Year | Since Inception | |||||
Class A (OAAIX) | 4/5/05 | 10.23% | 16.93% | 5.72% | ||||
Class B (OBAIX) | 4/5/05 | 10.99% | 17.12% | 5.85% | ||||
Class C (OCAIX) | 4/5/05 | 15.11% | 17.43% | 5.62% | ||||
Class N (ONAIX) | 4/5/05 | 15.68% | 18.07% | 6.22% | ||||
Class Y (OYAIX) | 4/5/05 | 17.27% | 18.78% | 6.87% |
Performance data quoted represents past performance, which does not guarantee future results. The investment return and principal value of an investment in the Fund will fluctuate so that an investor’s shares, when redeemed, may be worth more or less than their original cost. Current performance may be lower or higher than the performance quoted. Returns do not consider capital gains or income taxes on an individual’s investment. For performance data current to the most recent month-end, visit oppenheimerfunds.com or call 1.800.CALL OPP (225.5677). Fund returns include changes in share price, reinvested distributions, and the applicable sales charge: for Class A shares, the current maximum initial sales charge of 5.75%; for Class B shares, the contingent deferred sales charge of 5% (1-year) and 2% (5-year); and for Class C and N shares, the contingent deferred sales charge of 1% for the 1-year period. There is no sales charge for Class Y shares. Because Class B shares convert to Class A shares 72 months after purchase, the 10-year return for Class B shares uses Class A performance for the period after conversion.
The Fund’s performance is compared to the performance of the S&P 500 Index and the MSCI World Index. The S&P 500 Index is an unmanaged index of large-capitalization equity securities that is a measure of the general domestic stock market. The MSCI World Index is designed to measure the equity market performance of developed markets. The indices are unmanaged and cannot be purchased directly by investors. Index performance includes reinvestment of income, but does not reflect transaction costs, fees, expenses or taxes. Index performance is shown for illustrative purposes only as a benchmark for the Fund’s performance, and does not predict or depict performance of the Fund. The Fund’s performance reflects the effects of the Fund’s business and operating expenses.
The Fund’s investment strategy and focus can change over time. The mention of specific fund holdings does not constitute a recommendation by OppenheimerFunds, Inc. or its affiliates.
7 OPPENHEIMER PORTFOLIO SERIES EQUITY INVESTOR FUND
Before investing in any of the Oppenheimer funds, investors should carefully consider a fund’s investment objectives, risks, charges and expenses. Fund prospectuses and summary prospectuses contain this and other information about the funds, and may be obtained by asking your financial advisor, visiting oppenheimerfunds.com, or calling 1.800.CALL OPP (225.5677). Read prospectuses and summary prospectuses carefully before investing.
Shares of Oppenheimer funds are not deposits or obligations of any bank, are not guaranteed by any bank, are not insured by the FDIC or any other agency, and involve investment risks, including the possible loss of the principal amount invested.
8 OPPENHEIMER PORTFOLIO SERIES EQUITY INVESTOR FUND
Fund Expenses. As a shareholder of the Fund, you incur two types of costs: (1) transaction costs, which may include sales charges (loads) on purchase payments, contingent deferred sales charges on redemptions; and (2) ongoing costs, including management fees; distribution and service fees; and other Fund expenses. These examples are intended to help you understand your ongoing costs (in dollars) of investing in the Fund and to compare these costs with the ongoing costs of investing in other mutual funds.
The examples are based on an investment of $1,000.00 invested at the beginning of the period and held for the entire 6-month period ended January 31, 2014.
Actual Expenses. The first section of the table provides information about actual account values and actual expenses. You may use the information in this section for the class of shares you hold, together with the amount you invested, to estimate the expense that you paid over the period. Simply divide your account value by $1,000.00 (for example, an $8,600.00 account value divided by $1,000.00 = 8.60), then multiply the result by the number in the first section under the heading entitled “Expenses Paid During Period” to estimate the expenses you paid on your account during this period.
Hypothetical Example for Comparison Purposes. The second section of the table provides information about hypothetical account values and hypothetical expenses based on the Fund’s actual expense ratio for each class of shares, and an assumed rate of return of 5% per year for each class before expenses, which is not the actual return. The hypothetical account values and expenses may not be used to estimate the actual ending account balance or expenses you paid for the period. You may use this information to compare the ongoing costs of investing in the Fund and other funds. To do so, compare this 5% hypothetical example for the class of shares you hold with the 5% hypothetical examples that appear in the shareholder reports of the other funds.
Please note that the expenses shown in the table are meant to highlight your ongoing costs only and do not reflect any transactional costs, such as front-end or contingent deferred sales charges (loads), or a $12.00 fee imposed annually on accounts valued at less than $500.00 (subject to exceptions described in the Statement of Additional Information). Therefore, the “hypothetical” section of the table is useful in comparing ongoing costs only, and will not help you determine the relative total costs of owning different funds. In addition, if these transactional costs were included, your costs would have been higher.
9 OPPENHEIMER PORTFOLIO SERIES EQUITY INVESTOR FUND
| Actual | Beginning Value | Ending Account Value | Expenses Paid During 6 Months Ended | |||||||||
| ||||||||||||
Class A | $ | 1,000 .00 | $ | 1,068 .70 | $ | 2 .56 | ||||||
| ||||||||||||
Class B | 1,000 .00 | 1,064 .20 | 6 .52 | |||||||||
| ||||||||||||
Class C | 1,000 .00 | 1,064 .50 | 6 .52 | |||||||||
| ||||||||||||
Class N | 1,000 .00 | 1,066 .80 | 3 .86 | |||||||||
| ||||||||||||
Class Y | 1,000 .00 | 1,070 .40 | 1 .20 | |||||||||
Hypothetical | ||||||||||||
(5% return before expenses) | ||||||||||||
| ||||||||||||
Class A | 1,000 .00 | 1,022 .74 | 2 .50 | |||||||||
| ||||||||||||
Class B | 1,000 .00 | 1,018 .90 | 6 .38 | |||||||||
| ||||||||||||
Class C | 1,000 .00 | 1,018 .90 | 6 .38 | |||||||||
| ||||||||||||
Class N | 1,000 .00 | 1,021 .48 | 3 .78 | |||||||||
| ||||||||||||
Class Y | 1,000 .00 | 1,024 .05 | 1 .17 | |||||||||
Expenses are equal to the Fund’s annualized expense ratio for that class, multiplied by the average account value over the period, multiplied by 184/365 (to reflect the one-half year period). Those annualized expense ratios, excluding indirect expenses from affiliated funds, based on the 6-month period ended January 31, 2014 are as follows:
| Class | Expense Ratios | |||
| ||||
Class A | 0 .49% | |||
| ||||
Class B | 1 .25 | |||
| ||||
Class C | 1 .25 | |||
| ||||
Class N | 0 .74 | |||
| ||||
Class Y | 0 .23 | |||
The expense ratios reflect voluntary and/or contractual waivers and/or reimbursements of expenses by the Fund’s Transfer Agent. Some of these undertakings may be modified or terminated at any time, as indicated in the Fund’s prospectus. The “Financial Highlights” tables in the Fund’s financial statements, included in this report, also show the gross expense ratios, without such waivers or reimbursements and reduction to custodian expenses, if applicable.
10 OPPENHEIMER PORTFOLIO SERIES EQUITY INVESTOR FUND
| STATEMENTOF INVESTMENTS January 31, 2014 | ||
| Shares | Value | |||||||
Investment Companies—100.1%1 | ||||||||
Domestic Equity Funds—46.3% | ||||||||
Oppenheimer Capital Appreciation Fund, Cl. I | 2,385,074 | $ | 145,274,829 | |||||
Oppenheimer Main Street Small- & Mid-Cap Fund, Cl. I | 1,797,428 | 56,600,995 | ||||||
Oppenheimer Value Fund, Cl. I | 5,744,933 | 166,603,045 | ||||||
| 368,478,869 | ||||||||
Foreign Equity Funds—53.8% | ||||||||
Oppenheimer Developing Markets Fund, Cl. I | 1,656,290 | 57,357,318 | ||||||
Oppenheimer International Growth Fund, Cl. I | 4,746,721 | 171,261,676 | ||||||
Oppenheimer International Small Company Fund, Cl. I | 1,573,011 | 50,320,631 | ||||||
Oppenheimer International Value Fund, Cl. I | 8,100,656 | 149,538,104 | ||||||
|
| |||||||
|
| 428,477,729
|
| ||||||
Total Investments, at Value (Cost $544,506,669) | 100.1% | 796,956,598 | ||||||
Liabilities in Excess of Other Assets | (0.1) | (560,553) | ||||||
|
| |||||||
Net Assets | 100.0% | $ | 796,396,045 | |||||
|
| |||||||
Footnotes to Statement of Investments
1. Is or was an affiliate, as defined in the Investment Company Act of 1940, at or during the period ended January 31, 2014, by virtue of the Fund owning at least 5% of the voting securities of the issuer or as a result of the Fund and the issuer having the same investment adviser. Transactions during the period in which the issuer was an affiliate are as follows:
|
| Shares January 31, 2013 |
|
| Gross Additions |
|
| Gross Reductions |
|
| Shares January 31, 2014 |
| |||||
Oppenheimer Capital Appreciation Fund, Cl. I | — | 2,474,614 | a | 89,540 | 2,385,074 | |||||||||||
Oppenheimer Capital Appreciation Fund, Cl. Y | 2,293,019 | 42,443 | 2,335,462 | a | — | |||||||||||
Oppenheimer Developing Markets Fund, Cl. I | — | 1,740,956 | a | 84,666 | 1,656,290 | |||||||||||
Oppenheimer Developing Markets Fund, Cl. Y | 1,650,477 | 22,947 | 1,673,424 | a | — | |||||||||||
Oppenheimer International Growth Fund, Cl. I | — | 4,959,280 | a | 212,559 | 4,746,721 | |||||||||||
Oppenheimer International Growth Fund, Cl. Y | 4,724,026 | 61,950 | 4,785,976 | a | — | |||||||||||
Oppenheimer International Small Company Fund, Cl. I | — | 1,628,227 | a | 55,216 | 1,573,011 | |||||||||||
Oppenheimer International Small Company Fund, Cl. Y | 1,565,929 | 28,424 | 1,594,353 | a | — | |||||||||||
Oppenheimer International Value Fund, Cl. I | — | 8,452,430 | a | 351,774 | 8,100,656 | |||||||||||
Oppenheimer International Value Fund, Cl. Y | 7,974,070 | 103,051 | 8,077,121 | a | — | |||||||||||
Oppenheimer Main Street Small- & Mid-Cap Fund, Cl. I | — | 1,875,150 | a | 77,722 | 1,797,428 | |||||||||||
Oppenheimer Main Street Small- & Mid-Cap Fund, Cl. Y | 1,797,170 | 23,350 | 1,820,520 | a | — | |||||||||||
Oppenheimer Value Fund, Cl. I | — | 5,953,186 | a | 208,253 | 5,744,933 | |||||||||||
Oppenheimer Value Fund, Cl. Y | 5,680,068 | 100,416 | 5,780,484 | a | — |
11 OPPENHEIMER PORTFOLIO SERIES EQUITY INVESTOR FUND
| STATEMENT OF INVESTMENTS (Continued) | ||
Footnotes to Statement of Investments Continued
| Value | Income | Realized Gain (Loss) | ||||||||||
| ||||||||||||
Oppenheimer Capital Appreciation Fund, Cl. I | $ | 145,274,829 | $ | 652,190 | $ | 169,648 | ||||||
Oppenheimer Capital Appreciation Fund, Cl. Y | — | — | 139,531 | |||||||||
Oppenheimer Developing Markets Fund, Cl. I | 57,357,318 | 347,934 | (41,752) | |||||||||
Oppenheimer Developing Markets Fund, Cl. Y | — | — | (10,531) | |||||||||
Oppenheimer International Growth Fund, Cl. I | 171,261,676 | 1,955,926 | 560,023 | |||||||||
Oppenheimer International Growth Fund, Cl. Y | — | — | 205,049 | |||||||||
Oppenheimer International Small Company Fund, Cl. I | 50,320,631 | 517,700 | 67,796 | |||||||||
Oppenheimer International Small Company Fund, Cl. Y | — | — | 25,908 | |||||||||
Oppenheimer International Value Fund, Cl. I | 149,538,104 | 3,314,624 | 196,078 | |||||||||
Oppenheimer International Value Fund, Cl. Y | — | — | 31,534 | |||||||||
Oppenheimer Main Street Small- & Mid-Cap Fund, Cl. I | 56,600,995 | 280,627 | 158,977 | |||||||||
Oppenheimer Main Street Small- & Mid-Cap Fund, Cl. Y | — | — | 48,841 | |||||||||
Oppenheimer Value Fund, Cl. I | 166,603,045 | 2,754,210 | 254,744 | |||||||||
Oppenheimer Value Fund, Cl. Y | — | — | 149,743 | |||||||||
|
| |||||||||||
Total | $ | 796,956,598 | $ | 9,823,211 | $ | 1,955,589 | ||||||
|
| |||||||||||
a. The Fund elected to invest in Class I shares of the Underlying Funds as they became available to investors.
See accompanying Notes to Financial Statements.
12 OPPENHEIMER PORTFOLIO SERIES EQUITY INVESTOR FUND
ASSETS AND LIABILITIES January 31, 2014 | ||||
| ||||
Assets | ||||
Investments, at value—see accompanying statement of investments—affiliated companies (cost $544,506,669) | $ | 796,956,598 | ||
Cash | 16,241 | |||
| ||||
Receivables and other assets: | ||||
Shares of beneficial interest sold | 681,695 | |||
Other | 38,846 | |||
|
| |||
Total assets | 797,693,380 | |||
| ||||
Liabilities | ||||
Payables and other liabilities: | ||||
Shares of beneficial interest redeemed | 796,783 | |||
Distribution and service plan fees | 181,359 | |||
Transfer and shareholder servicing agent fees | 158,745 | |||
Investments purchased | 68,928 | |||
Trustees’ compensation | 55,008 | |||
Shareholder communications | 13,428 | |||
Other | 23,084 | |||
|
| |||
Total liabilities | 1,297,335 | |||
| ||||
Net Assets | $ | 796,396,045 | ||
|
| |||
| ||||
Composition of Net Assets | ||||
Par value of shares of beneficial interest | $ | 56,194 | ||
| ||||
Additional paid-in capital | 640,058,263 | |||
| ||||
Accumulated net investment income | 4,436,638 | |||
| ||||
Accumulated net realized loss on investments | (100,604,979) | |||
| ||||
Net unrealized appreciation on investments | 252,449,929 | |||
|
| |||
Net Assets | $ | 796,396,045 | ||
|
| |||
13 OPPENHEIMER PORTFOLIO SERIES EQUITY INVESTOR FUND
STATEMENTOF ASSETS AND LIABILITIES Continued | ||||
| ||||
Net Asset Value Per Share | ||||
Class A Shares: | ||||
| Net asset value and redemption price per share (based on net assets of $482,284,676 and 33,782,003 shares of beneficial interest outstanding) | $ | 14.28 | ||
Maximum offering price per share (net asset value plus sales charge of 5.75% of offering price) | $ | 15.15 | ||
| ||||
Class B Shares: | ||||
| Net asset value, redemption price (excludes applicable contingent deferred sales charge) and offering price per share (based on net assets of $63,602,169 and 4,565,007 shares of beneficial interest outstanding) | $ | 13.93 | ||
| ||||
Class C Shares: | ||||
| Net asset value, redemption price (excludes applicable contingent deferred sales charge) and offering price per share (based on net assets of $177,813,512 and 12,755,759 shares of beneficial interest outstanding) | $ | 13.94 | ||
| ||||
Class N Shares: | ||||
| Net asset value, redemption price (excludes applicable contingent deferred sales charge) and offering price per share (based on net assets of $52,432,762 and 3,678,424 shares of beneficial interest outstanding) | $ | 14.25 | ||
| ||||
Class Y Shares: | ||||
| Net asset value, redemption price and offering price per share (based on net assets of $20,262,926 and 1,413,077 shares of beneficial interest outstanding) | $ | 14.34 | ||
| ||||
See accompanying Notes to Financial Statements.
14 OPPENHEIMER PORTFOLIO SERIES EQUITY INVESTOR FUND
OPERATIONS For the Year Ended January 31, 2014 | ||
| ||||||
Investment Income | ||||||
Dividends affiliated companies | $ | 9,823,211 | ||||
| ||||||
Interest | 331 | |||||
| ||||||
Other income | 14,722 | |||||
|
| |||||
Total investment income | 9,838,264 | |||||
| ||||||
Expenses | ||||||
| ||||||
Distribution and service plan fees: | ||||||
Class A | 1,095,803 | |||||
Class B | 684,881 | |||||
Class C | 1,645,678 | |||||
Class N | 275,131 | |||||
| ||||||
Transfer and shareholder servicing agent fees: | ||||||
Class A | 919,608 | |||||
Class B | 152,368 | |||||
Class C | 333,405 | |||||
Class N | 107,172 | |||||
Class Y | 31,035 | |||||
| ||||||
Shareholder communications: | ||||||
Class A | 67,036 | |||||
Class B | 9,699 | |||||
Class C | 21,040 | |||||
Class N | 3,527 | |||||
Class Y | 335 | |||||
| ||||||
Trustees’ compensation | 15,353 | |||||
| ||||||
Custodian fees and expenses | 7,729 | |||||
| ||||||
Other | 43,062 | |||||
|
| |||||
Total expenses | 5,412,862 | |||||
Less waivers and reimbursements of expenses | (78,882) | |||||
|
| |||||
Net expenses | 5,333,980 | |||||
| ||||||
Net Investment Income | 4,504,284 | |||||
| ||||||
Realized and Unrealized Gain | ||||||
Net realized gain on: | ||||||
Investments from affiliated companies | 1,955,589 | |||||
Distributions received from affiliated companies | 6,093,924 | |||||
|
| |||||
Net realized gain | 8,049,513 | |||||
| ||||||
Net change in unrealized appreciation/depreciation on investments | 100,455,225 | |||||
| ||||||
Net Increase in Net Assets Resulting from Operations | $ | 113,009,022 | ||||
|
| |||||
See accompanying Notes to Financial Statements.
15 OPPENHEIMER PORTFOLIO SERIES EQUITY INVESTOR FUND
| STATEMENTSOF CHANGES IN NET ASSETS | ||
| Year Ended | Year Ended | |||||||
| January 31, 2014 | January 31, 2013 | |||||||
| ||||||||
Operations | ||||||||
Net investment income | $ | 4,504,284 | $ | 4,340,220 | ||||
| ||||||||
Net realized gain | 8,049,513 | 4,221,364 | ||||||
| ||||||||
Net change in unrealized appreciation/depreciation | 100,455,225 | 89,053,974 | ||||||
|
|
|
| |||||
Net increase in net assets resulting from operations | 113,009,022 | 97,615,558 | ||||||
| ||||||||
Dividends and/or Distributions to Shareholders | ||||||||
Dividends from net investment income: | ||||||||
Class A | (3,674,760) | (2,882,680) | ||||||
Class B | — | — | ||||||
Class C | (215,015) | (134,255) | ||||||
Class N | (260,098) | (249,307) | ||||||
Class Y | (202,072) | (167,715) | ||||||
|
| |||||||
| (4,351,945) | (3,433,957) | |||||||
| ||||||||
Beneficial Interest Transactions | ||||||||
Net increase (decrease) in net assets resulting from beneficial interest transactions: | ||||||||
Class A | 29,452,453 | 1,137,682 | ||||||
Class B | (19,505,677) | (19,776,586) | ||||||
Class C | 3,273,823 | (6,120,335) | ||||||
Class N | (9,557,126) | (14,143,294) | ||||||
Class Y | 1,970,876 | (103,222) | ||||||
|
|
|
| |||||
| 5,634,349 | (39,005,755) | |||||||
| ||||||||
Net Assets | ||||||||
Total increase | 114,291,426 | 55,175,846 | ||||||
| ||||||||
Beginning of period | 682,104,619 | 626,928,773 | ||||||
|
|
|
| |||||
End of period (including accumulated net investment income of $4,436,638 and $4,284,299, respectively) | $ | 796,396,045 | $ | 682,104,619 | ||||
|
| |||||||
See accompanying Notes to Financial Statements.
16 OPPENHEIMER PORTFOLIO SERIES EQUITY INVESTOR FUND
| FINANCIAL HIGHLIGHTS | ||
| Class A | Year Ended January 31, 2014 | Year Ended January 31, 2013 | Year Ended January 31, 2012 | Year Ended January 31, 2011 | Year Ended January 31, 2010 | |||||||||||||||
| ||||||||||||||||||||
Per Share Operating Data | ||||||||||||||||||||
Net asset value, beginning of period | $ | 12.30 | $ | 10.62 | $ | 11.17 | $ | 9.12 | $ | 6.46 | ||||||||||
| ||||||||||||||||||||
Income (loss) from investment operations: | ||||||||||||||||||||
Net investment income1 | 0.12 | 0.11 | 0.09 | 0.08 | 0.04 | |||||||||||||||
Net realized and unrealized gain (loss) | 1.97 | 1.66 | (0.56) | 2.00 | 2.84 | |||||||||||||||
|
| |||||||||||||||||||
Total from investment operations | 2.09 | 1.77 | (0.47) | 2.08 | 2.88 | |||||||||||||||
| ||||||||||||||||||||
Dividends and/or distributions to shareholders: | ||||||||||||||||||||
Dividends from net investment income | (0.11) | (0.09) | (0.08) | (0.03) | (0.05) | |||||||||||||||
Distributions from net realized gain | 0.00 | 0.00 | 0.00 | 0.00 | (0.17) | |||||||||||||||
|
| |||||||||||||||||||
Total dividends and/or distributions to shareholders | (0.11) | (0.09) | (0.08) | (0.03) | (0.22) | |||||||||||||||
| ||||||||||||||||||||
Net asset value, end of period | $ | 14.28 | $ | 12.30 | $ | 10.62 | $ | 11.17 | $ | 9.12 | ||||||||||
|
| |||||||||||||||||||
| ||||||||||||||||||||
Total Return, at Net Asset Value2 | 16.95% | 16.73% | (4.19)% | 22.76% | 44.42% | |||||||||||||||
| ||||||||||||||||||||
Ratios/Supplemental Data | ||||||||||||||||||||
Net assets, end of period (in thousands) | $ | 482,285 | $ | 388,790 | $ | 335,138 | $ | 352,321 | $ | 286,580 | ||||||||||
| ||||||||||||||||||||
Average net assets (in thousands) | $ | 442,886 | $ | 350,996 | $ | 343,680 | $ | 314,559 | $ | 244,278 | ||||||||||
| ||||||||||||||||||||
Ratios to average net assets:3 | ||||||||||||||||||||
Net investment income | 0.88% | 0.99% | 0.82% | 0.76% | 0.52% | |||||||||||||||
Total expenses4 | 0.48% | 0.47% | 0.48% | 0.51% | 0.58% | |||||||||||||||
| Expenses after payments, waivers and/or reimbursements and reduction to custodian expenses | 0.47% | 0.47% | 0.48% | 0.51% | 0.58% | |||||||||||||||
| ||||||||||||||||||||
Portfolio turnover rate | 6% | 17% | 5% | 54% | 11% | |||||||||||||||
1. Per share amounts calculated based on the average shares outstanding during the period.
2. Assumes an initial investment on the business day before the first day of the fiscal period, with all dividends and distributions reinvested in additional shares on the reinvestment date, and redemption at the net asset value calculated on the last business day of the fiscal period. Sales charges are not reflected in the total returns. Total returns are not annualized for periods less than one full year. Returns do not reflect the deduction of taxes that a shareholder would pay on fund distributions or the redemption of fund shares.
3. Annualized for periods less than one full year.
4. Total expenses including indirect expenses from affiliated fund were as follows:
Year Ended January 31, 2014 | 1.23 | % | ||||
Year Ended January 31, 2013 | 1.22 | % | ||||
Year Ended January 31, 2012 | 1.25 | % | ||||
Year Ended January 31, 2011 | 1.26 | % | ||||
Year Ended January 31, 2010 | 1.30 | % |
See accompanying Notes to Financial Statements.
17 OPPENHEIMER PORTFOLIO SERIES EQUITY INVESTOR FUND
| FINANCIAL HIGHLIGHTS Continued | ||
| Class B | Year Ended January 31, 2014 | Year Ended January 31, 2013 | Year Ended January 31, 2012 | Year Ended January 31, 2011 | Year Ended January 31, 2010 | |||||||||||||||
| ||||||||||||||||||||
Per Share Operating Data | ||||||||||||||||||||
Net asset value, beginning of period | $ 12.01 | $ 10.37 | $ 10.91 | $ 8.97 | $ 6.38 | |||||||||||||||
| ||||||||||||||||||||
Income (loss) from investment operations: | ||||||||||||||||||||
Net investment loss1 | (0.02) | 0.002 | (0.01) | (0.01) | (0.03) | |||||||||||||||
Net realized and unrealized gain (loss) | 1.94 | 1.64 | (0.53) | 1.95 | 2.79 | |||||||||||||||
|
| |||||||||||||||||||
Total from investment operations | 1.92 | 1.64 | (0.54) | 1.94 | 2.76 | |||||||||||||||
| ||||||||||||||||||||
Dividends and/or distributions to shareholders: | ||||||||||||||||||||
Dividends from net investment income | 0.00 | 0.00 | 0.00 | 0.00 | 0.00 | |||||||||||||||
Distributions from net realized gain | 0.00 | 0.00 | 0.00 | 0.00 | (0.17) | |||||||||||||||
|
| |||||||||||||||||||
Total dividends and/or distributions to shareholders | 0.00 | 0.00 | 0.00 | 0.00 | (0.17) | |||||||||||||||
Net asset value, end of period | $ 13.93 | $ 12.01 | $ 10.37 | $ 10.91 | $ 8.97 | |||||||||||||||
|
| |||||||||||||||||||
| ||||||||||||||||||||
Total Return, at Net Asset Value3 | 15.99% | 15.82% | (4.95)% | 21.63% | 43.19% | |||||||||||||||
| ||||||||||||||||||||
Ratios/Supplemental Data | ||||||||||||||||||||
Net assets, end of period (in thousands) | $ 63,602 | $ 72,843 | $ 81,718 | $ 92,953 | $76,495 | |||||||||||||||
| ||||||||||||||||||||
Average net assets (in thousands) | $ 68,259 | $ 75,680 | $ 87,253 | $ 83,498 | $66,935 | |||||||||||||||
| ||||||||||||||||||||
Ratios to average net assets:4 | ||||||||||||||||||||
Net investment income (loss) | (0.12)% | 0.03% | (0.06)% | (0.08)% | (0.33)% | |||||||||||||||
Total expenses5 | 1.25% | 1.30% | 1.32% | 1.35% | 1.45% | |||||||||||||||
| Expenses after payments, waivers and/or reimbursements and reduction to custodian expenses | 1.24% | 1.30% | 1.32% | 1.35% | 1.41% | |||||||||||||||
| ||||||||||||||||||||
Portfolio turnover rate | 6% | 17% | 5% | 54% | 11% | |||||||||||||||
1. Per share amounts calculated based on the average shares outstanding during the period.
2. Less than $0.005 per share.
3. Assumes an initial investment on the business day before the first day of the fiscal period, with all dividends and distributions reinvested in additional shares on the reinvestment date, and redemption at the net asset value calculated on the last business day of the fiscal period. Sales charges are not reflected in the total returns. Total returns are not annualized for periods less than one full year. Returns do not reflect the deduction of taxes that a shareholder would pay on fund distributions or the redemption of fund shares.
4. Annualized for periods less than one full year.
5. Total expenses including indirect expenses from affiliated fund were as follows:
Year Ended January 31, 2014 | 2.00 | % | ||||
Year Ended January 31, 2013 | 2.05 | % | ||||
Year Ended January 31, 2012 | 2.09 | % | ||||
Year Ended January 31, 2011 | 2.10 | % | ||||
Year Ended January 31, 2010 | 2.17 | % |
See accompanying Notes to Financial Statements.
18 OPPENHEIMER PORTFOLIO SERIES EQUITY INVESTOR FUND
| FINANCIAL HIGHLIGHTS Continued | ||
| Class C | Year Ended January 31, 2014 | Year Ended January 31, 2013 | Year Ended January 31, 2012 | Year Ended January 31, 2011 | Year Ended January 31, 2010 | |||||||||||||||
| ||||||||||||||||||||
Per Share Operating Data | ||||||||||||||||||||
Net asset value, beginning of period | $ | 12.02 | $ | 10.38 | $ | 10.92 | $ | 8.97 | $ | 6.37 | ||||||||||
| ||||||||||||||||||||
Income (loss) from investment operations: | ||||||||||||||||||||
Net investment income (loss)1 | 0.02 | 0.02 | 0.01 | 0.002 | (0.02) | |||||||||||||||
Net realized and unrealized gain (loss) | 1.92 | 1.63 | (0.55) | 1.95 | 2.79 | |||||||||||||||
|
| |||||||||||||||||||
Total from investment operations | 1.94 | 1.65 | (0.54) | 1.95 | 2.77 | |||||||||||||||
| ||||||||||||||||||||
Dividends and/or distributions to shareholders: | ||||||||||||||||||||
Dividends from net investment income | (0.02) | (0.01) | 0.00 | 0.00 | 0.00 | |||||||||||||||
Distributions from net realized gain | 0.00 | 0.00 | 0.00 | 0.00 | (0.17) | |||||||||||||||
|
| |||||||||||||||||||
| Total dividends and/or distributions to shareholders | (0.02) | (0.01) | 0.00 | 0.00 | (0.17) | |||||||||||||||
| ||||||||||||||||||||
Net asset value, end of period | $ | 13.94 | $ | 12.02 | $ | 10.38 | $ | 10.92 | $ | 8.97 | ||||||||||
|
| |||||||||||||||||||
| ||||||||||||||||||||
Total Return, at Net Asset Value3 | 16.11% | 15.91% | (4.95)% | 21.74% | 43.41% | |||||||||||||||
| ||||||||||||||||||||
Ratios/Supplemental Data | ||||||||||||||||||||
Net assets, end of period (in thousands) | $ | 177,813 | $ | 150,848 | $ | 136,229 | $ | 144,759 | $ | 118,730 | ||||||||||
| ||||||||||||||||||||
Average net assets (in thousands) | $ | 164,340 | $ | 139,727 | $ | 140,831 | $ | 129,727 | $ | 102,982 | ||||||||||
| ||||||||||||||||||||
Ratios to average net assets:4 | ||||||||||||||||||||
Net investment income (loss) | 0.12% | 0.22% | 0.08% | 0.00%5 | (0.26)% | |||||||||||||||
Total expenses6 | 1.23% | 1.21% | 1.23% | 1.26% | 1.35% | |||||||||||||||
| Expenses after payments, waivers and/or reimbursements and reduction to custodian expenses | 1.22% | 1.21% | 1.23% | 1.26% | 1.34% | |||||||||||||||
| ||||||||||||||||||||
Portfolio turnover rate | 6% | 17% | 5% | 54% | 11% | |||||||||||||||
1. Per share amounts calculated based on the average shares outstanding during the period.
2. Less than $0.005 per share.
3. Assumes an initial investment on the business day before the first day of the fiscal period, with all dividends and distributions reinvested in additional shares on the reinvestment date, and redemption at the net asset value calculated on the last business day of the fiscal period. Sales charges are not reflected in the total returns. Total returns are not annualized for periods less than one full year. Returns do not reflect the deduction of taxes that a shareholder would pay on fund distributions or the redemption of fund shares.
4. Annualized for periods less than one full year.
5. Less than 0.005%.
6. Total expenses including indirect expenses from affiliated fund were as follows:
Year Ended January 31, 2014 | 1.98 | % | ||||
Year Ended January 31, 2013 | 1.96 | % | ||||
Year Ended January 31, 2012 | 2.00 | % | ||||
Year Ended January 31, 2011 | 2.01 | % | ||||
Year Ended January 31, 2010 | 2.07 | % |
See accompanying Notes to Financial Statements.
19 OPPENHEIMER PORTFOLIO SERIES EQUITY INVESTOR FUND
| FINANCIAL HIGHLIGHTS Continued | ||
| Class N | Year Ended January 31, | Year Ended January 31, | Year Ended January 31, | Year Ended January 31, | Year Ended January 31, | |||||||||||||||
| ||||||||||||||||||||
Per Share Operating Data | ||||||||||||||||||||
Net asset value, beginning of period | $ | 12.27 | $ | 10.59 | $ | 11.13 | $ | 9.09 | $ | 6.44 | ||||||||||
| ||||||||||||||||||||
Income (loss) from investment operations: | ||||||||||||||||||||
Net investment income1 | 0.06 | 0.07 | 0.06 | 0.06 | 0.03 | |||||||||||||||
Net realized and unrealized gain (loss) | 1.99 | 1.67 | (0.55) | 1.99 | 2.82 | |||||||||||||||
|
| |||||||||||||||||||
Total from investment operations | 2.05 | 1.74 | (0.49) | 2.05 | 2.85 | |||||||||||||||
| ||||||||||||||||||||
Dividends and/or distributions to shareholders: | ||||||||||||||||||||
Dividends from net investment income | (0.07) | (0.06) | (0.05) | (0.01) | (0.03) | |||||||||||||||
Distributions from net realized gain | 0.00 | 0.00 | 0.00 | 0.00 | (0.17) | |||||||||||||||
|
| |||||||||||||||||||
| Total dividends and/or distributions to shareholders | (0.07) | (0.06) | (0.05) | (0.01) | (0.20) | |||||||||||||||
| ||||||||||||||||||||
Net asset value, end of period | $ | 14.25 | $ | 12.27 | $ | 10.59 | $ | 11.13 | $ | 9.09 | ||||||||||
|
| |||||||||||||||||||
| ||||||||||||||||||||
Total Return, at Net Asset Value2 | 16.68% | 16.43% | (4.36)% | 22.52% | 44.18% | |||||||||||||||
| ||||||||||||||||||||
Ratios/Supplemental Data | ||||||||||||||||||||
Net assets, end of period (in thousands) | $ | 52,433 | $ | 53,846 | $ | 60,029 | $ | 75,333 | $ | 61,344 | ||||||||||
| ||||||||||||||||||||
Average net assets (in thousands) | $ | 54,751 | $ | 55,283 | $ | 66,834 | $ | 68,038 | $ | 52,200 | ||||||||||
| ||||||||||||||||||||
Ratios to average net assets:3 | ||||||||||||||||||||
Net investment income | 0.46% | 0.62% | 0.58% | 0.57% | 0.31% | |||||||||||||||
Total expenses4 | 0.71% | 0.69% | 0.68% | 0.70% | 0.76% | |||||||||||||||
| Expenses after payments, waivers and/or reimbursements and reduction to custodian expenses | 0.70% | 0.69% | 0.68% | 0.70% | 0.76% | |||||||||||||||
| ||||||||||||||||||||
Portfolio turnover rate | 6% | 17% | 5% | 54% | 11% | |||||||||||||||
1. Per share amounts calculated based on the average shares outstanding during the period.
2. Assumes an initial investment on the business day before the first day of the fiscal period, with all dividends and distributions reinvested in additional shares on the reinvestment date, and redemption at the net asset value calculated on the last business day of the fiscal period. Sales charges are not reflected in the total returns. Total returns are not annualized for periods less than one full year. Returns do not reflect the deduction of taxes that a shareholder would pay on fund distributions or the redemption of fund shares.
3. Annualized for periods less than one full year.
4. Total expenses including indirect expenses from affiliated fund were as follows:
Year Ended January 31, 2014 | 1.46 | % | ||||
Year Ended January 31, 2013 | 1.44 | % | ||||
Year Ended January 31, 2012 | 1.45 | % | ||||
Year Ended January 31, 2011 | 1.45 | % | ||||
Year Ended January 31, 2010 | 1.48 | % |
See accompanying Notes to Financial Statements.
20 OPPENHEIMER PORTFOLIO SERIES EQUITY INVESTOR FUND
| FINANCIAL HIGHLIGHTS Continued | ||
| Class Y | Year Ended January 31, 2014 | Year Ended January 31, 2013 | Year Ended January 31, 2012 | Year Ended January 31, 2011 | Year Ended January 31, 2010 | |||||||||||||||
| ||||||||||||||||||||
Per Share Operating Data | ||||||||||||||||||||
Net asset value, beginning of period | $ | 12.35 | $ | 10.66 | $ | 11.21 | $ | 9.15 | $ | 6.48 | ||||||||||
| ||||||||||||||||||||
Income (loss) from investment operations: | ||||||||||||||||||||
Net investment income1 | 0.16 | 0.15 | 0.13 | 0.19 | 0.10 | |||||||||||||||
Net realized and unrealized gain (loss) | 1.98 | 1.68 | (0.56) | 1.94 | 2.83 | |||||||||||||||
|
| |||||||||||||||||||
Total from investment operations | 2.14 | 1.83 | (0.43) | 2.13 | 2.93 | |||||||||||||||
| ||||||||||||||||||||
Dividends and/or distributions to shareholders: | ||||||||||||||||||||
Dividends from net investment income | (0.15) | (0.14) | (0.12) | (0.07) | (0.09) | |||||||||||||||
Distributions from net realized gain | 0.00 | 0.00 | 0.00 | 0.00 | (0.17) | |||||||||||||||
|
| |||||||||||||||||||
Total dividends and/or distributions to shareholders | (0.15) | (0.14) | (0.12) | (0.07) | (0.26) | |||||||||||||||
| ||||||||||||||||||||
Net asset value, end of period | $ | 14.34 | $ | 12.35 | $ | 10.66 | $ | 11.21 | $ | 9.15 | ||||||||||
|
| |||||||||||||||||||
| ||||||||||||||||||||
Total Return, at Net Asset Value2 | 17.27% | 17.20% | (3.81)% | 23.31% | 45.03% | |||||||||||||||
| ||||||||||||||||||||
Ratios/Supplemental Data | ||||||||||||||||||||
Net assets, end of period (in thousands) | $ | 20,263 | $ | 15,778 | $ | 13,815 | $ | 14,579 | $ | 4,495 | ||||||||||
| ||||||||||||||||||||
Average net assets (in thousands) | $ | 17,842 | $ | 14,008 | $ | 14,243 | $ | 8,034 | $ | 3,087 | ||||||||||
| ||||||||||||||||||||
Ratios to average net assets:3 | ||||||||||||||||||||
Net investment income | 1.21% | 1.35% | 1.21% | 1.91% | 1.23% | |||||||||||||||
Total expenses4 | 0.18% | 0.08% | 0.12% | 0.07% | 0.07% | |||||||||||||||
| Expenses after payments, waivers and/or reimbursements and reduction to custodian expenses | 0.17% | 0.08% | 0.12% | 0.07% | 0.07% | |||||||||||||||
| ||||||||||||||||||||
Portfolio turnover rate | 6% | 17% | 5% | 54% | 11% | |||||||||||||||
1. Per share amounts calculated based on the average shares outstanding during the period.
2. Assumes an initial investment on the business day before the first day of the fiscal period, with all dividends and distributions reinvested in additional shares on the reinvestment date, and redemption at the net asset value calculated on the last business day of the fiscal period. Sales charges are not reflected in the total returns. Total returns are not annualized for periods less than one full year. Returns do not reflect the deduction of taxes that a shareholder would pay on fund distributions or the redemption of fund shares.
3. Annualized for periods less than one full year.
4 Total expenses including indirect expenses from affiliated fund were as follows:
Year Ended January 31, 2014 | 0.93 | % | ||||
Year Ended January 31, 2013 | 0.83 | % | ||||
Year Ended January 31, 2012 | 0.89 | % | ||||
Year Ended January 31, 2011 | 0.82 | % | ||||
Year Ended January 31, 2010 | 0.79 | % |
See accompanying Notes to Financial Statements.
21 OPPENHEIMER PORTFOLIO SERIES EQUITY INVESTOR FUND
| NOTES TO FINANCIAL STATEMENTS January 31, 2014 | ||
1. Significant Accounting Policies
Oppenheimer Portfolio Series (the “Trust”) is registered under the Investment Company Act of 1940, as amended, as a diversified open-end management investment company. Equity Investor Fund (the “Fund”) is a series of the Trust whose investment objective is to seek long-term growth of capital. The Fund normally invests in a diversified portfolio of Oppenheimer mutual funds (individually, an “Underlying Fund” and collectively, the “Underlying Funds”). The Fund’s investment adviser is OFI Global Asset Management, Inc. (“OFI Global” or the “Manager”), a wholly-owned subsidiary of OppenheimerFunds, Inc. (“OFI” or the “Sub-Adviser”). The Manager has entered into a sub-advisory agreement with OFI.
The Fund offers Class A, Class C, Class N and Class Y shares, and previously offered Class B shares for new purchase through June 29, 2012. Subsequent to that date, no new purchases of Class B shares are permitted, however reinvestment of dividend and/or capital gain distributions and exchanges of Class B shares into and from other Oppenheimer funds will be allowed. Class A shares are sold at their offering price, which is normally net asset value plus a front-end sales charge. Class C and Class N shares are sold, and Class B shares were sold, without a front-end sales charge but may be subject to a contingent deferred sales charge (“CDSC”). Class N shares are sold only through retirement plans. Retirement plans that offer Class N shares may impose charges on those accounts. Class Y shares are sold to certain institutional investors or intermediaries without either a front-end sales charge or a CDSC, however, the intermediaries may impose charges on their accountholders who beneficially own Class Y shares. All classes of shares have identical rights and voting privileges with respect to the Fund in general and exclusive voting rights on matters that affect that class alone. Earnings, net assets and net asset value per share may differ due to each class having its own expenses, such as transfer and shareholder servicing agent fees and shareholder communications, directly attributable to that class. Class A, B, C and N shares have separate distribution and/or service plans under which they pay fees. Class Y shares do not pay such fees. Class B shares will automatically convert to Class A shares 72 months after the date of purchase.
The following is a summary of significant accounting policies consistently followed by the Fund.
Risks of Investing in the Underlying Funds. Each of the Underlying Funds in which the Fund invests has its own investment risks, and those risks can affect the value of the Fund’s investments and therefore the value of the Fund’s shares. To the extent that the Fund invests more of its assets in one Underlying Fund than in another, the Fund will have greater exposure to the risks of that Underlying Fund.
Allocation of Income, Expenses, Gains and Losses. Income, expenses (other than those attributable to a specific class), gains and losses are allocated on a daily basis to each class of shares based upon the relative proportion of net assets represented by such class. Operating expenses directly attributable to a specific class are charged against the operations of that class.
22 OPPENHEIMER PORTFOLIO SERIES EQUITY INVESTOR FUND
| NOTES TO FINANCIAL STATEMENTS Continued | ||
1. Significant Accounting Policies (Continued)
Federal Taxes. The Fund intends to comply with provisions of the Internal Revenue Code applicable to regulated investment companies and to distribute substantially all of its investment company taxable income, including any net realized gain on investments not offset by capital loss carryforwards, if any, to shareholders. Therefore, no federal income or excise tax provision is required. The Fund files income tax returns in U.S. federal and applicable state jurisdictions. The statute of limitations on the Fund’s tax return filings generally remain open for the three preceding fiscal reporting period ends.
The tax components of capital shown in the following table represent distribution requirements the Fund must satisfy under the income tax regulations, losses the Fund may be able to offset against income and gains realized in future years and unrealized appreciation or depreciation of securities and other investments for federal income tax purposes.
Undistributed Net Investment Income | Undistributed Long-Term Gain | Accumulated Loss Carryforward1,2,3 | Net Unrealized Appreciation Based on cost of Securities and Other Investments for Federal Income Tax Purposes | |||||||||
| ||||||||||||
$4,522,211 | $— | $81,211,779 | $233,056,729 | |||||||||
1. As of January 31, 2014, the Fund had $81,211,779 of net capital loss carryforwards available to offset future realized capital gains, if any, and thereby reduce future taxable gain distributions. Details of the capital loss carryforwards are included in the table below. Capital loss carryovers with no expiration, if any, must be utilized prior to those with expiration dates.
| Expiring | ||||
| ||||
2018 | $ | 4,798,012 | ||
2019 | 76,413,767 | |||
|
| |||
Total | $ | 81,211,779 | ||
|
| |||
2. During the fiscal year ended January 31, 2014, the Fund utilized $7,941,916 of capital loss carryforward to offset capital gains realized in that fiscal year.
3. During the fiscal year ended January 31, 2013, the Fund utilized $3,441,641 of capital loss carryforward to offset capital gains realized in that fiscal year.
Net investment income (loss) and net realized gain (loss) may differ for financial statement and tax purposes. The character of dividends and distributions made during the fiscal year from net investment income or net realized gains may differ from their ultimate characterization for federal income tax purposes. Also, due to timing of dividends and distributions, the fiscal year in which amounts are distributed may differ from the fiscal year in which the income or net realized gain was recorded by the Fund.
The tax character of distributions paid during the years ended January 31, 2014 and January 31, 2013 was as follows:
23 OPPENHEIMER PORTFOLIO SERIES EQUITY INVESTOR FUND
| NOTES TO FINANCIAL STATEMENTS Continued | ||
1. Significant Accounting Policies (Continued)
| Year Ended | Year Ended | |||||||
| January 31, 2014 | January 31, 2013 | |||||||
| ||||||||
Distributions paid from: | ||||||||
Ordinary income | $ | 4,351,945 | $ | 3,433,957 | ||||
The aggregate cost of securities and other investments and the composition of unrealized appreciation and depreciation of securities and other investments for federal income tax purposes as of January 31, 2014 are noted in the following table. The primary difference between book and tax appreciation or depreciation of securities and other investments, if applicable, is attributable to the tax deferral of losses or tax realization of financial statement unrealized gain or loss.
Federal tax cost of securities | $ | 563,899,869 | ||
|
| |||
Gross unrealized appreciation | $ | 233,056,729 | ||
Gross unrealized depreciation | — | |||
|
| |||
Net unrealized appreciation | $ | 233,056,729 | ||
|
| |||
Trustees’ Compensation. The Fund has adopted an unfunded retirement plan (the “Plan”) for the Fund’s independent trustees. Benefits are based on years of service and fees paid to each trustee during their period of service. The Plan was frozen with respect to adding new participants effective December 31, 2006 (the “Freeze Date”) and existing Plan Participants as of the Freeze Date will continue to receive accrued benefits under the Plan. Active independent trustees as of the Freeze Date have each elected a distribution method with respect to their benefits under the Plan. During the year ended January 31, 2014, the Fund’s projected benefit obligations, payments to retired trustees and accumulated liability were as follows:
Projected Benefit Obligations Increased | $ | 2,184 | ||
Payments Made to Retired Trustees | 2,656 | |||
Accumulated Liability as of January 31, 2014 | 20,880 |
The Board of Trustees has adopted a compensation deferral plan for independent trustees that enables trustees to elect to defer receipt of all or a portion of the annual compensation they are entitled to receive from the Fund. For purposes of determining the amount owed to the Trustee under the plan, deferred amounts are treated as though equal dollar amounts had been invested in shares of the Fund or in other Oppenheimer funds selected by the Trustee. The Fund purchases shares of the funds selected for deferral by the Trustee in amounts equal to his or her deemed investment, resulting in a Fund asset equal to the deferred compensation liability. Such assets are included as a component of “Other” within the asset section of the Statement of Assets and Liabilities. Deferral of trustees’ fees under the plan will not affect the net assets of the Fund, and will not materially affect the Fund’s assets, liabilities or net investment income per share. Amounts will be deferred until distributed in accordance with the compensation deferral plan.
24 OPPENHEIMER PORTFOLIO SERIES EQUITY INVESTOR FUND
| NOTES TO FINANCIAL STATEMENTS Continued | ||
1. Significant Accounting Policies (Continued)
Dividends and Distributions to Shareholders. Dividends and distributions to shareholders, which are determined in accordance with income tax regulations and may differ from U.S. generally accepted accounting principles, are recorded on the ex-dividend date. Income and capital gain distributions, if any, are declared and paid annually or at other times as deemed necessary by the Manager.
Investment Income. Dividend distributions received from the Underlying Funds are recorded on the ex-dividend date. Upon receipt of notification from an Underlying Fund, and subsequent to the ex-dividend date, some of the dividend income originally recorded by the Fund may be reclassified as a tax return of capital by reducing the cost basis of the Underlying Fund and/or increasing the realized gain on sales of investments in the Underlying Fund.
Custodian Fees. “Custodian fees and expenses” in the Statement of Operations may include interest expense incurred by the Fund on any cash overdrafts of its custodian account during the period. Such cash overdrafts may result from the effects of failed trades in portfolio securities and from cash outflows resulting from unanticipated shareholder redemption activity. The Fund pays interest to its custodian on such cash overdraft at a rate equal to the 1 Month LIBOR Rate plus 2.00%. The “Reduction to custodian expenses” line item, if applicable, represents earnings on cash balances maintained by the Fund during the period. Such interest expense and other custodian fees may be paid with these earnings.
Security Transactions. Security transactions are recorded on the trade date. Realized gains and losses on securities sold are determined on the basis of identified cost.
Indemnifications. The Fund’s organizational documents provide current and former trustees and officers with a limited indemnification against liabilities arising in connection with the performance of their duties to the Fund. In the normal course of business, the Fund may also enter into contracts that provide general indemnifications. The Fund’s maximum exposure under these arrangements is unknown as this would be dependent on future claims that may be made against the Fund. The risk of material loss from such claims is considered remote.
Other. The preparation of financial statements in conformity with accounting principles generally accepted in the United States of America requires management to make estimates and assumptions that affect the reported amounts of assets and liabilities and disclosure of contingent assets and liabilities at the date of the financial statements and the reported amounts of increases and decreases in net assets from operations during the reporting period. Actual results could differ from those estimates.
2. Securities Valuation
The Fund calculates the net asset value of its shares based upon the net asset value of the applicable Underlying Fund. For each Underlying Fund, the net asset value per share for a class of shares is determined as of the close of the New York Stock Exchange (the
25 OPPENHEIMER PORTFOLIO SERIES EQUITY INVESTOR FUND
| NOTES TO FINANCIAL STATEMENTS Continued |
2. Securities Valuation (Continued) |
“Exchange”), normally 4:00 P.M. Eastern time, on each day the Exchange is open for trading by dividing the value of the Underlying Fund’s net assets attributable to that class by the number of outstanding shares of that class on that day.
The Fund’s Board has adopted procedures for the valuation of the Fund’s securities and has delegated the day-to-day responsibility for valuation determinations under those procedures to the Manager. The Manager has established a Valuation Committee which is responsible for determining a “fair valuation” for any security for which market quotations are not “readily available.” The Valuation Committee’s fair valuation determinations are subject to review, approval and ratification by the Fund’s Board at its next regularly scheduled meeting covering the calendar quarter in which the fair valuation was determined.
Valuations Methods and Inputs
To determine their net asset values, the Underlying Funds’ assets are valued primarily on the basis of current market quotations as generally supplied by third party portfolio pricing services or by dealers. Such market quotations are typically based on unadjusted quoted prices in active markets for identical securities or other observable market inputs.
If a market value or price cannot be determined for a security using the methodologies described above, or if, in the “good faith” opinion of the Manager, the market value or price obtained does not constitute a “readily available market quotation,” or a significant event has occurred that would materially affect the value of the security the security is fair valued either (i) by a standardized fair valuation methodology applicable to the security type or the significant event as previously approved by the Valuation Committee and the Fund’s Board or (ii) as determined in good faith by the Manager’s Valuation Committee. The Valuation Committee considers all relevant facts that are reasonably available, through either public information or information available to the Manager, when determining the fair value of a security. Fair value determinations by the Manager are subject to review, approval and ratification by the Fund’s Board at its next regularly scheduled meeting covering the calendar quarter in which the fair valuation was determined. The methodologies used for valuing securities are not necessarily an indication of the risks associated with investing in those Underlying Funds.
To assess the continuing appropriateness of security valuations, the Manager, or its third party service provider who is subject to oversight by the Manager, regularly compares prior day prices, prices on comparable securities, and sale prices to the current day prices and challenges those prices exceeding certain tolerance levels with the third party pricing service or broker source. For those securities valued by fair valuations, whether through a standardized fair valuation methodology or a fair valuation determination, the Valuation Committee reviews and affirms the reasonableness of the valuations based on such methodologies and fair valuation determinations on a regular basis after considering all relevant information that is reasonably available.
26 OPPENHEIMER PORTFOLIO SERIES EQUITY INVESTOR FUND
| NOTES TO FINANCIAL STATEMENTS Continued | ||
2. Securities Valuation (Continued)
Classifications
Each investment asset or liability of the Fund is assigned a level at measurement date based on the significance and source of the inputs to its valuation. Various data inputs are used in determining the value of each of the Fund’s investments as of the reporting period end. These data inputs are categorized in the following hierarchy under applicable financial accounting standards:
1) Level 1-unadjusted quoted prices in active markets for identical assets or liabilities (including securities actively traded on a securities exchange)
2) Level 2-inputs other than unadjusted quoted prices that are observable for the asset or liability (such as unadjusted quoted prices for similar assets and market corroborated inputs such as interest rates, prepayment speeds, credit risks, etc.)
3) Level 3-significant unobservable inputs (including the Manager’s own judgments about assumptions that market participants would use in pricing the asset or liability).
The inputs used for valuing securities are not necessarily an indication of the risks associated with investing in those securities.
The Fund classifies each of its investments in those Underlying Funds which are publicly offered and reported on an exchange as Level 1, and those Underlying Funds which are not publicly offered as Level 2, without consideration as to the classification level of the specific investments held by the Underlying Funds.
The table below categorizes amounts that are included in the Fund’s Statement of Assets and Liabilities as of January 31, 2014 based on valuation input level:
Level 1— | Level 2— | Level 3— Significant Unobservable Inputs | Value | |||||||||||||
| ||||||||||||||||
Assets Table | ||||||||||||||||
Investments, at Value: | ||||||||||||||||
Investment Companies | $ | 796,956,598 | $ | — | $ | — | $ | 796,956,598 | ||||||||
|
| |||||||||||||||
Total Assets | $ | 796,956,598 | $ | — | $ | — | $ | 796,956,598 | ||||||||
|
| |||||||||||||||
3. Shares of Beneficial Interest
The Fund has authorized an unlimited number of $0.001 par value shares of beneficial interest of each class. Transactions in shares of beneficial interest were as follows:
| Year Ended January 31, 2014 | Year Ended January 31, 2013 | |||||||||||||||
| Shares | Amount | Shares | Amount | |||||||||||||
| ||||||||||||||||
Class A | ||||||||||||||||
Sold | 7,459,417 | $ | 100,807,372 | 6,150,325 | $ | 69,068,506 | ||||||||||
Dividends and/or distributions reinvested | 241,867 | 3,613,476 | 240,424 | 2,824,970 | ||||||||||||
Redeemed | (5,535,417 | ) | (74,968,395 | ) | (6,346,441 | ) | (70,755,794 | ) | ||||||||
|
| |||||||||||||||
Net increase | 2,165,867 | $ | 29,452,453 | 44,308 | $ | 1,137,682 | ||||||||||
|
| |||||||||||||||
27 OPPENHEIMER PORTFOLIO SERIES EQUITY INVESTOR FUND
| NOTES TO FINANCIAL STATEMENTS Continued | ||
| ||
3. Shares of Beneficial Interest (Continued)
| Year Ended January 31, 2014 | Year Ended January 31, 2013 | |||||||||||||||
| Shares | Amount | Shares | Amount | |||||||||||||
| ||||||||||||||||
Class B | ||||||||||||||||
Sold | 108,086 | $ | 1,430,953 | 473,022 | $ | 5,074,354 | ||||||||||
Dividends and/or distributions reinvested | — | — | — | — | ||||||||||||
Redeemed | (1,610,544) | (20,936,630) | (2,287,283) | (24,850,940) | ||||||||||||
|
| |||||||||||||||
Net decrease | (1,502,458) | $ | (19,505,677) | (1,814,261) | $ | (19,776,586) | ||||||||||
|
| |||||||||||||||
| ||||||||||||||||
Class C | ||||||||||||||||
Sold | 2,495,238 | $ | 32,980,446 | 2,150,644 | $ | 23,561,148 | ||||||||||
Dividends and/or distributions reinvested | 14,550 | 212,426 | 11,477 | 131,982 | ||||||||||||
Redeemed | (2,300,695) | (29,919,049) | (2,735,667) | (29,813,465) | ||||||||||||
|
| |||||||||||||||
Net increase (decrease) | 209,093 | $ | 3,273,823 | (573,546) | $ | (6,120,335) | ||||||||||
|
| |||||||||||||||
| ||||||||||||||||
Class N | ||||||||||||||||
Sold | 779,306 | $ | 10,424,657 | 800,829 | $ | 8,927,575 | ||||||||||
Dividends and/or distributions reinvested | 17,018 | 253,906 | 20,488 | 240,319 | ||||||||||||
Redeemed | (1,504,876) | (20,235,689) | (2,104,502) | (23,311,188) | ||||||||||||
|
| |||||||||||||||
Net decrease | (708,552) | $ | (9,557,126) | (1,283,185) | $ | (14,143,294) | ||||||||||
|
| |||||||||||||||
| ||||||||||||||||
Class Y | ||||||||||||||||
Sold | 417,822 | $ | 5,749,315 | 289,115 | $ | 3,301,438 | ||||||||||
Dividends and/or distributions reinvested | 13,394 | 200,918 | 14,060 | 165,762 | ||||||||||||
Redeemed | (296,069) | (3,979,357) | (321,766) | (3,570,422) | ||||||||||||
|
| |||||||||||||||
Net increase (decrease) | 135,147 | $ | 1,970,876 | (18,591) | $ | (103,222) | ||||||||||
|
| |||||||||||||||
4. Purchases and Sales of Securities
The aggregate cost of purchases and proceeds from sales of securities, other than short-term obligations, for the year ended January 31, 2014 were as follows:
| Purchases | Sales | |||||||
| ||||||||
Investment securities | $ | 57,953,607 | $ | 45,879,920 | ||||
5. Fees and Other Transactions with Affiliates
Management Fees. Under the investment advisory agreement, the Manager does not charge a management fee, but rather collects indirect management fees from the Fund’s investments in the Underlying Funds. The weighted indirect management fees collected from the Fund’s investment in the Underlying Funds, as a percent of average daily net assets of the Fund for the year ended January 31, 2014 was 0.62%. This amount is gross of any waivers or reimbursements of management fees implemented at the Underlying Fund level.
28 OPPENHEIMER PORTFOLIO SERIES EQUITY INVESTOR FUND
| NOTES TO FINANCIAL STATEMENTS Continued | ||
|
| 5. Fees and Other Transactions with Affiliates (Continued) |
Sub-Adviser Fees. The Manager has retained the Sub-Adviser to provide the day-to-day portfolio management of the Fund. Under the Sub-Advisory Agreement, the Manager pays the Sub-Adviser an annual fee in monthly installments, equal to a percentage of the investment management fee collected by the Manager from the Fund, which shall be calculated after any investment management fee waivers. The fee paid to the Sub-Adviser is paid by the Manager, not by the Fund.
Transfer Agent Fees. OFI Global (the “Transfer Agent”) serves as the transfer and shareholder servicing agent for the Fund. Fees incurred by the Fund with respect to these services are detailed in the Statement of Operations.
Sub-Transfer Agent Fees. The Transfer Agent has retained Shareholder Services, Inc., a wholly-owned subsidiary of OFI (the “Sub-Transfer Agent”), to provide the day-to-day transfer agent and shareholder servicing of the Fund. Under the Sub-Transfer Agency Agreement, the Transfer Agent pays the Sub-Transfer Agent an annual fee in monthly installments, equal to a percentage of the transfer agent fee collected by the Transfer Agent from the Fund, which shall be calculated after any applicable fee waivers. The fee paid to the Sub-Transfer Agent is paid by the Transfer Agent, not by the Fund.
Distribution and Service Plan (12b-1) Fees. Under its General Distributor’s Agreement with the Fund, OppenheimerFunds Distributor, Inc. (the “Distributor”) acts as the Fund’s principal underwriter in the continuous public offering of the Fund’s classes of shares.
Service Plan for Class A Shares. The Fund has adopted a Service Plan (the “Plan”) for Class A shares under Rule 12b-1 of the Investment Company Act of 1940. Under the Plan, the Fund reimburses the Distributor for a portion of its costs incurred for services provided to accounts that hold Class A shares. Reimbursement is made periodically at an annual rate of up to 0.25% of the daily net assets of Class A shares of the Fund. The Distributor currently uses all of those fees to pay dealers, brokers, banks and other financial institutions periodically for providing personal service and maintenance of accounts of their customers that hold Class A shares. Any unreimbursed expenses the Distributor incurs with respect to Class A shares in any fiscal year cannot be recovered in subsequent periods. Fees incurred by the Fund under the Plan are detailed in the Statement of Operations.
Distribution and Service Plans for Class B, Class C and Class N Shares. The Fund has adopted Distribution and Service Plans (the “Plans”) for Class B, Class C and Class N shares under Rule 12b-1 of the Investment Company Act of 1940 to compensate the Distributor for its services in connection with the distribution of those shares and servicing accounts. Under the Plans, the Fund pays the Distributor an annual asset-based sales charge of 1.00% on Class B and Class C shares daily net assets and 0.50% on Class N shares daily net assets. The Distributor also receives a service fee of 0.25% per year under each plan. If either the Class B, Class C or Class N plan is terminated by the Fund or by the shareholders of a class, the Board of Trustees and its independent trustees must determine whether the
29 OPPENHEIMER PORTFOLIO SERIES EQUITY INVESTOR FUND
| NOTES TO FINANCIAL STATEMENTS Continued |
5. Fees and Other Transactions with Affiliates (Continued)
Distributor shall be entitled to payment from the Fund of all or a portion of the service fee and/or asset-based sales charge in respect to shares sold prior to the effective date of such termination. Fees incurred by the Fund under the Plans are detailed in the Statement of Operations. The Distributor determines its uncompensated expenses under the Plans at calendar quarter ends. The Distributor’s aggregate uncompensated expenses under the Plans at December 31, 2013 were as follows:
Class C | $ | 1,951,848 | ||
Class N | 917,430 |
Sales Charges. Front-end sales charges and contingent deferred sales charges (“CDSC”) do not represent expenses of the Fund. They are deducted from the proceeds of sales of Fund shares prior to investment or from redemption proceeds prior to remittance, as applicable. The sales charges retained by the Distributor from the sale of shares and the CDSC retained by the Distributor on the redemption of shares is shown in the following table for the period indicated.
| Year Ended | Class A Front-End | Class A Contingent Deferred Sales Charges Retained by Distributor | Class B Contingent Deferred Sales Charges Retained by Distributor | Class C Contingent Deferred Sales Charges Retained by Distributor | Class N Contingent Deferred Sales Charges Retained by Distributor | |||||||||||||||
| ||||||||||||||||||||
January 31, 2014 | $489,111 | $0 | $101,070 | $6,288 | $1,901 | |||||||||||||||
Waivers and Reimbursements of Expenses. The Manager has voluntarily agreed to waive fees and/or reimburse the Fund for certain expenses in order to limit “Expenses after payments, waivers and/or reimbursements and reduction to custodian expenses”, (the combined direct (Fund level) and indirect (Underlying Fund level) expenses), will not exceed the annual rate of 1.45%, 2.20%, 2.20%, 1.70% and 1.20%, for Class A, Class B, Class C, Class N and Class Y, respectively. The expense limitations do not include extraordinary expenses and other expenses not incurred in the ordinary course of the Fund’s business. Notwithstanding the foregoing limits, the Manager is not required to waive or reimburse Fund expenses in excess of the amount of indirect management fees earned from investments in the Underlying Funds.
The Transfer Agent has contractually agreed to limit transfer and shareholder servicing agent fees for all classes to 0.35% of average annual net assets per class.
During the year ended January 31, 2014, the Transfer Agent waived $78,882 of fees.
Some of these undertakings may be modified or terminated at any time; some may not be modified or terminated until after one year from the date of the current prospectus, as indicated therein.
30 OPPENHEIMER PORTFOLIO SERIES EQUITY INVESTOR FUND
| NOTES TO FINANCIAL STATEMENTS Continued | ||
6. Pending Litigation
Since 2009, seven class action lawsuits have been pending in the U.S. District Court for the District of Colorado against OppenheimerFunds, Inc. (“OFI”), OppenheimerFunds Distributor, Inc., the Fund’s principal underwriter and distributor (the “Distributor”), and certain funds (but not including the Fund) advised by OFI Global Asset Management, Inc. and distributed by the Distributor (the “Defendant Funds”). The lawsuits also name as defendants certain officers and current and former trustees of the respective Defendant Funds. The lawsuits raise claims under federal securities law and allege, among other things, that the disclosure documents of the respective Defendant Funds contained misrepresentations and omissions and that the respective Defendant Funds’ investment policies were not followed. The plaintiffs in these actions seek unspecified damages, equitable relief and awards of attorneys’ fees and litigation expenses. The Defendant Funds’ Boards of Trustees have also engaged counsel to represent the Funds and the present and former Independent Trustees named in those suits. On March 5, 2014, the parties in six of these lawsuits executed stipulations and agreements of settlement resolving those actions. The settlements are subject to a variety of contingencies, including approval by the court. The settlements do not resolve a seventh outstanding lawsuit relating to Oppenheimer California Municipal Fund.
Other class action and individual lawsuits have been filed since 2008 in various state and federal courts against OFI and certain of its affiliates by investors seeking to recover investments they allegedly lost as a result of the “Ponzi” scheme run by Bernard L. Madoff and his firm, Bernard L. Madoff Investment Securities, LLC (“BLMIS”). Plaintiffs in these suits allege that they suffered losses as a result of their investments in several funds managed by an affiliate of OFI and assert a variety of claims, including breach of fiduciary duty, fraud, negligent misrepresentation, unjust enrichment, and violation of federal and state securities laws and regulations, among others. They seek unspecified damages, equitable relief and awards of attorneys’ fees and litigation expenses. Neither the Distributor, nor any of the Oppenheimer mutual funds, their independent trustees or directors are named as defendants in these lawsuits. None of the Oppenheimer mutual funds invested in any funds or accounts managed by Madoff or BLMIS. On February 28, 2011, a stipulation of partial settlement of three groups of consolidated putative class action lawsuits relating to these matters was filed in the U.S. District Court for the Southern District of New York. On August 19, 2011, the court entered an order and final judgment approving the settlement as fair, reasonable and adequate. In September 2011, certain parties filed notices of appeal from the court’s order approving the settlement. The settlement does not resolve other outstanding lawsuits against OFI and its affiliates relating to BLMIS.
On April 16, 2010, a lawsuit was filed in New York state court against (i) OFI, (ii) an affiliate of OFI and (iii) AAArdvark IV Funding Limited (“AAArdvark IV”), an entity advised by OFI’s affiliate, in connection with investments made by the plaintiffs in AAArdvark IV. Plaintiffs alleged breach of contract and common law fraud claims against the defendants and sought compensatory damages, costs and disbursements, including attorney fees. On April 11, 2013, the court granted defendants’ motion for summary judgment, dismissing plaintiffs’
31 OPPENHEIMER PORTFOLIO SERIES EQUITY INVESTOR FUND
| NOTES TO FINANCIAL STATEMENTS Continued | ||
6. Pending Litigation (Continued)
fraud claim with prejudice and dismissing their contract claim without prejudice, and granted plaintiffs leave to replead their contract claim to assert a cause of action for specific performance within 30 days. On May 9, 2013, plaintiffs filed a notice of appeal from the court’s dismissal order. On January 7, 2014, the appellate court affirmed the trial court’s dismissal order. On July 15, 2011, a lawsuit was filed in New York state court against OFI, an affiliate of OFI and AAArdvark Funding Limited (“AAArdvark I”), an entity advised by OFI’s affiliate, in connection with investments made by the plaintiffs in AAArdvark I. The complaint alleges breach of contract and common law fraud claims against the defendants and seeks compensatory damages, costs and disbursements, including attorney fees. On November 9, 2011, a lawsuit was filed in New York state court against OFI, an affiliate of OFI and AAArdvark XS Funding Limited (“AAArdvark XS”), an entity advised by OFI’s affiliate, in connection with investments made by the plaintiffs in AAArdvark XS. The complaint alleged breach of contract against the defendants and sought compensatory damages, costs and disbursements, including attorney fees. On November 8, 2013, the parties filed a stipulation of discontinuance dismissing the lawsuit with prejudice.
OFI believes the lawsuits and appeals described above are without legal merit and, with the exception of actions it has settled, is defending against them vigorously. While it is premature to render any opinion as to the outcome in these lawsuits, or whether any costs that the Defendant Funds may bear in defending the suits might not be reimbursed by insurance, OFI believes that these suits should not impair the ability of OFI or the Distributor to perform their respective duties to the Fund, and that the outcome of all of the suits together should not have any material effect on the operations of any of the Oppenheimer mutual funds.
32 OPPENHEIMER PORTFOLIO SERIES EQUITY INVESTOR FUND
REPORTOF INDEPENDENT REGISTERED
PUBLIC ACCOUNTING FIRM |
The Board of Trustees and Shareholders of Oppenheimer Portfolio Series:
We have audited the accompanying statement of assets and liabilities of Equity Investor Fund (a series of Oppenheimer Portfolio Series), including the statement of investments, as of January 31, 2014, and the related statement of operations for the year then ended, the statements of changes in net assets for each of the years in the two-year period then ended, and the financial highlights for each of the years in the five-year period then ended. These financial statements and financial highlights are the responsibility of the Fund’s management. Our responsibility is to express an opinion on these financial statements and financial highlights based on our audits.
We conducted our audits in accordance with the standards of the Public Company Accounting Oversight Board (United States). Those standards require that we plan and perform the audit to obtain reasonable assurance about whether the financial statements and financial highlights are free of material misstatement. An audit includes examining, on a test basis, evidence supporting the amounts and disclosures in the financial statements. Our procedures included confirmation of securities owned as of January 31, 2014, by correspondence with the custodian, transfer agent and brokers, or by other appropriate auditing procedures where replies from brokers were not received. An audit also includes assessing the accounting principles used and significant estimates made by management, as well as evaluating the overall financial statement presentation. We believe that our audits provide a reasonable basis for our opinion.
In our opinion, the financial statements and financial highlights referred to above present fairly, in all material respects, the financial position of Equity Investor Fund as of January 31, 2014, the results of its operations for the year then ended, the changes in its net assets for each of the years in the two-year period then ended, and the financial highlights for each of the years in the five-year period then ended, in conformity with U.S. generally accepted accounting principles.
KPMGLLP
Denver, Colorado
March 24, 2014
33 OPPENHEIMER PORTFOLIO SERIES EQUITY INVESTOR FUND
|
In early 2014, if applicable, shareholders of record received information regarding all dividends and distributions paid to them by the Fund during calendar year 2013.
Dividends, if any, paid by the Fund during the fiscal year ended January 31, 2014 which are not designated as capital gain distributions should be multiplied by the maximum amount allowable but not less than 74.41% to arrive at the amount eligible for the corporate dividend-received deduction.
A portion, if any, of the dividends paid by the Fund during the fiscal year ended January 31, 2014 which are not designated as capital gain distributions are eligible for lower individual income tax rates to the extent that the Fund has received qualified dividend income as stipulated by recent tax legislation. The maximum amount allowable but not less than $9,289,918 of the Fund’s fiscal year taxable income may be eligible for the lower individual income tax rates. In early 2014, shareholders of record received information regarding the percentage of distributions that are eligible for lower individual income tax rates.
Recent tax legislation allows a regulated investment company to designate distributions not designated as capital gain distributions, as either interest related dividends or short-term capital gain dividends, both of which are exempt from the U.S. withholding tax applicable to non U.S. taxpayers. For the fiscal year ended January 31, 2014, the maximum amount allowable but not less than $10,405 of the ordinary distributions to be paid by the Fund qualifies as an interest related dividend.
The Fund has elected the application of Section 853 of the Internal Revenue Code to permit shareholders to take a federal income tax credit or deduction, at their option, on a per share basis. The maximum amount allowable but not less than $494,542 of foreign income taxes were paid by the Fund during the fiscal year ended January 31, 2014. A separate notice will be mailed to each shareholder, which will reflect the proportionate share of such foreign taxes which must be treated by shareholders as gross income for federal income tax purposes.
Gross income of the maximum amount allowable but not less than $4,821,004 was derived from sources within foreign countries or possessions of the United States.
The foregoing information is presented to assist shareholders in reporting distributions received from the Fund to the Internal Revenue Service. Because of the complexity of the federal regulations which may affect your individual tax return and the many variations in state and local tax regulations, we recommend that you consult your tax advisor for specific guidance.
34 OPPENHEIMER PORTFOLIO SERIES EQUITY INVESTOR FUND
BOARD APPROVAL OF THE FUND’S INVESTMENT
ADVISORY AND SUB-ADVISORY AGREEMENTS Unaudited |
The Fund has entered into an investment advisory agreement with OFI Global Asset Management, Inc. (“OFI Global” or the “Adviser”), a wholly-owned subsidiary of OppenheimerFunds, Inc. (“OFI” or the “Sub-Adviser”) (“OFI Global” and “OFI” together the “Managers”) and OFI Global has entered into a sub-advisory agreement with OFI whereby OFI provides investment sub-advisory services to the Fund (collectively, the “Agreements”). Each year, the Board of Trustees (the “Board”), including a majority of the independent Trustees, is required to determine whether to renew the Agreements. The Investment Company Act of 1940, as amended, requires that the Board request and evaluate, and that the Managers provide, such information as may be reasonably necessary to evaluate the terms of the Agreements. The Board employs an independent consultant to prepare a report that provides information, including comparative information that the Board requests for that purpose. In addition to in-person meetings focused on this evaluation, the Board receives information throughout the year regarding Fund services, fees, expenses and performance.
The Adviser, Sub-Adviser and the independent consultant provided information to the Board on the following factors: (i) the nature, quality and extent of the Managers’ services, (ii) the investment performance of the Fund and the Managers, (iii) the fees and expenses of the Fund, including comparative expense information, (iv) the profitability of the Managers and their affiliates, including an analysis of the cost of providing services, (v) whether economies of scale are realized as the Fund grows and whether fee levels reflect these economies of scale for Fund investors and (vi) other benefits to the Managers from their relationship with the Fund. The Board was aware that there are alternatives to retaining the Managers.
Outlined below is a summary of the principal information considered by the Board as well as the Board’s conclusions.
Nature, Quality and Extent of Services. The Board considered information about the nature, quality and extent of the services provided to the Fund and information regarding the Managers’ key personnel who provide such services. The Sub-Adviser’s duties include providing the Fund with the services of the portfolio manager and the Sub-Adviser’s investment team, who provide research, analysis and other advisory services in regard to the Fund’s investments; securities trading services; oversight of third-party service providers; monitoring compliance with applicable Fund policies and procedures and adherence to the Fund’s investment restrictions; and risk management. The Managers are responsible for providing certain administrative services to the Fund as well. Those services include providing and supervising all administrative and clerical personnel who are necessary in order to provide effective corporate administration for the Fund; compiling and maintaining records with respect to the Fund’s operations; preparing and filing reports required by the Securities and Exchange Commission; preparing periodic reports regarding the operations of the Fund for its shareholders; preparing proxy materials for shareholder meetings; and preparing the registration statements required by Federal and state securities laws for the sale of the Fund’s shares. The Managers also provide the Fund with office space, facilities and equipment.
The Board also considered the quality of the services provided and the quality of the Managers’ resources that are available to the Fund. The Board took account of the fact that the Sub-Adviser has had over fifty years of experience as an investment adviser and that its assets under management rank it among the top mutual fund managers in the United States. The Board evaluated the Sub-Adviser’s advisory, administrative, accounting, legal, compliance
35 OPPENHEIMER PORTFOLIO SERIES EQUITY INVESTOR FUND
BOARD APPROVAL OF THE FUND’S INVESTMENT
ADVISORY AND SUB-ADVISORY AGREEMENTS Unaudited Continued |
|
services and risk management, and information the Board has received regarding the experience and professional qualifications of the Managers’ key personnel and the size and functions of its staff. In its evaluation of the quality of the portfolio management services provided, the Board considered the experience of Mark Hamilton, the portfolio manager for the Fund, and the experience of the portfolio managers and the investment performance of the investment companies in which the Fund invests (the “Underlying Funds”). The Board members also considered the totality of their experiences with the Managers as directors or trustees of the Fund and other funds advised by the Managers. The Board considered information regarding the quality of services provided by affiliates of the Managers, which its members have become knowledgeable about in connection with the renewal of the Fund’s service agreements. The Board concluded, in light of the Managers’ experience, reputation, personnel, operations and resources that the Fund benefits from the services provided under the Agreement.
Investment Performance of the Fund, the Adviser and the Sub-Adviser. Throughout the year, the Adviser and the Sub-Adviser provided information on the investment performance of the Fund, the Adviser and the Sub-Adviser, including comparative performance information. The Board also reviewed information, prepared by the Adviser, the Sub-Adviser and the independent consultant, comparing the Fund’s historical performance to its benchmarks and to the performance of other retail world stock funds. The Board noted that the Fund’s one-year, three-year and five-year performance was better than its category median.
Costs of Services by the Adviser. The Board reviewed the fees paid to the Adviser and the other expenses borne by the Fund. The Board also considered the comparability of the fees charged and the services provided to the Fund to the fees and services for other clients or accounts advised by the Adviser. The independent consultant provided comparative data in regard to the fees and expenses of the Fund and other retail front-end load world stock funds with comparable asset levels and distribution features. The Adviser has voluntarily agreed to waive fees and/or reimburse the Fund for certain expenses in order to limit annual fund operating expenses after any fee waiver and/or expense reimbursement (including the combined direct (Fund level) and indirect (Underlying Fund level) expenses, but excluding (i) interest, taxes, dividends tied to short sales, brokerage commissions, and other expenditures which are capitalized in accordance with generally accepted accounting principles; (ii) certain other expenses attributable to, and incurred as a result of, a Fund’s investments; and (iii) other extraordinary expenses (including litigation expenses) not incurred in the ordinary course of the Fund’s business) to annual rates of 1.45% for Class A shares, 2.20% for Class B shares, 2.20% for Class C shares, 1.70% for Class N shares, and 1.20% for Class Y shares, as calculated on the daily net assets of the Fund. This fee waiver and/or expense reimbursement may be amended or withdrawn at any time without prior notice to shareholders. The Board noted that the Fund was charged no actual management fees, exclusive of Underlying Fund management fees, while certain peer group funds did charge direct management fees. The Fund’s total expenses were lower than its peer group median and its category median.
Economies of Scale and Profits Realized by the Adviser and Sub-Adviser. The Board considered information regarding OFI Global’s costs in serving as the Fund’s investment
36 OPPENHEIMER PORTFOLIO SERIES EQUITY INVESTOR FUND
BOARD APPROVAL OF THE FUND’S INVESTMENT
ADVISORY AND SUB-ADVISORY AGREEMENTS Unaudited Continued |
|
adviser, including the costs associated with the personnel and systems necessary to manage the Fund, and information regarding the Managers’ profitability from their relationship with the Fund. The Board reviewed whether the Managers may realize economies of scale in managing and supporting the Fund and whether those economies of scale benefit the Fund’s shareholders at the current level of Fund assets in relation to its management fee.
Other Benefits to the Managers. In addition to considering the profits realized by the Managers, the Board considered information that was provided regarding the direct and indirect benefits the Managers receive as a result of their relationship with the Fund, including compensation paid to the Managers’ affiliates. The Board also considered that the Managers must be able to pay and retain experienced professional personnel at competitive rates to provide quality services to the Fund.
Conclusions. These factors were also considered by the independent Trustees meeting separately from the full Board, assisted by experienced counsel to the Fund and to the independent Trustees. Fund counsel and the independent Trustees’ counsel are independent of the Managers within the meaning and intent of the Securities and Exchange Commission Rules.
Based on its review of the information it received and its evaluations described above, the Board, including a majority of the independent Trustees, decided to continue the Agreements through September 30, 2014. In arriving at its decision, the Board did not identify any factor or factors as being more important than others, but considered all of the above information, and considered the terms and conditions of the Agreements, including the management fees, in light of all the surrounding circumstances.
37 OPPENHEIMER PORTFOLIO SERIES EQUITY INVESTOR FUND
PORTFOLIO PROXY VOTING POLICIESAND PROCEDURES;
UPDATES TO STATEMENTS OF INVESTMENTS Unaudited |
The Fund has adopted Portfolio Proxy Voting Policies and Procedures under which the Fund votes proxies relating to securities (“portfolio proxies”) held by the Fund. A description of the Fund’s Portfolio Proxy Voting Policies and Procedures is available (i) without charge, upon request, by calling the Fund toll-free at 1.800.CALL OPP (225.5677), (ii) on the Fund’s website at oppenheimerfunds.com, and (iii) on the SEC’s website at www.sec.gov. In addition, the Fund is required to file Form N-PX, with its complete proxy voting record for the 12 months ended June 30th, no later than August 31st of each year. The Fund’s voting record is available (i) without charge, upon request, by calling the Fund toll-free at 1.800.CALL OPP (225.5677), and (ii) in the Form N-PX filing on the SEC’s website at www.sec.gov.
The Fund files its complete schedule of portfolio holdings with the SEC for the first quarter and the third quarter of each fiscal year on Form N-Q. The Fund’s Form N-Q filings are available on the SEC’s website at www.sec.gov. Those forms may be reviewed and copied at the SEC’s Public Reference Room in Washington, D.C. Information on the operation of the Public Reference Room may be obtained by calling 1-800-SEC-0330.
Householding—Delivery of Shareholder Documents
This is to inform you about OppenheimerFunds’ “householding” policy. If more than one member of your household maintains an account in a particular fund, OppenheimerFunds will mail only one copy of the fund’s prospectus (or, if available, the fund’s summary prospectus), annual and semiannual report and privacy policy. The consolidation of these mailings, called householding, benefits your fund through reduced mailing expense, and benefits you by reducing the volume of mail you receive from OppenheimerFunds. Householding does not affect the delivery of your account statements.
Please note that we will continue to household these mailings for as long as you remain an OppenheimerFunds shareholder, unless you request otherwise. If you prefer to receive multiple copies of these materials, please call us at 1.800.CALL-OPP (225-5677). You may also notify us in writing or via email. We will begin sending you individual copies of the prospectus (or, if available, the summary prospectus), reports and privacy policy within 30 days of receiving your request to stop householding.
38 OPPENHEIMER PORTFOLIO SERIES EQUITY INVESTOR FUND
| TRUSTEES AND OFFICERS Unaudited | ||||
| ||||
| Name, Position(s) Held with the Fund, Length of Service, Year of Birth | Principal Occupation(s) During the Past 5 Years; Other Trusteeships/Directorships Held; Number of Portfolios in the Fund Complex Currently Overseen | |
| INDEPENDENT TRUSTEES | The address of each Trustee in the chart below is 6803 S. Tucson Way, Centennial, Colorado 80112-3924. Each Trustee serves for an indefinite term, or until his or her resignation, retirement, death or removal. | |
Brian F. Wruble, Chairman of the Board of Trustees (since 2007) and Trustee (since 2005) Year of Birth: 1943 | Director of Community Foundation of the Florida Keys (non-profit) (since July 2012); Chairman Emeritus and Non-Voting Trustee of The Jackson Laboratory (non-profit) (since August 2011); Director of Special Value Opportunities Fund, LLC (registered investment company) (affiliate of the Sub-Adviser’s parent company) (since September 2004); Member of Zurich Insurance Advisory Council (insurance) (since 2004); Treasurer (since 2007) and Trustee of the Institute for Advanced Study (non-profit educational institute) (since May 1992); Chairman (August 2007-August 2011) and Trustee (since August 1991) of the Board of Trustees of The Jackson Laboratory (non-profit); General Partner of Odyssey Partners, L.P. (hedge fund) (September 1995-December 2007); Special Limited Partner of Odyssey Investment Partners, LLC (private equity investment) (January 1999-September 2004). Oversees 51 portfolios in the OppenheimerFunds complex. Mr. Wruble has served on the Boards of certain Oppenheimer funds since April 2001, during which time he has become familiar with the Fund’s (and other Oppenheimer funds’) financial, accounting, regulatory and investment matters and has contributed to the Boards’ deliberations. | |
David K. Downes, Trustee (since 2007) Year of Birth: 1940 | Director of THL Credit Inc. (since June 2009); Trustee of Employee Trusts (since January 2006); Chief Executive Officer and Board Member of Community Capital Management (investment management company) (since January 2004); President of The Community Reinvestment Act Qualified Investment Fund (investment management company) (since 2004); Director of Internet Capital Group (information technology company) (since October 2003); formerly, Independent Chairman GSK Employee Benefit Trust (April 2006- June 2013); Director of Correctnet (January 2006-2007); Independent Chairman of the Board of Trustees of Quaker Investment Trust (registered investment company) (2004-2007); Chief Operating Officer and Chief Financial Officer of Lincoln National Investment Companies, Inc. (subsidiary of Lincoln National Corporation, a publicly traded company) and Delaware Investments U.S., Inc. (investment management subsidiary of Lincoln National Corporation) (1993-2003); President, Chief Executive Officer and Trustee of Delaware Investment Family of Funds (1993-2003); President and Board Member of Lincoln National Convertible Securities Funds, Inc. and the Lincoln National Income Funds, TDC (1993-2003); Chairman and Chief Executive Officer of Retirement Financial Services, Inc. (registered transfer agent and investment adviser and subsidiary of Delaware Investments U.S., Inc.) (1993-2003); President and Chief Executive Officer of Delaware Service Company, Inc. (1995-2003); Chief Administrative Officer, Chief Financial Officer, Vice Chairman and Director of Equitable Capital Management Corporation (investment subsidiary of Equitable Life Assurance Society) (1985-1992); Corporate Controller of Merrill Lynch Company (financial services holding company) (1977-1985); held the following positions at the Colonial Penn Group, Inc. (insurance company): Corporate Budget Director (1974-1977), Assistant Treasurer (1972-1974) and Director of Corporate Taxes (1969-1972); held the following positions at Price | |
39 OPPENHEIMER PORTFOLIO SERIES EQUITY INVESTOR FUND
| TRUSTEES AND OFFICERS Unaudited / Continued |
David K. Downes, Continued | Waterhouse Company (financial services firm): Tax Manager (1967-1969), Tax Senior (1965-1967) and Staff Accountant (1963-1965); United States Marine Corps (1957-1959). Oversees 51 portfolios in the OppenheimerFunds complex. Mr. Downes has served on the Boards of certain Oppenheimer funds since December 2005, during which time he has become familiar with the Fund’s (and other Oppenheimer funds’) financial, accounting, regulatory and investment matters and has contributed to the Boards’ deliberations. | |
Matthew P. Fink, Trustee (since 2005) Year of Birth: 1941 | Trustee of the Committee for Economic Development (policy research foundation) (2005-2011); Director of ICI Education Foundation (education foundation) (October 1991-August 2006); President of the Investment Company Institute (trade association) (October 1991-June 2004); Director of ICI Mutual Insurance Company (insurance company) (October 1991-June 2004); Author of The Rise of Mutual Funds: An Insider’s View published by Oxford University Press (second edition 2010). Oversees 51 portfolios in the OppenheimerFunds complex. Mr. Fink has served on the Boards of certain Oppenheimer funds since January 2005, during which time he has become familiar with the Fund’s (and other Oppenheimer funds’) financial, accounting, regulatory and investment matters and has contributed to the Boards’ deliberations. | |
Edmund P. Giambastiani, Jr., Trustee (since 2013) Year of Birth: 1948 | Advisory Board Member of the Maxwell School of Citizenship and Public Affairs of Syracuse University (since April 2012); Director of Mercury Defense Systems Inc. (information technology) (August 2011-February 2013); Trustee of the U.S. Naval Academy Foundation (since November 2010); Advisory Board Member of the Massachusetts Institute of Technology Lincoln Laboratory (federally-funded research development center) (since May 2010); Director of The Boeing Company (aerospace and defense) (since October 2009); Trustee of MITRE Corporation (federally-funded research development center) (since September 2008); Independent Director of QinetiQ Group Plc (defense technology and security) (February 2008-August 2011); Director of Monster Worldwide, Inc. (on-line career services) (since January 2008, Lead Director since June 2011); Chairman of Alenia North America, Inc. (military and defense products) (January 2008-October 2009); Director of SRA International, Inc. (information technology and services) (January 2008-July 2011); President of Giambastiani Group LLC (national security and energy consulting) (since October 2007); United States Navy, career nuclear submarine officer (June 1970-October 2007), Vice Chairman of the Joint Chiefs of Staff (2005-October 2007), NATO Supreme Allied Commander Transformation (2003-2005), Commander, U.S. Joint Forces Command (2002-2005). Since his retirement from the U.S. Navy in October 2007, Admiral Giambastiani has also served on numerous U.S. Government advisory boards, investigations and task forces for the Secretaries of Defense, State and Interior and the Central Intelligence Agency. Oversees 51 portfolios in the OppenheimerFunds complex. Admiral Giambastiani has served on the Boards of certain Oppenheimer funds since February 2013, including as an Advisory Board Member for certain Oppenheimer funds, during which time he has become familiar with the Fund’s (and other Oppenheimer funds’) financial, accounting, regulatory and investment matters and has contributed to the Boards’ deliberations. For purposes of this report, Admiral Giambastiani is identified as a Trustee. | |
40 OPPENHEIMER PORTFOLIO SERIES EQUITY INVESTOR FUND
| TRUSTEES AND OFFICERS Unaudited / Continued |
Mary F. Miller, Trustee (since 2005) Year of Birth: 1942 | Trustee of International House (not-for-profit) (since June 2007); Trustee of the American Symphony Orchestra (not-for-profit) (October 1998-November 2011); and Senior Vice President and General Auditor of American Express Company (financial services company) (July 1998-February 2003). Oversees 51 portfolios in the OppenheimerFunds complex. Ms. Miller has served on the Boards of certain Oppenheimer funds since August 2004, during which time she has become familiar with the Fund’s (and other Oppenheimer funds’) financial, accounting, regulatory and investment matters and has contributed to the Boards’ deliberations. | |
Joel W. Motley, Trustee (since 2005) Year of Birth: 1952 | Member of the Vestry of Trinity Wall Street (since April 2012); Director of Southern Africa Legal Services Foundation (since March 2012); Board Member of Pulitzer Center for Crisis Reporting (non-profit journalism) (since December 2010); Managing Director of Public Capital Advisors, LLC (privately-held financial advisor) (since January 2006); Managing Director of Carmona Motley, Inc. (privately-held financial advisor) (since January 2002); Director of Columbia Equity Financial Corp. (privately-held financial advisor) (2002-2007); Managing Director of Carmona Motley Hoffman Inc. (privately-held financial advisor) (January 1998-December 2001); Member of the Finance and Budget Committee of the Council on Foreign Relations, Member of the Investment Committee and Board of Human Rights Watch and Member of the Investment Committee and Board of Historic Hudson Valley. Oversees 51 portfolios in the OppenheimerFunds complex. Mr. Motley has served on the Boards of certain Oppenheimer funds since October 2002, during which time he has become familiar with the Fund’s (and other Oppenheimer funds’) financial, accounting, regulatory and investment matters and has contributed to the Boards’ deliberations. | |
Joanne Pace, Trustee (since 2012) Year of Birth: 1958 | Board Director of Horizon Blue Cross Blue Shield of New Jersey (since November 2012); Advisory Board Director of The Alberleen Group LLC (since March 2012); Advisory Board Director of The Agile Trading Group LLC (since March 2012); Advisory Council Member of 100 Women in Hedge Funds (non-profit) (since December 2012); Advisory Council Member of Morgan Stanley Children’s Hospital (non-profit) (since May 2012); Board Director of The Komera Project (non-profit) (since April 2012); New York Advisory Board Director of Peace First (non-profit) (since March 2010); Senior Advisor of SECOR Asset Management, LP (2010-2011); Managing Director and Chief Operating Officer of Morgan Stanley Investment Management (2006-2010); Partner and Chief Operating Officer of FrontPoint Partners, LLC (hedge fund) (2005-2006); held the following positions at Credit Suisse: Managing Director (2003-2005); Global Head of Human Resources and member of Executive Board and Operating Committee (2004-2005), Global Head of Operations and Product Control (2003-2004); held the following positions at Morgan Stanley: Managing Director (1997-2003), Controller and Principal Accounting Officer (1999-2003); Chief Financial Officer (temporary assignment) for the Oversight Committee, Long Term Capital Management (1998-1999). Lead Independent Director and Chair of the Audit and Nominating Committee of The Global Chartist Fund, LLC of Oppenheimer Asset Management (2011-2012); Board Director of Managed Funds Association (2008-2010); Board Director of Morgan Stanley Foundation (2007-2010) and Investment Committee Chair (2008-2010). Oversees 51 portfolios in the OppenheimerFunds complex. Ms. Pace has served on the Boards of certain Oppenheimer funds since November 2012, including as an Advisory Board Member for certain Oppenheimer funds, during which time she has become familiar with the Fund’s (and other | |
41 OPPENHEIMER PORTFOLIO SERIES EQUITY INVESTOR FUND
| TRUSTEES AND OFFICERS Unaudited / Continued |
Joanne Pace, Continued | Oppenheimer funds’) financial, accounting, regulatory and investment matters and has contributed to the Board’s deliberations. For purposes of this report, Ms. Pace is identified as a Trustee.
| |
Joseph M. Wikler, Trustee (since 2005) Year of Birth: 1941 | Director of C-TASC (bio-statistics services) (2007-2012); formerly, Director of the following medical device companies: Medintec (1992-2011) and Cathco (1996-2011); Member of the Investment Committee of the Associated Jewish Charities of Baltimore (since 1994); Director of Lakes Environmental Association (environmental protection organization) (1996-2008); Director of Fortis/Hartford mutual funds (1994-December 2001). Oversees 51 portfolios in the OppenheimerFunds complex. Mr. Wikler has served on the Boards of certain Oppenheimer funds since August 2005, during which time he has become familiar with the Fund’s (and other Oppenheimer funds’) financial, accounting, regulatory and investment matters and has contributed to the Boards’ deliberations. | |
Peter I. Wold, Trustee (since 2005) Year of Birth: 1948 | Director of Arch Coal, Inc. (since 2010); President of Wold Oil Properties, Inc. (oil and gas exploration and production company) (since 1994); Vice President of American Talc Company, Inc. (talc mining and milling) (since 1999); Managing Member of Hole-in-the-Wall Ranch (cattle ranching) (since 1979); Director and Chairman of Wyoming Enhanced Oil Recovery Institute Commission (enhanced oil recovery study) (2004-2012); Director and Chairman of the Denver Branch of the Federal Reserve Bank of Kansas City (1993-1999); and Director of PacifiCorp. (electric utility) (1995-1999). Oversees 51 portfolios in the OppenheimerFunds complex. Mr. Wold has served on the Boards of certain Oppenheimer funds since August 2005, during which time he has become familiar with the Fund’s (and other Oppenheimer funds’) financial, accounting, regulatory and investment matters and has contributed to the Boards’ deliberations.
| |
| ||
| INTERESTED TRUSTEE AND OFFICER | Mr. Glavin is an “Interested Trustee” because he is affiliated with the Manager and the Sub-Adviser by virtue of his positions as an officer and director of the Manager and a director of the Sub-Adviser, and as a shareholder of the Sub-Adviser’s parent company. Both as a Trustee and as an officer, he serves for an indefinite term, or until his resignation, retirement, death or removal. Mr. Glavin’s address is Two World Financial Center, 225 Liberty Street, 11th Floor, New York, New York 10281-1008. | |
William F. Glavin, Jr., Trustee (since 2013), President and Principal Executive Officer (since 2009) Year of Birth: 1958 | Director, Chairman and Chief Executive Officer of the Manager (since January 2013); President of the Manager (January 2013-May 2013); Chairman of the Sub-Adviser (December 2009-December 2012); Chief Executive Officer (January 2009-December 2012) and Director of the Sub-Adviser (since January 2009); President of the Sub-Adviser (May 2009-December 2012); Management Director (since June 2009), President (since December 2009) and Chief Executive Officer (since January 2011) of Oppenheimer Acquisition Corp. (“OAC”) (the Sub-Adviser’s parent holding company); Director of Oppenheimer Real Asset Management, Inc. (since March 2010); Executive Vice President (March 2006-February 2009) and Chief Operating Officer (July 2007-February 2009) of Massachusetts Mutual Life Insurance Company (OAC’s parent company); Director (May 2004-March 2006) and Chief Operating Officer and Chief Compliance Officer (May 2004-January 2005), President (January 2005-March 2006) and Chief Executive Officer (June 2005- | |
42 OPPENHEIMER PORTFOLIO SERIES EQUITY INVESTOR FUND
| TRUSTEES AND OFFICERS Unaudited / Continued |
William F. Glavin, Jr., Continued | March 2006) of Babson Capital Management LLC; Director (March 2005-March 2006), President (May 2003-March 2006) and Chief Compliance Officer (July 2005-March 2006) of Babson Capital Securities, Inc. (a broker-dealer); President (May 2003-March 2006) of Babson Investment Company, Inc.; Director (May 2004-August 2006) of Babson Capital Europe Limited; Director (May 2004-October 2006) of Babson Capital Guernsey Limited; Director (May 2004-March 2006) of Babson Capital Management LLC; Non-Executive Director (March 2005-March 2007) of Baring Asset Management Limited; Director (February 2005-June 2006) Baring Pension Trustees Limited; Director and Treasurer (December 2003-November 2006) of Charter Oak Capital Management, Inc.; Director (May 2006-September 2006) of C.M. Benefit Insurance Company; Director (May 2008-June 2009) and Executive Vice President (June 2007-July 2009) of C.M. Life Insurance Company; President (March 2006-May 2007) of MassMutual Assignment Company; Director (January 2005-December 2006), Deputy Chairman (March 2005-December 2006) and President (February 2005-March 2005) of MassMutual Holdings (Bermuda) Limited; Director (May 2008-June 2009) and Executive Vice President (June 2007-July 2009) of MML Bay State Life Insurance Company; Chief Executive Officer and President (April 2007-January 2009) of MML Distributors, LLC; and Chairman (March 2006-December 2008) and Chief Executive Officer (May 2007-December 2008) of MML Investors Services, Inc. An officer of 90 portfolios in the OppenheimerFunds complex.
| |
| ||
| OTHER OFFICERS OF THE FUND | The addresses of the Officers in the chart below are as follows: for Messrs. Hamilton, Gabinet and Ms. Nasta, Two World Financial Center, 225 Liberty Street, New York, New York 10281-1008, for Messrs. Vandehey and Wixted, 6803 S. Tucson Way, Centennial, Colorado 80112-3924. Each Officer serves for an indefinite term or until his or her resignation, retirement, death or removal. | |
| ||
Mark Hamilton, Vice President (since 2013) Year of Birth: 1965 | Chief Investment Officer, Asset Allocation of the Sub-Adviser (since April 2013) and a Senior Vice President of the Sub-Adviser (since April 2013). Mr. Hamilton served at AllianceBernstein L.P. (from 1994-2013), as an Investment Director of Dynamic Asset Allocation (from 2010-2013), Head of North American Blend Team (from 2009-2010), and Senior Portfolio Manager of Blend Strategies (from 2006-2010). A portfolio manager and officer of other portfolios in the OppenheimerFunds complex. | |
Arthur S. Gabinet, Secretary and Chief Legal Officer (since 2011) Year of Birth: 1958 | Executive Vice President, Secretary and General Counsel of the Manager (since January 2013); General Counsel OFI SteelPath, Inc. (since January 2013); Executive Vice President (May 2010-December 2012) and General Counsel (since January 2011) of the Sub-Adviser; General Counsel of the Distributor (since January 2011); General Counsel of Centennial Asset Management Corporation (January 2011-December 2012); Executive Vice President (January 2011-December 2012) and General Counsel of HarbourView Asset Management Corporation (since January 2011); Assistant Secretary (since January 2011) and Director (since January 2011) of OppenheimerFunds International Ltd. and OppenheimerFunds plc; Director of Oppenheimer Real Asset Management, Inc. (January 2011-December 2012) and General Counsel (since January 2011); Executive Vice President (January 2011-December 2011) and General Counsel of Shareholder Financial Services, Inc. and Shareholder Services, Inc. (since January 2011); Executive Vice President (January 2011-December 2012) and General Counsel of OFI Private Investments Inc. (since January 2011); Vice President of OppenheimerFunds | |
43 OPPENHEIMER PORTFOLIO SERIES EQUITY INVESTOR FUND
| TRUSTEES AND OFFICERS Unaudited / Continued |
Arthur S. Gabinet, Continued | Legacy Program (January 2011-December 2011); Executive Vice President (January 2011-December 2012) and General Counsel of OFI Institutional Asset Management, Inc. (since January 2011); General Counsel, Asset Management of the Sub-Adviser (May 2010-December 2010); Principal, The Vanguard Group (November 2005-April 2010); District Administrator, U.S. Securities and Exchange Commission (January 2003-October 2005). An officer of 90 portfolios in the OppenheimerFunds complex. | |
Christina M. Nasta, Vice President and Chief Business Officer (since 2011) Year of Birth: 1973 | Senior Vice President of OppenheimerFunds Distributor, Inc. (since January 2013); Senior Vice President of the Sub-Adviser (July 2010-December 2012); Vice President of the Sub-Adviser (January 2003-July 2010); Vice President of OppenheimerFunds Distributor, Inc. (January 2003-July 2010). An officer of 90 portfolios in the OppenheimerFunds complex. | |
Mark S. Vandehey, Vice President and Chief Compliance Officer (since 2005) Year of Birth: 1950 | Senior Vice President and Chief Compliance Officer of the Manager (since January 2013); Chief Compliance Officer of OFI SteelPath, Inc. (since January 2013); Senior Vice President of the Sub-Adviser (March 2004-December 2012); Chief Compliance Officer of the Sub-Adviser, OppenheimerFunds Distributor, Inc., OFI Trust Company, OFI Institutional Asset Management, Inc., Oppenheimer Real Asset Management, Inc., OFI Private Investments, Inc., Harborview Asset Management Corporation, Trinity Investment Management Corporation, and Shareholder Services, Inc. (since March 2004); Vice President of OppenheimerFunds Distributor, Inc., Centennial Asset Management Corporation and Shareholder Services, Inc. (June 1983-December 2012). An officer of 90 portfolios in the OppenheimerFunds complex. | |
Brian W. Wixted, Treasurer and Principal Financial & Accounting Officer (since 2005) Year of Birth: 1959 | Senior Vice President of the Manager (since January 2013); Treasurer of the Sub-Adviser, HarbourView Asset Management Corporation, Shareholder Financial Services, Inc., Shareholder Services, Inc., and Oppenheimer Real Asset Management, Inc. (March 1999-June 2008), OFI Private Investments, Inc. (March 2000-June 2008), OppenheimerFunds International Ltd. and OppenheimerFunds plc (since May 2000), OFI Institutional Asset Management, Inc. (November 2000-June 2008), and OppenheimerFunds Legacy Program (charitable trust program established by the Sub-Adviser) (June 2003-December 2011); Treasurer and Chief Financial Officer of OFI Trust Company (since May 2000); Assistant Treasurer of Oppenheimer Acquisition Corporation (March 1999-June 2008). An officer of 90 portfolios in the OppenheimerFunds complex. | |
The Fund’s Statement of Additional Information contains additional information about the Fund’s Trustees and Officers and is available without charge upon request, by calling 1.800.CALL-OPP (225-5677).
44 OPPENHEIMER PORTFOLIO SERIES EQUITY INVESTOR FUND
OPPENHEIMER PORTFOLIO SERIES EQUITY INVESTOR FUND | ||
| Manager | OFI Global Asset Management, Inc. | |||
| Sub-Adviser | OppenheimerFunds, Inc. | |||
| Distributor | OppenheimerFunds Distributor, Inc. | |||
Transfer and Shareholder Servicing Agent | OFI Global Asset Management, Inc. | |||
| Sub-Transfer Agent | Shareholder Services, Inc. | |||
| DBA OppenheimerFunds Services | ||||
Independent Registered Public Accounting Firm | KPMG LLP | |||
| Legal Counsel | Kramer Levin Naftalis & Frankel LLP | |||
© 2014 OppenheimerFunds, Inc. All rights reserved.
45 OPPENHEIMER PORTFOLIO SERIES EQUITY INVESTOR FUND
| PRIVACY POLICY NOTICE |
As an Oppenheimer fund shareholder, you are entitled to know how we protect your personal information and how we limit its disclosure.
Information Sources
We obtain nonpublic personal information about our shareholders from the following sources:
| • | Applications or other forms |
| • | When you create a user ID and password for online account access |
| • | When you enroll in eDocs Direct, our electronic document delivery service |
| • | Your transactions with us, our affiliates or others |
| • | A software program on our website, often referred to as a “cookie,” which indicates which parts of our site you’ve visited |
| • | When you set up challenge questions to reset your password online |
If you visit oppenheimerfunds.com and do not log on to the secure account information areas, we do not obtain any personal information about you. When you do log on to a secure area, we do obtain your user ID and password to identify you. We also use this information to provide you with products and services you have requested, to inform you about products and services that you may be interested in and assist you in other ways.
We do not collect personal information through our website unless you willingly provide it to us, either directly by email or in those areas of the website that request information. In order to update your personal information (including your mailing address, email address and phone number) you must first log on and visit your user profile.
If you have set your browser to warn you before accepting cookies, you will receive the warning message with each cookie. You can refuse cookies by turning them off in your browser. However, doing so may limit your access to certain sections of our website.
We use cookies to help us improve and manage our website. For example, cookies help us recognize new versus repeat visitors to the site, track the pages visited, and enable some special features on the website. This data helps us provide a better service for our website visitors.
Protection of Information
We do not disclose any non-public personal information (such as names on a customer list) about current or former customers to anyone, except as permitted by law.
Disclosure of Information
We send your financial advisor (as designated by you) copies of confirmations, account statements and other documents reporting activity in your fund accounts. We may also use details about you and your investments to help us, our financial service affiliates, or firms that jointly market their financial products and services with ours, to better serve your investment needs or suggest financial services or educational material that may be of interest to you. If this requires us to provide you with an opportunity to “opt in” or “opt out” of such information sharing with a firm not affiliated with us, you will receive notification on how to do so, before any such sharing takes place.
Right of Refusal
We will not disclose your personal information to unaffiliated third parties (except as permitted by law), unless we first offer you a reasonable opportunity to refuse or “opt out” of such disclosure.
46 OPPENHEIMER PORTFOLIO SERIES EQUITY INVESTOR FUND
| PRIVACY POLICY NOTICE Continued |
Internet Security and Encryption
In general, the email services provided by our website are encrypted and provide a secure and private means of communication with us. To protect your own privacy, confidential and/or personal information should only be communicated via email when you are advised that you are using a secure website.
As a security measure, we do not include personal or account information in non-secure emails, and we advise you not to send such information to us in non-secure emails. Instead, you may take advantage of the secure features of our website to encrypt your email correspondence. To do this, you will need to use a browser that supports Secure Sockets Layer (SSL) protocol.
We do not guarantee or warrant that any part of our website, including files available for download, are free of viruses or other harmful code. It is your responsibility to take appropriate precautions, such as use of an anti-virus software package, to protect your computer hardware and software.
— All transactions, including redemptions, exchanges and purchases, are secured by SSL and 128-bit encryption. SSL is used to establish a secure connection between your PC and OppenheimerFunds’ server. It transmits information in an encrypted and scrambled format.
— Encryption is achieved through an electronic scrambling technology that uses a “key” to code and then decode the data. Encryption acts like the cable converter box you may have on your television set. It scrambles data with a secret code so that no one can make sense of it while it is being transmitted. When the data reaches its destination, the same software unscrambles the data.
— You can exit the secure area by either closing your browser, or for added security, you can use the Log Out button before you close your browser.
Other Security Measures
We maintain physical, electronic and procedural safeguards to protect your personal account information. Our employees and agents have access to that information only so that they may offer you products or provide services, for example, when responding to your account questions.
How You Can Help
You can also do your part to keep your account information private and to prevent unauthorized transactions. If you obtain a user ID and password for your account, do not allow it to be used by anyone else. Also, take special precautions when accessing your account on a computer used by others.
Who We Are
This joint notice describes the privacy policies of the Oppenheimer funds, OppenheimerFunds, Inc., and each of its investment adviser subsidiaries, OppenheimerFunds Distributor, Inc. and OFI Global Trust Co. It applies to all Oppenheimer fund accounts you presently have, or may open in the future, using your Social Security number—whether or not you remain a shareholder of our funds. This notice was last updated November 2013. In the event it is updated or changed, we will post an updated notice on our website at oppenheimerfunds.com. If you have any questions about these privacy policies, write to us at P.O. Box 5270, Denver, CO 80217-5270, email us by clicking on the Contact Us section of our website at oppenheimerfunds.com or call us at 1.800.CALL OPP (225.5677).
47 OPPENHEIMER PORTFOLIO SERIES EQUITY INVESTOR FUND

Item 2. Code of Ethics.
The registrant has adopted a code of ethics that applies to the registrant’s principal executive officer, principal financial officer, principal accounting officer or controller or persons performing similar functions.
Item 3. Audit Committee Financial Expert.
The Board of Trustees of the registrant has determined that David Downes, the Board’s Audit Committee Chairman, is an audit committee financial expert and that Mr. Downes is “independent” for purposes of this Item 3.
Item 4. Principal Accountant Fees and Services.
| (a) | Audit Fees |
The principal accountant for the audit of the registrant’s annual financial statements billed $78,300 in fiscal 2014 and $76,600 in fiscal 2013.
| (b) | Audit-Related Fees |
The principal accountant for the audit of the registrant’s annual financial statements billed no such fees in fiscal 2014 and $24,450 in fiscal 2013.
The principal accountant for the audit of the registrant’s annual financial statements billed $662,465 in fiscal 2014 and $299,639 in fiscal 2013 to the registrant’s investment adviser or any entity controlling, controlled by, or under common control with the adviser that provides ongoing services to the registrant.
Such services include: Internal control reviews, GIPS attestation procedures, internal audit training, Surprise Exam, system conversion testing, and company reorganization
| (c) | Tax Fees |
The principal accountant for the audit of the registrant’s annual financial statements billed no such fees in fiscal 2014 and no such fees in fiscal 2013.
The principal accountant for the audit of the registrant’s annual financial statements billed $581,620 in fiscal 2014 and $451,924 in fiscal 2013 to the registrant’s investment adviser or any entity controlling, controlled by, or under common control with the adviser that provides ongoing services to the registrant.
Such services include: tax compliance, tax planning and tax advice. Tax compliance generally involves preparation of original and amended tax returns, claims for a refund and tax payment-planning services. Tax planning and tax advice includes assistance with tax audits and appeals, tax advice related to mergers and acquisitions and requests for rulings or technical advice from taxing authorities.
| (d) | All Other Fees |
The principal accountant for the audit of the registrant’s annual financial statements billed no such fees in fiscal 2014 and no such fees in fiscal 2013.
The principal accountant for the audit of the registrant’s annual financial statements billed no such fees in fiscal 2014 and no such fees in fiscal 2013 to the registrant’s investment adviser or any entity controlling, controlled by, or under common control with the adviser that provides ongoing services to the registrant.
Such fees would include the cost to the principal accountant of attending audit committee meetings and consultations regarding the registrant’s retirement plan with respect to its Trustees.
| (e) | (1) During its regularly scheduled periodic meetings, the registrant’s audit committee will pre-approve all audit, audit-related, tax and other services to be provided by the principal accountants of the registrant. |
The audit committee has delegated pre-approval authority to its Chairman for any subsequent new engagements that arise between regularly scheduled meeting dates provided that any fees such pre-approved are presented to the audit committee at its next regularly scheduled meeting.
Under applicable laws, pre-approval of non-audit services may be waived provided that: 1) the aggregate amount of all such services provided constitutes no more than five percent of the total amount of fees paid by the registrant to its principal accountant during the fiscal year in which services are provided 2) such services were not recognized by the registrant at the time of engagement as non-audit services and 3) such services are promptly brought to the attention of the audit committee of the registrant and approved prior to the completion of the audit.
(2) 0%
| (f) | Not applicable as less than 50%. |
| (g) | The principal accountant for the audit of the registrant’s annual financial statements billed $1,244,085 in fiscal 2014 and $776,013 in fiscal 2013 to the registrant and the registrant’s investment adviser or any entity controlling, controlled by, or under common control with the adviser that provides ongoing services to the registrant related to non-audit fees. Those billings did not include any prohibited non-audit services as defined by the Securities Exchange Act of 1934. |
| (h) | The registrant’s audit committee of the board of Trustees has considered whether the provision of non-audit services that were rendered to the registrant’s investment adviser, and any entity controlling, controlled by, or under common control with the investment adviser that provides ongoing services to the registrant that were not pre-approved pursuant to paragraph (c)(7)(ii) of Rule 2-01 of Regulation S-X is compatible with maintaining the principal accountant’s independence. No such services were rendered. |
Item 5. Audit Committee of Listed Registrants
Not applicable.
Item 6. Schedule of Investments.
a) Not applicable. The complete schedule of investments is included in Item 1 of this Form N-CSR.
b) Not applicable.
Item 7. Disclosure of Proxy Voting Policies and Procedures for Closed-End Management Investment Companies.
Not applicable.
Item 8. Portfolio Managers of Closed-End Management Investment Companies.
Not applicable.
Item 9. Purchases of Equity Securities by Closed-End Management Investment Company and Affiliated Purchasers.
Not applicable.
Item 10. Submission of Matters to a Vote of Security Holders.
The Fund’s Governance Committee Provisions with Respect to Nominations of Directors/Trustees to the Respective Boards
None
Item 11. Controls and Procedures.
Based on their evaluation of the registrant’s disclosure controls and procedures (as defined in rule 30a-3(c) under the Investment Company Act of 1940 (17 CFR 270.30a-3(c)) as of 1/31/2014, the registrant’s principal executive officer and principal financial officer found the registrant’s disclosure controls and procedures to provide reasonable assurances that information required to be disclosed by the registrant in the reports that it files under the Securities Exchange Act of 1934 (a) is accumulated and communicated to registrant’s management, including its principal executive officer and principal financial officer, to allow timely decisions regarding required disclosure, and (b) is recorded, processed, summarized and reported, within the time periods specified in the rules and forms adopted by the U.S. Securities and Exchange Commission.
There have been no changes in the registrant’s internal controls over financial reporting that occurred during the registrant’s second fiscal quarter of the period covered by this report that have materially affected, or are reasonably likely to materially affect, the registrant’s internal control over financial reporting.
Item 12. Exhibits.
| (a) | (1) Exhibit attached hereto. |
(2) Exhibits attached hereto.
(3) Not applicable.
| (b) | Exhibit attached hereto. |
SIGNATURES
Pursuant to the requirements of the Securities Exchange Act of 1934 and the Investment Company Act of 1940, the registrant has duly caused this report to be signed on its behalf by the undersigned, thereunto duly authorized.
Oppenheimer Portfolio Series
| By: | /s/ William F. Glavin, Jr. | |
| William F. Glavin, Jr. | ||
| Principal Executive Officer | ||
| Date: | 3/13/2014 | |
Pursuant to the requirements of the Securities Exchange Act of 1934 and the Investment Company Act of 1940, this report has been signed below by the following persons on behalf of the registrant and in the capacities and on the dates indicated.
| By: | /s/ William F. Glavin, Jr. | |
| William F. Glavin, Jr. | ||
| Principal Executive Officer | ||
| Date: | 3/13/2014 | |
| By: | /s/ Brian W. Wixted | |
| Brian W. Wixted | ||
| Principal Financial Officer | ||
| Date: | 3/13/2014 | |