UNITED STATES
SECURITIES AND EXCHANGE COMMISSION
WASHINGTON, D.C. 20549
FORM N-CSR
CERTIFIED SHAREHOLDER REPORT OF REGISTERED MANAGEMENT
INVESTMENT COMPANIES
Investment Company Act file number 811-21686
Oppenheimer Portfolio Series
(Exact name of registrant as specified in charter)
6803 South Tucson Way, Centennial, Colorado 80112-3924
(Address of principal executive offices) (Zip code)
Cynthia Lo Bessette
OFI Global Asset Management, Inc.
225 Liberty Street, New York, New York 10281-1008
(Name and address of agent for service)
Registrant’s telephone number, including area code: (303) 768-3200
Date of fiscal year end: January 31
Date of reporting period: 1/31/2017
Item 1. Reports to Stockholders.
Table of Contents
Class A Shares
AVERAGE ANNUAL TOTAL RETURNS AT 1/31/17
| | | | | | | | |
| | | Class A Shares of the Fund | | | | |
| | | Without Sales Charge | | With Sales Charge | | Bloomberg Barclays
U.S. Aggregate Bond
Index | | S&P 500 Index |
1-Year | | 7.92% | | 1.71% | | 1.45% | | 20.04% |
|
5-Year | | 4.14 | | 2.92 | | 2.09 | | 14.09 |
|
10-Year | | 0.84 | | 0.25 | | 4.37 | | 6.99 |
|
Performance data quoted represents past performance, which does not guarantee future results. The investment return and principal value of an investment in the Fund will fluctuate so that an investor’s shares, when redeemed, may be worth more or less than their original cost. Fund returns include changes in share price, reinvested distributions, and a 5.75% maximum applicable sales charge except where “without sales charge” is indicated. Current performance may be lower or higher than the performance quoted. Returns do not consider capital gains or income taxes on an individual’s investment. For performance data current to the most recent month-end, visit oppenheimerfunds.com or call 1.800.CALL OPP (225.5677). See Fund prospectuses and summary prospectuses for more information on share classes and sales charges.
2 OPPENHEIMER PORTFOLIO SERIES CONSERVATIVE INVESTOR FUND
Fund Performance Discussion1
MARKET OVERVIEW
Markets were volatile this reporting period. Central Bank policy was a major focus this reporting period, with statements and actions from the Federal Reserve (the “Fed”), Bank of Japan (BoJ), European Central Bank (“ECB”), and more, fueling movements in global capital markets. Throughout most of the year, the question of when the Fed would raise interest rates remained. It finally did in the closing month of the reporting period. Improved economic data and outlook led the Fed to hike its policy rates by 0.25% in December, meeting market expectations. The Fed’s policymaking Federal Open Market Committee noted they will continue to be cautious and will hike rates gradually, but posted a modestly optimistic outlook. By year end, markets were pricing for slightly more than two hikes by the end of 2017.
Other major events that created volatility during the year were the United Kingdom’s (“UK”) vote to leave the European Union (commonly referred to as Brexit) and the U.S. Presidential election. After Brexit, U.S. markets became extremely volatile for two days. However, the event came and went with most financial assets rallying strong early in the third quarter.
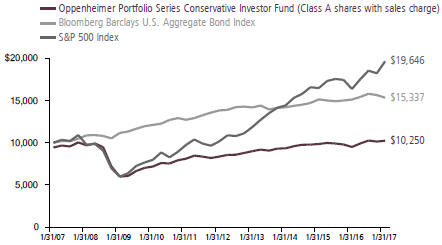
COMPARISON OF CHANGE IN VALUE OF $10,000 HYPOTHETICAL INVESTMENTS IN:
1. The Fund is invested in Class I shares of all underlying funds discussed in this Fund Performance Discussion, except for Oppenheimer Master Loan Fund, LLC, which does not offer Class I shares.
3 OPPENHEIMER PORTFOLIO SERIES CONSERVATIVE INVESTOR FUND
Markets turned to general risk on mode after the surprise election of Donald Trump with equities climbing, credit spreads narrowing to the tightest levels since early 2015, and U.S. Treasury yields climbing to levels not experienced since 2014. The dollar rallied strongly against many currencies, particularly after Mr. Trump’s victory.
In this environment, equities generally produced strong results and outperformed fixed-income securities for the overall one-year period.
FUND REVIEW
Against this market backdrop, the Fund’s Class A shares (without sales charge) produced a total return of 7.92%. The Fund employs a combination of sophisticated quantitative tools and qualitative analysis to seek to construct a well-diversified, globally allocated portfolio. The portfolio is allocated among a number of OppenheimerFunds’ actively managed funds according to risk and strategically rebalanced based on market conditions. At period end, the Fund had roughly 53% of its assets in fixed income funds, 28% in equity funds and 19% in alternative funds. In an environment that favored equities over fixed-income, the Fund’s diversified allocation resulted in outperformance versus the Bloomberg Barclays U.S. Aggregate Bond Index’s return of 1.45% and underperformance versus the S&P 500 Index’s return of 20.04%.
Equity funds produced the strongest contribution to the Fund’s total return, with domestic equity funds leading the way. All of the Fund’s domestic equity holdings provided positive returns. Oppenheimer Value Fund was the strongest performer for the Fund this reporting period, followed by Oppenheimer Capital Appreciation Fund. Oppenheimer Value Fund typically invests in large company U.S. value stocks. Value stocks outperformed growth stocks for much of the period, and this benefited Oppenheimer Value Fund’s performance. Oppenheimer Capital Appreciation Fund typically invests in large-cap U.S. growth stocks. Effective October 5, 2016, the new Portfolio Manager of this underlying fund is Paul Larson, who joined OppenheimerFunds in 2013 and has 20 years of investment experience. This underlying fund produced positive results. While still remaining a growth fund, the new portfolio management team has reduced the number of holdings and reduced some previously large sector bets relative to its benchmark, the Russell 1000 Growth Index.
All of the underlying foreign equity funds produced positive results for the Fund this period as well, led by Oppenheimer International Equity Fund (named Oppenheimer International Value Fund prior to 12/28/16), Oppenheimer Developing Markets Fund, and Oppenheimer International Growth Fund. Oppenheimer International Equity Fund typically invests in international
4 OPPENHEIMER PORTFOLIO SERIES CONSERVATIVE INVESTOR FUND
stocks that its portfolio manager believes are undervalued. This underlying fund favors a blend/core approach, but its emphasis on value stocks this reporting period had a positive impact on performance as value generally outperformed growth for much of the period. Oppenheimer Developing Markets Fund invests in developing market stocks. Developing market stocks performed well in 2016, supported by the bottoming of both oil prices and domestic growth conditions across the emerging markets. Despite performance reversing a bit following the outcome of the U.S. election, the asset class rebounded in January 2017 as the initial negative reaction began to subside. Oppenheimer International Growth Fund invests in a mix of foreign growth stocks. This underlying fund produced positive absolute results during the period, but its performance was held back a degree by its roughly 19% position in the UK at period end, aggravated by weakening pound versus the U.S. dollar. However, most of its UK-domiciled companies are global businesses with revenues from around the world. Translating those revenues into cheaper pounds should flatter their earnings over time.
Although fixed-income underperformed equities this reporting period, the Fund did receive positive contributions from each of its fixed-income holdings, led by its exposure to senior loans through Oppenheimer Master Loan Fund, LLC. During the period, loans
experienced strong demand due to their attractive income and low interest rate sensitivity. Oppenheimer International Bond Fund and Oppenheimer Core Bond Fund were also top performers in the fixed-income space. Oppenheimer International Bond Fund typically invests in international fixed income securities in both developed and emerging market countries. This underlying fund invests in three major risk categories, or levers – interest rates (typically government bonds), currencies, and credit (corporate bonds and other fixed-income instruments containing credit risk). All three areas produced positive absolute results. Oppenheimer Core Bond Fund, which typically invests in U.S. investment-grade fixed income instruments, produced positive results this period. This underlying fund’s investment team continued to favor diversified corporate and structured credit exposure. However, the team is more cautious on credit in general as it believes we currently reside in the second half of the credit cycle.
The Fund’s allocation to alternative funds also produced positive absolute returns. The strongest contributor to the Fund’s performance in this area was Oppenheimer
Gold & Special Minerals Fund. Over the first half of the reporting period, investors flocked to gold bullion and gold stocks as they sought refuge from global economic challenges. Gold stocks reversed course over the second half of the reporting period as investors’ risk
5 OPPENHEIMER PORTFOLIO SERIES CONSERVATIVE INVESTOR FUND
appetites grew and they shifted assets away from traditional safe havens. However, this reversal was not enough to offset the strong results over the first half of the period.
| | |
 | |  |
| | Mark Hamilton Portfolio Manager |
| |
| | |
 | |  |
| | Dokyoung Lee, CFA Portfolio Manager |
| |
6 OPPENHEIMER PORTFOLIO SERIES CONSERVATIVE INVESTOR FUND
Top Holdings and Allocations
ASSET CLASS ALLOCATION
| | |
Domestic Fixed Income Funds | | 42.4% |
Domestic Equity Funds | | 23.4 |
Alternative Funds | | 19.0 |
Foreign Fixed Income Funds | | 10.8 |
Foreign Equity Funds | | 4.3 |
Money Market Funds | | 0.1 |
Portfolio holdings and allocations are subject to change. Percentages are as of January 31, 2017, and are based on the total market value of investments.
TOP TEN HOLDINGS
| | |
| Oppenheimer Core Bond Fund, Cl. I | | 25.8% |
| Oppenheimer Limited-Term Government Fund, Cl. I | | 11.3 |
| Oppenheimer International Bond Fund, Cl. I | | 10.8 |
| Oppenheimer Value Fund, Cl. I | | 10.4 |
| Oppenheimer Capital Appreciation Fund, Cl. I | | 9.4 |
| Oppenheimer Master Inflation Protected Securities Fund, LLC | | 7.3 |
| Oppenheimer Master Loan Fund, LLC | | 5.3 |
| Oppenheimer Global Multi Strategies Fund, Cl. I | | 4.5 |
| Oppenheimer Real Estate Fund, Cl. I | | 3.2 |
| Oppenheimer Fundamental Alternatives Fund, Cl. I | | 2.2 |
Portfolio holdings and allocations are subject to change. Percentages are as of January 31, 2017, and are based on net assets. For more current Top 10 Fund holdings, please visit oppenheimerfunds.com.
7 OPPENHEIMER PORTFOLIO SERIES CONSERVATIVE INVESTOR FUND
Share Class Performance
AVERAGE ANNUAL TOTAL RETURNS WITHOUT SALES CHARGE AS OF 1/31/17
| | | | | | | | | | | | | | | | | | | | | | | | | | | | | | | | |
| | | Inception Date | | | | | | 1-Year | | | | | | 5-Year | | | | | | 10-Year | | | | |
Class A (OACIX) | | | 4/5/05 | | | | | | | | 7.92 | % | | | | | | | 4.14 | % | | | | | | | 0.84 | % | | | | |
Class B (OBCIX) | | | 4/5/05 | | | | | | | | 7.12 | | | | | | | | 3.35 | | | | | | | | 0.33 | | | | | |
Class C (OCCIX) | | | 4/5/05 | | | | | | | | 7.28 | | | | | | | | 3.39 | | | | | | | | 0.07 | | | | | |
Class R (ONCIX) | | | 4/5/05 | | | | | | | | 7.71 | | | | | | | | 3.89 | | | | | | | | 0.55 | | | | | |
Class Y (OYCIX) | | | 4/5/05 | | | | | | | | 8.27 | | | | | | | | 4.42 | | | | | | | | 1.13 | | | | | |
| |
AVERAGE ANNUAL TOTAL RETURNS WITH SALES CHARGE AS OF 1/31/17 | | | | | |
| | | Inception Date | | | | | | 1-Year | | | | | | 5-Year | | | | | | 10-Year | | | | |
Class A (OACIX) | | | 4/5/05 | | | | | | | | 1.71 | % | | | | | | | 2.92 | % | | | | | | | 0.25 | % | | | | |
Class B (OBCIX) | | | 4/5/05 | | | | | | | | 2.12 | | | | | | | | 3.00 | | | | | | | | 0.33 | | | | | |
Class C (OCCIX) | | | 4/5/05 | | | | | | | | 6.28 | | | | | | | | 3.39 | | | | | | | | 0.07 | | | | | |
Class R (ONCIX) | | | 4/5/05 | | | | | | | | 7.71 | | | | | | | | 3.89 | | | | | | | | 0.55 | | | | | |
Class Y (OYCIX) | | | 4/5/05 | | | | | | | | 8.27 | | | | | | | | 4.42 | | | | | | | | 1.13 | | | | | |
Performance data quoted represents past performance, which does not guarantee future results. The investment return and principal value of an investment in the Fund will fluctuate so that an investor’s shares, when redeemed, may be worth more or less than their original cost. Current performance may be lower or higher than the performance quoted. Returns do not consider capital gains or income taxes on an individual’s investment. For performance data current to the most recent month-end, visit oppenheimerfunds.com or call 1.800. CALL OPP (225.5677). Fund returns include changes in share price, reinvested distributions, and the applicable sales charge: for Class A shares, the current maximum initial sales charge of 5.75%; for Class B shares, the contingent deferred sales charge (“CDSC”) of 5% (1-year) and 2% (5-year); and for Class C shares, the contingent deferred sales charge (“CDSC”) of 1% for the 1-year period. There is no sales charge for Class Y shares. Because Class B shares convert to Class A shares 72 months after purchase, 10-year returns for Class B shares reflect Class A performance for the period after conversion. See Fund prospectuses and summary prospectuses for more information on share classes and sales charges.
The Fund’s performance is compared to the performance of the S&P 500 Index and the Bloomberg Barclays U.S. Aggregate Bond Index. The S&P 500 Index is a capitalization-weighted index of 500 stocks intended to be a representative sample of leading companies in leading industries within the U.S. economy. The Bloomberg Barclays U.S. Aggregate Bond Index is an index of U.S.-dollar-denominated, investment-grade U.S. corporate government and mortgage-backed securities. The indices are unmanaged and cannot be purchased directly by investors. While index comparisons may be useful to provide a benchmark for the Fund’s performance, it must be noted that the Fund’s investments are not limited to the investments comprising the indices. Index performance includes reinvestment of income, but does not reflect transaction costs, fees, expenses or taxes. Index performance is shown for illustrative purposes only as a benchmark for the Fund’s performance, and does not predict or depict
8 OPPENHEIMER PORTFOLIO SERIES CONSERVATIVE INVESTOR FUND
performance of the Fund. The Fund’s performance reflects the effects of the Fund’s business and operating expenses.
The Fund’s investment strategy and focus can change over time. The mention of specific fund holdings does not constitute a recommendation by OppenheimerFunds, Inc. or its affiliates.
Before investing in any of the Oppenheimer funds, investors should carefully consider a fund’s investment objectives, risks, charges and expenses. Fund prospectuses and summary prospectuses contain this and other information about the funds, and may be obtained by asking your financial advisor, visiting oppenheimerfunds.com, or calling 1.800.CALL OPP (225.5677). Read prospectuses and summary prospectuses carefully before investing.
Shares of Oppenheimer funds are not deposits or obligations of any bank, are not guaranteed by any bank, are not insured by the FDIC or any other agency, and involve investment risks, including the possible loss of the principal amount invested.
9 OPPENHEIMER PORTFOLIO SERIES CONSERVATIVE INVESTOR FUND
Fund Expenses
Fund Expenses. As a shareholder of the Fund, you incur two types of costs: (1) transaction costs, which may include sales charges (loads) on purchase payments and/or contingent deferred sales charges on redemptions; and (2) ongoing costs, including management fees; distribution and service fees; and other Fund expenses. These examples are intended to help you understand your ongoing costs (in dollars) of investing in the Fund and to compare these costs with the ongoing costs of investing in other mutual funds.
The examples are based on an investment of $1,000.00 invested at the beginning of the period and held for the entire 6-month period ended January 31, 2017.
Actual Expenses. The first section of the table provides information about actual account values and actual expenses. You may use the information in this section for the class of shares you hold, together with the amount you invested, to estimate the expense that you paid over the period. Simply divide your account value by $1,000.00 (for example, an $8,600.00 account value divided by $1,000.00 = 8.60), then multiply the result by the number in the first section under the heading entitled “Expenses Paid During 6 Months Ended January 31, 2017” to estimate the expenses you paid on your account during this period.
Hypothetical Example for Comparison Purposes. The second section of the table provides information about hypothetical account values and hypothetical expenses based on the Fund’s actual expense ratio for each class of shares, and an assumed rate of return of 5% per year for each class before expenses, which is not the Fund’s actual return. The hypothetical account values and expenses may not be used to estimate the actual ending account balance or expenses you paid for the period. You may use this information to compare the ongoing costs of investing in the Fund and other funds. To do so, compare this 5% hypothetical example for the class of shares you hold with the 5% hypothetical examples that appear in the shareholder reports of the other funds.
Please note that the expenses shown in the table are meant to highlight your ongoing costs only and do not reflect any transactional costs, such as front-end or contingent deferred sales charges (loads). Therefore, the “hypothetical” section of the table is useful in comparing ongoing costs only, and will not help you determine the relative total costs of owning different funds. In addition, if these transactional costs were included, your costs would have been higher.
10 OPPENHEIMER PORTFOLIO SERIES CONSERVATIVE INVESTOR FUND
| | | | | | | | | | | | |
| Actual | | Beginning Account Value August 1, 2016 | | | | Ending Account Value January 31, 2017 | | | | Expenses Paid During
6 Months Ended January 31, 2017 | | |
Class A | | $ 1,000.00 | | | | $ 998.50 | | | | $ 2.21 | | |
Class B | | 1,000.00 | | | | 994.30 | | | | 6.08 | | |
Class C | | 1,000.00 | | | | 994.90 | | | | 5.99 | | |
Class R | | 1,000.00 | | | | 997.60 | | | | 3.47 | | |
Class Y | | 1,000.00 | | | | 999.80 | | | | 0.96 | | |
Hypothetical (5% return before expenses) | | | | | | | | | | | | |
Class A | | 1,000.00 | | | | 1,022.92 | | | | 2.24 | | |
Class B | | 1,000.00 | | | | 1,019.05 | | | | 6.16 | | |
Class C | | 1,000.00 | | | | 1,019.15 | | | | 6.06 | | |
Class R | | 1,000.00 | | | | 1,021.67 | | | | 3.51 | | |
Class Y | | 1,000.00 | | | | 1,024.18 | | | | 0.97 | | |
Expenses are equal to the Fund’s annualized expense ratio for that class, multiplied by the average account value over the period, multiplied by 184/366 (to reflect the one-half year period). Those annualized expense ratios, excluding indirect expenses from affiliated funds, based on the 6-month period ended January 31, 2017 are as follows:
| | | | | | | | |
| Class | | Expense Ratios | | | | |
Class A | | | 0.44 | % | | | | |
Class B | | | 1.21 | | | | | |
Class C | | | 1.19 | | | | | |
Class R | | | 0.69 | | | | | |
Class Y | | | 0.19 | | | | | |
The expense ratios reflect voluntary and/or contractual waivers and/or reimbursements of expenses by the Fund’s Manager. Some of these undertakings may be modified or terminated at any time, as indicated in the Fund’s prospectus. The “Financial Highlights” tables in the Fund’s financial statements, included in this report, also show the gross expense ratios, without such waivers or reimbursements and reduction to custodian expenses, if applicable.
11 OPPENHEIMER PORTFOLIO SERIES CONSERVATIVE INVESTOR FUND
STATEMENT OF INVESTMENTS January 31, 2017
| | | | | | | | |
| | | Shares | | | Value | |
| |
Investment Companies—100.0%1 | |
Alternative Funds—19.0% | | | | | | | | |
Oppenheimer Fundamental Alternatives Fund, Cl. I | | | 520,002 | | | $ | 14,248,061 | |
| |
Oppenheimer Global Multi Strategies Fund, Cl. I | | | 1,218,770 | | | | 28,165,779 | |
| |
Oppenheimer Gold & Special Minerals Fund, Cl. I | | | 649,773 | | | | 11,104,615 | |
| |
Oppenheimer Master Inflation Protected Securities Fund, LLC | | | 3,849,228 | | | | 45,996,233 | |
| |
Oppenheimer Real Estate Fund, Cl. I | | | 807,449 | | | | 20,178,154 | |
| | | | | | | | |
| | | | | | | 119,692,842 | |
| |
Domestic Equity Funds—23.4% | | | | | | | | |
Oppenheimer Capital Appreciation Fund, Cl. I | | | 1,047,702 | | | | 59,331,381 | |
| |
Oppenheimer Main Street Mid Cap Fund, Cl. I | | | 397,772 | | | | 11,734,267 | |
| |
Oppenheimer Main Street Small Cap Fund, Cl. I | | | 747,643 | | | | 10,676,341 | |
| |
Oppenheimer Value Fund, Cl. I | | | 1,862,407 | | | | 65,761,587 | |
| | | | | | | | |
| | | | | | | 147,503,576 | |
| |
Domestic Fixed Income Funds—42.4% | | | | | | | | |
Oppenheimer Core Bond Fund, Cl. I | | | 24,074,319 | | | | 162,742,394 | |
| |
Oppenheimer Limited-Term Government Fund, Cl. I | | | 16,199,892 | | | | 71,603,523 | |
| |
Oppenheimer Master Loan Fund, LLC | | | 2,043,568 | | | | 33,132,921 | |
| | | | | | | | |
| | | | | | | 267,478,838 | |
| |
Foreign Equity Funds—4.3% | | | | | | | | |
Oppenheimer Developing Markets Fund, Cl. I | | | 119,978 | | | | 4,025,248 | |
| |
Oppenheimer International Equity Fund, Cl. I | | | 529,090 | | | | 9,322,564 | |
| |
Oppenheimer International Growth Fund, Cl. I | | | 296,019 | | | | 10,517,568 | |
| |
Oppenheimer International Small-Mid Company Fund, Cl. I | | | 83,966 | | | | 3,217,563 | |
| | | | | | | | |
| | | | | | | 27,082,943 | |
| |
Foreign Fixed Income Fund—10.8% | | | | | | | | |
Oppenheimer International Bond Fund, Cl. I | | | 12,062,842 | | | | 68,275,683 | |
| |
Money Market Fund—0.1% | | | | | | | | |
Oppenheimer Institutional Government Money Market Fund, Cl. E, 0.49%2 | | | 865,415 | | | | 865,415 | |
| |
Total Investments, at Value (Cost $602,418,744) | | | 100.0% | | | | 630,899,297 | |
| |
Net Other Assets (Liabilities) | | | (0.0) | | | | (205,119) | |
| | | | |
Net Assets | | | 100.0% | | | $ | 630,694,178 | |
| | | | |
Footnotes to Statement of Investments
1. Is or was an affiliate, as defined in the Investment Company Act of 1940, as amended, at or during the reporting period, by virtue of the Fund owning at least 5% of the voting securities of the issuer or as a result of the Fund and the issuer having the same investment adviser. Transactions during the reporting period in which the issuer was an affiliate are as follows:
| | | | | | | | | | | | | | | | |
| | | Shares
January 29,
2016a | | | Gross
Additions | | | Gross
Reductions | | | Shares
January 31,
2017 | |
| |
Oppenheimer Capital Appreciation Fund, Cl. I | | | 1,007,659 | | | | 114,077 | | | | 74,034 | | | | 1,047,702 | |
Oppenheimer Commodity Strategy Total Return Fund, Cl. I | | | 4,244,615 | | | | 174,756 | | | | 4,419,371 | b | | | — | |
Oppenheimer Core Bond Fund, Cl. I | | | 23,558,093 | | | | 2,366,299 | | | | 1,850,073 | | | | 24,074,319 | |
Oppenheimer Developing Markets Fund, Cl. I | | | 119,970 | | | | 11,727 | | | | 11,719 | | | | 119,978 | |
Oppenheimer Fundamental Alternatives Fund, Cl. I | | | — | | | | 551,886 | | | | 31,884 | | | | 520,002 | |
12 OPPENHEIMER PORTFOLIO SERIES CONSERVATIVE INVESTOR FUND
Footnotes to Statement of Investments (Continued)
| | | | | | | | | | | | | | | | |
| | | Shares
January 29,
2016a | | | Gross Additions | | | Gross
Reductions | | | Shares
January 31, 2017 | |
| |
Oppenheimer Global Multi Strategies Fund, Cl. I | | | 1,123,223 | | | | 190,383 | | | | 94,836 | | | | 1,218,770 | |
Oppenheimer Gold & Special Minerals Fund, Cl. I | | | 609,293 | | | | 95,132 | | | | 54,652 | | | | 649,773 | |
Oppenheimer Institutional Government Money Market Fund, Cl. Ec | | | 7,391,719 | | | | 8,369,642 | | | | 14,895,946 | | | | 865,415 | |
Oppenheimer International Bond Fund, Cl. I | | | 11,556,443 | | | | 1,481,976 | | | | 975,577 | | | | 12,062,842 | |
Oppenheimer International Equity Fund, Cl. Id | | | 519,346 | | | | 55,246 | | | | 45,502 | | | | 529,090 | |
Oppenheimer International Growth Fund, Cl. I | | | 293,348 | | | | 28,904 | | | | 26,233 | | | | 296,019 | |
Oppenheimer International Small- Mid Company Fund, Cl. I | | | 83,888 | | | | 6,337 | | | | 6,259 | | | | 83,966 | |
Oppenheimer Limited-Term Government Fund, Cl. I | | | 15,989,888 | | | | 1,529,784 | | | | 1,319,780 | | | | 16,199,892 | |
Oppenheimer Main Street Mid Cap Fund, Cl. I | | | 387,085 | | | | 38,683 | | | | 27,996 | | | | 397,772 | |
Oppenheimer Main Street Small Cap Fund, Cl. I | | | 746,638 | | | | 61,010 | | | | 60,005 | | | | 747,643 | |
Oppenheimer Master Inflation Protected Securities Fund, LLC | | | 3,873,035 | | | | 288,860 | | | | 312,667 | | | | 3,849,228 | |
Oppenheimer Master Loan Fund, LLC | | | 2,054,602 | | | | 151,524 | | | | 162,558 | | | | 2,043,568 | |
Oppenheimer Real Estate Fund, Cl. I | | | 714,912 | | | | 140,655 | | | | 48,118 | | | | 807,449 | |
Oppenheimer Value Fund, Cl. I | | | 1,833,644 | | | | 171,146 | | | | 142,383 | | | | 1,862,407 | |
| | | | |
| | | | | | Value | | | Income | | | Realized Gain
(Loss) | |
| |
Oppenheimer Capital Appreciation Fund, Cl. Ie | | | | | | $ | 59,331,381 | | | $ | 271,524 | | | $ | 1,280,949 | |
Oppenheimer Commodity Strategy Total Return Fund, Cl. I | | | | | | | — | | | | 111,748 | | | | (5,722,096) | |
Oppenheimer Core Bond Fund, Cl. I | | | | | | | 162,742,394 | | | | 4,533,690 | | | | 1,364,185 | |
Oppenheimer Developing Markets Fund, Cl. I | | | | | | | 4,025,248 | | | | 27,592 | | | | 48,381 | |
Oppenheimer Fundamental Alternatives Fund, Cl. I | | | | | | | 14,248,061 | | | | 103,230 | | | | 4,858 | |
Oppenheimer Global Multi Strategies Fund, Cl. I | | | | | | | 28,165,779 | | | | 2,383,123 | | | | 18,395 | |
Oppenheimer Gold & Special Minerals Fund, Cl. I | | | | | | | 11,104,615 | | | | 685,983 | | | | 144,362 | |
Oppenheimer Institutional Government Money Market Fund, Cl. Ec | | | | | | | 865,415 | | | | 13,104 | | | | — | |
Oppenheimer International Bond Fund, Cl. I | | | | | | | 68,275,683 | | | | 1,723,358 | | | | 151,899 | |
Oppenheimer International Equity Fund, Cl. Id | | | | | | | 9,322,564 | | | | 221,880 | | | | 163,924 | |
Oppenheimer International Growth Fund, Cl. I | | | | | | | 10,517,568 | | | | 157,837 | | | | 348,917 | |
Oppenheimer International Small-Mid Company Fund, Cl. I | | | | | | | 3,217,563 | | | | 18,889 | | | | 119,488 | |
Oppenheimer Limited-Term Government Fund, Cl. I | | | | | | | 71,603,523 | | | | 1,376,729 | | | | 12,742 | |
Oppenheimer Main Street Mid Cap Fund, Cl. If | | | | | | | 11,734,267 | | | | 135,621 | | | | 257,151 | |
Oppenheimer Main Street Small Cap Fund, Cl. I | | | | | | | 10,676,341 | | | | 61,029 | | | | 60,534 | |
Oppenheimer Master Inflation Protected Securities Fund, LLC | | | | | | | 45,996,233 | | | | 904,078h | | | | 156,341h | |
Oppenheimer Master Loan Fund, LLC | | | | | | | 33,132,921 | | | | 1,962,911i | | | | (546,375)i | |
13 OPPENHEIMER PORTFOLIO SERIES CONSERVATIVE INVESTOR FUND
|
| STATEMENT OF INVESTMENTS Continued |
Footnotes to Statement of Investments (Continued)
| | | | | | | | | | | | | | | | |
| | | | | | Value | | | Income | | | Realized Gain
(Loss) | |
| |
Oppenheimer Real Estate Fund, Cl. Ig | | | | | | $ | 20,178,154 | | | $ | 523,747 | | | $ | 804,336 | |
Oppenheimer Value Fund, Cl. I | | | | | | | 65,761,587 | | | | 1,233,503 | | | | 1,981,167 | |
| | | | | | | | |
Total | | | | | | $ | 630,899,297 | | | $ | 16,449,576 | | | $ | 649,158 | |
| | | | | | | | |
a. Represents the last business day of the Fund’s reporting period.
b. Oppenheimer Commodity Strategy Total Return Fund liquidated effective July 15, 2016.
c. Prior to September 28, 2016, this fund was named Oppenheimer Institutional Money Market Fund.
d. Prior to December 28, 2016, this fund was named Oppenheimer International Value Fund.
e. This fund distributed realized gains of $2,150,771.
f. This fund distributed realized gains of $222,179.
g. This fund distributed realized gains of $1,940,706.
h. Represents the amount allocated to the Fund from Oppenheimer Master Inflation Protected Securities Fund, LLC.
i. Represents the amount allocated to the Fund from Oppenheimer Master Loan Fund, LLC.
2. Rate shown is the 7-day yield at period end.
See accompanying Notes to Financial Statements.
14 OPPENHEIMER PORTFOLIO SERIES CONSERVATIVE INVESTOR FUND
STATEMENT OF ASSETS AND LIABILITIES January 31, 2017
| | | | |
Assets | | | | |
Investments, at value—see accompanying statement of investments—affiliated companies (cost $602,418,744) | | $ | 630,899,297 | |
Cash | | | 207,020 | |
Receivables and other assets: | | | | |
Investments sold | | | 1,120,616 | |
Dividends | | | 807,640 | |
Shares of beneficial interest sold | | | 402,968 | |
Other | | | 29,241 | |
Total assets | | | 633,466,782 | |
Liabilities | | | | |
Payables and other liabilities: | | | | |
Shares of beneficial interest redeemed | | | 1,768,181 | |
Investments purchased | | | 807,262 | |
Distribution and service plan fees | | | 132,956 | |
Trustees’ compensation | | | 32,952 | |
Shareholder communications | | | 6,360 | |
Other | | | 24,893 | |
Total liabilities | | | 2,772,604 | |
Net Assets | | $ | 630,694,178 | |
| | | | |
| |
| | |
Composition of Net Assets | | | | |
Par value of shares of beneficial interest | | $ | 70,098 | |
Additional paid-in capital | | | 686,187,912 | |
Accumulated net investment income | | | 3,517,720 | |
Accumulated net realized loss on investments | | | (87,562,105 | ) |
Net unrealized appreciation on investments | | | 28,480,553 | |
Net Assets | | $ | 630,694,178 | |
| | | | |
| | | | |
15 OPPENHEIMER PORTFOLIO SERIES CONSERVATIVE INVESTOR FUND
|
| STATEMENT OF ASSETS AND LIABILITIES Continued |
| | |
Net Asset Value Per Share | | |
| |
Class A Shares: | | |
| |
| Net asset value and redemption price per share (based on net assets of $428,722,468 and 47,515,265 shares of beneficial interest outstanding) | | $9.02 |
| |
| Maximum offering price per share (net asset value plus sales charge of 5.75% of offering price) | | $9.57 |
| |
| Class B Shares: | | |
| |
| Net asset value, redemption price (excludes applicable contingent deferred sales charge) and offering price per share (based on net assets of $6,616,677 and 729,947 shares of beneficial interest outstanding) | | $9.06 |
Class C Shares: | | |
| |
| Net asset value, redemption price (excludes applicable contingent deferred sales charge) and offering price per share (based on net assets of $147,359,380 and 16,526,662 shares of beneficial interest outstanding) | | $8.92 |
| |
| Class R Shares: | | |
| |
| Net asset value, redemption price (excludes applicable contingent deferred sales charge) and offering price per share (based on net assets of $42,715,646 and 4,743,293 shares of beneficial interest outstanding) | | $9.01 |
| |
| Class Y Shares: | | |
| |
| Net asset value, redemption price and offering price per share (based on net assets of $5,280,007 and 582,870 shares of beneficial interest outstanding) | | $9.06 |
See accompanying Notes to Financial Statements.
16 OPPENHEIMER PORTFOLIO SERIES CONSERVATIVE INVESTOR FUND
STATEMENT OF OPERATIONS For the Year Ended January 31, 2017
| | | | |
| |
Allocation of Income and Expenses from Master Funds1 | | | | |
Net investment income allocated from Oppenheimer Master Inflation Protected Securities Fund, LLC: | | | | |
Interest | | $ | 901,751 | |
Dividends | | | 2,327 | |
Net expenses | | | (216,445) | |
| | | | |
Net investment income allocated from Oppenheimer Master Inflation Protected Securities Fund, LLC | | | 687,633 | |
|
| |
Net investment income allocated from Oppenheimer Master Loan Fund, LLC: | | | | |
Interest | | | 1,918,869 | |
Dividends | | | 44,042 | |
Net expenses | | | (112,238) | |
| | | | |
Net investment income allocated from Oppenheimer Master Loan Fund, LLC | | | 1,850,673 | |
|
| |
Total allocation of net investment income from master funds | | | 2,538,306 | |
|
| |
Investment Income | | | | |
Dividends from affiliated companies | | | 13,582,587 | |
| |
Interest | | | 3,237 | |
| | | | |
Total investment income | | | 13,585,824 | |
|
| |
Expenses | | | | |
Distribution and service plan fees: | | | | |
Class A | | | 1,018,230 | |
Class B | | | 88,669 | |
Class C | | | 1,528,239 | |
Class R | | | 192,797 | |
| |
Transfer and shareholder servicing agent fees: | | | | |
Class A | | | 908,447 | |
Class B | | | 19,555 | |
Class C | | | 336,943 | |
Class R | | | 85,038 | |
Class Y | | | 11,159 | |
| |
Shareholder communications: | | | | |
Class A | | | 17,226 | |
Class B | | | 906 | |
Class C | | | 5,557 | |
Class R | | | 791 | |
Class Y | | | 153 | |
| |
Trustees’ compensation | | | 10,570 | |
| |
Custodian fees and expenses | | | 8,969 | |
| |
Borrowing fees | | | 4,782 | |
| |
Other | | | 57,011 | |
| | | | |
Total expenses | | | 4,295,042 | |
Less waivers and reimbursements of expenses | | | (618,701) | |
| | | | |
Net expenses | | | 3,676,341 | |
|
| |
Net Investment Income | | | 12,447,789 | |
17 OPPENHEIMER PORTFOLIO SERIES CONSERVATIVE INVESTOR FUND
|
| STATEMENT OF OPERATIONS Continued |
| | | | |
| |
Realized and Unrealized Gain (Loss) | | | | |
Net realized gain on: | | | | |
Investment transactions in affiliated companies | | $ | 1,039,192 | |
Distributions received from affiliate companies | | | 4,313,656 | |
| |
Net realized gain (loss) allocated from: | | | | |
Oppenheimer Master Inflation Protected Securities Fund, LLC | | | 156,341 | |
Oppenheimer Master Loan Fund, LLC | | | (546,375) | |
| | | | |
Net realized gain | | | 4,962,814 | |
| |
Net change in unrealized appreciation/depreciation on investments | | | 24,289,403 | |
| |
Net change in unrealized appreciation/depreciation allocated from: | | | | |
Oppenheimer Master Inflation Protected Securities Fund, LLC | | | 722,074 | |
Oppenheimer Master Loan Fund, LLC | | | 3,008,349 | |
| | | | |
Net change in unrealized appreciation/depreciation | | | 28,019,826 | |
|
| |
Net Increase in Net Assets Resulting from Operations | | $ | 45,430,429 | |
| | | | |
1. The Fund invests in certain affiliated mutual funds that expect to be treated as partnerships for tax purposes. See Note 4 of the accompanying Notes.
See accompanying Notes to Financial Statements.
18 OPPENHEIMER PORTFOLIO SERIES CONSERVATIVE INVESTOR FUND
STATEMENTS OF CHANGES IN NET ASSETS
| | | | | | | | |
| | | Year Ended
January 31, 2017 | | Year Ended
January 29, 20161 |
Operations | | | | | | | | |
Net investment income | | $ | 12,447,789 | | | $ | 8,942,505 | |
Net realized gain | | | 4,962,814 | | | | 19,460,624 | |
Net change in unrealized appreciation/depreciation | | | 28,019,826 | | | | (52,659,045 | ) |
Net increase (decrease) in net assets resulting from operations | | | 45,430,429 | | | | (24,255,916 | ) |
| | | | | | | | |
Dividends and/or Distributions to Shareholders | | | | | | | | |
Dividends from net investment income: | | | | | | | | |
Class A | | | (9,034,827 | ) | | | (8,720,528 | ) |
Class B | | | (66,676 | ) | | | (149,192 | ) |
Class C | | | (2,025,777 | ) | | | (2,309,593 | ) |
Class R | | | (800,365 | ) | | | (700,969 | ) |
Class Y | | | (122,045 | ) | | | (120,769 | ) |
| | | (12,049,690 | ) | | | (12,001,051 | ) |
Beneficial Interest Transactions | | | | | | | | |
Net increase (decrease) in net assets resulting from beneficial interest transactions: | | | | | | | | |
Class A | | | 25,104,936 | | | | 27,964,622 | |
Class B | | | (5,277,621 | ) | | | (5,622,808 | ) |
Class C | | | (12,054,247 | ) | | | (2,807,004 | ) |
Class R | | | 5,319,866 | | | | (5,220,226 | ) |
Class Y | | | (58,536 | ) | | | (1,498,399 | ) |
| | | 13,034,398 | | | | 12,816,185 | |
Net Assets | | | | | | | | |
Total increase (decrease) | | | 46,415,137 | | | | (23,440,782 | ) |
Beginning of period | | | 584,279,041 | | | | 607,719,823 | |
End of period (including accumulated net investment income of $3,517,720 and $2,715,874, respectively) | | $ | 630,694,178 | | | $ | 584,279,041 | |
| | | | | | | | |
| | | | | | | | |
1. Represents the last business day of the Fund’s reporting period.
See accompanying Notes to Financial Statements.
19 OPPENHEIMER PORTFOLIO SERIES CONSERVATIVE INVESTOR FUND
FINANCIAL HIGHLIGHTS
| | | | | | | | | | | | | | | | | | | | |
| Class A | | Year Ended
January 31,
2017 | | | Year Ended
January 29,
20161 | | | Year Ended
January 30,
20151 | | | Year Ended
January 31,
2014 | | | Year Ended
January 31,
2013 | |
| |
Per Share Operating Data | | | | | | | | | | | | | | | | | | | | |
| Net asset value, beginning of period | | | $8.54 | | | | $9.07 | | | | $8.74 | | | | $8.57 | | | | $8.13 | |
| |
| Income (loss) from investment operations: | | | | | | | | | | | | | | | | | | | | |
| Net investment income2 | | | 0.20 | | | | 0.15 | | | | 0.17 | | | | 0.18 | | | | 0.20 | |
| Net realized and unrealized gain (loss) | | | 0.47 | | | | (0.48) | | | | 0.31 | | | | 0.14 | | | | 0.42 | |
| | | | |
| Total from investment operations | | | 0.67 | | | | (0.33) | | | | 0.48 | | | | 0.32 | | | | 0.62 | |
| |
| Dividends and/or distributions to shareholders: | | | | | | | | | | | | | | | | | | | | |
| Dividends from net investment income’ | | | (0.19) | | | | (0.20) | | | | (0.15) | | | | (0.15) | | | | (0.18) | |
| |
| Net asset value, end of period | | | $9.02 | | | | $8.54 | | | | $9.07 | | | | $8.74 | | | | $8.57 | |
| | | | |
|
| |
Total Return, at Net Asset Value3 | | | 7.92% | | | | (3.68)% | | | | 5.54% | | | | 3.75% | | | | 7.62% | |
|
| |
Ratios/Supplemental Data | | | | | | | | | | | | | | | | | | | | |
| Net assets, end of period (in thousands) | | | $428,722 | | | | $381,636 | | | | $377,253 | | | | $328,792 | | | | $312,860 | |
| |
| Average net assets (in thousands) | | | $413,080 | | | | $385,849 | | | | $356,752 | | | | $321,008 | | | | $263,955 | |
| |
| Ratios to average net assets:4,5 | | | | | | | | | | | | | | | | | | | | |
| Net investment income | | | 2.22% | | | | 1.70% | | �� | | 1.84% | | | | 2.04% | | | | 2.33% | |
| Expenses excluding specific expenses listed below | | | 0.54% | | | | 0.54% | | | | 0.53% | | | | 0.52% | | | | 0.49% | |
| Interest and fees from borrowings | | | 0.00%6 | | | | 0.00%6 | | | | 0.00% | | | | 0.00% | | | | 0.00% | |
| | | | |
| Total expenses7 | | | 0.54% | | | | 0.54% | | | | 0.53% | | | | 0.52% | | | | 0.49% | |
| Expenses after payments, waivers and/or reimbursements and reduction to custodian expenses | | | 0.44% | | | | 0.44% | | | | 0.43% | | | | 0.41% | | | | 0.41% | |
| |
| Portfolio turnover rate | | | 9% | | | | 10% | | | | 14% | | | | 12% | | | | 27% | |
1. Represents the last business day of the Fund’s reporting period.
2. Per share amounts calculated based on the average shares outstanding during the period.
3. Assumes an initial investment on the business day before the first day of the fiscal period, with all dividends and distributions reinvested in additional shares on the reinvestment date, and redemption at the net asset value calculated on the last business day of the fiscal period. Sales charges are not reflected in the total returns. Total returns are not annualized for periods less than one full year. Returns do not reflect the deduction of taxes that a shareholder would pay on fund distributions or the redemption of fund shares.
4. Annualized for periods less than one full year.
5. Includes the Fund’s share of the allocated expenses and/or net investment income from the master funds.
6. Less than 0.005%.
7. Total expenses including indirect expenses from affiliated fund fees and expenses were as follows:
| | | | | | |
| | Year Ended January 31, 2017 | | 1.08% | | |
| | Year Ended January 29, 2016 | | 1.07% | |
| | Year Ended January 30, 2015 | | 1.06% | |
| | Year Ended January 31, 2014 | | 1.08% | |
| | Year Ended January 31, 2013 | | 1.08% | |
See accompanying Notes to Financial Statements.
20 OPPENHEIMER PORTFOLIO SERIES CONSERVATIVE INVESTOR FUND
| | | | | | | | | | | | | | | | | | | | |
| Class B | | Year Ended
January 31,
2017 | | | Year Ended
January 29,
20161 | | | Year Ended
January 30,
20151 | | | Year Ended
January 31,
2014 | | | Year Ended
January 31,
2013 | |
| |
Per Share Operating Data | | | | | | | | | | | | | | | | | | | | |
| Net asset value, beginning of period | | | $8.54 | | | | $9.05 | | | | $8.70 | | | | $8.52 | | | | $8.07 | |
| |
| Income (loss) from investment operations: | | | | | | | | | | | | | | | | | | | | |
| Net investment income2 | | | 0.13 | | | | 0.09 | | | | 0.09 | | | | 0.10 | | | | 0.12 | |
| Net realized and unrealized gain (loss) | | | 0.48 | | | | (0.49) | | | | 0.33 | | | | 0.15 | | | | 0.43 | |
| | | | |
| Total from investment operations | | | 0.61 | | | | (0.40) | | | | 0.42 | | | | 0.25 | | | | 0.55 | |
| |
| Dividends and/or distributions to shareholders: | | | | | | | | | | | | | | | | | | | | |
| Dividends from net investment income | | | (0.09) | | | | (0.11) | | | | (0.07) | | | | (0.07) | | | | (0.10) | |
| |
| Net asset value, end of period | | | $9.06 | | | | $8.54 | | | | $9.05 | | | | $8.70 | | | | $8.52 | |
| | | | |
|
| |
Total Return, at Net Asset Value3 | | | 7.12% | | | | (4.45)% | | | | 4.78% | | | | 2.90% | | | | 6.84% | |
|
| |
Ratios/Supplemental Data | | | | | | | | | | | | | | | | | | | | |
| Net assets, end of period (in thousands) | | | $6,617 | | | | $11,285 | | | | $17,607 | | | | $23,457 | | | | $30,526 | |
| |
| Average net assets (in thousands) | | | $8,872 | | | | $14,222 | | | | $20,359 | | | | $26,741 | | | | $30,910 | |
| |
| Ratios to average net assets:4,5 | | | | | | | | | | | | | | | | | | | | |
| Net investment income | | | 1.43% | | | | 0.95% | | | | 1.04% | | | | 1.16% | | | | 1.47% | |
| Expenses excluding specific expenses listed below | | | 1.30% | | | | 1.30% | | | | 1.28% | | | | 1.31% | | | | 1.31% | |
| Interest and fees from borrowings | | | 0.00%6 | | | | 0.00%6 | | | | 0.00% | | | | 0.00% | | | | 0.00% | |
| | | | |
| Total expenses7 | | | 1.30% | | | | 1.30% | | | | 1.28% | | | | 1.31% | | | | 1.31% | |
| Expenses after payments, waivers and/or reimbursements and reduction to custodian expenses | | | 1.20% | | | | 1.20% | | | | 1.18% | | | | 1.20% | | | | 1.23% | |
| |
| Portfolio turnover rate | | | 9% | | | | 10% | | | | 14% | | | | 12% | | | | 27% | |
1. Represents the last business day of the Fund’s reporting period.
2. Per share amounts calculated based on the average shares outstanding during the period.
3. Assumes an initial investment on the business day before the first day of the fiscal period, with all dividends and distributions reinvested in additional shares on the reinvestment date, and redemption at the net asset value calculated on the last business day of the fiscal period. Sales charges are not reflected in the total returns. Total returns are not annualized for periods less than one full year. Returns do not reflect the deduction of taxes that a shareholder would pay on fund distributions or the redemption of fund shares.
4. Annualized for periods less than one full year.
5. Includes the Fund’s share of the allocated expenses and/or net investment income from the master funds.
6. Less than 0.005%.
7. Total expenses including indirect expenses from affiliated fund fees and expenses were as follows:
| | | | | | |
| | Year Ended January 31, 2017 | | 1.84% | | |
| | Year Ended January 29, 2016 | | 1.83% | |
| | Year Ended January 30, 2015 | | 1.81% | |
| | Year Ended January 31, 2014 | | 1.87% | |
| | Year Ended January 31, 2013 | | 1.90% | |
See accompanying Notes to Financial Statements.
21 OPPENHEIMER PORTFOLIO SERIES CONSERVATIVE INVESTOR FUND
|
| FINANCIAL HIGHLIGHTS Continued |
| | | | | | | | | | | | | | | | | | | | |
| Class C | | Year Ended
January 31,
2017 | | | Year Ended
January 29,
20161 | | | Year Ended
January 30,
20151 | | | Year Ended
January 31,
2014 | | | Year Ended
January 31,
2013 | |
| |
Per Share Operating Data | | | | | | | | | | | | | | | | | | | | |
| Net asset value, beginning of period | | | $8.43 | | | | $8.96 | | | | $8.63 | | | | $8.47 | | | | $8.04 | |
| |
| Income (loss) from investment operations: | | | | | | | | | | | | | | | | | | | | |
| Net investment income2 | | | 0.13 | | | | 0.08 | | | | 0.10 | | | | 0.11 | | | | 0.13 | |
| Net realized and unrealized gain (loss) | | | 0.48 | | | | (0.48) | | | | 0.32 | | | | 0.14 | | | | 0.42 | |
| | | | |
| Total from investment operations | | | 0.61 | | | | (0.40) | | | | 0.42 | | | | 0.25 | | | | 0.55 | |
| |
| Dividends and/or distributions to shareholders: | | | | | | | | | | | | | | | | | | | | |
| Dividends from net investment income | | | (0.12) | | | | (0.13) | | | | (0.09) | | | | (0.09) | | | | (0.12) | |
| |
| Net asset value, end of period | | | $8.92 | | | | $8.43 | | | | $8.96 | | | | $8.63 | | | | $8.47 | |
| | | | |
|
| |
Total Return, at Net Asset Value3 | | | 7.28% | | | | (4.48)% | | | | 4.83% | | | | 2.89% | | | | 6.90% | |
|
| |
Ratios/Supplemental Data | | | | | | | | | | | | | | | | | | | | |
| Net assets, end of period (in thousands) | | | $147,359 | | | | $150,838 | | | | $163,041 | | | | $153,973 | | | | $153,128 | |
| |
| Average net assets (in thousands) | | | $153,128 | | | | $159,469 | | | | $160,307 | | | | $154,195 | | | | $131,124 | |
| |
| Ratios to average net assets:4,5 | | | | | | | | | | | | | | | | | | | | |
| Net investment income | | | 1.47% | | | | 0.95% | | | | 1.08% | | | | 1.26% | | | | 1.59% | |
| Expenses excluding specific expenses listed below | | | 1.29% | | | | 1.29% | | | | 1.28% | | | | 1.28% | | | | 1.23% | |
| Interest and fees from borrowings | | | 0.00%6 | | | | 0.00%6 | | | | 0.00% | | | | 0.00% | | | | 0.00% | |
| | | | |
| Total expenses7 | | | 1.29% | | | | 1.29% | | | | 1.28% | | | | 1.28% | | | | 1.23% | |
| Expenses after payments, waivers and/or reimbursements and reduction to custodian expenses | | | 1.19% | | | | 1.19% | | | | 1.18% | | | | 1.17% | | | | 1.15% | |
| |
| Portfolio turnover rate | | | 9% | | | | 10% | | | | 14% | | | | 12% | | | | 27% | |
1. Represents the last business day of the Fund’s reporting period.
2. Per share amounts calculated based on the average shares outstanding during the period.
3. Assumes an initial investment on the business day before the first day of the fiscal period, with all dividends and distributions reinvested in additional shares on the reinvestment date, and redemption at the net asset value calculated on the last business day of the fiscal period. Sales charges are not reflected in the total returns. Total returns are not annualized for periods less than one full year. Returns do not reflect the deduction of taxes that a shareholder would pay on fund distributions or the redemption of fund shares.
4. Annualized for periods less than one full year.
5. Includes the Fund’s share of the allocated expenses and/or net investment income from the master funds.
6. Less than 0.005%.
7. Total expenses including indirect expenses from affiliated fund fees and expenses were as follows:
| | | | | | |
| | Year Ended January 31, 2017 | | 1.83% | | |
| | Year Ended January 29, 2016 | | 1.82% | |
| | Year Ended January 30, 2015 | | 1.81% | |
| | Year Ended January 31, 2014 | | 1.84% | |
| | Year Ended January 31, 2013 | | 1.82% | |
See accompanying Notes to Financial Statements.
22 OPPENHEIMER PORTFOLIO SERIES CONSERVATIVE INVESTOR FUND
| | | | | | | | | | | | | | | | | | | | |
| Class R | | Year Ended
January 31,
2017 | | | Year Ended
January 29,
20161 | | | Year Ended
January 30,
20151 | | | Year Ended
January 31,
2014 | | | Year Ended
January 31,
2013 | |
| |
Per Share Operating Data | | | | | | | | | | | | | | | | | | | | |
| Net asset value, beginning of period | | | $8.53 | | | | $9.05 | | | | $8.72 | | | | $8.55 | | | | $8.10 | |
| |
| Income (loss) from investment operations: | | | | | | | | | | | | | | | | | | | | |
| Net investment income2 | | | 0.18 | | | | 0.13 | | | | 0.14 | | | | 0.15 | | | | 0.17 | |
| Net realized and unrealized gain (loss) | | | 0.47 | | | | (0.48) | | | | 0.32 | | | | 0.14 | | | | 0.43 | |
| | | | |
| Total from investment operations | | | 0.65 | | | | (0.35) | | | | 0.46 | | | | 0.29 | | | | 0.60 | |
| |
| Dividends and/or distributions to shareholders: | | | | | | | | | | | | | | | | | | | | |
| Dividends from net investment income | | | (0.17) | | | | (0.17) | | | | (0.13) | | | | (0.12) | | | | (0.15) | |
| |
| Net asset value, end of period | | | $9.01 | | | | $8.53 | | | | $9.05 | | | | $8.72 | | | | $8.55 | |
| | | | |
|
| |
Total Return, at Net Asset Value3 | | | 7.71% | | | | (3.89)% | | | | 5.28% | | | | 3.40% | | | | 7.40% | |
|
| |
Ratios/Supplemental Data | | | | | | | | | | | | | | | | | | | | |
| Net assets, end of period (in thousands) | | | $42,716 | | | | $35,442 | | | | $42,872 | | | | $43,246 | | | | $50,510 | |
| |
| Average net assets (in thousands) | | | $38,675 | | | | $39,789 | | | | $43,215 | | | | $47,223 | | | | $46,844 | |
| |
| Ratios to average net assets:4,5 | | | | | | | | | | | | | | | | | | | | |
| Net investment income | | | 1.99% | | | | 1.44% | | | | 1.58% | | | | 1.69% | | | | 2.00% | |
| Expenses excluding specific expenses listed below | | | 0.79% | | | | 0.79% | | | | 0.78% | | | | 0.79% | | | | 0.80% | |
| Interest and fees from borrowings | | | 0.00%6 | | | | 0.00%6 | | | | 0.00% | | | | 0.00% | | | | 0.00% | |
| | | | |
| Total expenses7 | | | 0.79% | | | | 0.79% | | | | 0.78% | | | | 0.79% | | | | 0.80% | |
| Expenses after payments, waivers and/or reimbursements and reduction to custodian expenses | | | 0.69% | | | | 0.69% | | | | 0.68% | | | | 0.68% | | | | 0.72% | |
| |
| Portfolio turnover rate | | | 9% | | | | 10% | | | | 14% | | | | 12% | | | | 27% | |
1. Represents the last business day of the Fund’s reporting period.
2. Per share amounts calculated based on the average shares outstanding during the period.
3. Assumes an initial investment on the business day before the first day of the fiscal period, with all dividends and distributions reinvested in additional shares on the reinvestment date, and redemption at the net asset value calculated on the last business day of the fiscal period. Sales charges are not reflected in the total returns. Total returns are not annualized for periods less than one full year. Returns do not reflect the deduction of taxes that a shareholder would pay on fund distributions or the redemption of fund shares.
4. Annualized for periods less than one full year.
5. Includes the Fund’s share of the allocated expenses and/or net investment income from the master funds.
6. Less than 0.005%.
7. Total expenses including indirect expenses from affiliated fund fees and expenses were as follows:
| | | | | | |
| | Year Ended January 31, 2017 | | 1.33% | | |
| | Year Ended January 29, 2016 | | 1.32% | |
| | Year Ended January 30, 2015 | | 1.31% | |
| | Year Ended January 31, 2014 | | 1.35% | |
| | Year Ended January 31, 2013 | | 1.39% | |
See accompanying Notes to Financial Statements.
23 OPPENHEIMER PORTFOLIO SERIES CONSERVATIVE INVESTOR FUND
|
| FINANCIAL HIGHLIGHTS Continued |
| | | | | | | | | | | | | | | | | | | | |
| Class Y | | Year Ended
January 31,
2017 | | | Year Ended
January 29,
20161 | | | Year Ended
January 30,
20151 | | | Year Ended
January 31,
2014 | | | Year Ended
January 31,
2013 | |
| |
Per Share Operating Data | | | | | | | | | | | | | | | | | | | | |
| Net asset value, beginning of period | | | $8.57 | | | | $9.10 | | | | $8.77 | | | | $8.60 | | | | $8.15 | |
| |
| Income (loss) from investment operations: | | | | | | | | | | | | | | | | | | | | |
| Net investment income2 | | | 0.23 | | | | 0.17 | | | | 0.20 | | | | 0.21 | | | | 0.22 | |
| Net realized and unrealized gain (loss) | | | 0.47 | | | | (0.49) | | | | 0.31 | | | | 0.14 | | | | 0.43 | |
| | | | |
| Total from investment operations | | | 0.70 | | | | (0.32) | | | | 0.51 | | | | 0.35 | | | | 0.65 | |
| |
| Dividends and/or distributions to shareholders: | | | | | | | | | | | | | | | | | | | | |
| Dividends from net investment income | | | (0.21) | | | | (0.21) | | | | (0.18) | | | | (0.18) | | | | (0.20) | |
| |
| Net asset value, end of period | | | $9.06 | | | | $8.57 | | | | $9.10 | | | | $8.77 | | | | $8.60 | |
| | | | |
|
| |
Total Return, at Net Asset Value3 | | | 8.27% | | | | (3.54)% | | | | 5.85% | | | | 4.01% | | | | 7.96% | |
|
| |
Ratios/Supplemental Data | | | | | | | | | | | | | | | | | | | | |
| Net assets, end of period (in thousands) | | | $5,280 | | | | $5,078 | | | | $6,947 | | | | $3,546 | | | | $2,886 | |
| |
| Average net assets (in thousands) | | | $5,067 | | | | $7,659 | | | | $4,601 | | | | $3,099 | | | | $2,922 | |
| |
| Ratios to average net assets:4,5 | | | | | | | | | | | | | | | | | | | | |
| Net investment income | | | 2.52% | | | | 1.93% | | | | 2.22% | | | | 2.37% | | | | 2.58% | |
| Expenses excluding specific expenses listed below | | | 0.29% | | | | 0.29% | | | | 0.28% | | | | 0.27% | | | | 0.21% | |
| Interest and fees from borrowings | | | 0.00%6 | | | | 0.00%6 | | | | 0.00% | | | | 0.00% | | | | 0.00% | |
| | | | |
| Total expenses7 | | | 0.29% | | | | 0.29% | | | | 0.28% | | | | 0.27% | | | | 0.21% | |
| Expenses after payments, waivers and/or reimbursements and reduction to custodian expenses | | | 0.19% | | | | 0.19% | | | | 0.18% | | | | 0.16% | | | | 0.13% | |
| |
| Portfolio turnover rate | | | 9% | | | | 10% | | | | 14% | | | | 12% | | | | 27% | |
1. Represents the last business day of the Fund’s reporting period.
2. Per share amounts calculated based on the average shares outstanding during the period.
3. Assumes an initial investment on the business day before the first day of the fiscal period, with all dividends and distributions reinvested in additional shares on the reinvestment date, and redemption at the net asset value calculated on the last business day of the fiscal period. Sales charges are not reflected in the total returns. Total returns are not annualized for periods less than one full year. Returns do not reflect the deduction of taxes that a shareholder would pay on fund distributions or the redemption of fund shares.
4. Annualized for periods less than one full year.
5. Includes the Fund’s share of the allocated expenses and/or net investment income from the master funds.
6. Less than 0.005%.
7. Total expenses including indirect expenses from affiliated fund fees and expenses were as follows:
| | | | | | |
| | Year Ended January 31, 2017 | | 0.83% | | |
| | Year Ended January 29, 2016 | | 0.82% | |
| | Year Ended January 30, 2015 | | 0.81% | |
| | Year Ended January 31, 2014 | | 0.83% | |
| | Year Ended January 31, 2013 | | 0.80% | |
See accompanying Notes to Financial Statements
24 OPPENHEIMER PORTFOLIO SERIES CONSERVATIVE INVESTOR FUND
NOTES TO FINANCIAL STATEMENTS January 31, 2017
1. Organization
Oppenheimer Portfolio Series (the “Trust”) is registered under the Investment Company Act of 1940 (“1940 Act”), as amended, as a diversified open-end management investment company. Conservative Investor Fund (the “Fund”) is a series of the Trust whose investment objective is to seek total return. The Fund normally invests in a diversified portfolio of Oppenheimer mutual funds (individually, an “Underlying Fund” and collectively, the “Underlying Funds”). The Fund’s investment adviser is OFI Global Asset Management, Inc. (“OFI Global” or the “Manager”), a wholly-owned subsidiary of OppenheimerFunds, Inc. (“OFI” or the “Sub-Adviser”). The Manager has entered into a sub-advisory agreement with OFI.
The Fund offers Class A, Class C, Class R and Class Y shares, and previously offered Class B shares for new purchase through June 29, 2012. Subsequent to that date, no new purchases of Class B shares are permitted, however reinvestment of dividend and/or capital gain distributions and exchanges of Class B shares into and from other Oppenheimer funds are allowed. As of July 1, 2014, Class N shares were renamed Class R shares. Class N shares subject to a CDSC on July 1, 2014, will continue to be subject to a CDSC after the shares are renamed. Purchases of Class R shares occurring on or after July 1, 2014, will not be subject to a CDSC upon redemption. Class A shares are sold at their offering price, which is normally net asset value plus a front-end sales charge. Class C and Class R shares are sold, and Class B shares were sold, without a front-end sales charge but may be subject to a contingent deferred sales charge (“CDSC”). Class R shares are sold only through retirement plans. Retirement plans that offer Class R shares may impose charges on those accounts. Class Y shares are sold to certain institutional investors or intermediaries without either a front-end sales charge or a CDSC, however, the intermediaries may impose charges on their accountholders who beneficially own Class Y shares. All classes of shares have identical rights and voting privileges with respect to the Fund in general and exclusive voting rights on matters that affect that class alone. Earnings, net assets and net asset value per share may differ due to each class having its own expenses, such as transfer and shareholder servicing agent fees and shareholder communications, directly attributable to that class. Class A, B, C and R shares have separate distribution and/or service plans under which they pay fees. Class Y shares do not pay such fees. Class B shares will automatically convert to Class A shares 72 months after the date of purchase.
The following is a summary of significant accounting policies followed in the Fund’s preparation of financial statements in accordance with accounting principles generally accepted in the United States (“U.S. GAAP”).
2. Significant Accounting Policies
Security Valuation. All investments in securities are recorded at their estimated fair value, as described in Note 3.
Allocation of Income, Expenses, Gains and Losses. Income, expenses (other than those attributable to a specific class), gains and losses are allocated on a daily basis to each class of shares based upon the relative proportion of net assets represented by such class. Operating
25 OPPENHEIMER PORTFOLIO SERIES CONSERVATIVE INVESTOR FUND
NOTES TO FINANCIAL STATEMENTS Continued
2. Significant Accounting Policies (Continued)
expenses directly attributable to a specific class are charged against the operations of that class.
Dividends and Distributions to Shareholders. Dividends and distributions to shareholders, which are determined in accordance with income tax regulations and may differ from U.S. GAAP, are recorded on the ex-dividend date. Income and capital gain distributions, if any, are declared and paid annually or at other times as deemed necessary by the Manager.
Investment Income. Dividend distributions received from the Underlying Funds are recorded on the ex-dividend date. Upon receipt of notification from an Underlying Fund, and subsequent to the ex-dividend date, some of the dividend income originally recorded by the Fund may be reclassified as a tax return of capital by reducing the cost basis of the Underlying Fund and/or increasing the realized gain on sales of investments in the Underlying Fund.
Custodian Fees. “Custodian fees and expenses” in the Statement of Operations may include interest expense incurred by the Fund on any cash overdrafts of its custodian account during the period. Such cash overdrafts may result from the effects of failed trades in portfolio securities and from cash outflows resulting from unanticipated shareholder redemption activity. The Fund pays interest to its custodian on such cash overdraft at a rate equal to the Prime Rate plus 0.35%. The “Reduction to custodian expenses” line item, if applicable, represents earnings on cash balances maintained by the Fund during the period. Such interest expense and other custodian fees may be paid with these earnings.
Security Transactions. Security transactions are recorded on the trade date. Realized gains and losses on securities sold are determined on the basis of identified cost.
Indemnifications. The Fund’s organizational documents provide current and former Trustees and officers with a limited indemnification against liabilities arising in connection with the performance of their duties to the Fund. In the normal course of business, the Fund may also enter into contracts that provide general indemnifications. The Fund’s maximum exposure under these arrangements is unknown as this would be dependent on future claims that may be made against the Fund. The risk of material loss from such claims is considered remote.
Federal Taxes. The Fund intends to comply with provisions of the Internal Revenue Code applicable to regulated investment companies and to distribute substantially all of its investment company taxable income, including any net realized gain on investments not offset by capital loss carryforwards, if any, to shareholders. Therefore, no federal income or excise tax provision is required. The Fund files income tax returns in U.S. federal and applicable state jurisdictions. The statute of limitations on the Fund’s tax return filings generally remains open for the three preceding fiscal reporting period ends. The Fund has analyzed its tax positions for the fiscal year ended January 31, 2017, including open tax years, and does not believe there are any uncertain tax positions requiring recognition in the Fund’s financial statements.
26 OPPENHEIMER PORTFOLIO SERIES CONSERVATIVE INVESTOR FUND
2. Significant Accounting Policies (Continued)
The tax components of capital shown in the following table represent distribution requirements the Fund must satisfy under the income tax regulations, losses the Fund may be able to offset against income and gains realized in future years and unrealized appreciation or depreciation of securities and other investments for federal income tax purposes.
| | | | | | |
Undistributed Net Investment Income | | Undistributed Long-Term Gain | | Accumulated Loss Carryforward1,2,3 | | Net Unrealized Depreciation Based on cost of Securities and Other Investments for Federal Income Tax Purposes |
$2,802,472 | | $— | | $47,130,940 | | $11,203,318 |
1. At period end, the Fund had $47,130,940 of net capital loss carryforward available to offset future realized capital gains, if any, and thereby reduce future taxable gain distributions. Details of the capital loss carryforwards are included in the table below. Capital loss carryovers with no expiration, if any, must be utilized prior to those with expiration dates.
| | | | |
| Expiring | | | |
2019 | | $ | 43,958,240 | |
No expiration | | | 3,172,700 | |
| | | | |
Total | | $ | 47,130,940 | |
| | | | |
2. During the reporting period, the Fund did not utilize any capital loss carryforward.
3. During the previous reporting period, the Fund utilized $13,331,467 of capital loss carryforward to offset capital gains realized in that fiscal year.
Net investment income (loss) and net realized gain (loss) may differ for financial statement and tax purposes. The character of dividends and distributions made during the fiscal year from net investment income or net realized gains are determined in accordance with federal income tax requirements, which may differ from the character of net investment income or net realized gains presented in those financial statements in accordance with U.S. GAAP. Also, due to timing of dividends and distributions, the fiscal year in which amounts are distributed may differ from the fiscal year in which the income or net realized gain was recorded by the Fund.
Accordingly, the following amounts have been reclassified for the reporting period. Net assets of the Fund were unaffected by the reclassifications.
| | | | |
| Increase | | Increase | |
| to Accumulated | | to Accumulated Net | |
| Net Investment | | Realized Loss | |
| Income | | on Investments | |
$403,747 | | | $403,747 | |
The tax character of distributions paid during the reporting periods:
27 OPPENHEIMER PORTFOLIO SERIES CONSERVATIVE INVESTOR FUND
NOTES TO FINANCIAL STATEMENTS Continued
2. Significant Accounting Policies (Continued)
| | | | | | | | |
| | | Year Ended
January 31, 2017 | | | Year Ended
January 31, 2016 | |
Distributions paid from: | | | | | | | | |
Ordinary income | | $ | 12,049,690 | | | $ | 12,001,051 | |
The aggregate cost of securities and other investments and the composition of unrealized appreciation and depreciation of securities and other investments for federal income tax purposes at period end are noted in the following table. The primary difference between book and tax appreciation or depreciation of securities and other investments, if applicable, is attributable to the tax deferral of losses or tax realization of financial statement unrealized gain or loss.
| | | | |
Federal tax cost of securities | | $ | 642,102,615 | |
| | | | |
Gross unrealized appreciation | | $ | 9,434,176 | |
Gross unrealized depreciation | | | (20,637,494) | |
| | | | |
Net unrealized depreciation | | $ | (11,203,318) | |
| | | | |
Use of Estimates. The preparation of financial statements in conformity with U.S. GAAP requires management to make estimates and assumptions that affect the reported amounts of assets and liabilities and disclosure of contingent assets and liabilities at the date of the financial statements and the reported amounts of increases and decreases in net assets from operations during the reporting period. Actual results could differ from those estimates.
Recent Accounting Pronouncement. In October 2016, the Securities and Exchange Commission (“SEC”) adopted amendments to rules under the Investment Company Act of 1940 (“final rules”) intended to modernize the reporting and disclosure of information by registered investment companies. The final rules amend Regulation S-X and require funds to provide standardized, enhanced derivative disclosure in fund financial statements in a format designed for individual investors. The amendments to Regulation S-X also update the disclosures for other investments and investments in, and advances to affiliates and amend the rules regarding the general form and content of fund financial statements. The compliance date for the amendments to Regulation S-X is August 1, 2017. OFI Global is currently evaluating the amendments and their impact, if any, on the fund’s financial statements.
3. Securities Valuation
The Fund calculates the net asset value of its shares based upon the net asset value of the applicable investment companies. For each investment company, the net asset value per share for a class of shares is determined as of 4:00 P.M. eastern time, on each day the New York Stock Exchange (the “Exchange”) is open for trading, except in the case of a scheduled early closing of the Exchange, in which case the Fund will calculate net asset value of the shares as of the scheduled early closing time of the Exchange. This is calculated by dividing the value of the investment company’s net assets attributable to that class by the number of outstanding shares of that class on that day.
28 OPPENHEIMER PORTFOLIO SERIES CONSERVATIVE INVESTOR FUND
3. Securities Valuation (Continued)
The Fund’s Board has adopted procedures for the valuation of the Fund’s securities and has delegated the day-to-day responsibility for valuation determinations under those procedures to the Manager. The Manager has established a Valuation Committee which is responsible for determining a “fair valuation” for any security for which market quotations are not “readily available.” The Valuation Committee’s fair valuation determinations are subject to review, approval and ratification by the Fund’s Board at its next regularly scheduled meeting covering the calendar quarter in which the fair valuation was determined.
Valuations Methods and Inputs
To determine their net asset values, the Underlying Funds’ assets are valued primarily on the basis of current market quotations as generally supplied by third party portfolio pricing services or by dealers. Such market quotations are typically based on unadjusted quoted prices in active markets for identical securities or other observable market inputs.
If a market value or price cannot be determined for a security using the methodologies described above, or if, in the “good faith” opinion of the Manager, the market value or price obtained does not constitute a “readily available market quotation,” or a significant event has occurred that would materially affect the value of the security, the security is fair valued either (i) by a standardized fair valuation methodology applicable to the security type or the significant event as previously approved by the Valuation Committee and the Fund’s Board or (ii) as determined in good faith by the Manager’s Valuation Committee. The Valuation Committee considers all relevant facts that are reasonably available, through either public information or information available to the Manager, when determining the fair value of a security. Fair value determinations by the Manager are subject to review, approval and ratification by the Fund’s Board at its next regularly scheduled meeting covering the calendar quarter in which the fair valuation was determined. The methodologies used for valuing securities are not necessarily an indication of the risks associated with investing in those Underlying Funds.
To assess the continuing appropriateness of security valuations, the Manager, or its third party service provider who is subject to oversight by the Manager, regularly compares prior day prices, prices on comparable securities, and sale prices to the current day prices and challenges those prices exceeding certain tolerance levels with the third party pricing service or broker source. For those securities valued by fair valuations, whether through a standardized fair valuation methodology or a fair valuation determination, the Valuation Committee reviews and affirms the reasonableness of the valuations based on such methodologies and fair valuation determinations on a regular basis after considering all relevant information that is reasonably available.
Classifications
Each investment asset or liability of the Fund is assigned a level at measurement date based on the significance and source of the inputs to its valuation. Various data inputs are used in determining the value of each of the Fund’s investments as of the reporting period end. These data inputs are categorized in the following hierarchy under applicable financial accounting
29 OPPENHEIMER PORTFOLIO SERIES CONSERVATIVE INVESTOR FUND
NOTES TO FINANCIAL STATEMENTS Continued
3. Securities Valuation (Continued)
standards:
1) Level 1-unadjusted quoted prices in active markets for identical assets or liabilities (including securities actively traded on a securities exchange)
2) Level 2-inputs other than unadjusted quoted prices that are observable for the asset or liability (such as unadjusted quoted prices for similar assets and market corroborated inputs such as interest rates, prepayment speeds, credit risks, etc.)
3) Level 3-significant unobservable inputs (including the Manager’s own judgments about assumptions that market participants would use in pricing the asset or liability).
The inputs used for valuing securities are not necessarily an indication of the risks associated with investing in those securities.
The Fund classifies each of its investments in investment companies which are publicly offered as Level 1. Investment companies that are not publicly offered are measured using net asset value as a practical expedient, and are not classified in the fair value hierarchy.
The table below categorizes amounts that are included in the Fund’s Statement of Assets and Liabilities at period end based on valuation input level:
| | | | | | | | | | | | | | | | | | | | | | | | | | | | | | |
| | | | | Level 1—
Unadjusted
Quoted Prices | | | | | | Level 2—
Other Significant
Observable Inputs | | | | | | Level 3—
Significant
Unobservable
Inputs | | | | | | Value | |
Assets Table | | | | | | | | | | | | | | | | | | | | | | | | | | | | | | |
Investments, at Value: | | | | | | | | | | | | | | | | | | | | | | | | | | | | | | |
Investment Companies | | $ | | | 551,770,143 | | | | | | | $ | — | | | | | | | $ | — | | | | | | | $ | 551,770,143 | |
| | | |
Total Assets excluding investment companies valued using practical expedient | | $ | | | 551,770,143 | | | | | | | $ | — | | | | | | | $ | — | | | | | | | | 551,770,143 | |
| | | |
Investment companies valued using practical expedient | | | | | | | | | | | | | | | | | | | | | | | | | | | | | 79,129,154 | |
| | | | | | | | | | | | | | | | | | | | | | | | | | | | | | |
Total Assets | | | | | | | | | | | | | | | | | | | | | | | | | | | | $ | 630,899,297 | |
| | | | | | | | | | | | | | | | | | | | | | | | | | | | | | |
Forward currency exchange contracts and futures contracts, if any, are reported at their unrealized appreciation/depreciation at measurement date, which represents the change in the contract’s value from trade date. All additional assets and liabilities included in the above table are reported at their market value at measurement date.
4. Investments and Risks
Risks of Investing in the Underlying Funds. The Fund invests in other mutual funds advised by the Manager. The Underlying Funds are registered open-end management investment companies under the 1940 Act, as amended. The Manager is the investment adviser of, and the Sub-Adviser provides investment and related advisory services to, the Underlying Funds. The Fund’s Investments in Underlying Funds are included in the Statement of Investments. Shares of Underlying Funds are valued at their net asset value per share. As a shareholder, the Fund is subject to its proportional share of the Underlying Funds’ expenses,
30 OPPENHEIMER PORTFOLIO SERIES CONSERVATIVE INVESTOR FUND
4. Investments and Risks (Continued)
including their management fee.
Each of the Underlying Funds in which the Fund invests has its own investment risks, and those risks can affect the value of the Fund’s investments and therefore the value of the Fund’s shares. To the extent that the Fund invests more of its assets in one Underlying Fund than in another, the Fund will have greater exposure to the risks of that Underlying Fund.
Significant Holdings. At period end, the Fund’s investment in Oppenheimer Core Bond Fund, accounted for 25.8% of the Fund’s net assets. Additional information on Oppenheimer Core Bond Fund, including the audited financials, can be found on the SEC website.
Investment in Oppenheimer Institutional Government Money Market Fund. The Fund is permitted to invest daily available cash balances in an affiliated money market fund. The Fund may invest the available cash in Class E shares of Oppenheimer Institutional Government Money Market Fund (“IGMMF”), formerly Oppenheimer Institutional Money Market Fund, is to seek current income while preserving liquidity or for defensive purposes. IGMMF is a registered open-end management investment company, regulated as a money market fund under the 1940 Act, as amended. The Manager is the investment adviser of IGMMF, and the Sub-Adviser provides investment and related advisory services to IGMMF. When applicable, the Fund’s investment in IGMMF is included in the Statement of Investments. Shares of IGMMF are valued at their net asset value per share. As a shareholder, the Fund is subject to its proportional share of IGMMF’s Class E expenses, including its management fee.
Investment in Oppenheimer Master Funds. Certain Underlying Funds in which the Fund invests are mutual funds registered under the 1940 Act, as amended, that expect to be treated as partnerships for tax purposes, specifically Oppenheimer Master Loan Fund, LLC (“Master Loan”) and Oppenheimer Master Inflation Protected Securities Fund, LLC (“Master Inflation Protected Securities”) (the “Master Funds”). Each Master Fund has its own investment risks, and those risks can affect the value of the Fund’s investments and therefore the value of the Fund’s shares. To the extent that the Fund invests more of its assets in one Master Fund than in another, the Fund will have greater exposure to the risks of that Master Fund.
The investment objective of Master Loan is to seek income. The investment objective of Master Inflation Protected Securities is to seek total return. The Fund’s investments in the Master Funds are included in the Statement of Investments. The Fund recognizes income and gain/(loss) on its investments in each Master Fund according to its allocated pro-rata share, based on its relative proportion of total outstanding Master Fund shares held, of the total net income earned and the net gain/(loss) realized on investments sold by the Master Funds. As a shareholder, the Fund is subject to its proportional share of the Master Funds’ expenses, including their management fee. The Fund owns 2.2% of Master Loan and 28.6% of Master Inflation Protected Securities at period end.
31 OPPENHEIMER PORTFOLIO SERIES CONSERVATIVE INVESTOR FUND
NOTES TO FINANCIAL STATEMENTS Continued
5. Market Risk Factors
The Fund’s investments in securities and/or financial derivatives may expose the Fund to various market risk factors:
Commodity Risk. Commodity risk relates to the change in value of commodities or commodity indexes as they relate to increases or decreases in the commodities market. Commodities are physical assets that have tangible properties. Examples of these types of assets are crude oil, heating oil, metals, livestock, and agricultural products.
Credit Risk. Credit risk relates to the ability of the issuer of debt to meet interest and principal payments, or both, as they come due. In general, lower-grade, higher-yield debt securities are subject to credit risk to a greater extent than lower-yield, higher-quality securities.
Equity Risk. Equity risk relates to the change in value of equity securities as they relate to increases or decreases in the general market.
Foreign Exchange Rate Risk. Foreign exchange rate risk relates to the change in the U.S. dollar value of a security held that is denominated in a foreign currency. The U.S. dollar value of a foreign currency denominated security will decrease as the dollar appreciates against the currency, while the U.S. dollar value will increase as the dollar depreciates against the currency.
Interest Rate Risk. Interest rate risk refers to the fluctuations in value of fixed-income securities resulting from the inverse relationship between price and yield. For example, an increase in general interest rates will tend to reduce the market value of already issued fixed-income investments, and a decline in general interest rates will tend to increase their value. In addition, debt securities with longer maturities, which tend to have higher yields, are subject to potentially greater fluctuations in value from changes in interest rates than obligations with shorter maturities.
Volatility Risk. Volatility risk refers to the magnitude of the movement, but not the direction of the movement, in a financial instrument’s price over a defined time period. Large increases or decreases in a financial instrument’s price over a relative time period typically indicate greater volatility risk, while small increases or decreases in its price typically indicate lower volatility risk.
6. Shares of Beneficial Interest
The Fund has authorized an unlimited number of $0.001 par value shares of beneficial interest of each class. Transactions in shares of beneficial interest were as follows:
| | | | | | | | | | | | | | | | |
| | | Year Ended January 31, 2017 | | | Year Ended January 29, 20161 | |
| | | Shares | | | Amount | | | Shares | | | Amount | |
Class A | | | | | | | | | | | | | | | | |
Sold | | | 12,265,538 | | | $ | 110,019,935 | | | | 13,736,193 | | | $ | 123,603,415 | |
Dividends and/or distributions reinvested | | | 998,558 | | | | 8,866,800 | | | | 985,910 | | | | 8,557,696 | |
Redeemed | | | (10,445,651) | | | | (93,781,799) | | | | (11,601,393) | | | | (104,196,489) | |
| | | | |
Net increase | | | 2,818,445 | | | $ | 25,104,936 | | | | 3,120,710 | | | $ | 27,964,622 | |
| | | | |
32 OPPENHEIMER PORTFOLIO SERIES CONSERVATIVE INVESTOR FUND
6. Shares of Beneficial Interest (Continued)
| | | | | | | | | | | | | | | | |
| | | Year Ended January 31, 2017 | | | Year Ended January 29, 20161 | |
| | | Shares | | | Amount | | | Shares | | | Amount | |
Class B | | | | | | | | | | | | | | | | |
Sold | | | 72,454 | | | $ | 652,263 | | | | 91,136 | | | $ | 811,048 | |
Dividends and/or distributions reinvested | | | 7,456 | | | | 66,585 | | | | 17,013 | | | | 147,848 | |
Redeemed | | | (671,142 | ) | | | (5,996,469 | ) | | | (731,776 | ) | | | (6,581,704 | ) |
| | | | |
Net decrease | | | (591,232 | ) | | $ | (5,277,621 | ) | | | (623,627 | ) | | $ | (5,622,808 | ) |
| | | | |
| | | | | | | | | | | | | | | | | |
Class C | | | | | | | | | | | | | | | | |
Sold | | | 3,477,228 | | | $ | 30,675,565 | | | | 4,313,849 | | | $ | 38,175,887 | |
Dividends and/or distributions reinvested | | | 227,221 | | | | 1,995,245 | | | | 263,320 | | | | 2,259,284 | |
Redeemed | | | (5,060,265 | ) | | | (44,725,057 | ) | | | (4,885,464 | ) | | | (43,242,175 | ) |
| | | | |
Net decrease | | | (1,355,816 | ) | | $ | (12,054,247 | ) | | | (308,295 | ) | | $ | (2,807,004 | ) |
| | | | |
| | | | | | | | | | | | | | | | | |
Class R | | | | | | | | | | | | | | | | |
Sold | | | 1,700,052 | | | $ | 15,266,241 | | | | 1,126,601 | | | $ | 10,132,069 | |
Dividends and/or distributions reinvested | | | 85,218 | | | | 755,036 | | | | 76,802 | | | | 665,873 | |
Redeemed | | | (1,199,298 | ) | | | (10,701,411 | ) | | | (1,781,921 | ) | | | (16,018,168 | ) |
| | | | |
Net increase (decrease) | | | 585,972 | | | $ | 5,319,866 | | | | (578,518 | ) | | $ | (5,220,226 | ) |
| | | | |
| | | | | | | | | | | | | | | | | |
Class Y | | | | | | | | | | | | | | | | |
Sold | | | 344,015 | | | $ | 3,074,103 | | | | 463,007 | | | $ | 4,184,996 | |
Dividends and/or distributions reinvested | | | 13,168 | | | | 117,323 | | | | 13,552 | | | | 118,035 | |
Redeemed | | | (366,911 | ) | | | (3,249,962 | ) | | | (647,624 | ) | | | (5,801,430 | ) |
| | | | |
Net decrease | | | (9,728 | ) | | $ | (58,536 | ) | | | (171,065 | ) | | $ | (1,498,399 | ) |
| | | | |
1. Represents the last business day of the Fund’s reporting period.
7. Purchases and Sales of Securities
The aggregate cost of purchases and proceeds from sales of securities, other than short-term obligations and investments in IGMMF, for the reporting period were as follows:
| | | | | | | | |
| | | Purchases | | | Sales | |
Investment securities | | $ | 78,777,419 | | | $ | 56,318,869 | |
8. Fees and Other Transactions with Affiliates
Management Fees. Under the investment advisory agreement, the Manager does not charge a management fee, but rather collects indirect management fees from the Fund’s investments in the Underlying Funds. The weighted indirect management fees collected from the Fund’s investment in the Underlying Funds, as a percent of average daily net assets of the Fund for the reporting period was 0.48%. This amount is gross of any waivers or reimbursements of management fees implemented at the Underlying Fund level. Under the sub-advisory agreement effective January 1, 2013, the Manager pays the Sub-Adviser a percentage of the indirect management fees (after all applicable waivers) from the Fund’s investments in the Underlying Funds.
33 OPPENHEIMER PORTFOLIO SERIES CONSERVATIVE INVESTOR FUND
NOTES TO FINANCIAL STATEMENTS Continued
8. Fees and Other Transactions with Affiliates (Continued)
Sub-Adviser Fees. The Manager has retained the Sub-Adviser to provide the day-to-day portfolio management of the Fund. Under the Sub-Advisory Agreement, the Manager pays the Sub-Adviser an annual fee in monthly installments, equal to a percentage of the indirect investment management fee collected by the Manager, which shall be calculated after any investment management fee waivers. The fee paid to the Sub-Adviser is paid by the Manager, not by the Fund.
Transfer Agent Fees. OFI Global (the “Transfer Agent”) serves as the transfer and shareholder servicing agent for the Fund. The Fund pays the Transfer Agent a fee based on annual net assets. Fees incurred and average net assets for each class with respect to these services are detailed in the Statement of Operations and Financial Highlights, respectively.
Sub-Transfer Agent Fees. The Transfer Agent has retained Shareholder Services, Inc., a wholly-owned subsidiary of OFI (the “Sub-Transfer Agent”), to provide the day-to-day transfer agent and shareholder servicing of the Fund. Under the Sub-Transfer Agency Agreement, the Transfer Agent pays the Sub-Transfer Agent an annual fee in monthly installments, equal to a percentage of the transfer agent fee collected by the Transfer Agent from the Fund, which shall be calculated after any applicable fee waivers. The fee paid to the Sub-Transfer Agent is paid by the Transfer Agent, not by the Fund.
Trustees’ Compensation. The Fund has adopted an unfunded retirement plan (the “Plan”) for the Fund’s Independent Trustees. Benefits are based on years of service and fees paid to each Trustee during their period of service. The Plan was frozen with respect to adding new participants effective December 31, 2006 (the “Freeze Date”) and existing Plan Participants as of the Freeze Date will continue to receive accrued benefits under the Plan. Active
Independent Trustees as of the Freeze Date have each elected a distribution method with respect to their benefits under the Plan. During the reporting period, the Fund’s projected benefit obligations, payments to retired Trustees and accumulated liability were as follows:
| | | | |
Projected Benefit Obligations Increased | | $ — | |
Payments Made to Retired Trustees | | 1,336 | |
Accumulated Liability as of January 31, 2017 | | 9,655 | |
The Fund’s Board of Trustees (“Board”) has adopted a compensation deferral plan for Independent Trustees that enables Trustees to elect to defer receipt of all or a portion of the annual compensation they are entitled to receive from the Fund. For purposes of determining the amount owed to the Trustee under the plan, deferred amounts are treated as though equal dollar amounts had been invested in shares of the Fund or in other Oppenheimer funds selected by the Trustee. The Fund purchases shares of the funds selected for deferral by the Trustee in amounts equal to his or her deemed investment, resulting in a Fund asset equal to the deferred compensation liability. Such assets are included as a component of “Other” within the asset section of the Statement of Assets and Liabilities. Deferral of Trustees’ fees under the plan will not affect the net assets of the Fund and will not materially affect the
34 OPPENHEIMER PORTFOLIO SERIES CONSERVATIVE INVESTOR FUND
8. Fees and Other Transactions with Affiliates (Continued)
Fund’s assets, liabilities or net investment income per share. Amounts will be deferred until distributed in accordance with the compensation deferral plan.
Distribution and Service Plan (12b-1) Fees. Under its General Distributor’s Agreement with the Fund, OppenheimerFunds Distributor, Inc. (the “Distributor”) acts as the Fund’s principal underwriter in the continuous public offering of the Fund’s classes of shares.
Service Plan for Class A Shares. The Fund has adopted a Service Plan (the “Plan”) for Class A shares pursuant to Rule 12b-1 under the 1940 Act. Under the Plan, the Fund reimburses the Distributor for a portion of its costs incurred for services provided to accounts that hold Class A shares. Reimbursement is made periodically at an annual rate of up to 0.25% of the daily net assets of Class A shares of the Fund. The Distributor currently uses all of those fees to pay dealers, brokers, banks and other financial institutions periodically for providing personal service and maintenance of accounts of their customers that hold Class A shares. Any unreimbursed expenses the Distributor incurs with respect to Class A shares in any fiscal year cannot be recovered in subsequent periods. Fees incurred by the Fund under the Plan are detailed in the Statement of Operations.
Distribution and Service Plans for Class B, Class C and Class R Shares. The Fund has adopted Distribution and Service Plans (the “Plans”) for Class B, Class C and Class R shares pursuant to Rule 12b-1 under the 1940 Act to compensate the Distributor for distributing those share classes, maintaining accounts and providing shareholder services. Under the Plans, the Fund pays the Distributor an annual asset-based sales charge of 0.75% on Class B and Class C shares’ daily net assets and 0.25% on Class R shares’ daily net assets. The Fund also pays a service fee under the Plans at an annual rate of 0.25% of daily net assets. The Plans continue in effect from year to year only if the Fund’s Board of Trustees votes annually to approve their continuance at an in person meeting called for that purpose. Fees incurred by the Fund under the Plans are detailed in the Statement of Operations.
Sales Charges. Front-end sales charges and CDSC do not represent expenses of the Fund. They are deducted from the proceeds of sales of Fund shares prior to investment or from redemption proceeds prior to remittance, as applicable. The sales charges retained by the Distributor from the sale of shares and the CDSC retained by the Distributor on the redemption of shares is shown in the following table for the period indicated.
| | | | | | | | | | | | | | | | | | | | |
| Year Ended | | Class A
Front-End
Sales Charges
Retained by
Distributor | | | Class A
Contingent
Deferred
Sales Charges
Retained by
Distributor | | | Class B
Contingent
Deferred
Sales Charges
Retained by
Distributor | | | Class C
Contingent
Deferred
Sales Charges
Retained by
Distributor | | | Class R
Contingent
Deferred
Sales Charges
Retained by
Distributor | |
January 31, 2017 | | | $181,239 | | | | $— | | | | $12,366 | | | | $18,242 | | | | $— | |
Waivers and Reimbursements of Expenses. The Manager has voluntarily agreed to
35 OPPENHEIMER PORTFOLIO SERIES CONSERVATIVE INVESTOR FUND
NOTES TO FINANCIAL STATEMENTS Continued
8. Fees and Other Transactions with Affiliates (Continued)
waive fees and/or reimburse the Fund for certain expenses in order to limit “Expenses after payments, waivers and/or reimbursements and reduction to custodian expenses”, (the combined direct (Fund level) and indirect (Underlying Fund level) expenses), will not exceed the annual rate of 1.25%, 2.00%, 2.00%, 1.50% and 1.00%, for Class A, Class B, Class C, Class R and Class Y, respectively. The expense limitations do not include interest and fees from borrowings and other expenses not incurred in the ordinary course of the Fund’s business. Notwithstanding the foregoing limits, the Manager is not required to waive or reimburse Fund expenses in excess of the amount of indirect management fees earned from investments in the Underlying Funds.
The Manager has also contractually agreed to waive fees and/or reimburse certain Fund expenses at an annual rate of 0.10% as calculated on the daily net assets of the Fund. This waiver and/or reimbursement is applied after (and in addition to) any other applicable waiver and/or expense reimbursements that may apply. During the reporting period, the Manager waived fees and/or reimbursed the Fund $618,701.
Waivers and/or reimbursements may be modified or terminated as set forth according to the terms in the prospectus.
9. Borrowings and Other Financing
Joint Credit Facility. A number of mutual funds managed by the Manager participate in a $1.3 billion revolving credit facility (the “Facility”) intended to provide short-term financing, if necessary, subject to certain restrictions in connection with atypical redemption activity. Expenses and fees related to the Facility are paid by the participating funds and are disclosed separately or as other expenses on the Statement of Operations. The Fund did not utilize the Facility during the reporting period. Effective July 18, 2016, the Fund no longer participated in the Facility.
36 OPPENHEIMER PORTFOLIO SERIES CONSERVATIVE INVESTOR FUND
REPORT OF INDEPENDENT REGISTERED PUBLIC ACCOUNTING FIRM
The Board of Trustees and Shareholders of Oppenheimer Portfolio Series:
We have audited the accompanying statement of assets and liabilities of Conservative Investor Fund (a series of Oppenheimer Portfolio Series), including the statement of investments, as of January 31, 2017, and the related statement of operations for the year then ended, the statements of changes in net assets for each of the years in the two-year period then ended, and the financial highlights for each of the years in the five-year period then ended. These financial statements and financial highlights are the responsibility of the Fund’s management. Our responsibility is to express an opinion on these financial statements and financial highlights based on our audits.
We conducted our audits in accordance with the standards of the Public Company Accounting Oversight Board (United States). Those standards require that we plan and perform the audit to obtain reasonable assurance about whether the financial statements and financial highlights are free of material misstatement. An audit includes examining, on a test basis, evidence supporting the amounts and disclosures in the financial statements. Our procedures included confirmation of securities owned as of January 31, 2017, by correspondence with the transfer agent. An audit also includes assessing the accounting principles used and significant estimates made by management, as well as evaluating the overall financial statement presentation. We believe that our audits provide a reasonable basis for our opinion.
In our opinion, the financial statements and financial highlights referred to above present fairly, in all material respects, the financial position of Conservative Investor Fund as of January 31, 2017, the results of its operations for the year then ended, the changes in its net assets for each of the years in the two-year period then ended, and the financial highlights for each of the years in the five-year period then ended, in conformity with U.S. generally accepted accounting principles.
KPMGLLP
Denver, Colorado
March 24, 2017
37 OPPENHEIMER PORTFOLIO SERIES CONSERVATIVE INVESTOR FUND
FEDERAL INCOME TAX INFORMATION Unaudited
In early 2017, if applicable, shareholders of record received information regarding all dividends and distributions paid to them by the Fund during calendar year 2016.
Dividends, if any, paid by the Fund during the reporting period which are not designated as capital gain distributions should be multiplied by the maximum amount allowable but not less than 14.14% to arrive at the amount eligible for the corporate dividend-received deduction.
A portion, if any, of the dividends paid by the Fund during the reporting period which are not designated as capital gain distributions are eligible for lower individual income tax rates to the extent that the Fund has received qualified dividend income as stipulated by recent tax legislation. The maximum amount allowable but not less than $2,418,828 of the Fund’s fiscal year taxable income may be eligible for the lower individual income tax rates. In early 2017, shareholders of record received information regarding the percentage of distributions that are eligible for lower individual income tax rates.
Recent tax legislation allows a regulated investment company to designate distributions not designated as capital gain distributions, as either interest related dividends or short-term capital gain dividends, both of which are exempt from the U.S. withholding tax applicable to non U.S. taxpayers. For the reporting period, the maximum amount allowable but not less than $6,703,413 of the ordinary distributions to be paid by the Fund qualifies as an interest related dividend.
The Fund has elected the application of Section 853 of the Internal Revenue Code to permit shareholders to take a federal income tax credit or deduction, at their option, on a per share basis. The maximum amount allowable but not less than $57,405 of foreign income taxes were paid by the Fund during the reporting period. A separate notice will be mailed to each shareholder, which will reflect the proportionate share of such foreign taxes which must be treated by shareholders as gross income for federal income tax purposes.
Gross income of the maximum amount allowable but not less than $446,620 was derived from sources within foreign countries or possessions of the United States.
The foregoing information is presented to assist shareholders in reporting distributions received from the Fund to the Internal Revenue Service. Because of the complexity of the federal regulations which may affect your individual tax return and the many variations in state and local tax regulations, we recommend that you consult your tax advisor for specific guidance.
38 OPPENHEIMER PORTFOLIO SERIES CONSERVATIVE INVESTOR FUND
BOARD APPROVAL OF THE FUND’S INVESTMENT ADVISORY AND SUB-ADVISORY AGREEMENTS Unaudited
The Fund has entered into an investment advisory agreement with OFI Global Asset Management, Inc. (“OFI Global” or the “Adviser”), a wholly-owned subsidiary of OppenheimerFunds, Inc. (“OFI” or the “Sub-Adviser”) (“OFI Global” and “OFI” together, the “Managers”) and OFI Global has entered into a sub-advisory agreement with OFI whereby OFI provides investment sub-advisory services to the Fund (collectively, the “Agreements”). Each year, the Board of Trustees (the “Board”), including a majority of the independent Trustees, is required to determine whether to approve the terms of the Agreements and the renewal thereof. The Investment Company Act of 1940, as amended, requires that the Board request and evaluate, and that the Managers provide, such information as may be reasonably necessary to evaluate the terms of the Agreements. The Board employs an independent consultant to prepare a report that provides information, including comparative information that the Board requests for that purpose. In addition to in-person meetings focused on this evaluation, the Board receives information throughout the year regarding Fund services, fees, expenses and performance.
The Managers and the independent consultant provided information to the Board on the following factors: (i) the nature, quality and extent of the Managers’ services, (ii) the comparative investment performance of the Fund and the Managers, (iii) the fees and expenses of the Fund, including comparative fee and expense information, (iv) the profitability of the Managers and their affiliates, including an analysis of the cost of providing services, (v) whether economies of scale are realized as the Fund grows and whether fee levels reflect these economies of scale for Fund investors and (vi) other benefits to the Managers from their relationship with the Fund. The Board was aware that there are alternatives to retaining the Managers.
Outlined below is a summary of the principal information considered by the Board as well as the Board’s conclusions.
Nature, Quality and Extent of Services. The Board considered information about the nature, quality and extent of the services provided to the Fund and information regarding the Managers’ key personnel who provide such services. The Managers’ duties include providing the Fund with the services of the portfolio managers and the Sub-Adviser’s investment team, who provide research, analysis and other advisory services in regard to the Fund’s investments; and securities trading services. OFI Global is responsible for oversight of third-party service providers; monitoring compliance with applicable Fund policies and procedures and adherence to the Fund’s investment restrictions; risk management; and oversight of the Sub-Adviser. OFI Global is also responsible for providing certain administrative services to the Fund as well. Those services include providing and supervising all administrative and clerical personnel who are necessary in order to provide effective corporate administration for the Fund; compiling and maintaining records with respect to the Fund’s operations; preparing and filing reports required by the U.S. Securities and Exchange Commission; preparing periodic reports regarding the operations of the Fund for its shareholders; preparing proxy materials for shareholder meetings; and preparing the registration statements required by federal and state securities laws for the sale of the Fund’s shares. OFI Global also provides the Fund with office space, facilities and equipment.
39 OPPENHEIMER PORTFOLIO SERIES CONSERVATIVE INVESTOR FUND
|
BOARD APPROVAL OF THE FUND’S INVESTMENT ADVISORY AND SUB-ADVISORY AGREEMENTS Unaudited / Continued |
The Board also considered the quality of the services provided and the quality of the Managers’ resources that are available to the Fund. The Board took account of the fact that the Sub-Adviser has over fifty years of experience as an investment adviser and that its assets under management rank it among the top mutual fund managers in the United States. The Board evaluated the Managers’ advisory, administrative, accounting, legal, compliance services and risk management, and information the Board has received regarding the experience and professional qualifications of the Managers’ key personnel and the size and functions of its staff. In its evaluation of the quality of the portfolio management services provided, the Board considered the experience of Mark Hamilton and Dokyoung Lee, the portfolio managers for the Fund, and the experience of the portfolio managers and the investment performance of the investment companies in which the Fund invests (the “Underlying Funds”). The Board members also considered the totality of their experiences with the Managers as directors or trustees of the Fund and other funds advised by the Managers. The Board considered information regarding the quality of services provided by affiliates of the Managers, which the Board members have become knowledgeable about through their experiences with the Managers and in connection with the renewal of the Fund’s service agreements. The Board concluded, in light of the Managers’ experience, reputation, personnel, operations and resources that the Fund benefits from the services provided under the Agreements.
Investment Performance of the Managers and the Fund. Throughout the year, the Managers provided information on the investment performance of the Fund, the Adviser and the Sub-Adviser, including comparative performance information. The Board also reviewed information, prepared by the Managers and the independent consultant, comparing the Fund’s historical performance to relevant benchmark or market indices and to the performance of other retail funds in the conservative allocation category. The Board noted that the Fund’s one-year, three-year, five-year and ten-year performance was below its category median.
Fees and Expenses of the Fund. The Board reviewed the expenses borne by the Fund. The Adviser does not charge a management fee to the Fund; however, the Adviser collects indirect management fees from the Fund’s Underlying Funds. The independent consultant provided comparative data in regard to the fees and expenses of the Fund and other retail front-end load conservative allocation funds with comparable asset levels and distribution features. After discussions with the Board, the Adviser has voluntarily agreed to waive fees and/or reimburse the Fund so that the total annual fund operating expenses, excluding certain expenses, as a percentage of average daily net assets will not exceed the following annual rates: 1.25% for Class A shares, 2.00% for Class B shares, 2.00% for Class C shares, 1.50% for Class R shares and 1.00% for Class Y shares, as calculated on the daily net assets of the Fund. This fee waiver and/or expense reimbursement may be amended or withdrawn at any time without prior notice to shareholders. After discussions with the Board, the Adviser has also agreed to contractually waive fees and/or reimburse certain Fund expenses at an annual rate of 0.10% as calculated on the daily net assets of the Fund. This waiver and/or reimbursement is applied after (and in addition to) any other applicable fee waivers and/or expense reimbursements that apply. The Adviser is not required to waive or reimburse Fund
40 OPPENHEIMER PORTFOLIO SERIES CONSERVATIVE INVESTOR FUND
expenses in excess of the amount of indirect management fees earned from investments in the Underlying Funds. This fee waiver and/or expense reimbursement may not be amended or withdrawn until one year from the date of the prospectus, unless approved by the Board. The Board noted that the Fund was charged no actual management fees, exclusive of Underlying Fund management fees, while certain peer group funds did charge direct management fees. The Board also noted that the Fund’s total expenses were lower than its peer group median and category median.
Economies of Scale and Profits Realized by the Adviser and Sub-Adviser. The Board considered information regarding the Managers’ costs in serving as the Fund’s investment adviser and sub-adviser, including the costs associated with the personnel and systems necessary to manage the Fund, and information regarding the Managers’ profitability from their relationship with the Fund. The Board also considered that the Managers must be able to pay and retain experienced professional personnel at competitive rates to provide quality services to the Fund. The Board reviewed whether the Managers may realize economies of scale in managing and supporting the Fund and whether those economies of scale benefit the Fund’s shareholders at the current level of Fund assets in relation to its management fee. The Fund currently does not charge a management fee.
Other Benefits to the Managers. In addition to considering the profits realized by the Managers, the Board considered information that was provided regarding the direct and indirect benefits the Managers receive as a result of their relationship with the Fund, including compensation paid to the Managers’ affiliates.
Conclusions. These factors were also considered by the independent Trustees meeting separately from the full Board, assisted by experienced counsel to the Fund and to the independent Trustees. Fund counsel and the independent Trustees’ counsel are independent of the Managers within the meaning and intent of the Securities and Exchange Commission Rules.
Based on its review of the information it received and its evaluations described above, the Board, including a majority of the independent Trustees, decided to continue the Agreements through September 30, 2017. In arriving at its decision, the Board did not identify any factor or factors as being more important than others, but considered all of the above information, and considered the terms and conditions of the Agreements, including the management fees, in light of all the surrounding circumstances.
41 OPPENHEIMER PORTFOLIO SERIES CONSERVATIVE INVESTOR FUND
PORTFOLIO PROXY VOTING POLICIES AND GUIDELINES;
UPDATES TO STATEMENTS OF INVESTMENTS Unaudited
The Fund has adopted Portfolio Proxy Voting Policies and Guidelines under which the Fund votes proxies relating to securities (“portfolio proxies”) held by the Fund. A description of the Fund’s Portfolio Proxy Voting Policies and Guidelines is available (i) without charge, upon request, by calling the Fund toll-free at 1.800.CALL OPP (225.5677), (ii) on the Fund’s website at www.oppenheimerfunds.com, and (iii) on the SEC’s website at www.sec.gov. In addition, the Fund is required to file Form N-PX, with its complete proxy voting record for the 12 months ended June 30th, no later than August 31st of each year. The Fund’s voting record is available (i) without charge, upon request, by calling the Fund toll-free at 1.800.CALL OPP (225.5677), and (ii) in the Form N-PX filing on the SEC’s website at www.sec.gov.
The Fund files its complete schedule of portfolio holdings with the SEC for the first quarter and the third quarter of each fiscal year on Form N-Q. The Fund’s Form N-Q filings are available on the SEC’s website at www.sec.gov. Those forms may be reviewed and copied at the SEC’s Public Reference Room in Washington, D.C. Information on the operation of the Public Reference Room may be obtained by calling 1-800-SEC-0330.
Householding—Delivery of Shareholder Documents
This is to inform you about OppenheimerFunds’ “householding” policy. If more than one member of your household maintains an account in a particular fund, OppenheimerFunds will mail only one copy of the fund’s prospectus (or, if available, the fund’s summary prospectus), annual and semiannual report and privacy policy. The consolidation of these mailings, called householding, benefits your fund through reduced mailing expense, and benefits you by reducing the volume of mail you receive from OppenheimerFunds. Householding does not affect the delivery of your account statements.
Please note that we will continue to household these mailings for as long as you remain an OppenheimerFunds shareholder, unless you request otherwise. If you prefer to receive multiple copies of these materials, please call us at 1.800.CALL-OPP (225-5677). You may also notify us in writing or via email. We will begin sending you individual copies of the prospectus (or, if available, the summary prospectus), reports and privacy policy within 30 days of receiving your request to stop householding.
42 OPPENHEIMER PORTFOLIO SERIES CONSERVATIVE INVESTOR FUND
TRUSTEES AND OFFICERS Unaudited
| | |
Name, Position(s) Held with the Fund, Length of Service, Year of Birth | | Principal Occupation(s) During the Past 5 Years; Other Trusteeships/ Directorships Held; Number of Portfolios in the Fund Complex Currently Overseen |
| |
| INDEPENDENT TRUSTEES | | The address of each Trustee in the chart below is 6803 S. Tucson Way, Centennial, Colorado 80112-3924. Each Trustee serves for an indefinite term, or until his or her resignation, retirement, death or removal. |
| |
Brian F. Wruble, Chairman of the Board of Trustees (since 2007), and Trustee (since 2005) Year of Birth: 1943 | | Governor and Vice Chairman of Community Foundation of the Florida Keys (non-profit) (since July 2012); Trustee of the Board of Trustees, The Jackson Laboratory (non-profit) (1991-2011 and since May 2014); Chairman Emeritus (since August 2011) of The Jackson Laboratory (non-profit); Member of Zurich Insurance Group’s Investment Management Advisory Council (insurance) (since 2004); Treasurer (since 2007) and Trustee of the Institute for Advanced Study (non-profit educational institute) (since May 1992); Director of Special Value Opportunities Fund, LLC (registered investment company) (affiliate of the Sub-Adviser’s parent company) (September 2004-June 2015); General Partner of Odyssey Partners, L.P. (hedge fund) (September 1995-December 2007); Special Limited Partner of Odyssey Investment Partners, LLC (private equity investment) (January 1999-September 2004). Oversees 56 portfolios in the OppenheimerFunds complex. Mr. Wruble has served on the Boards of certain Oppenheimer funds since April 2001, during which time he has become familiar with the Fund’s (and other Oppenheimer funds’) financial, accounting, regulatory and investment matters and has contributed to the Boards’ deliberations. |
| |
Beth Ann Brown, Trustee (since 2016) Year of Birth: 1968 | | Advisor, Board of Advisors of Caron Engineering Inc. (since December 2014); Independent Consultant (since September 2012); held the following positions at Columbia Management Investment Advisers LLC: Head of Intermediary Distribution (2008-2012), Managing Director, Strategic Relations (2005-2008), Managing Director, Head of National Accounts (2004-2005); Senior Vice President, National Account Manager (2002-2004), Senior Vice President, Key Account Manager (1999-2002) and Vice President, Key Account Manager (1996-1999) of Liberty Funds Distributor, Inc.; President and Director, of Acton Shapleigh Youth Conservation Corps (non-profit) (since 2012); and Vice President and Director of Grahamtastic Connection (non-profit) (since May 2013). Oversees 56 portfolios in the OppenheimerFunds complex. Ms. Brown has served on the Boards of certain Oppenheimer funds since January 2016, during which time she has become familiar with the Fund’s (and other Oppenheimer funds’) financial, accounting, regulatory and investment matters and has contributed to the Boards’ deliberations. |
| |
Edmund P. Giambastiani, Jr., Trustee (since 2013) Year of Birth: 1948 | | Advisory Board Member of the Maxwell School of Citizenship and Public Affairs of Syracuse University (since April 2012); Director of Mercury Defense Systems Inc. (information technology) (August 2011-February 2013); Trustee of the U.S. Naval Academy Foundation (since November 2010); Advisory Board Member of the Massachusetts Institute of Technology Lincoln Laboratory (federally-funded research development center) (since May 2010); Director of The Boeing Company (aerospace and defense) (since October 2009); Trustee of MITRE Corporation (federally-funded research development center) (since September 2008); Independent Director of QinetiQ Group Plc (defense technology and security) |
43 OPPENHEIMER PORTFOLIO SERIES CONSERVATIVE INVESTOR FUND
|
| TRUSTEES AND OFFICERS Unaudited / Continued |
| | |
Edmund P. Giambastiani, Jr., Continued | | (February 2008-August 2011); Lead Director (June 2011-March 2015); Chairman of Alenia North America, Inc. (military and defense products) (January 2008-October 2009); Director of SRA International, Inc. (information technology and services) (January 2008-July 2011); President of Giambastiani Group LLC (national security and energy consulting) (since October 2007); United States Navy, career nuclear submarine officer (June 1970-October 2007), Vice Chairman of the Joint Chiefs of Staff (2005-October 2007), Supreme Allied Commander of NATO Commander Transformation (2003-2005), Commander, U.S. Joint Forces Command (2002-2005). Since his retirement from the U.S. Navy in October 2007, Admiral Giambastiani has also served on numerous U.S. Government advisory boards, investigations and task forces for the Secretaries of Defense, State and Interior and the Central Intelligence Agency. He currently serves as a federal commissioner on the Military Compensation and Retirement Modernization Commission. Oversees 56 portfolios in the OppenheimerFunds complex. Admiral Giambastiani has served on the Boards of certain Oppenheimer funds since February 2013, including as an Advisory Board Member for certain Oppenheimer funds, during which time he has become familiar with the Fund’s (and other Oppenheimer funds’) financial, accounting, regulatory and investment matters and has contributed to the Boards’ deliberations. For purposes of this report, Admiral Giambastiani is identified as a Trustee. |
| |
Elizabeth Krentzman, Trustee (since 2014) Year of Birth: 1959 | | Advisory Board Member of the University of Florida Law Center Association (since 2016) and the Securities and Exchange Commission Historical Society (since 2007); held the following positions at Deloitte & Touche LLP: Principal and Chief Regulatory Advisor for Asset Management Services (2007-2014) and U.S. Mutual Fund Leader (2011-2014); General Counsel of the Investment Company Institute (trade association) (June 2004-April 2007); held the following positions at Deloitte & Touche LLP: National Director of the Investment Management Regulatory Consulting Practice (1997-2004), Principal (2003-2004), Director (1998-2003) and Senior Manager (1997-1998); Assistant Director of the Division of Investment Management – Office of Disclosure and Investment Adviser Regulation (1996- 1997) and various positions with the Division of Investment Management – Office of Regulatory Policy (1991-1996) of the U.S. Securities and Exchange Commission; Associate at Ropes & Gray (1987-1991). Oversees 56 portfolios in the OppenheimerFunds complex. Ms. Krentzman has served on the Boards of certain Oppenheimer funds since August 2014, during which time she has become familiar with the Fund’s (and other Oppenheimer funds’) financial, accounting, regulatory and investment matters and has contributed to the Boards’ deliberations. |
| |
Mary F. Miller, Trustee (since 2005) Year of Birth: 1942 | | Trustee of International House (not-for-profit) (since June 2007); Trustee of the American Symphony Orchestra (not-for-profit) (October 1998-November 2011); and Senior Vice President and General Auditor of American Express Company (financial services company) (July 1998-February 2003). Oversees 56 portfolios in the OppenheimerFunds complex. Ms. Miller has served on the Boards of certain Oppenheimer funds since August 2004, during which time she has become familiar with the Fund’s (and other Oppenheimer funds’) financial, accounting, regulatory and investment matters and has contributed to the Boards’ deliberations. |
44 OPPENHEIMER PORTFOLIO SERIES CONSERVATIVE INVESTOR FUND
| | |
Joel W. Motley, Trustee (since 2005) Year of Birth: 1952 | | Director of Greenwall Foundation (since October 2013); Member of Board and Investment Committee of The Greenwall Foundation (since April 2013); Member of the Vestry of Trinity Wall Street (since April 2012); Director of Southern Africa Legal Services Foundation (since March 2012); Board Member of Pulitzer Center for Crisis Reporting (non-profit journalism) (since March 2011); Managing Director of Public Capital Advisors, LLC (privately-held financial advisor) (since January 2006); Managing Director of Carmona Motley, Inc. (privately-held financial advisor) (since January 2002); Director of Columbia Equity Financial Corp. (privately-held financial advisor) (2002-2007); Managing Director of Carmona Motley Hoffman Inc. (privately-held financial advisor) (January 1998-December 2001); Member of the Finance and Budget Committee of the Council on Foreign Relations, Member of the Investment Committee and Board of Human Rights Watch (since July 2000) and Member of the Investment Committee and Board of Historic Hudson Valley (since February 2010). Oversees 56 portfolios in the OppenheimerFunds complex. Mr. Motley has served on the Boards of certain Oppenheimer funds since October 2002, during which time he has become familiar with the Fund’s (and other Oppenheimer funds’) financial, accounting, regulatory and investment matters and has contributed to the Boards’ deliberations. |
| |
Joanne Pace, Trustee (since 2012) Year of Birth: 1958 | | Advisory Board Director of Massey Quick and Company, LLC (since October 2014); Board Director of Horizon Blue Cross Blue Shield of New Jersey (since November 2012); Advisory Board Director of The Alberleen Group LLC (since March, 2012); Board Member (since January 2015), Advisory Council Member (December 2012-December 2014) of 100 Women in Hedge Funds (non-profit) (since December, 2012); Advisory Council Member of Morgan Stanley Children’s Hospital (non-profit) (since May, 2012); Board Director of The Komera Project (non-profit) (since April, 2012); New York Advisory Board Director of Peace First (non-profit) (2010-2015); Senior Advisor of SECOR Asset Management, LP (2010-2011); Managing Director and Chief Operating Officer of Morgan Stanley Investment Management (2006-2010); Partner and Chief Operating Officer of FrontPoint Partners, LLC (hedge fund) (2005-2006); held the following positions at Credit Suisse: Managing Director (2003-2005); Global Head of Human Resources and member of Executive Board and Operating Committee (2004-2005), Global Head of Operations and Product Control (2003-2004); held the following positions at Morgan Stanley: Managing Director (1997-2003), Controller and Principal Accounting Officer (1999-2003); Chief Financial Officer (temporary assignment) for the Oversight Committee, Long Term Capital Management (1998-1999). Lead Independent Director and Chair of the Audit and Nominating Committee of The Global Chartist Fund, LLC of Oppenheimer Asset Management (2011-2012); Board Director of Managed Funds Association (2008-2010); Board Director of Morgan Stanley Foundation (2007-2010) and Investment Committee Chair (2008-2010). Oversees 56 portfolios in the OppenheimerFunds complex. Ms. Pace has served on the Boards of certain Oppenheimer funds since November 2012, including as an Advisory Board Member for certain Oppenheimer funds, during which time she has become familiar with the Fund’s (and other Oppenheimer funds’) financial, accounting, regulatory and investment matters and has contributed to the Board’s deliberations. For purposes of this report, Ms. Pace is identified as a Trustee. |
| |
Daniel Vandivort, Trustee (since 2014) Year of Birth: 1954 | | Chairman and Lead Independent Director/Trustee (March 2010-September 2014), Chairman of the Audit Committee (March 2009-September 2014) and Director/ Trustee (December 2008-September 2014) of the Board of Directors/Trustees of Value Line Funds; Trustee, Board of Trustees of Huntington Disease Foundation |
45 OPPENHEIMER PORTFOLIO SERIES CONSERVATIVE INVESTOR FUND
|
| TRUSTEES AND OFFICERS Unaudited / Continued |
| | |
Daniel Vandivort, Continued | | of America (since January 2015 and June 2007-December 2013): Trustee, Board of Trustees, RIM Retirement Savings Plan (2005-2007); President and Chief Investment Officer, Robeco Investment Management, formerly known as Weiss Peck and Greer (January 2005-June 2007); Member, Management Committee of Robeco Investment Management (2001-2007); Chairman and Trustee of the Board of Trustees of Weiss, Peck and Greer Funds (2004-2005); Managing Director and Head of Fixed Income, Weiss, Peck and Greer (November 1994-January 2005); Managing Director and Head of Fixed Income, CS First Boston Investment Management (January 1992-November 1994); Director, Global Product Development, First Boston Asset Management (November 1989 to January 1992); Vice President, Fixed Income Sales, First Boston Corp. (May 1984-November 1989). Oversees 56 portfolios in the OppenheimerFunds complex. Mr. Vandivort has served on the Boards of certain Oppenheimer funds since 2014, during which time he has become familiar with the Fund’s (and other Oppenheimer funds’) financial, accounting, regulatory and investment matters and has contributed to the Boards’ deliberations. |
| INTERESTED TRUSTEE AND OFFICER | | Mr. Steinmetz is an “Interested Trustee” because he is affiliated with the Manager and the Sub-Adviser by virtue of his positions as Chairman of the Sub-Adviser and officer and director of the Manager. Both as a Trustee and as an officer, Mr. Steinmetz serves for an indefinite term, or until his resignation, retirement, death or removal. Mr. Steinmetz’s address is 225 Liberty Street, New York, New York 10281-1008. |
| |
Arthur P. Steinmetz Trustee (since 2015), President and Principal Executive Officer (Since 2014) Year of Birth: 1958 | | Chairman of the Sub-Adviser (since January 2015); CEO and Chairman of the Manager (since July 2014), President of the Manager (since May 2013), a Director of the Manager (since January 2013), Director of the Sub-Adviser (since July 2014), President, Management Director and CEO of Oppenheimer Acquisition Corp. (the Sub-Adviser’s parent holding company) (since July 2014), and President and Director of OFI SteelPath, Inc. (since January 2013). Chief Investment Officer of the OppenheimerFunds advisory entities from (January 2013-December 2013); Executive Vice President of the Manager (January 2013-May 2013); Chief Investment Officer of the Sub-Adviser (October 2010-December 2012); Chief Investment Officer, Fixed-Income, of the Sub-Adviser (April 2009-October 2010); Executive Vice President of the Sub-Adviser (October 2009-December 2012); Director of Fixed Income of the Sub-Adviser (January 2009-April 2009); and a Senior Vice President of the Sub-Adviser (March 1993-September 2009). An officer of 103 portfolios in the OppenheimerFunds complex. |
| OTHER OFFICERS OF THE FUND | | The addresses of the Officers in the chart below are as follows: for Messrs. Hamilton, Lee, Mss. Lo Bessette, Foxson and Picciotto, 225 Liberty Street, New York, New York 10281-1008, for Mr. Petersen, 6803 S. Tucson Way, Centennial, Colorado 80112-3924. Each Officer serves for an indefinite term or until his or her resignation, retirement, death or removal. |
| |
Mark Hamilton, Vice President (since 2013) Year of Birth: 1965 | | Chief Investment Officer, Asset Allocation and Senior Vice President of the Sub-Adviser (since April 2013). Mr. Hamilton served at AllianceBernstein L.P. (from 1994-2013) as an Investment Director of Dynamic Asset Allocation (from 2010-2013), Head of North American Blend Team (from 2009-2010), and Senior Portfolio Manager of Blend Strategies (from 2006-2010). A portfolio manager and officer of other portfolios in the OppenheimerFunds complex. |
46 OPPENHEIMER PORTFOLIO SERIES CONSERVATIVE INVESTOR FUND
| | |
Dokyoung Lee, Vice President (since 2014) Year of Birth: 1965 | | Director of Research, Global Multi-Asset Group and a Senior Vice President of the Sub-Adviser (since October 2013). Mr. Lee served at Alliance Bernstein L.P. (1994- 2013): Director of Research for Strategic Asset Allocation (2011-2013), Director of Research for Blend Strategies (2008-2011), Head of Asia Pacific Blend Strategies (2005-2008), Head of Quantitative Research and Senior Portfolio Manager for Japan Value Equities (2001-2005), Portfolio Manager for Emerging Markets Value Equities (1997-2001), and Quantitative Analyst for US Value Equities (1994-1997). A portfolio manager and officer of other portfolios in the OppenheimerFunds complex. |
| |
Cynthia Lo Bessette, Secretary and Chief Legal Officer (since 2016) Year of Birth: 1969 | | Executive Vice President, General Counsel and Secretary of the Manager (since February 2016); Chief Legal Officer of the Sub-Adviser and the Distributor (since February 2016); Vice President, General Counsel and Secretary of Oppenheimer Acquisition Corp. (since February 2016); General Counsel of OFI SteelPath, Inc., VTL Associates, LLC and Index Management Solutions, LLC (since February 2016); Chief Legal Officer of OFI Global Institutional, Inc., HarbourView Asset Management Corporation, OFI Global Trust Company, Oppenheimer Real Asset Management, Inc., OFI Private Investments Inc., Shareholder Services, Inc. and Trinity Investment Management Corporation (since February 2016); Senior Vice President and Deputy General Counsel (March 2015-February 2016) and Executive Vice President, Vice President, Corporate Counsel (February 2012-March 2015) and Deputy Chief Legal Officer (April 2013-March 2015) of Jennison Associates LLC; Assistant General Counsel (April 2008-September 2009) and Deputy General Counsel (October 2009-February 2012) of Lord Abbett & Co. LLC. An officer of 103 portfolios in the OppenheimerFunds complex. |
| |
Jennifer Foxson, Vice President and Chief Business Officer (since 2014) Year of Birth: 1969 | | Senior Vice President of OppenheimerFunds Distributor, Inc. (since June 2014); Vice President of OppenheimerFunds Distributor, Inc. (April 2006-June 2014); Vice President of the Sub-Adviser (January 1998-March 2006); Assistant Vice President of the Sub-Adviser (October 1991-December 1998). An officer of 103 portfolios in the OppenheimerFunds complex. |
| |
Mary Ann Picciotto, Chief Compliance Officer and Chief Anti-Money Laundering Officer (since 2014) Year of Birth: 1973 | | Senior Vice President and Chief Compliance Officer of the Manager (since March 2014); Chief Compliance Officer of the Sub-Adviser, OFI SteelPath, Inc., OFI Global Trust Company, OFI Global Institutional, Inc., Oppenheimer Real Asset Management, Inc., OFI Private Investments, Inc., Harborview Asset Management Corporation, Trinity Investment Management Corporation, and Shareholder Services, Inc. (since March 2014); Managing Director of Morgan Stanley Investment Management Inc. and certain of its various affiliated entities; Chief Compliance Officer of various Morgan Stanley Funds (May 2010-January 2014); Chief Compliance Officer of Morgan Stanley Investment Management Inc. (April 2007-January 2014). An officer of 103 portfolios in the OppenheimerFunds complex. |
| |
Brian S. Petersen, Treasurer and Principal Financial & Accounting Officer (since 2016) Year of Birth: 1970 | | Vice President of the Manager (since January 2013); Vice President of the Sub-Adviser (February 2007-December 2012); Assistant Vice President of the Sub-Adviser (August 2002-2007). An officer of 103 portfolios in the OppenheimerFunds complex. |
The Fund’s Statement of Additional Information contains additional information about the Fund’s Trustees and Officers and is available without charge upon request by calling 1.800.CALL OPP (225.5677).
47 OPPENHEIMER PORTFOLIO SERIES CONSERVATIVE INVESTOR FUND
OPPENHEIMER PORTFOLIO SERIES CONSERVATIVE INVESTOR FUND
| | |
| Manager | | OFI Global Asset Management, Inc. |
| |
| Sub-Adviser | | OppenheimerFunds, Inc. |
| |
| Distributor | | OppenheimerFunds Distributor, Inc. |
| |
| Transfer and Shareholder Servicing Agent | | OFI Global Asset Management, Inc. |
| |
| Sub-Transfer Agent | | Shareholder Services, Inc. DBA OppenheimerFunds Services |
| |
Independent Registered Public Accounting Firm | | KPMG LLP |
| |
| Legal Counsel | | Kramer Levin Naftalis & Frankel LLP |
© 2017 OppenheimerFunds, Inc. All rights reserved.
48 OPPENHEIMER PORTFOLIO SERIES CONSERVATIVE INVESTOR FUND
PRIVACY POLICY NOTICE
As an Oppenheimer fund shareholder, you are entitled to know how we protect your personal information and how we limit its disclosure.
Information Sources
We obtain nonpublic personal information about our shareholders from the following sources:
● Applications or other forms
● When you create a user ID and password for online account access
● When you enroll in eDocs Direct,SM our electronic document delivery service
● Your transactions with us, our affiliates or others
● Technologies on our website, including: “cookies” and web beacons, which are used to collect data on the pages you visit and the features you use.
If you visit oppenheimerfunds.com and do not log on to the secure account information areas, we do not obtain any personal information about you. When you do log on to a secure area, we do obtain your user ID and password to identify you. We also use this information to provide you with products and services you have requested, to inform you about products and services that you may be interested in and assist you in other ways.
We do not collect personal information through our website unless you willingly provide it to us, either directly by email or in those areas of the website that request information. In order to update your personal information (including your mailing address, email address and phone number) you must first log on and visit your user profile.
If you have set your browser to warn you before accepting cookies, you will receive the warning message with each cookie. You can refuse cookies by turning them off in your browser. However, doing so may limit your access to certain sections of our website.
We use cookies to help us improve and manage our website. For example, cookies help us recognize new versus repeat visitors to the site, track the pages visited, and enable some special features on the website. This data helps us provide a better service for our website visitors.
Protection of Information
We do not disclose any non-public personal information (such as names on a customer list) about current or former customers to anyone, except as permitted by law.
Disclosure of Information
Copies of confirmations, account statements and other documents reporting activity in your fund accounts are made available to your financial advisor (as designated by you). We may also use details about you and your investments to help us, our financial service affiliates, or firms that jointly market their financial products and services with ours, to better serve your investment needs or suggest educational material that may be of interest to you. If this requires us to provide you with an opportunity to “opt in” or “opt out” of such information sharing with a firm not affiliated with us, you will receive notification on how to do so, before any such sharing takes place.
Right of Refusal
We will not disclose your personal information to unaffiliated third parties (except as permitted by law), unless we first offer you a reasonable opportunity to refuse or “opt out” of such disclosure.
49 OPPENHEIMER PORTFOLIO SERIES CONSERVATIVE INVESTOR FUND
|
| PRIVACY POLICY NOTICE Continued |
Internet Security and Encryption
In general, the email services provided by our website are encrypted and provide a secure and private means of communication with us. To protect your own privacy, confidential and/or personal information should only be communicated via email when you are advised that you are using a secure website. As a security measure, we do not include personal or account information in non-secure emails, and we advise you not to send such information to us in non-secure emails. Instead, you may take advantage of the secure features of our website to encrypt your email correspondence. To do this, you will need to use a browser that supports Secure Sockets Layer (SSL) protocol.
| ● | | All transactions, including redemptions, exchanges and purchases, are secured by SSL and 256-bit encryption. SSL is used to establish a secure connection between your PC and OppenheimerFunds’ server. It transmits information in an encrypted and scrambled format. |
| ● | | Encryption is achieved through an electronic scrambling technology that uses a “key” to code and then decode the data. Encryption acts like the cable converter box you may have on your television set. It scrambles data with a secret code so that no one can make sense of it while it is being transmitted. When the data reaches its destination, the same software unscrambles the data. |
| ● | | You can exit the secure area by either closing your browser, or for added security, you can use the Log Out button before you close your browser. |
Other Security Measures
We maintain physical, electronic and procedural safeguards to protect your personal account information. Our employees and agents have access to that information only so that they may offer you products or provide services, for example, when responding to your account questions.
How You Can Help
You can also do your part to keep your account information private and to prevent unauthorized transactions. If you obtain a user ID and password for your account, safeguard that information. Also, take special precautions when accessing your account on a computer used by others.
Who We Are
This joint notice describes the privacy policies of the Oppenheimer funds, OppenheimerFunds, Inc., each of its investment adviser subsidiaries, OppenheimerFunds Distributor, Inc. and OFI Global Trust Co. It applies to all Oppenheimer fund accounts you presently have, or may open in the future, using your Social Security number—whether or not you remain a shareholder of our funds. This notice was last updated November 2016. In the event it is updated or changed, we will post an updated notice on our website at oppenheimerfunds.com. If you have any questions about this privacy policy, write to us at P.O. Box 5270, Denver, CO 80217-5270, email us by clicking on the Contact Us section of our website at oppenheimerfunds.com or call us at 1.800.CALL OPP (225.5677).
50 OPPENHEIMER PORTFOLIO SERIES CONSERVATIVE INVESTOR FUND
THIS PAGE INTENTIONALLY LEFT BLANK.
51 OPPENHEIMER PORTFOLIO SERIES CONSERVATIVE INVESTOR FUND
THIS PAGE INTENTIONALLY LEFT BLANK.
52 OPPENHEIMER PORTFOLIO SERIES CONSERVATIVE INVESTOR FUND
THIS PAGE INTENTIONALLY LEFT BLANK.
53 OPPENHEIMER PORTFOLIO SERIES CONSERVATIVE INVESTOR FUND
THIS PAGE INTENTIONALLY LEFT BLANK.
54 OPPENHEIMER PORTFOLIO SERIES CONSERVATIVE INVESTOR FUND
THIS PAGE INTENTIONALLY LEFT BLANK.
55 OPPENHEIMER PORTFOLIO SERIES CONSERVATIVE INVESTOR FUND
| | | | |
| | 
Oppenheimer Funds® The Right Way to Invest | | |
Visit Us oppenheimerfunds.com Call Us 800 225 5677 Follow Us 
| | Visit us at oppenheimerfunds.com for 24-hr access to account information and transactions or call us at 800.CALL OPP (800.225.5677) for 24-hr automated information and automated transactions. Representatives also available Mon–Fri 8am-8pm ET. | | |
| | | | |
| | Oppenheimer funds are distributed by OppenheimerFunds Distributor, Inc. 225 Liberty Street, New York, NY 10281-1008 © 2017 OppenheimerFunds Distributor, Inc. All rights reserved. RA0540.001.0117 March 24, 2017 | | |
| | | | | | | | |
| | Annual Report | | | 1/31/2017 | | | |
| | | | | |
| | 
| | | | | | |
| | Oppenheimer Portfolio Series Moderate Investor Fund | | | | | | |
| | | | | | | | |
| | | | | | | | |
| | | | | | | | |
| | | | | | | | |
| | | | | | | | |
| | | | | | | | |
| | | | | | | | |
| | | | | | | | |
Class A Shares
AVERAGE ANNUAL TOTAL RETURNS AT 1/31/17
| | | | | | | | |
| | | Class A Shares of the Fund | | | | |
| | Without Sales Charge | | With Sales Charge | | Bloomberg Barclays U.S. Aggregate Bond Index | | S&P 500 Index |
1-Year | | 10.95% | | 4.57% | | 1.45% | | 20.04% |
|
5-Year | | 6.62 | | 5.36 | | 2.09 | | 14.09 |
|
10-Year | | 2.13 | | 1.53 | | 4.37 | | 6.99 |
|
Performance data quoted represents past performance, which does not guarantee future results. The investment return and principal value of an investment in the Fund will fluctuate so that an investor’s shares, when redeemed, may be worth more or less than their original cost. Fund returns include changes in share price, reinvested distributions, and a 5.75% maximum applicable sales charge except where “without sales charge” is indicated. Current performance may be lower or higher than the performance quoted. Returns do not consider capital gains or income taxes on an individual’s investment. For performance data current to the most recent month-end, visit oppenheimerfunds.com or call 1.800.CALL OPP (225.5677). See Fund prospectuses and summary prospectuses for more information on share classes and sales charges.
2 OPPENHEIMER PORTFOLIO SERIES MODERATE INVESTOR FUND
Fund Performance Discussion1
MARKET OVERVIEW
Markets were volatile this reporting period. Central Bank policy was a major focus this reporting period, with statements and actions from the Federal Reserve (the “Fed”), Bank of Japan (BoJ), European Central Bank (“ECB”), and more, fueling movements in global capital markets. Throughout most of the year, the question of when the Fed would raise interest rates remained. It finally did in the closing month of the reporting period. Improved economic data and outlook led the Fed to hike its policy rates by 0.25% in December, meeting market expectations. The Fed’s policymaking Federal Open Market Committee noted they will continue to be cautious and will hike rates gradually, but posted a modestly optimistic outlook. By year end, markets were pricing for slightly more than two hikes by the end of 2017.
Other major events that created volatility during the year were the United Kingdom’s (“UK”) vote to leave the European Union (commonly referred to as Brexit) and the U.S. Presidential election. After Brexit, U.S. markets became extremely volatile for two days. However, the event came and went with most financial assets rallying strong early in the third quarter.
COMPARISON OF CHANGE IN VALUE OF $10,000 HYPOTHETICAL INVESTMENTS IN:
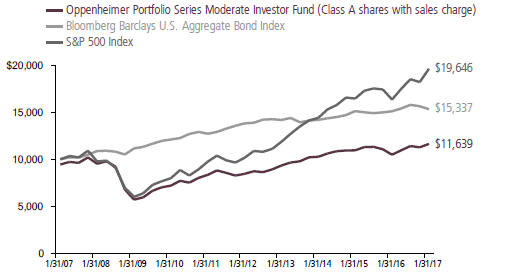
1. The Fund is invested in Class I shares of all underlying funds discussed in this Fund Performance Discussion, except for Oppenheimer Master Loan Fund, LLC, which does not offer Class I shares.
3 OPPENHEIMER PORTFOLIO SERIES MODERATE INVESTOR FUND
Markets turned to general risk on mode after the surprise election of Donald Trump with equities climbing, credit spreads narrowing to the tightest levels since early 2015, and U.S. Treasury yields climbing to levels not experienced since 2014. The dollar rallied strongly against many currencies, particularly after Mr. Trump’s victory.
In this environment, equities generally produced strong results and outperformed fixed-income securities for the overall one-year period.
FUND REVIEW
Against this market backdrop, the Fund’s Class A shares (without sales charge) produced a total return of 10.95%. The Fund employs a combination of sophisticated quantitative tools and qualitative analysis to seek to construct a well-diversified, globally allocated portfolio. The portfolio is allocated among a number of OppenheimerFunds’ actively managed funds according to risk and strategically rebalanced based on market conditions. At period end, the Fund had roughly 59% of its assets invested in equity funds, 31% in fixed income funds and 10% in alternative funds. In an environment that favored equities over fixed-income, the Fund’s diversified allocation resulted in outperformance versus the Bloomberg Barclays U.S. Aggregate Bond Index’s return of 1.45% and underperformance versus the S&P 500 Index’s return of 20.04%.
Equity funds produced the strongest contribution to the Fund’s total return, with domestic equity funds leading the way. All of the Fund’s domestic equity holdings provided positive returns. Oppenheimer Value Fund was the strongest performer for the Fund this reporting period, followed by Oppenheimer Capital Appreciation Fund. Oppenheimer Value Fund typically invests in large company U.S. value stocks. Value stocks outperformed growth stocks for much of the period, and this benefited Oppenheimer Value Fund’s performance. Oppenheimer Capital Appreciation Fund typically invests in large-cap U.S. growth stocks. Effective October 5, 2016, the new Portfolio Manager of this underlying fund is Paul Larson, who joined OppenheimerFunds in 2013 and has 20 years of investment experience. This underlying fund produced positive results. While still remaining a growth fund, the new portfolio management team has reduced the number of holdings and reduced some previously large sector bets relative to its benchmark, the Russell 1000 Growth Index.
All of the underlying foreign equity funds produced positive results for the Fund this period as well, led by Oppenheimer International Equity Fund (named Oppenheimer International Value Fund prior to 12/28/16), Oppenheimer Developing Markets Fund, and Oppenheimer International Growth Fund. Oppenheimer International Equity Fund typically invests in international stocks that its portfolio manager believes
4 OPPENHEIMER PORTFOLIO SERIES MODERATE INVESTOR FUND
are undervalued. This underlying fund favors a blend/core approach, but its emphasis on value stocks this reporting period had a positive impact on performance as value generally outperformed growth for much of the period. Oppenheimer Developing Markets Fund invests in developing market stocks. Developing market stocks performed well in 2016, supported by the bottoming of both oil prices and domestic growth conditions across the emerging markets. Despite performance reversing a bit following the outcome of the U.S. election, the asset class rebounded in January 2017 as the initial negative reaction began to subside. Oppenheimer International Growth Fund invests in a mix of foreign growth stocks. This underlying fund produced positive absolute results during the period, but its performance was held back a degree by its roughly 19% position in the UK at period end, aggravated by weakening pound versus the U.S. dollar. However, most of its UK-domiciled companies are global businesses with revenues from around the world. Translating those revenues into cheaper pounds should flatter their earnings over time.
Although fixed-income underperformed equities this reporting period, the Fund did receive positive contributions from each of its fixed-income holdings, led by its exposure to senior loans through Oppenheimer Master Loan Fund, LLC. During the period, loans experienced strong demand due to their
attractive income and low interest rate sensitivity. Oppenheimer International Bond Fund and Oppenheimer Core Bond Fund were also top performers in the fixed-income space. Oppenheimer International Bond Fund typically invests in international fixed income securities in both developed and emerging market countries. This underlying fund invests in three major risk categories, or levers – interest rates (typically government bonds), currencies, and credit (corporate bonds and other fixed-income instruments containing credit risk). All three areas produced positive absolute results. Oppenheimer Core Bond Fund, which typically invests in U.S. investment-grade fixed income instruments, produced positive results this period. This underlying fund’s investment team continued to favor diversified corporate and structured credit exposure. However, the team is more cautious on credit in general as it believes we currently reside in the second half of the credit cycle.
The Fund’s allocation to alternative funds also produced positive absolute returns. The strongest contributor to the Fund’s performance in this area was Oppenheimer Gold & Special Minerals Fund. Over the first half of the reporting period, investors flocked to gold bullion and gold stocks as they sought refuge from global economic challenges. Gold stocks reversed course over the second half of the reporting period as investors’ risk appetites grew and they shifted assets away
5 OPPENHEIMER PORTFOLIO SERIES MODERATE INVESTOR FUND
from traditional safe havens. However, this reversal was not enough to offset the strong results over the first half of the period.
| | |
 | | 
Mark Hamilton Portfolio Manager |
| |
| | |
 | | 
Dokyoung Lee, CFA Portfolio Manager |
| |
6 OPPENHEIMER PORTFOLIO SERIES MODERATE INVESTOR FUND
Top Holdings and Allocations
ASSET CLASS ALLOCATION
| | |
Domestic Equity Funds | | 44.2% |
Domestic Fixed Income Funds | | 24.7 |
Foreign Equity Funds | | 14.8 |
Alternative Funds | | 9.8 |
Foreign Fixed Income Funds | | 6.3 |
Money Market Funds | | 0.2 |
Portfolio holdings and allocations are subject to change. Percentages are as of January 31, 2017, and are based on the total market value of investments.
TOP TEN HOLDINGS
| | |
| Oppenheimer Value Fund, Cl. I | | 19.6% |
| Oppenheimer Capital Appreciation Fund, Cl. I | | 17.8 |
| Oppenheimer Core Bond Fund, Cl. I | | 15.0 |
| Oppenheimer Limited-Term Government Fund, Cl. I | | 6.6 |
| Oppenheimer International Bond Fund, Cl. I | | 6.3 |
| Oppenheimer International Growth Fund, Cl. I | | 5.7 |
| Oppenheimer International Equity Fund, Cl. I | | 5.1 |
| Oppenheimer Master Inflation Protected Securities Fund, LLC | | 4.2 |
| Oppenheimer Main Street Mid Cap Fund, Cl. I | | 3.5 |
| Oppenheimer Main Street Small Cap Fund, Cl. I | | 3.2 |
Portfolio holdings and allocations are subject to change. Percentages are as of January 31, 2017, and are based on net assets. For more current Top 10 Fund holdings, please visit oppenheimerfunds.com.
7 OPPENHEIMER PORTFOLIO SERIES MODERATE INVESTOR FUND
Share Class Performance
AVERAGE ANNUAL TOTAL RETURNS WITHOUT SALES CHARGE AS OF 1/31/17
| | | | | | | | | | | | | | | | |
| | | Inception | | | | | | | | | | |
| | | Date | | | 1-Year | | | 5-Year | | | 10-Year | |
Class A (OAMIX) | | | 4/5/05 | | | | 10.95 | % | | | 6.62 | % | | | 2.13% | |
Class B (OBMIX) | | | 4/5/05 | | | | 10.01 | | | | 5.78 | | | | 1.63 | |
Class C (OCMIX) | | | 4/5/05 | | | | 10.12 | | | | 5.81 | | | | 1.36 | |
Class R (ONMIX) | | | 4/5/05 | | | | 10.64 | | | | 6.35 | | | | 1.87 | |
Class Y (OYMIX) | | | 4/5/05 | | | | 11.16 | | | | 6.87 | | | | 2.44 | |
AVERAGE ANNUAL TOTAL RETURNS WITH SALES CHARGE AS OF 1/31/17 | |
| | | Inception | | | | | | | | | | |
| | | Date | | | 1-Year | | | 5-Year | | | 10-Year | |
Class A (OAMIX) | | | 4/5/05 | | | | 4.57 | % | | | 5.36 | % | | | 1.53% | |
Class B (OBMIX) | | | 4/5/05 | | | | 5.01 | | | | 5.46 | | | | 1.63 | |
Class C (OCMIX) | | | 4/5/05 | | | | 9.12 | | | | 5.81 | | | | 1.36 | |
Class R (ONMIX) | | | 4/5/05 | | | | 10.64 | | | | 6.35 | | | | 1.87 | |
Class Y (OYMIX) | | | 4/5/05 | | | | 11.16 | | | | 6.87 | | | | 2.44 | |
Performance data quoted represents past performance, which does not guarantee future results. The investment return and principal value of an investment in the Fund will fluctuate so that an investor’s shares, when redeemed, may be worth more or less than their original cost. Current performance may be lower or higher than the performance quoted. Returns do not consider capital gains or income taxes on an individual’s investment. For performance data current to the most recent month-end, visit oppenheimerfunds.com or call 1.800.CALL OPP (225.5677). Fund returns include changes in share price, reinvested distributions, and the applicable sales charge: for Class A shares, the current maximum initial sales charge of 5.75%; for Class B shares, the contingent deferred sales charge (“CDSC”) of 5% (1-year) and 2% (5-year); and for Class C shares, the contingent deferred sales charge (“CDSC”) of 1% for the 1-year period. There is no sales charge for Class Y shares. Because Class B shares convert to Class A shares 72 months after purchase, 10-year returns for Class B shares reflect Class A performance for the period after conversion. See Fund prospectuses and summary prospectuses for more information on share classes and sales charges.
The Fund’s performance is compared to the performance of the S&P 500 Index and the Bloomberg Barclays U.S. Aggregate Bond Index. The S&P 500 Index is a capitalization-weighted index of 500 stocks intended to be a representative sample of leading companies in leading industries within the U.S. economy. The Bloomberg Barclays U.S. Aggregate Bond Index is an index of U.S.-dollar-denominated, investment-grade U.S. corporate government and mortgage-backed securities. The indices are unmanaged and cannot be purchased directly by investors. While index comparisons may be useful to provide a benchmark for the Fund’s performance, it must be noted that the Fund’s investments are not limited to the investments comprising the indices. Index performance includes reinvestment of income, but does not reflect transaction costs, fees, expenses or taxes. Index performance is shown for illustrative purposes only as a benchmark for the Fund’s performance, and does not predict or depict
8 OPPENHEIMER PORTFOLIO SERIES MODERATE INVESTOR FUND
performance of the Fund. The Fund’s performance reflects the effects of the Fund’s business and operating expenses.
The Fund’s investment strategy and focus can change over time. The mention of specific fund holdings does not constitute a recommendation by OppenheimerFunds, Inc. or its affiliates.
Before investing in any of the Oppenheimer funds, investors should carefully consider a fund’s investment objectives, risks, charges and expenses. Fund prospectuses and summary prospectuses contain this and other information about the funds, and may be obtained by asking your financial advisor, visiting oppenheimerfunds.com, or calling 1.800.CALL OPP (225.5677). Read prospectuses and summary prospectuses carefully before investing.
Shares of Oppenheimer funds are not deposits or obligations of any bank, are not guaranteed by any bank, are not insured by the FDIC or any other agency, and involve investment risks, including the possible loss of the principal amount invested.
9 OPPENHEIMER PORTFOLIO SERIES MODERATE INVESTOR FUND
Fund Expenses
Fund Expenses. As a shareholder of the Fund, you incur two types of costs: (1) transaction costs, which may include sales charges (loads) on purchase payments and/or contingent deferred sales charges on redemptions; and (2) ongoing costs, including management fees; distribution and service fees; and other Fund expenses. These examples are intended to help you understand your ongoing costs (in dollars) of investing in the Fund and to compare these costs with the ongoing costs of investing in other mutual funds.
The examples are based on an investment of $1,000.00 invested at the beginning of the period and held for the entire 6-month period ended January 31, 2017.
Actual Expenses. The first section of the table provides information about actual account values and actual expenses. You may use the information in this section for the class of shares you hold, together with the amount you invested, to estimate the expense that you paid over the period. Simply divide your account value by $1,000.00 (for example, an $8,600.00 account value divided by $1,000.00 = 8.60), then multiply the result by the number in the first section under the heading entitled “Expenses Paid During 6 Months Ended January 31, 2017” to estimate the expenses you paid on your account during this period.
Hypothetical Example for Comparison Purposes. The second section of the table provides information about hypothetical account values and hypothetical expenses based on the Fund’s actual expense ratio for each class of shares, and an assumed rate of return of 5% per year for each class before expenses, which is not the Fund’s actual return. The hypothetical account values and expenses may not be used to estimate the actual ending account balance or expenses you paid for the period. You may use this information to compare the ongoing costs of investing in the Fund and other funds. To do so, compare this 5% hypothetical example for the class of shares you hold with the 5% hypothetical examples that appear in the shareholder reports of the other funds.
Please note that the expenses shown in the table are meant to highlight your ongoing costs only and do not reflect any transactional costs, such as front-end or contingent deferred sales charges (loads). Therefore, the “hypothetical” section of the table is useful in comparing ongoing costs only, and will not help you determine the relative total costs of owning different funds. In addition, if these transactional costs were included, your costs would have been higher.
10 OPPENHEIMER PORTFOLIO SERIES MODERATE INVESTOR FUND
| | | | | | | | | | | | | | | | |
| | | Beginning | | | Ending | | | Expenses | | | | |
| | | Account | | | Account | | | Paid During | | | | |
| | | Value | | | Value | | | 6 Months Ended | | | | |
| Actual | | August 1, 2016 | | | January 31, 2017 | | | January 31, 2017 | | | | |
| |
Class A | | $ | 1,000.00 | | | $ | 1,019.90 | | | $ | 2.24 | | | | | |
| |
Class B | | | 1,000.00 | | | | 1,016.00 | | | | 6.10 | | | | | |
| |
Class C | | | 1,000.00 | | | | 1,016.40 | | | | 6.05 | | | | | |
| |
Class R | | | 1,000.00 | | | | 1,018.50 | | | | 3.51 | | | | | |
| |
Class Y | | | 1,000.00 | | | | 1,021.40 | | | | 0.97 | | | | | |
| | | | |
| Hypothetical | | | | | | | | | | | | |
(5% return before expenses) | | | | | | | | | | | | | | | | |
| |
Class A | | | 1,000.00 | | | | 1,022.92 | | | | 2.24 | | | | | |
| |
Class B | | | 1,000.00 | | | | 1,019.10 | | | | 6.11 | | | | | |
| |
Class C | | | 1,000.00 | | | | 1,019.15 | | | | 6.06 | | | | | |
| |
Class R | | | 1,000.00 | | | | 1,021.67 | | | | 3.51 | | | | | |
| |
Class Y | | | 1,000.00 | | | | 1,024.18 | | | | 0.97 | | | | | |
Expenses are equal to the Fund’s annualized expense ratio for that class, multiplied by the average account value over the period, multiplied by 184/366 (to reflect the one-half year period). Those annualized expense ratios, excluding indirect expenses from affiliated funds, based on the 6-month period ended January 31, 2017 are as follows:
| | | | | | | | |
| Class | | | Expense Ratios | | | | | |
| |
Class A | | | 0.44 | % | | | | |
| |
Class B | | | 1.20 | | | | | |
| |
Class C | | | 1.19 | | | | | |
| |
Class R | | | 0.69 | | | | | |
| |
Class Y | | | 0.19 | | | | | |
The expense ratios reflect voluntary and/or contractual waivers and/or reimbursements of expenses by the Fund’s Manager. Some of these undertakings may be modified or terminated at any time, as indicated in the Fund’s prospectus. The “Financial Highlights” tables in the Fund’s financial statements, included in this report, also show the gross expense ratios, without such waivers or reimbursements and reduction to custodian expenses, if applicable.
11 OPPENHEIMER PORTFOLIO SERIES MODERATE INVESTOR FUND
STATEMENT OF INVESTMENTS January 31, 2017
| | | | | | | | |
| | | Shares | | | Value | |
| |
| Investment Companies—99.9%1 | | | | | | | | |
| Alternative Funds—9.8% | | | | | | | | |
| Oppenheimer Fundamental Alternatives Fund, Cl. I | | | 619,685 | | | $ | 16,979,380 | |
| |
| Oppenheimer Global Multi Strategies Fund, Cl. I | | | 1,453,990 | | | | 33,601,714 | |
| |
| Oppenheimer Gold & Special Minerals Fund, Cl. I | | | 770,653 | | | | 13,170,461 | |
| |
| Oppenheimer Master Inflation Protected Securities Fund, LLC | | | 5,576,142 | | | | 66,631,938 | |
| |
| Oppenheimer Real Estate Fund, Cl. I | | | 979,943 | | | | 24,488,785 | |
| | | | | | | | |
| | | | | | | 154,872,278 | |
| |
| Domestic Equity Funds—44.1% | | | | | | | | |
| Oppenheimer Capital Appreciation Fund, Cl. I | | | 4,950,190 | | | | 280,329,248 | |
| |
| Oppenheimer Main Street Mid Cap Fund, Cl. I | | | 1,841,968 | | | | 54,338,068 | |
| |
| Oppenheimer Main Street Small Cap Fund, Cl. I | | | 3,572,082 | | | | 51,009,330 | |
| |
| Oppenheimer Value Fund, Cl. I | | | 8,747,923 | | | | 308,889,176 | |
| | | | | | | | |
| | | | | | | 694,565,822 | |
| |
| Domestic Fixed Income Funds—24.7% | | | | | | | | |
| Oppenheimer Core Bond Fund, Cl. I | | | 34,989,328 | | | | 236,527,854 | |
| |
| Oppenheimer Limited-Term Government Fund, Cl. I | | | 23,449,648 | | | | 103,647,445 | |
| |
| Oppenheimer Master Loan Fund, LLC | | | 2,962,152 | | | | 48,026,172 | |
| | | | | | | | |
| | | | | | | 388,201,471 | |
| |
| Foreign Equity Funds—14.8% | | | | | | | | |
| Oppenheimer Developing Markets Fund, Cl. I | | | 1,034,389 | | | | 34,703,739 | |
| |
| Oppenheimer International Equity Fund, Cl. I | | | 4,557,278 | | | | 80,299,239 | |
| |
| Oppenheimer International Growth Fund, Cl. I | | | 2,535,010 | | | | 90,068,918 | |
| |
| Oppenheimer International Small-Mid Company Fund, Cl. I | | | 731,208 | | | | 28,019,883 | |
| | | | | | | | |
| | | | | | | 233,091,779 | |
| |
| Foreign Fixed Income Fund—6.3% | | | | | | | | |
| Oppenheimer International Bond Fund, Cl. I | | | 17,448,407 | | | | 98,757,985 | |
| |
| Money Market Fund—0.2% | | | | | | | | |
| Oppenheimer Institutional Government Money Market Fund, Cl. E, 0.49%2 | | | 2,401,483 | | | | 2,401,483 | |
| |
| Total Investments, at Value (Cost $1,359,765,622) | | | 99.9% | | | | 1,571,890,818 | |
| |
| Net Other Assets (Liabilities) | | | 0.1 | | | | 995,332 | |
| | | | | | | | |
| Net Assets | | | 100.0% | | | $ | 1,572,886,150 | |
| | | | | | | | |
Footnotes to Statement of Investments
1. Is or was an affiliate, as defined in the Investment Company Act of 1940, as amended, at or during the reporting period, by virtue of the Fund owning at least 5% of the voting securities of the issuer or as a result of the Fund and the issuer having the same investment adviser. Transactions during the reporting period in which the issuer was an affiliate are as follows:
| | | | | | | | | | | | | | | | |
| | | Shares | | | | | | | | | | |
| | | January 29, | | | Gross | | | Gross | | | Shares | |
| | | 2016a | | | Additions | | | Reductions | | | January 31, 2017 | |
| |
| Oppenheimer Capital Appreciation Fund, Cl. I | | | 4,955,269 | | | | 345,651 | | | | 350,730 | | | | 4,950,190 | |
| Oppenheimer Commodity Strategy Total Return Fund, Cl. I | | | 5,227,281 | | | | 122,340 | | | | 5,349,621b | | | | — | |
| Oppenheimer Core Bond Fund, Cl. I | | | 35,703,796 | | | | 1,990,880 | | | | 2,705,348 | | | | 34,989,328 | |
| Oppenheimer Developing Markets Fund, Cl. I | | | 1,090,546 | | | | 46,905 | | | | 103,062 | | | | 1,034,389 | |
| Oppenheimer Fundamental Alternatives Fund, Cl. I | | | — | | | | 657,100 | | | | 37,415 | | | | 619,685 | |
12 OPPENHEIMER PORTFOLIO SERIES MODERATE INVESTOR FUND
Footnotes to Statement of Investments (Continued)
| | | | | | | | | | | | | | | | |
| | | Shares | | | | | | | | | | |
| | | January 29, | | | Gross | | | Gross | | | Shares | |
| | | 2016a | | | Additions | | | Reductions | | | January 31, 2017 | |
| |
| Oppenheimer Global Multi Strategies Fund, Cl. I | | | 1,402,049 | | | | 165,801 | | | | 113,860 | | | | 1,453,990 | |
| Oppenheimer Gold & Special Minerals Fund, Cl. I | | | 754,471 | | | | 80,073 | | | | 63,891 | | | | 770,653 | |
| Oppenheimer Institutional Government Money Market Fund, Cl. Ec | | | 11,159,310 | | | | 9,711,808 | | | | 18,469,635 | | | | 2,401,483 | |
| Oppenheimer International Bond Fund, Cl. I | | | 17,474,480 | | | | 1,396,216 | | | | 1,422,289 | | | | 17,448,407 | |
| Oppenheimer International Equity Fund, Cl. Id | | | 4,692,875 | | | | 262,883 | | | | 398,480 | | | | 4,557,278 | |
| Oppenheimer International Growth Fund, Cl. I | | | 2,638,011 | | | | 125,483 | | | | 228,484 | | | | 2,535,010 | |
| Oppenheimer International Small- Mid Company Fund, Cl. I | | | 760,812 | | | | 25,308 | | | | 54,912 | | | | 731,208 | |
| Oppenheimer Limited-Term Government Fund, Cl. I | | | 24,207,643 | | | | 1,176,813 | | | | 1,934,808 | | | | 23,449,648 | |
| Oppenheimer Main Street Mid Cap Fund, Cl. I | | | 1,866,129 | | | | 108,392 | | | | 132,553 | | | | 1,841,968 | |
| Oppenheimer Main Street Small Cap Fund, Cl. I | | | 3,728,309 | | | | 130,399 | | | | 286,626 | | | | 3,572,082 | |
| Oppenheimer Master Inflation Protected Securities Fund, LLC | | | 5,861,790 | | | | 171,609 | | | | 457,257 | | | | 5,576,142 | |
| Oppenheimer Master Loan Fund, LLC | | | 3,110,472 | | | | 90,496 | | | | 238,816 | | | | 2,962,152 | |
| Oppenheimer Real Estate Fund, Cl. I | | | 897,980 | | | | 139,415 | | | | 57,452 | | | | 979,943 | |
| Oppenheimer Value Fund, Cl. I | | | 8,989,837 | | | | 436,637 | | | | 678,551 | | | | 8,747,923 | |
| | | | |
| | | | | | | | | | | | Realized Gain | |
| | | | | | Value | | | Income | | | (Loss) | |
| |
| Oppenheimer Capital Appreciation Fund, Cl. Ie | | | | | | $ | 280,329,248 | | | $ | 1,281,333 | | | $ | 6,320,010 | |
| Oppenheimer Commodity Strategy Total Return Fund, Cl. I | | | | | | | — | | | | 133,668 | | | | (6,870,683) | |
| Oppenheimer Core Bond Fund, Cl. I | | | | | | | 236,527,854 | | | | 6,731,581 | | | | 3,130,894 | |
| Oppenheimer Developing Markets Fund, Cl. I | | | | | | | 34,703,739 | | | | 237,502 | | | | 455,951 | |
| Oppenheimer Fundamental Alternatives Fund, Cl. I | | | | | | | 16,979,380 | | | | 122,916 | | | | 6,104 | |
| Oppenheimer Global Multi Strategies Fund, Cl. I | | | | | | | 33,601,714 | | | | 2,842,881 | | | | 21,259 | |
| Oppenheimer Gold & Special Minerals Fund, Cl. I | | | | | | | 13,170,461 | | | | 813,210 | | | | 60,578 | |
| Oppenheimer Institutional Government Money Market Fund, Cl. Ec | | | | | | | 2,401,483 | | | | 22,967 | | | | — | |
| Oppenheimer International Bond Fund, Cl. I | | | | | | | 98,757,985 | | | | 2,509,692 | | | | 347,769 | |
| Oppenheimer International Equity Fund, Cl. Id | | | | | | | 80,299,239 | | | | 1,911,972 | | | | 1,928,323 | |
| Oppenheimer International Growth Fund, Cl. I | | | | | | | 90,068,918 | | | | 1,352,210 | | | | 3,075,755 | |
| Oppenheimer International Small-Mid Company Fund, Cl. I | | | | | | | 28,019,883 | | | | 164,315 | | | | 1,058,727 | |
| Oppenheimer Limited-Term Government Fund, Cl. I | | | | | | | 103,647,445 | | | | 2,028,949 | | | | 111,793 | |
| Oppenheimer Main Street Mid Cap Fund, Cl. If | | | | | | | 54,338,068 | | | | 627,331 | | | | 1,214,542 | |
| Oppenheimer Main Street Small Cap Fund, Cl. I | | | | | | | 51,009,330 | | | | 291,344 | | | | 257,290 | |
| Oppenheimer Master Inflation Protected Securities Fund, LLC | | | | | | | 66,631,938 | | | | 1,341,425 | h | | | 234,859 | h |
| Oppenheimer Master Loan Fund, LLC | | | | | | | 48,026,172 | | | | 2,904,791 | i | | | (828,371)i | |
13 OPPENHEIMER PORTFOLIO SERIES MODERATE INVESTOR FUND
STATEMENT OF INVESTMENTS Continued
Footnotes to Statement of Investments (Continued)
| | | | | | | | | | | | |
| | | | | | | | | Realized Gain | |
| | | Value | | | Income | | | (Loss) | |
| |
| Oppenheimer Real Estate Fund, Cl. Ig | | $ | 24,488,785 | | | $ | 644,344 | | | $ | 1,022,629 | |
| Oppenheimer Value Fund, Cl. I | | | 308,889,176 | | | | 5,896,561 | | | | 9,907,511 | |
| | | | | | | | | | | | |
| Total | | $ | 1,571,890,818 | | | $ | 31,858,992 | | | $ | 21,454,940 | |
| | | | | | | | | | | | |
a. Represents the last business day of the Fund’s reporting period.
b. Oppenheimer Commodity Strategy Total Return Fund liquidated effective July 15, 2016.
c. Prior to September 28, 2016, this fund was named Oppenheimer Institutional Money Market Fund.
d. Prior to December 28, 2016, this fund was named Oppenheimer International Value Fund.
e. The fund distributed realized gains of $10,149,600.
f. The fund distributed realized gains of $1,027,720.
g. The fund distributed realized gains of $2,354,042.
h. Represents the amount allocated to the Fund from Oppenheimer Master Inflation Protected Securities Fund, LLC.
i. Represents the amount allocated to the Fund from Oppenheimer Master Loan Fund, LLC.
2. Rate shown is the 7-day yield at period end.
See accompanying Notes to Financial Statements.
14 OPPENHEIMER PORTFOLIO SERIES MODERATE INVESTOR FUND
STATEMENT OF ASSETS AND LIABILITIES January 31, 2017
| | | | |
| |
| Assets | | | | |
| Investments, at value—see accompanying statement of investments—affiliated companies (cost $1,359,765,622) | | $ | 1,571,890,818 | |
| |
| Cash | | | 2,218,171 | |
| |
| Receivables and other assets: | | | | |
| Shares of beneficial interest sold | | | 1,292,391 | |
| Dividends | | | 1,168,386 | |
| Investments sold | | | 300,183 | |
| Other | | | 70,467 | |
| | | | |
| Total assets | | | 1,576,940,416 | |
|
| |
| Liabilities | | | | |
| Payables and other liabilities: | | | | |
| Shares of beneficial interest redeemed | | | 2,430,984 | |
| Investments purchased | | | 1,167,394 | |
| Distribution and service plan fees | | | 330,413 | |
| Trustees’ compensation | | | 85,802 | |
| Shareholder communications | | | 9,054 | |
| Other | | | 30,619 | |
| | | | |
| Total liabilities | | | 4,054,266 | |
| |
| Net Assets | | $ | 1,572,886,150 | |
| | | | |
|
| |
| Composition of Net Assets | | | | |
| Par value of shares of beneficial interest | | $ | 142,928 | |
| |
| Additional paid-in capital | | | 1,451,181,606 | |
| |
| Accumulated net investment income | | | 11,175,858 | |
| |
| Accumulated net realized loss on investments | | | (101,739,438) | |
| |
| Net unrealized appreciation on investments | | | 212,125,196 | |
| | | | |
| Net Assets | | $ | 1,572,886,150 | |
| | | | |
15 OPPENHEIMER PORTFOLIO SERIES MODERATE INVESTOR FUND
STATEMENT OF ASSETS AND LIABILITIES Continued
| | | | |
| |
| Net Asset Value Per Share | | | | |
| Class A Shares: | | | | |
| |
| Net asset value and redemption price per share (based on net assets of $1,050,229,987 and 94,937,835 shares of beneficial interest outstanding) | | $ | 11.06 | |
| |
| Maximum offering price per share (net asset value plus sales charge of 5.75% of offering price) | | $ | 11.73 | |
| |
| |
| Class B Shares: | | | | |
| |
| Net asset value, redemption price (excludes applicable contingent deferred sales charge) and offering price per share (based on net assets of $23,489,033 and 2,136,556 shares of beneficial interest outstanding) | | $ | 10.99 | |
| |
| |
| Class C Shares: | | | | |
| |
| Net asset value, redemption price (excludes applicable contingent deferred sales charge) and offering price per share (based on net assets of $383,847,852 and 35,378,974 shares of beneficial interest outstanding) | | $ | 10.85 | |
| |
| |
| Class R Shares: | | | | |
| |
| Net asset value, redemption price (excludes applicable contingent deferred sales charge) and offering price per share (based on net assets of $105,975,665 and 9,634,385 shares of beneficial interest outstanding) | | $ | 11.00 | |
| |
| |
| Class Y Shares: | | | | |
| |
| Net asset value, redemption price and offering price per share (based on net assets of $9,343,613 and 840,005 shares of beneficial interest outstanding) | | $ | 11.12 | |
See accompanying Notes to Financial Statements.
16 OPPENHEIMER PORTFOLIO SERIES MODERATE INVESTOR FUND
STATEMENT OF OPERATIONS For the Year Ended January 31, 2017
| | | | |
| |
| Allocation of Income and Expenses from Master Funds1 | | | | |
Net investment income allocated from Oppenheimer Master Inflation Protected Securities Fund, LLC: Interest | | $ | 1,337,939 | |
| Dividends | | | 3,486 | |
| Net expenses | | | (320,347) | |
| | | | |
| Net investment income allocated from Oppenheimer Master Inflation Protected Securities Fund, LLC | | | 1,021,078 | |
| |
Net investment income allocated from Oppenheimer Master Loan Fund, LLC: Interest | | | 2,840,717 | |
| Dividends | | | 64,074 | |
| Net expenses | | | (166,228) | |
| | | | |
| Net investment income allocated from Oppenheimer Master Loan Fund, LLC | | | 2,738,563 | |
| | | | |
| Total allocation of net investment income from master funds | | | 3,759,641 | |
|
| |
| Investment Income | | | | |
| Dividends from affiliated companies | | | 27,612,776 | |
| |
| Interest | | | 7,661 | |
| | | | |
| Total investment income | | | 27,620,437 | |
|
| |
| Expenses | | | | |
| |
| Distribution and service plan fees: | | | | |
| Class A | | | 2,482,250 | |
| Class B | | | 322,633 | |
| Class C | | | 3,836,029 | |
| Class R | | | 500,857 | |
| |
| Transfer and shareholder servicing agent fees: | | | | |
| Class A | | | 2,241,610 | |
| Class B | | | 71,038 | |
| Class C | | | 846,206 | |
| Class R | | | 220,893 | |
| Class Y | | | 17,330 | |
| |
| Shareholder communications: | | | | |
| Class A | | | 24,937 | |
| Class B | | | 1,542 | |
| Class C | | | 7,916 | |
| Class R | | | 1,269 | |
| Class Y | | | 126 | |
| |
| Trustees’ compensation | | | 26,375 | |
| |
| Custodian fees and expenses | | | 21,217 | |
| |
| Borrowing fees | | | 12,372 | |
| |
| Other | | | 77,039 | |
| | | | |
| Total expenses | | | 10,711,639 | |
| Less waivers and reimbursements of expenses | | | (1,080,888) | |
| | | | |
| Net expenses | | | 9,630,751 | |
|
| |
| Net Investment Income | | | 21,749,327 | |
17 OPPENHEIMER PORTFOLIO SERIES MODERATE INVESTOR FUND
STATEMENT OF OPERATIONS Continued
| | | | |
| |
| Realized and Unrealized Gain (Loss) | | | | |
| Net realized gain on: | | | | |
| Investment transactions in affiliated companies | | $ | 22,048,452 | |
| Distributions received from affiliate companies | | | 13,531,362 | |
| |
| Net realized gain (loss) allocated from: | | | | |
| Oppenheimer Master Inflation Protected Securities Fund, LLC | | | 234,859 | |
| Oppenheimer Master Loan Fund, LLC | | | (828,371) | |
| | | | |
| Net realized gain | | | 34,986,302 | |
| |
| Net change in unrealized appreciation/depreciation on investments | | | 93,640,512 | |
| |
| Net change in unrealized appreciation/depreciation allocated from: | | | | |
| Oppenheimer Master Inflation Protected Securities Fund, LLC | | | 1,142,276 | |
| Oppenheimer Master Loan Fund, LLC | | | 4,492,124 | |
| | | | |
| Net change in unrealized appreciation/depreciation | | | 99,274,912 | |
|
| |
| Net Increase in Net Assets Resulting from Operations | | $ | 156,010,541 | |
| | | | |
1. The Fund invests in certain affiliated mutual funds that expect to be treated as partnerships for tax purposes. See Note 4 of the accompanying Notes.
See accompanying Notes to Financial Statements.
18 OPPENHEIMER PORTFOLIO SERIES MODERATE INVESTOR FUND
STATEMENTS OF CHANGES IN NET ASSETS
| | | | | | | | |
| | | Year Ended | | | Year Ended | |
| | | January 31, 2017 | | | January 29, 20161 | |
| |
| Operations | | | | | | | | |
| Net investment income | | $ | 21,749,327 | | | $ | 14,903,227 | |
| |
| Net realized gain | | | 34,986,302 | | | | 64,142,250 | |
| |
| Net change in unrealized appreciation/depreciation | | | 99,274,912 | | | | (147,688,724) | |
| | | | |
| Net increase (decrease) in net assets resulting from operations | | | 156,010,541 | | | | (68,643,247) | |
|
| |
| Dividends and/or Distributions to Shareholders | | | | | | | | |
| Dividends from net investment income: | | | | | | | | |
| Class A | | | (16,442,640) | | | | (7,633,842) | |
| Class B | | | (98,635) | | | | — | |
| Class C | | | (3,351,722) | | | | (61,876) | |
| Class R | | | (1,411,075) | | | | (462,146) | |
| Class Y | | | (157,749) | | | | (99,440) | |
| | | | |
| | | (21,461,821) | | | | (8,257,304) | |
|
| |
| Beneficial Interest Transactions | | | | | | | | |
| Net increase (decrease) in net assets resulting from beneficial interest transactions: | | | | | | | | |
| Class A | | | (3,929,948) | | | | 26,142,758 | |
| Class B | | | (22,375,205) | | | | (26,355,745) | |
| Class C | | | (20,465,196) | | | | 1,752,678 | |
| Class R | | | 4,836,032 | | | | (9,067,016) | |
| Class Y | | | (702,551) | | | | 297,187 | |
| | | | |
| | | (42,636,868) | | | | (7,230,138) | |
|
| |
| Net Assets | | | | | | | | |
| Total increase (decrease) | | | 91,911,852 | | | | (84,130,689) | |
| |
| Beginning of period | | | 1,480,974,298 | | | | 1,565,104,987 | |
| | | | |
| End of period (including accumulated net investment income of $11,175,858 and $10,131,465, respectively) | | $ | 1,572,886,150 | | | $ | 1,480,974,298 | |
| | | | |
1. January 29, 2016 represents the last business day of the Fund’s reporting period.
See accompanying Notes to Financial Statements.
19 OPPENHEIMER PORTFOLIO SERIES MODERATE INVESTOR FUND
FINANCIAL HIGHLIGHTS
| | | | | | | | | | | | | | | | | | | | |
| Class A | | Year Ended
January 31,
2017 | | | Year Ended
January 29,
20161 | | | Year Ended
January 30,
20151 | | | Year Ended
January 31,
2014 | | | Year Ended
January 31,
2013 | |
| |
| Per Share Operating Data | | | | | | | | | | | | | | | | | | | | |
| Net asset value, beginning of period | | | $10.13 | | | | $10.66 | | | | $10.23 | | | | $9.42 | | | | $8.67 | |
| |
| Income (loss) from investment operations: | | | | | | | | | | | | | | | | | | | | |
| Net investment income2 | | | 0.18 | | | | 0.12 | | | | 0.14 | | | | 0.15 | | | | 0.18 | |
| Net realized and unrealized gain (loss) | | | 0.93 | | | | (0.57) | | | | 0.54 | | | | 0.80 | | | | 0.73 | |
| | | | |
| Total from investment operations | | | 1.11 | | | | (0.45) | | | | 0.68 | | | | 0.95 | | | | 0.91 | |
| |
| Dividends and/or distributions to shareholders: | | | | | | | | | | | | | | | | | | | | |
| Dividends from net investment income | | | (0.18) | | | | (0.08) | | | | (0.25) | | | | (0.14) | | | | (0.16) | |
| |
| Net asset value, end of period | | | $11.06 | | | | $10.13 | | | | $10.66 | | | | $10.23 | | | | $9.42 | |
| | | | |
|
| |
| Total Return, at Net Asset Value3 | | | 10.95% | | | | (4.24)% | | | | 6.67% | | | | 10.00% | | | | 10.51% | |
|
| |
| Ratios/Supplemental Data | | | | | | | | | | | | | | | | | | | | |
| Net assets, end of period (in thousands) | | | $1,050,230 | | | | $965,539 | | | | $989,811 | | | | $888,533 | | | | $763,081 | |
| |
| Average net assets (in thousands) | | | $1,019,024 | | | | $1,016,035 | | | | $962,358 | | | | $830,952 | | | | $606,831 | |
| |
| Ratios to average net assets:4,5 | | | | | | | | | | | | | | | | | | | | |
| Net investment income | | | 1.63% | | | | 1.15% | | | | 1.34% | | | | 1.56% | | | | 2.00% | |
| Expenses excluding specific expenses listed below | | | 0.51% | | | | 0.50% | | | | 0.50% | | | | 0.49% | | | | 0.45% | |
| Interest and fees from borrowings | | | 0.00%6 | | | | 0.00%6 | | | | 0.00% | | | | 0.00% | | | | 0.00% | |
| | | | |
| Total expenses7 | | | 0.51% | | | | 0.50% | | | | 0.50% | | | | 0.49% | | | | 0.45% | |
| Expenses after payments, waivers and/or reimbursements and reduction to custodian expenses | | | 0.44% | | | | 0.43% | | | | 0.43% | | | | 0.41% | | | | 0.39% | |
| |
| Portfolio turnover rate | | | 7% | | | | 5% | | | | 14% | | | | 6% | | | | 23% | |
1. Represents the last business day of the Fund’s reporting period.
2. Per share amounts calculated based on the average shares outstanding during the period.
3. Assumes an initial investment on the business day before the first day of the fiscal period, with all dividends and distributions reinvested in additional shares on the reinvestment date, and redemption at the net asset value calculated on the last business day of the fiscal period. Sales charges are not reflected in the total returns. Total returns are not annualized for periods less than one full year. Returns do not reflect the deduction of taxes that a shareholder would pay on fund distributions or the redemption of fund shares.
4. Annualized for periods less than one full year.
5. Includes the Fund’s share of the allocated expenses and/or net investment income from the master funds.
6. Less than 0.005%.
7. Total expenses including indirect expenses from affiliated fund fees and expenses were as follows:
| | | | |
Year Ended January 31, 2017 | | | 1.10 | % |
Year Ended January 29, 2016 | | | 1.07 | % |
Year Ended January 30, 2015 | | | 1.08 | % |
Year Ended January 31, 2014 | | | 1.11 | % |
Year Ended January 31, 2013 | | | 1.09 | % |
See accompanying Notes to Financial Statements.
20 OPPENHEIMER PORTFOLIO SERIES MODERATE INVESTOR FUND
| | | | | | | | | | | | | | | | | | | | |
| Class B | | Year Ended
January 31,
2017 | | | Year Ended
January 29,
20161 | | | Year Ended
January 30,
20151 | | | Year Ended
January 31,
2014 | | | Year Ended
January 31,
2013 | |
| |
| Per Share Operating Data | | | | | | | | | | | | | | | | | | | | |
| Net asset value, beginning of period | | | $10.03 | | | | $10.54 | | | | $10.10 | | | | $9.30 | | | | $8.56 | |
| |
| Income (loss) from investment operations: | | | | | | | | | | | | | | | | | | | | |
| Net investment income2 | | | 0.08 | | | | 0.08 | | | | 0.04 | | | | 0.06 | | | | 0.09 | |
| Net realized and unrealized gain (loss) | | | 0.92 | | | | (0.59) | | | | 0.55 | | | | 0.78 | | | | 0.73 | |
| | | | |
| Total from investment operations | | | 1.00 | | | | (0.51) | | | | 0.59 | | | | 0.84 | | | | 0.82 | |
| |
| Dividends and/or distributions to shareholders: | | | | | | | | | | | | | | | | | | | | |
| Dividends from net investment income | | | (0.04) | | | | 0.00 | | | | (0.15) | | | | (0.04) | | | | (0.08) | |
| |
| Net asset value, end of period | | | $10.99 | | | | $10.03 | | | | $10.54 | | | | $10.10 | | | | $9.30 | |
| | | | |
| |
| Total Return, at Net Asset Value3 | | | 10.01% | | | | (4.93)% | | | | 5.94% | | | | 9.07% | | | | 9.59% | |
| | | | | | | | | | | | | | | | | | | | |
| |
Ratios/Supplemental Data | | | | | | | | | | | | | | | | | | | | |
| Net assets, end of period (in thousands) | | | $23,489 | | | | $42,689 | | | | $70,936 | | | | $95,620 | | | | $112,666 | |
| |
| Average net assets (in thousands) | | | $32,210 | | | | $56,585 | | | | $84,071 | | | | $102,915 | | | | $106,286 | |
| |
| Ratios to average net assets:4,5 | | | | | | | | | | | | | | | | | | | | |
| Net investment income | | | 0.78% | | | | 0.77% | | | | 0.37% | | | | 0.62% | | | | 1.07% | |
| Expenses excluding specific expenses listed below | | | 1.27% | | | | 1.26% | | | | 1.25% | | | | 1.27% | | | | 1.29% | |
| Interest and fees from borrowings | | | 0.00%6 | | | | 0.00%6 | | | | 0.00% | | | | 0.00% | | | | 0.00% | |
| | | | |
| Total expenses7 | | | 1.27% | | | | 1.26% | | | | 1.25% | | | | 1.27% | | | | 1.29% | |
| Expenses after payments, waivers and/or reimbursements and reduction to custodian expenses | | | 1.20% | | | | 1.19% | | | | 1.18% | | | | 1.19% | | | | 1.23% | |
| |
| Portfolio turnover rate | | | 7% | | | | 5% | | | | 14% | | | | 6% | | | | 23% | |
1. Represents the last business day of the Fund’s reporting period.
2. Per share amounts calculated based on the average shares outstanding during the period.
3. Assumes an initial investment on the business day before the first day of the fiscal period, with all dividends and distributions reinvested in additional shares on the reinvestment date, and redemption at the net asset value calculated on the last business day of the fiscal period. Sales charges are not reflected in the total returns. Total returns are not annualized for periods less than one full year. Returns do not reflect the deduction of taxes that a shareholder would pay on fund distributions or the redemption of fund shares.
4. Annualized for periods less than one full year.
5. Includes the Fund’s share of the allocated expenses and/or net investment income from the master funds.
6. Less than 0.005%.
7. Total expenses including indirect expenses from affiliated fund fees and expenses were as follows:
| | | | |
Year Ended January 31, 2017 | | | 1.86 | % |
Year Ended January 29, 2016 | | | 1.83 | % |
Year Ended January 30, 2015 | | | 1.83 | % |
Year Ended January 31, 2014 | | | 1.89 | % |
Year Ended January 31, 2013 | | | 1.93 | % |
See accompanying Notes to Financial Statements.
21 OPPENHEIMER PORTFOLIO SERIES MODERATE INVESTOR FUND
FINANCIAL HIGHLIGHTS Continued
| | | | | | | | | | |
| Class C | | Year Ended
January 31,
2017 | | Year Ended
January 29,
20161 | | Year Ended
January 30,
20151 | | Year Ended
January 31,
2014 | | Year Ended
January 31,
2013 |
|
| Per Share Operating Data | | | | | | | | | | |
| Net asset value, beginning of period | | $9.94 | | $10.46 | | $10.04 | | $9.26 | | $8.54 |
|
| Income (loss) from investment operations: | | | | | | | | | | |
| Net investment income2 | | 0.09 | | 0.04 | | 0.06 | �� | 0.08 | | 0.11 |
| Net realized and unrealized gain (loss) | | 0.91 | | (0.56) | | 0.54 | | 0.76 | | 0.71 |
| | |
| Total from investment operations | | 1.00 | | (0.52) | | 0.60 | | 0.84 | | 0.82 |
|
| Dividends and/or distributions to shareholders: | | | | | | | | | | |
| Dividends from net investment income | | (0.09) | | (0.00)3 | | (0.18) | | (0.06) | | (0.10) |
|
| Net asset value, end of period | | $10.85 | | $9.94 | | $10.46 | | $10.04 | | $9.26 |
| | |
|
|
| Total Return, at Net Asset Value4 | | 10.12% | | (4.96)% | | 5.93% | | 9.11% | | 9.63% |
|
|
| Ratios/Supplemental Data | | | | | | | | | | |
| Net assets, end of period (in thousands) | | $383,848 | | $370,818 | | $388,409 | | $359,725 | | $313,572 |
|
| Average net assets (in thousands) | | $384,610 | | $393,916 | | $383,852 | | $336,609 | | $257,063 |
|
| Ratios to average net assets:5,6 | | | | | | | | | | |
| Net investment income | | 0.87% | | 0.42% | | 0.57% | | 0.79% | | 1.22% |
| Expenses excluding specific expenses listed below | | 1.26% | | 1.25% | | 1.25% | | 1.25% | | 1.21% |
| Interest and fees from borrowings | | 0.00%7 | | 0.00%7 | | 0.00% | | 0.00% | | 0.00% |
| | |
| Total expenses8 | | 1.26% | | 1.25% | | 1.25% | | 1.25% | | 1.21% |
| Expenses after payments, waivers and/or reimbursements and reduction to custodian expenses | | 1.19% | | 1.18% | | 1.18% | | 1.17% | | 1.15% |
|
| Portfolio turnover rate | | 7% | | 5% | | 14% | | 6% | | 23% |
1. Represents the last business day of the Fund’s reporting period.
2. Per share amounts calculated based on the average shares outstanding during the period.
3. Less than $0.005 per share.
4. Assumes an initial investment on the business day before the first day of the fiscal period, with all dividends and distributions reinvested in additional shares on the reinvestment date, and redemption at the net asset value calculated on the last business day of the fiscal period. Sales charges are not reflected in the total returns. Total returns are not annualized for periods less than one full year. Returns do not reflect the deduction of taxes that a shareholder would pay on fund distributions or the redemption of fund shares.
5. Annualized for periods less than one full year.
6. Includes the Fund’s share of the allocated expenses and/or net investment income from the master funds.
7. Less than 0.005%.
8. Total expenses including indirect expenses from affiliated fund fees and expenses were as follows:
| | | | |
Year Ended January 31, 2017 | | | 1.85 | % |
Year Ended January 29, 2016 | | | 1.82 | % |
Year Ended January 30, 2015 | | | 1.83 | % |
Year Ended January 31, 2014 | | | 1.87 | % |
Year Ended January 31, 2013 | | | 1.85 | % |
See accompanying Notes to Financial Statements.
22 OPPENHEIMER PORTFOLIO SERIES MODERATE INVESTOR FUND
| | | | | | | | | | | | | | | | | | | | |
| Class R | | Year Ended
January 31,
2017 | | | Year Ended
January 29,
20161 | | | Year Ended
January 30,
20151 | | | Year Ended
January 31,
2014 | | | Year Ended
January 31,
2013 | |
| |
| Per Share Operating Data | | | | | | | | | | | | | | | | | | | | |
| Net asset value, beginning of period | | | $10.08 | | | | $10.60 | | | | $10.17 | | | | $9.36 | | | | $8.62 | |
| |
| Income (loss) from investment operations: | | | | | | | | | | | | | | | | | | | | |
| Net investment income2 | | | 0.15 | | | | 0.10 | | | | 0.11 | | | | 0.12 | | | | 0.15 | |
| Net realized and unrealized gain (loss) | | | 0.92 | | | | (0.57) | | | | 0.54 | | | | 0.80 | | | | 0.72 | |
| | | | |
| Total from investment operations | | | 1.07 | | | | (0.47) | | | | 0.65 | | | | 0.92 | | | | 0.87 | |
| |
| Dividends and/or distributions to shareholders: | | | | | | | | | | | | | | | | | | | | |
| Dividends from net investment income | | | (0.15) | | | | (0.05) | | | | (0.22) | | | | (0.11) | | | | (0.13) | |
| |
| Net asset value, end of period | | | $11.00 | | | | $10.08 | | | | $10.60 | | | | $10.17 | | | | $9.36 | |
| | | | |
|
| |
| Total Return, at Net Asset Value3 | | | 10.64% | | | | (4.45)% | | | | 6.40% | | | | 9.76% | | | | 10.17% | |
|
| |
| Ratios/Supplemental Data | | | | | | | | | | | | | | | | | | | | |
| Net assets, end of period (in thousands) | | | $105,976 | | | | $92,429 | | | | $106,271 | | | | $110,232 | | | | $115,659 | |
| |
| Average net assets (in thousands) | | | $100,425 | | | | $103,861 | | | | $109,830 | | | | $111,927 | | | | $99,577 | |
| |
| Ratios to average net assets:4,5 | | | | | | | | | | | | | | | | | | | | |
| Net investment income | | | 1.38% | | | | 0.97% | | | | 1.02% | | | | 1.21% | | | | 1.71% | |
| Expenses excluding specific expenses listed below | | | 0.76% | | | | 0.76% | | | | 0.75% | | | | 0.74% | | | | 0.71% | |
| Interest and fees from borrowings | | | 0.00%6 | | | | 0.00%6 | | | | 0.00% | | | | 0.00% | | | | 0.00% | |
| | | | |
| Total expenses7 | | | 0.76% | | | | 0.76% | | | | 0.75% | | | | 0.74% | | | | 0.71% | |
| Expenses after payments, waivers and/or reimbursements and reduction to custodian expenses | | | 0.69% | | | | 0.69% | | | | 0.68% | | | | 0.66% | | | | 0.65% | |
| |
| Portfolio turnover rate | | | 7% | | | | 5% | | | | 14% | | | | 6% | | | | 23% | |
1. Represents the last business day of the Fund’s reporting period.
2. Per share amounts calculated based on the average shares outstanding during the period.
3. Assumes an initial investment on the business day before the first day of the fiscal period, with all dividends and distributions reinvested in additional shares on the reinvestment date, and redemption at the net asset value calculated on the last business day of the fiscal period. Sales charges are not reflected in the total returns. Total returns are not annualized for periods less than one full year. Returns do not reflect the deduction of taxes that a shareholder would pay on fund distributions or the redemption of fund shares.
4. Annualized for periods less than one full year.
5. Includes the Fund’s share of the allocated expenses and/or net investment income from the master funds.
6. Less than 0.005%.
7. Total expenses including indirect expenses from affiliated fund fees and expenses were as follows:
| | | | |
Year Ended January 31, 2017 | | | 1.35 | % |
Year Ended January 29, 2016 | | | 1.33 | % |
Year Ended January 30, 2015 | | | 1.33 | % |
Year Ended January 31, 2014 | | | 1.36 | % |
Year Ended January 31, 2013 | | | 1.35 | % |
See accompanying Notes to Financial Statements.
23 OPPENHEIMER PORTFOLIO SERIES MODERATE INVESTOR FUND
FINANCIAL HIGHLIGHTS Continued
| | | | | | | | | | | | | | | | | | | | |
| Class Y | | Year Ended
January 31,
2017 | | | Year Ended
January 29,
20161 | | | Year Ended
January 30,
20151 | | | Year Ended
January 31,
2014 | | | Year Ended
January 31,
2013 | |
| |
| Per Share Operating Data | | | | | | | | | | | | | | | | | | | | |
| Net asset value, beginning of period | | | $10.19 | | | | $10.72 | | | | $10.28 | | | | $9.47 | | | | $8.70 | |
| |
| Income (loss) from investment operations: | | | | | | | | | | | | | | | | | | | | |
| Net investment income2 | | | 0.21 | | | | 0.17 | | | | 0.15 | | | | 0.19 | | | | 0.18 | |
| Net realized and unrealized gain (loss) | | | 0.92 | | | | (0.59) | | | | 0.57 | | | | 0.79 | | | | 0.75 | |
| | | | |
| Total from investment operations | | | 1.13 | | | | (0.42) | | | | 0.72 | | | | 0.98 | | | | 0.93 | |
| |
| Dividends and/or distributions to shareholders: | | | | | | | | | | | | | | | | | | | | |
| Dividends from net investment income | | | (0.20) | | | | (0.11) | | | | (0.28) | | | | (0.17) | | | | (0.16) | |
| |
| Net asset value, end of period | | | $11.12 | | | | $10.19 | | | | $10.72 | | | | $10.28 | | | | $9.47 | |
| | | | |
|
| |
| Total Return, at Net Asset Value3 | | | 11.16% | | | | (3.97)% | | | | 6.95% | | | | 10.29% | | | | 10.72% | |
|
| |
| Ratios/Supplemental Data | | | | | | | | | | | | | | | | | | | | |
| Net assets, end of period (in thousands) | | | $9,343 | | | | $9,499 | | | | $9,678 | | | | $10,023 | | | | $8,530 | |
| |
| Average net assets (in thousands) | | | $7,850 | | | | $9,416 | | | | $10,303 | | | | $9,064 | | | | $8,449 | |
| |
| Ratios to average net assets:4,5 | | | | | | | | | | | | | | | | | | | | |
| Net investment income | | | 1.94% | | | | 1.61% | | | | 1.41% | | | | 1.93% | | | | 2.01% | |
| Expenses excluding specific expenses listed below | | | 0.26% | | | | 0.26% | | | | 0.25% | | | | 0.15% | | | | 0.31% | |
| Interest and fees from borrowings | | | 0.00%6 | | | | 0.00%6 | | | | 0.00% | | | | 0.00% | | | | 0.00% | |
| | | | |
| Total expenses7 | | | 0.26% | | | | 0.26% | | | | 0.25% | | | | 0.15% | | | | 0.31% | |
| Expenses after payments, waivers and/or reimbursements and reduction to custodian expenses | | | 0.19% | | | | 0.19% | | | | 0.19% | | | | 0.07% | | | | 0.24% | |
| |
| Portfolio turnover rate | | | 7% | | | | 5% | | | | 14% | | | | 6% | | | | 23% | |
1. Represents the last business day of the Fund’s reporting period.
2. Per share amounts calculated based on the average shares outstanding during the period.
3. Assumes an initial investment on the business day before the first day of the fiscal period, with all dividends and distributions reinvested in additional shares on the reinvestment date, and redemption at the net asset value calculated on the last business day of the fiscal period. Sales charges are not reflected in the total returns. Total returns are not annualized for periods less than one full year. Returns do not reflect the deduction of taxes that a shareholder would pay on fund distributions or the redemption of fund shares.
4. Annualized for periods less than one full year.
5. Includes the Fund’s share of the allocated expenses and/or net investment income from the master funds.
6. Less than 0.005%.
7. Total expenses including indirect expenses from affiliated fund fees and expenses were as follows:
| | | | |
Year Ended January 31, 2017 | | | 0.85 | % |
Year Ended January 29, 2016 | | | 0.83 | % |
Year Ended January 30, 2015 | | | 0.83 | % |
Year Ended January 31, 2014 | | | 0.77 | % |
Year Ended January 31, 2013 | | | 0.95 | % |
See accompanying Notes to Financial Statements.
24 OPPENHEIMER PORTFOLIO SERIES MODERATE INVESTOR FUND
NOTES TO FINANCIAL STATEMENTS January 31, 2017
1. Organization
Oppenheimer Portfolio Series (the “Trust”) is registered under the Investment Company Act of 1940 (“1940 Act”), as amended, as a diversified open-end management investment company. Moderate Investor Fund (the “Fund”) is a series of the Trust whose investment objective is to seek total return. The Fund normally invests in a diversified portfolio of Oppenheimer mutual funds (individually, an “Underlying Fund” and collectively, the “Underlying Funds”). The Fund’s investment adviser is OFI Global Asset Management, Inc. (“OFI Global” or the “Manager”), a wholly-owned subsidiary of OppenheimerFunds, Inc. (“OFI” or the “Sub-Adviser”). The Manager has entered into a sub-advisory agreement with OFI.
The Fund offers Class A, Class C, Class R and Class Y shares, and previously offered Class B shares for new purchase through June 29, 2012. Subsequent to that date, no new purchases of Class B shares are permitted, however reinvestment of dividend and/or capital gain distributions and exchanges of Class B shares into and from other Oppenheimer funds are allowed. As of July 1, 2014, Class N shares were renamed Class R shares. Class N shares subject to a CDSC on July 1, 2014, will continue to be subject to a CDSC after the shares are renamed. Purchases of Class R shares occurring on or after July 1, 2014, will not be subject to a CDSC upon redemption. Class A shares are sold at their offering price, which is normally net asset value plus a front-end sales charge. Class C and Class R shares are sold, and Class B shares were sold, without a front-end sales charge but may be subject to a contingent deferred sales charge (“CDSC”). Class R shares are sold only through retirement plans. Retirement plans that offer Class R shares may impose charges on those accounts. Class Y shares are sold to certain institutional investors or intermediaries without either a front-end sales charge or a CDSC, however, the intermediaries may impose charges on their accountholders who beneficially own Class Y shares. All classes of shares have identical rights and voting privileges with respect to the Fund in general and exclusive voting rights on matters that affect that class alone. Earnings, net assets and net asset value per share may differ due to each class having its own expenses, such as transfer and shareholder servicing agent fees and shareholder communications, directly attributable to that class. Class A, B, C and R shares have separate distribution and/or service plans under which they pay fees. Class Y shares do not pay such fees. Class B shares will automatically convert to Class A shares 72 months after the date of purchase.
The following is a summary of significant accounting policies followed in the Fund’s preparation of financial statements in accordance with accounting principles generally accepted in the United States (“U.S. GAAP”).
2. Significant Accounting Policies
Security Valuation. All investments in securities are recorded at their estimated fair value, as described in Note 3.
Allocation of Income, Expenses, Gains and Losses. Income, expenses (other than those attributable to a specific class), gains and losses are allocated on a daily basis to each class of shares based upon the relative proportion of net assets represented by such class. Operating
25 OPPENHEIMER PORTFOLIO SERIES MODERATE INVESTOR FUND
NOTES TO FINANCIAL STATEMENTS Continued
2. Significant Accounting Policies (Continued)
expenses directly attributable to a specific class are charged against the operations of that class.
Dividends and Distributions to Shareholders. Dividends and distributions to shareholders, which are determined in accordance with income tax regulations and may differ from U.S. GAAP, are recorded on the ex-dividend date. Income and capital gain distributions, if any, are declared and paid annually or at other times as deemed necessary by the Manager.
Investment Income. Dividend distributions received from the Underlying Funds are recorded on the ex-dividend date. Upon receipt of notification from an Underlying Fund, and subsequent to the ex-dividend date, some of the dividend income originally recorded by the Fund may be reclassified as a tax return of capital by reducing the cost basis of the Underlying Fund and/or increasing the realized gain on sales of investments in the Underlying Fund.
Custodian Fees. “Custodian fees and expenses” in the Statement of Operations may include interest expense incurred by the Fund on any cash overdrafts of its custodian account during the period. Such cash overdrafts may result from the effects of failed trades in portfolio securities and from cash outflows resulting from unanticipated shareholder redemption activity. The Fund pays interest to its custodian on such cash overdraft at a rate equal to the Prime Rate plus 0.35%. The “Reduction to custodian expenses” line item, if applicable, represents earnings on cash balances maintained by the Fund during the period. Such interest expense and other custodian fees may be paid with these earnings.
Security Transactions. Security transactions are recorded on the trade date. Realized gains and losses on securities sold are determined on the basis of identified cost.
Indemnifications. The Fund’s organizational documents provide current and former Trustees and officers with a limited indemnification against liabilities arising in connection with the performance of their duties to the Fund. In the normal course of business, the Fund may also enter into contracts that provide general indemnifications. The Fund’s maximum exposure under these arrangements is unknown as this would be dependent on future claims that may be made against the Fund. The risk of material loss from such claims is considered remote.
Federal Taxes. The Fund intends to comply with provisions of the Internal Revenue Code applicable to regulated investment companies and to distribute substantially all of its investment company taxable income, including any net realized gain on investments not offset by capital loss carryforwards, if any, to shareholders. Therefore, no federal income or excise tax provision is required. The Fund files income tax returns in U.S. federal and applicable state jurisdictions. The statute of limitations on the Fund’s tax return filings generally remains open for the three preceding fiscal reporting period ends. The Fund has analyzed its tax positions for the fiscal year ended January 31, 2017, including open tax years, and does not believe there are any uncertain tax positions requiring recognition in the Fund’s financial statements.
26 OPPENHEIMER PORTFOLIO SERIES MODERATE INVESTOR FUND
2. Significant Accounting Policies (Continued)
The tax components of capital shown in the following table represent distribution requirements the Fund must satisfy under the income tax regulations, losses the Fund may be able to offset against income and gains realized in future years and unrealized appreciation or depreciation of securities and other investments for federal income tax purposes.
| | | | | | | | | | | | |
Undistributed Net Investment Income | | Undistributed
Long-Term
Gain | | | Accumulated
Loss
Carryforward1,2,3,4 | | | Net Unrealized
Appreciation
Based on cost of
Securities and
Other Investments
for Federal Income
Tax Purposes | |
| |
| $10,234,947 | | | $— | | | | $51,989,654 | | | | $163,399,899 | |
1. At period end, the Fund had $51,978,406 of net capital loss carryforward available to offset future realized capital gains, if any, and thereby reduce future taxable gain distributions. Details of the capital loss carryforwards are included in the table below. Capital loss carryovers with no expiration, if any, must be utilized prior to those with expiration dates.
| | | | |
| Expiring | | | |
| 2019 | | $ | 51,978,406 | |
2. At period end, the Fund had $11,248 of post-October losses available to offset future realized capital gains, if any.
3. During the reporting period, the Fund utilized $22,628,115 of capital loss carryforward to offset capital gains realized in that fiscal year.
4. During the previous reporting period, the Fund utilized $54,059,965 of capital loss carryforward to offset capital gains realized in that fiscal year.
Net investment income (loss) and net realized gain (loss) may differ for financial statement and tax purposes. The character of dividends and distributions made during the fiscal year from net investment income or net realized gains are determined in accordance with federal income tax requirements, which may differ from the character of net investment income or net realized gains presented in those financial statements in accordance with U.S. GAAP. Also, due to timing of dividends and distributions, the fiscal year in which amounts are distributed may differ from the fiscal year in which the income or net realized gain was recorded by the Fund.
Accordingly, the following amounts have been reclassified for the reporting period. Net assets of the Fund were unaffected by the reclassifications.
| | | | |
Increase
to Accumulated
Net Investment
Income | | Increase
to Accumulated Net
Realized Loss
on Investments | |
| |
| $756,887 | | | $756,887 | |
The tax character of distributions paid during the reporting periods:
27 OPPENHEIMER PORTFOLIO SERIES MODERATE INVESTOR FUND
NOTES TO FINANCIAL STATEMENTS Continued
2. Significant Accounting Policies (Continued)
| | | | | | | | |
| | | Year Ended
January 31, 2017 | | | Year Ended
January 31, 2016 | |
| |
| Distributions paid from: | | | | | | | | |
| Ordinary income | | $ | 21,461,821 | | | $ | 8,257,304 | |
The aggregate cost of securities and other investments and the composition of unrealized appreciation and depreciation of securities and other investments for federal income tax purposes at period end are noted in the following table. The primary difference between book and tax appreciation or depreciation of securities and other investments, if applicable, is attributable to the tax deferral of losses or tax realization of financial statement unrealized gain or loss.
| | | | |
| Federal tax cost of securities | | $ | 1,408,490,919 | |
| | | | |
| Gross unrealized appreciation | | $ | 188,176,791 | |
| Gross unrealized depreciation | | | (24,776,892) | |
| | | | |
| Net unrealized appreciation | | $ | 163,399,899 | |
| | | | |
Use of Estimates. The preparation of financial statements in conformity with U.S. GAAP requires management to make estimates and assumptions that affect the reported amounts of assets and liabilities and disclosure of contingent assets and liabilities at the date of the financial statements and the reported amounts of increases and decreases in net assets from operations during the reporting period. Actual results could differ from those estimates.
Recent Accounting Pronouncement. In October 2016, the Securities and Exchange Commission (“SEC”) adopted amendments to rules under the Investment Company Act of 1940 (“final rules”) intended to modernize the reporting and disclosure of information by registered investment companies. The final rules amend Regulation S-X and require funds to provide standardized, enhanced derivative disclosure in fund financial statements in a format designed for individual investors. The amendments to Regulation S-X also update the disclosures for other investments and investments in, and advances to affiliates and amend the rules regarding the general form and content of fund financial statements. The compliance date for the amendments to Regulation S-X is August 1, 2017. OFI Global is currently evaluating the amendments and their impact, if any, on the fund’s financial statements.
3. Securities Valuation
The Fund calculates the net asset value of its shares based upon the net asset value of the applicable investment companies. For each investment company, the net asset value per share for a class of shares is determined as of 4:00 P.M. eastern time, on each day the New York Stock Exchange (the “Exchange”) is open for trading, except in the case of a scheduled early closing of the Exchange, in which case the Fund will calculate net asset value of the shares as of the scheduled early closing time of the Exchange. This is calculated by dividing the value of the investment company’s net assets attributable to that class by the number of outstanding shares of that class on that day.
28 OPPENHEIMER PORTFOLIO SERIES MODERATE INVESTOR FUND
3. Securities Valuation (Continued)
The Fund’s Board has adopted procedures for the valuation of the Fund’s securities and has delegated the day-to-day responsibility for valuation determinations under those procedures to the Manager. The Manager has established a Valuation Committee which is responsible for determining a “fair valuation” for any security for which market quotations are not “readily available.” The Valuation Committee’s fair valuation determinations are subject to review, approval and ratification by the Fund’s Board at its next regularly scheduled meeting covering the calendar quarter in which the fair valuation was determined.
Valuations Methods and Inputs
To determine their net asset values, the Underlying Funds’ assets are valued primarily on the basis of current market quotations as generally supplied by third party portfolio pricing services or by dealers. Such market quotations are typically based on unadjusted quoted prices in active markets for identical securities or other observable market inputs.
If a market value or price cannot be determined for a security using the methodologies described above, or if, in the “good faith” opinion of the Manager, the market value or price obtained does not constitute a “readily available market quotation,” or a significant event has occurred that would materially affect the value of the security, the security is fair valued either (i) by a standardized fair valuation methodology applicable to the security type or the significant event as previously approved by the Valuation Committee and the Fund’s Board or (ii) as determined in good faith by the Manager’s Valuation Committee. The Valuation Committee considers all relevant facts that are reasonably available, through either public information or information available to the Manager, when determining the fair value of a security. Fair value determinations by the Manager are subject to review, approval and ratification by the Fund’s Board at its next regularly scheduled meeting covering the calendar quarter in which the fair valuation was determined. The methodologies used for valuing securities are not necessarily an indication of the risks associated with investing in those Underlying Funds.
To assess the continuing appropriateness of security valuations, the Manager, or its third party service provider who is subject to oversight by the Manager, regularly compares prior day prices, prices on comparable securities, and sale prices to the current day prices and challenges those prices exceeding certain tolerance levels with the third party pricing service or broker source. For those securities valued by fair valuations, whether through a standardized fair valuation methodology or a fair valuation determination, the Valuation Committee reviews and affirms the reasonableness of the valuations based on such methodologies and fair valuation determinations on a regular basis after considering all relevant information that is reasonably available.
Classifications
Each investment asset or liability of the Fund is assigned a level at measurement date based on the significance and source of the inputs to its valuation. Various data inputs are used in determining the value of each of the Fund’s investments as of the reporting period end. These data inputs are categorized in the following hierarchy under applicable financial accounting
29 OPPENHEIMER PORTFOLIO SERIES MODERATE INVESTOR FUND
NOTES TO FINANCIAL STATEMENTS Continued
3. Securities Valuation (Continued)
standards:
1) Level 1-unadjusted quoted prices in active markets for identical assets or liabilities (including securities actively traded on a securities exchange)
2) Level 2-inputs other than unadjusted quoted prices that are observable for the asset or liability (such as unadjusted quoted prices for similar assets and market corroborated inputs such as interest rates, prepayment speeds, credit risks, etc.)
3) Level 3-significant unobservable inputs (including the Manager’s own judgments about assumptions that market participants would use in pricing the asset or liability).
The inputs used for valuing securities are not necessarily an indication of the risks associated with investing in those securities.
The Fund classifies each of its investments in investment companies which are publicly offered as Level 1. Investment companies that are not publicly offered are measured using net asset value as a practical expedient, and are not classified in the fair value hierarchy.
The table below categorizes amounts that are included in the Fund’s Statement of Assets and Liabilities at period end based on valuation input level:
| | | | | | | | | | | | | | | | |
| | | Level 1—
Unadjusted
Quoted Prices | | | Level 2—
Other Significant
Observable Inputs | | | Level 3—
Significant
Unobservable
Inputs | | | Value | |
| |
Assets Table | | | | | | | | | | | | | | | | |
Investments, at Value: | | | | | | | | | | | | | | | | |
| Investment Companies | | $ | 1,457,232,708 | | | $ | — | | | $ | — | | | $ | 1,457,232,708 | |
| | | | |
| Total Assets excluding investment companies valued using practical expedient | | $ | 1,457,232,708 | | | $ | — | | | $ | — | | | | 1,457,232,708 | |
| | | | |
| Investment companies valued using practical expedient | | | | | | | | | | | | | | | 114,658,110 | |
| | | | | | | | | | | | | | | | |
| Total Assets | | | | | | | | | | | | | | $ | 1,571,890,818 | |
| | | | | | | | | | | | | | | | |
Forward currency exchange contracts and futures contracts, if any, are reported at their unrealized appreciation/depreciation at measurement date, which represents the change in the contract’s value from trade date. All additional assets and liabilities included in the above table are reported at their market value at measurement date.
4. Investments and Risks
Risks of Investing in the Underlying Funds. The Fund invests in other mutual funds advised by the Manager. The Underlying Funds are registered open-end management investment companies under the 1940 Act, as amended. The Manager is the investment adviser of, and the Sub-Adviser provides investment and related advisory services to, the Underlying Funds. The Fund’s Investments in Underlying Funds are included in the Statement of Investments. Shares of Underlying Funds are valued at their net asset value per share. As a shareholder, the Fund is subject to its proportional share of the Underlying Funds’ expenses, including their management fee.
30 OPPENHEIMER PORTFOLIO SERIES MODERATE INVESTOR FUND
4. Investments and Risks (Continued)
Each of the Underlying Funds in which the Fund invests has its own investment risks, and those risks can affect the value of the Fund’s investments and therefore the value of the Fund’s shares. To the extent that the Fund invests more of its assets in one Underlying Fund than in another, the Fund will have greater exposure to the risks of that Underlying Fund.
Investment in Oppenheimer Institutional Government Money Market Fund.
The Fund is permitted to invest daily available cash balances in an affiliated money market fund. The Fund may invest the available cash in Class E shares of Oppenheimer Institutional Government Money Market Fund (“IGMMF”), formerly Oppenheimer Institutional Money Market Fund, is to seek current income while preserving liquidity or for defensive purposes. IGMMF is a registered open-end management investment company, regulated as a money market fund under the 1940 Act, as amended. The Manager is the investment adviser of IGMMF, and the Sub-Adviser provides investment and related advisory services to IGMMF. When applicable, the Fund’s investment in IGMMF is included in the Statement of Investments. Shares of IGMMF are valued at their net asset value per share. As a shareholder, the Fund is subject to its proportional share of IGMMF’s Class E expenses, including its management fee.
Investment in Oppenheimer Master Funds. Certain Underlying Funds in which the Fund invests are mutual funds registered under the 1940 Act, as amended, that expect to be treated as partnerships for tax purposes, specifically Oppenheimer Master Loan Fund, LLC (“Master Loan”) and Oppenheimer Master Inflation Protected Securities Fund, LLC (“Master Inflation Protected Securities”) (the “Master Funds”). Each Master Fund has its own investment risks, and those risks can affect the value of the Fund’s investments and therefore the value of the Fund’s shares. To the extent that the Fund invests more of its assets in one Master Fund than in another, the Fund will have greater exposure to the risks of that Master Fund.
The investment objective of Master Loan is to seek income. The investment objective of Master Inflation Protected Securities is to seek total return. The Fund’s investments in the Master Funds are included in the Statement of Investments. The Fund recognizes income and gain/(loss) on its investments in each Master Fund according to its allocated pro-rata share, based on its relative proportion of total outstanding Master Fund shares held, of the total net income earned and the net gain/(loss) realized on investments sold by the Master Funds. As a shareholder, the Fund is subject to its proportional share of the Master Funds’ expenses, including their management fee. The Fund owns 3.15% of Master Loan and 41.33% of Master Inflation Protected Securities at period end.
5. Market Risk Factors
The Fund’s investments in securities and/or financial derivatives may expose the Fund to various market risk factors:
Commodity Risk. Commodity risk relates to the change in value of commodities or commodity indexes as they relate to increases or decreases in the commodities market.
31 OPPENHEIMER PORTFOLIO SERIES MODERATE INVESTOR FUND
NOTES TO FINANCIAL STATEMENTS Continued
5. Market Risk Factors (Continued)
Commodities are physical assets that have tangible properties. Examples of these types of assets are crude oil, heating oil, metals, livestock, and agricultural products.
Credit Risk. Credit risk relates to the ability of the issuer of debt to meet interest and principal payments, or both, as they come due. In general, lower-grade, higher-yield debt securities are subject to credit risk to a greater extent than lower-yield, higher-quality securities.
Equity Risk. Equity risk relates to the change in value of equity securities as they relate to increases or decreases in the general market.
Foreign Exchange Rate Risk. Foreign exchange rate risk relates to the change in the U.S. dollar value of a security held that is denominated in a foreign currency. The U.S. dollar value of a foreign currency denominated security will decrease as the dollar appreciates against the currency, while the U.S. dollar value will increase as the dollar depreciates against the currency.
Interest Rate Risk. Interest rate risk refers to the fluctuations in value of fixed-income securities resulting from the inverse relationship between price and yield. For example, an increase in general interest rates will tend to reduce the market value of already issued fixed-income investments, and a decline in general interest rates will tend to increase their value. In addition, debt securities with longer maturities, which tend to have higher yields, are subject to potentially greater fluctuations in value from changes in interest rates than obligations with shorter maturities.
Volatility Risk. Volatility risk refers to the magnitude of the movement, but not the direction of the movement, in a financial instrument’s price over a defined time period. Large increases or decreases in a financial instrument’s price over a relative time period typically indicate greater volatility risk, while small increases or decreases in its price typically indicate lower volatility risk.
6. Shares of Beneficial Interest
The Fund has authorized an unlimited number of $0.001 par value shares of beneficial interest of each class. Transactions in shares of beneficial interest were as follows:
| | | | | | | | | | | | | | | | |
| | | Year Ended January 31, 2017 | | | Year Ended January 29, 20161 | |
| | | Shares | | | Amount | | | Shares | | | Amount | |
| |
Class A | | | | | | | | | | | | | | | | |
| Sold | | | 15,595,750 | | | $ | �� 167,224,228 | | | | 19,072,475 | | | $ | 205,491,735 | |
| Dividends and/or distributions reinvested | | | 1,492,315 | | | | 16,191,621 | | | | 715,440 | | | | 7,519,258 | |
| Redeemed | | | (17,419,127) | | | | (187,345,797 | ) | | | (17,404,054) | | | | (186,868,235) | |
| | | | |
| Net increase (decrease) | | | (331,062) | | | $ | (3,929,948) | | | | 2,383,861 | | | $ | 26,142,758 | |
| | | | |
32 OPPENHEIMER PORTFOLIO SERIES MODERATE INVESTOR FUND
6. Shares of Beneficial Interest (Continued)
| | | | | | | | | | | | | | | | |
| | | Year Ended January 31, 2017 | | | Year Ended January 29, 20161 | |
| | | Shares | | | Amount | | | Shares | | | Amount | |
| |
Class B | | | | | | | | | | | | | | | | |
| Sold | | | 82,511 | | | $ | 867,685 | | | | 129,254 | | | $ | 1,370,718 | |
| Dividends and/or distributions reinvested | | | 9,085 | | | | 98,026 | | | | — | | | | — | |
| Redeemed | | | (2,211,637) | | | | (23,340,916) | | | | (2,600,041) | | | | (27,726,463) | |
| | | | |
| Net decrease | | | (2,120,041) | | | $ | (22,375,205) | | | | (2,470,787) | | | $ | (26,355,745) | |
| | | | |
| | | | | | | | | | | | | | | | |
| |
Class C | | | | | | | | | | | | | | | | |
| Sold | | | 6,311,625 | | | $ | 66,016,887 | | | | 7,351,012 | | | $ | 77,568,088 | |
| Dividends and/or distributions reinvested | | | 311,293 | | | | 3,315,272 | | | | 5,943 | | | | 61,332 | |
| Redeemed | | | (8,538,147) | | | | (89,797,355) | | | | (7,212,996) | | | | (75,876,742) | |
| | | | |
| Net increase (decrease) | | | (1,915,229) | | | $ | (20,465,196) | | | | 143,959 | | | $ | 1,752,678 | |
| | | | |
| | | | | | | | | | | | | | | | |
| |
Class R | | | | | | | | | | | | | | | | |
| Sold | | | 2,549,789 | | | $ | 27,220,994 | | | | 2,157,742 | | | $ | 23,013,119 | |
| Dividends and/or distributions reinvested | | | 125,071 | | | | 1,349,519 | | | | 42,123 | | | | 440,195 | |
| Redeemed | | | (2,209,563) | | | | (23,734,481) | | | | (3,060,922) | | | | (32,520,330) | |
| | | | |
| Net increase (decrease) | | | 465,297 | | | $ | 4,836,032 | | | | (861,057) | | | $ | (9,067,016) | |
| | | | |
| | | | | | | | | | | | | | | | |
| |
Class Y | | | | | | | | | | | | | | | | |
| Sold | | | 536,258 | | | $ | 5,826,101 | | | | 308,320 | | | $ | 3,326,211 | |
| Dividends and/or distributions reinvested | | | 14,064 | | | | 153,438 | | | | 8,989 | | | | 94,925 | |
| Redeemed | | | (642,301) | | | | (6,682,090) | | | | (288,272) | | | | (3,123,949) | |
| | | | |
| Net increase (decrease) | | | (91,979) | | | $ | (702,551) | | | | 29,037 | | | $ | 297,187 | |
| | | | |
1. Represents the last business day of the Fund’s reporting period.
7. Purchases and Sales of Securities
The aggregate cost of purchases and proceeds from sales of securities, other than short-term obligations and investments in IGMMF, for the reporting period were as follows:
| | | | | | | | |
| | | Purchases | | | Sales | |
| |
| Investment securities | | $ | 105,883,058 | | | $ | 129,620,008 | |
8. Fees and Other Transactions with Affiliates
Management Fees. Under the investment advisory agreement, the Manager does not charge a management fee, but rather collects indirect management fees from the Fund’s investments in the Underlying Funds. The weighted indirect management fees collected from the Fund’s investment in the Underlying Funds, as a percent of average daily net assets of the Fund for the reporting period was 0.53%. This amount is gross of any waivers or reimbursements of management fees implemented at the Underlying Fund level. Under the sub-advisory agreement effective January 1, 2013, the Manager pays the Sub-Adviser a percentage of the indirect management fees (after all applicable waivers) from the Fund’s investments in the Underlying Funds.
33 OPPENHEIMER PORTFOLIO SERIES MODERATE INVESTOR FUND
NOTES TO FINANCIAL STATEMENTS Continued
8. Fees and Other Transactions with Affiliates (Continued)
Sub-Adviser Fees. The Manager has retained the Sub-Adviser to provide the day-to-day portfolio management of the Fund. Under the Sub-Advisory Agreement, the Manager pays the Sub-Adviser an annual fee in monthly installments, equal to a percentage of the indirect investment management fee collected by the Manager, which shall be calculated after any investment management fee waivers. The fee paid to the Sub-Adviser is paid by the Manager, not by the Fund.
Transfer Agent Fees. OFI Global (the “Transfer Agent”) serves as the transfer and shareholder servicing agent for the Fund. The Fund pays the Transfer Agent a fee based on annual net assets. Fees incurred and average net assets for each class with respect to these services are detailed in the Statement of Operations and Financial Highlights, respectively.
Sub-Transfer Agent Fees. The Transfer Agent has retained Shareholder Services, Inc., a wholly-owned subsidiary of OFI (the “Sub-Transfer Agent”), to provide the day-to-day transfer agent and shareholder servicing of the Fund. Under the Sub-Transfer Agency Agreement, the Transfer Agent pays the Sub-Transfer Agent an annual fee in monthly installments, equal to a percentage of the transfer agent fee collected by the Transfer Agent from the Fund, which shall be calculated after any applicable fee waivers. The fee paid to the Sub-Transfer Agent is paid by the Transfer Agent, not by the Fund.
Trustees’ Compensation. The Fund has adopted an unfunded retirement plan (the “Plan”) for the Fund’s Independent Trustees. Benefits are based on years of service and fees paid to each Trustee during their period of service. The Plan was frozen with respect to adding new participants effective December 31, 2006 (the “Freeze Date”) and existing Plan Participants as of the Freeze Date will continue to receive accrued benefits under the Plan. Active Independent Trustees as of the Freeze Date have each elected a distribution method with respect to their benefits under the Plan. During the reporting period, the Fund’s projected benefit obligations, payments to retired Trustees and accumulated liability were as follows:
| | | | |
| Projected Benefit Obligations Increased | | $ | — | |
| Payments Made to Retired Trustees | | | 3,526 | |
| Accumulated Liability as of January 31, 2017 | | | 25,480 | |
The Fund’s Board of Trustees (“Board”) has adopted a compensation deferral plan for Independent Trustees that enables Trustees to elect to defer receipt of all or a portion of the annual compensation they are entitled to receive from the Fund. For purposes of determining the amount owed to the Trustee under the plan, deferred amounts are treated as though equal dollar amounts had been invested in shares of the Fund or in other Oppenheimer funds selected by the Trustee. The Fund purchases shares of the funds selected for deferral by the Trustee in amounts equal to his or her deemed investment, resulting in a Fund asset equal to the deferred compensation liability. Such assets are included as a component of “Other” within the asset section of the Statement of Assets and Liabilities. Deferral of Trustees’ fees under the plan will not affect the net assets of the Fund and will not materially affect the
34 OPPENHEIMER PORTFOLIO SERIES MODERATE INVESTOR FUND
8. Fees and Other Transactions with Affiliates (Continued)
Fund’s assets, liabilities or net investment income per share. Amounts will be deferred until distributed in accordance with the compensation deferral plan.
Distribution and Service Plan (12b-1) Fees. Under its General Distributor’s Agreement with the Fund, OppenheimerFunds Distributor, Inc. (the “Distributor”) acts as the Fund’s principal underwriter in the continuous public offering of the Fund’s classes of shares.
Service Plan for Class A Shares. The Fund has adopted a Service Plan (the “Plan”) for Class A shares pursuant to Rule 12b-1 under the 1940 Act. Under the Plan, the Fund reimburses the Distributor for a portion of its costs incurred for services provided to accounts that hold Class A shares. Reimbursement is made periodically at an annual rate of up to 0.25% of the daily net assets of Class A shares of the Fund. The Distributor currently uses all of those fees to pay dealers, brokers, banks and other financial institutions periodically for providing personal service and maintenance of accounts of their customers that hold Class A shares. Any unreimbursed expenses the Distributor incurs with respect to Class A shares in any fiscal year cannot be recovered in subsequent periods. Fees incurred by the Fund under the Plan are detailed in the Statement of Operations.
Distribution and Service Plans for Class B, Class C and Class R Shares. The Fund has adopted Distribution and Service Plans (the “Plans”) for Class B, Class C and Class R shares pursuant to Rule 12b-1 under the 1940 Act to compensate the Distributor for distributing those share classes, maintaining accounts and providing shareholder services. Under the Plans, the Fund pays the Distributor an annual asset-based sales charge of 0.75% on Class B and Class C shares’ daily net assets and 0.25% on Class R shares’ daily net assets. The Fund also pays a service fee under the Plans at an annual rate of 0.25% of daily net assets. The Plans continue in effect from year to year only if the Fund’s Board of Trustees votes annually to approve their continuance at an in person meeting called for that purpose. Fees incurred by the Fund under the Plans are detailed in the Statement of Operations.
Sales Charges. Front-end sales charges and CDSC do not represent expenses of the Fund. They are deducted from the proceeds of sales of Fund shares prior to investment or from redemption proceeds prior to remittance, as applicable. The sales charges retained by the Distributor from the sale of shares and the CDSC retained by the Distributor on the redemption of shares is shown in the following table for the period indicated.
| | | | | | | | | | | | | | | | | | | | |
| Year Ended | | Class A
Front-End
Sales Charges
Retained by
Distributor | | | Class A
Contingent
Deferred
Sales Charges
Retained by
Distributor | | | Class B
Contingent
Deferred
Sales Charges
Retained by
Distributor | | | Class C
Contingent
Deferred
Sales Charges
Retained by
Distributor | | | Class R
Contingent
Deferred
Sales Charges
Retained by
Distributor | |
| |
| January 31, 2017 | | | $760,605 | | | | $339 | | | | $33,778 | | | | $40,499 | | | | $— | |
Waivers and Reimbursements of Expenses. The Manager has voluntarily agreed to
35 OPPENHEIMER PORTFOLIO SERIES MODERATE INVESTOR FUND
NOTES TO FINANCIAL STATEMENTS Continued
8. Fees and Other Transactions with Affiliates (Continued)
waive fees and/or reimburse the Fund for certain expenses in order to limit “Expenses after payments, waivers and/or reimbursements and reduction to custodian expenses”, (the combined direct (Fund level) and indirect (Underlying Fund level) expenses), will not exceed the annual rate of 1.30%, 2.05%, 2.05%, 1.55% and 1.05%, for Class A, Class B, Class C, Class R and Class Y, respectively. The expense limitations do not include expenses not incurred in the ordinary course of the Fund’s business. Notwithstanding the foregoing limits, the Manager is not required to waive or reimburse Fund expenses in excess of the amount of indirect management fees earned from investments in the Underlying Funds.
The Manager has also contractually agreed to waive fees and/or reimburse certain Fund expenses at an annual rate of 0.07% as calculated on the daily net assets of the Fund. This waiver and/or reimbursement is applied after (and in addition to) any other applicable waiver and/or expense reimbursements that may apply. During the reporting period, the Manager waived fees and/or reimbursed the Fund $1,080,888.
Waivers and/or reimbursements may be modified or terminated as set forth according to the terms in the prospectus.
9. Borrowings and Other Financing
Joint Credit Facility. A number of mutual funds managed by the Manager participate in a $1.3 billion revolving credit facility (the “Facility”) intended to provide short-term financing, if necessary, subject to certain restrictions in connection with atypical redemption activity. Expenses and fees related to the Facility are paid by the participating funds and are disclosed separately or as other expenses on the Statement of Operations. Effective July 18, 2016, the Fund no longer participated in the Facility.
36 OPPENHEIMER PORTFOLIO SERIES MODERATE INVESTOR FUND
REPORT OF INDEPENDENT REGISTERED PUBLIC ACCOUNTING FIRM
The Board of Trustees and Shareholders of Oppenheimer Portfolio Series:
We have audited the accompanying statement of assets and liabilities of Moderate Investor Fund (a series of Oppenheimer Portfolio Series), including the statement of investments, as of January 31, 2017, and the related statement of operations for the year then ended, the statements of changes in net assets for each of the years in the two-year period then ended, and the financial highlights for each of the years in the five-year period then ended. These financial statements and financial highlights are the responsibility of the Fund’s management. Our responsibility is to express an opinion on these financial statements and financial highlights based on our audits.
We conducted our audits in accordance with the standards of the Public Company Accounting Oversight Board (United States). Those standards require that we plan and perform the audit to obtain reasonable assurance about whether the financial statements and financial highlights are free of material misstatement. An audit includes examining, on a test basis, evidence supporting the amounts and disclosures in the financial statements. Our procedures included confirmation of securities owned as of January 31, 2017, by correspondence with the transfer agent. An audit also includes assessing the accounting principles used and significant estimates made by management, as well as evaluating the overall financial statement presentation. We believe that our audits provide a reasonable basis for our opinion.
In our opinion, the financial statements and financial highlights referred to above present fairly, in all material respects, the financial position of Moderate Investor Fund as of January 31, 2017, the results of its operations for the year then ended, the changes in its net assets for each of the years in the two-year period then ended, and the financial highlights for each of the years in the five-year period then ended, in conformity with U.S. generally accepted accounting principles.
KPMGLLP
Denver, Colorado
March 24, 2017
37 OPPENHEIMER PORTFOLIO SERIES MODERATE INVESTOR FUND
FEDERAL INCOME TAX INFORMATION Unaudited
In early 2017, if applicable, shareholders of record received information regarding all dividends and distributions paid to them by the Fund during calendar year 2016.
Dividends, if any, paid by the Fund during the reporting period which are not designated as capital gain distributions should be multiplied by the maximum amount allowable but not less than 36.01% to arrive at the amount eligible for the corporate dividend-received deduction.
A portion, if any, of the dividends paid by the Fund during the reporting period which are not designated as capital gain distributions are eligible for lower individual income tax rates to the extent that the Fund has received qualified dividend income as stipulated by recent tax legislation. The maximum amount allowable but not less than $12,378,350 of the Fund’s fiscal year taxable income may be eligible for the lower individual income tax rates. In early 2017, shareholders of record received information regarding the percentage of distributions that are eligible for lower individual income tax rates.
Recent tax legislation allows a regulated investment company to designate distributions not designated as capital gain distributions, as either interest related dividends or short-term capital gain dividends, both of which are exempt from the U.S. withholding tax applicable to non U.S. taxpayers. For the reporting period, the maximum amount allowable but not less than $9,457,036 of the ordinary distributions to be paid by the Fund qualifies as an interest related dividend.
The Fund has elected the application of Section 853 of the Internal Revenue Code to permit shareholders to take a federal income tax credit or deduction, at their option, on a per share basis. The maximum amount allowable but not less than $457,806 of foreign income taxes were paid by the Fund during the reporting period. A separate notice will be mailed to each shareholder, which will reflect the proportionate share of such foreign taxes which must be treated by shareholders as gross income for federal income tax purposes.
Gross income of the maximum amount allowable but not less than $3,462,694 was derived from sources within foreign countries or possessions of the United States.
The foregoing information is presented to assist shareholders in reporting distributions received from the Fund to the Internal Revenue Service. Because of the complexity of the federal regulations which may affect your individual tax return and the many variations in state and local tax regulations, we recommend that you consult your tax advisor for specific guidance.
38 OPPENHEIMER PORTFOLIO SERIES MODERATE INVESTOR FUND
BOARD APPROVAL OF THE FUND’S INVESTMENT ADVISORY
AND SUB-ADVISORY AGREEMENTS Unaudited
The Fund has entered into an investment advisory agreement with OFI Global Asset Management, Inc. (“OFI Global” or the “Adviser”), a wholly-owned subsidiary of OppenheimerFunds, Inc. (“OFI” or the “Sub-Adviser”) (“OFI Global” and “OFI” together, the “Managers”) and OFI Global has entered into a sub-advisory agreement with OFI whereby OFI provides investment sub-advisory services to the Fund (collectively, the “Agreements”). Each year, the Board of Trustees (the “Board”), including a majority of the independent Trustees, is required to determine whether to approve the terms of the Agreements and the renewal thereof. The Investment Company Act of 1940, as amended, requires that the Board request and evaluate, and that the Managers provide, such information as may be reasonably necessary to evaluate the terms of the Agreements. The Board employs an independent consultant to prepare a report that provides information, including comparative information that the Board requests for that purpose. In addition to in-person meetings focused on this evaluation, the Board receives information throughout the year regarding Fund services, fees, expenses and performance.
The Managers and the independent consultant provided information to the Board on the following factors: (i) the nature, quality and extent of the Managers’ services, (ii) the comparative investment performance of the Fund and the Managers, (iii) the fees and expenses of the Fund, including comparative fee and expense information, (iv) the profitability of the Managers and their affiliates, including an analysis of the cost of providing services, (v) whether economies of scale are realized as the Fund grows and whether fee levels reflect these economies of scale for Fund investors and (vi) other benefits to the Managers from their relationship with the Fund. The Board was aware that there are alternatives to retaining the Managers.
Outlined below is a summary of the principal information considered by the Board as well as the Board’s conclusions.
Nature, Quality and Extent of Services. The Board considered information about the nature, quality and extent of the services provided to the Fund and information regarding the Managers’ key personnel who provide such services. The Managers’ duties include providing the Fund with the services of the portfolio managers and the Sub-Adviser’s investment team, who provide research, analysis and other advisory services in regard to the Fund’s investments; and securities trading services. OFI Global is responsible for oversight of third-party service providers; monitoring compliance with applicable Fund policies and procedures and adherence to the Fund’s investment restrictions; risk management; and oversight of the Sub-Adviser. OFI Global is also responsible for providing certain administrative services to the Fund as well. Those services include providing and supervising all administrative and clerical personnel who are necessary in order to provide effective corporate administration for the Fund; compiling and maintaining records with respect to the Fund’s operations; preparing and filing reports required by the U.S. Securities and Exchange Commission; preparing periodic reports regarding the operations of the Fund for its shareholders; preparing proxy materials for shareholder meetings; and preparing the registration statements required by federal and state securities laws for the sale of the Fund’s shares. OFI Global also provides the Fund with office space, facilities and equipment.
39 OPPENHEIMER PORTFOLIO SERIES MODERATE INVESTOR FUND
BOARD APPROVAL OF THE FUND’S INVESTMENT ADVISORY
AND SUB-ADVISORY AGREEMENTS Unaudited / Continued
The Board also considered the quality of the services provided and the quality of the Managers’ resources that are available to the Fund. The Board took account of the fact that the Sub-Adviser has over fifty years of experience as an investment adviser and that its assets under management rank it among the top mutual fund managers in the United States. The Board evaluated the Managers’ advisory, administrative, accounting, legal, compliance services and risk management, and information the Board has received regarding the experience and professional qualifications of the Managers’ key personnel and the size and functions of its staff. In its evaluation of the quality of the portfolio management services provided, the Board considered the experience of Mark Hamilton and Dokyoung Lee, the portfolio managers for the Fund, and the experience of the portfolio managers and the investment performance of the investment companies in which the Fund invests (the “Underlying Funds”). The Board members also considered the totality of their experiences with the Managers as directors or trustees of the Fund and other funds advised by the Managers. The Board considered information regarding the quality of services provided by affiliates of the Managers, which the Board members have become knowledgeable about through their experiences with the Managers and in connection with the renewal of the Fund’s service agreements. The Board concluded, in light of the Managers’ experience, reputation, personnel, operations and resources that the Fund benefits from the services provided under the Agreements.
Investment Performance of the Managers and the Fund. Throughout the year, the Managers provided information on the investment performance of the Fund, the Adviser and the Sub-Adviser, including comparative performance information. The Board also reviewed information, prepared by the Managers and the independent consultant, comparing the Fund’s historical performance to relevant benchmark or market indices and to the performance of other retail funds in the moderate allocation category. The Board noted that the Fund’s one-year performance was better than its category median although its three-year, five-year and ten-year performance was below its category median.
Fees and Expenses of the Fund. The Board reviewed the expenses borne by the Fund. The Adviser does not charge a management fee to the Fund; however, the Adviser collects indirect management fees from the Fund’s Underlying Funds. The independent consultant provided comparative data in regard to the fees and expenses of the Fund and other retail front-end load moderate allocation funds with comparable asset levels and distribution features. After discussions with the Board, the Adviser has voluntarily agreed to waive fees and/or reimburse the Fund so that the total annual fund operating expenses, excluding certain expenses, as a percentage of average daily net assets will not exceed the following annual rates: 1.30% for Class A shares, 2.05% for Class B shares, 2.05% for Class C shares, 1.55% for Class R shares and 1.05% for Class Y shares, as calculated on the daily net assets of the Fund. This fee waiver and/or expense reimbursement may be amended or withdrawn at any time without prior notice to shareholders. After discussions with the Board, the Adviser has also agreed to contractually waive fees and/or reimburse certain Fund expenses at an annual rate of 0.07% as calculated on the daily net assets of the Fund. This waiver and/or reimbursement is applied after (and in addition to) any other applicable fee waivers and/or expense reimbursements that apply. The Adviser is not required to waive or reimburse Fund
40 OPPENHEIMER PORTFOLIO SERIES MODERATE INVESTOR FUND
expenses in excess of the amount of indirect management fees earned from investments in the Underlying Funds. This contractual fee waiver and/or expense reimbursement may not be amended or withdrawn until one year from the date of the prospectus, unless approved by the Board. The Board noted that the Fund was charged no actual management fees, exclusive of Underlying Fund management fees, while certain peer group funds did charge direct management fees. The Board also noted that the Fund’s total expenses were lower than its peer group median and category median.
Economies of Scale and Profits Realized by the Adviser and Sub-Adviser.
The Board considered information regarding the Managers’ costs in serving as the Fund’s investment adviser and sub-adviser, including the costs associated with the personnel and systems necessary to manage the Fund, and information regarding the Managers’ profitability from their relationship with the Fund. The Board also considered that the Managers must be able to pay and retain experienced professional personnel at competitive rates to provide quality services to the Fund. The Board reviewed whether the Managers may realize economies of scale in managing and supporting the Fund and whether those economies of scale benefit the Fund’s shareholders at the current level of Fund assets in relation to its management fee. The Fund currently does not charge a management fee.
Other Benefits to the Managers. In addition to considering the profits realized by the Managers, the Board considered information that was provided regarding the direct and indirect benefits the Managers receive as a result of their relationship with the Fund, including compensation paid to the Managers’ affiliates.
Conclusions. These factors were also considered by the independent Trustees meeting separately from the full Board, assisted by experienced counsel to the Fund and to the independent Trustees. Fund counsel and the independent Trustees’ counsel are independent of the Managers within the meaning and intent of the Securities and Exchange Commission Rules.
Based on its review of the information it received and its evaluations described above, the Board, including a majority of the independent Trustees, decided to continue the Agreements through September 30, 2017. In arriving at its decision, the Board did not identify any factor or factors as being more important than others, but considered all of the above information, and considered the terms and conditions of the Agreements, including the management fees, in light of all the surrounding circumstances.
41 OPPENHEIMER PORTFOLIO SERIES MODERATE INVESTOR FUND
PORTFOLIO PROXY VOTING POLICIES AND GUIDELINES;
UPDATES TO STATEMENTS OF INVESTMENTS Unaudited
The Fund has adopted Portfolio Proxy Voting Policies and Guidelines under which the Fund votes proxies relating to securities (“portfolio proxies”) held by the Fund. A description of the Fund’s Portfolio Proxy Voting Policies and Guidelines is available (i) without charge, upon request, by calling the Fund toll-free at 1.800.CALL OPP (225.5677), (ii) on the Fund’s website at www.oppenheimerfunds.com, and (iii) on the SEC’s website at www.sec.gov. In addition, the Fund is required to file Form N-PX, with its complete proxy voting record for the 12 months ended June 30th, no later than August 31st of each year.
The Fund’s voting record is available (i) without charge, upon request, by calling the Fund toll-free at 1.800.CALL OPP (225.5677), and (ii) in the Form N-PX filing on the SEC’s website at www.sec.gov. The Fund files its complete schedule of portfolio holdings with the SEC for the first quarter and the third quarter of each fiscal year on Form N-Q. The Fund’s Form N-Q filings are available on the SEC’s website at www.sec.gov. Those forms may be reviewed and copied at the SEC���s Public Reference Room in Washington, D.C. Information on the operation of the Public Reference Room may be obtained by calling 1-800-SEC-0330.
Householding—Delivery of Shareholder Documents
This is to inform you about OppenheimerFunds’ “householding” policy. If more than one member of your household maintains an account in a particular fund, OppenheimerFunds will mail only one copy of the fund’s prospectus (or, if available, the fund’s summary prospectus), annual and semiannual report and privacy policy. The consolidation of these mailings, called householding, benefits your fund through reduced mailing expense, and benefits you by reducing the volume of mail you receive from OppenheimerFunds. Householding does not affect the delivery of your account statements.
Please note that we will continue to household these mailings for as long as you remain an OppenheimerFunds shareholder, unless you request otherwise. If you prefer to receive multiple copies of these materials, please call us at 1.800.CALL-OPP (225-5677). You may also notify us in writing or via email. We will begin sending you individual copies of the prospectus (or, if available, the summary prospectus), reports and privacy policy within 30 days of receiving your request to stop householding.
42 OPPENHEIMER PORTFOLIO SERIES MODERATE INVESTOR FUND
TRUSTEES AND OFFICERS Unaudited
| | |
| Name, Position(s) Held with the Fund, Length of Service, Year of Birth | | Principal Occupation(s) During the Past 5 Years; Other Trusteeships/ Directorships Held; Number of Portfolios in the Fund Complex Currently Overseen |
| |
| INDEPENDENT TRUSTEES | | The address of each Trustee in the chart below is 6803 S. Tucson Way, Centennial, Colorado 80112-3924. Each Trustee serves for an indefinite term, or until his or her resignation, retirement, death or removal. |
| |
Brian F. Wruble, Chairman of the Board of Trustees (since 2007) and Trustee (since 2005) Year of Birth: 1943 | | Governor and Vice Chairman of Community Foundation of the Florida Keys (non-profit) (since July 2012); Trustee of the Board of Trustees, The Jackson Laboratory (non-profit) (1991-2011 and since May 2014); Chairman Emeritus (since August 2011) of The Jackson Laboratory (non-profit); Member of Zurich Insurance Group’s Investment Management Advisory Council (insurance) (since 2004); Treasurer (since 2007) and Trustee of the Institute for Advanced Study (non-profit educational institute) (since May 1992); Director of Special Value Opportunities Fund, LLC (registered investment company) (affiliate of the Sub-Adviser’s parent company) (September 2004-June 2015); General Partner of Odyssey Partners, L.P. (hedge fund) (September 1995-December 2007); Special Limited Partner of Odyssey Investment Partners, LLC (private equity investment) (January 1999-September 2004). Oversees 56 portfolios in the OppenheimerFunds complex. Mr. Wruble has served on the Boards of certain Oppenheimer funds since April 2001, during which time he has become familiar with the Fund’s (and other Oppenheimer funds’) financial, accounting, regulatory and investment matters and has contributed to the Boards’ deliberations. |
| |
Beth Ann Brown, Trustee (since 2016) Year of Birth: 1968 | | Advisor, Board of Advisors of Caron Engineering Inc. (since December 2014); Independent Consultant (since September 2012); held the following positions at Columbia Management Investment Advisers LLC: Head of Intermediary Distribution (2008-2012), Managing Director, Strategic Relations (2005-2008), Managing Director, Head of National Accounts (2004-2005); Senior Vice President, National Account Manager (2002-2004), Senior Vice President, Key Account Manager (1999-2002) and Vice President, Key Account Manager (1996-1999) of Liberty Funds Distributor, Inc.; President and Director, of Acton Shapleigh Youth Conservation Corps (non-profit) (since 2012); and Vice President and Director of Grahamtastic Connection (non-profit) (since May 2013). Oversees 56 portfolios in the OppenheimerFunds complex. Ms. Brown has served on the Boards of certain Oppenheimer funds since January 2016, during which time she has become familiar with the Fund’s (and other Oppenheimer funds’) financial, accounting, regulatory and investment matters and has contributed to the Boards’ deliberations. |
43 OPPENHEIMER PORTFOLIO SERIES MODERATE INVESTOR FUND
TRUSTEES AND OFFICERS Unaudited / Continued
| | |
| |
Edmund P. Giambastiani, Jr., Trustee (since 2013) Year of Birth: 1948 | | Advisory Board Member of the Maxwell School of Citizenship and Public Affairs of Syracuse University (since April 2012); Director of Mercury Defense Systems Inc. (information technology) (August 2011-February 2013); Trustee of the U.S. Naval Academy Foundation (since November 2010); Advisory Board Member of the Massachusetts Institute of Technology Lincoln Laboratory (federally- funded research development center) (since May 2010); Director of The Boeing Company (aerospace and defense) (since October 2009); Trustee of MITRE Corporation (federally-funded research development center) (since September 2008); Independent Director of QinetiQ Group Plc (defense technology and security) (February 2008-August 2011); Lead Director (June 2011-March 2015); Chairman of Alenia North America, Inc. (military and defense products) (January 2008-October 2009); Director of SRA International, Inc. (information technology and services) (January 2008-July 2011); President of Giambastiani Group LLC (national security and energy consulting) (since October 2007); United States Navy, career nuclear submarine officer (June 1970-October 2007), Vice Chairman of the Joint Chiefs of Staff (2005-October 2007), Supreme Allied Commander of NATO Commander Transformation (2003-2005), Commander, U.S. Joint Forces Command (2002-2005). Since his retirement from the U.S. Navy in October 2007, Admiral Giambastiani has also served on numerous U.S. Government advisory boards, investigations and task forces for the Secretaries of Defense, State and Interior and the Central Intelligence Agency. He currently serves as a federal commissioner on the Military Compensation and Retirement Modernization Commission. Oversees 56 portfolios in the OppenheimerFunds complex. Admiral Giambastiani has served on the Boards of certain Oppenheimer funds since February 2013, including as an Advisory Board Member for certain Oppenheimer funds, during which time he has become familiar with the Fund’s (and other Oppenheimer funds’) financial, accounting, regulatory and investment matters and has contributed to the Boards’ deliberations. For purposes of this report, Admiral Giambastiani is identified as a Trustee. |
| |
Elizabeth Krentzman, Trustee (since 2014) Year of Birth: 1959 | | Advisory Board Member of the University of Florida Law Center Association (since 2016) and the Securities and Exchange Commission Historical Society (since 2007); held the following positions at Deloitte & Touche LLP: Principal and Chief Regulatory Advisor for Asset Management Services (2007-2014) and U.S. Mutual Fund Leader (2011-2014); General Counsel of the Investment Company Institute (trade association) (June 2004-April 2007); held the following positions at Deloitte & Touche LLP: National Director of the Investment Management Regulatory Consulting Practice (1997-2004), Principal (2003-2004), Director (1998-2003) and Senior Manager (1997-1998); Assistant Director of the Division of Investment Management – Office of Disclosure and Investment Adviser Regulation (1996- 1997) and various positions with the Division of Investment Management – Office of Regulatory Policy (1991-1996) of the U.S. Securities and Exchange Commission; Associate at Ropes & Gray (1987-1991). Oversees 56 portfolios in the OppenheimerFunds complex. Ms. Krentzman has served on the Boards of certain Oppenheimer funds since August 2014, during which time she has become familiar with the Fund’s (and other Oppenheimer funds’) financial, accounting, regulatory and investment matters and has contributed to the Boards’ deliberations. |
44 OPPENHEIMER PORTFOLIO SERIES MODERATE INVESTOR FUND
| | |
| |
Mary F. Miller, Trustee (since 2005) Year of Birth: 1942 | | Trustee of International House (not-for-profit) (since June 2007); Trustee of the American Symphony Orchestra (not-for-profit) (October 1998-November 2011); and Senior Vice President and General Auditor of American Express Company (financial services company) (July 1998-February 2003). Oversees 56 portfolios in the OppenheimerFunds complex. Ms. Miller has served on the Boards of certain Oppenheimer funds since August 2004, during which time she has become familiar with the Fund’s (and other Oppenheimer funds’) financial, accounting, regulatory and investment matters and has contributed to the Boards’ deliberations. |
| |
Joel W. Motley, Trustee (since 2005) Year of Birth: 1952 | | Director of Greenwall Foundation (since October 2013); Member of Board and Investment Committee of The Greenwall Foundation (since April 2013); Member of the Vestry of Trinity Wall Street (since April 2012); Director of Southern Africa Legal Services Foundation (since March 2012); Board Member of Pulitzer Center for Crisis Reporting (non-profit journalism) (since March 2011); Managing Director of Public Capital Advisors, LLC (privately-held financial advisor) (since January 2006); Managing Director of Carmona Motley, Inc. (privately-held financial advisor) (since January 2002); Director of Columbia Equity Financial Corp. (privately-held financial advisor) (2002-2007); Managing Director of Carmona Motley Hoffman Inc. (privately-held financial advisor) (January 1998-December 2001); Member of the Finance and Budget Committee of the Council on Foreign Relations, Member of the Investment Committee and Board of Human Rights Watch (since July 2000) and Member of the Investment Committee and Board of Historic Hudson Valley (since February 2010). Oversees 56 portfolios in the OppenheimerFunds complex. Mr. Motley has served on the Boards of certain Oppenheimer funds since October 2002, during which time he has become familiar with the Fund’s (and other Oppenheimer funds’) financial, accounting, regulatory and investment matters and has contributed to the Boards’ deliberations. |
| |
Joanne Pace, Trustee (since 2012) Year of Birth: 1958 | | Advisory Board Director of Massey Quick and Company, LLC (since October 2014); Board Director of Horizon Blue Cross Blue Shield of New Jersey (since November 2012); Advisory Board Director of The Alberleen Group LLC (since March, 2012); Board Member (since January 2015), Advisory Council Member (December 2012-December 2014) of 100 Women in Hedge Funds (non-profit) (since December, 2012); Advisory Council Member of Morgan Stanley Children’s Hospital (non-profit) (since May, 2012); Board Director of The Komera Project (non-profit) (since April, 2012); New York Advisory Board Director of Peace First (non-profit) (2010-2015); Senior Advisor of SECOR Asset Management, LP (2010-2011); Managing Director and Chief Operating Officer of Morgan Stanley Investment Management (2006-2010); Partner and Chief Operating Officer of FrontPoint Partners, LLC (hedge fund) (2005-2006); held the following positions at Credit Suisse: Managing Director (2003-2005); Global Head of Human Resources and member of Executive Board and Operating Committee (2004-2005), Global Head of Operations and Product Control (2003-2004); held the following positions at Morgan Stanley: Managing Director (1997-2003), Controller and Principal Accounting Officer (1999-2003); Chief Financial Officer (temporary assignment) for the Oversight Committee, Long Term Capital Management (1998-1999). Lead Independent Director and Chair of the Audit and Nominating Committee of The Global Chartist Fund, LLC of Oppenheimer Asset Management (2011-2012); Board Director of Managed Funds Association (2008-2010); Board Director of Morgan Stanley Foundation (2007-2010) and Investment Committee Chair (2008-2010). |
45 OPPENHEIMER PORTFOLIO SERIES MODERATE INVESTOR FUND
TRUSTEES AND OFFICERS Unaudited / Continued
| | |
Joanne Pace, (Continued) | | Oversees 56 portfolios in the OppenheimerFunds complex. Ms. Pace has served on the Boards of certain Oppenheimer funds since November 2012, including as an Advisory Board Member for certain Oppenheimer funds, during which time she has become familiar with the Fund’s (and other Oppenheimer funds’) financial, accounting, regulatory and investment matters and has contributed to the Board’s deliberations. For purposes of this report, Ms. Pace is identified as a Trustee. |
| |
Daniel Vandivort, Trustee (since 2014) Year of Birth: 1954 | | Chairman and Lead Independent Director/Trustee (March 2010-September 2014), Chairman of the Audit Committee (March 2009-September 2014) and Director/ Trustee (December 2008-September 2014) of the Board of Directors/Trustees of Value Line Funds; Trustee, Board of Trustees of Huntington Disease Foundation of America (since January 2015 and June 2007-December 2013): Trustee, Board of Trustees, RIM Retirement Savings Plan (2005-2007); President and Chief Investment Officer, Robeco Investment Management, formerly known as Weiss Peck and Greer (January 2005-June 2007); Member, Management Committee of Robeco Investment Management (2001-2007); Chairman and Trustee of the Board of Trustees of Weiss, Peck and Greer Funds (2004-2005); Managing Director and Head of Fixed Income, Weiss, Peck and Greer (November 1994-January 2005); Managing Director and Head of Fixed Income, CS First Boston Investment Management (January 1992-November 1994); Director, Global Product Development, First Boston Asset Management (November 1989 to January 1992); Vice President, Fixed Income Sales, First Boston Corp. (May 1984-November 1989). Oversees 56 portfolios in the OppenheimerFunds complex. Mr. Vandivort has served on the Boards of certain Oppenheimer funds since 2014, during which time he has become familiar with the Fund’s (and other Oppenheimer funds’) financial, accounting, regulatory and investment matters and has contributed to the Boards’ deliberations. |
INTERESTED TRUSTEE AND OFFICER | | Mr. Steinmetz is an “Interested Trustee” because he is affiliated with the Manager and the Sub-Adviser by virtue of his positions as Chairman of the Sub-Adviser and officer and director of the Manager. Both as a Trustee and as an officer, Mr. Steinmetz serves for an indefinite term, or until his resignation, retirement, death or removal. Mr. Steinmetz’s address is 225 Liberty Street, New York, New York 10281-1008. |
| |
Arthur P. Steinmetz, Trustee (since 2015), President and Principal Executive Officer (since 2014) Year of Birth: 1958 | | Chairman of the Sub-Adviser (since January 2015); CEO and Chairman of the Manager (since July 2014), President of the Manager (since May 2013), a Director of the Manager (since January 2013), Director of the Sub-Adviser (since July 2014), President, Management Director and CEO of Oppenheimer Acquisition Corp. (the Sub-Adviser’s parent holding company) (since July 2014), and President and Director of OFI SteelPath, Inc. (since January 2013). Chief Investment Officer of the OppenheimerFunds advisory entities from (January 2013-December 2013); Executive Vice President of the Manager (January 2013-May 2013); Chief Investment Officer of the Sub-Adviser (October 2010-December 2012); Chief Investment Officer, Fixed-Income, of the Sub-Adviser (April 2009-October 2010); Executive Vice President of the Sub-Adviser (October 2009-December 2012); Director of Fixed Income of the Sub-Adviser (January 2009-April 2009); and a Senior Vice President of the Sub-Adviser (March 1993-September 2009). An officer of 103 portfolios in the OppenheimerFunds complex. |
OTHER OFFICERS OF THE FUND | | The addresses of the Officers in the chart below are as follows: for Messrs. Hamilton, Lee, Mss. Lo Bessette, Foxson and Picciotto, 225 Liberty Street, New York, New York 10281-1008, for Mr. Petersen, 6803 S. Tucson Way, Centennial, Colorado 80112-3924. Each Officer serves for an indefinite term or until his or her resignation, retirement, death or removal. |
46 OPPENHEIMER PORTFOLIO SERIES MODERATE INVESTOR FUND
| | |
| |
Mark Hamilton, Vice President (since 2013) Year of Birth: 1965 | | CIO Equities of the Sub-Adviser (since January 2013); Senior Vice President of the Sub-Adviser (since July 2004). Director of International Equities of the Sub-Adviser (since July 2004); Director of Equities of the Sub-Adviser (October 2010-December 2012); Vice President of HarbourView Asset Management Corporation (July 1994-November 2001) and Vice President of the Sub-Adviser (October 1993-July 2004). A portfolio manager and officer of other portfolios in the OppenheimerFunds complex. |
| |
Dokyoung Lee, Vice President (since 2014) Year of Birth: 1965 | | Director of Research, Global Multi-Asset Group (since October 2013) and a Senior Vice President of the Sub-Adviser (since October 2013). Mr. Lee served at Alliance Bernstein L.P. (1994-2013): Director of Research for Strategic Asset Allocation (2011-2013), Director of Research for Blend Strategies (2008-2011), Head of Asia Pacific Blend Strategies (2005-2008), Head of Quantitative Research and Senior Portfolio Manager for Japan Value Equities (2001-2005), Portfolio Manager for Emerging Markets Value Equities (1997-2001), and Quantitative Analyst for US Value Equities (1994-1997). A portfolio manager and officer of other portfolios in the OppenheimerFunds complex. |
| |
Cynthia Lo Bessette, Secretary and Chief Legal Officer (since 2016) Year of Birth: 1969 | | Executive Vice President, General Counsel and Secretary of the Manager (since February 2016); Chief Legal Officer of the Sub-Adviser and the Distributor (since February 2016); Vice President, General Counsel and Secretary of Oppenheimer Acquisition Corp. (since February 2016); General Counsel of OFI SteelPath, Inc., VTL Associates, LLC and Index Management Solutions, LLC (since February 2016); Chief Legal Officer of OFI Global Institutional, Inc., HarbourView Asset Management Corporation, OFI Global Trust Company, Oppenheimer Real Asset Management, Inc., OFI Private Investments Inc., Shareholder Services, Inc. and Trinity Investment Management Corporation (since February 2016); Senior Vice President and Deputy General Counsel (March 2015-February 2016) and Executive Vice President, Vice President, Corporate Counsel (February 2012-March 2015) and Deputy Chief Legal Officer (April 2013-March 2015) of Jennison Associates LLC; Assistant General Counsel (April 2008-September 2009) and Deputy General Counsel (October 2009-February 2012) of Lord Abbett & Co. LLC. An officer of 103 portfolios in the OppenheimerFunds complex. |
| |
Jennifer Foxson, Vice President and Chief Business Officer (since 2014) Year of Birth: 1969 | | Senior Vice President of OppenheimerFunds Distributor, Inc. (since June 2014); Vice President of OppenheimerFunds Distributor, Inc. (April 2006-June 2014); Vice President of the Sub-Adviser (January 1998-March 2006); Assistant Vice President of the Sub-Adviser (October 1991-December 1998). An officer of 103 portfolios in the OppenheimerFunds complex. |
| |
Mary Ann Picciotto, Chief Compliance Officer and Chief Anti-Money Laundering Officer (since 2014) Year of Birth: 1973 | | Senior Vice President and Chief Compliance Officer of the Manager (since March 2014); Chief Compliance Officer of the Sub-Adviser, OFI SteelPath, Inc., OFI Global Trust Company, OFI Global Institutional, Inc., Oppenheimer Real Asset Management, Inc., OFI Private Investments, Inc., Harborview Asset Management Corporation, Trinity Investment Management Corporation, and Shareholder Services, Inc. (since March 2014); Managing Director of Morgan Stanley Investment Management Inc. and certain of its various affiliated entities; Chief Compliance Officer of various Morgan Stanley Funds (May 2010-January 2014); Chief Compliance Officer of Morgan Stanley Investment Management Inc. (April 2007-January 2014). An officer of 103 portfolios in the OppenheimerFunds complex. |
47 OPPENHEIMER PORTFOLIO SERIES MODERATE INVESTOR FUND
TRUSTEES AND OFFICERS Unaudited / Continued
| | |
| |
Brian S. Petersen, Treasurer and Principal Financial & Accounting Officer (since 2016) Year of Birth: 1970 | | Vice President of the Manager (since January 2013); Vice President of the Sub-Adviser (February 2007-December 2012); Assistant Vice President of the Sub-Adviser (August 2002-2007). An officer of 103 portfolios in the OppenheimerFunds complex. |
The Fund’s Statement of Additional Information contains additional information about the Fund’s Trustees and Officers and is available without charge upon request by calling 1.800.CALL OPP (225.5677).
48 OPPENHEIMER PORTFOLIO SERIES MODERATE INVESTOR FUND
OPPENHEIMER PORTFOLIO SERIES MODERATE INVESTOR FUND
| | |
| Manager | | OFI Global Asset Management, Inc. |
| |
| Sub-Adviser | | OppenheimerFunds, Inc. |
| |
| Distributor | | OppenheimerFunds Distributor, Inc. |
| |
Transfer and Shareholder Servicing Agent | | OFI Global Asset Management, Inc. |
| |
| Sub-Transfer Agent | | Shareholder Services, Inc. |
| |
| | DBA OppenheimerFunds Services |
| |
Independent Registered Public Accounting Firm | | KPMG LLP |
| |
| Legal Counsel | | Kramer Levin Naftalis & Frankel LLP |
© 2017 OppenheimerFunds, Inc. All rights reserved.
49 OPPENHEIMER PORTFOLIO SERIES MODERATE INVESTOR FUND
PRIVACY POLICY NOTICE
As an Oppenheimer fund shareholder, you are entitled to know how we protect your personal information and how we limit its disclosure.
Information Sources
We obtain nonpublic personal information about our shareholders from the following sources:
● Applications or other forms
● When you create a user ID and password for online account access
● When you enroll in eDocs Direct,SM our electronic document delivery service
● Your transactions with us, our affiliates or others
● Technologies on our website, including: “cookies” and web beacons, which are used to collect data on the pages you visit and the features you use.
If you visit oppenheimerfunds.com and do not log on to the secure account information areas, we do not obtain any personal information about you. When you do log on to a secure area, we do obtain your user ID and password to identify you. We also use this information to provide you with products and services you have requested, to inform you about products and services that you may be interested in and assist you in other ways.
We do not collect personal information through our website unless you willingly provide it to us, either directly by email or in those areas of the website that request information. In order to update your personal information (including your mailing address, email address and phone number) you must first log on and visit your user profile.
If you have set your browser to warn you before accepting cookies, you will receive the warning message with each cookie. You can refuse cookies by turning them off in your browser. However, doing so may limit your access to certain sections of our website.
We use cookies to help us improve and manage our website. For example, cookies help us recognize new versus repeat visitors to the site, track the pages visited, and enable some special features on the website. This data helps us provide a better service for our website visitors.
Protection of Information
We do not disclose any non-public personal information (such as names on a customer list) about current or former customers to anyone, except as permitted by law.
Disclosure of Information
Copies of confirmations, account statements and other documents reporting activity in your fund accounts are made available to your financial advisor (as designated by you). We may also use details about you and your investments to help us, our financial service affiliates, or firms that jointly market their financial products and services with ours, to better serve your investment needs or suggest educational material that may be of interest to you. If this requires us to provide you with an opportunity to “opt in” or “opt out” of such information sharing with a firm not affiliated with us, you will receive notification on how to do so, before any such sharing takes place.
Right of Refusal
We will not disclose your personal information to unaffiliated third parties (except as permitted by law), unless we first offer you a reasonable opportunity to refuse or “opt out” of such disclosure.
50 OPPENHEIMER PORTFOLIO SERIES MODERATE INVESTOR FUND
Internet Security and Encryption
In general, the email services provided by our website are encrypted and provide a secure and private means of communication with us. To protect your own privacy, confidential and/or personal information should only be communicated via email when you are advised that you are using a secure website. As a security measure, we do not include personal or account information in non-secure emails, and we advise you not to send such information to us in non-secure emails. Instead, you may take advantage of the secure features of our website to encrypt your email correspondence. To do this, you will need to use a browser that supports Secure Sockets Layer (SSL) protocol.
| | |
| ● | | All transactions, including redemptions, exchanges and purchases, are secured by SSL and 256-bit encryption. SSL is used to establish a secure connection between your PC and OppenheimerFunds’ server. It transmits information in an encrypted and scrambled format. |
| ● | | Encryption is achieved through an electronic scrambling technology that uses a “key” to code and then decode the data. Encryption acts like the cable converter box you may have on your television set. It scrambles data with a secret code so that no one can make sense of it while it is being transmitted. When the data reaches its destination, the same software unscrambles the data. |
| ● | | You can exit the secure area by either closing your browser, or for added security, you can use the Log Out button before you close your browser. |
Other Security Measures
We maintain physical, electronic and procedural safeguards to protect your personal account information. Our employees and agents have access to that information only so that they may offer you products or provide services, for example, when responding to your account questions.
How You Can Help
You can also do your part to keep your account information private and to prevent unauthorized transactions. If you obtain a user ID and password for your account, safeguard that information. Also, take special precautions when accessing your account on a computer used by others.
Who We Are
This joint notice describes the privacy policies of the Oppenheimer funds, OppenheimerFunds, Inc., each of its investment adviser subsidiaries, OppenheimerFunds Distributor, Inc. and OFI Global Trust Co. It applies to all Oppenheimer fund accounts you presently have, or may open in the future, using your Social Security number—whether or not you remain a shareholder of our funds. This notice was last updated November 2016. In the event it is updated or changed, we will post an updated notice on our website at oppenheimerfunds.com. If you have any questions about this privacy policy, write to us at P.O. Box 5270, Denver, CO 80217-5270, email us by clicking on the Contact Us section of our website at oppenheimerfunds.com or call us at 1.800.CALL OPP (225.5677).
51 OPPENHEIMER PORTFOLIO SERIES MODERATE INVESTOR FUND
THIS PAGE INTENTIONALLY LEFT BLANK.
52 OPPENHEIMER PORTFOLIO SERIES MODERATE INVESTOR FUND
THIS PAGE INTENTIONALLY LEFT BLANK.
53 OPPENHEIMER PORTFOLIO SERIES MODERATE INVESTOR FUND
THIS PAGE INTENTIONALLY LEFT BLANK.
54 OPPENHEIMER PORTFOLIO SERIES MODERATE INVESTOR FUND
THIS PAGE INTENTIONALLY LEFT BLANK.
55 OPPENHEIMER PORTFOLIO SERIES MODERATE INVESTOR FUND
| | | | |
| | 
Visit us at oppenheimerfunds.com for 24-hr access to account information and transactions or call us at 800.CALL OPP (800.225.5677) for 24-hr automated information and automated transactions. Representatives also available Mon–Fri 8am-8pm ET. | | |
Visit Us oppenheimerfunds.com | | | | |
Call Us 800 225 5677 | | | | |
Follow Us | | | | |
 | | Oppenheimer funds are distributed by OppenheimerFunds Distributor, Inc. 225 Liberty Street, New York, NY 10281-1008 © 2017 OppenheimerFunds Distributor, Inc. All rights reserved. RA0545.001.0117 March 24, 2017 | | |
| | | | | | | | |
| | Annual Report | | | 1/31/2017 | | | |
| | | | | |
| | 
| | | | | | |
| | Oppenheimer Portfolio Series
Active Allocation Fund | | | | | | |
| | | | | | | | |
| | | | | | | | |
| | | | | | | | |
| | | | | | | | |
| | | | | | | | |
| | | | | | | | |
| | | | | | | | |
| | | | | | | | |
Table of Contents
Class A Shares
AVERAGE ANNUAL TOTAL RETURNS AT 1/31/17
| | | | | | | | |
| | | Class A Shares of the Fund | | | | |
| | | Without Sales Charge | | With Sales Charge | | S&P 500 Index | | Bloomberg Barclays U.S. Aggregate Bond Index |
| 1-Year | | 12.50% | | 6.03% | | 20.04% | | 1.45% |
| 5-Year | | 7.87 | | 6.60 | | 14.09 | | 2.09 |
| 10-Year | | 2.61 | | 2.01 | | 6.99 | | 4.37 |
Performance data quoted represents past performance, which does not guarantee future results. The investment return and principal value of an investment in the Fund will fluctuate so that an investor’s shares, when redeemed, may be worth more or less than their original cost. Fund returns include changes in share price, reinvested distributions, and a 5.75% maximum applicable sales charge except where “without sales charge” is indicated. Current performance may be lower or higher than the performance quoted. Returns do not consider capital gains or income taxes on an individual’s investment. For performance data current to the most recent month-end, visit oppenheimerfunds.com or call 1.800.CALL OPP (225.5677). See Fund prospectuses and summary prospectuses for more information on share classes and sales charges.
|
| 2 OPPENHEIMER PORTFOLIO SERIES ACTIVE ALLOCATION FUND |
Fund Performance Discussion1
MARKET OVERVIEW
Markets were volatile this reporting period. Central Bank policy was a major focus this reporting period, with statements and actions from the Federal Reserve (the “Fed”), Bank of Japan (BoJ), European Central Bank (“ECB”), and more, fueling movements in global capital markets. Throughout most of the year, the question of when the Fed would raise interest rates remained. It finally did in the closing month of the reporting period. Improved economic data and outlook led the Fed to hike its policy rates by 0.25% in December, meeting market expectations. The Fed’s policymaking Federal Open Market Committee noted they will continue to be cautious and will hike rates gradually, but posted a modestly optimistic outlook. By year end, markets were pricing for slightly more than two hikes by the end of 2017.
Other major events that created volatility during the year were the United Kingdom’s (“UK”) vote to leave the European Union (commonly referred to as Brexit) and the U.S. Presidential election. After Brexit, U.S. markets became extremely volatile for two days. However, the event came and went with most financial assets rallying strong early in the third quarter.
COMPARISON OF CHANGE IN VALUE OF $10,000 HYPOTHETICAL INVESTMENTS IN:
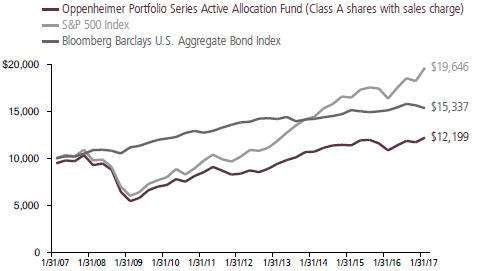
1. The Fund is invested in Class I shares of all underlying funds discussed in this Fund Performance Discussion, except for Oppenheimer Master Loan Fund, LLC and Oppenheimer Master Event-Linked Bond Fund, LLC, which do not offer Class I shares.
|
| 3 OPPENHEIMER PORTFOLIO SERIES ACTIVE ALLOCATION FUND |
Markets turned to general risk on mode after the surprise election of Donald Trump with equities climbing, credit spreads narrowing to the tightest levels since early 2015, and U.S. Treasury yields climbing to levels not experienced since 2014. The dollar rallied strongly against many currencies, particularly after Mr. Trump’s victory.
In this environment, equities generally produced strong results and outperformed fixed-income securities for the overall one-year period.
FUND REVIEW
Against this market backdrop, the Fund’s Class A shares (without sales charge) produced a total return of 12.50%. The Fund employs a combination of sophisticated quantitative tools and qualitative analysis to seek to construct a well-diversified, globally allocated portfolio. The portfolio is allocated among a number of OppenheimerFunds’ actively managed funds according to risk and strategically rebalanced based on market conditions. The Fund has roughly 20% of its assets invested in an “active component” that seeks to take advantage of short-term market conditions, and 80% invested in a “static component.”
At period end, the overall Fund had roughly 79% of its assets invested in equity funds, 15% in fixed income funds and 6% in alternative funds. Broken down by component, the static component had roughly 52% invested in domestic equity, 26.5%
in foreign equity, 17% in fixed-income and 4.5% in alternatives. The active component had roughly 44% invested in domestic equity, 39% in foreign equity, 9% in alternatives and 7% invested in fixed-income.
In an environment that favored equities over fixed-income, the Fund’s diversified allocation resulted in outperformance versus the Bloomberg Barclays U.S. Aggregate Bond Index’s return of 1.45% and underperformance versus the S&P 500 Index’s return of 20.04%.
UNDERLYING INVESTMENTS REVIEW
The strongest contributor to performance for both the active and static components was their exposure to equity funds, with domestic equity funds leading the way. All of the Fund’s domestic equity holdings provided positive returns. Oppenheimer Value Fund was the strongest contributor to performance for both components this reporting period, followed by Oppenheimer Capital Appreciation Fund. Oppenheimer Value Fund typically invests in large company U.S. value stocks. Value stocks outperformed growth stocks for much of the period, and this benefited Oppenheimer Value Fund’s performance. Oppenheimer Capital Appreciation Fund typically invests in large-cap U.S. growth stocks. Effective October 5, 2016, the new Portfolio Manager of this underlying fund is Paul Larson, who joined OppenheimerFunds in 2013 and has 20 years of investment experience. This underlying fund produced positive results. While still remaining a growth fund, the new portfolio
|
| 4 OPPENHEIMER PORTFOLIO SERIES ACTIVE ALLOCATION FUND |
management team has reduced the number of holdings and reduced some previously large sector bets relative to its benchmark, the Russell 1000 Growth Index.
All of the underlying foreign equity funds held by the active and static components produced positive absolute results, with the strongest contributors to performance being Oppenheimer International Equity Fund (named Oppenheimer International Value Fund prior to 12/28/16), Oppenheimer Developing Markets Fund, and Oppenheimer International Growth Fund. Oppenheimer International Equity Fund typically invests in international stocks that its portfolio manager believes are undervalued. This underlying fund favors a blend/core approach, but its emphasis on value stocks this reporting period had a positive impact on performance as value generally outperformed growth for much of the period. Oppenheimer Developing Markets Fund invests in developing market stocks. Developing market stocks performed well in 2016, supported by the bottoming of both oil prices and domestic growth conditions across the emerging markets. Despite performance reversing a bit following the outcome of the U.S. election, the asset class rebounded in January 2017 as the initial negative reaction began to subside. Oppenheimer International Growth Fund invests in a mix of foreign growth stocks. This underlying fund produced positive absolute results during the period, but its performance was held back a degree by its roughly 19% position in the UK at period end, aggravated by weakening pound versus the U.S. dollar.
However, most of its UK-domiciled companies are global businesses with revenues from around the world. Translating those revenues into cheaper pounds should flatter their earnings over time.
In fixed income, domestic fixed income fund Oppenheimer Core Bond Fund was the largest underlying holding for the Fund overall. This underlying fund generated a positive return for both components. Most of the Fund’s exposure to this underlying fund was held through the static component. This underlying fund’s investment team continued to favor diversified corporate and structured credit exposure. However, the team is more cautious on credit in general as it believes we currently reside in the second half of the credit cycle. Other top contributors to performance this period were Oppenheimer Master Loan Fund, LLC and Oppenheimer International Bond Fund, which provided positive results for both components. Oppenheimer Master Loan Fund, LLC invests primarily in senior loans. During the period, loans experienced strong demand due to their attractive income and low interest rate sensitivity. Oppenheimer International Bond Fund typically invests in international fixed income securities in both developed and emerging market countries. This underlying fund invests in three major risk categories, or levers – interest rates (typically government bonds), currencies, and credit (corporate bonds and other fixed-income instruments containing credit risk). All three areas produced positive absolute results.
|
| 5 OPPENHEIMER PORTFOLIO SERIES ACTIVE ALLOCATION FUND |
The strongest performing underlying holdings in alternatives included Oppenheimer Gold & Special Minerals Fund and Oppenheimer Master Event-Linked Bond Fund, LLC. Both components had allocations to Oppenheimer Gold & Special Minerals Fund, while Oppenheimer Master Event-Linked Bond Fund, LLC was held only by the active component. Over the first half of the reporting period, investors flocked to gold bullion and gold stocks as they sought refuge from global economic challenges. Gold stocks reversed
course over the second half of the reporting period as investors’ risk appetites grew and they shifted assets away from traditional safe havens. However, this reversal was not enough to offset the strong results over the first half of the period. Oppenheimer Master Event-Linked Bond Fund, LLC invests in event-linked securities, which transfer a specified set of catastrophe risks like hurricanes, earthquakes and windstorms from a sponsor to investors. Event-linked securities performed positively this reporting period.
| | |
 | | 
Mark Hamilton Portfolio Manager |
| | |
 | | 
Dokyoung Lee, CFA Portfolio Manager |
| | |
 | | 
Caleb Wong Portfolio Manager |
|
| 6 OPPENHEIMER PORTFOLIO SERIES ACTIVE ALLOCATION FUND |
Top Holdings and Allocations
| | | | |
| ASSET CLASS ALLOCATION | | | | |
| Domestic Equity Funds | | | 50.3% | |
| Foreign Equity Funds | | | 29.0 | |
| Domestic Fixed Income Funds | | | 11.4 | |
| Alternative Funds | | | 5.6 | |
| Foreign Fixed Income Funds | | | 3.5 | |
| Money Market Funds | | | 0.2 | |
Portfolio holdings and allocations are subject to change. Percentages are as of January 31, 2017, and are based on the total market value of investments.
| | | | |
| Oppenheimer Value Fund, Cl. I | | | 22.3% | |
| Oppenheimer Capital Appreciation Fund, Cl. I | | | 19.8 | |
| Oppenheimer International Growth Fund, Cl. I | | | 11.2 | |
| Oppenheimer International Equity Fund, Cl. I | | | 9.6 | |
| Oppenheimer Core Bond Fund, Cl. I | | | 6.8 | |
| Oppenheimer Developing Markets Fund, Cl. I | | | 4.5 | |
| Oppenheimer Main Street Small Cap Fund, Cl. I | | | 4.3 | |
| Oppenheimer Main Street Mid Cap Fund, Cl. I | | | 3.9 | |
| Oppenheimer International Small-Mid Company Fund, Cl. I | | | 3.7 | |
| Oppenheimer International Bond Fund, Cl. I | | | 3.5 | |
Portfolio holdings and allocations are subject to change. Percentages are as of January 31, 2017, and are based on net assets. For more current Top 10 Fund holdings, please visit oppenheimerfunds.com.
|
| 7 OPPENHEIMER PORTFOLIO SERIES ACTIVE ALLOCATION FUND |
Share Class Performance
AVERAGE ANNUAL TOTAL RETURNS WITHOUT SALES CHARGE AS OF 1/31/17
| | | | | | | | | | | | | | | | | | | | |
| | | Inception
Date | | | 1-Year | | | 5-Year | | | 10-Year | | | | |
| Class A (OAAAX) | | | 4/5/05 | | | | 12.50 | % | | | 7.87 | % | | | 2.61 | % | | | | |
| Class B (OAABX) | | | 4/5/05 | | | | 11.62 | | | | 7.04 | | | | 2.11 | | | | | |
| Class C (OAACX) | | | 4/5/05 | | | | 11.66 | | | | 7.05 | | | | 1.84 | | | | | |
| Class R (OAANX) | | | 4/5/05 | | | | 12.29 | | | | 7.62 | | | | 2.40 | | | | | |
| Class Y (OAAYX) | | | 4/5/05 | | | | 12.69 | | | | 8.14 | | | | 2.95 | | | | | |
AVERAGE ANNUAL TOTAL RETURNS WITH SALES CHARGE AS OF 1/31/17
| | | | | | | | | | | | | | | | | | | | |
| | | Inception
Date | | | 1-Year | | | 5-Year | | | 10-Year | | | | |
| Class A (OAAAX) | | | 4/5/05 | | | | 6.03 | % | | | 6.60 | % | | | 2.01 | % | | | | |
| Class B (OAABX) | | | 4/5/05 | | | | 6.62 | | | | 6.73 | | | | 2.11 | | | | | |
| Class C (OAACX) | | | 4/5/05 | | | | 10.66 | | | | 7.05 | | | | 1.84 | | | | | |
| Class R (OAANX) | | | 4/5/05 | | | | 12.29 | | | | 7.62 | | | | 2.40 | | | | | |
| Class Y (OAAYX) | | | 4/5/05 | | | | 12.69 | | | | 8.14 | | | | 2.95 | | | | | |
Performance data quoted represents past performance, which does not guarantee future results. The investment return and principal value of an investment in the Fund will fluctuate so that an investor’s shares, when redeemed, may be worth more or less than their original cost. Current performance may be lower or higher than the performance quoted. Returns do not consider capital gains or income taxes on an individual’s investment. For performance data current to the most recent month-end, visit oppenheimerfunds.com or call 1.800. CALL OPP (225.5677). Fund returns include changes in share price, reinvested distributions, and the applicable sales charge: for Class A shares, the current maximum initial sales charge of 5.75%; for Class B shares, the contingent deferred sales charge (“CDSC”) of 5% (1-year) and 2% (5-year); and for Class C shares, the contingent deferred sales charge (“CDSC”) of 1% for the 1-year period. There is no sales charge for Class Y shares. Because Class B shares convert to Class A shares 72 months after purchase, 10-year returns for Class B shares reflect Class A performance for the period after conversion. See Fund prospectuses and summary prospectuses for more information on share classes and sales charges.
The Fund’s performance is compared to the performance of the S&P 500 Index and the Bloomberg Barclays U.S. Aggregate Bond Index. The S&P 500 Index is a capitalization-weighted index of 500 stocks intended to be a representative sample of leading companies in leading industries within the U.S. economy. The Bloomberg Barclays U.S. Aggregate Bond Index is an index of U.S.-dollar-denominated, investment-grade U.S. corporate government and mortgage-backed securities. The indices are unmanaged and cannot be purchased directly by investors. While index comparisons may be useful to provide a benchmark for the Fund’s performance, it must be noted that the Fund’s investments are not limited to the investments comprising the indices. Index performance includes reinvestment of income, but does not reflect transaction costs, fees, expenses or taxes. Index performance is shown for illustrative purposes only as a benchmark for the Fund’s performance, and does not predict or depict
|
| 8 OPPENHEIMER PORTFOLIO SERIES ACTIVE ALLOCATION FUND |
performance of the Fund. The Fund’s performance reflects the effects of the Fund’s business and operating expenses.
The Fund’s investment strategy and focus can change over time. The mention of specific fund holdings does not constitute a recommendation by OppenheimerFunds, Inc. or its affiliates.
Before investing in any of the Oppenheimer funds, investors should carefully consider a fund’s investment objectives, risks, charges and expenses. Fund prospectuses and summary prospectuses contain this and other information about the funds, and may be obtained by asking your financial advisor, visiting oppenheimerfunds.com, or calling 1.800.CALL OPP (225.5677). Read prospectuses and summary prospectuses carefully before investing.
Shares of Oppenheimer funds are not deposits or obligations of any bank, are not guaranteed by any bank, are not insured by the FDIC or any other agency, and involve investment risks, including the possible loss of the principal amount invested.
|
| 9 OPPENHEIMER PORTFOLIO SERIES ACTIVE ALLOCATION FUND |
Fund Expenses
Fund Expenses. As a shareholder of the Fund, you incur two types of costs: (1) transaction costs, which may include sales charges (loads) on purchase payments and/or contingent deferred sales charges on redemptions; and (2) ongoing costs, including management fees; distribution and service fees; and other Fund expenses. These examples are intended to help you understand your ongoing costs (in dollars) of investing in the Fund and to compare these costs with the ongoing costs of investing in other mutual funds.
The examples are based on an investment of $1,000.00 invested at the beginning of the period and held for the entire 6-month period ended January 31, 2017.
Actual Expenses. The first section of the table provides information about actual account values and actual expenses. You may use the information in this section for the class of shares you hold, together with the amount you invested, to estimate the expense that you paid over the period. Simply divide your account value by $1,000.00 (for example, an $8,600.00 account value divided by $1,000.00 = 8.60), then multiply the result by the number in the first section under the heading entitled “Expenses Paid During 6 Months Ended January 31, 2017” to estimate the expenses you paid on your account during this period.
Hypothetical Example for Comparison Purposes. The second section of the table provides information about hypothetical account values and hypothetical expenses based on the Fund’s actual expense ratio for each class of shares, and an assumed rate of return of 5% per year for each class before expenses, which is not the Fund’s actual return. The hypothetical account values and expenses may not be used to estimate the actual ending account balance or expenses you paid for the period. You may use this information to compare the ongoing costs of investing in the Fund and other funds. To do so, compare this 5% hypothetical example for the class of shares you hold with the 5% hypothetical examples that appear in the shareholder reports of the other funds.
Please note that the expenses shown in the table are meant to highlight your ongoing costs only and do not reflect any transactional costs, such as front-end or contingent deferred sales charges (loads). Therefore, the “hypothetical” section of the table is useful in comparing ongoing costs only, and will not help you determine the relative total costs of owning different funds. In addition, if these transactional costs were included, your costs would have been higher.
|
| 10 OPPENHEIMER PORTFOLIO SERIES ACTIVE ALLOCATION FUND |
| | | | | | | | | | | | | | |
| Actual | | Beginning Account Value August 1, 2016 | | | Ending Account Value January 31, 2017 | | | Expenses Paid During 6 Months Ended
January 31, 2017 | | | |
| Class A | | $ | 1,000.00 | | | $ | 1,029.20 | | | $ | 2.86 | | | |
| Class B | | | 1,000.00 | | | | 1,026.10 | | | | 6.74 | | | |
| Class C | | | 1,000.00 | | | | 1,025.50 | | | | 6.69 | | | |
| Class R | | | 1,000.00 | | | | 1,029.30 | | | | 4.14 | | | |
| Class Y | | | 1,000.00 | | | | 1,031.00 | | | | 1.58 | | | |
| | | | |
Hypothetical (5% return before expenses) | | | | | | | | | | | |
| Class A | | | 1,000.00 | | | | 1,022.32 | | | | 2.85 | | | |
| Class B | | | 1,000.00 | | | | 1,018.50 | | | | 6.72 | | | |
| Class C | | | 1,000.00 | | | | 1,018.55 | | | | 6.67 | | | |
| Class R | | | 1,000.00 | | | | 1,021.06 | | | | 4.12 | | | |
| Class Y | | | 1,000.00 | | | | 1,023.58 | | | | 1.58 | | | |
Expenses are equal to the Fund’s annualized expense ratio for that class, multiplied by the average account value over the period, multiplied by 184/366 (to reflect the one-half year period). Those annualized expense ratios, excluding indirect expenses from affiliated funds, based on the 6-month period ended January 31, 2017 are as follows:
| | | | |
| Class | | Expense Ratios | |
| Class A | | | 0.56 | % |
| Class B | | | 1.32 | |
| Class C | | | 1.31 | |
| Class R | | | 0.81 | |
| Class Y | | | 0.31 | |
The expense ratios reflect voluntary and/or contractual waivers and/or reimbursements of expenses by the Fund’s Manager. Some of these undertakings may be modified or terminated at any time, as indicated in the Fund’s prospectus. The “Financial Highlights” tables in the Fund’s financial statements, included in this report, also show the gross expense ratios, without such waivers or reimbursements and reduction to custodian expenses, if applicable.
|
| 11 OPPENHEIMER PORTFOLIO SERIES ACTIVE ALLOCATION FUND |
STATEMENT OF INVESTMENTS January 31, 2017
| | | | | | | | |
| | | Shares | | | Value | |
| Investment Companies—100.0%1 | | | | | | | | |
| Alternative Funds—5.6% | |
| | |
| Oppenheimer Fundamental Alternatives Fund, Cl. I | | | 469,210 | | | $ | 12,856,349 | |
| Oppenheimer Global Multi Strategies Fund, Cl. I | | | 902,596 | | | | 20,859,003 | |
| Oppenheimer Gold & Special Minerals Fund, Cl. I | | | 516,254 | | | | 8,822,782 | |
| Oppenheimer Master Event-Linked Bond Fund, LLC | | | 1,747,468 | | | | 28,159,668 | |
| Oppenheimer Master Inflation Protected Securities Fund, LLC | | | 4,049,833 | | | | 48,393,361 | |
| Oppenheimer Real Estate Fund, Cl. I | | | 565,092 | | | | 14,121,648 | |
| | | | | | | | 133,212,811 | |
| Domestic Equity Funds—50.3% | | | | | | | | |
| | |
| Oppenheimer Capital Appreciation Fund, Cl. I | | | 8,365,070 | | | | 473,713,927 | |
| Oppenheimer Main Street Mid Cap Fund, Cl. I | | | 3,203,148 | | | | 94,492,869 | |
| Oppenheimer Main Street Small Cap Fund, Cl. I | | | 7,253,252 | | | | 103,576,433 | |
| Oppenheimer Value Fund, Cl. I | | | 15,149,620 | | | | 534,933,071 | |
| | | | | | | | 1,206,716,300 | |
| Domestic Fixed Income Funds—11.4% | | | | | | | | |
| | |
| Oppenheimer Core Bond Fund, Cl. I | | | 24,296,326 | | | | 164,243,164 | |
| Oppenheimer Limited-Term Government Fund, Cl. I | | | 15,566,232 | | | | 68,802,743 | |
| Oppenheimer Master Loan Fund, LLC | | | 2,527,665 | | | | 40,981,730 | |
| | | | | | | | 274,027,637 | |
| Foreign Equity Funds—29.0% | | | | | | | | |
| | |
| Oppenheimer Developing Markets Fund, Cl. I | | | 3,205,285 | | | | 107,537,313 | |
| Oppenheimer International Equity Fund, Cl. I | | | 13,027,700 | | | | 229,548,071 | |
| Oppenheimer International Growth Fund, Cl. I | | | 7,535,304 | | | | 267,729,361 | |
| Oppenheimer International Small-Mid Company Fund, Cl. I | | | 2,337,625 | | | | 89,577,802 | |
| | | | | | | | 694,392,547 | |
| Foreign Fixed Income Fund—3.5% | | | | | | | | |
| | |
| Oppenheimer International Bond Fund, Cl. I | | | 14,703,828 | | | | 83,223,668 | |
| Money Market Fund—0.2% | | | | | | | | |
| | |
| Oppenheimer Institutional Government Money Market Fund, Cl. E, 0.49%2 | | | 5,954,028 | | | | 5,954,028 | |
| Total Investments, at Value (Cost $1,904,250,276) | | | 100.0% | | | | 2,397,526,991 | |
| Net Other Assets (Liabilities) | | | 0.0 | | | | 355,175 | |
| Net Assets | | | 100.0% | | | $ | 2,397,882,166 | |
| | | | | | | | |
Footnotes to Statement of Investments
1. Is or was an affiliate, as defined in the Investment Company Act of 1940, as amended, at or during the reporting period, by virtue of the Fund owning at least 5% of the voting securities of the issuer or as a result of the Fund and the issuer having the same investment adviser. Transactions during the reporting period in which the issuer was an affiliate are as follows:
| | | | | | | | | | | | | | | | |
| | | Shares
January 29,
2016a | | | Gross
Additions | | | Gross
Reductions | | | Shares
January 31,
2017 | |
Oppenheimer Capital Appreciation Fund, Cl. I | | | 8,570,672 | | | | 525,097 | | | | 730,699 | | | | 8,365,070 | |
Oppenheimer Commodity Strategy Total Return Fund, Cl. I | | | 4,835,975 | | | | 140,344 | | | | 4,976,319 | b | | | — | |
Oppenheimer Core Bond Fund, Cl. I | | | 25,376,549 | | | | 1,191,048 | | | | 2,271,271 | | | | 24,296,326 | |
Oppenheimer Developing Markets Fund, Cl. I | | | 3,473,295 | | | | 107,476 | | | | 375,486 | | | | 3,205,285 | |
Oppenheimer Fundamental Alternatives Fund, Cl. I | | | — | | | | 503,584 | | | | 34,374 | | | | 469,210 | |
|
| 12 OPPENHEIMER PORTFOLIO SERIES ACTIVE ALLOCATION FUND |
Footnotes to Statement of Investments (Continued)
| | | | | | | | | | | | | | | | |
| | | Shares
January 29,
2016a | | | Gross
Additions | | | Gross
Reductions | | | Shares
January 31,
2017 | |
Oppenheimer Global Multi Strategies Fund, Cl. I | | | 892,220 | | | | 95,769 | | | | 85,393 | | | | 902,596 | |
Oppenheimer Gold & Special Minerals Fund, Cl. I | | | 517,313 | | | | 47,751 | | | | 48,810 | | | | 516,254 | |
Oppenheimer Institutional Government Money Market Fund, Cl. Ec | | | 10,546,451 | | | | 8,858,784 | | | | 13,451,207 | | | | 5,954,028 | |
Oppenheimer International Bond Fund, Cl. I | | | 15,083,603 | | | | 1,050,976 | | | | 1,430,751 | | | | 14,703,828 | |
Oppenheimer International Equity Fund, Cl. Id | | | 13,756,050 | | | | 624,651 | | | | 1,353,001 | | | | 13,027,700 | |
Oppenheimer International Growth Fund, Cl. I | | | 8,030,832 | | | | 295,312 | | | | 790,840 | | | | 7,535,304 | |
Oppenheimer International Small- Mid Company Fund, Cl. I | | | 2,486,072 | | | | 61,395 | | | | 209,842 | | | | 2,337,625 | |
Oppenheimer Limited-Term Government Fund, Cl. I | | | 16,471,843 | | | | 650,272 | | | | 1,555,883 | | | | 15,566,232 | |
Oppenheimer Main Street Mid Cap Fund, Cl. I | | | 3,323,236 | | | | 164,655 | | | | 284,743 | | | | 3,203,148 | |
Oppenheimer Main Street Small Cap Fund, Cl. I | | | 7,757,873 | | | | 199,298 | | | | 703,919 | | | | 7,253,252 | |
Oppenheimer Master Event-Linked Bond Fund, LLC | | | 1,869,222 | | | | 34,636 | | | | 156,390 | | | | 1,747,468 | |
Oppenheimer Master Inflation Protected Securities Fund, LLC | | | 4,361,168 | | | | 89,067 | | | | 400,402 | | | | 4,049,833 | |
Oppenheimer Master Loan Fund, LLC | | | 2,717,120 | | | | 53,946 | | | | 243,401 | | | | 2,527,665 | |
Oppenheimer Real Estate Fund, Cl. I | | | 528,679 | | | | 77,366 | | | | 40,953 | | | | 565,092 | |
Oppenheimer Value Fund, Cl. I | | | 15,944,534 | | | | 628,128 | | | | 1,423,042 | | | | 15,149,620 | |
| | | | | | | | | | | | |
| | | Value | | | Income | | | Realized Gain
(Loss) | |
Oppenheimer Capital Appreciation Fund, Cl. Ie | | $ | 473,713,927 | | | $ | 2,178,769 | | | $ | 12,984,116 | |
Oppenheimer Commodity Strategy Total Return Fund, Cl. I | | | — | | | | 123,593 | | | | (4,937,886) | |
Oppenheimer Core Bond Fund, Cl. I | | | 164,243,164 | | | | 4,720,921 | | | | 2,617,157 | |
Oppenheimer Developing Markets Fund, Cl. I | | | 107,537,313 | | | | 736,895 | | | | 6,021,006 | |
Oppenheimer Fundamental Alternatives Fund, Cl. I | | | 12,856,349 | | | | 93,694 | | | | 5,553 | |
Oppenheimer Global Multi Strategies Fund, Cl. I | | | 20,859,003 | | | | 1,776,991 | | | | 3,172 | |
Oppenheimer Gold & Special Minerals Fund, Cl. I | | | 8,822,782 | | | | 549,160 | | | | 40,598 | |
Oppenheimer Institutional Government Money Market Fund, Cl. Ec | | | 5,954,028 | | | | 31,544 | | | | — | |
Oppenheimer International Bond Fund, Cl. I | | | 83,223,668 | | | | 2,125,020 | | | | 99,650 | |
Oppenheimer International Equity Fund, Cl. Id | | | 229,548,071 | | | | 5,507,414 | | | | 4,603,828 | |
Oppenheimer International Growth Fund, Cl. I | | | 267,729,361 | | | | 4,050,428 | | | | 15,010,783 | |
Oppenheimer International Small-Mid Company Fund, Cl. I | | | 89,577,802 | | | | 528,859 | | | | 3,728,871 | |
Oppenheimer Limited-Term Government Fund, Cl. I | | | 68,802,743 | | | | 1,360,986 | | | | (72,564) | |
Oppenheimer Main Street Mid Cap Fund, Cl. If | | | 94,492,869 | | | | 1,098,500 | | | | 2,355,352 | |
Oppenheimer Main Street Small Cap Fund, Cl. I | | | 103,576,433 | | | | 592,153 | | | | 487,533 | |
Oppenheimer Master Event-Linked Bond Fund, LLC | | | 28,159,668 | | | | 1,666,408 | h | | | (244,782)h | |
|
| 13 OPPENHEIMER PORTFOLIO SERIES ACTIVE ALLOCATION FUND |
STATEMENT OF INVESTMENTS Continued
Footnotes to Statement of Investments (Continued)
| | | | | | | | | | | | |
| | | Value | | | Income | | | Realized Gain
(Loss) | |
Oppenheimer Master Inflation Protected Securities Fund, LLC | | $ | 48,393,361 | | | $ | 982,517i | | | $ | 172,862i | |
Oppenheimer Master Loan Fund, LLC | | | 40,981,730 | | | | 2,501,259j | | | | (717,404) | j |
Oppenheimer Real Estate Fund, Cl. Ig | | | 14,121,648 | | | | 374,447 | | | | 709,943 | |
Oppenheimer Value Fund, Cl. I | | | 534,933,071 | | | | 10,304,116 | | | | 19,747,127 | |
| | | | |
Total | | $ | 2,397,526,991 | | | $ | 41,303,674 | | | $ | 62,614,915 | |
| | | | |
a. Represents the last business day of the Fund’s reporting period.
b. Oppenheimer Commodity Strategy Total Return Fund liquidated effective July 15, 2016.
c. Prior to September 28, 2016, this fund was named Oppenheimer Institutional Money Market Fund.
d. Prior to December 28, 2016, this fund was named Oppenheimer International Value Fund.
e. This fund distributed realized gains of $17,258,287.
f. This fund distributed realized gains of $1,799,609.
g. This fund distributed realized gains of $1,366,542.
h. Represents the amount allocated to the Fund from Oppenheimer Master Event-Linked Bond Fund, LLC.
i. Represents the amount allocated to the Fund from Oppenheimer Master Inflation Protected Securities Fund, LLC.
j. Represents the amount allocated to the Fund from Oppenheimer Master Loan Fund, LLC.
2. Rate shown is the 7-day yield at period end.
See accompanying Notes to Financial Statements.
|
| 14 OPPENHEIMER PORTFOLIO SERIES ACTIVE ALLOCATION FUND |
STATEMENT OF ASSETS AND LIABILITIES January 31, 2017
| | | | |
| |
| Assets | | | | |
| |
| Investments, at value—see accompanying statement of investments—affiliated companies (cost $1,904,250,276) | | $ | 2,397,526,991 | |
| |
| Cash | | | 2,696,367 | |
| |
| Receivables and other assets: | | | | |
| Shares of beneficial interest sold | | | 1,005,540 | |
| Dividends | | | 882,571 | |
| Investments sold | | | 563,246 | |
| Other | | | 132,122 | |
| | | | |
| Total assets | | | 2,402,806,837 | |
| |
| Liabilities | | | | |
| |
| Payables and other liabilities: | | | | |
| Shares of beneficial interest redeemed | | | 3,311,369 | |
| Investments purchased | | | 880,171 | |
| Distribution and service plan fees | | | 494,996 | |
| Trustees’ compensation | | | 191,148 | |
| Shareholder communications | | | 12,454 | |
| Other | | | 34,533 | |
| | | | |
| Total liabilities | | | 4,924,671 | |
| |
Net Assets | | $ | 2,397,882,166 | |
| | | | |
| | | | |
| |
| Composition of Net Assets | | | | |
| |
| Par value of shares of beneficial interest | | $ | 190,005 | |
| |
| Additional paid-in capital | | | 2,270,190,673 | |
| |
| Accumulated net investment income | | | 23,221,709 | |
| |
| Accumulated net realized loss on investments | | | (388,996,936) | |
| |
| Net unrealized appreciation on investments | | | 493,276,715 | |
| | | | |
Net Assets | | $ | 2,397,882,166 | |
| | | | |
|
| 15 OPPENHEIMER PORTFOLIO SERIES ACTIVE ALLOCATION FUND |
STATEMENT OF ASSETS AND LIABILITIES Continued
| | | | |
| |
| Net Asset Value Per Share | | | | |
| |
Class A Shares: | | | | |
| |
| Net asset value and redemption price per share (based on net assets of $1,645,373,332 and 129,722,359 shares of beneficial interest outstanding) | | $ | 12.68 | |
| |
| Maximum offering price per share (net asset value plus sales charge of 5.75% of offering price) | | $ | 13.45 | |
| |
| |
Class B Shares: | | | | |
| |
| Net asset value, redemption price (excludes applicable contingent deferred sales charge) and offering price per share (based on net assets of $43,089,290 and 3,426,204 shares of beneficial interest outstanding) | | $ | 12.58 | |
| |
| |
Class C Shares: | | | | |
| |
| Net asset value, redemption price (excludes applicable contingent deferred sales charge) and offering price per share (based on net assets of $535,567,550 and 43,145,489 shares of beneficial interest outstanding) | | $ | 12.41 | |
| |
| |
Class R Shares: | | | | |
| |
| Net asset value, redemption price (excludes applicable contingent deferred sales charge) and offering price per share (based on net assets of $117,356,228 and 9,302,433 shares of beneficial interest outstanding) | | $ | 12.62 | |
| |
| |
Class Y Shares: | | | | |
| |
| Net asset value, redemption price and offering price per share (based on net assets of $56,495,766 and 4,408,821 shares of beneficial interest outstanding) | | $ | 12.81 | |
See accompanying Notes to Financial Statements.
|
| 16 OPPENHEIMER PORTFOLIO SERIES ACTIVE ALLOCATION FUND |
STATEMENT OF OPERATIONS For the Year Ended January 31, 2017
| | | | |
| |
| Allocation of Income and Expenses from Master Funds1 | | | | |
Net investment income allocated from Oppenheimer Master Event-Linked Bond Fund, LLC: | | | | |
Interest | | $ | 1,664,188 | |
Dividends | | | 2,220 | |
Net expenses | | | (126,869) | |
| | | | |
Net investment income allocated from Oppenheimer Master Event-Linked Bond Fund, LLC | | | 1,539,539 | |
|
| |
Net investment income allocated from Oppenheimer Master Inflation Protected Securities Fund, LLC: | | | | |
Interest | | | 979,951 | |
Dividends | | | 2,566 | |
Net expenses | | | (234,973) | |
| | | | |
Net investment income allocated from Oppenheimer Master Inflation Protected Securities Fund, LLC | | | 747,544 | |
|
| |
Net investment income allocated from Oppenheimer Master Loan Fund, LLC: | | | | |
Interest | | | 2,446,254 | |
Dividends | | | 55,005 | |
Net expenses | | | (142,845) | |
| | | | |
Net investment income allocated from Oppenheimer Master Loan Fund, LLC | | | 2,358,414 | |
|
| |
Total allocation of net investment income from master funds | | | 4,645,497 | |
|
| |
| Investment Income | | | | |
Dividends—affiliated companies | | | 36,153,490 | |
| |
Interest | | | 10,095 | |
| | | | |
Total investment income | | | 36,163,585 | |
|
| |
| Expenses | | | | |
| |
Distribution and service plan fees: | | | | |
Class A | | | 3,949,137 | |
Class B | | | 590,074 | |
Class C | | | 5,324,507 | |
Class R | | | 561,618 | |
| |
Transfer and shareholder servicing agent fees: | | | | |
Class A | | | 3,534,556 | |
Class B | | | 129,978 | |
Class C | | | 1,174,586 | |
Class R | | | 248,184 | |
Class Y | | | 91,497 | |
| |
Shareholder communications: | | | | |
Class A | | | 33,619 | |
Class B | | | 1,883 | |
Class C | | | 9,291 | |
Class R | | | 1,299 | |
Class Y | | | 413 | |
| |
Asset allocation fees | | | 2,354,001 | |
| |
Trustees’ compensation | | | 40,120 | |
| |
Custodian fees and expenses | | | 30,143 | |
| |
Borrowing fees | | | 19,236 | |
| |
Other | | | 89,134 | |
|
| 17 OPPENHEIMER PORTFOLIO SERIES ACTIVE ALLOCATION FUND |
STATEMENT OF OPERATIONS Continued
| | | | |
| |
| Expenses (Continued) | | | | |
| |
Total expenses | | $ | 18,183,276 | |
Less waivers and reimbursements of expenses | | | (941,600) | |
| | | | |
Net expenses | | | 17,241,676 | |
|
| |
Net Investment Income | | | 23,567,406 | |
| |
| Realized and Unrealized Gain (Loss) | | | | |
Net realized gain on: | | | | |
Investments transactions from affiliated companies | | | 63,404,239 | |
Distributions received from affiliate companies | | | 20,424,438 | |
| |
Net realized gain (loss) allocated from: | | | | |
Oppenheimer Master Event-Linked Bond Fund, LLC | | | (244,782) | |
Oppenheimer Master Inflation Protected Securities Fund, LLC | | | 172,862 | |
Oppenheimer Master Loan Fund, LLC | | | (717,404) | |
| | | | |
Net realized gain | | | 83,039,353 | |
| |
Net change in unrealized appreciation/depreciation on investments | | | 159,939,996 | |
| |
Net change in unrealized appreciation/depreciation allocated from: | | | | |
Oppenheimer Master Event-Linked Bond Fund, LLC | | | 648,607 | |
Oppenheimer Master Inflation Protected Securities Fund, LLC | | | 852,831 | |
Oppenheimer Master Loan Fund, LLC | | | 3,873,935 | |
| | | | |
Net change in unrealized appreciation/depreciation | | | 165,315,369 | |
|
| |
Net Increase in Net Assets Resulting from Operations | | $ | 271,922,128 | |
| | | | |
1. The Fund invests in certain affiliated mutual funds that expect to be treated as partnerships for tax purposes. See Note 4 of the accompanying Notes.
See accompanying Notes to Financial Statements.
|
| 18 OPPENHEIMER PORTFOLIO SERIES ACTIVE ALLOCATION FUND |
STATEMENTS OF CHANGES IN NET ASSETS
| | | | | | | | |
| | | Year Ended
January 31, 2017 | | | Year Ended
January 29, 20161 | |
| |
| Operations | | | | | | | | |
Net investment income | | $ | 23,567,406 | | | $ | 12,994,343 | |
| |
Net realized gain | | | 83,039,353 | | | | 144,666,635 | |
| |
Net change in unrealized appreciation/depreciation | | | 165,315,369 | | | | (273,334,419) | |
| | | | |
Net increase (decrease) in net assets resulting from operations | | | 271,922,128 | | | | (115,673,441) | |
| |
| Dividends and/or Distributions to Shareholders | | | | | | | | |
Dividends from net investment income: | | | | | | | | |
Class A | | | (15,571,834) | | | | (24,157,580) | |
Class B | | | — | | | | (402,652) | |
Class C | | | (1,236,925) | | | | (4,319,415) | |
Class R | | | (817,761) | | | | (1,430,086) | |
Class Y | | | (668,587) | | | | (719,558) | |
| | | | |
| | | (18,295,107) | | | | (31,029,291) | |
| |
| Beneficial Interest Transactions | | | | | | | | |
Net increase (decrease) in net assets resulting from beneficial interest transactions: | | | | | | | | |
Class A | | | (57,983,628) | | | | 30,490,812 | |
Class B | | | (42,745,371) | | | | (51,809,163) | |
Class C | | | (44,157,244) | | | | (1,614,041) | |
Class R | | | (3,558,847) | | | | (4,219,523) | |
Class Y | | | 13,332,099 | | | | 11,029,081 | |
| | | | |
| | | (135,112,991) | | | | (16,122,834) | |
| |
| Net Assets | | | | | | | | |
Total increase (decrease) | | | 118,514,030 | | | | (162,825,566) | |
| |
Beginning of period | | | 2,279,368,136 | | | | 2,442,193,702 | |
| | | | |
| End of period (including accumulated net investment income of $23,221,709 and $17,086,165, respectively) | | $ | 2,397,882,166 | | | $ | 2,279,368,136 | |
| | | | |
1. Represents the last business day of the Fund’s reporting period.
See accompanying Notes to Financial Statements.
|
| 19 OPPENHEIMER PORTFOLIO SERIES ACTIVE ALLOCATION FUND |
FINANCIAL HIGHLIGHTS
| | | | | | | | | | | | | | | | | | | | |
| Class A | | Year Ended
January 31,
2017 | | | Year Ended
January 29,
20161 | | | Year Ended
January 30,
20151 | | | Year Ended
January 31,
2014 | | | Year Ended
January 31,
2013 | |
| |
| Per Share Operating Data | | | | | | | | | | | | | | | | | | | | |
| Net asset value, beginning of period | | | $11.38 | | | | $12.12 | | | | $11.52 | | | | $10.27 | | | | $9.25 | |
| |
| Income (loss) from investment operations: | | | | | | | | | | | | | | | | | | | | |
| Net investment income2 | | | 0.15 | | | | 0.09 | | | | 0.11 | | | | 0.13 | | | | 0.15 | |
| Net realized and unrealized gain (loss) | | | 1.27 | | | | (0.65) | | | | 0.61 | | | | 1.28 | | | | 1.02 | |
| | | | |
| Total from investment operations | | | 1.42 | | | | (0.56) | | | | 0.72 | | | | 1.41 | | | | 1.17 | |
| |
| Dividends and/or distributions to shareholders: | | | | | | | | | | | | | | | | | | | | |
| Dividends from net investment income | | | (0.12) | | | | (0.18) | | | | (0.12) | | | | (0.16) | | | | (0.15) | |
| |
| Net asset value, end of period | | | $12.68 | | | | $11.38 | | | | $12.12 | | | | $11.52 | | | | $10.27 | |
| | | | |
|
| |
| Total Return, at Net Asset Value3 | | | 12.50% | | | | (4.67)% | | | | 6.26% | | | | 13.73% | | | | 12.67% | |
|
| |
| Ratios/Supplemental Data | | | | | | | | | | | | | | | | | | | | |
| Net assets, end of period (in thousands) | | | $1,645,373 | | | | $1,530,527 | | | | $1,599,618 | | | | $1,496,909 | | | | $1,308,798 | |
| |
| Average net assets (in thousands) | | | $1,606,586 | | | | $1,646,634 | | | | $1,591,772 | | | | $1,416,982 | | | | $1,153,465 | |
| |
| Ratios to average net assets:4,5 | | | | | | | | | | | | | | | | | | | | |
| Net investment income | | | 1.20% | | | | 0.74% | | | | 0.93% | | | | 1.14% | | | | 1.56% | |
| Expenses excluding specific expenses listed below | | | 0.60% | | | | 0.59% | | | | 0.59% | | | | 0.59% | | | | 0.56% | |
| Interest and fees from borrowings | | | 0.00%6 | | | | 0.00%6 | | | | 0.00% | | | | 0.00% | | | | 0.00% | |
| | | | |
| Total expenses7 | | | 0.60% | | | | 0.59% | | | | 0.59% | | | | 0.59% | | | | 0.56% | |
| Expenses after payments, waivers and/or reimbursements and reduction to custodian expenses | | | 0.56% | | | | 0.55% | | | | 0.55% | | | | 0.54% | | | | 0.52% | |
| |
| Portfolio turnover rate | | | 5% | | | | 8% | | | | 15% | | | | 9% | | | | 28%8 | |
1. Represents the last business day of the Fund’s reporting period.
2. Per share amounts calculated based on the average shares outstanding during the period.
3. Assumes an initial investment on the business day before the first day of the fiscal period, with all dividends and distributions reinvested in additional shares on the reinvestment date, and redemption at the net asset value calculated on the last business day of the fiscal period. Sales charges are not reflected in the total returns. Total returns are not annualized for periods less than one full year. Returns do not reflect the deduction of taxes that a shareholder would pay on fund distributions or the redemption of fund shares.
4. Annualized for periods less than one full year.
5. Includes the Fund’s share of the allocated expenses and/or net investment income from the master funds.
6. Less than 0.005%.
7. Total expenses including indirect expenses from affiliated fund fees and expenses were as follows:
| | | | | | |
| | | | | | |
| Year Ended January 31, 2017 | | | 1.23 | % | |
| Year Ended January 29, 2016 | | | 1.21 | % | |
| Year Ended January 30, 2015 | | | 1.21 | % | |
| Year Ended January 31, 2014 | | | 1.26 | % | |
| Year Ended January 31, 2013 | | | 1.24 | % | |
8. The portfolio turnover rate excludes purchase and sale transactions of To Be Announced (TBA) mortgage-related securities as follows:
| | | | | | | | |
| | | Purchase Transactions | | | Sale Transactions | |
Year Ended January 31, 2013 | | | $113,842,157 | | | | $114,874,878 | |
See accompanying Notes to Financial Statements.
|
| 20 OPPENHEIMER PORTFOLIO SERIES ACTIVE ALLOCATION FUND |
| | | | | | | | | | | | | | | | | | | | |
| Class B | | Year Ended
January 31,
2017 | | | Year Ended
January 29,
20161 | | | Year Ended
January 30,
20151 | | | Year Ended
January 31,
2014 | | | Year Ended
January 31,
2013 | |
| |
| Per Share Operating Data | | | | | | | | | | | | | | | | | | | | |
| Net asset value, beginning of period | | | $11.27 | | | | $11.96 | | | | $11.34 | | | | $10.10 | | | | $9.09 | |
| |
| Income (loss) from investment operations: | | | | | | | | | | | | | | | | | | | | |
| Net investment income (loss)2 | | | 0.04 | | | | (0.01) | | | | 0.01 | | | | 0.01 | | | | 0.06 | |
| Net realized and unrealized gain (loss) | | | 1.27 | | | | (0.62) | | | | 0.61 | | | | 1.29 | | | | 1.00 | |
| | | | |
| Total from investment operations | | | 1.31 | | | | (0.63) | | | | 0.62 | | | | 1.30 | | | | 1.06 | |
| |
| Dividends and/or distributions to shareholders: | | | | | | | | | | | | | | | | | | | | |
| Dividends from net investment income | | | 0.00 | | | | (0.06) | | | | 0.00 | | | | (0.06) | | | | (0.05) | |
| |
| Net asset value, end of period | | | $12.58 | | | | $11.27 | | | | $11.96 | | | | $11.34 | | | | $10.10 | |
| | | | |
|
| |
| Total Return, at Net Asset Value3 | | | 11.62% | | | �� | (5.33)% | | | | 5.48% | | | | 12.83% | | | | 11.73% | |
|
| |
| Ratios/Supplemental Data | | | | | | | | | | | | | | | | | | | | |
| Net assets, end of period (in thousands) | | | $43,089 | | | | $79,042 | | | | $134,496 | | | | $197,214 | | | | $249,959 | |
| |
| Average net assets (in thousands) | | | $58,930 | | | | $106,583 | | | | $166,076 | | | | $220,028 | | | | $259,073 | |
| |
| Ratios to average net assets:4,5 | | | | | | | | | | | | | | | | | | | | |
| Net investment income (loss) | | | 0.30% | | | | (0.08)% | | | | 0.11% | | | | 0.14% | | | | 0.61% | |
| Expenses excluding specific expenses listed below | | | 1.35% | | | | 1.35% | | | | 1.34% | | | | 1.37% | | | | 1.40% | |
| Interest and fees from borrowings | | | 0.00%6 | | | | 0.00%6 | | | | 0.00% | | | | 0.00% | | | | 0.00% | |
| | | | |
| Total expenses7 | | | 1.35% | | | | 1.35% | | | | 1.34% | | | | 1.37% | | | | 1.40% | |
| Expenses after payments, waivers and/or reimbursements and reduction to custodian expenses | | | 1.31% | | | | 1.31% | | | | 1.30% | | | | 1.32% | | | | 1.36% | |
| |
| Portfolio turnover rate | | | 5% | | | | 8% | | | | 15% | | | | 9% | | | | 28%8 | |
1. Represents the last business day of the Fund’s reporting period.
2. Per share amounts calculated based on the average shares outstanding during the period.
3. Assumes an initial investment on the business day before the first day of the fiscal period, with all dividends and distributions reinvested in additional shares on the reinvestment date, and redemption at the net asset value calculated on the last business day of the fiscal period. Sales charges are not reflected in the total returns. Total returns are not annualized for periods less than one full year. Returns do not reflect the deduction of taxes that a shareholder would pay on fund distributions or the redemption of fund shares.
4. Annualized for periods less than one full year.
5. Includes the Fund’s share of the allocated expenses and/or net investment income from the master funds.
6. Less than 0.005%.
7. Total expenses including indirect expenses from affiliated fund fees and expenses were as follows:
| | | | | | |
| | | | | | |
| Year Ended January 31, 2017 | | | 1.98 | % | |
| Year Ended January 29, 2016 | | | 1.97 | % | |
| Year Ended January 30, 2015 | | | 1.96 | % | |
| Year Ended January 31, 2014 | | | 2.04 | % | |
| Year Ended January 31, 2013 | | | 2.08 | % | |
8. The portfolio turnover rate excludes purchase and sale transactions of To Be Announced (TBA) mortgage-related securities as follows:
| | | | | | | | | | | | |
| | | Purchase Transactions | | | | | | Sale Transactions | |
Year Ended January 31, 2013 | | $ | 113,842,157 | | | | | | | $ | 114,874,878 | |
See accompanying Notes to Financial Statements.
|
| 21 OPPENHEIMER PORTFOLIO SERIES ACTIVE ALLOCATION FUND |
FINANCIALHIGHLIGHTS Continued
| | | | | | | | | | | | | | | | | | | | |
| Class C | | Year Ended
January 31,
2017 | | | Year Ended
January 29,
20161 | | | Year Ended
January 30,
20151 | | | Year Ended
January 31,
2014 | | | Year Ended
January 31,
2013 | |
| |
| Per Share Operating Data | | | | | | | | | | | | | | | | | | | | |
| Net asset value, beginning of period | | | $11.14 | | | | $11.87 | | | | $11.28 | | | | $10.06 | | | | $9.08 | |
| |
| Income (loss) from investment operations: | | | | | | | | | | | | | | | | | | | | |
| Net investment income2 | | | 0.05 | | | | 0.003 | | | | 0.02 | | | | 0.04 | | | | 0.08 | |
| Net realized and unrealized gain (loss) | | | 1.25 | | | | (0.64) | | | | 0.60 | | | | 1.26 | | | | 0.98 | |
| | | | |
| Total from investment operations | | | 1.30 | | | | (0.64) | | | | 0.62 | | | | 1.30 | | | | 1.06 | |
| |
| Dividends and/or distributions to shareholders: | | | | | | | | | | | | | | | | | | | | |
| Dividends from net investment income | | | (0.03) | | | | (0.09) | | | | (0.03) | | | | (0.08) | | | | (0.08) | |
| |
| Net asset value, end of period | | | $12.41 | | | | $11.14 | | | | $11.87 | | | | $11.28 | | | | $10.06 | |
| | | | |
| |
| Total Return, at Net Asset Value4 | | | 11.66% | | | | (5.41)% | | | | 5.53% | | | | 12.93% | | | | 11.70% | |
| |
| Ratios/Supplemental Data | | | | | | | | | | | | | | | | | | | | |
| Net assets, end of period (in thousands) | | | $535,568 | | | | $522,227 | | | | $557,576 | | | | $535,716 | | | | $492,455 | |
| |
| Average net assets (in thousands) | | | $533,800 | | | | $564,178 | | | | $562,221 | | | | $518,457 | | | | $445,399 | |
| |
| Ratios to average net assets:5,6 | | | | | | | | | | | | | | | | | | | | |
| Net investment income (loss) | | | 0.44% | | | | (0.01)% | | | | 0.18% | | | | 0.35% | | | | 0.79% | |
| Expenses excluding specific expenses listed below | | | 1.35% | | | | 1.34% | | | | 1.34% | | | | 1.33% | | | | 1.30% | |
| Interest and fees from borrowings | | | 0.00%7 | | | | 0.00%7 | | | | 0.00% | | | | 0.00% | | | | 0.00% | |
| | | | |
| Total expenses8 | | | 1.35% | | | | 1.34% | | | | 1.34% | | | | 1.33% | | | | 1.30% | |
| Expenses after payments, waivers and/or reimbursements and reduction to custodian expenses | | | 1.31% | | | | 1.30% | | | | 1.30% | | | | 1.28% | | | | 1.26% | |
| |
| Portfolio turnover rate | | | 5% | | | | 8% | | | | 15% | | | | 9% | | | | 28%9 | |
1. Represents the last business day of the Fund’s reporting period.
2. Per share amounts calculated based on the average shares outstanding during the period.
3. Less than $0.005 per share.
4. Assumes an initial investment on the business day before the first day of the fiscal period, with all dividends and distributions reinvested in additional shares on the reinvestment date, and redemption at the net asset value calculated on the last business day of the fiscal period. Sales charges are not reflected in the total returns. Total returns are not annualized for periods less than one full year. Returns do not reflect the deduction of taxes that a shareholder would pay on fund distributions or the redemption of fund shares.
5. Annualized for periods less than one full year.
6. Includes the Fund’s share of the allocated expenses and/or net investment income from the master funds.
7. Less than 0.005%.
8. Total expenses including indirect expenses from affiliated fund fees and expenses were as follows:
| | | | | | |
| | | | | | |
| Year Ended January 31, 2017 | | | 1.98 | % | |
| Year Ended January 29, 2016 | | | 1.96 | % | |
| Year Ended January 30, 2015 | | | 1.96 | % | |
| Year Ended January 31, 2014 | | | 2.00 | % | |
| Year Ended January 31, 2013 | | | 1.98 | % | |
9. The portfolio turnover rate excludes purchase and sale transactions of To Be Announced (TBA) mortgage-related securities as follows:
| | | | | | | | | | | | |
| | | Purchase Transactions | | | | | | Sale Transactions | |
Year Ended January 31, 2013 | | | $113,842,157 | | | | | | | | $114,874,878 | |
See accompanying Notes to Financial Statements.
|
| 22 OPPENHEIMER PORTFOLIO SERIES ACTIVE ALLOCATION FUND |
| | | | | | | | | | | | | | | | | | | | |
| Class R | | Year Ended
January 31,
2017 | | | Year Ended
January 29,
20161 | | | Year Ended
January 30,
20151 | | | Year Ended
January 31,
2014 | | | Year Ended
January 31,
2013 | |
| |
| Per Share Operating Data | | | | | | | | | | | | | | | | | | | | |
| Net asset value, beginning of period | | | $11.32 | | | | $12.05 | | | | $11.45 | | | | $10.21 | | | | $9.20 | |
| |
| Income (loss) from investment operations: | | | | | | | | | | | | | | | | | | | | |
| Net investment income2 | | | 0.11 | | | | 0.06 | | | | 0.08 | | | | 0.09 | | | | 0.13 | |
| Net realized and unrealized gain (loss) | | | 1.28 | | | | (0.64) | | | | 0.61 | | | | 1.28 | | | | 1.01 | |
| | | | |
| Total from investment operations | | | 1.39 | | | | (0.58) | | | | 0.69 | | | | 1.37 | | | | 1.14 | |
| |
| Dividends and/or distributions to shareholders: | | | | | | | | | | | | | | | | | | | | |
| Dividends from net investment income | | | (0.09) | | | | (0.15) | | | | (0.09) | | | | (0.13) | | | | (0.13) | |
| |
| Net asset value, end of period | | | $12.62 | | | | $11.32 | | | | $12.05 | | | | $11.45 | | | | $10.21 | |
| | | | |
|
| |
| Total Return, at Net Asset Value3 | | | 12.29% | | | | (4.88)% | | | | 5.99% | | | | 13.42% | | | | 12.42% | |
|
| |
| Ratios/Supplemental Data | | | | | | | | | | | | | | | | | | | | |
| Net assets, end of period (in thousands) | | | $117,356 | | | | $108,810 | | | | $119,953 | | | | $128,012 | | | | $138,042 | |
| |
| Average net assets (in thousands) | | | $112,804 | | | | $120,320 | | | | $127,487 | | | | $133,527 | | | | $122,558 | |
| |
| Ratios to average net assets:4,5 | | | | | | | | | | | | | | | | | | | | |
| Net investment income | | | 0.94% | | | | 0.50% | | | | 0.66% | | | | 0.78% | | | | 1.37% | |
| Expenses excluding specific expenses listed below | | | 0.85% | | | | 0.84% | | | | 0.84% | | | | 0.81% | | | | 0.77% | |
| Interest and fees from borrowings | | | 0.00%6 | | | | 0.00%6 | | | | 0.00% | | | | 0.00% | | | | 0.00% | |
| | | | |
| Total expenses7 | | | 0.85% | | | | 0.84% | | | | 0.84% | | | | 0.81% | | | | 0.77% | |
| Expenses after payments, waivers and/or reimbursements and reduction to custodian expenses | | | 0.81% | | | | 0.80% | | | | 0.80% | | | | 0.76% | | | | 0.73% | |
| |
| Portfolio turnover rate | | | 5% | | | | 8% | | | | 15% | | | | 9% | | | | 28%8 | |
1. Represents the last business day of the Fund’s reporting period.
2. Per share amounts calculated based on the average shares outstanding during the period.
3. Assumes an initial investment on the business day before the first day of the fiscal period, with all dividends and distributions reinvested in additional shares on the reinvestment date, and redemption at the net asset value calculated on the last business day of the fiscal period. Sales charges are not reflected in the total returns. Total returns are not annualized for periods less than one full year. Returns do not reflect the deduction of taxes that a shareholder would pay on fund distributions or the redemption of fund shares.
4. Annualized for periods less than one full year.
5. Includes the Fund’s share of the allocated expenses and/or net investment income from the master funds.
6. Less than 0.005%.
7. Total expenses including indirect expenses from affiliated fund fees and expenses were as follows:
| | | | | | |
| | | | | | |
| Year Ended January 31, 2017 | | | 1.48 | % | |
| Year Ended January 29, 2016 | | | 1.46 | % | |
| Year Ended January 30, 2015 | | | 1.46 | % | |
| Year Ended January 31, 2014 | | | 1.48 | % | |
| Year Ended January 31, 2013 | | | 1.45 | % | |
8. The portfolio turnover rate excludes purchase and sale transactions of To Be Announced (TBA) mortgage-related securities as follows:
| | | | | | | | | | | | |
| | | Purchase Transactions | | | | | | Sale Transactions | |
Year Ended January 31, 2013 | | $ | 113,842,157 | | | | | | | $ | 114,874,878 | |
See accompanying Notes to Financial Statements.
|
| 23 OPPENHEIMER PORTFOLIO SERIES ACTIVE ALLOCATION FUND |
FINANCIALHIGHLIGHTS Continued
| | | | | | | | | | | | | | | | | | | | |
| Class Y | | Year Ended
January 31,
2017 | | | Year Ended
January 29,
20161 | | | Year Ended
January 30,
20151 | | | Year Ended
January 31,
2014 | | | Year Ended
January 31,
2013 | |
| |
| Per Share Operating Data | | | | | | | | | | | | | | | | | | | | |
| Net asset value, beginning of period | | | $11.51 | | | | $12.25 | | | | $11.65 | | | | $10.38 | | | | $9.35 | |
| |
| Income (loss) from investment operations: | | | | | | | | | | | | | | | | | | | | |
| Net investment income2 | | | 0.20 | | | | 0.14 | | | | 0.17 | | | | 0.17 | | | | 0.16 | |
| Net realized and unrealized gain (loss) | | | 1.26 | | | | (0.66) | | | | 0.59 | | | | 1.30 | | | | 1.04 | |
| | | | |
| Total from investment operations | | | 1.46 | | | | (0.52) | | | | 0.76 | | | | 1.47 | | | | 1.20 | |
| |
| Dividends and/or distributions to shareholders: | | | | | | | | | | | | | | | | | | | | |
| Dividends from net investment income | | | (0.16) | | | | (0.22) | | | | (0.16) | | | | (0.20) | | | | (0.17) | |
| |
| Net asset value, end of period | | | $12.81 | | | | $11.51 | | | | $12.25 | | | | $11.65 | | | | $10.38 | |
| | | | |
|
| |
| Total Return, at Net Asset Value3 | | | 12.69% | | | | (4.34)% | | | | 6.52% | | | | 14.07% | | | | 12.92% | |
|
| |
| Ratios/Supplemental Data | | | | | | | | | | | | | | | | | | | | |
| Net assets, end of period (in thousands) | | | $56,496 | | | | $38,762 | | | | $30,551 | | | | $9,416 | | | | $7,830 | |
| |
| Average net assets (in thousands) | | | $41,675 | | | | $33,137 | | | | $17,424 | | | | $8,437 | | | | $11,661 | |
| |
| Ratios to average net assets:4,5 | | | | | | | | | | | | | | | | | | | | |
| Net investment income | | | 1.65% | | | | 1.14% | | | | 1.35% | | | | 1.48% | | | | 1.69% | |
| Expenses excluding specific expenses listed below | | | 0.35% | | | | 0.35% | | | | 0.35% | | | | 0.30% | | | | 0.21% | |
| Interest and fees from borrowings | | | 0.00%6 | | | | 0.00%6 | | | | 0.00% | | | | 0.00% | | | | 0.00% | |
| | | | |
| Total expenses7 | | | 0.35% | | | | 0.35% | | | | 0.35% | | | | 0.30% | | | | 0.21% | |
| Expenses after payments, waivers and/or reimbursements and reduction to custodian expenses | | | 0.31% | | | | 0.31% | | | | 0.31% | | | | 0.25% | | | | 0.17% | |
| |
| Portfolio turnover rate | | | 5% | | | | 8% | | | | 15% | | | | 9% | | | | 28%8 | |
1. Represents the last business day of the Fund’s reporting period.
2. Per share amounts calculated based on the average shares outstanding during the period.
3. Assumes an initial investment on the business day before the first day of the fiscal period, with all dividends and distributions reinvested in additional shares on the reinvestment date, and redemption at the net asset value calculated on the last business day of the fiscal period. Sales charges are not reflected in the total returns. Total returns are not annualized for periods less than one full year. Returns do not reflect the deduction of taxes that a shareholder would pay on fund distributions or the redemption of fund shares.
4. Annualized for periods less than one full year.
5. Includes the Fund’s share of the allocated expenses and/or net investment income from the master funds.
6. Less than 0.005%.
7. Total expenses including indirect expenses from affiliated fund fees and expenses were as follows:
| | | | | | |
| | | | | | |
| Year Ended January 31, 2017 | | | 0.98 | % | |
| Year Ended January 29, 2016 | | | 0.97 | % | |
| Year Ended January 30, 2015 | | | 0.97 | % | |
| Year Ended January 31, 2014 | | | 0.97 | % | |
| Year Ended January 31, 2013 | | | 0.89 | % | |
8. The portfolio turnover rate excludes purchase and sale transactions of To Be Announced (TBA) mortgage-related securities as follows:
| | | | | | | | | | | | |
| | | Purchase Transactions | | | | | | Sale Transactions | |
Year Ended January 31, 2013 | | | $113,842,157 | | | | | | | | $114,874,878 | |
See accompanying Notes to Financial Statements
|
| 24 OPPENHEIMER PORTFOLIO SERIES ACTIVE ALLOCATION FUND |
NOTES TO FINANCIAL STATEMENTS January 31, 2017
1. Organization
Oppenheimer Portfolio Series (the “Trust”) is registered under the Investment Company Act of 1940, as amended, as a diversified open-end management investment company. Active Allocation Fund (the “Fund”) is a series of the Trust whose investment objective is to seek total return. The Fund normally invests in a diversified portfolio of Oppenheimer mutual funds (individually, an “Underlying Fund” and collectively, the “Underlying Funds”). The Fund’s investment adviser is OFI Global Asset Management, Inc. (“OFI Global” or the “Manager”), a wholly-owned subsidiary of OppenheimerFunds, Inc. (“OFI” or the “Sub-Adviser”). The Manager has entered into a sub-advisory agreement with OFI.
The Fund offers Class A, Class C, Class R and Class Y shares, and previously offered Class B shares for new purchase through June 29, 2012. Subsequent to that date, no new purchases of Class B shares are permitted, however reinvestment of dividend and/or capital gain distributions and exchanges of Class B shares into and from other Oppenheimer funds are allowed. As of July 1, 2014, Class N shares were renamed Class R shares. Class N shares subject to a CDSC on July 1, 2014, will continue to be subject to a CDSC after the shares are renamed. Purchases of Class R shares occurring on or after July 1, 2014, will not be subject to a CDSC upon redemption. Class A shares are sold at their offering price, which is normally net asset value plus a front-end sales charge. Class C and Class R shares are sold, and Class B shares were sold, without a front-end sales charge but may be subject to a contingent deferred sales charge (“CDSC”). Class R shares are sold only through retirement plans. Retirement plans that offer Class R shares may impose charges on those accounts. Class Y shares are sold to certain institutional investors or intermediaries without either a front-end sales charge or a CDSC, however, the intermediaries may impose charges on their accountholders who beneficially own Class Y shares. All classes of shares have identical rights and voting privileges with respect to the Fund in general and exclusive voting rights on matters that affect that class alone. Earnings, net assets and net asset value per share may differ due to each class having its own expenses, such as transfer and shareholder servicing agent fees and shareholder communications, directly attributable to that class. Class A, B, C and R shares have separate distribution and/or service plans under which they pay fees. Class Y shares do not pay such fees. Class B shares will automatically convert to Class A shares 72 months after the date of purchase.
The following is a summary of significant accounting policies followed in the Fund’s preparation of financial statements in accordance with accounting principles generally accepted in the United States (“U.S. GAAP”).
2. Significant Accounting Policies
Security Valuation. All investments in securities are recorded at their estimated fair value, as described in Note 3.
Allocation of Income, Expenses, Gains and Losses. Income, expenses (other than those attributable to a specific class), gains and losses are allocated on a daily basis to each class of shares based upon the relative proportion of net assets represented by such class. Operating
|
| 25 OPPENHEIMER PORTFOLIO SERIES ACTIVE ALLOCATION FUND |
NOTES TO FINANCIAL STATEMENTS Continued
2. Significant Accounting Policies (Continued)
expenses directly attributable to a specific class are charged against the operations of that class.
Dividends and Distributions to Shareholders. Dividends and distributions to shareholders, which are determined in accordance with income tax regulations and may differ from U.S. GAAP, are recorded on the ex-dividend date. Income and capital gain distributions, if any, are declared and paid annually or at other times as deemed necessary by the Manager.
Investment Income. Dividend distributions received from the Underlying Funds are recorded on the ex-dividend date. Upon receipt of notification from an Underlying Fund, and subsequent to the ex-dividend date, some of the dividend income originally recorded by the Fund may be reclassified as a tax return of capital by reducing the cost basis of the Underlying Fund and/or increasing the realized gain on sales of investments in the Underlying Fund.
Custodian Fees. “Custodian fees and expenses” in the Statement of Operations may include interest expense incurred by the Fund on any cash overdrafts of its custodian account during the period. Such cash overdrafts may result from the effects of failed trades in portfolio securities and from cash outflows resulting from unanticipated shareholder redemption activity. The Fund pays interest to its custodian on such cash overdraft at a rate equal to the Prime Rate plus 0.35%. The “Reduction to custodian expenses” line item, if applicable, represents earnings on cash balances maintained by the Fund during the period. Such interest expense and other custodian fees may be paid with these earnings.
Security Transactions. Security transactions are recorded on the trade date. Realized gains and losses on securities sold are determined on the basis of identified cost.
Indemnifications. The Fund’s organizational documents provide current and former Trustees and officers with a limited indemnification against liabilities arising in connection with the performance of their duties to the Fund. In the normal course of business, the Fund may also enter into contracts that provide general indemnifications. The Fund’s maximum exposure under these arrangements is unknown as this would be dependent on future claims that may be made against the Fund. The risk of material loss from such claims is considered remote.
Federal Taxes. The Fund intends to comply with provisions of the Internal Revenue Code applicable to regulated investment companies and to distribute substantially all of its investment company taxable income, including any net realized gain on investments not offset by capital loss carryforwards, if any, to shareholders. Therefore, no federal income or excise tax provision is required. The Fund files income tax returns in U.S. federal and applicable state jurisdictions. The statute of limitations on the Fund’s tax return filings generally remains open for the three preceding fiscal reporting period ends. The Fund has analyzed its tax positions for the fiscal year ended January 31, 2017, including open tax years, and does not believe there are any uncertain tax positions requiring recognition in the Fund’s financial statements.
|
| 26 OPPENHEIMER PORTFOLIO SERIES ACTIVE ALLOCATION FUND |
2. Significant Accounting Policies (Continued)
The tax components of capital shown in the following table represent distribution requirements the Fund must satisfy under the income tax regulations, losses the Fund may be able to offset against income and gains realized in future years and unrealized appreciation or depreciation of securities and other investments for federal income tax purposes.
| | | | | | | | | | | | |
Undistributed Net Investment Income | | Undistributed
Long-Term
Gain | | | Accumulated
Loss
Carryforward1,2,3 | | | Net Unrealized
Appreciation
Based on cost of
Securities and
Other Investments
for Federal Income
Tax Purposes | |
| | |
$24,162,615 | | | $— | | | | $333,223,046 | | | | $436,749,693 | |
1. At period end, the Fund had $333,223,046 of net capital loss carryforward available to offset future realized capital gains, if any, and thereby reduce future taxable gain distributions. Details of the capital loss carryforwards are included in the table below. Capital loss carryovers with no expiration, if any, must be utilized prior to those with expiration dates.
| | | | |
| Expiring | | | |
| |
2018 | | $ | 112,193,831 | |
2019 | | | 221,029,215 | |
| | | | |
Total | | $ | 333,223,046 | |
| | | | |
2. During the reporting period, the Fund utilized $75,775,771 of capital loss carryforward to offset capital gains realized in that fiscal year.
3. During the previous reporting period, the Fund utilized $119,034,232 of capital loss carryforward to offset capital gains realized in that fiscal year.
Net investment income (loss) and net realized gain (loss) may differ for financial statement and tax purposes. The character of dividends and distributions made during the fiscal year from net investment income or net realized gains are determined in accordance with federal income tax requirements, which may differ from the character of net investment income or net realized gains presented in those financial statements in accordance with U.S. GAAP. Also, due to timing of dividends and distributions, the fiscal year in which amounts are distributed may differ from the fiscal year in which the income or net realized gain was recorded by the Fund.
Accordingly, the following amounts have been reclassified for the reporting period. Net assets of the Fund were unaffected by the reclassifications.
| | | | |
Increase to Accumulated Net Investment Income | | Increase
to Accumulated Net
Realized Loss
on Investments | |
$863,245 | | | $863,245 | |
The tax character of distributions paid during the reporting periods:
|
| 27 OPPENHEIMER PORTFOLIO SERIES ACTIVE ALLOCATION FUND |
NOTES TO FINANCIAL STATEMENTS Continued
2. Significant Accounting Policies (Continued)
| | | | | | | | |
| | | Year Ended
January 31, 2017 | | | Year Ended
January 31, 2016 | |
Distributions paid from: | | | | | | | | |
Ordinary income | | $ | 18,295,107 | | | $ | 31,029,291 | |
The aggregate cost of securities and other investments and the composition of unrealized appreciation and depreciation of securities and other investments for federal income tax purposes at period end are noted in the following table. The primary difference between book and tax appreciation or depreciation of securities and other investments, if applicable, is attributable to the tax deferral of losses or tax realization of financial statement unrealized gain or loss.
| | | | |
| Federal tax cost of securities | | $ | 1,960,777,298 | |
| | | | |
| Gross unrealized appreciation | | $ | 449,414,871 | |
| Gross unrealized depreciation | | | (12,665,178) | |
| | | | |
| Net unrealized appreciation | | $ | 436,749,693 | |
| | | | |
Use of Estimates. The preparation of financial statements in conformity with U.S. GAAP requires management to make estimates and assumptions that affect the reported amounts of assets and liabilities and disclosure of contingent assets and liabilities at the date of the financial statements and the reported amounts of increases and decreases in net assets from operations during the reporting period. Actual results could differ from those estimates.
Recent Accounting Pronouncement. In October 2016, the Securities and Exchange Commission (“SEC”) adopted amendments to rules under the Investment Company Act of 1940 (“final rules”) intended to modernize the reporting and disclosure of information by registered investment companies. The final rules amend Regulation S-X and require funds to provide standardized, enhanced derivative disclosure in fund financial statements in a format designed for individual investors. The amendments to Regulation S-X also update the disclosures for other investments and investments in, and advances to affiliates and amend the rules regarding the general form and content of fund financial statements. The compliance date for the amendments to Regulation S-X is August 1, 2017. OFI Global is currently evaluating the amendments and their impact, if any, on the fund’s financial statements.
3. Securities Valuation
The Fund calculates the net asset value of its shares based upon the net asset value of the applicable investment companies. For each investment company, the net asset value per share for a class of shares is determined as of 4:00 P.M. eastern time, on each day the New York Stock Exchange (the “Exchange”) is open for trading, except in the case of a scheduled early closing of the Exchange, in which case the Fund will calculate net asset value of the shares as of the scheduled early closing time of the Exchange. This is calculated by dividing the value of the investment company’s net assets attributable to that class by the number of outstanding shares of that class on that day.
|
| 28 OPPENHEIMER PORTFOLIO SERIES ACTIVE ALLOCATION FUND |
3. Securities Valuation (Continued)
The Fund’s Board has adopted procedures for the valuation of the Fund’s securities and has delegated the day-to-day responsibility for valuation determinations under those procedures to the Manager. The Manager has established a Valuation Committee which is responsible for determining a “fair valuation” for any security for which market quotations are not “readily available.” The Valuation Committee’s fair valuation determinations are subject to review, approval and ratification by the Fund’s Board at its next regularly scheduled meeting covering the calendar quarter in which the fair valuation was determined.
Valuations Methods and Inputs
To determine their net asset values, the Underlying Funds’ assets are valued primarily on the basis of current market quotations as generally supplied by third party portfolio pricing services or by dealers. Such market quotations are typically based on unadjusted quoted prices in active markets for identical securities or other observable market inputs.
If a market value or price cannot be determined for a security using the methodologies described above, or if, in the “good faith” opinion of the Manager, the market value or price obtained does not constitute a “readily available market quotation,” or a significant event has occurred that would materially affect the value of the security, the security is fair valued either (i) by a standardized fair valuation methodology applicable to the security type or the significant event as previously approved by the Valuation Committee and the Fund’s Board or (ii) as determined in good faith by the Manager’s Valuation Committee. The Valuation Committee considers all relevant facts that are reasonably available, through either public information or information available to the Manager, when determining the fair value of a security. Fair value determinations by the Manager are subject to review, approval and ratification by the Fund’s Board at its next regularly scheduled meeting covering the calendar quarter in which the fair valuation was determined. The methodologies used for valuing securities are not necessarily an indication of the risks associated with investing in those Underlying Funds.
To assess the continuing appropriateness of security valuations, the Manager, or its third party service provider who is subject to oversight by the Manager, regularly compares prior day prices, prices on comparable securities, and sale prices to the current day prices and challenges those prices exceeding certain tolerance levels with the third party pricing service or broker source. For those securities valued by fair valuations, whether through a standardized fair valuation methodology or a fair valuation determination, the Valuation Committee reviews and affirms the reasonableness of the valuations based on such methodologies and fair valuation determinations on a regular basis after considering all relevant information that is reasonably available.
Classifications
Each investment asset or liability of the Fund is assigned a level at measurement date based on the significance and source of the inputs to its valuation. Various data inputs are used in determining the value of each of the Fund’s investments as of the reporting period end. These data inputs are categorized in the following hierarchy under applicable financial accounting
|
| 29 OPPENHEIMER PORTFOLIO SERIES ACTIVE ALLOCATION FUND |
NOTES TO FINANCIAL STATEMENTS Continued
3. Securities Valuation (Continued)
standards:
1) Level 1-unadjusted quoted prices in active markets for identical assets or liabilities (including securities actively traded on a securities exchange)
2) Level 2-inputs other than unadjusted quoted prices that are observable for the asset or liability (such as unadjusted quoted prices for similar assets and market corroborated inputs such as interest rates, prepayment speeds, credit risks, etc.)
3) Level 3-significant unobservable inputs (including the Manager’s own judgments about assumptions that market participants would use in pricing the asset or liability).
The inputs used for valuing securities are not necessarily an indication of the risks associated with investing in those securities.
The Fund classifies each of its investments in investment companies which are publicly offered as Level 1. Investment companies that are not publicly offered are measured using net asset value as a practical expedient, and are not classified in the fair value hierarchy. The table below categorizes amounts that are included in the Fund’s Statement of Assets and Liabilities at period end based on valuation input level:
| | | | | | | | | | | | | | | | |
| | | Level 1—
Unadjusted Quoted Prices | | | Level 2—
Other Significant
Observable Inputs | | | Level 3—
Significant
Unobservable
Inputs | | | Value | |
Assets Table | |
Investments, at Value: | |
Investment Companies | | $ | 2,279,992,232 | | | $ | — | | | $ | — | | | $ | 2,279,992,232 | |
| | | | |
| Total Assets excluding investment companies valued using practical expedient | | $ | 2,279,992,232 | | | $ | — | | | $ | — | | | | 2,279,992,232 | |
| | | | |
| Investment companies valued using practical expedient | | | | | | | | | | | | | | | 117,534,759 | |
| | | | | | | | | | | | | | | | |
Total Assets | | | | | | | | | | | | | | $ | 2,397,526,991 | |
| | | | | | | | | | | | | | | | |
Forward currency exchange contracts and futures contracts, if any, are reported at their unrealized appreciation/depreciation at measurement date, which represents the change in the contract’s value from trade date. All additional assets and liabilities included in the above table are reported at their market value at measurement date.
4. Investments and Risks
Risks of Investing in the Underlying Funds. The Fund invests in other mutual funds advised by the Manager. The Underlying Funds are registered open-end management investment companies under the 1940 Act, as amended. The Manager is the investment adviser of, and the Sub-Adviser provides investment and related advisory services to, the Underlying Funds. The Fund’s Investments in Underlying Funds are included in the Statement of Investments. Shares of Underlying Funds are valued at their net asset value per share. As a shareholder, the Fund is subject to its proportional share of the Underlying Funds’ expenses, including their management fee.
Each of the Underlying Funds in which the Fund invests has its own investment risks, and
|
| 30 OPPENHEIMER PORTFOLIO SERIES ACTIVE ALLOCATION FUND |
4. Investments and Risks (Continued)
those risks can affect the value of the Fund’s investments and therefore the value of the Fund’s shares. To the extent that the Fund invests more of its assets in one Underlying Fund than in another, the Fund will have greater exposure to the risks of that Underlying Fund.
Investment in Oppenheimer Institutional Government Money Market Fund.
The Fund is permitted to invest daily available cash balances in an affiliated money market fund. The Fund may invest the available cash in Class E shares of Oppenheimer Institutional Government Money Market Fund (“IGMMF”), formerly Oppenheimer Institutional Money Market Fund, is to seek current income while preserving liquidity or for defensive purposes. IGMMF is a registered open-end management investment company, regulated as a money market fund under the 1940 Act, as amended. The Manager is the investment adviser of IGMMF, and the Sub-Adviser provides investment and related advisory services to IGMMF. When applicable, the Fund’s investment in IGMMF is included in the Statement of Investments. Shares of IGMMF are valued at their net asset value per share. As a shareholder, the Fund is subject to its proportional share of IGMMF’s Class E expenses, including its management fee.
Investment in Oppenheimer Master Funds. Certain Underlying Funds in which the Fund invests are mutual funds registered under the 1940 Act, as amended, that expect to be treated as partnerships for tax purposes, specifically Oppenheimer Master Loan Fund, LLC (“Master Loan”), Oppenheimer Master Event-Linked Bond Fund, LLC (“Master Event-Linked Bond”) and Oppenheimer Master Inflation Protected Securities Fund, LLC (“Master Inflation Protected Securities”) (the “Master Funds”). Each Master Fund has its own investment risks, and those risks can affect the value of the Fund’s investments and therefore the value of the Fund’s shares. To the extent that the Fund invests more of its assets in one Master Fund than in another, the Fund will have greater exposure to the risks of that Master Fund.
The investment objective of Master Loan is to seek income. The investment objective of Master Event-Linked Bond is to seek total return. The investment objective of Master Inflation Protected Securities is to seek total return. The Fund’s investments in the Master Funds are included in the Statement of Investments. The Fund recognizes income and gain/ (loss) on its investments in each Master Fund according to its allocated pro-rata share, based on its relative proportion of total outstanding Master Fund shares held, of the total net income earned and the net gain/(loss) realized on investments sold by the Master Funds. As a shareholder, the Fund is subject to its proportional share of the Master Funds’ expenses, including their management fee. The Manager will waive fees and/or reimburse Fund expenses in an amount equal to the indirect management fees incurred through the Fund’s investment in the Master Funds. The Fund owns 2.69% of Master Loan, 10.17% of Master Event-Linked Bond and 30.02% of Master Inflation Protected Securities at period end.
5. Market Risk Factors
The Fund’s investments in securities and/or financial derivatives may expose the Fund to
|
| 31 OPPENHEIMER PORTFOLIO SERIES ACTIVE ALLOCATION FUND |
NOTES TO FINANCIAL STATEMENTS Continued
5. Market Risk Factors (Continued)
various market risk factors:
Commodity Risk. Commodity risk relates to the change in value of commodities or commodity indexes as they relate to increases or decreases in the commodities market. Commodities are physical assets that have tangible properties. Examples of these types of assets are crude oil, heating oil, metals, livestock, and agricultural products.
Credit Risk. Credit risk relates to the ability of the issuer of debt to meet interest and principal payments, or both, as they come due. In general, lower-grade, higher-yield debt securities are subject to credit risk to a greater extent than lower-yield, higher-quality securities.
Equity Risk. Equity risk relates to the change in value of equity securities as they relate to increases or decreases in the general market.
Foreign Exchange Rate Risk. Foreign exchange rate risk relates to the change in the U.S. dollar value of a security held that is denominated in a foreign currency. The U.S. dollar value of a foreign currency denominated security will decrease as the dollar appreciates against the currency, while the U.S. dollar value will increase as the dollar depreciates against the currency.
Interest Rate Risk. Interest rate risk refers to the fluctuations in value of fixed-income securities resulting from the inverse relationship between price and yield. For example, an increase in general interest rates will tend to reduce the market value of already issued fixed-income investments, and a decline in general interest rates will tend to increase their value. In addition, debt securities with longer maturities, which tend to have higher yields, are subject to potentially greater fluctuations in value from changes in interest rates than obligations with shorter maturities.
Volatility Risk. Volatility risk refers to the magnitude of the movement, but not the direction of the movement, in a financial instrument’s price over a defined time period. Large increases or decreases in a financial instrument’s price over a relative time period typically indicate greater volatility risk, while small increases or decreases in its price typically indicate lower volatility risk.
6. Shares of Beneficial Interest
The Fund has authorized an unlimited number of $0.001 par value shares of beneficial interest of each class. Transactions in shares of beneficial interest were as follows:
| | | | | | | | | | | | | | | | |
| | | Year Ended January 31, 2017 | | | Year Ended January 29, 20161 | |
| | | Shares | | | Amount | | | Shares | | | Amount | |
Class A | | | | | | | | | | | | | | | | |
Sold | | | 15,954,799 | | | $ | 192,872,344 | | | | 20,695,042 | | | $ | 256,527,542 | |
Dividends and/or distributions reinvested | | | 1,238,461 | | | | 15,344,460 | | | | 1,989,569 | | | | 23,775,353 | |
Redeemed | | | (21,910,398) | | | | (266,200,432) | | | | (20,240,796) | | | | (249,812,083) | |
| | | | |
Net increase (decrease) | | | (4,717,138) | | | $ | (57,983,628) | | | | 2,443,815 | | | $ | 30,490,812 | |
| | | | |
|
| 32 OPPENHEIMER PORTFOLIO SERIES ACTIVE ALLOCATION FUND |
6. Shares of Beneficial Interest (Continued)
| | | | | | | | | | | | | | | | |
| | | Year Ended January 31, 2017 | | | Year Ended January 29, 20161 | |
| | | Shares | | | Amount | | | Shares | | | Amount | |
| |
Class B | | | | | | | | | | | | | | | | |
Sold | | | 32,210 | | | $ | 385,249 | | | | 112,946 | | | $ | 1,378,897 | |
Dividends and/or distributions reinvested | | | — | | | | — | | | | 33,843 | | | | 400,365 | |
Redeemed | | | (3,622,324) | | | | (43,130,620) | | | | (4,378,333) | | | | (53,588,425) | |
| | | | |
Net decrease | | | (3,590,114) | | | $ | (42,745,371) | | | | (4,231,544) | | | $ | (51,809,163) | |
| | | | |
| | | | | | | | | | | | | |
| |
Class C | | | | | | | | | | | | | | | | |
Sold | | | 5,564,819 | | | $ | 65,687,819 | | | | 6,949,000 | | | $ | 84,000,049 | |
Dividends and/or distributions reinvested | | | 100,829 | | | | 1,224,076 | | | | 364,700 | | | | 4,270,634 | |
Redeemed | | | (9,382,498) | | | | (111,069,139) | | | | (7,443,168) | | | | (89,884,724) | |
| | | | |
Net decrease | | | (3,716,850) | | | $ | (44,157,244) | | | | (129,468) | | | $ | (1,614,041) | |
| | | | |
| | | | | | | | | | | | | |
| |
Class R | | | | | | | | | | | | | | | | |
Sold | | | 1,817,772 | | | $ | 21,950,453 | | | | 1,679,503 | | | $ | 20,548,618 | |
Dividends and/or distributions reinvested | | | 64,142 | | | | 790,866 | | | | 116,758 | | | | 1,388,248 | |
Redeemed | | | (2,187,911) | | | | (26,300,166) | | | | (2,139,749) | | | | (26,156,389) | |
| | | | |
Net decrease | | | (305,997) | | | $ | (3,558,847) | | | | (343,488) | | | $ | (4,219,523) | |
| | | | |
| | | | | | | | | | | | | |
| |
Class Y | | | | | | | | | | | | | | | | |
Sold | | | 1,916,812 | | | $ | 23,738,704 | | | | 1,645,923 | | | $ | 20,523,625 | |
Dividends and/or distributions reinvested | | | 52,980 | | | | 663,316 | | | | 58,545 | | | | 706,636 | |
Redeemed | | | (930,034) | | | | (11,069,921) | | | | (828,998) | | | | (10,201,180) | |
| | | | |
Net increase | | | 1,039,758 | | | $ | 13,332,099 | | | | 875,470 | | | $ | 11,029,081 | |
| | | | |
| | | | | | | | | | | | | | | | |
1. Represents the last business day of the Fund’s reporting period.
7. Purchases and Sales of Securities
The aggregate cost of purchases and proceeds from sales of securities, other than short-term obligations and investments in IGMMF, for the reporting period were as follows:
| | | | | | | | |
| | | Purchases | | | Sales | |
Investment securities | | $ | 121,220,693 | | | $ | 229,942,478 | |
8. Fees and Other Transactions with Affiliates
Management Fees. Under the investment advisory agreement, the Manager does not charge a management fee, but rather collects indirect management fees from the Fund’s investments in the Underlying Funds. The weighted indirect management fees collected from the Fund’s investment in the Underlying Funds, as a percent of average daily net assets of the Fund for the reporting period was 0.58%. This amount is gross of any waivers or reimbursements of management fees implemented at the Underlying Fund level. Under the sub-advisory agreement effective January 1, 2013, the Manager pays the Sub-Adviser a percentage of the indirect management fees (after all applicable waivers) from the Fund’s
|
| 33 OPPENHEIMER PORTFOLIO SERIES ACTIVE ALLOCATION FUND |
NOTES TO FINANCIAL STATEMENTS Continued
8. Fees and Other Transactions with Affiliates (Continued)
investments in the Underlying Funds.
Asset Allocation Fees. The Fund pays the Manager an asset allocation fee equal to an annual rate of 0.10% of the first $3 billion of the daily net assets of the Fund and 0.08% of the daily net assets in excess of $3 billion.
Sub-Adviser Fees. The Manager has retained the Sub-Adviser to provide the day-to-day portfolio management of the Fund. Under the Sub-Advisory Agreement, the Manager pays the Sub-Adviser an annual fee in monthly installments, equal to a percentage of the indirect investment management fee collected by the Manager, which shall be calculated after any investment management fee waivers. The fee paid to the Sub-Adviser is paid by the Manager, not by the Fund.
Transfer Agent Fees. OFI Global (the “Transfer Agent”) serves as the transfer and shareholder servicing agent for the Fund. The Fund pays the Transfer Agent a fee based on annual net assets. Fees incurred and average net assets for each class with respect to these services are detailed in the Statement of Operations and Financial Highlights, respectively.
Sub-Transfer Agent Fees. The Transfer Agent has retained Shareholder Services, Inc., a wholly-owned subsidiary of OFI (the “Sub-Transfer Agent”), to provide the day-to-day transfer agent and shareholder servicing of the Fund. Under the Sub-Transfer Agency Agreement, the Transfer Agent pays the Sub-Transfer Agent an annual fee in monthly installments, equal to a percentage of the transfer agent fee collected by the Transfer Agent from the Fund, which shall be calculated after any applicable fee waivers. The fee paid to the Sub-Transfer Agent is paid by the Transfer Agent, not by the Fund.
Trustees’ Compensation. The Fund has adopted an unfunded retirement plan (the “Plan”) for the Fund’s Independent Trustees. Benefits are based on years of service and fees paid to each Trustee during their period of service. The Plan was frozen with respect to adding new participants effective December 31, 2006 (the “Freeze Date”) and existing Plan Participants as of the Freeze Date will continue to receive accrued benefits under the Plan. Active
Independent Trustees as of the Freeze Date have each elected a distribution method with respect to their benefits under the Plan. During the reporting period, the Fund’s projected benefit obligations, payments to retired Trustees and accumulated liability were as follows:
| | | | |
Projected Benefit Obligations Increased | | $ | — | |
Payments Made to Retired Trustees | | | 10,007 | |
Accumulated Liability as of January 31, 2017 | | | 72,326 | |
The Fund’s Board of Trustees (“Board”) has adopted a compensation deferral plan for Independent Trustees that enables Trustees to elect to defer receipt of all or a portion of the annual compensation they are entitled to receive from the Fund. For purposes of determining the amount owed to the Trustee under the plan, deferred amounts are treated as though
|
| 34 OPPENHEIMER PORTFOLIO SERIES ACTIVE ALLOCATION FUND |
8. Fees and Other Transactions with Affiliates (Continued)
equal dollar amounts had been invested in shares of the Fund or in other Oppenheimer funds selected by the Trustee. The Fund purchases shares of the funds selected for deferral by the Trustee in amounts equal to his or her deemed investment, resulting in a Fund asset equal to the deferred compensation liability. Such assets are included as a component of “Other” within the asset section of the Statement of Assets and Liabilities. Deferral of Trustees’ fees under the plan will not affect the net assets of the Fund and will not materially affect the Fund’s assets, liabilities or net investment income per share. Amounts will be deferred until distributed in accordance with the compensation deferral plan.
Distribution and Service Plan (12b-1) Fees. Under its General Distributor’s Agreement with the Fund, OppenheimerFunds Distributor, Inc. (the “Distributor”) acts as the Fund’s principal underwriter in the continuous public offering of the Fund’s classes of shares.
Service Plan for Class A Shares. The Fund has adopted a Service Plan (the “Plan”) for Class A shares pursuant to Rule 12b-1 under the 1940 Act. Under the Plan, the Fund reimburses the Distributor for a portion of its costs incurred for services provided to accounts that hold Class A shares. Reimbursement is made periodically at an annual rate of up to 0.25% of the daily net assets of Class A shares of the Fund. The Distributor currently uses all of those fees to pay dealers, brokers, banks and other financial institutions periodically for providing personal service and maintenance of accounts of their customers that hold Class A shares. Any unreimbursed expenses the Distributor incurs with respect to Class A shares in any fiscal year cannot be recovered in subsequent periods. Fees incurred by the Fund under the
Plan are detailed in the Statement of Operations.
Distribution and Service Plans for Class B, Class C and Class R Shares. The Fund has adopted Distribution and Service Plans (the “Plans”) for Class B, Class C and Class R shares pursuant to Rule 12b-1 under the 1940 Act to compensate the Distributor for distributing those share classes, maintaining accounts and providing shareholder services. Under the Plans, the Fund pays the Distributor an annual asset-based sales charge of 0.75% on Class B and Class C shares’ daily net assets and 0.25% on Class R shares’ daily net assets. The Fund also pays a service fee under the Plans at an annual rate of 0.25% of daily net assets. The Plans continue in effect from year to year only if the Fund’s Board of Trustees votes annually to approve their continuance at an in person meeting called for that purpose. Fees incurred by the Fund under the Plans are detailed in the Statement of Operations.
Sales Charges. Front-end sales charges and CDSC do not represent expenses of the Fund. They are deducted from the proceeds of sales of Fund shares prior to investment or from redemption proceeds prior to remittance, as applicable. The sales charges retained by the Distributor from the sale of shares and the CDSC retained by the Distributor on the redemption of shares is shown in the following table for the period indicated.
|
| 35 OPPENHEIMER PORTFOLIO SERIES ACTIVE ALLOCATION FUND |
NOTES TO FINANCIAL STATEMENTS Continued
8. Fees and Other Transactions with Affiliates (Continued)
| | | | | | | | | | | | | | | | | | | | |
| Year Ended | | Class A Front-End
Sales Charges
Retained by
Distributor | | | Class A
Contingent
Deferred
Sales Charges
Retained by
Distributor | | | Class B
Contingent
Deferred
Sales Charges
Retained by
Distributor | | | Class C
Contingent
Deferred
Sales Charges
Retained by
Distributor | | | Class R
Contingent
Deferred
Sales Charges
Retained by
Distributor | |
| January 31, 2017 | | | $968,006 | | | | $1,158 | | | | $57,290 | | | | $51,634 | | | | $— | |
Waivers and Reimbursements of Expenses. The Manager has voluntarily agreed to waive fees and/or reimburse the Fund for certain expenses in order to limit “Expenses after payments, waivers and/or reimbursements and reduction to custodian expenses”, (the combined direct (Fund level) and indirect (Underlying Fund level) expenses), will not exceed the annual rate of 1.45%, 2.20%, 2.20%, 1.70% and 1.20%, for Class A, Class B, Class C, Class R and Class Y, respectively. The expense limitations do not include interest and fees from borrowing, and other expenses not incurred in the ordinary course of the Fund’s business. Notwithstanding the foregoing limits, the Manager is not required to waive or reimburse Fund expenses in excess of the amount of indirect management fees earned from investments in the Underlying Funds.
The Manager has also contractually agreed to waive fees and/or reimburse certain Fund expenses at an annual rate of 0.04% as calculated on the daily net assets of the Fund. This waiver and/or reimbursement is applied after (and in addition to) any other applicable waiver and/or expense reimbursements that may apply. During the reporting period, the Manager waived fees and/or reimbursed the Fund $941,600.
9. Borrowings and Other Financing
Joint Credit Facility. A number of mutual funds managed by the Manager participate in a $1.3 billion revolving credit facility (the “Facility”) intended to provide short-term financing, if necessary, subject to certain restrictions in connection with atypical redemption activity. Expenses and fees related to the Facility are paid by the participating funds and are disclosed separately or as other expenses on the Statement of Operations. The Fund did not utilize the Facility during the reporting period. Effective July 18, 2016, the Fund no longer participated in the Facility.
|
| 36 OPPENHEIMER PORTFOLIO SERIES ACTIVE ALLOCATION FUND |
REPORT OF INDEPENDENT REGISTERED PUBLIC ACCOUNTING FIRM
The Board of Trustees and Shareholders of Oppenheimer Portfolio Series:
We have audited the accompanying statement of assets and liabilities of Active Allocation Fund (a series of Oppenheimer Portfolio Series), including the statement of investments, as of January 31, 2017, and the related statement of operations for the year then ended, the statements of changes in net assets for each of the years in the two-year period then ended, and the financial highlights for each of the years in the five-year period then ended. These financial statements and financial highlights are the responsibility of the Fund’s management. Our responsibility is to express an opinion on these financial statements and financial highlights based on our audits.
We conducted our audits in accordance with the standards of the Public Company Accounting Oversight Board (United States). Those standards require that we plan and perform the audit to obtain reasonable assurance about whether the financial statements and financial highlights are free of material misstatement. An audit includes examining, on a test basis, evidence supporting the amounts and disclosures in the financial statements. Our procedures included confirmation of securities owned as of January 31, 2017, by correspondence with the transfer agent. An audit also includes assessing the accounting principles used and significant estimates made by management, as well as evaluating the overall financial statement presentation. We believe that our audits provide a reasonable basis for our opinion.
In our opinion, the financial statements and financial highlights referred to above present fairly, in all material respects, the financial position of Active Allocation Fund as of January 31, 2017, the results of its operations for the year then ended, the changes in its net assets for each of the years in the two-year period then ended, and the financial highlights for each of the years in the five-year period then ended, in conformity with U.S. generally accepted accounting principles.
KPMG LLP
Denver, Colorado
March 24, 2017
|
| 37 OPPENHEIMER PORTFOLIO SERIES ACTIVE ALLOCATION FUND |
FEDERAL INCOME TAX INFORMATION
In early 2017, if applicable, shareholders of record received information regarding all dividends and distributions paid to them by the Fund during calendar year 2016.
Dividends, if any, paid by the Fund during the reporting period which are not designated as capital gain distributions should be multiplied by the maximum amount allowable but not less than 56.06% to arrive at the amount eligible for the corporate dividend-received deduction.
A portion, if any, of the dividends paid by the Fund during the reporting period which are not designated as capital gain distributions are eligible for lower individual income tax rates to the extent that the Fund has received qualified dividend income as stipulated by recent tax legislation. The maximum amount allowable but not less than $25,809,057 of the Fund’s fiscal year taxable income may be eligible for the lower individual income tax rates. In early
2017, shareholders of record received information regarding the percentage of distributions that are eligible for lower individual income tax rates.
Recent tax legislation allows a regulated investment company to designate distributions not designated as capital gain distributions, as either interest related dividends or short-term capital gain dividends, both of which are exempt from the U.S. withholding tax applicable to non U.S. taxpayers. For the reporting period, the maximum amount allowable but not less than $6,160,316 of the ordinary distributions to be paid by the Fund qualifies as an interest related dividend.
The Fund has elected the application of Section 853 of the Internal Revenue Code to permit shareholders to take a federal income tax credit or deduction, at their option, on a per share basis. The maximum amount allowable but not less than $1,348,745 of foreign income taxes were paid by the Fund during the reporting period. A separate notice will be mailed to each shareholder, which will reflect the proportionate share of such foreign taxes which must be treated by shareholders as gross income for federal income tax purposes.
Gross income of the maximum amount allowable but not less than $10,098,213 was derived from sources within foreign countries or possessions of the United States.
The foregoing information is presented to assist shareholders in reporting distributions received from the Fund to the Internal Revenue Service. Because of the complexity of the federal regulations which may affect your individual tax return and the many variations in state and local tax regulations, we recommend that you consult your tax advisor for specific guidance.
|
| 38 OPPENHEIMER PORTFOLIO SERIES ACTIVE ALLOCATION FUND |
BOARD APPROVAL OF THE FUND’S INVESTMENT ADVISORY
AND SUB-ADVISORY AGREEMENTS Unaudited
The Fund has entered into an investment advisory agreement with OFI Global Asset Management, Inc. (“OFI Global” or the “Adviser”), a wholly-owned subsidiary of OppenheimerFunds, Inc. (“OFI” or the “Sub-Adviser”) (“OFI Global” and “OFI” together, the “Managers”) and OFI Global has entered into a sub-advisory agreement with OFI whereby OFI provides investment sub-advisory services to the Fund (collectively, the “Agreements”). Each year, the Board of Trustees (the “Board”), including a majority of the independent Trustees, is required to determine whether to approve the terms of the Agreements and the renewal thereof. The Investment Company Act of 1940, as amended, requires that the Board request and evaluate, and that the Managers provide, such information as may be reasonably necessary to evaluate the terms of the Agreements. The Board employs an independent consultant to prepare a report that provides information, including comparative information that the Board requests for that purpose. In addition to in-person meetings focused on this evaluation, the Board receives information throughout the year regarding Fund services, fees, expenses and performance.
The Managers and the independent consultant provided information to the Board on the following factors: (i) the nature, quality and extent of the Managers’ services, (ii) the comparative investment performance of the Fund and the Managers, (iii) the fees and expenses of the Fund, including comparative fee and expense information, (iv) the profitability of the Managers and their affiliates, including an analysis of the cost of providing services, (v) whether economies of scale are realized as the Fund grows and whether fee levels reflect these economies of scale for Fund investors and (vi) other benefits to the Managers from their relationship with the Fund. The Board was aware that there are alternatives to retaining the Managers.
Outlined below is a summary of the principal information considered by the Board as well as the Board’s conclusions.
Nature, Quality and Extent of Services. The Board considered information about the nature, quality and extent of the services provided to the Fund and information regarding the Managers’ key personnel who provide such services. The Managers’ duties include providing the Fund with the services of the portfolio managers and the Sub-Adviser’s investment team, who provide research, analysis and other advisory services in regard to the Fund’s investments; and securities trading services. OFI Global is responsible for oversight of third-party service providers; monitoring compliance with applicable Fund policies and procedures and adherence to the Fund’s investment restrictions; risk management; and oversight of the Sub-Adviser. OFI Global is also responsible for providing certain administrative services to the Fund as well. Those services include providing and supervising all administrative and clerical personnel who are necessary in order to provide effective corporate administration for the Fund; compiling and maintaining records with respect to the Fund’s operations; preparing and filing reports required by the U.S. Securities and Exchange Commission; preparing periodic reports regarding the operations of the Fund for its shareholders; preparing proxy materials for shareholder meetings; and preparing the registration statements required by federal and state securities laws for the sale of the Fund’s shares. OFI Global also provides the Fund with office space, facilities and equipment.
|
| 39 OPPENHEIMER PORTFOLIO SERIES ACTIVE ALLOCATION FUND |
BOARD APPROVAL OF THE FUND’S INVESTMENT ADVISORY
AND SUB-ADVISORY AGREEMENTS Unaudited / Continued
The Board also considered the quality of the services provided and the quality of the Managers’ resources that are available to the Fund. The Board took account of the fact that the Sub-Adviser has over fifty years of experience as an investment adviser and that its assets under management rank it among the top mutual fund managers in the United States. The Board evaluated the Managers’ advisory, administrative, accounting, legal, compliance services and risk management, and information the Board has received regarding the experience and professional qualifications of the Managers’ key personnel and the size and functions of its staff. In its evaluation of the quality of the portfolio management services provided, the Board considered the experience of Mark Hamilton, Caleb Wong and Dokyoung Lee, the portfolio managers for the Fund, and the experience of the portfolio managers and the investment performance of the investment companies in which the Fund invests (the “Underlying Funds”). The Board members also considered the totality of their experiences with the Managers as directors or trustees of the Fund and other funds advised by the Managers. The Board considered information regarding the quality of services provided by affiliates of the Managers, which the Board members have become knowledgeable about through their experiences with the Managers and in connection with the renewal of the Fund’s service agreements. The Board concluded, in light of the Managers’ experience, reputation, personnel, operations and resources that the Fund benefits from the services provided under the Agreements.
Investment Performance of the Managers and the Fund. Throughout the year, the Managers provided information on the investment performance of the Fund, the Adviser and the Sub-Adviser, including comparative performance information. The Board also reviewed information, prepared by the Managers and the independent consultant, comparing the Fund’s historical performance to relevant benchmark or market indices and to the performance of other retail funds in the world allocation category. The Board noted that the Fund’s one-year performance was better than its category median although its three-year, five-year and ten-year performance was below its category median.
Fees and Expenses of the Fund. The Board reviewed the expenses borne by the Fund. The Adviser does not charge a traditional management fee to the Fund; however, the Adviser collects indirect management fees from the Fund’s investment in the Underlying Funds and also charges an additional asset allocation management fee. The independent consultant provided comparative data in regard to the fees and expenses of the Fund and other retail front-end load world allocation funds with comparable asset levels and distribution features. After discussions with the Board, the Adviser has voluntarily agreed to waive fees and/ or reimburse the Fund so that the total annual fund operating expenses, excluding certain expenses, as a percentage of average daily net assets will not exceed the following annual rates: 1.45% for Class A shares, 2.20% for Class B shares, 2.20% for Class C shares, 1.70% for Class R shares and 1.20% for Class Y shares, as calculated on the daily net assets of the Fund. This fee waiver and/or expense reimbursement may be amended or withdrawn at any time without prior notice to shareholders. After discussions with the Board, the Adviser has also agreed to contractually waive fees and/or reimburse certain Fund expenses at an annual rate of 0.04% as calculated on the daily net assets of the Fund. This waiver and/or reimbursement is applied after (and in addition to) any other applicable fee waivers and/or
|
| 40 OPPENHEIMER PORTFOLIO SERIES ACTIVE ALLOCATION FUND |
expense reimbursements that apply. The Adviser is not required to waive or reimburse Fund expenses in excess of the amount of indirect management fees earned from investments in the Underlying Funds. This fee waiver and/or expense reimbursement may not be amended or withdrawn until one year from the date of the prospectus, unless approved by the Board. The Board noted that the Fund was charged no direct traditional management fees, exclusive of Underlying Fund management fees, while certain peer group funds did charge direct traditional management fees. The Board also noted that the Fund’s total expenses were lower than its peer group median and category median.
Economies of Scale and Profits Realized by the Adviser and Sub-Adviser.
The Board considered information regarding the Managers’ costs in serving as the Fund’s investment adviser and sub-adviser, including the costs associated with the personnel and systems necessary to manage the Fund, and information regarding the Managers’ profitability from their relationship with the Fund. The Board also considered that the
Managers must be able to pay and retain experienced professional personnel at competitive rates to provide quality services to the Fund. The Board reviewed whether the Managers may realize economies of scale in managing and supporting the Fund and whether those economies of scale benefit the Fund’s shareholders at the current level of Fund assets in relation to its management fee. The Board noted that the Fund currently has asset allocation fee breakpoints, which are intended to share with Fund shareholders economies of scale that may exist as the Fund’s assets grow.
Other Benefits to the Managers. In addition to considering the profits realized by the Managers, the Board considered information that was provided regarding the direct and indirect benefits the Managers receive as a result of their relationship with the Fund, including compensation paid to the Managers’ affiliates.
Conclusions. These factors were also considered by the independent Trustees meeting separately from the full Board, assisted by experienced counsel to the Fund and to the independent Trustees. Fund counsel and the independent Trustees’ counsel are independent of the Managers within the meaning and intent of the Securities and Exchange Commission Rules.
Based on its review of the information it received and its evaluations described above, the Board, including a majority of the independent Trustees, decided to continue the Agreements through September 30, 2017. In arriving at its decision, the Board did not identify any factor or factors as being more important than others, but considered all of the above information, and considered the terms and conditions of the Agreements, including the management fees, in light of all the surrounding circumstances.
|
| 41 OPPENHEIMER PORTFOLIO SERIES ACTIVE ALLOCATION FUND |
PORTFOLIO PROXY VOTING POLICIES AND GUIDELINES;
UPDATES TO STATEMENTS OF INVESTMENTS Unaudited
The Fund has adopted Portfolio Proxy Voting Policies and Guidelines under which the Fund votes proxies relating to securities (“portfolio proxies”) held by the Fund. A description of the Fund’s Portfolio Proxy Voting Policies and Guidelines is available (i) without charge, upon request, by calling the Fund toll-free at 1.800.CALL OPP (225.5677), (ii) on the Fund’s website at www.oppenheimerfunds.com, and (iii) on the SEC’s website at www.sec.gov. In addition, the Fund is required to file Form N-PX, with its complete proxy voting record for the 12 months ended June 30th, no later than August 31st of each year. The Fund’s voting record is available (i) without charge, upon request, by calling the Fund toll-free at 1.800.CALL OPP (225.5677), and (ii) in the Form N-PX filing on the SEC’s website at www.sec.gov.
The Fund files its complete schedule of portfolio holdings with the SEC for the first quarter and the third quarter of each fiscal year on Form N-Q. The Fund’s Form N-Q filings are available on the SEC’s website at www.sec.gov. Those forms may be reviewed and copied at the SEC’s Public Reference Room in Washington, D.C. Information on the operation of the Public Reference Room may be obtained by calling 1-800-SEC-0330.
Householding—Delivery of Shareholder Documents
This is to inform you about OppenheimerFunds’ “householding” policy. If more than one member of your household maintains an account in a particular fund, OppenheimerFunds will mail only one copy of the fund’s prospectus (or, if available, the fund’s summary prospectus), annual and semiannual report and privacy policy. The consolidation of these mailings, called householding, benefits your fund through reduced mailing expense, and benefits you by reducing the volume of mail you receive from OppenheimerFunds. Householding does not affect the delivery of your account statements.
Please note that we will continue to household these mailings for as long as you remain an OppenheimerFunds shareholder, unless you request otherwise. If you prefer to receive multiple copies of these materials, please call us at 1.800.CALL-OPP (225-5677). You may also notify us in writing or via email. We will begin sending you individual copies of the prospectus (or, if available, the summary prospectus), reports and privacy policy within 30 days of receiving your request to stop householding.
|
| 42 OPPENHEIMER PORTFOLIO SERIES ACTIVE ALLOCATION FUND |
TRUSTEES AND OFFICERS Unaudited
| | |
Name, Position(s) Held with the Fund, Length of Service, Year of Birth | | Principal Occupation(s) During the Past 5 Years; Other Trusteeships/ Directorships Held; Number of Portfolios in the Fund Complex Currently Overseen |
| |
| INDEPENDENT TRUSTEES | | The address of each Trustee in the chart below is 6803 S. Tucson Way, Centennial, Colorado 80112-3924. Each Trustee serves for an indefinite term, or until his or her resignation, retirement, death or removal. |
| |
Brian F. Wruble, Chairman of the Board of Trustees (since 2007), and Trustee (since 2005) Year of Birth: 1943 | | Governor and Vice Chairman of Community Foundation of the Florida Keys (non- profit) (since July 2012); Trustee of the Board of Trustees, The Jackson Laboratory (non-profit) (1991-2011 and since May 2014); Chairman Emeritus (since August 2011) of The Jackson Laboratory (non-profit); Member of Zurich Insurance Group’s Investment Management Advisory Council (insurance) (since 2004); Treasurer (since 2007) and Trustee of the Institute for Advanced Study (non-profit educational institute) (since May 1992); Director of Special Value Opportunities Fund, LLC (registered investment company) (affiliate of the Sub-Adviser’s parent company) (September 2004-June 2015); General Partner of Odyssey Partners, L.P. (hedge fund) (September 1995-December 2007); Special Limited Partner of Odyssey Investment Partners, LLC (private equity investment) (January 1999-September 2004). Oversees 56 portfolios in the OppenheimerFunds complex. Mr. Wruble has served on the Boards of certain Oppenheimer funds since April 2001, during which time he has become familiar with the Fund’s (and other Oppenheimer funds’) financial, accounting, regulatory and investment matters and has contributed to the Boards’ deliberations. |
| |
Beth Ann Brown, Trustee (since 2016) Year of Birth: 1968 | | Advisor, Board of Advisors of Caron Engineering Inc. (since December 2014); Independent Consultant (since September 2012); held the following positions at Columbia Management Investment Advisers LLC: Head of Intermediary Distribution (2008-2012), Managing Director, Strategic Relations (2005-2008), Managing Director, Head of National Accounts (2004-2005); Senior Vice President, National Account Manager (2002-2004), Senior Vice President, Key Account Manager (1999-2002) and Vice President, Key Account Manager (1996-1999) of Liberty Funds Distributor, Inc.; President and Director, of Acton Shapleigh Youth Conservation Corps (non-profit) (since 2012); and Vice President and Director of Grahamtastic Connection (non-profit) (since May 2013). Oversees 56 portfolios in the OppenheimerFunds complex. Ms. Brown has served on the Boards of certain Oppenheimer funds since January 2016, during which time she has become familiar with the Fund’s (and other Oppenheimer funds’) financial, accounting, regulatory and investment matters and has contributed to the Boards’ deliberations. |
|
| 43 OPPENHEIMER PORTFOLIO SERIES ACTIVE ALLOCATION FUND |
TRUSTEES AND OFFICERS Unaudited / Continued
| | |
Edmund P. Giambastiani, Jr., Trustee (since 2013) Year of Birth: 1948 | | Advisory Board Member of the Maxwell School of Citizenship and Public Affairs of Syracuse University (since April 2012); Director of Mercury Defense Systems Inc. (information technology) (August 2011-February 2013); Trustee of the U.S. Naval Academy Foundation (since November 2010); Advisory Board Member of the Massachusetts Institute of Technology Lincoln Laboratory (federally- funded research development center) (since May 2010); Director of The Boeing Company (aerospace and defense) (since October 2009); Trustee of MITRE Corporation (federally-funded research development center) (since September 2008); Independent Director of QinetiQ Group Plc (defense technology and security) (February 2008-August 2011); Lead Director (June 2011-March 2015); Chairman of Alenia North America, Inc. (military and defense products) (January 2008-October 2009); Director of SRA International, Inc. (information technology and services) (January 2008-July 2011); President of Giambastiani Group LLC (national security and energy consulting) (since October 2007); United States Navy, career nuclear submarine officer (June 1970-October 2007), Vice Chairman of the Joint Chiefs of Staff (2005-October 2007), Supreme Allied Commander of NATO Commander Transformation (2003-2005), Commander, U.S. Joint Forces Command (2002-2005). Since his retirement from the U.S. Navy in October 2007, Admiral Giambastiani has also served on numerous U.S. Government advisory boards, investigations and task forces for the Secretaries of Defense, State and Interior and the Central Intelligence Agency. He currently serves as a federal commissioner on the Military Compensation and Retirement Modernization Commission. Oversees 56 portfolios in the OppenheimerFunds complex. Admiral Giambastiani has served on the Boards of certain Oppenheimer funds since February 2013, including as an Advisory Board Member for certain Oppenheimer funds, during which time he has become familiar with the Fund’s (and other Oppenheimer funds’) financial, accounting, regulatory and investment matters and has contributed to the Boards’ deliberations. For purposes of this report, Admiral Giambastiani is identified as a Trustee. |
| |
Elizabeth Krentzman, Trustee (since 2014) Year of Birth: 1959 | | Advisory Board Member of the University of Florida Law Center Association (since 2016) and the Securities and Exchange Commission Historical Society (since 2007); held the following positions at Deloitte & Touche LLP: Principal and Chief Regulatory Advisor for Asset Management Services (2007-2014) and U.S. Mutual Fund Leader (2011-2014); General Counsel of the Investment Company Institute (trade association) (June 2004-April 2007); held the following positions at Deloitte & Touche LLP: National Director of the Investment Management Regulatory Consulting Practice (1997-2004), Principal (2003-2004), Director (1998-2003) and Senior Manager (1997-1998); Assistant Director of the Division of Investment Management – Office of Disclosure and Investment Adviser Regulation (1996- 1997) and various positions with the Division of Investment Management – Office of Regulatory Policy (1991-1996) of the U.S. Securities and Exchange Commission; Associate at Ropes & Gray (1987-1991). Oversees 56 portfolios in the OppenheimerFunds complex. Ms. Krentzman has served on the Boards of certain Oppenheimer funds since August 2014, during which time she has become familiar with the Fund’s (and other Oppenheimer funds’) financial, accounting, regulatory and investment matters and has contributed to the Boards’ deliberations. |
|
| 44 OPPENHEIMER PORTFOLIO SERIES ACTIVE ALLOCATION FUND |
| | |
Mary F. Miller, Trustee (since 2005) Year of Birth: 1942 | | Trustee of International House (not-for-profit) (since June 2007); Trustee of the American Symphony Orchestra (not-for-profit) (October 1998-November 2011); and Senior Vice President and General Auditor of American Express Company (financial services company) (July 1998-February 2003). Oversees 56 portfolios in the OppenheimerFunds complex. Ms. Miller has served on the Boards of certain Oppenheimer funds since August 2004, during which time she has become familiar with the Fund’s (and other Oppenheimer funds’) financial, accounting, regulatory and investment matters and has contributed to the Boards’ deliberations. |
| |
Joel W. Motley, Trustee (since 2005) Year of Birth: 1952 | | Director of Greenwall Foundation (since October 2013); Member of Board and Investment Committee of The Greenwall Foundation (since April 2013); Member of the Vestry of Trinity Wall Street (since April 2012); Director of Southern Africa Legal Services Foundation (since March 2012); Board Member of Pulitzer Center for Crisis Reporting (non-profit journalism) (since March 2011); Managing Director of Public Capital Advisors, LLC (privately-held financial advisor) (since January 2006); Managing Director of Carmona Motley, Inc. (privately-held financial advisor) (since January 2002); Director of Columbia Equity Financial Corp. (privately-held financial advisor) (2002-2007); Managing Director of Carmona Motley Hoffman Inc. (privately-held financial advisor) (January 1998-December 2001); Member of the Finance and Budget Committee of the Council on Foreign Relations, Member of the Investment Committee and Board of Human Rights Watch (since July 2000) and Member of the Investment Committee and Board of Historic Hudson Valley (since February 2010). Oversees 56 portfolios in the OppenheimerFunds complex. Mr. Motley has served on the Boards of certain Oppenheimer funds since October 2002, during which time he has become familiar with the Fund’s (and other Oppenheimer funds’) financial, accounting, regulatory and investment matters and has contributed to the Boards’ deliberations. |
| |
Joanne Pace, Trustee (since 2012) Year of Birth: 1958 | | Advisory Board Director of Massey Quick and Company, LLC (since October 2014); Board Director of Horizon Blue Cross Blue Shield of New Jersey (since November 2012); Advisory Board Director of The Alberleen Group LLC (since March, 2012); Board Member (since January 2015), Advisory Council Member (December 2012-December 2014) of 100 Women in Hedge Funds (non-profit) (since December, 2012); Advisory Council Member of Morgan Stanley Children’s Hospital (non-profit) (since May, 2012); Board Director of The Komera Project (non-profit) (since April, 2012); New York Advisory Board Director of Peace First (non-profit) (2010-2015); Senior Advisor of SECOR Asset Management, LP (2010-2011); Managing Director and Chief Operating Officer of Morgan Stanley Investment Management (2006-2010); Partner and Chief Operating Officer of FrontPoint Partners, LLC (hedge fund) (2005-2006); held the following positions at Credit Suisse: Managing Director (2003-2005); Global Head of Human Resources and member of Executive Board and Operating Committee (2004-2005), Global Head of Operations and Product Control (2003-2004); held the following positions at Morgan Stanley: Managing Director (1997-2003), Controller and Principal Accounting Officer (1999-2003); Chief Financial Officer (temporary assignment) for the Oversight Committee, Long Term Capital Management (1998-1999). Lead Independent Director and Chair of the Audit and Nominating Committee of The Global Chartist Fund, LLC of Oppenheimer Asset Management (2011-2012); Board Director of Managed Funds Association (2008-2010); Board Director of Morgan Stanley Foundation (2007-2010) and Investment Committee Chair (2008-2010). Oversees 56 portfolios in the OppenheimerFunds complex. Ms. Pace has served on the Boards of certain Oppenheimer funds since November 2012, including as |
|
| 45 OPPENHEIMER PORTFOLIO SERIES ACTIVE ALLOCATION FUND |
TRUSTEES AND OFFICERS Unaudited / Continued
| | |
Joanne Pace, Continued | | an Advisory Board Member for certain Oppenheimer funds, during which time she has become familiar with the Fund’s (and other Oppenheimer funds’) financial, accounting, regulatory and investment matters and has contributed to the Board’s deliberations. For purposes of this report, Ms. Pace is identified as a Trustee. |
| |
Daniel Vandivort, Trustee (since 2014) Year of Birth: 1954 | | Chairman and Lead Independent Director/Trustee (March 2010-September 2014), Chairman of the Audit Committee (March 2009-September 2014) and Director/ Trustee (December 2008-September 2014) of the Board of Directors/Trustees of Value Line Funds; Trustee, Board of Trustees of Huntington Disease Foundation of America (since January 2015 and June 2007-December 2013): Trustee, Board of Trustees, RIM Retirement Savings Plan (2005-2007); President and Chief Investment Officer, Robeco Investment Management, formerly known as Weiss Peck and Greer (January 2005-June 2007); Member, Management Committee of Robeco Investment Management (2001-2007); Chairman and Trustee of the Board of Trustees of Weiss, Peck and Greer Funds (2004-2005); Managing Director and Head of Fixed Income, Weiss, Peck and Greer (November 1994-January 2005); Managing Director and Head of Fixed Income, CS First Boston Investment Management (January 1992-November 1994); Director, Global Product Development, First Boston Asset Management (November 1989 to January 1992); Vice President, Fixed Income Sales, First Boston Corp. (May 1984-November 1989). Oversees 56 portfolios in the OppenheimerFunds complex. Mr. Vandivort has served on the Boards of certain Oppenheimer funds since 2014, during which time he has become familiar with the Fund’s (and other Oppenheimer funds’) financial, accounting, regulatory and investment matters and has contributed to the Boards’ deliberations. |
| | |
| INTERESTED TRUSTEE AND OFFICER | | Mr. Steinmetz is an “Interested Trustee” because he is affiliated with the Manager and the Sub-Adviser by virtue of his positions as Chairman of the Sub-Adviser and officer and director of the Manager. Both as a Trustee and as an officer, Mr. Steinmetz serves for an indefinite term, or until his resignation, retirement, death or removal. Mr. Steinmetz’s address is 225 Liberty Street, New York, New York 10281-1008. |
| |
Arthur P. Steinmetz, Trustee (since 2015), President and Principal Executive Officer (since 2014) Year of Birth: 1958 | | Chairman of the Sub-Adviser (since January 2015); CEO and Chairman of the Manager (since July 2014), President of the Manager (since May 2013), a Director of the Manager (since January 2013), Director of the Sub-Adviser (since July 2014), President, Management Director and CEO of Oppenheimer Acquisition Corp. (the Sub-Adviser’s parent holding company) (since July 2014), and President and Director of OFI SteelPath, Inc. (since January 2013). Chief Investment Officer of the OppenheimerFunds advisory entities from (January 2013-December 2013); Executive Vice President of the Manager (January 2013-May 2013); Chief Investment Officer of the Sub-Adviser (October 2010-December 2012); Chief Investment Officer, Fixed-Income, of the Sub-Adviser (April 2009-October 2010); Executive Vice President of the Sub-Adviser (October 2009-December 2012); Director of Fixed Income of the Sub-Adviser (January 2009-April 2009); and a Senior Vice President of the Sub-Adviser (March 1993-September 2009). An officer of 103 portfolios in the OppenheimerFunds complex. |
| | |
| OTHER OFFICERS OF THE FUND | | The addresses of the Officers in the chart below are as follows: for Messrs. Hamilton, Lee, Wong, Mss. Lo Bessette, Foxson and Picciotto, 225 Liberty Street, New York, New York 10281-1008, for Mr. Petersen, 6803 S. Tucson Way, Centennial, Colorado 80112-3924. Each Officer serves for an indefinite term or until his or her resignation, retirement, death or removal. |
|
| 46 OPPENHEIMER PORTFOLIO SERIES ACTIVE ALLOCATION FUND |
| | |
Mark Hamilton, Vice President (since 2013) Year of Birth: 1965 | | Chief Investment Officer, Asset Allocation and Senior Vice President of the Sub-Adviser (since April 2013). Mr. Hamilton served at AllianceBernstein L.P. (from 1994-2013) as an Investment Director of Dynamic Asset Allocation (from 2010-2013), Head of North American Blend Team (from 2009-2010), and Senior Portfolio Manager of Blend Strategies (from 2006-2010). A portfolio manager and officer of other portfolios in the OppenheimerFunds complex. |
| |
Dokyoung Lee, Vice President (since 2014) Year of Birth: 1965 | | Director of Research, Global Multi-Asset Group and a Senior Vice President of the Sub-Adviser (since October 2013). Mr. Lee served at Alliance Bernstein L.P. (1994- 2013): Director of Research for Strategic Asset Allocation (2011-2013), Director of Research for Blend Strategies (2008-2011), Head of Asia Pacific Blend Strategies (2005-2008), Head of Quantitative Research and Senior Portfolio Manager for Japan Value Equities (2001-2005), Portfolio Manager for Emerging Markets Value Equities (1997-2001), and Quantitative Analyst for US Value Equities (1994-1997). A portfolio manager and officer of other portfolios in the OppenheimerFunds complex. |
| |
Caleb Wong, Vice President (since 2005) Year of Birth: 1965 | | Vice President of the Sub-Adviser (since June 1999); Senior Portfolio Manager of the Sub-Adviser (since January 2005); Head of fixed income quantitative research and risk management of the Sub-Adviser (1997-1999) and worked in fixed-income quantitative research and risk management for the Sub-Adviser (since July 1996). A portfolio manager and officer of other portfolios in the OppenheimerFunds complex. |
| |
Cynthia Lo Bessette, Secretary and Chief Legal Officer (since 2016) Year of Birth: 1969 | | Executive Vice President, General Counsel and Secretary of the Manager (since February 2016); Chief Legal Officer of the Sub-Adviser and the Distributor (since February 2016); Vice President, General Counsel and Secretary of Oppenheimer Acquisition Corp. (since February 2016); General Counsel of OFI SteelPath, Inc., VTL Associates, LLC and Index Management Solutions, LLC (since February 2016); Chief Legal Officer of OFI Global Institutional, Inc., HarbourView Asset Management Corporation, OFI Global Trust Company, Oppenheimer Real Asset Management, Inc., OFI Private Investments Inc., Shareholder Services, Inc. and Trinity Investment Management Corporation (since February 2016); Senior Vice President and Deputy General Counsel (March 2015-February 2016) and Executive Vice President, Vice President, Corporate Counsel (February 2012-March 2015) and Deputy Chief Legal Officer (April 2013-March 2015) of Jennison Associates LLC; Assistant General Counsel (April 2008-September 2009) and Deputy General Counsel (October 2009-February 2012) of Lord Abbett & Co. LLC. An officer of 103 portfolios in the OppenheimerFunds complex. |
| |
Jennifer Foxson, Vice President and Chief Business Officer (since 2014) Year of Birth: 1969 | | Senior Vice President of OppenheimerFunds Distributor, Inc. (since June 2014); Vice President of OppenheimerFunds Distributor, Inc. (April 2006-June 2014); Vice President of the Sub-Adviser (January 1998-March 2006); Assistant Vice President of the Sub-Adviser (October 1991-December 1998). An officer of 103 portfolios in the OppenheimerFunds complex. |
|
| 47 OPPENHEIMER PORTFOLIO SERIES ACTIVE ALLOCATION FUND |
TRUSTEES AND OFFICERS Unaudited / Continued
| | |
Mary Ann Picciotto, Vice President and Chief Business Officer (since 2014) Year of Birth: 1969 | | Senior Vice President and Chief Compliance Officer of the Manager (since March 2014); Chief Compliance Officer of the Sub-Adviser, OFI SteelPath, Inc., OFI Global Trust Company, OFI Global Institutional, Inc., Oppenheimer Real Asset Management, Inc., OFI Private Investments, Inc., Harborview Asset Management Corporation, Trinity Investment Management Corporation, and Shareholder Services, Inc. (since March 2014); Managing Director of Morgan Stanley Investment Management Inc. and certain of its various affiliated entities; Chief Compliance Officer of various Morgan Stanley Funds (May 2010-January 2014); Chief Compliance Officer of Morgan Stanley Investment Management Inc. (April 2007-January 2014). An officer of 103 portfolios in the OppenheimerFunds complex. |
| |
Brian S. Petersen, Treasurer and Principal Financial & Accounting Officer (since 2016) Year of Birth: 1970 | | Vice President of the Manager (since January 2013); Vice President of the Sub-Adviser (February 2007-December 2012); Assistant Vice President of the Sub-Adviser (August 2002-2007). An officer of 103 portfolios in the OppenheimerFunds complex. |
The Fund’s Statement of Additional Information contains additional information about the Fund’s Trustees and Officers is available without charge upon request, by calling 1.800.CALL OPP (225.5677).
|
| 48 OPPENHEIMER PORTFOLIO SERIES ACTIVE ALLOCATION FUND |
OPPENHEIMER PORTFOLIO SERIES ACTIVE ALLOCATION FUND
| | |
| Manager | | OFI Global Asset Management, Inc. |
| |
| Sub-Adviser | | OppenheimerFunds, Inc. |
| |
| Distributor | | OppenheimerFunds Distributor, Inc. |
| |
Transfer and Shareholder Servicing Agent | | OFI Global Asset Management, Inc. |
| |
| Sub-Transfer Agent | | Shareholder Services, Inc. DBA OppenheimerFunds Services |
| |
Independent Registered Public Accounting Firm | | KPMG LLP |
| |
| Legal Counsel | | Kramer Levin Naftalis & Frankel LLP |
© 2017 OppenheimerFunds, Inc. All rights reserved.
|
| 49 OPPENHEIMER PORTFOLIO SERIES ACTIVE ALLOCATION FUND |
PRIVACY POLICY NOTICE
As an Oppenheimer fund shareholder, you are entitled to know how we protect your personal information and how we limit its disclosure.
Information Sources
We obtain nonpublic personal information about our shareholders from the following sources:
| • | | Applications or other forms |
| • | | When you create a user ID and password for online account access |
| • | | When you enroll in eDocs Direct,SM our electronic document delivery service |
| • | | Your transactions with us, our affiliates or others |
| • | | Technologies on our website, including: “cookies” and web beacons, which are used to collect data on the pages you visit and the features you use. |
If you visit oppenheimerfunds.com and do not log on to the secure account information areas, we do not obtain any personal information about you. When you do log on to a secure area, we do obtain your user ID and password to identify you. We also use this information to provide you with products and services you have requested, to inform you about products and services that you may be interested in and assist you in other ways.
We do not collect personal information through our website unless you willingly provide it to us, either directly by email or in those areas of the website that request information. In order to update your personal information (including your mailing address, email address and phone number) you must first log on and visit your user profile.
If you have set your browser to warn you before accepting cookies, you will receive the warning message with each cookie. You can refuse cookies by turning them off in your browser. However, doing so may limit your access to certain sections of our website.
We use cookies to help us improve and manage our website. For example, cookies help us recognize new versus repeat visitors to the site, track the pages visited, and enable some special features on the website. This data helps us provide a better service for our website visitors.
Protection of Information
We do not disclose any non-public personal information (such as names on a customer list) about current or former customers to anyone, except as permitted by law.
Disclosure of Information
Copies of confirmations, account statements and other documents reporting activity in your fund accounts are made available to your financial advisor (as designated by you). We may also use details about you and your investments to help us, our financial service affiliates, or firms that jointly market their financial products and services with ours, to better serve your investment needs or suggest educational material that may be of interest to you. If this requires us to provide you with an opportunity to “opt in” or “opt out” of such information sharing with a firm not affiliated with us, you will receive notification on how to do so, before any such sharing takes place.
Right of Refusal
We will not disclose your personal information to unaffiliated third parties (except as permitted by law), unless we first offer you a reasonable opportunity to refuse or “opt out” of such disclosure.
|
| 50 OPPENHEIMER PORTFOLIO SERIES ACTIVE ALLOCATION FUND |
Internet Security and Encryption
In general, the email services provided by our website are encrypted and provide a secure and private means of communication with us. To protect your own privacy, confidential and/or personal information should only be communicated via email when you are advised that you are using a secure website. As a security measure, we do not include personal or account information in non-secure emails, and we advise you not to send such information to us in non-secure emails. Instead, you may take advantage of the secure features of our website to encrypt your email correspondence. To do this, you will need to use a browser that supports Secure Sockets Layer (SSL) protocol.
| • | | All transactions, including redemptions, exchanges and purchases, are secured by SSL and 256-bit encryption. SSL is used to establish a secure connection between your PC and OppenheimerFunds’ server. It transmits information in an encrypted and scrambled format. |
| • | | Encryption is achieved through an electronic scrambling technology that uses a “key” to code and then decode the data. Encryption acts like the cable converter box you may have on your television set. It scrambles data with a secret code so that no one can make sense of it while it is being transmitted. When the data reaches its destination, the same software unscrambles the data. |
| • | | You can exit the secure area by either closing your browser, or for added security, you can use the Log Out button before you close your browser. |
Other Security Measures
We maintain physical, electronic and procedural safeguards to protect your personal account information. Our employees and agents have access to that information only so that they may offer you products or provide services, for example, when responding to your account questions.
How You Can Help
You can also do your part to keep your account information private and to prevent unauthorized transactions. If you obtain a user ID and password for your account, safeguard that information. Also, take special precautions when accessing your account on a computer used by others.
Who We Are
This joint notice describes the privacy policies of the Oppenheimer funds, OppenheimerFunds, Inc., each of its investment adviser subsidiaries, OppenheimerFunds Distributor, Inc. and OFI Global Trust Co. It applies to all Oppenheimer fund accounts you presently have, or may open in the future, using your Social Security number—whether or not you remain a shareholder of our funds. This notice was last updated November 2016. In the event it is updated or changed, we will post an updated notice on our website at oppenheimerfunds.com. If you have any questions about this privacy policy, write to us at P.O. Box 5270, Denver, CO 80217-5270, email us by clicking on the Contact Us section of our website at oppenheimerfunds.com or call us at 1.800.CALL OPP (225.5677).
|
| 51 OPPENHEIMER PORTFOLIO SERIES ACTIVE ALLOCATION FUND |
THIS PAGE INTENTIONALLY LEFT BLANK.
52 OPPENHEIMER PORTFOLIO SERIES ACTIVE ALLOCATION FUND
THIS PAGE INTENTIONALLY LEFT BLANK.
53 OPPENHEIMER PORTFOLIO SERIES ACTIVE ALLOCATION FUND
THIS PAGE INTENTIONALLY LEFT BLANK.
54 OPPENHEIMER PORTFOLIO SERIES ACTIVE ALLOCATION FUND
THIS PAGE INTENTIONALLY LEFT BLANK.
55 OPPENHEIMER PORTFOLIO SERIES ACTIVE ALLOCATION FUND
| | |
| | | 
|
| |
| Visit Us | | Visit us at oppenheimerfunds.com for 24-hr access to account information and transactions or call us at 800.CALL OPP (800.225.5677) for 24-hr automated information and automated transactions. Representatives also available Mon–Fri 8am-8pm ET. |
oppenheimerfunds.com | | |
| |
Call Us | | |
800 225 5677 | | |
| |
Follow Us | | |

| | Oppenheimer funds are distributed by OppenheimerFunds Distributor, Inc. 225 Liberty Street, New York, NY 10281-1008 © 2017 OppenheimerFunds Distributor, Inc. All rights reserved. RA0550.001.0117 March 24, 2017 |

Table of Contents
Class A Shares
AVERAGE ANNUAL TOTAL RETURNS AT 1/31/17
| | | | | | | | | | | | | | |
| | | Class A Shares of the Fund | | | | | | |
| | | Without Sales Charge | | | | With Sales Charge | | | | S&P 500 Index | | | | MSCI World Index |
1-Year | | 13.52% | | | | 6.99% | | | | 20.04% | | | | 17.11% |
5-Year | | 9.15 | | | | 7.87 | | | | 14.09 | | | | 9.86 |
10-Year | | 4.21 | | | | 3.60 | | | | 6.99 | | | | 3.95 |
Performance data quoted represents past performance, which does not guarantee future results. The investment return and principal value of an investment in the Fund will fluctuate so that an investor’s shares, when redeemed, may be worth more or less than their original cost. Fund returns include changes in share price, reinvested distributions, and a 5.75% maximum applicable sales charge except where “without sales charge” is indicated. Current performance may be lower or higher than the performance quoted. Returns do not consider capital gains or income taxes on an individual’s investment. For performance data current to the most recent month-end, visit oppenheimerfunds.com or call 1.800.CALL OPP (225.5677). See Fund prospectuses and summary prospectuses for more information on share classes and sales charges.
2 OPPENHEIMER PORTFOLIO SERIES EQUITY INVESTOR FUND
Fund Performance Discussion1
MARKET OVERVIEW
Markets were volatile this reporting period. Central Bank policy was a major focus this reporting period, with statements and actions from the Federal Reserve (the “Fed”), Bank of Japan (BoJ), European Central Bank (“ECB”), and more, fueling movements in global capital markets. Throughout most of the year, the question of when the Fed would raise interest rates remained. It finally did in the closing month of the reporting period. Improved economic data and outlook led the Fed to hike its policy rates by 0.25% in December, meeting market expectations. The Fed’s policymaking Federal Open Market Committee noted they will continue to be cautious and will hike rates gradually, but posted a modestly optimistic outlook. By year end, markets were pricing for slightly more than two hikes by the end of 2017.
Other major events that created volatility during the year were the United Kingdom’s (“UK”) vote to leave the European Union (commonly referred to as Brexit) and the U.S. Presidential election.
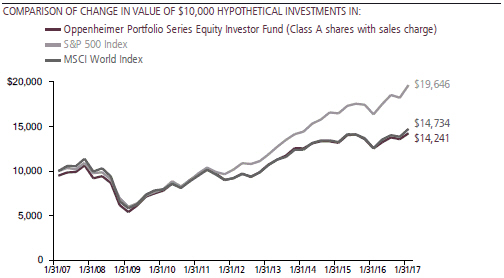
1. The Fund is invested in Class I shares of all underlying funds discussed in this Fund Performance Discussion.
|
| 3 OPPENHEIMER PORTFOLIO SERIES EQUITY INVESTOR FUND |
After Brexit, U.S. markets became extremely volatile for two days. However, the event came and went with most financial assets rallying strong early in the third quarter.
Markets turned to general risk on mode after the surprise election of Donald Trump with equities climbing, credit spreads narrowing to the tightest levels since early 2015, and U.S. Treasury yields climbing to levels not experienced since 2014. The dollar rallied strongly against many currencies, particularly after Mr. Trump’s victory.
In this environment, equities generally produced strong results and outperformed fixed-income securities for the overall one-year period.
FUND REVIEW
Against this market backdrop, the Fund’s Class A shares (without sales charge) produced a total return of 13.52%. In comparison, the Fund’s benchmarks, the S&P 500 Index and the MSCI World Index returned 20.04% and 17.11%, respectively. While all of the underlying funds held in the portfolio produced positive absolute returns, the Fund underperformed these benchmarks in an environment where all underlying foreign equity funds other than Oppenheimer Developing Markets Fund produced a lower return than the MSCI World Index. Oppenheimer Capital Appreciation Fund was a top contributor to the Fund’s absolute results, but its return also underperformed the returns produced by the S&P 500 Index and
the MSCI World Index this reporting period.
The Fund employs a combination of sophisticated quantitative tools and qualitative analysis to seek to construct a well-diversified, globally allocated equity portfolio. The portfolio is allocated among a number of OppenheimerFunds’ actively managed funds according to risk and strategically rebalanced based on market conditions. At period end, the Fund had roughly 52% of its assets invested in domestic equity funds and 48% invested in foreign equity funds.
On an absolute basis, the Fund’s allocation to domestic equity funds was the strongest contributor to performance. Oppenheimer Value Fund was the strongest absolute performer for the Fund this reporting period, followed by Oppenheimer Capital Appreciation Fund. Oppenheimer Value Fund typically invests in large company U.S. value stocks. Value stocks outperformed growth stocks for much of the period, and this benefited Oppenheimer Value Fund’s performance. Oppenheimer Capital Appreciation Fund typically invests in large-cap U.S. growth stocks. Effective October 5, 2016, the new Portfolio Manager of this underlying fund is Paul Larson, who joined OppenheimerFunds in 2013 and has 20 years of investment experience. This underlying fund produced positive results. While still remaining a growth fund, the new portfolio management team has reduced the number of holdings and reduced some previously large sector bets relative to its benchmark, the
|
| 4 OPPENHEIMER PORTFOLIO SERIES EQUITY INVESTOR FUND |
Russell 1000 Growth Index.
All of the underlying foreign equity funds produced positive results for the Fund this period as well, led by Oppenheimer International Equity Fund (named Oppenheimer International Value Fund prior to 12/28/16), Oppenheimer Developing Markets Fund, and Oppenheimer International Growth Fund. Oppenheimer International Equity Fund typically invests in international stocks that its portfolio manager believes are undervalued. This underlying fund favors a blend/core approach, but its emphasis on value stocks this reporting period had a positive impact on performance as value generally outperformed growth for much of the period. Oppenheimer Developing Markets Fund invests in developing market stocks. Developing market stocks performed well in
| | |
 | | 
Mark Hamilton Portfolio Manager |
2016, supported by the bottoming of both oil prices and domestic growth conditions across the emerging markets. Despite performance reversing a bit following the outcome of the U.S. election, the asset class rebounded in January 2017 as the initial negative reaction began to subside. Oppenheimer International Growth Fund invests in a mix of foreign growth stocks. This underlying fund produced positive absolute results during the period, but its performance was held back a degree by its roughly 19% position in the UK at period end, aggravated by weakening pound versus the U.S. dollar. However, most of its UK-domiciled companies are global businesses with revenues from around the world. Translating those revenues into cheaper pounds should flatter their earnings over time.
| | |
 | | 
Dokyoung Lee, CFA Portfolio Manager |
|
| 5 OPPENHEIMER PORTFOLIO SERIES EQUITY INVESTOR FUND |
Top Holdings and Allocations
ASSET CLASS ALLOCATION
| | | | |
| Domestic Equity Funds | | | 52.0% | |
| Foreign Equity Funds | | | 48.0 | |
Portfolio holdings and allocations are subject to change. Percentages are as of January 31, 2017, and are based on the total market value of investments.
TOP HOLDINGS
| | | | |
| Oppenheimer Value Fund, Cl. I | | | 23.6% | |
| Oppenheimer Capital Appreciation Fund, Cl. I | | | 20.2 | |
| Oppenheimer International Growth Fund, Cl. I | | | 18.9 | |
| Oppenheimer International Equity Fund, Cl. I | | | 16.3 | |
| Oppenheimer International Small-Mid Company Fund, Cl. I | | | 6.9 | |
| Oppenheimer Developing Markets Fund, Cl. I | | | 6.0 | |
| Oppenheimer Main Street Mid Cap Fund, Cl. I | | | 4.4 | |
| Oppenheimer Main Street Small Cap Fund, Cl. I | | | 3.7 | |
Portfolio holdings and allocations are subject to change. Percentages are as of January 31, 2017, and are based on net assets. For more current Top 10 Fund holdings, please visit oppenheimerfunds.com.
|
| 6 OPPENHEIMER PORTFOLIO SERIES EQUITY INVESTOR FUND |
Share Class Performance
AVERAGE ANNUAL TOTAL RETURNS WITHOUT SALES CHARGE AS OF 1/31/17
| | | | | | | | |
| | | Inception Date | | 1-Year | | 5-Year | | 10-Year |
| Class A (OAAIX) | | 4/5/05 | | 13.52% | | 9.15% | | 4.21% |
| Class B (OBAIX) | | 4/5/05 | | 12.73 | | 8.32 | | 3.71 |
| Class C (OCAIX) | | 4/5/05 | | 12.71 | | 8.36 | | 3.44 |
| Class R (ONAIX) | | 4/5/05 | | 13.31 | | 8.90 | | 3.99 |
| Class Y (OYAIX) | | 4/5/05 | | 13.88 | | 9.47 | | 4.60 |
|
AVERAGE ANNUAL TOTAL RETURNS WITH SALES CHARGE AS OF 1/31/17 |
| | | Inception Date | | 1-Year | | 5-Year | | 10-Year |
| Class A (OAAIX) | | 4/5/05 | | 6.99% | | 7.87% | | 3.60% |
| Class B (OBAIX) | | 4/5/05 | | 7.73 | | 8.03 | | 3.71 |
| Class C (OCAIX) | | 4/5/05 | | 11.71 | | 8.36 | | 3.44 |
| Class R (ONAIX) | | 4/5/05 | | 13.31 | | 8.90 | | 3.99 |
| Class Y (OYAIX) | | 4/5/05 | | 13.88 | | 9.47 | | 4.60 |
Performance data quoted represents past performance, which does not guarantee future results. The investment return and principal value of an investment in the Fund will fluctuate so that an investor’s shares, when redeemed, may be worth more or less than their original cost. Current performance may be lower or higher than the performance quoted. Returns do not consider capital gains or income taxes on an individual’s investment. For performance data current to the most recent month-end, visit oppenheimerfunds.com or call 1.800. CALL OPP (225.5677). Fund returns include changes in share price, reinvested distributions, and the applicable sales charge: for Class A shares, the current maximum initial sales charge of 5.75%; for Class B shares, the contingent deferred sales charge (“CDSC”) of 5% (1-year) and 2% (5-year); and for Class C shares, the contingent deferred sales charge (“CDSC”) of 1% for the 1-year period. There is no sales charge for Class Y shares. Because Class B shares convert to Class A shares 72 months after purchase, 10-year returns for Class B shares reflect Class A performance for the period after conversion. See Fund prospectuses and summary prospectuses for more information on share classes and sales charges.
The Fund’s performance is compared to the performance of the S&P 500 Index and the MSCI World Index. The S&P 500 Index is a broad-based measure of domestic stock performance. The MSCI World Index is designed to measure the equity market performance of developed markets. The indices are unmanaged and cannot be purchased directly by investors. While index comparisons may be useful to provide a benchmark for the Fund’s performance, it must be noted that the Fund’s investments are not limited to the investments comprising the indices. Index performance includes reinvestment of income, but does not reflect transaction costs, fees, expenses or taxes. Index performance is shown for illustrative purposes only as a benchmark for the Fund’s performance, and does not predict or depict performance of the Fund. The Fund’s performance reflects the effects of the Fund’s business and operating expenses.
7 OPPENHEIMER PORTFOLIO SERIES EQUITY INVESTOR FUND
The Fund’s investment strategy and focus can change over time. The mention of specific fund holdings does not constitute a recommendation by OppenheimerFunds, Inc. or its affiliates.
Before investing in any of the Oppenheimer funds, investors should carefully consider a fund’s investment objectives, risks, charges and expenses. Fund prospectuses and summary prospectuses contain this and other information about the funds, and may be obtained by asking your financial advisor, visiting oppenheimerfunds.com, or calling 1.800.CALL OPP (225.5677). Read prospectuses and summary prospectuses carefully before investing.
Shares of Oppenheimer funds are not deposits or obligations of any bank, are not guaranteed by any bank, are not insured by the FDIC or any other agency, and involve investment risks, including the possible loss of the principal amount invested.
|
| 8 OPPENHEIMER PORTFOLIO SERIES EQUITY INVESTOR FUND |
Fund Expenses
Fund Expenses. As a shareholder of the Fund, you incur two types of costs: (1) transaction costs, which may include sales charges (loads) on purchase payments and/or contingent deferred sales charges on redemptions; and (2) ongoing costs, including management fees; distribution and service fees; and other Fund expenses. These examples are intended to help you understand your ongoing costs (in dollars) of investing in the Fund and to compare these costs with the ongoing costs of investing in other mutual funds.
The examples are based on an investment of $1,000.00 invested at the beginning of the period and held for the entire 6-month period ended January 31, 2017.
Actual Expenses. The first section of the table provides information about actual account values and actual expenses. You may use the information in this section for the class of shares you hold, together with the amount you invested, to estimate the expense that you paid over the period. Simply divide your account value by $1,000.00 (for example, an $8,600.00 account value divided by $1,000.00 = 8.60), then multiply the result by the number in the first section under the heading entitled “Expenses Paid During 6 Months Ended January 31, 2017” to estimate the expenses you paid on your account during this period.
Hypothetical Example for Comparison Purposes. The second section of the table provides information about hypothetical account values and hypothetical expenses based on the Fund’s actual expense ratio for each class of shares, and an assumed rate of return of 5% per year for each class before expenses, which is not the Fund’s actual return. The hypothetical account values and expenses may not be used to estimate the actual ending account balance or expenses you paid for the period. You may use this information to compare the ongoing costs of investing in the Fund and other funds. To do so, compare this 5% hypothetical example for the class of shares you hold with the 5% hypothetical examples that appear in the shareholder reports of the other funds.
Please note that the expenses shown in the table are meant to highlight your ongoing costs only and do not reflect any transactional costs, such as front-end or contingent deferred sales charges (loads). Therefore, the “hypothetical” section of the table is useful in comparing ongoing costs only, and will not help you determine the relative total costs of owning different funds. In addition, if these transactional costs were included, your costs would have been higher.
|
| 9 OPPENHEIMER PORTFOLIO SERIES EQUITY INVESTOR FUND |
| | | | | | |
| Actual | | Beginning Account Value August 1, 2016 | | Ending Account Value January 31, 2017 | | Expenses Paid During 6 Months Ended January 31, 2017 |
| Class A | | $ 1,000.00 | | $ 1,033.90 | | $ 2.46 |
| Class B | | 1,000.00 | | 1,030.30 | | 6.35 |
| Class C | | 1,000.00 | | 1,029.80 | | 6.29 |
| Class R | | 1,000.00 | | 1,032.60 | | 3.74 |
| Class Y | | 1,000.00 | | 1,035.60 | | 1.18 |
| | | |
Hypothetical (5% return before expenses) | | | | | | |
| Class A | | 1,000.00 | | 1,022.72 | | 2.44 |
| Class B | | 1,000.00 | | 1,018.90 | | 6.31 |
| Class C | | 1,000.00 | | 1,018.95 | | 6.26 |
| Class R | | 1,000.00 | | 1,021.47 | | 3.72 |
| Class Y | | 1,000.00 | | 1,023.98 | | 1.17 |
Expenses are equal to the Fund’s annualized expense ratio for that class, multiplied by the average account value over the period, multiplied by 184/366 (to reflect the one-half year period). Those annualized expense ratios, excluding indirect expenses from affiliated funds, based on the 6-month period ended January 31, 2017 are as follows:
| | | | |
| Class | | Expense Ratios | |
| Class A | | | 0.48% | |
| Class B | | | 1.24 | |
| Class C | | | 1.23 | |
| Class R | | | 0.73 | |
| Class Y | | | 0.23 | |
|
| 10 OPPENHEIMER PORTFOLIO SERIES EQUITY INVESTOR FUND |
STATEMENT OF INVESTMENTS January 31, 2017
| | | | | | | | |
| | | Shares | | | Value | |
| Investment Companies—100.0%1 | | | | | | | | |
Domestic Equity Funds—52.0% | | | | | | | | |
| Oppenheimer Capital Appreciation Fund, Cl. I | | | 2,848,778 | | | $ | 161,326,296 | |
| Oppenheimer Main Street Mid Cap Fund, Cl. I | | | 1,199,448 | | | | 35,383,729 | |
| Oppenheimer Main Street Small Cap Fund, Cl. I | | | 2,068,309 | | | | 29,535,454 | |
| Oppenheimer Value Fund, Cl. I | | | 5,326,813 | | | | 188,089,764 | |
| | | | | | | | 414,335,243 | |
Foreign Equity Funds—48.0% | | | | | | | | |
| Oppenheimer Developing Markets Fund, Cl. I | | | 1,419,854 | | | | 47,636,093 | |
| Oppenheimer International Equity Fund, Cl. I | | | 7,355,865 | | | | 129,610,337 | |
| Oppenheimer International Growth Fund, Cl. I | | | 4,236,807 | | | | 150,533,766 | |
| Oppenheimer International Small-Mid Company Fund, Cl. I | | | 1,425,838 | | | | 54,638,105 | |
| | | | | | | | 382,418,301 | |
| Total Investments, at Value (Cost $560,772,147) | | | 100.0% | | | | 796,753,544 | |
| Net Other Assets (Liabilities) | | | 0.0 | | | | 364,027 | |
Net Assets | | | 100.0% | | | $ | 797,117,571 | |
| | | | | | | | |
Footnotes to Statement of Investments
1. Is or was an affiliate, as defined in the Investment Company Act of 1940, as amended, at or during the reporting period, by virtue of the Fund owning at least 5% of the voting securities of the issuer or as a result of the Fund and the issuer having the same investment adviser. Transactions during the reporting period in which the issuer was an affiliate are as follows:
| | | | | | | | | | | | | | | | |
| | | Shares January 29, 2016a | | | Gross Additions | | | Gross
Reductions | | | Shares January 31, 2017 | |
Oppenheimer Capital Appreciation Fund, Cl. I | | | 2,920,033 | | | | 228,959 | | | | 300,214 | | | | 2,848,778 | |
Oppenheimer Developing Markets Fund, Cl. I | | | 1,574,892 | | | | 100,602 | | | | 255,640 | | | | 1,419,854 | |
Oppenheimer International Equity Fund, Cl. Ib | | | 7,817,841 | | | | 531,246 | | | | 993,222 | | | | 7,355,865 | |
Oppenheimer International Growth Fund, Cl. I | | | 4,541,712 | | | | 266,520 | | | | 571,425 | | | | 4,236,807 | |
Oppenheimer International Small- Mid Company Fund, Cl. I | | | 1,505,837 | | | | 56,998 | | | | 136,997 | | | | 1,425,838 | |
Oppenheimer Main Street Mid Cap Fund, Cl. I | | | 1,234,906 | | | | 77,884 | | | | 113,342 | | | | 1,199,448 | |
Oppenheimer Main Street Small Cap Fund, Cl. I | | | 2,213,939 | | | | 99,094 | | | | 244,724 | | | | 2,068,309 | |
Oppenheimer Value Fund, Cl. I | | | 5,591,160 | | | | 315,466 | | | | 579,813 | | | | 5,326,813 | |
| | | | |
| | | | | | Value | | | Income | | | Realized Gain
(Loss) | |
Oppenheimer Capital Appreciation Fund, Cl. Ic | | | | | | $ | 161,326,296 | | | $ | 743,173 | | | $ | (2,252,529) | |
Oppenheimer Developing Markets Fund, Cl. I | | | | | | | 47,636,093 | | | | 331,017 | | | | (850,347) | |
Oppenheimer International Equity Fund, Cl. Ib | | | | | | | 129,610,337 | | | | 3,110,625 | | | | 3,232 | |
Oppenheimer International Growth Fund, Cl. I | | | | | | | 150,533,766 | | | | 2,277,711 | | | | 858 | |
Oppenheimer International Small-Mid Company Fund, Cl. I | | | | | | | 54,638,105 | | | | 322,171 | | | | 375,034 | |
Oppenheimer Main Street Mid Cap Fund, Cl. Id | | | | | | | 35,383,729 | | | | 410,645 | | | | (323,362) | |
Oppenheimer Main Street Small Cap Fund, Cl. I | | | | | | | 29,535,454 | | | | 169,921 | | | | 20,909 | |
|
| 11 OPPENHEIMER PORTFOLIO SERIES EQUITY INVESTOR FUND |
STATEMENT OF INVESTMENTS Continued
Footnotes to Statement of Investments (Continued)
| | | | | | | | | | | | |
| | | Value | | | Income | | | Realized Gain
(Loss) | |
| |
Oppenheimer Value Fund, Cl. I | | $ | 188,089,764 | | | $ | 3,630,348 | | | $ | 171,113 | |
| | | | |
Total | | $ | 796,753,544 | | | $ | 10,995,611 | | | $ | (2,855,092) | |
| | | | |
a. Represents the last business day of the Fund’s reporting period.
b. Prior to December 28, 2016, this fund was named Oppenheimer International Value Fund.
c. This Fund distributed realized gains of $5,886,758.
d. This Fund distributed realized gains of $672,735.
See accompanying Notes to Financial Statements.
|
| 12 OPPENHEIMER PORTFOLIO SERIES EQUITY INVESTOR FUND |
STATEMENT OF ASSETS AND LIABILITIES January 31, 2017
| | | | |
| |
| Assets | | | | |
| Investments, at value affiliated companies (cost $560,772,147)—see accompanying statement of investments | | $ | 796,753,544 | |
| |
| Cash | | | 924,849 | |
| |
Receivables and other assets: | | | | |
| Shares of beneficial interest sold | | | 507,352 | |
| Investments sold | | | 293,946 | |
| Other | | | 38,506 | |
| | | | |
| Total assets | | | 798,518,197 | |
| | | | |
| |
| Liabilities | | | | |
| Payables and other liabilities: | | | | |
| Shares of beneficial interest redeemed | | | 1,157,753 | |
| Distribution and service plan fees | | | 164,258 | |
| Trustees’ compensation | | | 46,308 | |
| Shareholder communications | | | 6,582 | |
| Other | | | 25,725 | |
| | | | |
| Total liabilities | | | 1,400,626 | |
|
| |
Net Assets | | $ | 797,117,571 | |
| | | | |
| | | | |
| |
| Composition of Net Assets | | | | |
| Par value of shares of beneficial interest | | $ | 51,417 | |
| |
| Additional paid-in capital | | | 571,355,993 | |
| |
| Accumulated net investment income | | | 2,059,221 | |
| |
| Accumulated net realized loss on investments | | | (12,330,457) | |
| |
| Net unrealized appreciation on investments | | | 235,981,397 | |
| | | | |
Net Assets | | $ | 797,117,571 | |
| | | | |
|
| 13 OPPENHEIMER PORTFOLIO SERIES EQUITY INVESTOR FUND |
STATEMENT OF ASSETS AND LIABILITIES Continued
| | | | |
| |
| Net Asset Value Per Share | | | | |
Class A Shares: | | | | |
| Net asset value and redemption price per share (based on net assets of $537,926,030 and 34,493,978 shares of beneficial interest outstanding) | | $ | 15.59 | |
| |
| Maximum offering price per share (net asset value plus sales charge of 5.75% of offering price) | | $ | 16.54 | |
| |
| |
Class B Shares: Net asset value, redemption price (excludes applicable contingent deferred sales charge) and offering price per share (based on net assets of $14,087,888 and 920,152 shares of beneficial interest outstanding) | | $ | 15.31 | |
| |
| |
Class C Shares: | | | | |
| Net asset value, redemption price (excludes applicable contingent deferred sales charge) and offering price per share (based on net assets of $180,364,424 and 11,855,767 shares of beneficial interest outstanding) | | $ | 15.21 | |
| |
| |
Class R Shares: | | | | |
| Net asset value, redemption price (excludes applicable contingent deferred sales charge)and offering price per share (based on net assets of $45,222,057 and 2,901,314 shares of beneficial interest outstanding) | | $ | 15.59 | |
| |
| |
Class Y Shares: | | | | |
| Net asset value, redemption price and offering price per share (based on net assets of $19,517,172 and 1,245,685 shares of beneficial interest outstanding) | | $ | 15.67 | |
See accompanying Notes to Financial Statements.
|
| 14 OPPENHEIMER PORTFOLIO SERIES EQUITY INVESTOR FUND |
STATEMENT OF OPERATIONS For the Year Ended January 31, 2017
| | | | |
| |
| Investment Income | | | | |
| Dividends—affiliated companies | | $ | 10,995,611 | |
| |
| Interest | | | 3,319 | |
| | | | |
| Total investment income | | | 10,998,930 | |
|
| |
| Expenses | | | | |
| |
| Distribution and service plan fees: | | | | |
| Class A | | | 1,284,770 | |
| Class B | | | 192,916 | |
| Class C | | | 1,788,477 | |
| Class R | | | 218,953 | |
| |
| Transfer and shareholder servicing agent fees: | | | | |
| Class A | | | 1,149,133 | |
| Class B | | | 42,550 | |
| Class C | | | 394,276 | |
| Class R | | | 96,449 | |
| Class Y | | | 41,472 | |
| |
| Shareholder communications: | | | | |
| Class A | | | 18,346 | |
| Class B | | | 1,272 | |
| Class C | | | 5,168 | |
| Class R | | | 928 | |
| Class Y | | | 148 | |
| |
| Trustees’ compensation | | | 13,342 | |
| |
| Custodian fees and expenses | | | 12,482 | |
| |
| Borrowing fees | | | 6,467 | |
| |
| Other | | | 59,380 | |
| | | | |
| Total expenses | | | 5,326,529 | |
| |
| Net Investment Income | | | 5,672,401 | |
|
| |
| Realized and Unrealized Gain (Loss) | | | | |
| Net realized gain (loss) on: | | | | |
| Investment transactions in affiliated companies | | | (2,855,092) | |
| Distributions received from affiliate companies | | | 6,559,493 | |
| | | | |
| Net realized gain | | | 3,704,401 | |
| |
| Net change in unrealized appreciation/depreciation on investments | | | 88,342,576 | |
| |
| Net Increase in Net Assets Resulting from Operations | | $ | 97,719,378 | |
| | | | |
See accompanying Notes to Financial Statements.
|
| 15 OPPENHEIMER PORTFOLIO SERIES EQUITY INVESTOR FUND |
STATEMENTS OF CHANGES IN NET ASSETS
| | | | | | | | |
| | | Year Ended
January 31, 2017 | | | Year Ended
January 29, 20161 | |
| |
| Operations | | | | | | | | |
| Net investment income | | $ | 5,672,401 | | | $ | 1,879,691 | |
| |
| Net realized gain | | | 3,704,401 | | | | 34,891,896 | |
| |
| Net change in unrealized appreciation/depreciation | | | 88,342,576 | | | | (76,417,991) | |
| | | | |
Net increase (decrease) in net assets resulting from operations | | | 97,719,378 | | | | (39,646,404) | |
| |
| Dividends and/or Distributions to Shareholders | | | | | | | | |
| Dividends from net investment income: | | | | | | | | |
| Class A | | | (5,575,647) | | | | (6,723,531) | |
| Class B | | | — | | | | (59,463) | |
| Class C | | | (591,489) | | | | (935,615) | |
| Class R | | | (349,363) | | | | (422,436) | |
| Class Y | | | (245,471) | | | | (332,338) | |
| | | | |
| | | (6,761,970) | | | | (8,473,383) | |
|
| |
| Distributions from net realized gain: | | | | | | | | |
| Class A | | | (4,099,293) | | | | — | |
| Class B | | | (119,006) | | | | — | |
| Class C | | | (1,418,042) | | | | — | |
| Class R | | | (339,397) | | | | — | |
| Class Y | | | (146,998) | | | | — | |
| | | | |
| | | (6,122,736) | | | | — | |
| | | | | | | | |
| |
| Beneficial Interest Transactions | | | | | | | | |
| Net increase (decrease) in net assets resulting from beneficial interest transactions: | | | | | | | | |
| Class A | | | (11,235,256) | | | | 11,464,024 | |
| Class B | | | (14,060,658) | | | | (17,635,431) | |
| Class C | | | (11,593,850) | | | | (3,510,477) | |
| Class R | | | (658,299) | | | | (5,508,573) | |
| Class Y | | | (3,119,990) | | | | 1,604,477 | |
| | | | |
| | | (40,668,053) | | | | (13,585,980) | |
|
| |
| Net Assets | | | | | | | | |
| Total increase (decrease) | | | 44,166,619 | | | | (61,705,767) | |
| |
| Beginning of period | | | 752,950,952 | | | | 814,656,719 | |
| | | | |
| End of period (including accumulated net investment income of $2,059,221 and $2,911,760, respectively) | | $ | 797,117,571 | | | $ | 752,950,952 | |
| | | | |
1. January 29, 2016 represents the last business day of the Fund’s reporting period.
See accompanying Notes to Financial Statements.
|
| 16 OPPENHEIMER PORTFOLIO SERIES EQUITY INVESTOR FUND |
FINANCIAL HIGHLIGHTS
| | | | | | | | | | | | | | | | | | | | |
| Class A | | Year Ended January 31, 2017 | | | Year Ended January 29, 20161 | | | Year Ended January 30, 20151 | | | Year Ended January 31, 2014 | | | Year Ended January 31, 2013 | |
| |
| Per Share Operating Data | | | | | | | | | | | | | | | | | | | | |
| Net asset value, beginning of period | | | $13.99 | | | | $14.87 | | | | $14.28 | | | | $12.30 | | | | $10.62 | |
| |
| Income (loss) from investment operations: | | | | | | | | | | | | | | | | | | | | |
| Net investment income2 | | | 0.14 | | | | 0.07 | | | | 0.11 | | | | 0.12 | | | | 0.11 | |
| Net realized and unrealized gain (loss) | | | 1.74 | | | | (0.76) | | | | 0.60 | | | | 1.97 | | | | 1.66 | |
| | | | |
| Total from investment operations | | | 1.88 | | | | (0.69) | | | | 0.71 | | | | 2.09 | | | | 1.77 | |
| |
| Dividends and/or distributions to shareholders: | | | | | | | | | | | | | | | | | | | | |
| Dividends from net investment income | | | (0.16) | | | | (0.19) | | | | (0.12) | | | | (0.11) | | | | (0.09) | |
| Distributions from net realized gain | | | (0.12) | | | | 0.00 | | | | 0.00 | | | | 0.00 | | | | 0.00 | |
| | | | |
| Total dividends and/or distributions to shareholders | | | (0.28) | | | | (0.19) | | | | (0.12) | | | | (0.11) | | | | (0.09) | |
| |
| Net asset value, end of period | | | $15.59 | | | | $13.99 | | | | $14.87 | | | | $14.28 | | | | $12.30 | |
| | | | |
| | | | |
|
| |
| Total Return, at Net Asset Value3 | | | 13.52% | | | | (4.78)% | | | | 4.99% | | | | 16.95% | | | | 16.73% | |
|
| |
| Ratios/Supplemental Data | | | | | | | | | | | | | | | | | | | | |
| Net assets, end of period (in thousands) | | | $537,926 | | | | $492,539 | | | | $513,521 | | | | $482,285 | | | | $388,790 | |
| |
| Average net assets (in thousands) | | | $522,301 | | | | $533,833 | | | | $519,483 | | | | $442,886 | | | | $350,996 | |
| |
| Ratios to average net assets:4 | | | | | | | | | | | | | | | | | | | | |
| Net investment income | | | 0.93% | | | | 0.45% | | | | 0.72% | | | | 0.88% | | | | 0.99% | |
| Expenses excluding specific expenses listed below | | | 0.48% | | | | 0.48% | | | | 0.48% | | | | 0.48% | | | | 0.47% | |
| Interest and fees from borrowings | | | 0.00%5 | | | | 0.00%5 | | | | 0.00% | | | | 0.00% | | | | 0.00% | |
| | | | |
| Total expenses6 | | | 0.48% | | | | 0.48% | | | | 0.48% | | | | 0.48% | | | | 0.47% | |
| Expenses after payments, waivers and/or reimbursements and reduction to custodian expenses | | | 0.48% | | | | 0.48% | | | | 0.48% | | | | 0.47% | | | | 0.47% | |
| |
| Portfolio turnover rate | | | 6% | | | | 8% | | | | 10% | | | | 6% | | | | 17% | |
1. Represents the last business day of the Fund’s reporting period.
2. Per share amounts calculated based on the average shares outstanding during the period.
3. Assumes an initial investment on the business day before the first day of the fiscal period, with all dividends and distributions reinvested in additional shares on the reinvestment date, and redemption at the net asset value calculated on the last business day of the fiscal period. Sales charges are not reflected in the total returns. Total returns are not annualized for periods less than one full year. Returns do not reflect the deduction of taxes that a shareholder would pay on fund distributions or the redemption of fund shares.
4. Annualized for periods less than one full year.
5. Less than 0.005%.
6. Total expenses including indirect expenses from affiliated fund fees and expenses were as follows:
| | | | | | | | |
Year Ended January 31, 2017 | | | 1.18% | | | | | |
Year Ended January 29, 2016 | | | 1.16% | | | | | |
Year Ended January 30, 2015 | | | 1.17% | | | | | |
Year Ended January 31, 2014 | | | 1.23% | | | | | |
Year Ended January 31, 2013 | | | 1.22% | | | | | |
See accompanying Notes to Financial Statements.
|
| 17 OPPENHEIMER PORTFOLIO SERIES EQUITY INVESTOR FUND |
FINANCIAL HIGHLIGHTS Continued
| | | | | | | | | | | | | | | | | | | | |
| Class B | | Year Ended January 31, 2017 | | | Year Ended January 29, 20161 | | | Year Ended January 30, 20151 | | | Year Ended January 31, 2014 | | | Year Ended January 31, 2013 | |
| |
| Per Share Operating Data | | | | | | | | | | | | | | | | | | | | |
| Net asset value, beginning of period | | | $13.69 | | | | $14.52 | | | | $13.93 | | | | $12.01 | | | | $10.37 | |
| |
| Income (loss) from investment operations: | | | | | | | | | | | | | | | | | | | | |
| Net investment income (loss)2 | | | (0.01) | | | | (0.07) | | | | (0.02) | | | | (0.02) | | | | 0.00 | |
| Net realized and unrealized gain (loss) | | | 1.75 | | | | (0.73) | | | | 0.61 | | | | 1.94 | | | | 1.64 | |
| | | | |
| Total from investment operations | | | 1.74 | | | | (0.80) | | | | 0.59 | | | | 1.92 | | | | 1.64 | |
| |
| Dividends and/or distributions to shareholders: | | | | | | | | | | | | | | | | | | | | |
| Dividends from net investment income | | | 0.00 | | | | (0.03) | | | | 0.00 | | | | 0.00 | | | | 0.00 | |
| Distributions from net realized gain | | | (0.12) | | | | 0.00 | | | | 0.00 | | | | 0.00 | | | | 0.00 | |
| | | | |
| Total dividends and/or distributions to shareholders | | | (0.12) | | | | (0.03) | | | | 0.00 | | | | 0.00 | | | | 0.00 | |
| |
| Net asset value, end of period | | | $15.31 | | | | $13.69 | | | | $14.52 | | | | $13.93 | | | | $12.01 | |
| | | | |
| | | | |
|
| |
| Total Return, at Net Asset Value3 | | | 12.73% | | | | (5.52)% | | | | 4.24% | | | | 15.99% | | | | 15.82% | |
|
| |
| Ratios/Supplemental Data | | | | | | | | | | | | | | | | | | | | |
| Net assets, end of period (in thousands) | | | $14,088 | | | | $25,864 | | | | $44,518 | | | | $63,602 | | | | $72,843 | |
| |
| Average net assets (in thousands) | | | $19,291 | | | | $35,961 | | | | $55,111 | | | | $68,259 | | | | $75,680 | |
| |
| Ratios to average net assets:4 | | | | | | | | | | | | | | | | | | | | |
| Net investment income (loss) | | | (0.07)% | | | | (0.44)% | | | | (0.14)% | | | | (0.12)% | | | | 0.03% | |
| Expenses excluding specific expenses listed below | | | 1.24% | | | | 1.23% | | | | 1.23% | | | | 1.25% | | | | 1.30% | |
| Interest and fees from borrowings | | | 0.00%5 | | | | 0.00%5 | | | | 0.00% | | | | 0.00% | | | | 0.00% | |
| | | | |
| Total expenses6 | | | 1.24% | | | | 1.23% | | | | 1.23% | | | | 1.25% | | | | 1.30% | |
| Expenses after payments, waivers and/or reimbursements and reduction to custodian expenses | | | 1.24% | | | | 1.23% | | | | 1.23% | | | | 1.24% | | | | 1.30% | |
| |
| Portfolio turnover rate | | | 6% | | | | 8% | | | | 10% | | | | 6% | | | | 17% | |
1. Represents the last business day of the Fund’s reporting period.
2. Per share amounts calculated based on the average shares outstanding during the period.
3. Assumes an initial investment on the business day before the first day of the fiscal period, with all dividends and distributions reinvested in additional shares on the reinvestment date, and redemption at the net asset value calculated on the last business day of the fiscal period. Sales charges are not reflected in the total returns. Total returns are not annualized for periods less than one full year. Returns do not reflect the deduction of taxes that a shareholder would pay on fund distributions or the redemption of fund shares.
4. Annualized for periods less than one full year.
5. Less than 0.005%.
6. Total expenses including indirect expenses from affiliated fund fees and expenses were as follows:
| | | | | | | | |
Year Ended January 31, 2017 | | | 1.94% | | | | | |
Year Ended January 29, 2016 | | | 1.91% | | | | | |
Year Ended January 30, 2015 | | | 1.92% | | | | | |
Year Ended January 31, 2014 | | | 2.00% | | | | | |
Year Ended January 31, 2013 | | | 2.05% | | | | | |
See accompanying Notes to Financial Statements.
|
| 18 OPPENHEIMER PORTFOLIO SERIES EQUITY INVESTOR FUND |
| | | | | | | | | | | | | | | | | | | | |
| Class C | | Year Ended
January 31,
2017 | | | Year Ended
January 29,
20161 | | | Year Ended
January 30,
20151 | | | Year Ended
January 31,
2014 | | | Year Ended
January 31,
2013 | |
| |
| Per Share Operating Data | | | | | | | | | | | | | | | | | | | | |
| Net asset value, beginning of period | | | $13.65 | | | | $14.52 | | | | $13.94 | | | | $12.02 | | | | $10.38 | |
| |
| Income (loss) from investment operations: | | | | | | | | | | | | | | | | | | | | |
| Net investment income (loss)2 | | | 0.02 | | | | (0.05) | | | | 0.00 | | | | 0.02 | | | | 0.02 | |
| Net realized and unrealized gain (loss) | | | 1.71 | | | | (0.75) | | | | 0.59 | | | | 1.92 | | | | 1.63 | |
| | | | |
| Total from investment operations | | | 1.73 | | | | (0.80) | | | | 0.59 | | | | 1.94 | | | | 1.65 | |
| |
| Dividends and/or distributions to shareholders: | | | | | | | | | | | | | | | | | | | | |
| Dividends from net investment income | | | (0.05) | | | | (0.07) | | | | (0.01) | | | | (0.02) | | | | (0.01) | |
| Distributions from net realized gain | | | (0.12) | | | | 0.00 | | | | 0.00 | | | | 0.00 | | | | 0.00 | |
| | | | |
| Total dividends and/or distributions to shareholders | | | (0.17) | | | | (0.07) | | | | (0.01) | | | | (0.02) | | | | (0.01) | |
| |
| Net asset value, end of period | | | $15.21 | | | | $13.65 | | | | $14.52 | | | | $13.94 | | | | $12.02 | |
| | | | |
| | | | |
|
| |
| Total Return, at Net Asset Value3 | | | 12.71% | | | | (5.51)% | | | | 4.22% | | | | 16.11% | | | | 15.91% | |
|
| |
| Ratios/Supplemental Data | | | | | | | | | | | | | | | | | | | | |
| Net assets, end of period (in thousands) | | | $180,365 | | | | $172,605 | | | | $186,923 | | | | $177,813 | | | | $150,848 | |
| |
| Average net assets (in thousands) | | | $179,171 | | | | $189,362 | | | | $189,422 | | | | $164,340 | | | | $139,727 | |
| |
| Ratios to average net assets:4 | | | | | | | | | | | | | | | | | | | | |
| Net investment income (loss) | | | 0.16% | | | | (0.31)% | | | | (0.02)% | | | | 0.12% | | | | 0.22% | |
| Expenses excluding specific expenses listed below | | | 1.23% | | | | 1.23% | | | | 1.22% | | | | 1.23% | | | | 1.21% | |
| Interest and fees from borrowings | | | 0.00%5 | | | | 0.00%5 | | | | 0.00% | | | | 0.00% | | | | 0.00% | |
| | | | |
| Total expenses6 | | | 1.23% | | | | 1.23% | | | | 1.22% | | | | 1.23% | | | | 1.21% | |
| Expenses after payments, waivers and/or reimbursements and reduction to custodian expenses | | | 1.23% | | | | 1.23% | | | | 1.22% | | | | 1.22% | | | | 1.21% | |
| |
| Portfolio turnover rate | | | 6% | | | | 8% | | | | 10% | | | | 6% | | | | 17% | |
1. Represents the last business day of the Fund’s reporting period.
2. Per share amounts calculated based on the average shares outstanding during the period.
3. Assumes an initial investment on the business day before the first day of the fiscal period, with all dividends and distributions reinvested in additional shares on the reinvestment date, and redemption at the net asset value calculated on the last business day of the fiscal period. Sales charges are not reflected in the total returns. Total returns are not annualized for periods less than one full year. Returns do not reflect the deduction of taxes that a shareholder would pay on fund distributions or the redemption of fund shares.
4. Annualized for periods less than one full year.
5. Less than 0.005%.
6. Total expenses including indirect expenses from affiliated fund fees and expenses were as follows:
| | | | | | | | |
Year Ended January 31, 2017 | | | 1.93% | | | | | |
Year Ended January 29, 2016 | | | 1.91% | | | | | |
Year Ended January 30, 2015 | | | 1.91% | | | | | |
Year Ended January 31, 2014 | | | 1.98% | | | | | |
Year Ended January 31, 2013 | | | 1.96% | | | | | |
See accompanying Notes to Financial Statements.
|
| 19 OPPENHEIMER PORTFOLIO SERIES EQUITY INVESTOR FUND |
FINANCIAL HIGHLIGHTS Continued
| | | | | | | | | | | | | | | | | | | | |
| Class R | | Year Ended
January 31,
2017 | | | Year Ended
January 29,
20161 | | | Year Ended
January 30,
20151 | | | Year Ended
January 31,
2014 | | | Year Ended
January 31,
2013 | |
| |
| Per Share Operating Data | | | | | | | | | | | | | | | | | | | | |
| Net asset value, beginning of period | | | $13.98 | | | | $14.86 | | | | $14.25 | | | | $12.27 | | | | $10.59 | |
| |
| Income (loss) from investment operations: | | | | | | | | | | | | | | | | | | | | |
| Net investment income2 | | | 0.10 | | | | 0.03 | | | | 0.06 | | | | 0.06 | | | | 0.07 | |
| Net realized and unrealized gain (loss) | | | 1.75 | | | | (0.77) | | | | 0.62 | | | | 1.99 | | | | 1.67 | |
| | | | |
| Total from investment operations | | | 1.85 | | | | (0.74) | | | | 0.68 | | | | 2.05 | | | | 1.74 | |
| |
| Dividends and/or distributions to shareholders: | | | | | | | | | | | | | | | | | | | | |
| Dividends from net investment income | | | (0.12) | | | | (0.14) | | | | (0.07) | | | | (0.07) | | | | (0.06) | |
| Distributions from net realized gain | | | (0.12) | | | | 0.00 | | | | 0.00 | | | | 0.00 | | | | 0.00 | |
| | | | |
| Total dividends and/or distributions to shareholders | | | (0.24) | | | | (0.14) | | | | (0.07) | | | | (0.07) | | | | (0.06) | |
| |
| Net asset value, end of period | | | $15.59 | | | | $13.98 | | | | $14.86 | | | | $14.25 | | | | $12.27 | |
| | | | |
| | | | |
|
| |
| Total Return, at Net Asset Value3 | | | 13.31% | | | | (5.02)% | | | | 4.77% | | | | 16.68% | | | | 16.43% | |
|
| |
| Ratios/Supplemental Data | | | | | | | | | | | | | | | | | | | | |
| Net assets, end of period (in thousands) | | | $45,222 | | | | $41,159 | | | | $49,122 | | | | $52,433 | | | | $53,846 | |
| |
| Average net assets (in thousands) | | | $43,838 | | | | $48,259 | | | | $52,717 | | | | $54,751 | | | | $55,283 | |
| |
| Ratios to average net assets:4 | | | | | | | | | | | | | | | | | | | | |
| Net investment income | | | 0.68% | | | | 0.19% | | | | 0.43% | | | | 0.46% | | | | 0.62% | |
| Expenses excluding specific expenses listed below | | | 0.73% | | | | 0.73% | | | | 0.73% | | | | 0.71% | | | | 0.69% | |
| Interest and fees from borrowings | | | 0.00%5 | | | | 0.00%5 | | | | 0.00% | | | | 0.00% | | | | 0.00% | |
| | | | |
| Total expenses6 | | | 0.73% | | | | 0.73% | | | | 0.73% | | | | 0.71% | | | | 0.69% | |
| Expenses after payments, waivers and/or reimbursements and reduction to custodian expenses | | | 0.73% | | | | 0.73% | | | | 0.73% | | | | 0.70% | | | | 0.69% | |
| |
| Portfolio turnover rate | | | 6% | | | | 8% | | | | 10% | | | | 6% | | | | 17% | |
1. Represents the last business day of the Fund’s reporting period.
2. Per share amounts calculated based on the average shares outstanding during the period.
3. Assumes an initial investment on the business day before the first day of the fiscal period, with all dividends and distributions reinvested in additional shares on the reinvestment date, and redemption at the net asset value calculated on the last business day of the fiscal period. Sales charges are not reflected in the total returns. Total returns are not annualized for periods less than one full year. Returns do not reflect the deduction of taxes that a shareholder would pay on fund distributions or the redemption of fund shares.
4. Annualized for periods less than one full year.
5. Less than 0.005%.
6. Total expenses including indirect expenses from affiliated fund fees and expenses were as follows:
| | | | | | | | |
Year Ended January 31, 2017 | | | 1.43% | | | | | |
Year Ended January 29, 2016 | | | 1.41% | | | | | |
Year Ended January 30, 2015 | | | 1.42% | | | | | |
Year Ended January 31, 2014 | | | 1.46% | | | | | |
Year Ended January 31, 2013 | | | 1.44% | | | | | |
See accompanying Notes to Financial Statements.
|
| 20 OPPENHEIMER PORTFOLIO SERIES EQUITY INVESTOR FUND |
| | | | | | | | | | | | | | | | | | | | |
| Class Y | | Year Ended
January 31,
2017 | | | Year Ended
January 29,
20161 | | | Year Ended
January 30,
20151 | | | Year Ended
January 31,
2014 | | | Year Ended
January 31,
2013 | |
| |
| Per Share Operating Data | | | | | | | | | | | | | | | | | | | | |
| Net asset value, beginning of period | | | $14.05 | | | | $14.94 | | | | $14.34 | | | | $12.35 | | | | $10.66 | |
| |
| Income (loss) from investment operations: | | | | | | | | | | | | | | | | | | | | |
| Net investment income2 | | | 0.18 | | | | 0.11 | | | | 0.15 | | | | 0.16 | | | | 0.15 | |
| Net realized and unrealized gain (loss) | | | 1.76 | | | | (0.77) | | | | 0.60 | | | | 1.98 | | | | 1.68 | |
| | | | |
| Total from investment operations | | | 1.94 | | | | (0.66) | | | | 0.75 | | | | 2.14 | | | | 1.83 | |
| |
| Dividends and/or distributions to shareholders: | | | | | | | | | | | | | | | | | | | | |
| Dividends from net investment income | | | (0.20) | | | | (0.23) | | | | (0.15) | | | | (0.15) | | | | (0.14) | |
| Distributions from net realized gain | | | (0.12) | | | | 0.00 | | | | 0.00 | | | | 0.00 | | | | 0.00 | |
| | | | |
| Total dividends and/or distributions to shareholders | | | (0.32) | | | | (0.23) | | | | (0.15) | | | | (0.15) | | | | (0.14) | |
| |
| Net asset value, end of period | | | $15.67 | | | | $14.05 | | | | $14.94 | | | | $14.34 | | | | $12.35 | |
| | | | |
| | | | |
|
| |
| Total Return, at Net Asset Value3 | | | 13.88% | | | | (4.53)% | | | | 5.24% | | | | 17.27% | | | | 17.20% | |
|
| |
| Ratios/Supplemental Data | | | | | | | | | | | | | | | | | | | | |
| Net assets, end of period (in thousands) | | | $19,517 | | | | $20,784 | | | | $20,573 | | | | $20,263 | | | | $15,778 | |
| |
| Average net assets (in thousands) | | | $18,820 | | | | $22,268 | | | | $20,881 | | | | $17,842 | | | | $14,008 | |
| |
| Ratios to average net assets:4 | | | | | | | | | | | | | | | | | | | | |
| Net investment income | | | 1.18% | | | | 0.71% | | | | 1.00% | | | | 1.21% | | | | 1.35% | |
| Expenses excluding specific expenses listed below | | | 0.23% | | | | 0.23% | | | | 0.23% | | | | 0.18% | | | | 0.08% | |
| Interest and fees from borrowings | | | 0.00%5 | | | | 0.00%5 | | | | 0.00% | | | | 0.00% | | | | 0.00% | |
| | | | |
| Total expenses6 | | | 0.23% | | | | 0.23% | | | | 0.23% | | | | 0.18% | | | | 0.08% | |
| Expenses after payments, waivers and/or reimbursements and reduction to custodian expenses | | | 0.23% | | | | 0.23% | | | | 0.23% | | | | 0.17% | | | | 0.08% | |
| |
| Portfolio turnover rate | | | 6% | | | | 8% | | | | 10% | | | | 6% | | | | 17% | |
1. Represents the last business day of the Fund’s reporting period.
2. Per share amounts calculated based on the average shares outstanding during the period.
3. Assumes an initial investment on the business day before the first day of the fiscal period, with all dividends and distributions reinvested in additional shares on the reinvestment date, and redemption at the net asset value calculated on the last business day of the fiscal period. Sales charges are not reflected in the total returns. Total returns are not annualized for periods less than one full year. Returns do not reflect the deduction of taxes that a shareholder would pay on fund distributions or the redemption of fund shares.
4. Annualized for periods less than one full year.
5. Less than 0.005%.
6. Total expenses including indirect expenses from affiliated fund fees and expenses were as follows:
| | | | | | | | |
Year Ended January 31, 2017 | | | 0.93% | | | | | |
Year Ended January 29, 2016 | | | 0.91% | | | | | |
Year Ended January 30, 2015 | | | 0.92% | | | | | |
Year Ended January 31, 2014 | | | 0.93% | | | | | |
Year Ended January 31, 2013 | | | 0.83% | | | | | |
See accompanying Notes to Financial Statements
|
| 21 OPPENHEIMER PORTFOLIO SERIES EQUITY INVESTOR FUND |
NOTES TO FINANCIAL STATEMENTS January 31, 2017
1. Organization
Oppenheimer Portfolio Series (the “Trust”) is registered under the Investment Company Act of 1940 (“1940 Act”), as amended, as a diversified open-end management investment company. Equity Investor Fund (the “Fund”) is a series of the Trust whose investment objective is to seek capital appreciation. The Fund normally invests in a diversified portfolio of Oppenheimer mutual funds (individually, an “Underlying Fund” and collectively, the “Underlying Funds”). The Fund’s investment adviser is OFI Global Asset Management, Inc. (“OFI Global” or the “Manager”), a wholly-owned subsidiary of OppenheimerFunds, Inc. (“OFI” or the “Sub-Adviser”). The Manager has entered into a sub-advisory agreement with OFI.
The Fund offers Class A, Class C, Class R and Class Y shares, and previously offered Class B shares for new purchase through June 29, 2012. Subsequent to that date, no new purchases of Class B shares are permitted, however reinvestment of dividend and/or capital gain distributions and exchanges of Class B shares into and from other Oppenheimer funds are allowed. As of July 1, 2014, Class N shares were renamed Class R shares. Class N shares subject to a CDSC on July 1, 2014, will continue to be subject to a CDSC after the shares are renamed. Purchases of Class R shares occurring on or after July 1, 2014, will not be subject to a CDSC upon redemption. Class A shares are sold at their offering price, which is normally net asset value plus a front-end sales charge. Class C and Class R shares are sold, and Class B shares were sold, without a front-end sales charge but may be subject to a contingent deferred sales charge (“CDSC”). Class R shares are sold only through retirement plans. Retirement plans that offer Class R shares may impose charges on those accounts. Class Y shares are sold to certain institutional investors or intermediaries without either a front-end sales charge or a CDSC, however, the intermediaries may impose charges on their accountholders who beneficially own Class Y shares. All classes of shares have identical rights and voting privileges with respect to the Fund in general and exclusive voting rights on matters that affect that class alone. Earnings, net assets and net asset value per share may differ due to each class having its own expenses, such as transfer and shareholder servicing agent fees and shareholder communications, directly attributable to that class. Class A, B, C and R shares have separate distribution and/or service plans under which they pay fees. Class Y shares do not pay such fees. Class B shares will automatically convert to Class A shares 72 months after the date of purchase.
The following is a summary of significant accounting policies followed in the Fund’s preparation of financial statements in accordance with accounting principles generally accepted in the United States (“U.S. GAAP”).
2. Significant Accounting Policies
Security Valuation. All investments in securities are recorded at their estimated fair value, as described in Note 3.
Allocation of Income, Expenses, Gains and Losses. Income, expenses (other than those attributable to a specific class), gains and losses are allocated on a daily basis to each class of shares based upon the relative proportion of net assets represented by such class. Operating
|
| 22 OPPENHEIMER PORTFOLIO SERIES EQUITY INVESTOR FUND |
2. Significant Accounting Policies (Continued)
expenses directly attributable to a specific class are charged against the operations of that class.
Dividends and Distributions to Shareholders. Dividends and distributions to shareholders, which are determined in accordance with income tax regulations and may differ from U.S. GAAP, are recorded on the ex-dividend date. Income and capital gain distributions, if any, are declared and paid annually or at other times as deemed necessary by the Manager.
Investment Income. Dividend distributions received from the Underlying Funds are recorded on the ex-dividend date. Upon receipt of notification from an Underlying Fund, and subsequent to the ex-dividend date, some of the dividend income originally recorded by the Fund may be reclassified as a tax return of capital by reducing the cost basis of the Underlying Fund and/or increasing the realized gain on sales of investments in the Underlying Fund.
Custodian Fees. “Custodian fees and expenses” in the Statement of Operations may include interest expense incurred by the Fund on any cash overdrafts of its custodian account during the period. Such cash overdrafts may result from the effects of failed trades in portfolio securities and from cash outflows resulting from unanticipated shareholder redemption activity. The Fund pays interest to its custodian on such cash overdraft at a rate equal to the Prime Rate plus 0.35%. The “Reduction to custodian expenses” line item, if applicable, represents earnings on cash balances maintained by the Fund during the period. Such interest expense and other custodian fees may be paid with these earnings.
Security Transactions. Security transactions are recorded on the trade date. Realized gains and losses on securities sold are determined on the basis of identified cost.
Indemnifications. The Fund’s organizational documents provide current and former Trustees and officers with a limited indemnification against liabilities arising in connection with the performance of their duties to the Fund. In the normal course of business, the Fund may also enter into contracts that provide general indemnifications. The Fund’s maximum exposure under these arrangements is unknown as this would be dependent on future claims that may be made against the Fund. The risk of material loss from such claims is considered remote.
Federal Taxes. The Fund intends to comply with provisions of the Internal Revenue Code applicable to regulated investment companies and to distribute substantially all of its investment company taxable income, including any net realized gain on investments not offset by capital loss carryforwards, if any, to shareholders. Therefore, no federal income or excise tax provision is required. The Fund files income tax returns in U.S. federal and applicable state jurisdictions. The statute of limitations on the Fund’s tax return filings generally remains open for the three preceding fiscal reporting period ends. The Fund has analyzed its tax positions for the fiscal year ended January 31, 2017, including open tax years, and does not believe there are any uncertain tax positions requiring recognition in the Fund’s financial statements.
|
| 23 OPPENHEIMER PORTFOLIO SERIES EQUITY INVESTOR FUND |
NOTES TO FINANCIAL STATEMENTS Continued
2. Significant Accounting Policies (Continued)
The tax components of capital shown in the following table represent distribution requirements the Fund must satisfy under the income tax regulations, losses the Fund may be able to offset against income and gains realized in future years and unrealized appreciation or depreciation of securities and other investments for federal income tax purposes.
| | | | | | | | | | | | |
| | | | | | | | | Net Unrealized | |
| | | | | | | | | Appreciation | |
| | | | | | | | | Based on cost of | |
| | | | | | | | | Securities and | |
| Undistributed | | Undistributed | | | Accumulated | | | Other Investments | |
| Net Investment | | Long-Term | | | Loss | | | for Federal Income | |
| Income | | Gain | | | Carryforward1,2 | | | Tax Purposes | |
| |
$2,104,415 | | | $3,416,324 | | | | $— | | | | $220,234,619 | |
1. During the reporting period, the Fund did not utilize any capital loss carryforward.
2. During the previous reporting period, the Fund utilized $29,335,607 of capital loss carryforward to offset capital gains realized in that fiscal year.
Net investment income (loss) and net realized gain (loss) may differ for financial statement and tax purposes. The character of dividends and distributions made during the fiscal year from net investment income or net realized gains are determined in accordance with federal income tax requirements, which may differ from the character of net investment income or net realized gains presented in those financial statements in accordance with U.S. GAAP. Also, due to timing of dividends and distributions, the fiscal year in which amounts are distributed may differ from the fiscal year in which the income or net realized gain was recorded by the Fund.
Accordingly, the following amounts have been reclassified for the reporting period. Net assets of the Fund were unaffected by the reclassifications.
| | | | | | | | |
| | | Increase | | | Increase | |
| | | to Accumulated | | | to Accumulated Net | |
| Increase | | Net Investment | | | Realized Loss | |
| to Paid-in Capital | | Income | | | on Investments3 | |
| |
$370,457 | | | $237,030 | | | | $607,487 | |
3. $370,457, all of which was long-term capital gain, was distributed in connection with Fund share redemptions.
The tax character of distributions paid during the reporting periods:
| | | | | | | | |
| | | Year Ended | | | Year Ended | |
| | | January 31, 2017 | | | January 31, 2016 | |
| |
Distributions paid from: | | | | | | | | |
Ordinary income | | $ | 6,761,970 | | | $ | 8,473,383 | |
Long-term capital gain | | | 6,122,736 | | | | — | |
| | | | |
Total | | $ | 12,884,706 | | | $ | 8,473,383 | |
| | | | |
The aggregate cost of securities and other investments and the composition of unrealized appreciation and depreciation of securities and other investments for federal income tax purposes at period end are noted in the following table. The primary difference between
|
| 24 OPPENHEIMER PORTFOLIO SERIES EQUITY INVESTOR FUND |
2. Significant Accounting Policies (Continued)
book and tax appreciation or depreciation of securities and other investments, if applicable, is attributable to the tax deferral of losses or tax realization of financial statement unrealized gain or loss.
| | | | |
Federal tax cost of securities | | $ | 576,518,925 | |
| | | | |
Gross unrealized appreciation | | $ | 220,234,619 | |
Gross unrealized depreciation | | | — | |
| | | | |
Net unrealized appreciation | | $ | 220,234,619 | |
| | | | |
Use of Estimates. The preparation of financial statements in conformity with U.S. GAAP requires management to make estimates and assumptions that affect the reported amounts of assets and liabilities and disclosure of contingent assets and liabilities at the date of the financial statements and the reported amounts of increases and decreases in net assets from operations during the reporting period. Actual results could differ from those estimates.
Recent Accounting Pronouncement. In October 2016, the Securities and Exchange Commission (“SEC”) adopted amendments to rules under the Investment Company Act of 1940 (“final rules”) intended to modernize the reporting and disclosure of information by registered investment companies. The final rules amend Regulation S-X and require funds to provide standardized, enhanced derivative disclosure in fund financial statements in a format designed for individual investors. The amendments to Regulation S-X also update the disclosures for other investments and investments in, and advances to affiliates and amend the rules regarding the general form and content of fund financial statements. The compliance date for the amendments to Regulation S-X is August 1, 2017. OFI Global is currently evaluating the amendments and their impact, if any, on the fund’s financial statements.
3. Securities Valuation
The Fund calculates the net asset value of its shares based upon the net asset value of the applicable investment companies. For each investment company, the net asset value per share for a class of shares is determined as of 4:00 P.M. eastern time, on each day the New York Stock Exchange (the “Exchange”) is open for trading, except in the case of a scheduled early closing of the Exchange, in which case the Fund will calculate net asset value of the shares as of the scheduled early closing time of the Exchange. This is calculated by dividing the value of the investment company’s net assets attributable to that class by the number of outstanding shares of that class on that day.
The Fund’s Board has adopted procedures for the valuation of the Fund’s securities and has delegated the day-to-day responsibility for valuation determinations under those procedures to the Manager. The Manager has established a Valuation Committee which is responsible for determining a “fair valuation” for any security for which market quotations are not “readily available.” The Valuation Committee’s fair valuation determinations are subject to review, approval and ratification by the Fund’s Board at its next regularly scheduled meeting covering the calendar quarter in which the fair valuation was determined.
|
| 25 OPPENHEIMER PORTFOLIO SERIES EQUITY INVESTOR FUND |
NOTES TO FINANCIAL STATEMENTS Continued
3. Securities Valuation (Continued)
Valuations Methods and Inputs
To determine their net asset values, the Underlying Funds’ assets are valued primarily on the basis of current market quotations as generally supplied by third party portfolio pricing services or by dealers. Such market quotations are typically based on unadjusted quoted prices in active markets for identical securities or other observable market inputs.
If a market value or price cannot be determined for a security using the methodologies described above, or if, in the “good faith” opinion of the Manager, the market value or price obtained does not constitute a “readily available market quotation,” or a significant event has occurred that would materially affect the value of the security, the security is fair valued either (i) by a standardized fair valuation methodology applicable to the security type or the significant event as previously approved by the Valuation Committee and the Fund’s Board or (ii) as determined in good faith by the Manager’s Valuation Committee. The Valuation Committee considers all relevant facts that are reasonably available, through either public information or information available to the Manager, when determining the fair value of a security. Fair value determinations by the Manager are subject to review, approval and ratification by the Fund’s Board at its next regularly scheduled meeting covering the calendar quarter in which the fair valuation was determined. The methodologies used for valuing securities are not necessarily an indication of the risks associated with investing in those Underlying Funds.
To assess the continuing appropriateness of security valuations, the Manager, or its third party service provider who is subject to oversight by the Manager, regularly compares prior day prices, prices on comparable securities, and sale prices to the current day prices and challenges those prices exceeding certain tolerance levels with the third party pricing service or broker source. For those securities valued by fair valuations, whether through a standardized fair valuation methodology or a fair valuation determination, the Valuation Committee reviews and affirms the reasonableness of the valuations based on such methodologies and fair valuation determinations on a regular basis after considering all relevant information that is reasonably available.
Classifications
Each investment asset or liability of the Fund is assigned a level at measurement date based on the significance and source of the inputs to its valuation. Various data inputs are used in determining the value of each of the Fund’s investments as of the reporting period end. These data inputs are categorized in the following hierarchy under applicable financial accounting standards:
1) Level 1-unadjusted quoted prices in active markets for identical assets or liabilities (including securities actively traded on a securities exchange)
2) Level 2-inputs other than unadjusted quoted prices that are observable for the asset or liability (such as unadjusted quoted prices for similar assets and market corroborated inputs such as interest rates, prepayment speeds, credit risks, etc.)
3) Level 3-significant unobservable inputs (including the Manager’s own judgments about assumptions that market participants would use in pricing the asset or liability).
|
| 26 OPPENHEIMER PORTFOLIO SERIES EQUITY INVESTOR FUND |
3. Securities Valuation (Continued)
The inputs used for valuing securities are not necessarily an indication of the risks associated with investing in those securities.
The Fund classifies each of its investments in investment companies which are publicly offered as Level 1. Investment companies that are not publicly offered are measured using net asset value as a practical expedient, and are not classified in the fair value hierarchy.
The table below categorizes amounts that are included in the Fund’s Statement of Assets and Liabilities at period end based on valuation input level:
| | | | | | | | | | | | | | | | |
| | | | | | | | | Level 3— | | | | |
| | | Level 1— | | | Level 2— | | | Significant | | | | |
| | | Unadjusted | | | Other Significant | | | Unobservable | | | | |
| | | Quoted Prices | | | Observable Inputs | | | Inputs | | | Value | |
| |
Assets Table | | | | | | | | | | | | | | | | |
Investments, at Value: | | | | | | | | | | | | | | | | |
Investment Companies | | $ | 796,753,544 | | | $ | — | | | $ | — | | | $ | 796,753,544 | |
| | | | |
Total Assets | | $ | 796,753,544 | | | $ | — | | | $ | — | | | $ | 796,753,544 | |
| | | | |
Forward currency exchange contracts and futures contracts, if any, are reported at their unrealized appreciation/depreciation at measurement date, which represents the change in the contract’s value from trade date. All additional assets and liabilities included in the above table are reported at their market value at measurement date.
4. Investments and Risks
Risks of Investing in the Underlying Funds. The Fund invests in other mutual funds advised by the Manager. The Underlying Funds are registered open-end management investment companies under the 1940 Act, as amended. The Manager is the investment adviser of, and the Sub-Adviser provides investment and related advisory services to, the Underlying Funds. The Fund’s Investments in Underlying Funds are included in the Statement of Investments. Shares of Underlying Funds are valued at their net asset value per share. As a shareholder, the Fund is subject to its proportional share of the Underlying Funds’ expenses, including their management fee.
Each of the Underlying Funds in which the Fund invests has its own investment risks, and those risks can affect the value of the Fund’s investments and therefore the value of the Fund’s shares. To the extent that the Fund invests more of its assets in one Underlying Fund than in another, the Fund will have greater exposure to the risks of that Underlying Fund.
5. Market Risk Factors
The Fund’s investments in securities and/or financial derivatives may expose the Fund to various market risk factors:
Commodity Risk. Commodity risk relates to the change in value of commodities or commodity indexes as they relate to increases or decreases in the commodities market. Commodities are physical assets that have tangible properties. Examples of these types of assets are crude oil, heating oil, metals, livestock, and agricultural products.
Credit Risk. Credit risk relates to the ability of the issuer of debt to meet interest and
|
| 27 OPPENHEIMER PORTFOLIO SERIES EQUITY INVESTOR FUND |
NOTES TO FINANCIAL STATEMENTS Continued
5. Market Risk Factors (Continued)
principal payments, or both, as they come due. In general, lower-grade, higher-yield debt securities are subject to credit risk to a greater extent than lower-yield, higher-quality securities.
Equity Risk. Equity risk relates to the change in value of equity securities as they relate to increases or decreases in the general market.
Foreign Exchange Rate Risk. Foreign exchange rate risk relates to the change in the U.S. dollar value of a security held that is denominated in a foreign currency. The U.S. dollar value of a foreign currency denominated security will decrease as the dollar appreciates against the currency, while the U.S. dollar value will increase as the dollar depreciates against the currency.
Interest Rate Risk. Interest rate risk refers to the fluctuations in value of fixed-income securities resulting from the inverse relationship between price and yield. For example, an increase in general interest rates will tend to reduce the market value of already issued fixed-income investments, and a decline in general interest rates will tend to increase their value. In addition, debt securities with longer maturities, which tend to have higher yields, are subject to potentially greater fluctuations in value from changes in interest rates than obligations with shorter maturities.
Volatility Risk. Volatility risk refers to the magnitude of the movement, but not the direction of the movement, in a financial instrument’s price over a defined time period. Large increases or decreases in a financial instrument’s price over a relative time period typically indicate greater volatility risk, while small increases or decreases in its price typically indicate lower volatility risk.
6. Shares of Beneficial Interest
The Fund has authorized an unlimited number of $0.001 par value shares of beneficial interest of each class. Transactions in shares of beneficial interest were as follows:
| | | | | | | | | | | | | | | | |
| | | Year Ended January 31, 2017 | | | Year Ended January 29, 20161 | |
| | | Shares | | | Amount | | | Shares | | | Amount | |
| |
Class A | | | | | | | | | | | | | | | | |
Sold | | | 4,799,969 | | | $ | 71,456,139 | | | | 6,684,379 | | | $ | 102,316,889 | |
Dividends and/or distributions reinvested | | | 631,076 | | | | 9,567,117 | | | | 445,252 | | | | 6,607,547 | |
Redeemed | | | (6,151,717) | | | | (92,258,512) | | | | (6,438,572) | | | | (97,460,412) | |
| | | | |
Net increase (decrease) | | | (720,672) | | | $ | (11,235,256) | | | | 691,059 | | | $ | 11,464,024 | |
| | | | |
|
| |
Class B | | | | | | | | | | | | | | | | |
Sold | | | 10,617 | | | $ | 155,045 | | | | 30,812 | | | $ | 468,781 | |
Dividends and/or distributions reinvested | | | 7,962 | | | | 118,561 | | | | 4,075 | | | | 59,250 | |
Redeemed | | | (987,435) | | | | (14,334,264) | | | | (1,212,636) | | | | (18,163,462) | |
| | | | |
Net decrease | | | (968,856) | | | $ | (14,060,658) | | | | (1,177,749) | | | $ | (17,635,431) | |
| | | | |
|
| 28 OPPENHEIMER PORTFOLIO SERIES EQUITY INVESTOR FUND |
6. Shares of Beneficial Interest (Continued)
| | | | | | | | | | | | | | | | |
| | | Year Ended January 31, 2017 | | Year Ended January 29, 20161 |
| | | Shares | | Amount | | Shares | | Amount | |
| |
Class C | | | | | | | | | | | | | | | | |
Sold | | | 1,703,640 | | | $ | 24,708,434 | | | | 2,039,551 | | | $ | 30,401,171 | |
Dividends and/or distributions reinvested | | | 134,751 | | | | 1,994,308 | | | | 63,900 | | | | 926,549 | |
Redeemed | | | (2,627,276 | ) | | | (38,296,592 | ) | | | (2,335,342 | ) | | | (34,838,197) | |
| | | | |
Net decrease | | | (788,885 | ) | | $ | (11,593,850 | ) | | | (231,891 | ) | | $ | (3,510,477) | |
| | | | |
|
| |
Class R | | | | | | | | | | | | | | | | |
Sold | | | 713,032 | | | $ | 10,693,944 | | | | 629,802 | | | $ | 9,608,036 | |
Dividends and/or distributions reinvested | | | 44,344 | | | | 671,814 | | | | 28,012 | | | | 415,702 | |
Redeemed | | | (800,317 | ) | | | (12,024,057 | ) | | | (1,019,845 | ) | | | (15,532,311) | |
| | | | |
Net decrease | | | (42,941 | ) | | $ | (658,299 | ) | | | (362,031 | ) | | $ | (5,508,573) | |
| | | | |
|
| |
Class Y | | | | | | | | | | | | | | | | |
Sold | | | 159,505 | | | $ | 2,397,131 | | | | 289,435 | | | $ | 4,511,592 | |
Dividends and/or distributions reinvested | | | 25,519 | | | | 388,396 | | | | 22,126 | | | | 329,681 | |
Redeemed | | | (418,614 | ) | | | (5,905,517 | ) | | | (209,247 | ) | | | (3,236,796) | |
| | | | |
Net increase (decrease) | | | (233,590 | ) | | $ | (3,119,990 | ) | | | 102,314 | | | $ | 1,604,477 | |
| | | | |
1. Represents the last business day of the Fund’s reporting period.
7. Purchases and Sales of Securities
The aggregate cost of purchases and proceeds from sales of securities, other than short-term obligations, for the reporting period were as follows:
| | | | | | | | |
| | | Purchases | | | Sales | |
| |
Investment securities | | $ | 49,806,933 | | | $ | 92,360,614 | |
8. Fees and Other Transactions with Affiliates
Management Fees. Under the investment advisory agreement, the Manager does not charge a management fee, but rather collects indirect management fees from the Fund’s investments in the Underlying Funds. The weighted indirect management fees collected from the Fund’s investment in the Underlying Funds, as a percent of average daily net assets of the Fund for the reporting period was 0.65%. This amount is gross of any waivers or reimbursements of management fees implemented at the Underlying Fund level. Under the sub-advisory agreement effective January 1, 2013, the Manager pays the Sub-Adviser a percentage of the indirect management fees (after all applicable waivers) from the Fund’s investments in the Underlying Funds.
Sub-Adviser Fees. The Manager has retained the Sub-Adviser to provide the day-to-day portfolio management of the Fund. Under the Sub-Advisory Agreement, the Manager pays the Sub-Adviser an annual fee in monthly installments, equal to a percentage of the indirect investment management fee collected by the Manager, which shall be calculated after any
|
| 29 OPPENHEIMER PORTFOLIO SERIES EQUITY INVESTOR FUND |
NOTES TO FINANCIAL STATEMENTS Continued
8. Fees and Other Transactions with Affiliates (Continued)
investment management fee waivers. The fee paid to the Sub-Adviser is paid by the Manager, not by the Fund.
Transfer Agent Fees. OFI Global (the “Transfer Agent”) serves as the transfer and shareholder servicing agent for the Fund. The Fund pays the Transfer Agent a fee based on annual net assets. Fees incurred and average net assets for each class with respect to these services are detailed in the Statement of Operations and Financial Highlights, respectively.
Sub-Transfer Agent Fees. The Transfer Agent has retained Shareholder Services, Inc., a wholly-owned subsidiary of OFI (the “Sub-Transfer Agent”), to provide the day-to-day transfer agent and shareholder servicing of the Fund. Under the Sub-Transfer Agency Agreement, the Transfer Agent pays the Sub-Transfer Agent an annual fee in monthly installments, equal to a percentage of the transfer agent fee collected by the Transfer Agent from the Fund, which shall be calculated after any applicable fee waivers. The fee paid to the Sub-Transfer Agent is paid by the Transfer Agent, not by the Fund.
Trustees’ Compensation. The Fund has adopted an unfunded retirement plan (the “Plan”) for the Fund’s Independent Trustees. Benefits are based on years of service and fees paid to each Trustee during their period of service. The Plan was frozen with respect to adding new participants effective December 31, 2006 (the “Freeze Date”) and existing Plan Participants as of the Freeze Date will continue to receive accrued benefits under the Plan. Active Independent Trustees as of the Freeze Date have each elected a distribution method with respect to their benefits under the Plan. During the reporting period, the Fund’s projected benefit obligations, payments to retired Trustees and accumulated liability were as follows:
| | | | |
Projected Benefit Obligations Increased | | $ | — | |
Payments Made to Retired Trustees | | | 2,008 | |
Accumulated Liability as of January 31, 2017 | | | 14,504 | |
The Fund’s Board of Trustees (“Board”) has adopted a compensation deferral plan for Independent Trustees that enables Trustees to elect to defer receipt of all or a portion of the annual compensation they are entitled to receive from the Fund. For purposes of determining the amount owed to the Trustee under the plan, deferred amounts are treated as though equal dollar amounts had been invested in shares of the Fund or in other Oppenheimer funds selected by the Trustee. The Fund purchases shares of the funds selected for deferral by the Trustee in amounts equal to his or her deemed investment, resulting in a Fund asset equal to the deferred compensation liability. Such assets are included as a component of “Other” within the asset section of the Statement of Assets and Liabilities. Deferral of Trustees’ fees under the plan will not affect the net assets of the Fund and will not materially affect the Fund’s assets, liabilities or net investment income per share. Amounts will be deferred until distributed in accordance with the compensation deferral plan.
Distribution and Service Plan (12b-1) Fees. Under its General Distributor’s Agreement
|
| 30 OPPENHEIMER PORTFOLIO SERIES EQUITY INVESTOR FUND |
8. Fees and Other Transactions with Affiliates (Continued)
with the Fund, OppenheimerFunds Distributor, Inc. (the “Distributor”) acts as the Fund’s principal underwriter in the continuous public offering of the Fund’s classes of shares.
Service Plan for Class A Shares. The Fund has adopted a Service Plan (the “Plan”) for Class A shares pursuant to Rule 12b-1 under the 1940 Act. Under the Plan, the Fund reimburses the Distributor for a portion of its costs incurred for services provided to accounts that hold Class A shares. Reimbursement is made periodically at an annual rate of up to 0.25% of the daily net assets of Class A shares of the Fund. The Distributor currently uses all of those fees to pay dealers, brokers, banks and other financial institutions periodically for providing personal service and maintenance of accounts of their customers that hold Class A shares. Any unreimbursed expenses the Distributor incurs with respect to Class A shares in any fiscal year cannot be recovered in subsequent periods. Fees incurred by the Fund under the Plan are detailed in the Statement of Operations.
Distribution and Service Plans for Class B, Class C and Class R Shares. The Fund has adopted Distribution and Service Plans (the “Plans”) for Class B, Class C and Class R shares pursuant to Rule 12b-1 under the 1940 Act to compensate the Distributor for distributing those share classes, maintaining accounts and providing shareholder services. Under the Plans, the Fund pays the Distributor an annual asset-based sales charge of 0.75% on Class B and Class C shares’ daily net assets and 0.25% on Class R shares’ daily net assets. The Fund also pays a service fee under the Plans at an annual rate of 0.25% of daily net assets. The Plans continue in effect from year to year only if the Fund’s Board of Trustees votes annually to approve their continuance at an in person meeting called for that purpose. Fees incurred by the Fund under the Plans are detailed in the Statement of Operations.
Sales Charges. Front-end sales charges and CDSC do not represent expenses of the Fund. They are deducted from the proceeds of sales of Fund shares prior to investment or from redemption proceeds prior to remittance, as applicable. The sales charges retained by the Distributor from the sale of shares and the CDSC retained by the Distributor on the redemption of shares is shown in the following table for the period indicated.
| | | | | | | | | | | | | | | | | | | | |
| | | | | | Class A | | | Class B | | | Class C | | | Class R | |
| | | Class A | | | Contingent | | | Contingent | | | Contingent | | | Contingent | |
| | | Front-End | | | Deferred | | | Deferred | | | Deferred | | | Deferred | |
| | | Sales Charges | | | Sales Charges | | | Sales Charges | | | Sales Charges | | | Sales Charges | |
| | | Retained by | | | Retained by | | | Retained by | | | Retained by | | | Retained by | |
| Year Ended | | Distributor | | | Distributor | | | Distributor | | | Distributor | | | Distributor | |
| |
January 31, 2017 | | | $462,757 | | | | $133 | | | | $17,069 | | | | $20,913 | | | | $— | |
Waivers and Reimbursements of Expenses. The Manager has contractually agreed to waive fees and/or reimburse the Fund for certain expenses in order to limit “Expenses after payments, waivers and/or reimbursements and reduction to custodian expenses”, (the combined direct (Fund level) and indirect (Underlying Fund level) expenses), will not exceed the annual rate of 1.45%, 2.20%, 2.20%, 1.70% and 1.20%, for Class A, Class B, Class C,
|
| 31 OPPENHEIMER PORTFOLIO SERIES EQUITY INVESTOR FUND |
NOTES TO FINANCIAL STATEMENTS Continued
8. Fees and Other Transactions with Affiliates (Continued)
Class R and Class Y, respectively. The expense limitations do not include interest and fees from borrowings, and other expenses not incurred in the ordinary course of the Fund’s business. Notwithstanding the foregoing limits, the Manager is not required to waive or reimburse Fund expenses in excess of the amount of indirect management fees earned from investments in the Underlying Funds.
Waivers and/or reimbursements may be modified or terminated as set forth according to the terms in the prospectus.
9. Borrowings and Other Financing
Joint Credit Facility. A number of mutual funds managed by the Manager participate in a $1.3 billion revolving credit facility (the “Facility”) intended to provide short-term financing, if necessary, subject to certain restrictions in connection with atypical redemption activity. Expenses and fees related to the Facility are paid by the participating funds and are disclosed separately or as other expenses on the Statement of Operations. The Fund did not utilize the Facility during the reporting period. Effective July 18, 2016, the Fund no longer participated in the Facility.
|
| 32 OPPENHEIMER PORTFOLIO SERIES EQUITY INVESTOR FUND |
REPORT OF INDEPENDENT REGISTERED PUBLIC ACCOUNTING FIRM
The Board of Trustees and Shareholders of Oppenheimer Portfolio Series:
We have audited the accompanying statement of assets and liabilities of Equity Investor Fund (a series of Oppenheimer Portfolio Series), including the statement of investments, as of January 31, 2017, and the related statement of operations for the year then ended, the statements of changes in net assets for each of the years in the two-year period then ended, and the financial highlights for each of the years in the five-year period then ended. These financial statements and financial highlights are the responsibility of the Fund’s management. Our responsibility is to express an opinion on these financial statements and financial highlights based on our audits.
We conducted our audits in accordance with the standards of the Public Company Accounting Oversight Board (United States). Those standards require that we plan and perform the audit to obtain reasonable assurance about whether the financial statements and financial highlights are free of material misstatement. An audit includes examining, on a test basis, evidence supporting the amounts and disclosures in the financial statements. Our procedures included confirmation of securities owned as of January 31, 2017, by correspondence with the transfer agent. An audit also includes assessing the accounting principles used and significant estimates made by management, as well as evaluating the overall financial statement presentation. We believe that our audits provide a reasonable basis for our opinion.
In our opinion, the financial statements and financial highlights referred to above present fairly, in all material respects, the financial position of Equity Investor Fund as of January 31, 2017, the results of its operations for the year then ended, the changes in its net assets for each of the years in the two-year period then ended, and the financial highlights for each of the years in the five-year period then ended, in conformity with U.S. generally accepted accounting principles.
KPMGLLP
Denver, Colorado
March 24, 2017
|
| 33 OPPENHEIMER PORTFOLIO SERIES EQUITY INVESTOR FUND |
FEDERAL INCOME TAX INFORMATION Unaudited
In early 2017, if applicable, shareholders of record received information regarding all dividends and distributions paid to them by the Fund during calendar year 2016.
Capital gain distributions of $0.11987 per share were paid to Class A, Class B, Class C, Class R and Class Y shareholders, respectively, on December 21, 2016. Whether received in stock or in cash, the capital gain distribution should be treated by shareholders as a gain from the sale of the capital assets held for more than one year (long-term capital gains).
Dividends, if any, paid by the Fund during the reporting period which are not designated as capital gain distributions should be multiplied by the maximum amount allowable but not less than 75.11% to arrive at the amount eligible for the corporate dividend-received deduction.
A portion, if any, of the dividends paid by the Fund during the reporting period which are not designated as capital gain distributions are eligible for lower individual income tax rates to the extent that the Fund has received qualified dividend income as stipulated by recent tax legislation. The maximum amount allowable but not less than $11,232,640 of the Fund’s fiscal year taxable income may be eligible for the lower individual income tax rates. In early 2017, shareholders of record received information regarding the percentage of distributions that are eligible for lower individual income tax rates.
Recent tax legislation allows a regulated investment company to designate distributions not designated as capital gain distributions, as either interest related dividends or short-term capital gain dividends, both of which are exempt from the U.S. withholding tax applicable to non U.S. taxpayers. For the reporting period, the maximum amount allowable but not less than $37,577 of the ordinary distributions to be paid by the Fund qualifies as an interest related dividend.
The Fund has elected the application of Section 853 of the Internal Revenue Code to permit shareholders to take a federal income tax credit or deduction, at their option, on a per share basis. The maximum amount allowable but not less than $742,403 of foreign income taxes were paid by the Fund during the reporting period. A separate notice will be mailed to each shareholder, which will reflect the proportionate share of such foreign taxes which must be treated by shareholders as gross income for federal income tax purposes.
Gross income of the maximum amount allowable but not less than $5,596,092 was derived from sources within foreign countries or possessions of the United States.
The foregoing information is presented to assist shareholders in reporting distributions received from the Fund to the Internal Revenue Service. Because of the complexity of the federal regulations which may affect your individual tax return and the many variations in state and local tax regulations, we recommend that you consult your tax advisor for specific guidance.
|
| 34 OPPENHEIMER PORTFOLIO SERIES EQUITY INVESTOR FUND |
BOARD APPROVAL OF THE FUND’S INVESTMENT ADVISORY
AND SUB-ADVISORY AGREEMENTS Unaudited
The Fund has entered into an investment advisory agreement with OFI Global Asset Management, Inc. (“OFI Global” or the “Adviser”), a wholly-owned subsidiary of OppenheimerFunds, Inc. (“OFI” or the “Sub-Adviser”) (“OFI Global” and “OFI” together, the “Managers”) and OFI Global has entered into a sub-advisory agreement with OFI whereby OFI provides investment sub-advisory services to the Fund (collectively, the “Agreements”). Each year, the Board of Trustees (the “Board”), including a majority of the independent Trustees, is required to determine whether to approve the terms of the Agreements and the renewal thereof. The Investment Company Act of 1940, as amended, requires that the Board request and evaluate, and that the Managers provide, such information as may be reasonably necessary to evaluate the terms of the Agreements. The Board employs an independent consultant to prepare a report that provides information, including comparative information that the Board requests for that purpose. In addition to in-person meetings focused on this evaluation, the Board receives information throughout the year regarding Fund services, fees, expenses and performance.
The Managers and the independent consultant provided information to the Board on the following factors: (i) the nature, quality and extent of the Managers’ services, (ii) the comparative investment performance of the Fund and the Managers, (iii) the fees and expenses of the Fund, including comparative fee and expense information, (iv) the profitability of the Managers and their affiliates, including an analysis of the cost of providing services, (v) whether economies of scale are realized as the Fund grows and whether fee levels reflect these economies of scale for Fund investors and (vi) other benefits to the Managers from their relationship with the Fund. The Board was aware that there are alternatives to retaining the Managers.
Outlined below is a summary of the principal information considered by the Board as well as the Board’s conclusions.
Nature, Quality and Extent of Services. The Board considered information about the nature, quality and extent of the services provided to the Fund and information regarding the Managers’ key personnel who provide such services. The Managers’ duties include providing the Fund with the services of the portfolio managers and the Sub-Adviser’s investment team, who provide research, analysis and other advisory services in regard to the Fund’s investments; and securities trading services. OFI Global is responsible for oversight of third-party service providers; monitoring compliance with applicable Fund policies and procedures and adherence to the Fund’s investment restrictions; risk management; and oversight of the Sub-Adviser. OFI Global is also responsible for providing certain administrative services to the Fund as well. Those services include providing and supervising all administrative and clerical personnel who are necessary in order to provide effective corporate administration for the Fund; compiling and maintaining records with respect to the Fund’s operations; preparing and filing reports required by the U.S. Securities and Exchange Commission; preparing periodic reports regarding the operations of the Fund for its shareholders; preparing proxy materials for shareholder meetings; and preparing the registration statements required by federal and state securities laws for the sale of the Fund’s shares. OFI Global also provides the Fund with office space, facilities and equipment.
|
| 35 OPPENHEIMER PORTFOLIO SERIES EQUITY INVESTOR FUND |
BOARD APPROVAL OF THE FUND’S INVESTMENT ADVISORY
AND SUB-ADVISORY AGREEMENTS Unaudited / Continued
The Board also considered the quality of the services provided and the quality of the Managers’ resources that are available to the Fund. The Board took account of the fact that the Sub-Adviser has over fifty years of experience as an investment adviser and that its assets under management rank it among the top mutual fund managers in the United States. The Board evaluated the Managers’ advisory, administrative, accounting, legal, compliance services and risk management, and information the Board has received regarding the experience and professional qualifications of the Managers’ key personnel and the size and functions of its staff. In its evaluation of the quality of the portfolio management services provided, the Board considered the experience of Mark Hamilton and Dokyoung Lee, the portfolio managers for the Fund, and the experience of the portfolio managers and the investment performance of the investment companies in which the Fund invests (the “Underlying Funds”). The Board members also considered the totality of their experiences with the Managers as directors or trustees of the Fund and other funds advised by the Managers. The Board considered information regarding the quality of services provided by affiliates of the Managers, which the Board members have become knowledgeable about through their experiences with the Managers and in connection with the renewal of the Fund’s service agreements. The Board concluded, in light of the Managers’ experience, reputation, personnel, operations and resources that the Fund benefits from the services provided under the Agreements.
Investment Performance of the Managers and the Fund. Throughout the year, the Managers provided information on the investment performance of the Fund, the Adviser and the Sub-Adviser, including comparative performance information. The Board also reviewed information, prepared by the Managers and the independent consultant, comparing the Fund’s historical performance to relevant benchmark or market indices and to the performance of other retail funds in the world stock category. The Board noted that the Fund’s one-year, three-year, five-year and ten-year performance was better than its category median.
Fees and Expenses of the Fund. The Board reviewed the expenses borne by the Fund. The Adviser does not charge a management fee to the Fund; however, the Adviser collects indirect management fees from the Fund’s Underlying Funds. The independent consultant provided comparative data in regard to the fees and expenses of the Fund and other retail front-end load world stock funds with comparable asset levels and distribution features. After discussions with the Board, the Adviser has contractually agreed to waive fees and/ or reimburse the Fund so that the total annual fund operating expenses, excluding certain expenses, as a percentage of average daily net assets will not exceed the following annual rates: 1.45% for Class A shares, 2.20% for Class B shares, 2.20% for Class C shares, 1.70% for Class R shares and 1.20% for Class Y shares, as calculated on the daily net assets of the Fund. This fee waiver and/or expense reimbursement may be amended or withdrawn at any time without prior notice to shareholders. The Board noted that the Fund was charged no actual management fees, exclusive of Underlying Fund management fees, while certain peer group funds did charge direct management fees. The Board also noted that the Fund’s total expenses were lower than its peer group median and category median.
|
| 36 OPPENHEIMER PORTFOLIO SERIES EQUITY INVESTOR FUND |
Economies of Scale and Profits Realized by the Adviser and Sub-Adviser. The Board considered information regarding the Managers’ costs in serving as the Fund’s investment adviser and sub-adviser, including the costs associated with the personnel and systems necessary to manage the Fund, and information regarding the Managers’ profitability from their relationship with the Fund. The Board also considered that the Managers must be able to pay and retain experienced professional personnel at competitive rates to provide quality services to the Fund. The Board reviewed whether the Managers may realize economies of scale in managing and supporting the Fund and whether those economies of scale benefit the Fund’s shareholders at the current level of Fund assets in relation to its management fee. The Fund currently does not charge a management fee.
Other Benefits to the Managers. In addition to considering the profits realized by the Managers, the Board considered information that was provided regarding the direct and indirect benefits the Managers receive as a result of their relationship with the Fund, including compensation paid to the Managers’ affiliates.
Conclusions. These factors were also considered by the independent Trustees meeting separately from the full Board, assisted by experienced counsel to the Fund and to the independent Trustees. Fund counsel and the independent Trustees’ counsel are independent of the Managers within the meaning and intent of the Securities and Exchange Commission Rules.
Based on its review of the information it received and its evaluations described above, the Board, including a majority of the independent Trustees, decided to continue the Agreements through September 30, 2017. In arriving at its decision, the Board did not identify any factor or factors as being more important than others, but considered all of the above information, and considered the terms and conditions of the Agreements, including the management fees, in light of all the surrounding circumstances.
|
| 37 OPPENHEIMER PORTFOLIO SERIES EQUITY INVESTOR FUND |
PORTFOLIO PROXY VOTING POLICIES AND GUIDELINES;
UPDATES TO STATEMENTS OF INVESTMENTS Unaudited
The Fund has adopted Portfolio Proxy Voting Policies and Guidelines under which the Fund votes proxies relating to securities (“portfolio proxies”) held by the Fund. A description of the Fund’s Portfolio Proxy Voting Policies and Guidelines is available (i) without charge, upon request, by calling the Fund toll-free at 1.800.CALL OPP (225.5677), (ii) on the Fund’s website at www.oppenheimerfunds.com, and (iii) on the SEC’s website at www.sec.gov. In addition, the Fund is required to file Form N-PX, with its complete proxy voting record for the 12 months ended June 30th, no later than August 31st of each year. The Fund’s voting record is available (i) without charge, upon request, by calling the Fund toll-free at 1.800.CALL OPP (225.5677), and (ii) in the Form N-PX filing on the SEC’s website at www.sec.gov.
The Fund files its complete schedule of portfolio holdings with the SEC for the first quarter and the third quarter of each fiscal year on Form N-Q. The Fund’s Form N-Q filings are available on the SEC’s website at www.sec.gov. Those forms may be reviewed and copied at the SEC’s Public Reference Room in Washington, D.C. Information on the operation of the Public Reference Room may be obtained by calling 1-800-SEC-0330.
Householding—Delivery of Shareholder Documents
This is to inform you about OppenheimerFunds’ “householding” policy. If more than one member of your household maintains an account in a particular fund, OppenheimerFunds will mail only one copy of the fund’s prospectus (or, if available, the fund’s summary prospectus), annual and semiannual report and privacy policy. The consolidation of these mailings, called householding, benefits your fund through reduced mailing expense, and benefits you by reducing the volume of mail you receive from OppenheimerFunds. Householding does not affect the delivery of your account statements.
Please note that we will continue to household these mailings for as long as you remain an OppenheimerFunds shareholder, unless you request otherwise. If you prefer to receive multiple copies of these materials, please call us at 1.800.CALL-OPP (225-5677). You may also notify us in writing or via email. We will begin sending you individual copies of the prospectus (or, if available, the summary prospectus), reports and privacy policy within 30 days of receiving your request to stop householding.
|
| 38 OPPENHEIMER PORTFOLIO SERIES EQUITY INVESTOR FUND |
DISTRIBUTION SOURCES Unaudited
For any distribution that took place over the last six months of the Fund’s reporting period, the table below details on a per-share basis the percentage of the Fund’s total distribution payment amount that was derived from the following sources: net income, net profit from the sale of securities, and other capital sources. This information is based upon income and capital gains using generally accepted accounting principles as of the date of each distribution. Because the Fund is actively managed, the relative amount of the Fund’s total distributions derived from various sources over the calendar year may change. Please note that this information should not be used for tax reporting purposes as the tax character of distributable income may differ from the amounts used for this notification. You will receive IRS tax forms in the first quarter of each calendar year detailing the actual amount of the taxable and non-taxable portion of distributions paid to you during the tax year.
For the most current information, please go to oppenheimerfunds.com. Select your Fund, then the ’Detailed’ tab; where ‘Dividends’ are shown, the Fund’s latest pay date will be followed by the sources of any distribution, updated daily.
| | | | | | | | | | | | | | | | |
| | | | | | | | | | | | Other | |
| | | Pay | | | | | | Net Profit | | | Capital | |
| Fund Name | | Date | | | Net Income | | | from Sale | | | Sources | |
| |
Oppenheimer Portfolio Series: Equity Investor Fund | | | 12/21/16 | | | | 46.1% | | | | 6.4% | | | | 47.5% | |
| |
|
| 39 OPPENHEIMER PORTFOLIO SERIES EQUITY INVESTOR FUND |
TRUSTEES AND OFFICERS Unaudited
| | |
Name, Position(s) Held with the Fund, Length of Service, Year of Birth | | Principal Occupation(s) During the Past 5 Years; Other Trusteeships/Directorships Held; Number of Portfolios in the Fund Complex Currently Overseen |
| |
| INDEPENDENT TRUSTEES | | The address of each Trustee in the chart below is 6803 S. Tucson Way, Centennial, Colorado 80112-3924. Each Trustee serves for an indefinite term, or until his or her resignation, retirement, death or removal. |
| |
Brian F. Wruble, Chairman of the Board of Trustees (since 2007), and Trustee (since 2005) Year of Birth: 1943 | | Governor and Vice Chairman of Community Foundation of the Florida Keys (non-profit) (since July 2012); Trustee of the Board of Trustees, The Jackson Laboratory (non-profit) (1991-2011 and since May 2014); Chairman Emeritus (since August 2011) of The Jackson Laboratory (non-profit); Member of Zurich Insurance Group’s Investment Management Advisory Council (insurance) (since 2004); Treasurer (since 2007) and Trustee of the Institute for Advanced Study (non-profit educational institute) (since May 1992); Director of Special Value Opportunities Fund, LLC (registered investment company) (affiliate of the Sub-Adviser’s parent company) (September 2004-June 2015); General Partner of Odyssey Partners, L.P. (hedge fund) (September 1995-December 2007); Special Limited Partner of Odyssey Investment Partners, LLC (private equity investment) (January 1999-September 2004). Oversees 56 portfolios in the OppenheimerFunds complex. Mr. Wruble has served on the Boards of certain Oppenheimer funds since April 2001, during which time he has become familiar with the Fund’s (and other Oppenheimer funds’) financial, accounting, regulatory and investment matters and has contributed to the Boards’ deliberations. |
| |
Beth Ann Brown, Trustee (since 2016) Year of Birth: 1968 | | Advisor, Board of Advisors of Caron Engineering Inc. (since December 2014); Independent Consultant (since September 2012); held the following positions at Columbia Management Investment Advisers LLC: Head of Intermediary Distribution (2008-2012), Managing Director, Strategic Relations (2005-2008), Managing Director, Head of National Accounts (2004-2005); Senior Vice President, National Account Manager (2002-2004), Senior Vice President, Key Account Manager (1999-2002) and Vice President, Key Account Manager (1996-1999) of Liberty Funds Distributor, Inc.; President and Director, of Acton Shapleigh Youth Conservation Corps (non-profit) (since 2012); and Vice President and Director of Grahamtastic Connection (non-profit) (since May 2013). Oversees 56 portfolios in the OppenheimerFunds complex. Ms. Brown has served on the Boards of certain Oppenheimer funds since January 2016, during which time she has become familiar with the Fund’s (and other Oppenheimer funds’) financial, accounting, regulatory and investment matters and has contributed to the Boards’ deliberations. |
|
| 40 OPPENHEIMER PORTFOLIO SERIES EQUITY INVESTOR FUND |
| | |
Edmund P. Giambastiani, Jr., Trustee (since 2013) Year of Birth: 1948 | | Advisory Board Member of the Maxwell School of Citizenship and Public Affairs of Syracuse University (since April 2012); Director of Mercury Defense Systems Inc. (information technology) (August 2011-February 2013); Trustee of the U.S. Naval Academy Foundation (since November 2010); Advisory Board Member of the Massachusetts Institute of Technology Lincoln Laboratory (federally- funded research development center) (since May 2010); Director of The Boeing Company (aerospace and defense) (since October 2009); Trustee of MITRE Corporation (federally-funded research development center) (since September 2008); Independent Director of QinetiQ Group Plc (defense technology and security) (February 2008-August 2011); Lead Director (June 2011-March 2015); Chairman of Alenia North America, Inc. (military and defense products) (January 2008-October 2009); Director of SRA International, Inc. (information technology and services) (January 2008-July 2011); President of Giambastiani Group LLC (national security and energy consulting) (since October 2007); United States Navy, career nuclear submarine officer (June 1970-October 2007), Vice Chairman of the Joint Chiefs of Staff (2005-October 2007), Supreme Allied Commander of NATO Commander Transformation (2003-2005), Commander, U.S. Joint Forces Command (2002-2005). Since his retirement from the U.S. Navy in October 2007, Admiral Giambastiani has also served on numerous U.S. Government advisory boards, investigations and task forces for the Secretaries of Defense, State and Interior and the Central Intelligence Agency. He currently serves as a federal commissioner on the Military Compensation and Retirement Modernization Commission. Oversees 56 portfolios in the OppenheimerFunds complex. Admiral Giambastiani has served on the Boards of certain Oppenheimer funds since February 2013, including as an Advisory Board Member for certain Oppenheimer funds, during which time he has become familiar with the Fund’s (and other Oppenheimer funds’) financial, accounting, regulatory and investment matters and has contributed to the Boards’ deliberations. For purposes of this report, Admiral Giambastiani is identified as a Trustee. |
| |
Elizabeth Krentzman, Trustee (since 2014) Year of Birth: 1959 | | Advisory Board Member of the University of Florida Law Center Association (since 2016) and the Securities and Exchange Commission Historical Society (since 2007); held the following positions at Deloitte & Touche LLP: Principal and Chief Regulatory Advisor for Asset Management Services (2007-2014) and U.S. Mutual Fund Leader (2011-2014); General Counsel of the Investment Company Institute (trade association) (June 2004-April 2007); held the following positions at Deloitte & Touche LLP: National Director of the Investment Management Regulatory Consulting Practice (1997-2004), Principal (2003-2004), Director (1998-2003) and Senior Manager (1997-1998); Assistant Director of the Division of Investment Management – Office of Disclosure and Investment Adviser Regulation (1996- 1997) and various positions with the Division of Investment Management – Office of Regulatory Policy (1991-1996) of the U.S. Securities and Exchange Commission; Associate at Ropes & Gray (1987-1991). Oversees 56 portfolios in the OppenheimerFunds complex. Ms. Krentzman has served on the Boards of certain Oppenheimer funds since August 2014, during which time she has become familiar with the Fund’s (and other Oppenheimer funds’) financial, accounting, regulatory and investment matters and has contributed to the Boards’ deliberations. |
|
| 41 OPPENHEIMER PORTFOLIO SERIES EQUITY INVESTOR FUND |
TRUSTEES AND OFFICERS Unaudited / Continued
| | |
Mary F. Miller, Trustee (since 2005) Year of Birth: 1942 | | Trustee of International House (not-for-profit) (since June 2007); Trustee of the American Symphony Orchestra (not-for-profit) (October 1998-November 2011); and Senior Vice President and General Auditor of American Express Company (financial services company) (July 1998-February 2003). Oversees 56 portfolios in the OppenheimerFunds complex. Ms. Miller has served on the Boards of certain Oppenheimer funds since August 2004, during which time she has become familiar with the Fund’s (and other Oppenheimer funds’) financial, accounting, regulatory and investment matters and has contributed to the Boards’ deliberations. |
| |
Joel W. Motley, Trustee (since 2005) Year of Birth: 1952 | | Director of Greenwall Foundation (since October 2013); Member of Board and Investment Committee of The Greenwall Foundation (since April 2013); Member of the Vestry of Trinity Wall Street (since April 2012); Director of Southern Africa Legal Services Foundation (since March 2012); Board Member of Pulitzer Center for Crisis Reporting (non-profit journalism) (since March 2011); Managing Director of Public Capital Advisors, LLC (privately-held financial advisor) (since January 2006); Managing Director of Carmona Motley, Inc. (privately-held financial advisor) (since January 2002); Director of Columbia Equity Financial Corp. (privately-held financial advisor) (2002-2007); Managing Director of Carmona Motley Hoffman Inc. (privately-held financial advisor) (January 1998-December 2001); Member of the Finance and Budget Committee of the Council on Foreign Relations, Member of the Investment Committee and Board of Human Rights Watch (since July 2000) and Member of the Investment Committee and Board of Historic Hudson Valley (since February 2010). Oversees 56 portfolios in the OppenheimerFunds complex. Mr. Motley has served on the Boards of certain Oppenheimer funds since October 2002, during which time he has become familiar with the Fund’s (and other Oppenheimer funds’) financial, accounting, regulatory and investment matters and has contributed to the Boards’ deliberations. |
| |
Joanne Pace, Trustee (since 2012) Year of Birth: 1958 | | Advisory Board Director of Massey Quick and Company, LLC (since October 2014); Board Director of Horizon Blue Cross Blue Shield of New Jersey (since November 2012); Advisory Board Director of The Alberleen Group LLC (since March, 2012); Board Member (since January 2015), Advisory Council Member (December 2012-December 2014) of 100 Women in Hedge Funds (non-profit) (since December, 2012); Advisory Council Member of Morgan Stanley Children’s Hospital (non-profit) (since May, 2012); Board Director of The Komera Project (non-profit) (since April, 2012); New York Advisory Board Director of Peace First (non-profit) (2010-2015); Senior Advisor of SECOR Asset Management, LP (2010-2011); Managing Director and Chief Operating Officer of Morgan Stanley Investment Management (2006-2010); Partner and Chief Operating Officer of FrontPoint Partners, LLC (hedge fund) (2005-2006); held the following positions at Credit Suisse: Managing Director (2003-2005); Global Head of Human Resources and member of Executive Board and Operating Committee (2004-2005), Global Head of Operations and Product Control (2003-2004); held the following positions at Morgan Stanley: Managing Director (1997-2003), Controller and Principal Accounting Officer (1999-2003); Chief Financial Officer (temporary assignment) for the Oversight Committee, Long Term Capital Management (1998-1999). Lead Independent Director and Chair of the Audit and Nominating Committee of The Global Chartist Fund, LLC of Oppenheimer Asset Management (2011-2012); Board Director of Managed Funds Association (2008-2010); Board Director of Morgan Stanley Foundation (2007-2010) and Investment Committee Chair (2008-2010). Oversees 56 portfolios in the OppenheimerFunds complex. Ms. Pace has served on the Boards of certain Oppenheimer funds since November 2012, including as |
|
| 42 OPPENHEIMER PORTFOLIO SERIES EQUITY INVESTOR FUND |
| | |
Joanne Pace, Continued | | an Advisory Board Member for certain Oppenheimer funds, during which time she has become familiar with the Fund’s (and other Oppenheimer funds’) financial, accounting, regulatory and investment matters and has contributed to the Board’s deliberations. For purposes of this report, Ms. Pace is identified as a Trustee. |
| |
Daniel Vandivort, Trustee (since 2014) Year of Birth: 1954 | | Chairman and Lead Independent Director/Trustee (March 2010-September 2014), Chairman of the Audit Committee (March 2009-September 2014) and Director/ Trustee (December 2008-September 2014) of the Board of Directors/Trustees of Value Line Funds; Trustee, Board of Trustees of Huntington Disease Foundation of America (since January 2015 and June 2007-December 2013): Trustee, Board of Trustees, RIM Retirement Savings Plan (2005-2007); President and Chief Investment Officer, Robeco Investment Management, formerly known as Weiss Peck and Greer (January 2005-June 2007); Member, Management Committee of Robeco Investment Management (2001-2007); Chairman and Trustee of the Board of Trustees of Weiss, Peck and Greer Funds (2004-2005); Managing Director and Head of Fixed Income, Weiss, Peck and Greer (November 1994-January 2005); Managing Director and Head of Fixed Income, CS First Boston Investment Management (January 1992-November 1994); Director, Global Product Development, First Boston Asset Management (November 1989 to January 1992); Vice President, Fixed Income Sales, First Boston Corp. (May 1984-November 1989). Oversees 56 portfolios in the OppenheimerFunds complex. Mr. Vandivort has served on the Boards of certain Oppenheimer funds since 2014, during which time he has become familiar with the Fund’s (and other Oppenheimer funds’) financial, accounting, regulatory and investment matters and has contributed to the Boards’ deliberations. |
|
INTERESTED TRUSTEE AND OFFICER | | Mr. Steinmetz is an “Interested Trustee” because he is affiliated with the Manager and the Sub-Adviser by virtue of his positions as Chairman of the Sub-Adviser and officer and director of the Manager. Both as a Trustee and as an officer, Mr. Steinmetz serves for an indefinite term, or until his resignation, retirement, death or removal. Mr. Steinmetz’s address is 225 Liberty Street, New York, New York 10281-1008. |
| |
Arthur P. Steinmetz, Trustee (since 2015), President and Principal Executive Officer (since 2014) Year of Birth: 1958 | | Chairman of the Sub-Adviser (since January 2015); CEO and Chairman of the Manager (since July 2014), President of the Manager (since May 2013), a Director of the Manager (since January 2013), Director of the Sub-Adviser (since July 2014), President, Management Director and CEO of Oppenheimer Acquisition Corp. (the Sub-Adviser’s parent holding company) (since July 2014), and President and Director of OFI SteelPath, Inc. (since January 2013). Chief Investment Officer of the OppenheimerFunds advisory entities from (January 2013-December 2013); Executive Vice President of the Manager (January 2013-May 2013); Chief Investment Officer of the Sub-Adviser (October 2010-December 2012); Chief Investment Officer, Fixed-Income, of the Sub-Adviser (April 2009-October 2010); Executive Vice President of the Sub-Adviser (October 2009-December 2012); Director of Fixed Income of the Sub-Adviser (January 2009-April 2009); and a Senior Vice President of the Sub-Adviser (March 1993-September 2009). An officer of 103 portfolios in the OppenheimerFunds complex. |
|
| OTHER OFFICERS OF THE FUND | | The addresses of the Officers in the chart below are as follows: for Messrs. Hamilton, Lee, Mss. Lo Bessette, Foxson and Picciotto, 225 Liberty Street, New York, New York 10281-1008, for Mr. Petersen, 6803 S. Tucson Way, Centennial, Colorado 80112-3924. Each Officer serves for an indefinite term or until his or her resignation, retirement, death or removal. |
|
| 43 OPPENHEIMER PORTFOLIO SERIES EQUITY INVESTOR FUND |
TRUSTEES AND OFFICERS Unaudited / Continued
| | |
Mark Hamilton, Vice President (since 2013) Year of Birth: 1965 | | Chief Investment Officer, Asset Allocation and Senior Vice President of the Sub-Adviser (since April 2013). Mr. Hamilton served at AllianceBernstein L.P. (from 1994-2013) as an Investment Director of Dynamic Asset Allocation (from 2010-2013), Head of North American Blend Team (from 2009-2010), and Senior Portfolio Manager of Blend Strategies (from 2006-2010). A portfolio manager and officer of other portfolios in the OppenheimerFunds complex. |
| |
Dokyoung Lee, Vice President (since 2014) Year of Birth: 1965 | | Director of Research, Global Multi-Asset Group and a Senior Vice President of the Sub-Adviser (since October 2013). Mr. Lee served at Alliance Bernstein L.P. (1994- 2013): Director of Research for Strategic Asset Allocation (2011-2013), Director of Research for Blend Strategies (2008-2011), Head of Asia Pacific Blend Strategies (2005-2008), Head of Quantitative Research and Senior Portfolio Manager for Japan Value Equities (2001-2005), Portfolio Manager for Emerging Markets Value Equities (1997-2001), and Quantitative Analyst for US Value Equities (1994-1997). A portfolio manager and officer of other portfolios in the OppenheimerFunds complex. |
| |
Cynthia Lo Bessette, Secretary and Chief Legal Officer (since 2016) Year of Birth: 1969 | | Executive Vice President, General Counsel and Secretary of the Manager (since February 2016); Chief Legal Officer of the Sub-Adviser and the Distributor (since February 2016); Vice President, General Counsel and Secretary of Oppenheimer Acquisition Corp. (since February 2016); General Counsel of OFI SteelPath, Inc., VTL Associates, LLC and Index Management Solutions, LLC (since February 2016); Chief Legal Officer of OFI Global Institutional, Inc., HarbourView Asset Management Corporation, OFI Global Trust Company, Oppenheimer Real Asset Management, Inc., OFI Private Investments Inc., Shareholder Services, Inc. and Trinity Investment Management Corporation (since February 2016); Senior Vice President and Deputy General Counsel (March 2015-February 2016) and Executive Vice President, Vice President, Corporate Counsel (February 2012-March 2015) and Deputy Chief Legal Officer (April 2013-March 2015) of Jennison Associates LLC; Assistant General Counsel (April 2008-September 2009) and Deputy General Counsel (October 2009-February 2012) of Lord Abbett & Co. LLC. An officer of 103 portfolios in the OppenheimerFunds complex. |
| |
Jennifer Foxson, Vice President and Chief Business Officer (since 2014) Year of Birth: 1969 | | Senior Vice President of OppenheimerFunds Distributor, Inc. (since June 2014); Vice President of OppenheimerFunds Distributor, Inc. (April 2006-June 2014); Vice President of the Sub-Adviser (January 1998-March 2006); Assistant Vice President of the Sub-Adviser (October 1991-December 1998). An officer of 103 portfolios in the OppenheimerFunds complex. |
| |
Mary Ann Picciotto, Chief Compliance Officer and Chief Anti-Money Laundering Officer (since 2014) Year of Birth: 1973 | | Senior Vice President and Chief Compliance Officer of the Manager (since March 2014); Chief Compliance Officer of the Sub-Adviser, OFI SteelPath, Inc., OFI Global Trust Company, OFI Global Institutional, Inc., Oppenheimer Real Asset Management, Inc., OFI Private Investments, Inc., Harborview Asset Management Corporation, Trinity Investment Management Corporation, and Shareholder Services, Inc. (since March 2014); Managing Director of Morgan Stanley Investment Management Inc. and certain of its various affiliated entities; Chief Compliance Officer of various Morgan Stanley Funds (May 2010-January 2014); Chief Compliance Officer of Morgan Stanley Investment Management Inc. (April 2007-January 2014). An officer of 103 portfolios in the OppenheimerFunds complex. |
|
| 44 OPPENHEIMER PORTFOLIO SERIES EQUITY INVESTOR FUND |
| | |
Brian S. Petersen, Treasurer and Principal Financial & Accounting Officer (since 2016) Year of Birth: 1970 | | Vice President of the Manager (since January 2013); Vice President of the Sub-Adviser (February 2007-December 2012); Assistant Vice President of the Sub-Adviser (August 2002-2007). An officer of 103 portfolios in the OppenheimerFunds complex. |
The Fund’s Statement of Additional Information contains additional information about the Fund’s Trustees and Officers and is available without charge upon request by calling 1.800.CALL OPP (225.5677).
|
| 45 OPPENHEIMER PORTFOLIO SERIES EQUITY INVESTOR FUND |
OPPENHEIMER PORTFOLIO SERIES EQUITY INVESTOR FUND
| | |
| Manager | | OFI Global Asset Management, Inc. |
| |
| Sub-Adviser | | OppenheimerFunds, Inc. |
| |
| Distributor | | OppenheimerFunds Distributor, Inc. |
| |
| Transfer and Shareholder | | OFI Global Asset Management, Inc. |
| Servicing Agent | | |
| |
| Sub-Transfer Agent | | Shareholder Services, Inc. |
| | DBA OppenheimerFunds Services |
| |
| Independent Registered | | KPMG LLP |
| Public Accounting Firm | | |
| |
| Legal Counsel | | Kramer Levin Naftalis & Frankel LLP |
© 2017 OppenheimerFunds, Inc. All rights reserved.
|
| 46 OPPENHEIMER PORTFOLIO SERIES EQUITY INVESTOR FUND |
PRIVACY POLICY NOTICE
As an Oppenheimer fund shareholder, you are entitled to know how we protect your personal information and how we limit its disclosure.
Information Sources
We obtain nonpublic personal information about our shareholders from the following sources:
| ● | | Applications or other forms |
| ● | | When you create a user ID and password for online account access |
| ● | | When you enroll in eDocs Direct,SM our electronic document delivery service |
| ● | | Your transactions with us, our affiliates or others |
| ● | | Technologies on our website, including: “cookies” and web beacons, which are used to collect data on the pages you visit and the features you use. |
If you visit oppenheimerfunds.com and do not log on to the secure account information areas, we do not obtain any personal information about you. When you do log on to a secure area, we do obtain your user ID and password to identify you. We also use this information to provide you with products and services you have requested, to inform you about products and services that you may be interested in and assist you in other ways.
We do not collect personal information through our website unless you willingly provide it to us, either directly by email or in those areas of the website that request information. In order to update your personal information (including your mailing address, email address and phone number) you must first log on and visit your user profile.
If you have set your browser to warn you before accepting cookies, you will receive the warning message with each cookie. You can refuse cookies by turning them off in your browser. However, doing so may limit your access to certain sections of our website.
We use cookies to help us improve and manage our website. For example, cookies help us recognize new versus repeat visitors to the site, track the pages visited, and enable some special features on the website. This data helps us provide a better service for our website visitors.
Protection of Information
We do not disclose any non-public personal information (such as names on a customer list) about current or former customers to anyone, except as permitted by law.
Disclosure of Information
Copies of confirmations, account statements and other documents reporting activity in your fund accounts are made available to your financial advisor (as designated by you). We may also use details about you and your investments to help us, our financial service affiliates, or firms that jointly market their financial products and services with ours, to better serve your investment needs or suggest educational material that may be of interest to you. If this requires us to provide you with an opportunity to “opt in” or “opt out” of such information sharing with a firm not affiliated with us, you will receive notification on how to do so, before any such sharing takes place.
Right of Refusal
We will not disclose your personal information to unaffiliated third parties (except as permitted by law), unless we first offer you a reasonable opportunity to refuse or “opt out” of such disclosure.
|
| 47 OPPENHEIMER PORTFOLIO SERIES EQUITY INVESTOR FUND |
PRIVACY POLICY NOTICE Continued
Internet Security and Encryption
In general, the email services provided by our website are encrypted and provide a secure and private means of communication with us. To protect your own privacy, confidential and/or personal information should only be communicated via email when you are advised that you are using a secure website. As a security measure, we do not include personal or account information in non-secure emails, and we advise you not to send such information to us in non-secure emails. Instead, you may take advantage of the secure features of our website to encrypt your email correspondence. To do this, you will need to use a browser that supports Secure Sockets Layer (SSL) protocol.
| ● | | All transactions, including redemptions, exchanges and purchases, are secured by SSL and 256-bit encryption. SSL is used to establish a secure connection between your PC and OppenheimerFunds’ server. It transmits information in an encrypted and scrambled format. |
| ● | | Encryption is achieved through an electronic scrambling technology that uses a “key” to code and then decode the data. Encryption acts like the cable converter box you may have on your television set. It scrambles data with a secret code so that no one can make sense of it while it is being transmitted. When the data reaches its destination, the same software unscrambles the data. |
| ● | | You can exit the secure area by either closing your browser, or for added security, you can use the Log Out button before you close your browser. |
Other Security Measures
We maintain physical, electronic and procedural safeguards to protect your personal account information. Our employees and agents have access to that information only so that they may offer you products or provide services, for example, when responding to your account questions.
How You Can Help
You can also do your part to keep your account information private and to prevent unauthorized transactions. If you obtain a user ID and password for your account, safeguard that information. Also, take special precautions when accessing your account on a computer used by others.
Who We Are
This joint notice describes the privacy policies of the Oppenheimer funds, OppenheimerFunds, Inc., each of its investment adviser subsidiaries, OppenheimerFunds Distributor, Inc. and OFI Global Trust Co. It applies to all Oppenheimer fund accounts you presently have, or may open in the future, using your Social Security number—whether or not you remain a shareholder of our funds. This notice was last updated November 2016. In the event it is updated or changed, we will post an updated notice on our website at oppenheimerfunds.com. If you have any questions about this privacy policy, write to us at P.O. Box 5270, Denver, CO 80217-5270, email us by clicking on the Contact Us section of our website at oppenheimerfunds.com or call us at 1.800.CALL OPP (225.5677).
|
| 48 OPPENHEIMER PORTFOLIO SERIES EQUITY INVESTOR FUND |
THIS PAGE INTENTIONALLY LEFT BLANK.
|
| 49 OPPENHEIMER PORTFOLIO SERIES EQUITY INVESTOR FUND |
THIS PAGE INTENTIONALLY LEFT BLANK.
|
| 50 OPPENHEIMER PORTFOLIO SERIES EQUITY INVESTOR FUND |
THIS PAGE INTENTIONALLY LEFT BLANK.
|
| 51 OPPENHEIMER PORTFOLIO SERIES EQUITY INVESTOR FUND |
THIS PAGE INTENTIONALLY LEFT BLANK.
|
| 52 OPPENHEIMER PORTFOLIO SERIES EQUITY INVESTOR FUND |
THIS PAGE INTENTIONALLY LEFT BLANK.
|
| 53 OPPENHEIMER PORTFOLIO SERIES EQUITY INVESTOR FUND |
THIS PAGE INTENTIONALLY LEFT BLANK.
|
| 54 OPPENHEIMER PORTFOLIO SERIES EQUITY INVESTOR FUND |
THIS PAGE INTENTIONALLY LEFT BLANK.
|
| 55 OPPENHEIMER PORTFOLIO SERIES EQUITY INVESTOR FUND |

OppenheimerFunds®
The Right Way
to Invest
Visit us at oppenheimerfunds.com for 24-hr access to
account information and transactions or call us at 800.CALL
OPP (800.225.5677) for 24-hr automated information and
automated transactions. Representatives also available
Mon–Fri 8am-8pm ET.
| | |
Visit Us oppenheimerfunds.com Call Us 800 225 5677 | | |
| |
Follow Us 
| | Oppenheimer funds are distributed by OppenheimerFunds Distributor, Inc. 225 Liberty Street, New York, NY 10281-1008 © 2017 OppenheimerFunds Distributor, Inc. All rights reserved. RA0555.001.0117 March 24, 2017 |
Item 2. Code of Ethics.
The registrant has adopted a code of ethics that applies to the registrant’s principal executive officer, principal financial officer, principal accounting officer or controller or persons performing similar functions.
Item 3. Audit Committee Financial Expert.
The Board of Trustees of the registrant has determined that Joanne Pace, the Board’s Audit Committee Chairwoman, is an audit committee financial expert and that Ms. Pace is “independent” for purposes of this Item 3.
Item 4. Principal Accountant Fees and Services.
The principal accountant for the audit of the registrant’s annual financial statements billed $87,000 in fiscal 2017 and $83,000 in fiscal 2016.
The principal accountant for the audit of the registrant’s annual financial statements billed $28,000 in fiscal 2017 and no such fees in fiscal 2016.
The principal accountant for the audit of the registrant’s annual financial statements billed $232,185 in fiscal 2017 and $520,440 in fiscal 2016 to the registrant’s investment adviser or any entity controlling, controlled by, or under common control with the adviser that provides ongoing services to the registrant.
Such services include: Internal control reviews, GIPS attestation procedures, and additional audit services
The principal accountant for the audit of the registrant’s annual financial statements billed no such fees in fiscal 2017 and no such fees in fiscal 2016.
The principal accountant for the audit of the registrant’s annual financial statements billed $716,713 in fiscal 2017 and $521,665 in fiscal 2016 to the registrant’s investment adviser or any entity controlling, controlled by, or under common control with the adviser that provides ongoing services to the registrant.
Such services include: tax compliance, tax planning and tax advice. Tax compliance generally involves preparation of original and amended tax returns, claims for a refund and tax payment-planning services. Tax planning and tax advice includes assistance with tax audits and appeals, tax advice related to mergers and acquisitions and requests for rulings or technical advice from taxing authorities.
The principal accountant for the audit of the registrant’s annual financial statements billed no such fees in fiscal 2017 and no such fees in fiscal 2016.
The principal accountant for the audit of the registrant’s annual financial statements billed no such fees in fiscal 2017 and no such fees in fiscal 2016 to the registrant’s investment adviser or any entity controlling, controlled by, or under common control with the adviser that provides ongoing services to the registrant.
Such fees would include the cost to the principal accountant of attending audit committee meetings and consultations regarding the registrant’s retirement plan with respect to its Trustees.
| (e) | (1) During its regularly scheduled periodic meetings, the registrant’s audit committee will pre-approve all audit, audit-related, tax and other services to be provided by the principal accountants of the registrant. |
The audit committee has delegated pre-approval authority to its Chairwoman for any subsequent new engagements that arise between regularly scheduled meeting dates provided that any fees such pre-approved are presented to the audit committee at its next regularly scheduled meeting.
Under applicable laws, pre-approval of non-audit services may be waived provided that: 1) the aggregate amount of all such services provided constitutes no more than five percent of the total amount of fees paid by the registrant to its principal accountant during the fiscal year in which services are provided 2) such services were not recognized by the registrant at the time of engagement as non-audit services and 3) such services are promptly brought to the attention of the audit committee of the registrant and approved prior to the completion of the audit.
(2) 0%
| (f) | Not applicable as less than 50%. |
| (g) | The principal accountant for the audit of the registrant’s annual financial statements billed $976,898 in fiscal 2017 and $1,042,105 in fiscal 2016 to the registrant and the registrant’s investment adviser or any entity controlling, controlled by, or under common control with the adviser that provides ongoing services to the registrant related to non-audit fees. Those billings did not include any prohibited non-audit services as defined by the Securities Exchange Act of 1934. |
| (h) | The registrant’s audit committee of the board of Trustees has considered whether the provision of non-audit services that were rendered to the registrant’s investment adviser, and any entity controlling, controlled by, or under common control with the investment adviser that provides ongoing services to the registrant that were not pre-approved pursuant to paragraph (c)(7)(ii) of Rule 2-01 of Regulation S-X is compatible with maintaining the principal accountant’s independence. No such services were rendered. |
Item 5. Audit Committee of Listed Registrants
Not applicable.
Item 6. Schedule of Investments.
a) Not applicable. The complete schedule of investments is included in Item 1 of this Form N-CSR.
b) Not applicable.
Item 7. Disclosure of Proxy Voting Policies and Procedures for Closed-End Management Investment Companies.
Not applicable.
Item 8. Portfolio Managers of Closed-End Management Investment Companies.
Not applicable.
Item 9. Purchases of Equity Securities by Closed-End Management Investment Company and Affiliated Purchasers.
Not applicable.
Item 10. Submission of Matters to a Vote of Security Holders.
The Fund’s Governance Committee Provisions with Respect to Nominations of Directors/Trustees to the Respective Boards
None
Item 11. Controls and Procedures.
Based on their evaluation of the registrant’s disclosure controls and procedures (as defined in rule 30a-3(c) under the Investment Company Act of 1940 (17 CFR 270.30a-3(c)) as of 1/31/2017, the registrant’s principal executive officer and principal financial officer found the registrant’s disclosure controls and procedures to provide reasonable assurances that information required to be disclosed by the registrant in the reports that it files under the Securities Exchange Act of 1934 (a) is accumulated and communicated to registrant’s management, including its principal executive officer and principal financial officer, to allow timely decisions regarding required disclosure, and (b) is recorded, processed, summarized and reported, within the time periods specified in the rules and forms adopted by the U.S. Securities and Exchange Commission.
There have been no changes in the registrant’s internal controls over financial reporting that occurred during the registrant’s second fiscal quarter of the period covered by this report that have materially affected, or are reasonably likely to materially affect, the registrant’s internal control over financial reporting.
Item 12. Exhibits.
| (a) | (1) Exhibit attached hereto. |
(2) Exhibits attached hereto.
(3) Not applicable.
| (b) | Exhibit attached hereto. |
SIGNATURES
Pursuant to the requirements of the Securities Exchange Act of 1934 and the Investment Company Act of 1940, the registrant has duly caused this report to be signed on its behalf by the undersigned, thereunto duly authorized.
Oppenheimer Portfolio Series
| | |
| By: | | /s/ Arthur P. Steinmetz |
| | |
| | Arthur P. Steinmetz |
| | Principal Executive Officer |
| Date: | | 3/17/2017 |
Pursuant to the requirements of the Securities Exchange Act of 1934 and the Investment Company Act of 1940, this report has been signed below by the following persons on behalf of the registrant and in the capacities and on the dates indicated.
| | |
| By: | | /s/ Arthur P. Steinmetz |
| | |
| | Arthur P. Steinmetz |
| | Principal Executive Officer |
| Date: | | 3/17/2017 |
| | |
| By: | | /s/ Brian S. Petersen |
| | |
| | Brian S. Petersen |
| | Principal Financial Officer |
| Date: | | 3/17/2017 |