UNITED STATES
SECURITIES AND EXCHANGE COMMISSION
WASHINGTON, D.C. 20549
FORMN-CSR
CERTIFIED SHAREHOLDER REPORT OF REGISTERED MANAGEMENT
INVESTMENT COMPANIES
Investment Company Act file number811-21686
Oppenheimer Portfolio Series
(Exact name of registrant as specified in charter)
6803 South Tucson Way, Centennial, Colorado 80112-3924
(Address of principal executive offices) (Zip code)
Cynthia Lo Bessette
OFI Global Asset Management, Inc.
225 Liberty Street, New York, New York 10281-1008
(Name and address of agent for service)
Registrant’s telephone number, including area code:(303)768-3200
Date of fiscal year end:January 31
Date of reporting period:1/31/2019
Item 1. Reports to Stockholders.

Important Updates
On October 18, 2018, Massachusetts Mutual Life Insurance Company, an indirect corporate parent of OppenheimerFunds, Inc. and its subsidiaries OFI Global Asset Management, Inc., OFI SteelPath, Inc. and OFI Advisors, LLC, announced that it has entered into an agreement whereby Invesco Ltd., a global investment management company, will acquire OppenheimerFunds, Inc. As of the date of this report, the transaction is expected to close in the second quarter of 2019, pending necessary regulatory and other third-party approvals. This is subject to change. See the Notes to Financial Statements for more information.
Update to Shareholder Report Document Delivery
Beginning January 1, 2021, OppenheimerFunds will send a notice, either by mail or email, each time your fund’s updated report is available on our website (oppenheimerfunds.com). Investors who are not enrolled in electronic delivery by January 1, 2021 will receive the notice in the mail. Enrolling in electronic delivery will enable you to receive a direct link to your full shareholder report the moment it becomes available, and limit the amount of mail you receive. All investors who prefer to receive shareholder reports in paper may, at any time, choose that option.
How do you update your delivery preferences?
If you own these shares through a financial intermediary, you may contact your financial intermediary.
If your accounts are held through OppenheimerFunds and you receive statements, confirms, and other documents directly from us, you can enroll in our eDocs DirectSM service atoppenheimerfunds.com or by calling us. Once you’re enrolled, you’ll begin to receive email notifications of updated documents when they become available. If you have any questions, feel free to call us at1.800.225.5677.
Table of Contents
Class A Shares
AVERAGE ANNUAL TOTAL RETURNS AT 1/31/19
| | | | | | | | |
| | | Class A Shares of the Fund | | | | |
| | | Without Sales Charge | | With Sales Charge | | Bloomberg Barclays
U.S. Aggregate Bond
Index | | S&P 500 Index |
1-Year | | -1.49% | | -7.16% | | 2.25% | | -2.31% |
|
5-Year | | 3.43 | | 2.21 | | 2.44 | | 10.96 |
|
10-Year | | 6.32 | | 5.69 | | 3.68 | | 15.00 |
|
Performance data quoted represents past performance, which does not guarantee future results.The investment return and principal value of an investment in the Fund will fluctuate so that an investor’s shares, when redeemed, may be worth more or less than their original cost. Fund returns include changes in share price, reinvested distributions, and a 5.75% maximum applicable sales charge except where “without sales charge” is indicated. Current performance may be lower or higher than the performance quoted. Returns do not consider capital gains or income taxes on an individual’s investment. Returns for periods of less than one year are cumulative and not annualized. For performance data current to the most recentmonth-end, visit oppenheimerfunds.com or call 1.800.CALL OPP (225.5677). See Fund prospectuses and summary prospectuses for more information on share classes and sales charges.
3 OPPENHEIMER PORTFOLIO SERIES CONSERVATIVE INVESTOR FUND
Fund Performance Discussion1
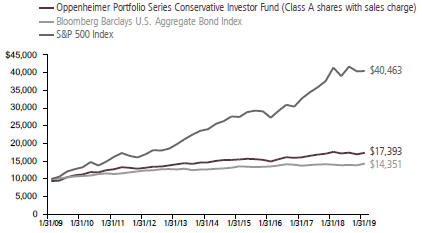
During theone-year period ended January 31, 2019, the Fund’s Class A shares (without sales charge) returned-1.49%. For theone-year period ended January 31, 2019, the Fund underperformed the Bloomberg Barclays U.S. Aggregate Bond Index’s 2.25% return and outperformed the S&P 500 Index’s-2.31% return.
MARKET OVERVIEW
Markets were volatile in 2018 and hit a wall in the last quarter of the year, before picking up again in January 2019. Several shocks negatively affected market sentiment. The U.S. Federal Reserve (Fed) once again decided to hike interest rates, as was nearly universally expected, but the post-meeting conference was more hawkish than expected. Markets were expecting a clear message that the Fed might consider a pause in any future rate increases, but that was not initially
communicated. Equity markets sold off, bonds rallied, and the U.S. dollar weakened. The sell-offs were sizable, which led some to think a recession might be imminent. It was not just the Fed making headlines, some key economic data were also weaker in December. In the U.S., regional surveys from the Fed and Institute for Supply Management (ISM) sentiment surveys decreased markedly, along with acool-off in housing. Politics were once again a factor because there was little clarity
COMPARISON OF CHANGE IN VALUE OF $10,000 HYPOTHETICAL INVESTMENTS IN:
1. The Fund is invested in Class I shares of all underlying funds discussed in this Fund Performance Discussion.
4 OPPENHEIMER PORTFOLIO SERIES CONSERVATIVE INVESTOR FUND
from the Trump Administration about the policies for tariffs on Chinese imports, and the U.S. Government shutdown did not help in an environment where the appetite for risk declined. Risk markets rallied in January 2019. The strong gains were driven by a shift in the statements from the Fed, which signaled a more dovish tone on future interest rate rises.
Despite rallying in January 2019, equities generally declined for theone-year period ended January 31, 2019. U.S. equities outperformed their international counterparts, with the S&P 500 returning-2.31%, the MSCI ACWI returning-7.48%, and emerging markets falling the most with a-14.24% return for the MSCI Emerging Markets Index. Growth stocks continued to outperform value stocks this reporting period. Fixed income fared better than equities in a volatile environment, with the Bloomberg Barclays U.S. Aggregate Bond Index returning 2.25% and the Bloomberg Barclays Global Aggregate Bond Index, Hedged returning 3.58%.
FUND REVIEW
In a period where U.S. fixed income produced positive returns and outperformed equities, the Fund’s exposure to both Oppenheimer Total Return Bond Fund and Oppenheimer Limited-Term Government Fund benefited performance. The Fund’s allocation to Oppenheimer International Bond Fund detracted slightly from performance as a result of asell-off in emerging markets fixed income.
The Fund’s equity exposure detracted from performance. Top detractors from performance in this area included Oppenheimer Value Fund, Oppenheimer Capital Appreciation Fund, Oppenheimer International Growth Fund, and Oppenheimer International Equity Fund. As mentioned earlier, value stocks underperformed this reporting period, which impacted Oppenheimer Value Fund’s performance. Oppenheimer Capital Appreciation Fund, which typically invests inlarge-cap U.S. growth stocks, fared better than Oppenheimer Value Fund as growth outperformed; however, Oppenheimer Capital Appreciation Fund experienced declines and negatively impacted performance as it remained a top holding for most of the reporting period. We significantly trimmed our exposure to Oppenheimer Capital Appreciation Fund over the closing months of the reporting period. With international stocks underperforming U.S. stocks this period, the Fund’s allocation to Oppenheimer International Growth Fund and Oppenheimer International Equity Fund detracted from performance this reporting period. Oppenheimer Developing Markets Fund also detracted from absolute results as emerging market equities had a difficult reporting period.
Oppenheimer Global Fund and Oppenheimer Emerging Markets Innovators Fund were underlying equity funds that contributed positively to performance this period. We initiated positions in these underlying funds over the second half of the reporting period.
5 OPPENHEIMER PORTFOLIO SERIES CONSERVATIVE INVESTOR FUND
POST-PERIOD UPDATE
Effective February 1, 2019, we implemented changes to the Fund, which we believe will meaningfully enhance our investment capabilities and flexibility to manage the strategy in line with client expectations. The investment universe of the Fund has been expanded across OppenheimerFunds’ products, including additional mutual funds, ETFs andclosed-end funds, which will offer us additional component parts and greater investment flexibility to seek to achieve the
| | |
 | | 
Jeffrey Bennett Portfolio Manager |
| | |
Fund’s investment objective. In addition, the Fund will permit derivative usage for cash and duration management. To better reflect the changes to the Fund, including an increase in international exposure, the Fund changed its benchmarks from the Bloomberg Barclays U.S. Aggregate Bond Index and S&P 500 Index to the Bloomberg Barclays Global Aggregate Bond Index, Hedged, MSCI ACWI, and a blended benchmark that consists of 20% MSCI ACWI and 80% Bloomberg Barclays Global Aggregate Bond Index, Hedged.
6 OPPENHEIMER PORTFOLIO SERIES CONSERVATIVE INVESTOR FUND
Top Holdings and Allocations
ASSET CLASS ALLOCATION
| | |
Domestic Fixed Income Funds | | 47.2% |
Foreign Fixed Income Fund | | 24.6 |
Foreign Equity Funds | | 14.2 |
Alternative Funds | | 8.0 |
Domestic Equity Funds | | 6.0 |
Money Market Fund | | —* |
| * | Represents a value of less than 0.05%. |
Portfolio holdings and allocations are subject to change. Percentages are as of January 31, 2019, and are based on the total market value of investments.
TOP TEN HOLDINGS
| | |
| Oppenheimer Total Return Bond Fund, Cl. I | | 24.7% |
| Oppenheimer International Bond Fund, Cl. I | | 24.6 |
| Oppenheimer Master Loan Fund, LLC | | 9.7 |
| Oppenheimer Limited-Term Government Fund, Cl. I | | 8.3 |
| Oppenheimer Global Fund, Cl. I | | 6.2 |
| Oppenheimer Master Inflation Protected Securities Fund, LLC | | 4.4 |
| Oppenheimer Master Event-Linked Bond Fund, LLC | | 3.3 |
| Oppenheimer Value Fund, Cl. I | | 2.7 |
| Oppenheimer Fundamental Alternatives Fund, Cl. I | | 1.9 |
| Oppenheimer International Equity Fund, Cl. I | | 1.9 |
Portfolio holdings and allocations are subject to change. Percentages are as of January 31, 2019, and are based on net assets.
For more current Fund holdings, please visit oppenheimerfunds.com.
7 OPPENHEIMER PORTFOLIO SERIES CONSERVATIVE INVESTOR FUND
Share Class Performance
AVERAGE ANNUAL TOTAL RETURNS WITHOUT SALES CHARGE AS OF 1/31/19
| | | | | | | | | | | | | | | | | | | | | | | | | | | | | | | | |
| | | Inception
Date | | | | | | 1-Year | | | | | | 5-Year | | | | | | 10-Year | | | | |
Class A (OACIX) | | | 4/5/05 | | | | | | | | -1.49 | % | | | | | | | 3.43 | % | | | | | | | 6.32 | % | | | | |
Class C (OCCIX) | | | 4/5/05 | | | | | | | | -2.30 | | | | | | | | 2.67 | | | | | | | | 5.51 | | | | | |
Class R (ONCIX) | | | 4/5/05 | | | | | | | | -1.73 | | | | | | | | 3.18 | | | | | | | | 6.03 | | | | | |
Class Y (OYCIX) | | | 4/5/05 | | | | | | | | -1.31 | | | | | | | | 3.67 | | | | | | | | 6.60 | | | | | |
AVERAGE ANNUAL TOTAL RETURNS WITH SALES CHARGE AS OF 1/31/19
| | | | | | | | | | | | | | | | | | | | | | | | | | | | | | | | |
| | | Inception
Date | | | | | | 1-Year | | | | | | 5-Year | | | | | | 10-Year | | | | |
Class A (OACIX) | | | 4/5/05 | | | | | | | | -7.16 | % | | | | | | | 2.21 | % | | | | | | | 5.69 | % | | | | |
Class C (OCCIX) | | | 4/5/05 | | | | | | | | -3.27 | | | | | | | | 2.67 | | | | | | | | 5.51 | | | | | |
Class R (ONCIX) | | | 4/5/05 | | | | | | | | -1.73 | | | | | | | | 3.18 | | | | | | | | 6.03 | | | | | |
Class Y (OYCIX) | | | 4/5/05 | | | | | | | | -1.31 | | | | | | | | 3.67 | | | | | | | | 6.60 | | | | | |
Performance data quoted represents past performance, which does not guarantee future results.The investment return and principal value of an investment in the Fund will fluctuate so that an investor’s shares, when redeemed, may be worth more or less than their original cost. Current performance may be lower or higher than the performance quoted. Returns do not consider capital gains or income taxes on an individual’s investment. For performance data current to the most recentmonth-end, visit oppenheimerfunds.com or call 1.800. CALL OPP (225.5677). Fund returns include changes in share price, reinvested distributions, and the applicable sales charge: for Class A shares, the current maximum initial sales charge of 5.75% and for Class C shares, the contingent deferred sales charge of 1% for the1-year period. There is no sales charge for Class R and Class Y shares. Returns for periods of less than one year are cumulative and not annualized. See Fund prospectuses and summary prospectuses for more information on share classes and sales charges.
The Fund’s performance is compared to the performance of the S&P 500 Index and the Bloomberg Barclays U.S. Aggregate Bond Index. The S&P 500 Index is a capitalization-weighted index of 500 stocks intended to be a representative sample of leading companies in leading industries within the U.S. economy. The Bloomberg Barclays U.S. Aggregate Bond Index is an index of U.S.-dollar-denominated, investment-grade U.S. corporate government and mortgage-backed securities. The indices areunmanaged and cannot be purchased directly by investors. While index comparisons may be useful to provide a benchmark for the Fund’s performance, it must be noted that the Fund’s investments are not limited to the investments comprising theindices. Index performance includes reinvestment of income, but does not reflect transaction costs, fees, expenses or taxes. Index performance is shown for illustrative purposes only as a benchmark for the Fund’s performance, and does not predict or depict performance of the Fund. The Fund’s performance reflects the effects of the Fund’s business and operating expenses.
The views in the Fund Performance Discussion represent the opinions of this Fund’s portfolio manager(s) and are not intended as investment advice or to predict or depict the performance of any investment. These views are as of the close of business on January 31, 2019, and are
8 OPPENHEIMER PORTFOLIO SERIES CONSERVATIVE INVESTOR FUND
subject to change based on subsequent developments. The Fund’s portfolio and strategies are subject to change.
Before investing in any of the Oppenheimer funds, investors should carefully consider a fund’s investment objectives, risks, charges and expenses. Fund prospectuses and summary prospectuses contain this and other information about the funds, and may be obtained by asking your financial advisor, visiting oppenheimerfunds.com, or calling 1.800.CALL OPP (225.5677). Read prospectuses and summary prospectuses carefully before investing.
Shares of Oppenheimer funds are not deposits or obligations of any bank, are not guaranteed by any bank, are not insured by the FDIC or any other agency, and involve investment risks, including the possible loss of the principal amount invested.
9 OPPENHEIMER PORTFOLIO SERIES CONSERVATIVE INVESTOR FUND
Fund Expenses
Fund Expenses. As a shareholder of the Fund, you incur two types of costs: (1) transaction costs, which may include sales charges (loads) on purchase payments and/or contingent deferred sales charges on redemptions; and (2) ongoing costs, including management fees; distribution and service fees; and other Fund expenses. These examples are intended to help you understand your ongoing costs (in dollars) of investing in the Fund and to compare these costs with the ongoing costs of investing in other mutual funds.
The examples are based on an investment of $1,000.00 invested at the beginning of the period and held for the entire6-month period ended January 31, 2019.
Actual Expenses. The first section of the table provides information about actual account values and actual expenses. You may use the information in this section for the class of shares you hold, together with the amount you invested, to estimate the expense that you paid over the period. Simply divide your account value by $1,000.00 (for example, an $8,600.00 account value divided by $1,000.00 = 8.60), then multiply the result by the number in the first section under the heading entitled “Expenses Paid During 6 Months Ended January 31, 2019” to estimate the expenses you paid on your account during this period.
Hypothetical Example for Comparison Purposes.The second section of the table provides information about hypothetical account values and hypothetical expenses based on the Fund’s actual expense ratio for each class of shares, and an assumed rate of return of 5% per year for each class before expenses, which is not the Fund’s actual return. The hypothetical account values and expenses may not be used to estimate the actual ending account balance or expenses you paid for the period. You may use this information to compare the ongoing costs of investing in the Fund and other funds. To do so, compare this 5% hypothetical example for the class of shares you hold with the 5% hypothetical examples that appear in the shareholder reports of the other funds.
Please note that the expenses shown in the table are meant to highlight your ongoing costs only and do not reflect any transactional costs, such asfront-end or contingent deferred sales charges (loads). Therefore, the “hypothetical” section of the table is useful in comparing ongoing costs only, and will not help you determine the relative total costs of owning different funds. In addition, if these transactional costs were included, your costs would have been higher.
10 OPPENHEIMER PORTFOLIO SERIES CONSERVATIVE INVESTOR FUND
| | | | | | | | | | | | |
| Actual | | Beginning Account Value August 1, 2018 | | | | Ending Account Value January 31, 2019 | | | | Expenses Paid During 6 Months Ended January 31, 2019 | | |
Class A | | $ 1,000.00 | | | | $ 997.40 | | | | $ 2.17 | | |
Class C | | 1,000.00 | | | | 993.60 | | | | 5.95 | | |
Class R | | 1,000.00 | | | | 996.10 | | | | 3.43 | | |
Class Y | | 1,000.00 | | | | 998.30 | | | | 0.96 | | |
Hypothetical (5% return before expenses) | | | | | | | | | | | | |
Class A | | 1,000.00 | | | | 1,023.04 | | | | 2.19 | | |
Class C | | 1,000.00 | | | | 1,019.26 | | | | 6.02 | | |
Class R | | 1,000.00 | | | | 1,021.78 | | | | 3.47 | | |
Class Y | | 1,000.00 | | | | 1,024.25 | | | | 0.97 | | |
Expenses are equal to the Fund’s annualized expense ratio for that class, multiplied by the average account value over the period, multiplied by 184/365 (to reflect theone-half year period). Those annualized expense ratios, excluding indirect expenses from affiliated funds, based on the6-month period ended January 31, 2019 are as follows:
| | | | | | | | |
| Class | | Expense Ratios | | | | |
Class A | | | 0.43 | % | | | | |
Class C | | | 1.18 | | | | | |
Class R | | | 0.68 | | | | | |
Class Y | | | 0.19 | | | | | |
The expense ratios reflect voluntary and/or contractual waivers and/or reimbursements of expenses by the Fund’s Manager. Some of these undertakings may be modified or terminated at any time, as indicated in the Fund’s prospectus. The “Financial Highlights” tables in the Fund’s financial statements, included in this report, also show the gross expense ratios, without such waivers or reimbursements and reduction to custodian expenses, if applicable.
11 OPPENHEIMER PORTFOLIO SERIES CONSERVATIVE INVESTOR FUND
STATEMENT OF INVESTMENTSJanuary 31, 2019
| | | | | | | | |
| | | Shares | | | Value | |
| |
Investment Companies—99.8%1 | |
Alternative Funds—8.0% | | | | | | | | |
Oppenheimer Fundamental Alternatives Fund, Cl. I | | | 409,938 | | | $ | 11,006,849 | |
| |
Oppenheimer Master Event-Linked Bond Fund, LLC | | | 1,226,899 | | | | 19,003,204 | |
| |
Oppenheimer Real Estate Fund, Cl. I | | | 396,960 | | | | 9,943,844 | |
| |
Oppenheimer SteelPath MLP Select 40 Fund, Cl. I | | | 737,093 | | | | 5,771,438 | |
| | | | | | | | |
| | | | | | | 45,725,335 | |
| |
Domestic Equity Funds—6.0% | | | | | | | | |
Oppenheimer Capital Appreciation Fund, Cl. I | | | 118,471 | | | | 7,262,243 | |
| |
Oppenheimer Discovery Mid Cap Growth Fund, Cl. I | | | 272,484 | | | | 5,801,191 | |
| |
Oppenheimer Main Street Small Cap Fund, Cl. I | | | 411,452 | | | | 5,776,785 | |
| |
Oppenheimer Value Fund, Cl. I | | | 489,329 | | | | 15,702,572 | |
| | | | | | | | |
| | | | | | | 34,542,791 | |
| |
Domestic Fixed Income Funds—47.1% | | | | | | | | |
Oppenheimer Limited-Term Government Fund, Cl. I | | | 10,961,760 | | | | 47,464,421 | |
| |
Oppenheimer Master Inflation Protected Securities Fund, LLC | | | 2,087,517 | | | | 25,343,831 | |
| |
Oppenheimer Master Loan Fund, LLC | | | 3,228,487 | | | | 55,546,345 | |
| |
Oppenheimer Total Return Bond Fund, Cl. I | | | 21,263,843 | | | | 141,404,555 | |
| | | | | | | | |
| | | | | | | 269,759,152 | |
| |
Foreign Equity Funds—14.1% | | | | | | | | |
Oppenheimer Developing Markets Fund, Cl. I | | | 220,108 | | | | 8,978,195 | |
| |
Oppenheimer Emerging Markets Innovators Fund, Cl. I2 | | | 302,160 | | | | 2,940,020 | |
| |
Oppenheimer Global Fund, Cl. I | | | 436,351 | | | | 35,654,209 | |
| |
Oppenheimer International Equity Fund, Cl. I | | | 558,975 | | | | 10,704,379 | |
| |
Oppenheimer International Growth Fund, Cl. I | | | 237,334 | | | | 8,812,219 | |
| |
Oppenheimer InternationalSmall-Mid Co. Fund, Cl. I | | | 81,208 | | | | 3,529,302 | |
| |
Oppenheimer Macquarie Global Infrastructure Fund, Cl. I | | | 960,524 | | | | 10,277,607 | |
| | | | | | | | |
| | | | | | | 80,895,931 | |
| |
Foreign Fixed Income Fund—24.6% | | | | | | | | |
Oppenheimer International Bond Fund, Cl. I | | | 25,266,341 | | | | 140,480,858 | |
| |
Money Market Fund—0.0% | | | | | | | | |
Oppenheimer Institutional Government Money Market Fund, Cl. E, 2.35%3 | | | 109,421 | | | | 109,421 | |
| |
Total Investments, at Value(Cost $576,057,187) | | | 99.8% | | | | 571,513,488 | |
| |
Net Other Assets (Liabilities) | | | 0.2 | | | | 904,858 | |
| | | | |
Net Assets | | | 100.0% | | | $ | 572,418,346 | |
| | | | |
Footnotes to Statement of Investments
1. Is or was an affiliate, as defined in the Investment Company Act of 1940, as amended, at or during the reporting period, by virtue of the Fund owning at least 5% of the voting securities of the issuer or as a result of the Fund and the issuer having the same investment adviser. Transactions during the reporting period in which the issuer was an affiliate are as follows:
| | | | | | | | | | | | | | | | |
| | | Shares January 31, 2018 | | | Gross Additions | | | Gross Reductions | | | Shares January 31, 2019 | |
| |
Investment Companies Alternative Funds | | | | | | | | | | | | | | | | |
Oppenheimer Fundamental Alternatives Fund, Cl. I | | | 485,515 | | | | 481,301 | | | | 556,878 | | | | 409,938 | |
Oppenheimer Global Multi Strategies Fund, Cl. I | | | 1,155,713 | | | | 630 | | | | 1,156,343 | | | | — | |
12 OPPENHEIMER PORTFOLIO SERIES CONSERVATIVE INVESTOR FUND
Footnotes to Statement of Investments (Continued)
| | | | | | | | | | | | | | | | |
| | | Shares January 31, 2018 | | | Gross Additions | | | Gross Reductions | | | Shares January 31, 2019 | |
| |
Oppenheimer Gold & Special Minerals Fund, Cl. I | | | 610,836 | | | | 332,724 | | | | 943,560 | | | | — | |
Oppenheimer Master Event-Linked Bond Fund, LLC | | | — | | | | 1,333,591 | | | | 106,692 | | | | 1,226,899 | |
Oppenheimer Real Estate Fund, Cl. I | | | 793,943 | | | | 138,525 | | | | 535,508 | | | | 396,960 | |
Oppenheimer SteelPath MLP Select 40 Fund, Cl. I | | | — | | | | 754,134 | | | | 17,041 | | | | 737,093 | |
Domestic Equity Funds | | | | | | | | | | | | | | | | |
Oppenheimer Capital Appreciation Fund, Cl. I | | | 1,068,074 | | | | 14,985 | | | | 964,588 | | | | 118,471 | |
Oppenheimer Discovery Mid Cap Growth Fund, Cl. I | | | — | | | | 278,698 | | | | 6,214 | | | | 272,484 | |
Oppenheimer Main Street Mid Cap Fund, Cl. I | | | 423,476 | | | | 14,562 | | | | 438,038 | | | | — | |
Oppenheimer Main Street Small Cap Fund, Cl. I | | | 735,252 | | | | 42,352 | | | | 366,152 | | | | 411,452 | |
Oppenheimer Value Fund, Cl. I | | | 1,833,645 | | | | 130,696 | | | | 1,475,012 | | | | 489,329 | |
Domestic Fixed Income Funds | | | | | | | | | | | | | | | | |
Oppenheimer Limited-Term Government Fund, Cl. I | | | 15,119,183 | | | | 2,410,202 | | | | 6,567,625 | | | | 10,961,760 | |
Oppenheimer Master Inflation Protected Securities Fund, LLC | | | 3,517,926 | | | | 428,318 | | | | 1,858,727 | | | | 2,087,517 | |
Oppenheimer Master Loan Fund, LLC | | | 1,883,024 | | | | 1,799,112 | | | | 453,649 | | | | 3,228,487 | |
Oppenheimer Total Return Bond Fund, Cl. I | | | 22,817,338 | | | | 2,382,324 | | | | 3,935,819 | | | | 21,263,843 | |
Foreign Equity Funds | | | | | | | | | | | | | | | | |
Oppenheimer Developing Markets Fund, Cl. I | | | 110,827 | | | | 125,572 | | | | 16,291 | | | | 220,108 | |
Oppenheimer Emerging Markets Innovators Fund, Cl. I | | | — | | | | 309,283 | | | | 7,123 | | | | 302,160 | |
Oppenheimer Global Fund, Cl. I | | | — | | | | 446,072 | | | | 9,721 | | | | 436,351 | |
Oppenheimer International Equity Fund, Cl. I | | | 490,134 | | | | 161,928 | | | | 93,087 | | | | 558,975 | |
Oppenheimer International Growth Fund, Cl. I | | | 274,637 | | | | 18,527 | | | | 55,830 | | | | 237,334 | |
Oppenheimer International Small- Mid Co. Fund, Cl. I | | | 81,335 | | | | 9,362 | | | | 9,489 | | | | 81,208 | |
Oppenheimer Macquarie Global Infrastructure Fund, Cl. I | | | — | | | | 982,846 | | | | 22,322 | | | | 960,524 | |
Foreign Fixed Income Funds | | | | | | | | | | | | | | | | |
Oppenheimer International Bond Fund, Cl. I | | | 11,588,336 | | | | 15,517,801 | | | | 1,839,796 | | | | 25,266,341 | |
Money Market Funds | | | | | | | | | | | | | | | | |
Oppenheimer Institutional Government Money Market Fund, Cl. E | | | 199,526 | | | | 23,235,699 | | | | 23,325,804 | | | | 109,421 | |
13 OPPENHEIMER PORTFOLIO SERIES CONSERVATIVE INVESTOR FUND
STATEMENT OF INVESTMENTSContinued
Footnotes to Statement of Investments (Continued)
| | | | | | | | | | | | | | | | |
| | | Value | | | Income | | | Realized Gain (Loss) | | | Change in Unrealized Gain (Loss) | |
| |
Investment Companies Alternative Funds | | | | | | | | | | | | | | | | |
Oppenheimer Fundamental Alternatives Fund, Cl. I | | $ | 11,006,849 | | | $ | 232,183 | | | $ | 244,476 | | | $ | (563,979) | |
Oppenheimer Global Multi Strategies Fund, Cl. I | | | — | | | | — | | | | (4,129,984) | | | | 3,647,259 | |
Oppenheimer Gold & Special Minerals Fund, Cl. I | | | — | | | | — | | | | (6,574,418) | | | | 5,113,070 | |
Oppenheimer Master Event-Linked Bond Fund, LLC | | | 19,003,204 | | | | 1,022,004a | | | | (387,983) | a | | | (577,411) | a |
Oppenheimer Real Estate Fund, Cl. Ib | | | 9,943,844 | | | | 271,192 | | | | 2,386,123 | | | | (1,983,599) | |
Oppenheimer SteelPath MLP Select 40 Fund, Cl. I | | | 5,771,438 | | | | 84,750 | | | | (1,383) | | | | (72,903) | |
Domestic Equity Funds | | | | | | | | | | | | | | | | |
Oppenheimer Capital Appreciation Fund, Cl. Ic | | | 7,262,243 | | | | 15,791 | | | | 13,423,448 | | | | (16,447,286) | |
Oppenheimer Discovery Mid Cap Growth Fund, Cl. Id | | | 5,801,191 | | | | — | | | | (2,853) | | | | (233,423) | |
Oppenheimer Main Street Mid Cap Fund, Cl. Ie | | | — | | | | 11,475 | | | | 1,044,056 | | | | (1,888,269) | |
Oppenheimer Main Street Small Cap Fund, Cl. If | | | 5,776,785 | | | | 25,130 | | | | 899,295 | | | | (1,524,320) | |
Oppenheimer Value Fund, Cl. Ig | | | 15,702,572 | | | | 889,988 | | | | 18,823,207 | | | | (27,553,054) | |
Domestic Fixed Income Funds | | | | | | | | | | | | | | | | |
Oppenheimer Limited-Term Government Fund, Cl. I | | | 47,464,421 | | | | 1,627,174 | | | | (1,070,864) | | | | 675,628 | |
Oppenheimer Master Inflation Protected Securities Fund, LLC | | | 25,343,831 | | | | 1,133,707h | | | | (570,925) | h | | | (506,407) | h |
Oppenheimer Master Loan Fund, LLC | | | 55,546,345 | | | | 2,354,999i | | | | 209,597i | | | | (2,238,688) | i |
Oppenheimer Total Return Bond Fund, Cl. I | | | 141,404,555 | | | | 5,353,779 | | | | (613,667) | | | | (2,562,704) | |
Foreign Equity Funds | | | | | | | | | | | | | | | | |
Oppenheimer Developing Markets Fund, Cl. I | | | 8,978,195 | | | | 53,832 | | | | 184,544 | | | | (500,698) | |
Oppenheimer Emerging Markets Innovators Fund, Cl. I | | | 2,940,020 | | | | — | | | | 339 | | | | 125,303 | |
Oppenheimer Global Fund, Cl. Ij | | | 35,654,209 | | | | 201,962 | | | | (20,848) | | | | (1,424,464) | |
Oppenheimer International Equity Fund, Cl. I | | | 10,704,379 | | | | 155,178 | | | | 613,023 | | | | (2,513,682) | |
Oppenheimer International Growth Fund, Cl. I | | | 8,812,219 | | | | 132,750 | | | | 833,500 | | | | (3,075,027) | |
Oppenheimer International Small-Mid Co. Fund, Cl. Ik | | | 3,529,302 | | | | 35,700 | | | | 278,199 | | | | (934,565) | |
Oppenheimer Macquarie Global Infrastructure Fund, Cl. Il | | | 10,277,607 | | | | 48,314 | | | | 341 | | | | 336,368 | |
Foreign Fixed Income Funds | | | | | | | | | | | | | | | | |
Oppenheimer International Bond Fund, Cl. I | | | 140,480,858 | | | | 2,663,885 | | | | 261,479 | | | | (2,367,935) | |
14 OPPENHEIMER PORTFOLIO SERIES CONSERVATIVE INVESTOR FUND
Footnotes to Statement of Investments (Continued)
| | | | | | | | | | | | | | | | |
| | | Value | | | Income | | | Realized Gain (Loss) | | | Change in Unrealized Gain (Loss) | |
| |
Money Market Funds | | | | | | | | | | | | | | | | |
Oppenheimer Institutional Government Money Market Fund, Cl. E | | $ | 109,421 | | | $ | 92,936 | | | $ | — | | | $ | — | |
| | | | |
Total | | $ | 571,513,488 | | | $ | 16,406,729 | | | $ | 25,828,702 | | | $ | (57,070,786) | |
| | | | |
a. Represents the amount allocated to the Fund from Oppenheimer Event-Linked Bond Fund, LLC.
b. This fund distributed realized gains of $245,461.
c. This fund distributed realized gains of $511,524.
d. This fund distributed realized gains of $290,744.
e. This fund distributed realized gains of $288,026.
f. This fund distributed realized gains of $455,317.
g. This fund distributed realized gains of $2,908,020.
h. Represents the amount allocated to the Fund from Oppenheimer Master Inflation Protected Securities Fund, LLC.
i. Represents the amount allocated to the Fund from Oppenheimer Master Loan Fund, LLC.
j. This fund distributed realized gains of $2,256,961.
k. This fund distributed realized gains of $310,730.
l. This fund distributed realized gains of $34,454.
2.Non-income producing security.
3. Rate shown is the7-day yield at period end.
See accompanying Notes to Financial Statements.
15 OPPENHEIMER PORTFOLIO SERIES CONSERVATIVE INVESTOR FUND
STATEMENT OF ASSETS AND LIABILITIESJanuary 31, 2019
| | | | |
Assets | | | | |
Investments, at value—see accompanying statement of investments—affiliated companies (cost $576,057,187) | | $ | 571,513,488 | |
Cash | | | 1,035,179 | |
Receivables and other assets: | | | | |
Dividends | | | 1,153,224 | |
Investments sold | | | 462,417 | |
Shares of beneficial interest sold | | | 183,668 | |
Other | | | 24,454 | |
| | | | |
Total assets | | | 574,372,430 | |
Liabilities | | | | |
Payables and other liabilities: | | | | |
Investments purchased | | | 1,177,404 | |
Shares of beneficial interest redeemed | | | 593,151 | |
Distribution and service plan fees | | | 118,022 | |
Trustees’ compensation | | | 32,302 | |
Shareholder communications | | | 6,339 | |
Other | | | 26,866 | |
| | | | |
Total liabilities | | | 1,954,084 | |
Net Assets | | $ | 572,418,346 | |
| | | | |
| | | | |
Composition of Net Assets | | | | |
Par value of shares of beneficial interest | | $ | 61,652 | |
Additionalpaid-in capital | | | 602,620,990 | |
Total accumulated loss | | | (30,264,296) | |
| | | | |
Net Assets | | $ | 572,418,346 | |
| | | | |
| | | | |
Net Asset Value Per Share | | | | |
Class A Shares: | | | | |
| |
| Net asset value and redemption price per share (based on net assets of $396,318,269 and 42,569,816 shares of beneficial interest outstanding) | | | $9.31 | |
Maximum offering price per share (net asset value plus sales charge of 5.75% of offering price) | | | $9.88 | |
| |
Class C Shares: | | | | |
| |
| Net asset value, redemption price (excludes applicable contingent deferred sales charge) and offering price per share (based on net assets of $125,385,307 and 13,625,568 shares of beneficial interest outstanding) | | | $9.20 | |
| |
Class R Shares: | | | | |
| |
| Net asset value, redemption price (excludes applicable contingent deferred sales charge) and offering price per share (based on net assets of $44,044,202 and 4,742,315 shares of beneficial interest outstanding) | | | $9.29 | |
| |
Class Y Shares: | | | | |
| |
| Net asset value, redemption price and offering price per share (based on net assets of $6,670,568 and 713,922 shares of beneficial interest outstanding) | | | $9.34 | |
See accompanying Notes to Financial Statements.
16 OPPENHEIMER PORTFOLIO SERIES CONSERVATIVE INVESTOR FUND
STATEMENT OF
OPERATIONSFor the Year EndedJanuary 31, 2019
| | | | |
Allocation of Income and Expenses from Master Funds1 | | | | |
Net investment income allocated from Oppenheimer Master Event-Linked Bond Fund, LLC: | | | | |
Interest | | $ | 1,014,534 | |
Dividends | | | 7,470 | |
Net expenses | | | (60,035) | |
| | | | |
Net investment income allocated from Oppenheimer Master Event-Linked Bond Fund, LLC | | | 961,969 | |
| |
Net investment income allocated from Oppenheimer Master Inflation Protected Securities Fund, LLC: | | | | |
Interest | | | 1,128,321 | |
Dividends | | | 5,386 | |
Net expenses | | | (184,721) | |
| | | | |
Net investment income allocated from Oppenheimer Master Inflation Protected Securities Fund, LLC | | | 948,986 | |
| |
Net investment income allocated from Oppenheimer Master Loan Fund, LLC: | | | | |
Interest | | | 2,306,755 | |
Dividends | | | 48,244 | |
Net expenses | | | (155,288) | |
| | | | |
Net investment income allocated from Oppenheimer Master Loan Fund, LLC | | | 2,199,711 | |
| | | | |
Total allocation of net investment income from master funds | | | 4,110,666 | |
| | | | |
Investment Income | | | | |
Dividends from affiliated companies | | | 11,896,019 | |
| |
Interest | | | 13,824 | |
| | | | |
Total investment income | | | 11,909,843 | |
| | | | |
Expenses | | | | |
Distribution and service plan fees: | | | | |
Class A | | | 1,004,210 | |
Class B2 | | | 2,955 | |
Class C | | | 1,289,932 | |
Class R | | | 210,629 | |
| |
Transfer and shareholder servicing agent fees: | | | | |
Class A | | | 807,233 | |
Class B2 | | | 578 | |
Class C | | | 253,007 | |
Class R | | | 83,741 | |
Class Y | | | 11,492 | |
| |
Shareholder communications: | | | | |
Class A | | | 17,994 | |
Class B2 | | | 49 | |
Class C | | | 5,654 | |
Class R | | | 1,590 | |
Class Y | | | 225 | |
| |
Trustees’ compensation | | | 8,432 | |
| |
Custodian fees and expenses | | | 4,080 | |
| |
Other | | | 54,733 | |
| | | | |
Total expenses | | | 3,756,534 | |
17 OPPENHEIMER PORTFOLIO SERIES CONSERVATIVE INVESTOR FUND
STATEMENT OF
OPERATIONSContinued
| | | | |
|
| |
Expenses (Continued) | | | | |
Less waivers and reimbursements of expenses | | $ | (592,849) | |
| | | | |
Net expenses | | | 3,163,685 | |
|
| |
Net Investment Income | | | 12,856,824 | |
|
| |
Realized and Unrealized Gain (Loss) | | | | |
Net realized gain on: | | | | |
Investment transactions in affiliated companies | | | 26,578,013 | |
Distributions received from affiliate companies | | | 7,301,237 | |
| |
Net realized gain (loss) allocated from: | | | | |
Oppenheimer Master Event-Linked Bond Fund, LLC | | | (387,983) | |
Oppenheimer Master Inflation Protected Securities Fund, LLC | | | (570,925) | |
Oppenheimer Master Loan Fund, LLC | | | 209,597 | |
| | | | |
Net realized gain | | | 33,129,939 | |
| |
Net change in unrealized appreciation/(depreciation) on investment transactions | | | (53,748,280) | |
| |
Net change in unrealized appreciation/(depreciation) allocated from: | | | | |
Oppenheimer Master Event-Linked Bond Fund, LLC | | | (577,411) | |
Oppenheimer Master Inflation Protected Securities Fund, LLC | | | (506,407) | |
Oppenheimer Master Loan Fund, LLC | | | (2,238,688) | |
| | | | |
Net change in unrealized appreciation/(depreciation) | | | (57,070,786) | |
|
| |
Net Decrease in Net Assets Resulting from Operations | | $ | (11,084,023) | |
| | | | |
1. The Fund invests in certain affiliated mutual funds that expect to be treated as partnerships for tax purposes. See Note 4 of the accompanying Notes.
2. Effective June 1, 2018, all Class B shares converted to Class A shares.
See accompanying Notes to Financial Statements.
18 OPPENHEIMER PORTFOLIO SERIES CONSERVATIVE INVESTOR FUND
STATEMENTS OF CHANGES IN NET ASSETS
| | | | | | | | |
| | | Year Ended
January 31, 2019 | | Year Ended
January 31, 20181 | |
Operations | | | | | | | | |
Net investment income | | $ | 12,856,824 | | | $ | 10,404,475 | |
| |
Net realized gain | | | 33,129,939 | | | | 22,131,340 | |
| |
Net change in unrealized appreciation/(depreciation) | | | (57,070,786 | ) | | | 24,046,534 | |
| | | | |
Net increase (decrease) in net assets resulting from operations | | | (11,084,023 | ) | | | 56,582,349 | |
Dividends and/or Distributions to Shareholders | | | | | | | | |
Dividends and distributions declared: | | | | | | | | |
Class A | | | (8,685,727 | ) | | | (9,351,733) | |
Class B2 | | | — | | | | (5,347) | |
Class C | | | (1,802,991 | ) | | | (1,929,785) | |
Class R | | | (845,052 | ) | | | (861,904) | |
Class Y | | | (156,417 | ) | | | (153,200) | |
| | | | |
Total dividends and distributions declared | | | (11,490,187 | ) | | | (12,301,969) | |
Beneficial Interest Transactions | | | | | | | | |
Net increase (decrease) in net assets resulting from beneficial interest transactions: | | | | | | | | |
Class A | | | (33,682,311 | ) | | | (13,651,741) | |
Class B2 | | | (1,830,823 | ) | | | (5,059,405) | |
Class C | | | (8,930,783 | ) | | | (17,926,869) | |
Class R | | | 52,916 | | | | (162,889) | |
Class Y | | | 687,591 | | | | 522,312 | |
| | | | |
Total beneficial interest transactions | | | (43,703,410 | ) | | | (36,278,592) | |
Net Assets | | | | | | | | |
Total increase (decrease) | | | (66,277,620 | ) | | | 8,001,788 | |
| |
Beginning of period | | | 638,695,966 | | | | 630,694,178 | |
| | | | |
End of period | | $ | 572,418,346 | | | $ | 638,695,966 | |
| | | | |
1. Prior period amounts have been conformed to current year presentation. See Notes to Financial Statements, Note
2– New Accounting Pronouncements for further details.
2. Effective June 1, 2018, all Class B shares converted to Class A shares.
See accompanying Notes to Financial Statements.
19 OPPENHEIMER PORTFOLIO SERIES CONSERVATIVE INVESTOR FUND
FINANCIAL HIGHLIGHTS
| | | | | | | | | | | | | | | | | | | | |
| Class A | | Year Ended
January 31,
2019 | | | Year Ended
January 31,
2018 | | | Year Ended
January 31,
2017 | | | Year Ended
January 29,
20161 | | | Year Ended
January 30,
20151 | |
| |
Per Share Operating Data | | | | | | | | | | | | | | | | | | | | |
| Net asset value, beginning of period | | | $9.67 | | | | $9.02 | | | | $8.54 | | | | $9.07 | | | | $8.74 | |
| |
| Income (loss) from investment operations: | | | | | | | | | | | | | | | | | | | | |
| Net investment income2 | | | 0.22 | | | | 0.17 | | | | 0.20 | | | | 0.15 | | | | 0.17 | |
| Net realized and unrealized gain (loss) | | | (0.37) | | | | 0.69 | | | | 0.47 | | | | (0.48) | | | | 0.31 | |
| | | | |
| Total from investment operations | | | (0.15) | | | | 0.86 | | | | 0.67 | | | | (0.33) | | | | 0.48 | |
| |
| Dividends and/or distributions to shareholders: | | | | | | | | | | | | | | | | | | | | |
| Dividends from net investment income | | | (0.21) | | | | (0.21) | | | | (0.19) | | | | (0.20) | | | | (0.15) | |
| |
| Net asset value, end of period | | | $9.31 | | | | $9.67 | | | | $9.02 | | | | $8.54 | | | | $9.07 | |
| | | | |
|
| |
Total Return, at Net Asset Value3 | | | (1.49)% | | | | 9.53% | | | | 7.92% | | | | (3.68)% | | | | 5.54% | |
|
| |
Ratios/Supplemental Data | | | | | | | | | | | | | | | | | | | | |
| Net assets, end of period (in thousands) | | | $396,318 | | | | $445,732 | | | | $428,722 | | | | $381,636 | | | | $377,253 | |
| |
| Average net assets (in thousands) | | | $413,824 | | | | $440,897 | | | | $413,080 | | | | $385,849 | | | | $356,752 | |
| |
| Ratios to average net assets:4,5 | | | | | | | | | | | | | | | | | | | | |
| Net investment income | | | 2.35% | | | | 1.82% | | | | 2.22% | | | | 1.70% | | | | 1.84% | |
| Expenses excluding specific expenses listed below | | | 0.52% | | | | 0.53% | | | | 0.54% | | | | 0.54% | | | | 0.53% | |
| Interest and fees from borrowings | | | 0.00% | | | | 0.00% | | | | 0.00%6 | | | | 0.00%6 | | | | 0.00% | |
| | | | |
| Total expenses7 | | | 0.52% | | | | 0.53% | | | | 0.54% | | | | 0.54% | | | | 0.53% | |
| Expenses after payments, waivers and/or reimbursements and reduction to custodian expenses | | | 0.42% | | | | 0.42% | | | | 0.44% | | | | 0.44% | | | | 0.43% | |
| |
| Portfolio turnover rate | | | 45% | | | | 7% | | | | 9% | | | | 10% | | | | 14% | |
1. Represents the last business day of the Fund’s reporting period.
2. Per share amounts calculated based on the average shares outstanding during the period.
3. Assumes an initial investment on the business day before the first day of the fiscal period, with all dividends and distributions reinvested in additional shares on the reinvestment date, and redemption at the net asset value calculated on the last business day of the fiscal period. Sales charges are not reflected in the total returns. Total returns are not annualized for periods less than one full year. Returns do not reflect the deduction of taxes that a shareholder would pay on fund distributions or the redemption of fund shares.
4. Annualized for periods less than one full year.
5. Includes the Fund’s share of the allocated expenses and/or net investment income from the master funds.
6. Less than 0.005%.
7. Total expenses including indirect expenses from affiliated fund fees and expenses were as follows:
| | | | | | |
| | | | | | |
Year Ended January 31, 2019 | | | 1.00 | % |
Year Ended January 31, 2018 | | | 1.06 | % |
Year Ended January 31, 2017 | | | 1.08 | % |
Year Ended January 29, 2016 | | | 1.07 | % |
Year Ended January 30, 2015 | | | 1.06 | % |
See accompanying Notes to Financial Statements.
20 OPPENHEIMER PORTFOLIO SERIES CONSERVATIVE INVESTOR FUND
| | | | | | | | | | | | | | | | | | | | |
| Class C | | Year Ended
January 31,
2019 | | | Year Ended
January 31,
2018 | | | Year Ended
January 31,
2017 | | | Year Ended
January 29,
20161 | | | Year Ended
January 30,
20151 | |
| |
Per Share Operating Data | | | | | | | | | | | | | | | | | | | | |
| Net asset value, beginning of period | | | $9.56 | | | | $8.92 | | | | $8.43 | | | | $8.96 | | | | $8.63 | |
| |
| Income (loss) from investment operations: | | | | | | | | | | | | | | | | | | | | |
| Net investment income2 | | | 0.15 | | | | 0.10 | | | | 0.13 | | | | 0.08 | | | | 0.10 | |
| Net realized and unrealized gain (loss) | | | (0.38) | | | | 0.67 | | | | 0.48 | | | | (0.48) | | | | 0.32 | |
| | | | |
| Total from investment operations | | | (0.23) | | | | 0.77 | | | | 0.61 | | | | (0.40) | | | | 0.42 | |
| |
| Dividends and/or distributions to shareholders: | | | | | | | | | | | | | | | | | | | | |
| Dividends from net investment income | | | (0.13) | | | | (0.13) | | | | (0.12) | | | | (0.13) | | | | (0.09) | |
| |
| Net asset value, end of period | | | $9.20 | | | | $9.56 | | | | $8.92 | | | | $8.43 | | | | $8.96 | |
| | | | |
|
| |
Total Return, at Net Asset Value3 | | | (2.30)% | | | | 8.69% | | | | 7.28% | | | | (4.48)% | | | | 4.83% | |
|
| |
Ratios/Supplemental Data | | | | | | | | | | | | | | | | | | | | |
| Net assets, end of period (in thousands) | | | $125,385 | | | | $139,290 | | | | $147,359 | | | | $150,838 | | | | $163,041 | |
| |
| Average net assets (in thousands) | | | $129,705 | | | | $141,175 | | | | $153,128 | | | | $159,469 | | | | $160,307 | |
| |
| Ratios to average net assets:4,5 | | | | | | | | | | | | | | | | | | | | |
| Net investment income | | | 1.60% | | | | 1.06% | | | | 1.47% | | | | 0.95% | | | | 1.08% | |
| Expenses excluding specific expenses listed below | | | 1.27% | | | | 1.28% | | | | 1.29% | | | | 1.29% | | | | 1.28% | |
| Interest and fees from borrowings | | | 0.00% | | | | 0.00% | | | | 0.00%6 | | | | 0.00%6 | | | | 0.00% | |
| | | | |
| Total expenses7 | | | 1.27% | | | | 1.28% | | | | 1.29% | | | | 1.29% | | | | 1.28% | |
| Expenses after payments, waivers and/or reimbursements and reduction to custodian expenses | | | 1.17% | | | | 1.17% | | | | 1.19% | | | | 1.19% | | | | 1.18% | |
| |
| Portfolio turnover rate | | | 45% | | | | 7% | | | | 9% | | | | 10% | | | | 14% | |
1. Represents the last business day of the Fund’s reporting period.
2. Per share amounts calculated based on the average shares outstanding during the period.
3. Assumes an initial investment on the business day before the first day of the fiscal period, with all dividends and distributions reinvested in additional shares on the reinvestment date, and redemption at the net asset value calculated on the last business day of the fiscal period. Sales charges are not reflected in the total returns. Total returns are not annualized for periods less than one full year. Returns do not reflect the deduction of taxes that a shareholder would pay on fund distributions or the redemption of fund shares.
4. Annualized for periods less than one full year.
5. Includes the Fund’s share of the allocated expenses and/or net investment income from the master funds.
6. Less than 0.005%.
7. Total expenses including indirect expenses from affiliated fund fees and expenses were as follows:
| | | | | | |
| | | | | | |
Year Ended January 31, 2019 | | | 1.75 | % |
Year Ended January 31, 2018 | | | 1.81 | % |
Year Ended January 31, 2017 | | | 1.83 | % |
Year Ended January 29, 2016 | | | 1.82 | % |
Year Ended January 30, 2015 | | | 1.81 | % |
See accompanying Notes to Financial Statements.
21 OPPENHEIMER PORTFOLIO SERIES CONSERVATIVE INVESTOR FUND
FINANCIAL HIGHLIGHTSContinued
| | | | | | | | | | | | | | | | | | | | |
| Class R | | Year Ended
January 31,
2019 | | | Year Ended
January 31,
2018 | | | Year Ended
January 31,
2017 | | | Year Ended
January 29,
20161 | | | Year Ended
January 30,
20151 | |
| |
Per Share Operating Data | | | | | | | | | | | | | | | | | | | | |
| Net asset value, beginning of period | | | $9.65 | | | | $9.01 | | | | $8.53 | | | | $9.05 | | | | $8.72 | |
| |
| Income (loss) from investment operations: | | | | | | | | | | | | | | | | | | | | |
| Net investment income2 | | | 0.20 | | | | 0.15 | | | | 0.18 | | | | 0.13 | | | | 0.14 | |
| Net realized and unrealized gain (loss) | | | (0.37) | | | | 0.67 | | | | 0.47 | | | | (0.48) | | | | 0.32 | |
| | | | |
| Total from investment operations | | | (0.17) | | | | 0.82 | | | | 0.65 | | | | (0.35) | | | | 0.46 | |
| |
| Dividends and/or distributions to shareholders: | | | | | | | | | | | | | | | | | | | | |
| Dividends from net investment income | | | (0.19) | | | | (0.18) | | | | (0.17) | | | | (0.17) | | | | (0.13) | |
| |
| Net asset value, end of period | | | $9.29 | | | | $9.65 | | | | $9.01 | | | | $8.53 | | | | $9.05 | |
| | | | |
|
| |
Total Return, at Net Asset Value3 | | | (1.73)% | | | | 9.18% | | | | 7.71% | | | | (3.89)% | | | | 5.28% | |
|
| |
Ratios/Supplemental Data | | | | | | | | | | | | | | | | | | | | |
| Net assets, end of period (in thousands) | | | $44,044 | | | | $45,605 | | | | $42,716 | | | | $35,442 | | | | $42,872 | |
| |
| Average net assets (in thousands) | | | $42,940 | | | | $44,190 | | | | $38,675 | | | | $39,789 | | | | $43,215 | |
| |
| Ratios to average net assets:4,5 | | | | | | | | | | | | | | | | | | | | |
| Net investment income | | | 2.10% | | | | 1.59% | | | | 1.99% | | | | 1.44% | | | | 1.58% | |
| Expenses excluding specific expenses listed below | | | 0.77% | | | | 0.77% | | | | 0.79% | | | | 0.79% | | | | 0.78% | |
| Interest and fees from borrowings | | | 0.00% | | | | 0.00% | | | | 0.00%6 | | | | 0.00%6 | | | | 0.00% | |
| | | | |
| Total expenses7 | | | 0.77% | | | | 0.77% | | | | 0.79% | | | | 0.79% | | | | 0.78% | |
| Expenses after payments, waivers and/or reimbursements and reduction to custodian expenses | | | 0.67% | | | | 0.66% | | | | 0.69% | | | | 0.69% | | | | 0.68% | |
| |
| Portfolio turnover rate | | | 45% | | | | 7% | | | | 9% | | | | 10% | | | | 14% | |
1. Represents the last business day of the Fund’s reporting period.
2. Per share amounts calculated based on the average shares outstanding during the period.
3. Assumes an initial investment on the business day before the first day of the fiscal period, with all dividends and distributions reinvested in additional shares on the reinvestment date, and redemption at the net asset value calculated on the last business day of the fiscal period. Sales charges are not reflected in the total returns. Total returns are not annualized for periods less than one full year. Returns do not reflect the deduction of taxes that a shareholder would pay on fund distributions or the redemption of fund shares.
4. Annualized for periods less than one full year.
5. Includes the Fund’s share of the allocated expenses and/or net investment income from the master funds.
6. Less than 0.005%.
7. Total expenses including indirect expenses from affiliated fund fees and expenses were as follows:
| | | | | | |
| | | | | | |
Year Ended January 31, 2019 | | | 1.25 | % |
Year Ended January 31, 2018 | | | 1.30 | % |
Year Ended January 31, 2017 | | | 1.33 | % |
Year Ended January 29, 2016 | | | 1.32 | % |
Year Ended January 30, 2015 | | | 1.31 | % |
See accompanying Notes to Financial Statements.
22 OPPENHEIMER PORTFOLIO SERIES CONSERVATIVE INVESTOR FUND
| | | | | | | | | | | | | | | | | | | | |
| Class Y | | Year Ended
January 31,
2019 | | | Year Ended
January 31,
2018 | | | Year Ended
January 31,
2017 | | | Year Ended
January 29,
20161 | | | Year Ended
January 30,
20151 | |
| |
Per Share Operating Data | | | | | | | | | | | | | | | | | | | | |
| Net asset value, beginning of period | | | $9.71 | | | | $9.06 | | | | $8.57 | | | | $9.10 | | | | $8.77 | |
| |
| Income (loss) from investment operations: | | | | | | | | | | | | | | | | | | | | |
| Net investment income2 | | | 0.24 | | | | 0.20 | | | | 0.23 | | | | 0.17 | | | | 0.20 | |
| Net realized and unrealized gain (loss) | | | (0.38) | | | | 0.68 | | | | 0.47 | | | | (0.49) | | | | 0.31 | |
| | | | |
| Total from investment operations | | | (0.14) | | | | 0.88 | | | | 0.70 | | | | (0.32) | | | | 0.51 | |
| |
| Dividends and/or distributions to shareholders: | | | | | | | | | | | | | | | | | | | | |
| Dividends from net investment income | | | (0.23) | | | | (0.23) | | | | (0.21) | | | | (0.21) | | | | (0.18) | |
| |
| Net asset value, end of period | | | $9.34 | | | | $9.71 | | | | $9.06 | | | | $8.57 | | | | $9.10 | |
| | | | |
|
| |
Total Return, at Net Asset Value3 | | | (1.31)% | | | | 9.78% | | | | 8.27% | | | | (3.54)% | | | | 5.85% | |
|
| |
Ratios/Supplemental Data | | | | | | | | | | | | | | | | | | | | |
| Net assets, end of period (in thousands) | | | $6,671 | | | | $6,195 | | | | $5,280 | | | | $5,078 | | | | $6,947 | |
| |
| Average net assets (in thousands) | | | $5,897 | | | | $5,831 | | | | $5,067 | | | | $7,659 | | | | $4,601 | |
| |
| Ratios to average net assets:4,5 | | | | | | | | | | | | | | | | | | | | |
| Net investment income | | | 2.59% | | | | 2.14% | | | | 2.52% | | | | 1.93% | | | | 2.22% | |
| Expenses excluding specific expenses listed below | | | 0.28% | | | | 0.28% | | | | 0.29% | | | | 0.29% | | | | 0.28% | |
| Interest and fees from borrowings | | | 0.00% | | | | 0.00% | | | | 0.00%6 | | | | 0.00%6 | | | | 0.00% | |
| | | | |
| Total expenses7 | | | 0.28% | | | | 0.28% | | | | 0.29% | | | | 0.29% | | | | 0.28% | |
| Expenses after payments, waivers and/or reimbursements and reduction to custodian expenses | | | 0.18% | | | | 0.17% | | | | 0.19% | | | | 0.19% | | | | 0.18% | |
| |
| Portfolio turnover rate | | | 45% | | | | 7% | | | | 9% | | | | 10% | | | | 14% | |
1. Represents the last business day of the Fund’s reporting period.
2. Per share amounts calculated based on the average shares outstanding during the period.
3. Assumes an initial investment on the business day before the first day of the fiscal period, with all dividends and distributions reinvested in additional shares on the reinvestment date, and redemption at the net asset value calculated on the last business day of the fiscal period. Sales charges are not reflected in the total returns. Total returns are not annualized for periods less than one full year. Returns do not reflect the deduction of taxes that a shareholder would pay on fund distributions or the redemption of fund shares.
4. Annualized for periods less than one full year.
5. Includes the Fund’s share of the allocated expenses and/or net investment income from the master funds.
6. Less than 0.005%.
7. Total expenses including indirect expenses from affiliated fund fees and expenses were as follows:
| | | | | | |
| | | | | | |
Year Ended January 31, 2019 | | | 0.76 | % |
Year Ended January 31, 2018 | | | 0.81 | % |
Year Ended January 31, 2017 | | | 0.83 | % |
Year Ended January 29, 2016 | | | 0.82 | % |
Year Ended January 30, 2015 | | | 0.81 | % |
See accompanying Notes to Financial Statements.
23 OPPENHEIMER PORTFOLIO SERIES CONSERVATIVE INVESTOR FUND
NOTES TO FINANCIAL STATEMENTSJanuary 31, 2019
1. Organization
Oppenheimer Portfolio Series (the “Trust”) is registered under the Investment Company Act of 1940 (“1940 Act”), as amended, as a diversifiedopen-end management investment company. Conservative Investor Fund (the “Fund”) is a series of the Trust whose investment objective is to seek total return. The Fund normally invests in a diversified portfolio of Oppenheimer mutual funds (individually, an “Underlying Fund” and collectively, the “Underlying Funds”). The Fund’s investment adviser is OFI Global Asset Management, Inc. (“OFI Global” or the “Manager”), a wholly-owned subsidiary of OppenheimerFunds, Inc. (“OFI” or the“Sub-Adviser”). The Manager has entered into asub-advisory agreement with OFI.
The Fund offers Class A, Class C, Class R and Class Y shares, and previously offered Class B shares for new purchase through June 29, 2012. Subsequent to that date, no new purchases of Class B shares were permitted. Reinvestment of dividend and/or capital gain distributions and exchanges of Class B shares into and from other Oppenheimer funds were permitted through May 31, 2018. Effective June 1, 2018 (the “Conversion Date”), all Class B shares converted to Class A shares. Class A shares are sold at their offering price, which is normally net asset value plus afront-end sales charge. Class C and Class R shares are sold, and Class B shares were sold, without afront-end sales charge but may be subject to a contingent deferred sales charge (“CDSC”). Class R shares are sold only through retirement plans. Retirement plans that offer Class R shares may impose charges on those accounts. Class Y shares are sold to certain institutional investors or intermediaries without either afront-end sales charge or a CDSC, however, the intermediaries may impose charges on their accountholders who beneficially own Class Y shares. All classes of shares have identical rights and voting privileges with respect to the Fund in general and exclusive voting rights on matters that affect that class alone. Earnings, net assets and net asset value per share may differ due to each class having its own expenses, such as transfer and shareholder servicing agent fees and shareholder communications, directly attributable to that class. Class A, C and R shares have, and Class B shares had, separate distribution and/or service plans under which they pay, and Class B shares paid, fees. Class Y shares do not pay such fees. Previously issued Class B shares automatically converted to Class A shares 72 months after the date of purchase.
The following is a summary of significant accounting policies followed in the Fund’s preparation of financial statements in accordance with accounting principles generally accepted in the United States (“U.S. GAAP”).
2. Significant Accounting Policies
Security Valuation.All investments in securities are recorded at their estimated fair value, as described in Note 3.
Allocation of Income, Expenses, Gains and Losses.Income, expenses (other than those attributable to a specific class), gains and losses are allocated on a daily basis to each class of shares based upon the relative proportion of net assets represented by such class. Operating expenses directly attributable to a specific class are charged against the operations of that
24 OPPENHEIMER PORTFOLIO SERIES CONSERVATIVE INVESTOR FUND
2. Significant Accounting Policies (Continued)
class.
Dividends and Distributions to Shareholders. Dividends and distributions to shareholders, which are determined in accordance with income tax regulations and may differ from U.S. GAAP, are recorded on theex-dividend date. Income and capital gain distributions, if any, are declared and paid annually or at other times as determined necessary by the Manager.
Investment Income.Dividend distributions received from the Underlying Funds are recorded on theex-dividend date. Upon receipt of notification from an Underlying Fund, and subsequent to theex-dividend date, some of the dividend income originally recorded by the Fund may be reclassified as a tax return of capital by reducing the cost basis of the Underlying Fund and/or increasing the realized gain on sales of investments in the Underlying Fund.
Custodian Fees. “Custodian fees and expenses” in the Statement of Operations may include interest expense incurred by the Fund on any cash overdrafts of its custodian account during the period. Such cash overdrafts may result from the effects of failed trades in portfolio securities and from cash outflows resulting from unanticipated shareholder redemption activity. The Fund pays interest to its custodian on such cash overdraft at a rate equal to the Prime Rate plus 0.35%. The “Reduction to custodian expenses” line item, if applicable, represents earnings on cash balances maintained by the Fund during the period. Such interest expense and other custodian fees may be paid with these earnings.
Security Transactions. Security transactions are recorded on the trade date. Realized gains and losses on securities sold are determined on the basis of identified cost.
Indemnifications.The Fund’s organizational documents provide current and former Trustees and officers with a limited indemnification against liabilities arising in connection with the performance of their duties to the Fund. In the normal course of business, the Fund may also enter into contracts that provide general indemnifications. The Fund’s maximum exposure under these arrangements is unknown as this would be dependent on future claims that may be made against the Fund. The risk of material loss from such claims is considered remote.
Federal Taxes.The Fund intends to comply with provisions of the Internal Revenue Code applicable to regulated investment companies and to distribute substantially all of its investment company taxable income, including any net realized gain on investments not offset by capital loss carryforwards, if any, to shareholders. Therefore, no federal income or excise tax provision is required. The Fund files income tax returns in U.S. federal and applicable state jurisdictions. The statute of limitations on the Fund’s tax return filings generally remains open for the three preceding fiscal reporting period ends. The Fund has analyzed its tax positions for the fiscal year ended January 31, 2019, including open tax years, and does not believe there are any uncertain tax positions requiring recognition in the Fund’s financial statements.
25 OPPENHEIMER PORTFOLIO SERIES CONSERVATIVE INVESTOR FUND
NOTES TO FINANCIAL STATEMENTSContinued
2. Significant Accounting Policies (Continued)
The tax components of capital shown in the following table represent distribution requirements the Fund must satisfy under the income tax regulations, losses the Fund may be able to offset against income and gains realized in future years and unrealized appreciation or depreciation of securities and other investments for federal income tax purposes.
| | | | | | |
Undistributed
Net Investment
Income | | Undistributed Long-Term Gain | | Accumulated Loss Carryforward1,2,3 | | Net Unrealized Depreciation Based on cost of Securities and Other Investments for Federal Income Tax Purposes |
$4,377,014 | | $— | | $— | | $34,609,986 |
1.During the reporting period, the Fund utilized $26,273,805 of capital loss carryforward to offset capital gains realized in that fiscal year.
2.During the previous reporting period, the Fund utilized $17,263,769 of capital loss carryforward to offset capital gains realized in that fiscal year.
3.During the reporting period, $3,593,366 of unused capital loss carryforward expired.
Net investment income (loss) and net realized gain (loss) may differ for financial statement and tax purposes. The character of dividends and distributions made during the fiscal year from net investment income or net realized gains are determined in accordance with federal income tax requirements, which may differ from the character of net investment income or net realized gains presented in those financial statements in accordance with U.S. GAAP. Also, due to timing of dividends and distributions, the fiscal year in which amounts are distributed may differ from the fiscal year in which the income or net realized gain was recorded by the Fund.
Accordingly, the following amounts have been reclassified for the reporting period. Net assets of the Fund were unaffected by the reclassifications.
| | | | |
Reduction
toPaid-in Capital | | Reduction to Accumulated Net Loss | |
$3,593,366 | | | $3,593,366 | |
The tax character of distributions paid during the reporting periods:
| | | | | | | | |
| | | Year Ended January 31, 2019 | | | Year Ended January 31, 2018 | |
Distributions paid from: | | | | | | | | |
Ordinary income | | $ | 11,490,187 | | | $ | 12,301,969 | |
The aggregate cost of securities and other investments and the composition of unrealized appreciation and depreciation of securities and other investments for federal income tax purposes at period end are noted in the following table. The primary difference between book and tax appreciation or depreciation of securities and other investments, if applicable, is attributable to the tax deferral of losses or tax realization of financial statement unrealized
26 OPPENHEIMER PORTFOLIO SERIES CONSERVATIVE INVESTOR FUND
2. Significant Accounting Policies (Continued)
gain or loss.
| | | | |
Federal tax cost of securities | | $ | 606,123,474 | |
| | | | |
Gross unrealized appreciation | | $ | 9,089,587 | |
Gross unrealized depreciation | | | (43,699,573) | |
| | | | |
Net unrealized depreciation | | $ | (34,609,986) | |
| | | | |
Use of Estimates. The preparation of financial statements in conformity with U.S. GAAP requires management to make estimates and assumptions that affect the reported amounts of assets and liabilities and disclosure of contingent assets and liabilities at the date of the financial statements and the reported amounts of increases and decreases in net assets from operations during the reporting period. Actual results could differ from those estimates.
New Accounting Pronouncements. In March 2017, Financial Accounting Standards Board (“FASB”) issued Accounting Standards Update (“ASU”), ASU2017-08. This provides guidance related to the amortization period for certain purchased callable debt securities held at a premium. The ASU is effective for annual periods beginning after December 15, 2018, and interim periods within those annual periods. The Manager has evaluated the impacts of these changes on the financial statements and there are no material impacts.
During August 2018, the Securities and Exchange Commission (the “SEC”) issued Final Rule ReleaseNo. 33-10532 (the “Rule”), Disclosure Update and Simplification. The rule amends certain financial statement disclosure requirements to conform to U.S. GAAP. The amendments to Rule6-04.17 of RegulationS-X (balance sheet) remove the requirement to separately state the book basis components of net assets: undistributed (over-distribution of) net investment income (“UNII”), accumulated undistributed net realized gains (losses), and net unrealized appreciation (depreciation) at the balance sheet date. Instead, consistent with U.S. GAAP, funds will be required to disclose total distributable earnings. The amendments to Rule6-09 of RegulationS-X (statement of changes in net assets) remove the requirement to separately state the sources of distributions paid. Instead, consistent with U.S. GAAP, funds will be required to disclose the total amount of distributions paid, except that any tax return of capital must be separately disclosed. The amendments also remove the requirement to parenthetically state the book basis amount of UNII on the statement of changes in net assets. The requirements of the Rule were effective November 5, 2018, and the Fund’s Statement of Assets and Liabilities and Statement of Changes in Net Assets for the current reporting period have been modified accordingly. In addition, certain amounts within the Fund’s Statement of Changes in Net Assets for the prior fiscal period have been modified to conform to the Rule.
3. Securities Valuation
The Fund calculates the net asset value of its shares based upon the net asset value of the applicable investment companies. For each investment company, the net asset value per share for a class of shares is determined as of 4:00 P.M. Eastern Time, on each day the New York Stock Exchange (the “Exchange” or “NYSE”) is open for trading, except in the case of
27 OPPENHEIMER PORTFOLIO SERIES CONSERVATIVE INVESTOR FUND
NOTES TO FINANCIAL STATEMENTSContinued
3. Securities Valuation (Continued)
a scheduled early closing of the Exchange, in which case the Fund will calculate net asset value of the shares as of the scheduled early closing time of the Exchange. This is calculated by dividing the value of the investment company’s net assets attributable to that class by the number of outstanding shares of that class on that day.
The Fund’s Board has adopted procedures for the valuation of the Fund’s securities and has delegated theday-to-day responsibility for valuation determinations under those procedures to the Manager. The Manager has established a Valuation Committee which is responsible for determining a fair valuation for any security for which market quotations are not readily available. The Valuation Committee’s fair valuation determinations are subject to review, approval and ratification by the Fund’s Board at least quarterly or more frequently, if necessary.
Valuations Methods and Inputs
To determine their net asset values, the Underlying Funds’ assets are valued primarily on the basis of current market quotations as generally supplied by third party portfolio pricing services or by dealers. Such market quotations are typically based on unadjusted quoted prices in active markets for identical securities or other observable market inputs.
Securities for which market quotations are not readily available, or when a significant event has occurred that would materially affect the value of the security, are fair valued either (i) by a standardized fair valuation methodology applicable to the security type or the significant event as previously approved by the Valuation Committee and the Fund’s Board or (ii) as determined in good faith by the Manager’s Valuation Committee. The Valuation Committee considers all relevant facts that are reasonably available, through either public information or information available to the Manager, when determining the fair value of a security. The methodologies used for valuing securities are not necessarily an indication of the risks associated with investing in those Underlying Funds.
Classifications
Each investment asset or liability of the Fund is assigned a level at measurement date based on the significance and source of the inputs to its valuation. Various data inputs may be used in determining the value of each of the Fund’s investments as of the reporting period end. These data inputs are categorized in the following hierarchy under applicable financial accounting standards:
1) Level1-unadjusted quoted prices in active markets for identical assets or liabilities (including securities actively traded on a securities exchange)
2) Level2-inputs other than unadjusted quoted prices that are observable for the asset or liability (such as unadjusted quoted prices for similar assets and market corroborated inputs such as interest rates, prepayment speeds, credit risks, etc.)
3) Level3-significant unobservable inputs (including the Manager’s own judgments about assumptions that market participants would use in pricing the asset or liability).
The inputs used for valuing securities are not necessarily an indication of the risks associated
28 OPPENHEIMER PORTFOLIO SERIES CONSERVATIVE INVESTOR FUND
3. Securities Valuation (Continued)
with investing in those securities.
The Fund classifies each of its investments in investment companies which are publicly offered as Level 1. Investment companies that are not publicly offered, if any, are measured using net asset value and are classified as Level 2 in the fair value hierarchy. The table below categorizes amounts that are included in the Fund’s Statement of Assets and Liabilities at period end based on valuation input level:
| | | | | | | | | | | | | | | | | | | | | | | | | | | | | | | | | | |
| | | | | | | | Level 1—
Unadjusted
Quoted Prices | | | | | | Level 2—
Other Significant
Observable Inputs | | | | | | Level 3—
Significant
Unobservable
Inputs | | | | | | Value | |
Assets Table | | | | | | | | | | | | | | | | | | | | | | | | | | | | | | | | | | |
Investments, at Value: | | | | | | | | | | | | | | | | | | | | | | | | | | | | | | | | | | |
Investment Companies | | | | | | | | $ | 471,620,108 | | | $ | | | | | 99,893,380 | | | $ | | | | | — | | | $ | | | | | 571,513,488 | |
| | | | | | | | | | |
Total Assets | | | | | | | | $ | 471,620,108 | | | $ | | | | | 99,893,380 | | | $ | | | | | — | | | $ | | | | | 571,513,488 | |
| | | | | | | | | | |
Forward currency exchange contracts and futures contracts, if any, are reported at their unrealized appreciation/depreciation at measurement date, which represents the change in the contract’s value from trade date. All additional assets and liabilities included in the above table are reported at their market value at measurement date.
For the reporting period, there were no transfers between levels.
4. Investments and Risks
Risks of Investing in the Underlying Funds.The Fund invests in other mutual funds advised by the Manager. The Underlying Funds are registeredopen-end management investment companies under the 1940 Act, as amended. The Manager is the investment adviser of, and theSub-Adviser provides investment and related advisory services to, the Underlying Funds. The Fund’s Investments in Underlying Funds are included in the Statement of Investments. Shares of Underlying Funds are valued at their net asset value per share. As a shareholder, the Fund is subject to its proportional share of the Underlying Funds’ expenses, including their management fee.
Each of the Underlying Funds in which the Fund invests has its own investment risks, and those risks can affect the value of the Fund’s investments and therefore the value of the Fund’s shares. To the extent that the Fund invests more of its assets in one Underlying Fund than in another, the Fund will have greater exposure to the risks of that Underlying Fund.
Investment in Oppenheimer Institutional Government Money Market Fund.The Fund is permitted to invest daily available cash balances in an affiliated money market fund. The Fund may invest the available cash in Class E shares of Oppenheimer Institutional Government Money Market Fund (“IGMMF”) to seek current income while preserving liquidity or for defensive purposes. IGMMF is a registeredopen-end management investment company, regulated as a money market fund under the 1940 Act, as amended. The Manager is the investment adviser of IGMMF, and theSub-Adviser provides investment and related advisory services to IGMMF. When applicable, the Fund’s investment in IGMMF is included in
29 OPPENHEIMER PORTFOLIO SERIES CONSERVATIVE INVESTOR FUND
NOTES TO FINANCIAL STATEMENTSContinued
4. Investments and Risks (Continued)
the Statement of Investments. Shares of IGMMF are valued at their net asset value per share. As a shareholder, the Fund is subject to its proportional share of IGMMF’s Class E expenses, including its management fee.
Investment in Oppenheimer Master Funds.Certain Underlying Funds in which the Fund invests are mutual funds registered under the 1940 Act, as amended, that expect to be treated as partnerships for tax purposes, specifically Oppenheimer Master Loan Fund, LLC (“Master Loan”), Oppenheimer Master Event-Linked Bond Fund, LLC (“Master Event-Linked Bond”) and Oppenheimer Master Inflation Protected Securities Fund, LLC (“Master Inflation Protected Securities”) (the “Master Funds”). Each Master Fund has its own investment risks, and those risks can affect the value of the Fund’s investments and therefore the value of the Fund’s shares. To the extent that the Fund invests more of its assets in one Master Fund than in another, the Fund will have greater exposure to the risks of that Master Fund.
The investment objective of Master Loan is to seek income. The investment objective of Master Event-Linked Bond is to seek total return. The investment objective of Master Inflation Protected Securities is to seek total return. The Fund’s investments in the Master Funds are included in the Statement of Investments. The Fund recognizes income and gain/ (loss) on its investments in each Master Fund according to its allocatedpro-rata share, based on its relative proportion of total outstanding Master Fund shares held, of the total net income earned and the net gain/(loss) realized on investments sold by the Master Funds. As a shareholder, the Fund is subject to its proportional share of the Master Funds’ expenses, including their management fee. The Manager will waive fees and/or reimburse Fund expenses in an amount equal to the indirect management fees incurred through the Fund’s investment in the Master Funds. The Fund owns 5.24% of Master Loan, 5.44% of Master Event-Linked Bond and 26.43% of Master Inflation Protected Securities at period end.
5. Market Risk Factors
The Fund’s investments in securities and/or financial derivatives may expose the Fund to various market risk factors:
Commodity Risk. Commodity risk relates to the change in value of commodities or commodity indexes as they relate to increases or decreases in the commodities market. Commodities are physical assets that have tangible properties. Examples of these types of assets are crude oil, heating oil, metals, livestock, and agricultural products.
Credit Risk.Credit risk relates to the ability of the issuer of debt to meet interest and principal payments, or both, as they come due. In general, lower-grade, higher-yield debt securities are subject to credit risk to a greater extent than lower-yield, higher-quality securities.
Equity Risk. Equity risk relates to the change in value of equity securities as they relate to increases or decreases in the general market.
Foreign Exchange Rate Risk. Foreign exchange rate risk relates to the change in the U.S. dollar value of a security held that is denominated in a foreign currency. The U.S. dollar
30 OPPENHEIMER PORTFOLIO SERIES CONSERVATIVE INVESTOR FUND
5. Market Risk Factors (Continued)
value of a foreign currency denominated security will decrease as the dollar appreciates against the currency, while the U.S. dollar value will increase as the dollar depreciates against the currency.
Interest Rate Risk.Interest rate risk refers to the fluctuations in value of fixed-income securities resulting from the inverse relationship between price and yield. For example, an increase in general interest rates will tend to reduce the market value of already issued fixed-income investments, and a decline in general interest rates will tend to increase their value. In addition, debt securities with longer maturities, which tend to have higher yields, are subject to potentially greater fluctuations in value from changes in interest rates than obligations with shorter maturities.
Volatility Risk.Volatility risk refers to the magnitude of the movement, but not the direction of the movement, in a financial instrument’s price over a defined time period. Large increases or decreases in a financial instrument’s price over a relative time period typically indicate greater volatility risk, while small increases or decreases in its price typically indicate lower volatility risk.
6. Shares of Beneficial Interest
The Fund has authorized an unlimited number of $0.001 par value shares of beneficial interest of each class. Transactions in shares of beneficial interest were as follows:
| | | | | | | | | | | | | | | | | | | | |
| | | Year Ended January 31, 2019 | | | | | | Year Ended January 31, 2018 | |
| | | Shares | | | Amount | | | | | | Shares | | | Amount | |
Class A | | | | | | | | | | | | | | | | | | | | |
Sold1 | | | 3,948,210 | | | $ | 37,032,236 | | | | | | | | 6,927,441 | | | $ | 64,650,066 | |
Dividends and/or distributions reinvested | | | 953,425 | | | | 8,514,084 | | | | | | | | 969,633 | | | | 9,182,426 | |
Redeemed | | | (8,422,920) | | | | (79,228,631) | | | | | | | | (9,321,238) | | | | (87,484,233) | |
| | | | |
Net decrease | | | (3,521,285) | | | $ | (33,682,311) | | | | | | | | (1,424,164) | | | $ | (13,651,741) | |
| | | | |
| | | | | | | | | | | | | | | | | | | | | |
Class B | | | | | | | | | | | | | | | | | | | | |
Sold | | | 1,000 | | | $ | 9,621 | | | | | | | | 14,790 | | | $ | 139,803 | |
Dividends and/or distributions reinvested | | | — | | | | — | | | | | | | | 555 | | | | 5,342 | |
Redeemed1 | | | (191,749) | | | | (1,840,444) | | | | | | | | (554,543) | | | | (5,204,550) | |
| | | | |
Net decrease | | | (190,749) | | | $ | (1,830,823) | | | | | | | | (539,198) | | | $ | (5,059,405) | |
| | | | |
| | | | | | | | | | | | | | | | | | | | | |
Class C | | | | | | | | | | | | | | | | | | | | |
Sold | | | 2,105,838 | | | $ | 19,435,041 | | | | | | | | 2,487,610 | | | $ | 22,996,790 | |
Dividends and/or distributions reinvested | | | 202,257 | | | | 1,787,955 | | | | | | | | 204,382 | | | | 1,913,018 | |
Redeemed | | | (3,258,602) | | | | (30,153,779) | | | | | | | | (4,642,579) | | | | (42,836,677) | |
| | | | |
Net decrease | | | (950,507) | | | $ | (8,930,783) | | | | | | | | (1,950,587) | | | $ | (17,926,869) | |
| | | | |
31 OPPENHEIMER PORTFOLIO SERIES CONSERVATIVE INVESTOR FUND
NOTES TO FINANCIAL STATEMENTSContinued
6. Shares of Beneficial Interest (Continued)
| | | | | | | | | | | | | | | | |
| | | Year Ended January 31, 2019 | | | Year Ended January 31, 2018 | |
| | | Shares | | | Amount | | | Shares | | | Amount | |
Class R | | | | | | | | | | | | | | | | |
Sold | | | 1,320,170 | | | $ | 12,350,680 | | | | 1,474,568 | | | $ | 13,805,145 | |
Dividends and/or distributions reinvested | | | 90,471 | | | | 806,093 | | | | 87,314 | | | | 825,116 | |
Redeemed | | | (1,394,615) | | | | (13,103,857) | | | | (1,578,886) | | | | (14,793,150) | |
| | | | |
Net increase (decrease) | | | 16,026 | | | $ | 52,916 | | | | (17,004) | | | $ | (162,889) | |
| | | | |
| | | | | | | | | | | | | | | | | |
Class Y | | | | | | | | | | | | | | | | |
Sold | | | 327,615 | | | $ | 3,083,657 | | | | 491,505 | | | $ | 4,610,190 | |
Dividends and/or distributions reinvested | | | 17,368 | | | | 155,620 | | | | 14,320 | | | | 136,038 | |
Redeemed | | | (269,068) | | | | (2,551,686) | | | | (450,688) | | | | (4,223,916) | |
| | | | |
Net increase | | | 75,915 | | | $ | 687,591 | | | | 55,137 | | | $ | 522,312 | |
| | | | |
1. All outstanding Class B shares converted to Class A shares on June 1, 2018.
7. Purchases and Sales of Securities
The aggregate cost of purchases and proceeds from sales of securities, other than short-term obligations and investments in IGMMF, for the reporting period were as follows:
| | | | | | | | |
| | | Purchases | | | Sales | |
Investment securities | | $ | 266,676,454 | | | $ | 304,598,719 | |
8. Fees and Other Transactions with Affiliates
Management Fees.Under the investment advisory agreement, the Manager does not charge a management fee, but rather collects indirect management fees from the Fund’s investments in the Underlying Funds. The weighted indirect management fees collected from the Fund’s investment in the Underlying Funds, as a percent of average daily net assets of the Fund for the reporting period was 0.43%. This amount is gross of any waivers or reimbursements of management fees implemented at the Underlying Fund level.
Sub-Adviser Fees.The Manager has retained theSub-Adviser to provide theday-to-day portfolio management of the Fund. Under theSub-Advisory Agreement, the Manager pays theSub-Adviser an annual fee in monthly installments, equal to a percentage of the indirect investment management fee collected by the Manager, which shall be calculated after any investment management fee waivers. The fee paid to theSub-Adviser is paid by the Manager, not by the Fund.
Transfer Agent Fees.OFI Global (the “Transfer Agent”) serves as the transfer and shareholder servicing agent for the Fund. The Fund pays the Transfer Agent a fee based on annual net assets, which shall be calculated after any applicable fee waivers. Fees incurred and average net assets for each class with respect to these services are detailed in the Statement of Operations and Financial Highlights, respectively.
32 OPPENHEIMER PORTFOLIO SERIES CONSERVATIVE INVESTOR FUND
8. Fees and Other Transactions with Affiliates (Continued)
Sub-Transfer Agent Fees.The Transfer Agent has retained Shareholder Services, Inc., a wholly-owned subsidiary of OFI (the“Sub-Transfer Agent”), to provide theday-to-day transfer agent and shareholder servicing of the Fund. Under theSub-Transfer Agency Agreement, the Transfer Agent pays theSub-Transfer Agent an annual fee in monthly installments, equal to a percentage of the transfer agent fee collected by the Transfer Agent from the Fund, which shall be calculated after any applicable fee waivers. The fee paid to theSub-Transfer Agent is paid by the Transfer Agent, not by the Fund.
Trustees’ Compensation.The Fund has adopted an unfunded retirement plan (the “Plan”) for the Fund’s Independent Trustees. Benefits are based on years of service and fees paid to each Trustee during their period of service. The Plan was frozen with respect to adding new participants effective December 31, 2006 (the “Freeze Date”) and existing Plan Participants as of the Freeze Date will continue to receive accrued benefits under the Plan. Active Independent Trustees as of the Freeze Date have each elected a distribution method with respect to their benefits under the Plan.
During the reporting period, the Fund’s projected benefit obligations, payments to retired Trustees and accumulated liability were as follows:
| | | | |
Projected Benefit Obligations Increased | | $ | — | |
Payments Made to Retired Trustees | | | 1,027 | |
Accumulated Liability as of January 31, 2019 | | | 7,609 | |
The Fund’s Board of Trustees (“Board”) has adopted a compensation deferral plan for Independent Trustees that enables Trustees to elect to defer receipt of all or a portion of the annual compensation they are entitled to receive from the Fund. For purposes of determining the amount owed to the Trustee under the plan, deferred amounts are treated as though equal dollar amounts had been invested in shares of the Fund or in other Oppenheimer funds selected by the Trustee. The Fund purchases shares of the funds selected for deferral by the Trustee in amounts equal to his or her deemed investment, resulting in a Fund asset equal to the deferred compensation liability. Such assets are included as a component of “Other” within the asset section of the Statement of Assets and Liabilities. Deferral of Trustees’ fees under the plan will not affect the net assets of the Fund and will not materially affect the Fund’s assets, liabilities or net investment income per share. Amounts will be deferred until distributed in accordance with the compensation deferral plan.
Distribution and Service Plan(12b-1) Fees.Under its General Distributor’s Agreement with the Fund, OppenheimerFunds Distributor, Inc. (the “Distributor”) acts as the Fund’s principal underwriter in the continuous public offering of the Fund’s classes of shares.
Service Plan for Class A Shares. The Fund has adopted a Service Plan (the “Plan”) for Class A shares pursuant to Rule12b-1 under the 1940 Act. Under the Plan, the Fund reimburses the Distributor for a portion of its costs incurred for services provided to accounts
33 OPPENHEIMER PORTFOLIO SERIES CONSERVATIVE INVESTOR FUND
NOTES TO FINANCIAL STATEMENTSContinued
8. Fees and Other Transactions with Affiliates (Continued)
that hold Class A shares. Reimbursement is made periodically at an annual rate of up to 0.25% of the daily net assets of Class A shares of the Fund. The Distributor currently uses all of those fees to pay dealers, brokers, banks and other financial institutions periodically for providing personal service and maintenance of accounts of their customers that hold Class A shares. Any unreimbursed expenses the Distributor incurs with respect to Class A shares in any fiscal year cannot be recovered in subsequent periods. Fees incurred by the Fund under the Plan are detailed in the Statement of Operations.
Distribution and Service Plans for Class B, Class C and Class R Shares.The Fund has adopted Distribution and Service Plans (the “Plans”) for Class C and Class R shares, and had previously adopted a similar plan for Class B shares, pursuant to Rule12b-1 under the 1940 Act to compensate the Distributor for distributing those share classes, maintaining accounts and providing shareholder services. Under the Plans, the Fund pays the Distributor an annual asset-based sales charge of 0.75% on Class C shares’ daily net assets and 0.25% on Class R shares’ daily net assets. The Fund paid the Distributor an annual asset-based sales charge of 0.75% on Class B shares prior to their Conversion Date. The Fund also pays a service fee under the Plans at an annual rate of 0.25% of daily net assets and previously paid this fee for Class B prior to their Conversion Date. The Plans continue in effect from year to year only if the Fund’s Board of Trustees votes annually to approve their continuance at an in person meeting called for that purpose. Fees incurred by the Fund under the Plans are detailed in the Statement of Operations.
Sales Charges.Front-end sales charges and CDSC do not represent expenses of the Fund. They are deducted from the proceeds of sales of Fund shares prior to investment or from redemption proceeds prior to remittance, as applicable. The sales charges retained by the Distributor from the sale of shares and the CDSC retained by the Distributor on the redemption of shares is shown in the following table for the period indicated.
| | | | | | | | | | | | | | | | | | | | |
| Year Ended | | Class A
Front-End
Sales Charges
Retained by
Distributor | | | Class A
Contingent
Deferred
Sales Charges
Retained by
Distributor | | | Class B
Contingent
Deferred
Sales Charges
Retained by
Distributor1 | | | Class C
Contingent
Deferred
Sales Charges
Retained by
Distributor | | | Class R
Contingent
Deferred
Sales Charges
Retained by
Distributor | |
January 31, 2019 | | | $118,538 | | | | $764 | | | | $84 | | | | $8,992 | | | | $— | |
1. Effective June 1, 2018, all Class B shares converted to Class A shares.
Waivers and Reimbursements of Expenses. The Manager has contractually agreed to waive fees and/or reimburse certain Fund expenses at an annual rate of 0.10% as calculated on the daily net assets of the Fund. This waiver and/or reimbursement is applied after (and in addition to) any other applicable waiver and/or expense reimbursements that may apply, and may not be amended or withdrawn for one year from the date of the Fund’s prospectus, unless approved by the Board. During the reporting period, the Manager waived fees and/or reimbursed the Fund $592,849.
34 OPPENHEIMER PORTFOLIO SERIES CONSERVATIVE INVESTOR FUND
9. Pending Acquisition
On October 18, 2018, Massachusetts Mutual Life Insurance Company, an indirect corporate parent of theSub-Adviser and the Manager, announced that it has entered into an agreement whereby Invesco Ltd. (“Invesco”), a global investment management company, will acquire theSub-Adviser (the “Transaction”). In connection with the Transaction, on January 11, 2019, the Fund’s Board unanimously approved an Agreement and Plan of Reorganization (the “Agreement”), which provides for the transfer of the assets and liabilities of the Fund to a corresponding, newly formed fund (the “Acquiring Fund”) in the Invesco family of funds (the “Reorganization”) in exchange for shares of the corresponding Acquiring Fund of equal value to the value of the shares of the Fund as of the close of business on the closing date. Although the Acquiring Fund will be managed by Invesco Advisers, Inc., the Acquiring Fund will, as of the closing date, have the same investment objective and substantially similar principal investment strategies and risks as the Fund. After the Reorganization, Invesco Advisers, Inc. will be the investment adviser to the Acquiring Fund, and the Fund will be liquidated and dissolved under applicable law and terminate its registration under the Investment Company Act of 1940, as amended. The Reorganization is expected to be atax-free reorganization for U.S. federal income tax purposes.
The Reorganization is subject to the approval of shareholders of the Fund. Shareholders of record of the Fund on January 14, 2019 will be entitled to vote on the Reorganization and will receive a combined prospectus and proxy statement describing the Reorganization, the shareholder meeting, and a discussion of the factors the Fund’s Board considered in approving the Agreement. The combined prospectus and proxy statement is expected to be distributed to shareholders of record on or about February 28, 2019. The anticipated date of the shareholder meeting is on or about April 12, 2019.
If shareholders approve the Agreement and certain other closing conditions are satisfied or waived, the Reorganization is expected to close during the second quarter of 2019, or as soon as practicable thereafter. This is subject to change.
35 OPPENHEIMER PORTFOLIO SERIES CONSERVATIVE INVESTOR FUND
REPORT OF INDEPENDENT REGISTERED PUBLIC ACCOUNTING FIRM
To the Shareholders of Conservative Investor Fund and Board of Trustees of
Oppenheimer Portfolio Series:
Opinion on the Financial Statements
We have audited the accompanying statement of assets and liabilities of Conservative Investor Fund (the “Fund”), a series of Oppenheimer Portfolio Series, including the statement of investments, as of January 31, 2019, the related statement of operations for the year then ended, the statements of changes in net assets for each of the years in thetwo-year period then ended, and the related notes (collectively, the “financial statements”) and the financial highlights for each of the years in the five-year period then ended. In our opinion, the financial statements and financial highlights present fairly, in all material respects, the financial position of the Fund as of January 31, 2019, the results of its operations for the year then ended, the changes in its net assets for each of the years in thetwo-year period then ended, and the financial highlights for each of the years in the five-year period then ended, in conformity with U.S. generally accepted accounting principles.
Basis for Opinion
These financial statements and financial highlights are the responsibility of the Fund’s management. Our responsibility is to express an opinion on these financial statements and financial highlights based on our audits. We are a public accounting firm registered with the Public Company Accounting Oversight Board (United States) (“PCAOB”) and are required to be independent with respect to the Fund in accordance with the U.S. federal securities laws and the applicable rules and regulations of the Securities and Exchange Commission and the PCAOB.
We conducted our audits in accordance with the standards of the PCAOB. Those standards require that we plan and perform the audit to obtain reasonable assurance about whether the financial statements and financial highlights are free of material misstatement, whether due to error or fraud. Our audits included performing procedures to assess the risks of material misstatement of the financial statements and financial highlights, whether due to error or fraud, and performing procedures that respond to those risks. Such procedures included examining, on a test basis, evidence regarding the amounts and disclosures in the financial statements and financial highlights. Such procedures also included confirmation of securities owned as of January 31, 2019, by correspondence with the transfer agent, or by other appropriate auditing procedures. Our audits also included evaluating the accounting principles used and significant estimates made by management, as well as evaluating the overall presentation of the financial statements and financial highlights. We believe that our audits provide a reasonable basis for our opinion.
KPMGLLP
We have not been able to determine the specific year that we began serving as the auditor of one or more Oppenheimer Funds investment companies, however we are aware that we have served as the auditor of one or more Oppenheimer Funds investment companies since at least 1969.
Denver, Colorado
March 25, 2019
36 OPPENHEIMER PORTFOLIO SERIES CONSERVATIVE INVESTOR FUND
FEDERAL INCOME TAX INFORMATIONUnaudited
In early 2019, if applicable, shareholders of record received information regarding all dividends and distributions paid to them by the Fund during calendar year 2018.
Dividends, if any, paid by the Fund during the reporting period which are not designated as capital gain distributions should be multiplied by the maximum amount allowable but not less than 11.79% to arrive at the amount eligible for the corporate dividend-received deduction.
A portion, if any, of the dividends paid by the Fund during the reporting period which are not designated as capital gain distributions are eligible for lower individual income tax rates to the extent that the Fund has received qualified dividend income as stipulated by recent tax legislation. The maximum amount allowable but not less than $2,768,552 of the Fund’s fiscal year taxable income may be eligible for the lower individual income tax rates. In early 2019, shareholders of record received information regarding the percentage of distributions that are eligible for lower individual income tax rates.
Recent tax legislation allows a regulated investment company to designate distributions not designated as capital gain distributions, as either interest related dividends or short-term capital gain dividends, both of which are exempt from the U.S. withholding tax applicable to non U.S. taxpayers. For the reporting period, the maximum amount allowable but not less than $6,686,617 of the ordinary distributions to be paid by the Fund qualifies as an interest related dividend.
The Fund has elected the application of Section 853 of the Internal Revenue Code to permit shareholders to take a federal income tax credit or deduction, at their option, on a per share basis. The maximum amount allowable but not less than $103,912 of foreign income taxes were paid by the Fund during the reporting period. A separate notice will be mailed to each shareholder, which will reflect the proportionate share of such foreign taxes which must be treated by shareholders as gross income for federal income tax purposes.
Gross income of the maximum amount allowable but not less than $507,845 was derived from sources within foreign countries or possessions of the United States.
The foregoing information is presented to assist shareholders in reporting distributions received from the Fund to the Internal Revenue Service. Because of the complexity of the federal regulations which may affect your individual tax return and the many variations in state and local tax regulations, we recommend that you consult your tax advisor for specific guidance.
37 OPPENHEIMER PORTFOLIO SERIES CONSERVATIVE INVESTOR FUND
BOARD APPROVAL OF THE FUND’S INVESTMENT ADVISORY
ANDSUB-ADVISORY AGREEMENTSUnaudited
The Fund has entered into an investment advisory agreement with OFI Global Asset Management, Inc. (“OFI Global” or the “Adviser”), a wholly-owned subsidiary of OppenheimerFunds, Inc. (“OFI” or the“Sub-Adviser”) (“OFI Global” and “OFI” together the “Managers”) and OFI Global has entered into asub-advisory agreement with OFI whereby OFI provides investmentsub-advisory services to the Fund (collectively, the “Agreements”). Each year, the Board of Trustees (the “Board”), including a majority of the independent Trustees, is required to determine whether to approve the terms of the Agreements and the renewal thereof. The Investment Company Act of 1940, as amended, requires that the Board request and evaluate, and that the Managers provide, such information as may be reasonably necessary to evaluate the terms of the Agreements. The Board employs an independent consultant to prepare a report that provides information, including comparative information that the Board requests for that purpose. In addition toin-person meetings focused on this evaluation, the Board receives information throughout the year regarding Fund services, fees, expenses and performance.
The Managers and the independent consultant provided information to the Board on the following factors: (i) the nature, quality and extent of the Managers’ services, (ii) the comparative investment performance of the Fund and the Managers, (iii) the fees and expenses of the Fund, including comparative fee and expense information, (iv) the profitability of the Managers and their affiliates, including an analysis of the cost of providing services, (v) whether economies of scale are realized as the Fund grows and whether fee levels reflect these economies of scale for Fund investors and (vi) other benefits to the Managers from their relationship with the Fund. The Board was aware that there are alternatives to retaining the Managers.
Outlined below is a summary of the principal information considered by the Board as well as the Board’s conclusions.
Nature, Quality and Extent of Services. The Board considered information about the nature, quality and extent of the services provided to the Fund and information regarding the Managers’ key personnel who provide such services. The Managers’ duties include providing the Fund with the services of theSub-Adviser’s portfolio manager and investment team, who provide research, analysis and other advisory services in regard to the Fund’s investments; and securities trading services. OFI Global is responsible for oversight of third-party service providers; monitoring compliance with applicable Fund policies and procedures and adherence to the Fund’s investment restrictions; risk management; and oversight of theSub-Adviser. OFI Global is also responsible for providing certain administrative services to the Fund. Those services include providing and supervising all administrative and clerical personnel who are necessary in order to provide effective corporate administration for the Fund; compiling and maintaining records with respect to the Fund’s operations; preparing and filing reports required by the U.S. Securities and Exchange Commission; preparing periodic reports regarding the operations of the Fund for its shareholders; preparing proxy materials for shareholder meetings; and preparing the registration statements required by federal and state securities laws for the sale of the Fund’s shares. OFI Global also provides the Fund with office space, facilities and equipment.
38 OPPENHEIMER PORTFOLIO SERIES CONSERVATIVE INVESTOR FUND
The Board also considered the quality of the services provided and the quality of the Managers’ resources that are available to the Fund. The Board took account of the fact that theSub-Adviser has over fifty years of experience as an investment adviser and that its assets under management rank it among the top mutual fund managers in the United States. The Board evaluated the Managers’ advisory, administrative, accounting, legal, compliance and risk management services, among other services, and information the Board has received regarding the experience and professional qualifications of the Managers’ key personnel and the size and functions of their staff. In its evaluation of the quality of the portfolio management services provided, the Board considered the experience of Jeffrey Bennett, the portfolio manager for the Fund, and theSub-Adviser’s investment team and analysts. The Board members also considered the totality of their experiences with the Managers as directors or trustees of the Fund and other funds advised by the Managers. The Board considered information regarding the quality of services provided by affiliates of the Managers, which the Board members have become knowledgeable about through their experiences with the Managers and in connection with the review or renewal of the Fund’s service agreements or service providers. The Board concluded, in light of the Managers’ experience, reputation, personnel, operations and resources that the Fund benefits from the services provided under the Agreements.
Investment Performance of the Managers and the Fund. Throughout the year, the Managers provided information on the investment performance of the Fund, the Adviser and theSub-Adviser, including comparative performance information. The Board also reviewed information, prepared by the Managers and by the independent consultant, comparing the Fund’s historical performance to relevant benchmarks or market indices and to the performance of other retail funds in the allocation – 30%50% equity category. The Board noted that the Fund’sone-year, three-year, five-year andten-year performance was below its category median.
Fees and Expenses of the Fund. The Board reviewed the fees paid to the Adviser and the other expenses borne by the Fund. The Board noted that the Adviser, not the Fund, pays theSub-Adviser’s fee under thesub-advisory agreement. The Board also considered the comparability of the fees charged and the services provided to the Fund to the fees and services for other clients or accounts advised by the Adviser. The independent consultant provided comparative data in regard to the fees and expenses of the Fund and other retailfront-end load allocation – 30%50% equity funds with comparable asset levels and distribution features. After discussions with the Board, the Adviser has agreed to contractually waive fees and/or reimburse certain Fund expenses at an annual rate of 0.10% as calculated on the daily net assets of the Fund. This waiver and/or reimbursement is applied after (and in addition to) any other applicable fee waivers and/or expense reimbursements that apply. This fee waiver and/or expense reimbursement may not be amended or withdrawn until one year from the date of the prospectus, unless approved by the Board. The Board noted that the Fund was charged no actual management fees, exclusive of Underlying Fund management fees, while certain peer group funds did charge direct management fees. The Board also noted that the Fund’s total expenses were lower than its peer group and category median.
39 OPPENHEIMER PORTFOLIO SERIES CONSERVATIVE INVESTOR FUND
BOARD APPROVAL OF THE FUND’S INVESTMENT ADVISORY
ANDSUB-ADVISORY AGREEMENTSUnaudited / Continued
Economies of Scale and Profits Realized by the Managers. The Board considered information regarding the Managers’ costs in serving as the Fund’s investment adviser,sub-adviser, including the costs associated with the personnel and systems necessary to manage the Fund, and information regarding the Managers’ profitability from their relationship with the Fund. The Board also considered that the Managers must be able to pay and retain experienced professional personnel at competitive rates to provide quality services to the Fund. The Board reviewed whether the Managers may realize economies of scale in managing and supporting the Fund and whether those economies of scale benefit the Fund’s shareholders at the current level of Fund assets in relation to its management fee. The Fund currently does not charge a management fee.
Other Benefits to the Managers. In addition to considering the profits realized by the Managers, the Board considered information that was provided regarding the direct and indirect benefits the Managers receive as a result of their relationship with the Fund, including compensation paid to the Managers’ affiliates.
Conclusions. These factors were also considered by the independent Trustees meeting separately from the full Board, assisted by experienced counsel to the Fund and to the independent Trustees. Fund counsel and the independent Trustees’ counsel are independent of the Managers within the meaning and intent of the Securities and Exchange Commission Rules.
Based on its review of the information it received and its evaluations described above, the Board, including a majority of the independent Trustees, decided to continue the Agreements through September 30, 2019. In arriving at its decision, the Board did not identify any factor or factors as being more important than others, but considered all of the above information, and considered the terms and conditions of the Agreements, including the management fees, in light of all the surrounding circumstances.
40 OPPENHEIMER PORTFOLIO SERIES CONSERVATIVE INVESTOR FUND
PORTFOLIO PROXY VOTING POLICIES AND GUIDELINES;
UPDATES TO STATEMENT OF INVESTMENTSUnaudited
The Fund has adopted Portfolio Proxy Voting Policies and Guidelines under which the Fund votes proxies relating to securities (“portfolio proxies”) held by the Fund. A description of the Fund’s Portfolio Proxy Voting Policies and Guidelines is available (i) without charge, upon request, by calling the Fund toll-free at 1.800.CALL OPP (225.5677), (ii) on the Fund’s website at www.oppenheimerfunds.com, and (iii) on the SEC’s website at www.sec.gov. In addition, the Fund is required to file FormN-PX, with its complete proxy voting record for the 12 months ended June 30th, no later than August 31st of each year. The Fund’s voting record is available (i) without charge, upon request, by calling the Fund toll-free at 1.800.CALL OPP (225.5677), and (ii) in the FormN-PX filing on the SEC’s website at www.sec.gov.
The Fund files its complete schedule of portfolio holdings with the SEC for the first quarter and the third quarter of each fiscal year on FormN-Q. The Fund’s FormN-Q filings are available on the SEC’s website at www.sec.gov. Beginning in April 2019, the Fund will no longer file FormN-Qs and will instead disclose its portfolio holdings monthly on FormN-PORT, which will also be available on the SEC’s website at www.sec.gov.
Householding—Delivery of Shareholder Documents
This is to inform you about OppenheimerFunds’ “householding” policy. If more than one member of your household maintains an account in a particular fund, OppenheimerFunds will mail only one copy of the fund’s prospectus (or, if available, the fund’s summary prospectus), annual and semiannual report and privacy policy. The consolidation of these mailings, called householding, benefits your fund through reduced mailing expense, and benefits you by reducing the volume of mail you receive from OppenheimerFunds. Householding does not affect the delivery of your account statements.
Please note that we will continue to household these mailings for as long as you remain an OppenheimerFunds shareholder, unless you request otherwise. If you prefer to receive multiple copies of these materials, please call us at1.800.CALL-OPP(225-5677).You may also notify us in writing or via email. We will begin sending you individual copies of the prospectus (or, if available, the summary prospectus), reports and privacy policy within 30 days of receiving your request to stop householding.
41 OPPENHEIMER PORTFOLIO SERIES CONSERVATIVE INVESTOR FUND
TRUSTEES AND OFFICERSUnaudited
| | |
| Name, Position(s) Held with the Fund, Length of Service, Year of Birth | | Principal Occupation(s) During the Past 5 Years; Other Trusteeships/ Directorships Held; Number of Portfolios in the Fund Complex Currently Overseen |
| |
| INDEPENDENT TRUSTEES | | The address of each Trustee in the chart below is 6803 S. Tucson Way, Centennial, Colorado 80112-3924. Each Trustee serves for an indefinite term, or until his or her resignation, retirement, death or removal. Each of the Trustees in the chart below oversee 46 portfolios in the OppenheimerFunds complex. |
| |
Joel W. Motley, Chairman of the Board of Trustees (since 2019) and Trustee (since 2005) Year of Birth: 1952 | | Director of Office of Finance Federal Home Loan Bank (since September 2016); Director of Greenwall Foundation (since October 2013); Member of Board and Investment Committee of The Greenwall Foundation (since April 2013); Member of the Vestry of Trinity Wall Street (since April 2012); Director of Southern Africa Legal Services Foundation (since March 2012); Board Member and Investment Committee Member of Pulitzer Center for Crisis Reporting(non-profit journalism) (since March 2011); Managing Director of Public Capital Advisors, LLC (privately-held financial advisor) (since January 2006); Managing Director of Carmona Motley, Inc. (privately-held financial advisor) (since January 2002); Director of Columbia Equity Financial Corp. (privately-held financial advisor) (2002-2007); Managing Director of Carmona Motley Hoffman Inc. (privately-held financial advisor) (January 1998-December 2001); Member of the Finance and Budget Committee of the Council on Foreign Relations, Member of the Investment Committee and Board of Human Rights Watch (since July 2000) and Member of the Investment Committee and Board of Historic Hudson Valley (since February 2010). Mr. Motley has served on the Boards of certain Oppenheimer funds since October 2002, during which time he has become familiar with the Fund’s (and other Oppenheimer funds’) financial, accounting, regulatory and investment matters and has contributed to the Board’s deliberations. |
| |
Beth Ann Brown, Trustee (since 2016) Year of Birth: 1968 | | Director, Board of Directors of Caron Engineering Inc. (since January 2018); Advisor, Board of Advisors of Caron Engineering Inc. (December 2014-December 2017); Independent Consultant (since September 2012); held the following positions at Columbia Management Investment Advisers LLC: Head of Intermediary Distribution (2008-2012), Managing Director, Strategic Relations (2005-2008), Managing Director, Head of National Accounts (2004-2005); Senior Vice President, National Account Manager (2002-2004), Senior Vice President, Key Account Manager (1999-2002) and Vice President, Key Account Manager (1996-1999) of Liberty Funds Distributor, Inc.; President and Director, of Acton Shapleigh Youth Conservation Corps (non -profit) (2012-2015); and Vice President and Director of Grahamtastic Connection(non-profit) (since May 2013). Ms. Brown has served on the Boards of certain Oppenheimer funds since January 2016, during which time she has become familiar with the Fund’s (and other Oppenheimer funds’) financial, accounting, regulatory and investment matters and has contributed to the Board’s deliberations. |
| |
Edmund P. Giambastiani, Jr., Trustee (since 2013) Year of Birth: 1948 | | Director of THL Credit, Inc. (since November 2016) (alternative credit investment manager); Advisory Board Member of the Maxwell School of Citizenship and Public Affairs of Syracuse University (April 2012-September 2016); Director of Mercury Defense Systems Inc. (information technology) (August 2011-February 2013); Trustee of the U.S. Naval Academy Foundation Athletic & Scholarship Program (since November 2010); Advisory Board Member of the Massachusetts Institute of Technology Lincoln Laboratory (federally-funded research development) (since May 2010); Director of The Boeing Company (aerospace and defense) (since October 2009); Trustee of MITRE Corporation (federally-funded research development) |
42 OPPENHEIMER PORTFOLIO SERIES CONSERVATIVE INVESTOR FUND
| | |
| Edmund P. Giambastiani, Jr.,(Continued) | | (since September 2008); Independent Director of QinetiQ Group Plc (defense technology and security) (February 2008-August 2011); Chairman of Monster Worldwide, Inc. (career services) (March 2015-November 2016), Director of Monster Worldwide, Inc. (career services) (February 2008-June 2011); Lead Director (June 2011-March 2015); Chairman of Alenia North America, Inc. (military and defense products) (January 2008-October 2009); Director of SRA International, Inc. (information technology and services) (January 2008-July 2011); President of Giambastiani Group LLC (national security and energy consulting) (since October 2007); United States Navy, career nuclear submarine officer (June 1970-October 2007); Seventh Vice Chairman of the Joint Chiefs of Staff (2005-October 2007); Supreme Allied Commander of NATO Allied Command Transformation (2003-2005) and Commander, U.S. Joint Forces Command (2002-2005). Since his retirement from the U.S. Navy in October 2007, Admiral Giambastiani has also served on numerous U.S. Government advisory boards, investigations and task forces for the Secretaries of Defense, State and Interior and the Central Intelligence Agency. He recently completed serving as a federal commissioner on the Military Compensation and Retirement Modernization Commission. Admiral Giambastiani has served on the Boards of certain Oppenheimer funds since February 2013, during which time he has become familiar with the Fund’s (and other Oppenheimer funds’) financial, accounting, regulatory and investment matters and has contributed to the Board’s deliberations. |
| |
Elizabeth Krentzman, Trustee (since 2014) Year of Birth: 1959 | | Trustee of the University of Florida National Board Foundation (since September 2017); Member of the Cartica Funds Board of Directors (private investment funds) (since January 2017); Member of the University of Florida Law Center Association, Inc. Board of Trustees and Audit Committee Member (since April 2016); Member of University of Florida Law Advisory Board, Washington, DC Alumni Group (since 2015); Advisory Board Member of the Securities and Exchange Commission Historical Society (since 2007); held the following positions at Deloitte & Touche LLP: Principal and Chief Regulatory Advisor for Asset Management Services (2007 - 2014) and U.S. Mutual Fund Leader (2011 - 2014); General Counsel of the Investment Company Institute (trade association) (June 2004 - April 2007); held the following positions at Deloitte & Touche LLP: National Director of the Investment Management Regulatory Consulting Practice (1997 - 2004), Principal (2003 - 2004), Director (1998 - 2003) and Senior Manager (1997 - 1998); Assistant Director of the Division of Investment Management - Office of Disclosure and Investment Adviser Regulation of the U.S. Securities and Exchange Commission (1996 - 1997) and various positions with the Division of Investment Management – Office of Regulatory Policy (1991 - 1996) of the U.S. Securities and Exchange Commission; Associate at Ropes & Gray LLP (1987 – 1991). Ms. Krentzman has served on the Boards of certain Oppenheimer funds since August 2014, during which time she has become familiar with the Fund’s (and other Oppenheimer funds’) financial, accounting, regulatory and investment matters and has contributed to the Board’s deliberations. |
| |
Mary F. Miller, Trustee (since 2005) Year of Birth: 1942 | | Trustee of International House(not-for-profit) (since June 2007); Trustee of the American Symphony Orchestra(not-for-profit) (October 1998-November 2011); and Senior Vice President and General Auditor of American Express Company (financial services company) (July 1998-February 2003). Ms. Miller has served on the Boards of certain Oppenheimer funds since August 2004, during which time she has become familiar with the Fund’s (and other Oppenheimer funds’) financial, accounting, regulatory and investment matters and has contributed to the Board’s deliberations. |
43 OPPENHEIMER PORTFOLIO SERIES CONSERVATIVE INVESTOR FUND
TRUSTEES AND OFFICERSUnaudited / Continued
| | |
| |
Joanne Pace, Trustee (since 2012) Year of Birth: 1958 | | Advisory Board Director of Massey Quick Simon & Co. (wealth management), LLC (since October 2014); Board Director of Horizon Blue Cross Blue Shield of New Jersey (healthcare) (since November 2012); Advisory Board Director of The Alberleen Group LLC (investment banking) (since March 2012); Governing Council Member (since 2016) and Chair of Education Committee (since 2017) of Independent Directors Council (IDC) (since 2016); Board Member of 100 Women in Finance(non-profit) (since January 2015); Advisory Council Member of Morgan Stanley Children’s Hospital(non-profit) (since May 2012); Director of The Komera Project(non-profit) (April 2012-2016); New York Advisory Board Director of Peace First(non-profit) (March 2010-2013); Senior Advisor of SECOR Asset Management, LP (2010-2011); Managing Director and Chief Operating Officer of Morgan Stanley Investment Management (2006-2010); Partner and Chief Operating Officer of FrontPoint Partners, LLC (hedge fund) (2005-2006); held the following positions at Credit Suisse (investment banking): Managing Director (2003-2005); Global Head of Human Resources and member of Executive Board and Operating Committee (2004-2005), Global Head of Operations and Product Control (2003-2004); held the following positions at Morgan Stanley: Managing Director (1997-2003), Controller and Principal Accounting Officer (1999-2003); Chief Financial Officer (temporary assignment) for the Oversight Committee, Long Term Capital Management (1998-1999). Lead Independent Director and Chair of the Audit and Nominating Committee of The Global Chartist Fund, LLC of Oppenheimer Asset Management (2011-2012); Board Director of Managed Funds Association (2008-2010); Board Director of Morgan Stanley Foundation (2007-2010) and Investment Committee Chair (2008-2010). Ms. Pace has served on the Boards of certain Oppenheimer funds since November 2012, during which time she has become familiar with the Fund’s (and other Oppenheimer funds’) financial, accounting, regulatory and investment matters and has contributed to the Board’s deliberations. |
| |
Daniel Vandivort, Trustee (since 2014) Year of Birth: 1954 | | Chairman and Lead Independent Director/Trustee (March 2010-September 2014), Chairman of the Audit Committee (March 2009-September 2014) and Director/Trustee (December 2008-September 2014) of the Board of Directors/ Trustees of Value Line Funds; Trustee (since January 2015) and Treasurer and Chairman of the Audit Committee and Finance Committee (since January 2016) of Board of Trustees of Huntington Disease Foundation of America; Trustee, Board of Trustees, RIM Retirement Savings Plan (2005-2007); President and Chief Investment Officer, Robeco Investment Management, formerly known as Weiss Peck and Greer (January 2005-June 2007); Member, Management Committee of Robeco Investment Management (2001-2007); Chairman and Trustee of the Board of Trustees of Weiss, Peck and Greer Funds (2004-2005); Managing Director and Head of Fixed Income, Weiss, Peck and Greer (November 1994-January 2005); Managing Director and Head of Fixed Income, CS First Boston Investment Management (January 1992-November 1994); Director, Global Product Development, First Boston Asset Management (November 1989-January 1992); Vice President, Fixed Income Sales, First Boston Corp. (May 1984-November 1989). Mr. Vandivort has served on the Boards of certain Oppenheimer funds since 2014, during which time he has become familiar with the Fund’s (and other Oppenheimer funds’) financial, accounting, regulatory and investment matters and has contributed to the Board’s deliberations. |
44 OPPENHEIMER PORTFOLIO SERIES CONSERVATIVE INVESTOR FUND
| | |
Brian F. Wruble, Trustee (since 2005) Year of Birth: 1943 | | Governor of Community Foundation of the Florida Keys(non-profit) (since July 2012); Director of TCP Capital, Inc. (registered business development company) (since November 2015); Chairman Emeritus of the Board of Trustees (since August 2011), Chairman of the Board of Trustees (August 2007-August 2011), Trustee of the Board of Trustees (since August 1991) of The Jackson Laboratory(non-profit); Member of Zurich Insurance Group’s Investment Management Advisory Council (insurance) (October 2004-February 2017); Treasurer (since 2007) and Trustee (since May 1992) of the Institute for Advanced Study(non-profit educational institute); Director of Special Value Opportunities Fund, LLC (registered investment company) (affiliate of theSub-Adviser’s parent company) (September 2004-June 2015); General Partner of Odyssey Partners, L.P. (hedge fund) (September 1995-December 2007); Special Limited Partner of Odyssey Investment Partners, LLC (private equity investment) (January 1999-September 2004). Mr. Wruble has served on the Boards of certain Oppenheimer funds since April 2001, during which time he has become familiar with the Fund’s (and other Oppenheimer funds’) financial, accounting, regulatory and investment matters and has contributed to the Board’s deliberations. |
| INTERESTED TRUSTEE AND OFFICER | | Mr. Steinmetz is an “Interested Trustee” because he is affiliated with the Manager and theSub-Adviser by virtue of his positions as Chairman of theSub-Adviser and officer and director of the Manager. Both as a Trustee and as an officer, Mr. Steinmetz serves for an indefinite term, or until his resignation, retirement, death or removal. Mr. Steinmetz’s address is 225 Liberty Street, New York, New York 10281-1008. Mr. Steinmetz is an officer of 104 portfolios in the OppenheimerFunds complex. |
| |
Arthur P. Steinmetz, Trustee (since 2015), President and Principal Executive Officer (since 2014) Year of Birth: 1958 | | Chairman of OppenheimerFunds, Inc. (since January 2015); CEO and Chairman of OFI Global Asset Management, Inc. (since July 2014), President of OFI Global Asset Management, Inc. (since May 2013), a Director of OFI Global Asset Management, Inc. (since January 2013), Director of OppenheimerFunds, Inc. (since July 2014), President, Management Director and CEO of Oppenheimer Acquisition Corp. (OppenheimerFunds, Inc.‘s parent holding company) (since July 2014), and President and Director of OFI SteelPath, Inc. (since January 2013). Chief Investment Officer of the OppenheimerFunds advisory entities (January 2013-December 2013); Executive Vice President of OFI Global Asset Management, Inc. (January2013-May 2013); Chief Investment Officer of OppenheimerFunds, Inc. (October 2010-December 2012); Chief Investment Officer, Fixed-Income, of OppenheimerFunds, Inc. (April 2009-October 2010); Executive Vice President of OppenheimerFunds, Inc. (October 2009-December 2012); Director of Fixed Income of OppenheimerFunds, Inc. (January 2009-April 2009); and a Senior Vice President of OppenheimerFunds, Inc. (March 1993-September 2009). |
| OTHER OFFICERS OF THE FUND | | The addresses of the Officers in the chart below are as follows: for Mr. Bennett, Mss. Lo Bessette, Foxson and Picciotto, 225 Liberty Street, New York, New York 10281-1008, for Mr. Petersen, 6803 S. Tucson Way, Centennial, Colorado 80112-3924. Each Officer serves for an indefinite term or until his or her resignation, retirement, death or removal. |
| |
Jeffrey Bennett, Vice President (since 2018) Year of Birth: 1976 | | Vice President of theSub-Adviser (since November 2016). Managing Director, Alternative Investment Management, for Alliance Bernstein 2011-2016); Director of Research at Fischer & Company (2008 to 2011). |
45 OPPENHEIMER PORTFOLIO SERIES CONSERVATIVE INVESTOR FUND
TRUSTEES AND OFFICERSUnaudited / Continued
| | |
| |
Cynthia Lo Bessette, Secretary and Chief Legal Officer (since 2016) Year of Birth: 1969 | | Executive Vice President, General Counsel and Secretary of OFI Global Asset Management, Inc. (since February 2016); Senior Vice President and Deputy General Counsel of OFI Global Asset Management, Inc. (March 2015-February 2016); Chief Legal Officer of OppenheimerFunds, Inc. and OppenheimerFunds Distributor, Inc. (since February 2016); Vice President, General Counsel and Secretary of Oppenheimer Acquisition Corp. (since February 2016); General Counsel of OFI SteelPath, Inc., OFI Advisors, LLC and Index Management Solutions, LLC (since February 2016); Chief Legal Officer of OFI Global Institutional, Inc., HarbourView Asset Management Corporation, OFI Global Trust Company, Oppenheimer Real Asset Management, Inc., OFI Private Investments Inc., Shareholder Services, Inc. and Trinity Investment Management Corporation (since February 2016); Corporate Counsel (February 2012-March 2015) and Deputy Chief Legal Officer (April 2013-March 2015) of Jennison Associates LLC; Assistant General Counsel (April 2008-September 2009) and Deputy General Counsel (October 2009-February 2012) of Lord Abbett & Co. LLC. |
| |
Jennifer Foxson, Vice President and Chief Business Officer (since 2014) Year of Birth: 1969 | | Senior Vice President of OppenheimerFunds Distributor, Inc. (since June 2014); Vice President of OppenheimerFunds Distributor, Inc. (April 2006-June 2014); Vice President of OppenheimerFunds, Inc. (January 1998-March 2006); Assistant Vice President of OppenheimerFunds, Inc. (October 1991-December 1998). |
| |
Mary Ann Picciotto, Chief Compliance Officer and Chief Anti-Money Laundering Officer (since 2014) Year of Birth: 1973 | | Senior Vice President and Chief Compliance Officer of OFI Global Asset Management, Inc. (since March 2014); Chief Compliance Officer of OppenheimerFunds, Inc., OFI SteelPath, Inc., OFI Global Institutional, Inc., Oppenheimer Real Asset Management, Inc., OFI Private Investments Inc., Harborview Asset Management Corporation, Trinity Investment Management Corporation, and Shareholder Services, Inc. (since March 2014); Managing Director of Morgan Stanley Investment Management Inc. and certain of its various affiliated entities; Chief Compliance Officer of various Morgan Stanley Funds (May 2010-January 2014); Chief Compliance Officer of Morgan Stanley Investment Management Inc. (April 2007-January 2014). |
| |
Brian S. Petersen, Treasurer and Principal Financial & Accounting Officer (since 2016) Year of Birth: 1970 | | Senior Vice President of OFI Global Asset Management, Inc. (since January 2017); Vice President of OFI Global Asset Management, Inc. (January 2013-January 2017); Vice President of OppenheimerFunds, Inc. (February 2007-December 2012); Assistant Vice President of OppenheimerFunds, Inc. (August 2002-2007). |
The Fund’s Statement of Additional Information contains additional information about the Fund’s Trustees and Officers and is available without charge upon request by calling 1.800.CALL OPP (225.5677).
46 OPPENHEIMER PORTFOLIO SERIES CONSERVATIVE INVESTOR FUND
OPPENHEIMER PORTFOLIO SERIES CONSERVATIVE INVESTOR FUND
| | |
| Manager | | OFI Global Asset Management, Inc. |
| |
| Sub-Adviser | | OppenheimerFunds, Inc. |
| |
| Distributor | | OppenheimerFunds Distributor, Inc. |
| |
| Transfer and Shareholder | | OFI Global Asset Management, Inc. |
| Servicing Agent | | |
| |
| Sub-Transfer Agent | | Shareholder Services, Inc. DBA OppenheimerFunds Services |
| |
Independent Registered Public Accounting Firm | | KPMG LLP |
| |
| Legal Counsel | | Kramer Levin Naftalis & Frankel LLP |
© 2019 OppenheimerFunds, Inc. All rights reserved.
47 OPPENHEIMER PORTFOLIO SERIES CONSERVATIVE INVESTOR FUND
PRIVACY NOTICE
As an Oppenheimer fund shareholder, you are entitled to know how we protect your personal information and how we limit its disclosure.
Information Sources
We obtainnon-public personal information about our shareholders from the following sources:
● Applications or other forms.
● When you create a user ID and password for online account access.
● When you enroll in eDocs Direct,SM our electronic document delivery service.
● Your transactions with us, our affiliates or others.
● Technologies on our website, including: “cookies” and web beacons, which are used to collect data on the pages you visit and the features you use.
If you visit oppenheimerfunds.com and do not log on to the secure account information areas, we do not obtain any personal information about you. When you do log on to a secure area, we do obtain your user ID and password to identify you. We also use this information to provide you with products and services you have requested, to inform you about products and services that you may be interested in and assist you in other ways.
We do not collect personal information through our website unless you willingly provide it to us, either directly by email or in those areas of the website that request information. In order to update your personal information (including your mailing address, email address and phone number) you must first log on and visit your user profile.
If you have set your browser to warn you before accepting cookies, you will receive the warning message with each cookie. You can refuse cookies by turning them off in your browser. However, doing so may limit your access to certain sections of our website.
We use cookies to help us improve and manage our website. For example, cookies help us recognize new versus repeat visitors to the site, track the pages visited, and enable some special features on the website. This data helps us provide better service for our website visitors.
Protection of Information
We do not disclose anynon-public personal information (such as names on a customer list) about current or former customers to anyone, except as permitted by law.
Disclosure of Information
Copies of confirmations, account statements and other documents reporting activity in your fund accounts are made available to your financial advisor (as designated by you). We may also use details about you and your investments to help us, our financial service affiliates, or firms that jointly market their financial products and services with ours, to better serve your investment needs or suggest educational material that may be of interest to you. If this requires us to provide you with an opportunity to “opt in” or “opt out” of such information sharing with a firm not affiliated with us, you will receive notification on how to do so, before any such sharing takes place.
Right of Refusal
We will not disclose your personal information to unaffiliated third parties (except as permitted by law), unless we first offer you a reasonable opportunity to refuse or “opt out” of such disclosure.
48 OPPENHEIMER PORTFOLIO SERIES CONSERVATIVE INVESTOR FUND
Internet Security and Encryption
In general, the email services provided by our website are encrypted and provide a secure and private means of communication with us. To protect your own privacy, confidential and/ or personal information should only be communicated via email when you are advised that you are using a secure website.
As a security measure, we do not include personal or account information innon-secure emails, and we advise you not to send such information to us innon-secure emails. Instead, you may take advantage of the secure features of our website to encrypt your email correspondence. To do this, you will need to use a browser that supports Secure Sockets Layer (SSL) protocol.
| ● | | All transactions conducted via our websites, including redemptions, exchanges and purchases, are secured by the highest encryption standards available. SSL is used to establish a secure connection between your PC and OppenheimerFunds’ server. It transmits information in an encrypted and scrambled format. |
| ● | | Encryption is achieved through an electronic scrambling technology that uses a “key” to code and then decode the data. Encryption acts like the cable converter box you may have on your television set. It scrambles data with a secret code so that no one can make sense of it while it is being transmitted. When the data reaches its destination, the same software unscrambles the data. |
| ● | | You can exit the secure area by closing your browser or, for added security, you can use the Log Out button before you close your browser. |
Other Security Measures
We maintain physical, electronic and procedural safeguards to protect your personal account information. Our employees and agents have access to that information only so that they may offer you products or provide services, for example, when responding to your account questions.
How You Can Help
You can also do your part to keep your account information private and to prevent unauthorized transactions. If you obtain a user ID and password for your account, safeguard that information. Strengthening your online credentials–your online security profile–typically your user name, password, and security questions and answers, can be one of your most important lines of defense on the Internet. For additional information on how you can help prevent identity theft, visit https://www.oppenheimerfunds.com/security.
Who We Are
This joint notice describes the privacy policies of the Oppenheimer funds, OppenheimerFunds, Inc., each of its investment adviser subsidiaries, OppenheimerFunds Distributor, Inc. and OFI Global Trust Co. It applies to all Oppenheimer fund accounts you presently have, or may open in the future, using your Social Security number—whether or not you remain a shareholder of our funds. This notice was last updated as of November 2017. In the event it is updated or changed, we will post an updated notice on our website at oppenheimerfunds.com. If you have any questions about this privacy policy, email us by clicking on theContact Us section of our website at oppenheimerfunds.com, write to us at P.O. Box 5270, Denver, CO 80217-5270, or call us at800 CALL OPP (225 5677).
49 OPPENHEIMER PORTFOLIO SERIES CONSERVATIVE INVESTOR FUND
THIS PAGE INTENTIONALLY LEFT BLANK.
50 OPPENHEIMER PORTFOLIO SERIES CONSERVATIVE INVESTOR FUND
THIS PAGE INTENTIONALLY LEFT BLANK.
51 OPPENHEIMER PORTFOLIO SERIES CONSERVATIVE INVESTOR FUND
THIS PAGE INTENTIONALLY LEFT BLANK.
52 OPPENHEIMER PORTFOLIO SERIES CONSERVATIVE INVESTOR FUND
THIS PAGE INTENTIONALLY LEFT BLANK.
53 OPPENHEIMER PORTFOLIO SERIES CONSERVATIVE INVESTOR FUND
THIS PAGE INTENTIONALLY LEFT BLANK.
54 OPPENHEIMER PORTFOLIO SERIES CONSERVATIVE INVESTOR FUND
THIS PAGE INTENTIONALLY LEFT BLANK.
55 OPPENHEIMER PORTFOLIO SERIES CONSERVATIVE INVESTOR FUND
| | | | |
| | 
OppenheimerFunds® The Right Way to Invest | | |
Visit Us oppenheimerfunds.com Call Us 800 225 5677 Follow Us 
| | Visit us at oppenheimerfunds.com for24-hr access to account information and transactions or call us at 800.CALL OPP (800.225.5677) for24-hr automated information and automated transactions. Representatives also available Mon–Fri8am-8pm ET. | | |
| | | | |
| | Oppenheimer funds are distributed by OppenheimerFunds Distributor, Inc. 225 Liberty Street, New York, NY 10281-1008 © 2019 OppenheimerFunds Distributor, Inc. All rights reserved. RA0540.001.0119 March 25, 2019 | | |
Important Updates
On October 18, 2018, Massachusetts Mutual Life Insurance Company, an indirect corporate parent of OppenheimerFunds, Inc. and its subsidiaries OFI Global Asset Management, Inc., OFI SteelPath, Inc. and OFI Advisors, LLC, announced that it has entered into an agreement whereby Invesco Ltd., a global investment management company, will acquire OppenheimerFunds, Inc. As of the date of this report, the transaction is expected to close in the second quarter of 2019, pending necessary regulatory and other third-party approvals. This is subject to change. See the Notes to Financial Statements for more information.
Update to Shareholder Report Document Delivery
Beginning January 1, 2021, OppenheimerFunds will send a notice, either by mail or email, each time your fund’s updated report is available on our website (oppenheimerfunds.com). Investors who are not enrolled in electronic delivery by January 1, 2021 will receive the notice in the mail. Enrolling in electronic delivery will enable you to receive a direct link to your full shareholder report the moment it becomes available, and limit the amount of mail you receive. All investors who prefer to receive shareholder reports in paper may, at any time, choose that option.
How do you update your delivery preferences?
If you own these shares through a financial intermediary, you may contact your financial intermediary.
If your accounts are held through OppenheimerFunds and you receive statements, confirms, and other documents directly from us, you can enroll in our eDocs DirectSM service atoppenheimerfunds.com or by calling us. Once you’re enrolled, you’ll begin to receive email notifications of updated documents when they become available. If you have any questions, feel free to call us at1.800.225.5677.
Table of Contents
Class A Shares
AVERAGE ANNUAL TOTAL RETURNS AT 1/31/19
| | | | | | | | |
| | | Class A Shares of the Fund | | | | |
| | Without Sales Charge | | With Sales Charge | | Bloomberg Barclays U.S. Aggregate Bond Index | | S&P 500 Index |
1-Year | | -4.59% | | -10.08% | | 2.25% | | -2.31% |
|
5-Year | | 4.74 | | 3.51 | | 2.44 | | 10.96 |
|
10-Year | | 8.56 | | 7.92 | | 3.68 | | 15.00 |
|
Performance data quoted represents past performance, which does not guarantee future results.The investment return and principal value of an investment in the Fund will fluctuate so that an investor’s shares, when redeemed, may be worth more or less than their original cost. Fund returns include changes in share price, reinvested distributions, and a 5.75% maximum applicable sales charge except where “without sales charge” is indicated. Current performance may be lower or higher than the performance quoted. Returns do not consider capital gains or income taxes on an individual’s investment. Returns for periods of less than one year are cumulative and not annualized. For performance data current to the most recentmonth-end, visit oppenheimerfunds.com or call 1.800. CALL OPP (225.5677). See Fund prospectuses and summary prospectuses for more information on share classes and sales charges.
3 OPPENHEIMER PORTFOLIO SERIES MODERATE INVESTOR FUND
Fund Performance Discussion1
During theone-year period ended January 31, 2019, the Fund’s Class A shares (without sales charge) returned-4.59%. For theone-year period ended January 31, 2019, the Fund underperformed the Bloomberg Barclays U.S. Aggregate Bond Index and the S&P 500 Index, which returned 2.25% and-2.31%, respectively.
MARKET OVERVIEW
Markets were volatile in 2018 and hit a wall in the last quarter of the year, before picking up again in January 2019. Several shocks negatively affected market sentiment. The U.S. Federal Reserve (Fed) once again decided to hike interest rates, as was nearly universally expected, but the post-meeting conference was more hawkish than expected. Markets were expecting a clear message that the Fed might consider a pause in any future rate increases, but that was not initially
communicated. Equity markets sold off, bonds rallied, and the U.S. dollar weakened. The sell-offs were sizable, which led some to think a recession might be imminent. It was not just the Fed making headlines, some key economic data were also weaker in December. In the U.S., regional surveys from the Fed and Institute for Supply Management (ISM) sentiment surveys decreased markedly, along with acool-off in housing. Politics were once
COMPARISON OF CHANGE IN VALUE OF $10,000 HYPOTHETICAL INVESTMENTS IN:
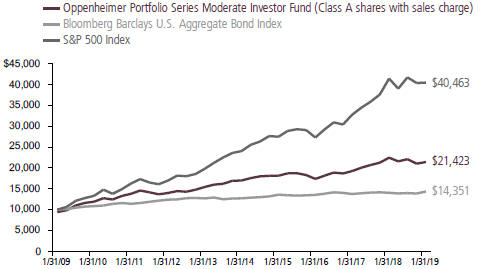
1. The Fund is invested in Class I shares of all underlying funds discussed in this Fund Performance Discussion.
4 OPPENHEIMER PORTFOLIO SERIES MODERATE INVESTOR FUND
again a factor because there was little clarity from the Trump Administration about the policies for tariffs on Chinese imports, and the U.S. Government shutdown did not help in an environment where the appetite for risk declined. Risk markets rallied in January 2019. The strong gains were driven by a shift in the statements from the Fed, which signaled a more dovish tone on future interest rate rises.
Despite rallying in January 2019, equities generally declined for theone-year period ended January 31, 2019. U.S. equities outperformed their international counterparts, with the S&P 500 Index returning 2.31%, the MSCI ACWI returning-7.48%, and emerging markets falling the most with a-14.24% return for the MSCI Emerging Markets Index. Growth stocks continued to outperform value stocks this reporting period. Fixed income fared better than equities in a volatile environment, with the Bloomberg Barclays U.S. Aggregate Bond Index returning 2.25% and the Bloomberg Barclays Global Aggregate Bond Index, Hedged, returning 3.58%.
FUND REVIEW
In an environment where equities experienced declines, the Fund’s equity exposure detracted from performance. Top detractors from performance in this area included Oppenheimer Value Fund, Oppenheimer Capital Appreciation Fund, Oppenheimer International Growth Fund, and Oppenheimer International Equity Fund. As mentioned earlier, value stocks underperformed this reporting period, which impacted
Oppenheimer Value Fund’s performance. Oppenheimer Capital Appreciation Fund, which typically invests inlarge-cap U.S. growth stocks, fared better than Oppenheimer Value Fund as growth outperformed; however, Oppenheimer Capital Appreciation Fund experienced declines and negatively impacted performance as it remained a top holding for most of the reporting period. We significantly trimmed our exposure to Oppenheimer Capital Appreciation Fund over the closing months of the reporting period. With international stocks underperforming U.S. stocks this period, the Fund’s allocation to Oppenheimer International Growth Fund and Oppenheimer International Equity Fund detracted from performance. Oppenheimer Developing Markets Fund also detracted from absolute results as emerging market equities had a difficult reporting period.
Oppenheimer Global Fund and Oppenheimer Emerging Markets Innovators Fund were underlying equity funds that contributed positively to performance this period. We initiated positions in these underlying funds over the second half of the reporting period.
In a period where U.S. fixed income produced positive returns, the Fund’s exposure to both Oppenheimer Total Return Bond Fund and Oppenheimer Limited-Term Government Fund benefited performance. The Fund’s allocation to Oppenheimer International Bond Fund detracted slightly from performance as a result of asell-off in emerging markets fixed income.
5 OPPENHEIMER PORTFOLIO SERIES MODERATE INVESTOR FUND
POST-PERIOD UPDATE
Shortly after the reporting period ended on February 1, 2019, we implemented changes to the Fund, which we believe will meaningfully enhance our investment capabilities and flexibility to manage the strategy in line with client expectations. The investment universe of the Fund has been expanded across OppenheimerFunds’ products, including additional mutual funds, ETFs andclosed-end funds, which will offer us additional component parts and greater investment flexibility to seek to achieve the
Fund’s investment objective. In addition, the Fund will permit derivative usage for better cash and duration management. To reflect the increase in international exposure, the Fund changed its benchmarks from the Bloomberg Barclays U.S. Aggregate Bond Index and S&P 500 Index to the MSCI ACWI, Bloomberg Barclays Global Aggregate Bond Index, Hedged, and a blended benchmark that consists of 60% MSCI ACWI and 40% Bloomberg Barclays Global Aggregate Bond Index, Hedged.
| | |
 | | 
Jeffrey Bennett Portfolio Manager |
6 OPPENHEIMER PORTFOLIO SERIES MODERATE INVESTOR FUND
Top Holdings and Allocations
ASSET CLASS ALLOCATION
| | |
Foreign Equity Funds | | 30.9% |
Domestic Equity Funds | | 26.0 |
Domestic Fixed Income Funds | | 25.9 |
Alternative Funds | | 9.0 |
Foreign Fixed Income Fund | | 8.2 |
Money Market Fund | | —* |
*Represents a value of less than 0.05%.
Portfolio holdings and allocations are subject to change. Percentages are as of January 31, 2019, and are based on the total market value of investments.
TOP TEN HOLDINGS
| | |
| Oppenheimer Value Fund, Cl. I | | 14.9% |
| Oppenheimer Total Return Bond Fund, Cl. I | | 12.8 |
| Oppenheimer Global Fund, Cl. I | | 9.3 |
| Oppenheimer International Bond Fund, Cl. I | | 8.2 |
| Oppenheimer Limited-Term Government Fund, Cl. I | | 6.3 |
| Oppenheimer International Equity Fund, Cl. I | | 5.9 |
| Oppenheimer Developing Markets Fund, Cl. I | | 5.2 |
| Oppenheimer International Growth Fund, Cl. I | | 5.1 |
| Oppenheimer Capital Appreciation Fund, Cl. I | | 5.1 |
| Oppenheimer Master Loan Fund, LLC | | 3.9 |
Portfolio holdings and allocations are subject to change. Percentages are as of January 31, 2019, and are based on net assets.
For more current Fund holdings, please visit oppenheimerfunds.com.
7 OPPENHEIMER PORTFOLIO SERIES MODERATE INVESTOR FUND
Share Class Performance
AVERAGE ANNUAL TOTAL RETURNS WITHOUT SALES CHARGE AS OF 1/31/19
| | | | | | | | | | | | | | | | |
| | | Inception | | | | | | | | | | |
| | | Date | | | 1-Year | | | 5-Year | | | 10-Year | |
Class A (OAMIX) | | | 4/5/05 | | | | -4.59 | % | | | 4.74 | % | | | 8.56% | |
Class C (OCMIX) | | | 4/5/05 | | | | -5.33 | | | | 3.96 | | | | 7.74 | |
Class R (ONMIX) | | | 4/5/05 | | | | -4.86 | | | | 4.48 | | | | 8.29 | |
Class Y (OYMIX) | | | 4/5/05 | | | | -4.41 | | | | 4.99 | | | | 8.85 | |
AVERAGE ANNUAL TOTAL RETURNS WITH SALES CHARGE AS OF 1/31/19 | |
| | | Inception | | | | | | | | | | |
| | | Date | | | 1-Year | | | 5-Year | | | 10-Year | |
Class A (OAMIX) | | | 4/5/05 | | | | -10.08 | % | | | 3.51 | % | | | 7.92% | |
Class C (OCMIX) | | | 4/5/05 | | | | -6.26 | | | | 3.96 | | | | 7.74 | |
Class R (ONMIX) | | | 4/5/05 | | | | -4.86 | | | | 4.48 | | | | 8.29 | |
Class Y (OYMIX) | | | 4/5/05 | | | | -4.41 | | | | 4.99 | | | | 8.85 | |
Performance data quoted represents past performance, which does not guarantee future results.The investment return and principal value of an investment in the Fund will fluctuate so that an investor’s shares, when redeemed, may be worth more or less than their original cost. Current performance may be lower or higher than the performance quoted. Returns do not consider capital gains or income taxes on an individual’s investment. For performance data current to the most recentmonth-end, visit oppenheimerfunds.com or call 1.800. CALL OPP (225.5677). Fund returns include changes in share price, reinvested distributions, and the applicable sales charge: for Class A shares, the current maximum initial sales charge of 5.75% and for Class C shares, the contingent deferred sales charge of 1% for the1-year period. There is no sales charge for Class R and Class Y shares. Returns for periods of less than one year are cumulative and not annualized. See Fund prospectuses and summary prospectuses for more information on share classes and sales charges.
The Fund’s performance is compared to the performance of the S&P 500 Index and the Bloomberg Barclays U.S. Aggregate Bond Index. The S&P 500 Index is a capitalization-weighted index of 500 stocks intended to be a representative sample of leading companies in leading industries within the U.S. economy. The Bloomberg Barclays U.S. Aggregate Bond Index is an index of U.S.-dollar-denominated, investment-grade U.S. corporate government and mortgage-backed securities. The indices areunmanaged and cannot be purchased directly by investors. While index comparisons may be useful to provide a benchmark for the Fund’s performance, it must be noted that the Fund’s investments are not limited to the investments comprising theindices. Index performance includes reinvestment of income, but does not reflect transaction costs, fees, expenses or taxes. Index performance is shown for illustrative purposes only as a benchmark for the Fund’s performance, and does not predict or depict performance of the Fund. The Fund’s performance reflects the effects of the Fund’s business and operating expenses.
The views in the Fund Performance Discussion represent the opinions of this Fund’s portfolio manager(s) and are not intended as investment advice or to predict or depict the performance of any investment. These views are as of the close of business on January 31, 2019, and are
8 OPPENHEIMER PORTFOLIO SERIES MODERATE INVESTOR FUND
subject to change based on subsequent developments. The Fund’s portfolio and strategies are subject to change.
Before investing in any of the Oppenheimer funds, investors should carefully consider a fund’s investment objectives, risks, charges and expenses. Fund prospectuses and summary prospectuses contain this and other information about the funds, and may be obtained by asking your financial advisor, visiting oppenheimerfunds.com, or calling 1.800. CALL OPP (225.5677). Read prospectuses and summary prospectuses carefully before investing.
Shares of Oppenheimer funds are not deposits or obligations of any bank, are not guaranteed by any bank, are not insured by the FDIC or any other agency, and involve investment risks, including the possible loss of the principal amount invested.
9 OPPENHEIMER PORTFOLIO SERIES MODERATE INVESTOR FUND
Fund Expenses
Fund Expenses. As a shareholder of the Fund, you incur two types of costs: (1) transaction costs, which may include sales charges (loads) on purchase payments and/or contingent deferred sales charges on redemptions; and (2) ongoing costs, including management fees; distribution and service fees; and other Fund expenses. These examples are intended to help you understand your ongoing costs (in dollars) of investing in the Fund and to compare these costs with the ongoing costs of investing in other mutual funds.
The examples are based on an investment of $1,000.00 invested at the beginning of the period and held for the entire6-month period ended January 31, 2019.
Actual Expenses. The first section of the table provides information about actual account values and actual expenses. You may use the information in this section for the class of shares you hold, together with the amount you invested, to estimate the expense that you paid over the period. Simply divide your account value by $1,000.00 (for example, an $8,600.00 account value divided by $1,000.00 = 8.60), then multiply the result by the number in the first section under the heading entitled “Expenses Paid During 6 Months Ended January 31, 2019” to estimate the expenses you paid on your account during this period.
Hypothetical Example for Comparison Purposes.The second section of the table provides information about hypothetical account values and hypothetical expenses based on the Fund’s actual expense ratio for each class of shares, and an assumed rate of return of 5% per year for each class before expenses, which is not the Fund’s actual return. The hypothetical account values and expenses may not be used to estimate the actual ending account balance or expenses you paid for the period. You may use this information to compare the ongoing costs of investing in the Fund and other funds. To do so, compare this 5% hypothetical example for the class of shares you hold with the 5% hypothetical examples that appear in the shareholder reports of the other funds.
Please note that the expenses shown in the table are meant to highlight your ongoing costs only and do not reflect any transactional costs, such asfront-end or contingent deferred sales charges (loads). Therefore, the “hypothetical” section of the table is useful in comparing ongoing costs only, and will not help you determine the relative total costs of owning different funds. In addition, if these transactional costs were included, your costs would have been higher.
10 OPPENHEIMER PORTFOLIO SERIES MODERATE INVESTOR FUND
| | | | | | | | | | | | | | | | |
| | | Beginning | | | Ending | | | Expenses | | | | |
| | | Account | | | Account | | | Paid During | | | | |
| | | Value | | | Value | | | 6 Months Ended | | | | |
| Actual | | August 1, 2018 | | | January 31, 2019 | | | January 31, 2019 | | | | |
| |
Class A | | $ | 1,000.00 | | | $ | 969.40 | | | $ | 2.04 | | | | | |
| |
Class C | | | 1,000.00 | | | | 965.40 | | | | 5.81 | | | | | |
| |
Class R | | | 1,000.00 | | | | 968.30 | | | | 3.33 | | | | | |
| |
Class Y | | | 1,000.00 | | | | 969.60 | | | | 0.89 | | | | | |
| | | | |
| Hypothetical | | | | | | | | | | | | |
(5% return before expenses) | | | | | | | | | | | | | | | | |
| |
Class A | | | 1,000.00 | | | | 1,023.14 | | | | 2.09 | | | | | |
| |
Class C | | | 1,000.00 | | | | 1,019.31 | | | | 5.97 | | | | | |
| |
Class R | | | 1,000.00 | | | | 1,021.83 | | | | 3.42 | | | | | |
| |
Class Y | | | 1,000.00 | | | | 1,024.30 | | | | 0.92 | | | | | |
Expenses are equal to the Fund’s annualized expense ratio for that class, multiplied by the average account value over the period, multiplied by 184/365 (to reflect theone-half year period). Those annualized expense ratios, excluding indirect expenses from affiliated funds, based on the6-month period ended January 31, 2019 are as follows:
| | | | | | | | |
| Class | | | Expense Ratios | | | | | |
| |
Class A | | | 0.41 | % | | | | |
| |
Class C | | | 1.17 | | | | | |
| |
Class R | | | 0.67 | | | | | |
| |
Class Y | | | 0.18 | | | | | |
The expense ratios reflect voluntary and/or contractual waivers and/or reimbursements of expenses by the Fund’s Manager. Some of these undertakings may be modified or terminated at any time, as indicated in the Fund’s prospectus. The “Financial Highlights” tables in the Fund’s financial statements, included in this report, also show the gross expense ratios, without such waivers or reimbursements and reduction to custodian expenses, if applicable.
11 OPPENHEIMER PORTFOLIO SERIES MODERATE INVESTOR FUND
STATEMENT OF INVESTMENTSJanuary 31, 2019
| | | | | | | | |
| | | Shares | | | Value | |
| |
| Investment Companies—99.9%1 | | | | | | | | |
| Alternative Funds—8.9% | | | | | | | | |
| Oppenheimer Fundamental Alternatives Fund, Cl. I | | | 1,089,637 | | | $ | 29,256,761 | |
| |
| Oppenheimer Master Event-Linked Bond Fund, LLC | | | 3,245,107 | | | | 50,262,858 | |
| |
| Oppenheimer Real Estate Fund, Cl. I | | | 1,205,721 | | | | 30,203,300 | |
| |
| Oppenheimer SteelPath MLP Select 40 Fund, Cl. I | | | 3,428,817 | | | | 26,847,636 | |
| | | | | | | | |
| | | | | | | 136,570,555 | |
| |
| Domestic Equity Funds—26.0% | | | | | | | | |
| Oppenheimer Capital Appreciation Fund, Cl. I | | | 1,260,701 | | | | 77,280,953 | |
| |
| Oppenheimer Discovery Mid Cap Growth Fund, Cl. I | | | 1,810,432 | | | | 38,544,087 | |
| |
| Oppenheimer Main Street Small Cap Fund, Cl. I | | | 3,828,120 | | | | 53,746,808 | |
| |
| Oppenheimer Value Fund, Cl. I | | | 7,097,684 | | | | 227,764,680 | |
| | | | | | | | |
| | | | | | | 397,336,528 | |
| |
| Domestic Fixed Income Funds—25.9% | | | | | | | | |
| Oppenheimer Limited-Term Government Fund, Cl. I | | | 22,276,896 | | | | 96,458,959 | |
| |
| Oppenheimer Master Inflation Protected Securities Fund, LLC | | | 3,696,930 | | | | 44,883,154 | |
| |
| Oppenheimer Master Loan Fund, LLC | | | 3,431,809 | | | | 59,044,510 | |
| |
| Oppenheimer Total Return Bond Fund, Cl. I | | | 29,385,784 | | | | 195,415,463 | |
| | | | | | | | |
| | | | | | | 395,802,086 | |
| |
| Foreign Equity Funds—30.9% | | | | | | | | |
| Oppenheimer Developing Markets Fund, Cl. I | | | 1,950,044 | | | | 79,542,293 | |
| |
| Oppenheimer Emerging Markets Innovators Fund, Cl. I2 | | | 2,409,256 | | | | 23,442,059 | |
| |
| Oppenheimer Global Fund, Cl. I | | | 1,739,671 | | | | 142,148,524 | |
| |
| Oppenheimer International Equity Fund, Cl. I | | | 4,682,540 | | | | 89,670,635 | |
| |
| Oppenheimer International Growth Fund, Cl. I | | | 2,103,975 | | | | 78,120,592 | |
| |
| Oppenheimer InternationalSmall-Mid Co. Fund, Cl. I | | | 732,700 | | | | 31,843,148 | |
| |
| Oppenheimer Macquarie Global Infrastructure Fund, Cl. I | | | 2,553,476 | | | | 27,322,192 | |
| | | | | | | | |
| | | | | | | 472,089,443 | |
| |
| Foreign Fixed Income Fund—8.2% | | | | | | | | |
| Oppenheimer International Bond Fund, Cl. I | | | 22,388,626 | | | | 124,480,761 | |
| |
| Money Market Fund—0.0% | | | | | | | | |
| Oppenheimer Institutional Government Money Market Fund, Cl. E, 2.35%3 | | | 585,022 | | | | 585,022 | |
| |
| Total Investments, at Value (Cost $1,347,709,701) | | | 99.9% | | | | 1,526,864,395 | |
| |
| Net Other Assets (Liabilities) | | | 0.1 | | | | 2,083,366 | |
| | | | |
| Net Assets | | | 100.0% | | | $ | 1,528,947,761 | |
| | | | |
Footnotes to Statement of Investments
1. Is or was an affiliate, as defined in the Investment Company Act of 1940, as amended, at or during the reporting period, by virtue of the Fund owning at least 5% of the voting securities of the issuer or as a result of the Fund and the issuer having the same investment adviser. Transactions during the reporting period in which the issuer was an affiliate are as follows:
| | | | | | | | | | | | | | | | |
| | | Shares | | | Gross | | | Gross | | | Shares | |
| | | January 31, 2018 | | | Additions | | | Reductions | | | January 31, 2019 | |
| |
Investment Companies Alternative Funds | | | | | | | | | | | | | | | | |
| Oppenheimer Fundamental Alternatives Fund, Cl. I | | | 587,747 | | | | 786,985 | | | | 285,095 | | | | 1,089,637 | |
| Oppenheimer Global Multi Strategies Fund, Cl. I | | | 1,401,676 | | | | 379 | | | | 1,402,055 | | | | — | |
| Oppenheimer Gold & Special Minerals Fund, Cl. I | | | 736,866 | | | | 442,673 | | | | 1,179,539 | | | | — | |
12 OPPENHEIMER PORTFOLIO SERIES MODERATE INVESTOR FUND
Footnotes to Statement of Investments (Continued)
| | | | | | | | | | | | | | | | |
| | | Shares | | Gross | | Gross | | Shares |
| | | January 31, 2018 | | Additions | | Reductions | | January 31, 2019 |
| Oppenheimer Master Event-Linked Bond Fund, LLC | | | — | | | | 3,391,540 | | | | 146,433 | | | | 3,245,107 | |
| Oppenheimer Real Estate Fund, Cl. I | | | 976,792 | | | | 496,309 | | | | 267,380 | | | | 1,205,721 | |
| Oppenheimer SteelPath MLP Select 40 Fund, Cl. I | | | — | | | | 3,509,595 | | | | 80,778 | | | | 3,428,817 | |
| Domestic Equity Funds | | | | | | | | | | | | | | | | |
| Oppenheimer Capital Appreciation Fund, Cl. I | | | 5,106,160 | | | | 122,835 | | | | 3,968,294 | | | | 1,260,701 | |
| Oppenheimer Discovery Mid Cap Growth Fund, Cl. I | | | — | | | | 1,852,849 | | | | 42,417 | | | | 1,810,432 | |
| Oppenheimer Main Street Mid Cap Fund, Cl. I | | | 1,983,854 | | | | 72,853 | | | | 2,056,707 | | | | — | |
| Oppenheimer Main Street Small Cap Fund, Cl. I | | | 3,563,180 | | | | 887,869 | | | | 622,929 | | | | 3,828,120 | |
| Oppenheimer Value Fund, Cl. I | | | 8,723,891 | | | | 1,033,701 | | | | 2,659,908 | | | | 7,097,684 | |
| Domestic Fixed Income Funds | | | | | | | | | | | | | | | | |
| Oppenheimer Limited-Term Government Fund, Cl. I | | | 22,247,133 | | | | 5,369,941 | | | | 5,340,178 | | | | 22,276,896 | |
| Oppenheimer Master Inflation Protected Securities Fund, LLC | | | 5,179,639 | | | | 1,102,996 | | | | 2,585,705 | | | | 3,696,930 | |
| Oppenheimer Master Loan Fund, LLC | | | 2,769,703 | | | | 1,449,609 | | | | 787,503 | | | | 3,431,809 | |
| Oppenheimer Total Return Bond Fund, Cl. I | | | 33,673,455 | | | | 5,807,388 | | | | 10,095,059 | | | | 29,385,784 | |
| Foreign Equity Funds | | | | | | | | | | | | | | | | |
| Oppenheimer Developing Markets Fund, Cl. I | | | 968,366 | | | | 1,101,849 | | | | 120,171 | | | | 1,950,044 | |
| Oppenheimer Emerging Markets Innovators Fund, Cl. I | | | — | | | | 2,466,656 | | | | 57,400 | | | | 2,409,256 | |
| Oppenheimer Global Fund, Cl. I | | | — | | | | 1,779,446 | | | | 39,775 | | | | 1,739,671 | |
| Oppenheimer International Equity Fund, Cl. I | | | 4,275,433 | | | | 915,061 | | | | 507,954 | | | | 4,682,540 | |
| Oppenheimer International Growth Fund, Cl. I | | | 2,383,911 | | | | 263,583 | | | | 543,519 | | | | 2,103,975 | |
| Oppenheimer International Small-Mid Co. Fund, Cl. I | | | 715,977 | | | | 82,256 | | | | 65,533 | | | | 732,700 | |
| Oppenheimer Macquarie Global Infrastructure Fund, Cl. I | | | — | | | | 2,613,872 | | | | 60,396 | | | | 2,553,476 | |
| Foreign Fixed Income Funds | | | | | | | | | | | | | | | | |
| Oppenheimer International Bond Fund, Cl. I | | | 17,012,232 | | | | 7,270,746 | | | | 1,894,352 | | | | 22,388,626 | |
| Money Market Funds | | | | | | | | | | | | | | | | |
| Oppenheimer Institutional Government Money Market Fund, Cl. E | | | 1,606,449 | | | | 32,666,295 | | | | 33,687,722 | | | | 585,022 | |
13 OPPENHEIMER PORTFOLIO SERIES MODERATE INVESTOR FUND
STATEMENT OF INVESTMENTSContinued
Footnotes to Statement of Investments (Continued)
| | | | | | | | | | | | | | | | |
| | | Value | | Income | | | Realized
Gain (Loss) | | Change in
Unrealized
Gain (Loss) |
Investment Companies Alternative Funds | | | | | | | | | | | | | | | | |
| Oppenheimer Fundamental Alternatives Fund, Cl. I | | $ | 29,256,761 | | | $ | 619,635 | | | $ | 12,632 | | | $ | (1,038,506 | ) |
| Oppenheimer Global Multi Strategies Fund, Cl. I | | | — | | | | — | | | | (4,924,233 | ) | | | 4,339,405 | |
| Oppenheimer Gold & Special Minerals Fund, Cl. I | | | — | | | | — | | | | (10,227,888 | ) | | | 8,285,831 | |
| Oppenheimer Master Event-Linked Bond Fund, LLC | | | 50,262,858 | | | | 1,724,897 | a | | | (641,418 | )a | | | (682,230 | )a |
| Oppenheimer Real Estate Fund, Cl. Ib | | | 30,203,300 | | | | 499,504 | | | | (900,118 | ) | | | 2,050,183 | |
| Oppenheimer SteelPath MLP Select 40 Fund, Cl. I | | | 26,847,636 | | | | 399,347 | | | | (46,343 | ) | | | (316,216 | ) |
| Domestic Equity Funds | | | | | | | | | | | | | | | | |
| Oppenheimer Capital Appreciation Fund, Cl. Ic | | | 77,280,953 | | | | 168,683 | | | | 40,630,975 | | | | (57,295,945 | ) |
| Oppenheimer Discovery Mid Cap Growth Fund, Cl. Id | | | 38,544,087 | | | | — | | | | (111,760 | ) | | | (1,509,332 | ) |
| Oppenheimer Main Street Mid Cap Fund, Cl. Ie | | | — | | | | 59,293 | | | | 8,412,358 | | | | (12,625,866 | ) |
| Oppenheimer Main Street Small Cap Fund, Cl. If | | | 53,746,808 | | | | 190,744 | | | | 711,598 | | | | (5,227,503 | ) |
| Oppenheimer Value Fund, Cl. Ig | | | 227,764,680 | | | | 5,061,397 | | | | 10,954,815 | | | | (66,360,787 | ) |
| Domestic Fixed Income Funds | | | | | | | | | | | | | | | | |
| Oppenheimer Limited-Term Government Fund, Cl. I | | | 96,458,959 | | | | 2,766,063 | | | | (2,000,045 | ) | | | 1,458,867 | |
| Oppenheimer Master Inflation Protected Securities Fund, LLC | | | 44,883,154 | | | | 1,849,922 | h | | | (1,393,833 | )h | | | (154,904 | )h |
| Oppenheimer Master Loan Fund, LLC | | | 59,044,510 | | | | 3,123,780 | i | | | 400,145 | i | | | (2,852,027 | )i |
| Oppenheimer Total Return Bond Fund, Cl. I | | | 195,415,463 | | | | 8,246,057 | | | | (12,577,136 | ) | | | 7,195,637 | |
| Foreign Equity Funds | | | | | | | | | | | | | | | | |
| Oppenheimer Developing Markets Fund, Cl. I | | | 79,542,293 | | | | 487,273 | | | | (204,531 | ) | | | (2,917,920 | ) |
| Oppenheimer Emerging Markets Innovators Fund, Cl. I | | | 23,442,059 | | | | — | | | | (9,482 | ) | | | 1,013,529 | |
| Oppenheimer Global Fund, Cl. Ij | | | 142,148,524 | | | | 820,553 | | | | (427,972 | ) | | | (5,579,311 | ) |
| Oppenheimer International Equity Fund, Cl. I | | | 89,670,635 | | | | 1,376,874 | | | | 270,531 | | | | (18,072,767 | ) |
| Oppenheimer International Growth Fund, Cl. I | | | 78,120,592 | | | | 1,228,693 | | | | (511,497 | ) | | | (20,787,177 | ) |
| Oppenheimer International Small- Mid Co. Fund, Cl. Ik | | | 31,843,148 | | | | 323,366 | | | | 399,536 | | | | (6,325,727 | ) |
| Oppenheimer Macquarie Global Infrastructure Fund, Cl. Il | | | 27,322,192 | | | | 130,970 | | | | (7,046 | ) | | | 901,415 | |
| Foreign Fixed Income Funds | | | | | | | | | | | | | | | | |
| Oppenheimer International Bond Fund, Cl. I | | | 124,480,761 | | | | 3,096,335 | | | | (662,384 | ) | | | (6,044,543 | ) |
14 OPPENHEIMER PORTFOLIO SERIES MODERATE INVESTOR FUND
Footnotes to Statement of Investments (Continued)
| | | | | | | | | | | | | | | | |
| | | Value | | Income | | Realized
Gain (Loss) | | Change in
Unrealized
Gain (Loss) |
Money Market Funds | | | | | | | | | | | | | | | | |
| Oppenheimer Institutional Government Money Market Fund, Cl. E | | $ | 585,022 | | | $ | 161,132 | | | $ | — | | | $ | — | |
| | | | |
| Total | | $ | 1,526,864,395 | | | $ | 32,334,518 | | | $ | 27,146,904 | | | $ | (182,545,894 | ) |
| | | | |
a. Represents the amount allocated to the Fund from Oppenheimer Master Event-Linked Bond Fund, LLC.
b. The fund distributed realized gains of $748,619.
c. The fund distributed realized gains of $5,464,342.
d. The fund distributed realized gains of $1,963,698.
e. The fund distributed realized gains of $1,488,396.
f. The fund distributed realized gains of $3,456,088.
g. The fund distributed realized gains of $25,591,529.
h. Represents the amount allocated to the Fund from Oppenheimer Master Inflation Protected Securities Fund, LLC.
i. Represents the amount allocated to the Fund from Oppenheimer Master Loan Fund, LLC.
j. The fund distributed realized gains of $9,169,804.
k. The fund distributed realized gains of $2,814,502.
l. The fund distributed realized gains of $93,401.
2.Non-income producing security.
3. Rate shown is the7-day yield at period end.
See accompanying Notes to Financial Statements.
15 OPPENHEIMER PORTFOLIO SERIES MODERATE INVESTOR FUND
STATEMENT OF ASSETS AND LIABILITIESJanuary 31, 2019
| | | | |
| |
| Assets | | | | |
| Investments, at value—see accompanying statement of investments—affiliated companies (cost $1,347,709,701) | | $ | 1,526,864,395 | |
| |
| Cash | | | 2,729,704 | |
| |
| Receivables and other assets: | | | | |
| Dividends | | | 1,332,036 | |
| Shares of beneficial interest sold | | | 1,068,550 | |
| Investments sold | | | 265,310 | |
| Other | | | 63,506 | |
| | | | |
| Total assets | | | 1,532,323,501 | |
|
| |
| Liabilities | | | | |
| Payables and other liabilities: | | | | |
| Shares of beneficial interest redeemed | | | 1,569,366 | |
| Investments purchased | | | 1,364,166 | |
| Distribution and service plan fees | | | 312,482 | |
| Trustees’ compensation | | | 84,371 | |
| Shareholder communications | | | 8,773 | |
| Other | | | 36,582 | |
| | | | |
Total liabilities | | | 3,375,740 | |
| |
| Net Assets | | $ | 1,528,947,761 | |
| | | | |
|
| |
| Composition of Net Assets | | | | |
| Par value of shares of beneficial interest | | $ | 131,139 | |
| |
| Additionalpaid-in capital | | | 1,315,670,803 | |
| |
| Total distributable earnings | | | 213,145,819 | |
| | | | |
| Net Assets | | $ | 1,528,947,761 | |
| | | | |
|
| |
| Net Asset Value Per Share | | | | |
| Class A Shares: | | | | |
| |
| Net asset value and redemption price per share (based on net assets of $1,037,832,440 and 88,568,006 shares of beneficial interest outstanding) | | | $11.72 | |
| |
| Maximum offering price per share (net asset value plus sales charge of 5.75% of offering price) | | | $12.44 | |
| |
| |
| Class C Shares: | | | | |
| |
| Net asset value, redemption price (excludes applicable contingent deferred sales charge) and offering price per share (based on net assets of $358,745,790 and 31,220,047 shares of beneficial interest outstanding) | | | $11.49 | |
| |
| |
| Class R Shares: | | | | |
| |
| Net asset value, redemption price (excludes applicable contingent deferred sales charge) and offering price per share (based on net assets of $116,637,266 and 10,015,709 shares of beneficial interest outstanding) | | | $11.65 | |
| |
| |
| Class Y Shares: | | | | |
| |
| Net asset value, redemption price and offering price per share (based on net assets of $15,732,265 and 1,335,305 shares of beneficial interest outstanding) | | | $11.78 | |
See accompanying Notes to Financial Statements.
16 OPPENHEIMER PORTFOLIO SERIES MODERATE INVESTOR FUND
STATEMENT OF
OPERATIONSFor the Year Ended January 31, 2019
| | | | |
| |
| Allocation of Income and Expenses from Master Funds1 | | | | |
| Net investment income allocated from Oppenheimer Master Event-Linked Bond Fund, LLC: | | | | |
| Interest | | $ | 1,712,766 | |
| Dividends | | | 12,131 | |
| Net expenses | | | (99,479) | |
| | | | |
Net investment income allocated from Oppenheimer Master Event-Linked Bond Fund, LLC | | | 1,625,418 | |
| |
| Net investment income allocated from Oppenheimer Master Inflation Protected Securities Fund, LLC: | | | | |
| Interest | | | 1,840,794 | |
| Dividends | | | 9,128 | |
| Net expenses | | | (310,742) | |
| | | | |
Net investment income allocated from Oppenheimer Master Inflation Protected Securities Fund, LLC | | | 1,539,180 | |
| |
| Net investment income allocated from Oppenheimer Master Loan Fund, LLC: | | | | |
| Interest | | | 3,058,819 | |
| Dividends | | | 64,961 | |
| Net expenses | | | (203,671) | |
| | | | |
| Net investment income allocated from Oppenheimer Master Loan Fund, LLC | | | 2,920,109 | |
| | | | |
| Total allocation of net investment income from master funds | | | 6,084,707 | |
|
| |
| Investment Income | | | | |
| Dividends affiliated companies | | | 25,635,919 | |
| |
| Interest | | | 41,412 | |
| | | | |
| Total investment income | | | 25,677,331 | |
|
| |
| Expenses | | | | |
| Distribution and service plan fees: | | | | |
| Class A | | | 2,584,160 | |
| Class B2 | | | 9,927 | |
| Class C | | | 3,764,542 | |
| Class R | | | 577,792 | |
| |
| Transfer and shareholder servicing agent fees: | | | | |
| Class A | | | 2,122,446 | |
| Class B2 | | | 1,941 | |
| Class C | | | 739,426 | |
| Class R | | | 229,671 | |
| Class Y | | | 30,996 | |
| |
| Shareholder communications: | | | | |
| Class A | | | 24,519 | |
| Class B2 | | | 449 | |
| Class C | | | 7,720 | |
| Class R | | | 2,450 | |
| Class Y | | | 238 | |
| |
| Trustees’ compensation | | | 22,873 | |
| |
| Custodian fees and expenses | | | 11,145 | |
| |
| Other | | | 72,556 | |
| | | | |
| Total expenses | | | 10,202,851 | |
17 OPPENHEIMER PORTFOLIO SERIES MODERATE INVESTOR FUND
STATEMENT OF
OPERATIONSContinued
| | | | |
| |
| Expenses (Continued) | | | | |
| Less waivers and reimbursements of expenses | | $ | (1,121,613) | |
| | | | |
Net expenses | | | 9,081,238 | |
| |
| Net Investment Income | | | 22,680,800 | |
| |
| Realized and Unrealized Gain (Loss) | | | | |
| Net realized gain on: | | | | |
| |
| Investment transactions in affiliated companies | | | 28,782,010 | |
| Distributions received from affiliate companies | | | 50,790,379 | |
| |
| |
| Net realized gain (loss) allocated from: | | | | |
| |
| Oppenheimer Master Event-Linked Bond Fund, LLC | | | (641,418) | |
| |
| Oppenheimer Master Inflation Protected Securities Fund, LLC | | | (1,393,833) | |
| |
| Oppenheimer Master Loan Fund, LLC | | | 400,145 | |
| | | | |
| Net realized gain | | | 77,937,283 | |
| |
| Net change in unrealized appreciation/(depreciation) on investment transactions | | | (178,856,733) | |
| |
| |
| Net change in unrealized appreciation/(depreciation) allocated from: | | | | |
| |
| Oppenheimer Master Event-Linked Bond Fund, LLC | | | (682,230) | |
| |
| Oppenheimer Master Inflation Protected Securities Fund, LLC | | | (154,904) | |
| |
| Oppenheimer Master Loan Fund, LLC | | | (2,852,027) | |
| | | | |
| |
| Net change in unrealized appreciation/(depreciation) | | | (182,545,894) | |
|
| |
| Net Decrease in Net Assets Resulting from Operations | | $ | (81,927,811) | |
| | | | |
1. The Fund invests in certain affiliated mutual funds that expect to be treated as partnerships for tax purposes. See Note 4 of the accompanying Notes.
2.Effective June 1, 2018, all Class B shares converted to Class A shares.
See accompanying Notes to Financial Statements.
18 OPPENHEIMER PORTFOLIO SERIES MODERATE INVESTOR FUND
STATEMENTS OF CHANGES IN NET ASSETS
| | | | | | | | |
| | | Year Ended | | Year Ended | |
| | | January 31, 2019 | | January 31, 20181 | |
| |
| Operations | | | | | | | | |
| Net investment income | | $ | 22,680,800 | | | $ | 16,225,028 | |
| |
| Net realized gain | | | 77,937,283 | | | | 82,991,709 | |
| |
| Net change in unrealized appreciation/(depreciation) | | | (182,545,894 | ) | | | 149,575,392 | |
| | | | |
| Net increase (decrease) in net assets resulting from operations | | | (81,927,811 | ) | | | 248,792,129 | |
|
| |
| Dividends and/or Distributions to Shareholders | | | | | | | | |
| Dividends and distributions declared: | | | | | | | | |
| Class A | | | (29,193,711 | ) | | | (20,616,889) | |
| Class B2 | | | — | | | | — | |
| Class C | | | (7,444,350 | ) | | | (4,479,933) | |
| Class R | | | (2,967,500 | ) | | | (1,913,694) | |
| Class Y | | | (429,520 | ) | | | (348,945) | |
| | | | |
| Total dividends and distributions declared | | | (40,035,081 | ) | | | (27,359,461) | |
|
| |
| Beneficial Interest Transactions | | | | | | | | |
| Net increase (decrease) in net assets resulting from beneficial interest transactions: | | | | | | | | |
| Class A | | | (48,223,970 | ) | | | (30,489,140) | |
| Class B2 | | | (6,160,529 | ) | | | (19,057,811) | |
| Class C | | | (21,711,027 | ) | | | (27,410,543) | |
| Class R | | | 1,510,659 | | | | 2,568,594 | |
| Class Y | | | (844,964 | ) | | | 6,410,566 | |
| | | | |
| Total beneficial interest transactions | | | (75,429,831 | ) | | | (67,978,334) | |
|
| |
| Net Assets | | | | | | | | |
| Total increase (decrease) | | | (197,392,723 | ) | | | 153,454,334 | |
| |
| Beginning of period | | | 1,726,340,484 | | | | 1,572,886,150 | |
| | | | |
| End of period | | $ | 1,528,947,761 | | | $ | 1,726,340,484 | |
| | | | |
1. Prior period amounts have been conformed to current year presentation. See Notes to Consolidated Financial Statements, Note 2– New Accounting Pronouncements for further details.
2. Effective June 1, 2018, all Class B shares converted to Class A shares.
See accompanying Notes to Financial Statements.
19 OPPENHEIMER PORTFOLIO SERIES MODERATE INVESTOR FUND
FINANCIAL HIGHLIGHTS
| | | | | | | | | | | | | | | | | | | | |
| Class A | | Year Ended
January 31,
2019 | | | Year Ended
January 31,
2018 | | | Year Ended
January 31,
2017 | | | Year Ended
January 29,
20161 | | | Year Ended
January 30,
20151 | |
| |
| Per Share Operating Data | | | | | | | | | | | | | | | | | | | | |
| Net asset value, beginning of period | | | $12.66 | | | | $11.06 | | | | $10.13 | | | | $10.66 | | | | $10.23 | |
| |
| Income (loss) from investment operations: | | | | | | | | | | | | | | | | | | | | |
| Net investment income2 | | | 0.20 | | | | 0.14 | | | | 0.18 | | | | 0.12 | | | | 0.14 | |
| Net realized and unrealized gain (loss) | | | (0.80) | | | | 1.69 | | | | 0.93 | | | | (0.57) | | | | 0.54 | |
| | | | |
| Total from investment operations | | | (0.60) | | | | 1.83 | | | | 1.11 | | | | (0.45) | | | | 0.68 | |
| |
| Dividends and/or distributions to shareholders: | | | | | | | | | | | | | | | | | | | | |
| Dividends from net investment income | | | (0.21) | | | | (0.23) | | | | (0.18) | | | | (0.08) | | | | (0.25) | |
| Distributions from net realized gain | | | (0.13) | | | | 0.00 | | | | 0.00 | | | | 0.00 | | | | 0.00 | |
| | | | |
| Total dividends and/or distributions to shareholders | | | (0.34) | | | | (0.23) | | | | (0.18) | | | | (0.08) | | | | (0.25) | |
| |
| Net asset value, end of period | | | $11.72 | | | | $12.66 | | | | $11.06 | | | | $10.13 | | | | $10.66 | |
| | | | |
|
| |
| Total Return, at Net Asset Value3 | | | (4.59)% | | | | 16.59% | | | | 10.95% | | | | (4.24)% | | | | 6.67% | |
|
| |
| Ratios/Supplemental Data | | | | | | | | | | | | | | | | | | | | |
| Net assets, end of period (in thousands) | | | $1,037,833 | | | | $1,169,055 | | | | $1,050,230 | | | | $965,539 | | | | $989,811 | |
| |
| Average net assets (in thousands) | | | $1,088,101 | | | | $1,102,710 | | | | $1,019,024 | | | | $1,016,035 | | | | $962,358 | |
| |
| Ratios to average net assets:4,5 | | | | | | | | | | | | | | | | | | | | |
| Net investment income | | | 1.61% | | | | 1.20% | | | | 1.63% | | | | 1.15% | | | | 1.34% | |
| Expenses excluding specific expenses listed below | | | 0.48% | | | | 0.49% | | | | 0.51% | | | | 0.50% | | | | 0.50% | |
| Interest and fees from borrowings | | | 0.00% | | | | 0.00% | | | | 0.00%6 | | | | 0.00%6 | | | | 0.00% | |
| | | | |
| Total expenses7 | | | 0.48% | | | | 0.49% | | | | 0.51% | | | | 0.50% | | | | 0.50% | |
| Expenses after payments, waivers and/or reimbursements and reduction to custodian expenses | | | 0.41% | | | | 0.41% | | | | 0.44% | | | | 0.43% | | | | 0.43% | |
| |
| Portfolio turnover rate | | | 40% | | | | 6% | | | | 7% | | | | 5% | | | | 14% | |
1. Represents the last business day of the Fund’s reporting period.
2. Per share amounts calculated based on the average shares outstanding during the period.
3. Assumes an initial investment on the business day before the first day of the fiscal period, with all dividends and distributions reinvested in additional shares on the reinvestment date, and redemption at the net asset value calculated on the last business day of the fiscal period. Sales charges are not reflected in the total returns. Total returns are not annualized for periods less than one full year. Returns do not reflect the deduction of taxes that a shareholder would pay on fund distributions or the redemption of fund shares.
4. Annualized for periods less than one full year.
5. Includes the Fund’s share of the allocated expenses and/or net investment income from the master funds.
6. Less than 0.005%.
7. Total expenses including indirect expenses from affiliated fund fees and expenses were as follows:
| | | | | | |
| | | | | | |
| | | | | | |
Year Ended January 31, 2019 | | | 1.05 | % |
Year Ended January 31, 2018 | | | 1.07 | % |
Year Ended January 31, 2017 | | | 1.10 | % |
Year Ended January 29, 2016 | | | 1.07 | % |
Year Ended January 30, 2015 | | | 1.08 | % |
See accompanying Notes to Financial Statements.
20 OPPENHEIMER PORTFOLIO SERIES MODERATE INVESTOR FUND
| | | | | | | | | | | | | | | | | | | | |
| Class C | | Year Ended
January 31,
2019 | | | Year Ended
January 31,
2018 | | | Year Ended
January 31,
2017 | | | Year Ended
January 29,
20161 | | | Year Ended
January 30,
20151 | |
| |
| Per Share Operating Data | | | | | | | | | | | | | | | | | | | | |
| Net asset value, beginning of period | | | $12.41 | | | | $10.85 | | | | $9.94 | | | | $10.46 | | | | $10.04 | |
| |
| Income (loss) from investment operations: | | | | | | | | | | | | | | | | | | | | |
| Net investment income2 | | | 0.10 | | | | 0.05 | | | | 0.09 | | | | 0.04 | | | | 0.06 | |
| Net realized and unrealized gain (loss) | | | (0.78) | | | | 1.65 | | | | 0.91 | | | | (0.56) | | | | 0.54 | |
| | | | |
| Total from investment operations | | | (0.68) | | | | 1.70 | | | | 1.00 | | | | (0.52) | | | | 0.60 | |
| |
| Dividends and/or distributions to shareholders: | | | | | | | | | | | | | | | | | | | | |
| Dividends from net investment income | | | (0.11) | | | | (0.14) | | | | (0.09) | | | | (0.00)3 | | | | (0.18) | |
| Distributions from net realized gain | | | (0.13) | | | | 0.00 | | | | 0.00 | | | | 0.00 | | | | 0.00 | |
| | | | |
| Total dividends and/or distributions to shareholders | | | (0.24) | | | | (0.14) | | | | (0.09) | | | | (0.00)3 | | | | (0.18) | |
| |
| Net asset value, end of period | | | $11.49 | | | | $12.41 | | | | $10.85 | | | | $9.94 | | | | $10.46 | |
| | | | |
|
| |
| Total Return, at Net Asset Value4 | | | (5.33)% | | | | 15.69% | | | | 10.12% | | | | (4.96)% | | | | 5.93% | |
|
| |
| Ratios/Supplemental Data | | | | | | | | | | | | | | | | | | | | |
| Net assets, end of period (in thousands) | | | $358,746 | | | | $409,418 | | | | $383,848 | | | | $370,818 | | | | $388,409 | |
| |
| Average net assets (in thousands) | | | $379,039 | | | | $392,056 | | | | $384,610 | | | | $393,916 | | | | $383,852 | |
| |
| Ratios to average net assets:5,6 | | | | | | | | | | | | | | | | | | | | |
| Net investment income | | | 0.86% | | | | 0.43% | | | | 0.87% | | | | 0.42% | | | | 0.57% | |
| Expenses excluding specific expenses listed below | | | 1.24% | | | | 1.25% | | | | 1.26% | | | | 1.25% | | | | 1.25% | |
| Interest and fees from borrowings | | | 0.00% | | | | 0.00% | | | | 0.00%7 | | | | 0.00%7 | | | | 0.00% | |
| | | | |
| Total expenses8 | | | 1.24% | | | | 1.25% | | | | 1.26% | | | | 1.25% | | | | 1.25% | |
| Expenses after payments, waivers and/or reimbursements and reduction to custodian expenses | | | 1.17% | | | | 1.16% | | | | 1.19% | | | | 1.18% | | | | 1.18% | |
| |
| Portfolio turnover rate | | | 40% | | | | 6% | | | | 7% | | | | 5% | | | | 14% | |
1. Represents the last business day of the Fund’s reporting period.
2. Per share amounts calculated based on the average shares outstanding during the period.
3. Less than $0.005 per share.
4. Assumes an initial investment on the business day before the first day of the fiscal period, with all dividends and distributions reinvested in additional shares on the reinvestment date, and redemption at the net asset value calculated on the last business day of the fiscal period. Sales charges are not reflected in the total returns. Total returns are not annualized for periods less than one full year. Returns do not reflect the deduction of taxes that a shareholder would pay on fund distributions or the redemption of fund shares.
5. Annualized for periods less than one full year.
6. Includes the Fund’s share of the allocated expenses and/or net investment income from the master funds.
7. Less than 0.005%.
8. Total expenses including indirect expenses from affiliated fund fees and expenses were as follows:
| | | | | | |
| | | | | | |
Year Ended January 31, 2019 | | | 1.81 | % |
Year Ended January 31, 2018 | | | 1.83 | % |
Year Ended January 31, 2017 | | | 1.85 | % |
Year Ended January 29, 2016 | | | 1.82 | % |
Year Ended January 30, 2015 | | | 1.83 | % |
See accompanying Notes to Financial Statements.
21 OPPENHEIMER PORTFOLIO SERIES MODERATE INVESTOR FUND
FINANCIAL HIGHLIGHTSContinued
| | | | | | | | | | | | | | | | | | | | |
| Class R | | Year Ended
January 31,
2019 | | | Year Ended
January 31,
2018 | | | Year Ended
January 31,
2017 | | | Year Ended
January 29,
20161 | | | Year Ended
January 30,
20151 | |
| |
| Per Share Operating Data | | | | | | | | | | | | | | | | | | | | |
| Net asset value, beginning of period | | | $12.59 | | | | $11.00 | | | | $10.08 | | | | $10.60 | | | | $10.17 | |
| |
| Income (loss) from investment operations: | | | | | | | | | | | | | | | | | | | | |
| Net investment income2 | | | 0.16 | | | | 0.11 | | | | 0.15 | | | | 0.10 | | | | 0.11 | |
| Net realized and unrealized gain (loss) | | | (0.79) | | | | 1.68 | | | | 0.92 | | | | (0.57) | | | | 0.54 | |
| | | | |
| Total from investment operations | | | (0.63) | | | | 1.79 | | | | 1.07 | | | | (0.47) | | | | 0.65 | |
| |
| Dividends and/or distributions to shareholders: | | | | | | | | | | | | | | | | | | | | |
| Dividends from net investment income | | | (0.18) | | | | (0.20) | | | | (0.15) | | | | (0.05) | | | | (0.22) | |
| Distributions from net realized gain | | | (0.13) | | | | 0.00 | | | | 0.00 | | | | 0.00 | | | | 0.00 | |
| | | | |
| Total dividends and/or distributions to shareholders | | | (0.31) | | | | (0.20) | | | | (0.15) | | | | (0.05) | | | | (0.22) | |
| |
| Net asset value, end of period | | | $11.65 | | | | $12.59 | | | | $11.00 | | | | $10.08 | | | | $10.60 | |
| | | | |
|
| |
| Total Return, at Net Asset Value3 | | | (4.86)% | | | | 16.33% | | | | 10.64% | | | | (4.45)% | | | | 6.40% | |
|
| |
| Ratios/Supplemental Data | | | | | | | | | | | | | | | | | | | | |
| Net assets, end of period (in thousands) | | | $116,637 | | | | $123,884 | | | | $105,976 | | | | $92,429 | | | | $106,271 | |
| |
| Average net assets (in thousands) | | | $117,767 | | | | $113,239 | | | | $100,425 | | | | $103,861 | | | | $109,830 | |
| |
| Ratios to average net assets:4,5 | | | | | | | | | | | | | | | | | | | | |
| Net investment income | | | 1.36% | | | | 0.96% | | | | 1.38% | | | | 0.97% | | | | 1.02% | |
| Expenses excluding specific expenses listed below | | | 0.73% | | | | 0.74% | | | | 0.76% | | | | 0.76% | | | | 0.75% | |
| Interest and fees from borrowings | | | 0.00% | | | | 0.00% | | | | 0.00%6 | | | | 0.00%6 | | | | 0.00% | |
| | | | |
| Total expenses7 | | | 0.73% | | | | 0.74% | | | | 0.76% | | | | 0.76% | | | | 0.75% | |
| Expenses after payments, waivers and/or reimbursements and reduction to custodian expenses | | | 0.66% | | | | 0.66% | | | | 0.69% | | | | 0.69% | | | | 0.68% | |
| |
| Portfolio turnover rate | | | 40% | | | | 6% | | | | 7% | | | | 5% | | | | 14% | |
1. Represents the last business day of the Fund’s reporting period.
2. Per share amounts calculated based on the average shares outstanding during the period.
3. Assumes an initial investment on the business day before the first day of the fiscal period, with all dividends and distributions reinvested in additional shares on the reinvestment date, and redemption at the net asset value calculated on the last business day of the fiscal period. Sales charges are not reflected in the total returns. Total returns are not annualized for periods less than one full year. Returns do not reflect the deduction of taxes that a shareholder would pay on fund distributions or the redemption of fund shares.
4. Annualized for periods less than one full year.
5. Includes the Fund’s share of the allocated expenses and/or net investment income from the master funds.
6. Less than 0.005%.
7. Total expenses including indirect expenses from affiliated fund fees and expenses were as follows:
| | | | | | |
| | | | | | |
Year Ended January 31, 2019 | | | 1.30 | % |
Year Ended January 31, 2018 | | | 1.32 | % |
Year Ended January 31, 2017 | | | 1.35 | % |
Year Ended January 29, 2016 | | | 1.33 | % |
Year Ended January 30, 2015 | | | 1.33 | % |
See accompanying Notes to Financial Statements.
22 OPPENHEIMER PORTFOLIO SERIES MODERATE INVESTOR FUND
| | | | | | | | | | | | | | | | | | | | |
| Class Y | | Year Ended
January 31,
2019 | | | Year Ended
January 31,
2018 | | | Year Ended
January 31,
2017 | | | Year Ended
January 29,
20161 | | | Year Ended
January 30,
20151 | |
| |
| Per Share Operating Data | | | | | | | | | | | | | | | | | | | | |
| Net asset value, beginning of period | | | $12.73 | | | | $11.12 | | | | $10.19 | | | | $10.72 | | | | $10.28 | |
| |
| Income (loss) from investment operations: | | | | | | | | | | | | | | | | | | | | |
| Net investment income2 | | | 0.23 | | | | 0.20 | | | | 0.21 | | | | 0.17 | | | | 0.15 | |
| Net realized and unrealized gain (loss) | | | (0.82) | | | | 1.67 | | | | 0.92 | | | | (0.59) | | | | 0.57 | |
| | | | |
| Total from investment operations | | | (0.59) | | | | 1.87 | | | | 1.13 | | | | (0.42) | | | | 0.72 | |
| |
| Dividends and/or distributions to shareholders: | | | | | | | | | | | | | | | | | | | | |
| Dividends from net investment income | | | (0.23) | | | | (0.26) | | | | (0.20) | | | | (0.11) | | | | (0.28) | |
| Distributions from net realized gain | | | (0.13) | | | | 0.00 | | | | 0.00 | | | | 0.00 | | | | 0.00 | |
| | | | |
| Total dividends and/or distributions to shareholders | | | (0.36) | | | | (0.26) | | | | (0.20) | | | | (0.11) | | | | (0.28) | |
| |
| Net asset value, end of period | | | $11.78 | | | | $12.73 | | | | $11.12 | | | | $10.19 | | | | $10.72 | |
| | | | |
|
| |
| Total Return, at Net Asset Value3 | | | (4.41)% | | | | 16.91% | | | | 11.16% | | | | (3.97)% | | | | 6.95% | |
|
| |
| Ratios/Supplemental Data | | | | | | | | | | | | | | | | | | | | |
| Net assets, end of period (in thousands) | | | $15,732 | | | | $17,618 | | | | $9,343 | | | | $9,499 | | | | $9,678 | |
| |
| Average net assets (in thousands) | | | $15,895 | | | | $13,977 | | | | $7,850 | | | | $9,416 | | | | $10,303 | |
| |
| Ratios to average net assets:4,5 | | | | | | | | | | | | | | | | | | | | |
| Net investment income | | | 1.85% | | | | 1.63% | | | | 1.94% | | | | 1.61% | | | | 1.41% | |
| Expenses excluding specific expenses listed below | | | 0.24% | | | | 0.25% | | | | 0.26% | | | | 0.26% | | | | 0.25% | |
| Interest and fees from borrowings | | | 0.00% | | | | 0.00% | | | | 0.00%6 | | | | 0.00%6 | | | | 0.00% | |
| | | | |
| Total expenses7 | | | 0.24% | | | | 0.25% | | | | 0.26% | | | | 0.26% | | | | 0.25% | |
| Expenses after payments, waivers and/or reimbursements and reduction to custodian expenses | | | 0.17% | | | | 0.17% | | | | 0.19% | | | | 0.19% | | | | 0.19% | |
| |
| Portfolio turnover rate | | | 40% | | | | 6% | | | | 7% | | | | 5% | | | | 14% | |
1. Represents the last business day of the Fund’s reporting period.
2. Per share amounts calculated based on the average shares outstanding during the period.
3. Assumes an initial investment on the business day before the first day of the fiscal period, with all dividends and distributions reinvested in additional shares on the reinvestment date, and redemption at the net asset value calculated on the last business day of the fiscal period. Sales charges are not reflected in the total returns. Total returns are not annualized for periods less than one full year. Returns do not reflect the deduction of taxes that a shareholder would pay on fund distributions or the redemption of fund shares.
4. Annualized for periods less than one full year.
5. Includes the Fund’s share of the allocated expenses and/or net investment income from the master funds.
6. Less than 0.005%.
7. Total expenses including indirect expenses from affiliated fund fees and expenses were as follows:
| | | | | | |
| | | | | | |
Year Ended January 31, 2019 | | | 0.81 | % |
Year Ended January 31, 2018 | | | 0.83 | % |
Year Ended January 31, 2017 | | | 0.85 | % |
Year Ended January 29, 2016 | | | 0.83 | % |
Year Ended January 30, 2015 | | | 0.83 | % |
See accompanying Notes to Financial Statements.
23 OPPENHEIMER PORTFOLIO SERIES MODERATE INVESTOR FUND
NOTES TO FINANCIAL STATEMENTSJanuary 31, 2019
1. Organization
Oppenheimer Portfolio Series (the “Trust”) is registered under the Investment Company Act of 1940 (“1940 Act”), as amended, as a diversifiedopen-end management investment company. Moderate Investor Fund (the “Fund”) is a series of the Trust whose investment objective is to seek total return. The Fund normally invests in a diversified portfolio of Oppenheimer mutual funds (individually, an “Underlying Fund” and collectively, the “Underlying Funds”). The Fund’s investment adviser is OFI Global Asset Management, Inc. (“OFI Global” or the “Manager”), a wholly-owned subsidiary of OppenheimerFunds, Inc. (“OFI” or the“Sub-Adviser”). The Manager has entered into asub-advisory agreement with OFI.
The Fund offers Class A, Class C, Class R and Class Y shares, and previously offered Class B shares for new purchase through June 29, 2012. Subsequent to that date, no new purchases of Class B shares were permitted. Reinvestment of dividend and/or capital gain distributions and exchanges of Class B shares into and from other Oppenheimer funds were permitted through May 31, 2018. Effective June 1, 2018 (the “Conversion Date”), all Class B shares converted to Class A shares. Class A shares are sold at their offering price, which is normally net asset value plus afront-end sales charge. Class C and Class R shares are sold, and Class B shares were sold, without afront-end sales charge but may be subject to a contingent deferred sales charge (“CDSC”). Class R shares are sold only through retirement plans. Retirement plans that offer Class R shares may impose charges on those accounts. Class Y shares are sold to certain institutional investors or intermediaries without either afront-end sales charge or a CDSC, however, the intermediaries may impose charges on their accountholders who beneficially own Class Y shares. All classes of shares have identical rights and voting privileges with respect to the Fund in general and exclusive voting rights on matters that affect that class alone. Earnings, net assets and net asset value per share may differ due to each class having its own expenses, such as transfer and shareholder servicing agent fees and shareholder communications, directly attributable to that class. Class A, C and R shares have, and Class B shares had, separate distribution and/or service plans under which they pay, and Class B shares paid, fees. Class Y shares do not pay such fees. Previously issued Class B shares automatically converted to Class A shares 72 months after the date of purchase.
The following is a summary of significant accounting policies followed in the Fund’s preparation of financial statements in accordance with accounting principles generally accepted in the United States (“U.S. GAAP”).
2. Significant Accounting Policies
Security Valuation.All investments in securities are recorded at their estimated fair value, as described in Note 3.
Allocation of Income, Expenses, Gains and Losses.Income, expenses (other than those attributable to a specific class), gains and losses are allocated on a daily basis to each class of shares based upon the relative proportion of net assets represented by such class. Operating expenses directly attributable to a specific class are charged against the operations of that
24 OPPENHEIMER PORTFOLIO SERIES MODERATE INVESTOR FUND
2. Significant Accounting Policies (Continued)
class.
Dividends and Distributions to Shareholders. Dividends and distributions to shareholders, which are determined in accordance with income tax regulations and may differ from U.S. GAAP, are recorded on theex-dividend date. Income and capital gain distributions, if any, are declared and paid annually or at other times as determined necessary by the Manager.
Investment Income.Dividend distributions received from the Underlying Funds are recorded on theex-dividend date. Upon receipt of notification from an Underlying Fund, and subsequent to theex-dividend date, some of the dividend income originally recorded by the Fund may be reclassified as a tax return of capital by reducing the cost basis of the Underlying Fund and/or increasing the realized gain on sales of investments in the Underlying Fund.
Custodian Fees. “Custodian fees and expenses” in the Statement of Operations may include interest expense incurred by the Fund on any cash overdrafts of its custodian account during the period. Such cash overdrafts may result from the effects of failed trades in portfolio securities and from cash outflows resulting from unanticipated shareholder redemption activity. The Fund pays interest to its custodian on such cash overdraft at a rate equal to the Prime Rate plus 0.35%. The “Reduction to custodian expenses” line item, if applicable, represents earnings on cash balances maintained by the Fund during the period. Such interest expense and other custodian fees may be paid with these earnings.
Security Transactions. Security transactions are recorded on the trade date. Realized gains and losses on securities sold are determined on the basis of identified cost.
Indemnifications.The Fund’s organizational documents provide current and former Trustees and officers with a limited indemnification against liabilities arising in connection with the performance of their duties to the Fund. In the normal course of business, the Fund may also enter into contracts that provide general indemnifications. The Fund’s maximum exposure under these arrangements is unknown as this would be dependent on future claims that may be made against the Fund. The risk of material loss from such claims is considered remote.
Federal Taxes.The Fund intends to comply with provisions of the Internal Revenue Code applicable to regulated investment companies and to distribute substantially all of its investment company taxable income, including any net realized gain on investments not offset by capital loss carryforwards, if any, to shareholders. Therefore, no federal income or excise tax provision is required. The Fund files income tax returns in U.S. federal and applicable state jurisdictions. The statute of limitations on the Fund’s tax return filings generally remains open for the three preceding fiscal reporting period ends. The Fund has analyzed its tax positions for the fiscal year ended January 31, 2019, including open tax years, and does not believe there are any uncertain tax positions requiring recognition in the Fund’s financial statements.
25 OPPENHEIMER PORTFOLIO SERIES MODERATE INVESTOR FUND
NOTES TO FINANCIAL STATEMENTSContinued
2. Significant Accounting Policies (Continued)
The tax components of capital shown in the following table represent distribution requirements the Fund must satisfy under the income tax regulations, losses the Fund may be able to offset against income and gains realized in future years and unrealized appreciation or depreciation of securities and other investments for federal income tax purposes.
| | | | | | | | | | | | |
Undistributed Net Investment Income | | Undistributed
Long-Term
Gain | | | Accumulated
Loss
Carryforward1,2 | | | Net Unrealized
Appreciation
Based on cost of
Securities and
Other Investments
for Federal Income
Tax Purposes | |
| |
| $12,804,987 | | | $66,612,634 | | | | $— | | | | $133,809,998 | |
1. During the reporting period, the Fund did not utilize any capital loss carryforward.
2.During the previous reporting period, the Fund utilized $51,978,404 of capital loss carryforward to offset capital gains realized in that fiscal year.
Net investment income (loss) and net realized gain (loss) may differ for financial statement and tax purposes. The character of dividends and distributions made during the fiscal year from net investment income or net realized gains are determined in accordance with federal income tax requirements, which may differ from the character of net investment income or net realized gains presented in those financial statements in accordance with U.S. GAAP. Also, due to timing of dividends and distributions, the fiscal year in which amounts are distributed may differ from the fiscal year in which the income or net realized gain was recorded by the Fund.
Accordingly, the following amounts have been reclassified for the reporting period. Net assets of the Fund were unaffected by the reclassifications.
| | | | |
Increase toPaid-in Capital | | Reduction to
Accumulated Net
Earnings3 | |
| |
| $6,305,692 | | | $6,305,692 | |
3. $6,304,704, all of which was long-term capital gain, was distributed in connection with Fund share redemptions.
The tax character of distributions paid during the reporting periods:
| | | | | | | | |
| | | Year Ended
January 31, 2019 | | | Year Ended
January 31, 2018 | |
| |
| Distributions paid from: | | | | | | | | |
| Ordinary income | | $ | 23,328,141 | | | $ | 27,359,461 | |
Long-term capital gain | | | 16,706,940 | | | | — | |
| | | | |
Total | | $ | 40,035,081 | | | $ | 27,359,461 | |
| | | | |
The aggregate cost of securities and other investments and the composition of unrealized appreciation and depreciation of securities and other investments for federal income tax purposes at period end are noted in the following table. The primary difference between
26 OPPENHEIMER PORTFOLIO SERIES MODERATE INVESTOR FUND
2. Significant Accounting Policies (Continued)
book and tax appreciation or depreciation of securities and other investments, if applicable, is attributable to the tax deferral of losses or tax realization of financial statement unrealized gain or loss.
| | | | |
| Federal tax cost of securities | | $ | 1,393,054,397 | |
| | | | |
| Gross unrealized appreciation | | $ | 146,741,051 | |
| Gross unrealized depreciation | | | (12,931,053) | |
| | | | |
| Net unrealized appreciation | | $ | 133,809,998 | |
| | | | |
Use of Estimates. The preparation of financial statements in conformity with U.S. GAAP requires management to make estimates and assumptions that affect the reported amounts of assets and liabilities and disclosure of contingent assets and liabilities at the date of the financial statements and the reported amounts of increases and decreases in net assets from operations during the reporting period. Actual results could differ from those estimates.
New Accounting Pronouncements. In March 2017, Financial Accounting Standards Board (“FASB”) issued Accounting Standards Update (“ASU”), ASU2017-08. This provides guidance related to the amortization period for certain purchased callable debt securities held at a premium. The ASU is effective for annual periods beginning after December 15, 2018, and interim periods within those annual periods. The Manager has evaluated the impacts of these changes on the financial statements and there are no material impacts.
During August 2018, the Securities and Exchange Commission (the “SEC”) issued Final Rule ReleaseNo. 33-10532 (the “Rule”), Disclosure Update and Simplification. The rule amends certain financial statement disclosure requirements to conform to U.S. GAAP. The amendments to Rule6-04.17 of RegulationS-X (balance sheet) remove the requirement to separately state the book basis components of net assets: undistributed (over-distribution of) net investment income (“UNII”), accumulated undistributed net realized gains (losses), and net unrealized appreciation (depreciation) at the balance sheet date. Instead, consistent with U.S. GAAP, funds will be required to disclose total distributable earnings. The amendments to Rule6-09 of RegulationS-X (statement of changes in net assets) remove the requirement to separately state the sources of distributions paid. Instead, consistent with U.S. GAAP, funds will be required to disclose the total amount of distributions paid, except that any tax return of capital must be separately disclosed. The amendments also remove the requirement to parenthetically state the book basis amount of UNII on the statement of changes in net assets. The requirements of the Rule were effective November 5, 2018, and the Fund’s Statement of Assets and Liabilities and Statement of Changes in Net Assets for the current reporting period have been modified accordingly. In addition, certain amounts within the Fund’s Statement of Changes in Net Assets for the prior fiscal period have been modified to conform to the Rule.
3. Securities Valuation
The Fund calculates the net asset value of its shares based upon the net asset value of the applicable investment companies. For each investment company, the net asset value per
27 OPPENHEIMER PORTFOLIO SERIES MODERATE INVESTOR FUND
NOTES TO FINANCIAL STATEMENTSContinued
3. Securities Valuation (Continued)
share for a class of shares is determined as of 4:00 P.M. Eastern Time, on each day the New York Stock Exchange (the “Exchange” or “NYSE”) is open for trading, except in the case of a scheduled early closing of the Exchange, in which case the Fund will calculate net asset value of the shares as of the scheduled early closing time of the Exchange. This is calculated by dividing the value of the investment company’s net assets attributable to that class by the number of outstanding shares of that class on that day.
The Fund’s Board has adopted procedures for the valuation of the Fund’s securities and has delegated theday-to-day responsibility for valuation determinations under those procedures to the Manager. The Manager has established a Valuation Committee which is responsible for determining a fair valuation for any security for which market quotations are not readily available. The Valuation Committee’s fair valuation determinations are subject to review, approval and ratification by the Fund’s Board at least quarterly or more frequently, if necessary.
Valuations Methods and Inputs
To determine their net asset values, the Underlying Funds’ assets are valued primarily on the basis of current market quotations as generally supplied by third party portfolio pricing services or by dealers. Such market quotations are typically based on unadjusted quoted prices in active markets for identical securities or other observable market inputs.
Securities for which market quotations are not readily available, or when a significant event has occurred that would materially affect the value of the security, are fair valued either (i) by a standardized fair valuation methodology applicable to the security type or the significant event as previously approved by the Valuation Committee and the Fund’s Board or (ii) as determined in good faith by the Manager’s Valuation Committee. The Valuation Committee considers all relevant facts that are reasonably available, through either public information or information available to the Manager, when determining the fair value of a security. The methodologies used for valuing securities are not necessarily an indication of the risks associated with investing in those Underlying Funds.
Classifications
Each investment asset or liability of the Fund is assigned a level at measurement date based on the significance and source of the inputs to its valuation. Various data inputs may be used in determining the value of each of the Fund’s investments as of the reporting period end. These data inputs are categorized in the following hierarchy under applicable financial accounting standards:
1) Level1-unadjusted quoted prices in active markets for identical assets or liabilities (including securities actively traded on a securities exchange)
2) Level2-inputs other than unadjusted quoted prices that are observable for the asset or liability (such as unadjusted quoted prices for similar assets and market corroborated inputs such as interest rates, prepayment speeds, credit risks, etc.)
3) Level3-significant unobservable inputs (including the Manager’s own judgments about assumptions that market participants would use in pricing the asset or liability).
28 OPPENHEIMER PORTFOLIO SERIES MODERATE INVESTOR FUND
3. Securities Valuation (Continued)
The inputs used for valuing securities are not necessarily an indication of the risks associated with investing in those securities.
The Fund classifies each of its investments in investment companies which are publicly offered as Level 1. Investment companies that are not publicly offered, if any, are measured using net asset value and are classified as Level 2 in the fair value hierarchy.
The table below categorizes amounts that are included in the Fund’s Statement of Assets and Liabilities at period end based on valuation input level:
| | | | | | | | | | | | | | | | |
| | | Level 1—
Unadjusted
Quoted Prices | | | Level 2— Other Significant
Observable Inputs | | | Level 3—
Significant
Unobservable
Inputs | | | Value | |
| |
Assets Table | | | | | | | | | | | | | | | | |
Investments, at Value: | | | | | | | | | | | | | | | | |
| Investment Companies | | $ | 1,372,673,873 | | | $ | 154,190,522 | | | $ | — | | | $ | 1,526,864,395 | |
| | | | |
| Total Assets | | $ | 1,372,673,873 | | | $ | 154,190,522 | | | $ | — | | | $ | 1,526,864,395 | |
| | | | |
Forward currency exchange contracts and futures contracts, if any, are reported at their unrealized appreciation/depreciation at measurement date, which represents the change in the contract’s value from trade date. All additional assets and liabilities included in the above table are reported at their market value at measurement date.
For the reporting period, there were no transfers between levels.
4. Investments and Risks
Risks of Investing in the Underlying Funds.The Fund invests in other mutual funds advised by the Manager. The Underlying Funds are registeredopen-end management investment companies under the 1940 Act, as amended. The Manager is the investment adviser of, and theSub-Adviser provides investment and related advisory services to, the Underlying Funds. The Fund’s Investments in Underlying Funds are included in the Statement of Investments. Shares of Underlying Funds are valued at their net asset value per share. As a shareholder, the Fund is subject to its proportional share of the Underlying Funds’ expenses, including their management fee.
Each of the Underlying Funds in which the Fund invests has its own investment risks, and those risks can affect the value of the Fund’s investments and therefore the value of the Fund’s shares. To the extent that the Fund invests more of its assets in one Underlying Fund than in another, the Fund will have greater exposure to the risks of that Underlying Fund.
Investment in Oppenheimer Institutional Government Money Market Fund.The Fund is permitted to invest daily available cash balances in an affiliated money market fund. The Fund may invest the available cash in Class E shares of Oppenheimer Institutional Government Money Market Fund (“IGMMF”) to seek current income while preserving liquidity or for defensive purposes. IGMMF is a registeredopen-end management investment company, regulated as a money market fund under the 1940 Act, as amended. The Manager
29 OPPENHEIMER PORTFOLIO SERIES MODERATE INVESTOR FUND
NOTES TO FINANCIAL STATEMENTSContinued
4. Investments and Risks (Continued)
is the investment adviser of IGMMF, and theSub-Adviser provides investment and related advisory services to IGMMF. When applicable, the Fund’s investment in IGMMF is included in the Statement of Investments. Shares of IGMMF are valued at their net asset value per share. As a shareholder, the Fund is subject to its proportional share of IGMMF’s Class E expenses, including its management fee.
Investment in Oppenheimer Master Funds.Certain Underlying Funds in which the Fund invests are mutual funds registered under the 1940 Act, as amended, that expect to be treated as partnerships for tax purposes, specifically Oppenheimer Master Loan Fund, LLC (“Master Loan”), Oppenheimer Master Event-Linked Bond Fund, LLC (“Master Event-Linked Bond”) and Oppenheimer Master Inflation Protected Securities Fund, LLC (“Master Inflation Protected Securities”) (the “Master Funds”). Each Master Fund has its own investment risks, and those risks can affect the value of the Fund’s investments and therefore the value of the Fund’s shares. To the extent that the Fund invests more of its assets in one Master Fund than in another, the Fund will have greater exposure to the risks of that Master Fund.
The investment objective of Master Loan is to seek income. The investment objective of Master Event-Linked Bond is to seek total return. The investment objective of Master Inflation Protected Securities is to seek total return. The Fund’s investments in the Master Funds are included in the Statement of Investments. The Fund recognizes income and gain/ (loss) on its investments in each Master Fund according to its allocatedpro-rata share, based on its relative proportion of total outstanding Master Fund shares held, of the total net income earned and the net gain/(loss) realized on investments sold by the Master Funds. As a shareholder, the Fund is subject to its proportional share of the Master Funds’ expenses, including their management fee. The Manager will waive fees and/or reimburse Fund expenses in an amount equal to the indirect management fees incurred through the Fund’s investment in the Master Funds. The Fund owns 5.57% of Master Loan, 14.39% of Master Event-Linked Bond and 46.78% of Master Inflation Protected Securities at period end.
5. Market Risk Factors
The Fund’s investments in securities and/or financial derivatives may expose the Fund to various market risk factors:
Commodity Risk. Commodity risk relates to the change in value of commodities or commodity indexes as they relate to increases or decreases in the commodities market. Commodities are physical assets that have tangible properties. Examples of these types of assets are crude oil, heating oil, metals, livestock, and agricultural products.
Credit Risk.Credit risk relates to the ability of the issuer of debt to meet interest and principal payments, or both, as they come due. In general, lower-grade, higher-yield debt securities are subject to credit risk to a greater extent than lower-yield, higher-quality securities.
Equity Risk. Equity risk relates to the change in value of equity securities as they relate to increases or decreases in the general market.
30 OPPENHEIMER PORTFOLIO SERIES MODERATE INVESTOR FUND
5. Market Risk Factors (Continued)
Foreign Exchange Rate Risk. Foreign exchange rate risk relates to the change in the U.S. dollar value of a security held that is denominated in a foreign currency. The U.S. dollar value of a foreign currency denominated security will decrease as the dollar appreciates against the currency, while the U.S. dollar value will increase as the dollar depreciates against the currency.
Interest Rate Risk.Interest rate risk refers to the fluctuations in value of fixed-income securities resulting from the inverse relationship between price and yield. For example, an increase in general interest rates will tend to reduce the market value of already issued fixed-income investments, and a decline in general interest rates will tend to increase their value. In addition, debt securities with longer maturities, which tend to have higher yields, are subject to potentially greater fluctuations in value from changes in interest rates than obligations with shorter maturities.
Volatility Risk.Volatility risk refers to the magnitude of the movement, but not the direction of the movement, in a financial instrument’s price over a defined time period. Large increases or decreases in a financial instrument’s price over a relative time period typically indicate greater volatility risk, while small increases or decreases in its price typically indicate lower volatility risk.
6. Shares of Beneficial Interest
The Fund has authorized an unlimited number of $0.001 par value shares of beneficial interest of each class. Transactions in shares of beneficial interest were as follows:
| | | | | | | | | | | | | | | | |
| | | Year Ended January 31, 2019 | | | Year Ended January 31, 2018 | |
| | | Shares | | | Amount | | | Shares | | | Amount | |
| |
Class A | | | | | | | | | | | | | | | | |
| Sold1 | | | 8,289,502 | | | $ | 100,338,678 | | | | 11,919,071 | | | $ | 140,647,926 | |
| Dividends and/or distributions reinvested | | | 2,624,370 | | | | 28,763,097 | | | | 1,668,411 | | | | 20,337,853 | |
| Redeemed | | | (14,664,045 | ) | | | (177,325,745 | ) | | | (16,207,138 | ) | | | (191,474,919) | |
| | | | |
| Net decrease | | | (3,750,173 | ) | | $ | (48,223,970 | ) | | | (2,619,656 | ) | | $ | (30,489,140) | |
| | | | |
|
| |
Class B | | | | | | | | | | | | | | | | |
| Sold | | | 789 | | | $ | 9,766 | | | | 9,456 | | | $ | 109,719 | |
| Dividends and/or distributions reinvested | | | — | | | | — | | | | — | | | | — | |
| Redeemed1 | | | (501,184 | ) | | | (6,170,295 | ) | | | (1,645,617 | ) | | | (19,167,530) | |
| | | | |
| Net decrease | | | (500,395 | ) | | $ | (6,160,529 | ) | | | (1,636,161 | ) | | $ | (19,057,811) | |
| | | | |
|
| |
Class C | | | | | | | | | | | | | | | | |
| Sold | | | 4,171,781 | | | $ | 49,343,633 | | | | 4,778,797 | | | $ | 55,312,088 | |
| Dividends and/or distributions reinvested | | | 689,202 | | | | 7,415,802 | | | | 372,757 | | | | 4,458,180 | |
| Redeemed | | | (6,622,556 | ) | | | (78,470,462 | ) | | | (7,548,908 | ) | | | (87,180,811) | |
| | | | |
| Net decrease | | | (1,761,573 | ) | | $ | (21,711,027 | ) | | | (2,397,354 | ) | | $ | (27,410,543) | |
| | | | |
31 OPPENHEIMER PORTFOLIO SERIES MODERATE INVESTOR FUND
NOTES TO FINANCIAL STATEMENTSContinued
6. Shares of Beneficial Interest (Continued)
| | | | | | | | | | | | | | | | |
| | | Year Ended January 31, 2019 | | | Year Ended January 31, 2018 | |
| | | Shares | | | Amount | | | Shares | | | Amount | |
| |
Class R | | | | | | | | | | | | | | | | |
| Sold | | | 2,550,765 | | | $ | 30,646,424 | | | | 2,562,059 | | | $ | 30,159,064 | |
| Dividends and/or distributions reinvested | | | 261,334 | | | | 2,845,923 | | | | 150,933 | | | | 1,829,302 | |
| Redeemed | | | (2,638,778 | ) | | | (31,981,688 | ) | | | (2,504,989 | ) | | | (29,419,772) | |
| | | | |
| Net increase | | | 173,321 | | | $ | 1,510,659 | | | | 208,003 | | | $ | 2,568,594 | |
| | | | |
|
| |
Class Y | | | | | | | | | | | | | | | | |
| Sold | | | 601,002 | | | $ | 7,164,319 | | | | 998,810 | | | $ | 11,809,579 | |
| Dividends and/or distributions reinvested | | | 38,944 | | | | 429,166 | | | | 27,637 | | | | 338,547 | |
| Redeemed | | | (688,378 | ) | | | (8,438,449 | ) | | | (482,715 | ) | | | (5,737,560) | |
| | | | |
| Net increase (decrease) | | | (48,432 | ) | | $ | (844,964 | ) | | | 543,732 | | | $ | 6,410,566 | |
| | | | |
1. All outstanding Class B shares converted to Class A shares on June 1, 2018.
7. Purchases and Sales of Securities
The aggregate cost of purchases and proceeds from sales of securities, other than short-term obligations and investments in IGMMF, for the reporting period were as follows:
| | | | | | | | |
| | | Purchases | | | Sales | |
| |
| Investment securities | | $ | 633,349,838 | | | $ | 678,073,359 | |
8. Fees and Other Transactions with Affiliates
Management Fees.Under the investment advisory agreement, the Manager does not charge a management fee, but rather collects indirect management fees from the Fund’s investments in the Underlying Funds. The weighted indirect management fees collected from the Fund’s investment in the Underlying Funds, as a percent of average daily net assets of the Fund for the reporting period was 0.51%. This amount is gross of any waivers or reimbursements of management fees implemented at the Underlying Fund level.
Sub-Adviser Fees.The Manager has retained theSub-Adviser to provide theday-to-day portfolio management of the Fund. Under theSub-Advisory Agreement, the Manager pays theSub-Adviser an annual fee in monthly installments, equal to a percentage of the indirect investment management fee collected by the Manager, which shall be calculated after any investment management fee waivers. The fee paid to theSub-Adviser is paid by the Manager, not by the Fund.
Transfer Agent Fees.OFI Global (the “Transfer Agent”) serves as the transfer and shareholder servicing agent for the Fund. The Fund pays the Transfer Agent a fee based on annual net assets, which shall be calculated after any applicable fee waivers. Fees incurred and average net assets for each class with respect to these services are detailed in the Statement of Operations and Financial Highlights, respectively.
32 OPPENHEIMER PORTFOLIO SERIES MODERATE INVESTOR FUND
8. Fees and Other Transactions with Affiliates (Continued)
Sub-Transfer Agent Fees.The Transfer Agent has retained Shareholder Services, Inc., a wholly-owned subsidiary of OFI (the“Sub-Transfer Agent”), to provide theday-to-day transfer agent and shareholder servicing of the Fund. Under theSub-Transfer Agency Agreement, the Transfer Agent pays theSub-Transfer Agent an annual fee in monthly installments, equal to a percentage of the transfer agent fee collected by the Transfer Agent from the Fund, which shall be calculated after any applicable fee waivers. The fee paid to theSub-Transfer Agent is paid by the Transfer Agent, not by the Fund.
Trustees’ Compensation.The Fund has adopted an unfunded retirement plan (the “Plan”) for the Fund’s Independent Trustees. Benefits are based on years of service and fees paid to each Trustee during their period of service. The Plan was frozen with respect to adding new participants effective December 31, 2006 (the “Freeze Date”) and existing Plan Participants as of the Freeze Date will continue to receive accrued benefits under the Plan. Active Independent Trustees as of the Freeze Date have each elected a distribution method with respect to their benefits under the Plan.
During the reporting period, the Fund’s projected benefit obligations, payments to retired Trustees and accumulated liability were as follows:
| | | | |
| Projected Benefit Obligations Increased | | $ | — | |
| Payments Made to Retired Trustees | | | 2,712 | |
| Accumulated Liability as of January 31, 2019 | | | 20,080 | |
The Fund’s Board of Trustees (“Board”) has adopted a compensation deferral plan for Independent Trustees that enables Trustees to elect to defer receipt of all or a portion of the annual compensation they are entitled to receive from the Fund. For purposes of determining the amount owed to the Trustee under the plan, deferred amounts are treated as though equal dollar amounts had been invested in shares of the Fund or in other Oppenheimer funds selected by the Trustee. The Fund purchases shares of the funds selected for deferral by the Trustee in amounts equal to his or her deemed investment, resulting in a Fund asset equal to the deferred compensation liability. Such assets are included as a component of “Other” within the asset section of the Statement of Assets and Liabilities. Deferral of Trustees’ fees under the plan will not affect the net assets of the Fund and will not materially affect the Fund’s assets, liabilities or net investment income per share. Amounts will be deferred until distributed in accordance with the compensation deferral plan.
Distribution and Service Plan(12b-1) Fees.Under its General Distributor’s Agreement with the Fund, OppenheimerFunds Distributor, Inc. (the “Distributor”) acts as the Fund’s principal underwriter in the continuous public offering of the Fund’s classes of shares.
Service Plan for Class A Shares. The Fund has adopted a Service Plan (the “Plan”) for Class A shares pursuant to Rule12b-1 under the 1940 Act. Under the Plan, the Fund reimburses the Distributor for a portion of its costs incurred for services provided to accounts
33 OPPENHEIMER PORTFOLIO SERIES MODERATE INVESTOR FUND
NOTES TO FINANCIAL STATEMENTSContinued
8. Fees and Other Transactions with Affiliates (Continued)
that hold Class A shares. Reimbursement is made periodically at an annual rate of up to 0.25% of the daily net assets of Class A shares of the Fund. The Distributor currently uses all of those fees to pay dealers, brokers, banks and other financial institutions periodically for providing personal service and maintenance of accounts of their customers that hold Class A shares. Any unreimbursed expenses the Distributor incurs with respect to Class A shares in any fiscal year cannot be recovered in subsequent periods. Fees incurred by the Fund under the Plan are detailed in the Statement of Operations.
Distribution and Service Plans for Class B, Class C and Class R Shares.The Fund has adopted Distribution and Service Plans (the “Plans”) for Class C and Class R shares, and had previously adopted a similar plan for Class B shares, pursuant to Rule12b-1 under the 1940 Act to compensate the Distributor for distributing those share classes, maintaining accounts and providing shareholder services. Under the Plans, the Fund pays the Distributor an annual asset-based sales charge of 0.75% on Class C shares’ daily net assets and 0.25% on Class R shares’ daily net assets. The Fund paid the Distributor an annual asset-based sales charge of 0.75% on Class B shares prior to their Conversion Date. The Fund also pays a service fee under the Plans at an annual rate of 0.25% of daily net assets and previously paid this fee for Class B prior to their Conversion Date. The Plans continue in effect from year to year only if the Fund’s Board of Trustees votes annually to approve their continuance at an in person meeting called for that purpose. Fees incurred by the Fund under the Plans are detailed in the Statement of Operations.
Sales Charges.Front-end sales charges and CDSC do not represent expenses of the Fund. They are deducted from the proceeds of sales of Fund shares prior to investment or from redemption proceeds prior to remittance, as applicable. The sales charges retained by the Distributor from the sale of shares and the CDSC retained by the Distributor on the redemption of shares is shown in the following table for the period indicated.
| | | | | | | | | | | | | | | | | | | | |
| Year Ended | | Class A
Front-End
Sales Charges
Retained by
Distributor | | | Class A
Contingent
Deferred
Sales Charges
Retained by
Distributor | | | Class B
Contingent
Deferred
Sales Charges
Retained by
Distributor1 | | | Class C
Contingent
Deferred
Sales Charges
Retained by
Distributor | | | Class R
Contingent
Deferred
Sales Charges
Retained by
Distributor | |
| |
| January 31, 2019 | | | $544,885 | | | | $360 | | | | $1,024 | | | | $32,252 | | | | $— | |
1. Effective June 1, 2018, all Class B shares converted to Class A shares.
Waivers and Reimbursements of Expenses.The Manager has contractually agreed to waive fees and/or reimburse certain Fund expenses at an annual rate of 0.07% as calculated on the daily net assets of the Fund. This waiver and/or reimbursement is applied after (and in addition to) any other applicable waiver and/or expense reimbursements that may apply, and may not be withdrawn for one year from the date of the Fund’s prospectus, unless approved by the Board. During the reporting period, the Manager waived fees and/or reimbursed the
34 OPPENHEIMER PORTFOLIO SERIES MODERATE INVESTOR FUND
8. Fees and Other Transactions with Affiliates (Continued)
Fund $1,121,613.
9. Pending Acquisition
On October 18, 2018, Massachusetts Mutual Life Insurance Company, an indirect corporate parent of theSub-Adviser and the Manager, announced that it has entered into an agreement whereby Invesco Ltd. (“Invesco”), a global investment management company, will acquire theSub-Adviser (the “Transaction”). In connection with the Transaction, on January 11, 2019, the Fund’s Board unanimously approved an Agreement and Plan of Reorganization (the “Agreement”), which provides for the transfer of the assets and liabilities of the Fund to a corresponding, newly formed fund (the “Acquiring Fund”) in the Invesco family of funds (the “Reorganization”) in exchange for shares of the corresponding Acquiring Fund of equal value to the value of the shares of the Fund as of the close of business on the closing date. Although the Acquiring Fund will be managed by Invesco Advisers, Inc., the Acquiring Fund will, as of the closing date, have the same investment objective and substantially similar principal investment strategies and risks as the Fund. After the Reorganization, Invesco Advisers, Inc. will be the investment adviser to the Acquiring Fund, and the Fund will be liquidated and dissolved under applicable law and terminate its registration under the Investment Company Act of 1940, as amended. The Reorganization is expected to be atax-free reorganization for U.S. federal income tax purposes.
The Reorganization is subject to the approval of shareholders of the Fund. Shareholders of record of the Fund on January 14, 2019 will be entitled to vote on the Reorganization and will receive a combined prospectus and proxy statement describing the Reorganization, the shareholder meeting, and a discussion of the factors the Fund’s Board considered in approving the Agreement. The combined prospectus and proxy statement is expected to be distributed to shareholders of record on or about February 28, 2019. The anticipated date of the shareholder meeting is on or about April 12, 2019.
If shareholders approve the Agreement and certain other closing conditions are satisfied or waived, the Reorganization is expected to close during the second quarter of 2019, or as soon as practicable thereafter. This is subject to change.
35 OPPENHEIMER PORTFOLIO SERIES MODERATE INVESTOR FUND
REPORT OF INDEPENDENT REGISTERED PUBLIC ACCOUNTING FIRM
To the Shareholders of Moderate Investor Fund and Board of Trustees of
Oppenheimer Portfolio Series:
Opinion on the Financial Statements
We have audited the accompanying statement of assets and liabilities of Moderate Investor Fund (the “Fund”), a series of Oppenheimer Portfolio Series, including the statement of investments, as of January 31, 2019, the related statement of operations for the year then ended, the statements of changes in net assets for each of the years in thetwo-year period then ended, and the related notes (collectively, the “financial statements”) and the financial highlights for each of the years in the five-year period then ended. In our opinion, the financial statements and financial highlights present fairly, in all material respects, the financial position of the Fund as of January 31, 2019, the results of its operations for the year then ended, the changes in its net assets for each of the years in thetwo-year period then ended, and the financial highlights for each of the years in the five-year period then ended, in conformity with U.S. generally accepted accounting principles.
Basis for Opinion
These financial statements and financial highlights are the responsibility of the Fund’s management. Our responsibility is to express an opinion on these financial statements and financial highlights based on our audits. We are a public accounting firm registered with the Public Company Accounting Oversight Board (United States) (“PCAOB”) and are required to be independent with respect to the Fund in accordance with the U.S. federal securities laws and the applicable rules and regulations of the Securities and Exchange Commission and the PCAOB.
We conducted our audits in accordance with the standards of the PCAOB. Those standards require that we plan and perform the audit to obtain reasonable assurance about whether the financial statements and financial highlights are free of material misstatement, whether due to error or fraud. Our audits included performing procedures to assess the risks of material misstatement of the financial statements and financial highlights, whether due to error or fraud, and performing procedures that respond to those risks. Such procedures included examining, on a test basis, evidence regarding the amounts and disclosures in the financial statements and financial highlights. Such procedures also included confirmation of securities owned as of January 31, 2019, by correspondence with the transfer agent, or by other appropriate auditing procedures. Our audits also included evaluating the accounting principles used and significant estimates made by management, as well as evaluating the overall presentation of the financial statements and financial highlights. We believe that our audits provide a reasonable basis for our opinion.
KPMGLLP
We have not been able to determine the specific year that we began serving as the auditor of one or more Oppenheimer Funds investment companies, however we are aware that we have served as the auditor of one or more Oppenheimer Funds investment companies since at least 1969.
Denver, Colorado
March 25, 2019
36 OPPENHEIMER PORTFOLIO SERIES MODERATE INVESTOR FUND
FEDERAL INCOME TAX INFORMATIONUnaudited
In early 2019, if applicable, shareholders of record received information regarding all dividends and distributions paid to them by the Fund during calendar year 2018.
Capital gain distributions of $0.12991 per share were paid to Class A, Class C, Class R and Class Y shareholders, respectively, on December 20, 2018. Whether received in stock or in cash, the capital gain distribution should be treated by shareholders as a gain from the sale of the capital assets held for more than one year (long-term capital gains).
Dividends, if any, paid by the Fund during the reporting period which are not designated as capital gain distributions should be multiplied by the maximum amount allowable but not less than 31.86% to arrive at the amount eligible for the corporate dividend-received deduction.
A portion, if any, of the dividends paid by the Fund during the reporting period which are not designated as capital gain distributions are eligible for lower individual income tax rates to the extent that the Fund has received qualified dividend income as stipulated by recent tax legislation. The maximum amount allowable but not less than $14,275,489 of the Fund’s fiscal year taxable income may be eligible for the lower individual income tax rates. In early 2019, shareholders of record received information regarding the percentage of distributions that are eligible for lower individual income tax rates.
Recent tax legislation allows a regulated investment company to designate distributions not designated as capital gain distributions, as either interest related dividends or short-term capital gain dividends, both of which are exempt from the U.S. withholding tax applicable to non U.S. taxpayers. For the reporting period, the maximum amount allowable but not less than $9,960,051 of the ordinary distributions to be paid by the Fund qualifies as an interest related dividend.
The Fund has elected the application of Section 853 of the Internal Revenue Code to permit shareholders to take a federal income tax credit or deduction, at their option, on a per share basis. The maximum amount allowable but not less than $735,369 of foreign income taxes were paid by the Fund during the reporting period. A separate notice will be mailed to each shareholder, which will reflect the proportionate share of such foreign taxes which must be treated by shareholders as gross income for federal income tax purposes.
Gross income of the maximum amount allowable but not less than $3,294,368 was derived from sources within foreign countries or possessions of the United States.
The foregoing information is presented to assist shareholders in reporting distributions received from the Fund to the Internal Revenue Service. Because of the complexity of the federal regulations which may affect your individual tax return and the many variations in state and local tax regulations, we recommend that you consult your tax advisor for specific guidance.
37 OPPENHEIMER PORTFOLIO SERIES MODERATE INVESTOR FUND
BOARD APPROVAL OF THE FUND’S INVESTMENT ADVISORY
ANDSUB-ADVISORY AGREEMENTSUnaudited
The Fund has entered into an investment advisory agreement with OFI Global Asset Management, Inc. (“OFI Global” or the “Adviser”), a wholly-owned subsidiary of OppenheimerFunds, Inc. (“OFI” or the“Sub-Adviser”) (“OFI Global” and “OFI” together the “Managers”) and OFI Global has entered into asub-advisory agreement with OFI whereby OFI provides investmentsub-advisory services to the Fund (collectively, the “Agreements”). Each year, the Board of Trustees (the “Board”), including a majority of the independent Trustees, is required to determine whether to approve the terms of the Agreements and the renewal thereof. The Investment Company Act of 1940, as amended, requires that the Board request and evaluate, and that the Managers provide, such information as may be reasonably necessary to evaluate the terms of the Agreements. The Board employs an independent consultant to prepare a report that provides information, including comparative information that the Board requests for that purpose. In addition toin-person meetings focused on this evaluation, the Board receives information throughout the year regarding Fund services, fees, expenses and performance.
The Managers and the independent consultant provided information to the Board on the following factors: (i) the nature, quality and extent of the Managers’ services, (ii) the comparative investment performance of the Fund and the Managers, (iii) the fees and expenses of the Fund, including comparative fee and expense information, (iv) the profitability of the Managers and their affiliates, including an analysis of the cost of providing services, (v) whether economies of scale are realized as the Fund grows and whether fee levels reflect these economies of scale for Fund investors and (vi) other benefits to the Managers from their relationship with the Fund. The Board was aware that there are alternatives to retaining the Managers.
Outlined below is a summary of the principal information considered by the Board as well as the Board’s conclusions.
Nature, Quality and Extent of Services. The Board considered information about the nature, quality and extent of the services provided to the Fund and information regarding the Managers’ key personnel who provide such services. The Managers’ duties include providing the Fund with the services of theSub-Adviser’s portfolio manager and investment team, who provide research, analysis and other advisory services in regard to the Fund’s investments; and securities trading services. OFI Global is responsible for oversight of third-party service providers; monitoring compliance with applicable Fund policies and procedures and adherence to the Fund’s investment restrictions; risk management; and oversight of theSub-Adviser. OFI Global is also responsible for providing certain administrative services to the Fund. Those services include providing and supervising all administrative and clerical personnel who are necessary in order to provide effective corporate administration for the Fund; compiling and maintaining records with respect to the Fund’s operations; preparing and filing reports required by the U.S. Securities and Exchange Commission; preparing periodic reports regarding the operations of the Fund for its shareholders; preparing proxy materials for shareholder meetings; and preparing the registration statements required by federal and state securities laws for the sale of the Fund’s shares. OFI Global also provides the Fund with office space, facilities and equipment.
38 OPPENHEIMER PORTFOLIO SERIES MODERATE INVESTOR FUND
The Board also considered the quality of the services provided and the quality of the Managers’ resources that are available to the Fund. The Board took account of the fact that theSub-Adviser has over fifty years of experience as an investment adviser and that its assets under management rank it among the top mutual fund managers in the United States. The Board evaluated the Managers’ advisory, administrative, accounting, legal, compliance and risk management services, among other services, and information the Board has received regarding the experience and professional qualifications of the Managers’ key personnel and the size and functions of their staff. In its evaluation of the quality of the portfolio management services provided, the Board considered the experience of Jeffrey Bennett, the portfolio manager for the Fund, and theSub-Adviser’s investment team and analysts. The Board members also considered the totality of their experiences with the Managers as directors or trustees of the Fund and other funds advised by the Managers. The Board considered information regarding the quality of services provided by affiliates of the Managers, which the Board members have become knowledgeable about through their experiences with the Managers and in connection with the review or renewal of the Fund’s service agreements or service providers. The Board concluded, in light of the Managers’ experience, reputation, personnel, operations and resources that the Fund benefits from the services provided under the Agreements.
Investment Performance of the Managers and the Fund. Throughout the year, the Managers provided information on the investment performance of the Fund, the Adviser and theSub-Adviser, including comparative performance information. The Board also reviewed information, prepared by the Managers and by the independent consultant, comparing the Fund’s historical performance to relevant benchmarks or market indices and to the performance of other retail funds in the allocation – 50% to 70% equity category. The Board noted that the Fund’sone-year performance was better than its category median although its three-year, five-year andten-year performance was below its category median.
Fees and Expenses of the Fund. The Board reviewed the fees paid to the Adviser and the other expenses borne by the Fund. The Board noted that the Adviser, not the Fund, pays theSub-Adviser’s fee under thesub-advisory agreement. The Board also considered the comparability of the fees charged and the services provided to the Fund to the fees and services for other clients or accounts advised by the Adviser. The independent consultant provided comparative data in regard to the fees and expenses of the Fund and other retailfront-end load allocation – 50% to 70% equity funds with comparable asset levels and distribution features. After discussions with the Board, the Adviser has agreed to contractually waive fees and/or reimburse certain Fund expenses at an annual rate of 0.07% as calculated on the daily net assets of the Fund. This waiver and/or reimbursement is applied after (and in addition to) any other applicable fee waivers and/or expense reimbursements that apply. This contractual fee waiver and/or expense reimbursement may not be amended or withdrawn until one year from the date of the prospectus, unless approved by the Board. The Board noted that the Fund was charged no actual management fees, exclusive of Underlying Fund management fees, while certain peer group funds did charge direct management fees. The Board also noted that the Fund’s total expenses, net of waivers, were lower than its peer group median and category median.
39 OPPENHEIMER PORTFOLIO SERIES MODERATE INVESTOR FUND
BOARD APPROVAL OF THE FUND’S INVESTMENT ADVISORY
ANDSUB-ADVISORY AGREEMENTSUnaudited / Continued
Economies of Scale and Profits Realized by the Managers. The Board considered information regarding the Managers’ costs in serving as the Fund’s investment adviser,sub-adviser, including the costs associated with the personnel and systems necessary to manage the Fund, and information regarding the Managers’ profitability from their relationship with the Fund. The Board also considered that the Managers must be able to pay and retain experienced professional personnel at competitive rates to provide quality services to the Fund. The Board reviewed whether the Managers may realize economies of scale in managing and supporting the Fund and whether those economies of scale benefit the Fund’s shareholders at the current level of Fund assets in relation to its management fee. The Fund currently does not charge a management fee.
Other Benefits to the Managers. In addition to considering the profits realized by the Managers, the Board considered information that was provided regarding the direct and indirect benefits the Managers receive as a result of their relationship with the Fund, including compensation paid to the Managers’ affiliates.
Conclusions. These factors were also considered by the independent Trustees meeting separately from the full Board, assisted by experienced counsel to the Fund and to the independent Trustees. Fund counsel and the independent Trustees’ counsel are independent of the Managers within the meaning and intent of the Securities and Exchange Commission Rules.
Based on its review of the information it received and its evaluations described above, the Board, including a majority of the independent Trustees, decided to continue the Agreements through September 30, 2019. In arriving at its decision, the Board did not identify any factor or factors as being more important than others, but considered all of the above information, and considered the terms and conditions of the Agreements, including the management fees, in light of all the surrounding circumstances.
40 OPPENHEIMER PORTFOLIO SERIES MODERATE INVESTOR FUND
PORTFOLIO PROXY VOTING POLICIES AND GUIDELINES;
UPDATES TO STATEMENT OF INVESTMENTSUnaudited
The Fund has adopted Portfolio Proxy Voting Policies and Guidelines under which the Fund votes proxies relating to securities (“portfolio proxies”) held by the Fund. A description of the Fund’s Portfolio Proxy Voting Policies and Guidelines is available (i) without charge, upon request, by calling the Fund toll-free at 1.800. CALL OPP (225.5677), (ii) on the Fund’s website at www.oppenheimerfunds.com, and (iii) on the SEC’s website at www.sec.gov. In addition, the Fund is required to file FormN-PX, with its complete proxy voting record for the 12 months ended June 30th, no later than August 31st of each year. The Fund’s voting record is available (i) without charge, upon request, by calling the Fund toll-free at 1.800. CALL OPP (225.5677), and (ii) in the FormN-PX filing on the SEC’s website at www.sec.gov.
The Fund files its complete schedule of portfolio holdings with the SEC for the first quarter and the third quarter of each fiscal year on FormN-Q. The Fund’s FormN-Q filings are available on the SEC’s website at www.sec.gov. Beginning in April 2019, the Fund will no longer file FormN-Qs and will instead disclose its portfolio holdings monthly on FormN-PORT, which will also be available on the SEC’s website at www.sec.gov.
Householding—Delivery of Shareholder Documents
This is to inform you about OppenheimerFunds’ “householding” policy. If more than one member of your household maintains an account in a particular fund, OppenheimerFunds will mail only one copy of the fund’s prospectus (or, if available, the fund’s summary prospectus), annual and semiannual report and privacy policy. The consolidation of these mailings, called householding, benefits your fund through reduced mailing expense, and benefits you by reducing the volume of mail you receive from OppenheimerFunds. Householding does not affect the delivery of your account statements.
Please note that we will continue to household these mailings for as long as you remain an OppenheimerFunds shareholder, unless you request otherwise. If you prefer to receive multiple copies of these materials, please call us at1.800.CALL-OPP(225-5677).You may also notify us in writing or via email. We will begin sending you individual copies of the prospectus (or, if available, the summary prospectus), reports and privacy policy within 30 days of receiving your request to stop householding.
41 OPPENHEIMER PORTFOLIO SERIES MODERATE INVESTOR FUND
DISTRIBUTION SOURCESUnaudited
For any distribution that took place over the last six months of the Fund’s reporting period, the table below details on aper-share basis the percentage of the Fund’s total distribution payment amount that was derived from the following sources: net income, net profit from the sale of securities, and other capital sources. Other capital sources represent a return of capital. A return of capital may occur, for example, when some or all of the money that you invested in the Fund is paid back to you. A return of capital distribution does not necessarily reflect the Fund’s investment performance and should not be confused with “yield” or “income.” You should not draw any conclusions about the Fund’s investment performance from the amounts of these distributions. This information is based upon income and capital gains using generally accepted accounting principles as of the date of each distribution. If the Fund (or an underlying fund in which the Fund invests) invests in real estate investment trusts (REITs) and/or master limited partnerships (MLPs), the percentages attributed to each category are estimated using historical information because the character of the amounts received from the REITs and/or MLPs in which the Fund (or underlying fund) invests is unknown until after the end of the calendar year. Because the Fund is actively managed, the relative amount of the Fund’s total distributions derived from various sources over the calendar year may change. Please note that this information should not be used for tax reporting purposes as the tax character of distributable income may differ from the amounts used for this notification. You will receive IRS tax forms in the first quarter of each calendar year detailing the actual amount of the taxable andnon-taxable portion of distributions paid to you during the tax year.
For the most current information, please go to oppenheimerfunds.com. Select your Fund, and scroll down to the ‘Dividends’ table under ‘Analytics’.
| | | | | | | | | | | | | | | | |
| Fund Name | | Pay
Date | | | Net Income | | | Net Profit
from Sale | | | Other
Capital
Sources | |
| |
Oppenheimer Portfolio Series: Moderate Investor Fund | | | 12/20/18 | | | | 58.3% | | | | 41.7% | | | | 0.0% | |
| |
42 OPPENHEIMER PORTFOLIO SERIES MODERATE INVESTOR FUND
TRUSTEES AND OFFICERS Unaudited
| | |
| Name, Position(s) Held with the Fund, Length of Service, Year of Birth | | Principal Occupation(s) During the Past 5 Years; Other Trusteeships/ Directorships Held; Number of Portfolios in the Fund Complex Currently Overseen |
| |
| INDEPENDENT TRUSTEES | | The address of each Trustee in the chart below is 6803 S. Tucson Way, Centennial, Colorado 80112-3924. Each Trustee serves for an indefinite term, or until his or her resignation, retirement, death or removal. Each of the Trustees in the chart below oversees 46 portfolios in the OppenheimerFunds complex. |
| |
Joel W. Motley, Chairman of the Board of Trustees (since 2019) and Trustee (since 2005) Year of Birth: 1952 | | Director of Office of Finance Federal Home Loan Bank (since September 2016); Director of Greenwall Foundation (since October 2013); Member of Board and Investment Committee of The Greenwall Foundation (since April 2013); Member of the Vestry of Trinity Wall Street (since April 2012); Director of Southern Africa Legal Services Foundation (since March 2012); Board Member and Investment Committee Member of Pulitzer Center for Crisis Reporting(non-profit journalism) (since March 2011); Managing Director of Public Capital Advisors, LLC (privately-held financial advisor) (since January 2006); Managing Director of Carmona Motley, Inc. (privately-held financial advisor) (since January 2002); Director of Columbia Equity Financial Corp. (privately-held financial advisor) (2002-2007); Managing Director of Carmona Motley Hoffman Inc. (privately-held financial advisor) (January 1998-December 2001); Member of the Finance and Budget Committee of the Council on Foreign Relations, Member of the Investment Committee and Board of Human Rights Watch (since July 2000) and Member of the Investment Committee and Board of Historic Hudson Valley (since February 2010). Mr. Motley has served on the Boards of certain Oppenheimer funds since October 2002, during which time he has become familiar with the Fund’s (and other Oppenheimer funds’) financial, accounting, regulatory and investment matters and has contributed to the Board’s deliberations. |
| |
Beth Ann Brown, Trustee (since 2016) Year of Birth: 1968 | | Director, Board of Directors of Caron Engineering Inc. (since January 2018); Advisor, Board of Advisors of Caron Engineering Inc. (December 2014-December 2017); Independent Consultant (since September 2012); held the following positions at Columbia Management Investment Advisers LLC: Head of Intermediary Distribution (2008-2012), Managing Director, Strategic Relations (2005-2008), Managing Director, Head of National Accounts (2004-2005); Senior Vice President, National Account Manager (2002-2004), Senior Vice President, Key Account Manager (1999-2002) and Vice President, Key Account Manager (1996-1999) of Liberty Funds Distributor, Inc.; President and Director, of Acton Shapleigh Youth Conservation Corps (non -profit) (2012-2015); and Vice President and Director of Grahamtastic Connection(non-profit) (since May 2013). Ms. Brown has served on the Boards of certain Oppenheimer funds since January 2016, during which time she has become familiar with the Fund’s (and other Oppenheimer funds’) financial, accounting, regulatory and investment matters and has contributed to the Board’s deliberations. |
| |
Edmund P. Giambastiani, Jr., Trustee (since 2013) Year of Birth: 1948 | | Director of THL Credit, Inc. (since November 2016) (alternative credit investment manager); Advisory Board Member of the Maxwell School of Citizenship and Public Affairs of Syracuse University (April 2012-September 2016); Director of Mercury Defense Systems Inc. (information technology) (August 2011-February 2013); Trustee of the U.S. Naval Academy Foundation Athletic & Scholarship Program (since November 2010); Advisory Board Member of the Massachusetts Institute of Technology Lincoln Laboratory (federally-funded research development) (since May 2010); Director of The Boeing Company (aerospace and defense) (since October 2009); Trustee of MITRE Corporation (federally-funded research development) |
43 OPPENHEIMER PORTFOLIO SERIES MODERATE INVESTOR FUND
TRUSTEES AND OFFICERSUnaudited / Continued
| | |
| |
Edmund P. Giambastiani, Jr., (Continued) | | (since September 2008); Independent Director of QinetiQ Group Plc (defense technology and security) (February 2008-August 2011); Chairman of Monster Worldwide, Inc. (career services) (March 2015-November 2016), Director of Monster Worldwide, Inc. (career services) (February 2008-June 2011); Lead Director (June 2011-March 2015); Chairman of Alenia North America, Inc. (military and defense products) (January 2008-October 2009); Director of SRA International, Inc. (information technology and services) (January 2008-July 2011); President of Giambastiani Group LLC (national security and energy consulting) (since October 2007); United States Navy, career nuclear submarine officer (June 1970-October 2007); Seventh Vice Chairman of the Joint Chiefs of Staff (2005-October 2007); Supreme Allied Commander of NATO Allied Command Transformation (2003- 2005) and Commander, U.S. Joint Forces Command (2002-2005). Since his retirement from the U.S. Navy in October 2007, Admiral Giambastiani has also served on numerous U.S. Government advisory boards, investigations and task forces for the Secretaries of Defense, State and Interior and the Central Intelligence Agency. He recently completed serving as a federal commissioner on the Military Compensation and Retirement Modernization Commission. Admiral Giambastiani has served on the Boards of certain Oppenheimer funds since February 2013, during which time he has become familiar with the Fund’s (and other Oppenheimer funds’) financial, accounting, regulatory and investment matters and has contributed to the Board’s deliberations. |
| |
Elizabeth Krentzman, Trustee (since 2014) Year of Birth: 1959 | | Trustee of the University of Florida National Board Foundation (since September 2017); Member of the Cartica Funds Board of Directors (private investment funds) (since January 2017); Member of the University of Florida Law Center Association, Inc. Board of Trustees and Audit Committee Member (since April 2016); Member of University of Florida Law Advisory Board, Washington, DC Alumni Group (since 2015); Advisory Board Member of the Securities and Exchange Commission Historical Society (since 2007); held the following positions at Deloitte & Touche LLP: Principal and Chief Regulatory Advisor for Asset Management Services (2007 - 2014) and U.S. Mutual Fund Leader (2011 - 2014); General Counsel of the Investment Company Institute (trade association) (June 2004 - April 2007); held the following positions at Deloitte & Touche LLP: National Director of the Investment Management Regulatory Consulting Practice (1997 - 2004), Principal (2003 - 2004), Director (1998 - 2003) and Senior Manager (1997 - 1998); Assistant Director of the Division of Investment Management - Office of Disclosure and Investment Adviser Regulation of the U.S. Securities and Exchange Commission (1996 - 1997) and various positions with the Division of Investment Management – Office of Regulatory Policy (1991 - 1996) of the U.S. Securities and Exchange Commission; Associate at Ropes & Gray LLP (1987 – 1991). Ms. Krentzman has served on the Boards of certain Oppenheimer funds since August 2014, during which time she has become familiar with the Fund’s (and other Oppenheimer funds’) financial, accounting, regulatory and investment matters and has contributed to the Board’s deliberations. |
| |
Mary F. Miller, Trustee (since 2005) Year of Birth: 1942 | | Trustee of International House(not-for-profit) (since June 2007); Trustee of the American Symphony Orchestra(not-for-profit) (October 1998-November 2011); and Senior Vice President and General Auditor of American Express Company (financial services company) (July 1998-February 2003). Ms. Miller has served on the Boards of certain Oppenheimer funds since August 2004, during which time she has become familiar with the Fund’s (and other Oppenheimer funds’) financial, accounting, regulatory and investment matters and has contributed to the Board’s deliberations. |
44 OPPENHEIMER PORTFOLIO SERIES MODERATE INVESTOR FUND
| | |
| |
Joanne Pace, Trustee (since 2012) Year of Birth: 1958 | | Advisory Board Director of Massey Quick Simon & Co. (wealth management), LLC (since October 2014); Board Director of Horizon Blue Cross Blue Shield of New Jersey (healthcare) (since November 2012); Advisory Board Director of The Alberleen Group LLC (investment banking) (since March 2012); Governing Council Member (since 2016) and Chair of Education Committee (since 2017) of Independent Directors Council (IDC) (since 2016); Board Member of 100 Women in Finance(non-profit) (since January 2015); Advisory Council Member of Morgan Stanley Children’s Hospital(non-profit) (since May 2012); Director of The Komera Project(non-profit) (April 2012-2016); New York Advisory Board Director of Peace First(non-profit) (March 2010-2013); Senior Advisor of SECOR Asset Management, LP (2010-2011); Managing Director and Chief Operating Officer of Morgan Stanley Investment Management (2006-2010); Partner and Chief Operating Officer of FrontPoint Partners, LLC (hedge fund) (2005-2006); held the following positions at Credit Suisse (investment banking): Managing Director (2003-2005); Global Head of Human Resources and member of Executive Board and Operating Committee (2004-2005), Global Head of Operations and Product Control (2003-2004); held the following positions at Morgan Stanley: Managing Director (1997-2003), Controller and Principal Accounting Officer (1999-2003); Chief Financial Officer (temporary assignment) for the Oversight Committee, Long Term Capital Management (1998-1999). Lead Independent Director and Chair of the Audit and Nominating Committee of The Global Chartist Fund, LLC of Oppenheimer Asset Management (2011-2012); Board Director of Managed Funds Association (2008-2010); Board Director of Morgan Stanley Foundation (2007- 2010) and Investment Committee Chair (2008-2010). Ms. Pace has served on the Boards of certain Oppenheimer funds since November 2012, during which time she has become familiar with the Fund’s (and other Oppenheimer funds’) financial, accounting, regulatory and investment matters and has contributed to the Board’s deliberations. |
| |
Daniel Vandivort, Trustee (since 2014) Year of Birth: 1954 | | Chairman and Lead Independent Director/Trustee (March 2010-September 2014), Chairman of the Audit Committee (March 2009-September 2014) and Director/Trustee (December 2008-September 2014) of the Board of Directors/ Trustees of Value Line Funds; Trustee (since January 2015) and Treasurer and Chairman of the Audit Committee and Finance Committee (since January 2016) of Board of Trustees of Huntington Disease Foundation of America; Trustee, Board of Trustees, RIM Retirement Savings Plan (2005-2007); President and Chief Investment Officer, Robeco Investment Management, formerly known as Weiss Peck and Greer (January 2005-June 2007); Member, Management Committee of Robeco Investment Management (2001-2007); Chairman and Trustee of the Board of Trustees of Weiss, Peck and Greer Funds (2004-2005); Managing Director and Head of Fixed Income, Weiss, Peck and Greer (November 1994-January 2005); Managing Director and Head of Fixed Income, CS First Boston Investment Management (January 1992-November 1994); Director, Global Product Development, First Boston Asset Management (November 1989-January 1992); Vice President, Fixed Income Sales, First Boston Corp. (May 1984-November 1989). Mr. Vandivort has served on the Boards of certain Oppenheimer funds since 2014, during which time he has become familiar with the Fund’s (and other Oppenheimer funds’) financial, accounting, regulatory and investment matters and has contributed to the Board’s deliberations. |
45 OPPENHEIMER PORTFOLIO SERIES MODERATE INVESTOR FUND
TRUSTEES AND OFFICERSUnaudited / Continued
| | |
| |
Brian F. Wruble, Trustee (since 2005) Year of Birth: 1943 | | Governor of Community Foundation of the Florida Keys(non-profit) (since July 2012); Director of TCP Capital, Inc. (registered business development company) (since November 2015); Chairman Emeritus of the Board of Trustees (since August 2011), Chairman of the Board of Trustees (August 2007-August 2011), Trustee of the Board of Trustees (since August 1991) of The Jackson Laboratory(non-profit); Member of Zurich Insurance Group’s Investment Management Advisory Council (insurance) (October 2004-February 2017); Treasurer (since 2007) and Trustee (since May 1992) of the Institute for Advanced Study(non-profit educational institute); Director of Special Value Opportunities Fund, LLC (registered investment company) (affiliate of theSub-Adviser’s parent company) (September 2004- June 2015); General Partner of Odyssey Partners, L.P. (hedge fund) (September 1995-December 2007); Special Limited Partner of Odyssey Investment Partners, LLC (private equity investment) (January 1999-September 2004). Mr. Wruble has served on the Boards of certain Oppenheimer funds since April 2001, during which time he has become familiar with the Fund’s (and other Oppenheimer funds’) financial, accounting, regulatory and investment matters and has contributed to the Board’s deliberations. |
| INTERESTED TRUSTEE AND OFFICER | | Mr. Steinmetz is an “Interested Trustee” because he is affiliated with the Manager and theSub-Adviser by virtue of his positions as Chairman of theSub-Adviser and officer and director of the Manager. Both as a Trustee and as an officer, Mr. Steinmetz serves for an indefinite term, or until his resignation, retirement, death or removal. Mr. Steinmetz’s address is 225 Liberty Street, New York, New York 10281-1008. Mr. Steinmetz is an officer of 104 portfolios in the OppenheimerFunds complex. |
| |
Arthur P. Steinmetz, Trustee (since 2015), President and Principal Executive Officer (since 2014) Year of Birth: 1958 | | Chairman of OppenheimerFunds, Inc. (since January 2015); CEO and Chairman of OFI Global Asset Management, Inc. (since July 2014), President of OFI Global Asset Management, Inc. (since May 2013), a Director of OFI Global Asset Management, Inc. (since January 2013), Director of OppenheimerFunds, Inc. (since July 2014), President, Management Director and CEO of Oppenheimer Acquisition Corp. (OppenheimerFunds, Inc.‘s parent holding company) (since July 2014), and President and Director of OFI SteelPath, Inc. (since January 2013). Chief Investment Officer of the OppenheimerFunds advisory entities (January 2013-December 2013); Executive Vice President of OFI Global Asset Management, Inc. (January2013-May 2013); Chief Investment Officer of OppenheimerFunds, Inc. (October 2010-December 2012); Chief Investment Officer, Fixed-Income, of OppenheimerFunds, Inc. (April 2009-October 2010); Executive Vice President of OppenheimerFunds, Inc. (October 2009-December 2012); Director of Fixed Income of OppenheimerFunds, Inc. (January 2009-April 2009); and a Senior Vice President of OppenheimerFunds, Inc. (March 1993-September 2009). |
| OTHER OFFICERS OF THE FUND | | The addresses of the Officers in the chart below are as follows: for Mr. Bennett, Mss. Lo Bessette, Foxson and Picciotto, 225 Liberty Street, New York, New York 10281-1008, for Mr. Petersen, 6803 S. Tucson Way, Centennial, Colorado 80112-3924. Each Officer serves for an indefinite term or until his or her resignation, retirement, death or removal. |
| |
Jeffrey Bennett, Vice President (since 2018) Year of Birth: 1976 | | Vice President of theSub-Adviser (since November 2016). Managing Director, Alternative Investment Management, for Alliance Bernstein 2011-2016); Director of Research at Fischer & Company (2008 to 2011). |
46 OPPENHEIMER PORTFOLIO SERIES MODERATE INVESTOR FUND
| | |
| |
Cynthia Lo Bessette, Secretary and Chief Legal Officer (since 2016) Year of Birth: 1969 | | Executive Vice President, General Counsel and Secretary of OFI Global Asset Management, Inc. (since February 2016); Senior Vice President and Deputy General Counsel of OFI Global Asset Management, Inc. (March 2015-February 2016); Chief Legal Officer of OppenheimerFunds, Inc. and OppenheimerFunds Distributor, Inc. (since February 2016); Vice President, General Counsel and Secretary of Oppenheimer Acquisition Corp. (since February 2016); General Counsel of OFI SteelPath, Inc., OFI Advisors, LLC and Index Management Solutions, LLC (since February 2016); Chief Legal Officer of OFI Global Institutional, Inc., HarbourView Asset Management Corporation, OFI Global Trust Company, Oppenheimer Real Asset Management, Inc., OFI Private Investments Inc., Shareholder Services, Inc. and Trinity Investment Management Corporation (since February 2016); Corporate Counsel (February 2012-March 2015) and Deputy Chief Legal Officer (April 2013-March 2015) of Jennison Associates LLC; Assistant General Counsel (April 2008-September 2009) and Deputy General Counsel (October 2009-February 2012) of Lord Abbett & Co. LLC. |
| |
Jennifer Foxson, Vice President and Chief Business Officer (since 2014) Year of Birth: 1969 | | Senior Vice President of OppenheimerFunds Distributor, Inc. (since June 2014); Vice President of OppenheimerFunds Distributor, Inc. (April 2006-June 2014); Vice President of OppenheimerFunds, Inc. (January 1998-March 2006); Assistant Vice President of OppenheimerFunds, Inc. (October 1991-December 1998). |
| |
Mary Ann Picciotto, Chief Compliance Officer and Chief Anti-Money Laundering Officer (since 2014) Year of Birth: 1973 | | Senior Vice President and Chief Compliance Officer of OFI Global Asset Management, Inc. (since March 2014); Chief Compliance Officer of OppenheimerFunds, Inc., OFI SteelPath, Inc., OFI Global Institutional, Inc., Oppenheimer Real Asset Management, Inc., OFI Private Investments Inc., Harborview Asset Management Corporation, Trinity Investment Management Corporation, and Shareholder Services, Inc. (since March 2014); Managing Director of Morgan Stanley Investment Management Inc. and certain of its various affiliated entities; Chief Compliance Officer of various Morgan Stanley Funds (May 2010-January 2014); Chief Compliance Officer of Morgan Stanley Investment Management Inc. (April 2007-January 2014). |
| |
Brian S. Petersen, Treasurer and Principal Financial & Accounting Officer (since 2016) Year of Birth: 1970 | | Senior Vice President of OFI Global Asset Management, Inc. (since January 2017); Vice President of OFI Global Asset Management, Inc. (January 2013-January 2017); Vice President of OppenheimerFunds, Inc. (February 2007-December 2012); Assistant Vice President of OppenheimerFunds, Inc. (August 2002-2007). |
The Fund’s Statement of Additional Information contains additional information about the Fund’s Trustees and Officers is available without charge upon request, by calling 1.800. CALL OPP (225.5677).
47 OPPENHEIMER PORTFOLIO SERIES MODERATE INVESTOR FUND
OPPENHEIMER PORTFOLIO SERIES MODERATE INVESTOR FUND
| | |
| Manager | | OFI Global Asset Management, Inc. |
| |
| Sub-Adviser | | OppenheimerFunds, Inc. |
| |
| Distributor | | OppenheimerFunds Distributor, Inc. |
| |
Transfer and Shareholder Servicing Agent | | OFI Global Asset Management, Inc. |
| |
| Sub-Transfer Agent | | Shareholder Services, Inc. |
| | DBA OppenheimerFunds Services |
| |
Independent Registered Public Accounting Firm | | KPMG LLP |
| |
| Legal Counsel | | Kramer Levin Naftalis & Frankel LLP |
© 2019 OppenheimerFunds, Inc. All rights reserved.
48 OPPENHEIMER PORTFOLIO SERIES MODERATE INVESTOR FUND
PRIVACY NOTICE
As an Oppenheimer fund shareholder, you are entitled to know how we protect your personal information and how we limit its disclosure.
Information Sources
We obtainnon-public personal information about our shareholders from the following sources:
| ● | Applications or other forms. |
| ● | When you create a user ID and password for online account access. |
| ● | When you enroll in eDocs Direct,SM our electronic document delivery service. |
| ● | Your transactions with us, our affiliates or others. |
| ● | Technologies on our website, including: “cookies” and web beacons, which are used to collect data on the pages you visit and the features you use. |
If you visit oppenheimerfunds.com and do not log on to the secure account information areas, we do not obtain any personal information about you. When you do log on to a secure area, we do obtain your user ID and password to identify you. We also use this information to provide you with products and services you have requested, to inform you about products and services that you may be interested in and assist you in other ways.
We do not collect personal information through our website unless you willingly provide it to us, either directly by email or in those areas of the website that request information. In order to update your personal information (including your mailing address, email address and phone number) you must first log on and visit your user profile.
If you have set your browser to warn you before accepting cookies, you will receive the warning message with each cookie. You can refuse cookies by turning them off in your browser. However, doing so may limit your access to certain sections of our website.
We use cookies to help us improve and manage our website. For example, cookies help us recognize new versus repeat visitors to the site, track the pages visited, and enable some special features on the website. This data helps us provide better service for our website visitors.
Protection of Information
We do not disclose anynon-public personal information (such as names on a customer list) about current or former customers to anyone, except as permitted by law.
Disclosure of Information
Copies of confirmations, account statements and other documents reporting activity in your fund accounts are made available to your financial advisor (as designated by you). We may also use details about you and your investments to help us, our financial service affiliates, or firms that jointly market their financial products and services with ours, to better serve your investment needs or suggest educational material that may be of interest to you. If this requires us to provide you with an opportunity to “opt in” or “opt out” of such information sharing with a firm not affiliated with us, you will receive notification on how to do so, before any such sharing takes place.
Right of Refusal
We will not disclose your personal information to unaffiliated third parties (except as permitted by law), unless we first offer you a reasonable opportunity to refuse or “opt out” of such disclosure.
49 OPPENHEIMER PORTFOLIO SERIES MODERATE INVESTOR FUND
PRIVACY NOTICEContinued
Internet Security and Encryption
In general, the email services provided by our website are encrypted and provide a secure and private means of communication with us. To protect your own privacy, confidential and/ or personal information should only be communicated via email when you are advised that you are using a secure website.
As a security measure, we do not include personal or account information innon-secure emails, and we advise you not to send such information to us innon-secure emails. Instead, you may take advantage of the secure features of our website to encrypt your email correspondence. To do this, you will need to use a browser that supports Secure Sockets Layer (SSL) protocol.
| ● | All transactions conducted via our websites, including redemptions, exchanges and purchases, are secured by the highest encryption standards available. SSL is used to establish a secure connection between your PC and OppenheimerFunds’ server. It transmits information in an encrypted and scrambled format. |
| ● | Encryption is achieved through an electronic scrambling technology that uses a “key” to code and then decode the data. Encryption acts like the cable converter box you may have on your television set. It scrambles data with a secret code so that no one can make sense of it while it is being transmitted. When the data reaches its destination, the same software unscrambles the data. |
| ● | You can exit the secure area by closing your browser or, for added security, you can use the Log Out button before you close your browser. |
Other Security Measures
We maintain physical, electronic and procedural safeguards to protect your personal account information. Our employees and agents have access to that information only so that they may offer you products or provide services, for example, when responding to your account questions.
How You Can Help
You can also do your part to keep your account information private and to prevent unauthorized transactions. If you obtain a user ID and password for your account, safeguard that information. Strengthening your online credentials–your online security profile–typically your user name, password, and security questions and answers, can be one of your most important lines of defense on the Internet. For additional information on how you can help prevent identity theft, visit https://www. oppenheimerfunds.com/security.
Who We Are
This joint notice describes the privacy policies of the Oppenheimer funds, OppenheimerFunds, Inc., each of its investment adviser subsidiaries, OppenheimerFunds Distributor, Inc. and OFI Global Trust Co. It applies to all Oppenheimer fund accounts you presently have, or may open in the future, using your Social Security number—whether or not you remain a shareholder of our funds. This notice was last updated as of November 2017. In the event it is updated or changed, we will post an updated notice on our website at oppenheimerfunds.com. If you have any questions about this privacy policy, email us by clicking on theContact Us section of our website at oppenheimerfunds.com, write to us at P.O. Box 5270, Denver, CO 80217-5270, or call us at800 CALL OPP (225 5677).
50 OPPENHEIMER PORTFOLIO SERIES MODERATE INVESTOR FUND
THIS PAGE INTENTIONALLY LEFT BLANK.
51 OPPENHEIMER PORTFOLIO SERIES MODERATE INVESTOR FUND
THIS PAGE INTENTIONALLY LEFT BLANK.
52 OPPENHEIMER PORTFOLIO SERIES MODERATE INVESTOR FUND
THIS PAGE INTENTIONALLY LEFT BLANK.
53 OPPENHEIMER PORTFOLIO SERIES MODERATE INVESTOR FUND
THIS PAGE INTENTIONALLY LEFT BLANK.
54 OPPENHEIMER PORTFOLIO SERIES MODERATE INVESTOR FUND
THIS PAGE INTENTIONALLY LEFT BLANK.
55 OPPENHEIMER PORTFOLIO SERIES MODERATE INVESTOR FUND
| | | | |
| | 
Visit us at oppenheimerfunds.com for24-hr access to account information and transactions or call us at 800.CALL OPP (800.225.5677) for24-hr automated information and automated transactions. Representatives also available Mon–Fri8am-8pm ET. | | |
Visit Us oppenheimerfunds.com | | | | |
Call Us 800 225 5677 | | | | |
Follow Us | | | | |
 | | Oppenheimer funds are distributed by OppenheimerFunds Distributor, Inc. 225 Liberty Street, New York, NY 10281-1008 © 2019 OppenheimerFunds Distributor, Inc. All rights reserved. RA0545.001.0119 March 25, 2019 | | |
Important Updates
On October 18, 2018, Massachusetts Mutual Life Insurance Company, an indirect corporate parent of OppenheimerFunds, Inc. and its subsidiaries OFI Global Asset Management, Inc., OFI SteelPath, Inc. and OFI Advisors, LLC, announced that it has entered into an agreement whereby Invesco Ltd., a global investment management company, will acquire OppenheimerFunds, Inc. As of the date of this report, the transaction is expected to close in the second quarter of 2019, pending necessary regulatory and other third-party approvals. This is subject to change. See the Notes to Financial Statements for more information.
Update to Shareholder Report Document Delivery
Beginning January 1, 2021, OppenheimerFunds will send a notice, either by mail or email, each time your fund’s updated report is available on our website (oppenheimerfunds.com). Investors who are not enrolled in electronic delivery by January 1, 2021 will receive the notice in the mail. Enrolling in electronic delivery will enable you to receive a direct link to your full shareholder report the moment it becomes available, and limit the amount of mail you receive. All investors who prefer to receive shareholder reports in paper may, at any time, choose that option.
How do you update your delivery preferences?
If you own these shares through a financial intermediary, you may contact your financial intermediary.
If your accounts are held through OppenheimerFunds and you receive statements, confirms, and other documents directly from us, you can enroll in our eDocs DirectSM service atoppenheimerfunds.com or by calling us. Once you’re enrolled, you’ll begin to receive email notifications of updated documents when they become available. If you have any questions, feel free to call us at1.800.225.5677.
Table of Contents
Class A Shares
AVERAGE ANNUAL TOTAL RETURNS AT 1/31/19
| | | | | | | | |
| | | Class A Shares of the Fund | | | | |
| | Without Sales Charge | | With Sales Charge | | S&P 500 Index | | Bloomberg Barclays
U.S. Aggregate
Bond Index |
1-Year | | -7.22% | | -12.56% | | -2.31% | | 2.25% |
5-Year | | 5.16 | | 3.92 | | 10.96 | | 2.44 |
10-Year | | 9.73 | | 9.09 | | 15.00 | | 3.68 |
Performance data quoted represents past performance, which does not guarantee future results.The investment return and principal value of an investment in the Fund will fluctuate so that an investor’s shares, when redeemed, may be worth more or less than their original cost. Fund returns include changes in share price, reinvested distributions, and a 5.75% maximum applicable sales charge except where “without sales charge” is indicated. Current performance may be lower or higher than the performance quoted. Returns do not consider capital gains or income taxes on an individual’s investment. Returns for periods of less than one year are cumulative and not annualized. For performance data current to the most recentmonth-end, visit oppenheimerfunds.com or call 1.800.CALL OPP (225.5677). See Fund prospectuses and summary prospectuses for more information on share classes and sales charges.
|
| 3 OPPENHEIMER PORTFOLIO SERIES ACTIVE ALLOCATION FUND |
Fund Performance Discussion1
During theone-year period ended January 31, 2019, the Fund’s Class A shares (without sales charge) returned-7.22%. For theone-year period ended January 31, 2019, the Fund underperformed the Bloomberg Barclays U.S. Aggregate Bond Index and the S&P 500 Index, which returned 2.25% and-2.31%, respectively.
MARKET OVERVIEW
Markets were volatile in 2018 and hit a wall in the last quarter of the year, before picking up again in January 2019. Several shocks negatively affected market sentiment. The U.S. Federal Reserve (Fed) once again decided to hike interest rates, as was nearly universally expected, but the post-meeting conference was more hawkish than expected. Markets were expecting a clear message that the Fed might consider a pause in any future rate increases, but that was not initially
communicated. Equity markets sold off, bonds rallied, and the U.S. dollar weakened. The sell-offs were sizable, which led some to think a recession might be imminent. It was not just the Fed making headlines, some key economic data were also weaker in December. In the U.S., regional surveys from the Fed and Institute for Supply Management (ISM) sentiment surveys decreased markedly, along with acool-off in housing. Politics were once again a factor because there was little clarity
COMPARISON OF CHANGE IN VALUE OF $10,000 HYPOTHETICAL INVESTMENTS IN:
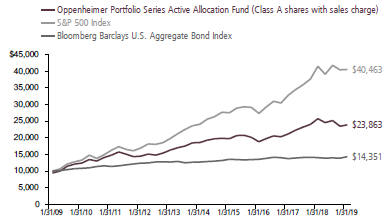
1. The Fund is invested in Class I shares of all underlying funds discussed in this Fund Performance Discussion.
|
| 4 OPPENHEIMER PORTFOLIO SERIES ACTIVE ALLOCATION FUND |
from the Trump Administration about the policies for tariffs on Chinese imports, and the U.S. Government shutdown did not help in an environment where the appetite for risk declined. Risk markets rallied in January 2019. The strong gains were driven by a shift in the statements from the Fed, which signaled a more dovish tone on future interest rate rises.
Despite rallying in January 2019, equities generally declined for theone-year period ended January 31, 2019. U.S. equities outperformed their international counterparts, with the S&P 500 returning-2.31%, the MSCI ACWI returning-7.48%, and emerging markets falling the most with a-14.24% return for the MSCI Emerging Markets Index. Growth stocks continued to outperform value stocks this reporting period. Fixed income fared better than equities in a volatile environment, with the Bloomberg Barclays U.S. Aggregate Bond Index returning 2.25% and the Bloomberg Barclays Global Aggregate Bond Index, Hedged, returning 3.58%.
FUND REVIEW
In an environment where equities experienced declines, the Fund’s equity exposure detracted from performance. With international stocks underperforming U.S. stocks this period, the Fund’s allocation to Oppenheimer International Growth Fund and Oppenheimer International Equity Fund detracted from performance. Oppenheimer Developing Markets Fund also negatively impacted absolute results as emerging market equities had a difficult reporting period. As mentioned
earlier, value stocks underperformed this reporting period, which impacted Oppenheimer Value Fund’s performance. Oppenheimer Capital Appreciation Fund, which typically invests inlarge-cap U.S. growth stocks, fared better than Oppenheimer Value Fund as growth outperformed; however, Oppenheimer Capital Appreciation Fund experienced declines and negatively impacted performance as it remained a top holding for most of the reporting period. We significantly trimmed our exposure to Oppenheimer Capital Appreciation Fund over the closing months of the reporting period.
Oppenheimer Global Fund and Oppenheimer Emerging Markets Innovators Fund were underlying equity funds that contributed positively to performance this period. We initiated positions in these underlying funds over the second half of the reporting period.
In a period where U.S. fixed income produced positive returns, the Fund’s exposure to both Oppenheimer Total Return Bond Fund and Oppenheimer Limited-Term Government Fund benefited performance. The Fund’s allocation to Oppenheimer International Bond Fund detracted slightly from performance as a result of asell-off in emerging markets fixed income.
POST-PERIOD UPDATE
Shortly after the reporting period ended on February 1, 2019, we implemented changes to the Fund, which we believe will meaningfully enhance our investment
|
| 5 OPPENHEIMER PORTFOLIO SERIES ACTIVE ALLOCATION FUND |
capabilities and flexibility to manage the strategy in line with client expectations. The investment universe of the Fund has been expanded across OppenheimerFunds’ products, including additional mutual funds, ETFs andclosed-end funds, which will offer us additional component parts and greater investment flexibility to seek to achieve the Fund’s investment objective. In addition, the Fund will permit derivative usage for better
cash and duration management. To reflect the increase in international exposure, the Fund changed its benchmarks from the Bloomberg Barclays U.S. Aggregate Bond Index and S&P 500 Index to the MSCI ACWI, Bloomberg Barclays Global Aggregate Bond Index, Hedged, and a blended benchmark that consists of 80% MSCI ACWI and 20% Global Aggregate Bond Index, Hedged.
| | |
 | | 
Jeffrey Bennett Portfolio Manager |
|
| 6 OPPENHEIMER PORTFOLIO SERIES ACTIVE ALLOCATION FUND |
Top Holdings and Allocations
ASSET CLASS ALLOCATION
| | | | |
| Foreign Equity Funds | | | 41.3% | |
| Domestic Equity Funds | | | 34.6 | |
| Domestic Fixed Income Funds | | | 10.8 | |
| Alternative Funds | | | 9.4 | |
| Foreign Fixed Income Fund | | | 3.9 | |
| Money Market Fund | | | —* | |
* Represents a value of less than 0.05%.
Portfolio holdings and allocations are subject to change. Percentages are as of January 31, 2019, and are based on the total market value of investments.
TOP TEN HOLDINGS
| | | | |
| Oppenheimer Value Fund, Cl. I | | | 18.4% | |
| Oppenheimer Global Fund, Cl. I | | | 10.8 | |
| Oppenheimer Capital Appreciation Fund, Cl. I | | | 8.9 | |
| Oppenheimer International Equity Fund, Cl. I | | | 7.5 | |
| Oppenheimer International Growth Fund, Cl. I | | | 6.9 | |
| Oppenheimer Developing Markets Fund, Cl. I | | | 6.8 | |
| Oppenheimer Total Return Bond Fund, Cl. I | | | 5.6 | |
| Oppenheimer International Small-Mid Co. Fund, Cl. I | | | 4.3 | |
| Oppenheimer Main Street Small Cap Fund, Cl. I | | | 4.0 | |
| Oppenheimer International Bond Fund, Cl. I | | | 3.8 | |
Portfolio holdings and allocations are subject to change. Percentages are as of January 31, 2019, and are based on net assets.
For more current Fund holdings, please visit oppenheimerfunds.com.
|
| 7 OPPENHEIMER PORTFOLIO SERIES ACTIVE ALLOCATION FUND |
Share Class Performance
AVERAGE ANNUAL TOTAL RETURNS WITHOUT SALES CHARGE AS OF 1/31/19
| | | | | | | | |
| | | Inception Date | | 1-Year | | 5-Year | | 10-Year |
| Class A (OAAAX) | | 4/5/05 | | -7.22% | | 5.16% | | 9.73% |
| Class C (OAACX) | | 4/5/05 | | -7.92 | | 4.38 | | 8.91 |
| Class R (OAANX) | | 4/5/05 | | -7.44 | | 4.91 | | 9.50 |
| Class Y (OAAYX) | | 4/5/05 | | -7.00 | | 5.43 | | 10.08 |
AVERAGE ANNUAL TOTAL RETURNS WITH SALES CHARGE AS OF 1/31/19
| | | | | | | | |
| | | Inception Date | | 1-Year | | 5-Year | | 10-Year |
| Class A (OAAAX) | | 4/5/05 | | -12.56% | | 3.92% | | 9.09% |
| Class C (OAACX) | | 4/5/05 | | -8.84 | | 4.38 | | 8.91 |
| Class R (OAANX) | | 4/5/05 | | -7.44 | | 4.91 | | 9.50 |
| Class Y (OAAYX) | | 4/5/05 | | -7.00 | | 5.43 | | 10.08 |
Performance data quoted represents past performance, which does not guarantee future results.The investment return and principal value of an investment in the Fund will fluctuate so that an investor’s shares, when redeemed, may be worth more or less than their original cost. Current performance may be lower or higher than the performance quoted. Returns do not consider capital gains or income taxes on an individual’s investment. For performance data current to the most recentmonth-end, visit oppenheimerfunds.com or call 1.800. CALL OPP (225.5677). Fund returns include changes in share price, reinvested distributions, and the applicable sales charge: for Class A shares, the current maximum initial sales charge of 5.75% and for Class C shares, the contingent deferred sales charge of 1% for the1-year period. There is no sales charge for Class R and Class Y shares. Returns for periods of less than one year are cumulative and not annualized. See Fund prospectuses and summary prospectuses for more information on share classes and sales charges.
The Fund’s performance is compared to the performance of the S&P 500 Index and the Bloomberg Barclays U.S. Aggregate Bond Index. The S&P 500 Index is a capitalization-weighted index of 500 stocks intended to be a representative sample of leading companies in leading industries within the U.S. economy. The Bloomberg Barclays U.S. Aggregate Bond Index is an index of U.S.-dollar-denominated, investment-grade U.S. corporate government and mortgage-backed securities. The indices are unmanaged and cannot be purchased directly by investors. While index comparisons may be useful to provide a benchmark for the Fund’s performance, it must be noted that the Fund’s investments are not limited to the investments comprising the indices. Index performance includes reinvestment of income, but does not reflect transaction costs, fees, expenses or taxes. Index performance is shown for illustrative purposes only as a benchmark for the Fund’s performance, and does not predict or depict performance of the Fund. The Fund’s performance reflects the effects of the Fund’s business and operating expenses.
|
| 8 OPPENHEIMER PORTFOLIO SERIES ACTIVE ALLOCATION FUND |
The views in the Fund Performance Discussion represent the opinions of this Fund’s portfolio manager(s) and are not intended as investment advice or to predict or depict the performance of any investment. These views are as of the close of business on January 31, 2019, and are subject to change based on subsequent developments. The Fund’s portfolio and strategies are subject to change.
Before investing in any of the Oppenheimer funds, investors should carefully consider a fund’s investment objectives, risks, charges and expenses. Fund prospectuses and summary prospectuses contain this and other information about the funds, and may be obtained by asking your financial advisor, visiting oppenheimerfunds.com, or calling 1.800.CALL OPP (225.5677). Read prospectuses and summary prospectuses carefully before investing.
Shares of Oppenheimer funds are not deposits or obligations of any bank, are not guaranteed by any bank, are not insured by the FDIC or any other agency, and involve investment risks, including the possible loss of the principal amount invested.
|
| 9 OPPENHEIMER PORTFOLIO SERIES ACTIVE ALLOCATION FUND |
Fund Expenses
Fund Expenses. As a shareholder of the Fund, you incur two types of costs: (1) transaction costs, which may include sales charges (loads) on purchase payments and/or contingent deferred sales charges on redemptions; and (2) ongoing costs, including management fees; distribution and service fees; and other Fund expenses. These examples are intended to help you understand your ongoing costs (in dollars) of investing in the Fund and to compare these costs with the ongoing costs of investing in other mutual funds.
The examples are based on an investment of $1,000.00 invested at the beginning of the period and held for the entire6-month period ended January 31, 2019.
Actual Expenses. The first section of the table provides information about actual account values and actual expenses. You may use the information in this section for the class of shares you hold, together with the amount you invested, to estimate the expense that you paid over the period. Simply divide your account value by $1,000.00 (for example, an $8,600.00 account value divided by $1,000.00 = 8.60), then multiply the result by the number in the first section under the heading entitled “Expenses Paid During 6 Months Ended January 31, 2019” to estimate the expenses you paid on your account during this period.
Hypothetical Example for Comparison Purposes.The second section of the table provides information about hypothetical account values and hypothetical expenses based on the Fund’s actual expense ratio for each class of shares, and an assumed rate of return of 5% per year for each class before expenses, which is not the Fund’s actual return. The hypothetical account values and expenses may not be used to estimate the actual ending account balance or expenses you paid for the period. You may use this information to compare the ongoing costs of investing in the Fund and other funds. To do so, compare this 5% hypothetical example for the class of shares you hold with the 5% hypothetical examples that appear in the shareholder reports of the other funds.
Please note that the expenses shown in the table are meant to highlight your ongoing costs only and do not reflect any transactional costs, such asfront-end or contingent deferred sales charges (loads). Therefore, the “hypothetical” section of the table is useful in comparing ongoing costs only, and will not help you determine the relative total costs of owning different funds. In addition, if these transactional costs were included, your costs would have been higher.
|
| 10 OPPENHEIMER PORTFOLIO SERIES ACTIVE ALLOCATION FUND |
| | | | | | |
| Actual | | Beginning Account Value August 1, 2018 | | Ending Account Value January 31, 2019 | | Expenses Paid During 6 Months Ended January 31, 2019 |
| Class A | | $ 1,000.00 | | $ 948.30 | | $ 2.61 |
| Class C | | 1,000.00 | | 944.20 | | 6.29 |
| Class R | | 1,000.00 | | 947.50 | | 3.84 |
| Class Y | | 1,000.00 | | 949.80 | | 1.43 |
| | | |
Hypothetical (5% return before expenses) | | | | | | |
| Class A | | 1,000.00 | | 1,022.53 | | 2.71 |
| Class C | | 1,000.00 | | 1,018.75 | | 6.53 |
| Class R | | 1,000.00 | | 1,021.27 | | 3.98 |
| Class Y | | 1,000.00 | | 1,023.74 | | 1.48 |
Expenses are equal to the Fund’s annualized expense ratio for that class, multiplied by the average account value over the period, multiplied by 184/365 (to reflect theone-half year period). Those annualized expense ratios, excluding indirect expenses from affiliated funds, based on the6-month period ended January 31, 2019 are as follows:
| | | | |
| Class | | Expense Ratios | |
| Class A | | | 0.53% | |
| Class C | | | 1.28 | |
| Class R | | | 0.78 | |
| Class Y | | | 0.29 | |
The expense ratios reflect voluntary and/or contractual waivers and/or reimbursements of expenses by the Fund’s Manager. Some of these undertakings may be modified or terminated at any time, as indicated in the Fund’s prospectus. The “Financial Highlights” tables in the Fund’s financial statements, included in this report, also show the gross expense ratios, without such waivers or reimbursements and reduction to custodian expenses, if applicable.
|
| 11 OPPENHEIMER PORTFOLIO SERIES ACTIVE ALLOCATION FUND |
STATEMENT OF INVESTMENTSJanuary 31, 2019
| | | | | | | | |
| | | Shares | | | Value | |
| Investment Companies—99.7%1 | | | | | | | | |
| Alternative Funds—9.4% | | | | | | | | |
| Oppenheimer Fundamental Alternatives Fund, Cl. I | | | 1,371,218 | | | $ | 36,817,196 | |
| Oppenheimer Gold & Special Minerals Fund, Cl. I2 | | | 161,391 | | | | 2,569,343 | |
| Oppenheimer Master Event-Linked Bond Fund, LLC | | | 5,253,585 | | | | 81,371,811 | |
| Oppenheimer Real Estate Fund, Cl. I | | | 2,225,283 | | | | 55,743,331 | |
| Oppenheimer SteelPath MLP Select 40 Fund, Cl. I | | | 4,678,203 | | | | 36,630,327 | |
| | | | | | | | |
| | | | | | | | 213,132,008 | |
| Domestic Equity Funds—34.5% | | | | | | | | |
| Oppenheimer Capital Appreciation Fund, Cl. I | | | 3,302,969 | | | | 202,472,004 | |
| Oppenheimer Discovery Mid Cap Growth Fund, Cl. I | | | 2,593,847 | | | | 55,222,999 | |
| Oppenheimer Main Street Mid Cap Fund, Cl. I | | | 743,700 | | | | 18,882,546 | |
| Oppenheimer Main Street Small Cap Fund, Cl. I | | | 6,382,443 | | | | 89,609,501 | |
| Oppenheimer Value Fund, Cl. I | | | 13,065,728 | | | | 419,279,211 | |
| | | | | | | | |
| | | | | | | | 785,466,261 | |
| Domestic Fixed Income Funds—10.8% | | | | | | | | |
| Oppenheimer Limited-Term Government Fund, Cl. I | | | 12,160,372 | | | | 52,654,409 | |
| Oppenheimer Master Inflation Protected Securities Fund, LLC | | | 2,105,995 | | | | 25,568,159 | |
| Oppenheimer Master Loan Fund, LLC | | | 2,371,784 | | | | 40,806,705 | |
| Oppenheimer Total Return Bond Fund, Cl. I | | | 18,994,600 | | | | 126,314,089 | |
| | | | | | | | |
| | | | | | | | 245,343,362 | |
| Foreign Equity Funds—41.2% | | | | | | | | |
| Oppenheimer Developing Markets Fund, Cl. I | | | 3,773,674 | | | | 153,928,174 | |
| Oppenheimer Emerging Markets Innovators Fund, Cl. I2 | | | 7,671,316 | | | | 74,641,907 | |
| Oppenheimer Global Fund, Cl. I | | | 3,000,229 | | | | 245,148,690 | |
| Oppenheimer International Equity Fund, Cl. I | | | 8,901,378 | | | | 170,461,383 | |
| Oppenheimer International Growth Fund, Cl. I | | | 4,262,607 | | | | 158,270,596 | |
| Oppenheimer InternationalSmall-Mid Co. Fund, Cl. I | | | 2,242,751 | | | | 97,469,947 | |
| Oppenheimer Macquarie Global Infrastructure Fund, Cl. I | | | 3,484,852 | | | | 37,287,913 | |
| | | | | | | | |
| | | | | | | | 937,208,610 | |
| Foreign Fixed Income Fund—3.8% | | | | | | | | |
| Oppenheimer International Bond Fund, Cl. I | | | 15,820,013 | | | | 87,959,275 | |
Money Market Fund—0.0% | | | | | | | | |
| Oppenheimer Institutional Government Money Market Fund, Cl. E, 2.35%3 | | | 673,284 | | | | 673,284 | |
| Total Investments, at Value (Cost $1,993,016,776) | | | 99.7 | % | | | 2,269,782,800 | |
Net Other Assets (Liabilities) | | | 0.3 | | | | 5,802,399 | |
Net Assets | | | 100.0 | % | | $ | 2,275,585,199 | |
| | | | | | | | |
Footnotes to Statement of Investments
1. Is or was an affiliate, as defined in the Investment Company Act of 1940, as amended, at or during the reporting period, by virtue of the Fund owning at least 5% of the voting securities of the issuer or as a result of the Fund and the issuer having the same investment adviser. Transactions during the reporting period in which the issuer was an affiliate are as follows:
| | | | | | | | | | | | | | | | |
| | | Shares
January 31, 2018 | | Gross
Additions | | Gross
Reductions | | Shares
January 31, 2019 |
Investment Companies Alternative Funds | | | | | | | | | | | | | | | | |
Oppenheimer Fundamental Alternatives Fund, Cl. I | | | 363,572 | | | | 1,102,478 | | | | 94,832 | | | | 1,371,218 | |
Oppenheimer Global Multi Strategies Fund, Cl. I | | | 870,291 | | | | 755 | | | | 871,046 | | | | — | |
|
| 12 OPPENHEIMER PORTFOLIO SERIES ACTIVE ALLOCATION FUND |
| | | | | | | | | | | | | | | | |
Footnotes to Statement of Investments (Continued) | |
| | | Shares
January 31, 2018 | | Gross
Additions | | Gross
Reductions | | Shares
January 31, 2019 |
| Oppenheimer Gold & Special Minerals Fund, Cl. I | | | 469,836 | | | | 729,375 | | | | 1,037,820 | | | | 161,391 | |
| Oppenheimer Master Event-Linked Bond Fund, LLC | | | 1,493,604 | | | | 4,044,222 | | | | 284,241 | | | | 5,253,585 | |
| Oppenheimer Real Estate Fund, Cl. I | | | 547,627 | | | | 1,775,521 | | | | 97,865 | | | | 2,225,283 | |
| Oppenheimer SteelPath MLP Select 40 Fund, Cl. I | | | — | | | | 4,773,507 | | | | 95,304 | | | | 4,678,203 | |
| Domestic Equity Funds | | | | | | | | | | | | | | | | |
| Oppenheimer Capital Appreciation Fund, Cl. I | | | 9,005,104 | | | | 317,317 | | | | 6,019,452 | | | | 3,302,969 | |
| Oppenheimer Discovery Mid Cap Growth Fund, Cl. I | | | — | | | | 2,646,384 | | | | 52,537 | | | | 2,593,847 | |
| Oppenheimer Main Street Mid Cap Fund, Cl. I | | | 3,854,798 | | | | 199,533 | | | | 3,310,631 | | | | 743,700 | |
| Oppenheimer Main Street Small Cap Fund, Cl. I | | | 6,199,301 | | | | 1,052,224 | | | | 869,082 | | | | 6,382,443 | |
| Oppenheimer Value Fund, Cl. I | | | 15,013,184 | | | | 1,929,586 | | | | 3,877,042 | | | | 13,065,728 | |
| Domestic Fixed Income Funds | | | | | | | | | | | | | | | | |
| Oppenheimer Limited-Term Government Fund, Cl. I | | | 14,292,458 | | | | 3,949,334 | | | | 6,081,420 | | | | 12,160,372 | |
| Oppenheimer Master Inflation Protected Securities Fund, LLC | | | 3,653,830 | | | | 821,684 | | | | 2,369,519 | | | | 2,105,995 | |
| Oppenheimer Master Loan Fund, LLC | | | 2,806,582 | | | | 533,343 | | | | 968,141 | | | | 2,371,784 | |
| Oppenheimer Total Return Bond Fund, Cl. I | | | 22,710,820 | | | | 4,437,276 | | | | 8,153,496 | | | | 18,994,600 | |
| Foreign Equity Funds | | | | | | | | | | | | | | | | |
| Oppenheimer Developing Markets Fund, Cl. I | | | 2,805,883 | | | | 1,315,673 | | | | 347,882 | | | | 3,773,674 | |
| Oppenheimer Emerging Markets Innovators Fund, Cl. I | | | — | | | | 7,829,019 | | | | 157,703 | | | | 7,671,316 | |
| Oppenheimer Global Fund, Cl. I | | | — | | | | 3,059,601 | | | | 59,372 | | | | 3,000,229 | |
| Oppenheimer International Equity Fund, Cl. I | | | 11,557,153 | | | | 1,150,360 | | | | 3,806,135 | | | | 8,901,378 | |
| Oppenheimer International Growth Fund, Cl. I | | | 6,211,070 | | | | 773,468 | | | | 2,721,931 | | | | 4,262,607 | |
| Oppenheimer International Small- Mid Co. Fund, Cl. I | | | 2,049,178 | | | | 406,559 | | | | 212,986 | | | | 2,242,751 | |
| Oppenheimer Macquarie Global Infrastructure Fund, Cl. I | | | — | | | | 3,555,855 | | | | 71,003 | | | | 3,484,852 | |
| Foreign Fixed Income Funds | | | | | | | | | | | | | | | | |
| Oppenheimer International Bond Fund, Cl. I | | | 12,724,854 | | | | 4,684,108 | | | | 1,588,949 | | | | 15,820,013 | |
| Money Market Funds | | | | | | | | | | | | | | | | |
| Oppenheimer Institutional Government Money Market Fund, Cl. E | | | 5,206,535 | | | | 2,911,689 | | | | 7,444,940 | | | | 673,284 | |
|
| 13 OPPENHEIMER PORTFOLIO SERIES ACTIVE ALLOCATION FUND |
STATEMENT OF INVESTMENTSContinued
| | | | | | | | | | | | | | | | |
Footnotes to Statement of Investments (Continued) | |
| | | Value | | Income | | Realized Gain (Loss) | | Change in
Unrealized Gain (Loss) |
| Investment Companies Alternative Funds | | | | | | | | | | | | | | | | |
| Oppenheimer Fundamental Alternatives Fund, Cl. I | | $ | 36,817,196 | | | $ | 780,047 | | | $ | (16,903) | | | $ | (1,426,488) | |
| Oppenheimer Global Multi Strategies Fund, Cl. I | | | — | | | | — | | | | (3,092,029) | | | | 2,713,037 | |
| Oppenheimer Gold & Special Minerals Fund, Cl. I | | | 2,569,343 | | | | — | | | | (5,164,658) | | | | 3,888,100 | |
| Oppenheimer Master Event-Linked Bond Fund, LLC | | | 81,371,811 | | | | 2,973,285 | a | | | (1,030,932) | a | | | (1,316,860) | a |
| Oppenheimer Real Estate Fund, Cl. Ib | | | 55,743,331 | | | | 573,314 | | | | 375,136 | | | | 1,430,072 | |
| Oppenheimer SteelPath MLP Select 40 Fund, Cl. I | | | 36,630,327 | | | | 550,377 | | | | (53,530) | | | | (483,660) | |
| Domestic Equity Funds | | | | | | | | | | | | | | | | |
| Oppenheimer Capital Appreciation Fund, Cl. Ic | | | 202,472,004 | | | | 443,169 | | | | 85,463,659 | | | | (117,893,122) | |
| Oppenheimer Discovery Mid Cap Growth Fund, Cl. Id | | | 55,222,999 | | | | — | | | | (139,777) | | | | (2,259,413) | |
| Oppenheimer Main Street Mid Cap Fund, Cl. Ie | | | 18,882,546 | | | | 159,598 | | | | 9,870,058 | | | | (19,332,428) | |
| Oppenheimer Main Street Small Cap Fund, Cl. If | | | 89,609,501 | | | | 332,882 | | | | 2,036,773 | | | | (10,079,754) | |
| Oppenheimer Value Fund, Cl. Ig | | | 419,279,211 | | | | 9,217,501 | | | | 38,260,554 | | | | (139,328,791) | |
| Domestic Fixed Income Funds | | | | | | | | | | | | | | | | |
| Oppenheimer Limited-Term Government Fund, Cl. I | | | 52,654,409 | | | | 1,741,277 | | | | (1,789,968) | | | | 1,425,078 | |
| Oppenheimer Master Inflation Protected Securities Fund, LLC | | | 25,568,159 | | | | 1,312,596 | h | | | (973,333) | h | | | (263,468) | h |
| Oppenheimer Master Loan Fund, LLC | | | 40,806,705 | | | | 2,603,873 | i | | | 398,495i | | | | (2,317,916) | i |
| Oppenheimer Total Return Bond Fund, Cl. I | | | 126,314,089 | | | | 5,629,542 | | | | (432,268) | | | | (3,292,682) | |
| Foreign Equity Funds | | | | | | | | | | | | | | | | |
| Oppenheimer Developing Markets Fund, Cl. I | | | 153,928,174 | | | | 1,079,314 | | | | 4,397,105 | | | | (20,378,058) | |
| Oppenheimer Emerging Markets Innovators Fund, Cl. I | | | 74,641,907 | | | | — | | | | (18,420) | | | | 3,212,931 | |
| Oppenheimer Global Fund, Cl. Ij | | | 245,148,690 | | | | 1,437,814 | | | | (648,190) | | | | (10,115,895) | |
| Oppenheimer International Equity Fund, Cl. I | | | 170,461,383 | | | | 3,036,504 | | | | 10,135,711 | | | | (59,574,854) | |
| Oppenheimer International Growth Fund, Cl. I | | | 158,270,596 | | | | 2,804,883 | | | | 22,895,940 | | | | (79,515,033) | |
| Oppenheimer International Small-Mid Co. Fund, Cl. Ik | | | 97,469,947 | | | | 997,558 | | | | 4,238,725 | | | | (22,189,593) | |
| Oppenheimer Macquarie Global Infrastructure Fund, Cl. Il | | | 37,287,913 | | | | 181,773 | | | | (9,715) | | | | 1,218,853 | |
| Foreign Fixed Income Funds | | | | | | | | | | | | | | | | |
| Oppenheimer International Bond Fund, Cl. I | | | 87,959,275 | | | | 2,361,962 | | | | (27,768) | | | | (5,752,338) | |
|
| 14 OPPENHEIMER PORTFOLIO SERIES ACTIVE ALLOCATION FUND |
| | | | | | | | | | | | | | | | |
Footnotes to Statement of Investments (Continued) | |
| | | Value | | Income | | Realized Gain
(Loss) | | Change in
Unrealized Gain (Loss) |
Money Market Funds | | | | | | | | | | | | | | | | |
| Oppenheimer Institutional Government Money Market Fund, Cl. E | | $ | 673,284 | | | $ | 101,256 | | | $ | — | | | $ | — | |
| Total | | $ | 2,269,782,800 | | | $ | 38,318,525 | | | $ | 164,674,665 | | | $ | (481,632,282) | |
| | | | | | | | | | | | | | | | |
a. Represents the amount allocated to the Fund from Oppenheimer Master Event-Linked Bond Fund, LLC.
b. This fund distributed realized gains of $1,381,541.
c. This fund distributed realized gains of $14,356,086.
d. This fund distributed realized gains of $2,855,300.
e. This fund distributed realized gains of $4,006,268.
f. This fund distributed realized gains of $6,031,490.
g. This fund distributed realized gains of $47,360,951.
h. Represents the amount allocated to the Fund from Oppenheimer Master Inflation Protected Securities Fund, LLC.
i. Represents the amount allocated to the Fund from Oppenheimer Master Loan Fund, LLC.
j. This fund distributed realized gains of $16,067,767.
k. This fund distributed realized gains of $8,682,506.
l. This fund distributed realized gains of $129,631.
2.Non-income producing security.
3. Rate shown is the7-day yield at period end.
See accompanying Notes to Financial Statements.
|
| 15 OPPENHEIMER PORTFOLIO SERIES ACTIVE ALLOCATION FUND |
STATEMENT OF ASSETS AND LIABILITIESJanuary 31, 2019
| | | | |
| Assets | | | | |
| Investments, at value—see accompanying statement of investments—affiliated companies (cost $1,993,016,776) | | $ | 2,269,782,800 | |
| Cash | | | 5,579,471 | |
| Receivables and other assets: | | | | |
| Investments sold | | | 2,712,953 | |
| Dividends | | | 900,117 | |
| Shares of beneficial interest sold | | | 821,260 | |
| Other | | | 119,105 | |
| Total assets | | | 2,279,915,706 | |
| | | | | |
| Liabilities | | | | |
| Payables and other liabilities: | | | | |
| Shares of beneficial interest redeemed | | | 2,740,148 | |
| Investments purchased | | | 898,736 | |
| Distribution and service plan fees | | | 462,284 | |
| Trustees’ compensation | | | 177,028 | |
| Shareholder communications | | | 11,275 | |
| Other | | | 41,036 | |
| Total liabilities | | | 4,330,507 | |
| | | | | |
Net Assets | | $ | 2,275,585,199 | |
| | | | |
| | | | | |
| Composition of Net Assets | | | | |
| Par value of shares of beneficial interest | | $ | 164,573 | |
| Additionalpaid-in capital | | | 1,920,846,137 | |
| Total distributable earnings | | | 354,574,489 | |
Net Assets | | $ | 2,275,585,199 | |
| | | | |
| | | | | |
| Net Asset Value Per Share | | | | |
Class A Shares: | | | | |
| |
| Net asset value and redemption price per share (based on net assets of $1,636,758,965 and 117,812,347 shares of beneficial interest outstanding) | | | $13.89 | |
| |
| Maximum offering price per share (net asset value plus sales charge of 5.75% of offering price) | | | $14.74 | |
| |
Class C Shares: | | | | |
| |
| Net asset value, redemption price (excludes applicable contingent deferred sales charge) and offering price per share (based on net assets of $489,473,827 and 35,983,716 shares of beneficial interest outstanding) | | | $13.60 | |
| |
Class R Shares: | | | | |
| |
| Net asset value, redemption price (excludes applicable contingent deferred sales charge) and offering price per share (based on net assets of $125,161,769 and 9,059,022 shares of beneficial interest outstanding) | | | $13.82 | |
| |
Class Y Shares: | | | | |
| |
| Net asset value, redemption price and offering price per share (based on net assets of $24,190,638 and 1,718,380 shares of beneficial interest outstanding) | | | $14.08 | |
See accompanying Notes to Financial Statements.
|
| 16 OPPENHEIMER PORTFOLIO SERIES ACTIVE ALLOCATION FUND |
STATEMENT OF
OPERATIONSFor the Year Ended January 31, 2019
| | | | |
| Allocation of Income and Expenses from Master Funds1 | | | | |
Net investment income allocated from Oppenheimer Master Event-Linked Bond Fund, LLC: | | | | |
Interest | | $ | 2,952,108 | |
Dividends | | | 21,177 | |
Net expenses | | | (173,095) | |
Net investment income allocated from Oppenheimer Master Event-Linked Bond Fund, LLC | | | 2,800,190 | |
Net investment income allocated from Oppenheimer Master Inflation Protected Securities | | | | |
Fund, LLC: | | | | |
Interest | | | 1,306,517 | |
Dividends | | | 6,079 | |
Net expenses | | | (215,738) | |
Net investment income allocated from Oppenheimer Master Inflation Protected Securities | | | | |
Fund, LLC | | | 1,096,858 | |
Net investment income allocated from Oppenheimer Master Loan Fund, LLC: | | | | |
Interest | | | 2,549,163 | |
Dividends | | | 54,710 | |
Net expenses | | | (168,481) | |
Net investment income allocated from Oppenheimer Master Loan Fund, LLC | | | 2,435,392 | |
Total allocation of net investment income from master funds | | | 6,332,440 | |
| Investment Income | | | | |
Dividends from affiliated companies | | | 31,428,771 | |
Interest | | | 49,697 | |
Total investment income | | | 31,478,468 | |
| Expenses | | | | |
Distribution and service plan fees: | | | | |
Class A | | | 4,218,426 | |
Class B2 | | | 19,155 | |
Class C | | | 5,254,765 | |
Class R | | | 631,150 | |
Transfer and shareholder servicing agent fees: | | | | |
Class A | | | 3,396,732 | |
Class B2 | | | 3,756 | |
Class C | | | 1,030,101 | |
Class R | | | 249,043 | |
Class Y | | | 105,596 | |
Shareholder communications: | | | | |
Class A | | | 31,387 | |
Class B2 | | | 346 | |
Class C | | | 8,647 | |
Class R | | | 2,072 | |
Class Y | | | 555 | |
Asset allocation fees | | | 2,453,978 | |
Trustees’ compensation | | | 35,017 | |
Custodian fees and expenses | | | 21,070 | |
Other | | | 87,182 | |
Total expenses | | | 17,548,978 | |
|
| 17 OPPENHEIMER PORTFOLIO SERIES ACTIVE ALLOCATION FUND |
STATEMENT OF
OPERATIONSContinued
| | | | |
| Expenses (Continued) | | | | |
Less waivers and reimbursements of expenses | | $ | (981,591) | |
| | | | |
Net expenses | | | 16,567,387 | |
| Net Investment Income | | | 21,243,521 | |
| Realized and Unrealized Gain (Loss) | | | | |
Net realized gain on: | | | | |
Investment transactions in affiliated companies | | | 166,280,435 | |
| Distributions received from affiliate companies | | | 100,871,540 | |
Net realized gain (loss) allocated from: | | | | |
Oppenheimer Master Event-Linked Bond Fund, LLC | | | (1,030,932) | |
Oppenheimer Master Inflation Protected Securities Fund, LLC | | | (973,333) | |
Oppenheimer Master Loan Fund, LLC | | | 398,495 | |
| | | | |
| Net realized gain | | | 265,546,205 | |
Net change in unrealized appreciation/(depreciation) on: | | | | |
| Investment transactions in affiliated companies | | | (477,734,038) | |
Net change in unrealized appreciation/(depreciation) allocated from: | | | | |
Oppenheimer Master Event-Linked Bond Fund, LLC | | | (1,316,860) | |
Oppenheimer Master Inflation Protected Securities Fund, LLC | | | (263,468) | |
Oppenheimer Master Loan Fund, LLC | | | (2,317,916) | |
| | | | |
Net change in unrealized appreciation/(depreciation) | | | (481,632,282) | |
| | | | | |
Net Decrease in Net Assets Resulting from Operations | | $ | (194,842,556) | |
| | | | |
1. The Fund invests in certain affiliated mutual funds that expect to be treated as partnerships for tax purposes. See
Note 4 of the accompanying Notes.
2. Effective June 1, 2018, all Class B shares converted to Class A shares.
See accompanying Notes to Financial Statements.
|
| 18 OPPENHEIMER PORTFOLIO SERIES ACTIVE ALLOCATION FUND |
STATEMENTS OF CHANGES IN NET ASSETS
| | | | | | | | |
| | | Year Ended
January 31, 2019 | | | Year Ended
January 31, 20181 |
| Operations | | | | | | | | |
| Net investment income | | $ | 21,243,521 | | | $ | 14,027,621 | |
| Net realized gain | | | 265,546,205 | | | | 210,265,730 | |
| Net change in unrealized appreciation/(depreciation) | | | (481,632,282) | | | | 265,121,591 | |
| | | | |
| Net increase (decrease) in net assets resulting from operations | | | (194,842,556) | | | | 489,414,942 | |
| | | | | | | | | |
| Dividends and/or Distributions to Shareholders | | | | | | | | |
| Dividends and distributions declared: | | | | | | | | |
| Class A | | | (27,862,215) | | | | (20,135,054) | |
| Class B2 | | | — | | | | — | |
| Class C | | | (4,583,299) | | | | (2,258,627) | |
| Class R | | | (1,804,076) | | | | (1,116,655) | |
| Class Y | | | (423,069) | | | | (772,087) | |
| | | | |
| Total dividends and distributions declared | | | (34,672,659) | | | | (24,282,423) | |
| | | | | | | | | |
| Beneficial Interest Transactions | | | | | | | | |
| Net increase (decrease) in net assets resulting from beneficial interest transactions: | | | | | | | | |
| Class A | | | (89,769,891) | | | | (80,802,213) | |
| Class B2 | | | (12,190,697) | | | | (35,083,644) | |
| Class C | | | (41,140,743) | | | | (57,650,166) | |
| Class R | | | 2,511,712 | | | | (5,783,509) | |
| Class Y | | | (33,580,542) | | | | (4,424,578) | |
| | | | |
| Total beneficial interest transactions | | | (174,170,161) | | | | (183,744,110) | |
| | | | | | | | | |
| Net Assets | | | | | | | | |
| Total increase (decrease) | | | (403,685,376) | | | | 281,388,409 | |
| Beginning of period | | | 2,679,270,575 | | | | 2,397,882,166 | |
| | | | |
| End of period | | $ | 2,275,585,199 | | | $ | 2,679,270,575 | |
| | | | |
1. Prior period amounts have been conformed to current year presentation. See Notes to Financial Statements, Note
2—New Accounting Pronouncements for further details.
2. Effective June 1, 2018, all Class B shares converted to Class A shares.
See accompanying Notes to Financial Statements.
|
| 19 OPPENHEIMER PORTFOLIO SERIES ACTIVE ALLOCATION FUND |
FINANCIAL HIGHLIGHTS
| | | | | | | | | | | | | | | | | | | | |
| Class A | | Year Ended
January 31,
2019 | | | Year Ended
January 31,
2018 | | | Year Ended
January 31,
2017 | | | Year Ended
January 29,
20161 | | | Year Ended
January 30,
20151 | |
| | | | | |
| Per Share Operating Data | | | | | | | | | | | | | | | | | | | | |
| Net asset value, beginning of period | | | $15.25 | | | | $12.68 | | | | $11.38 | | | | $12.12 | | | | $11.52 | |
| Income (loss) from investment operations: | | | | | | | | | | | | | | | | | | | | |
| Net investment income2 | | | 0.15 | | | | 0.10 | | | | 0.15 | | | | 0.09 | | | | 0.11 | |
| Net realized and unrealized gain (loss) | | | (1.27) | | | | 2.63 | | | | 1.27 | | | | (0.65) | | | | 0.61 | |
| Total from investment operations | | | (1.12) | | | | 2.73 | | | | 1.42 | | | | (0.56) | | | | 0.72 | |
| Dividends and/or distributions to shareholders: | | | | | | | | | | | | | | | | | | | | |
| Dividends from net investment income | | | (0.24) | | | | (0.16) | | | | (0.12) | | | | (0.18) | | | | (0.12) | |
| Net asset value, end of period | | | $13.89 | | | | $15.25 | | | | $12.68 | | | | $11.38 | | | | $12.12 | |
| | | | |
| | | | | | | | | | | | | | | | | | | | |
| Total Return, at Net Asset Value3 | | | (7.22)% | | | | 21.62% | | | | 12.50% | | | | (4.67)% | | | | 6.26% | |
| | | | | | | | | | | | | | | | | | | | |
| Ratios/Supplemental Data | | | | | | | | | | | | | | | | | | | | |
| Net assets, end of period (in thousands) | | | $1,636,759 | | | | $1,888,596 | | | | $1,645,373 | | | | $1,530,527 | | | | $1,599,618 | |
| Average net assets (in thousands) | | | $1,741,048 | | | | $1,749,924 | | | | $1,606,586 | | | | $1,646,634 | | | | $1,591,772 | |
| Ratios to average net assets:4,5 | | | | | | | | | | | | | | | | | | | | |
| Net investment income | | | 1.04% | | | | 0.75% | | | | 1.20% | | | | 0.74% | | | | 0.93% | |
| Expenses excluding specific expenses listed below | | | 0.57% | | | | 0.59% | | | | 0.60% | | | | 0.59% | | | | 0.59% | |
| Interest and fees from borrowings | | | 0.00% | | | | 0.00% | | | | 0.00%6 | | | | 0.00%6 | | | | 0.00% | |
| Total expenses7 | | | 0.57% | | | | 0.59% | | | | 0.60% | | | | 0.59% | | | | 0.59% | |
| Expenses after payments, waivers and/or reimbursements and reduction to custodian expenses | | | 0.53% | | | | 0.53% | | | | 0.56% | | | | 0.55% | | | | 0.55% | |
| Portfolio turnover rate | | | 38% | | | | 9% | | | | 5% | | | | 8% | | | | 15% | |
1. Represents the last business day of the Fund’s reporting period.
2. Per share amounts calculated based on the average shares outstanding during the period.
3. Assumes an initial investment on the business day before the first day of the fiscal period, with all dividends and distributions reinvested in additional shares on the reinvestment date, and redemption at the net asset value calculated on the last business day of the fiscal period. Sales charges are not reflected in the total returns. Total returns are not annualized for periods less than one full year. Returns do not reflect the deduction of taxes that a shareholder would pay on fund distributions or the redemption of fund shares.
4. Annualized for periods less than one full year.
5. Includes the Fund’s share of the allocated expenses and/or net investment income from the master funds.
6. Less than 0.005%.
7. Total expenses including indirect expenses from affiliated fund fees and expenses were as follows:
| | | | | | | | |
| Year Ended January 31, 2019 | | | 1.20% | | | | | |
| Year Ended January 31, 2018 | | | 1.22% | | | | | |
| Year Ended January 31, 2017 | | | 1.23% | | | | | |
| Year Ended January 29, 2016 | | | 1.21% | | | | | |
| Year Ended January 30, 2015 | | | 1.21% | | | | | |
See accompanying Notes to Financial Statements.
|
| 20 OPPENHEIMER PORTFOLIO SERIES ACTIVE ALLOCATION FUND |
| | | | | | | | | | | | | | | | | | | | |
| Class C | | Year Ended
January 31,
2019 | | | Year Ended
January 31,
2018 | | | Year Ended
January 31,
2017 | | | Year Ended
January 29,
20161 | | | Year Ended
January 30,
20151 | |
| | | | | |
| Per Share Operating Data | | | | | | | | | | | | | | | | | | | | |
| Net asset value, beginning of period | | | $14.92 | | | | $12.41 | | | | $11.14 | | | | $11.87 | | | | $11.28 | |
| Income (loss) from investment operations: | | | | | | | | | | | | | | | | | | | | |
| Net investment income2 | | | 0.04 | | | | 0.003 | | | | 0.05 | | | | 0.003 | | | | 0.02 | |
| Net realized and unrealized gain (loss) | | | (1.23) | | | | 2.57 | | | | 1.25 | | | | (0.64) | | | | 0.60 | |
| Total from investment operations | | | (1.19) | | | | 2.57 | | | | 1.30 | | | | (0.64) | | | | 0.62 | |
| Dividends and/or distributions to shareholders: | | | | | | | | | | | | | | | | | | | | |
| Dividends from net investment income | | | (0.13) | | | | (0.06) | | | | (0.03) | | | | (0.09) | | | | (0.03) | |
| Net asset value, end of period | | | $13.60 | | | | $14.92 | | | | $12.41 | | | | $11.14 | | | | $11.87 | |
| | | | |
| | | | | | | | | | | | | | | | | | | | |
| Total Return, at Net Asset Value4 | | | (7.92)% | | | | 20.72% | | | | 11.66% | | | | (5.41)% | | | | 5.53% | |
| | | | | | | | | | | | | | | | | | | | |
| Ratios/Supplemental Data | | | | | | | | | | | | | | | | | | | | |
| Net assets, end of period (in thousands) | | | $489,474 | | | | $579,999 | | | | $535,568 | | | | $522,227 | | | | $557,576 | |
| Average net assets (in thousands) | | | $527,915 | | | | $552,895 | | | | $533,800 | | | | $564,178 | | | | $562,221 | |
| Ratios to average net assets:5,6 | | | | | | | | | | | | | | | | | | | | |
| Net investment income (loss) | | | 0.28% | | | | (0.03)% | | | | 0.44% | | | | (0.01)% | | | | 0.18% | |
| Expenses excluding specific expenses listed below | | | 1.32% | | | | 1.34% | | | | 1.35% | | | | 1.34% | | | | 1.34% | |
| Interest and fees from borrowings | | | 0.00% | | | | 0.00% | | | | 0.00%7 | | | | 0.00%7 | | | | 0.00% | |
| Total expenses8 | | | 1.32% | | | | 1.34% | | | | 1.35% | | | | 1.34% | | | | 1.34% | |
| Expenses after payments, waivers and/or reimbursements and reduction to custodian expenses | | | 1.28% | | | | 1.28% | | | | 1.31% | | | | 1.30% | | | | 1.30% | |
| Portfolio turnover rate | | | 38% | | | | 9% | | | | 5% | | | | 8% | | | | 15% | |
1. Represents the last business day of the Fund’s reporting period.
2. Per share amounts calculated based on the average shares outstanding during the period.
3. Less than $0.005 per share.
4. Assumes an initial investment on the business day before the first day of the fiscal period, with all dividends and distributions reinvested in additional shares on the reinvestment date, and redemption at the net asset value calculated on the last business day of the fiscal period. Sales charges are not reflected in the total returns. Total returns are not annualized for periods less than one full year. Returns do not reflect the deduction of taxes that a shareholder would pay on fund distributions or the redemption of fund shares.
5. Annualized for periods less than one full year.
6. Includes the Fund’s share of the allocated expenses and/or net investment income from the master funds.
7. Less than 0.005%.
8. Total expenses including indirect expenses from affiliated fund fees and expenses were as follows:
| | | | | | | | |
| Year Ended January 31, 2019 | | | 1.95% | | | | | |
| Year Ended January 31, 2018 | | | 1.97% | | | | | |
| Year Ended January 31, 2017 | | | 1.98% | | | | | |
| Year Ended January 29, 2016 | | | 1.96% | | | | | |
| Year Ended January 30, 2015 | | | 1.96% | | | | | |
See accompanying Notes to Financial Statements.
|
| 21 OPPENHEIMER PORTFOLIO SERIES ACTIVE ALLOCATION FUND |
FINANCIAL HIGHLIGHTSContinued
| | | | | | | | | | | | | | | | | | | | |
| Class R | | Year Ended
January 31,
2019 | | | Year Ended
January 31,
2018 | | | Year Ended
January 31,
2017 | | | Year Ended
January 29,
20161 | | | Year Ended
January 30,
20151 | |
| | | | | |
| Per Share Operating Data | | | | | | | | | | | | | | | | | | | | |
| Net asset value, beginning of period | | | $15.17 | | | | $12.62 | | | | $11.32 | | | | $12.05 | | | | $11.45 | |
| Income (loss) from investment operations: | | | | | | | | | | | | | | | | | | | | |
| Net investment income2 | | | 0.11 | | | | 0.07 | | | | 0.11 | | | | 0.06 | | | | 0.08 | |
| Net realized and unrealized gain (loss) | | | (1.26) | | | | 2.61 | | | | 1.28 | | | | (0.64) | | | | 0.61 | |
| Total from investment operations | | | (1.15) | | | | 2.68 | | | | 1.39 | | | | (0.58) | | | | 0.69 | |
| Dividends and/or distributions to shareholders: | | | | | | | | | | | | | | | | | | | | |
| Dividends from net investment income | | | (0.20) | | | | (0.13) | | | | (0.09) | | | | (0.15) | | | | (0.09) | |
| Net asset value, end of period | | | $13.82 | | | | $15.17 | | | | $12.62 | | | | $11.32 | | | | $12.05 | |
| | | | |
| | | | | | | | | | | | | | | | | | | | |
| Total Return, at Net Asset Value3 | | | (7.44)% | | | | 21.28% | | | | 12.29% | | | | (4.88)% | | | | 5.99% | |
| | | | | | | | | | | | | | | | | | | | |
| Ratios/Supplemental Data | | | | | | | | | | | | | | | | | | | | |
| Net assets, end of period (in thousands) | | | $125,162 | | | | $134,457 | | | | $117,356 | | | | $108,810 | | | | $119,953 | |
| Average net assets (in thousands) | | | $127,683 | | | | $123,173 | | | | $112,804 | | | | $120,320 | | | | $127,487 | |
| Ratios to average net assets:4,5 | | | | | | | | | | | | | | | | | | | | |
| Net investment income | | | 0.78% | | | | 0.49% | | | | 0.94% | | | | 0.50% | | | | 0.66% | |
| Expenses excluding specific expenses listed below | | | 0.82% | | | | 0.84% | | | | 0.85% | | | | 0.84% | | | | 0.84% | |
| Interest and fees from borrowings | | | 0.00% | | | | 0.00% | | | | 0.00%6 | | | | 0.00%6 | | | | 0.00% | |
| Total expenses7 | | | 0.82% | | | | 0.84% | | | | 0.85% | | | | 0.84% | | | | 0.84% | |
| Expenses after payments, waivers and/or reimbursements and reduction to custodian expenses | | | 0.78% | | | | 0.78% | | | | 0.81% | | | | 0.80% | | | | 0.80% | |
| Portfolio turnover rate | | | 38% | | | | 9% | | | | 5% | | | | 8% | | | | 15% | |
1. Represents the last business day of the Fund’s reporting period.
2. Per share amounts calculated based on the average shares outstanding during the period.
3. Assumes an initial investment on the business day before the first day of the fiscal period, with all dividends and distributions reinvested in additional shares on the reinvestment date, and redemption at the net asset value calculated on the last business day of the fiscal period. Sales charges are not reflected in the total returns. Total returns are not annualized for periods less than one full year. Returns do not reflect the deduction of taxes that a shareholder would pay on fund distributions or the redemption of fund shares.
4. Annualized for periods less than one full year.
5. Includes the Fund’s share of the allocated expenses and/or net investment income from the master funds.
6. Less than 0.005%.
7. Total expenses including indirect expenses from affiliated fund fees and expenses were as follows:
| | | | | | | | |
| Year Ended January 31, 2019 | | | 1.45% | | | | | |
Year Ended January 31, 2018 | | | 1.47% | | | | | |
| Year Ended January 31, 2017 | | | 1.48% | | | | | |
Year Ended January 29, 2016 | | | 1.46% | | | | | |
| Year Ended January 30, 2015 | | | 1.46% | | | | | |
See accompanying Notes to Financial Statements.
|
| 22 OPPENHEIMER PORTFOLIO SERIES ACTIVE ALLOCATION FUND |
| | | | | | | | | | | | | | | | | | | | |
| Class Y | | Year Ended
January 31,
2019 | | | Year Ended
January 31,
2018 | | | Year Ended
January 31,
2017 | | | Year Ended
January 29,
20161 | | | Year Ended
January 30,
20151 | |
| | | | | |
| Per Share Operating Data | | | | | | | | | | | | | | | | | | | | |
| Net asset value, beginning of period | | | $15.42 | | | | $12.81 | | | | $11.51 | | | | $12.25 | | | | $11.65 | |
| Income (loss) from investment operations: | | | | | | | | | | | | | | | | | | | | |
| Net investment income2 | | | 0.19 | | | | 0.13 | | | | 0.20 | | | | 0.14 | | | | 0.17 | |
| Net realized and unrealized gain (loss) | | | (1.29) | | | | 2.68 | | | | 1.26 | | | | (0.66) | | | | 0.59 | |
| Total from investment operations | | | (1.10) | | | | 2.81 | | | | 1.46 | | | | (0.52) | | | | 0.76 | |
| Dividends and/or distributions to shareholders: | | | | | | | | | | | | | | | | | | | | |
| Dividends from net investment income | | | (0.24) | | | | (0.20) | | | | (0.16) | | | | (0.22) | | | | (0.16) | |
| Net asset value, end of period | | | $14.08 | | | | $15.42 | | | | $12.81 | | | | $11.51 | | | | $12.25 | |
| | | | |
| | | | | | | | | | | | | | | | | | | | |
| Total Return, at Net Asset Value3 | | | (7.00)% | | | | 21.98% | | | | 12.69% | | | | (4.34)% | | | | 6.52% | |
| | | | | | | | | | | | | | | | | | | | |
| Ratios/Supplemental Data | | | | | | | | | | | | | | | | | | | | |
| Net assets, end of period (in thousands) | | | $24,190 | | | | $63,523 | | | | $56,496 | | | | $38,762 | | | | $30,551 | |
| Average net assets (in thousands) | | | $53,966 | | | | $61,326 | | | | $41,675 | | | | $33,137 | | | | $17,424 | |
| Ratios to average net assets:4,5 | | | | | | | | | | | | | | | | | | | | |
| Net investment income | | | 1.28% | | | | 0.90% | | | | 1.65% | | | | 1.14% | | | | 1.35% | |
| Expenses excluding specific expenses listed below | | | 0.33% | | | | 0.34% | | | | 0.35% | | | | 0.35% | | | | 0.35% | |
| Interest and fees from borrowings | | | 0.00% | | | | 0.00% | | | | 0.00%6 | | | | 0.00%6 | | | | 0.00% | |
| Total expenses7 | | | 0.33% | | | | 0.34% | | | | 0.35% | | | | 0.35% | | | | 0.35% | |
| Expenses after payments, waivers and/or reimbursements and reduction to custodian expenses | | | 0.29% | | | | 0.28% | | | | 0.31% | | | | 0.31% | | | | 0.31% | |
| Portfolio turnover rate | | | 38% | | | | 9% | | | | 5% | | | | 8% | | | | 15% | |
1. Represents the last business day of the Fund’s reporting period.
2. Per share amounts calculated based on the average shares outstanding during the period.
3. Assumes an initial investment on the business day before the first day of the fiscal period, with all dividends and distributions reinvested in additional shares on the reinvestment date, and redemption at the net asset value calculated on the last business day of the fiscal period. Sales charges are not reflected in the total returns. Total returns are not annualized for periods less than one full year. Returns do not reflect the deduction of taxes that a shareholder would pay on fund distributions or the redemption of fund shares.
4. Annualized for periods less than one full year.
5. Includes the Fund’s share of the allocated expenses and/or net investment income from the master funds.
6. Less than 0.005%.
7. Total expenses including indirect expenses from affiliated fund fees and expenses were as follows:
| | | | | | | | |
| Year Ended January 31, 2019 | | | 0.96% | | | | | |
Year Ended January 31, 2018 | | | 0.97% | | | | | |
| Year Ended January 31, 2017 | | | 0.98% | | | | | |
Year Ended January 29, 2016 | | | 0.97% | | | | | |
| Year Ended January 30, 2015 | | | 0.97% | | | | | |
See accompanying Notes to Financial Statements.
|
| 23 OPPENHEIMER PORTFOLIO SERIES ACTIVE ALLOCATION FUND |
NOTES TO FINANCIAL STATEMENTSJanuary 31, 2019
1. Organization
Oppenheimer Portfolio Series (the “Trust”) is registered under the Investment Company Act of
1940 (“1940 Act”), as amended, as a diversifiedopen-end management investment company.
Active Allocation Fund (the “Fund”) is a series of the Trust whose investment objective is to seek total return. The Fund normally invests in a diversified portfolio of Oppenheimer mutual funds (individually, an “Underlying Fund” and collectively, the “Underlying Funds”). The Fund’s investment adviser is OFI Global Asset Management, Inc. (“OFI Global” or the “Manager”), a wholly-owned subsidiary of OppenheimerFunds, Inc. (“OFI” or the“Sub-Adviser”). The Manager has entered into asub-advisory agreement with OFI.
The Fund offers Class A, Class C, Class R and Class Y shares, and previously offered Class B shares for new purchase through June 29, 2012. Subsequent to that date, no new purchases of Class B shares were permitted. Reinvestment of dividend and/or capital gain distributions and exchanges of Class B shares into and from other Oppenheimer funds were permitted through May 31, 2018. Effective June 1, 2018 (the “Conversion Date”), all Class B shares converted to Class A shares. Class A shares are sold at their offering price, which is normally net asset value plus afront-end sales charge. Class C and Class R shares are sold, and Class B shares were sold, without afront-end sales charge but may be subject to a contingent deferred sales charge (“CDSC”). Class R shares are sold only through retirement plans. Retirement plans that offer Class R shares may impose charges on those accounts. Class Y shares are sold to certain institutional investors or intermediaries without either afront-end sales charge or a CDSC, however, the intermediaries may impose charges on their accountholders who beneficially own Class Y shares. All classes of shares have identical rights and voting privileges with respect to the Fund in general and exclusive voting rights on matters that affect that class alone. Earnings, net assets and net asset value per share may differ due to each class having its own expenses, such as transfer and shareholder servicing agent fees and shareholder communications, directly attributable to that class. Class A, C and R shares have, and Class B shares had, separate distribution and/or service plans under which they pay, and Class B shares paid, fees. Class Y shares do not pay such fees. Previously issued Class B shares automatically converted to Class A shares 72 months after the date of purchase.
The following is a summary of significant accounting policies followed in the Fund’s preparation of financial statements in accordance with accounting principles generally accepted in the United States (“U.S. GAAP”).
2. Significant Accounting Policies
Security Valuation.All investments in securities are recorded at their estimated fair value, as described in Note 3.
Allocation of Income, Expenses, Gains and Losses.Income, expenses (other than those attributable to a specific class), gains and losses are allocated on a daily basis to each class of shares based upon the relative proportion of net assets represented by such class. Operating expenses directly attributable to a specific class are charged against the operations of that
|
| 24 OPPENHEIMER PORTFOLIO SERIES ACTIVE ALLOCATION FUND |
2. Significant Accounting Policies (Continued)
class.
Dividends and Distributions to Shareholders. Dividends and distributions to shareholders, which are determined in accordance with income tax regulations and may differ from U.S. GAAP, are recorded on theex-dividend date. Income and capital gain distributions, if any, are declared and paid annually or at other times as determined necessary by the Manager.
Investment Income.Dividend distributions received from the Underlying Funds are recorded on theex-dividend date. Upon receipt of notification from an Underlying Fund, and subsequent to theex-dividend date, some of the dividend income originally recorded by the Fund may be reclassified as a tax return of capital by reducing the cost basis of the Underlying Fund and/or increasing the realized gain on sales of investments in the Underlying Fund.
Custodian Fees. “Custodian fees and expenses” in the Statement of Operations may include interest expense incurred by the Fund on any cash overdrafts of its custodian account during the period. Such cash overdrafts may result from the effects of failed trades in portfolio securities and from cash outflows resulting from unanticipated shareholder redemption activity. The Fund pays interest to its custodian on such cash overdraft at a rate equal to the Prime Rate plus 0.35%. The “Reduction to custodian expenses” line item, if applicable, represents earnings on cash balances maintained by the Fund during the period. Such interest expense and other custodian fees may be paid with these earnings.
Security Transactions. Security transactions are recorded on the trade date. Realized gains and losses on securities sold are determined on the basis of identified cost.
Indemnifications.The Fund’s organizational documents provide current and former Trustees and officers with a limited indemnification against liabilities arising in connection with the performance of their duties to the Fund. In the normal course of business, the Fund may also enter into contracts that provide general indemnifications. The Fund’s maximum exposure under these arrangements is unknown as this would be dependent on future claims that may be made against the Fund. The risk of material loss from such claims is considered remote.
Federal Taxes.The Fund intends to comply with provisions of the Internal Revenue Code applicable to regulated investment companies and to distribute substantially all of its investment company taxable income, including any net realized gain on investments not offset by capital loss carryforwards, if any, to shareholders. Therefore, no federal income or excise tax provision is required. The Fund files income tax returns in U.S. federal and applicable state jurisdictions. The statute of limitations on the Fund’s tax return filings generally remains open for the three preceding fiscal reporting period ends. The Fund has analyzed its tax positions for the fiscal year ended January 31, 2019, including open tax years, and does not believe there are any uncertain tax positions requiring recognition in the Fund’s financial statements.
|
| 25 OPPENHEIMER PORTFOLIO SERIES ACTIVE ALLOCATION FUND |
NOTES TO FINANCIAL STATEMENTSContinued
2. Significant Accounting Policies (Continued)
The tax components of capital shown in the following table represent distribution requirements the Fund must satisfy under the income tax regulations, losses the Fund may be able to offset against income and gains realized in future years and unrealized appreciation or depreciation of securities and other investments for federal income tax purposes.
| | | | | | | | | | | | |
Undistributed Net Investment Income | | Undistributed
Long-Term
Gain | | | Accumulated
Loss
Carryforward1,2
| | | Net Unrealized
Appreciation
Based on cost of
Securities and
Other Investments
for Federal Income
Tax Purposes | |
$28,765,113 | | | $93,685,842 | | | | $— | | | | $232,296,777 | |
1.During the reporting period, the Fund utilized $143,139,986 of capital loss carryforward to offset capital gains realized in that fiscal year.
2.During the previous reporting period, the Fund utilized $190,061,560 of capital loss carryforward to offset capital gains realized in that fiscal year.
Net investment income (loss) and net realized gain (loss) may differ for financial statement and tax purposes. The character of dividends and distributions made during the fiscal year from net investment income or net realized gains are determined in accordance with federal income tax requirements, which may differ from the character of net investment income or net realized gains presented in those financial statements in accordance with U.S. GAAP. Also, due to timing of dividends and distributions, the fiscal year in which amounts are distributed may differ from the fiscal year in which the income or net realized gain was recorded by the Fund.
Accordingly, the following amounts have been reclassified for the reporting period. Net assets of the Fund were unaffected by the reclassifications.
| | | | |
Increase toPaid-in Capital | | Reduction to Accumulated Net
Earnings3 | |
$8,533,379 | | | $8,533,379 | |
3. $8,533,379, all of which was long-term capital gain, was distributed in connection with Fund share redemptions.
The tax character of distributions paid during the reporting periods:
| | | | | | | | |
| | | Year Ended | | | Year Ended | |
| | | January 31, 2019 | | | January 31, 2018 | |
Distributions paid from: | | | | | | | | |
Ordinary income | | $ | 34,672,659 | | | $ | 24,282,423 | |
The aggregate cost of securities and other investments and the composition of unrealized appreciation and depreciation of securities and other investments for federal income tax purposes at period end are noted in the following table. The primary difference between book and tax appreciation or depreciation of securities and other investments, if applicable, is attributable to the tax deferral of losses or tax realization of financial statement unrealized gain or loss.
|
| 26 OPPENHEIMER PORTFOLIO SERIES ACTIVE ALLOCATION FUND |
2. Significant Accounting Policies (Continued)
| | | | |
| Federal tax cost of securities | | $ | 2,037,486,023 | |
| | | | |
| Gross unrealized appreciation | | $ | 260,822,226 | |
| Gross unrealized depreciation | | | (28,525,449 | ) |
| | | | |
| Net unrealized appreciation | | $ | 232,296,777 | |
| | | | |
Use of Estimates. The preparation of financial statements in conformity with U.S. GAAP requires management to make estimates and assumptions that affect the reported amounts of assets and liabilities and disclosure of contingent assets and liabilities at the date of the financial statements and the reported amounts of increases and decreases in net assets from operations during the reporting period. Actual results could differ from those estimates.
New Accounting Pronouncements. In March 2017, Financial Accounting Standards Board (“FASB”) issued Accounting Standards Update (“ASU”), ASU2017-08. This provides guidance related to the amortization period for certain purchased callable debt securities held at a premium. The ASU is effective for annual periods beginning after December 15, 2018, and interim periods within those annual periods. The Manager has evaluated the impacts of these changes on the financial statements and there are no material impacts.
During August 2018, the Securities and Exchange Commission (the “SEC”) issued Final
Rule ReleaseNo. 33-10532 (the “Rule”), Disclosure Update and Simplification. The rule amends certain financial statement disclosure requirements to conform to U.S. GAAP. The amendments to Rule6-04.17 of RegulationS-X (balance sheet) remove the requirement to separately state the book basis components of net assets: undistributed (over-distribution of) net investment income (“UNII”), accumulated undistributed net realized gains (losses), and net unrealized appreciation (depreciation) at the balance sheet date. Instead, consistent with U.S. GAAP, funds will be required to disclose total distributable earnings. The amendments to Rule6-09 of RegulationS-X (statement of changes in net assets) remove the requirement to separately state the sources of distributions paid. Instead, consistent with U.S. GAAP, funds will be required to disclose the total amount of distributions paid, except that any tax return of capital must be separately disclosed. The amendments also remove the requirement to parenthetically state the book basis amount of UNII on the statement of changes in net assets. The requirements of the Rule were effective November 5, 2018, and the Fund’s Statement of Assets and Liabilities and Statement of Changes in Net Assets for the current reporting period have been modified accordingly. In addition, certain amounts within the Fund’s Statement of Changes in Net Assets for the prior fiscal period have been modified to conform to the Rule.
3. Securities Valuation
The Fund calculates the net asset value of its shares based upon the net asset value of the applicable investment companies. For each investment company, the net asset value per share for a class of shares is determined as of 4:00 P.M. Eastern Time, on each day the New York Stock Exchange (the “Exchange” or “NYSE”) is open for trading, except in the case of a scheduled early closing of the Exchange, in which case the Fund will calculate net asset
|
| 27 OPPENHEIMER PORTFOLIO SERIES ACTIVE ALLOCATION FUND |
NOTES TO FINANCIAL STATEMENTSContinued
3. Securities Valuation (Continued)
value of the shares as of the scheduled early closing time of the Exchange. This is calculated by dividing the value of the investment company’s net assets attributable to that class by the number of outstanding shares of that class on that day.
The Fund’s Board has adopted procedures for the valuation of the Fund’s securities and has delegated theday-to-day responsibility for valuation determinations under those procedures to the Manager. The Manager has established a Valuation Committee which is responsible for determining a fair valuation for any security for which market quotations are not readily available. The Valuation Committee’s fair valuation determinations are subject to review, approval and ratification by the Fund’s Board at least quarterly or more frequently, if necessary.
Valuations Methods and Inputs
To determine their net asset values, the Underlying Funds’ assets are valued primarily on the basis of current market quotations as generally supplied by third party portfolio pricing services or by dealers. Such market quotations are typically based on unadjusted quoted prices in active markets for identical securities or other observable market inputs.
Securities for which market quotations are not readily available, or when a significant event has occurred that would materially affect the value of the security, are fair valued either (i) by a standardized fair valuation methodology applicable to the security type or the significant event as previously approved by the Valuation Committee and the Fund’s Board or (ii) as determined in good faith by the Manager’s Valuation Committee. The Valuation Committee considers all relevant facts that are reasonably available, through either public information or information available to the Manager, when determining the fair value of a security. The methodologies used for valuing securities are not necessarily an indication of the risks associated with investing in those Underlying Funds.
Classifications
Each investment asset or liability of the Fund is assigned a level at measurement date based on the significance and source of the inputs to its valuation. Various data inputs may be used in determining the value of each of the Fund’s investments as of the reporting period end.
These data inputs are categorized in the following hierarchy under applicable financial accounting standards:
1) Level1-unadjusted quoted prices in active markets for identical assets or liabilities (including securities actively traded on a securities exchange)
2) Level2-inputs other than unadjusted quoted prices that are observable for the asset or liability (such as unadjusted quoted prices for similar assets and market corroborated inputs such as interest rates, prepayment speeds, credit risks, etc.)
3) Level3-significant unobservable inputs (including the Manager’s own judgments about assumptions that market participants would use in pricing the asset or liability).
The inputs used for valuing securities are not necessarily an indication of the risks associated with investing in those securities.
|
| 28 OPPENHEIMER PORTFOLIO SERIES ACTIVE ALLOCATION FUND |
3. Securities Valuation (Continued)
The Fund classifies each of its investments in investment companies which are publicly offered as Level 1. Investment companies that are not publicly offered, if any, are measured using net asset value and are classified as Level 2 in the fair value hierarchy. The table below categorizes amounts that are included in the Fund’s Statement of Assets and Liabilities at period end based on valuation input level:
| | | | | | | | | | | | | | | | |
| | | Level 1— Unadjusted Quoted Prices | | | Level 2— Other Significant Observable Inputs | | | Level 3— Significant Unobservable Inputs | | | Value | |
Assets Table | | | | | | | | | | | | | | | | |
Investments, at Value: | | | | | | | | | | | | | | | | |
| Investment Companies | | $ | 2,122,036,125 | | | $ | 147,746,675 | | | $ | — | | | $ | 2,269,782,800 | |
| | | | |
| Total Assets | | $ | 2,122,036,125 | | | $ | 147,746,675 | | | $ | — | | | $ | 2,269,782,800 | |
| | | | |
Forward currency exchange contracts and futures contracts, if any, are reported at their unrealized appreciation/depreciation at measurement date, which represents the change in the contract’s value from trade date. All additional assets and liabilities included in the above table are reported at their market value at measurement date.
For the reporting period, there were no transfers between levels.
4. Investments and Risks
Risks of Investing in the Underlying Funds.The Fund invests in other mutual funds advised by the Manager. The Underlying Funds are registeredopen-end management investment companies under the 1940 Act, as amended. The Manager is the investment adviser of, and theSub-Adviser provides investment and related advisory services to, the Underlying Funds. The Fund’s Investments in Underlying Funds are included in the Statement of Investments. Shares of Underlying Funds are valued at their net asset value per share. As a shareholder, the Fund is subject to its proportional share of the Underlying Funds’ expenses, including their management fee.
Each of the Underlying Funds in which the Fund invests has its own investment risks, and those risks can affect the value of the Fund’s investments and therefore the value of the Fund’s shares. To the extent that the Fund invests more of its assets in one Underlying Fund than in another, the Fund will have greater exposure to the risks of that Underlying Fund.
Investment in Oppenheimer Institutional Government Money Market Fund.
The Fund is permitted to invest daily available cash balances in an affiliated money market fund. The Fund may invest the available cash in Class E shares of Oppenheimer Institutional Government Money Market Fund (“IGMMF”) to seek current income while preserving liquidity or for defensive purposes. IGMMF is a registeredopen-end management investment company, regulated as a money market fund under the 1940 Act, as amended. The Manager is the investment adviser of IGMMF, and theSub-Adviser provides investment and related advisory services to IGMMF. When applicable, the Fund’s investment in IGMMF is included in the Statement of Investments. Shares of IGMMF are valued at their net asset value per share.
|
| 29 OPPENHEIMER PORTFOLIO SERIES ACTIVE ALLOCATION FUND |
NOTES TO FINANCIAL STATEMENTSContinued
4. Investments and Risks (Continued)
As a shareholder, the Fund is subject to its proportional share of IGMMF’s Class E expenses, including its management fee.
Investment in Oppenheimer Master Funds.Certain Underlying Funds in which the Fund invests are mutual funds registered under the 1940 Act, as amended, that expect to be treated as partnerships for tax purposes, specifically Oppenheimer Master Loan Fund, LLC (“Master Loan”), Oppenheimer Master Event-Linked Bond Fund, LLC (“Master Event-Linked Bond”) and Oppenheimer Master Inflation Protected Securities Fund, LLC (“Master Inflation Protected Securities”) (the “Master Funds”). Each Master Fund has its own investment risks, and those risks can affect the value of the Fund’s investments and therefore the value of the Fund’s shares. To the extent that the Fund invests more of its assets in one Master Fund than in another, the Fund will have greater exposure to the risks of that Master Fund.
The investment objective of Master Loan is to seek income. The investment objective of Master Event-Linked Bond is to seek total return. The investment objective of Master Inflation Protected Securities is to seek total return. The Fund’s investments in the Master Funds are included in the Statement of Investments. The Fund recognizes income and gain/ (loss) on its investments in each Master Fund according to its allocatedpro-rata share, based on its relative proportion of total outstanding Master Fund shares held, of the total net income earned and the net gain/(loss) realized on investments sold by the Master Funds. As a shareholder, the Fund is subject to its proportional share of the Master Funds’ expenses, including their management fee. The Manager will waive fees and/or reimburse Fund expenses in an amount equal to the indirect management fees incurred through the Fund’s investment in the Master Funds. The Fund owns 3.85% of Master Loan, 23.31% of Master Event-Linked Bond and 26.66% of Master Inflation Protected Securities at period end.
5. Market Risk Factors
The Fund’s investments in securities and/or financial derivatives may expose the Fund to various market risk factors:Commodity Risk. Commodity risk relates to the change in value of commodities or commodity indexes as they relate to increases or decreases in the commodities market. Commodities are physical assets that have tangible properties. Examples of these types of assets are crude oil, heating oil, metals, livestock, and agricultural products.
Credit Risk.Credit risk relates to the ability of the issuer of debt to meet interest and principal payments, or both, as they come due. In general, lower-grade, higher-yield debt securities are subject to credit risk to a greater extent than lower-yield, higher-quality securities.
Equity Risk. Equity risk relates to the change in value of equity securities as they relate to increases or decreases in the general market.
Foreign Exchange Rate Risk. Foreign exchange rate risk relates to the change in the U.S. dollar value of a security held that is denominated in a foreign currency. The U.S. dollar value of a foreign currency denominated security will decrease as the dollar appreciates
|
| 30 OPPENHEIMER PORTFOLIO SERIES ACTIVE ALLOCATION FUND |
5. Market Risk Factors (Continued)
against the currency, while the U.S. dollar value will increase as the dollar depreciates against the currency.
Interest Rate Risk.Interest rate risk refers to the fluctuations in value of fixed-income securities resulting from the inverse relationship between price and yield. For example, an increase in general interest rates will tend to reduce the market value of already issued fixed-income investments, and a decline in general interest rates will tend to increase their value. In addition, debt securities with longer maturities, which tend to have higher yields, are subject to potentially greater fluctuations in value from changes in interest rates than obligations with shorter maturities.
Volatility Risk.Volatility risk refers to the magnitude of the movement, but not the direction of the movement, in a financial instrument’s price over a defined time period. Large increases or decreases in a financial instrument’s price over a relative time period typically indicate greater volatility risk, while small increases or decreases in its price typically indicate lower volatility risk.
6. Shares of Beneficial Interest
The Fund has authorized an unlimited number of $0.001 par value shares of beneficial interest of each class. Transactions in shares of beneficial interest were as follows:
| | | | | | | | | | | | | | | | |
| | | Year Ended January 31, 2019 | | | Year Ended January 31, 2018 | |
| | | Shares | | | Amount | | | Shares | | | Amount | |
|
| |
Class A | | | | | | | | | | | | | | | | |
| Sold1 | | | 8,279,326 | | | $ | 119,604,327 | | | | 11,520,154 | | | $ | 158,595,411 | |
| Dividends and/or distributions reinvested | | | 2,151,162 | | | | 27,534,859 | | | | 1,370,124 | | | | 19,894,213 | |
| Redeemed | | | (16,442,583 | ) | | | (236,909,077 | ) | | | (18,788,195 | ) | | | (259,291,837) | |
| | | | |
Net decrease | | | (6,012,095 | ) | | $ | (89,769,891 | ) | | | (5,897,917 | ) | | $ | (80,802,213) | |
| | | | |
|
| |
Class B | | | | | | | | | | | | | | | | |
| Sold | | | 1,308 | | | $ | 19,225 | | | | 5,644 | | | $ | 79,086 | |
| Dividends and/or distributions reinvested | | | — | | | | — | | | | — | | | | — | |
| Redeemed1 | | | (837,842 | ) | | | (12,209,922 | ) | | | (2,595,314 | ) | | | (35,162,730) | |
| | | | |
Net decrease | | | (836,534 | ) | | $ | (12,190,697 | ) | | | (2,589,670 | ) | | $ | (35,083,644) | |
| | | | |
|
| |
Class C | | | | | | | | | | | | | | | | |
| Sold | | | 3,761,309 | | | $ | 52,980,575 | | | | 4,207,402 | | | $ | 56,797,604 | |
| Dividends and/or distributions reinvested | | | 364,166 | | | | 4,566,645 | | | | 157,946 | | | | 2,245,998 | |
| Redeemed | | | (7,012,693 | ) | | | (98,687,963 | ) | | | (8,639,903 | ) | | | (116,693,768) | |
| | | | |
Net decrease | | | (2,887,218 | ) | | $ | (41,140,743 | ) | | | (4,274,555 | ) | | $ | (57,650,166) | |
| | | | |
|
| 31 OPPENHEIMER PORTFOLIO SERIES ACTIVE ALLOCATION FUND |
NOTES TO FINANCIAL STATEMENTSContinued
6. Shares of Beneficial Interest (Continued)
| | | | | | | | | | | | | | | | |
| | | Year Ended January 31, 2019 | | | Year Ended January 31, 2018 | |
| | | Shares | | | Amount | | | Shares | | | Amount |
Class R | | | | | | | | | | | | | | | | |
| Sold | | | 1,978,258 | | | $ | 28,370,328 | | | | 2,028,899 | | | $ | 28,004,514 | |
| Dividends and/or distributions reinvested | | | 139,114 | | | | 1,770,934 | | | | 75,414 | | | | 1,088,982 | |
| Redeemed | | | (1,922,981 | ) | | | (27,629,550 | ) | | | (2,542,115 | ) | | | (34,877,005) | |
| | | | |
Net increase (decrease) | | | 194,391 | | | $ | 2,511,712 | | | | (437,802 | ) | | $ | (5,783,509) | |
| | | | |
|
| |
Class Y | | | | | | | | | | | | | | | | |
| Sold | | | 1,172,064 | | | $ | 17,257,200 | | | | 1,933,793 | | | $ | 26,855,663 | |
| Dividends and/or distributions reinvested | | | 32,182 | | | | 417,075 | | | | 51,993 | | | | 762,732 | |
| Redeemed | | | (3,606,532 | ) | | | (51,254,817 | ) | | | (2,273,941 | ) | | | (32,042,973) | |
| | | | |
Net decrease | | | (2,402,286 | ) | | $ | (33,580,542 | ) | | | (288,155 | ) | | $ | (4,424,578) | |
| | | | |
1.All outstanding Class B shares converted to Class A shares on June 1, 2018.
7. Purchases and Sales of Securities
The aggregate cost of purchases and proceeds from sales of securities, other than short-term obligations and investments in IGMMF, for the reporting period were as follows:
| | | | | | | | |
| | | Purchases | | | Sales | |
|
| |
Investment securities | | $ | 937,941,438 | | | $ | 1,028,796,673 | |
8. Fees and Other Transactions with Affiliates
Management Fees.Under the investment advisory agreement, the Manager does not charge a management fee, but rather collects indirect management fees from the Fund’s investments in the Underlying Funds. The weighted indirect management fees collected from the Fund’s investment in the Underlying Funds, as a percent of average daily net assets of the Fund for the reporting period was 0.58%. This amount is gross of any waivers or reimbursements of management fees implemented at the Underlying Fund level.
Asset Allocation Fees. The Fund pays the Manager an asset allocation fee equal to an annual rate of 0.10% of the first $3 billion of the daily net assets of the Fund and 0.08% of the daily net assets in excess of $3 billion.
Sub-Adviser Fees.The Manager has retained theSub-Adviser to provide theday-to-day portfolio management of the Fund. Under theSub-Advisory Agreement, the Manager pays theSub-Adviser an annual fee in monthly installments, equal to a percentage of the indirect investment management fee collected by the Manager, which shall be calculated after any investment management fee waivers. The fee paid to theSub-Adviser is paid by the Manager, not by the Fund.
Transfer Agent Fees.OFI Global (the “Transfer Agent”) serves as the transfer and
|
| 32 OPPENHEIMER PORTFOLIO SERIES ACTIVE ALLOCATION FUND |
8. Fees and Other Transactions with Affiliates (Continued)
shareholder servicing agent for the Fund. The Fund pays the Transfer Agent a fee based on annual net assets, which shall be calculated after any applicable fee waivers. Fees incurred and average net assets for each class with respect to these services are detailed in the Statement of Operations and Financial Highlights, respectively.
Sub-Transfer Agent Fees.The Transfer Agent has retained Shareholder Services, Inc., a wholly-owned subsidiary of OFI (the“Sub-Transfer Agent”), to provide theday-to-day transfer agent and shareholder servicing of the Fund. Under theSub-Transfer Agency Agreement, the Transfer Agent pays theSub-Transfer Agent an annual fee in monthly installments, equal to a percentage of the transfer agent fee collected by the Transfer Agent from the Fund, which shall be calculated after any applicable fee waivers. The fee paid to theSub-Transfer Agent is paid by the Transfer Agent, not by the Fund.
Trustees’ Compensation.The Fund has adopted an unfunded retirement plan (the “Plan”) for the Fund’s Independent Trustees. Benefits are based on years of service and fees paid to each Trustee during their period of service. The Plan was frozen with respect to adding new participants effective December 31, 2006 (the “Freeze Date”) and existing Plan Participants as of the Freeze Date will continue to receive accrued benefits under the Plan. Active Independent Trustees as of the Freeze Date have each elected a distribution method with respect to their benefits under the Plan.
During the reporting period, the Fund’s projected benefit obligations, payments to retired
Trustees and accumulated liability were as follows:
| | | | |
| Projected Benefit Obligations Increased | | $ | — | |
| Payments Made to Retired Trustees | | | 7,696 | |
| Accumulated Liability as of January 31, 2019 | | | 56,998 | |
The Fund’s Board of Trustees (“Board”) has adopted a compensation deferral plan for Independent Trustees that enables Trustees to elect to defer receipt of all or a portion of the annual compensation they are entitled to receive from the Fund. For purposes of determining the amount owed to the Trustee under the plan, deferred amounts are treated as though equal dollar amounts had been invested in shares of the Fund or in other Oppenheimer funds selected by the Trustee. The Fund purchases shares of the funds selected for deferral by the Trustee in amounts equal to his or her deemed investment, resulting in a Fund asset equal to the deferred compensation liability. Such assets are included as a component of “Other” within the asset section of the Statement of Assets and Liabilities. Deferral of Trustees’ fees under the plan will not affect the net assets of the Fund and will not materially affect the Fund’s assets, liabilities or net investment income per share. Amounts will be deferred until distributed in accordance with the compensation deferral plan.
Distribution and Service Plan(12b-1) Fees.Under its General Distributor’s Agreement with the Fund, OppenheimerFunds Distributor, Inc. (the “Distributor”) acts as the Fund’s
|
| 33 OPPENHEIMER PORTFOLIO SERIES ACTIVE ALLOCATION FUND |
NOTES TO FINANCIAL STATEMENTSContinued
8. Fees and Other Transactions with Affiliates (Continued)
principal underwriter in the continuous public offering of the Fund’s classes of shares.
Service Plan for Class A Shares. The Fund has adopted a Service Plan (the “Plan”) for Class A shares pursuant to Rule12b-1 under the 1940 Act. Under the Plan, the Fund reimburses the Distributor for a portion of its costs incurred for services provided to accounts that hold Class A shares. Reimbursement is made periodically at an annual rate of up to
0.25% of the daily net assets of Class A shares of the Fund. The Distributor currently uses all of those fees to pay dealers, brokers, banks and other financial institutions periodically for providing personal service and maintenance of accounts of their customers that hold Class A shares. Any unreimbursed expenses the Distributor incurs with respect to Class A shares in any fiscal year cannot be recovered in subsequent periods. Fees incurred by the Fund under the Plan are detailed in the Statement of Operations.
Distribution and Service Plans for Class B, Class C and Class R Shares.The Fund has adopted Distribution and Service Plans (the “Plans”) for Class C and Class R shares, and had previously adopted a similar plan for Class B shares, pursuant to Rule12b-1 under the 1940 Act to compensate the Distributor for distributing those share classes, maintaining accounts and providing shareholder services. Under the Plans, the Fund pays the Distributor an annual asset-based sales charge of 0.75% on Class C shares’ daily net assets and 0.25% on Class R shares’ daily net assets. The Fund paid the Distributor an annual asset-based sales charge of 0.75% on Class B shares prior to their Conversion Date. The Fund also pays a service fee under the Plans at an annual rate of 0.25% of daily net assets and previously paid this fee for Class B prior to their Conversion Date. The Plans continue in effect from year to year only if the Fund’s Board of Trustees votes annually to approve their continuance at an in person meeting called for that purpose. Fees incurred by the Fund under the Plans are detailed in the Statement of Operations.
Sales Charges.Front-end sales charges and CDSC do not represent expenses of the Fund. They are deducted from the proceeds of sales of Fund shares prior to investment or from redemption proceeds prior to remittance, as applicable. The sales charges retained by the Distributor from the sale of shares and the CDSC retained by the Distributor on the redemption of shares is shown in the following table for the period indicated.
| | | | | | | | | | | | | | | | | | | | |
| Year Ended | | Class A
Front-End
Sales Charges
Retained by
Distributor | | | Class A
Contingent
Deferred
Sales Charges
Retained by
Distributor | | | Class B
Contingent
Deferred
Sales Charges
Retained by
Distributor1 | | | Class C
Contingent
Deferred
Sales Charges
Retained by
Distributor | | | Class R
Contingent
Deferred
Sales Charges
Retained by
Distributor | |
| January 31, 2019 | | $ | 713,332 | | | $ | — | | | $ | 1,739 | | | $ | 41,057 | | | $ | — | |
1. Effective June 1, 2018, all Class B shares converted to Class A shares.
|
| 34 OPPENHEIMER PORTFOLIO SERIES ACTIVE ALLOCATION FUND |
8. Fees and Other Transactions with Affiliates (Continued)
Waivers and Reimbursements of Expenses. The Manager has contractually agreed to waive fees and/or reimburse certain Fund expenses at an annual rate of 0.04% as calculated on the daily net assets of the Fund. This waiver and/or reimbursement is applied after (and in addition to) any other applicable waiver and/or expense reimbursements that may apply, and may not be amended or withdrawn for one year from the date of the Fund’s prospectus, unless approved by the Board. During the reporting period, the Manager waived fees and/or reimbursed the Fund $981,591.
9. Pending Acquisition
On October 18, 2018, Massachusetts Mutual Life Insurance Company, an indirect corporate parent of theSub-Adviser and the Manager, announced that it has entered into an agreement whereby Invesco Ltd. (“Invesco”), a global investment management company, will acquire theSub-Adviser (the “Transaction”). In connection with the Transaction, on January 11, 2019, the Fund’s Board unanimously approved an Agreement and Plan of Reorganization (the “Agreement”), which provides for the transfer of the assets and liabilities of the Fund to a corresponding, newly formed fund (the “Acquiring Fund”) in the Invesco family of funds (the “Reorganization”) in exchange for shares of the corresponding Acquiring Fund of equal value to the value of the shares of the Fund as of the close of business on the closing date. Although the Acquiring Fund will be managed by Invesco Advisers, Inc., the Acquiring Fund will, as of the closing date, have the same investment objective and substantially similar principal investment strategies and risks as the Fund. After the Reorganization, Invesco Advisers, Inc. will be the investment adviser to the Acquiring Fund, and the Fund will be liquidated and dissolved under applicable law and terminate its registration under the Investment Company Act of 1940, as amended. The Reorganization is expected to be atax-free reorganization for U.S. federal income tax purposes.
The Reorganization is subject to the approval of shareholders of the Fund. Shareholders of record of the Fund on January 14, 2019 will be entitled to vote on the Reorganization and will receive a combined prospectus and proxy statement describing the Reorganization, the shareholder meeting, and a discussion of the factors the Fund’s Board considered in approving the Agreement. The combined prospectus and proxy statement is expected to be distributed to shareholders of record on or about February 28, 2019. The anticipated date of the shareholder meeting is on or about April 12, 2019.
If shareholders approve the Agreement and certain other closing conditions are satisfied or waived, the Reorganization is expected to close during the second quarter of 2019, or as soon as practicable thereafter. This is subject to change.
|
| 35 OPPENHEIMER PORTFOLIO SERIES ACTIVE ALLOCATION FUND |
REPORT OF INDEPENDENT REGISTERED PUBLIC ACCOUNTING FIRM
To the Shareholders of Active Allocation Fund and Board of Trustees of Oppenheimer Portfolio Series:
Opinion on the Financial Statements
We have audited the accompanying statement of assets and liabilities of Active Allocation Fund (the “Fund”), a series of Oppenheimer Portfolio Series, including the statement of investments, as of January 31, 2019, the related statement of operations for the year then ended, the statements of changes in net assets for each of the years in thetwo-year period then ended, and the related notes (collectively, the “financial statements”) and the financial highlights for each of the years in the five-year period then ended. In our opinion, the financial statements and financial highlights present fairly, in all material respects, the financial position of the Fund as of January 31, 2019, the results of its operations for the year then ended, the changes in its net assets for each of the years in thetwo-year period then ended, and the financial highlights for each of the years in the five-year period then ended, in conformity with U.S. generally accepted accounting principles.
Basis for Opinion
These financial statements and financial highlights are the responsibility of the Fund’s management. Our responsibility is to express an opinion on these financial statements and financial highlights based on our audits. We are a public accounting firm registered with the Public Company Accounting
Oversight Board (United States) (“PCAOB”) and are required to be independent with respect to the Fund in accordance with the U.S. federal securities laws and the applicable rules and regulations of the Securities and Exchange Commission and the PCAOB.
We conducted our audits in accordance with the standards of the PCAOB. Those standards require that we plan and perform the audit to obtain reasonable assurance about whether the financial statements and financial highlights are free of material misstatement, whether due to error or fraud. Our audits included performing procedures to assess the risks of material misstatement of the financial statements and financial highlights, whether due to error or fraud, and performing procedures that respond to those risks. Such procedures included examining, on a test basis, evidence regarding the amounts and disclosures in the financial statements and financial highlights. Such procedures also included confirmation of securities owned as of January 31, 2019, by correspondence with the transfer agent, or by other appropriate auditing procedures. Our audits also included evaluating the accounting principles used and significant estimates made by management, as well as evaluating the overall presentation of the financial statements and financial highlights. We believe that our audits provide a reasonable basis for our opinion.
KPMGLLP
We have not been able to determine the specific year that we began serving as the auditor of one or more Oppenheimer Funds investment companies, however we are aware that we have served as the auditor of one or more Oppenheimer Funds investment companies since at least 1969.
Denver, Colorado
March 25, 2019
|
| 36 OPPENHEIMER PORTFOLIO SERIES ACTIVE ALLOCATION FUND |
FEDERAL INCOME TAX INFORMATION Unaudited
In early 2019, if applicable, shareholders of record received information regarding all dividends and distributions paid to them by the Fund during calendar year 2018.
Dividends, if any, paid by the Fund during the reporting period which are not designated as capital gain distributions should be multiplied by the maximum amount allowable but not less than 50.52% to arrive at the amount eligible for the corporate dividend-received deduction.
A portion, if any, of the dividends paid by the Fund during the reporting period which are not designated as capital gain distributions are eligible for lower individual income tax rates to the extent that the Fund has received qualified dividend income as stipulated by recent tax legislation. The maximum amount allowable but not less than $27,330,751 of the Fund’s fiscal year taxable income may be eligible for the lower individual income tax rates. In early 2019, shareholders of record received information regarding the percentage of distributions that are eligible for lower individual income tax rates.
Recent tax legislation allows a regulated investment company to designate distributions not designated as capital gain distributions, as either interest related dividends or short-term capital gain dividends, both of which are exempt from the U.S. withholding tax applicable to non U.S. taxpayers. For the reporting period, the maximum amount allowable but not less than $7,363,083 of the ordinary distributions to be paid by the Fund qualifies as an interest related dividend.
The Fund has elected the application of Section 853 of the Internal Revenue Code to permit shareholders to take a federal income tax credit or deduction, at their option, on a per share basis. The maximum amount allowable but not less than $1,597,542 of foreign income taxes were paid by the Fund during the reporting period. A separate notice will be mailed to each shareholder, which will reflect the proportionate share of such foreign taxes which must be treated by shareholders as gross income for federal income tax purposes.
Gross income of the maximum amount allowable but not less than $6,695,921 was derived from sources within foreign countries or possessions of the United States.
The foregoing information is presented to assist shareholders in reporting distributions received from the Fund to the Internal Revenue Service. Because of the complexity of the federal regulations which may affect your individual tax return and the many variations in state and local tax regulations, we recommend that you consult your tax advisor for specific guidance.
|
| 37 OPPENHEIMER PORTFOLIO SERIES ACTIVE ALLOCATION FUND |
BOARD APPROVAL OF THE FUND’S INVESTMENT ADVISORY
AND SUB-ADVISORY AGREEMENTSUnaudited
The Fund has entered into an investment advisory agreement with OFI Global Asset Management, Inc. (“OFI Global” or the “Adviser”), a wholly-owned subsidiary of OppenheimerFunds, Inc. (“OFI” or the“Sub-Adviser”) (“OFI Global” and “OFI” together the “Managers”) and OFI Global has entered into asub-advisory agreement with OFI whereby OFI provides investmentsub-advisory services to the Fund (collectively, the “Agreements”). Each year, the Board of Trustees (the “Board”), including a majority of the independent Trustees, is required to determine whether to approve the terms of the Agreements and the renewal thereof. The Investment Company Act of 1940, as amended, requires that the Board request and evaluate, and that the Managers provide, such information as may be reasonably necessary to evaluate the terms of the Agreements. The Board employs an independent consultant to prepare a report that provides information, including comparative information that the Board requests for that purpose. In addition toin-person meetings focused on this evaluation, the Board receives information throughout the year regarding Fund services, fees, expenses and performance.
The Managers and the independent consultant provided information to the Board on the following factors: (i) the nature, quality and extent of the Managers’ services, (ii) the comparative investment performance of the Fund and the Managers, (iii) the fees and expenses of the Fund, including comparative fee and expense information, (iv) the profitability of the Managers and their affiliates, including an analysis of the cost of providing services, (v) whether economies of scale are realized as the Fund grows and whether fee levels reflect these economies of scale for Fund investors and (vi) other benefits to the Managers from their relationship with the Fund. The Board was aware that there are alternatives to retaining the Managers.
Outlined below is a summary of the principal information considered by the Board as well as the Board’s conclusions.
Nature, Quality and Extent of Services. The Board considered information about the nature, quality and extent of the services provided to the Fund and information regarding the Managers’ key personnel who provide such services. The Managers’ duties include providing the Fund with the services of theSub-Adviser’s portfolio managers and investment team, who provide research, analysis and other advisory services in regard to the Fund’s investments; and securities trading services. OFI Global is responsible for oversight of third-party service providers; monitoring compliance with applicable Fund policies and procedures and adherence to the Fund’s investment restrictions; risk management; and oversight of theSub-Adviser. OFI Global is also responsible for providing certain administrative services to the Fund. Those services include providing and supervising all administrative and clerical personnel who are necessary in order to provide effective corporate administration for the Fund; compiling and maintaining records with respect to the Fund’s operations; preparing and filing reports required by the U.S. Securities and Exchange Commission; preparing periodic reports regarding the operations of the Fund for its shareholders; preparing proxy materials for shareholder meetings; and preparing the registration statements required by federal and state securities laws for the sale of the Fund’s shares. OFI Global also provides the Fund with office space, facilities and equipment.
|
| 38 OPPENHEIMER PORTFOLIO SERIES ACTIVE ALLOCATION FUND |
The Board also considered the quality of the services provided and the quality of the Managers’ resources that are available to the Fund. The Board took account of the fact that theSub-Adviser has over fifty years of experience as an investment adviser and that its assets under management rank it among the top mutual fund managers in the United States. The Board evaluated the Managers’ advisory, administrative, accounting, legal, compliance and risk management services, among other services, and information the Board has received regarding the experience and professional qualifications of the Managers’ key personnel and the size and functions of their staff. In its evaluation of the quality of the portfolio management services provided, the Board considered the experience of Jeffrey Bennett and Caleb Wong, the portfolio managers for the Fund, and theSub-Adviser’s investment team and analysts. The Board members also considered the totality of their experiences with the Managers as directors or trustees of the Fund and other funds advised by the Managers. The Board considered information regarding the quality of services provided by affiliates of the Managers, which the Board members have become knowledgeable about through their experiences with the Managers and in connection with the review or renewal of the Fund’s service agreements or service providers. The Board concluded, in light of the Managers’ experience, reputation, personnel, operations and resources that the Fund benefits from the services provided under the Agreements.
Investment Performance of the Managers and the Fund. Throughout the year, the Managers provided information on the investment performance of the Fund, the Adviser and theSub-Adviser, including comparative performance information. The Board also reviewed information, prepared by the Managers and by the independent consultant, comparing the Fund’s historical performance to relevant benchmarks or market indices and to the performance of other retail funds in the allocation – 70% to 85% equity category. The Board noted that the Fund’sone-year performance was better than its category median although its three-year, five-year andten-year performance was below its category median.
Fees and Expenses of the Fund. The Board reviewed the fees paid to the Adviser and the other expenses borne by the Fund. The Board noted that the Adviser, not the Fund, pays theSub-Adviser’s fee under thesub-advisory agreement. The Board also considered the comparability of the fees charged and the services provided to the Fund to the fees and services for other clients or accounts advised by the Adviser. The independent consultant provided comparative data in regard to the fees and expenses of the Fund and other retailfront-end load allocation – 70% to 85% equity funds with comparable asset levels and distribution features. After discussions with the Board, the Adviser has agreed to contractually waive fees and/or reimburse certain Fund expenses at an annual rate of 0.04% as calculated on the daily net assets of the Fund. This waiver and/or reimbursement is applied after (and in addition to) any other applicable fee waivers and/or expense reimbursements that apply. This fee waiver and/or expense reimbursement may not be amended or withdrawn until one year from the date of the prospectus, unless approved by the Board. The Board noted that the Fund was charged no direct traditional management fees, exclusive of Underlying Fund management fees, while certain peer group funds did charge direct traditional management fees. The Board also noted that the Fund’s total
|
| 39 OPPENHEIMER PORTFOLIO SERIES ACTIVE ALLOCATION FUND |
BOARD APPROVAL OF THE FUND’S INVESTMENT ADVISORY
AND SUB-ADVISORY AGREEMENTSUnaudited / Continued
expenses, net of waivers, were equal to its peer group median and lower than its category median.
Economies of Scale and Profits Realized by the Adviser andSub-Adviser. The Board considered information regarding the Managers’ costs in serving as the Fund’s investment adviser andsub-adviser, including the costs associated with the personnel and systems necessary to manage the Fund, and information regarding the Managers’ profitability from their relationship with the Fund. The Board also considered that the
Managers must be able to pay and retain experienced professional personnel at competitive rates to provide quality services to the Fund. The Board reviewed whether the Managers may realize economies of scale in managing and supporting the Fund and whether those economies of scale benefit the Fund’s shareholders at the current level of Fund assets in relation to its management fee. The Board noted that the Fund currently has asset allocation fee breakpoints, which are intended to share with Fund shareholders economies of scale that may exist as the Fund’s assets grow.
Other Benefits to the Managers. In addition to considering the profits realized by the Managers, the Board considered information that was provided regarding the direct and indirect benefits the Managers receive as a result of their relationship with the Fund, including compensation paid to the Managers’ affiliates.
Conclusions. These factors were also considered by the independent Trustees meeting separately from the full Board, assisted by experienced counsel to the Fund and to the independent Trustees. Fund counsel and the independent Trustees’ counsel are independent of the Managers within the meaning and intent of the Securities and Exchange Commission Rules.
Based on its review of the information it received and its evaluations described above, the Board, including a majority of the independent Trustees, decided to continue the Agreements through September 30, 2019. In arriving at its decision, the Board did not identify any factor or factors as being more important than others, but considered all of the above information, and considered the terms and conditions of the Agreements, including the management fees, in light of all the surrounding circumstances.
|
| 40 OPPENHEIMER PORTFOLIO SERIES ACTIVE ALLOCATION FUND |
PORTFOLIO PROXY VOTING POLICIES AND GUIDELINES;
UPDATES TO STATEMENT OF INVESTMENTSUnaudited
The Fund has adopted Portfolio Proxy Voting Policies and Guidelines under which the Fund votes proxies relating to securities (“portfolio proxies”) held by the Fund. A description of the Fund’s Portfolio Proxy Voting Policies and Guidelines is available (i) without charge, upon request, by calling the Fund toll-free at 1.800.CALL OPP (225.5677), (ii) on the Fund’s website at www.oppenheimerfunds.com, and (iii) on the SEC’s website at www.sec.gov. In addition, the Fund is required to file FormN-PX, with its complete proxy voting record for the 12 months ended June 30th, no later than August 31st of each year. The Fund’s voting record is available (i) without charge, upon request, by calling the Fund toll-free at 1.800.CALL OPP (225.5677), and (ii) in the FormN-PX filing on the SEC’s website at www.sec.gov.
The Fund files its complete schedule of portfolio holdings with the SEC for the first quarter and the third quarter of each fiscal year on FormN-Q. The Fund’s FormN-Q filings are available on the SEC’s website at www.sec.gov. Beginning in April 2019, the Fund will no longer file FormN-Qs and will instead disclose its portfolio holdings monthly on FormN-PORT, which will also be available on the SEC’s website at www.sec.gov.
Householding—Delivery of Shareholder Documents
This is to inform you about OppenheimerFunds’ “householding” policy. If more than one member of your household maintains an account in a particular fund, OppenheimerFunds will mail only one copy of the fund’s prospectus (or, if available, the fund’s summary prospectus), annual and semiannual report and privacy policy. The consolidation of these mailings, called householding, benefits your fund through reduced mailing expense, and benefits you by reducing the volume of mail you receive from OppenheimerFunds. Householding does not affect the delivery of your account statements.
Please note that we will continue to household these mailings for as long as you remain an OppenheimerFunds shareholder, unless you request otherwise. If you prefer to receive multiple copies of these materials, please call us at1.800.CALL-OPP(225-5677).You may also notify us in writing or via email. We will begin sending you individual copies of the prospectus (or, if available, the summary prospectus), reports and privacy policy within 30 days of receiving your request to stop householding.
|
| 41 OPPENHEIMER PORTFOLIO SERIES ACTIVE ALLOCATION FUND |
DISTRIBUTION SOURCESUnaudited
For any distribution that took place over the last six months of the Fund’s reporting period, the table below details on aper-share basis the percentage of the Fund’s total distribution payment amount that was derived from the following sources: net income, net profit from the sale of securities, and other capital sources. Other capital sources represent a return of capital. A return of capital may occur, for example, when some or all of the money that you invested in the Fund is paid back to you. A return of capital distribution does not necessarily reflect the Fund’s investment performance and should not be confused with “yield” or “income.” You should not draw any conclusions about the Fund’s investment performance from the amounts of these distributions. This information is based upon income and capital gains using generally accepted accounting principles as of the date of each distribution. If the Fund (or an underlying fund in which the Fund invests) invests in real estate investment trusts (REITs) and/or master limited partnerships (MLPs), the percentages attributed to each category are estimated using historical information because the character of the amounts received from the REITs and/or MLPs in which the Fund (or underlying fund) invests is unknown until after the end of the calendar year. Because the Fund is actively managed, the relative amount of the Fund’s total distributions derived from various sources over the calendar year may change. Please note that this information should not be used for tax reporting purposes as the tax character of distributable income may differ from the amounts used for this notification. You will receive IRS tax forms in the first quarter of each calendar year detailing the actual amount of the taxable andnon-taxable portion of distributions paid to you during the tax year.
For the most current information, please go to oppenheimerfunds.com. Select your Fund, and scroll down to the ‘Dividends’ table under ‘Analytics’.
| | | | | | | | | | | | | | | | |
| Fund Name | | Pay Date | | | Net
Income | | | Net Profit
from Sale | | | Other
Capital
Sources | |
| Oppenheimer Portfolio Series: Active Allocation Fund | | | 12/20/18 | | | | 79.0% | | | | 0.00% | | | | 21.00% | |
|
| 42 OPPENHEIMER PORTFOLIO SERIES ACTIVE ALLOCATION FUND |
TRUSTEES AND OFFICERSUnaudited
| | |
| Name, Position(s) Held with the Fund, Length of Service, Year of Birth | | Principal Occupation(s) During the Past 5 Years; Other Trusteeships/ Directorships Held; Number of Portfolios in the Fund Complex Currently Overseen |
| |
| INDEPENDENT TRUSTEES | | The address of each Trustee in the chart below is 6803 S. Tucson Way, Centennial, Colorado 80112-3924. Each Trustee serves for an indefinite term, or until his or her resignation, retirement, death or removal. Each of the Trustees in the chart below oversee 46 portfolios in the OppenheimerFunds complex. |
| |
Joel W. Motley, Chairman of the Board of Trustees (since 2019) and Trustee (since 2005) Year of Birth: 1952 | | Director of Office of Finance Federal Home Loan Bank (since September 2016); Director of Greenwall Foundation (since October 2013); Member of Board and Investment Committee of The Greenwall Foundation (since April 2013); Member of the Vestry of Trinity Wall Street (since April 2012); Director of Southern Africa Legal Services Foundation (since March 2012); Board Member and Investment Committee Member of Pulitzer Center for Crisis Reporting(non-profit journalism) (since March 2011); Managing Director of Public Capital Advisors, LLC (privately- held financial advisor) (since January 2006); Managing Director of Carmona Motley, Inc. (privately-held financial advisor) (since January 2002); Director of Columbia Equity Financial Corp. (privately-held financial advisor) (2002-2007); Managing Director of Carmona Motley Hoffman Inc. (privately-held financial advisor) (January 1998-December 2001); Member of the Finance and Budget Committee of the Council on Foreign Relations, Member of the Investment Committee and Board of Human Rights Watch (since July 2000) and Member of the Investment Committee and Board of Historic Hudson Valley (since February 2010). Mr. Motley has served on the Boards of certain Oppenheimer funds since October 2002, during which time he has become familiar with the Fund’s (and other Oppenheimer funds’) financial, accounting, regulatory and investment matters and has contributed to the Board’s deliberations. |
| |
Beth Ann Brown, Trustee (since 2016) Year of Birth: 1968 | | Director, Board of Directors of Caron Engineering Inc. (since January 2018); Advisor, Board of Advisors of Caron Engineering Inc. (December 2014-December 2017); Independent Consultant (since September 2012); held the following positions at Columbia Management Investment Advisers LLC: Head of Intermediary Distribution (2008-2012), Managing Director, Strategic Relations (2005-2008), Managing Director, Head of National Accounts (2004-2005); Senior Vice President, National Account Manager (2002-2004), Senior Vice President, Key Account Manager (1999-2002) and Vice President, Key Account Manager (1996-1999) of Liberty Funds Distributor, Inc.; President and Director, of Acton Shapleigh Youth Conservation Corps (non -profit) (2012-2015); and Vice President and Director of Grahamtastic Connection(non-profit) (since May 2013). Ms. Brown has served on the Boards of certain Oppenheimer funds since January 2016, during which time she has become familiar with the Fund’s (and other Oppenheimer funds’) financial, accounting, regulatory and investment matters and has contributed to the Board’s deliberations. |
| |
Edmund P. Giambastiani, Jr.,Trustee (since 2013) Year of Birth: 1948 | | Director of THL Credit, Inc. (since November 2016) (alternative credit investment manager); Advisory Board Member of the Maxwell School of Citizenship and Public Affairs of Syracuse University (April 2012-September 2016); Director of Mercury Defense Systems Inc. (information technology) (August 2011-February 2013); Trustee of the U.S. Naval Academy Foundation Athletic & Scholarship Program (since November 2010); Advisory Board Member of the Massachusetts Institute of Technology Lincoln Laboratory (federally-funded research development) (since May 2010); Director of The Boeing Company (aerospace and defense) (since October 2009); Trustee of MITRE Corporation (federally-funded research development) |
|
| 43 OPPENHEIMER PORTFOLIO SERIES ACTIVE ALLOCATION FUND |
TRUSTEES AND OFFICERSUnaudited / Continued
| | |
| |
Edmund P. Giambastiani, Jr., Continued | | (since September 2008); Independent Director of QinetiQ Group Plc (defense technology and security) (February 2008-August 2011); Chairman of Monster Worldwide, Inc. (career services) (March 2015-November 2016), Director of Monster Worldwide, Inc. (career services) (February 2008-June 2011); Lead Director (June 2011-March 2015); Chairman of Alenia North America, Inc. (military and defense products) (January 2008-October 2009); Director of SRA International, Inc. (information technology and services) (January 2008-July 2011); President of Giambastiani Group LLC (national security and energy consulting) (since October 2007); United States Navy, career nuclear submarine officer (June 1970-October 2007); Seventh Vice Chairman of the Joint Chiefs of Staff (2005-October 2007); Supreme Allied Commander of NATO Allied Command Transformation (2003- 2005) and Commander, U.S. Joint Forces Command (2002-2005). Since his retirement from the U.S. Navy in October 2007, Admiral Giambastiani has also served on numerous U.S. Government advisory boards, investigations and task forces for the Secretaries of Defense, State and Interior and the Central Intelligence Agency. He recently completed serving as a federal commissioner on the Military Compensation and Retirement Modernization Commission. Admiral Giambastiani has served on the Boards of certain Oppenheimer funds since February 2013, during which time he has become familiar with the Fund’s (and other Oppenheimer funds’) financial, accounting, regulatory and investment matters and has contributed to the Board’s deliberations. |
| |
Elizabeth Krentzman, Trustee (since 2014) Year of Birth: 1959 | | Trustee of the University of Florida National Board Foundation (since September 2017); Member of the Cartica Funds Board of Directors (private investment funds) (since January 2017); Member of the University of Florida Law Center Association, Inc. Board of Trustees and Audit Committee Member (since April 2016); Member of University of Florida Law Advisory Board, Washington, DC Alumni Group (since 2015); Advisory Board Member of the Securities and Exchange Commission Historical Society (since 2007); held the following positions at Deloitte & Touche LLP: Principal and Chief Regulatory Advisor for Asset Management Services (2007 - 2014) and U.S. Mutual Fund Leader (2011 - 2014); General Counsel of the Investment Company Institute (trade association) (June 2004 - April 2007); held the following positions at Deloitte & Touche LLP: National Director of the Investment Management Regulatory Consulting Practice (1997 - 2004), Principal (2003 - 2004), Director (1998 - 2003) and Senior Manager (1997 - 1998); Assistant Director of the Division of Investment Management—Office of Disclosure and Investment Adviser Regulation of the U.S. Securities and Exchange Commission (1996 -1997) and various positions with the Division of Investment Management – Office of Regulatory Policy (1991 - 1996) of the U.S. Securities and Exchange Commission; Associate at Ropes & Gray LLP (1987 – 1991). Ms. Krentzman has served on the Boards of certain Oppenheimer funds since August 2014, during which time she has become familiar with the Fund’s (and other Oppenheimer funds’) financial, accounting, regulatory and investment matters and has contributed to the Board’s deliberations. |
| |
Mary F. Miller, Trustee (since 2005) Year of Birth: 1942 | | Trustee of International House(not-for-profit) (since June 2007); Trustee of the American Symphony Orchestra(not-for-profit) (October 1998-November 2011); and Senior Vice President and General Auditor of American Express Company (financial services company) (July 1998-February 2003). Ms. Miller has served on the Boards of certain Oppenheimer funds since August 2004, during which time she has become familiar with the Fund’s (and other Oppenheimer funds’) financial, accounting, regulatory and investment matters and has contributed to the Board’s deliberations. |
|
| 44 OPPENHEIMER PORTFOLIO SERIES ACTIVE ALLOCATION FUND |
| | |
| |
Joanne Pace, Trustee (since 2012) Year of Birth: 1958 | | Advisory Board Director of Massey Quick Simon & Co. (wealth management), LLC (since October 2014); Board Director of Horizon Blue Cross Blue Shield of New Jersey (healthcare) (since November 2012); Advisory Board Director of The Alberleen Group LLC (investment banking) (since March 2012); Governing Council Member (since 2016) and Chair of Education Committee (since 2017) of Independent Directors Council (IDC) (since 2016); Board Member of 100 Women in Finance(non-profit) (since January 2015); Advisory Council Member of Morgan Stanley Children’s Hospital(non-profit) (since May 2012); Director of The Komera Project(non-profit) (April 2012-2016); New York Advisory Board Director of Peace First(non-profit) (March 2010-2013); Senior Advisor of SECOR Asset Management, LP (2010-2011); Managing Director and Chief Operating Officer of Morgan Stanley Investment Management (2006-2010); Partner and Chief Operating Officer of FrontPoint Partners, LLC (hedge fund) (2005-2006); held the following positions at Credit Suisse (investment banking): Managing Director (2003-2005); Global Head of Human Resources and member of Executive Board and Operating Committee (2004-2005), Global Head of Operations and Product Control (2003-2004); held the following positions at Morgan Stanley: Managing Director (1997-2003), Controller and Principal Accounting Officer (1999-2003); Chief Financial Officer (temporary assignment) for the Oversight Committee, Long Term Capital Management (1998-1999). Lead Independent Director and Chair of the Audit and Nominating Committee of The Global Chartist Fund, LLC of Oppenheimer Asset Management (2011-2012); Board Director of Managed Funds Association (2008-2010); Board Director of Morgan Stanley Foundation (2007- 2010) and Investment Committee Chair (2008-2010). Ms. Pace has served on the Boards of certain Oppenheimer funds since November 2012, during which time she has become familiar with the Fund’s (and other Oppenheimer funds’) financial, accounting, regulatory and investment matters and has contributed to the Board’s deliberations. |
| |
Daniel Vandivort, Trustee (since 2014) Year of Birth: 1954 | | Chairman and Lead Independent Director/Trustee (March 2010-September 2014), Chairman of the Audit Committee (March 2009-September 2014) and Director/Trustee (December 2008-September 2014) of the Board of Directors/ Trustees of Value Line Funds; Trustee (since January 2015) and Treasurer and Chairman of the Audit Committee and Finance Committee (since January 2016) of Board of Trustees of Huntington Disease Foundation of America; Trustee, Board of Trustees, RIM Retirement Savings Plan (2005-2007); President and Chief Investment Officer, Robeco Investment Management, formerly known as Weiss Peck and Greer (January 2005-June 2007); Member, Management Committee of Robeco Investment Management (2001-2007); Chairman and Trustee of the Board of Trustees of Weiss, Peck and Greer Funds (2004-2005); Managing Director and Head of Fixed Income, Weiss, Peck and Greer (November 1994-January 2005); Managing Director and Head of Fixed Income, CS First Boston Investment Management (January 1992-November 1994); Director, Global Product Development, First Boston Asset Management (November 1989-January 1992); Vice President, Fixed Income Sales, First Boston Corp. (May 1984-November 1989). Mr. Vandivort has served on the Boards of certain Oppenheimer funds since 2014, during which time he has become familiar with the Fund’s (and other Oppenheimer funds’) financial, accounting, regulatory and investment matters and has contributed to the Board’s deliberations. |
|
| 45 OPPENHEIMER PORTFOLIO SERIES ACTIVE ALLOCATION FUND |
TRUSTEES AND OFFICERSUnaudited / Continued
| | |
| |
Brian F. Wruble, Trustee (since 2005) Year of Birth: 1943 | | Governor of Community Foundation of the Florida Keys(non-profit) (since July 2012); Director of TCP Capital, Inc. (registered business development company) (since November 2015); Chairman Emeritus of the Board of Trustees (since August 2011), Chairman of the Board of Trustees (August 2007-August 2011), Trustee of the Board of Trustees (since August 1991) of The Jackson Laboratory(non-profit); Member of Zurich Insurance Group’s Investment Management Advisory Council (insurance) (October 2004-February 2017); Treasurer (since 2007) and Trustee (since May 1992) of the Institute for Advanced Study(non-profit educational institute); Director of Special Value Opportunities Fund, LLC (registered investment company) (affiliate of theSub-Adviser’s parent company) (September 2004- June 2015); General Partner of Odyssey Partners, L.P. (hedge fund) (September 1995-December 2007); Special Limited Partner of Odyssey Investment Partners, LLC (private equity investment) (January 1999-September 2004). Mr. Wruble has served on the Boards of certain Oppenheimer funds since April 2001, during which time he has become familiar with the Fund’s (and other Oppenheimer funds’) financial, accounting, regulatory and investment matters and has contributed to the Board’s deliberations. |
| INTERESTED TRUSTEE AND OFFICER | | Mr. Steinmetz is an “Interested Trustee” because he is affiliated with the Manager and theSub-Adviser by virtue of his positions as Chairman of theSub-Adviser and officer and director of the Manager. Both as a Trustee and as an officer, Mr. Steinmetz serves for an indefinite term, or until his resignation, retirement, death or removal. Mr. Steinmetz’s address is 225 Liberty Street, New York, New York 10281-1008. Mr. Steinmetz is an officer of 104 portfolios in the OppenheimerFunds complex. |
| |
Arthur P. Steinmetz, Trustee (since 2015),President and Principal Executive Officer (since 2014) Year of Birth: 1958 | | Chairman of OppenheimerFunds, Inc. (since January 2015); CEO and Chairman of OFI Global Asset Management, Inc. (since July 2014), President of OFI Global Asset Management, Inc. (since May 2013), a Director of OFI Global Asset Management, Inc. (since January 2013), Director of OppenheimerFunds, Inc. (since July 2014), President, Management Director and CEO of Oppenheimer Acquisition Corp. (OppenheimerFunds, Inc.‘s parent holding company) (since July 2014), and President and Director of OFI SteelPath, Inc. (since January 2013). Chief Investment Officer of the OppenheimerFunds advisory entities (January 2013-December 2013); Executive Vice President of OFI Global Asset Management, Inc. (January2013-May 2013); Chief Investment Officer of OppenheimerFunds, Inc. (October 2010-December 2012); Chief Investment Officer, Fixed-Income, of OppenheimerFunds, Inc. (April 2009-October 2010); Executive Vice President of OppenheimerFunds, Inc. (October 2009-December 2012); Director of Fixed Income of OppenheimerFunds, Inc. (January 2009-April 2009); and a Senior Vice President of OppenheimerFunds, Inc. (March 1993-September 2009). |
| OTHER OFFICERS OF THE FUND | | The addresses of the Officers in the chart below are as follows: for Mr. Bennett, Mss. Lo Bessette, Foxson and Picciotto, 225 Liberty Street, New York, New York 10281-1008, for Mr. Petersen, 6803 S. Tucson Way, Centennial, Colorado 80112-3924. Each Officer serves for an indefinite term or until his or her resignation, retirement, death or removal. |
| |
Jeffrey Bennett, Vice President (since 2018) Year of Birth: 1976 | | Vice President of theSub-Adviser (since November 2016). Managing Director, Alternative Investment Management, for Alliance Bernstein 2011-2016); Director of Research at Fischer & Company (2008 to 2011). |
|
| 46 OPPENHEIMER PORTFOLIO SERIES ACTIVE ALLOCATION FUND |
| | |
| |
Cynthia Lo Bessette, Secretary and Chief Legal Officer(since 2016) Year of Birth: 1976 | | Executive Vice President, General Counsel and Secretary of OFI Global Asset Management, Inc. (since February 2016); Senior Vice President and Deputy General Counsel of OFI Global Asset Management, Inc. (March 2015-February 2016); Chief Legal Officer of OppenheimerFunds, Inc. and OppenheimerFunds Distributor, Inc. (since February 2016); Vice President, General Counsel and Secretary of Oppenheimer Acquisition Corp. (since February 2016); General Counsel of OFI SteelPath, Inc., OFI Advisors, LLC and Index Management Solutions, LLC (since February 2016); Chief Legal Officer of OFI Global Institutional, Inc., HarbourView Asset Management Corporation, OFI Global Trust Company, Oppenheimer Real Asset Management, Inc., OFI Private Investments Inc., Shareholder Services, Inc. and Trinity Investment Management Corporation (since February 2016); Corporate Counsel (February 2012-March 2015) and Deputy Chief Legal Officer (April 2013-March 2015) of Jennison Associates LLC; Assistant General Counsel (April 2008-September 2009) and Deputy General Counsel (October 2009-February 2012) of Lord Abbett & Co. LLC. |
| |
Jennifer Foxson, Vice President and Chief Business Officer(since 2014) Year of Birth: 1969 | | Senior Vice President of OppenheimerFunds Distributor, Inc. (since June 2014); Vice President of OppenheimerFunds Distributor, Inc. (April 2006-June 2014); Vice President of OppenheimerFunds, Inc. (January 1998-March 2006); Assistant Vice President of OppenheimerFunds, Inc. (October 1991-December 1998). |
| |
Mary Ann Picciotto, Chief Compliance Officer andChief Anti-Money LaunderingOfficer (since 2014) Year of Birth: 1973 | | Senior Vice President and Chief Compliance Officer of OFI Global Asset Management, Inc. (since March 2014); Chief Compliance Officer of OppenheimerFunds, Inc., OFI SteelPath, Inc., OFI Global Institutional, Inc., Oppenheimer Real Asset Management, Inc., OFI Private Investments Inc., Harborview Asset Management Corporation, Trinity Investment Management Corporation, and Shareholder Services, Inc. (since March 2014); Managing Director of Morgan Stanley Investment Management Inc. and certain of its various affiliated entities; Chief Compliance Officer of various Morgan Stanley Funds (May 2010-January 2014); Chief Compliance Officer of Morgan Stanley Investment Management Inc. (April 2007-January 2014). |
| |
Brian S. Petersen, Treasurer and PrincipalFinancial & Accounting Officer (since 2016) Year of Birth: 1970 | | Senior Vice President of OFI Global Asset Management, Inc. (since January 2017); Vice President of OFI Global Asset Management, Inc. (January 2013-January 2017); Vice President of OppenheimerFunds, Inc. (February 2007-December 2012); Assistant Vice President of OppenheimerFunds, Inc. (August 2002-2007). |
The Fund’s Statement of Additional Information contains additional information about the Fund’s Trustees and Officers is available without charge upon request, by calling 1.800.CALL OPP (225.5677).
|
| 47 OPPENHEIMER PORTFOLIO SERIES ACTIVE ALLOCATION FUND |
OPPENHEIMER PORTFOLIO SERIES ACTIVE ALLOCATION FUND
| | |
| Manager | | OFI Global Asset Management, Inc. |
| |
| Sub-Adviser | | OppenheimerFunds, Inc. |
| |
| Distributor | | OppenheimerFunds Distributor, Inc. |
| |
| Transfer and Shareholder | | OFI Global Asset Management, Inc. |
| Servicing Agent | | |
| |
| Sub-Transfer Agent | | Shareholder Services, Inc. |
| | DBA OppenheimerFunds Services |
| |
| Independent Registered | | KPMG LLP |
| Public Accounting Firm | | |
| |
| Legal Counsel | | Kramer Levin Naftalis & Frankel LLP |
© 2019 OppenheimerFunds, Inc. All rights reserved.
|
| 48 OPPENHEIMER PORTFOLIO SERIES ACTIVE ALLOCATION FUND |
PRIVACY NOTICE
As an Oppenheimer fund shareholder, you are entitled to know how we protect your personal information and how we limit its disclosure.
Information Sources
We obtainnon-public personal information about our shareholders from the following sources:
| ● | | Applications or other forms. |
| ● | | When you create a user ID and password for online account access. |
| ● | | When you enroll in eDocs Direct,SM our electronic document delivery service. |
| ● | | Your transactions with us, our affiliates or others. |
| ● | | Technologies on our website, including: “cookies” and web beacons, which are used to collect data on the pages you visit and the features you use. |
If you visit oppenheimerfunds.com and do not log on to the secure account information areas, we do not obtain any personal information about you. When you do log on to a secure area, we do obtain your user ID and password to identify you. We also use this information to provide you with products and services you have requested, to inform you about products and services that you may be interested in and assist you in other ways.
We do not collect personal information through our website unless you willingly provide it to us, either directly by email or in those areas of the website that request information. In order to update your personal information (including your mailing address, email address and phone number) you must first log on and visit your user profile.
If you have set your browser to warn you before accepting cookies, you will receive the warning message with each cookie. You can refuse cookies by turning them off in your browser. However, doing so may limit your access to certain sections of our website.
We use cookies to help us improve and manage our website. For example, cookies help us recognize new versus repeat visitors to the site, track the pages visited, and enable some special features on the website. This data helps us provide better service for our website visitors.
Protection of Information
We do not disclose anynon-public personal information (such as names on a customer list) about current or former customers to anyone, except as permitted by law.
Disclosure of Information
Copies of confirmations, account statements and other documents reporting activity in your fund accounts are made available to your financial advisor (as designated by you). We may also use details about you and your investments to help us, our financial service affiliates, or firms that jointly market their financial products and services with ours, to better serve your investment needs or suggest educational material that may be of interest to you. If this requires us to provide you with an opportunity to “opt in” or “opt out” of such information sharing with a firm not affiliated with us, you will receive notification on how to do so, before any such sharing takes place.
Right of Refusal
We will not disclose your personal information to unaffiliated third parties (except as permitted by law), unless we first offer you a reasonable opportunity to refuse or “opt out” of such disclosure.
|
| 49 OPPENHEIMER PORTFOLIO SERIES ACTIVE ALLOCATION FUND |
PRIVACY NOTICEContinued
Internet Security and Encryption
In general, the email services provided by our website are encrypted and provide a secure and private means of communication with us. To protect your own privacy, confidential and/ or personal information should only be communicated via email when you are advised that you are using a secure website.
As a security measure, we do not include personal or account information innon-secure emails, and we advise you not to send such information to us innon-secure emails. Instead, you may take advantage of the secure features of our website to encrypt your email correspondence. To do this, you will need to use a browser that supports Secure Sockets Layer (SSL) protocol.
| ● | | All transactions conducted via our websites, including redemptions, exchanges and purchases, are secured by the highest encryption standards available. SSL is used to establish a secure connection between your PC and OppenheimerFunds’ server. It transmits information in an encrypted and scrambled format. |
| ● | | Encryption is achieved through an electronic scrambling technology that uses a “key” to code and then decode the data. Encryption acts like the cable converter box you may have on your television set. It scrambles data with a secret code so that no one can make sense of it while it is being transmitted. When the data reaches its destination, the same software unscrambles the data. |
| ● | | You can exit the secure area by closing your browser or, for added security, you can use the Log Out button before you close your browser. |
Other Security Measures
We maintain physical, electronic and procedural safeguards to protect your personal account information. Our employees and agents have access to that information only so that they may offer you products or provide services, for example, when responding to your account questions.
How You Can Help
You can also do your part to keep your account information private and to prevent unauthorized transactions. If you obtain a user ID and password for your account, safeguard that information.
Strengthening your online credentials–your online security profile–typically your user name, password, and security questions and answers, can be one of your most important lines of defense on the Internet. For additional information on how you can help prevent identity theft, visit https://www. oppenheimerfunds.com/security.
Who We Are
This joint notice describes the privacy policies of the Oppenheimer funds, OppenheimerFunds, Inc., each of its investment adviser subsidiaries, OppenheimerFunds Distributor, Inc. and OFI Global Trust Co. It applies to all Oppenheimer fund accounts you presently have, or may open in the future, using your Social Security number—whether or not you remain a shareholder of our funds. This notice was last updated as of November 2017. In the event it is updated or changed, we will post an updated notice on our website at oppenheimerfunds.com. If you have any questions about this privacy policy, email us by clicking on theContact Us section of our website at oppenheimerfunds.com, write to us at P.O. Box 5270, Denver, CO 80217-5270, or call us at800 CALL OPP (225 5677).
|
| 50 OPPENHEIMER PORTFOLIO SERIES ACTIVE ALLOCATION FUND |
THIS PAGE INTENTIONALLY LEFT BLANK.
|
| 51 OPPENHEIMER PORTFOLIO SERIES ACTIVE ALLOCATION FUND |
THIS PAGE INTENTIONALLY LEFT BLANK.
|
| 52 OPPENHEIMER PORTFOLIO SERIES ACTIVE ALLOCATION FUND |
THIS PAGE INTENTIONALLY LEFT BLANK.
|
| 53 OPPENHEIMER PORTFOLIO SERIES ACTIVE ALLOCATION FUND |
THIS PAGE INTENTIONALLY LEFT BLANK.
|
| 54 OPPENHEIMER PORTFOLIO SERIES ACTIVE ALLOCATION FUND |
THIS PAGE INTENTIONALLY LEFT BLANK.
|
| 55 OPPENHEIMER PORTFOLIO SERIES ACTIVE ALLOCATION FUND |
| | |
 | | |
Visit us at oppenheimerfunds.com for24-hr access to account information and transactions or call us at 800.CALL OPP (800.225.5677) for24-hr automated information and automated transactions. Representatives also available Mon–Fri8am-8pm ET. | | |
| | |
Visit Us Oppenheimerfunds.com Call Us 800 225 5677 Follow Us | | |
 | | Oppenheimer funds are distributed by OppenheimerFunds Distributor, Inc. 225 Liberty Street, New York, NY 10281-1008 © 2019 OppenheimerFunds Distributor, Inc. All rights reserved. RA0550.001.0119 March 25, 2019 |
Important Updates
On October 18, 2018, Massachusetts Mutual Life Insurance Company, an indirect corporate parent of OppenheimerFunds, Inc. and its subsidiaries OFI Global Asset Management, Inc., OFI SteelPath, Inc. and OFI Advisors, LLC, announced that it has entered into an agreement whereby Invesco Ltd., a global investment management company, will acquire OppenheimerFunds, Inc. As of the date of this report, the transaction is expected to close in the second quarter of 2019, pending necessary regulatory and other third-party approvals. This is subject to change. See the Notes to Financial Statements for more information.
Update to Shareholder Report Document Delivery
Beginning January 1, 2021, OppenheimerFunds will send a notice, either by mail or email, each time your fund’s updated report is available on our website (oppenheimerfunds.com). Investors who are not enrolled in electronic delivery by January 1, 2021 will receive the notice in the mail. Enrolling in electronic delivery will enable you to receive a direct link to your full shareholder report the moment it becomes available, and limit the amount of mail you receive. All investors who prefer to receive shareholder reports in paper may, at any time, choose that option.
How do you update your delivery preferences?
If you own these shares through a financial intermediary, you may contact your financial intermediary.
If your accounts are held through OppenheimerFunds and you receive statements, confirms, and other documents directly from us, you can enroll in our eDocs DirectSM service atoppenheimerfunds.com or by calling us. Once you’re enrolled, you’ll begin to receive email notifications of updated documents when they become available. If you have any questions, feel free to call us at1.800.225.5677.
Table of Contents
Class A Shares
AVERAGE ANNUAL TOTAL RETURNS AT 1/31/19
| | | | | | | | | | | | | | |
| | | Class A Shares of the Fund | | | | | | |
| | | Without Sales Charge | | | | With Sales Charge | | | | S&P 500 Index | | | | MSCI World Index |
1-Year | | -10.71% | | | | -15.84% | | | | -2.31% | | | | -6.54% |
5-Year | | 5.31 | | | | 4.07 | | | | 10.96 | | | | 6.94 |
10-Year | | 11.63 | | | | 10.97 | | | | 15.00 | | | | 11.51 |
Performance data quoted represents past performance, which does not guarantee future results.The investment return and principal value of an investment in the Fund will fluctuate so that an investor’s shares, when redeemed, may be worth more or less than their original cost. Fund returns include changes in share price, reinvested distributions, and a 5.75% maximum applicable sales charge except where “without sales charge” is indicated. Current performance may be lower or higher than the performance quoted. Returns do not consider capital gains or income taxes on an individual’s investment. Returns for periods of less than one year are cumulative and not annualized. For performance data current to the most recentmonth-end, visit oppenheimerfunds.com or call 1.800.CALL OPP (225.5677). See Fund prospectuses and summary prospectuses for more information on share classes and sales charges.
3 OPPENHEIMER PORTFOLIO SERIES GROWTH INVESTOR FUND
Fund Performance Discussion1
During theone-year period ended January 31, 2019, the Fund’s Class A shares (without sales charge) returned-10.71%. For theone-year period ended January 31, 2019, the Fund underperformed the S&P 500 Index and MSCI World Index, which returned-2.31% and-6.54%, respectively.
MARKET OVERVIEW
Markets were volatile in 2018 and hit a wall in the last quarter of the year, before picking up again in January 2019. Several shocks negatively affected market sentiment. The U.S. Federal Reserve (Fed) once again decided to hike interest rates, as was nearly universally expected, but the post-meeting conference was more hawkish than expected. Markets were expecting a clear message that the Fed might consider a pause in any future rate increases, but that was not initially
communicated. Equity markets sold off, bonds rallied, and the U.S. dollar weakened. The sell-offs were sizable, which led some to think a recession might be imminent. It was not just the Fed making headlines, some key economic data were also weaker in December. In the U.S., regional surveys from the Fed and Institute for Supply Management (ISM) sentiment surveys decreased markedly, along with acool-off in housing. Politics were once again a factor because there was little clarity from the Trump Administration about the policies for tariffs on Chinese imports, and
COMPARISON OF CHANGE IN VALUE OF $10,000 HYPOTHETICAL INVESTMENTS IN:
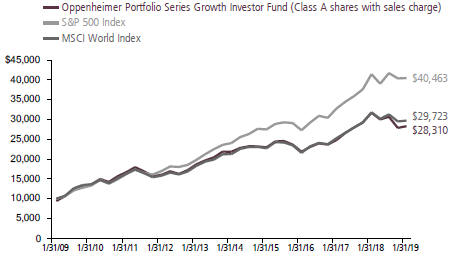
1. The Fund is invested in Class I shares of all underlying funds discussed in this Fund Performance Discussion.
4 OPPENHEIMER PORTFOLIO SERIES GROWTH INVESTOR FUND
the U.S. Government shutdown did not help in an environment where the appetite for risk declined. Risk markets rallied in January 2019. The strong gains were driven by a shift in the statements from the Fed, which signaled a more dovish tone on future interest rate rises.
Despite rallying in January 2019, equities generally declined for theone-year period ended January 31, 2019. U.S. equities outperformed their international counterparts, with the S&P 500 Index returning-2.31%, the MSCI ACWI returning-7.48%, and emerging markets falling the most with a-14.24% return for the MSCI Emerging Markets Index. Growth stocks continued to outperform value stocks this reporting period. Fixed income fared better than equities in a volatile environment, with the Bloomberg Barclays U.S. Aggregate Bond Index returning 2.25% and the Bloomberg Barclays Global Aggregate Bond Index, Hedged returning 3.58%.
FUND REVIEW
In a volatile market environment for equities, the Fund produced negative returns. With international stocks underperforming U.S. stocks this period, the Fund’s allocation to Oppenheimer International Growth Fund and Oppenheimer International Equity Fund detracted from performance. Oppenheimer Developing Markets Fund also negatively impacted absolute results as emerging market equities had a difficult reporting period. As mentioned earlier, value stocks underperformed this reporting period, which impacted Oppenheimer Value
Fund’s performance. Oppenheimer Capital Appreciation Fund, which typically invests inlarge-cap U.S. growth stocks, fared better than Oppenheimer Value Fund as growth outperformed; however, Oppenheimer Capital Appreciation Fund experienced declines and negatively impacted performance as it remained a top holding for most of the reporting period. We significantly trimmed our exposure to Oppenheimer Capital Appreciation Fund over the closing months of the reporting period.
Oppenheimer Global Fund and Oppenheimer Emerging Markets Innovators Fund were underlying equity funds that contributed positively to performance this period. We initiated positions in these underlying funds over the second half of the reporting period.
POST-PERIOD UPDATE
Shortly after the reporting period ended on February 1, 2019, we implemented changes to the Fund, which we believe will meaningfully enhance our investment capabilities and flexibility to manage the strategy in line with client expectations. The investment universe of the Fund has been expanded across OppenheimerFunds’ products, including additional mutual funds, ETFs andclosed-end funds, which will offer us additional component parts and greater investment flexibility to seek to achieve the Fund’s investment objective. In addition, the Fund will permit derivative usage for better cash and duration management. To reflect the expanded investable universe, Oppenheimer
5 OPPENHEIMER PORTFOLIO SERIES GROWTH INVESTOR FUND
Portfolio Series Equity Investor Fund was renamed Oppenheimer Portfolio Series Growth Investor Fund on February 1, 2019. Additionally, in connection with this change, the Fund’s investment objective was changed
| | |
 | |  |
| | Jeffrey Bennett, Portfolio Manager |
from capital appreciation to total return, and the Fund changed its benchmarks from the S&P 500 Index and MSCI World Index to the MSCI ACWI and Bloomberg Barclays Global Aggregate Bond Index, Hedged.
6 OPPENHEIMER PORTFOLIO SERIES GROWTH INVESTOR FUND
Top Holdings and Allocations
ASSET CLASS ALLOCATION
| | | | |
| Foreign Equity Funds | | | 64.4% | |
| Domestic Equity Funds | | | 35.6 | |
Portfolio holdings and allocations are subject to change. Percentages are as of January 31, 2019, and are based on the total market value of investments.
TOP TEN HOLDINGS
| | | | |
| Oppenheimer Value Fund, Cl. I | | | 20.6% | |
| Oppenheimer International Equity Fund, Cl. I | | | 17.5 | |
| Oppenheimer Global Fund, Cl. I | | | 16.3 | |
| Oppenheimer International Growth Fund, Cl. I | | | 10.6 | |
| Oppenheimer Developing Markets Fund, Cl. I | | | 8.2 | |
| Oppenheimer Capital Appreciation Fund, Cl. I | | | 7.0 | |
| Oppenheimer International Small-Mid Co. Fund, Cl. I | | | 6.7 | |
| Oppenheimer Emerging Markets Innovators Fund, Cl. I | | | 5.0 | |
| Oppenheimer Main Street Small Cap Fund, Cl. I | | | 4.9 | |
| Oppenheimer Discovery Mid Cap Growth Fund, Cl. I | | | 3.0 | |
Portfolio holdings and allocations are subject to change. Percentages are as of January 31, 2019, and are based on net assets.
For more current Fund holdings, please visit oppenheimerfunds.com.
7 OPPENHEIMER PORTFOLIO SERIES GROWTH INVESTOR FUND
Share Class Performance
AVERAGE ANNUAL TOTAL RETURNS WITHOUT SALES CHARGE AS OF 1/31/19
| | | | | | | | |
| | | Inception Date | | 1-Year | | 5-Year | | 10-Year |
| Class A (OAAIX) | | 4/5/05 | | -10.71% | | 5.31% | | 11.63% |
| Class C (OCAIX) | | 4/5/05 | | -11.39 | | 4.52 | | 10.79 |
| Class R (ONAIX) | | 4/5/05 | | -10.97 | | 5.05 | | 11.37 |
| Class Y (OYAIX) | | 4/5/05 | | -10.50 | | 5.57 | | 11.98 |
|
AVERAGE ANNUAL TOTAL RETURNS WITH SALES CHARGE AS OF 1/31/19 |
| | | Inception Date | | 1-Year | | 5-Year | | 10-Year |
| Class A (OAAIX) | | 4/5/05 | | -15.84% | | 4.07% | | 10.97% |
| Class C (OCAIX) | | 4/5/05 | | -12.22 | | 4.52 | | 10.79 |
| Class R (ONAIX) | | 4/5/05 | | -10.97 | | 5.05 | | 11.37 |
| Class Y (OYAIX) | | 4/5/05 | | -10.50 | | 5.57 | | 11.98 |
Performance data quoted represents past performance, which does not guarantee future results.The investment return and principal value of an investment in the Fund will fluctuate so that an investor’s shares, when redeemed, may be worth more or less than their original cost. Current performance may be lower or higher than the performance quoted. Returns do not consider capital gains or income taxes on an individual’s investment. For performance data current to the most recentmonth-end, visit oppenheimerfunds.com or call 1.800. CALL OPP (225.5677). Fund returns include changes in share price, reinvested distributions, and the applicable sales charge: for Class A shares, the current maximum initial sales charge of 5.75% and for Class C shares, the contingent deferred sales charge of 1% for the1-year period. There is no sales charge for Class R and Class Y shares. Returns for periods of less than one year are cumulative and not annualized. See Fund prospectuses and summary prospectuses for more information on share classes and sales charges.
The Fund’s performance is compared to the performance of the S&P 500 Index and the MSCI World Index. The S&P 500 Index is a capitalization-weighted index of 500 stocks intended to be a representative sample of leading companies in leading industries within the U.S. economy. The MSCI World Index is an index of issuers listed on the stock exchanges of foreign countries and the United States. It is widely recognized as a measure of global stock market performance. The indicesunmanaged and cannot be purchased directly by investors. While index comparisons may be useful to provide a benchmark for the Fund’s performance, it must be noted that the Fund’s investments are not limited to the investments comprising theindices. Index performance includes reinvestment of income, but does not reflect transaction costs, fees, expenses or taxes. Index performance is shown for illustrative purposes only as a benchmark for the Fund’s performance, and does not predict or depict performance of the Fund. The Fund’s performance reflects the effects of the Fund’s business and operating expenses.
The views in the Fund Performance Discussion represent the opinions of this Fund’s portfolio manager(s) and are not intended as investment advice or to predict or depict the performance of any investment. These views are as of the close of business on January 31, 2019, and are
8 OPPENHEIMER PORTFOLIO SERIES GROWTH INVESTOR FUND
subject to change based on subsequent developments. The Fund’s portfolio and strategies are subject to change.
Before investing in any of the Oppenheimer funds, investors should carefully consider a fund’s investment objectives, risks, charges and expenses. Fund prospectuses and summary prospectuses contain this and other information about the funds, and may be obtained by asking your financial advisor, visiting oppenheimerfunds.com, or calling 1.800.CALL OPP (225.5677). Read prospectuses and summary prospectuses carefully before investing.
Shares of Oppenheimer funds are not deposits or obligations of any bank, are not guaranteed by any bank, are not insured by the FDIC or any other agency, and involve investment risks, including the possible loss of the principal amount invested.
9 OPPENHEIMER PORTFOLIO SERIES GROWTH INVESTOR FUND
Fund Expenses
Fund Expenses. As a shareholder of the Fund, you incur two types of costs: (1) transaction costs, which may include sales charges (loads) on purchase payments and/or contingent deferred sales charges on redemptions; and (2) ongoing costs, including management fees; distribution and service fees; and other Fund expenses. These examples are intended to help you understand your ongoing costs (in dollars) of investing in the Fund and to compare these costs with the ongoing costs of investing in other mutual funds.
The examples are based on an investment of $1,000.00 invested at the beginning of the period and held for the entire6-month period ended January 31, 2019.
Actual Expenses. The first section of the table provides information about actual account values and actual expenses. You may use the information in this section for the class of shares you hold, together with the amount you invested, to estimate the expense that you paid over the period. Simply divide your account value by $1,000.00 (for example, an $8,600.00 account value divided by $1,000.00 = 8.60), then multiply the result by the number in the first section under the heading entitled “Expenses Paid During 6 Months Ended January 31, 2019” to estimate the expenses you paid on your account during this period.
Hypothetical Example for Comparison Purposes.The second section of the table provides information about hypothetical account values and hypothetical expenses based on the Fund’s actual expense ratio for each class of shares, and an assumed rate of return of 5% per year for each class before expenses, which is not the Fund’s actual return. The hypothetical account values and expenses may not be used to estimate the actual ending account balance or expenses you paid for the period. You may use this information to compare the ongoing costs of investing in the Fund and other funds. To do so, compare this 5% hypothetical example for the class of shares you hold with the 5% hypothetical examples that appear in the shareholder reports of the other funds.
Please note that the expenses shown in the table are meant to highlight your ongoing costs only and do not reflect any transactional costs, such asfront-end or contingent deferred sales charges (loads). Therefore, the “hypothetical” section of the table is useful in comparing ongoing costs only, and will not help you determine the relative total costs of owning different funds. In addition, if these transactional costs were included, your costs would have been higher.
10 OPPENHEIMER PORTFOLIO SERIES GROWTH INVESTOR FUND
| | | | | | |
| Actual | | Beginning Account Value August 1, 2018 | | Ending Account Value January 31, 2019 | | Expenses Paid During 6 Months Ended January 31, 2019 |
| Class A | | $ 1,000.00 | | $ 922.80 | | $ 2.18 |
| Class C | | 1,000.00 | | 919.00 | | 5.87 |
| Class R | | 1,000.00 | | 921.60 | | 3.45 |
| Class Y | | 1,000.00 | | 923.90 | | 1.02 |
| | | |
Hypothetical
(5% return before expenses) | | | | | | |
| Class A | | 1,000.00 | | 1,022.94 | | 2.30 |
| Class C | | 1,000.00 | | 1,019.11 | | 6.18 |
| Class R | | 1,000.00 | | 1,021.63 | | 3.62 |
| Class Y | | 1,000.00 | | 1,024.15 | | 1.07 |
Expenses are equal to the Fund’s annualized expense ratio for that class, multiplied by the average account value over the period, multiplied by 184/365 (to reflect theone-half year period). Those annualized expense ratios, excluding indirect expenses from affiliated funds, based on the6-month period ended January 31, 2019 are as follows:
| | | | |
| Class | | Expense Ratios | |
| Class A | | | 0.45% | |
| Class C | | | 1.21 | |
| Class R | | | 0.71 | |
| Class Y | | | 0.21 | |
11 OPPENHEIMER PORTFOLIO SERIES GROWTH INVESTOR FUND
STATEMENT OF INVESTMENTSJanuary 31, 2019
| | | | | | | | |
| | | Shares | | | Value | |
| |
| Investment Companies—99.8%1 | | | | | | | | |
Domestic Equity Funds—35.5% | | | | | | | | |
| Oppenheimer Capital Appreciation Fund, Cl. I | | | 936,339 | | | $ | 57,397,572 | |
| Oppenheimer Discovery Mid Cap Growth Fund, Cl. I | | | 1,151,347 | | | | 24,512,187 | |
| Oppenheimer Main Street Small Cap Fund, Cl. I | | | 2,899,007 | | | | 40,702,058 | |
| Oppenheimer Value Fund, Cl. I | | | 5,268,137 | | | | 169,054,530 | |
| | | | | | | | 291,666,347 | |
Foreign Equity Funds—64.3% | | | | | | | | |
| Oppenheimer Developing Markets Fund, Cl. I | | | 1,653,500 | | | | 67,446,258 | |
| Oppenheimer Emerging Markets Innovators Fund, Cl. I2 | | | 4,255,654 | | | | 41,407,517 | |
| Oppenheimer Global Fund, Cl. I | | | 1,638,862 | | | | 133,911,374 | |
| Oppenheimer International Equity Fund, Cl. I | | | 7,483,572 | | | | 143,310,400 | |
| Oppenheimer International Growth Fund, Cl. I | | | 2,336,050 | | | | 86,737,551 | |
| Oppenheimer InternationalSmall-Mid Co. Fund, Cl. I | | | 1,273,544 | | | | 55,348,210 | |
| | | | | | | | 528,161,310 | |
| Total Investments, at Value (Cost $626,247,575) | | | 99.8% | | | | 819,827,657 | |
| Net Other Assets (Liabilities) | | | 0.2 | | | | 1,254,203 | |
Net Assets | | | 100.0% | | | $ | 821,081,860 | |
| | | | | | | | |
Footnotes to Statement of Investments
1. Is or was an affiliate, as defined in the Investment Company Act of 1940, as amended, at or during the reporting period, by virtue of the Fund owning at least 5% of the voting securities of the issuer or as a result of the Fund and the issuer having the same investment adviser. Transactions during the reporting period in which the issuer was an affiliate are as follows:
| | | | | | | | | | | | | | | | |
| | | Shares
January 31, 2018 | | | Gross
Additions | | | Gross
Reductions | | | Shares
January 31, 2019 | |
| Investment Companies | | | | | | | | | | | | | | | | |
| Domestic Equity Funds | | | | | | | | | | | | | | | | |
| Oppenheimer Capital Appreciation Fund, Cl. I | | | 2,981,202 | | | | 103,351 | | | | 2,148,214 | | | | 936,339 | |
| Oppenheimer Discovery Mid Cap Growth Fund, Cl. I | | | — | | | | 1,173,873 | | | | 22,526 | | | | 1,151,347 | |
| Oppenheimer Main Street Mid Cap Fund, Cl. I | | | 1,318,341 | | | | 52,186 | | | | 1,370,527 | | | | — | |
| Oppenheimer Main Street Small Cap Fund, Cl. I | | | 2,096,673 | | | | 1,026,721 | | | | 224,387 | | | | 2,899,007 | |
| Oppenheimer Value Fund, Cl. I | | | 5,409,855 | | | | 790,620 | | | | 932,338 | | | | 5,268,137 | |
| Foreign Equity Funds | | | | | | | | | | | | | | | | |
| Oppenheimer Developing Markets Fund, Cl. I | | | 1,337,978 | | | | 544,175 | | | | 228,653 | | | | 1,653,500 | |
| Oppenheimer Emerging Markets Innovators Fund, Cl. I | | | — | | | | 4,341,659 | | | | 86,005 | | | | 4,255,654 | |
| Oppenheimer Global Fund, Cl. I | | | — | | | | 1,670,005 | | | | 31,143 | | | | 1,638,862 | |
| Oppenheimer International Equity Fund, Cl. I | | | 7,009,190 | | | | 1,136,355 | | | | 661,973 | | | | 7,483,572 | |
| Oppenheimer International Growth Fund, Cl. I | | | 4,059,673 | | | | 647,037 | | | | 2,370,660 | | | | 2,336,050 | |
| Oppenheimer International Small- Mid Co. Fund, Cl. I | | | 1,424,623 | | | | 150,372 | | | | 301,451 | | | | 1,273,544 | |
12 OPPENHEIMER PORTFOLIO SERIES GROWTH INVESTOR FUND
Footnotes to Statement of Investments (Continued)
| | | | | | | | | | | | | | | | |
| | | Value | | | Income | | | Realized Gain (Loss) | | | Change in
Unrealized Gain (Loss) | |
| Investment Companies | | | | | | | | | | | | | | | | |
| Domestic Equity Funds | | | | | | | | | | | | | | | | |
| Oppenheimer Capital Appreciation Fund, Cl. Ia | | $ | 57,397,572 | | | $ | 124,651 | | | $ | 29,635,915 | | | $ | (39,880,565) | |
| Oppenheimer Discovery Mid Cap Growth Fund, Cl. Ib | | | 24,512,187 | | | | — | | | | (49,013) | | | | (1,012,697) | |
| Oppenheimer Main Street Mid Cap Fund, Cl. Ic | | | — | | | | 37,722 | | | | 6,734,510 | | | | (9,517,407) | |
| Oppenheimer Main Street Small Cap Fund, Cl. Id | | | 40,702,058 | | | | 139,682 | | | | 53,537 | | | | (3,329,486) | |
| Oppenheimer Value Fund, Cl. Ie | | | 169,054,530 | | | | 3,266,172 | | | | 6,804,065 | | | | (44,165,874) | |
| Foreign Equity Funds | | | | | | | | | | | | | | | | |
| Oppenheimer Developing Markets Fund, Cl. I | | | 67,446,258 | | | | 506,875 | | | | (1,043,168) | | | | (8,264,565) | |
| Oppenheimer Emerging Markets Innovators Fund, Cl. I | | | 41,407,517 | | | | — | | | | (9,788) | | | | 1,784,959 | |
| Oppenheimer Global Fund, Cl. If | | | 133,911,374 | | | | 786,696 | | | | (267,063) | | | | (5,636,710) | |
| Oppenheimer International Equity Fund, Cl. I | | | 143,310,400 | | | | 2,327,928 | | | | (975,736) | | | | (30,420,262) | |
| Oppenheimer International Growth Fund, Cl. I | | | 86,737,551 | | | | 1,696,029 | | | | 20,836,229 | | | | (58,929,550) | |
| Oppenheimer International Small-Mid Co. Fund, Cl. Ig | | | 55,348,210 | | | | 558,731 | | | | 6,366,153 | | | | (17,106,086) | |
| | | | |
Total | | $ | 819,827,657 | | | $ | 9,444,486 | | | $ | 68,085,641 | | | $ | (216,478,243) | |
| | | | |
a. This fund distributed realized gains of $4,037,950.
b. This fund distributed realized gains of $1,268,613.
c. This fund distributed realized gains of $946,912.
d. This fund distributed realized gains of $2,530,911.
e. This fund distributed realized gains of $18,200,795.
f. This fund distributed realized gains of $8,791,441.
g. This fund distributed realized gains of $4,863,061.
2.Non-income producing security.
See accompanying Notes to Financial Statements.
13 OPPENHEIMER PORTFOLIO SERIES GROWTH INVESTOR FUND
STATEMENT OF ASSETS AND LIABILITIESJanuary 31, 2019
| | | | |
|
| |
| Assets | | | | |
| Investments, at value—affiliated companies (cost $626,247,575)—see accompanying statement of investments | | $ | 819,827,657 | |
| |
| Cash | | | 1,045,462 | |
| |
| Receivables and other assets: | | | | |
| Shares of beneficial interest sold | | | 458,105 | |
| Investments sold | | | 449,182 | |
| Other | | | 33,821 | |
| | | | |
| Total assets | | | 821,814,227 | |
| | | | |
|
| |
| Liabilities | | | | |
| Payables and other liabilities: | | | | |
| Shares of beneficial interest redeemed | | | 489,000 | |
| Distribution and service plan fees | | | 162,707 | |
| Trustees’ compensation | | | 45,551 | |
| Shareholder communications | | | 6,161 | |
| Other | | | 28,948 | |
| | | | |
| Total liabilities | | | 732,367 | |
| | | | |
|
| |
Net Assets | | $ | 821,081,860 | |
| | | | |
| | | | |
|
| |
| Composition of Net Assets | | | | |
| Par value of shares of beneficial interest | | $ | 51,189 | |
| |
| Additionalpaid-in capital | | | 566,093,064 | |
| |
| Total distributable earnings | | | 254,937,607 | |
| | | | |
Net Assets | | $ | 821,081,860 | |
| | | | |
| | | | |
|
| |
| Net Asset Value Per Share | | | | |
| Class A Shares: | | | | |
| |
| Net asset value and redemption price per share (based on net assets of $574,046,118 and 35,597,859 shares of beneficial interest outstanding) | | | $16.13 | |
| Maximum offering price per share (net asset value plus sales charge of 5.75% of offering price) | | | $17.11 | |
| |
| |
| Class C Shares: | | | | |
| |
| Net asset value, redemption price (excludes applicable contingent deferred sales charge) and offering price per share (based on net assets of $169,142,124 and 10,764,571 shares of beneficial interest outstanding) | | | $15.71 | |
| |
| |
| Class R Shares: | | | | |
| |
| Net asset value, redemption price (excludes applicable contingent deferred sales charge) and offering price per share (based on net assets of $56,311,460 and 3,494,766 shares of beneficial interest outstanding) | | | $16.11 | |
| |
| |
| Class Y Shares: | | | | |
| |
| Net asset value, redemption price and offering price per share (based on net assets of $21,582,158 and 1,332,033 shares of beneficial interest outstanding) | | | $16.20 | |
See accompanying Notes to Financial Statements.
14 OPPENHEIMER PORTFOLIO SERIES GROWTH INVESTOR FUND
STATEMENT
OF OPERATIONSFor the Year Ended January 31, 2019
| | | | |
| |
| Investment Income | | | | |
| Dividends—affiliated companies | | $ | 9,444,486 | |
| |
| Interest | | | 20,800 | |
| | | | |
| Total investment income | | | 9,465,286 | |
|
| |
| Expenses | | | | |
| Distribution and service plan fees: | | | | |
| Class A | | | 1,492,499 | |
| Class B1 | | | 6,412 | |
| Class C | | | 1,848,580 | |
| Class R | | | 283,917 | |
| |
| Transfer and shareholder servicing agent fees: | | | | |
| Class A | | | 1,199,548 | |
| Class B1 | | | 1,256 | |
| Class C | | | 362,007 | |
| Class R | | | 111,848 | |
| Class Y | | | 43,625 | |
| |
| Shareholder communications: | | | | |
| Class A | | | 17,491 | |
| Class B1 | | | 165 | |
| Class C | | | 4,787 | |
| Class R | | | 1,929 | |
| Class Y | | | 255 | |
| |
| Trustees’ compensation | | | 12,571 | |
| |
| Custodian fees and expenses | | | 5,585 | |
| |
| Other | | | 61,552 | |
| | | | |
| Total expenses | | | 5,454,027 | |
| |
Net Investment Income | | | 4,011,259 | |
| |
| Realized and Unrealized Gain (Loss) | | | | |
| Net realized gain on: | | | | |
| Investment transactions in affiliated companies | | | 68,085,641 | |
| Distributions received from affiliated companies | | | 40,639,683 | |
| | | | |
| Net realized gain | | | 108,725,324 | |
| |
| Net change in unrealized appreciation/(depreciation) on investment transactions in affiliated companies | | | (216,478,243) | |
|
| |
Net Decrease in Net Assets Resulting from Operations | | $ | (103,741,660) | |
| | | | |
1.Effective June 1, 2018, all Class B shares converted to Class A shares.
See accompanying Notes to Financial Statements.
15 OPPENHEIMER PORTFOLIO SERIES GROWTH INVESTOR FUND
STATEMENTS OF CHANGES IN NET ASSETS
| | | | | | | | |
| | | Year Ended
January 31, 2019 | | | Year Ended
January 31, 20181 | |
| |
| Operations | | | | | | | | |
| Net investment income | | $ | 4,011,259 | | | $ | 1,990,057 | |
| |
| Net realized gain | | | 108,725,324 | | | | 37,844,368 | |
| |
| Net change in unrealized appreciation/(depreciation) | | | (216,478,243) | | | | 174,076,927 | |
| | | | |
Net increase (decrease) in net assets resulting from operations | | | (103,741,660) | | | | 213,911,352 | |
|
| |
| Dividends and/or Distributions to Shareholders | | | | | | | | |
| Dividends and distributions declared: | | | | | | | | |
| Class A | | | (37,591,204) | | | | (14,939,008) | |
| Class B2 | | | — | | | | (46,784) | |
| Class C | | | (10,025,817) | | | | (3,446,860) | |
| Class R | | | (3,476,706) | | | | (1,183,957) | |
| Class Y | | | (1,467,025) | | | | (642,081) | |
| | | | |
| Total dividends and distributions declared | | | (52,560,752) | | | | (20,258,690) | |
| | | | | | | | |
|
| |
| Beneficial Interest Transactions | | | | | | | | |
| Net increase (decrease) in net assets resulting from beneficial interest transactions: | | | | | | | | |
| Class A | | | 8,115,281 | | | | 4,113,274 | |
| Class B2 | | | (4,030,402) | | | | (11,826,177) | |
| Class C | | | (10,943,268) | | | | (10,175,540) | |
| Class R | | | 6,877,354 | | | | 3,238,839 | |
| Class Y | | | (33,926) | | | | 1,278,604 | |
| | | | |
| Total beneficial interest transactions | | | (14,961) | | | | (13,371,000) | |
| | | | | | | | |
|
| |
| Net Assets | | | | | | | | |
| Total increase (decrease) | | | (156,317,373) | | | | 180,281,662 | |
| |
| Beginning of period | | | 977,399,233 | | | | 797,117,571 | |
| | | | |
| End of period | | $ | 821,081,860 | | | $ | 977,399,233 | |
| | | | |
1. Prior period amounts have been conformed to current year presentation. See Notes to Financial Statements, Note
2 – New Accounting Pronouncements for further details.
2. Effective June 1, 2018, all Class B shares converted to Class A shares.
See accompanying Notes to Financial Statements.
16 OPPENHEIMER PORTFOLIO SERIES GROWTH INVESTOR FUND
FINANCIAL HIGHLIGHTS
| | | | | | | | | | | | | | | | | | | | |
| Class A | | Year Ended
January 31,
2019 | | | Year Ended
January 31,
2018 | | | Year Ended
January 31,
2017 | | | Year Ended
January 29,
20161 | | | Year Ended
January 30,
20151 | |
| |
| Per Share Operating Data | | | | | | | | | | | | | | | | | | | | |
| Net asset value, beginning of period | | | $19.46 | | | | $15.59 | | | | $13.99 | | | | $14.87 | | | | $14.28 | |
| |
| Income (loss) from investment operations: | | | | | | | | | | | | | | | | | | | | |
| Net investment income2 | | | 0.11 | | | | 0.07 | | | | 0.14 | | | | 0.07 | | | | 0.11 | |
| Net realized and unrealized gain (loss) | | | (2.31) | | | | 4.24 | | | | 1.74 | | | | (0.76) | | | | 0.60 | |
| | | | |
| Total from investment operations | | | (2.20) | | | | 4.31 | | | | 1.88 | | | | (0.69) | | | | 0.71 | |
| |
| Dividends and/or distributions to shareholders: | | | | | | | | | | | | | | | | | | | | |
| Dividends from net investment income | | | (0.18) | | | | (0.27) | | | | (0.16) | | | | (0.19) | | | | (0.12) | |
| Distributions from net realized gain | | | (0.95) | | | | (0.17) | | | | (0.12) | | | | 0.00 | | | | 0.00 | |
| | | | |
| Total dividends and/or distributions to shareholders | | | (1.13) | | | | (0.44) | | | | (0.28) | | | | (0.19) | | | | (0.12) | |
| |
| Net asset value, end of period | | | $16.13 | | | | $19.46 | | | | $15.59 | | | | $13.99 | | | | $14.87 | |
| | | | |
| | | | |
|
| |
| Total Return, at Net Asset Value3 | | | (10.71)% | | | | 27.83% | | | | 13.52% | | | | (4.78)% | | | | 4.99% | |
|
| |
| Ratios/Supplemental Data | | | | | | | | | | | | | | | | | | | | |
| Net assets, end of period (in thousands) | | | $574,046 | | | | $674,845 | | | | $537,926 | | | | $492,539 | | | | $513,521 | |
| |
| Average net assets (in thousands) | | | $614,960 | | | | $598,934 | | | | $522,301 | | | | $533,833 | | | | $519,483 | |
| |
| Ratios to average net assets:4 | | | | | | | | | | | | | | | | | | | | |
| Net investment income | | | 0.62% | | | | 0.42% | | | | 0.93% | | | | 0.45% | | | | 0.72% | |
| Expenses excluding specific expenses listed below | | | 0.45% | | | | 0.47% | | | | 0.48% | | | | 0.48% | | | | 0.48% | |
| Interest and fees from borrowings | | | 0.00% | | | | 0.00% | | | | 0.00%5 | | | | 0.00%5 | | | | 0.00% | |
| | | | |
| Total expenses6 | | | 0.45% | | | | 0.47% | | | | 0.48% | | | | 0.48% | | | | 0.48% | |
| Expenses after payments, waivers and/or reimbursements and reduction to custodian expenses | | | 0.45% | | | | 0.46% | | | | 0.48% | | | | 0.48% | | | | 0.48% | |
| |
| Portfolio turnover rate | | | 38% | | | | 8% | | | | 6% | | | | 8% | | | | 10% | |
1. Represents the last business day of the Fund’s reporting period.
2. Per share amounts calculated based on the average shares outstanding during the period.
3. Assumes an initial investment on the business day before the first day of the fiscal period, with all dividends and distributions reinvested in additional shares on the reinvestment date, and redemption at the net asset value calculated on the last business day of the fiscal period. Sales charges are not reflected in the total returns. Total returns are not annualized for periods less than one full year. Returns do not reflect the deduction of taxes that a shareholder would pay on fund distributions or the redemption of fund shares.
4. Annualized for periods less than one full year.
5. Less than 0.005%.
6. Total expenses including indirect expenses from affiliated fund fees and expenses were as follows:
| | | | | | |
| | | | | | |
| | | | | | |
Year Ended January 31, 2019 | | | 1.16 | % |
Year Ended January 31, 2018 | | | 1.17 | % |
Year Ended January 31, 2017 | | | 1.18 | % |
Year Ended January 29, 2016 | | | 1.16 | % |
Year Ended January 30, 2015 | | | 1.17 | % |
See accompanying Notes to Financial Statements.
17 OPPENHEIMER PORTFOLIO SERIES GROWTH INVESTOR FUND
FINANCIAL HIGHLIGHTSContinued
| | | | | | | | | | | | | | | | | | | | |
| Class C | | Year Ended
January 31,
2019 | | | Year Ended
January 31,
2018 | | | Year Ended
January 31,
2017 | | | Year Ended
January 29,
20161 | | | Year Ended
January 30,
20151 | |
| |
| Per Share Operating Data | | | | | | | | | | | | | | | | | | | | |
| Net asset value, beginning of period | | | $18.96 | | | | $15.21 | | | | $13.65 | | | | $14.52 | | | | $13.94 | |
| |
| Income (loss) from investment operations: | | | | | | | | | | | | | | | | | | | | |
| Net investment income (loss)2 | | | (0.02) | | | | (0.06) | | | | 0.02 | | | | (0.05) | | | | 0.00 | |
| Net realized and unrealized gain (loss) | | | (2.24) | | | | 4.12 | | | | 1.71 | | | | (0.75) | | | | 0.59 | |
| | | | |
| Total from investment operations | | | (2.26) | | | | 4.06 | | | | 1.73 | | | | (0.80) | | | | 0.59 | |
| |
| Dividends and/or distributions to shareholders: | | | | | | | | | | | | | | | | | | | | |
| Dividends from net investment income | | | (0.04) | | | | (0.14) | | | | (0.05) | | | | (0.07) | | | | (0.01) | |
| Distributions from net realized gain | | | (0.95) | | | | (0.17) | | | | (0.12) | | | | 0.00 | | | | 0.00 | |
| | | | |
| Total dividends and/or distributions to shareholders | | | (0.99) | | | | (0.31) | | | | (0.17) | | | | (0.07) | | | | (0.01) | |
| |
| Net asset value, end of period | | | $15.71 | | | | $18.96 | | | | $15.21 | | | | $13.65 | | | | $14.52 | |
| | | | |
| | | | |
|
| |
| Total Return, at Net Asset Value3 | | | (11.39)% | | | | 26.83% | | | | 12.71% | | | | (5.51)% | | | | 4.22% | |
|
| |
| Ratios/Supplemental Data | | | | | | | | | | | | | | | | | | | | |
| Net assets, end of period (in thousands) | | | $169,142 | | | | $212,996 | | | | $180,365 | | | | $172,605 | | | | $186,923 | |
| |
| Average net assets (in thousands) | | | $185,541 | | | | $193,616 | | | | $179,171 | | | | $189,362 | | | | $189,422 | |
| |
| Ratios to average net assets:4 | | | | | | | | | | | | | | | | | | | | |
| Net investment income (loss) | | | (0.13)% | | | | (0.36)% | | | | 0.16% | | | | (0.31)% | | | | (0.02)% | |
| Expenses excluding specific expenses listed below | | | 1.20% | | | | 1.22% | | | | 1.23% | | | | 1.23% | | | | 1.22% | |
| Interest and fees from borrowings | | | 0.00% | | | | 0.00% | | | | 0.00%5 | | | | 0.00%5 | | | | 0.00% | |
| | | | |
| Total expenses6 | | | 1.20% | | | | 1.22% | | | | 1.23% | | | | 1.23% | | | | 1.22% | |
| Expenses after payments, waivers and/or reimbursements and reduction to custodian expenses | | | 1.20% | | | | 1.21% | | | | 1.23% | | | | 1.23% | | | | 1.22% | |
| |
| Portfolio turnover rate | | | 38% | | | | 8% | | | | 6% | | | | 8% | | | | 10% | |
1. Represents the last business day of the Fund’s reporting period.
2. Per share amounts calculated based on the average shares outstanding during the period.
3. Assumes an initial investment on the business day before the first day of the fiscal period, with all dividends and distributions reinvested in additional shares on the reinvestment date, and redemption at the net asset value calculated on the last business day of the fiscal period. Sales charges are not reflected in the total returns. Total returns are not annualized for periods less than one full year. Returns do not reflect the deduction of taxes that a shareholder would pay on fund distributions or the redemption of fund shares.
4. Annualized for periods less than one full year.
5. Less than 0.005%.
6. Total expenses including indirect expenses from affiliated fund fees and expenses were as follows:
| | | | | | |
| | | | | | |
| | | | | | |
Year Ended January 31, 2019 | | | 1.91 | % |
Year Ended January 31, 2018 | | | 1.92 | % |
Year Ended January 31, 2017 | | | 1.93 | % |
Year Ended January 29, 2016 | | | 1.91 | % |
Year Ended January 30, 2015 | | | 1.91 | % |
See accompanying Notes to Financial Statements.
18 OPPENHEIMER PORTFOLIO SERIES GROWTH INVESTOR FUND
| | | | | | | | | | | | | | | | | | | | |
| Class R | | Year Ended
January 31,
2019 | | | Year Ended
January 31,
2018 | | | Year Ended
January 31,
2017 | | | Year Ended
January 29,
20161 | | | Year Ended
January 30,
20151 | |
| |
| Per Share Operating Data | | | | | | | | | | | | | | | | | | | | |
| Net asset value, beginning of period | | | $19.44 | | | | $15.59 | | | | $13.98 | | | | $14.86 | | | | $14.25 | |
| |
| Income (loss) from investment operations: | | | | | | | | | | | | | | | | | | | | |
| Net investment income2 | | | 0.07 | | | | 0.04 | | | | 0.10 | | | | 0.03 | | | | 0.06 | |
| Net realized and unrealized gain (loss) | | | (2.31) | | | | 4.21 | | | | 1.75 | | | | (0.77) | | | | 0.62 | |
| | | | |
| Total from investment operations | | | (2.24) | | | | 4.25 | | | | 1.85 | | | | (0.74) | | | | 0.68 | |
| |
| Dividends and/or distributions to shareholders: | | | | | | | | | | | | | | | | | | | | |
| Dividends from net investment income | | | (0.14) | | | | (0.23) | | | | (0.12) | | | | (0.14) | | | | (0.07) | |
| Distributions from net realized gain | | | (0.95) | | | | (0.17) | | | | (0.12) | | | | 0.00 | | | | 0.00 | |
| | | | |
| Total dividends and/or distributions to shareholders | | | (1.09) | | | | (0.40) | | | | (0.24) | | | | (0.14) | | | | (0.07) | |
| |
| Net asset value, end of period | | | $16.11 | | | | $19.44 | | | | $15.59 | | | | $13.98 | | | | $14.86 | |
| | | | |
| | | | |
|
| |
| Total Return, at Net Asset Value3 | | | (10.97)% | | | | 27.44% | | | | 13.31% | | | | (5.02)% | | | | 4.77% | |
|
| |
| Ratios/Supplemental Data | | | | | | | | | | | | | | | | | | | | |
| Net assets, end of period (in thousands) | | | $56,312 | | | | $59,559 | | | | $45,222 | | | | $41,159 | | | | $49,122 | |
| |
| Average net assets (in thousands) | | | $57,352 | | | | $50,000 | | | | $43,838 | | | | $48,259 | | | | $52,717 | |
| |
| Ratios to average net assets:4 | | | | | | | | | | | | | | | | | | | | |
| Net investment income | | | 0.37% | | | | 0.22% | | | | 0.68% | | | | 0.19% | | | | 0.43% | |
| Expenses excluding specific expenses listed below | | | 0.70% | | | | 0.72% | | | | 0.73% | | | | 0.73% | | | | 0.73% | |
| Interest and fees from borrowings | | | 0.00% | | | | 0.00% | | | | 0.00%5 | | | | 0.00%5 | | | | 0.00% | |
| | | | |
| Total expenses6 | | | 0.70% | | | | 0.72% | | | | 0.73% | | | | 0.73% | | | | 0.73% | |
| Expenses after payments, waivers and/or reimbursements and reduction to custodian expenses | | | 0.70% | | | | 0.71% | | | | 0.73% | | | | 0.73% | | | | 0.73% | |
| |
| Portfolio turnover rate | | | 38% | | | | 8% | | | | 6% | | | | 8% | | | | 10% | |
1. Represents the last business day of the Fund’s reporting period.
2. Per share amounts calculated based on the average shares outstanding during the period.
3. Assumes an initial investment on the business day before the first day of the fiscal period, with all dividends and distributions reinvested in additional shares on the reinvestment date, and redemption at the net asset value calculated on the last business day of the fiscal period. Sales charges are not reflected in the total returns. Total returns are not annualized for periods less than one full year. Returns do not reflect the deduction of taxes that a shareholder would pay on fund distributions or the redemption of fund shares.
4. Annualized for periods less than one full year.
5. Less than 0.005%.
6. Total expenses including indirect expenses from affiliated fund fees and expenses were as follows:
| | | | | | |
| | | | | | |
| | | | | | |
Year Ended January 31, 2019 | | | 1.41 | % |
Year Ended January 31, 2018 | | | 1.42 | % |
Year Ended January 31, 2017 | | | 1.43 | % |
Year Ended January 29, 2016 | | | 1.41 | % |
Year Ended January 30, 2015 | | | 1.42 | % |
See accompanying Notes to Financial Statements.
19 OPPENHEIMER PORTFOLIO SERIES GROWTH INVESTOR FUND
FINANCIAL HIGHLIGHTSContinued
| | | | | | | | | | | | | | | | | | | | |
| Class Y | | Year Ended
January 31,
2019 | | | Year Ended
January 31,
2018 | | | Year Ended
January 31,
2017 | | | Year Ended
January 29,
20161 | | | Year Ended
January 30,
20151 | |
| |
| Per Share Operating Data | | | | | | | | | | | | | | | | | | | | |
| Net asset value, beginning of period | | | $19.55 | | | | $15.67 | | | | $14.05 | | | | $14.94 | | | | $14.34 | |
| |
| Income (loss) from investment operations: | | | | | | | | | | | | | | | | | | | | |
| Net investment income2 | | | 0.16 | | | | 0.13 | | | | 0.18 | | | | 0.11 | | | | 0.15 | |
| Net realized and unrealized gain (loss) | | | (2.33) | | | | 4.23 | | | | 1.76 | | | | (0.77) | | | | 0.60 | |
| | | | |
| Total from investment operations | | | (2.17) | | | | 4.36 | | | | 1.94 | | | | (0.66) | | | | 0.75 | |
| |
| Dividends and/or distributions to shareholders: | | | | | | | | | | | | | | | | | | | | |
| Dividends from net investment income | | | (0.23) | | | | (0.31) | | | | (0.20) | | | | (0.23) | | | | (0.15) | |
| Distributions from net realized gain | | | (0.95) | | | | (0.17) | | | | (0.12) | | | | 0.00 | | | | 0.00 | |
| | | | |
| Total dividends and/or distributions to shareholders | | | (1.18) | | | | (0.48) | | | | (0.32) | | | | (0.23) | | | | (0.15) | |
| |
| Net asset value, end of period | | | $16.20 | | | | $19.55 | | | | $15.67 | | | | $14.05 | | | | $14.94 | |
| | | | |
| | | | |
|
| |
| Total Return, at Net Asset Value3 | | | (10.50)% | | | | 28.04% | | | | 13.88% | | | | (4.53)% | | | | 5.24% | |
|
| |
| Ratios/Supplemental Data | | | | | | | | | | | | | | | | | | | | |
| Net assets, end of period (in thousands) | | | $21,582 | | | | $25,773 | | | | $19,517 | | | | $20,784 | | | | $20,573 | |
| |
| Average net assets (in thousands) | | | $22,363 | | | | $22,559 | | | | $18,820 | | | | $22,268 | | | | $20,881 | |
| |
| Ratios to average net assets:4 | | | | | | | | | | | | | | | | | | | | |
| Net investment income | | | 0.87% | | | | 0.72% | | | | 1.18% | | | | 0.71% | | | | 1.00% | |
| Expenses excluding specific expenses listed below | | | 0.21% | | | | 0.23% | | | | 0.23% | | | | 0.23% | | | | 0.23% | |
| Interest and fees from borrowings | | | 0.00% | | | | 0.00% | | | | 0.00%5 | | | | 0.00%5 | | | | 0.00% | |
| | | | |
| Total expenses6 | | | 0.21% | | | | 0.23% | | | | 0.23% | | | | 0.23% | | | | 0.23% | |
| Expenses after payments, waivers and/or reimbursements and reduction to custodian expenses | | | 0.21% | | | | 0.22% | | | | 0.23% | | | | 0.23% | | | | 0.23% | |
| |
| Portfolio turnover rate | | | 38% | | | | 8% | | | | 6% | | | | 8% | | | | 10% | |
1. Represents the last business day of the Fund’s reporting period.
2. Per share amounts calculated based on the average shares outstanding during the period.
3. Assumes an initial investment on the business day before the first day of the fiscal period, with all dividends and distributions reinvested in additional shares on the reinvestment date, and redemption at the net asset value calculated on the last business day of the fiscal period. Sales charges are not reflected in the total returns. Total returns are not annualized for periods less than one full year. Returns do not reflect the deduction of taxes that a shareholder would pay on fund distributions or the redemption of fund shares.
4. Annualized for periods less than one full year.
5. Less than 0.005%.
6. Total expenses including indirect expenses from affiliated fund fees and expenses were as follows:
| | | | | | |
| | | | | | |
| | | | | | |
Year Ended January 31, 2019 | | | 0.92 | % |
Year Ended January 31, 2018 | | | 0.93 | % |
Year Ended January 31, 2017 | | | 0.93 | % |
Year Ended January 29, 2016 | | | 0.91 | % |
Year Ended January 30, 2015 | | | 0.92 | % |
See accompanying Notes to Financial Statements.
20 OPPENHEIMER PORTFOLIO SERIES GROWTH INVESTOR FUND
NOTES TO FINANCIAL STATEMENTSJanuary 31, 2019
1. Organization
Oppenheimer Portfolio Series (the “Trust”) is registered under the Investment Company Act of 1940 (“1940 Act”), as amended, as a diversifiedopen-end management investment company. Equity Investor Fund, (the “Fund”), (effective February 1, 2019, the Fund will be named Growth Investor Fund), is a series of the Trust whose investment objective is to seek total return. The Fund normally invests in a diversified portfolio of Oppenheimer mutual funds (individually, an “Underlying Fund” and collectively, the “Underlying Funds”). The Fund’s investment adviser is OFI Global Asset Management, Inc. (“OFI Global” or the “Manager”), a wholly-owned subsidiary of OppenheimerFunds, Inc. (“OFI” or the“Sub-Adviser”). The Manager has entered into asub-advisory agreement with OFI.
The Fund offers Class A, Class C, Class R and Class Y shares, and previously offered Class B shares for new purchase through June 29, 2012. Subsequent to that date, no new purchases of Class B shares were permitted. Reinvestment of dividend and/or capital gain distributions and exchanges of Class B shares into and from other Oppenheimer funds were permitted through May 31, 2018. Effective June 1, 2018 (the “Conversion Date”), all Class B shares converted to Class A shares. Class A shares are sold at their offering price, which is normally net asset value plus afront-end sales charge. Class C and Class R shares are sold, and Class B shares were sold, without afront-end sales charge but may be subject to a contingent deferred sales charge (“CDSC”). Class R shares are sold only through retirement plans. Retirement plans that offer Class R shares may impose charges on those accounts. Class Y shares are sold to certain institutional investors or intermediaries without either afront-end sales charge or a CDSC, however, the intermediaries may impose charges on their accountholders who beneficially own Class Y shares. All classes of shares have identical rights and voting privileges with respect to the Fund in general and exclusive voting rights on matters that affect that class alone. Earnings, net assets and net asset value per share may differ due to each class having its own expenses, such as transfer and shareholder servicing agent fees and shareholder communications, directly attributable to that class. Class A, C and R shares have, and Class B shares had, separate distribution and/or service plans under which they pay, and Class B shares paid, fees. Class Y shares do not pay such fees. Previously issued Class B shares automatically converted to Class A shares 72 months after the date of purchase.
The following is a summary of significant accounting policies followed in the Fund’s preparation of financial statements in accordance with accounting principles generally accepted in the United States (“U.S. GAAP”).
2. Significant Accounting Policies
Security Valuation.All investments in securities are recorded at their estimated fair value, as described in Note 3.
Allocation of Income, Expenses, Gains and Losses.Income, expenses (other than those attributable to a specific class), gains and losses are allocated on a daily basis to each class of shares based upon the relative proportion of net assets represented by such class. Operating
21 OPPENHEIMER PORTFOLIO SERIES GROWTH INVESTOR FUND
NOTES TO FINANCIAL STATEMENTSContinued
2. Significant Accounting Policies (Continued)
expenses directly attributable to a specific class are charged against the operations of that class.
Dividends and Distributions to Shareholders. Dividends and distributions to shareholders, which are determined in accordance with income tax regulations and may differ from U.S. GAAP, are recorded on theex-dividend date. Income and capital gain distributions, if any, are declared and paid annually or at other times as determined necessary by the Manager.
Investment Income.Dividend distributions received from the Underlying Funds are recorded on theex-dividend date. Upon receipt of notification from an Underlying Fund, and subsequent to theex-dividend date, some of the dividend income originally recorded by the Fund may be reclassified as a tax return of capital by reducing the cost basis of the Underlying Fund and/or increasing the realized gain on sales of investments in the Underlying Fund.
Custodian Fees. “Custodian fees and expenses” in the Statement of Operations may include interest expense incurred by the Fund on any cash overdrafts of its custodian account during the period. Such cash overdrafts may result from the effects of failed trades in portfolio securities and from cash outflows resulting from unanticipated shareholder redemption activity. The Fund pays interest to its custodian on such cash overdraft at a rate equal to the Prime Rate plus 0.35%. The “Reduction to custodian expenses” line item, if applicable, represents earnings on cash balances maintained by the Fund during the period. Such interest expense and other custodian fees may be paid with these earnings.
Security Transactions. Security transactions are recorded on the trade date. Realized gains and losses on securities sold are determined on the basis of identified cost.
Indemnifications.The Fund’s organizational documents provide current and former Trustees and officers with a limited indemnification against liabilities arising in connection with the performance of their duties to the Fund. In the normal course of business, the Fund may also enter into contracts that provide general indemnifications. The Fund’s maximum exposure under these arrangements is unknown as this would be dependent on future claims that may be made against the Fund. The risk of material loss from such claims is considered remote.
Federal Taxes.The Fund intends to comply with provisions of the Internal Revenue Code applicable to regulated investment companies and to distribute substantially all of its investment company taxable income, including any net realized gain on investments not offset by capital loss carryforwards, if any, to shareholders. Therefore, no federal income or excise tax provision is required. The Fund files income tax returns in U.S. federal and applicable state jurisdictions. The statute of limitations on the Fund’s tax return filings generally remains open for the three preceding fiscal reporting period ends. The Fund has analyzed its tax positions for the fiscal year ended January 31, 2019, including open tax years, and does not believe there
22 OPPENHEIMER PORTFOLIO SERIES GROWTH INVESTOR FUND
2. Significant Accounting Policies (Continued)
are any uncertain tax positions requiring recognition in the Fund’s financial statements.
The tax components of capital shown in the following table represent distribution requirements the Fund must satisfy under the income tax regulations, losses the Fund may be able to offset against income and gains realized in future years and unrealized appreciation or depreciation of securities and other investments for federal income tax purposes.
| | | | | | | | | | | | |
Undistributed Net Investment Income | | Undistributed
Long-Term
Gain | | | Accumulated
Loss
Carryforward1,2 | | | Net Unrealized
Appreciation
Based on cost of
Securities and
Other Investments
for Federal Income
Tax Purposes | |
| |
| $— | | | $72,488,287 | | | | $— | | | | $182,493,527 | |
1. During the reporting period, the Fund did not utilize any capital loss carryforward.
2.During the previous reporting period, the Fund did not utilize any capital loss carryforward.
Net investment income (loss) and net realized gain (loss) may differ for financial statement and tax purposes. The character of dividends and distributions made during the fiscal year from net investment income or net realized gains are determined in accordance with federal income tax requirements, which may differ from the character of net investment income or net realized gains presented in those financial statements in accordance with U.S. GAAP. Also, due to timing of dividends and distributions, the fiscal year in which amounts are distributed may differ from the fiscal year in which the income or net realized gain was recorded by the Fund.
Accordingly, the following amounts have been reclassified for the reporting period. Net assets of the Fund were unaffected by the reclassifications.
| | | | |
Increase toPaid-in Capital | | Reduction to Accumulated Net Loss3 | |
| |
| $6,299,245 | | | $6,299,245 | |
3. $6,269,690, all of which was long-term capital gain, was distributed in connection with Fund share redemptions.
The tax character of distributions paid during the reporting periods:
| | | | | | | | |
| | | Year Ended
January 31, 2019 | | | Year Ended
January 31, 2018 | |
| |
| Distributions paid from: | | | | | | | | |
| Ordinary income | | $ | 7,210,396 | | | $ | 11,562,317 | |
Long-term capital gain | | | 45,350,356 | | | | 8,696,373 | |
| | | | |
Total | | $ | 52,560,752 | | | $ | 20,258,690 | |
| | | | |
The aggregate cost of securities and other investments and the composition of unrealized appreciation and depreciation of securities and other investments for federal income tax purposes at period end are noted in the following table. The primary difference between
23 OPPENHEIMER PORTFOLIO SERIES GROWTH INVESTOR FUND
NOTES TO FINANCIAL STATEMENTSContinued
2. Significant Accounting Policies (Continued)
book and tax appreciation or depreciation of securities and other investments, if applicable, is attributable to the tax deferral of losses or tax realization of financial statement unrealized gain or loss.
| | | | |
| Federal tax cost of securities | | $ | 637,334,130 | |
| | | | |
| Gross unrealized appreciation | | $ | 189,142,934 | |
| Gross unrealized depreciation | | | (6,649,407) | |
| | | | |
| Net unrealized appreciation | | $ | 182,493,527 | |
| | | | |
Use of Estimates. The preparation of financial statements in conformity with U.S. GAAP requires management to make estimates and assumptions that affect the reported amounts of assets and liabilities and disclosure of contingent assets and liabilities at the date of the financial statements and the reported amounts of increases and decreases in net assets from operations during the reporting period. Actual results could differ from those estimates.
New Accounting Pronouncements. In March 2017, Financial Accounting Standards Board (“FASB”) issued Accounting Standards Update (“ASU”), ASU2017-08. This provides guidance related to the amortization period for certain purchased callable debt securities held at a premium. The ASU is effective for annual periods beginning after December 15, 2018, and interim periods within those annual periods. The Manager has evaluated the impacts of these changes on the financial statements and there are no material impacts.
During August 2018, the Securities and Exchange Commission (the “SEC”) issued Final Rule ReleaseNo. 33-10532 (the “Rule”), Disclosure Update and Simplification. The rule amends certain financial statement disclosure requirements to conform to U.S. GAAP. The amendments to Rule6-04.17 of RegulationS-X (balance sheet) remove the requirement to separately state the book basis components of net assets: undistributed (over-distribution of) net investment income (“UNII”), accumulated undistributed net realized gains (losses), and net unrealized appreciation (depreciation) at the balance sheet date. Instead, consistent with U.S. GAAP, funds will be required to disclose total distributable earnings. The amendments to Rule6-09 of RegulationS-X (statement of changes in net assets) remove the requirement to separately state the sources of distributions paid. Instead, consistent with U.S. GAAP, funds will be required to disclose the total amount of distributions paid, except that any tax return of capital must be separately disclosed. The amendments also remove the requirement to parenthetically state the book basis amount of UNII on the statement of changes in net assets. The requirements of the Rule were effective November 5, 2018, and the Fund’s Statement of Assets and Liabilities and Statement of Changes in Net Assets for the current reporting period have been modified accordingly. In addition, certain amounts within the Fund’s Statement of Changes in Net Assets for the prior fiscal period have been modified to conform to the Rule.
3. Securities Valuation
The Fund calculates the net asset value of its shares based upon the net asset value of the applicable investment companies. For each investment company, the net asset value per
24 OPPENHEIMER PORTFOLIO SERIES GROWTH INVESTOR FUND
3. Securities Valuation (Continued)
share for a class of shares is determined as of 4:00 P.M. Eastern Time, on each day the New York Stock Exchange (the “Exchange” or “NYSE”) is open for trading, except in the case of a scheduled early closing of the Exchange, in which case the Fund will calculate net asset value of the shares as of the scheduled early closing time of the Exchange. This is calculated by dividing the value of the investment company’s net assets attributable to that class by the number of outstanding shares of that class on that day.
The Fund’s Board has adopted procedures for the valuation of the Fund’s securities and has delegated theday-to-day responsibility for valuation determinations under those procedures to the Manager. The Manager has established a Valuation Committee which is responsible for determining a fair valuation for any security for which market quotations are not readily available. The Valuation Committee’s fair valuation determinations are subject to review, approval and ratification by the Fund’s Board at least quarterly or more frequently, if necessary.
Valuations Methods and Inputs
To determine their net asset values, the Underlying Funds’ assets are valued primarily on the basis of current market quotations as generally supplied by third party portfolio pricing services or by dealers. Such market quotations are typically based on unadjusted quoted prices in active markets for identical securities or other observable market inputs.
Securities for which market quotations are not readily available, or when a significant event has occurred that would materially affect the value of the security, are fair valued either (i) by a standardized fair valuation methodology applicable to the security type or the significant event as previously approved by the Valuation Committee and the Fund’s Board or (ii) as determined in good faith by the Manager’s Valuation Committee. The Valuation Committee considers all relevant facts that are reasonably available, through either public information or information available to the Manager, when determining the fair value of a security. The methodologies used for valuing securities are not necessarily an indication of the risks associated with investing in those Underlying Funds.
Classifications
Each investment asset or liability of the Fund is assigned a level at measurement date based on the significance and source of the inputs to its valuation. Various data inputs may be used in determining the value of each of the Fund’s investments as of the reporting period end. These data inputs are categorized in the following hierarchy under applicable financial accounting standards:
1) Level1-unadjusted quoted prices in active markets for identical assets or liabilities (including securities actively traded on a securities exchange)
2) Level2-inputs other than unadjusted quoted prices that are observable for the asset or liability (such as unadjusted quoted prices for similar assets and market corroborated inputs such as interest rates, prepayment speeds, credit risks, etc.)
3) Level3-significant unobservable inputs (including the Manager’s own judgments about assumptions that market participants would use in pricing the asset or liability).
25 OPPENHEIMER PORTFOLIO SERIES GROWTH INVESTOR FUND
NOTES TO FINANCIAL STATEMENTSContinued
3. Securities Valuation (Continued)
The inputs used for valuing securities are not necessarily an indication of the risks associated with investing in those securities.
The Fund classifies each of its investments in investment companies which are publicly offered as Level 1. Investment companies that are not publicly offered, if any, are measured using net asset value and are classified as Level 2 in the fair value hierarchy.
The table below categorizes amounts that are included in the Fund’s Statement of Assets and Liabilities at period end based on valuation input level:
| | | | | | | | | | | | | | | | |
| | | Level 1—
Unadjusted
Quoted Prices | | | Level 2— Other Significant
Observable Inputs | | | Level 3—
Significant
Unobservable
Inputs | | | Value | |
| |
Assets Table | | | | | | | | | | | | | | | | |
Investments, at Value: | | | | | | | | | | | | | | | | |
| Investment Companies | | $ | 819,827,657 | | | $ | — | | | $ | — | | | $ | 819,827,657 | |
| | | | |
| Total Assets | | $ | 819,827,657 | | | $ | — | | | $ | — | | | $ | 819,827,657 | |
| | | | |
Forward currency exchange contracts and futures contracts, if any, are reported at their unrealized appreciation/depreciation at measurement date, which represents the change in the contract’s value from trade date. All additional assets and liabilities included in the above table are reported at their market value at measurement date.
For the reporting period, there were no transfers between levels.
4. Investments and Risks
Risks of Investing in the Underlying Funds.The Fund invests in other mutual funds advised by the Manager. The Underlying Funds are registeredopen-end management investment companies under the 1940 Act, as amended. The Manager is the investment adviser of, and theSub-Adviser provides investment and related advisory services to, the Underlying Funds. The Fund’s Investments in Underlying Funds are included in the Statement of Investments. Shares of Underlying Funds are valued at their net asset value per share. As a shareholder, the Fund is subject to its proportional share of the Underlying Funds’ expenses, including their management fee.
Each of the Underlying Funds in which the Fund invests has its own investment risks, and those risks can affect the value of the Fund’s investments and therefore the value of the Fund’s shares. To the extent that the Fund invests more of its assets in one Underlying Fund than in another, the Fund will have greater exposure to the risks of that Underlying Fund.
5. Market Risk Factors
The Fund’s investments in securities and/or financial derivatives may expose the Fund to various market risk factors:
Commodity Risk. Commodity risk relates to the change in value of commodities or commodity indexes as they relate to increases or decreases in the commodities market. Commodities are physical assets that have tangible properties. Examples of these types of
26 OPPENHEIMER PORTFOLIO SERIES GROWTH INVESTOR FUND
5. Market Risk Factors (Continued)
assets are crude oil, heating oil, metals, livestock, and agricultural products.
Credit Risk.Credit risk relates to the ability of the issuer of debt to meet interest and principal payments, or both, as they come due. In general, lower-grade, higher-yield debt securities are subject to credit risk to a greater extent than lower-yield, higher-quality securities.
Equity Risk. Equity risk relates to the change in value of equity securities as they relate to increases or decreases in the general market.
Foreign Exchange Rate Risk. Foreign exchange rate risk relates to the change in the U.S. dollar value of a security held that is denominated in a foreign currency. The U.S. dollar value of a foreign currency denominated security will decrease as the dollar appreciates against the currency, while the U.S. dollar value will increase as the dollar depreciates against the currency.
Interest Rate Risk.Interest rate risk refers to the fluctuations in value of fixed-income securities resulting from the inverse relationship between price and yield. For example, an increase in general interest rates will tend to reduce the market value of already issued fixed-income investments, and a decline in general interest rates will tend to increase their value. In addition, debt securities with longer maturities, which tend to have higher yields, are subject to potentially greater fluctuations in value from changes in interest rates than obligations with shorter maturities.
Volatility Risk.Volatility risk refers to the magnitude of the movement, but not the direction of the movement, in a financial instrument’s price over a defined time period. Large increases or decreases in a financial instrument’s price over a relative time period typically indicate greater volatility risk, while small increases or decreases in its price typically indicate lower volatility risk.
6. Shares of Beneficial Interest
The Fund has authorized an unlimited number of $0.001 par value shares of beneficial interest of each class. Transactions in shares of beneficial interest were as follows:
| | | | | | | | | | | | | | | | |
| | | Year Ended January 31, 2019 | | | Year Ended January 31, 2018 | |
| | | Shares | | | Amount | | | Shares | | | Amount | |
| |
Class A | | | | | | | | | | | | | | | | |
| Sold1 | | | 3,382,506 | | | $ | 60,652,621 | | | | 4,255,418 | | | $ | 73,837,273 | |
| Dividends and/or distributions reinvested | | | 2,546,191 | | | | 37,352,617 | | | | 809,186 | | | | 14,824,293 | |
| Redeemed | | | (5,011,396 | ) | | | (89,889,957 | ) | | | (4,878,024 | ) | | | (84,548,292) | |
| | | | |
| Net increase | | | 917,301 | | | $ | 8,115,281 | | | | 186,580 | | | $ | 4,113,274 | |
| | | | |
| | | | | | | | | | | | | | | | | |
| |
Class B | | | | | | | | | | | | | | | | |
| Sold | | | 1,300 | | | $ | 23,534 | | | | 5,494 | | | $ | 88,315 | |
| Dividends and/or distributions reinvested | | | — | | | | — | | | | 2,571 | | | | 46,608 | |
| Redeemed1 | | | (221,037 | ) | | | (4,053,936 | ) | | | (708,480 | ) | | | (11,961,100) | |
| | | | |
| Net decrease | | | (219,737 | ) | | $ | (4,030,402 | ) | | | (700,415 | ) | | $ | (11,826,177) | |
| | | | |
27 OPPENHEIMER PORTFOLIO SERIES GROWTH INVESTOR FUND
NOTES TO FINANCIAL STATEMENTSContinued
6. Shares of Beneficial Interest (Continued)
| | | | | | | | | | | | | | | | |
| | | Year Ended January 31, 2019 | | | Year Ended January 31, 2018 | |
| | | Shares | | | Amount | | | Shares | | | Amount | |
| |
Class C | | | | | | | | | | | | | | | | |
| Sold | | | 1,208,629 | | | $ | 20,887,085 | | | | 1,466,443 | | | $ | 24,979,786 | |
| Dividends and/or distributions reinvested | | | 698,214 | | | | 9,991,408 | | | | 192,073 | | | | 3,432,355 | |
| Redeemed | | | (2,374,231 | ) | | | (41,821,761 | ) | | | (2,282,324 | ) | | | (38,587,681) | |
| | | | |
| Net decrease | | | (467,388 | ) | | $ | (10,943,268 | ) | | | (623,808 | ) | | $ | (10,175,540) | |
| | | | |
| | | | | | | | | | | | | | | | | |
| |
Class R | | | | | | | | | | | | | | | | |
| Sold | | | 934,269 | | | $ | 16,635,893 | | | | 925,969 | | | $ | 16,305,280 | |
| Dividends and/or distributions reinvested | | | 231,695 | | | | 3,398,976 | | | | 63,134 | | | | 1,155,983 | |
| Redeemed | | | (734,930 | ) | | | (13,157,515 | ) | | | (826,685 | ) | | | (14,222,424) | |
| | | | |
| Net increase | | | 431,034 | | | $ | 6,877,354 | | | | 162,418 | | | $ | 3,238,839 | |
| | | | |
| | | | | | | | | | | | | | | | | |
| |
Class Y | | | | | | | | | | | | | | | | |
| Sold | | | 320,289 | | | $ | 5,876,474 | | | | 485,650 | | | $ | 8,400,649 | |
| Dividends and/or distributions reinvested | | | 99,331 | | | | 1,464,129 | | | | 34,536 | | | | 635,808 | |
| Redeemed | | | (405,596 | ) | | | (7,374,529 | ) | | | (447,862 | ) | | | (7,757,853) | |
| | | | |
| Net increase (decrease) | | | 14,024 | | | $ | (33,926 | ) | | | 72,324 | | | $ | 1,278,604 | |
| | | | |
1. All outstanding Class B share converted to Class A shares on June 1, 2018.
7. Purchases and Sales of Securities
The aggregate cost of purchases and proceeds from sales of securities, other than short-term obligations, for the reporting period were as follows:
| | | | | | | | |
| | | Purchases | | | Sales | |
| |
| Investment securities | | $ | 339,430,613 | | | $ | 347,761,115 | |
8. Fees and Other Transactions with Affiliates
Management Fees.Under the investment advisory agreement, the Manager does not charge a management fee, but rather collects indirect management fees from the Fund’s investments in the Underlying Funds. The weighted indirect management fees collected from the Fund’s investment in the Underlying Funds, as a percent of average daily net assets of the Fund for the reporting period was 0.66%. This amount is gross of any waivers or reimbursements of management fees implemented at the Underlying Fund level.
Sub-Adviser Fees.The Manager has retained theSub-Adviser to provide theday-to-day portfolio management of the Fund. Under theSub-Advisory Agreement, the Manager pays theSub-Adviser an annual fee in monthly installments, equal to a percentage of the indirect investment management fee collected by the Manager, which shall be calculated after any investment management fee waivers. The fee paid to theSub-Adviser is paid by the Manager, not by the Fund.
28 OPPENHEIMER PORTFOLIO SERIES GROWTH INVESTOR FUND
8. Fees and Other Transactions with Affiliates (Continued)
Transfer Agent Fees.OFI Global (the “Transfer Agent”) serves as the transfer and shareholder servicing agent for the Fund. The Fund pays the Transfer Agent a fee based on annual net assets, which shall be calculated after any applicable fee waivers. Fees incurred and average net assets for each class with respect to these services are detailed in the Statement of Operations and Financial Highlights, respectively.
Sub-Transfer Agent Fees.The Transfer Agent has retained Shareholder Services, Inc., a wholly-owned subsidiary of OFI (the“Sub-Transfer Agent”), to provide theday-to-day transfer agent and shareholder servicing of the Fund. Under theSub-Transfer Agency Agreement, the Transfer Agent pays theSub-Transfer Agent an annual fee in monthly installments, equal to a percentage of the transfer agent fee collected by the Transfer Agent from the Fund, which shall be calculated after any applicable fee waivers. The fee paid to theSub-Transfer Agent is paid by the Transfer Agent, not by the Fund.
Trustees’ Compensation.The Fund has adopted an unfunded retirement plan (the “Plan”) for the Fund’s Independent Trustees. Benefits are based on years of service and fees paid to each Trustee during their period of service. The Plan was frozen with respect to adding new participants effective December 31, 2006 (the “Freeze Date”) and existing Plan Participants as of the Freeze Date will continue to receive accrued benefits under the Plan. Active Independent Trustees as of the Freeze Date have each elected a distribution method with respect to their benefits under the Plan.
During the reporting period, the Fund’s projected benefit obligations, payments to retired Trustees and accumulated liability were as follows:
| | | | |
| Projected Benefit Obligations Increased | | $ | — | |
| Payments Made to Retired Trustees | | | 1,544 | |
| Accumulated Liability as of January 31, 2019 | | | 11,430 | |
The Fund’s Board of Trustees (“Board”) has adopted a compensation deferral plan for Independent Trustees that enables Trustees to elect to defer receipt of all or a portion of the annual compensation they are entitled to receive from the Fund. For purposes of determining the amount owed to the Trustee under the plan, deferred amounts are treated as though equal dollar amounts had been invested in shares of the Fund or in other Oppenheimer funds selected by the Trustee. The Fund purchases shares of the funds selected for deferral by the Trustee in amounts equal to his or her deemed investment, resulting in a Fund asset equal to the deferred compensation liability. Such assets are included as a component of “Other” within the asset section of the Statement of Assets and Liabilities. Deferral of Trustees’ fees under the plan will not affect the net assets of the Fund and will not materially affect the Fund’s assets, liabilities or net investment income per share. Amounts will be deferred until distributed in accordance with the compensation deferral plan.
Distribution and Service Plan(12b-1) Fees.Under its General Distributor’s Agreement
29 OPPENHEIMER PORTFOLIO SERIES GROWTH INVESTOR FUND
NOTES TO FINANCIAL STATEMENTSContinued
8. Fees and Other Transactions with Affiliates (Continued)
with the Fund, OppenheimerFunds Distributor, Inc. (the “Distributor”) acts as the Fund’s principal underwriter in the continuous public offering of the Fund’s classes of shares.
Service Plan for Class A Shares. The Fund has adopted a Service Plan (the “Plan”) for Class A shares pursuant to Rule12b-1 under the 1940 Act. Under the Plan, the Fund reimburses the Distributor for a portion of its costs incurred for services provided to accounts that hold Class A shares. Reimbursement is made periodically at an annual rate of up to 0.25% of the daily net assets of Class A shares of the Fund. The Distributor currently uses all of those fees to pay dealers, brokers, banks and other financial institutions periodically for providing personal service and maintenance of accounts of their customers that hold Class A shares. Any unreimbursed expenses the Distributor incurs with respect to Class A shares in any fiscal year cannot be recovered in subsequent periods. Fees incurred by the Fund under the Plan are detailed in the Statement of Operations.
Distribution and Service Plans for Class B, Class C and Class R Shares.The Fund has adopted Distribution and Service Plans (the “Plans”) for Class C and Class R shares, and had previously adopted a similar plan for Class B shares, pursuant to Rule12b-1 under the 1940 Act to compensate the Distributor for distributing those share classes, maintaining accounts and providing shareholder services. Under the Plans, the Fund pays the Distributor an annual asset-based sales charge of 0.75% on Class C shares’ daily net assets and 0.25% on Class R shares’ daily net assets. The Fund paid the Distributor an annual asset-based sales charge of 0.75% on Class B shares prior to their Conversion Date. The Fund also pays a service fee under the Plans at an annual rate of 0.25% of daily net assets and previously paid this fee for Class B prior to their Conversion Date. The Plans continue in effect from year to year only if the Fund’s Board of Trustees votes annually to approve their continuance at an in person meeting called for that purpose. Fees incurred by the Fund under the Plans are detailed in the Statement of Operations.
Sales Charges.Front-end sales charges and CDSC do not represent expenses of the Fund. They are deducted from the proceeds of sales of Fund shares prior to investment or from redemption proceeds prior to remittance, as applicable. The sales charges retained by the Distributor from the sale of shares and the CDSC retained by the Distributor on the redemption of shares is shown in the following table for the period indicated.
| | | | | | | | | | | | | | | | | | | | |
| Year Ended | | Class A
Front-End
Sales Charges
Retained by
Distributor | | | Class A
Contingent
Deferred
Sales Charges
Retained by
Distributor | | | Class B
Contingent
Deferred
Sales Charges
Retained by
Distributor1 | | | Class C
Contingent
Deferred
Sales Charges
Retained by
Distributor | | | Class R
Contingent
Deferred
Sales Charges
Retained by
Distributor | |
| |
| January 31, 2019 | | | $406,122 | | | | $— | | | | $565 | | | | $19,331 | | | | $— | |
1.Effective June 1, 2018, all Class B shares converted to Class A shares.
30 OPPENHEIMER PORTFOLIO SERIES GROWTH INVESTOR FUND
9. Pending Acquisition
On October 18, 2018, Massachusetts Mutual Life Insurance Company, an indirect corporate parent of theSub-Adviser and the Manager, announced that it has entered into an agreement whereby Invesco Ltd. (“Invesco”), a global investment management company, will acquire theSub-Adviser (the “Transaction”). In connection with the Transaction, on January 11, 2019, the Fund’s Board unanimously approved an Agreement and Plan of Reorganization (the “Agreement”), which provides for the transfer of the assets and liabilities of the Fund to a corresponding, newly formed fund (the “Acquiring Fund”) in the Invesco family of funds (the “Reorganization”) in exchange for shares of the corresponding Acquiring Fund of equal value to the value of the shares of the Fund as of the close of business on the closing date. Although the Acquiring Fund will be managed by Invesco Advisers, Inc., the Acquiring Fund will, as of the closing date, have the same investment objective and substantially similar principal investment strategies and risks as the Fund. After the Reorganization, Invesco Advisers, Inc. will be the investment adviser to the Acquiring Fund, and the Fund will be liquidated and dissolved under applicable law and terminate its registration under the Investment Company Act of 1940, as amended. The Reorganization is expected to be atax-free reorganization for U.S. federal income tax purposes.
The Reorganization is subject to the approval of shareholders of the Fund. Shareholders of record of the Fund on January 14, 2019 will be entitled to vote on the Reorganization and will receive a combined prospectus and proxy statement describing the Reorganization, the shareholder meeting, and a discussion of the factors the Fund’s Board considered in approving the Agreement. The combined prospectus and proxy statement is expected to be distributed to shareholders of record on or about February 28, 2019. The anticipated date of the shareholder meeting is on or about April 12, 2019.
If shareholders approve the Agreement and certain other closing conditions are satisfied or waived, the Reorganization is expected to close during the second quarter of 2019, or as soon as practicable thereafter. This is subject to change.
31 OPPENHEIMER PORTFOLIO SERIES GROWTH INVESTOR FUND
REPORT OF INDEPENDENT REGISTERED PUBLIC ACCOUNTING FIRM
To the Shareholders of Growth Investor Fund and Board of Trustees of
Oppenheimer Portfolio Series:
Opinion on the Financial Statements
We have audited the accompanying statement of assets and liabilities of Growth Investor Fund, formerly Equity Investor Fund, (the “Fund”), a series of Oppenheimer Portfolio Series, including the statement of investments, as of January 31, 2019, the related statement of operations for the year then ended, the statements of changes in net assets for each of the years in thetwo-year period then ended, and the related notes (collectively, the “financial statements”) and the financial highlights for each of the years in the five-year period then ended. In our opinion, the financial statements and financial highlights present fairly, in all material respects, the financial position of the Fund as of January 31, 2019, the results of its operations for the year then ended, the changes in its net assets for each of the years in thetwo-year period then ended, and the financial highlights for each of the years in the five-year period then ended, in conformity with U.S. generally accepted accounting principles.
Basis for Opinion
These financial statements and financial highlights are the responsibility of the Fund’s management. Our responsibility is to express an opinion on these financial statements and financial highlights based on our audits. We are a public accounting firm registered with the Public Company Accounting Oversight Board (United States) (“PCAOB”) and are required to be independent with respect to the Fund in accordance with the U.S. federal securities laws and the applicable rules and regulations of the Securities and Exchange Commission and the PCAOB.
We conducted our audits in accordance with the standards of the PCAOB. Those standards require that we plan and perform the audit to obtain reasonable assurance about whether the financial statements and financial highlights are free of material misstatement, whether due to error or fraud. Our audits included performing procedures to assess the risks of material misstatement of the financial statements and financial highlights, whether due to error or fraud, and performing procedures that respond to those risks. Such procedures included examining, on a test basis, evidence regarding the amounts and disclosures in the financial statements and financial highlights. Such procedures also included confirmation of securities owned as of January 31, 2019, by correspondence with the transfer agent, or by other appropriate auditing procedures. Our audits also included evaluating the accounting principles used and significant estimates made by management, as well as evaluating the overall presentation of the financial statements and financial highlights. We believe that our audits provide a reasonable basis for our opinion.
KPMGLLP
We have not been able to determine the specific year that we began serving as the auditor of one or more Oppenheimer Funds investment companies, however we are aware that we have served as the auditor of one or more Oppenheimer Funds investment companies since at least 1969.
Denver, Colorado
March 25, 2019
32 OPPENHEIMER PORTFOLIO SERIES GROWTH INVESTOR FUND
FEDERAL INCOME TAX INFORMATIONUnaudited
In early 2019, if applicable, shareholders of record received information regarding all dividends and distributions paid to them by the Fund during calendar year 2018.
Capital gain distributions of $0.95125per share were paid to Class A, Class C, Class R and Class Y shareholders, respectively, on December 20, 2018. Whether received in stock or in cash, the capital gain distribution should be treated by shareholders as a gain from the sale of the capital assets held for more than one year (long-term capital gains).
Dividends, if any, paid by the Fund during the reporting period which are not designated as capital gain distributions should be multiplied by the maximum amount allowable but not less than 67.11% to arrive at the amount eligible for the corporate dividend-received deduction.
A portion, if any, of the dividends paid by the Fund during the reporting period which are not designated as capital gain distributions are eligible for lower individual income tax rates to the extent that the Fund has received qualified dividend income as stipulated by recent tax legislation. The maximum amount allowable but not less than $11,735,412 of the Fund’s fiscal year taxable income may be eligible for the lower individual income tax rates. In early 2019, shareholders of record received information regarding the percentage of distributions that are eligible for lower individual income tax rates.
Recent tax legislation allows a regulated investment company to designate distributions not designated as capital gain distributions, as either interest related dividends or short-term capital gain dividends, both of which are exempt from the U.S. withholding tax applicable to non U.S. taxpayers. For the reporting period, the maximum amount allowable but not less than $281,022 of the ordinary distributions to be paid by the Fund qualifies as an interest related dividend.
The Fund has elected the application of Section 853 of the Internal Revenue Code to permit shareholders to take a federal income tax credit or deduction, at their option, on a per share basis. The maximum amount allowable but not less than $969,701 of foreign income taxes were paid by the Fund during the reporting period. A separate notice will be mailed to each shareholder, which will reflect the proportionate share of such foreign taxes which must be treated by shareholders as gross income for federal income tax purposes.
Gross income of the maximum amount allowable but not less than $3,718,523 was derived from sources within foreign countries or possessions of the United States.
The foregoing information is presented to assist shareholders in reporting distributions received from the Fund to the Internal Revenue Service. Because of the complexity of the federal regulations which may affect your individual tax return and the many variations in state and local tax regulations, we recommend that you consult your tax advisor for specific guidance.
33 OPPENHEIMER PORTFOLIO SERIES GROWTH INVESTOR FUND
BOARD APPROVAL OF THE FUND’S INVESTMENT ADVISORY
ANDSUB-ADVISORY AGREEMENTSUnaudited
The Fund has entered into an investment advisory agreement with OFI Global Asset Management, Inc. (“OFI Global” or the “Adviser”), a wholly-owned subsidiary of OppenheimerFunds, Inc. (“OFI” or the“Sub-Adviser”) (“OFI Global” and “OFI” together the “Managers”) and OFI Global has entered into asub-advisory agreement with OFI whereby OFI provides investmentsub-advisory services to the Fund (collectively, the “Agreements”). Each year, the Board of Trustees (the “Board”), including a majority of the independent Trustees, is required to determine whether to approve the terms of the Agreements and the renewal thereof. The Investment Company Act of 1940, as amended, requires that the Board request and evaluate, and that the Managers provide, such information as may be reasonably necessary to evaluate the terms of the Agreements. The Board employs an independent consultant to prepare a report that provides information, including comparative information that the Board requests for that purpose. In addition toin-person meetings focused on this evaluation, the Board receives information throughout the year regarding Fund services, fees, expenses and performance.
The Managers and the independent consultant provided information to the Board on the following factors: (i) the nature, quality and extent of the Managers’ services, (ii) the comparative investment performance of the Fund and the Managers, (iii) the fees and expenses of the Fund, including comparative fee and expense information, (iv) the profitability of the Managers and their affiliates, including an analysis of the cost of providing services, (v) whether economies of scale are realized as the Fund grows and whether fee levels reflect these economies of scale for Fund investors and (vi) other benefits to the Managers from their relationship with the Fund. The Board was aware that there are alternatives to retaining the Managers.
Outlined below is a summary of the principal information considered by the Board as well as the Board’s conclusions.
Nature, Quality and Extent of Services. The Board considered information about the nature, quality and extent of the services provided to the Fund and information regarding the Managers’ key personnel who provide such services. The Managers’ duties include providing the Fund with the services of theSub-Adviser’s portfolio manager and investment team, who provide research, analysis and other advisory services in regard to the Fund’s investments; and securities trading services. OFI Global is responsible for oversight of third-party service providers; monitoring compliance with applicable Fund policies and procedures and adherence to the Fund’s investment restrictions; risk management; and oversight of theSub-Adviser. OFI Global is also responsible for providing certain administrative services to the Fund. Those services include providing and supervising all administrative and clerical personnel who are necessary in order to provide effective corporate administration for the Fund; compiling and maintaining records with respect to the Fund’s operations; preparing and filing reports required by the U.S. Securities and Exchange Commission; preparing periodic reports regarding the operations of the Fund for its shareholders; preparing proxy materials for shareholder meetings; and preparing the registration statements required by federal and state securities laws for the sale of the Fund’s shares. OFI Global also provides the Fund with office space, facilities and equipment.
34 OPPENHEIMER PORTFOLIO SERIES GROWTH INVESTOR FUND
The Board also considered the quality of the services provided and the quality of the Managers’ resources that are available to the Fund. The Board took account of the fact that theSub-Adviser has over fifty years of experience as an investment adviser and that its assets under management rank it among the top mutual fund managers in the United States. The Board evaluated the Managers’ advisory, administrative, accounting, legal, compliance and risk management services, among other services, and information the Board has received regarding the experience and professional qualifications of the Managers’ key personnel and the size and functions of their staff. In its evaluation of the quality of the portfolio management services provided, the Board considered the experience of Jeffrey Bennett, the portfolio manager for the Fund, and theSub-Adviser’s investment team and analysts. The Board members also considered the totality of their experiences with the Managers as directors or trustees of the Fund and other funds advised by the Managers. The Board considered information regarding the quality of services provided by affiliates of the Managers, which the Board members have become knowledgeable about through their experiences with the Managers and in connection with the review or renewal of the Fund’s service agreements or service providers. The Board concluded, in light of the Managers’ experience, reputation, personnel, operations and resources that the Fund benefits from the services provided under the Agreements.
Investment Performance of the Managers and the Fund. Throughout the year, the Managers provided information on the investment performance of the Fund, the Adviser and theSub-Adviser, including comparative performance information. The Board also reviewed information, prepared by the Managers and by the independent consultant, comparing the Fund’s historical performance to relevant benchmarks or market indices and to the performance of other retail funds in the world large stock category. The Board noted that the Fund’sone-year, three-year, five-year andten-year performance was better than its category median.
Fees and Expenses of the Fund. The Board reviewed the fees paid to the Adviser and the other expenses borne by the Fund. The Board noted that the Adviser, not the Fund, pays theSub-Adviser’s fee under thesub-advisory agreement. The Board also considered the comparability of the fees charged and the services provided to the Fund to the fees and services for other clients or accounts advised by the Adviser. The independent consultant provided comparative data in regard to the fees and expenses of the Fund and other retailfront-end load world large stock funds with comparable asset levels and distribution features. The Board noted that the Fund was charged no actual management fees, exclusive of Underlying Fund management fees, while certain peer group funds did charge direct management fees. The Board also noted that the Fund’s total expenses were lower than its peer group and category median.
Economies of Scale and Profits Realized by the Managers. The Board considered information regarding the Managers’ costs in serving as the Fund’s investment adviser,sub-adviser, including the costs associated with the personnel and systems necessary to manage the Fund, and information regarding the Managers’ profitability from their relationship with the Fund. The Board also considered that the Managers must be able to pay and retain experienced professional personnel at competitive rates to provide quality services
35 OPPENHEIMER PORTFOLIO SERIES GROWTH INVESTOR FUND
BOARD APPROVAL OF THE FUND’S INVESTMENT ADVISORY
ANDSUB-ADVISORY AGREEMENTSUnaudited / Continued
to the Fund. The Board reviewed whether the Managers may realize economies of scale in managing and supporting the Fund and whether those economies of scale benefit the Fund’s shareholders at the current level of Fund assets in relation to its management fee. The Fund currently does not charge a management fee.
Other Benefits to the Managers. In addition to considering the profits realized by the Managers, the Board considered information that was provided regarding the direct and indirect benefits the Managers receive as a result of their relationship with the Fund, including compensation paid to the Managers’ affiliates.
Conclusions. These factors were also considered by the independent Trustees meeting separately from the full Board, assisted by experienced counsel to the Fund and to the independent Trustees. Fund counsel and the independent Trustees’ counsel are independent of the Managers within the meaning and intent of the Securities and Exchange Commission Rules.
Based on its review of the information it received and its evaluations described above, the Board, including a majority of the independent Trustees, decided to continue the Agreements through September 30, 2019. In arriving at its decision, the Board did not identify any factor or factors as being more important than others, but considered all of the above information, and considered the terms and conditions of the Agreements, including the management fees, in light of all the surrounding circumstances.
36 OPPENHEIMER PORTFOLIO SERIES GROWTH INVESTOR FUND
PORTFOLIO PROXY VOTING POLICIES AND GUIDELINES;
UPDATES TO STATEMENT OF INVESTMENTSUnaudited
The Fund has adopted Portfolio Proxy Voting Policies and Guidelines under which the Fund votes proxies relating to securities (“portfolio proxies”) held by the Fund. A description of the Fund’s Portfolio Proxy Voting Policies and Guidelines is available (i) without charge, upon request, by calling the Fund toll-free at 1.800.CALL OPP (225.5677), (ii) on the Fund’s website at www.oppenheimerfunds.com, and (iii) on the SEC’s website at www.sec.gov. In addition, the Fund is required to file FormN-PX, with its complete proxy voting record for the 12 months ended June 30th, no later than August 31st of each year. The Fund’s voting record is available (i) without charge, upon request, by calling the Fund toll-free at 1.800.CALL OPP (225.5677), and (ii) in the FormN-PX filing on the SEC’s website at www.sec.gov.
The Fund files its complete schedule of portfolio holdings with the SEC for the first quarter and the third quarter of each fiscal year on FormN-Q. The Fund’s FormN-Q filings are available on the SEC’s website at www.sec.gov. Beginning in April 2019, the Fund will no longer file FormN-Qs and will instead disclose its portfolio holdings monthly on FormN-PORT, which will also be available on the SEC’s website at www.sec.gov.
Householding—Delivery of Shareholder Documents
This is to inform you about OppenheimerFunds’ “householding” policy. If more than one member of your household maintains an account in a particular fund, OppenheimerFunds will mail only one copy of the fund’s prospectus (or, if available, the fund’s summary prospectus), annual and semiannual report and privacy policy. The consolidation of these mailings, called householding, benefits your fund through reduced mailing expense, and benefits you by reducing the volume of mail you receive from OppenheimerFunds. Householding does not affect the delivery of your account statements.
Please note that we will continue to household these mailings for as long as you remain an OppenheimerFunds shareholder, unless you request otherwise. If you prefer to receive multiple copies of these materials, please call us at1.800.CALL-OPP(225-5677).You may also notify us in writing or via email. We will begin sending you individual copies of the prospectus (or, if available, the summary prospectus), reports and privacy policy within 30 days of receiving your request to stop householding.
37 OPPENHEIMER PORTFOLIO SERIES GROWTH INVESTOR FUND
TRUSTEES AND OFFICERSUnaudited
| | |
| Name, Position(s) Held with the Fund, Length of Service, Year of Birth | | Principal Occupation(s) During the Past 5 Years; Other Trusteeships/ Directorships Held; Number of Portfolios in the Fund Complex Currently Overseen |
| |
| INDEPENDENT TRUSTEES | | The address of each Trustee in the chart below is 6803 S. Tucson Way, Centennial, Colorado 80112-3924. Each Trustee serves for an indefinite term, or until his or her resignation, retirement, death or removal. Each of the Trustees in the chart below oversees 46 portfolios in the OppenheimerFunds complex. |
| |
Joel W. Motley, Chairman of the Board of Trustees (since 2019) and Trustee (since 2005) Year of Birth: 1952 | | Director of Office of Finance Federal Home Loan Bank (since September 2016); Director of Greenwall Foundation (since October 2013); Member of Board and Investment Committee of The Greenwall Foundation (since April 2013); Member of the Vestry of Trinity Wall Street (since April 2012); Director of Southern Africa Legal Services Foundation (since March 2012); Board Member and Investment Committee Member of Pulitzer Center for Crisis Reporting(non-profit journalism) (since March 2011); Managing Director of Public Capital Advisors, LLC (privately- held financial advisor) (since January 2006); Managing Director of Carmona Motley, Inc. (privately-held financial advisor) (since January 2002); Director of Columbia Equity Financial Corp. (privately-held financial advisor) (2002-2007); Managing Director of Carmona Motley Hoffman Inc. (privately-held financial advisor) (January 1998-December 2001); Member of the Finance and Budget Committee of the Council on Foreign Relations, Member of the Investment Committee and Board of Human Rights Watch (since July 2000) and Member of the Investment Committee and Board of Historic Hudson Valley (since February 2010). Mr. Motley has served on the Boards of certain Oppenheimer funds since October 2002, during which time he has become familiar with the Fund’s (and other Oppenheimer funds’) financial, accounting, regulatory and investment matters and has contributed to the Board’s deliberations. |
| |
Beth Ann Brown, Trustee (since 2016) Year of Birth: 1968 | | Director, Board of Directors of Caron Engineering Inc. (since January 2018); Advisor, Board of Advisors of Caron Engineering Inc. (December 2014-December 2017); Independent Consultant (since September 2012); held the following positions at Columbia Management Investment Advisers LLC: Head of Intermediary Distribution (2008-2012), Managing Director, Strategic Relations (2005-2008), Managing Director, Head of National Accounts (2004-2005); Senior Vice President, National Account Manager (2002-2004), Senior Vice President, Key Account Manager (1999-2002) and Vice President, Key Account Manager (1996-1999) of Liberty Funds Distributor, Inc.; President and Director, of Acton Shapleigh Youth Conservation Corps (non -profit) (2012-2015); and Vice President and Director of Grahamtastic Connection(non-profit) (since May 2013). Ms. Brown has served on the Boards of certain Oppenheimer funds since January 2016, during which time she has become familiar with the Fund’s (and other Oppenheimer funds’) financial, accounting, regulatory and investment matters and has contributed to the Board’s deliberations. |
| |
Edmund P. Giambastiani, Jr.,Trustee (since 2013) Year of Birth: 1948 | | Director of THL Credit, Inc. (since November 2016) (alternative credit investment manager); Advisory Board Member of the Maxwell School of Citizenship and Public Affairs of Syracuse University (April 2012-September 2016); Director of Mercury Defense Systems Inc. (information technology) (August 2011-February 2013); Trustee of the U.S. Naval Academy Foundation Athletic & Scholarship Program (since November 2010); Advisory Board Member of the Massachusetts Institute of Technology Lincoln Laboratory (federally-funded research development) (since May 2010); Director of The Boeing Company (aerospace and defense) (since October 2009); Trustee of MITRE Corporation (federally-funded research development) |
38 OPPENHEIMER PORTFOLIO SERIES GROWTH INVESTOR FUND
| | |
| |
| Edmund P. Giambastiani, Jr.,(Continued) | | (since September 2008); Independent Director of QinetiQ Group Plc (defense technology and security) (February 2008-August 2011); Chairman of Monster Worldwide, Inc. (career services) (March 2015-November 2016), Director of Monster Worldwide, Inc. (career services) (February 2008-June 2011); Lead Director (June 2011-March 2015); Chairman of Alenia North America, Inc. (military and defense products) (January 2008-October 2009); Director of SRA International, Inc. (information technology and services) (January 2008-July 2011); President of Giambastiani Group LLC (national security and energy consulting) (since October 2007); United States Navy, career nuclear submarine officer (June 1970-October 2007); Seventh Vice Chairman of the Joint Chiefs of Staff (2005-October 2007); Supreme Allied Commander of NATO Allied Command Transformation (2003- 2005) and Commander, U.S. Joint Forces Command (2002-2005). Since his retirement from the U.S. Navy in October 2007, Admiral Giambastiani has also served on numerous U.S. Government advisory boards, investigations and task forces for the Secretaries of Defense, State and Interior and the Central Intelligence Agency. He recently completed serving as a federal commissioner on the Military Compensation and Retirement Modernization Commission. Admiral Giambastiani has served on the Boards of certain Oppenheimer funds since February 2013, during which time he has become familiar with the Fund’s (and other Oppenheimer funds’) financial, accounting, regulatory and investment matters and has contributed to the Board’s deliberations. |
| |
Elizabeth Krentzman, Trustee (since 2014) Year of Birth: 1959 | | Trustee of the University of Florida National Board Foundation (since September 2017); Member of the Cartica Funds Board of Directors (private investment funds) (since January 2017); Member of the University of Florida Law Center Association, Inc. Board of Trustees and Audit Committee Member (since April 2016); Member of University of Florida Law Advisory Board, Washington, DC Alumni Group (since 2015); Advisory Board Member of the Securities and Exchange Commission Historical Society (since 2007); held the following positions at Deloitte & Touche LLP: Principal and Chief Regulatory Advisor for Asset Management Services (2007 - 2014) and U.S. Mutual Fund Leader (2011 - 2014); General Counsel of the Investment Company Institute (trade association) (June 2004 - April 2007); held the following positions at Deloitte & Touche LLP: National Director of the Investment Management Regulatory Consulting Practice (1997 - 2004), Principal (2003 - 2004), Director (1998 - 2003) and Senior Manager (1997 - 1998); Assistant Director of the Division of Investment Management - Office of Disclosure and Investment Adviser Regulation of the U.S. Securities and Exchange Commission (1996 - 1997) and various positions with the Division of Investment Management – Office of Regulatory Policy (1991 - 1996) of the U.S. Securities and Exchange Commission; Associate at Ropes & Gray LLP (1987 – 1991). Ms. Krentzman has served on the Boards of certain Oppenheimer funds since August 2014, during which time she has become familiar with the Fund’s (and other Oppenheimer funds’) financial, accounting, regulatory and investment matters and has contributed to the Board’s deliberations. |
| |
Mary F. Miller, Trustee (since 2005) Year of Birth: 1942 | | Trustee of International House(not-for-profit) (since June 2007); Trustee of the American Symphony Orchestra(not-for-profit) (October 1998-November 2011); and Senior Vice President and General Auditor of American Express Company (financial services company) (July 1998-February 2003). Ms. Miller has served on the Boards of certain Oppenheimer funds since August 2004, during which time she has become familiar with the Fund’s (and other Oppenheimer funds’) financial, accounting, regulatory and investment matters and has contributed to the Board’s deliberations. |
39 OPPENHEIMER PORTFOLIO SERIES GROWTH INVESTOR FUND
TRUSTEES AND OFFICERSUnaudited / Continued
| | |
| |
Joanne Pace, Trustee (since 2012) Year of Birth: 1958 | | Advisory Board Director of Massey Quick Simon & Co. (wealth management), LLC (since October 2014); Board Director of Horizon Blue Cross Blue Shield of New Jersey (healthcare) (since November 2012); Advisory Board Director of The Alberleen Group LLC (investment banking) (since March 2012); Governing Council Member (since 2016) and Chair of Education Committee (since 2017) of Independent Directors Council (IDC) (since 2016); Board Member of 100 Women in Finance(non-profit) (since January 2015); Advisory Council Member of Morgan Stanley Children’s Hospital(non-profit) (since May 2012); Director of The Komera Project(non-profit) (April 2012-2016); New York Advisory Board Director of Peace First(non-profit) (March 2010-2013); Senior Advisor of SECOR Asset Management, LP (2010-2011); Managing Director and Chief Operating Officer of Morgan Stanley Investment Management (2006-2010); Partner and Chief Operating Officer of FrontPoint Partners, LLC (hedge fund) (2005-2006); held the following positions at Credit Suisse (investment banking): Managing Director (2003-2005); Global Head of Human Resources and member of Executive Board and Operating Committee (2004-2005), Global Head of Operations and Product Control (2003-2004); held the following positions at Morgan Stanley: Managing Director (1997-2003), Controller and Principal Accounting Officer (1999-2003); Chief Financial Officer (temporary assignment) for the Oversight Committee, Long Term Capital Management (1998-1999). Lead Independent Director and Chair of the Audit and Nominating Committee of The Global Chartist Fund, LLC of Oppenheimer Asset Management (2011-2012); Board Director of Managed Funds Association (2008-2010); Board Director of Morgan Stanley Foundation (2007- 2010) and Investment Committee Chair (2008-2010). Ms. Pace has served on the Boards of certain Oppenheimer funds since November 2012, during which time she has become familiar with the Fund’s (and other Oppenheimer funds’) financial, accounting, regulatory and investment matters and has contributed to the Board’s deliberations. |
| |
Daniel Vandivort, Trustee (since 2014) Year of Birth: 1954 | | Chairman and Lead Independent Director/Trustee (March 2010-September 2014), Chairman of the Audit Committee (March 2009-September 2014) and Director/Trustee (December 2008-September 2014) of the Board of Directors/ Trustees of Value Line Funds; Trustee (since January 2015) and Treasurer and Chairman of the Audit Committee and Finance Committee (since January 2016) of Board of Trustees of Huntington Disease Foundation of America; Trustee, Board of Trustees, RIM Retirement Savings Plan (2005-2007); President and Chief Investment Officer, Robeco Investment Management, formerly known as Weiss Peck and Greer (January 2005-June 2007); Member, Management Committee of Robeco Investment Management (2001-2007); Chairman and Trustee of the Board of Trustees of Weiss, Peck and Greer Funds (2004-2005); Managing Director and Head of Fixed Income, Weiss, Peck and Greer (November 1994-January 2005); Managing Director and Head of Fixed Income, CS First Boston Investment Management (January 1992-November 1994); Director, Global Product Development, First Boston Asset Management (November 1989-January 1992); Vice President, Fixed Income Sales, First Boston Corp. (May 1984-November 1989). Mr. Vandivort has served on the Boards of certain Oppenheimer funds since 2014, during which time he has become familiar with the Fund’s (and other Oppenheimer funds’) financial, accounting, regulatory and investment matters and has contributed to the Board’s deliberations. |
40 OPPENHEIMER PORTFOLIO SERIES GROWTH INVESTOR FUND
| | |
| |
Brian F. Wruble, Trustee (since 2005) Year of Birth: 1943 | | Governor of Community Foundation of the Florida Keys(non-profit) (since July 2012); Director of TCP Capital, Inc. (registered business development company) (since November 2015); Chairman Emeritus of the Board of Trustees (since August 2011), Chairman of the Board of Trustees (August 2007-August 2011), Trustee of the Board of Trustees (since August 1991) of The Jackson Laboratory(non-profit); Member of Zurich Insurance Group’s Investment Management Advisory Council (insurance) (October 2004-February 2017); Treasurer (since 2007) and Trustee (since May 1992) of the Institute for Advanced Study(non-profit educational institute); Director of Special Value Opportunities Fund, LLC (registered investment company) (affiliate of theSub-Adviser’s parent company) (September 2004- June 2015); General Partner of Odyssey Partners, L.P. (hedge fund) (September 1995-December 2007); Special Limited Partner of Odyssey Investment Partners, LLC (private equity investment) (January 1999-September 2004). Mr. Wruble has served on the Boards of certain Oppenheimer funds since April 2001, during which time he has become familiar with the Fund’s (and other Oppenheimer funds’) financial, accounting, regulatory and investment matters and has contributed to the Board’s deliberations. |
| INTERESTED TRUSTEE AND OFFICER | | Mr. Steinmetz is an “Interested Trustee” because he is affiliated with the Manager and theSub-Adviser by virtue of his positions as Chairman of theSub-Adviser and officer and director of the Manager. Both as a Trustee and as an officer, Mr. Steinmetz serves for an indefinite term, or until his resignation, retirement, death or removal. Mr. Steinmetz’s address is 225 Liberty Street, New York, New York 10281-1008. Mr. Steinmetz is an officer of 104 portfolios in the OppenheimerFunds complex. |
| |
Arthur P. Steinmetz, Trustee (since 2015), President and Principal Executive Officer (since 2014) Year of Birth: 1958 | | Chairman of OppenheimerFunds, Inc. (since January 2015); CEO and Chairman of OFI Global Asset Management, Inc. (since July 2014), President of OFI Global Asset Management, Inc. (since May 2013), a Director of OFI Global Asset Management, Inc. (since January 2013), Director of OppenheimerFunds, Inc. (since July 2014), President, Management Director and CEO of Oppenheimer Acquisition Corp. (OppenheimerFunds, Inc.‘s parent holding company) (since July 2014), and President and Director of OFI SteelPath, Inc. (since January 2013). Chief Investment Officer of the OppenheimerFunds advisory entities (January 2013-December 2013); Executive Vice President of OFI Global Asset Management, Inc. (January2013-May 2013); Chief Investment Officer of OppenheimerFunds, Inc. (October 2010-December 2012); Chief Investment Officer, Fixed-Income, of OppenheimerFunds, Inc. (April 2009-October 2010); Executive Vice President of OppenheimerFunds, Inc. (October 2009-December 2012); Director of Fixed Income of OppenheimerFunds, Inc. (January 2009-April 2009); and a Senior Vice President of OppenheimerFunds, Inc. (March 1993-September 2009). |
| OTHER OFFICERS OF THE FUND | | The addresses of the Officers in the chart below are as follows: for Mr. Bennett, Mss. Lo Bessette, Foxson and Picciotto, 225 Liberty Street, New York, New York 10281-1008, for Mr. Petersen, 6803 S. Tucson Way, Centennial, Colorado 80112-3924. Each Officer serves for an indefinite term or until his or her resignation, retirement, death or removal. |
| |
Jeffrey Bennett, Vice President (since 2018) Year of Birth: 1976 | | Vice President of theSub-Adviser (since November 2016). Managing Director, Alternative Investment Management, for Alliance Bernstein 2011-2016); Director of Research at Fischer & Company (2008 to 2011). |
41 OPPENHEIMER PORTFOLIO SERIES GROWTH INVESTOR FUND
TRUSTEES AND OFFICERSUnaudited / Continued
| | |
| |
Cynthia Lo Bessette, Secretary and Chief Legal Officer(since 2016) Year of Birth: 1969 | | Executive Vice President, General Counsel and Secretary of OFI Global Asset Management, Inc. (since February 2016); Senior Vice President and Deputy General Counsel of OFI Global Asset Management, Inc. (March 2015-February 2016); Chief Legal Officer of OppenheimerFunds, Inc. and OppenheimerFunds Distributor, Inc. (since February 2016); Vice President, General Counsel and Secretary of Oppenheimer Acquisition Corp. (since February 2016); General Counsel of OFI SteelPath, Inc., OFI Advisors, LLC and Index Management Solutions, LLC (since February 2016); Chief Legal Officer of OFI Global Institutional, Inc., HarbourView Asset Management Corporation, OFI Global Trust Company, Oppenheimer Real Asset Management, Inc., OFI Private Investments Inc., Shareholder Services, Inc. and Trinity Investment Management Corporation (since February 2016); Corporate Counsel (February 2012-March 2015) and Deputy Chief Legal Officer (April 2013-March 2015) of Jennison Associates LLC; Assistant General Counsel (April 2008-September 2009) and Deputy General Counsel (October 2009-February 2012) of Lord Abbett & Co. LLC. |
| |
Jennifer Foxson, Vice President and Chief Business Officer (since 2014) Year of Birth: 1969 | | Senior Vice President of OppenheimerFunds Distributor, Inc. (since June 2014); Vice President of OppenheimerFunds Distributor, Inc. (April 2006-June 2014); Vice President of OppenheimerFunds, Inc. (January 1998-March 2006); Assistant Vice President of OppenheimerFunds, Inc. (October 1991-December 1998). |
| |
Mary Ann Picciotto, Chief Compliance Officer and Chief Anti-Money Laundering Officer (since 2014) Year of Birth: 1973 | | Senior Vice President and Chief Compliance Officer of OFI Global Asset Management, Inc. (since March 2014); Chief Compliance Officer of OppenheimerFunds, Inc., OFI SteelPath, Inc., OFI Global Institutional, Inc., Oppenheimer Real Asset Management, Inc., OFI Private Investments Inc., Harborview Asset Management Corporation, Trinity Investment Management Corporation, and Shareholder Services, Inc. (since March 2014); Managing Director of Morgan Stanley Investment Management Inc. and certain of its various affiliated entities; Chief Compliance Officer of various Morgan Stanley Funds (May 2010-January 2014); Chief Compliance Officer of Morgan Stanley Investment Management Inc. (April 2007-January 2014). |
| |
Brian S. Petersen, Treasurer and PrincipalFinancial & Accounting Officer (since 2016) Year of Birth: 1970 | | Senior Vice President of OFI Global Asset Management, Inc. (since January 2017); Vice President of OFI Global Asset Management, Inc. (January 2013-January 2017); Vice President of OppenheimerFunds, Inc. (February 2007-December 2012); Assistant Vice President of OppenheimerFunds, Inc. (August 2002-2007). |
The Fund’s Statement of Additional Information contains additional information about the Fund’s
Trustees and Officers and is available without charge upon request by calling 1.800.CALL OPP (225.5677).
42 OPPENHEIMER PORTFOLIO SERIES GROWTH INVESTOR FUND
OPPENHEIMER PORTFOLIO SERIES GROWTH INVESTOR FUND
| | |
| Manager | | OFI Global Asset Management, Inc. |
| |
| Sub-Adviser | | OppenheimerFunds, Inc. |
| |
| Distributor | | OppenheimerFunds Distributor, Inc. |
| |
Transfer and Shareholder Servicing Agent | | OFI Global Asset Management, Inc. |
| |
| Sub-Transfer Agent | | Shareholder Services, Inc. |
| | DBA OppenheimerFunds Services |
| |
Independent Registered Public Accounting Firm | | KPMG LLP |
| |
| Legal Counsel | | Kramer Levin Naftalis & Frankel LLP |
© 2019 OppenheimerFunds, Inc. All rights reserved.
43 OPPENHEIMER PORTFOLIO SERIES GROWTH INVESTOR FUND
PRIVACY NOTICE
As an Oppenheimer fund shareholder, you are entitled to know how we protect your personal information and how we limit its disclosure.
Information Sources
We obtainnon-public personal information about our shareholders from the following sources:
| ● | Applications or other forms. |
| ● | When you create a user ID and password for online account access. |
| ● | When you enroll in eDocs Direct,SM our electronic document delivery service. |
| ● | Your transactions with us, our affiliates or others. |
| ● | Technologies on our website, including: “cookies” and web beacons, which are used to collect data on the pages you visit and the features you use. |
If you visit oppenheimerfunds.com and do not log on to the secure account information areas, we do not obtain any personal information about you. When you do log on to a secure area, we do obtain your user ID and password to identify you. We also use this information to provide you with products and services you have requested, to inform you about products and services that you may be interested in and assist you in other ways.
We do not collect personal information through our website unless you willingly provide it to us, either directly by email or in those areas of the website that request information. In order to update your personal information (including your mailing address, email address and phone number) you must first log on and visit your user profile.
If you have set your browser to warn you before accepting cookies, you will receive the warning message with each cookie. You can refuse cookies by turning them off in your browser. However, doing so may limit your access to certain sections of our website.
We use cookies to help us improve and manage our website. For example, cookies help us recognize new versus repeat visitors to the site, track the pages visited, and enable some special features on the website. This data helps us provide better service for our website visitors.
Protection of Information
We do not disclose anynon-public personal information (such as names on a customer list) about current or former customers to anyone, except as permitted by law.
Disclosure of Information
Copies of confirmations, account statements and other documents reporting activity in your fund accounts are made available to your financial advisor (as designated by you). We may also use details about you and your investments to help us, our financial service affiliates, or firms that jointly market their financial products and services with ours, to better serve your investment needs or suggest educational material that may be of interest to you. If this requires us to provide you with an opportunity to “opt in” or “opt out” of such information sharing with a firm not affiliated with us, you will receive notification on how to do so, before any such sharing takes place.
Right of Refusal
We will not disclose your personal information to unaffiliated third parties (except as permitted by law), unless we first offer you a reasonable opportunity to refuse or “opt out” of such disclosure.
44 OPPENHEIMER PORTFOLIO SERIES GROWTH INVESTOR FUND
Internet Security and Encryption
In general, the email services provided by our website are encrypted and provide a secure and private means of communication with us. To protect your own privacy, confidential and/ or personal information should only be communicated via email when you are advised that you are using a secure website.
As a security measure, we do not include personal or account information innon-secure emails, and we advise you not to send such information to us innon-secure emails. Instead, you may take advantage of the secure features of our website to encrypt your email correspondence. To do this, you will need to use a browser that supports Secure Sockets Layer (SSL) protocol.
| ● | All transactions conducted via our websites, including redemptions, exchanges and purchases, are secured by the highest encryption standards available. SSL is used to establish a secure connection between your PC and OppenheimerFunds’ server. It transmits information in an encrypted and scrambled format. |
| ● | Encryption is achieved through an electronic scrambling technology that uses a “key” to code and then decode the data. Encryption acts like the cable converter box you may have on your television set. It scrambles data with a secret code so that no one can make sense of it while it is being transmitted. When the data reaches its destination, the same software unscrambles the data. |
| ● | You can exit the secure area by closing your browser or, for added security, you can use the Log Out button before you close your browser. |
Other Security Measures
We maintain physical, electronic and procedural safeguards to protect your personal account information. Our employees and agents have access to that information only so that they may offer you products or provide services, for example, when responding to your account questions.
How You Can Help
You can also do your part to keep your account information private and to prevent unauthorized transactions. If you obtain a user ID and password for your account, safeguard that information. Strengthening your online credentials–your online security profile–typically your user name, password, and security questions and answers, can be one of your most important lines of defense on the Internet. For additional information on how you can help prevent identity theft, visit https://www. oppenheimerfunds.com/security.
Who We Are
This joint notice describes the privacy policies of the Oppenheimer funds, OppenheimerFunds, Inc., each of its investment adviser subsidiaries, OppenheimerFunds Distributor, Inc. and OFI Global Trust Co. It applies to all Oppenheimer fund accounts you presently have, or may open in the future, using your Social Security number—whether or not you remain a shareholder of our funds. This notice was last updated as of November 2017. In the event it is updated or changed, we will post an updated notice on our website at oppenheimerfunds.com. If you have any questions about this privacy policy, email us by clicking on theContact Us section of our website at oppenheimerfunds.com, write to us at P.O. Box 5270, Denver, CO 80217-5270, or call us at800 CALL OPP (225 5677).
45 OPPENHEIMER PORTFOLIO SERIES GROWTH INVESTOR FUND
THIS PAGE INTENTIONALLY LEFT BLANK.
46 OPPENHEIMER PORTFOLIO SERIES GROWTH INVESTOR FUND
THIS PAGE INTENTIONALLY LEFT BLANK.
47 OPPENHEIMER PORTFOLIO SERIES GROWTH INVESTOR FUND
| | | | |
| | 
Visit us at oppenheimerfunds.com for24-hr access to account information and transactions or call us at 800.CALL OPP (800.225.5677) for24-hr automated information and automated transactions. Representatives also available Mon–Fri8am-8pm ET. | | |
Visit Us oppenheimerfunds.com | | | | |
Call Us 800 225 5677 | | | | |
Follow Us | | | | |
 | | Oppenheimer funds are distributed by OppenheimerFunds Distributor, Inc. 225 Liberty Street, New York, NY 10281-1008 © 2019 OppenheimerFunds Distributor, Inc. All rights reserved. RA0555.001.0119 March 25, 2019 | | |
Item 2. Code of Ethics.
The registrant has adopted a code of ethics that applies to the registrant’s principal executive officer, principal financial officer, principal accounting officer or controller or persons performing similar functions.
Item 3. Audit Committee Financial Expert.
The Board of Trustees of the registrant has determined that Joanne Pace, the Board’s Audit Committee Chairwoman, is an audit committee financial expert and that Ms. Pace is “independent” for purposes of this Item 3.
Item 4. Principal Accountant Fees and Services.
The principal accountant for the audit of the registrant’s annual financial statements billed $93,910 in fiscal 2019 and $91,600 in fiscal 2018.
The principal accountant for the audit of the registrant’s annual financial statements billed $23,336 in fiscal 2019 and $24,000 in fiscal 2018.
The principal accountant for the audit of the registrant’s annual financial statements billed $297,836 in fiscal 2019 and $386,986 in fiscal 2018 to the registrant’s investment adviser or any entity controlling, controlled by, or under common control with the adviser that provides ongoing services to the registrant.
Such services include: Internal control reviews, GIPS attestation procedures, custody audits, incremental, and additional, audit services
The principal accountant for the audit of the registrant’s annual financial statements billed no such fees in fiscal 2019 and no such fees in fiscal 2018.
The principal accountant for the audit of the registrant’s annual financial statements billed $534,826 in fiscal 2019 and $591,136 in fiscal 2018 to the registrant’s investment adviser or any entity controlling, controlled by, or under common control with the adviser that provides ongoing services to the registrant.
Such services include: tax compliance, tax planning and tax advice. Tax compliance generally involves preparation of original and amended tax returns, claims for a refund and tax payment-planning services. Tax planning and tax advice includes assistance with tax audits and appeals, tax advice related to mergers and acquisitions and requests for rulings or technical advice from taxing authorities.
The principal accountant for the audit of the registrant’s annual financial statements billed no such fees in fiscal 2019 and no such fees in fiscal 2018.
The principal accountant for the audit of the registrant’s annual financial statements billed no such fees in fiscal 2019 and no such fees in fiscal 2018 to the registrant’s investment adviser or any entity controlling, controlled by, or under common control with the adviser that provides ongoing services to the registrant.
Such fees would include the cost to the principal accountant of attending audit committee meetings and consultations regarding the registrant’s retirement plan with respect to its Trustees.
| (e) | (1) During its regularly scheduled periodic meetings, the registrant’s audit committee willpre-approve all audit, audit-related, tax and other services to be provided by the principal accountants of the registrant. |
The audit committee has delegatedpre-approval authority to its Chairwoman for any subsequent new engagements that arise between regularly scheduled meeting dates provided that any fees suchpre-approved are presented to the audit committee at its next regularly scheduled meeting.
Under applicable laws,pre-approval ofnon-audit services may be waived provided that: 1) the aggregate amount of all such services provided constitutes no more than five percent of the total amount of fees paid by the registrant to its principal accountant during the fiscal year in which services are provided 2) such services were not recognized by the registrant at the time of engagement asnon-audit services and 3) such services are promptly brought to the attention of the audit committee of the registrant and approved prior to the completion of the audit.
(2) 0%
| (f) | Not applicable as less than 50%. |
| (g) | The principal accountant for the audit of the registrant’s annual financial statements billed $855,998 in fiscal 2019 and $1,002,122 in fiscal 2018 to the registrant and the registrant’s investment adviser or any entity controlling, controlled by, or under common control with the adviser that provides ongoing services to the registrant related tonon-audit fees. Those billings did not include any prohibitednon-audit services as defined by the Securities Exchange Act of 1934. |
| (h) | The registrant’s audit committee of the board of Trustees has considered whether the provision ofnon-audit services that were rendered to the registrant’s investment adviser, and any entity controlling, controlled by, or under common control with the investment adviser that provides ongoing services to the registrant that were notpre-approved pursuant to paragraph (c)(7)(ii) of Rule2-01 of RegulationS-X is compatible with maintaining the principal accountant’s independence. No such services were rendered. |
Item 5. Audit Committee of Listed Registrants
Not applicable.
Item 6. Schedule of Investments.
a) Not applicable. The complete schedule of investments is included in Item 1 of this FormN-CSR.
b) Not applicable.
Item 7. Disclosure of Proxy Voting Policies and Procedures forClosed-End Management Investment Companies.
Not applicable.
Item 8. Portfolio Managers ofClosed-End Management Investment Companies.
Not applicable.
Item 9. Purchases of Equity Securities byClosed-End Management Investment Company and Affiliated Purchasers.
Not applicable.
Item 10. Submission of Matters to a Vote of Security Holders.
The Fund’s Governance Committee Provisions with Respect to Nominations of Directors/Trustees to the Respective Boards
None
Item 11. Controls and Procedures.
Based on their evaluation of the registrant’s disclosure controls and procedures (as defined in rule30a-3(c) under the Investment Company Act of 1940 (17 CFR270.30a-3(c)) as of 1/31/2019, the registrant’s principal executive officer and principal financial officer found the registrant’s disclosure controls and procedures to provide reasonable assurances that information required to be disclosed by the registrant in the reports that it files under the Securities Exchange Act of 1934 (a) is accumulated and communicated to registrant’s management, including its principal executive officer and principal financial officer, to allow timely decisions regarding required disclosure, and (b) is recorded, processed, summarized and reported, within the time periods specified in the rules and forms adopted by the U.S. Securities and Exchange Commission.
There have been no changes in the registrant’s internal controls over financial reporting that occurred during the registrant’s second fiscal quarter of the period covered by this report that
have materially affected, or are reasonably likely to materially affect, the registrant’s internal control over financial reporting.
Item 12. Disclosure of Securities Lending Activities forClosed-End Management Investment Companies.
Not applicable.
Item 13. Exhibits.
| (a) | (1) Exhibit attached hereto. |
(2) Exhibits attached hereto.
SIGNATURES
Pursuant to the requirements of the Securities Exchange Act of 1934 and the Investment Company Act of 1940, the registrant has duly caused this report to be signed on its behalf by the undersigned, thereunto duly authorized.
Oppenheimer Portfolio Series
| | |
| By: | | /s/ Arthur P. Steinmetz |
| | Arthur P. Steinmetz |
| | Principal Executive Officer |
| Date: | | 3/15/2019 |
Pursuant to the requirements of the Securities Exchange Act of 1934 and the Investment Company Act of 1940, this report has been signed below by the following persons on behalf of the registrant and in the capacities and on the dates indicated.
| | |
| By: | | /s/ Arthur P. Steinmetz |
| | Arthur P. Steinmetz |
| | Principal Executive Officer |
| Date: | | 3/15/2019 |
| | |
| By: | | /s/ Brian S. Petersen |
| | Brian S. Petersen |
| | Principal Financial Officer |
| Date: | | 3/15/2019 |