Exhibit (c)(3)
[Either insert client logo (height about 1”) above line if it is high resolution, or type client name.] Preliminary Discussion Materials Regarding Project Dallas July 30, 2019 The Special Committee of the Board of Directors of DryShips Inc. PRELIMINARY DRAFT SUBJECT TO MATERIAL CHANGES BASED ON ONGOING DUE DILIGENCE

R - 38 G - 77 B - 130 R - 106 G - 151 B - 212 R - 235 G - 133 B - 33 R - 0 G - 134 B - 0 R - 250 G - 202 B - 0 R - 193 G - 2 B - 2 R - 100 G - 100 B - 100 R - 0 G - 105 B - 170 R - 236 G - 163 B - 33 R - 138 G - 173 B - 70 R - 255 G - 219 B - 67 R - 221 G - 70 B - 55 R - 191 G - 191 B - 191 R - 240 G - 181 B - 74 R - 189 G - 209 B - 143 R - 209 G - 226 B - 255 R - 106 G - 151 B - 212 R - 183 G - 205 B - 235 R - 217 G - 217 B - 217 R - 158 G - 198 B - 197 R - 200 G - 222 B - 222 R - 191 G - 191 B - 191 R - 38 G - 77 B - 130 R - 193 G - 2 B - 2 Accent colors/ contrasting colors: R - 0 G - 134 B - 0 R - 235 G - 133 B - 33 R - 250 G - 202 B - 0 R - 170 G - 54 B - 206 Excel chart colors: For basic graphics, diagrams: Light gray for default Word table fill, callout boxes and annotated boxes: R - 234 G - 234 B - 234 Word tables: 3pt border, R - 38,G - 77,B - 130 Highlight colors: R - 106 G - 151 B - 212 R - 235 G - 133 B - 33 R - 0 G - 134 B - 0 R - 250 G - 202 B - 0 R - 219 G - 230 B - 245 R - 245 G - 192 B - 139 R - 201 G - 255 B - 201 R - 255 G - 235 B - 151 Group 1: For text, wireframe, borders, colored bullets: Group 2: For fills and larger areas of colors, e.g., Word table fill: Secondary colored font: R - 0 G - 105 B - 170 Primary colored font: R - 38 G - 77 B - 130 Preliminary Draft – Confidential These materials have been prepared by Evercore Group L . L . C . (“Evercore”) for the Special Committee (the “Committee”) of the Board of Directors of DryShips, Inc . (the “Company”) to whom such materials are directly addressed and delivered and may not be used or relied upon for any purpose other than as specifically contemplated . These materials are based on information provided by or on behalf of the Company and/or other potential transaction participants, from public sources or otherwise reviewed by Evercore . Evercore assumes no responsibility for independent investigation or verification of such information and has relied on such information being complete and accurate in all material respects . To the extent such information includes estimates and forecasts of future financial performance prepared by or reviewed with the management of the Company and/or other potential transaction participants or obtained from public sources, Evercore has assumed that such estimates and forecasts have been reasonably prepared on bases reflecting the best currently available estimates and judgments of such management (or, with respect to estimates and forecasts obtained from public sources, represent reasonable estimates) . No representation or warranty, express or implied, is made as to the accuracy or completeness of such information and nothing contained herein is, or shall be relied upon as, a representation, whether as to the past, the present or the future . These materials were designed for use by specific persons familiar with the business and affairs of the Company . These materials are not intended to provide the sole basis for evaluating, and should not be considered a recommendation with respect to, any transaction or other matter . These materials have been developed by and are proprietary to Evercore and were prepared exclusively for the benefit and internal use of the Committee . These materials were compiled on a confidential basis for use by the Committee in evaluating the potential transaction described herein and not with a view to public disclosure or filing thereof under state or federal securities laws, and may not be reproduced, disseminated, quoted or referred to, in whole or in part, without the prior written consent of Evercore . These materials do not constitute an offer or solicitation to sell or purchase any securities and are not a commitment by Evercore (or any affiliate) to provide or arrange any financing for any transaction or to purchase any security in connection therewith . Evercore assumes no obligation to update or otherwise revise these materials . These materials may not reflect information known to other professionals in other business areas of Evercore and its affiliates . Evercore and its affiliates do not provide legal, accounting or tax advice . Accordingly, any statements contained herein as to tax matters were neither written nor intended by Evercore or its affiliates to be used and cannot be used by any taxpayer for the purpose of avoiding tax penalties that may be imposed on such taxpayer . Each person should seek legal, accounting and tax advice based on his, her or its particular circumstances from independent advisors regarding the impact of the transactions or matters described herein . Note, this disclaimer page should follow the title page in presentations. Please fill out the [blanks] in the text.

R - 38 G - 77 B - 130 R - 106 G - 151 B - 212 R - 235 G - 133 B - 33 R - 0 G - 134 B - 0 R - 250 G - 202 B - 0 R - 193 G - 2 B - 2 R - 100 G - 100 B - 100 R - 0 G - 105 B - 170 R - 236 G - 163 B - 33 R - 138 G - 173 B - 70 R - 255 G - 219 B - 67 R - 221 G - 70 B - 55 R - 191 G - 191 B - 191 R - 240 G - 181 B - 74 R - 189 G - 209 B - 143 R - 209 G - 226 B - 255 R - 106 G - 151 B - 212 R - 183 G - 205 B - 235 R - 217 G - 217 B - 217 R - 158 G - 198 B - 197 R - 200 G - 222 B - 222 R - 191 G - 191 B - 191 R - 38 G - 77 B - 130 R - 193 G - 2 B - 2 Accent colors/ contrasting colors: R - 0 G - 134 B - 0 R - 235 G - 133 B - 33 R - 250 G - 202 B - 0 R - 170 G - 54 B - 206 Excel chart colors: For basic graphics, diagrams: Light gray for default Word table fill, callout boxes and annotated boxes: R - 234 G - 234 B - 234 Word tables: 3pt border, R - 38,G - 77,B - 130 Highlight colors: R - 106 G - 151 B - 212 R - 235 G - 133 B - 33 R - 0 G - 134 B - 0 R - 250 G - 202 B - 0 R - 219 G - 230 B - 245 R - 245 G - 192 B - 139 R - 201 G - 255 B - 201 R - 255 G - 235 B - 151 Group 1: For text, wireframe, borders, colored bullets: Group 2: For fills and larger areas of colors, e.g., Word table fill: Secondary colored font: R - 0 G - 105 B - 170 Primary colored font: R - 38 G - 77 B - 130 Preliminary Draft – Confidential Table of Contents Introduction DryShips Situation Analysis Preliminary Valuation of the Common Shares Appendix Section I II III Note, the TOC page can be generated using FactSet. If FactSet doesn’t check the slides for you, select the dividers manually. x x
To update section number manually, click in the text box, go to Numbering: I. Introduction

R - 38 G - 77 B - 130 R - 106 G - 151 B - 212 R - 235 G - 133 B - 33 R - 0 G - 134 B - 0 R - 250 G - 202 B - 0 R - 193 G - 2 B - 2 R - 100 G - 100 B - 100 R - 0 G - 105 B - 170 R - 236 G - 163 B - 33 R - 138 G - 173 B - 70 R - 255 G - 219 B - 67 R - 221 G - 70 B - 55 R - 191 G - 191 B - 191 R - 240 G - 181 B - 74 R - 189 G - 209 B - 143 R - 209 G - 226 B - 255 R - 106 G - 151 B - 212 R - 183 G - 205 B - 235 R - 217 G - 217 B - 217 R - 158 G - 198 B - 197 R - 200 G - 222 B - 222 R - 191 G - 191 B - 191 R - 38 G - 77 B - 130 R - 193 G - 2 B - 2 Accent colors/ contrasting colors: R - 0 G - 134 B - 0 R - 235 G - 133 B - 33 R - 250 G - 202 B - 0 R - 170 G - 54 B - 206 Excel chart colors: For basic graphics, diagrams: Light gray for default Word table fill, callout boxes and annotated boxes: R - 234 G - 234 B - 234 Word tables: 3pt border, R - 38,G - 77,B - 130 Highlight colors: R - 106 G - 151 B - 212 R - 235 G - 133 B - 33 R - 0 G - 134 B - 0 R - 250 G - 202 B - 0 R - 219 G - 230 B - 245 R - 245 G - 192 B - 139 R - 201 G - 255 B - 201 R - 255 G - 235 B - 151 Group 1: For text, wireframe, borders, colored bullets: Group 2: For fills and larger areas of colors, e.g., Word table fill: Secondary colored font: R - 0 G - 105 B - 170 Primary colored font: R - 38 G - 77 B - 130 Preliminary Draft – Confidential Introduction Overview Source: Company Management, FactSet Evercore Group L.L.C. (“Evercore”) is pleased to provide the materials herein to the Special Committee of the Board of Directors (the “Special Committee”) of DryShips, Inc. (the “Company” or “DRYS”) regarding the proposed acquisition by SPII Holdings Inc. (“SPII ” or “the Buyer”), a company controlled by DRYS’ Chairman and CEO George Economou (“Economou”) of all outstanding common shares (each, a “Common Share”) from the current holders of such shares other than the Common Shares held by SPII, Economou or entities affiliated with Economou (the “Proposed Transaction”), to be merged into an SPII subsidiary in exchange for the right to receive $4.00 in cash per Common Share (the “Proposed Consideration”) The Proposed Consideration offered by SPII on June 13, 2019, represented a 26.6% premium to DRYS’ unaffected closing share price of $3.16 as of June 12, 2019 The Board formed the Special Committee to consider the Proposed Transaction. On July 8, 2019, the Special Committee announced its appointment of legal and financial advisors The following materials reviewing the Proposed Transaction include the following: An introduction, including an overview of the Proposed Transaction detailing summary proposed terms, an overview of the Company’s current summary organizational structure and ownership, an analysis of financial metrics implied by the Proposed Transaction and certain issues for consideration; A situational overview of DRYS; A review of the financial projections for DRYS as provided by Company Management (the “Company Financial Projections”) and a review of the assumptions utilized by Company Management in deriving such financial projections; and A preliminary valuation of the Common Shares 1
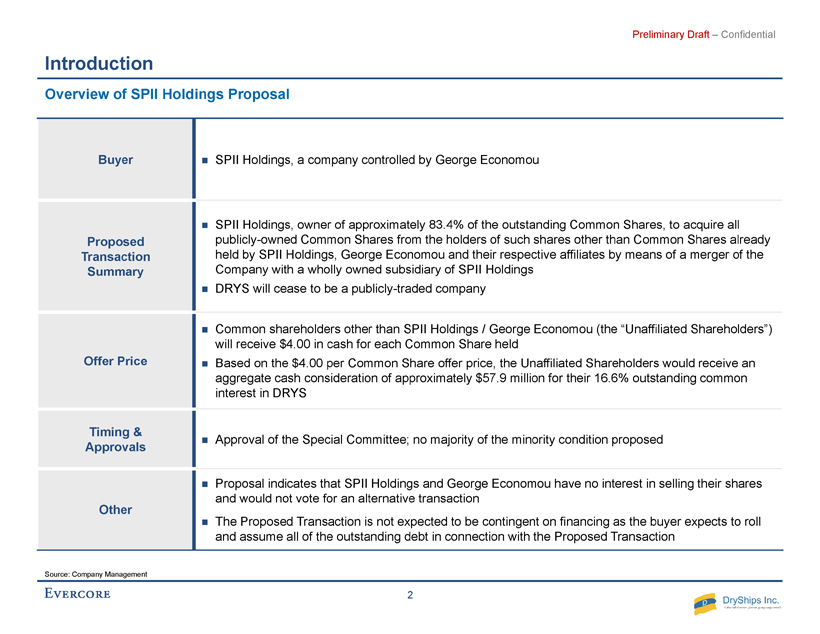
R - 38 G - 77 B - 130 R - 106 G - 151 B - 212 R - 235 G - 133 B - 33 R - 0 G - 134 B - 0 R - 250 G - 202 B - 0 R - 193 G - 2 B - 2 R - 100 G - 100 B - 100 R - 0 G - 105 B - 170 R - 236 G - 163 B - 33 R - 138 G - 173 B - 70 R - 255 G - 219 B - 67 R - 221 G - 70 B - 55 R - 191 G - 191 B - 191 R - 240 G - 181 B - 74 R - 189 G - 209 B - 143 R - 209 G - 226 B - 255 R - 106 G - 151 B - 212 R - 183 G - 205 B - 235 R - 217 G - 217 B - 217 R - 158 G - 198 B - 197 R - 200 G - 222 B - 222 R - 191 G - 191 B - 191 R - 38 G - 77 B - 130 R - 193 G - 2 B - 2 Accent colors/ contrasting colors: R - 0 G - 134 B - 0 R - 235 G - 133 B - 33 R - 250 G - 202 B - 0 R - 170 G - 54 B - 206 Excel chart colors: For basic graphics, diagrams: Light gray for default Word table fill, callout boxes and annotated boxes: R - 234 G - 234 B - 234 Word tables: 3pt border, R - 38,G - 77,B - 130 Highlight colors: R - 106 G - 151 B - 212 R - 235 G - 133 B - 33 R - 0 G - 134 B - 0 R - 250 G - 202 B - 0 R - 219 G - 230 B - 245 R - 245 G - 192 B - 139 R - 201 G - 255 B - 201 R - 255 G - 235 B - 151 Group 1: For text, wireframe, borders, colored bullets: Group 2: For fills and larger areas of colors, e.g., Word table fill: Secondary colored font: R - 0 G - 105 B - 170 Primary colored font: R - 38 G - 77 B - 130 Preliminary Draft – Confidential Introduction Overview of SPII Holdings Proposal Source: Company Management Buyer SPII Holdings, a company controlled by George Economou Proposed Transaction Summary SPII Holdings, owner of approximately 83.4% of the outstanding Common Shares, to acquire all publicly - owned Common Shares from the holders of such shares other than Common Shares already held by SPII Holdings, George Economou and their respective affiliates by means of a merger of the Company with a wholly owned subsidiary of SPII Holdings DRYS will cease to be a publicly - traded company Offer Price Common shareholders other than SPII Holdings / George Economou (the “Unaffiliated Shareholders”) will receive $4.00 in cash for each Common Share held Based on the $4.00 per Common Share offer price, the Unaffiliated Shareholders would receive an aggregate cash consideration of approximately $57.9 million for their 16.6% outstanding common interest in DRYS Timing & Approvals Approval of the Special Committee; no majority of the minority condition proposed Other Proposal indicates that SPII Holdings and George Economou have no interest in selling their shares and would not vote for an alternative transaction The Proposed Transaction is not expected to be contingent on financing as the buyer expects to roll and assume all of the outstanding debt in connection with the Proposed Transaction 2
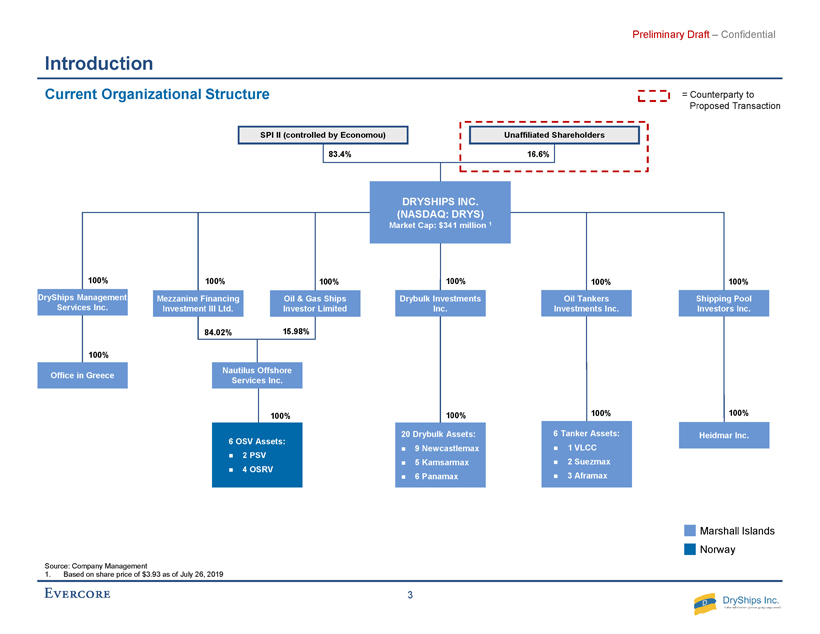
R - 38 G - 77 B - 130 R - 106 G - 151 B - 212 R - 235 G - 133 B - 33 R - 0 G - 134 B - 0 R - 250 G - 202 B - 0 R - 193 G - 2 B - 2 R - 100 G - 100 B - 100 R - 0 G - 105 B - 170 R - 236 G - 163 B - 33 R - 138 G - 173 B - 70 R - 255 G - 219 B - 67 R - 221 G - 70 B - 55 R - 191 G - 191 B - 191 R - 240 G - 181 B - 74 R - 189 G - 209 B - 143 R - 209 G - 226 B - 255 R - 106 G - 151 B - 212 R - 183 G - 205 B - 235 R - 217 G - 217 B - 217 R - 158 G - 198 B - 197 R - 200 G - 222 B - 222 R - 191 G - 191 B - 191 R - 38 G - 77 B - 130 R - 193 G - 2 B - 2 Accent colors/ contrasting colors: R - 0 G - 134 B - 0 R - 235 G - 133 B - 33 R - 250 G - 202 B - 0 R - 170 G - 54 B - 206 Excel chart colors: For basic graphics, diagrams: Light gray for default Word table fill, callout boxes and annotated boxes: R - 234 G - 234 B - 234 Word tables: 3pt border, R - 38,G - 77,B - 130 Highlight colors: R - 106 G - 151 B - 212 R - 235 G - 133 B - 33 R - 0 G - 134 B - 0 R - 250 G - 202 B - 0 R - 219 G - 230 B - 245 R - 245 G - 192 B - 139 R - 201 G - 255 B - 201 R - 255 G - 235 B - 151 Group 1: For text, wireframe, borders, colored bullets: Group 2: For fills and larger areas of colors, e.g., Word table fill: Secondary colored font: R - 0 G - 105 B - 170 Primary colored font: R - 38 G - 77 B - 130 Preliminary Draft – Confidential Introduction Current Organizational Structure 100% Marshall Islands Norway Nautilus Offshore Services Inc. DryShips Management Services Inc. Mezzanine Financing Investment III Ltd. Oil & Gas Ships Investor Limited Oil Tankers Investments Inc. 6 Tanker Assets: 1 VLCC 2 Suezmax 3 Aframax Drybulk Investments Inc. 20 Drybulk Assets: 9 Newcastlemax 5 Kamsarmax 6 Panamax DRYSHIPS INC. (NASDAQ: DRYS) Market Cap: $341 million 1 100% 100% 100% 100% 100% 100% 100% 15.98% 84.02% 100% Source: Company Management 1. Based on share price of $3.93 as of July 26, 2019 Shipping Pool Investors Inc. Heidmar Inc. 100% SPI II (controlled by Economou ) Unaffiliated Shareholders 83.4% 16.6% 6 OSV Assets: 2 PSV 4 OSRV = Counterparty to Proposed Transaction Office in Greece 100% 3

R - 38 G - 77 B - 130 R - 106 G - 151 B - 212 R - 235 G - 133 B - 33 R - 0 G - 134 B - 0 R - 250 G - 202 B - 0 R - 193 G - 2 B - 2 R - 100 G - 100 B - 100 R - 0 G - 105 B - 170 R - 236 G - 163 B - 33 R - 138 G - 173 B - 70 R - 255 G - 219 B - 67 R - 221 G - 70 B - 55 R - 191 G - 191 B - 191 R - 240 G - 181 B - 74 R - 189 G - 209 B - 143 R - 209 G - 226 B - 255 R - 106 G - 151 B - 212 R - 183 G - 205 B - 235 R - 217 G - 217 B - 217 R - 158 G - 198 B - 197 R - 200 G - 222 B - 222 R - 191 G - 191 B - 191 R - 38 G - 77 B - 130 R - 193 G - 2 B - 2 Accent colors/ contrasting colors: R - 0 G - 134 B - 0 R - 235 G - 133 B - 33 R - 250 G - 202 B - 0 R - 170 G - 54 B - 206 Excel chart colors: For basic graphics, diagrams: Light gray for default Word table fill, callout boxes and annotated boxes: R - 234 G - 234 B - 234 Word tables: 3pt border, R - 38,G - 77,B - 130 Highlight colors: R - 106 G - 151 B - 212 R - 235 G - 133 B - 33 R - 0 G - 134 B - 0 R - 250 G - 202 B - 0 R - 219 G - 230 B - 245 R - 245 G - 192 B - 139 R - 201 G - 255 B - 201 R - 255 G - 235 B - 151 Group 1: For text, wireframe, borders, colored bullets: Group 2: For fills and larger areas of colors, e.g., Word table fill: Secondary colored font: R - 0 G - 105 B - 170 Primary colored font: R - 38 G - 77 B - 130 Preliminary Draft – Confidential Introduction Source: Company Management, FactSet as of July 26, 2019 1. Implied value as of July 26, 2019 based on DRYS Common Share price of $3.93 2. Other / Retail / Undisclosed Private Shareholders represents the difference between units held by Institutions & Insiders and units outstanding : (i) Individual investors that have not crossed a disclosure threshold, (ii) Mutual funds not covered due to non - disclosure laws, (ii) Institutional investors in U.S. managing less than $100 million and do not fi le 13F and (iv) Institutional investors outside the U.S. that disregard 13F requirements or manage less than $100 million 3. Excludes shares held by SPII Holdings / George E. Economou Equity Ownership Summary DryShips, Inc. Share Count Detail ($ in millions ) Ownership Rank Investor Investor Classification Shares (mm) Value 1 Total (% Shares) Top DRYS Common Shareholders Company Statistics 1. SPII Holdings / George E. Economou Individual 72.422 $284.6 83.35% 2. Invesco Capital Management LLC Investment Adviser 0.187 0.7 0.21% 3. Susquehanna Investment Group LLC Investment Adviser 0.152 0.6 0.18% 4. BMO Asset Management, Inc. Mutual Fund Manager 0.051 0.2 0.06% 5. Creative Planning, Inc. Investment Adviser 0.051 0.2 0.06% 6. SSgA Funds Management, Inc. Mutual Fund Manager 0.039 0.2 0.04% 7. Northern Trust Investments, Inc.(Investment Management) Investment Adviser 0.036 0.1 0.04% 8. Jane Street Capital LLC Broker 0.024 0.1 0.03% 9. Millennium Management LLC Hedge Fund Manager 0.019 0.1 0.02% 10. Marshall Wace LLP Hedge Fund Manager 0.013 0.1 0.02% 11. Barclays Bank Plc Private Banking/Wealth Mgmt 0.013 0.1 0.01% 12. Cutler Group LP Broker 0.008 0.0 0.01% 13. NEXT Financial Group, Inc. Investment Adviser 0.005 0.0 0.01% 14. BlueMountain Capital Management LLC Hedge Fund Manager 0.005 0.0 0.01% 15. Simplex Trading LLC Broker 0.004 0.0 0.00% Total - Top DRYS Common Shareholders 73.029 $287.0 84.05% Total - Other / Retail / Undisclosed Private Shareholders 2 13.858 $54.5 15.95% Basic DRYS Common Shares Outstanding (Net of 17.388m Treasury Shares) 86.887 $341.5 100.0% Basic Common Shares Owned by the Public 3 14.465 $56.8 16.65% 4

R - 38 G - 77 B - 130 R - 106 G - 151 B - 212 R - 235 G - 133 B - 33 R - 0 G - 134 B - 0 R - 250 G - 202 B - 0 R - 193 G - 2 B - 2 R - 100 G - 100 B - 100 R - 0 G - 105 B - 170 R - 236 G - 163 B - 33 R - 138 G - 173 B - 70 R - 255 G - 219 B - 67 R - 221 G - 70 B - 55 R - 191 G - 191 B - 191 R - 240 G - 181 B - 74 R - 189 G - 209 B - 143 R - 209 G - 226 B - 255 R - 106 G - 151 B - 212 R - 183 G - 205 B - 235 R - 217 G - 217 B - 217 R - 158 G - 198 B - 197 R - 200 G - 222 B - 222 R - 191 G - 191 B - 191 R - 38 G - 77 B - 130 R - 193 G - 2 B - 2 Accent colors/ contrasting colors: R - 0 G - 134 B - 0 R - 235 G - 133 B - 33 R - 250 G - 202 B - 0 R - 170 G - 54 B - 206 Excel chart colors: For basic graphics, diagrams: Light gray for default Word table fill, callout boxes and annotated boxes: R - 234 G - 234 B - 234 Word tables: 3pt border, R - 38,G - 77,B - 130 Highlight colors: R - 106 G - 151 B - 212 R - 235 G - 133 B - 33 R - 0 G - 134 B - 0 R - 250 G - 202 B - 0 R - 219 G - 230 B - 245 R - 245 G - 192 B - 139 R - 201 G - 255 B - 201 R - 255 G - 235 B - 151 Group 1: For text, wireframe, borders, colored bullets: Group 2: For fills and larger areas of colors, e.g., Word table fill: Secondary colored font: R - 0 G - 105 B - 170 Primary colored font: R - 38 G - 77 B - 130 Preliminary Draft – Confidential DRYS Share Price Consideration June 13, 2019 Offer: $4.00 $4.50 $5.00 $5.50 $6.00 $6.50 Implied Premium / (Discount): DRYS Unaffected Share Price as of June 12, 2019 ($3.16) 26.6% 42.4% 58.2% 74.1% 89.9% 105.7% DRYS Current Share Price as of July 26, 2019 ($3.93) 1.8% 14.5% 27.2% 39.9% 52.7% 65.4% 10-Day VWAP ($3.31) 1 20.8% 36.0% 51.1% 66.2% 81.3% 96.4% 30-Day VWAP ($3.74) 1 7.0% 20.3% 33.7% 47.1% 60.4% 73.8% 60-Day VWAP ($4.08) 1 (2.0%) 10.3% 22.5% 34.8% 47.1% 59.3% 90-Day VWAP ($4.51) 1 (11.3%) (0.2%) 10.9% 22.0% 33.0% 44.1% Fully Diluted Shares Outstanding 86.887 86.887 86.887 86.887 86.887 86.887 Implied DRYS Equity Value (100%) $347.5 $391.0 $434.4 $477.9 $521.3 $564.8 Plus: Debt (June 30, 2019E) 3 386.8 386.8 386.8 386.8 386.8 386.8 Plus: Outstanding Legal Fees (June 30, 2019E) 4.6 4.6 4.6 4.6 4.6 4.6 Less: Cash & Restricted Cash (June 30, 2019E) 3 (115.1) (115.1) (115.1) (115.1) (115.1) (115.1) Less: Heidmar Cash (June 30, 2019E) (19.2) (19.2) (19.2) (19.2) (19.2) (19.2) Less: Investment in 9.5% Bonds (June 30, 2019E) (5.0) (5.0) (5.0) (5.0) (5.0) (5.0) Implied DRYS Enterprise Value (100%) $599.6 $643.1 $686.5 $729.9 $773.4 $816.8 TEV / Adj. EBITDA 2 Metric: 2019E $75.2 8.0x 8.5x 9.1x 9.7x 10.3x 10.9x 2020E 86.5 6.9 7.4 7.9 8.4 8.9 9.4 2021E 80.3 7.5 8.0 8.6 9.1 9.6 10.2 P / NAV 4 Metric: Estimated NAV $6.81 0.59x 0.66x 0.73x 0.81x 0.88x 0.95x Implied Offer Value Memo: Basic Common Shares Owned by the Public 14.465 14.465 14.465 14.465 14.465 14.465 DRYS Common Share Consideration $4.00 $4.50 $5.00 $5.50 $6.00 $6.50 Implied Offer Value to Unaffiliated Public Holders (16.6%) $57.9 $65.1 $72.3 $79.6 $86.8 $94.0 Introduction Proposed Transaction Economics: Analysis at Various Prices ($ in millions, except per share amounts) Source: Company Management, Bloomberg, FactSet as of July 26, 2019 1. VWAPs based on unaffected date of June 12, 2019 2. Based on DRYS management projections, inclusive of Heidmar projections (subject to ongoing due diligence with Company Management) 3. Adjusted for ABN refinancing 4. Asset values based on average broker values of the Company’s drybulk and tanker vessels from SSY (6/30/19 ) and Clarksons (6/30/19 ), which are subsequently adjusted for estimated scrubber value of $1.5mm per vessel. The Company’s offshore asset value is based on the average broker values from Clarksons (6/30/19) and Maersk (7/16/19). Heidmar’s value is based on the recent purchase price of $51mm. Includes net working capital as of 6/30/19 5

R - 38 G - 77 B - 130 R - 106 G - 151 B - 212 R - 235 G - 133 B - 33 R - 0 G - 134 B - 0 R - 250 G - 202 B - 0 R - 193 G - 2 B - 2 R - 100 G - 100 B - 100 R - 0 G - 105 B - 170 R - 236 G - 163 B - 33 R - 138 G - 173 B - 70 R - 255 G - 219 B - 67 R - 221 G - 70 B - 55 R - 191 G - 191 B - 191 R - 240 G - 181 B - 74 R - 189 G - 209 B - 143 R - 209 G - 226 B - 255 R - 106 G - 151 B - 212 R - 183 G - 205 B - 235 R - 217 G - 217 B - 217 R - 158 G - 198 B - 197 R - 200 G - 222 B - 222 R - 191 G - 191 B - 191 R - 38 G - 77 B - 130 R - 193 G - 2 B - 2 Accent colors/ contrasting colors: R - 0 G - 134 B - 0 R - 235 G - 133 B - 33 R - 250 G - 202 B - 0 R - 170 G - 54 B - 206 Excel chart colors: For basic graphics, diagrams: Light gray for default Word table fill, callout boxes and annotated boxes: R - 234 G - 234 B - 234 Word tables: 3pt border, R - 38,G - 77,B - 130 Highlight colors: R - 106 G - 151 B - 212 R - 235 G - 133 B - 33 R - 0 G - 134 B - 0 R - 250 G - 202 B - 0 R - 219 G - 230 B - 245 R - 245 G - 192 B - 139 R - 201 G - 255 B - 201 R - 255 G - 235 B - 151 Group 1: For text, wireframe, borders, colored bullets: Group 2: For fills and larger areas of colors, e.g., Word table fill: Secondary colored font: R - 0 G - 105 B - 170 Primary colored font: R - 38 G - 77 B - 130 Preliminary Draft – Confidential Introduction Issues for Consideration Management Agreements Agreements with TMS Bulkers, TMS Tankers and TMS Offshore Services cover executive management, commercial, accounting, reporting, financing, legal, manning, catering, information technology, attendance, insurance, technical and operation services The agreements have a ten year duration effective January 1, 2017 The agreements burden the Company with significant costs relative to other drybulk public companies with potential net present value impact of $0.58 to $0.88 1 per share The negative drag on value could impact the market’s view on NPV value The Company may terminate the agreements at any time for a fee of $50 million ($0.58 per share) Secured Debt Beneficial Ownership Across six secured credit facilities with a total outstanding debt of $214.2 million, Economou must continue to beneficially own at least 50% of the Company’s issued and outstanding share capital or issued and outstanding voting share capital Offshore Assets Potential cost to redeploy offshore assets Ability to realize appraisal value given lack of employment and challenges in the broader offshore market Heidmar Vessels under management drop from 2018 to 2019 (per actual vessels in pool) but then vessels in pools stay reasonably constant Management turnover at the executive level DryShips hired a new CEO at Heidmar with the goal to stabilize and turn around the platform Business was marketed for sale extensively by Morgan Stanley, who was unable to find a buyer above the value paid by DryShips Ongoing Litigation Overhang Ongoing SEC investigation and shareholder suits ► SEC issued subpoena ► Shareholder lawsuits filed Potential significant legal expenses and damages associated with outstanding investigations / lawsuits Awaiting additional litigation expense information Source : Company Management 1. Bottom end of range based on $ 50mm management agreement termination fee divided by shares outstanding of 86.887mm and top end of range based on the implied difference in unlevered free cash flow between the Company’s current per vessel per day overhead of $2,809 and $ 1,317, which represents the median of GOGL, DSX, SB, EGLE, GNK and SBLK, through 2026 (the termination date of the Management Agreem ent ) discounted at the Company’s weighted average cost of capital of 9.0%, divided by shares outstanding of 86.887mm 6

R - 38 G - 77 B - 130 R - 106 G - 151 B - 212 R - 235 G - 133 B - 33 R - 0 G - 134 B - 0 R - 250 G - 202 B - 0 R - 193 G - 2 B - 2 R - 100 G - 100 B - 100 R - 0 G - 105 B - 170 R - 236 G - 163 B - 33 R - 138 G - 173 B - 70 R - 255 G - 219 B - 67 R - 221 G - 70 B - 55 R - 191 G - 191 B - 191 R - 240 G - 181 B - 74 R - 189 G - 209 B - 143 R - 209 G - 226 B - 255 R - 106 G - 151 B - 212 R - 183 G - 205 B - 235 R - 217 G - 217 B - 217 R - 158 G - 198 B - 197 R - 200 G - 222 B - 222 R - 191 G - 191 B - 191 R - 38 G - 77 B - 130 R - 193 G - 2 B - 2 Accent colors/ contrasting colors: R - 0 G - 134 B - 0 R - 235 G - 133 B - 33 R - 250 G - 202 B - 0 R - 170 G - 54 B - 206 Excel chart colors: For basic graphics, diagrams: Light gray for default Word table fill, callout boxes and annotated boxes: R - 234 G - 234 B - 234 Word tables: 3pt border, R - 38,G - 77,B - 130 Highlight colors: R - 106 G - 151 B - 212 R - 235 G - 133 B - 33 R - 0 G - 134 B - 0 R - 250 G - 202 B - 0 R - 219 G - 230 B - 245 R - 245 G - 192 B - 139 R - 201 G - 255 B - 201 R - 255 G - 235 B - 151 Group 1: For text, wireframe, borders, colored bullets: Group 2: For fills and larger areas of colors, e.g., Word table fill: Secondary colored font: R - 0 G - 105 B - 170 Primary colored font: R - 38 G - 77 B - 130 Preliminary Draft – Confidential Introduction Overview of Other Potential Strategic Alternatives Action Description Benefits Considerations Status Quo Reject offer and maintain public listing, for outstanding 16.6% public common interest Retains optionality for future value creating alternatives Gives long-term holders of DRYS Common Shares equity exposure to future financial performance of the Company Additional clarity on impact of litigation over time Company lacks sponsorship with no research coverage and limited public float and trading liquidity Potential litigation costs Potentially reduced access to capital markets given ongoing SEC investigation, shareholder lawsuits and controlled nature of the Company Given that Economou owns 83.4% of Common Shares outstanding, he could increase his ownership to 90.0% through open market purchases or share repurchases, and be in a position to implement a squeeze-out merger without approval from the Special Committee Sale of the Company to a Third Party Actively market the Company to third party buyers Potentially achieve a higher price for Common Shareholders Ability to realize operational and SG&A synergies Economou maintains voting control of the Company and has indicated he would not support other alternatives Potential for significant termination costs associated with existing management agreements $214.2mm of outstanding debt requires Economou to continue to beneficially own at least 50% of the Company’s issued and outstanding share capital or issued and outstanding voting share capital Open litigation and SEC investigation may impact sale process and price Sale of Individual Segments / Assets Realize proceeds for segment / asset sales Sale of segments / assets to best individual buyer theoretically maximizes value Requires the support of Economou as a practical matter Reduces potential upside realization depending on asset segment 7

To update section number manually, click in the text box, go to Numbering: II. DryShips Situation Analysis
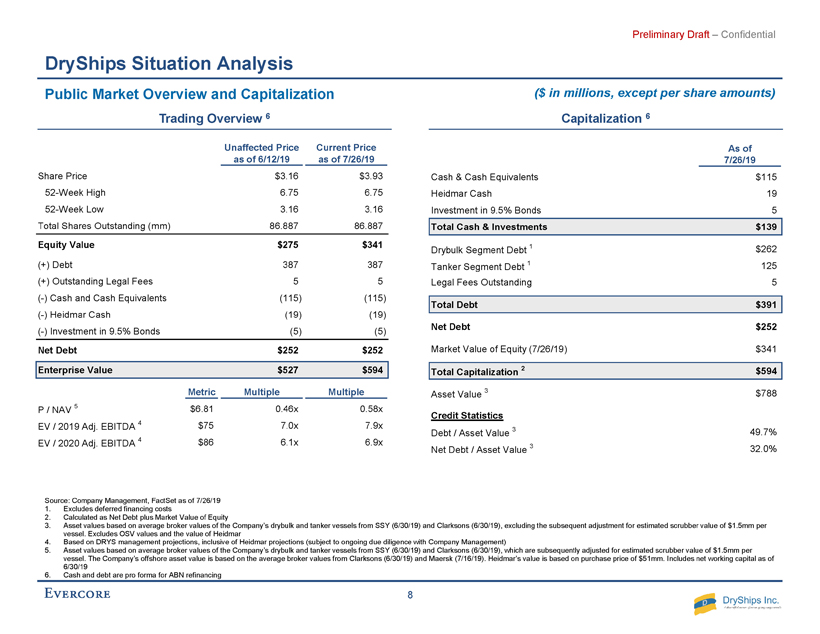
R - 38 G - 77 B - 130 R - 106 G - 151 B - 212 R - 235 G - 133 B - 33 R - 0 G - 134 B - 0 R - 250 G - 202 B - 0 R - 193 G - 2 B - 2 R - 100 G - 100 B - 100 R - 0 G - 105 B - 170 R - 236 G - 163 B - 33 R - 138 G - 173 B - 70 R - 255 G - 219 B - 67 R - 221 G - 70 B - 55 R - 191 G - 191 B - 191 R - 240 G - 181 B - 74 R - 189 G - 209 B - 143 R - 209 G - 226 B - 255 R - 106 G - 151 B - 212 R - 183 G - 205 B - 235 R - 217 G - 217 B - 217 R - 158 G - 198 B - 197 R - 200 G - 222 B - 222 R - 191 G - 191 B - 191 R - 38 G - 77 B - 130 R - 193 G - 2 B - 2 Accent colors/ contrasting colors: R - 0 G - 134 B - 0 R - 235 G - 133 B - 33 R - 250 G - 202 B - 0 R - 170 G - 54 B - 206 Excel chart colors: For basic graphics, diagrams: Light gray for default Word table fill, callout boxes and annotated boxes: R - 234 G - 234 B - 234 Word tables: 3pt border, R - 38,G - 77,B - 130 Highlight colors: R - 106 G - 151 B - 212 R - 235 G - 133 B - 33 R - 0 G - 134 B - 0 R - 250 G - 202 B - 0 R - 219 G - 230 B - 245 R - 245 G - 192 B - 139 R - 201 G - 255 B - 201 R - 255 G - 235 B - 151 Group 1: For text, wireframe, borders, colored bullets: Group 2: For fills and larger areas of colors, e.g., Word table fill: Secondary colored font: R - 0 G - 105 B - 170 Primary colored font: R - 38 G - 77 B - 130 Preliminary Draft – Confidential DryShips Situation Analysis Public Market Overview and Capitalization Source: Company Management, FactSet as of 7/26/19 1. Excludes deferred financing costs 2. Calculated as Net Debt plus Market Value of Equity 3. Asset values based on average broker values of the Company’s drybulk and tanker vessels from SSY (6/30/19) and Clarksons (6/30/19), excluding the subsequent adjustment for estimated scrubber value of $1.5mm per vessel. Excludes OSV values and the value of Heidmar 4. Based on DRYS management projections, inclusive of Heidmar projections (subject to ongoing due diligence with Company Management) 5. Asset values based on average broker values of the Company’s drybulk and tanker vessels from SSY (6/30/19) and Clarksons (6/30/19), which are subsequently adjusted for estimated scrubber value of $1.5mm per vessel . The Company’s offshore asset value is based on the average broker values from Clarksons (6/30/19) and Maersk (7/16/19). Heidmar’s value is based on purchase price of $ 51mm. Includes net working capital as of 6/30/19 6. Cash and debt are pro forma for ABN refinancing ($ in millions, except per share amounts ) Unaffected Price Current Price as of 6/12/19 as of 7/26/19 Share Price $3.16 $3.93 52-Week High 6.75 6.75 52-Week Low 3.16 3.16 Total Shares Outstanding (mm) 86.887 86.887 Equity Value $275 $341 (+) Debt 387 387 (+) Outstanding Legal Fees 5 5 (-) Cash and Cash Equivalents (115) (115) (-) Heidmar Cash (19) (19) (-) Investment in 9.5% Bonds (5) (5) Net Debt $252 $252 Enterprise Value $527 $594 Metric Multiple Multiple P / NAV 5 $6.81 0.46x 0.58x EV / 2019 Adj. EBITDA 4 $75 7.0x 7.9x EV / 2020 Adj. EBITDA 4 $86 6.1x 6.9x As of 7/26/19 Cash & Cash Equivalents $115 Heidmar Cash 19 Investment in 9.5% Bonds 5 Total Cash & Investments $139 Drybulk Segment Debt 1 $262 Tanker Segment Debt 1 125 Legal Fees Outstanding 5 Total Debt $391 Net Debt $252 Market Value of Equity (7/26/19) $341 Total Capitalization 2 $594 Asset Value 3 $788 Credit Statistics Debt / Asset Value 3 49.7% Net Debt / Asset Value 3 32.0% Trading Overview 6 Capitalization 6 8
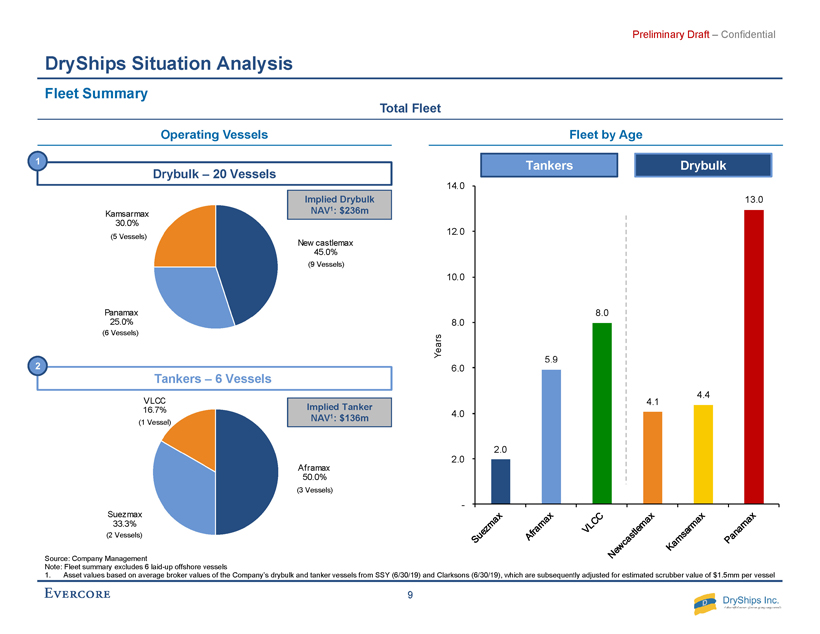
R - 38 G - 77 B - 130 R - 106 G - 151 B - 212 R - 235 G - 133 B - 33 R - 0 G - 134 B - 0 R - 250 G - 202 B - 0 R - 193 G - 2 B - 2 R - 100 G - 100 B - 100 R - 0 G - 105 B - 170 R - 236 G - 163 B - 33 R - 138 G - 173 B - 70 R - 255 G - 219 B - 67 R - 221 G - 70 B - 55 R - 191 G - 191 B - 191 R - 240 G - 181 B - 74 R - 189 G - 209 B - 143 R - 209 G - 226 B - 255 R - 106 G - 151 B - 212 R - 183 G - 205 B - 235 R - 217 G - 217 B - 217 R - 158 G - 198 B - 197 R - 200 G - 222 B - 222 R - 191 G - 191 B - 191 R - 38 G - 77 B - 130 R - 193 G - 2 B - 2 Accent colors/ contrasting colors: R - 0 G - 134 B - 0 R - 235 G - 133 B - 33 R - 250 G - 202 B - 0 R - 170 G - 54 B - 206 Excel chart colors: For basic graphics, diagrams: Light gray for default Word table fill, callout boxes and annotated boxes: R - 234 G - 234 B - 234 Word tables: 3pt border, R - 38,G - 77,B - 130 Highlight colors: R - 106 G - 151 B - 212 R - 235 G - 133 B - 33 R - 0 G - 134 B - 0 R - 250 G - 202 B - 0 R - 219 G - 230 B - 245 R - 245 G - 192 B - 139 R - 201 G - 255 B - 201 R - 255 G - 235 B - 151 Group 1: For text, wireframe, borders, colored bullets: Group 2: For fills and larger areas of colors, e.g., Word table fill: Secondary colored font: R - 0 G - 105 B - 170 Primary colored font: R - 38 G - 77 B - 130 Preliminary Draft – Confidential Aframax 50.0% Suezmax 33.3% VLCC 16.7% DryShips Situation Analysis Fleet Summary Source: Company Management Note: Fleet summary e xcludes 6 laid - up offshore vessels 1. Asset values based on average broker values of the Company’s drybulk and tanker vessels from SSY (6/30/19) and Clarksons (6/30/19), which are subsequently adjusted for estimated scrubber value of $1.5mm per vessel 2.0 5.9 8.0 4.1 4.4 13.0 - 2.0 4.0 6.0 8.0 10.0 12.0 14.0 Years Total Fleet Operating Vessels Fleet by Age Drybulk – 20 Vessels 1 Tankers – 6 Vessels 2 Newcastlemax 45.0% Panamax 25.0% Kamsarmax 30.0% ( 9 Vessels) ( 5 Vessels) ( 6 Vessels) Drybulk Tankers ( 2 Vessels) (1 Vessel) ( 3 Vessels) Implied Drybulk NAV 1 : $236m Implied Tanker NAV 1 : $136m 9

R - 38 G - 77 B - 130 R - 106 G - 151 B - 212 R - 235 G - 133 B - 33 R - 0 G - 134 B - 0 R - 250 G - 202 B - 0 R - 193 G - 2 B - 2 R - 100 G - 100 B - 100 R - 0 G - 105 B - 170 R - 236 G - 163 B - 33 R - 138 G - 173 B - 70 R - 255 G - 219 B - 67 R - 221 G - 70 B - 55 R - 191 G - 191 B - 191 R - 240 G - 181 B - 74 R - 189 G - 209 B - 143 R - 209 G - 226 B - 255 R - 106 G - 151 B - 212 R - 183 G - 205 B - 235 R - 217 G - 217 B - 217 R - 158 G - 198 B - 197 R - 200 G - 222 B - 222 R - 191 G - 191 B - 191 R - 38 G - 77 B - 130 R - 193 G - 2 B - 2 Accent colors/ contrasting colors: R - 0 G - 134 B - 0 R - 235 G - 133 B - 33 R - 250 G - 202 B - 0 R - 170 G - 54 B - 206 Excel chart colors: For basic graphics, diagrams: Light gray for default Word table fill, callout boxes and annotated boxes: R - 234 G - 234 B - 234 Word tables: 3pt border, R - 38,G - 77,B - 130 Highlight colors: R - 106 G - 151 B - 212 R - 235 G - 133 B - 33 R - 0 G - 134 B - 0 R - 250 G - 202 B - 0 R - 219 G - 230 B - 245 R - 245 G - 192 B - 139 R - 201 G - 255 B - 201 R - 255 G - 235 B - 151 Group 1: For text, wireframe, borders, colored bullets: Group 2: For fills and larger areas of colors, e.g., Word table fill: Secondary colored font: R - 0 G - 105 B - 170 Primary colored font: R - 38 G - 77 B - 130 Preliminary Draft – Confidential DryShips Situation Analysis Detailed Fleet List Source: Company Management 1. Weighted by deadweight tonnes, as of 6/30/19 # Offshore fleet Age Vessel Type DWT Charterers Daily Hire Expiry 1 Crescendo 7 PSV 1,457 NA NA NA 2 Colorado 7 PSV 1,430 NA NA NA 3 Jubilee 7 OSRV 1,313 NA NA NA 4 Emblem 6 OSRV 1,362 NA NA NA 5 Indigo 6 OSRV 1,401 NA NA NA 6 Jacaranda 7 OSRV 1,360 NA NA NA Total / Average 7 8,323 # Tanker Fleet Age Vessel Type DWT Charterers Daily Hire Expiry 1 Shiraga 8 VLCC 320,105 NA Spot NA 2 Samsara 2 Suezmax 158,000 Clients of TMS $18,000 Mar-22 3 Marfa 2 Suezmax 159,513 NA Spot NA 4 Balla 2 Aframax 113,600 NA Spot NA 5 Stamos 7 Aframax 115,666 NA Spot NA 6 Botafogo 9 Aframax 106,892 NA Spot NA Total / Average 5 973,776 Dry Bulk Fleet # Drybulk Fleet Age Vessel Type DWT Charterers Daily Hire Expiry 1 Netadola 2 Newcastlemax 208,998 TMS Dry Index Linked Open Period 2 Xanadu 2 Newcastlemax 208,827 TMS Dry Index Linked Open Period 3 Conquistador 3 Newcastlemax 209,090 TMS Dry Index Linked Open Period 4 Pink Sands 3 Newcastlemax 208,931 TMS Dry Index Linked Open Period 5 Judd 4 Newcastlemax 205,797 Koch Index Linked Sep-19 to Oct-19 6 Marini 5 Newcastlemax 205,854 TMS Dry Index Linked Oct-19 to Dec-19 7 Huahine 6 Newcastlemax 206,037 Pacific Bulk Index Linked Sep-19 to Oct-19 8 Morandi 6 Newcastlemax 205,854 Koch Index Linked Aug-19 to Sep-19 9 Bacon 6 Newcastlemax 205,170 Swissmarine Index Linked Sep-19 to Oct-19 10 Kelly 2 Kamsarmax 81,600 Spot 11 Castellani 5 Kamsarmax 82,129 Spot 12 Nasaka 5 Kamsarmax 81,918 Spot 13 Valadon 5 Kamsarmax 81,129 Spot 14 Matisse 5 Kamsarmax 81,129 Spot 15 Raraka 7 Panamax 76,037 Spot 16 Rapallo 10 Panamax 75,123 Spot 17 Majorca 14 Panamax 74,477 Spot 18 Catalina 14 Panamax 74,432 Spot 19 Ligari 15 Panamax 75,583 Spot 20 Levanto 18 Panamax 73,925 Spot Total / Average 6 2,722,040 1 1 1 Tanker Fleet Offshore Fleet Earliest Redelivery: March 2022 Latest Redelivery: May 2025 10
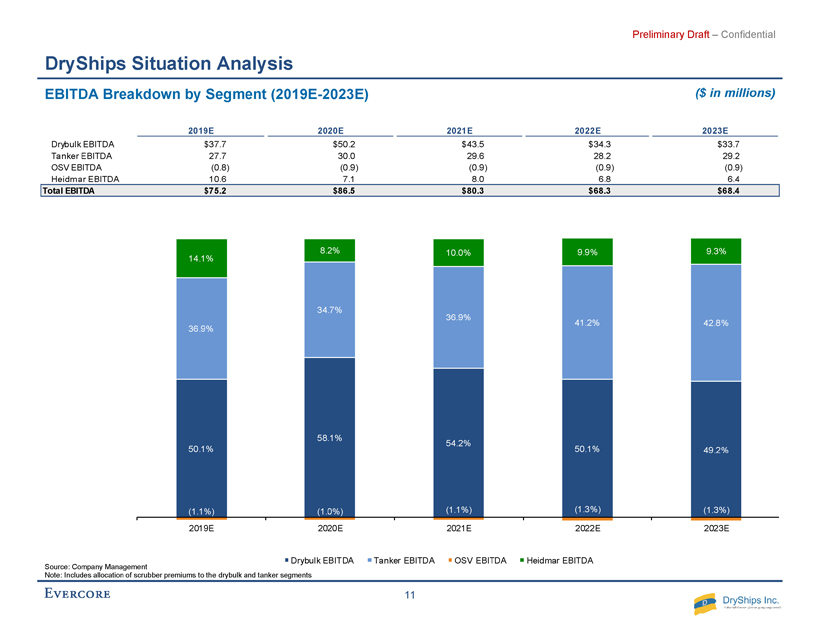
R - 38 G - 77 B - 130 R - 106 G - 151 B - 212 R - 235 G - 133 B - 33 R - 0 G - 134 B - 0 R - 250 G - 202 B - 0 R - 193 G - 2 B - 2 R - 100 G - 100 B - 100 R - 0 G - 105 B - 170 R - 236 G - 163 B - 33 R - 138 G - 173 B - 70 R - 255 G - 219 B - 67 R - 221 G - 70 B - 55 R - 191 G - 191 B - 191 R - 240 G - 181 B - 74 R - 189 G - 209 B - 143 R - 209 G - 226 B - 255 R - 106 G - 151 B - 212 R - 183 G - 205 B - 235 R - 217 G - 217 B - 217 R - 158 G - 198 B - 197 R - 200 G - 222 B - 222 R - 191 G - 191 B - 191 R - 38 G - 77 B - 130 R - 193 G - 2 B - 2 Accent colors/ contrasting colors: R - 0 G - 134 B - 0 R - 235 G - 133 B - 33 R - 250 G - 202 B - 0 R - 170 G - 54 B - 206 Excel chart colors: For basic graphics, diagrams: Light gray for default Word table fill, callout boxes and annotated boxes: R - 234 G - 234 B - 234 Word tables: 3pt border, R - 38,G - 77,B - 130 Highlight colors: R - 106 G - 151 B - 212 R - 235 G - 133 B - 33 R - 0 G - 134 B - 0 R - 250 G - 202 B - 0 R - 219 G - 230 B - 245 R - 245 G - 192 B - 139 R - 201 G - 255 B - 201 R - 255 G - 235 B - 151 Group 1: For text, wireframe, borders, colored bullets: Group 2: For fills and larger areas of colors, e.g., Word table fill: Secondary colored font: R - 0 G - 105 B - 170 Primary colored font: R - 38 G - 77 B - 130 Preliminary Draft – Confidential DryShips Situation Analysis EBITDA Breakdown by Segment (2019E - 2023E) ($ in millions ) Source: Company Management Note: Includes allocation of scrubber premiums to the drybulk and tanker segments 2019E 2020E 2021E 2022E 2023E Drybulk EBITDA $37.7 $50.2 $43.5 $34.3 $33.7 Tanker EBITDA 27.7 30.0 29.6 28.2 29.2 OSV EBITDA (0.8) (0.9) (0.9) (0.9) (0.9) Heidmar EBITDA 10.6 7.1 8.0 6.8 6.4 Total EBITDA $75.2 $86.5 $80.3 $68.3 $68.4 50.1% 58.1% 54.2% 50.1% 49.2% 36.9% 34.7% 36.9% 41.2% 42.8% (1.1%) (1.0%) (1.1%) (1.3%) (1.3%) 14.1% 8.2% 10.0% 9.9% 9.3% (10.0%) 10.0% 30.0% 50.0% 70.0% 90.0% 110.0% 2019E 2020E 2021E 2022E 2023E Drybulk EBITDA Tanker EBITDA OSV EBITDA Heidmar EBITDA 11
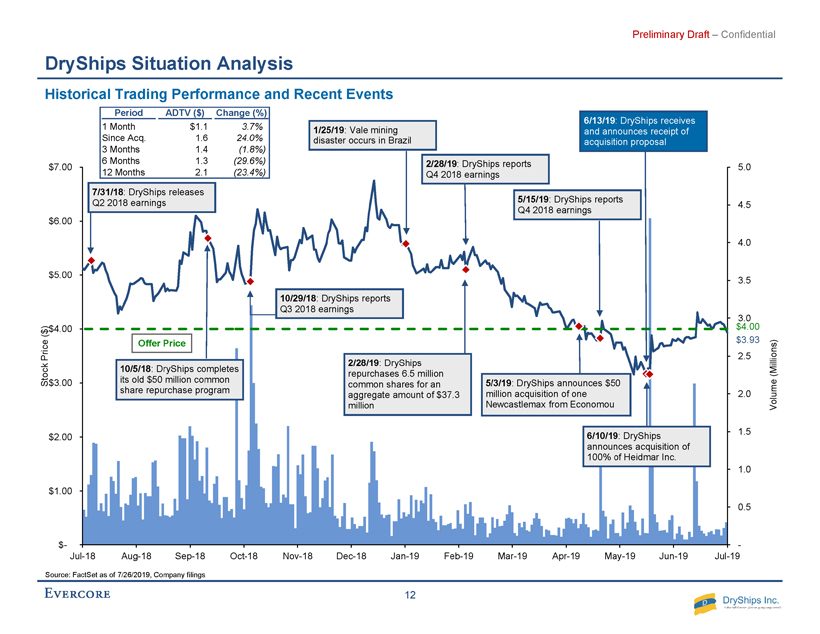
R - 38 G - 77 B - 130 R - 106 G - 151 B - 212 R - 235 G - 133 B - 33 R - 0 G - 134 B - 0 R - 250 G - 202 B - 0 R - 193 G - 2 B - 2 R - 100 G - 100 B - 100 R - 0 G - 105 B - 170 R - 236 G - 163 B - 33 R - 138 G - 173 B - 70 R - 255 G - 219 B - 67 R - 221 G - 70 B - 55 R - 191 G - 191 B - 191 R - 240 G - 181 B - 74 R - 189 G - 209 B - 143 R - 209 G - 226 B - 255 R - 106 G - 151 B - 212 R - 183 G - 205 B - 235 R - 217 G - 217 B - 217 R - 158 G - 198 B - 197 R - 200 G - 222 B - 222 R - 191 G - 191 B - 191 R - 38 G - 77 B - 130 R - 193 G - 2 B - 2 Accent colors/ contrasting colors: R - 0 G - 134 B - 0 R - 235 G - 133 B - 33 R - 250 G - 202 B - 0 R - 170 G - 54 B - 206 Excel chart colors: For basic graphics, diagrams: Light gray for default Word table fill, callout boxes and annotated boxes: R - 234 G - 234 B - 234 Word tables: 3pt border, R - 38,G - 77,B - 130 Highlight colors: R - 106 G - 151 B - 212 R - 235 G - 133 B - 33 R - 0 G - 134 B - 0 R - 250 G - 202 B - 0 R - 219 G - 230 B - 245 R - 245 G - 192 B - 139 R - 201 G - 255 B - 201 R - 255 G - 235 B - 151 Group 1: For text, wireframe, borders, colored bullets: Group 2: For fills and larger areas of colors, e.g., Word table fill: Secondary colored font: R - 0 G - 105 B - 170 Primary colored font: R - 38 G - 77 B - 130 Preliminary Draft – Confidential $3.93 $4.00 - 0.5 1.0 1.5 2.0 2.5 3.0 3.5 4.0 4.5 5.0 $- $1.00 $2.00 $3.00 $4.00 $5.00 $6.00 $7.00 Jul-18 Aug-18 Sep-18 Oct-18 Nov-18 Dec-18 Jan-19 Feb-19 Mar-19 Apr-19 May-19 Jun-19 Jul-19 Volume (Millions) Stock Price ($) DryShips Situation Analysis Historical Trading Performance and Recent Events Source: FactSet as of 7/26/2019, Company filings Period ADTV ($) Change (%) 1 Month $1.1 3.7% Since Acq. 1.6 24.0% 3 Months 1.4 (1.8%) 6 Months 1.3 (29.6%) 12 Months 2.1 (23.4%) 2/28/19 : DryShips reports Q4 2018 earnings 7/31/18 : DryShips releases Q2 2018 earnings 10/29/18 : DryShips reports Q3 2018 earnings 5/15/19 : DryShips reports Q4 2018 earnings 6/10/19 : DryShips announces acquisition of 100% of Heidmar Inc. 2/28/19 : DryShips repurchases 6.5 million common shares for an aggregate amount of $37.3 million 10/5/18 : DryShips completes its old $50 million common share repurchase program 6/13/19 : DryShips receives and announces receipt of acquisition proposal 1/25/19 : Vale mining disaster occurs in Brazil Offer Price 5/3/19 : DryShips announces $ 50 million acquisition of one Newcastlemax from Economou 12

R - 38 G - 77 B - 130 R - 106 G - 151 B - 212 R - 235 G - 133 B - 33 R - 0 G - 134 B - 0 R - 250 G - 202 B - 0 R - 193 G - 2 B - 2 R - 100 G - 100 B - 100 R - 0 G - 105 B - 170 R - 236 G - 163 B - 33 R - 138 G - 173 B - 70 R - 255 G - 219 B - 67 R - 221 G - 70 B - 55 R - 191 G - 191 B - 191 R - 240 G - 181 B - 74 R - 189 G - 209 B - 143 R - 209 G - 226 B - 255 R - 106 G - 151 B - 212 R - 183 G - 205 B - 235 R - 217 G - 217 B - 217 R - 158 G - 198 B - 197 R - 200 G - 222 B - 222 R - 191 G - 191 B - 191 R - 38 G - 77 B - 130 R - 193 G - 2 B - 2 Accent colors/ contrasting colors: R - 0 G - 134 B - 0 R - 235 G - 133 B - 33 R - 250 G - 202 B - 0 R - 170 G - 54 B - 206 Excel chart colors: For basic graphics, diagrams: Light gray for default Word table fill, callout boxes and annotated boxes: R - 234 G - 234 B - 234 Word tables: 3pt border, R - 38,G - 77,B - 130 Highlight colors: R - 106 G - 151 B - 212 R - 235 G - 133 B - 33 R - 0 G - 134 B - 0 R - 250 G - 202 B - 0 R - 219 G - 230 B - 245 R - 245 G - 192 B - 139 R - 201 G - 255 B - 201 R - 255 G - 235 B - 151 Group 1: For text, wireframe, borders, colored bullets: Group 2: For fills and larger areas of colors, e.g., Word table fill: Secondary colored font: R - 0 G - 105 B - 170 Primary colored font: R - 38 G - 77 B - 130 Preliminary Draft – Confidential DryShips Situation Analysis Historical Trading Performance Subsequent to Acquisition Proposal Source: FactSet as of 7/26/2019, Company filings $3.93 $4.00 - 0.5 1.0 1.5 2.0 2.5 3.0 3.5 4.0 4.5 5.0 $2.50 $3.00 $3.50 $4.00 $4.50 $5.00 6/12 6/15 6/18 6/21 6/24 6/27 6/30 7/3 7/6 7/9 7/12 7/15 7/18 7/22 7/25 Volume (Millions) Stock Price ($) 6/13/19 : DryShips receives and announces receipt of acquisition proposal Offer Price 7/8/19 : DryShips announces appointment by Special Committee of legal and financial advisors 13

R - 38 G - 77 B - 130 R - 106 G - 151 B - 212 R - 235 G - 133 B - 33 R - 0 G - 134 B - 0 R - 250 G - 202 B - 0 R - 193 G - 2 B - 2 R - 100 G - 100 B - 100 R - 0 G - 105 B - 170 R - 236 G - 163 B - 33 R - 138 G - 173 B - 70 R - 255 G - 219 B - 67 R - 221 G - 70 B - 55 R - 191 G - 191 B - 191 R - 240 G - 181 B - 74 R - 189 G - 209 B - 143 R - 209 G - 226 B - 255 R - 106 G - 151 B - 212 R - 183 G - 205 B - 235 R - 217 G - 217 B - 217 R - 158 G - 198 B - 197 R - 200 G - 222 B - 222 R - 191 G - 191 B - 191 R - 38 G - 77 B - 130 R - 193 G - 2 B - 2 Accent colors/ contrasting colors: R - 0 G - 134 B - 0 R - 235 G - 133 B - 33 R - 250 G - 202 B - 0 R - 170 G - 54 B - 206 Excel chart colors: For basic graphics, diagrams: Light gray for default Word table fill, callout boxes and annotated boxes: R - 234 G - 234 B - 234 Word tables: 3pt border, R - 38,G - 77,B - 130 Highlight colors: R - 106 G - 151 B - 212 R - 235 G - 133 B - 33 R - 0 G - 134 B - 0 R - 250 G - 202 B - 0 R - 219 G - 230 B - 245 R - 245 G - 192 B - 139 R - 201 G - 255 B - 201 R - 255 G - 235 B - 151 Group 1: For text, wireframe, borders, colored bullets: Group 2: For fills and larger areas of colors, e.g., Word table fill: Secondary colored font: R - 0 G - 105 B - 170 Primary colored font: R - 38 G - 77 B - 130 Preliminary Draft – Confidential (23.4%) (23.7%) 13.4% (80.0%) (60.0%) (40.0%) (20.0%) 0.0% 20.0% 40.0% Jul-18 Aug-18 Sep-18 Oct-18 Nov-18 Dec-18 Jan-19 Feb-19 Mar-19 Apr-19 May-19 Jun-19 Jul-19 DryShips Drybulk Index Baltic Dry Index DryShips Situation Analysis Indexed Price Performance Relative to Drybulk Composite and Baltic Dry Index Source: FactSet as of 7/26/2019 , Company filings 1. Composite based on Eaglebulk , Star Bulk, Safe Bulkers, Scorpio Bulkers, Golden Ocean, Diana Shipping, Genco 1 1/25/19 : Vale mining disaster occurs in Brazil 6/13/19 : DryShips receives and announces receipt of acquisition proposal DryShips Drybulk Index Baltic Dry Index Period Change (%) Change (%) Change (%) LTM (23.4%) (23.7%) 13.4% Last 6 Months (29.6%) 14.0% 114.0% Last 3 Months (1.8%) 17.4% 117.9% Last 1 Month 3.7% 20.0% 47.1% Post-Proposal 24.4% 34.3% 79.4% YTD (30.4%) 11.8% 52.4% 14
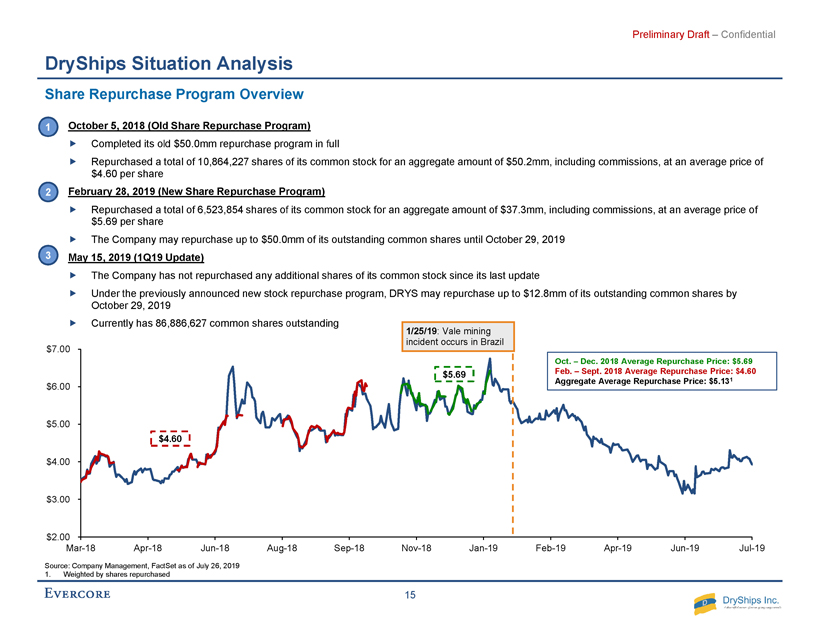
R - 38 G - 77 B - 130 R - 106 G - 151 B - 212 R - 235 G - 133 B - 33 R - 0 G - 134 B - 0 R - 250 G - 202 B - 0 R - 193 G - 2 B - 2 R - 100 G - 100 B - 100 R - 0 G - 105 B - 170 R - 236 G - 163 B - 33 R - 138 G - 173 B - 70 R - 255 G - 219 B - 67 R - 221 G - 70 B - 55 R - 191 G - 191 B - 191 R - 240 G - 181 B - 74 R - 189 G - 209 B - 143 R - 209 G - 226 B - 255 R - 106 G - 151 B - 212 R - 183 G - 205 B - 235 R - 217 G - 217 B - 217 R - 158 G - 198 B - 197 R - 200 G - 222 B - 222 R - 191 G - 191 B - 191 R - 38 G - 77 B - 130 R - 193 G - 2 B - 2 Accent colors/ contrasting colors: R - 0 G - 134 B - 0 R - 235 G - 133 B - 33 R - 250 G - 202 B - 0 R - 170 G - 54 B - 206 Excel chart colors: For basic graphics, diagrams: Light gray for default Word table fill, callout boxes and annotated boxes: R - 234 G - 234 B - 234 Word tables: 3pt border, R - 38,G - 77,B - 130 Highlight colors: R - 106 G - 151 B - 212 R - 235 G - 133 B - 33 R - 0 G - 134 B - 0 R - 250 G - 202 B - 0 R - 219 G - 230 B - 245 R - 245 G - 192 B - 139 R - 201 G - 255 B - 201 R - 255 G - 235 B - 151 Group 1: For text, wireframe, borders, colored bullets: Group 2: For fills and larger areas of colors, e.g., Word table fill: Secondary colored font: R - 0 G - 105 B - 170 Primary colored font: R - 38 G - 77 B - 130 Preliminary Draft – Confidential $2.00 $3.00 $4.00 $5.00 $6.00 $7.00 Mar-18 Apr-18 Jun-18 Aug-18 Sep-18 Nov-18 Jan-19 Feb-19 Apr-19 Jun-19 Jul-19 DryShips Situation Analysis Share Repurchase Program Overview Source: Company Management, FactSet as of July 26, 2019 1. Weighted by shares repurchased Oct. – Dec. 2018 Average Repurchase Price : $ 5.69 Feb. – Sept. 2018 Average Repurchase Price: $4.60 Aggregate Average Repurchase Price: $5.13 1 October 5, 2018 (Old Share Repurchase Program) Completed its old $50.0mm repurchase program in full Repurchased a total of 10,864,227 shares of its common stock for an aggregate amount of $50.2mm, including commissions, at an av erage price of $4.60 per share February 28, 2019 (New Share Repurchase Program) Repurchased a total of 6,523,854 shares of its common stock for an aggregate amount of $ 37.3mm, including commissions, at an average price of $5.69 per share The Company may repurchase up to $50.0mm of its outstanding common shares until October 29, 2019 May 15, 2019 (1Q19 Update) The Company has not repurchased any additional shares of its common stock since its last update Under the previously announced new stock repurchase program, DRYS may repurchase up to $12.8mm of its outstanding common shar es by October 29, 2019 Currently has 86,886,627 common shares outstanding 1 2 3 $4.60 $5.69 1/25/19 : Vale mining incident occurs in Brazil 15
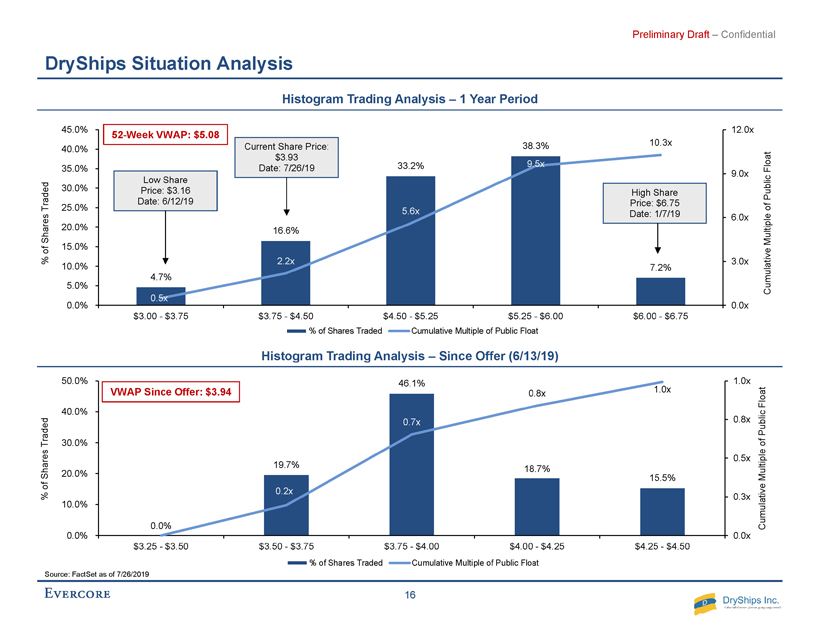
R - 38 G - 77 B - 130 R - 106 G - 151 B - 212 R - 235 G - 133 B - 33 R - 0 G - 134 B - 0 R - 250 G - 202 B - 0 R - 193 G - 2 B - 2 R - 100 G - 100 B - 100 R - 0 G - 105 B - 170 R - 236 G - 163 B - 33 R - 138 G - 173 B - 70 R - 255 G - 219 B - 67 R - 221 G - 70 B - 55 R - 191 G - 191 B - 191 R - 240 G - 181 B - 74 R - 189 G - 209 B - 143 R - 209 G - 226 B - 255 R - 106 G - 151 B - 212 R - 183 G - 205 B - 235 R - 217 G - 217 B - 217 R - 158 G - 198 B - 197 R - 200 G - 222 B - 222 R - 191 G - 191 B - 191 R - 38 G - 77 B - 130 R - 193 G - 2 B - 2 Accent colors/ contrasting colors: R - 0 G - 134 B - 0 R - 235 G - 133 B - 33 R - 250 G - 202 B - 0 R - 170 G - 54 B - 206 Excel chart colors: For basic graphics, diagrams: Light gray for default Word table fill, callout boxes and annotated boxes: R - 234 G - 234 B - 234 Word tables: 3pt border, R - 38,G - 77,B - 130 Highlight colors: R - 106 G - 151 B - 212 R - 235 G - 133 B - 33 R - 0 G - 134 B - 0 R - 250 G - 202 B - 0 R - 219 G - 230 B - 245 R - 245 G - 192 B - 139 R - 201 G - 255 B - 201 R - 255 G - 235 B - 151 Group 1: For text, wireframe, borders, colored bullets: Group 2: For fills and larger areas of colors, e.g., Word table fill: Secondary colored font: R - 0 G - 105 B - 170 Primary colored font: R - 38 G - 77 B - 130 Preliminary Draft – Confidential 4.7% 16.6% 33.2% 38.3% 7.2% 0.5x 2.2x 5.6x 9.5x 10.3x 0.0x 3.0x 6.0x 9.0x 12.0x 0.0% 5.0% 10.0% 15.0% 20.0% 25.0% 30.0% 35.0% 40.0% 45.0% $3.00 - $3.75 $3.75 - $4.50 $4.50 - $5.25 $5.25 - $6.00 $6.00 - $6.75 Cumulative Multiple of Public Float % of Shares Traded % of Shares Traded Cumulative Multiple of Public Float DryShips Situation Analysis Source: FactSet as of 7/26/2019 Low Share Price: $3.16 Date: 6/12/19 Current Share Price: $3.93 Date: 7/26/19 High Share Price: $6.75 Date: 1/7/19 Histogram Trading Analysis – 1 Year Period Histogram Trading Analysis – Since Offer (6/13/19) 0.0% 19.7% 46.1% 18.7% 15.5% 0.2x 0.7x 0.8x 1.0x 0.0x 0.3x 0.5x 0.8x 1.0x 0.0% 10.0% 20.0% 30.0% 40.0% 50.0% $3.25 - $3.50 $3.50 - $3.75 $3.75 - $4.00 $4.00 - $4.25 $4.25 - $4.50 Cumulative Multiple of Public Float % of Shares Traded % of Shares Traded Cumulative Multiple of Public Float 16 52 - Week VWAP: $5.08 VWAP Since Offer: $3.94
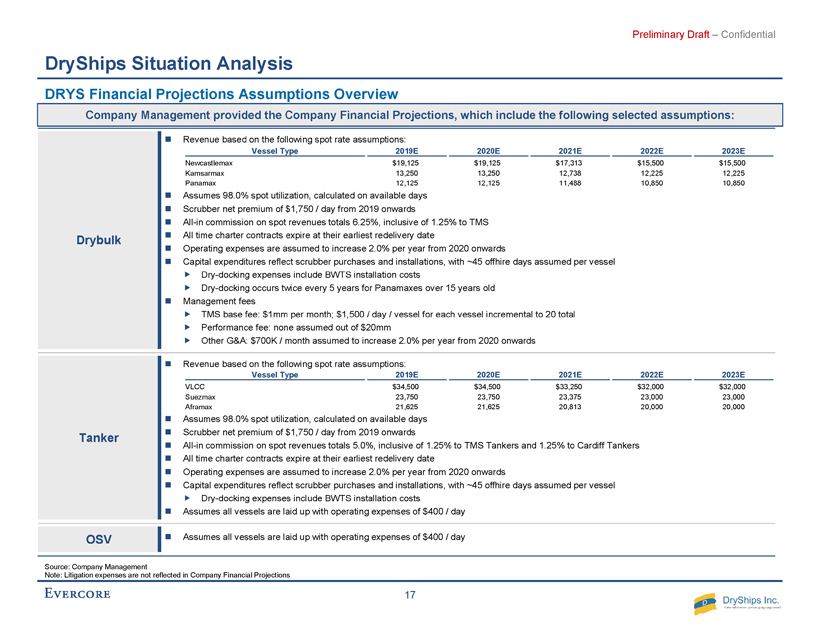
R - 38 G - 77 B - 130 R - 106 G - 151 B - 212 R - 235 G - 133 B - 33 R - 0 G - 134 B - 0 R - 250 G - 202 B - 0 R - 193 G - 2 B - 2 R - 100 G - 100 B - 100 R - 0 G - 105 B - 170 R - 236 G - 163 B - 33 R - 138 G - 173 B - 70 R - 255 G - 219 B - 67 R - 221 G - 70 B - 55 R - 191 G - 191 B - 191 R - 240 G - 181 B - 74 R - 189 G - 209 B - 143 R - 209 G - 226 B - 255 R - 106 G - 151 B - 212 R - 183 G - 205 B - 235 R - 217 G - 217 B - 217 R - 158 G - 198 B - 197 R - 200 G - 222 B - 222 R - 191 G - 191 B - 191 R - 38 G - 77 B - 130 R - 193 G - 2 B - 2 Accent colors/ contrasting colors: R - 0 G - 134 B - 0 R - 235 G - 133 B - 33 R - 250 G - 202 B - 0 R - 170 G - 54 B - 206 Excel chart colors: For basic graphics, diagrams: Light gray for default Word table fill, callout boxes and annotated boxes: R - 234 G - 234 B - 234 Word tables: 3pt border, R - 38,G - 77,B - 130 Highlight colors: R - 106 G - 151 B - 212 R - 235 G - 133 B - 33 R - 0 G - 134 B - 0 R - 250 G - 202 B - 0 R - 219 G - 230 B - 245 R - 245 G - 192 B - 139 R - 201 G - 255 B - 201 R - 255 G - 235 B - 151 Group 1: For text, wireframe, borders, colored bullets: Group 2: For fills and larger areas of colors, e.g., Word table fill: Secondary colored font: R - 0 G - 105 B - 170 Primary colored font: R - 38 G - 77 B - 130 Preliminary Draft – Confidential DryShips Situation Analysis DRYS Financial Projections Assumptions Overview Source: Company Management Note: Litigation expenses are not reflected in Company Financial Projections Drybulk Revenue based on the following spot rate assumptions: Assumes 98.0% spot utilization, calculated on available days Scrubber net premium of $1,750 / day from 2019 onwards All-in commission on spot revenues totals 6.25%, inclusive of 1.25% to TMS All time charter contracts expire at their earliest redelivery date Operating expenses are assumed to increase 2.0% per year from 2020 onwards Capital expenditures reflect scrubber purchases and installations, with ~45 offhire days assumed per vessel Dry-docking expenses include BWTS installation costs Dry-docking occurs twice every 5 years for Panamaxes over 15 years old Management fees TMS base fee: $1mm per month; $1,500 / day / vessel for each vessel incremental to 20 total Performance fee: none assumed out of $20mm Other G&A: $700K / month assumed to increase 2.0% per year from 2020 onwards Tanker Revenue based on the following spot rate assumptions: Assumes 98.0% spot utilization, calculated on available days Scrubber net premium of $1,750 / day from 2019 onwards All-in commission on spot revenues totals 5.0%, inclusive of 1.25% to TMS Tankers and 1.25% to Cardiff Tankers All time charter contracts expire at their earliest redelivery date Operating expenses are assumed to increase 2.0% per year from 2020 onwards Capital expenditures reflect scrubber purchases and installations, with ~45 offhire days assumed per vessel Dry-docking expenses include BWTS installation costs Assumes all vessels are laid up with operating expenses of $400 / day OSV Assumes all vessels are laid up with operating expenses of $400 / day Vessel Type 2019E 2020E 2021E 2022E 2023E VLCC $34,500 $34,500 $33,250 $32,000 $32,000 Suezmax 23,750 23,750 23,375 23,000 23,000 Aframax 21,625 21,625 20,813 20,000 20,000 Vessel Type 2019E 2020E 2021E 2022E 2023E Newcastlemax $19,125 $19,125 $17,313 $15,500 $15,500 Kamsarmax 13,250 13,250 12,738 12,225 12,225 Panamax 12,125 12,125 11,488 10,850 10,850 Company Management provided the Company Financial Projections, which include the following selected assumptions: 17

R - 38 G - 77 B - 130 R - 106 G - 151 B - 212 R - 235 G - 133 B - 33 R - 0 G - 134 B - 0 R - 250 G - 202 B - 0 R - 193 G - 2 B - 2 R - 100 G - 100 B - 100 R - 0 G - 105 B - 170 R - 236 G - 163 B - 33 R - 138 G - 173 B - 70 R - 255 G - 219 B - 67 R - 221 G - 70 B - 55 R - 191 G - 191 B - 191 R - 240 G - 181 B - 74 R - 189 G - 209 B - 143 R - 209 G - 226 B - 255 R - 106 G - 151 B - 212 R - 183 G - 205 B - 235 R - 217 G - 217 B - 217 R - 158 G - 198 B - 197 R - 200 G - 222 B - 222 R - 191 G - 191 B - 191 R - 38 G - 77 B - 130 R - 193 G - 2 B - 2 Accent colors/ contrasting colors: R - 0 G - 134 B - 0 R - 235 G - 133 B - 33 R - 250 G - 202 B - 0 R - 170 G - 54 B - 206 Excel chart colors: For basic graphics, diagrams: Light gray for default Word table fill, callout boxes and annotated boxes: R - 234 G - 234 B - 234 Word tables: 3pt border, R - 38,G - 77,B - 130 Highlight colors: R - 106 G - 151 B - 212 R - 235 G - 133 B - 33 R - 0 G - 134 B - 0 R - 250 G - 202 B - 0 R - 219 G - 230 B - 245 R - 245 G - 192 B - 139 R - 201 G - 255 B - 201 R - 255 G - 235 B - 151 Group 1: For text, wireframe, borders, colored bullets: Group 2: For fills and larger areas of colors, e.g., Word table fill: Secondary colored font: R - 0 G - 105 B - 170 Primary colored font: R - 38 G - 77 B - 130 Preliminary Draft – Confidential DryShips Situation Analysis Heidmar Financial Projections Assumptions Overview (Subject to Ongoing Due Diligence) Source: Company Management Heidmar Assumes the following average vessel counts per pool over the projection period : Assumes the same spot rate assumptions as the aforementioned Tanker segment Assumes a 1.9% annual increase in wages, benefits and non - compensation G&A Assumes a commission income on TCE rates per pool equal to 2.8% daily net income per pool for Blue Find Tanker, Sigma Tanker, Star Tanker and the Seawolf Tanker pools, respectively Assumes commercial management fee of $387 per vessel day Assumed an annual capital expenditure equal to Heidmar’s annual depreciation expense Assumed an annual working capital requirement equal to the average of Heidmar’s working capital over the last 5 years (10.5% on commercial management operations) Assumed salaries and non - compensated expenses to increase 1.73% annually, based on IMF average CPI forecasts Assumed $1.0mm for annual employee compensation bonuses In terms of the managed and operated fleet, assumed three additional terminations of VLCCs managed under the Seawolf Tanker pool in FY19 based on recent upturn of the time charter market; for 2020 - 2023, assumed fleet growth of 1 VLCC managed per year under the Seawolf Tanker pool Assumed an annual increase of 2.3% in audit and professional fees from 1Q19 and a vessels / employee ratio equal to Heidmar’s three - year historical average of 1.2x Pool Vessel Type 2018A Q2.19 - Q1.20 Q2.20 - Q1.21 Q2.21 - Q1.22 Q2.22 - Q1.23 Q2.23 - Q1.24 Seawolf VLCC 9.6 3.3 4.2 5.2 6.2 7.0 Blue Fin Suezmax 22.7 24.0 24.0 24.0 24.0 24.0 Sigma Aframax 44.6 33.4 33.0 33.0 33.0 33.0 Star Panamax 2.3 1.0 1.0 1.0 1.0 1.0 Total 79.2 61.7 62.2 63.2 64.2 65.0 Company Management provided the Heidmar Standalone Financial Projections, which include the following selected assumptions: 18

R - 38 G - 77 B - 130 R - 106 G - 151 B - 212 R - 235 G - 133 B - 33 R - 0 G - 134 B - 0 R - 250 G - 202 B - 0 R - 193 G - 2 B - 2 R - 100 G - 100 B - 100 R - 0 G - 105 B - 170 R - 236 G - 163 B - 33 R - 138 G - 173 B - 70 R - 255 G - 219 B - 67 R - 221 G - 70 B - 55 R - 191 G - 191 B - 191 R - 240 G - 181 B - 74 R - 189 G - 209 B - 143 R - 209 G - 226 B - 255 R - 106 G - 151 B - 212 R - 183 G - 205 B - 235 R - 217 G - 217 B - 217 R - 158 G - 198 B - 197 R - 200 G - 222 B - 222 R - 191 G - 191 B - 191 R - 38 G - 77 B - 130 R - 193 G - 2 B - 2 Accent colors/ contrasting colors: R - 0 G - 134 B - 0 R - 235 G - 133 B - 33 R - 250 G - 202 B - 0 R - 170 G - 54 B - 206 Excel chart colors: For basic graphics, diagrams: Light gray for default Word table fill, callout boxes and annotated boxes: R - 234 G - 234 B - 234 Word tables: 3pt border, R - 38,G - 77,B - 130 Highlight colors: R - 106 G - 151 B - 212 R - 235 G - 133 B - 33 R - 0 G - 134 B - 0 R - 250 G - 202 B - 0 R - 219 G - 230 B - 245 R - 245 G - 192 B - 139 R - 201 G - 255 B - 201 R - 255 G - 235 B - 151 Group 1: For text, wireframe, borders, colored bullets: Group 2: For fills and larger areas of colors, e.g., Word table fill: Secondary colored font: R - 0 G - 105 B - 170 Primary colored font: R - 38 G - 77 B - 130 Preliminary Draft – Confidential DryShips Situation Analysis Spot Rate Comparison Source: Company Management, Wall Street research, Clarksons Note: Assumes Newcastlemax vessels realize a 20% rate premium to Capesize vessels 1. Assumed a 20% premium on Panamax rates for Kamsarmaxes 2. Based on Evercore ISI, J.P.Morgan , Morgan Stanley, Jefferies and Pareto Securities 3. Used a 82,000 DWT Panamax rate as proxy for Kamsarmaxes ; data for proxy only goes back until 2014 $20,000 $14,000 $12,000 $13,920 $10,830 $9,025 $19,800 $14,640 $12,200 $17,883 $10,268 $10,477 $ - $5,000 $10,000 $15,000 $20,000 $25,000 Newcastlemax Kamsarmax Panamax Management FFA Wall Street Research Average Clarksons 5-Year Average Clarksons 10-Year Average 1, 2 1 3 Drybulk 2019E 2020E Tankers 1 2 $19,125 $13,250 $12,125 $18,150 $11,836 $9,863 $15,168 $12,826 $10,688 $16,949 $10,353 $10,436 $ - $5,000 $10,000 $15,000 $20,000 $25,000 Newcastlemax Kamsarmax Panamax $19,125 $13,250 $12,125 $19,470 $11,850 $9,875 $18,600 $14,190 $11,825 $16,949 $10,353 $10,436 $ - $5,000 $10,000 $15,000 $20,000 $25,000 Newcastlemax Kamsarmax Panamax $34,500 $23,750 $21,625 $21,137 $25,283 $12,740 $26,966 $20,716 $18,775 $33,153 $24,758 $19,701 $ - $9,000 $18,000 $27,000 $36,000 $45,000 VLCC Suezmax Aframax $34,500 $23,750 $21,625 $24,690 $20,990 $14,567 $40,500 $30,950 $25,375 $33,153 $24,758 $19,701 $ - $9,000 $18,000 $27,000 $36,000 $45,000 VLCC Suezmax Aframax 19
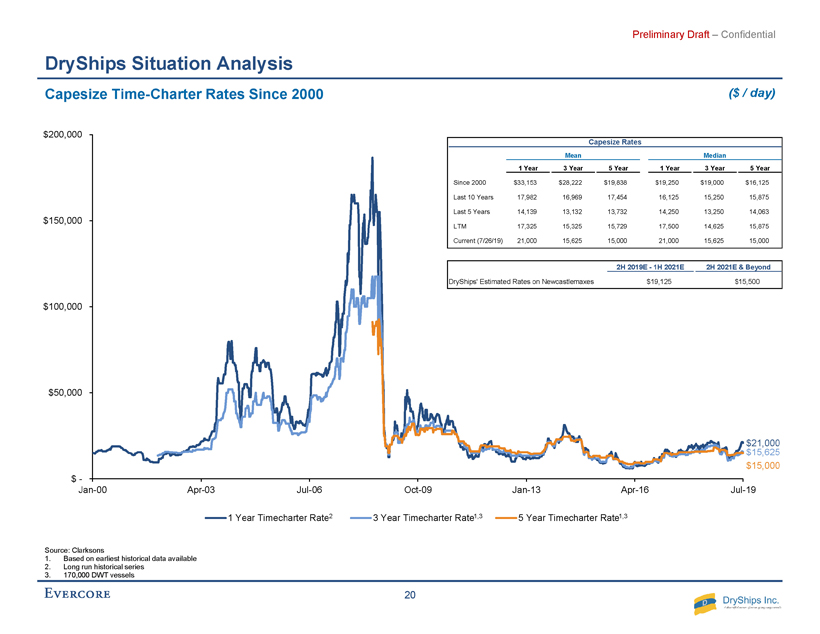
R - 38 G - 77 B - 130 R - 106 G - 151 B - 212 R - 235 G - 133 B - 33 R - 0 G - 134 B - 0 R - 250 G - 202 B - 0 R - 193 G - 2 B - 2 R - 100 G - 100 B - 100 R - 0 G - 105 B - 170 R - 236 G - 163 B - 33 R - 138 G - 173 B - 70 R - 255 G - 219 B - 67 R - 221 G - 70 B - 55 R - 191 G - 191 B - 191 R - 240 G - 181 B - 74 R - 189 G - 209 B - 143 R - 209 G - 226 B - 255 R - 106 G - 151 B - 212 R - 183 G - 205 B - 235 R - 217 G - 217 B - 217 R - 158 G - 198 B - 197 R - 200 G - 222 B - 222 R - 191 G - 191 B - 191 R - 38 G - 77 B - 130 R - 193 G - 2 B - 2 Accent colors/ contrasting colors: R - 0 G - 134 B - 0 R - 235 G - 133 B - 33 R - 250 G - 202 B - 0 R - 170 G - 54 B - 206 Excel chart colors: For basic graphics, diagrams: Light gray for default Word table fill, callout boxes and annotated boxes: R - 234 G - 234 B - 234 Word tables: 3pt border, R - 38,G - 77,B - 130 Highlight colors: R - 106 G - 151 B - 212 R - 235 G - 133 B - 33 R - 0 G - 134 B - 0 R - 250 G - 202 B - 0 R - 219 G - 230 B - 245 R - 245 G - 192 B - 139 R - 201 G - 255 B - 201 R - 255 G - 235 B - 151 Group 1: For text, wireframe, borders, colored bullets: Group 2: For fills and larger areas of colors, e.g., Word table fill: Secondary colored font: R - 0 G - 105 B - 170 Primary colored font: R - 38 G - 77 B - 130 Preliminary Draft – Confidential $21,000 $15,625 $15,000 $ - $50,000 $100,000 $150,000 $200,000 Jan-00 Apr-03 Jul-06 Oct-09 Jan-13 Apr-16 Jul-19 1 Year Timecharter Rate 3 Year Timecharter Rate 5 Year Timecharter Rate DryShips Situation Analysis Capesize Time - Charter Rates Since 2000 ($ / day) Source: Clarksons 1. Based on earliest historical data available 2. Long run historical series 3. 170,000 DWT vessels 2 1,3 1,3 Capesize Rates Mean Median 1 Year 3 Year 5 Year 1 Year 3 Year 5 Year Since 2000 $33,153 $28,222 $19,838 $19,250 $19,000 $16,125 Last 10 Years 17,982 16,969 17,454 16,125 15,250 15,875 Last 5 Years 14,139 13,132 13,732 14,250 13,250 14,063 LTM 17,325 15,325 15,729 17,500 14,625 15,875 Current (7/26/19) 21,000 15,625 15,000 21,000 15,625 15,000 2H 2019E - 1H 2021E 2H 2021E & Beyond DryShips' Estimated Rates on Newcastlemaxes $19,125 $15,500 20
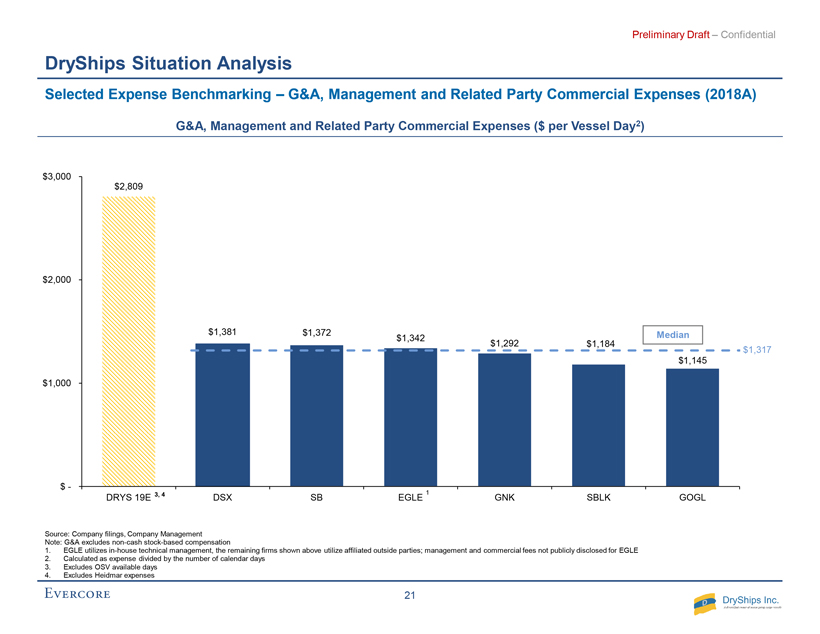
R - 38 G - 77 B - 130 R - 106 G - 151 B - 212 R - 235 G - 133 B - 33 R - 0 G - 134 B - 0 R - 250 G - 202 B - 0 R - 193 G - 2 B - 2 R - 100 G - 100 B - 100 R - 0 G - 105 B - 170 R - 236 G - 163 B - 33 R - 138 G - 173 B - 70 R - 255 G - 219 B - 67 R - 221 G - 70 B - 55 R - 191 G - 191 B - 191 R - 240 G - 181 B - 74 R - 189 G - 209 B - 143 R - 209 G - 226 B - 255 R - 106 G - 151 B - 212 R - 183 G - 205 B - 235 R - 217 G - 217 B - 217 R - 158 G - 198 B - 197 R - 200 G - 222 B - 222 R - 191 G - 191 B - 191 R - 38 G - 77 B - 130 R - 193 G - 2 B - 2 Accent colors/ contrasting colors: R - 0 G - 134 B - 0 R - 235 G - 133 B - 33 R - 250 G - 202 B - 0 R - 170 G - 54 B - 206 Excel chart colors: For basic graphics, diagrams: Light gray for default Word table fill, callout boxes and annotated boxes: R - 234 G - 234 B - 234 Word tables: 3pt border, R - 38,G - 77,B - 130 Highlight colors: R - 106 G - 151 B - 212 R - 235 G - 133 B - 33 R - 0 G - 134 B - 0 R - 250 G - 202 B - 0 R - 219 G - 230 B - 245 R - 245 G - 192 B - 139 R - 201 G - 255 B - 201 R - 255 G - 235 B - 151 Group 1: For text, wireframe, borders, colored bullets: Group 2: For fills and larger areas of colors, e.g., Word table fill: Secondary colored font: R - 0 G - 105 B - 170 Primary colored font: R - 38 G - 77 B - 130 Preliminary Draft – Confidential DryShips Situation Analysis Selected Expense Benchmarking – G&A, Management and Related Party Commercial Expenses Selected Expense Benchmarking – G&A, Management and Related Party Commercial Expenses (2018A) Source: Company filings, Company Management Note: G&A excludes non - cash stock - based compensation 1. EGLE utilizes in - house technical management, the remaining firms shown above utilize affiliated outside parties; management and commercial fees not publicly disclosed for EGLE 2. Calculated as expense divided by the number of calendar days 3. Excludes OSV available days 4. Excludes Heidmar expenses $2,809 $1,381 $1,372 $1,342 $1,292 $1,184 $1,145 $1,317 $ - $1,000 $2,000 $3,000 DRYS 19E DSX SB EGLE GNK SBLK GOGL G&A, Management and Related Party Commercial Expenses ($ per Vessel Day 2 ) 3, 4 1 Median 21

R - 38 G - 77 B - 130 R - 106 G - 151 B - 212 R - 235 G - 133 B - 33 R - 0 G - 134 B - 0 R - 250 G - 202 B - 0 R - 193 G - 2 B - 2 R - 100 G - 100 B - 100 R - 0 G - 105 B - 170 R - 236 G - 163 B - 33 R - 138 G - 173 B - 70 R - 255 G - 219 B - 67 R - 221 G - 70 B - 55 R - 191 G - 191 B - 191 R - 240 G - 181 B - 74 R - 189 G - 209 B - 143 R - 209 G - 226 B - 255 R - 106 G - 151 B - 212 R - 183 G - 205 B - 235 R - 217 G - 217 B - 217 R - 158 G - 198 B - 197 R - 200 G - 222 B - 222 R - 191 G - 191 B - 191 R - 38 G - 77 B - 130 R - 193 G - 2 B - 2 Accent colors/ contrasting colors: R - 0 G - 134 B - 0 R - 235 G - 133 B - 33 R - 250 G - 202 B - 0 R - 170 G - 54 B - 206 Excel chart colors: For basic graphics, diagrams: Light gray for default Word table fill, callout boxes and annotated boxes: R - 234 G - 234 B - 234 Word tables: 3pt border, R - 38,G - 77,B - 130 Highlight colors: R - 106 G - 151 B - 212 R - 235 G - 133 B - 33 R - 0 G - 134 B - 0 R - 250 G - 202 B - 0 R - 219 G - 230 B - 245 R - 245 G - 192 B - 139 R - 201 G - 255 B - 201 R - 255 G - 235 B - 151 Group 1: For text, wireframe, borders, colored bullets: Group 2: For fills and larger areas of colors, e.g., Word table fill: Secondary colored font: R - 0 G - 105 B - 170 Primary colored font: R - 38 G - 77 B - 130 Preliminary Draft – Confidential Drydocking Cost BWTS Cost Scrubber Installation Cost Yard & Silicon Total IMO USCG Total PO Projected Total Total DD & Peripherals Ducts Paints DD/SS Due Due BWTS Placement Scrubbers Installation Scrubbers Scrubber Vessel Type Year Built Due Date Cost Cost Cost Cost Date Date Cost Date Cost Costs Cost Costs Castellani KAMS 2014 1/27/19 $0.94 $0.94 NA 7/9/18 $1.03 $1.08 $2.11 $3.04 Levanto PNMX 2001 4/30/19 0.92 0.92 NA NA - - - 0.92 Ligari PNMX 2004 4/10/19 1.09 1.09 4/11/24 4/10/19 $0.57 8/10/18 0.97 1.11 2.08 3.74 Marini NEWC 2014 6/15/19 1.24 $0.27 $0.32 1.83 6/15/24 6/15/19 0.89 7/20/18 1.43 1.70 3.12 5.84 Rapallo PNMX 2009 6/3/19 1.55 1.55 6/3/24 6/3/19 0.62 7/20/18 0.96 1.22 2.18 4.35 Nasaka KAMS 2014 7/17/19 0.94 0.94 NA 8/10/18 1.03 1.08 2.11 3.04 Valadon KAMS 2014 9/25/19 1.00 1.00 NA 10/24/18 0.95 1.15 2.10 3.10 Matisse KAMS 2014 8/25/19 1.00 1.00 NA 9/26/18 0.95 1.15 2.10 3.10 Morandi NEWC 2013 6/4/23 0.09 0.09 6/4/23 12/4/20 0.89 11/29/18 1.43 1.70 3.12 4.11 Huahine NEWC 2013 10/20/23 0.09 0.09 10/20/23 10/20/23 NA 11/12/18 1.57 1.70 3.27 3.36 Judd NEWC 2015 4/15/20 1.24 $0.27 $0.33 1.84 7/13/22 4/15/20 0.89 12/10/18 1.43 1.70 3.12 5.85 Bacon NEWC 2013 10/19/23 0.05 0.05 10/19/23 4/19/21 0.89 12/30/18 1.43 1.70 3.12 4.07 Netadola NEWC 2017 5/15/22 0.09 0.09 NA 1/13/19 1.19 1.70 2.89 2.98 Pink Sands NEWC 2016 10/17/21 0.09 0.09 NA 1/13/19 1.19 1.70 2.89 2.98 Xanadu NEWC 2017 2/14/22 0.09 0.09 NA 1/29/19 1.19 1.70 2.89 2.98 Conquistador NEWC 2016 4/20/21 0.09 0.09 NA 1/29/19 1.19 1.70 2.89 2.98 Catalina PNMX 2005 3/31/20 1.35 1.35 4/28/22 3/31/20 0.57 6/30/19 1.03 1.00 2.03 3.95 Majorca PNMX 2005 11/22/22 0.09 0.09 8/27/22 5/1/20 0.57 6/30/19 1.03 1.10 2.13 2.79 Kelly KAMS 2017 6/13/22 0.05 0.05 NA 7/1/19 0.96 1.10 2.06 2.11 Raraka PNMX 2012 9/3/21 1.15 1.15 2/1/22 9/3/21 0.60 8/1/19 1.17 1.00 2.17 3.92 Total $14.34 $6.50 $48.37 $69.21 Botafogo AFRA 2010 1/25/20 $1.50 $1.50 4/3/22 1/25/20 $1.01 7/23/18 $1.17 $1.29 $2.47 $4.97 Shiraga VLCC 2011 12/1/21 NA NA 12/1/21 12/1/21 1.45 10/9/18 1.74 1.83 3.57 5.02 Stamos AFRA 2012 2/28/22 NA NA 2/28/22 2/28/22 NA 9/1/19 1.20 1.47 2.67 2.67 Marfa SUEZ 2017 9/26/22 NA NA NA 11/1/19 1.21 1.64 2.84 2.84 Samsara SUEZ 2017 5/18/22 NA NA NA 1/1/20 1.21 1.64 2.84 2.84 Balla AFRA 2017 4/1/22 1.30 $0.16 1.46 NA 9/1/19 0.96 1.50 2.46 3.92 Total $2.96 $2.46 $16.84 $22.26 Drybulk and Tanker Total $17.30 $8.95 $65.21 $91.47 Paid to Date 2.02 8.77 10.80 Remaining $6.93 $56.44 $80.67 Tanker Drybulk DryShips Situation Analysis Drydock Schedule Source: Company Management Note: Reflects gross totals 1. Assumes $6.4mm for the financing of the scrubbers cost for Conquistador / Pink Sands / Xanadu per the agreed term sheet 2 1 ($ in millions ) 1 1 1 22

R - 38 G - 77 B - 130 R - 106 G - 151 B - 212 R - 235 G - 133 B - 33 R - 0 G - 134 B - 0 R - 250 G - 202 B - 0 R - 193 G - 2 B - 2 R - 100 G - 100 B - 100 R - 0 G - 105 B - 170 R - 236 G - 163 B - 33 R - 138 G - 173 B - 70 R - 255 G - 219 B - 67 R - 221 G - 70 B - 55 R - 191 G - 191 B - 191 R - 240 G - 181 B - 74 R - 189 G - 209 B - 143 R - 209 G - 226 B - 255 R - 106 G - 151 B - 212 R - 183 G - 205 B - 235 R - 217 G - 217 B - 217 R - 158 G - 198 B - 197 R - 200 G - 222 B - 222 R - 191 G - 191 B - 191 R - 38 G - 77 B - 130 R - 193 G - 2 B - 2 Accent colors/ contrasting colors: R - 0 G - 134 B - 0 R - 235 G - 133 B - 33 R - 250 G - 202 B - 0 R - 170 G - 54 B - 206 Excel chart colors: For basic graphics, diagrams: Light gray for default Word table fill, callout boxes and annotated boxes: R - 234 G - 234 B - 234 Word tables: 3pt border, R - 38,G - 77,B - 130 Highlight colors: R - 106 G - 151 B - 212 R - 235 G - 133 B - 33 R - 0 G - 134 B - 0 R - 250 G - 202 B - 0 R - 219 G - 230 B - 245 R - 245 G - 192 B - 139 R - 201 G - 255 B - 201 R - 255 G - 235 B - 151 Group 1: For text, wireframe, borders, colored bullets: Group 2: For fills and larger areas of colors, e.g., Word table fill: Secondary colored font: R - 0 G - 105 B - 170 Primary colored font: R - 38 G - 77 B - 130 Preliminary Draft – Confidential DryShips Situation Analysis Summary Financial Projections – DryShips (Excl. Heidmar ) ($ in millions, except per day data) 2019E 2020E 2021E 2022E 2023E Fixed revenues $28.5 $7.3 $8.3 $7.8 $8.2 Spot revenues 101.1 144.6 137.2 128.3 129.5 Net Revenue (excl. TMS Commission) $129.7 $151.9 $145.5 $136.1 $137.7 TMS Commission (2.1) (2.4) (2.3) (2.2) (2.2) Scrubbers Premium 13.6 15.7 16.1 16.0 16.2 Total Revenue $141.2 $165.2 $159.2 $149.8 $151.6 OPEX (52.0) (58.8) (59.8) (61.0) (62.2) Management Fees (16.9) (18.6) (18.6) (18.6) (18.6) Other G&As (7.7) (8.5) (8.6) (8.7) (8.8) EBITDA $64.6 $79.3 $72.3 $61.6 $62.0 Drydocking Expenses (17.2) (3.9) (8.7) (13.7) (5.3) Scrubbers CAPEX (31.1) (27.7) (2.4) - - Unlevered Free Cash Flow 16.3 47.6 61.2 47.8 56.8 Interest Expenses (17.4) (19.5) (18.0) (15.9) (13.0) Principal Repayment (28.7) (36.2) (42.6) (36.7) (31.9) Extraordinary Debt Repayments (21.9) - - (23.7) (72.0) Debt Proceeds 85.5 11.5 - - 72.0 Finance Fees (0.5) (0.0) - - (0.7) Heidmar Acquisition (74.2) - - - - Transfers from/(to) other entities (6.9) - - - - Total Cash Flow ($47.7) $3.5 $0.5 ($28.5) $11.2 Starting Free Cash Balance $142.3 $94.6 $98.0 $98.5 $70.1 Total Cash Flow (47.7) $3.5 $0.5 ($28.5) $11.2 Ending Free Cash Balance $94.6 $98.0 $98.5 $70.1 $81.2 Restricted Cash 15.0 15.0 15.0 15.0 15.0 Total Ending Cash $109.6 $113.0 $113.5 $85.1 $96.2 Ending Debt Balance $394.3 $369.6 $327.0 $266.6 $234.7 Leverage Metrics Gross Debt / LTM EBITDA 6.1x 4.7x 4.5x 4.3x 3.8x Net Debt / LTM EBITDA 4.4x 3.2x 3.0x 2.9x 2.2x EBITDA / Interest Expense 3.7x 4.1x 4.0x 3.9x 4.8x Source: Company Management Note: Summary financial projections do not reflect any go forward legal cost associated with ongoing litigation 23

R - 38 G - 77 B - 130 R - 106 G - 151 B - 212 R - 235 G - 133 B - 33 R - 0 G - 134 B - 0 R - 250 G - 202 B - 0 R - 193 G - 2 B - 2 R - 100 G - 100 B - 100 R - 0 G - 105 B - 170 R - 236 G - 163 B - 33 R - 138 G - 173 B - 70 R - 255 G - 219 B - 67 R - 221 G - 70 B - 55 R - 191 G - 191 B - 191 R - 240 G - 181 B - 74 R - 189 G - 209 B - 143 R - 209 G - 226 B - 255 R - 106 G - 151 B - 212 R - 183 G - 205 B - 235 R - 217 G - 217 B - 217 R - 158 G - 198 B - 197 R - 200 G - 222 B - 222 R - 191 G - 191 B - 191 R - 38 G - 77 B - 130 R - 193 G - 2 B - 2 Accent colors/ contrasting colors: R - 0 G - 134 B - 0 R - 235 G - 133 B - 33 R - 250 G - 202 B - 0 R - 170 G - 54 B - 206 Excel chart colors: For basic graphics, diagrams: Light gray for default Word table fill, callout boxes and annotated boxes: R - 234 G - 234 B - 234 Word tables: 3pt border, R - 38,G - 77,B - 130 Highlight colors: R - 106 G - 151 B - 212 R - 235 G - 133 B - 33 R - 0 G - 134 B - 0 R - 250 G - 202 B - 0 R - 219 G - 230 B - 245 R - 245 G - 192 B - 139 R - 201 G - 255 B - 201 R - 255 G - 235 B - 151 Group 1: For text, wireframe, borders, colored bullets: Group 2: For fills and larger areas of colors, e.g., Word table fill: Secondary colored font: R - 0 G - 105 B - 170 Primary colored font: R - 38 G - 77 B - 130 Preliminary Draft – Confidential DryShips Situation Analysis Summary Financial Projections – Heidmar Source: Company Management Note: 2019E - 2023E based on 25% of current fiscal year ending in March of the same calendar year and 75% of following fiscal year ; Heidmar financial projections subject to ongoing due diligence with Company Management ($ in millions, except per day data) 2019E 2020E 2021E 2022E 2023E Assumptions: Average Pool Returns (TCE / Day) $23,000 $23,000 $22,231 $21,463 $21,463 Average Vessel Count 63 62 63 64 65 Commissions $14.3 $11.8 $14.4 $14.4 $14.6 Management Fees 8.5 6.6 8.1 8.1 8.1 Total Fee Revenue $22.8 $18.4 $22.5 $22.4 $22.7 Wages and Benefits $10.9 $8.1 $10.3 $10.6 $11.0 Discretionary Incentive Compensation 1.0 0.8 1.0 1.0 1.0 Non Comp 4.7 3.5 4.4 4.5 4.6 Total G&A expense $16.6 $12.4 $15.7 $16.1 $16.6 EBITDA from pool operations $6.2 $5.9 $6.8 $6.3 $6.1 Chartered vessels 4.4 1.0 0.9 0.2 0.0 HBS 0.2 0.1 0.2 0.2 0.2 Heidmar2020 (0.1) 0.1 0.1 0.1 0.1 EBITDA $10.6 $7.1 $8.0 $6.8 $6.4 Working Capital 0.9 0.2 0.8 0.9 0.2 Capital Expenditures (0.2) (0.2) (0.2) (0.2) (0.2) Norwalk Office Lease - Straight Line Depreciation 0.2 0.2 0.2 0.2 0.2 Norwalk Office Lease - Cash Basis (0.3) - - - - LTIP - Payments (0.2) - - - - LTIP 4 - Payments (0.0) (0.1) (0.0) - - DIC and LTIP Payroll Taxes & 401K (0.0) (0.0) (0.0) - - Piraeus/Perth Working Capital Loan 0.5 - - - - Pool Return Guarantee (0.5) - - - - Income Tax Paid - UK 0.0 0.1 0.0 0.0 0.0 Payments (to)/from Syndication Partners (1.0) - - - - Syndication Cash Adjustment (2.7) - - - - Free Cash Flow to Equity Holders $7.4 $7.3 $8.8 $7.7 $6.6 Beginning Cash Balance $18.2 $25.6 $32.9 $41.8 $49.5 Net Change in Cash 7.4 7.3 8.8 7.7 6.6 Ending Cash Balance $25.6 $32.9 $41.8 $49.5 $56.1 24

R - 38 G - 77 B - 130 R - 106 G - 151 B - 212 R - 235 G - 133 B - 33 R - 0 G - 134 B - 0 R - 250 G - 202 B - 0 R - 193 G - 2 B - 2 R - 100 G - 100 B - 100 R - 0 G - 105 B - 170 R - 236 G - 163 B - 33 R - 138 G - 173 B - 70 R - 255 G - 219 B - 67 R - 221 G - 70 B - 55 R - 191 G - 191 B - 191 R - 240 G - 181 B - 74 R - 189 G - 209 B - 143 R - 209 G - 226 B - 255 R - 106 G - 151 B - 212 R - 183 G - 205 B - 235 R - 217 G - 217 B - 217 R - 158 G - 198 B - 197 R - 200 G - 222 B - 222 R - 191 G - 191 B - 191 R - 38 G - 77 B - 130 R - 193 G - 2 B - 2 Accent colors/ contrasting colors: R - 0 G - 134 B - 0 R - 235 G - 133 B - 33 R - 250 G - 202 B - 0 R - 170 G - 54 B - 206 Excel chart colors: For basic graphics, diagrams: Light gray for default Word table fill, callout boxes and annotated boxes: R - 234 G - 234 B - 234 Word tables: 3pt border, R - 38,G - 77,B - 130 Highlight colors: R - 106 G - 151 B - 212 R - 235 G - 133 B - 33 R - 0 G - 134 B - 0 R - 250 G - 202 B - 0 R - 219 G - 230 B - 245 R - 245 G - 192 B - 139 R - 201 G - 255 B - 201 R - 255 G - 235 B - 151 Group 1: For text, wireframe, borders, colored bullets: Group 2: For fills and larger areas of colors, e.g., Word table fill: Secondary colored font: R - 0 G - 105 B - 170 Primary colored font: R - 38 G - 77 B - 130 Preliminary Draft – Confidential DryShips Situation Analysis Source: Company Management Sensitivity Cases – Overview Methodology Description Sensitivity Case 1 Increase Newcastlemax spot rates from 2H 2021E and thereafter by 10% From $15,500 / day to $17,050 / day Sensitivity Case 2 Increase Newcastlemax spot rates from 2H 2021E and thereafter by 15% From $15,500 / day to $17,825 / day Sensitivity Case 3 Increase Newcastlemax spot rates from 2H 2021E and thereafter by 20% From $15,500 / day to $18,600 / day DryShips Standalone Methodology Description Heidmar Sensivitiy Assumes no pool participants in the Seawolf Pool (VLCC), dropping from 3.3 vessels to zero after 1Q 2021E Incorporated in Sensitivity Cases 1 - 3 Heidmar 1 2 3 A 25 At the request of the Special Committee, we ran the following Sensitivity Cases. Other than as noted below, all assumptions in Sensitivity Cases are same as Management Case
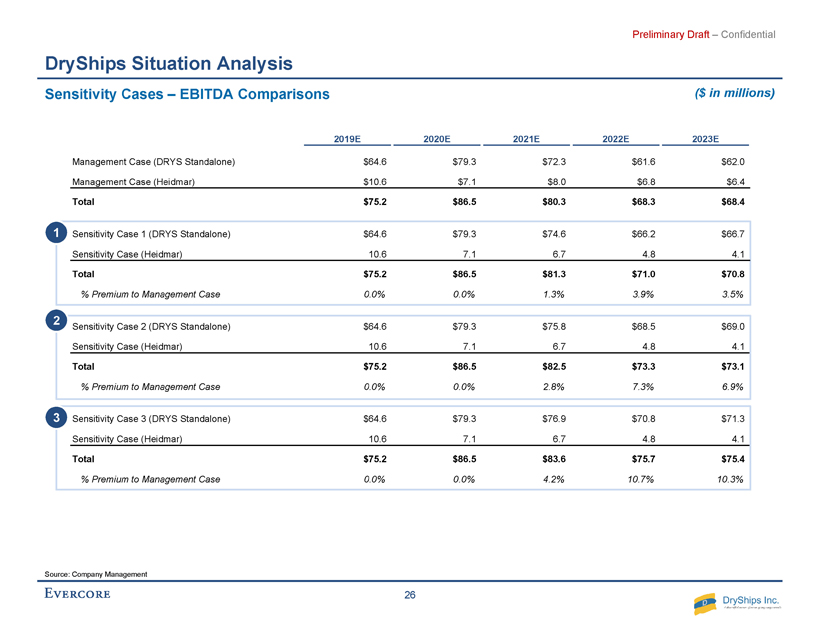
R - 38 G - 77 B - 130 R - 106 G - 151 B - 212 R - 235 G - 133 B - 33 R - 0 G - 134 B - 0 R - 250 G - 202 B - 0 R - 193 G - 2 B - 2 R - 100 G - 100 B - 100 R - 0 G - 105 B - 170 R - 236 G - 163 B - 33 R - 138 G - 173 B - 70 R - 255 G - 219 B - 67 R - 221 G - 70 B - 55 R - 191 G - 191 B - 191 R - 240 G - 181 B - 74 R - 189 G - 209 B - 143 R - 209 G - 226 B - 255 R - 106 G - 151 B - 212 R - 183 G - 205 B - 235 R - 217 G - 217 B - 217 R - 158 G - 198 B - 197 R - 200 G - 222 B - 222 R - 191 G - 191 B - 191 R - 38 G - 77 B - 130 R - 193 G - 2 B - 2 Accent colors/ contrasting colors: R - 0 G - 134 B - 0 R - 235 G - 133 B - 33 R - 250 G - 202 B - 0 R - 170 G - 54 B - 206 Excel chart colors: For basic graphics, diagrams: Light gray for default Word table fill, callout boxes and annotated boxes: R - 234 G - 234 B - 234 Word tables: 3pt border, R - 38,G - 77,B - 130 Highlight colors: R - 106 G - 151 B - 212 R - 235 G - 133 B - 33 R - 0 G - 134 B - 0 R - 250 G - 202 B - 0 R - 219 G - 230 B - 245 R - 245 G - 192 B - 139 R - 201 G - 255 B - 201 R - 255 G - 235 B - 151 Group 1: For text, wireframe, borders, colored bullets: Group 2: For fills and larger areas of colors, e.g., Word table fill: Secondary colored font: R - 0 G - 105 B - 170 Primary colored font: R - 38 G - 77 B - 130 Preliminary Draft – Confidential DryShips Situation Analysis Sensitivity Cases – EBITDA Comparisons ($ in millions) Source: Company Management 2019E 2020E 2021E 2022E 2023E Management Case (DRYS Standalone) $64.6 $79.3 $72.3 $61.6 $62.0 Management Case (Heidmar) $10.6 $7.1 $8.0 $6.8 $6.4 Total $75.2 $86.5 $80.3 $68.3 $68.4 Sensitivity Case 1 (DRYS Standalone) $64.6 $79.3 $74.6 $66.2 $66.7 Sensitivity Case (Heidmar) 10.6 7.1 6.7 4.8 4.1 Total $75.2 $86.5 $81.3 $71.0 $70.8 % Premium to Management Case 0.0% 0.0% 1.3% 3.9% 3.5% Sensitivity Case 2 (DRYS Standalone) $64.6 $79.3 $75.8 $68.5 $69.0 Sensitivity Case (Heidmar) 10.6 7.1 6.7 4.8 4.1 Total $75.2 $86.5 $82.5 $73.3 $73.1 % Premium to Management Case 0.0% 0.0% 2.8% 7.3% 6.9% Sensitivity Case 3 (DRYS Standalone) $64.6 $79.3 $76.9 $70.8 $71.3 Sensitivity Case (Heidmar) 10.6 7.1 6.7 4.8 4.1 Total $75.2 $86.5 $83.6 $75.7 $75.4 % Premium to Management Case 0.0% 0.0% 4.2% 10.7% 10.3% 1 2 3 26
To update section number manually, click in the text box, go to Numbering: III. Preliminary Valuation of the Common Shares

R - 38 G - 77 B - 130 R - 106 G - 151 B - 212 R - 235 G - 133 B - 33 R - 0 G - 134 B - 0 R - 250 G - 202 B - 0 R - 193 G - 2 B - 2 R - 100 G - 100 B - 100 R - 0 G - 105 B - 170 R - 236 G - 163 B - 33 R - 138 G - 173 B - 70 R - 255 G - 219 B - 67 R - 221 G - 70 B - 55 R - 191 G - 191 B - 191 R - 240 G - 181 B - 74 R - 189 G - 209 B - 143 R - 209 G - 226 B - 255 R - 106 G - 151 B - 212 R - 183 G - 205 B - 235 R - 217 G - 217 B - 217 R - 158 G - 198 B - 197 R - 200 G - 222 B - 222 R - 191 G - 191 B - 191 R - 38 G - 77 B - 130 R - 193 G - 2 B - 2 Accent colors/ contrasting colors: R - 0 G - 134 B - 0 R - 235 G - 133 B - 33 R - 250 G - 202 B - 0 R - 170 G - 54 B - 206 Excel chart colors: For basic graphics, diagrams: Light gray for default Word table fill, callout boxes and annotated boxes: R - 234 G - 234 B - 234 Word tables: 3pt border, R - 38,G - 77,B - 130 Highlight colors: R - 106 G - 151 B - 212 R - 235 G - 133 B - 33 R - 0 G - 134 B - 0 R - 250 G - 202 B - 0 R - 219 G - 230 B - 245 R - 245 G - 192 B - 139 R - 201 G - 255 B - 201 R - 255 G - 235 B - 151 Group 1: For text, wireframe, borders, colored bullets: Group 2: For fills and larger areas of colors, e.g., Word table fill: Secondary colored font: R - 0 G - 105 B - 170 Primary colored font: R - 38 G - 77 B - 130 Preliminary Draft – Confidential Preliminary Valuation of the Common Shares Valuation Methodologies Methodology Description Metrics / Assumptions Discounted Cash Flow Analysis (“DCF”) Values DryShips and Heidmar separately on the concept of the time value of money Based on the Company Financial Projections, Evercore: Utilized varying WACC discount rates to derive valuation ranges for DryShips’ assets based on their unlevered cash flows Calculated terminal values based on a range of multiples of EBITDA as well as a range of perpetuity growth rates Discounted the projected cash flows to June 30, 2019 EBITDA exit multiple of 8.0x to 10.0x Perpetuity growth rate of 2.0% to 3.0% WACC of 8.5% to 9.5% based on capital asset pricing model (“CAPM”) Discounted the projected cash flows to June 30, 2019 EBITDA exit multiple of 5.0x to 7.0x Perpetuity growth rate of 2.0% to 3.0% Cost of equity of 10.0% to 11.0% Peer Group Trading Analysis Values the Common Shares based on the current market enterprise value multiples of EBITDA and Price to NAV multiples for publicly - traded entities with assets similar to those owned by DryShips Heidmar EBITDA consolidated into DRYS’ total Multiples for both tanker and dry bulk companies were utilized EBITDA multiples and Price to NAV multiples based on peer group of crude and mixed tanker and drybulk companies Price to NAV multiple applied to estimated NAV Enterprise value / EBITDA multiples applied to 2019E and 2020E EBITDA Net Asset Value Analysis (“NAV”) Values the Common Shares based on the implied value of DRYS’ respective vessel segments: Values Bulkers based on a range of third party appraisals Values Tankers based on a range of third party appraisals Values OSVs based on a range of third party appraisals Values Heidmar based on the recent consideration paid of $51mm on a 100% basis Total implied asset value from DRYS’ respective vessel segments adjusted by segment level net debt and projected capex Vessel appraisals from third party broker as provided by Company management Evercore utilized the Company Financial Projections and the following methodologies to analyze a range of values of the Common Shares: DryShips Heidmar Note: Summary financial projections do not reflect any go forward legal costs associated with ongoing litigation; Heidmar financial projections subject to ongoing due diligence with Company Management 27

R - 38 G - 77 B - 130 R - 106 G - 151 B - 212 R - 235 G - 133 B - 33 R - 0 G - 134 B - 0 R - 250 G - 202 B - 0 R - 193 G - 2 B - 2 R - 100 G - 100 B - 100 R - 0 G - 105 B - 170 R - 236 G - 163 B - 33 R - 138 G - 173 B - 70 R - 255 G - 219 B - 67 R - 221 G - 70 B - 55 R - 191 G - 191 B - 191 R - 240 G - 181 B - 74 R - 189 G - 209 B - 143 R - 209 G - 226 B - 255 R - 106 G - 151 B - 212 R - 183 G - 205 B - 235 R - 217 G - 217 B - 217 R - 158 G - 198 B - 197 R - 200 G - 222 B - 222 R - 191 G - 191 B - 191 R - 38 G - 77 B - 130 R - 193 G - 2 B - 2 Accent colors/ contrasting colors: R - 0 G - 134 B - 0 R - 235 G - 133 B - 33 R - 250 G - 202 B - 0 R - 170 G - 54 B - 206 Excel chart colors: For basic graphics, diagrams: Light gray for default Word table fill, callout boxes and annotated boxes: R - 234 G - 234 B - 234 Word tables: 3pt border, R - 38,G - 77,B - 130 Highlight colors: R - 106 G - 151 B - 212 R - 235 G - 133 B - 33 R - 0 G - 134 B - 0 R - 250 G - 202 B - 0 R - 219 G - 230 B - 245 R - 245 G - 192 B - 139 R - 201 G - 255 B - 201 R - 255 G - 235 B - 151 Group 1: For text, wireframe, borders, colored bullets: Group 2: For fills and larger areas of colors, e.g., Word table fill: Secondary colored font: R - 0 G - 105 B - 170 Primary colored font: R - 38 G - 77 B - 130 Preliminary Draft – Confidential Reference Values Discounted Cash Flow Analysis Peer Group Trading Analysis NAV Analysis Precedent Transactions Share Price Exit Multiple Perpetuity Growth 2019E EBITDA 2020E EBITDA Price / NAV Fully Delivered NAV P / NAV EBITDA Multiple Premiums Paid 52 Week High / Low DryShips Co. Valuation Assumptions WACC: 2019E EBITDA 2020E EBITDA Total NAV 2 Total NAV 2 Total NAV 2 2019E EBITDA Unaffected Price 52-Week High 8.5% - 9.5% $75.2 $86.5 $6.81 $6.81 $6.81 $75.2 $3.16 $6.75 EBITDA Exit Multiple: 8.0x - 10.0x EV / EV / Price Implied EV / Price EV / % Premiums Perpetuity Growth: 2019E EBITDA 2020E EBITDA / NAV 1 2020E EBITDA / NAV 1 2019E EBITDA Paid 52-Week Low 2.0% - 3.0% 8.00x - 10.00x 5.00x - 7.00x 0.65x - 0.90x 9.55x - 9.86x 0.90x - 1.10x 7.50x - 10.00x 10.0% - 20.0% $3.16 Heidmar Valuation Assumptions (Value per Share) DCF (Exit Multiple & Perp. Growth Ranges): EBITDA methods include Heidmar NAV methods are based on the Includes Heidmar $0.78 - $0.89 EBITDA and cash on a consolidated basis total consideration paid for Heidmar: 3 EBITDA and cash on a N/A $1.07 - $1.24 $0.59 consolidated basis Precedent $3.37 $2.48 $4.02 $2.07 $4.43 $6.66 $6.13 $3.59 $3.48 $3.16 $4.64 $3.73 $5.76 $4.06 $6.13 $6.96 $7.49 $5.76 $3.79 $6.75 $ - $2.00 $4.00 $6.00 $8.00 1 2 3 4 5 6 7 8 9 10 $3.54 $5.77 $5.25 $5.55 $6.39 $6.91 Preliminary Valuation of the Common Shares Illustrative Common Share Valuation Source: Bloomberg, FactSet as of 7/26/19 Note: This summary of certain analyses is provided for illustrative purposes. It does not represent all of the analyses perfo rme d by Evercore and should be considered with the information elsewhere in this Presentation . Summary financial projections do not reflect any go forward legal costs associated with ongoing litigation; Heidmar financial projections subject to ongoing due diligence with Company Management 1. Represents equity value paid for target NAV 2. Includes OSV asset values and Heidmar . Total NAV is based on midpoint of the NAV / share range on page 32 3. Assumes $51mm of total consideration paid for Heidmar 4. Bottom end of range based on $ 50mm management agreement termination fee divided by shares outstanding of 86.887mm and top end of range based on the implied difference in unlevered free cash flow between the Company’s current per vessel per day overhead of $2,809 and $ 1,317, which represents the median of GOGL, DSX, SB, EGLE, GNK and SBLK, through 2026 (the termination date of the Management Agreem ent ) discounted at the Company’s weighted average cost of capital of 9.0%, divided by shares outstanding of 86.887mm ($ per share) Offer Price: $4.00 30 - Day VWAP: $3.74 Unaffected Price: $3.16 = Adjusted for deduction of $0.58 - $0.88 per share for potential Management Agreement friction costs 4 28

R - 38 G - 77 B - 130 R - 106 G - 151 B - 212 R - 235 G - 133 B - 33 R - 0 G - 134 B - 0 R - 250 G - 202 B - 0 R - 193 G - 2 B - 2 R - 100 G - 100 B - 100 R - 0 G - 105 B - 170 R - 236 G - 163 B - 33 R - 138 G - 173 B - 70 R - 255 G - 219 B - 67 R - 221 G - 70 B - 55 R - 191 G - 191 B - 191 R - 240 G - 181 B - 74 R - 189 G - 209 B - 143 R - 209 G - 226 B - 255 R - 106 G - 151 B - 212 R - 183 G - 205 B - 235 R - 217 G - 217 B - 217 R - 158 G - 198 B - 197 R - 200 G - 222 B - 222 R - 191 G - 191 B - 191 R - 38 G - 77 B - 130 R - 193 G - 2 B - 2 Accent colors/ contrasting colors: R - 0 G - 134 B - 0 R - 235 G - 133 B - 33 R - 250 G - 202 B - 0 R - 170 G - 54 B - 206 Excel chart colors: For basic graphics, diagrams: Light gray for default Word table fill, callout boxes and annotated boxes: R - 234 G - 234 B - 234 Word tables: 3pt border, R - 38,G - 77,B - 130 Highlight colors: R - 106 G - 151 B - 212 R - 235 G - 133 B - 33 R - 0 G - 134 B - 0 R - 250 G - 202 B - 0 R - 219 G - 230 B - 245 R - 245 G - 192 B - 139 R - 201 G - 255 B - 201 R - 255 G - 235 B - 151 Group 1: For text, wireframe, borders, colored bullets: Group 2: For fills and larger areas of colors, e.g., Word table fill: Secondary colored font: R - 0 G - 105 B - 170 Primary colored font: R - 38 G - 77 B - 130 Preliminary Draft – Confidential Preliminary Valuation of the Common Shares Source: Company Management Illustrative Common Share Valuation Based on Discounted Cash Flow Methods (Sensitivity Case) Management Case Sensivity Case 1 Sensivity Case 2 Sensivity Case 3 EBITDA Multiple Perpetuity Growth Rate EBITDA Multiple Perpetuity Growth Rate EBITDA Multiple Perpetuity Growth Rate EBITDA Multiple Perpetuity Growth Rate DryShips Co. Valuation Assumptions 8.5% - 9.5% WACC 2023E EBITDA Exit Multiple Perpetuity Growth Rate 8.0x - 10.0x 2.0% - 3.0% Heidmar Valuation Assumptions (Value per Share) 2023E EBITDA Exit Multiple Perpetuity Growth Rate 2023E EBITDA Exit Multiple Perpetuity Growth Rate $0.78 - $0.89 $1.07 - $1.24 $0.66 - $0.73 $0.84 - $0.95 $3.37 $2.48 $3.62 $2.83 $3.80 $3.12 $3.98 $3.41 $4.64 $3.73 $4.94 $4.22 $5.17 $4.61 $5.40 $5.01 $0.00 $1.00 $2.00 $3.00 $4.00 $5.00 $6.00 Offer Price: $4.00 30 - Day Unaffected VWAP: $3.74 Unaffected Price: $3.16 1 2 3 A ($ per share) 29

R - 38 G - 77 B - 130 R - 106 G - 151 B - 212 R - 235 G - 133 B - 33 R - 0 G - 134 B - 0 R - 250 G - 202 B - 0 R - 193 G - 2 B - 2 R - 100 G - 100 B - 100 R - 0 G - 105 B - 170 R - 236 G - 163 B - 33 R - 138 G - 173 B - 70 R - 255 G - 219 B - 67 R - 221 G - 70 B - 55 R - 191 G - 191 B - 191 R - 240 G - 181 B - 74 R - 189 G - 209 B - 143 R - 209 G - 226 B - 255 R - 106 G - 151 B - 212 R - 183 G - 205 B - 235 R - 217 G - 217 B - 217 R - 158 G - 198 B - 197 R - 200 G - 222 B - 222 R - 191 G - 191 B - 191 R - 38 G - 77 B - 130 R - 193 G - 2 B - 2 Accent colors/ contrasting colors: R - 0 G - 134 B - 0 R - 235 G - 133 B - 33 R - 250 G - 202 B - 0 R - 170 G - 54 B - 206 Excel chart colors: For basic graphics, diagrams: Light gray for default Word table fill, callout boxes and annotated boxes: R - 234 G - 234 B - 234 Word tables: 3pt border, R - 38,G - 77,B - 130 Highlight colors: R - 106 G - 151 B - 212 R - 235 G - 133 B - 33 R - 0 G - 134 B - 0 R - 250 G - 202 B - 0 R - 219 G - 230 B - 245 R - 245 G - 192 B - 139 R - 201 G - 255 B - 201 R - 255 G - 235 B - 151 Group 1: For text, wireframe, borders, colored bullets: Group 2: For fills and larger areas of colors, e.g., Word table fill: Secondary colored font: R - 0 G - 105 B - 170 Primary colored font: R - 38 G - 77 B - 130 Preliminary Draft – Confidential Preliminary Valuation of the Common Shares Discounted Cash Flow Analysis – DryShips (Excl. Heidmar ) Source: Company Management, Bloomberg Note: Summary financial projections do not reflect any go forward legal expenditures associated with ongoing litigation 1. Terminal drydock expense represents the normalized average drydock expense from DRYS’ 26 vessels (excluding scrubbers) 2. Represents replacement capex based on Company - provided vessel scrap values and remaining useful life to arrive at cumulative annualized depreciation ($ in millions, except per share amounts ) EBITDA Exit Multiple Sensitivities Perpetuity Growth Rate Sensitivities Assumptions Exit Multiple 9.0x Perpetuity Growth Rate 2.5% WACC 9.0% Terminal Value 6 Months Ending For Years Ending December 31, EBITDA Perpetuity 2019E 2020E 2021E 2022E 2023E Exit Multiple Growth Rate DryShips EBITDA $34.9 $79.3 $72.3 $61.6 $62.0 $62.0 $62.0 (-) Drydock Expense 1 (8.6) (3.9) (8.7) (13.7) (5.3) (7.4) (-) Scrubber Expense (26.3) (27.7) (2.4) - - - (-) Replacement Capital Expenditure 2 - - - - - (31.2) Unlevered Free Cash Flow ($0.0) $47.6 $61.2 $47.8 $56.8 $23.5 EBITDA Exit Multiple / Perpetuity Growth Rate 9.0x 2.5% Terminal Value $558.4 - $361.5 Present Value of Terminal Value @ 9.0% WACC $362.9 - $250.6 Plus: Present Value of Unlevered Free Cash Flow @ 9.0% WACC ($0.0) $42.8 $50.4 $36.1 $39.4 $168.6 - $168.6 Implied Enterprise Value Range $531.5 - $419.3 (-) Total Debt as of June 30, 2019E ($386.8) ($386.8) (-) Legal Fees Outstanding as of June 30, 2019E (4.6) (4.6) (+) Cash as of June 30, 2019E 115.1 115.1 (+) Investment in 9.5% Bonds as of June 30, 2019E 5.0 $5.0 (+) OSV Scrap Value 14.3 14.3 Implied DryShips Equity Value Range $274.5 - $162.2 Implied DryShips Share Price Range $3.16 - $1.87 EBITDA Exit Multiple Perpetuity Growth Rate $3.16 8.00x 8.50x 9.00x 9.50x 10.00x 8.50% $2.81 $3.04 $3.28 $3.52 $3.76 8.75% 2.75 2.99 3.22 3.45 3.69 9.00% 2.70 2.93 3.16 3.39 3.62 9.25% 2.64 2.87 3.10 3.33 3.56 9.50% 2.59 2.81 3.04 3.27 3.50 DRYS Implied Equity Value $2.59 - $3.76 WACC Perpetuity Growth Rate $1.87 2.00% 2.25% 2.50% 2.75% 3.00% 8.50% $1.95 $2.07 $2.19 $2.33 $2.48 8.75% 1.80 1.91 2.02 2.15 2.29 9.00% 1.66 1.76 1.87 1.98 2.11 9.25% 1.53 1.62 1.72 1.83 1.94 9.50% 1.41 1.50 1.59 1.68 1.79 DRYS Implied Equity Value $1.41 - $2.48 WACC 30
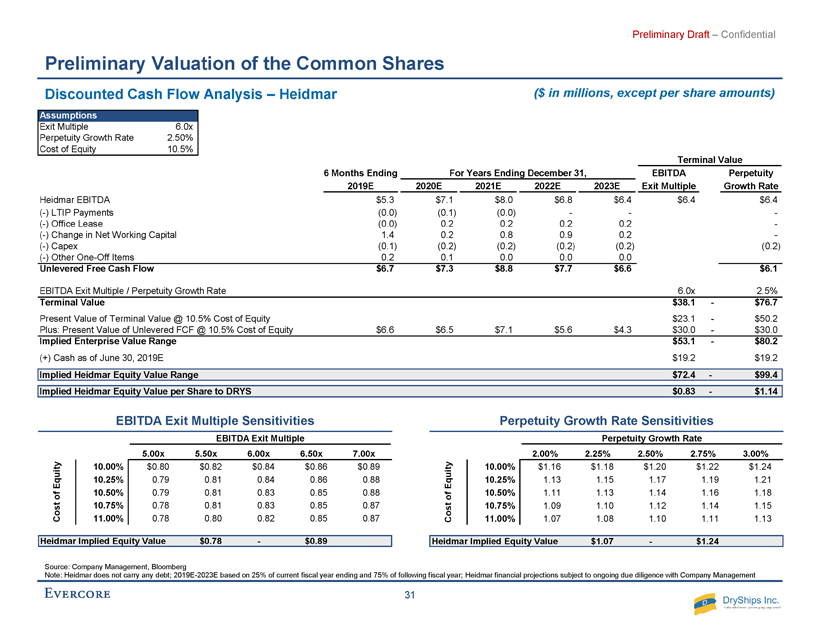
R - 38 G - 77 B - 130 R - 106 G - 151 B - 212 R - 235 G - 133 B - 33 R - 0 G - 134 B - 0 R - 250 G - 202 B - 0 R - 193 G - 2 B - 2 R - 100 G - 100 B - 100 R - 0 G - 105 B - 170 R - 236 G - 163 B - 33 R - 138 G - 173 B - 70 R - 255 G - 219 B - 67 R - 221 G - 70 B - 55 R - 191 G - 191 B - 191 R - 240 G - 181 B - 74 R - 189 G - 209 B - 143 R - 209 G - 226 B - 255 R - 106 G - 151 B - 212 R - 183 G - 205 B - 235 R - 217 G - 217 B - 217 R - 158 G - 198 B - 197 R - 200 G - 222 B - 222 R - 191 G - 191 B - 191 R - 38 G - 77 B - 130 R - 193 G - 2 B - 2 Accent colors/ contrasting colors: R - 0 G - 134 B - 0 R - 235 G - 133 B - 33 R - 250 G - 202 B - 0 R - 170 G - 54 B - 206 Excel chart colors: For basic graphics, diagrams: Light gray for default Word table fill, callout boxes and annotated boxes: R - 234 G - 234 B - 234 Word tables: 3pt border, R - 38,G - 77,B - 130 Highlight colors: R - 106 G - 151 B - 212 R - 235 G - 133 B - 33 R - 0 G - 134 B - 0 R - 250 G - 202 B - 0 R - 219 G - 230 B - 245 R - 245 G - 192 B - 139 R - 201 G - 255 B - 201 R - 255 G - 235 B - 151 Group 1: For text, wireframe, borders, colored bullets: Group 2: For fills and larger areas of colors, e.g., Word table fill: Secondary colored font: R - 0 G - 105 B - 170 Primary colored font: R - 38 G - 77 B - 130 Preliminary Draft – Confidential Preliminary Valuation of the Common Shares Discounted Cash Flow Analysis – Heidmar Source: Company Management, Bloomberg Note: Heidmar does not carry any debt; 2019E - 2023E based on 25% of current fiscal year ending and 75% of following fiscal year; Heidmar financial projections subject to ongoing due diligence with Company Management ($ in millions, except per share amounts ) EBITDA Exit Multiple Sensitivities Perpetuity Growth Rate Sensitivities Assumptions Exit Multiple 6.0x Perpetuity Growth Rate 2.50% Cost of Equity 10.5% Terminal Value 6 Months Ending For Years Ending December 31, EBITDA Perpetuity 2019E 2020E 2021E 2022E 2023E Exit Multiple Growth Rate Heidmar EBITDA $5.3 $7.1 $8.0 $6.8 $6.4 $6.4 $6.4 (-) LTIP Payments (0.0) (0.1) (0.0) - - - (-) Office Lease (0.0) 0.2 0.2 0.2 0.2 - (-) Change in Net Working Capital 1.4 0.2 0.8 0.9 0.2 - (-) Capex (0.1) (0.2) (0.2) (0.2) (0.2) (0.2) (-) Other One-Off Items 0.2 0.1 0.0 0.0 0.0 Unlevered Free Cash Flow $6.7 $7.3 $8.8 $7.7 $6.6 $6.1 EBITDA Exit Multiple / Perpetuity Growth Rate 6.0x 2.5% Terminal Value $38.1 - $76.7 Present Value of Terminal Value @ 10.5% Cost of Equity $23.1 - $50.2 Plus: Present Value of Unlevered FCF @ 10.5% Cost of Equity $6.6 $6.5 $7.1 $5.6 $4.3 $30.0 - $30.0 Implied Enterprise Value Range $53.1 - $80.2 (+) Cash as of June 30, 2019E $19.2 $19.2 Implied Heidmar Equity Value Range $72.4 - $99.4 Implied Heidmar Equity Value per Share to DRYS $0.83 - $1.14 EBITDA Exit Multiple Perpetuity Growth Rate $0.83 5.00x 5.50x 6.00x 6.50x 7.00x 10.00% $0.80 $0.82 $0.84 $0.86 $0.89 10.25% 0.79 0.81 0.84 0.86 0.88 10.50% 0.79 0.81 0.83 0.85 0.88 10.75% 0.78 0.81 0.83 0.85 0.87 11.00% 0.78 0.80 0.82 0.85 0.87 Heidmar Implied Equity Value $0.78 - $0.89 Cost of Equity Perpetuity Growth Rate 1.14 2.00% 2.25% 2.50% 2.75% 3.00% 10.00% $1.16 $1.18 $1.20 $1.22 $1.24 10.25% 1.13 1.15 1.17 1.19 1.21 10.50% 1.11 1.13 1.14 1.16 1.18 10.75% 1.09 1.10 1.12 1.14 1.15 11.00% 1.07 1.08 1.10 1.11 1.13 Heidmar Implied Equity Value $1.07 - $1.24 Cost of Equity 31

R - 38 G - 77 B - 130 R - 106 G - 151 B - 212 R - 235 G - 133 B - 33 R - 0 G - 134 B - 0 R - 250 G - 202 B - 0 R - 193 G - 2 B - 2 R - 100 G - 100 B - 100 R - 0 G - 105 B - 170 R - 236 G - 163 B - 33 R - 138 G - 173 B - 70 R - 255 G - 219 B - 67 R - 221 G - 70 B - 55 R - 191 G - 191 B - 191 R - 240 G - 181 B - 74 R - 189 G - 209 B - 143 R - 209 G - 226 B - 255 R - 106 G - 151 B - 212 R - 183 G - 205 B - 235 R - 217 G - 217 B - 217 R - 158 G - 198 B - 197 R - 200 G - 222 B - 222 R - 191 G - 191 B - 191 R - 38 G - 77 B - 130 R - 193 G - 2 B - 2 Accent colors/ contrasting colors: R - 0 G - 134 B - 0 R - 235 G - 133 B - 33 R - 250 G - 202 B - 0 R - 170 G - 54 B - 206 Excel chart colors: For basic graphics, diagrams: Light gray for default Word table fill, callout boxes and annotated boxes: R - 234 G - 234 B - 234 Word tables: 3pt border, R - 38,G - 77,B - 130 Highlight colors: R - 106 G - 151 B - 212 R - 235 G - 133 B - 33 R - 0 G - 134 B - 0 R - 250 G - 202 B - 0 R - 219 G - 230 B - 245 R - 245 G - 192 B - 139 R - 201 G - 255 B - 201 R - 255 G - 235 B - 151 Group 1: For text, wireframe, borders, colored bullets: Group 2: For fills and larger areas of colors, e.g., Word table fill: Secondary colored font: R - 0 G - 105 B - 170 Primary colored font: R - 38 G - 77 B - 130 Preliminary Draft – Confidential Preliminary Valuation of the Common Shares Source: FactSet as of 7/26/19, Company filings, Wall Street research 1. Based on average of research estimates from Evercore ISI, Jefferies, J.P. Morgan, Morgan Stanley and Pareto Securities 2. Volume - weighted by deadweight tonnage 3. Based on DRYS management projections, inclusive of Heidmar projections (subject to ongoing due diligence with Company Management) 4. Based on asset value disclosed in investor presentation on May 14, 2019 ($ in millions, except per share amounts ) Peer Group Trading Analysis 4 Tankers (Crude / Mixed) Price % of 52-Week Equity Enterprise Enterprise Value/EBITDA Company 7/26/19 High Value Value 2019E 2020E P/NAV 1 Fleet Age 2 DHT Holdings $5.91 94.7% $839 $1,710 8.3x 4.8x 1.01x 8.1 Euronav 8.83 86.4% 1,913 3,475 8.0 5.5 0.82 8.9 Frontline 8.05 84.3% 1,368 3,081 9.9 6.6 1.34 7.1 International Seaways Inc. 17.40 77.3% 511 1,179 7.6 3.4 0.64 8.7 Nordic American Tankers 2.11 60.8% 300 678 6.2 4.5 0.85 11.0 Teekay Tankers 1.25 88.0% 338 1,344 6.8 4.8 0.72 9.4 Diamond S Shipping Inc. 12.06 84.6% 481 1,394 7.6 4.4 0.66 9.1 Tanker Mean 7.8x 4.9x 0.86x 8.9 Tanker Median 7.6x 4.8x 0.82x 8.9 Drybulk Price % of 52-Week Equity Enterprise Enterprise Value/EBITDA Company 7/26/19 High Value Value 2019E 2020E P/NAV 1 Fleet Age 2 Diana Shipping inc. $3.66 80.1% $368 $767 7.9x 7.7x 0.74x 9.3 Eagle Bulk 4.50 75.3% 329 590 8.4 5.7 0.86 8.9 Genco 9.98 66.3% 418 765 8.5 4.7 0.68 9.4 Golden Ocean Group Limited 6.47 64.4% 936 1,975 13.1 7.8 0.75 5.9 Safe Bulkers 2.18 62.8% 221 718 7.2 5.1 1.19 9.1 Scorpio Bulkers Inc. 6.38 84.5% 462 1,198 15.0 8.0 0.66 3.2 Star Bulk 10.40 67.6% 985 2,260 9.0 4.8 0.77 7.8 Drybulk Mean 9.9x 6.3x 0.81x 7.7 Drybulk Median 8.5x 5.7x 0.75x 8.9 DryShips (as of 7/26/19) 3 $3.93 54.4% $341 $594 7.9x 6.9x 0.58x 6.0 DryShips (Unaffected) 3 $3.16 43.8% $275 $527 7.0x 6.1x 0.46x 6.0 32
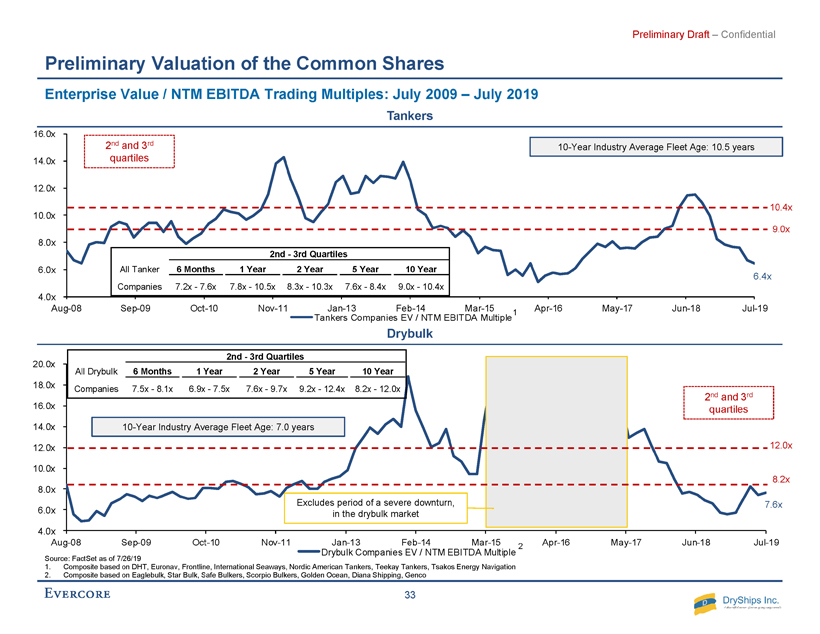
R - 38 G - 77 B - 130 R - 106 G - 151 B - 212 R - 235 G - 133 B - 33 R - 0 G - 134 B - 0 R - 250 G - 202 B - 0 R - 193 G - 2 B - 2 R - 100 G - 100 B - 100 R - 0 G - 105 B - 170 R - 236 G - 163 B - 33 R - 138 G - 173 B - 70 R - 255 G - 219 B - 67 R - 221 G - 70 B - 55 R - 191 G - 191 B - 191 R - 240 G - 181 B - 74 R - 189 G - 209 B - 143 R - 209 G - 226 B - 255 R - 106 G - 151 B - 212 R - 183 G - 205 B - 235 R - 217 G - 217 B - 217 R - 158 G - 198 B - 197 R - 200 G - 222 B - 222 R - 191 G - 191 B - 191 R - 38 G - 77 B - 130 R - 193 G - 2 B - 2 Accent colors/ contrasting colors: R - 0 G - 134 B - 0 R - 235 G - 133 B - 33 R - 250 G - 202 B - 0 R - 170 G - 54 B - 206 Excel chart colors: For basic graphics, diagrams: Light gray for default Word table fill, callout boxes and annotated boxes: R - 234 G - 234 B - 234 Word tables: 3pt border, R - 38,G - 77,B - 130 Highlight colors: R - 106 G - 151 B - 212 R - 235 G - 133 B - 33 R - 0 G - 134 B - 0 R - 250 G - 202 B - 0 R - 219 G - 230 B - 245 R - 245 G - 192 B - 139 R - 201 G - 255 B - 201 R - 255 G - 235 B - 151 Group 1: For text, wireframe, borders, colored bullets: Group 2: For fills and larger areas of colors, e.g., Word table fill: Secondary colored font: R - 0 G - 105 B - 170 Primary colored font: R - 38 G - 77 B - 130 Preliminary Draft – Confidential 7.6x 4.0x 6.0x 8.0x 10.0x 12.0x 14.0x 16.0x 18.0x 20.0x Aug-08 Sep-09 Oct-10 Nov-11 Jan-13 Feb-14 Mar-15 Apr-16 May-17 Jun-18 Jul-19 Drybulk Companies EV / NTM EBITDA Multiple Preliminary Valuation of the Common Shares Source: FactSet as of 7/26/19 1. Composite based on DHT, Euronav , Frontline, International Seaways, Nordic American Tankers, Teekay Tankers, Tsakos Energy Navigation 2. Composite based on Eaglebulk , Star Bulk, Safe Bulkers, Scorpio Bulkers, Golden Ocean, Diana Shipping, Genco Tankers Drybulk 6.4x 4.0x 6.0x 8.0x 10.0x 12.0x 14.0x 16.0x Aug-08 Sep-09 Oct-10 Nov-11 Jan-13 Feb-14 Mar-15 Apr-16 May-17 Jun-18 Jul-19 Tankers Companies EV / NTM EBITDA Multiple 10 - Year Industry Average Fleet Age: 10.5 years 10.4x 9.0x 2 nd and 3 rd quartiles 1 2 Excludes period of a severe downturn, in the drybulk market 2 nd and 3 rd quartiles 12.0x 8.2x 10 - Year Industry Average Fleet Age: 7.0 years Enterprise Value / NTM EBITDA Trading Multiples: July 2009 – July 2019 2nd - 3rd Quartiles All Tanker 6 Months 1 Year 2 Year 5 Year 10 Year Companies 7.2x - 7.6x 7.8x - 10.5x 8.3x - 10.3x 7.6x - 8.4x 9.0x - 10.4x 2nd - 3rd Quartiles All Drybulk 6 Months 1 Year 2 Year 5 Year 10 Year Companies 7.5x - 8.1x 6.9x - 7.5x 7.6x - 9.7x 9.2x - 12.4x 8.2x - 12.0x 33
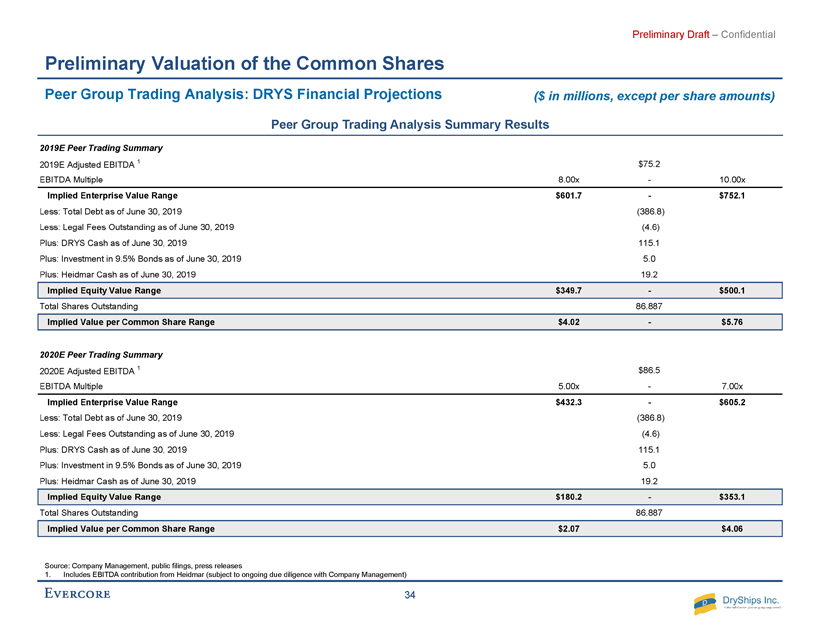
R - 38 G - 77 B - 130 R - 106 G - 151 B - 212 R - 235 G - 133 B - 33 R - 0 G - 134 B - 0 R - 250 G - 202 B - 0 R - 193 G - 2 B - 2 R - 100 G - 100 B - 100 R - 0 G - 105 B - 170 R - 236 G - 163 B - 33 R - 138 G - 173 B - 70 R - 255 G - 219 B - 67 R - 221 G - 70 B - 55 R - 191 G - 191 B - 191 R - 240 G - 181 B - 74 R - 189 G - 209 B - 143 R - 209 G - 226 B - 255 R - 106 G - 151 B - 212 R - 183 G - 205 B - 235 R - 217 G - 217 B - 217 R - 158 G - 198 B - 197 R - 200 G - 222 B - 222 R - 191 G - 191 B - 191 R - 38 G - 77 B - 130 R - 193 G - 2 B - 2 Accent colors/ contrasting colors: R - 0 G - 134 B - 0 R - 235 G - 133 B - 33 R - 250 G - 202 B - 0 R - 170 G - 54 B - 206 Excel chart colors: For basic graphics, diagrams: Light gray for default Word table fill, callout boxes and annotated boxes: R - 234 G - 234 B - 234 Word tables: 3pt border, R - 38,G - 77,B - 130 Highlight colors: R - 106 G - 151 B - 212 R - 235 G - 133 B - 33 R - 0 G - 134 B - 0 R - 250 G - 202 B - 0 R - 219 G - 230 B - 245 R - 245 G - 192 B - 139 R - 201 G - 255 B - 201 R - 255 G - 235 B - 151 Group 1: For text, wireframe, borders, colored bullets: Group 2: For fills and larger areas of colors, e.g., Word table fill: Secondary colored font: R - 0 G - 105 B - 170 Primary colored font: R - 38 G - 77 B - 130 Preliminary Draft – Confidential Preliminary Valuation of the Common Shares Peer Group Trading Analysis: DRYS Financial Projections Peer Group Trading Analysis Summary Results Source: Company Management, public filings, press releases 1. Includes EBITDA contribution from Heidmar (subject to ongoing due diligence with Company Management) 2019E Peer Trading Summary 2019E Adjusted EBITDA 1 $75.2 EBITDA Multiple 8.00x - 10.00x Implied Enterprise Value Range $601.7 - $752.1 Less: Total Debt as of June 30, 2019 (386.8) Less: Legal Fees Outstanding as of June 30, 2019 (4.6) Plus: DRYS Cash as of June 30, 2019 115.1 Plus: Investment in 9.5% Bonds as of June 30, 2019 5.0 Plus: Heidmar Cash as of June 30, 2019 19.2 Implied Equity Value Range $349.7 - $500.1 Total Shares Outstanding 86.887 Implied Value per Common Share Range $4.02 - $5.76 2020E Peer Trading Summary 2020E Adjusted EBITDA 1 $86.5 EBITDA Multiple 5.00x - 7.00x Implied Enterprise Value Range $432.3 - $605.2 Less: Total Debt as of June 30, 2019 (386.8) Less: Legal Fees Outstanding as of June 30, 2019 (4.6) Plus: DRYS Cash as of June 30, 2019 115.1 Plus: Investment in 9.5% Bonds as of June 30, 2019 5.0 Plus: Heidmar Cash as of June 30, 2019 19.2 Implied Equity Value Range $180.2 - $353.1 Total Shares Outstanding 86.887 Implied Value per Common Share Range $2.07 $4.06 ($ in millions, except per share amounts) 34
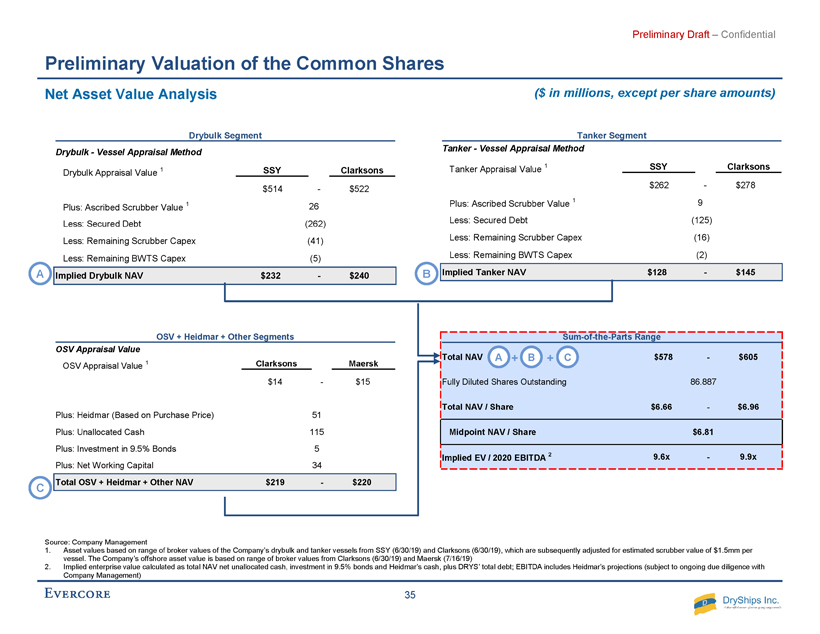
R - 38 G - 77 B - 130 R - 106 G - 151 B - 212 R - 235 G - 133 B - 33 R - 0 G - 134 B - 0 R - 250 G - 202 B - 0 R - 193 G - 2 B - 2 R - 100 G - 100 B - 100 R - 0 G - 105 B - 170 R - 236 G - 163 B - 33 R - 138 G - 173 B - 70 R - 255 G - 219 B - 67 R - 221 G - 70 B - 55 R - 191 G - 191 B - 191 R - 240 G - 181 B - 74 R - 189 G - 209 B - 143 R - 209 G - 226 B - 255 R - 106 G - 151 B - 212 R - 183 G - 205 B - 235 R - 217 G - 217 B - 217 R - 158 G - 198 B - 197 R - 200 G - 222 B - 222 R - 191 G - 191 B - 191 R - 38 G - 77 B - 130 R - 193 G - 2 B - 2 Accent colors/ contrasting colors: R - 0 G - 134 B - 0 R - 235 G - 133 B - 33 R - 250 G - 202 B - 0 R - 170 G - 54 B - 206 Excel chart colors: For basic graphics, diagrams: Light gray for default Word table fill, callout boxes and annotated boxes: R - 234 G - 234 B - 234 Word tables: 3pt border, R - 38,G - 77,B - 130 Highlight colors: R - 106 G - 151 B - 212 R - 235 G - 133 B - 33 R - 0 G - 134 B - 0 R - 250 G - 202 B - 0 R - 219 G - 230 B - 245 R - 245 G - 192 B - 139 R - 201 G - 255 B - 201 R - 255 G - 235 B - 151 Group 1: For text, wireframe, borders, colored bullets: Group 2: For fills and larger areas of colors, e.g., Word table fill: Secondary colored font: R - 0 G - 105 B - 170 Primary colored font: R - 38 G - 77 B - 130 Preliminary Draft – Confidential Preliminary Valuation of the Common Shares Net Asset Value Analysis Source: Company Management 1. Asset values based on range of broker values of the Company’s drybulk and tanker vessels from SSY (6/30/19) and Clarksons (6/30/19), which are subsequently adjusted for estimated scrubber value of $1.5mm per vessel. The Company’s offshore asset value is based on range of broker values from Clarksons (6/30/19) and Maersk (7/16/19) 2. Implied enterprise value calculated as total NAV net unallocated cash, investment in 9.5% bonds and Heidmar’s cash, plus DRYS’ total debt; EBITDA includes Heidmar’s projections (subject to ongoing due diligence with Company Management) ($ in millions, except per share amounts ) Drybulk Segment Drybulk - Vessel Appraisal Method Drybulk Appraisal Value 1 SSY Clarksons $514 - $522 Plus: Ascribed Scrubber Value 1 26 Less: Secured Debt (262) Less: Remaining Scrubber Capex (41) Less: Remaining BWTS Capex (5) Implied Drybulk NAV $232 - $240 Tanker Segment Tanker - Vessel Appraisal Method Tanker Appraisal Value 1 SSY Clarksons $262 - $278 Plus: Ascribed Scrubber Value 1 9 Less: Secured Debt (125) Less: Remaining Scrubber Capex (16) Less: Remaining BWTS Capex (2) Implied Tanker NAV $128 - $145 OSV + Heidmar + Other Segments OSV Appraisal Value OSV Appraisal Value 1 Clarksons Maersk $14 - $15 Plus: Heidmar (Based on Purchase Price) 51 Plus: Unallocated Cash 115 Plus: Investment in 9.5% Bonds 5 Plus: Net Working Capital 34 Total OSV + Heidmar + Other NAV $219 - $220 A B C Sum-of-the-Parts Range Total NAV $578 - $605 Fully Diluted Shares Outstanding 86.887 Total NAV / Share $6.66 - $6.96 Midpoint NAV / Share $6.81 Implied EV / 2020 EBITDA 2 9.6x - 9.9x A B C + + 35
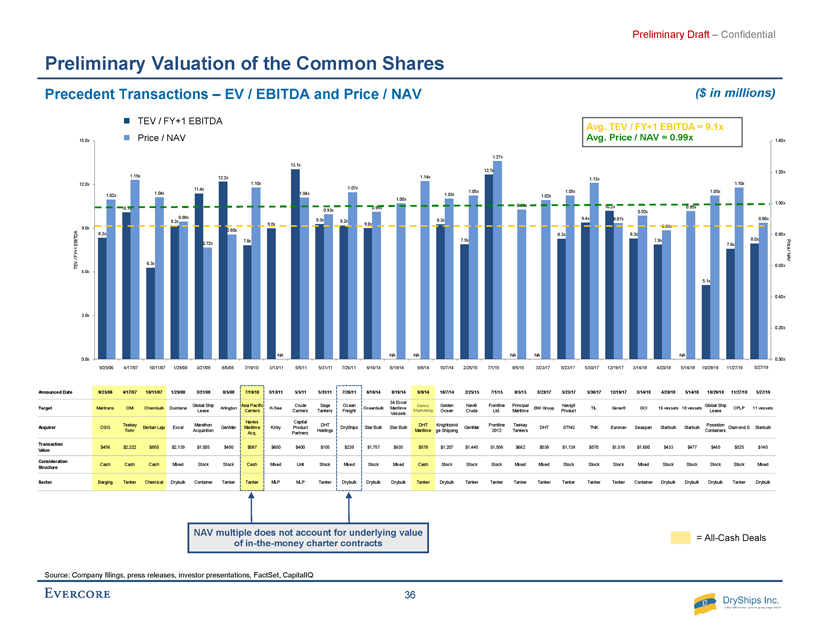
R - 38 G - 77 B - 130 R - 106 G - 151 B - 212 R - 235 G - 133 B - 33 R - 0 G - 134 B - 0 R - 250 G - 202 B - 0 R - 193 G - 2 B - 2 R - 100 G - 100 B - 100 R - 0 G - 105 B - 170 R - 236 G - 163 B - 33 R - 138 G - 173 B - 70 R - 255 G - 219 B - 67 R - 221 G - 70 B - 55 R - 191 G - 191 B - 191 R - 240 G - 181 B - 74 R - 189 G - 209 B - 143 R - 209 G - 226 B - 255 R - 106 G - 151 B - 212 R - 183 G - 205 B - 235 R - 217 G - 217 B - 217 R - 158 G - 198 B - 197 R - 200 G - 222 B - 222 R - 191 G - 191 B - 191 R - 38 G - 77 B - 130 R - 193 G - 2 B - 2 Accent colors/ contrasting colors: R - 0 G - 134 B - 0 R - 235 G - 133 B - 33 R - 250 G - 202 B - 0 R - 170 G - 54 B - 206 Excel chart colors: For basic graphics, diagrams: Light gray for default Word table fill, callout boxes and annotated boxes: R - 234 G - 234 B - 234 Word tables: 3pt border, R - 38,G - 77,B - 130 Highlight colors: R - 106 G - 151 B - 212 R - 235 G - 133 B - 33 R - 0 G - 134 B - 0 R - 250 G - 202 B - 0 R - 219 G - 230 B - 245 R - 245 G - 192 B - 139 R - 201 G - 255 B - 201 R - 255 G - 235 B - 151 Group 1: For text, wireframe, borders, colored bullets: Group 2: For fills and larger areas of colors, e.g., Word table fill: Secondary colored font: R - 0 G - 105 B - 170 Primary colored font: R - 38 G - 77 B - 130 Preliminary Draft – Confidential Preliminary Valuation of the Common Shares ($ in millions) Precedent Transactions – EV / EBITDA and Price / NAV Target Maritrans OMI Chembulk Quintana Global Ship Lease Arlington Asia Pacific Carriers K-Sea Crude Carriers Saga Tankers Ocean Freight Oceanbulk 34 Excel Maritime Vessels Samco Shipholding Golden Ocean Navi8 Crude Frontline Ltd. Principal Maritime BW Group Navig8 Product TIL Gener8 GCI 16 vessels 18 vessels Global Ship Lease CPLP 11 vessels Acquiror OSG Teekay Torm Berlian Laju Excel Marathon Acquisition GenMar Navios Maritime Acq. Kirby Capital Product Partners DHT Holdings DryShips Star Bulk Star Bulk DHT Maritime Knightsbrid ge Shipping GenMar Frontline 2012 Teekay Tankers DHT STNG TNK Euronav Seaspan Starbulk Starbulk Poseidon Containers Diamond S Starbulk Transaction Value $456 $2,222 $850 $2,139 $1,005 $490 $587 $600 $400 $105 $239 $1,757 $635 $578 $1,207 $1,445 $1,506 $662 $538 $1,138 $570 $1,518 $1,600 $433 $477 $465 $525 $140 Consideration Structure Cash Cash Cash Mixed Stock Stock Cash Mixed Unit Stock Mixed Stock Mixed Cash Stock Stock Stock Mixed Mixed Stock Stock Stock Mixed Stock Stock Stock Stock Mixed Sector Barging Tanker Chemical Drybulk Container Tanker Tanker MLP MLP Tanker Drybulk Drybulk Drybulk Tanker Drybulk Tanker Tanker Tanker Tanker Tanker Tanker Tanker Container Drybulk Drybulk Drybulk Tanker Drybulk 10/29/18 5/27/196/16/14 5/30/17 12/19/17 3/14/18 4/20/18 11/27/188/19/14 9/9/14 10/7/14 2/25/15 7/1/15 5/23/178/5/15 3/23/17 5/14/187/26/11Announced Date 9/25/06 4/17/07 10/11/07 1/29/08 3/21/08 8/5/08 7/19/10 3/13/11 5/5/11 5/31/11 8.3x 10.1x 6.3x 9.2x 11.4x 12.2x 7.8x 9.0x 13.1x 9.3x 9.2x 9.0x NA NA 9.3x 7.9x 12.7x NA NA 8.3x 9.4x 10.2x 8.3x 7.9x NA 5.1x 7.6x 8.0x 1.02x 1.15x 1.04x 0.88x 0.72x 0.80x 1.10x NA 1.04x 0.93x 1.07x 0.95x 1.00x 1.14x 1.03x 1.05x 1.27x 0.96x 1.02x 1.05x 1.13x 0.87x 0.92x 0.83x 0.95x 1.05x 1.10x 0.88x 0.00x 0.20x 0.40x 0.60x 0.80x 1.00x 1.20x 1.40x 0.0x 3.0x 6.0x 9.0x 12.0x 15.0x Price / NAV TEV / FY+1 EBITDA 9/25/06 4/17/07 10/11/07 1/29/08 3/21/08 8/5/08 7/19/10 3/13/11 5/5/11 5/31/11 7/26/11 6/16/14 8/19/14 9/9/14 10/7/14 2/25/15 7/1/15 8/5/15 3/23/17 5/23/17 5/30/17 12/19/17 3/14/18 4/20/18 5/14/18 5/27/19 11/27/18 10/29/18 Source: Company filings, press releases, investor presentations, FactSet , CapitalIQ TEV / FY+1 EBITDA Price / NAV Avg. TEV / FY+1 EBITDA = 9.1x Avg. Price / NAV = 0.99x = All - Cash Deals NAV multiple does not account for underlying value of in - the - money charter contracts 36

R - 38 G - 77 B - 130 R - 106 G - 151 B - 212 R - 235 G - 133 B - 33 R - 0 G - 134 B - 0 R - 250 G - 202 B - 0 R - 193 G - 2 B - 2 R - 100 G - 100 B - 100 R - 0 G - 105 B - 170 R - 236 G - 163 B - 33 R - 138 G - 173 B - 70 R - 255 G - 219 B - 67 R - 221 G - 70 B - 55 R - 191 G - 191 B - 191 R - 240 G - 181 B - 74 R - 189 G - 209 B - 143 R - 209 G - 226 B - 255 R - 106 G - 151 B - 212 R - 183 G - 205 B - 235 R - 217 G - 217 B - 217 R - 158 G - 198 B - 197 R - 200 G - 222 B - 222 R - 191 G - 191 B - 191 R - 38 G - 77 B - 130 R - 193 G - 2 B - 2 Accent colors/ contrasting colors: R - 0 G - 134 B - 0 R - 235 G - 133 B - 33 R - 250 G - 202 B - 0 R - 170 G - 54 B - 206 Excel chart colors: For basic graphics, diagrams: Light gray for default Word table fill, callout boxes and annotated boxes: R - 234 G - 234 B - 234 Word tables: 3pt border, R - 38,G - 77,B - 130 Highlight colors: R - 106 G - 151 B - 212 R - 235 G - 133 B - 33 R - 0 G - 134 B - 0 R - 250 G - 202 B - 0 R - 219 G - 230 B - 245 R - 245 G - 192 B - 139 R - 201 G - 255 B - 201 R - 255 G - 235 B - 151 Group 1: For text, wireframe, borders, colored bullets: Group 2: For fills and larger areas of colors, e.g., Word table fill: Secondary colored font: R - 0 G - 105 B - 170 Primary colored font: R - 38 G - 77 B - 130 Preliminary Draft – Confidential Preliminary Valuation of the Common Shares ($ in millions) Precedent Transactions – EV / EBITDA and Price / NAV Source: Company Management, Company filings, press releases, investor presentations, FactSet, CapitalIQ 1. Includes EBITDA contribution from Heidmar (subject to ongoing due diligence with Company Management) 2. Based on midpoint of the NAV / share range, including consolidated figures from Heidmar (subject to ongoing due diligence with Company Management) EV / EBITDA Precedent Transactions Summary 2019E Adjusted EBITDA 1 $75.2 EBITDA Multiple 7.50x - 10.00x Implied Enterprise Value Range $564.1 - $752.1 Less: Total Debt as of June 30, 2019 (386.8) Less: Legal Fees Outstanding as of June 30, 2019 (4.6) Plus: DRYS Cash as of June 30, 2019 115.1 Plus: Investment in 9.5% Bonds as of June 30, 2019 5.0 Plus: Heidmar Cash as of June 30, 2019 19.2 Implied Equity Value Range $312.1 - $500.1 Total Shares Outstanding 86.887 Implied Value per Common Share Range $3.59 - $5.76 Price / NAV Precedent Transactions Summary Net Asset Value per Share 2 $6.81 Price / NAV 0.90x - 1.10x Implied Value per Common Share Range $6.13 - $7.49 37

R - 38 G - 77 B - 130 R - 106 G - 151 B - 212 R - 235 G - 133 B - 33 R - 0 G - 134 B - 0 R - 250 G - 202 B - 0 R - 193 G - 2 B - 2 R - 100 G - 100 B - 100 R - 0 G - 105 B - 170 R - 236 G - 163 B - 33 R - 138 G - 173 B - 70 R - 255 G - 219 B - 67 R - 221 G - 70 B - 55 R - 191 G - 191 B - 191 R - 240 G - 181 B - 74 R - 189 G - 209 B - 143 R - 209 G - 226 B - 255 R - 106 G - 151 B - 212 R - 183 G - 205 B - 235 R - 217 G - 217 B - 217 R - 158 G - 198 B - 197 R - 200 G - 222 B - 222 R - 191 G - 191 B - 191 R - 38 G - 77 B - 130 R - 193 G - 2 B - 2 Accent colors/ contrasting colors: R - 0 G - 134 B - 0 R - 235 G - 133 B - 33 R - 250 G - 202 B - 0 R - 170 G - 54 B - 206 Excel chart colors: For basic graphics, diagrams: Light gray for default Word table fill, callout boxes and annotated boxes: R - 234 G - 234 B - 234 Word tables: 3pt border, R - 38,G - 77,B - 130 Highlight colors: R - 106 G - 151 B - 212 R - 235 G - 133 B - 33 R - 0 G - 134 B - 0 R - 250 G - 202 B - 0 R - 219 G - 230 B - 245 R - 245 G - 192 B - 139 R - 201 G - 255 B - 201 R - 255 G - 235 B - 151 Group 1: For text, wireframe, borders, colored bullets: Group 2: For fills and larger areas of colors, e.g., Word table fill: Secondary colored font: R - 0 G - 105 B - 170 Primary colored font: R - 38 G - 77 B - 130 Preliminary Draft – Confidential Preliminary Valuation of the Common Shares ($ in millions) Premiums Paid Analysis (All - Cash) All Transactions Transaction Size : $250 - $500mm Median Premiums Paid Prior to Announcement: All Transactions Median Premiums Paid Prior to Announcement: $250 - $500mm Number of Transactions 288 Premiums Paid 1 Day Prior 1 Week Prior 1 Month Prior Median 13.0% 13.6% 14.2% 75th Percentile 41.8% 42.7% 46.7% 25th Percentile 0.0% 0.0% (1.3%) 13.0% 13.6% 14.2% 0.0% 5.0% 10.0% 15.0% 20.0% 1 Day Prior 1 Week Prior 1 Month Prior Number of Transactions 59 Premiums Paid 1 Day Prior 1 Week Prior 1 Month Prior Median 13.8% 16.6% 18.8% 75th Percentile 26.5% 30.3% 33.2% 25th Percentile 2.4% 1.7% 3.6% 13.8% 16.6% 18.8% 0.0% 5.0% 10.0% 15.0% 20.0% 1 Day Prior 1 Week Prior 1 Month Prior Source: Thomson SDC Note: Parameters include all take - private transactions for minority take - outs of less than 25% ranging from since January 1, 2009, excluding spin - offs, transactions in the financial and REIT sector, and select deals that did not publicly disclose relevant data 38
To update section number manually, click in the text box, go to Numbering: Appendix

R - 38 G - 77 B - 130 R - 106 G - 151 B - 212 R - 235 G - 133 B - 33 R - 0 G - 134 B - 0 R - 250 G - 202 B - 0 R - 193 G - 2 B - 2 R - 100 G - 100 B - 100 R - 0 G - 105 B - 170 R - 236 G - 163 B - 33 R - 138 G - 173 B - 70 R - 255 G - 219 B - 67 R - 221 G - 70 B - 55 R - 191 G - 191 B - 191 R - 240 G - 181 B - 74 R - 189 G - 209 B - 143 R - 209 G - 226 B - 255 R - 106 G - 151 B - 212 R - 183 G - 205 B - 235 R - 217 G - 217 B - 217 R - 158 G - 198 B - 197 R - 200 G - 222 B - 222 R - 191 G - 191 B - 191 R - 38 G - 77 B - 130 R - 193 G - 2 B - 2 Accent colors/ contrasting colors: R - 0 G - 134 B - 0 R - 235 G - 133 B - 33 R - 250 G - 202 B - 0 R - 170 G - 54 B - 206 Excel chart colors: For basic graphics, diagrams: Light gray for default Word table fill, callout boxes and annotated boxes: R - 234 G - 234 B - 234 Word tables: 3pt border, R - 38,G - 77,B - 130 Highlight colors: R - 106 G - 151 B - 212 R - 235 G - 133 B - 33 R - 0 G - 134 B - 0 R - 250 G - 202 B - 0 R - 219 G - 230 B - 245 R - 245 G - 192 B - 139 R - 201 G - 255 B - 201 R - 255 G - 235 B - 151 Group 1: For text, wireframe, borders, colored bullets: Group 2: For fills and larger areas of colors, e.g., Word table fill: Secondary colored font: R - 0 G - 105 B - 170 Primary colored font: R - 38 G - 77 B - 130 Preliminary Draft – Confidential Appendix DCF Sensitivity Case 1 – 2H 2021E - 2023E Newcastlemax Rates: +10% (Excl. Heidmar ) Assumptions Exit Multiple 9.0x Perpetuity Growth Rate 2.5% WACC 9.0% Terminal Value 6 Months Ending For Years Ending December 31, EBITDA Perpetuity 2019E 2020E 2021E 2022E 2023E Exit Multiple Growth Rate DryShips EBITDA $34.9 $79.3 $74.6 $66.2 $66.7 $66.7 $66.7 (-) Drydock Expense 1 (8.6) (3.9) (8.7) (13.7) (5.3) (7.4) (-) Scrubber Expense (26.3) (27.7) (2.4) - - - (-) Replacement Capital Expenditure 2 - - - - - (31.2) Unlevered Free Cash Flow ($0.0) $47.6 $63.5 $52.5 $61.4 $28.1 EBITDA Exit Multiple / Perpetuity Growth Rate 9.0x 2.5% Terminal Value $599.9 - $432.5 Present Value of Terminal Value @ 9.0% WACC $389.9 - $299.9 Plus: Present Value of Unlevered Free Cash Flow @ 9.0% WACC ($0.0) $42.8 $52.3 $39.6 $42.6 $177.3 - $177.3 Implied Enterprise Value Range $567.2 - $477.2 (-) Total Debt as of June 30, 2019E ($386.8) ($386.8) (-) Legal Fees Outstanding as of June 30, 2019E (4.6) (4.6) (+) Cash as of June 30, 2019E 115.1 115.1 (+) Investment in 9.5% Bonds as of June 30, 2019E 5.0 $5.0 (+) OSV Scrap Value 14.3 14.3 Implied DryShips Equity Value Range $310.2 - $220.1 Implied DryShips Share Price Range $3.57 - $2.53 Source: Company Management, Bloomberg 1. Terminal drydock expense represents the normalized average drydock expense from DRYS’ 26 vessels (excluding scrubbers) 2. Represents replacement capex based on Company - provided vessel scrap values and remaining useful life to arrive at cumulative ann ualized depreciation EBITDA Exit Multiple Sensitivities Perpetuity Growth Rate Sensitivities EBITDA Exit Multiple Perpetuity Growth Rate $3.57 8.00x 8.50x 9.00x 9.50x 10.00x 8.50% $3.19 $3.44 $3.70 $3.96 $4.21 8.75% 3.13 3.38 3.63 3.89 4.14 9.00% 3.07 3.32 3.57 3.82 4.07 9.25% 3.01 3.26 3.51 3.75 4.00 9.50% 2.96 3.20 3.44 3.69 3.93 DRYS Implied Equity Value $2.96 - $4.21 WACC Perpetuity Growth Rate $2.53 2.00% 2.25% 2.50% 2.75% 3.00% 8.50% $2.63 $2.77 $2.92 $3.09 $3.27 8.75% 2.45 2.58 2.72 2.87 3.03 9.00% 2.29 2.41 2.53 2.67 2.82 9.25% 2.13 2.24 2.36 2.49 2.62 9.50% 1.99 2.09 2.20 2.32 2.44 DRYS Implied Equity Value $1.99 - $3.27 WACC 1 39

R - 38 G - 77 B - 130 R - 106 G - 151 B - 212 R - 235 G - 133 B - 33 R - 0 G - 134 B - 0 R - 250 G - 202 B - 0 R - 193 G - 2 B - 2 R - 100 G - 100 B - 100 R - 0 G - 105 B - 170 R - 236 G - 163 B - 33 R - 138 G - 173 B - 70 R - 255 G - 219 B - 67 R - 221 G - 70 B - 55 R - 191 G - 191 B - 191 R - 240 G - 181 B - 74 R - 189 G - 209 B - 143 R - 209 G - 226 B - 255 R - 106 G - 151 B - 212 R - 183 G - 205 B - 235 R - 217 G - 217 B - 217 R - 158 G - 198 B - 197 R - 200 G - 222 B - 222 R - 191 G - 191 B - 191 R - 38 G - 77 B - 130 R - 193 G - 2 B - 2 Accent colors/ contrasting colors: R - 0 G - 134 B - 0 R - 235 G - 133 B - 33 R - 250 G - 202 B - 0 R - 170 G - 54 B - 206 Excel chart colors: For basic graphics, diagrams: Light gray for default Word table fill, callout boxes and annotated boxes: R - 234 G - 234 B - 234 Word tables: 3pt border, R - 38,G - 77,B - 130 Highlight colors: R - 106 G - 151 B - 212 R - 235 G - 133 B - 33 R - 0 G - 134 B - 0 R - 250 G - 202 B - 0 R - 219 G - 230 B - 245 R - 245 G - 192 B - 139 R - 201 G - 255 B - 201 R - 255 G - 235 B - 151 Group 1: For text, wireframe, borders, colored bullets: Group 2: For fills and larger areas of colors, e.g., Word table fill: Secondary colored font: R - 0 G - 105 B - 170 Primary colored font: R - 38 G - 77 B - 130 Preliminary Draft – Confidential Appendix DCF Sensitivity Case 2 – 2H 2021E - 2023E Newcastlemax Rates: +15% (Excl. Heidmar ) Assumptions Exit Multiple 9.0x Perpetuity Growth Rate 2.5% WACC 9.0% Terminal Value 6 Months Ending For Years Ending December 31, EBITDA Perpetuity 2019E 2020E 2021E 2022E 2023E Exit Multiple Growth Rate DryShips EBITDA $34.9 $79.3 $75.8 $68.5 $69.0 $69.0 $69.0 (-) Drydock Expense 1 (8.6) (3.9) (8.7) (13.7) (5.3) (7.4) (-) Scrubber Expense (26.3) (27.7) (2.4) - - - (-) Replacement Capital Expenditure 2 - - - - - (31.2) Unlevered Free Cash Flow ($0.0) $47.6 $64.7 $54.8 $63.7 $30.4 EBITDA Exit Multiple / Perpetuity Growth Rate 9.0x 2.5% Terminal Value $620.7 - $468.0 Present Value of Terminal Value @ 9.0% WACC $403.4 - $324.5 Plus: Present Value of Unlevered Free Cash Flow @ 9.0% WACC ($0.0) $42.8 $53.3 $41.4 $44.2 $181.6 - $181.6 Implied Enterprise Value Range $585.0 - $506.1 (-) Total Debt as of June 30, 2019E ($386.8) ($386.8) (-) Legal Fees Outstanding as of June 30, 2019E (4.6) (4.6) (+) Cash as of June 30, 2019E 115.1 115.1 (+) Investment in 9.5% Bonds as of June 30, 2019E 5.0 $5.0 (+) OSV Scrap Value 14.3 14.3 Implied DryShips Equity Value Range $328.0 - $249.1 Implied DryShips Share Price Range $3.78 - $2.87 Source: Company Management, Bloomberg 1. Terminal drydock expense represents the normalized average drydock expense from DRYS’ 26 vessels (excluding scrubbers) 2. Represents replacement capex based on Company - provided vessel scrap values and remaining useful life to arrive at cumulative ann ualized depreciation EBITDA Exit Multiple Sensitivities Perpetuity Growth Rate Sensitivities EBITDA Exit Multiple Perpetuity Growth Rate $3.78 8.00x 8.50x 9.00x 9.50x 10.00x 8.50% $3.38 $3.65 $3.91 $4.17 $4.44 8.75% 3.32 3.58 3.84 4.10 4.36 9.00% 3.26 3.52 3.78 4.03 4.29 9.25% 3.20 3.45 3.71 3.96 4.22 9.50% 3.14 3.39 3.64 3.90 4.15 DRYS Implied Equity Value $3.14 - $4.44 WACC Perpetuity Growth Rate $2.87 2.00% 2.25% 2.50% 2.75% 3.00% 8.50% $2.97 $3.12 $3.28 $3.46 $3.66 8.75% 2.78 2.92 3.07 3.23 3.41 9.00% 2.60 2.73 2.87 3.02 3.18 9.25% 2.44 2.55 2.68 2.82 2.97 9.50% 2.28 2.39 2.51 2.63 2.77 DRYS Implied Equity Value $2.28 - $3.66 WACC 2 40
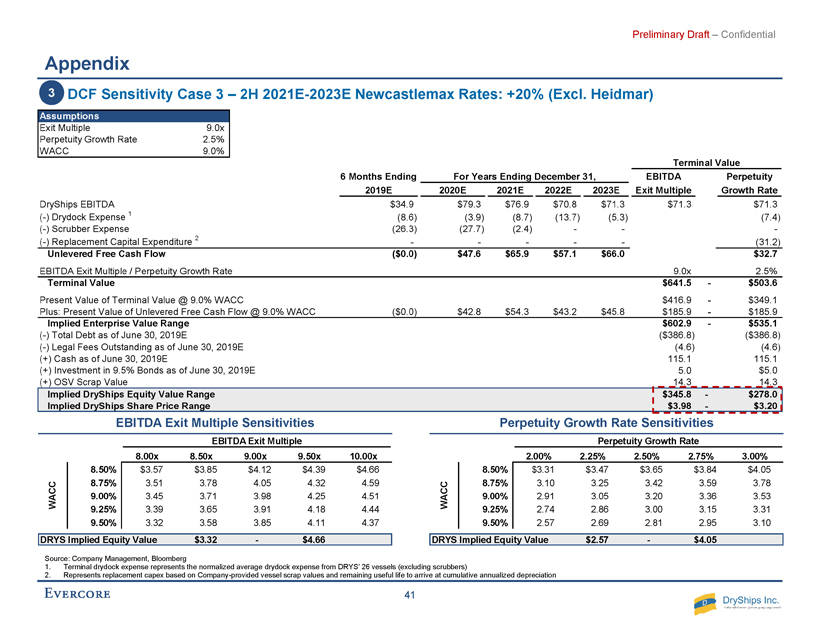
R - 38 G - 77 B - 130 R - 106 G - 151 B - 212 R - 235 G - 133 B - 33 R - 0 G - 134 B - 0 R - 250 G - 202 B - 0 R - 193 G - 2 B - 2 R - 100 G - 100 B - 100 R - 0 G - 105 B - 170 R - 236 G - 163 B - 33 R - 138 G - 173 B - 70 R - 255 G - 219 B - 67 R - 221 G - 70 B - 55 R - 191 G - 191 B - 191 R - 240 G - 181 B - 74 R - 189 G - 209 B - 143 R - 209 G - 226 B - 255 R - 106 G - 151 B - 212 R - 183 G - 205 B - 235 R - 217 G - 217 B - 217 R - 158 G - 198 B - 197 R - 200 G - 222 B - 222 R - 191 G - 191 B - 191 R - 38 G - 77 B - 130 R - 193 G - 2 B - 2 Accent colors/ contrasting colors: R - 0 G - 134 B - 0 R - 235 G - 133 B - 33 R - 250 G - 202 B - 0 R - 170 G - 54 B - 206 Excel chart colors: For basic graphics, diagrams: Light gray for default Word table fill, callout boxes and annotated boxes: R - 234 G - 234 B - 234 Word tables: 3pt border, R - 38,G - 77,B - 130 Highlight colors: R - 106 G - 151 B - 212 R - 235 G - 133 B - 33 R - 0 G - 134 B - 0 R - 250 G - 202 B - 0 R - 219 G - 230 B - 245 R - 245 G - 192 B - 139 R - 201 G - 255 B - 201 R - 255 G - 235 B - 151 Group 1: For text, wireframe, borders, colored bullets: Group 2: For fills and larger areas of colors, e.g., Word table fill: Secondary colored font: R - 0 G - 105 B - 170 Primary colored font: R - 38 G - 77 B - 130 Preliminary Draft – Confidential Appendix DCF Sensitivity Case 3 – 2H 2021E - 2023E Newcastlemax Rates: +20% (Excl. Heidmar ) Assumptions Exit Multiple 9.0x Perpetuity Growth Rate 2.5% WACC 9.0% Terminal Value 6 Months Ending For Years Ending December 31, EBITDA Perpetuity 2019E 2020E 2021E 2022E 2023E Exit Multiple Growth Rate DryShips EBITDA $34.9 $79.3 $76.9 $70.8 $71.3 $71.3 $71.3 (-) Drydock Expense 1 (8.6) (3.9) (8.7) (13.7) (5.3) (7.4) (-) Scrubber Expense (26.3) (27.7) (2.4) - - - (-) Replacement Capital Expenditure 2 - - - - - (31.2) Unlevered Free Cash Flow ($0.0) $47.6 $65.9 $57.1 $66.0 $32.7 EBITDA Exit Multiple / Perpetuity Growth Rate 9.0x 2.5% Terminal Value $641.5 - $503.6 Present Value of Terminal Value @ 9.0% WACC $416.9 - $349.1 Plus: Present Value of Unlevered Free Cash Flow @ 9.0% WACC ($0.0) $42.8 $54.3 $43.2 $45.8 $185.9 - $185.9 Implied Enterprise Value Range $602.9 - $535.1 (-) Total Debt as of June 30, 2019E ($386.8) ($386.8) (-) Legal Fees Outstanding as of June 30, 2019E (4.6) (4.6) (+) Cash as of June 30, 2019E 115.1 115.1 (+) Investment in 9.5% Bonds as of June 30, 2019E 5.0 $5.0 (+) OSV Scrap Value 14.3 14.3 Implied DryShips Equity Value Range $345.8 - $278.0 Implied DryShips Share Price Range $3.98 - $3.20 Source: Company Management, Bloomberg 1. Terminal drydock expense represents the normalized average drydock expense from DRYS’ 26 vessels (excluding scrubbers) 2. Represents replacement capex based on Company - provided vessel scrap values and remaining useful life to arrive at cumulative ann ualized depreciation EBITDA Exit Multiple Sensitivities Perpetuity Growth Rate Sensitivities EBITDA Exit Multiple Perpetuity Growth Rate $3.98 8.00x 8.50x 9.00x 9.50x 10.00x 8.50% $3.57 $3.85 $4.12 $4.39 $4.66 8.75% 3.51 3.78 4.05 4.32 4.59 9.00% 3.45 3.71 3.98 4.25 4.51 9.25% 3.39 3.65 3.91 4.18 4.44 9.50% 3.32 3.58 3.85 4.11 4.37 DRYS Implied Equity Value $3.32 - $4.66 WACC Perpetuity Growth Rate $3.20 2.00% 2.25% 2.50% 2.75% 3.00% 8.50% $3.31 $3.47 $3.65 $3.84 $4.05 8.75% 3.10 3.25 3.42 3.59 3.78 9.00% 2.91 3.05 3.20 3.36 3.53 9.25% 2.74 2.86 3.00 3.15 3.31 9.50% 2.57 2.69 2.81 2.95 3.10 DRYS Implied Equity Value $2.57 - $4.05 WACC 3 41

R - 38 G - 77 B - 130 R - 106 G - 151 B - 212 R - 235 G - 133 B - 33 R - 0 G - 134 B - 0 R - 250 G - 202 B - 0 R - 193 G - 2 B - 2 R - 100 G - 100 B - 100 R - 0 G - 105 B - 170 R - 236 G - 163 B - 33 R - 138 G - 173 B - 70 R - 255 G - 219 B - 67 R - 221 G - 70 B - 55 R - 191 G - 191 B - 191 R - 240 G - 181 B - 74 R - 189 G - 209 B - 143 R - 209 G - 226 B - 255 R - 106 G - 151 B - 212 R - 183 G - 205 B - 235 R - 217 G - 217 B - 217 R - 158 G - 198 B - 197 R - 200 G - 222 B - 222 R - 191 G - 191 B - 191 R - 38 G - 77 B - 130 R - 193 G - 2 B - 2 Accent colors/ contrasting colors: R - 0 G - 134 B - 0 R - 235 G - 133 B - 33 R - 250 G - 202 B - 0 R - 170 G - 54 B - 206 Excel chart colors: For basic graphics, diagrams: Light gray for default Word table fill, callout boxes and annotated boxes: R - 234 G - 234 B - 234 Word tables: 3pt border, R - 38,G - 77,B - 130 Highlight colors: R - 106 G - 151 B - 212 R - 235 G - 133 B - 33 R - 0 G - 134 B - 0 R - 250 G - 202 B - 0 R - 219 G - 230 B - 245 R - 245 G - 192 B - 139 R - 201 G - 255 B - 201 R - 255 G - 235 B - 151 Group 1: For text, wireframe, borders, colored bullets: Group 2: For fills and larger areas of colors, e.g., Word table fill: Secondary colored font: R - 0 G - 105 B - 170 Primary colored font: R - 38 G - 77 B - 130 Preliminary Draft – Confidential Appendix DCF Heidmar Sensitivity – 2H 2021E - 2023E Excluding VLCCs Source: Company Management, Bloomberg Note: Heidmar does not carry any debt; 2019E - 2023E based on 25% of current fiscal year ending and 75% of following fiscal year; Heidmar financial projections subject to ongoing due diligence with Company Management ($ in millions, except per share amounts ) EBITDA Exit Multiple Sensitivities Perpetuity Growth Rate Sensitivities Assumptions Exit Multiple 6.0x Perpetuity Growth Rate 2.50% Cost of Equity 10.5% Terminal Value 6 Months Ending For Years Ending December 31, EBITDA Perpetuity 2019E 2020E 2021E 2022E 2023E Exit Multiple Growth Rate Heidmar EBITDA $5.3 $7.1 $6.7 $4.8 $4.1 $4.1 $4.1 (-) LTIP Payments (0.0) (0.1) (0.0) - - - (-) Office Lease (0.0) 0.2 0.2 0.2 0.2 - (-) Change in Net Working Capital 1.4 0.2 0.8 0.9 0.2 - (-) Capex (0.1) (0.2) (0.2) (0.2) (0.2) (0.2) (-) Other One-Off Items 0.2 0.1 0.0 - - Unlevered Free Cash Flow $6.7 $7.3 $7.5 $5.8 $4.4 $3.9 EBITDA Exit Multiple / Perpetuity Growth Rate 6.0x 2.5% Terminal Value $24.9 - $49.1 Present Value of Terminal Value @ 10.5% Cost of Equity $15.1 - $32.1 Plus: Present Value of Unlevered FCF @ 10.5% Cost of Equity $6.6 $6.5 $6.0 $4.2 $2.9 $26.1 - $26.1 Implied Enterprise Value Range $41.2 - $58.2 (+) Cash as of June 30, 2019E $19.2 $19.2 Implied Heidmar Equity Value Range $60.4 - $77.4 Implied Heidmar Equity Value per Share to DRYS $0.70 - $0.89 EBITDA Exit Multiple Perpetuity Growth Rate $0.70 5.00x 5.50x 6.00x 6.50x 7.00x 10.00% $0.67 $0.69 $0.70 $0.72 $0.73 10.25% 0.67 0.68 0.70 0.71 0.73 10.50% 0.67 0.68 0.70 0.71 0.72 10.75% 0.66 0.68 0.69 0.71 0.72 11.00% 0.66 0.67 0.69 0.70 0.72 Heidmar Implied Equity Value $0.66 - $0.73 Cost of Equity Perpetuity Growth Rate 0.89 2.00% 2.25% 2.50% 2.75% 3.00% 10.00% $0.90 $0.91 $0.93 $0.94 $0.95 10.25% 0.88 0.90 0.91 0.92 0.93 10.50% 0.87 0.88 0.89 0.90 0.92 10.75% 0.85 0.86 0.88 0.89 0.90 11.00% 0.84 0.85 0.86 0.87 0.88 Heidmar Implied Equity Value $0.84 - $0.95 Cost of Equity A 42
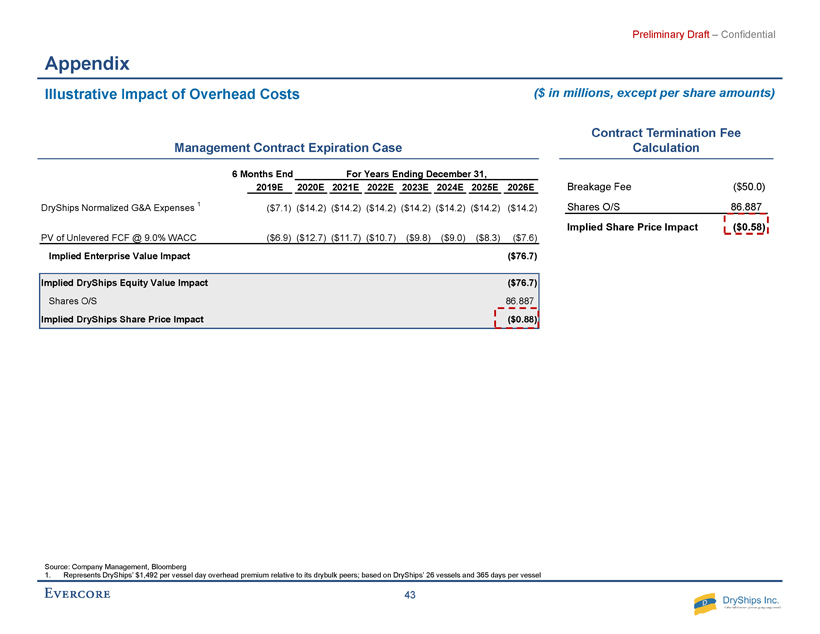
R - 38 G - 77 B - 130 R - 106 G - 151 B - 212 R - 235 G - 133 B - 33 R - 0 G - 134 B - 0 R - 250 G - 202 B - 0 R - 193 G - 2 B - 2 R - 100 G - 100 B - 100 R - 0 G - 105 B - 170 R - 236 G - 163 B - 33 R - 138 G - 173 B - 70 R - 255 G - 219 B - 67 R - 221 G - 70 B - 55 R - 191 G - 191 B - 191 R - 240 G - 181 B - 74 R - 189 G - 209 B - 143 R - 209 G - 226 B - 255 R - 106 G - 151 B - 212 R - 183 G - 205 B - 235 R - 217 G - 217 B - 217 R - 158 G - 198 B - 197 R - 200 G - 222 B - 222 R - 191 G - 191 B - 191 R - 38 G - 77 B - 130 R - 193 G - 2 B - 2 Accent colors/ contrasting colors: R - 0 G - 134 B - 0 R - 235 G - 133 B - 33 R - 250 G - 202 B - 0 R - 170 G - 54 B - 206 Excel chart colors: For basic graphics, diagrams: Light gray for default Word table fill, callout boxes and annotated boxes: R - 234 G - 234 B - 234 Word tables: 3pt border, R - 38,G - 77,B - 130 Highlight colors: R - 106 G - 151 B - 212 R - 235 G - 133 B - 33 R - 0 G - 134 B - 0 R - 250 G - 202 B - 0 R - 219 G - 230 B - 245 R - 245 G - 192 B - 139 R - 201 G - 255 B - 201 R - 255 G - 235 B - 151 Group 1: For text, wireframe, borders, colored bullets: Group 2: For fills and larger areas of colors, e.g., Word table fill: Secondary colored font: R - 0 G - 105 B - 170 Primary colored font: R - 38 G - 77 B - 130 Preliminary Draft – Confidential Appendix Illustrative Impact of Overhead Costs Source: Company Management, Bloomberg 1. Represents DryShips ’ $1,492 per vessel day overhead premium relative to its drybulk peers; based on DryShips ’ 26 vessels and 365 days per vessel ($ in millions, except per share amounts ) Management Contract Expiration Case 6 Months Ending For Years Ending December 31, 2019E 2020E 2021E 2022E 2023E 2024E 2025E 2026E DryShips Normalized G&A Expenses 1 ($7.1) ($14.2) ($14.2) ($14.2) ($14.2) ($14.2) ($14.2) ($14.2) PV of Unlevered FCF @ 9.0% WACC ($6.9) ($12.7) ($11.7) ($10.7) ($9.8) ($9.0) ($8.3) ($7.6) Implied Enterprise Value Impact ($76.7) Implied DryShips Equity Value Impact ($76.7) Shares O/S 86.887 Implied DryShips Share Price Impact ($0.88) Contract Termination Fee Calculation Breakage Fee ($50.0) Shares O/S 86.887 Implied Share Price Impact ($0.58) 43

R - 38 G - 77 B - 130 R - 106 G - 151 B - 212 R - 235 G - 133 B - 33 R - 0 G - 134 B - 0 R - 250 G - 202 B - 0 R - 193 G - 2 B - 2 R - 100 G - 100 B - 100 R - 0 G - 105 B - 170 R - 236 G - 163 B - 33 R - 138 G - 173 B - 70 R - 255 G - 219 B - 67 R - 221 G - 70 B - 55 R - 191 G - 191 B - 191 R - 240 G - 181 B - 74 R - 189 G - 209 B - 143 R - 209 G - 226 B - 255 R - 106 G - 151 B - 212 R - 183 G - 205 B - 235 R - 217 G - 217 B - 217 R - 158 G - 198 B - 197 R - 200 G - 222 B - 222 R - 191 G - 191 B - 191 R - 38 G - 77 B - 130 R - 193 G - 2 B - 2 Accent colors/ contrasting colors: R - 0 G - 134 B - 0 R - 235 G - 133 B - 33 R - 250 G - 202 B - 0 R - 170 G - 54 B - 206 Excel chart colors: For basic graphics, diagrams: Light gray for default Word table fill, callout boxes and annotated boxes: R - 234 G - 234 B - 234 Word tables: 3pt border, R - 38,G - 77,B - 130 Highlight colors: R - 106 G - 151 B - 212 R - 235 G - 133 B - 33 R - 0 G - 134 B - 0 R - 250 G - 202 B - 0 R - 219 G - 230 B - 245 R - 245 G - 192 B - 139 R - 201 G - 255 B - 201 R - 255 G - 235 B - 151 Group 1: For text, wireframe, borders, colored bullets: Group 2: For fills and larger areas of colors, e.g., Word table fill: Secondary colored font: R - 0 G - 105 B - 170 Primary colored font: R - 38 G - 77 B - 130 Preliminary Draft – Confidential Vessels Age Debt Outstanding 1 Maturity Amortization Profile Pricing LTV 1 ABN Facility Botafogo 2 , Huahine, Judd, Raraka 9 years / 6 years / 4 years / 7 years $62.9 million June 30, 2024 20 quarterly payments of $1,675,000 and balloon installment of $30,000,000 after 20th quarterly installment Floating - LIBOR plus a 2.50% margin p.a. 58.6% KfW Facility 3 Conquistador, Pink Sands, Xanadu 3 years / 3 years / 2 years $68.9 million April 19, 2028; October 13, 2028; February 10, 2029, respectively 48 quarterly payments of $1,387,500. Balloon installment of $16,650,000 payable after 47th or 48th quarterly installment Floating - LIBOR plus a 2.20% margin p.a. 50.2% DekaBank Facility Netadola 2 years $25.0 million May 12, 2029 40 quarterly payments of $481,000. Balloon installment of $5,772,000 payable after 81st quarterly installment Floating - LIBOR plus a 2.50% margin p.a. 52.5% DVB / Valadon- Matisse-Rapallo Facility Valadon, Matisse, Rapallo 5 years / 5 years / 10 years $30.8 million March 7, 2024 23 quarterly payments of $847,500. Balloon installment of $14,660,000 after 23rd quarterly installment Floating - LIBOR plus a 2.50% margin p.a. 59.4% ICBC Facility Bacon, Castellani, Marini, Morandi, Nasaka 6 years / 5 years / 5 years / 6 years / 5 years $76.5 million May 15, 2026 32 quarterly payments of $1,366,668. Balloon installment of $38,266,624 after 32nd quarterly installment Floating - LIBOR plus a 2.85% margin p.a. 53.3% CMB Facility Kelly 2 years $12.2 million April 13, 2028 40 quarterly payments of $219,576. Balloon installment of $4,325,970 after 40th quarterly installment Floating - LIBOR plus a 3.00% margin p.a. 50.2% Credit Suisse Facility Shiraga, Samsara, Stamos, Balla 8 years / 2 years / 7 years / 2 years $79.6 million January 24, 2023 20 quarterly payments of $2,085,000. Balloon installment of $48,300,00 payable together with 20th quarterly installment Floating - LIBOR plus a 2.50% margin p.a. 42.0% DVB / Marfa Facility Marfa 2 years $30.9 million September 23, 2023 22 quarterly payments of $583,333. Balloon installment of $21,000,000 payable after 22nd quarterly installment Floating - LIBOR plus a 2.50% margin p.a. 56.5% Total $386.8 million 49.1% Appendix Source: Company loan agreements Note: Excludes outstanding legal fees 1. Based on company model as of July 2019 2. Botafogo is a tanker 3. Excludes scrubber facility of $6.4mm Drybulk Tankers 1 2 Debt Overview 44
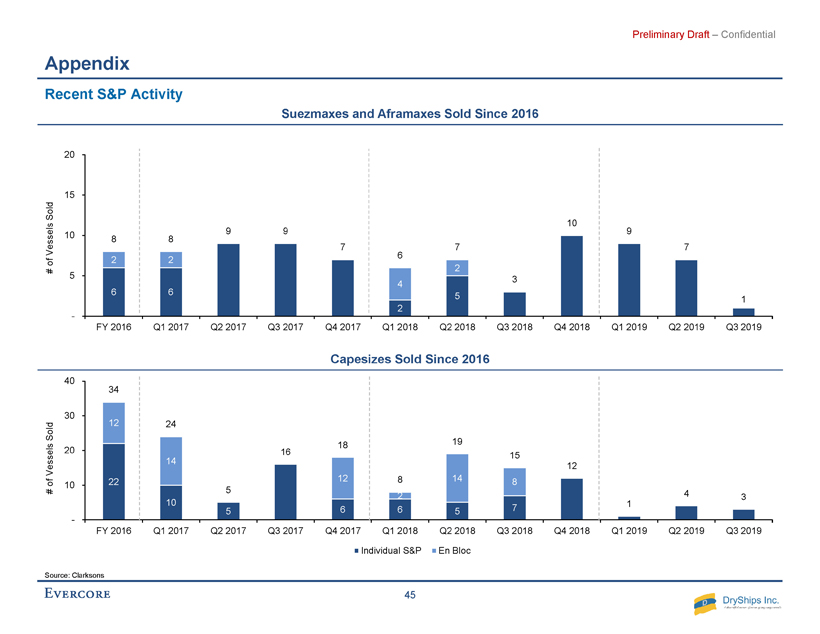
R - 38 G - 77 B - 130 R - 106 G - 151 B - 212 R - 235 G - 133 B - 33 R - 0 G - 134 B - 0 R - 250 G - 202 B - 0 R - 193 G - 2 B - 2 R - 100 G - 100 B - 100 R - 0 G - 105 B - 170 R - 236 G - 163 B - 33 R - 138 G - 173 B - 70 R - 255 G - 219 B - 67 R - 221 G - 70 B - 55 R - 191 G - 191 B - 191 R - 240 G - 181 B - 74 R - 189 G - 209 B - 143 R - 209 G - 226 B - 255 R - 106 G - 151 B - 212 R - 183 G - 205 B - 235 R - 217 G - 217 B - 217 R - 158 G - 198 B - 197 R - 200 G - 222 B - 222 R - 191 G - 191 B - 191 R - 38 G - 77 B - 130 R - 193 G - 2 B - 2 Accent colors/ contrasting colors: R - 0 G - 134 B - 0 R - 235 G - 133 B - 33 R - 250 G - 202 B - 0 R - 170 G - 54 B - 206 Excel chart colors: For basic graphics, diagrams: Light gray for default Word table fill, callout boxes and annotated boxes: R - 234 G - 234 B - 234 Word tables: 3pt border, R - 38,G - 77,B - 130 Highlight colors: R - 106 G - 151 B - 212 R - 235 G - 133 B - 33 R - 0 G - 134 B - 0 R - 250 G - 202 B - 0 R - 219 G - 230 B - 245 R - 245 G - 192 B - 139 R - 201 G - 255 B - 201 R - 255 G - 235 B - 151 Group 1: For text, wireframe, borders, colored bullets: Group 2: For fills and larger areas of colors, e.g., Word table fill: Secondary colored font: R - 0 G - 105 B - 170 Primary colored font: R - 38 G - 77 B - 130 Preliminary Draft – Confidential 6 6 2 5 1 2 2 4 2 8 8 9 9 7 6 7 3 10 9 7 - 5 10 15 20 FY 2016 Q1 2017 Q2 2017 Q3 2017 Q4 2017 Q1 2018 Q2 2018 Q3 2018 Q4 2018 Q1 2019 Q2 2019 Q3 2019 # of Vessels Sold Appendix Recent S&P Activity Source: Clarksons Suezmaxes and Aframaxes Sold Since 2016 Capesizes Sold Since 2016 22 10 5 6 6 5 7 12 14 12 2 14 8 34 24 5 16 18 8 19 15 12 1 4 3 - 10 20 30 40 FY 2016 Q1 2017 Q2 2017 Q3 2017 Q4 2017 Q1 2018 Q2 2018 Q3 2018 Q4 2018 Q1 2019 Q2 2019 Q3 2019 # of Vessels Sold Individual S&P En Bloc 45

R - 38 G - 77 B - 130 R - 106 G - 151 B - 212 R - 235 G - 133 B - 33 R - 0 G - 134 B - 0 R - 250 G - 202 B - 0 R - 193 G - 2 B - 2 R - 100 G - 100 B - 100 R - 0 G - 105 B - 170 R - 236 G - 163 B - 33 R - 138 G - 173 B - 70 R - 255 G - 219 B - 67 R - 221 G - 70 B - 55 R - 191 G - 191 B - 191 R - 240 G - 181 B - 74 R - 189 G - 209 B - 143 R - 209 G - 226 B - 255 R - 106 G - 151 B - 212 R - 183 G - 205 B - 235 R - 217 G - 217 B - 217 R - 158 G - 198 B - 197 R - 200 G - 222 B - 222 R - 191 G - 191 B - 191 R - 38 G - 77 B - 130 R - 193 G - 2 B - 2 Accent colors/ contrasting colors: R - 0 G - 134 B - 0 R - 235 G - 133 B - 33 R - 250 G - 202 B - 0 R - 170 G - 54 B - 206 Excel chart colors: For basic graphics, diagrams: Light gray for default Word table fill, callout boxes and annotated boxes: R - 234 G - 234 B - 234 Word tables: 3pt border, R - 38,G - 77,B - 130 Highlight colors: R - 106 G - 151 B - 212 R - 235 G - 133 B - 33 R - 0 G - 134 B - 0 R - 250 G - 202 B - 0 R - 219 G - 230 B - 245 R - 245 G - 192 B - 139 R - 201 G - 255 B - 201 R - 255 G - 235 B - 151 Group 1: For text, wireframe, borders, colored bullets: Group 2: For fills and larger areas of colors, e.g., Word table fill: Secondary colored font: R - 0 G - 105 B - 170 Primary colored font: R - 38 G - 77 B - 130 Preliminary Draft – Confidential Appendix DryShips Standalone WACC Analysis – Theoretical CAPM ($ in millions, except per share amounts) Beta and Capital Structure Benchmarking Weighted Average Cost of Capital Cost of Equity – Sensitivities WACC – Sensitivities Arithmetic Avg. Premium Supply Side Premium Target Debt / Capitalization Target Debt / Capitalization 45.0% 50.0% 55.0% 45.0% 50.0% 55.0% 0.38 9.6% 10.0% 10.6% 0.38 9.0% 9.5% 10.0% 0.43 10.2% 10.8% 11.4% 0.43 9.6% 10.1% 10.7% 0.48 10.9% 11.5% 12.2% 0.48 10.2% 10.7% 11.4% 0.49 11.0% 11.6% 12.4% 0.49 10.3% 10.9% 11.5% 0.50 11.1% 11.8% 12.5% 0.50 10.4% 11.0% 11.7% Unlevered Beta Arithmetic Avg. Premium Supply Side Premium Target Debt / Capitalization Target Debt / Capitalization 45.0% 50.0% 55.0% 45.0% 50.0% 55.0% 0.38 8.0% 8.0% 8.1% 0.38 7.7% 7.8% 7.8% 0.43 8.3% 8.4% 8.5% 0.43 8.0% 8.1% 8.1% 0.48 8.7% 8.8% 8.8% 0.48 8.3% 8.4% 8.5% 0.49 8.8% 8.8% 8.9% 0.49 8.4% 8.5% 8.5% 0.50 8.8% 8.9% 9.0% 0.50 8.5% 8.5% 8.6% Unlevered Beta Source: FactSet, Bloomberg, Duff & Phelps, market data as of 7/26/19 Note: Total debt includes preferred equity; any existing debt balance is updated for market values when available 1. U.S. Treasury 20 - year note current yield to maturity as of 7/26/19 2. Based on 2019 Duff & Phelps estimate 3. Based on 2019 Duff & Phelps estimate, based on the decile breakdown for approximate NAV of $613 million 4. Cost of debt is estimated based with a current average margin of ~3.0% (from the Company’s internal model) plus 5 - year LIBOR swap of 3.05% 5. Bloomberg 2 - year adjusted beta as of 7/26/19 Share Price Market Total Debt + Pref / Adjusted (5) Unlevered Ticker Company 7/26/19 Equity Value Debt + Pref Capital Beta Beta DHT DHT Holdings $5.91 $839 $940 52.8% 0.77 0.36 EURN Euronav 8.83 1,913 1,790 48.3% 1.03 0.53 FRO Frontline 8.05 1,368 1,721 55.7% 1.09 0.48 INSW International Seaways Inc. 17.40 511 806 61.2% 1.03 0.40 NAT Nordic American Tankers 2.11 300 416 58.1% 1.30 0.54 TNK Teekay Tankers 1.25 338 716 67.9% 1.09 0.35 Tanker Mean 57.4% 1.05 0.44 Tanker Median 56.9% 1.06 0.44 DSX Diana Shipping inc. $3.66 $368 $506 57.9% 0.78 0.33 EGLE Eagle Bulk 4.50 329 321 49.4% 1.13 0.57 GNK Genco 9.98 418 535 56.1% 1.31 0.57 GOGL-US Golden Ocean Group Limited 6.47 936 1,163 55.4% 1.25 0.56 SB Safe Bulkers 2.18 221 580 72.4% 1.26 0.35 SALT Scorpio Bulkers Inc. 6.38 462 896 66.0% 1.11 0.38 SBLK Star Bulk 10.40 985 1,422 59.1% 1.30 0.53 Drybulk Mean 59.5% 1.16 0.47 Dybulk Median 57.9% 1.25 0.53 Total Mean 58.5% 1.11 0.46 Total Median 57.9% 1.11 0.48 DRYS DryShips $3.93 $341 $391 53.4% 0.81 0.38 Arithmetic Avg. Supply Side Peers Target Peers Target Risk Free Rate 1 2.4% 2.4% 2.4% 2.4% Unlevered Beta 0.48 0.38 0.48 0.38 Adj. Relevered Beta 0.96 0.81 0.96 0.81 Equity Risk Premium 2 6.9% 6.9% 6.1% 6.1% Size Premium 3 2.5% 3.5% 2.5% 3.5% Cost of Equity 11.5% 11.4% 10.7% 10.8% Tax Rate 0.0% 0.0% 0.0% 0.0% Target Debt / Capitalization 50.0% 50.0% 50.0% 50.0% Pre-Tax Cost of Debt 4 6.0% 6.0% 6.0% 6.0% After-Tax Cost of Debt 6.0% 6.0% 6.0% 6.0% WACC 8.8% 8.7% 8.4% 8.4% 46

R - 38 G - 77 B - 130 R - 106 G - 151 B - 212 R - 235 G - 133 B - 33 R - 0 G - 134 B - 0 R - 250 G - 202 B - 0 R - 193 G - 2 B - 2 R - 100 G - 100 B - 100 R - 0 G - 105 B - 170 R - 236 G - 163 B - 33 R - 138 G - 173 B - 70 R - 255 G - 219 B - 67 R - 221 G - 70 B - 55 R - 191 G - 191 B - 191 R - 240 G - 181 B - 74 R - 189 G - 209 B - 143 R - 209 G - 226 B - 255 R - 106 G - 151 B - 212 R - 183 G - 205 B - 235 R - 217 G - 217 B - 217 R - 158 G - 198 B - 197 R - 200 G - 222 B - 222 R - 191 G - 191 B - 191 R - 38 G - 77 B - 130 R - 193 G - 2 B - 2 Accent colors/ contrasting colors: R - 0 G - 134 B - 0 R - 235 G - 133 B - 33 R - 250 G - 202 B - 0 R - 170 G - 54 B - 206 Excel chart colors: For basic graphics, diagrams: Light gray for default Word table fill, callout boxes and annotated boxes: R - 234 G - 234 B - 234 Word tables: 3pt border, R - 38,G - 77,B - 130 Highlight colors: R - 106 G - 151 B - 212 R - 235 G - 133 B - 33 R - 0 G - 134 B - 0 R - 250 G - 202 B - 0 R - 219 G - 230 B - 245 R - 245 G - 192 B - 139 R - 201 G - 255 B - 201 R - 255 G - 235 B - 151 Group 1: For text, wireframe, borders, colored bullets: Group 2: For fills and larger areas of colors, e.g., Word table fill: Secondary colored font: R - 0 G - 105 B - 170 Primary colored font: R - 38 G - 77 B - 130 Preliminary Draft – Confidential Appendix Heidmar Standalone Cost of Equity Analysis – Theoretical CAPM ($ in millions, except per share amounts) Beta and Capital Structure Benchmarking Cost of Equity Cost of Equity – Sensitivities Share Market Price Equity Total Debt + Pref / Adjusted 4 Unlevered Ticker Company 7/26/19 Value Debt + Pref Capital Beta Beta DHT DHT Holdings $5.91 $839 $940 52.8% 0.77 0.36 EURN Euronav 8.83 1,913 1,790 48.3% 1.03 0.53 FRO Frontline 8.05 1,368 1,721 55.7% 1.09 0.48 INSW International Seaways Inc. 17.40 511 806 61.2% 1.03 0.40 NAT Nordic American Tankers 2.11 300 416 58.1% 1.30 0.54 TNK Teekay Tankers 1.25 338 716 67.9% 1.09 0.35 Mean 57.4% 1.05 0.44 Median 56.9% 1.06 0.44 Arithmetic Avg. Supply Side Peers Peers Risk Free Rate 1 2.4% 2.4% Unlevered Beta 0.44 0.44 Adj. Relevered Beta 0.44 0.44 Equity Risk Premium 2 6.9% 6.1% Size Premium 3 5.3% 5.3% Cost of Equity 10.7% 10.4% Tax Rate 0.0% 0.0% Target Debt / Capitalization 0.0% 0.0% Source: FactSet, Bloomberg, Duff & Phelps, market data as of 7/26/19 Note: Total debt includes preferred equity; any existing debt balance is updated for market values when available 1. U.S. Treasury 20 - year note current yield to maturity as of 7/26/19 2. Based on 2019 Duff & Phelps estimate 3. Based on estimate from previous fairness opinion, which used Damodaran , Duff & Phelps and KPMG’s survey report; based on decile breakdown of $127 - $190mm market capitalization 4. Bloomberg 2 - year adjusted beta as of 7/26/19 Arithmetic Avg. Premium Supply Side Premium Size Premium Size Premium 5.3% 5.3% 0.42 10.6% 0.42 10.2% 0.43 10.6% 0.43 10.3% 0.44 10.7% 0.44 10.4% 0.45 10.8% 0.45 10.5% 0.47 10.9% 0.47 10.5% Unlevered Beta Unlevered Beta 47