Exhibit (c)(4)
[Either insert client logo (height about 1”) above line if it is high resolution, or type client name.] Discussion Materials Regarding Project Dallas August 6, 2019 DryShips Inc. PRELIMINARY DRAFT SUBJECT TO MATERIAL CHANGES
R - 38 G - 77 B - 130 R - 106 G - 151 B - 212 R - 235 G - 133 B - 33 R - 0 G - 134 B - 0 R - 250 G - 202 B - 0 R - 193 G - 2 B - 2 R - 100 G - 100 B - 100 R - 0 G - 105 B - 170 R - 236 G - 163 B - 33 R - 138 G - 173 B - 70 R - 255 G - 219 B - 67 R - 221 G - 70 B - 55 R - 191 G - 191 B - 191 R - 240 G - 181 B - 74 R - 189 G - 209 B - 143 R - 209 G - 226 B - 255 R - 106 G - 151 B - 212 R - 183 G - 205 B - 235 R - 217 G - 217 B - 217 R - 158 G - 198 B - 197 R - 200 G - 222 B - 222 R - 191 G - 191 B - 191 R - 38 G - 77 B - 130 R - 193 G - 2 B - 2 Accent colors/ contrasting colors: R - 0 G - 134 B - 0 R - 235 G - 133 B - 33 R - 250 G - 202 B - 0 R - 170 G - 54 B - 206 Excel chart colors: For basic graphics, diagrams: Light gray for default Word table fill, callout boxes and annotated boxes: R - 234 G - 234 B - 234 Word tables: 3pt border, R - 38,G - 77,B - 130 Highlight colors: R - 106 G - 151 B - 212 R - 235 G - 133 B - 33 R - 0 G - 134 B - 0 R - 250 G - 202 B - 0 R - 219 G - 230 B - 245 R - 245 G - 192 B - 139 R - 201 G - 255 B - 201 R - 255 G - 235 B - 151 Group 1: For text, wireframe, borders, colored bullets: Group 2: For fills and larger areas of colors, e.g., Word table fill: Secondary colored font: R - 0 G - 105 B - 170 Primary colored font: R - 38 G - 77 B - 130 Preliminary Draft – Confidential These materials have been prepared by Evercore Group L . L . C . (“Evercore”) on behalf of the Special Committee of DryShips , Inc . for SPII Holdings (the “Company ”) to whom such materials are directly addressed and delivered and may not be used or relied upon for any purpose other than as specifically contemplated . These materials are based on information provided by or on behalf of the Company and/or other potential transaction participants, from public sources or otherwise reviewed by Evercore . Evercore assumes no responsibility for independent investigation or verification of such information and has relied on such information being complete and accurate in all material respects . To the extent such information includes estimates and forecasts of future financial performance prepared by or reviewed with the management of the Company and/or other potential transaction participants or obtained from public sources, Evercore has assumed that such estimates and forecasts have been reasonably prepared on bases reflecting the best currently available estimates and judgments of such management (or, with respect to estimates and forecasts obtained from public sources, represent reasonable estimates) . No representation or warranty, express or implied, is made as to the accuracy or completeness of such information and nothing contained herein is, or shall be relied upon as, a representation, whether as to the past, the present or the future . These materials were designed for use by specific persons familiar with the business and affairs of the Company . These materials are not intended to provide the sole basis for evaluating, and should not be considered a recommendation with respect to, any transaction or other matter . These materials have been developed by and are proprietary to Evercore and were prepared exclusively for the benefit and internal use of the Company . These materials were compiled on a confidential basis for use by the Company in evaluating the potential transaction described herein and not with a view to public disclosure or filing thereof under state or federal securities laws, and may not be reproduced, disseminated, quoted or referred to, in whole or in part, without the prior written consent of Evercore . These materials do not constitute an offer or solicitation to sell or purchase any securities and are not a commitment by Evercore (or any affiliate) to provide or arrange any financing for any transaction or to purchase any security in connection therewith . Evercore assumes no obligation to update or otherwise revise these materials . These materials may not reflect information known to other professionals in other business areas of Evercore and its affiliates . Evercore and its affiliates do not provide legal, accounting or tax advice . Accordingly, any statements contained herein as to tax matters were neither written nor intended by Evercore or its affiliates to be used and cannot be used by any taxpayer for the purpose of avoiding tax penalties that may be imposed on such taxpayer . Each person should seek legal, accounting and tax advice based on his, her or its particular circumstances from independent advisors regarding the impact of the transactions or matters described herein . Note, this disclaimer page should follow the title page in presentations. Please fill out the [blanks] in the text.

R - 38 G - 77 B - 130 R - 106 G - 151 B - 212 R - 235 G - 133 B - 33 R - 0 G - 134 B - 0 R - 250 G - 202 B - 0 R - 193 G - 2 B - 2 R - 100 G - 100 B - 100 R - 0 G - 105 B - 170 R - 236 G - 163 B - 33 R - 138 G - 173 B - 70 R - 255 G - 219 B - 67 R - 221 G - 70 B - 55 R - 191 G - 191 B - 191 R - 240 G - 181 B - 74 R - 189 G - 209 B - 143 R - 209 G - 226 B - 255 R - 106 G - 151 B - 212 R - 183 G - 205 B - 235 R - 217 G - 217 B - 217 R - 158 G - 198 B - 197 R - 200 G - 222 B - 222 R - 191 G - 191 B - 191 R - 38 G - 77 B - 130 R - 193 G - 2 B - 2 Accent colors/ contrasting colors: R - 0 G - 134 B - 0 R - 235 G - 133 B - 33 R - 250 G - 202 B - 0 R - 170 G - 54 B - 206 Excel chart colors: For basic graphics, diagrams: Light gray for default Word table fill, callout boxes and annotated boxes: R - 234 G - 234 B - 234 Word tables: 3pt border, R - 38,G - 77,B - 130 Highlight colors: R - 106 G - 151 B - 212 R - 235 G - 133 B - 33 R - 0 G - 134 B - 0 R - 250 G - 202 B - 0 R - 219 G - 230 B - 245 R - 245 G - 192 B - 139 R - 201 G - 255 B - 201 R - 255 G - 235 B - 151 Group 1: For text, wireframe, borders, colored bullets: Group 2: For fills and larger areas of colors, e.g., Word table fill: Secondary colored font: R - 0 G - 105 B - 170 Primary colored font: R - 38 G - 77 B - 130 Preliminary Draft – Confidential $3.67 $5.07 $4.50 $2.00 $2.50 $3.00 $3.50 $4.00 $4.50 $5.00 $5.50 $6.00 $6.50 $7.00 Aug-18 Sep-18 Oct-18 Nov-18 Dec-18 Feb-19 Mar-19 Apr-19 May-19 Jun-19 Aug-19 Stock Price ($) Discussion Materials Regarding Project Dallas The Take Private Offer Coincided with DRYS’ 52 - Week Low and Lows Among Industry Peers Source: FactSet as of 8/2/2019, Company filings 6/12/19 : DryShips share price reaches 52 - week low of $3.16 1/7/19 : DryShips share price reaches 52 - week high of $6.75 The revised offer of $4.50 is below the LTM VWAP of $5.07 and 33% below DRYS’ 52 - week high LTM VWAP: $5.07 Revised Offer Price: $4.50 6/13/19 : DryShips receives and announces receipt of acquisition proposal 1

R - 38 G - 77 B - 130 R - 106 G - 151 B - 212 R - 235 G - 133 B - 33 R - 0 G - 134 B - 0 R - 250 G - 202 B - 0 R - 193 G - 2 B - 2 R - 100 G - 100 B - 100 R - 0 G - 105 B - 170 R - 236 G - 163 B - 33 R - 138 G - 173 B - 70 R - 255 G - 219 B - 67 R - 221 G - 70 B - 55 R - 191 G - 191 B - 191 R - 240 G - 181 B - 74 R - 189 G - 209 B - 143 R - 209 G - 226 B - 255 R - 106 G - 151 B - 212 R - 183 G - 205 B - 235 R - 217 G - 217 B - 217 R - 158 G - 198 B - 197 R - 200 G - 222 B - 222 R - 191 G - 191 B - 191 R - 38 G - 77 B - 130 R - 193 G - 2 B - 2 Accent colors/ contrasting colors: R - 0 G - 134 B - 0 R - 235 G - 133 B - 33 R - 250 G - 202 B - 0 R - 170 G - 54 B - 206 Excel chart colors: For basic graphics, diagrams: Light gray for default Word table fill, callout boxes and annotated boxes: R - 234 G - 234 B - 234 Word tables: 3pt border, R - 38,G - 77,B - 130 Highlight colors: R - 106 G - 151 B - 212 R - 235 G - 133 B - 33 R - 0 G - 134 B - 0 R - 250 G - 202 B - 0 R - 219 G - 230 B - 245 R - 245 G - 192 B - 139 R - 201 G - 255 B - 201 R - 255 G - 235 B - 151 Group 1: For text, wireframe, borders, colored bullets: Group 2: For fills and larger areas of colors, e.g., Word table fill: Secondary colored font: R - 0 G - 105 B - 170 Primary colored font: R - 38 G - 77 B - 130 Preliminary Draft – Confidential Discussion Materials Regarding Project Dallas Recent Repurchase Activity Occurred at Prices Exceeding the Offer Price Source: Company Management, FactSet as of August 2, 2019 1. Weighted by shares repurchased Feb. – Sept. 2018 Average Repurchase Price: $4.60 October 5, 2018 Announcement (Initial Share Repurchase Program): $50.2 Million in Size Repurchased 10.864 million shares of its common stock at an average price of $4.60 per share February 28, 2019 Announcement (Recent Share Repurchase Program): $37.3 Million in Size Repurchased 6.524 million shares of its common stock at an average price of $5.69 per share 1 2 $3.93 $5.13 $4.50 $2.00 $3.00 $4.00 $5.00 $6.00 $7.00 Mar-18 Apr-18 Jun-18 Aug-18 Sep-18 Nov-18 Jan-19 Mar-19 Apr-19 Jun-19 Aug-19 Aggregate Average Repurchase Price Revised Offer Price Oct. – Dec. 2018 Average Repurchase Price : $ 5.69 2
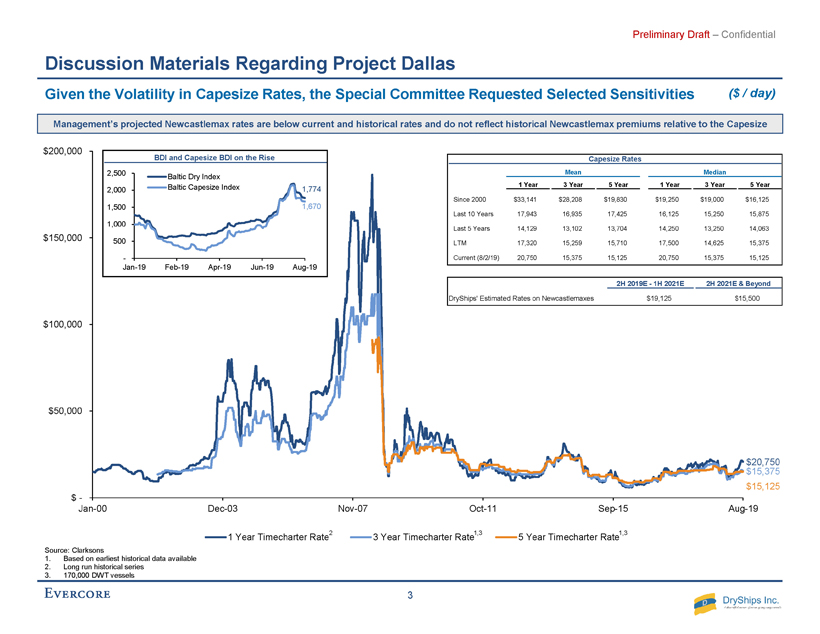
R - 38 G - 77 B - 130 R - 106 G - 151 B - 212 R - 235 G - 133 B - 33 R - 0 G - 134 B - 0 R - 250 G - 202 B - 0 R - 193 G - 2 B - 2 R - 100 G - 100 B - 100 R - 0 G - 105 B - 170 R - 236 G - 163 B - 33 R - 138 G - 173 B - 70 R - 255 G - 219 B - 67 R - 221 G - 70 B - 55 R - 191 G - 191 B - 191 R - 240 G - 181 B - 74 R - 189 G - 209 B - 143 R - 209 G - 226 B - 255 R - 106 G - 151 B - 212 R - 183 G - 205 B - 235 R - 217 G - 217 B - 217 R - 158 G - 198 B - 197 R - 200 G - 222 B - 222 R - 191 G - 191 B - 191 R - 38 G - 77 B - 130 R - 193 G - 2 B - 2 Accent colors/ contrasting colors: R - 0 G - 134 B - 0 R - 235 G - 133 B - 33 R - 250 G - 202 B - 0 R - 170 G - 54 B - 206 Excel chart colors: For basic graphics, diagrams: Light gray for default Word table fill, callout boxes and annotated boxes: R - 234 G - 234 B - 234 Word tables: 3pt border, R - 38,G - 77,B - 130 Highlight colors: R - 106 G - 151 B - 212 R - 235 G - 133 B - 33 R - 0 G - 134 B - 0 R - 250 G - 202 B - 0 R - 219 G - 230 B - 245 R - 245 G - 192 B - 139 R - 201 G - 255 B - 201 R - 255 G - 235 B - 151 Group 1: For text, wireframe, borders, colored bullets: Group 2: For fills and larger areas of colors, e.g., Word table fill: Secondary colored font: R - 0 G - 105 B - 170 Primary colored font: R - 38 G - 77 B - 130 Preliminary Draft – Confidential $20,750 $15,375 $15,125 $ - $50,000 $100,000 $150,000 $200,000 Jan-00 Dec-03 Nov-07 Oct-11 Sep-15 Aug-19 1 Year Timecharter Rate 3 Year Timecharter Rate 5 Year Timecharter Rate Discussion Materials Regarding Project Dallas Given the Volatility in Capesize Rates, the Special Committee Requested Selected Sensitivities ($ / day) Source: Clarksons 1. Based on earliest historical data available 2. Long run historical series 3. 170,000 DWT vessels 2 1,3 1,3 Capesize Rates Mean Median 1 Year 3 Year 5 Year 1 Year 3 Year 5 Year Since 2000 $33,141 $28,208 $19,830 $19,250 $19,000 $16,125 Last 10 Years 17,943 16,935 17,425 16,125 15,250 15,875 Last 5 Years 14,129 13,102 13,704 14,250 13,250 14,063 LTM 17,320 15,259 15,710 17,500 14,625 15,375 Current (8/2/19) 20,750 15,375 15,125 20,750 15,375 15,125 2H 2019E - 1H 2021E 2H 2021E & Beyond DryShips' Estimated Rates on Newcastlemaxes $19,125 $15,500 Management’s projected Newcastlemax rates are below current and historical rates and do not reflect historical Newcastlemax premiums relative to the Capesize BDI and Capesize BDI on the Rise 1,774 1,670 - 500 1,000 1,500 2,000 2,500 Jan-19 Feb-19 Apr-19 Jun-19 Aug-19 Baltic Dry Index Baltic Capesize Index 3
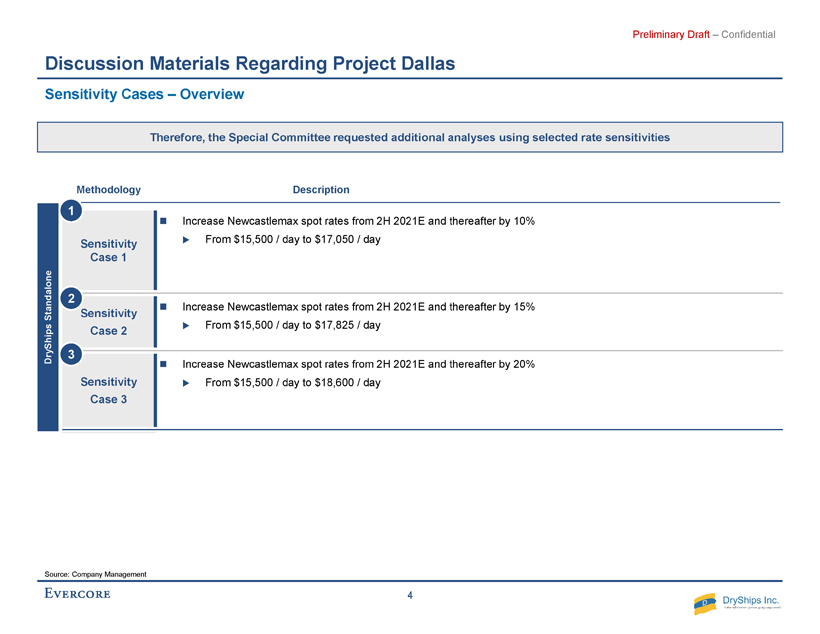
R - 38 G - 77 B - 130 R - 106 G - 151 B - 212 R - 235 G - 133 B - 33 R - 0 G - 134 B - 0 R - 250 G - 202 B - 0 R - 193 G - 2 B - 2 R - 100 G - 100 B - 100 R - 0 G - 105 B - 170 R - 236 G - 163 B - 33 R - 138 G - 173 B - 70 R - 255 G - 219 B - 67 R - 221 G - 70 B - 55 R - 191 G - 191 B - 191 R - 240 G - 181 B - 74 R - 189 G - 209 B - 143 R - 209 G - 226 B - 255 R - 106 G - 151 B - 212 R - 183 G - 205 B - 235 R - 217 G - 217 B - 217 R - 158 G - 198 B - 197 R - 200 G - 222 B - 222 R - 191 G - 191 B - 191 R - 38 G - 77 B - 130 R - 193 G - 2 B - 2 Accent colors/ contrasting colors: R - 0 G - 134 B - 0 R - 235 G - 133 B - 33 R - 250 G - 202 B - 0 R - 170 G - 54 B - 206 Excel chart colors: For basic graphics, diagrams: Light gray for default Word table fill, callout boxes and annotated boxes: R - 234 G - 234 B - 234 Word tables: 3pt border, R - 38,G - 77,B - 130 Highlight colors: R - 106 G - 151 B - 212 R - 235 G - 133 B - 33 R - 0 G - 134 B - 0 R - 250 G - 202 B - 0 R - 219 G - 230 B - 245 R - 245 G - 192 B - 139 R - 201 G - 255 B - 201 R - 255 G - 235 B - 151 Group 1: For text, wireframe, borders, colored bullets: Group 2: For fills and larger areas of colors, e.g., Word table fill: Secondary colored font: R - 0 G - 105 B - 170 Primary colored font: R - 38 G - 77 B - 130 Preliminary Draft – Confidential Discussion Materials Regarding Project Dallas Source: Company Management Sensitivity Cases – Overview Methodology Description Sensitivity Case 1 Increase Newcastlemax spot rates from 2H 2021E and thereafter by 10% From $15,500 / day to $17,050 / day Sensitivity Case 2 Increase Newcastlemax spot rates from 2H 2021E and thereafter by 15% From $15,500 / day to $17,825 / day Sensitivity Case 3 Increase Newcastlemax spot rates from 2H 2021E and thereafter by 20% From $15,500 / day to $18,600 / day DryShips Standalone 1 2 3 Therefore, the Special Committee requested additional analyses using selected rate sensitivities 4
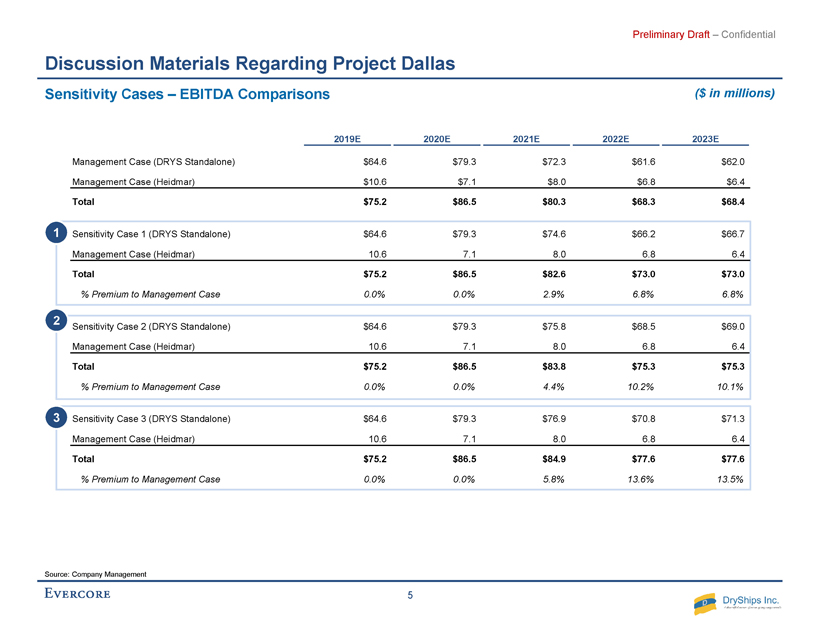
R - 38 G - 77 B - 130 R - 106 G - 151 B - 212 R - 235 G - 133 B - 33 R - 0 G - 134 B - 0 R - 250 G - 202 B - 0 R - 193 G - 2 B - 2 R - 100 G - 100 B - 100 R - 0 G - 105 B - 170 R - 236 G - 163 B - 33 R - 138 G - 173 B - 70 R - 255 G - 219 B - 67 R - 221 G - 70 B - 55 R - 191 G - 191 B - 191 R - 240 G - 181 B - 74 R - 189 G - 209 B - 143 R - 209 G - 226 B - 255 R - 106 G - 151 B - 212 R - 183 G - 205 B - 235 R - 217 G - 217 B - 217 R - 158 G - 198 B - 197 R - 200 G - 222 B - 222 R - 191 G - 191 B - 191 R - 38 G - 77 B - 130 R - 193 G - 2 B - 2 Accent colors/ contrasting colors: R - 0 G - 134 B - 0 R - 235 G - 133 B - 33 R - 250 G - 202 B - 0 R - 170 G - 54 B - 206 Excel chart colors: For basic graphics, diagrams: Light gray for default Word table fill, callout boxes and annotated boxes: R - 234 G - 234 B - 234 Word tables: 3pt border, R - 38,G - 77,B - 130 Highlight colors: R - 106 G - 151 B - 212 R - 235 G - 133 B - 33 R - 0 G - 134 B - 0 R - 250 G - 202 B - 0 R - 219 G - 230 B - 245 R - 245 G - 192 B - 139 R - 201 G - 255 B - 201 R - 255 G - 235 B - 151 Group 1: For text, wireframe, borders, colored bullets: Group 2: For fills and larger areas of colors, e.g., Word table fill: Secondary colored font: R - 0 G - 105 B - 170 Primary colored font: R - 38 G - 77 B - 130 Preliminary Draft – Confidential Discussion Materials Regarding Project Dallas Sensitivity Cases – EBITDA Comparisons ($ in millions) Source: Company Management 2019E 2020E 2021E 2022E 2023E Management Case (DRYS Standalone) $64.6 $79.3 $72.3 $61.6 $62.0 Management Case (Heidmar) $10.6 $7.1 $8.0 $6.8 $6.4 Total $75.2 $86.5 $80.3 $68.3 $68.4 Sensitivity Case 1 (DRYS Standalone) $64.6 $79.3 $74.6 $66.2 $66.7 Management Case (Heidmar) 10.6 7.1 8.0 6.8 6.4 Total $75.2 $86.5 $82.6 $73.0 $73.0 % Premium to Management Case 0.0% 0.0% 2.9% 6.8% 6.8% Sensitivity Case 2 (DRYS Standalone) $64.6 $79.3 $75.8 $68.5 $69.0 Management Case (Heidmar) 10.6 7.1 8.0 6.8 6.4 Total $75.2 $86.5 $83.8 $75.3 $75.3 % Premium to Management Case 0.0% 0.0% 4.4% 10.2% 10.1% Sensitivity Case 3 (DRYS Standalone) $64.6 $79.3 $76.9 $70.8 $71.3 Management Case (Heidmar) 10.6 7.1 8.0 6.8 6.4 Total $75.2 $86.5 $84.9 $77.6 $77.6 % Premium to Management Case 0.0% 0.0% 5.8% 13.6% 13.5% 1 2 3 5
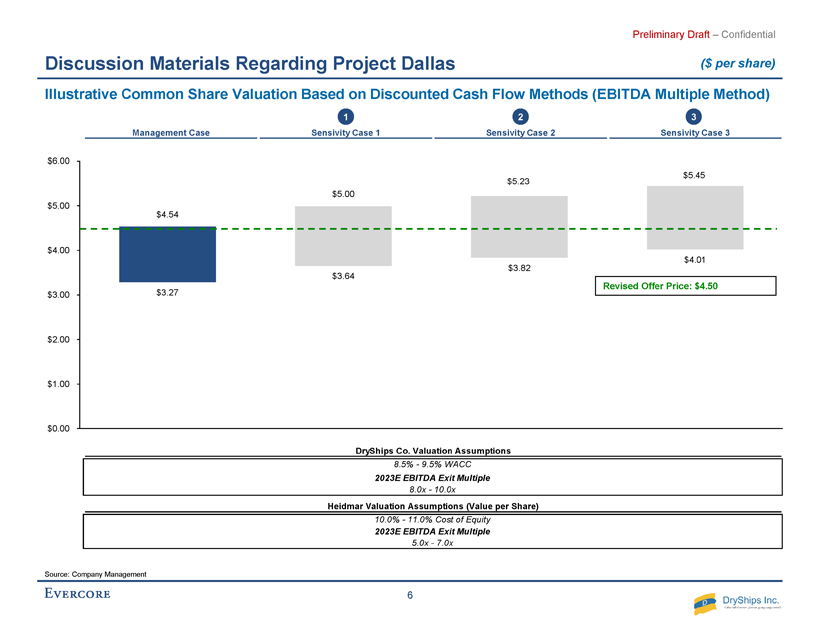
R - 38 G - 77 B - 130 R - 106 G - 151 B - 212 R - 235 G - 133 B - 33 R - 0 G - 134 B - 0 R - 250 G - 202 B - 0 R - 193 G - 2 B - 2 R - 100 G - 100 B - 100 R - 0 G - 105 B - 170 R - 236 G - 163 B - 33 R - 138 G - 173 B - 70 R - 255 G - 219 B - 67 R - 221 G - 70 B - 55 R - 191 G - 191 B - 191 R - 240 G - 181 B - 74 R - 189 G - 209 B - 143 R - 209 G - 226 B - 255 R - 106 G - 151 B - 212 R - 183 G - 205 B - 235 R - 217 G - 217 B - 217 R - 158 G - 198 B - 197 R - 200 G - 222 B - 222 R - 191 G - 191 B - 191 R - 38 G - 77 B - 130 R - 193 G - 2 B - 2 Accent colors/ contrasting colors: R - 0 G - 134 B - 0 R - 235 G - 133 B - 33 R - 250 G - 202 B - 0 R - 170 G - 54 B - 206 Excel chart colors: For basic graphics, diagrams: Light gray for default Word table fill, callout boxes and annotated boxes: R - 234 G - 234 B - 234 Word tables: 3pt border, R - 38,G - 77,B - 130 Highlight colors: R - 106 G - 151 B - 212 R - 235 G - 133 B - 33 R - 0 G - 134 B - 0 R - 250 G - 202 B - 0 R - 219 G - 230 B - 245 R - 245 G - 192 B - 139 R - 201 G - 255 B - 201 R - 255 G - 235 B - 151 Group 1: For text, wireframe, borders, colored bullets: Group 2: For fills and larger areas of colors, e.g., Word table fill: Secondary colored font: R - 0 G - 105 B - 170 Primary colored font: R - 38 G - 77 B - 130 Preliminary Draft – Confidential Discussion Materials Regarding Project Dallas Source: Company Management Illustrative Common Share Valuation Based on Discounted Cash Flow Methods (EBITDA Multiple Method) Management Case Sensivity Case 1 Sensivity Case 2 Sensivity Case 3 DryShips Co. Valuation Assumptions 8.5% - 9.5% WACC 2023E EBITDA Exit Multiple 8.0x - 10.0x Heidmar Valuation Assumptions (Value per Share) 10.0% - 11.0% Cost of Equity 2023E EBITDA Exit Multiple 5.0x - 7.0x $3.27 $3.64 $3.82 $4.01 $4.54 $5.00 $5.23 $5.45 $0.00 $1.00 $2.00 $3.00 $4.00 $5.00 $6.00 Revised Offer Price: $4.50 1 2 3 ($ per share) 6
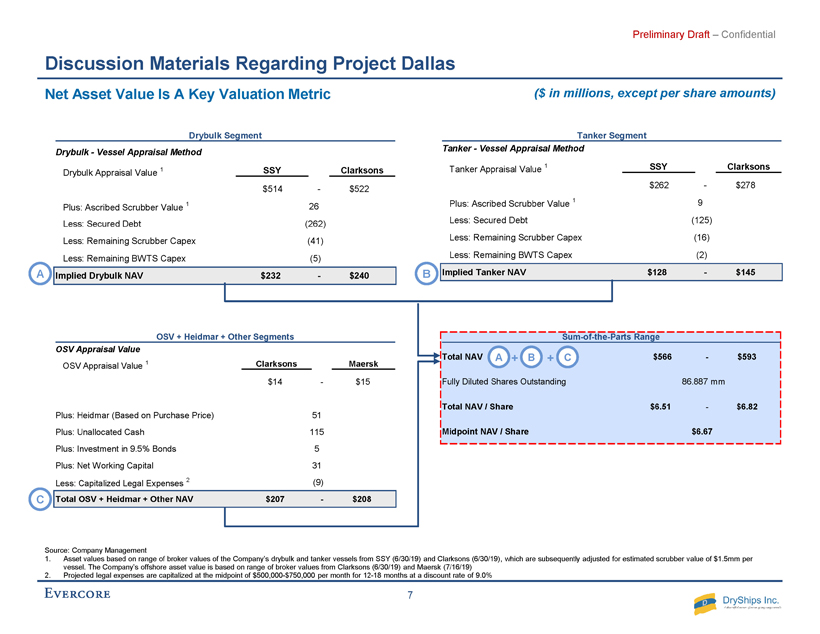
R - 38 G - 77 B - 130 R - 106 G - 151 B - 212 R - 235 G - 133 B - 33 R - 0 G - 134 B - 0 R - 250 G - 202 B - 0 R - 193 G - 2 B - 2 R - 100 G - 100 B - 100 R - 0 G - 105 B - 170 R - 236 G - 163 B - 33 R - 138 G - 173 B - 70 R - 255 G - 219 B - 67 R - 221 G - 70 B - 55 R - 191 G - 191 B - 191 R - 240 G - 181 B - 74 R - 189 G - 209 B - 143 R - 209 G - 226 B - 255 R - 106 G - 151 B - 212 R - 183 G - 205 B - 235 R - 217 G - 217 B - 217 R - 158 G - 198 B - 197 R - 200 G - 222 B - 222 R - 191 G - 191 B - 191 R - 38 G - 77 B - 130 R - 193 G - 2 B - 2 Accent colors/ contrasting colors: R - 0 G - 134 B - 0 R - 235 G - 133 B - 33 R - 250 G - 202 B - 0 R - 170 G - 54 B - 206 Excel chart colors: For basic graphics, diagrams: Light gray for default Word table fill, callout boxes and annotated boxes: R - 234 G - 234 B - 234 Word tables: 3pt border, R - 38,G - 77,B - 130 Highlight colors: R - 106 G - 151 B - 212 R - 235 G - 133 B - 33 R - 0 G - 134 B - 0 R - 250 G - 202 B - 0 R - 219 G - 230 B - 245 R - 245 G - 192 B - 139 R - 201 G - 255 B - 201 R - 255 G - 235 B - 151 Group 1: For text, wireframe, borders, colored bullets: Group 2: For fills and larger areas of colors, e.g., Word table fill: Secondary colored font: R - 0 G - 105 B - 170 Primary colored font: R - 38 G - 77 B - 130 Preliminary Draft – Confidential Discussion Materials Regarding Project Dallas Net Asset Value Is A Key Valuation Metric Source: Company Management 1. Asset values based on range of broker values of the Company’s drybulk and tanker vessels from SSY (6/30/19) and Clarksons (6/30/19), which are subsequently adjusted for estimated scrubber value of $1.5mm per vessel. The Company’s offshore asset value is based on range of broker values from Clarksons (6/30/19) and Maersk (7/16/19) 2. Projected legal expenses are capitalized at the midpoint of $500,000 - $750,000 per month for 12 - 18 months at a discount rate of 9.0% ($ in millions, except per share amounts ) Drybulk Segment Drybulk - Vessel Appraisal Method Drybulk Appraisal Value 1 SSY Clarksons $514 - $522 Plus: Ascribed Scrubber Value 1 26 Less: Secured Debt (262) Less: Remaining Scrubber Capex (41) Less: Remaining BWTS Capex (5) Implied Drybulk NAV $232 - $240 Tanker Segment Tanker - Vessel Appraisal Method Tanker Appraisal Value 1 SSY Clarksons $262 - $278 Plus: Ascribed Scrubber Value 1 9 Less: Secured Debt (125) Less: Remaining Scrubber Capex (16) Less: Remaining BWTS Capex (2) Implied Tanker NAV $128 - $145 OSV + Heidmar + Other Segments OSV Appraisal Value OSV Appraisal Value 1 Clarksons Maersk $14 - $15 Plus: Heidmar (Based on Purchase Price) 51 Plus: Unallocated Cash 115 Plus: Investment in 9.5% Bonds 5 Plus: Net Working Capital 31 Less: Capitalized Legal Expenses 2 (9) Total OSV + Heidmar + Other NAV $207 - $208 A B C Sum-of-the-Parts Range Total NAV $566 - $593 Fully Diluted Shares Outstanding 86.887mm Total NAV / Share $6.51 - $6.82 Midpoint NAV / Share $6.67 A B C + + 7
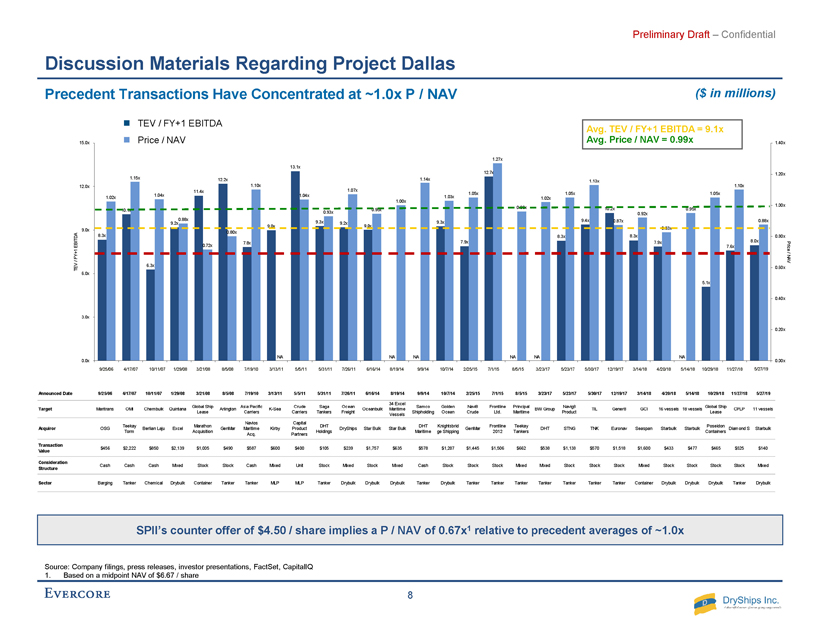
R - 38 G - 77 B - 130 R - 106 G - 151 B - 212 R - 235 G - 133 B - 33 R - 0 G - 134 B - 0 R - 250 G - 202 B - 0 R - 193 G - 2 B - 2 R - 100 G - 100 B - 100 R - 0 G - 105 B - 170 R - 236 G - 163 B - 33 R - 138 G - 173 B - 70 R - 255 G - 219 B - 67 R - 221 G - 70 B - 55 R - 191 G - 191 B - 191 R - 240 G - 181 B - 74 R - 189 G - 209 B - 143 R - 209 G - 226 B - 255 R - 106 G - 151 B - 212 R - 183 G - 205 B - 235 R - 217 G - 217 B - 217 R - 158 G - 198 B - 197 R - 200 G - 222 B - 222 R - 191 G - 191 B - 191 R - 38 G - 77 B - 130 R - 193 G - 2 B - 2 Accent colors/ contrasting colors: R - 0 G - 134 B - 0 R - 235 G - 133 B - 33 R - 250 G - 202 B - 0 R - 170 G - 54 B - 206 Excel chart colors: For basic graphics, diagrams: Light gray for default Word table fill, callout boxes and annotated boxes: R - 234 G - 234 B - 234 Word tables: 3pt border, R - 38,G - 77,B - 130 Highlight colors: R - 106 G - 151 B - 212 R - 235 G - 133 B - 33 R - 0 G - 134 B - 0 R - 250 G - 202 B - 0 R - 219 G - 230 B - 245 R - 245 G - 192 B - 139 R - 201 G - 255 B - 201 R - 255 G - 235 B - 151 Group 1: For text, wireframe, borders, colored bullets: Group 2: For fills and larger areas of colors, e.g., Word table fill: Secondary colored font: R - 0 G - 105 B - 170 Primary colored font: R - 38 G - 77 B - 130 Preliminary Draft – Confidential Discussion Materials Regarding Project Dallas ($ in millions) Precedent Transactions Have Concentrated at ~1.0x P / NAV Target Maritrans OMI Chembulk Quintana Global Ship Lease Arlington Asia Pacific Carriers K-Sea Crude Carriers Saga Tankers Ocean Freight Oceanbulk 34 Excel Maritime Vessels Samco Shipholding Golden Ocean Navi8 Crude Frontline Ltd. Principal Maritime BW Group Navig8 Product TIL Gener8 GCI 16 vessels 18 vessels Global Ship Lease CPLP 11 vessels Acquiror OSG Teekay Torm Berlian Laju Excel Marathon Acquisition GenMar Navios Maritime Acq. Kirby Capital Product Partners DHT Holdings DryShips Star Bulk Star Bulk DHT Maritime Knightsbrid ge Shipping GenMar Frontline 2012 Teekay Tankers DHT STNG TNK Euronav Seaspan Starbulk Starbulk Poseidon Containers Diamond S Starbulk Transaction Value $456 $2,222 $850 $2,139 $1,005 $490 $587 $600 $400 $105 $239 $1,757 $635 $578 $1,207 $1,445 $1,506 $662 $538 $1,138 $570 $1,518 $1,600 $433 $477 $465 $525 $140 Consideration Structure Cash Cash Cash Mixed Stock Stock Cash Mixed Unit Stock Mixed Stock Mixed Cash Stock Stock Stock Mixed Mixed Stock Stock Stock Mixed Stock Stock Stock Stock Mixed Sector Barging Tanker Chemical Drybulk Container Tanker Tanker MLP MLP Tanker Drybulk Drybulk Drybulk Tanker Drybulk Tanker Tanker Tanker Tanker Tanker Tanker Tanker Container Drybulk Drybulk Drybulk Tanker Drybulk 3/23/17 5/14/187/26/11Announced Date 9/25/06 4/17/07 10/11/07 1/29/08 3/21/08 8/5/08 7/19/10 3/13/11 5/5/11 5/31/11 10/29/18 5/27/196/16/14 5/30/17 12/19/17 3/14/18 4/20/18 11/27/188/19/14 9/9/14 10/7/14 2/25/15 7/1/15 5/23/178/5/15 8.3x 10.1x 6.3x 9.2x 11.4x 12.2x 7.8x 9.0x 13.1x 9.3x 9.2x 9.0x NA NA 9.3x 7.9x 12.7x NA NA 8.3x 9.4x 10.2x 8.3x 7.9x NA 5.1x 7.6x 8.0x 1.02x 1.15x 1.04x 0.88x 0.72x 0.80x 1.10x NA 1.04x 0.93x 1.07x 0.95x 1.00x 1.14x 1.03x 1.05x 1.27x 0.96x 1.02x 1.05x 1.13x 0.87x 0.92x 0.83x 0.95x 1.05x 1.10x 0.88x 0.00x 0.20x 0.40x 0.60x 0.80x 1.00x 1.20x 1.40x 0.0x 3.0x 6.0x 9.0x 12.0x 15.0x Price / NAV TEV / FY+1 EBITDA 9/25/06 4/17/07 10/11/07 1/29/08 3/21/08 8/5/08 7/19/10 3/13/11 5/5/11 5/31/11 7/26/11 6/16/14 8/19/14 9/9/14 10/7/14 2/25/15 7/1/15 8/5/15 3/23/17 5/23/17 5/30/17 12/19/17 3/14/18 4/20/18 5/14/18 5/27/19 11/27/18 10/29/18 Source: Company filings, press releases, investor presentations, FactSet , CapitalIQ 1. Based on a midpoint NAV of $6.67 / share TEV / FY+1 EBITDA Price / NAV Avg. TEV / FY+1 EBITDA = 9.1x Avg. Price / NAV = 0.99x SPII’s counter offer of $4.50 / share implies a P / NAV of 0.67x 1 relative to precedent averages of ~1.0x 8

To update section number manually, click in the text box, go to Numbering: Appendix
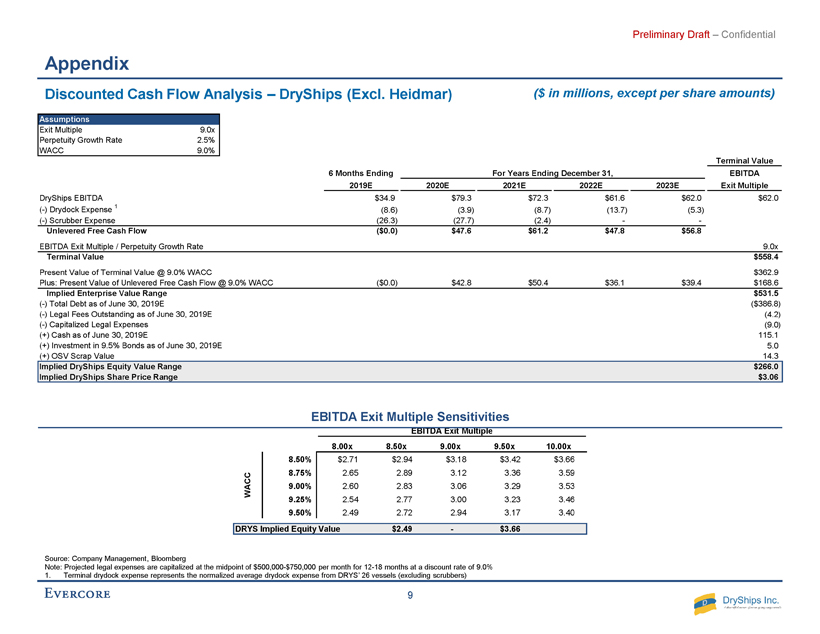
R - 38 G - 77 B - 130 R - 106 G - 151 B - 212 R - 235 G - 133 B - 33 R - 0 G - 134 B - 0 R - 250 G - 202 B - 0 R - 193 G - 2 B - 2 R - 100 G - 100 B - 100 R - 0 G - 105 B - 170 R - 236 G - 163 B - 33 R - 138 G - 173 B - 70 R - 255 G - 219 B - 67 R - 221 G - 70 B - 55 R - 191 G - 191 B - 191 R - 240 G - 181 B - 74 R - 189 G - 209 B - 143 R - 209 G - 226 B - 255 R - 106 G - 151 B - 212 R - 183 G - 205 B - 235 R - 217 G - 217 B - 217 R - 158 G - 198 B - 197 R - 200 G - 222 B - 222 R - 191 G - 191 B - 191 R - 38 G - 77 B - 130 R - 193 G - 2 B - 2 Accent colors/ contrasting colors: R - 0 G - 134 B - 0 R - 235 G - 133 B - 33 R - 250 G - 202 B - 0 R - 170 G - 54 B - 206 Excel chart colors: For basic graphics, diagrams: Light gray for default Word table fill, callout boxes and annotated boxes: R - 234 G - 234 B - 234 Word tables: 3pt border, R - 38,G - 77,B - 130 Highlight colors: R - 106 G - 151 B - 212 R - 235 G - 133 B - 33 R - 0 G - 134 B - 0 R - 250 G - 202 B - 0 R - 219 G - 230 B - 245 R - 245 G - 192 B - 139 R - 201 G - 255 B - 201 R - 255 G - 235 B - 151 Group 1: For text, wireframe, borders, colored bullets: Group 2: For fills and larger areas of colors, e.g., Word table fill: Secondary colored font: R - 0 G - 105 B - 170 Primary colored font: R - 38 G - 77 B - 130 Preliminary Draft – Confidential Appendix Discounted Cash Flow Analysis – DryShips (Excl. Heidmar ) Source: Company Management, Bloomberg Note: Projected legal expenses are capitalized at the midpoint of $500,000 - $750,000 per month for 12 - 18 months at a discount rate of 9.0% 1. Terminal drydock expense represents the normalized average drydock expense from DRYS’ 26 vessels (excluding scrubbers) ($ in millions, except per share amounts ) EBITDA Exit Multiple Perpetuity Growth Rate $3.06 8.00x 8.50x 9.00x 9.50x 10.00x 8.50% $2.71 $2.94 $3.18 $3.42 $3.66 8.75% 2.65 2.89 3.12 3.36 3.59 9.00% 2.60 2.83 3.06 3.29 3.53 9.25% 2.54 2.77 3.00 3.23 3.46 9.50% 2.49 2.72 2.94 3.17 3.40 DRYS Implied Equity Value $2.49 - $3.66 WACC Assumptions Exit Multiple 9.0x Perpetuity Growth Rate 2.5% WACC 9.0% Terminal Value 6 Months Ending For Years Ending December 31, EBITDA 2019E 2020E 2021E 2022E 2023E Exit Multiple DryShips EBITDA $34.9 $79.3 $72.3 $61.6 $62.0 $62.0 (-) Drydock Expense 1 (8.6) (3.9) (8.7) (13.7) (5.3) (-) Scrubber Expense (26.3) (27.7) (2.4) - - Unlevered Free Cash Flow ($0.0) $47.6 $61.2 $47.8 $56.8 EBITDA Exit Multiple / Perpetuity Growth Rate 9.0x Terminal Value $558.4 Present Value of Terminal Value @ 9.0% WACC $362.9 Plus: Present Value of Unlevered Free Cash Flow @ 9.0% WACC ($0.0) $42.8 $50.4 $36.1 $39.4 $168.6 Implied Enterprise Value Range $531.5 (-) Total Debt as of June 30, 2019E ($386.8) (-) Legal Fees Outstanding as of June 30, 2019E (4.2) (-) Capitalized Legal Expenses (9.0) (+) Cash as of June 30, 2019E 115.1 (+) Investment in 9.5% Bonds as of June 30, 2019E 5.0 (+) OSV Scrap Value 14.3 Implied DryShips Equity Value Range $266.0 Implied DryShips Share Price Range $3.06 EBITDA Exit Multiple Sensitivities 9
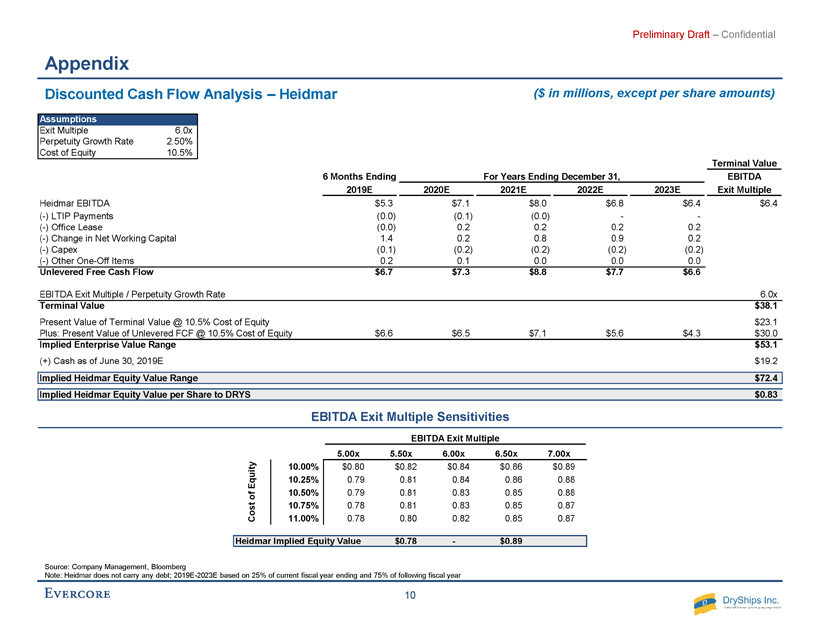
R - 38 G - 77 B - 130 R - 106 G - 151 B - 212 R - 235 G - 133 B - 33 R - 0 G - 134 B - 0 R - 250 G - 202 B - 0 R - 193 G - 2 B - 2 R - 100 G - 100 B - 100 R - 0 G - 105 B - 170 R - 236 G - 163 B - 33 R - 138 G - 173 B - 70 R - 255 G - 219 B - 67 R - 221 G - 70 B - 55 R - 191 G - 191 B - 191 R - 240 G - 181 B - 74 R - 189 G - 209 B - 143 R - 209 G - 226 B - 255 R - 106 G - 151 B - 212 R - 183 G - 205 B - 235 R - 217 G - 217 B - 217 R - 158 G - 198 B - 197 R - 200 G - 222 B - 222 R - 191 G - 191 B - 191 R - 38 G - 77 B - 130 R - 193 G - 2 B - 2 Accent colors/ contrasting colors: R - 0 G - 134 B - 0 R - 235 G - 133 B - 33 R - 250 G - 202 B - 0 R - 170 G - 54 B - 206 Excel chart colors: For basic graphics, diagrams: Light gray for default Word table fill, callout boxes and annotated boxes: R - 234 G - 234 B - 234 Word tables: 3pt border, R - 38,G - 77,B - 130 Highlight colors: R - 106 G - 151 B - 212 R - 235 G - 133 B - 33 R - 0 G - 134 B - 0 R - 250 G - 202 B - 0 R - 219 G - 230 B - 245 R - 245 G - 192 B - 139 R - 201 G - 255 B - 201 R - 255 G - 235 B - 151 Group 1: For text, wireframe, borders, colored bullets: Group 2: For fills and larger areas of colors, e.g., Word table fill: Secondary colored font: R - 0 G - 105 B - 170 Primary colored font: R - 38 G - 77 B - 130 Preliminary Draft – Confidential Appendix Discounted Cash Flow Analysis – Heidmar Source: Company Management, Bloomberg Note: Heidmar does not carry any debt; 2019E - 2023E based on 25% of current fiscal year ending and 75% of following fiscal year ($ in millions, except per share amounts ) EBITDA Exit Multiple Sensitivities EBITDA Exit Multiple Perpetuity Growth Rate $0.83 5.00x 5.50x 6.00x 6.50x 7.00x 10.00% $0.80 $0.82 $0.84 $0.86 $0.89 10.25% 0.79 0.81 0.84 0.86 0.88 10.50% 0.79 0.81 0.83 0.85 0.88 10.75% 0.78 0.81 0.83 0.85 0.87 11.00% 0.78 0.80 0.82 0.85 0.87 Heidmar Implied Equity Value $0.78 - $0.89 Cost of Equity Assumptions Exit Multiple 6.0x Perpetuity Growth Rate 2.50% Cost of Equity 10.5% Terminal Value 6 Months Ending For Years Ending December 31, EBITDA 2019E 2020E 2021E 2022E 2023E Exit Multiple Heidmar EBITDA $5.3 $7.1 $8.0 $6.8 $6.4 $6.4 (-) LTIP Payments (0.0) (0.1) (0.0) - - (-) Office Lease (0.0) 0.2 0.2 0.2 0.2 (-) Change in Net Working Capital 1.4 0.2 0.8 0.9 0.2 (-) Capex (0.1) (0.2) (0.2) (0.2) (0.2) (-) Other One-Off Items 0.2 0.1 0.0 0.0 0.0 Unlevered Free Cash Flow $6.7 $7.3 $8.8 $7.7 $6.6 EBITDA Exit Multiple / Perpetuity Growth Rate 6.0x Terminal Value $38.1 Present Value of Terminal Value @ 10.5% Cost of Equity $23.1 Plus: Present Value of Unlevered FCF @ 10.5% Cost of Equity $6.6 $6.5 $7.1 $5.6 $4.3 $30.0 Implied Enterprise Value Range $53.1 (+) Cash as of June 30, 2019E $19.2 Implied Heidmar Equity Value Range $72.4 Implied Heidmar Equity Value per Share to DRYS $0.83 10