UNITED STATES
SECURITIES AND EXCHANGE COMMISSION
Washington, D.C. 20549
FORM N-CSR
CERTIFIED SHAREHOLDER REPORT OF REGISTERED
MANAGEMENT INVESTMENT COMPANIES
Investment Company Act file number | 811-21677 |
|
Cohen & Steers International Realty Fund, Inc. |
(Exact name of registrant as specified in charter) |
|
280 Park Avenue, New York, NY | | 10017 |
(Address of principal executive offices) | | (Zip code) |
|
Adam M. Derechin Cohen & Steers Capital Management, Inc. 280 Park Avenue New York, New York 10017 |
(Name and address of agent for service) |
|
Registrant’s telephone number, including area code: | (212) 832-3232 | |
|
Date of fiscal year end: | December 31 | |
|
Date of reporting period: | December 31, 2005 | |
| | | | | | | | |
Item 1. Reports to Stockholders.
COHEN & STEERS INTERNATIONAL REALTY FUND, INC.
February 9, 2006
To Our Shareholders:
We are pleased to submit to you our report for the six months and period ended December 31, 2005. The net asset values per share at that date were $13.28, $13.26, and $13.28 for Class A, Class C, and Class I shares, respectively. In addition, a distribution was declared for shareholders of record on December 22, 2005 and paid on December 23, 2005 to all three classes of sharesa. The distributions were as follows:
| | | Total
Dividend | | Ordinary
Income | | Short-term
Capital
Gain | |
| Class A | | $ | 0.091 | | | $ | 0.043 | | | $ | 0.048 | | |
| Class C | | $ | 0.059 | | | $ | 0.011 | | | $ | 0.048 | | |
| Class I | | $ | 0.110 | | | $ | 0.062 | | | $ | 0.048 | | |
Investment Review
The total return, including income and change in net asset value, for Cohen & Steers International Realty Fund and the comparative benchmarks were:
| | | Six Months Ended
12/31/05 | | March 31, 2005
(commencement
of operations)
through
12/31/05 | |
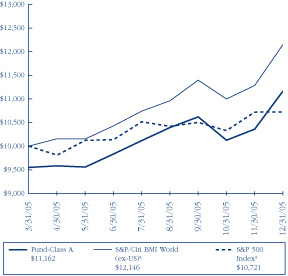
| Cohen & Steers International Realty Fund—Class A | | | 13.51 | % | | | 16.88 | % | |
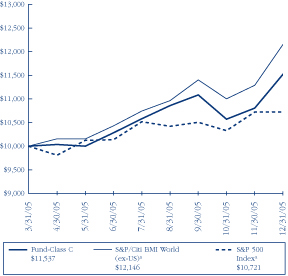
| Cohen & Steers International Realty Fund—Class C | | | 13.16 | % | | | 16.37 | % | |
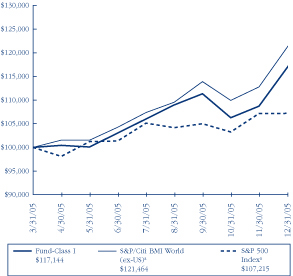
| Cohen & Steers International Realty Fund—Class I | | | 13.67 | % | | | 17.14 | % | |
| S&P/ Citigroup BMI World Property Index (ex. U.S.)b | | | 16.48 | % | | | 21.46 | % | |
| S&P 500 Indexb | | | 5.77 | % | | | 7.23 | % | |
The performance data quoted represent past performance. Past performance is no guarantee of future results. The investment return and the principal value of an investment will fluctuate and shares, if redeemed, may be worth more or less than their original cost. Current performance may be lower or higher than the performance data quoted. Total returns of the fund current to the most recent month-end can be obtained by visiting our Web site at cohenandsteers.com. Performance does not include the effect of sales charges. If sales charges were included, returns would have been lower.
a Please note that distributions paid by the fund to shareholders are subject to recharacterization for tax purposes. The final tax treatment of these distributions is reported to shareholders after the close of each fiscal year.
b The S&P/Citigroup BMI World Property Index (excluding U.S.) is an unmanaged portfolio of approximately 262 constituents from 19 countries. The S&P 500 Index is an unmanaged index of common stocks that is frequently used as a general measure of stock market performance.
1
COHEN & STEERS INTERNATIONAL REALTY FUND, INC.
The globalization of real estate advanced significantly during 2005. Real estate companies and investors increasingly looked abroad for investment opportunities. In addition, we believe the general strengthening of real estate fundamentals around most of the world also contributed to investor interest in the group and to the attractive returns that were generated in 2005. For the year, the S&P/Citigroup World ex-United States Broad Market Index returned 17.3%, which compared favorably with the 12.2% total return of the NAREIT Equity REIT Index and the 14.0% return of the broader MSCI EAFE Index.
The year was marked by a series of significant advancements in the globalization of real estate securities and the expansion of REIT-like structures. The increasingly global reach of real estate was apparent in many ways as more companies committed resources to acquisitions and developments outside their domestic borders. This was highlighted in dramatic fashion by the largest cross-border merger ever between two public companies. The 5.6 billion euro acquisition of the French REIT, Gecina, by the Spanish company, Metrovacesa, was a surprise when announced in March, but appears to have been well received by the market as Metrovacesa returned 44% over the last three quarters of the year following the announcement of the deal.
The REIT market also progressed globally last year, with the largest-ever REIT IPO (also the first listed REIT in Hong Kong), the approval of legislation creating a REIT-like structure in Malaysia, and the liberalization of the REIT-like structure in several other countries, most notably, Hong Kong and Singapore. We also believe that there is increasing momentum for the creation of a tax efficient REIT-like structure in two of the world's largest economies, the United Kingdom and Germany.
Most major countries generated attractive returns in 2005, and we believe that it is notable that no major country reported a negative total return for the year. Japanese real estate securities generated the highest total return in 2005, with the country index rising 74.3%, followed by Spain, up 70.3%. After more than a decade of decline, Japanese economic and real estate fundamentals showed firm evidence of improvement in 2005 and conditions in Spain remained very strong for another year, spurred by negative real interest rates and strong economic growth.
2
COHEN & STEERS INTERNATIONAL REALTY FUND, INC.
Two of the oldest and most mature REIT markets generated the lowest returns among major markets, although they were still attractive in absolute terms. Real estate stocks in the United States returned 12.2% on average and those in Australia delivered 12.6%. The only countries that posted negative returns for the year were Malaysia, down 9.9%, and Taiwan, down 9.0%. The following table details returns for some of the most important real estate securities markets:
Real Estate Security Total Returns
| | | 2005 | | 3/31/05* –
12/31/05 | |
Country | |
USD | | Local
Currency | |
USD | | Local
Currency | |
| Japan | | | 51.3 | % | | | 74.3 | % | | | 53.2 | % | | | 69.0 | % | |
| Spain | | | 47.8 | % | | | 70.3 | % | | | 26.8 | % | | | 39.7 | % | |
| Germany | | | 26.4 | % | | | 45.6 | % | | | 21.5 | % | | | 33.8 | % | |
| Singapore | | | 32.8 | % | | | 35.2 | % | | | 26.8 | % | | | 27.8 | % | |
| France | | | 12.2 | % | | | 29.3 | % | | | 9.8 | % | | | 21.0 | % | |
| United Kingdom | | | 8.2 | % | | | 21.0 | % | | | 16.2 | % | | | 27.9 | % | |
| Canada | | | 23.4 | % | | | 20.4 | % | | | 21.3 | % | | | 17.2 | % | |
| World | | | 14.8 | % | | | 20.1 | % | | | 21.1 | % | | | 25.2 | % | |
| Netherlands | | | 1.8 | % | | | 17.3 | % | | | 6.1 | % | | | 16.9 | % | |
| Australia | | | 5.4 | % | | | 12.6 | % | | | 10.4 | % | | | 16.4 | % | |
| United States | | | 12.2 | % | | | 12.2 | % | | | 20.7 | % | | | 20.7 | % | |
| Hong Kong | | | 6.4 | % | | | 6.2 | % | | | 15.6 | % | | | 14.9 | % | |
Source: S&P/Citigroup and NAREIT. Past performance is no guarantee of future results. Index performance is not representative of the performance of the fund and the fund will not seek to replicate an index. You cannot invest directly in an index.
* Inception of the fund.
Real estate fundamentals generally improved in many economies and real estate markets throughout 2005. Among the core property types, office markets made the most progress and drove the internal growth of office landlords in many regions. In many major office markets, including Hong Kong, Calgary, and New York, vacancy rates declined to the threshold where rents could be increased meaningfully. In addition, another group of major markets including Tokyo, London, and Sydney witnessed declining vacancy and the stabilization and initial recovery in rents after several years of decline. Retail real estate conditions generally showed less strength, but were still representative of a healthy economic environment. Retailer sales, along with retail real estate occupancy and rents, increased modestly, but were held back in many regions by consumer spending that was restrained by higher interest rates and oil prices in most countries, and declining ho me values in several countries.
3
COHEN & STEERS INTERNATIONAL REALTY FUND, INC.
During the year, there was significant external growth activity (acquisitions, mergers, developments), largely driven by the themes outlined above—companies building up portfolios outside their domestic borders, companies taking advantage of new flexibility or cost of capital benefits implicit in new or modified REIT structures, or companies acquiring or developing in response to improving real estate fundamentals. So-called spread investing (investment yields exceeding the cost of debt) played a large role in the investing activity of many Asian and Australian companies, while buying assets in front of a fundamental recovery was a larger driver in Germany and Japan. Merger and acquisition activity was significant in the United States and was a major driver of stock price performance, but was largely absent in the rest of the world, with the exception of the Metrovacesa-Gecina transaction. We expect to see an acceleration of cross-borde r merger and acquisition activity in 2006.
Equity issuance was relatively significant during the year, especially related to IPOs in Asia. The Link REIT completed a very successful $3 billion IPO in late November, making it the largest-ever REIT IPO and the first REIT listed in Hong Kong. It was rapidly followed by two more Hong Kong IPOs and the public announcement of plans for several more to be completed in 2006. Singapore and Japan also contributed to the equity issuance with a number of IPOs, in addition to several sizable secondary offerings earlier in the year. During the second half of the year, European companies also accessed equity capital, including Metrovacesa's large 1 billion euro offering to fund their merger, as well as a number of small IPOs, many of which are targeting investment in Central and Eastern Europe. With attractive investment opportunities available in many markets and investors' continued willingness to fund them through private and public formats, we e xpect that acquisition activity and equity issuance will grow in the coming year.
Relative to the S&P/Citigroup World ex-U.S. Property Broad Market Index since March, 31, 2005 (inception of the fund), the fund benefited from our stock selection in Japan, particularly our investments in some of the large, diversified property developers such as Sumitomo Realty & Development (80.2% total return) and Mitsui Fudosan Co. (72.9%). These companies benefited greatly in the second half of the year as more signs of economic recovery emerged in Japan. Our underweight and stock selection in Australia were also large contributors to the fund's performance. Our avoidance of Multiplex Group (–25.4%) and our investment in Stockland Trust Group (12.7%) had the greatest positive impact. In addition, our stock selection in Hong Kong, primarily the Link REIT (22.0% since its IPO in November), Hong Kong Land (17.4%) and Hysan Development (28.0%), as well as our stock selection in Canada, also contributed to performance.
Higher than normal cash levels during the fund's initial investment period was the largest detractor from relative performance, considering that much of the sector rallied during this period. Our underweight in Japan was also a detractor. Our underweight and stock selection in Singapore impacted the fund's performance as well. Capitaland performed well (48.8%); however, the fund's position was only half the index weight and our investment in Ascendas REIT (7.2%) trailed the index. In addition, our overweight allocations throughout much of Europe, including The Netherlands, France, Germany and the United Kingdom negatively impacted the fund's relative performance as did our stock selection in the United Kingdom—specifically, Development Securities (–0.4%) and Liberty International (–5.3%).
4
COHEN & STEERS INTERNATIONAL REALTY FUND, INC.
Investment Outlook
Strong stock price performance plus new equity issuance lifted the market capitalization of the World Property Index by 20% to $850 billion, and the number of companies to 407, by the end of 2005. We believe that 2005 marked the beginning of the widespread expansion and acceptance of the global real estate securities market, and that the increase in market capitalization, along with many of the trends referenced above, are likely to continue. We believe that the globalization process is in the early stages of evolution and that activity will accelerate from here. Over time, we expect that this will drive an ever-increasing amount of the world's income producing property into publicly traded REIT-like vehicles, furthering the demand for REITs as an asset class, both domestically and abroad.
We believe that REIT–like structures are likely to be introduced in several new countries in the next several years, with a reasonable likelihood that Germany and the United Kingdom, two of the world's largest economies and real estate markets, will be in this group. Although each country approaches decision making for the REIT structure differently, the success of the REIT model in a growing number of global markets cannot be ignored—–returns have improved as real estate was transferred to ownership by those who value its characteristics most highly, and volatility has declined as an income-driven business model prevailed and transparency increased. The German government should be further motivated to adopt the structure to protect its individual investors, who have had negative experiences with the current vehicles for real estate ownership, while the U.K. government is motivated to protect its tax base, in response to a gro wing portion of U.K. real estate ownership being moved offshore into tax free havens. However, we are cognizant that this complicated process could take several years and that the initial structures may not prove ideal, creating added risks.
The number of REIT and real estate company IPOs should accelerate in 2006. The press has already reported on at least a dozen new companies that hope to list during the first half of the year. Several of these potential IPOs may be spun off from existing public or private real estate companies, but we believe they will differ from their parent by offering potentially higher income, better disclosure, and greater tax efficiency—essentially repackaging current companies into an investment vehicle for which investors have greater demand. Other IPOs may be created by non-real estate corporations spinning off their owned real estate into an actively managed vehicle whose primary goal will be to create stable and growing cash flow and asset value, rather than just being a passive, potentially-conflicted real estate division of a government entity, retailer or financial institution. The themes of these types of potential transactions are clear : income-producing real estate is moving into more efficient hands and often into a more tax efficient structure, both of which should create value for shareholders, in our view. Although we cannot be certain that these prospective transactions will occur, we believe that sponsors, investors, and regulators are all motivated.
Our belief in the continuation of these trends and the general globalization of real estate, combined with our knowledge of the fundamental market conditions in each region and our detailed valuation work, are reflected in our current portfolio weightings. Our search for companies that we believe will benefit from improving real estate fundamentals and that are attractively valued has driven our overweight position in several markets.
5
COHEN & STEERS INTERNATIONAL REALTY FUND, INC.
We favor the Hong Kong market, where stocks are trading on average at 20% discounts to our estimated net asset value (NAV), while fundamentals, in our view, are quite attractive, driven by the China-led economic growth in the region combined with the restrained level of new development due to the Hong Kong government's land policy. We also see value in a number of Dutch companies, where stocks trade at 10% discounts to our estimate of NAV, on average, and we forecast a fundamental improvement in the real estate market as the economy emerges from several years of lackluster growth. Finally, although economic fundamentals have languished for much of the past decade, we have a positive view on German real estate stocks, which we believe, have an incredible opportunity to create value through the acquisition of real estate at attractive prices from semi-distressed or motivated corporate or government sellers and subsequent management of them thr ough the prospective economic and real estate recovery that we believe is just beginning. Note that each of these three countries are, in our view, in a position to benefit from potential structural changes related to REIT legislation, including the likely creation of a REIT model in Germany, the rapid growth of REIT listings that we expect in Hong Kong, and the liberalization of the long standing, but relatively restrictive REIT structure in the Netherlands.
On the other side of this structural change, we note that some of the world's most mature real estate markets have relatively less room to advance. Australia is a good example of a mature market with less growth than we see elsewhere, which, combined with higher valuations, leaves less opportunity for upside. We also have an underweight position in Japanese REITs where, despite improving real estate and economic fundamentals, we believe that all the good news is more than reflected in stock prices, which are generally well above our NAV estimates.
At the company level, we are generally more focused on office and apartment owners and developers at this point in the cycle. These property types are just starting to experience improving occupancy rates and, in some cases, rising rental rates. Conversely, retail owners have performed very well for several years, and we believe that higher interest rates and higher energy prices globally will challenge consumer spending growth, driving our more cautious view on the fundamentals for many of these companies.
6
COHEN & STEERS INTERNATIONAL REALTY FUND, INC.
The current environment of moderate global economic growth along with rapid structural change for real estate should provide an attractive environment for international real estate securities. With our portfolio of stocks trading at an average 3% discount to our estimated real estate value, and with prospective earnings growth projected to be in the double digits, we believe that international real estate securities should provide attractive returns to investors.
Sincerely,
 | |  | |
|
| MARTIN COHEN | | ROBERT H. STEERS | |
|
| Co-chairman | | Co-chairman | |
|
 | |  | |
|
| JOSEPH M. HARVEY | | JAMES S. CORL | |
|
| Portfolio Manager | | Portfolio Manager | |
|
 | |  | |
|
| W. JOSEPH HOULIHAN | | GERIOS J.M. ROVERS | |
|
| Portfolio Manager | | Portfolio Manager | |
|
The views and opinions in the preceding commentary are as of the date stated and are subject to change. This material represents an assessment of the market environment at a specific point in time, should not be relied upon as investment advice and is not intended to predict or depict performance of any investment.
Visit Cohen & Steers online at cohenandsteers.com
For more information about any of our funds, visit cohenandsteers.com, where you'll find daily net asset values, fund fact sheets and portfolio highlights. You can also access newsletters, education tools and market updates covering REIT, utility and preferred securities sectors.
In addition, our Web site contains comprehensive information about our firm, including our most recent press releases, profiles of our senior investment professionals, and an overview or our investment approach.
7
COHEN & STEERS INTERNATIONAL REALTY FUND, INC.
Performance Review
Cohen & Steers International Realty Fund—Class A
Growth of a $10,000 Investment
Cohen & Steers International Realty Fund—Class C
Growth of a $10,000 Investment
Cohen & Steers International Realty Fund—Class I
Growth of a $100,000 Investment
8
COHEN & STEERS INTERNATIONAL REALTY FUND, INC.
Performance Review—(Continued)
| | | Class A
Shares | | Class C
Shares | | Class I
Shares | |
Since Inceptiond
(with sales charge) | | | 11.62 | %b | | | 15.37 | %c | | | — | | |
Since Inceptiond
(without sales charge) | | | 16.88 | % | | | 16.37 | % | | | 17.14 | % | |
The performance data quoted represent past performance. Past performance is no guarantee of future results. The investment return and principal value of an investment will fluctuate and shares, when redeemed, may be worth more or less than their original cost. Current performance may be lower or higher than the performance data quoted. Performance information current to the most recent month-end can be obtained by visiting our website at cohenandsteers.com. The performance graph and table do not reflect the deduction of taxes that a shareholder would pay on fund distributions on the redemption of fund shares.
Through December 31, 2006, the fund's advisor has contractually agreed to waive certain fees and/or reimburse the fund for expenses. Absent such arrangements, returns would have been lower.
a The comparative indexes are not adjusted to reflect expenses or other fees that the SEC requires to be reflected in the fund's performance. The fund's performance assumes the reinvestment of all dividends and distributions. For more information, including charges and expenses, please read the prospectus carefully before you invest.
b Reflects a 4.50% front-end sales charge.
c Reflects a contingent deferred sales charge of 1%.
d Inception date of March 31, 2005.
9
COHEN & STEERS INTERNATIONAL REALTY FUND, INC.
Expense Example (Unaudited)
As a shareholder of the fund, you incur two types of costs: (1) transaction costs, including sales charges (loads) on purchase payments and redemption fees; and (2) ongoing costs including management fees; distribution and/or service (12b-1) fees; and other fund expenses. This example is intended to help you understand your ongoing costs (in dollars) of investing in the fund and to compare these costs with the ongoing costs of investing in other mutual funds.
The example is based on an investment of $1,000 invested at the beginning of the period and held for the entire period 07/01/05 – 12/31/05.
Actual Expenses
The first line of the table below provides information about actual account values and expenses. You may use the information in this line, together with the amount you invested, to estimate the expenses that you paid over the period. Simply divide your account value by $1,000 (for example, an $8,600 account value divided by $1,000 = 8.6), then multiply the result by the number in the first line under the heading entitled "Expenses Paid During Period"" to estimate the expenses you paid on your account during this period.
Hypothetical Example for Comparison Purposes
The second line of the table below provides information about hypothetical account values and hypothetical expenses based on the fund's actual expense ratio and an assumed rate of return of 5% per year before expenses, which is not the fund's actual return. The hypothetical account values and expenses may not be used to estimate the actual ending account balance or expenses you paid for the period. You may use this information to compare the ongoing cost of investing in the fund and other funds. To do so, compare this 5% hypothetical example with the 5% hypothetical examples that appear in the shareholder reports of the other funds.
Please note that the expenses shown in the table are meant to highlight your ongoing costs only and do not reflect any transactional costs, such as sales charges (loads) and redemption fees. Therefore, the second line of the table is useful in comparing ongoing costs only, and will not help you determine the relative total costs of owning different funds. In addition, if these transactional costs were included, your costs would have been higher.
10
COHEN & STEERS INTERNATIONAL REALTY FUND, INC.
Expense Example (Unaudited)—(Continued)
| | | Beginning
Account Value
07/01/05 | | Ending
Account Value
12/31/05 | | Expenses Paid
During Period*
07/01/05–
12/31/05 | |
| Class A | |
| Actual (13.51% return) | | $ | 1,000.00 | | | $ | 1,135.12 | | | $ | 9.04 | | |
| Hypothetical (5% annual return before expenses) | | $ | 1,000.00 | | | $ | 1,016.74 | | | $ | 8.54 | | |
| Class C | |
| Actual (13.16% return) | | $ | 1,000.00 | | | $ | 1,131.64 | | | $ | 12.47 | | |
| Hypothetical (5% annual return before expenses) | | $ | 1,000.00 | | | $ | 1,013.51 | | | $ | 11.77 | | |
| Class I | |
| Actual (13.67% return) | | $ | 1,000.00 | | | $ | 1,136.74 | | | $ | 7.16 | | |
| Hypothetical (5% annual return before expenses) | | $ | 1,000.00 | | | $ | 1,018.50 | | | $ | 6.77 | | |
* Expenses are equal to the fund's Class A, Class C and Class I annualized expense ratio of 1.68%, 2.32% and 1.33%, respectively, multiplied by the average account value over the period, multiplied by 184/365 (to reflect the one-half year period). If the fund had borne all of its expenses that were assumed by the advisor, the annualized expense ratios would have been 1.78%, 2.43% and 1.45%, respectively.
11
COHEN & STEERS INTERNATIONAL REALTY FUND, INC.
December 31, 2005
Top Long-Term Holdings Report
(Unaudited)
| Security | | Market
Value | | % of
Net Assets | |
| 1 Mitsubishi Estate Co., Ltd. | | $ | 19,299,190 | | | | 6.4 | % | |
| 2 Westfield Group | | | 15,833,269 | | | | 5.2 | | |
| 3 Mitsui Fudosan Co., Ltd. | | | 14,743,460 | | | | 4.9 | | |
| 4 Cheung Kong Holdings Ltd. | | | 14,615,829 | | | | 4.8 | | |
| 5 Land Securities Group PLC | | | 12,217,353 | | | | 4.0 | | |
| 6 Sun Hung Kai Properties Ltd. | | | 11,812,414 | | | | 3.9 | | |
| 7 Sumitomo Realty & Development Co., Ltd. | | | 9,808,920 | | | | 3.2 | | |
| 8 Unibail | | | 9,571,218 | | | | 3.2 | | |
| 9 British Land Co., PLC | | | 9,542,657 | | | | 3.1 | | |
| 10 Hongkong Land Holdings Ltd. (USD) | | | 7,919,968 | | | | 2.6 | | |
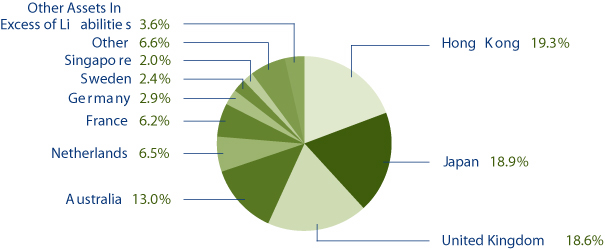
Country Breakdown
(Based on Net Assets)
(Unaudited)
12
COHEN & STEERS INTERNATIONAL REALTY FUND, INC.
SCHEDULE OF INVESTMENTS
December 31, 2005
| | | | | Number
of Shares | | Value | |
| COMMON STOCK | | | 96.4 | % | | | | | | | | | |
| AUSTRALIA | | | 13.0 | % | | | | | | | | | |
| DIVERSIFIED | | | 5.1 | % | | | | | | | | | |
| General Property Trust | | | | | | | 2,531,900 | | | $ | 7,610,159 | | |
| Mirvac Group | | | | | | | 994,300 | | | | 3,003,157 | | |
| Stockland | | | | | | | 1,033,241 | | | | 4,923,550 | | |
| | | | | | | | 15,536,866 | | |
| INDUSTRIAL | | | 1.2 | % | | | | | | | | | |
| Macquarie Goodman Group | | | | | | | 1,066,600 | | | | 3,737,600 | | |
| OFFICE | | | 1.5 | % | | | | | | | | | |
| Investa Property Group | | | | | | | 1,515,300 | | | | 2,205,070 | | |
| Tishman Speyer Office Fund | | | | | | | 1,453,100 | | | | 2,205,105 | | |
| | | | | | | | 4,410,175 | | |
| SHOPPING CENTER | | | 5.2 | % | | | | | | | | | |
| Westfield Group | | | | | | | 1,189,300 | | | | 15,833,269 | | |
| TOTAL AUSTRALIA | | | | | | | | | | | 39,517,910 | | |
| AUSTRIA | | | 0.9 | % | | | | | | | | | |
| DIVERSIFIED | |
| Immofinanz Immobilien Anlagen AG | | | | | | | 283,279 | | | | 2,719,883 | | |
| CANADA | | | 1.7 | % | | | | | | | | | |
| OFFICE | | | 1.2 | % | | | | | | | | | |
| Brookfield Properties Corp. | | | | | | | 125,792 | | | | 3,700,801 | | |
| SHOPPING CENTER | | | 0.5 | % | | | | | | | | | |
| Primaris Retail REIT | | | | | | | 97,400 | | | | 1,369,105 | | |
| TOTAL CANADA | | | | | | | | | | | 5,069,906 | | |
| FINLAND | | | 1.1 | % | | | | | | | | | |
| DIVERSIFIED | |
| Citycon Oyj | | | | | | | 319,830 | | | | 1,177,591 | | |
| Sponda Oyj | | | | | | | 230,832 | | | | 2,172,592 | | |
| | | | | | | | 3,350,183 | | |
See accompanying notes to financial statements.
13
COHEN & STEERS INTERNATIONAL REALTY FUND, INC.
SCHEDULE OF INVESTMENTS—(Continued)
December 31, 2005
| | | | | Number
of Shares | | Value | |
| FRANCE | | | 6.2 | % | | | | | | | | | |
| DIVERSIFIED | | | 5.8 | % | | | | | | | | | |
| Klepierre | | | | | | | 30,019 | | | $ | 2,818,282 | | |
| Mercialys Promesse | | | | | | | 83,193 | | | | 1,913,703 | | |
Societe Immobiliere de Location pour L'Industrie et le
Commerce (Silic) | | | | | | | 34,357 | | | | 3,174,703 | | |
| Unibail | | | | | | | 71,926 | | | | 9,571,218 | | |
| | | | | | | | 17,477,906 | | |
| OFFICE | | | 0.4 | % | | | | | | | | | |
| Fonciere des Regions | | | | | | | 11,940 | | | | 1,272,219 | | |
| TOTAL FRANCE | | | | | | | | | | | 18,750,125 | | |
| GERMANY | | | 2.9 | % | | | | | | | | | |
| APARTMENT | | | 1.3 | % | | | | | | | | | |
| Deutsche Wohnen AG | | | | | | | 17,476 | | | | 4,040,725 | | |
| DIVERSIFIED | | | 1.6 | % | | | | | | | | | |
| Deutsche Euroshop AG | | | | | | | 24,152 | | | | 1,356,764 | | |
| IVG Immobilien AG | | | | | | | 167,063 | | | | 3,502,788 | | |
| | | | | | | | 4,859,552 | | |
| TOTAL GERMANY | | | | | | | | | | | 8,900,277 | | |
| HONG KONG | | | 19.3 | % | | | | | | | | | |
| DIVERSIFIED | | | 15.1 | % | | | | | | | | | |
| Cheung Kong Holdings Ltd. | | | | | | | 1,422,800 | | | | 14,615,829 | | |
| Great Eagle Holdings Ltd. | | | | | | | 1,642,000 | | | | 4,595,436 | | |
| Henderson Land Development Company Ltd. | | | | | | | 1,545,000 | | | | 7,273,026 | | |
| Hysan Development Company Ltd. | | | | | | | 2,947,500 | | | | 7,298,756 | | |
| Sun Hung Kai Properties Ltd. | | | | | | | 1,209,100 | | | | 11,812,414 | | |
| | | | | | | | 45,595,461 | | |
| OFFICE | | | 2.6 | % | | | | | | | | | |
| Hongkong Land Holdings Ltd. (USD) | | | | | | | 2,522,283 | | | | 7,919,968 | | |
| SHOPPING CENTER | | | 1.6 | % | | | | | | | | | |
| Link REIT | | | | | | | 2,546,000 | | | | 4,826,914 | | |
| TOTAL HONG KONG | | | | | | | | | | | 58,342,343 | | |
See accompanying notes to financial statements.
14
COHEN & STEERS INTERNATIONAL REALTY FUND, INC.
SCHEDULE OF INVESTMENTS—(Continued)
December 31, 2005
| | | | | Number
of Shares | | Value | |
| JAPAN | | | 18.9 | % | | | | | | | | | |
| APARTMENT | | | 0.5 | % | | | | | | | | | |
| Leopalace21 Corp. | | | | | | | 41,400 | | | $ | 1,502,455 | | |
| DIVERSIFIED | | | 16.6 | % | | | | | | | | | |
| Mitsubishi Estate Co., Ltd. | | | | | | | 929,000 | | | | 19,299,190 | | |
| Mitsui Fudosan Co., Ltd. | | | | | | | 726,000 | | | | 14,743,460 | | |
| NTT Urban Development Corp. | | | | | | | 639 | | | | 4,231,645 | | |
| Sumitomo Realty & Development Co., Ltd. | | | | | | | 451,000 | | | | 9,808,920 | | |
| Tokyo Tatemono Co., Ltd. | | | | | | | 239,000 | | | | 2,381,185 | | |
| | | | | | | | 50,464,400 | | |
| OFFICE | | | 1.0 | % | | | | | | | | | |
| Japan Prime Realty Investment Corp. | | | | | | | 489 | | | | 1,372,442 | | |
| Japan Real Estate Investment Corp. | | | | | | | 203 | | | | 1,673,091 | | |
| | | | | | | | 3,045,533 | | |
| SHOPPING CENTER | | | 0.8 | % | | | | | | | | | |
| Japan Retail Fund Investment Corp. | | | | | | | 310 | | | | 2,407,767 | | |
| TOTAL JAPAN | | | | | | | | | | | 57,420,155 | | |
| NETHERLANDS | | | 6.5 | % | | | | | | | | | |
| DIVERSIFIED | | | 3.3 | % | | | | | | | | | |
| Corio NV | | | | | | | 111,317 | | | | 6,049,078 | | |
| Eurocommercial Properties NV | | | | | | | 38,059 | | | | 1,307,585 | | |
| Wereldhave NV | | | | | | | 29,152 | | | | 2,748,964 | | |
| | | | | | | | 10,105,627 | | |
| OFFICE | | | 0.5 | % | | | | | | | | | |
| VastNed Offices/Industrial NV | | | | | | | 54,461 | | | | 1,457,166 | | |
| SHOPPING CENTER | | | 2.7 | % | | | | | | | | | |
| Rodamco Europe NV | | | | | | | 77,419 | | | | 6,443,441 | | |
| VastNed Retail NV | | | | | | | 28,023 | | | | 1,783,233 | | |
| | | | | | | | 8,226,674 | | |
| TOTAL NETHERLANDS | | | | | | | | | | | 19,789,467 | | |
See accompanying notes to financial statements.
15
COHEN & STEERS INTERNATIONAL REALTY FUND, INC.
SCHEDULE OF INVESTMENTS—(Continued)
December 31, 2005
| | | | | Number
of Shares | | Value | |
| SINGAPORE | | | 2.0 | % | | | | | | | | | |
| DIVERSIFIED | | | 1.0 | % | | | | | | | | | |
| CapitaLand Ltd. | | | | | | | 751,100 | | | $ | 1,554,015 | | |
| City Development Ltd. | | | | | | | 268,900 | | | | 1,407,049 | | |
| | | | | | | | 2,961,064 | | |
| INDUSTRIAL | | | 1.0 | % | | | | | | | | | |
| Ascendas Real Estate Investment Trust | | | | | | | 2,558,900 | | | | 3,001,146 | | |
| TOTAL SINGAPORE | | | | | | | | | | | 5,962,210 | | |
| SPAIN | | | 0.9 | % | | | | | | | | | |
| DIVERSIFIED | | | | | | | | | | | | | |
| Inmobiliaria Urbis SA | | | | | | | 142,631 | | | | 2,619,031 | | |
| SWEDEN | | | 2.4 | % | | | | | | | | | |
| DIVERSIFIED | | | | | | | | | | | | | |
| Castellum AB | | | | | | | 64,379 | | | | 2,317,628 | | |
| Fabege AB | | | | | | | 182,236 | | | | 3,475,203 | | |
| Kungsleden AB | | | | | | | 47,225 | | | | 1,367,204 | | |
| TOTAL SWEDEN | | | | | | | | | | | 7,160,035 | | |
| SWITZERLAND | | | 0.9 | % | | | | | | | | | |
| DIVERSIFIED | | | | | | | | | | | | | |
| PSP Swiss Property AG | | | | | | | 63,006 | | | | 2,733,033 | | |
| UNITED KINGDOM | | | 18.6 | % | | | | | | | | | |
| DIVERSIFIED | | | 10.0 | % | | | | | | | | | |
| British Land Co., PLC | | | | | | | 520,304 | | | | 9,542,657 | | |
| Development Securities PLC | | | | | | | 318,764 | | | | 2,733,943 | | |
| Great Portland Estates PLC | | | | | | | 570,682 | | | | 4,217,085 | | |
| Hammerson PLC | | | | | | | 404,660 | | | | 7,115,348 | | |
| Helical Bar PLC | | | | | | | 464,583 | | | | 2,437,912 | | |
| Quintain Estates & Development PLC | | | | | | | 386,467 | | | | 4,179,003 | | |
| | | | | | | | 30,225,948 | | |
| INDUSTRIAL | | | 2.2 | % | | | | | | | | | |
| Slough Estates PLC | | | | | | | 630,628 | | | | 6,493,702 | | |
See accompanying notes to financial statements.
16
COHEN & STEERS INTERNATIONAL REALTY FUND, INC.
SCHEDULE OF INVESTMENTS—(Continued)
December 31, 2005
| | | | | Number
of Shares | | Value | |
| INVESTMENT COMPANY | | | 0.4 | % | | | | | | | | | |
| Dawnay Day Treveria PLC | | | | | | | 1,086,743 | | | $ | 1,338,059 | | |
| OFFICE | | | 4.0 | % | | | | | | | | | |
| Land Securities Group PLC | | | | | | | 427,002 | | | | 12,217,353 | | |
| SHOPPING CENTER | | | 2.0 | % | | | | | | | | | |
| Liberty International PLC | | | | | | | 358,316 | | | | 6,044,617 | | |
| TOTAL UNITED KINGDOM | | | | | | | | | | | 56,319,679 | | |
| UNITED STATES | | | 1.1 | % | | | | | | | | | |
| HOTEL | |
| Hilton Hotels Corp. | | | | | | | 72,874 | | | | 1,756,992 | | |
| Starwood Hotels & Resorts Worldwide | | | | | | | 25,700 | | | | 1,641,202 | | |
| TOTAL UNITED STATES | | | | | | | | | | | 3,398,194 | | |
| TOTAL COMMON STOCK (Identified cost—$268,948,432) | | | | | | | | | | | 292,052,431 | | |
| | | | | Principal
Amount | | | |
| COMMERCIAL PAPER | | | 3.5 | % | | | | | | | | | |
Citigroup Funding, 3.23%, due 1/3/06
(Identified cost—$10,638,091) | | | | | | $ | 10,640,000 | | | | 10,638,091 | | |
| Total Investments (Identified cost—$279,586,523) | | | 99.9 | % | | | | | | | 302,690,522 | | |
| OTHER ASSETS IN EXCESS OF LIABILITIES | | | 0.1 | % | | | | | | | 439,471 | | |
| NET ASSETS | | | 100.0 | % | | | | | | $ | 303,129,993 | | |
Glossary of Portfolio Abbreviations
REIT Real Estate Investment Trust
USD United States Dollar
Note: Percentages indicated are based on the net assets of the fund.
See accompanying notes to financial statements.
17
COHEN & STEERS INTERNATIONAL REALTY FUND, INC.
STATEMENT OF ASSETS AND LIABILITIES
December 31, 2005
| ASSETS: | |
| Investments in securities, at value (Identified cost—$279,586,523) | | $ | 302,690,522 | | |
| Foreign currency (Identified cost—$137,659) | | | 136,824 | | |
| Receivable for fund shares sold | | | 4,081,601 | | |
| Receivable for foreign exchange contracts | | | 2,223,694 | | |
| Receivable for investment securities sold | | | 769,682 | | |
| Dividends and interest receivable | | | 550,544 | | |
| Receivable due from advisor | | | 51,211 | | |
| Other assets | | | 2,495 | | |
| Total Assets | | | 310,506,573 | | |
| LIABILITIES: | |
| Payable for investment securities purchased | | | 4,757,652 | | |
| Payable for foreign exchange contracts | | | 2,225,697 | | |
| Payable to investment advisor | | | 195,929 | | |
| Payable for distribution fees | | | 51,584 | | |
| Payable for shareholder servicing fees | | | 18,373 | | |
| Payable to administrator | | | 12,374 | | |
| Payable for fund shares redeemed | | | 7,059 | | |
| Payable for directors' fees | | | 539 | | |
| Other liabilities | | | 107,373 | | |
| Total Liabilities | | | 7,376,580 | | |
| NET ASSETS | | $ | 303,129,993 | | |
| NET ASSETS consist of: | |
| Paid-in capital | | $ | 280,475,469 | | |
| Dividends in excess of net investment income | | | (872,888 | ) | |
| Undistributed net realized gain | | | 424,556 | | |
| Net unrealized appreciation | | | 23,102,856 | | |
| | | $ | 303,129,993 | | |
See accompanying notes to financial statements.
18
COHEN & STEERS INTERNATIONAL REALTY FUND, INC.
STATEMENT OF ASSETS AND LIABILITIES—(Continued)
December 31, 2005
| CLASS A SHARES: | |
| NET ASSETS | | $ | 91,586,060 | | |
| Shares issued and outstanding ($0.001 par value common stock outstanding) | | | 6,898,423 | | |
| Net asset value and redemption price per share | | $ | 13.28 | | |
| Maximum offering price per share ($13.28 ÷ 0.955)a | | $ | 13.91 | | |
| CLASS C SHARES: | |
| NET ASSETS | | $ | 61,350,655 | | |
| Shares issued and outstanding ($0.001 par value common stock outstanding) | | | 4,627,159 | | |
| Net asset value and offering price per shareb | | $ | 13.26 | | |
| CLASS I SHARES: | |
| NET ASSETS | | $ | 150,193,278 | | |
| Shares issued and outstanding ($0.001 par value common stock outstanding) | | | 11,307,153 | | |
| Net asset value, offering and redemption price per share | | $ | 13.28 | | |
a On investments of $100,000 or more, the offering price is reduced.
b Redemption price per share is equal to the net asset value per share less any applicable deferred sales charge which varies with the length of time shares are held.
See accompanying notes to financial statements.
19
COHEN & STEERS INTERNATIONAL REALTY FUND, INC.
STATEMENT OF OPERATIONS
For the Period March 31, 2005a through December 31, 2005
| Investment Income: | |
| Dividend income (net of $286,701 of foreign withholding tax) | | $ | 2,010,461 | | |
| Interest income | | | 156,385 | | |
| Total Income | | | 2,166,846 | | |
| Expenses: | |
| Investment advisory fees | | | 829,239 | | |
| Distribution fees—Class A | | | 80,275 | | |
| Distribution fees—Class C | | | 137,961 | | |
| Custodian fees and expenses | | | 126,268 | | |
| Administration fees | | | 113,453 | | |
| Professional fees | | | 97,198 | | |
| Shareholder servicing fees—Class A | | | 32,110 | | |
| Shareholder servicing fees—Class C | | | 45,986 | | |
| Transfer agent fees | | | 54,507 | | |
| Shareholder reporting expenses | | | 46,287 | | |
| Directors' fees and expenses | | | 37,140 | | |
| Registration and filing fees | | | 29,396 | | |
| Line of credit fees | | | 726 | | |
| Miscellaneous | | | 4,356 | | |
| Total Expenses | | | 1,634,902 | | |
| Reduction of Expenses | | | (161,946 | ) | |
| Net Expenses | | | 1,472,956 | | |
| Net Investment Income | | | 693,890 | | |
| Net Realized and Unrealized Gain(Loss) on Investments: | |
| Net realized gain(loss) on: | |
| Investments | | | 1,460,903 | | |
| Foreign currency transactions | | | (432,911 | ) | |
| Net realized gain | | | 1,027,992 | | |
| Net change in unrealized appreciation (depreciation) on: | |
| Investments | | | 23,103,999 | | |
| Foreign currency translations | | | (1,143 | ) | |
| Net change in unrealized appreciation | | | 23,102,856 | | |
| Total net realized and unrealized gain on investments | | | 24,130,848 | | |
| Net Increase in Net Assets Resulting from Operations | | $ | 24,824,738 | | |
a Commencement of operations.
See accompanying notes to financial statements.
20
COHEN & STEERS INTERNATIONAL REALTY FUND, INC.
STATEMENT OF CHANGES IN NET ASSETS
| | | For the Period
March 31, 2005a
through
December 31, 2005 | |
| Change in Net Assets: | |
| From Operations: | |
| Net investment income | | $ | 693,890 | | |
| Net realized gain | | | 1,027,992 | | |
| Net change in unrealized appreciation | | | 23,102,856 | | |
| Net increase in net assets resulting from operations | | | 24,824,738 | | |
| Less Dividends and Distributions to Shareholders from: | |
| Net investment income: | |
| Class A | | | (323,527 | ) | |
| Class C | | | (64,631 | ) | |
| Class I | | | (752,226 | ) | |
| Net realized gain on investments: | |
| Class A | | | (316,743 | ) | |
| Class C | | | (210,681 | ) | |
| Class I | | | (508,917 | ) | |
| Total dividends and distributions to shareholders | | | (2,176,725 | ) | |
| Capital Stock Transactions: | |
| Increase in net assets from fund share transactions | | | 280,381,705 | | |
| Total increase in net assets | | | 303,029,718 | | |
| Net Assets: | |
| Beginning of period | | | 100,275 | | |
| End of periodb | | $ | 303,129,993 | | |
a Commencement of operations.
b Including dividends in excess of net investment income of $872,888.
See accompanying notes to financial statements.
21
COHEN & STEERS INTERNATIONAL REALTY FUND, INC.
FINANCIAL HIGHLIGHTS
The following table includes selected data for a share outstanding throughout the period and other performance information derived from the financial statements. It should be read in conjunction with the financial statements and notes thereto.
| Per Share Operating Performance: | | For the Period March 31, 2005a through December 31, 2005 | |
| | | Class A | | Class C | | Class I | |
| Net asset value, beginning of period | | $ | 11.46 | | | $ | 11.46 | | | $ | 11.46 | | |
| Income from investment operations: | |
| Net investment incomeb | | | 0.07 | | | | 0.01 | | | | 0.11 | | |
| Net realized and unrealized gain on investments | | | 1.86 | | | | 1.87 | | | | 1.85 | | |
| Total from investment operations | | | 1.93 | | | | 1.88 | | | | 1.96 | | |
| Less dividends and distributions to shareholders from: | |
| Net investment income | | | (0.06 | ) | | | (0.03 | ) | | | (0.09 | ) | |
| Net realized gain on investments | | | (0.05 | ) | | | (0.05 | ) | | | (0.05 | ) | |
| Total dividends and distributions to shareholders | | | (0.11 | ) | | | (0.08 | ) | | | (0.14 | ) | |
| Redemption fees retained by the fund | | | 0.00 | c | | | 0.00 | c | | | 0.00 | c | |
| Net increase in net asset value | | | 1.82 | | | | 1.80 | | | | 1.82 | | |
| Net asset value, end of period | | $ | 13.28 | | | $ | 13.26 | | | $ | 13.28 | | |
| Total investment returnf | | | 16.88 | %d | | | 16.37 | %d | | | 17.14 | % | |
| Ratios/Supplemental Data: | |
| Net assets, end of period (in millions) | | $ | 91.6 | | | $ | 61.4 | | | $ | 150.2 | | |
Ratio of expenses to average daily net assets
(before expense reduction)e | | | 1.86 | % | | | 2.50 | % | | | 1.57 | % | |
Ratio of expenses to average daily net assets
(net of expense reduction)e | | | 1.70 | % | | | 2.35 | % | | | 1.35 | % | |
Ratio of net investment income (loss) to average daily net assets
(before expense reduction)e | | | 0.56 | % | | | (0.09 | )% | | | 1.00 | % | |
Ratio of net investment income to average daily net assets
(net of expense reduction)e | | | 0.72 | % | | | 0.07 | % | | | 1.22 | % | |
| Portfolio turnover ratef | | | 35 | % | | | 35 | % | | | 35 | % | |
a Commencement of operations.
b Calculated based on the average shares outstanding during the period.
c Less than $0.005 per share.
d Does not reflect sales charges, which would reduce return.
e Annualized
f Not annualized
See accompanying notes to financial statements.
22
COHEN & STEERS INTERNATIONAL REALTY FUND, INC.
NOTES TO FINANCIAL STATEMENTS
Note 1. Significant Accounting Policies
Cohen & Steers International Realty Fund, Inc. (the fund) was incorporated under the laws of the State of Maryland on November 23, 2004 and is registered under the Investment Company Act of 1940, as amended, as a nondiversified, open-end management investment company. The fund's investment objective is total return. The fund had no operations until January 11, 2005 when it sold 10 shares each of Class A, B, C, and 8,720 shares of Class I for $100,275 to Cohen & Steers Capital Management, Inc. (The Class B shares were subsequently transferred to Class I and Class B shares are presently not offered). Investment operations commenced on March 31, 2005. The authorized shares of the fund are divided into three classes designated Class A, C, and I shares. Each of the fund's shares has equal dividend, liquidation and voting rights (except for matters relating to distributions and shareholder servicing of such shares).
The following is a summary of significant accounting policies consistently followed by the fund in the preparation of its financial statements. The policies are in conformity with accounting principles generally accepted in the United States of America (GAAP). The preparation of the financial statements in accordance with GAAP requires management to make estimates and assumptions that affect the reported amounts of assets and liabilities at the date of the financial statements and the reported amounts of income and expenses during the reporting period. Actual results could differ from those estimates.
Portfolio Valuation: Investments in securities that are listed on the New York Stock Exchange are valued, except as indicated below, at the last sale price reflected at the close of the New York Stock Exchange on the business day as of which such value is being determined. If there has been no sale on such day, the securities are valued at the mean of the closing bid and asked prices for the day or, if no asked price is available, at the bid price.
Securities not listed on the New York Stock Exchange but listed on other domestic or foreign securities exchanges or admitted to trading on the National Association of Securities Dealers Automated Quotations, Inc. (Nasdaq) national market system are valued in a similar manner. Securities traded on more than one securities exchange are valued at the last sale price on the business day as of which such value is being determined as reflected on the tape at the close of the exchange representing the principal market for such securities.
Readily marketable securities traded in the over-the-counter market, including listed securities whose primary market is believed by Cohen & Steers Capital Management, Inc. to be over-the-counter, but excluding securities admitted to trading on the Nasdaq National List, are valued at the official closing prices as reported by Nasdaq, the National Quotation Bureau, or such other comparable sources as the Board of Directors deem appropriate to reflect their fair market value. If there has been no sale on such day, the securities are valued at the mean of the closing bid and asked prices for the day, or if no asked price is available, at the bid price. However, certain fixed-income securities may be valued on the basis of prices provided by a pricing service when such prices are believed by the Board of Directors to reflect the fair market value of such securities. Where securities are traded on more than one exchange and also over-the-coun ter, the securities will generally be valued using the quotations the Board of Directors believes most closely reflect the value of such securities.
23
COHEN & STEERS INTERNATIONAL REALTY FUND, INC.
NOTES TO FINANCIAL STATEMENTS—(Continued)
Portfolio securities primarily traded on foreign markets are generally valued at the preceding closing values of such securities on their respective exchanges or if after the close of the foreign markets, but prior to the close of business on the day the securities are being valued, market conditions change significantly, certain foreign securities may be fair valued pursuant to procedures established by the Board of Directors.
Securities for which market prices are unavailable will be valued at fair value pursuant to procedures approved by the fund's Board of Directors. Circumstances in which market prices may be unavailable include, but are not limited to, when trading in a security is suspended, the exchange on which the security is traded is subject to an unscheduled close or disruption or material events occur after the close of the exchange on which the security is principally traded. In these circumstances, the fund determines fair value in a manner that fairly reflects the market value of the security on the valuation date based on consideration of any information or factors it deems appropriate. These may include recent transactions in comparable securities, information relating to the specific security and developments in the markets.
To the extent the fund holds securities that are primarily listed on foreign exchanges that trade on weekends or days when the fund does not price its shares, the value of the securities held in the fund may change on days when you will not be able to purchase or redeem fund shares.
The fund's use of fair value pricing may cause the net asset value of fund shares to differ from the net asset value that would be calculated using market quotations. Fair value pricing involves subjective judgments and it is possible that the fair value determined for a security may be materially different than the value that could be realized upon the sale of that security.
Short-term debt securities, which have a maturity date of 60 days or less, are valued at amortized cost, which approximates value.
Security Transactions and Investment Income: Security transactions are recorded on trade date. Realized gains and losses on investments sold are recorded on the basis of identified cost. Interest income is recorded on the accrual basis. Discounts are accreted and premiums are amortized over the life of the respective securities. Dividend income is recorded on the ex-dividend date. The fund records distributions received in excess of income from underlying investments as a reduction of cost of investments and/or realized gain. Such amounts are based on estimates if actual amounts are not available, and actual amounts of income, realized gain and return of capital may differ from the estimated amounts. The fund adjusts the estimated amounts of the components of distributions (and consequently its net investment income) as an increase to unrealized appreciation/ (dep reciation) and realized gain/(loss) on investments as necessary once the issuers provide information about the actual composition of the distributions. Income, expenses (other than expenses attributable to a specific class), and realized and unrealized gains or losses on investments are allocated to each class of shares based on its relative net assets.
24
COHEN & STEERS INTERNATIONAL REALTY FUND, INC.
NOTES TO FINANCIAL STATEMENTS—(Continued)
Foreign Currency Translation and Forward Foreign Currency Contracts: The books and records of the fund are maintained in U.S. dollars as follows: (1) the foreign currency market value of investment securities, other assets and liabilities and forward foreign currency contracts (forward contracts) are translated at the exchange rates prevailing at the end of the period; and (2) purchases, sales, income and expenses are translated at the exchange rates prevailing on the respective dates of such transactions. The resultant exchange gains and losses are recorded as realized and unrealized gain/loss on foreign exchange transactions. Pursuant to U.S. federal income tax regulations, certain foreign exchange gains/losses included in realized and unrealized gain/loss are included in or are a reduction of ordinary income for federal income tax purposes. The fund does not is olate that portion of the results of operations arising as a result of changes in the foreign exchange rates from the changes in the market prices of the securities. Forward contracts are valued daily at the appropriate exchange rates. The resultant unrealized exchange gains and losses are recorded as unrealized foreign currency gain or loss. The fund records realized gains or losses on delivery of the currency or at the time the forward contract is extinguished (compensated) by entering into a closing transaction prior to delivery.
Foreign Securities: The fund may directly purchase securities of foreign issuers. Investing in securities of foreign issuers involves special risks not typically associated with investing in securities of U.S. issuers. The risks include possible revaluation of currencies, the ability to repatriate funds, less complete financial information about companies and possible future adverse political and economic developments. Moreover, securities of many foreign issuers and their markets may be less liquid and their prices more volatile than those of securities of comparable U.S. issuers.
Dividends and Distributions to Shareholders: Dividends from net investment income and capital gain distributions are determined in accordance with U.S. federal income tax regulations, which may differ from GAAP. Dividends from net investment income are declared and paid quarterly. Net realized capital gains, unless offset by any available capital loss carryforward, are distributed to shareholders annually. Dividends and distributions to shareholders are recorded on the ex-dividend date and are automatically reinvested in full and fractional shares of the fund based on the net asset value per share at the close of business on the ex-dividend date unless the shareholder has elected to have them paid in cash.
Distributions paid by the fund are subject to recharacterization for tax purposes. For the period March 31, 2005 (commencement of operations) through ended December 31, 2005, a portion of the dividends paid have been reclassified to return of capital and distributions of net realized capital gains.
Federal Income Taxes: It is the policy of the fund to continue to qualify as a regulated investment company, if such qualification is in the best interest of the shareholders, by complying with the requirements of Subchapter M of the Internal Revenue Code applicable to regulated investment companies, and by distributing substantially all of its taxable earnings to its shareholders. Accordingly, no provision for federal income or excise tax is necessary.
25
COHEN & STEERS INTERNATIONAL REALTY FUND, INC.
NOTES TO FINANCIAL STATEMENTS—(Continued)
Note 2. Investment Advisory and Administration Fees and Other Transactions with Affiliates
Investment Advisory Fees: Cohen & Steers Capital Management, Inc. (the advisor) serves as the fund's investment advisor pursuant to an investment advisory agreement (the advisory agreement). Under the terms of the advisory agreement, the advisor provides the fund with the day-to-day investment decisions and generally manages the fund's investments in accordance with the stated policies of the fund, subject to the supervision of the fund's Board of Directors. For the services provided to the fund, the advisor receives a monthly fee, accrued daily and paid monthly at the annual rate of 0.95% of the average daily net assets of the fund up to and including $1.5 billion and 0.85% of the average daily net asset above $1.5 billion.
For the period March 31, 2005 (commencement of operations) through December 31, 2005 and through December 31, 2006, the advisor has contractually agreed to waive its fee and/or reimburse the fund for expenses incurred to the extent necessary to maintain the fund's operating expenses at 1.70% for the Class A shares, 2.35% for the Class C shares and 1.35% for the Class I shares.
Under a subadvisory agreement between the advisor and Houlihan Rovers S.A. (the subadvisor), an affiliate of the advisor, the subadvisor is responsible for managing the fund's investments in certain non-U.S. real estate securities. For its services provided under the subadvisory agreement, the advisor (not the fund) pays the subadvisor a monthly fee at the annual rate of 0.30% of the average daily net assets of the fund. For the period March 31, 2005 (commencement of operations) through December 31, 2005, the advisor paid the subadvisor $261,865.
Administration Fees: The fund has entered into an administration agreement with the advisor under which the advisor performs certain administrative functions for the fund and receives a fee, accrued daily and paid monthly at the annual rate of 0.06% of the fund's average daily net assets. For the period March 31, 2005 (commencement of operations) through December 31, 2005, the fund paid the advisor $52,373 in fees under this administration agreement.
Distribution Fees: Cohen & Steers Securities, LLC (the distributor), an affiliated entity of the advisor, distributes the shares of the fund. The fund has adopted a distribution plan (the plan) pursuant to Rule 12b-1 under the Investment Company Act of 1940. Under the plan, the fund may not incur distribution fees which exceed an annual rate of 0.25% of the average daily net assets attributable to the Class A shares and 0.75% of the average daily net assets attributable to the Class C shares.
For the period March 31, 2005 (commencement of operations) through December 31, 2005, the fund has been advised that the distributor received $86,976 in sales commissions from the sale of Class A shares and that the distributor also received $3,761 of contingent deferred sales charges relating to redemptions of Class C shares. The distributor has advised the fund that proceeds from the contingent deferred sales charge on the Class C shares are paid to the distributor and are used by the distributor to defray its expenses related to providing distribution-related services to the fund in connection with the sale of the Class C shares, including payments to dealers and other financial intermediaries for selling Class C shares and interest and other financing costs associated with Class C shares.
26
COHEN & STEERS INTERNATIONAL REALTY FUND, INC.
NOTES TO FINANCIAL STATEMENTS—(Continued)
Shareholder Servicing Fees: The fund has adopted a shareholder services plan which provides that the fund may obtain the services of qualified financial institutions to act as shareholder servicing agents for their customers. For these services, the fund may pay the shareholder servicing agent a fee at an annual rate of up to 0.10% of the average daily net asset value of the fund's Class A shares and up to 0.25% of the average daily net asset value of the fund's Class C shares.
Directors' and Officers' Fees: Certain directors and officers of the fund are also directors, officers, and/or employees of the advisor. The fund does not pay compensation to any affiliated directors and officers except for the Chief Compliance Officer, who received $1,420 from the fund for the year ended December 31, 2005.
Note 3. Purchases and Sales of Securities
Purchases and sales of securities, excluding short-term investments, for the period March 31, 2005 (commencement of operations) through December 31, 2005 totaled $311,782,319 and $44,030,029 respectively.
Note 4. Income Tax Information
The tax character of dividends and distributions paid for the period March 31, 2005 (commencement of operations) through December 31, 2005 was as follows:
| Ordinary income | | $ | 2,176,725 | | |
As of December 31, 2005, the tax-basis components of accumulated earnings and the federal tax cost were as follows:
| Gross unrealized appreciation | | $ | 20,374,975 | | |
| Gross unrealized depreciation | | | (1,762,419 | ) | |
| Net unrealized appreciation | | $ | 18,612,556 | | |
| Undistributed ordinary income | | $ | 4,256,849 | | |
| Undistributed long-term capital gains | | $ | 57,989 | | |
| Cost for federal income tax purposes | | $ | 284,077,966 | | |
As of December 31, 2005, the fund had temporary book/tax differences primarily attributable to wash sales on portfolio securities and the mark-to-market of passive foreign investment companies and permanent book/tax differences primarily attributable to foreign currency losses. To reflect reclassifications arising from the permanent differences, paid-in capital was charged $6,511, accumulated net realized gain was credited $432,905 and accumulated net investment income was charged $426,394.
27
COHEN & STEERS INTERNATIONAL REALTY FUND, INC.
NOTES TO FINANCIAL STATEMENTS—(Continued)
Note 5. Capital Stock
The fund is authorized to issue 200 million shares of capital stock, at a par value of $0.001 per share. The Board of Directors of the fund may increase or decrease the aggregate number of shares of common stock that the fund has authority to issue. At December 31, 2005, Cohen & Steers Capital Management Inc. owned 449,879 shares of Class I. Transactions in fund shares were as follows:
| | | For the Period
March 31, 2005*
through
December 31, 2005 | |
| | | Shares | | Amount | |
| Class A: | |
| Sold | | | 7,009,246 | | | $ | 85,114,447 | | |
| Issued as reinvestment of dividends | | | 29,652 | | | | 387,984 | | |
| Redeemed | | | (140,485 | ) | | | (1,753,046 | ) | |
| Redemption fees retained by the funda | | | — | | | | 1,824 | | |
| Net increase | | | 6,898,413 | | | $ | 83,751,209 | | |
| Class C: | |
| Sold | | | 4,671,986 | | | $ | 57,212,816 | | |
| Issued as reinvestment of dividends | | | 6,732 | | | | 88,101 | | |
| Redeemed | | | (51,569 | ) | | | (639,735 | ) | |
| Redemption fees retained by the funda | | | — | | | | 857 | | |
| Net increase | | | 4,627,149 | | | $ | 56,662,039 | | |
| Class I: | |
| Sold | | | 11,330,663 | | | $ | 140,337,487 | | |
| Issued as reinvestment of dividends | | | 95,403 | | | | 1,247,618 | | |
| Redeemed | | | (127,633 | ) | | | (1,618,220 | ) | |
| Redemption fees retained by the funda | | | — | | | | 1,572 | | |
| Net increase | | | 11,298,433 | | | $ | 139,968,457 | | |
* Commencement of operations
a The fund may charge a 1% redemption fee on shares sold within six months of the time of purchase.
28
COHEN & STEERS INTERNATIONAL REALTY FUND, INC.
NOTES TO FINANCIAL STATEMENTS—(Continued)
Note 6. Borrowings
The fund, in conjunction with other Cohen & Steers funds is a party to a $150,000,000 syndicated credit agreement (the credit agreement) with State Street Bank and Trust Company, as administrative agent and operations agent, and the lenders identified in the credit agreement.
During the period March 31, 2005 (commencement of operations) through December 31, 2005, the fund did not utilize the line of credit.
Note 7. Other
In the normal course of business, the fund enters into contracts that provide general indemnifications. The fund's maximum exposure under these arrangements is dependent on claims that may be made against the fund in the future and, therefore, cannot be estimated; however, based on experience, the risk of material loss from such claims is considered remote.
29
COHEN & STEERS INTERNATIONAL REALTY FUND, INC.
REPORT OF INDEPENDENT REGISTERED PUBLIC ACCOUNTING FIRM
To the Board of Directors and Shareholders of
Cohen & Steers International Realty Fund, Inc.
In our opinion, the accompanying statement of assets and liabilities, including the schedule of investments, and the related statements of operations and of changes in net assets and the financial highlights present fairly, in all material respects, the financial position of Cohen & Steers International Realty Fund, Inc. (the "Fund") at December 31, 2005, and the results of its operations, the changes in its net assets and the financial highlights for the period March 31, 2005 (commencement of operations) through December 31, 2005, in conformity with accounting principles generally accepted in the United States of America. These financial statements and financial highlights (hereafter referred to as "financial statements") are the responsibility of the Fund's management. Our responsibility is to express an opinion on these financial statements based on our audit. We conducted our audit of these financial statements in accordance with the standards of the Public Company Accounting Oversight Board (United States). Those standards require that we plan and perform the audit to obtain reasonable assurance about whether the financial statements are free of material misstatement. An audit includes examining, on a test basis, evidence supporting the amounts and disclosures in the financial statements, assessing the accounting principles used and significant estimates made by management, and evaluating the overall financial statement presentation. We believe that our audit, which included confirmation of securities at December 31, 2005 by correspondence with the custodian and brokers, provides a reasonable basis for our opinion.
PricewaterhouseCoopers LLP
New York, New York
February 17, 2006
30
COHEN & STEERS INTERNATIONAL REALTY FUND, INC.
TAX INFORMATION—2005 (Unaudited)
Pursuant to the Jobs and Growth Relief Reconciliation Act of 2003, the fund designates qualified dividend income of $864,878.
The fund has elected, pursuant to section 853 of the Internal Revenue Code, to pass through foreign taxes of $265,528. The fund generated net foreign source income of $2,180,972 with respect to this election.
OTHER INFORMATION
A description of the policies and procedures that the fund uses to determine how to vote proxies relating to portfolio securities is available (i) without charge, upon request, by calling 1-800-330-7348, (ii) on our Web site at cohenandsteers.com or (iii) on the Securities and Exchange Commission's Web site at http://www.sec.gov. In addition, the fund's proxy voting record for the most recent 12-month period ended June 30 is available (i) without charge, upon request, by calling 800-330-7348 or (ii) on the SEC's Web site at http://www.sec.gov.
The fund files its complete schedule of portfolio holdings with the SEC for the first and third quarters of each fiscal year on Form N-Q. The fund's Forms N-Q are available (i) without charge, upon request by calling 1-800-330-7348, or (ii) on the SEC's Web site at http://www.sec.gov. In addition, the Forms N-Q may be reviewed and copied at the SEC's Public Reference Room in Washington, DC. Information on the operation of the Public Reference Room may be obtained by calling 800-SEC-0330.
Please note that the distributions paid by the fund to shareholders are subject to recharacterization for tax purposes. The final tax treatment of these distributions is reported to shareholders on their 1099-DIV forms, which are mailed to shareholders after the close of each fiscal year. The fund may pay distributions in excess of the fund's net investment company taxable income and this excess would be a tax-free return of capital distributed from the fund's assets. To the extent this occurs, the fund's shareholders of record will be notified of the estimated amount of capital returned to shareholders for each such distribution and this information will also be available at cohenandsteers.com. Distributions of capital decrease the fund's total assets and, therefore, could have the effect of increasing the fund's expense ratio. In addition, in order to make these distributions, the fund may have to sell portfolio securities at a less than o pportune time.
31
COHEN & STEERS INTERNATIONAL REALTY FUND, INC.
MANAGEMENT OF THE FUND
The business and affairs of the fund are managed under the direction of the board of directors. The board of directors approves all significant agreements between the fund and persons or companies furnishing services to it, including the fund's agreements with its advisor, administrator, custodian and transfer agent. The management of the fund's day-to-day operations is delegated to its officers, the advisor and the fund's administrator, subject always to the investment objective and policies of the fund and to the general supervision of the board of directors.
The directors and officers of the fund and their principal occupations during the past five years are set forth below. The statement of additional information (SAI) includes additional information about fund directors and is available, without charge, upon request by calling 1-800-330-7348.
| Name, Address and Age* | | Position(s) Held
with Fund | | Term of
Office | | Principal Occupation
During Past 5 Years
(Including Other
Directorships Held) | | Number of
Funds Within
Fund
Complex
Overseen by
Director
(Including
the Fund) | | Length
of Time
Served** | |
| Interested Directors1 | |
|
| Robert H. Steers Age: 52 | | Director and Co-Chairman | | Until next election of directors | | Co-Chairman and Co-Chief Executive Officer of Cohen & Steers Capital Management, Inc. (CSCM), the fund's investment manager, and its parent company, Cohen & Steers, Inc. (CNS) since 2004. President and Director, Cohen & Steers Securities, LLC (CSSL), the Cohen & Steers open-end funds' distributor. Prior thereto, Chairman of CSCM and the Cohen & Steers funds. | | | 17 | | | 1991 to
present | |
|
| Martin Cohen Age: 56 | | Director and Co-Chairman | | Until next election of directors | | Co-Chairman and Co-Chief Executive Officer of CSCM and CNS. Vice President and Director of CSSL. Prior thereto, President of the CSCM and the Cohen & Steers funds. | | | 17 | | | 1991 to
present | |
|
* The address for each director is 280 Park Avenue, New York, NY 10017.
** The length of time served represents the year in which the director was first elected or appointed to any fund in the Cohen & Steers fund complex.
1 "Interested person", as defined in the 1940 Act, of the fund because of affiliation with CSCM.
2 Martin Cohen and Bonnie Cohen are not related.
32
COHEN & STEERS INTERNATIONAL REALTY FUND, INC.
| Name, Address and Age* | | Position(s) Held
with Fund | | Term of
Office | | Principal Occupation
During Past 5 Years
(Including Other
Directorships Held) | | Number of
Funds Within
Fund
Complex
Overseen by
Director
(Including
the Fund) | | Length
of Time
Served** | |
| Disinterested Directors | |
|
| Bonnie Cohen2 Age: 63 | | Director | | Until next election of directors | | Consultant. Prior thereto, Undersecretary of State, United States Department of State. Director of Wellsford Real Properties, Inc. | | | 17 | | | 2001 to
present | |
|
| George Grossman, Age: 52 | | Director | | Until next election of directors | | Attorney-at-law | | | 17 | | | 1993 to
present | |
|
| Richard E. Kroon, Age: 63 | | Director | | Until next election of directors | | Board member of Finlay Enterprises, Inc., (operator of department store fine jewelry leased departments) and several private companies; member of Investment Subcommittee, Monmouth University; retired Chairman and Managing Partner of the Sprout Group venture capital funds, then an affiliate of Donaldson, Lufkin & Jenrette Securities Corporation; and former Chairman of the National Venture Capital Association. | | | 17 | | | 2004 to
present | |
|
| Richard J. Norman Age: 62 | | Director | | Until next election of directors | | Private Investor. President of the Board of Directors of Maryland Public Television, Board Member of the Salvation Army. Prior thereto, Investment Representative of Morgan Stanley Dean Witter. | | | 17 | | | 2001 to
present | |
|
(table continued on next page)
* The address for each director is 280 Park Avenue, New York, NY 10017.
** The length of time served represents the year in which the director was first elected or appointed to any fund in the Cohen & Steers fund complex.
33
COHEN & STEERS INTERNATIONAL REALTY FUND, INC.
(table continued from previous page)
| Name, Address and Age* | | Position(s) Held
with Fund | | Term of
Office | | Principal Occupation
During Past 5 Years
(Including Other
Directorships Held) | | Number of
Funds Within
Fund
Complex
Overseen by
Director
(Including
the Fund) | | Length
of Time
Served** | |
| Frank K. Ross Age: 62 | | Director | | Until next election of directors | | Professor of Accounting, Howard University; Board member of NCRIC Group, Inc. (insurance) and Pepco Holdings, Inc. (electric utility). Formerly, Midatlantic Area Managing Partner for Audit and Risk Advisory Services at KPMG LLP and Managing Partner of its Washington, DC office. | | | 17 | | | 2004 to
present | |
|
| Willard H. Smith Jr. Age: 69 | | Director | | Until next election of directors | | Board member of Essex Property Trust Inc., Realty Income Corporation and Crest Net Lease, Inc. Managing Director at Merrill Lynch & Co., Equity Capital Markets Division from 1983 to 1995. | | | 17 | | | 1996 to
present | |
|
| C. Edward Ward, Jr. Age: 59 | | Director | | Until next election of directors | | Member of the Board of Trustees of Directors Manhattan College, Riverdale, New York. Formerly head of closed-end fund listings for the New York Stock Exchange. | | | 17 | | | 2004 to
present | |
|
* The address for each director is 280 Park Avenue, New York, NY 10017.
** The length of time served represents the year in which the director was first elected or appointed to any fund in the Cohen & Steers fund complex.
34
COHEN & STEERS INTERNATIONAL REALTY FUND, INC.
The officers of the fund (other than Messrs. Cohen and Steers, whose biographies are provided above), their address, their ages and their principal occupations for at least the past five years are set forth below.
| Name, Address and Age* | | Position(s) Held
with Fund | | Principal Occupation During Past 5 Years | | Lenth
of Time
Served** | |
| Adam M. Derechin Age: 41 | | President and Chief Executive Officer | | Chief Operating Officer of CSCM (since 2003) and CNS (since 2004). Prior to that, Senior Vice President of CSCM and Vice President and Assistant Treasurer of the Cohen & Steers funds. | | Since
2005 | |
|
Joseph M. Harvey
Age: 42 | | Vice President | | President of CSCM (since 2003) and CNS (since 2004). Prior to that, Senior Vice President and Director of Investment Research of CSCM. | | Since
2004 | |
|
James S. Corl,
Age: 39 | | Vice President | | Executive Vice President of CSCM and CNS since 2004. Prior to that, Senior Vice President of CSCM. | | Since
2004 | |
|
Lawrence B. Stoller
Age: 42 | | Secretary | | Executive Vice President and General Counsel of CSCM and CNS since 2004. Secretary of CSSL since 2006. Prior to that, Senior Vice President and General Counsel of CSCM and Assistant Secretary of the Cohen & Steers funds (since 1999) and Chief Legal Officer of CSSL (since 2002). | | Since
2005 | |
|
Jay J. Chen
Age: 42 | | Treasurer and Chief Financial Officer | | Senior Vice President of CSCM since August 2003 and Assistant Treasurer of CSSL since 2002. Prior to that, Vice President of CSCM. | | Since
2005 | |
|
John E. McLean
Age: 34 | | Chief Compliance Officer and Assistant Secretary | | Vice President and Associate General Counsel of CSCM since September 2003. Prior to that, Vice President, Law and Regulation, J&W Seligman & Co. Incorporated (money manager). | | Since
2004 | |
|
* The address of each officer is 280 Park Avenue, New York, NY 10017
** Officers serve one-year terms. The length of time served represents the year in which the officer was first elected to that position in any fund in the Cohen & Steers fund complex. All of the officers listed above are officers of one or more of the other funds in the complex.
35
COHEN & STEERS INTERNATIONAL REALTY FUND, INC.
Meet the Cohen & Steers family of open-end funds:

• Designed for investors seeking maximum total return, investing primarily in REITs
• Symbol: CSRSX

• Designed for institutional investors seeking maximum total return, investing primarily in REITs
• Symbol: CSRIX

• Designed for investors seeking high current income, investing primarily in REITs
• Symbols: CSEIX, CSBIX, CSCIX, CSDIX

• Designed for investors seeking maximum capital appreciation, investing in a limited number of REITs and other real estate securities
• Symbols: CSFAX, CSFBX, CSFCX, CSSPX

• Designed for investors seeking maximum total return, investing primarily in international real estate securities
• Symbols: IRFAX, IRFCX, IRFIX

• Designed for investors seeking maximum total return, investing primarily in utilities
• Symbols: CSUAX, CSUBX, CSUCX, CSUIX

• Designed for investors seeking high current income and long-term growth of income and capital appreciation, investing primarily in dividend paying common stocks and preferred stocks.
• Symbols: DVFAX, DVFCX, DVFIX
Please consider the investment objectives, risks, charges and expenses of the fund carefully before investing. A prospectus containing this and other information can be obtained by calling 800-330-7348 or by visting cohenandsteers.com. Please read the prospectus carefully before investing.
Cohen & Steers Securities, LLC, Distributor
36
COHEN & STEERS INTERNATIONAL REALTY FUND, INC.
OFFICERS AND DIRECTORS
Robert H. Steers
Director and co-chairman
Martin Cohen
Director and co-chairman
Bonnie Cohen
Director
George Grossman
Director
Richard E. Kroon
Director
Richard J. Norman
Director
Frank K. Ross
Director
Willard H. Smith Jr.
Director
C. Edward Ward, Jr.
Director
Adam M. Derechin
President and chief executive officer
Joseph M. Harvey
Vice president
James S. Corl
Vice president
Lawrence B. Stoller
Secretary
Jay J. Chen
Treasurer and chief financial officer
John E. McLean
Chief compliance officer and assistant secretary
KEY INFORMATION
Investment Advisor
Cohen & Steers Capital Management, Inc.
280 Park Avenue
New York, NY 10017
(212) 832-3232
Subadvisor
Houlihan Rovers SA
166 Choussee de la Hulpe
1170 Brussels, Belgium
Fund Subadministrator and Custodian
State Street Bank and Trust Company
225 Franklin Street
Boston, MA 02110
Transfer Agent
Boston Financial Data Services, Inc.
66 Brooks Drive
Braintree, MA 02184
(800) 437-9912
Legal Counsel
Stroock & Stroock & Lavan LLP
180 Maiden Lane
New York, NY 10038
Distributor
Cohen & Steers Securities, LLC
280 Park Avenue
New York, NY 10017
Nasdaq Symbol: Class A—IRFAX
C—IRFCX
I— IRFIX
Web site: cohenandsteers.com
This report is authorized for delivery only to shareholders of Cohen & Steers International Realty Fund, Inc. unless accompanied or preceded by the delivery of a currently effective prospectus setting forth details of the fund. Past performance is of course no guarantee of future results and your investment may be worth more or less at the time you sell.
37
COHEN & STEERS
INTERNATIONAL REALTY FUND
280 PARK AVENUE
NEW YORK, NY 10017

ANNUAL REPORT
DECEMBER 31, 2005
Item 2. Code of Ethics.
The registrant has adopted a Code of Ethics that applies to its Principal Executive Officer and Principal Financial Officer. The registrant undertakes to provide to any person without charge, upon request, a copy of the Code of Ethics. Such request can be made by calling 800-330-7348 or writing to the Secretary of the registrant, 280 Park Avenue, New York, NY 10017.
Item 3. Audit Committee Financial Expert.
The registrant’s board has determined that Frank K. Ross, a member of the board’s audit committee, is an “audit committee financial expert”. Mr. Ross is “independent,” as such term is defined in this Item.
Item 4. Principal Accountant Fees and Services.
(a) – (d) Aggregate fees billed to the registrant for the last two fiscal years for professional services rendered by the registrant’s principal accountant were as follows:
| | 2005 | | 2004 | |
Audit Fees | | $ | 66,000 | | N/A | |
Audit-Related Fees | | — | | N/A | |
Tax Fees | | 12,975 | | N/A | |
All Other Fees | | — | | N/A | |
| | | | | | |
Tax fees were billed in connection with the preparation of tax returns, calculation and designation of dividends and other miscellaneous tax services.
Aggregate fees billed by the registrant’s principal accountant for the last two fiscal years for non-audit services provided to the registrant’s investment adviser (not including a sub-adviser whose role is primarily portfolio management and is subcontracted or overseen by another investment adviser) and any entity controlling, controlled by, or under common control with the investment adviser that provides ongoing services to the registered investment company, where the engagement relates directly to the operations and financial reporting of the registrant, were as follows:
| | 2005 | | 2004 | |
Audit-Related Fees | | — | | N/A | |
Tax Fees | | — | | N/A | |
All Other Fees | | $ | 85,000 | | N/A | |
| | | | | | |
These other fees were billed in connection with internal control reviews and AIMR performance reviews.
(e)(1) The audit committee is required to pre-approve audit and non-audit services performed for the registrant by the principal accountant. The audit committee also is required to pre-approve non-audit services performed by the registrant’s principal accountant for the registrant’s investment adviser and any sub-adviser (not including any sub-adviser whose role is primarily portfolio management and is subcontracted with or overseen by another investment adviser) and/or to any entity controlling, controlled by or under common control with the registrant’s investment adviser that provides ongoing services to the registrant, if the engagement for services relates directly to the operations and financial reporting of the registrant.
The audit committee may delegate pre-approval authority to one or more of its members who are independent members of the board of directors of the registrant. The member or members to whom such authority is delegated shall report any pre-approval decisions to the audit committee at its next scheduled meeting. The audit committee may not delegate its responsibility to pre-approve services to be performed by the registrant’s principal accountant to the investment adviser.
(e) (2) No services included in (b) – (d) above were approved by the audit committee pursuant to paragraphs (c)(7)(i)(C) of Rule 2-01 of Regulation S-X.
(f) Not applicable.
(g) For the fiscal years ended December 31, 2005 and December 31, 2004, the aggregate fees billed by the registrant’s principal accountant for non-audit services rendered to the registrant and for non-audit services rendered to the registrant’s investment adviser (not including any sub-adviser whose role is primarily portfolio management and is subcontracted with or overseen by another investment adviser) and/or to any entity controlling, controlled by or under common control with the registrant’s investment adviser that provides ongoing services to the registrant were $97,975 and $0, respectively.
(h) The registrant’s audit committee considered whether the provision of non-audit services that were rendered to the registrant’s investment adviser (not including any sub-adviser whose role is primarily portfolio management and is subcontracted with or overseen by another investment adviser) and/or to any entity controlling, controlled by or under common control with the registrant’s investment adviser that provides ongoing services to the registrant that were not required to be pre-approved pursuant to paragraph (c)(7)(ii) of Rule 2-01 of Regulation S-X was compatible with maintaining the principal accountant’s independence.
Item 5. Audit Committee of Listed Registrants.
Not applicable.
Item 6. Schedule of Investments.
Included in Item 1 above.
Item 7. Disclosure of Proxy Voting Policies and Procedures for Closed-End Management Investment Companies.
Not applicable.
Item 8. Portfolio Managers of Closed-End Investment Companies.
Not applicable.
Item 9. Purchases of Equity Securities by Closed-End Management Investment Company and Affiliated Purchasers.
Not applicable.
Item 10. Submission of Matters to a Vote of Security Holders.
The board of directors of the registrant has adopted a Nominating Committee Charter which provides that the Nominating Committee (the “Committee”) will consider and evaluate nominee candidates properly submitted by shareholders on the same basis as it considers and evaluates candidates recommended by other sources. The shareholder must submit any such recommendation in writing to the registrant, to the attention of the Secretary, at the address of the principal executive offices of the registrant. A copy of the qualifications and procedures that must be met or followed by shareholders to properly submit a nominee candidate to the Committee may be obtained by submitting a request in writing to the Secretary of the registrant.
Item 11. Controls and Procedures.
(a) The registrant’s principal executive officer and principal financial officer have concluded that the registrant’s disclosure controls and procedures are reasonably designed to ensure that information required to be disclosed by the registrant in this Form N-CSR was recorded, processed, summarized and reported within the time periods specified in the Securities and Exchange Commission’s rules and forms, based upon such officers’ evaluation of these controls and procedures as of a date within 90 days of the filing date of this report.
(b) There were no changes in the registrant’s internal control over financial reporting that occurred during the second fiscal quarter of the period covered by this report that have materially affected, or are reasonably likely to materially affect, the registrant’s internal control over financial reporting.
Item 12. Exhibits.
(a)(1) Not applicable.
(a) (2) Certifications of principal executive officer and principal financial officer as required by Rule 30a-2(a) under the Investment Company Act of 1940.
(b) Certifications of chief executive officer and chief financial officer as required by Rule 30a- 2(b) under the Investment Company Act of 1940.
SIGNATURES
Pursuant to the requirements of the Securities Exchange Act of 1934 and the Investment Company Act of 1940, the registrant has duly caused this report to be signed on its behalf by the undersigned, thereunto duly authorized.
COHEN & STEERS INTERNATIONAL REALTY FUND, INC. |
|
|
| By: | /s/ | Adam M. Derechin | |
| | Name: Adam M. Derechin |
| | Title: President and Chief Executive Officer |
|
| Date: March 6, 2006 |
|
Pursuant to the requirements of the Securities Exchange Act of 1934 and the Investment Company Act of 1940, this report has been signed below by the following persons on behalf of the registrant and in the capacities and on the dates indicated. |
|
|
| By: | /s/ | Adam M. Derechin | |
| | Name: | Adam M. Derechin |
| | Title: | President and Chief Executive Officer |
| | | (principal executive officer) |
|
| By: | /s/ | Jay J. Chen | |
| | Name: | Jay J. Chen |
| | Title: | Treasurer |
| | | (principal financial officer) |
|
|
| Date: March 6, 2006 |
| | | | | |