UNITED STATES
SECURITIES AND EXCHANGE COMMISSION
Washington, D.C. 20549
FORM N-CSR
CERTIFIED SHAREHOLDER REPORT OF REGISTERED
MANAGEMENT INVESTMENT COMPANIES
Investment Company Act file number | 811-21677 |
|
Cohen & Steers International Realty Fund, Inc. |
(Exact name of registrant as specified in charter) |
|
280 Park Avenue, New York, NY | | 10017 |
(Address of principal executive offices) | | (Zip code) |
|
Adam M. Derechin Cohen & Steers Capital Management, Inc. 280 Park Avenue New York, New York 10017 |
(Name and address of agent for service) |
|
Registrant’s telephone number, including area code: | (212) 832-3232 | |
|
Date of fiscal year end: | December 31 | |
|
Date of reporting period: | December 31, 2006 | |
| | | | | | | | |
Item 1. Reports to Stockholders.
COHEN & STEERS INTERNATIONAL REALTY FUND, INC.
February 9, 2007
To Our Shareholders:
We are pleased to submit to you our report for the year ended December 31, 2006. The net asset values per share at that date were $18.48, $18.44, and $18.50 for Class A, Class C, and Class I shares, respectively. In addition, a distribution was declared for shareholders of record on December 21, 2006 and paid on December 22, 2006 to all three classes of shares.a The distribution was as follows:
| | | Total
Distribution | | Ordinary
Income | | Short-Term
Capital Gain | | Long-Term
Capital Gain | |
| Class A | | $ | 0.499 | | | $ | 0.423 | | | $ | 0.066 | | | $ | 0.01 | | |
| Class C | | $ | 0.457 | | | $ | 0.381 | | | $ | 0.066 | | | $ | 0.01 | | |
| Class I | | $ | 0.519 | | | $ | 0.443 | | | $ | 0.066 | | | $ | 0.01 | | |
The total return, including income and change in net asset value, for Cohen and Steers International Realty Fund and the comparative benchmarks were:
| | | Six Months Ended
12/31/06 | | Year Ended
12/31/06 | |
| Cohen & Steers International Realty Fund—Class A | | | 25.85 | % | | | 43.88 | % | |
| Cohen & Steers International Realty Fund—Class C | | | 25.38 | % | | | 42.99 | % | |
| Cohen & Steers International Realty Fund—Class I | | | 26.04 | % | | | 44.45 | % | |
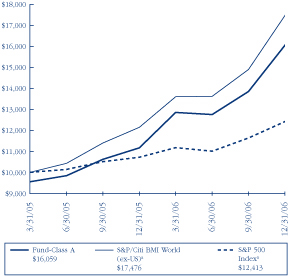
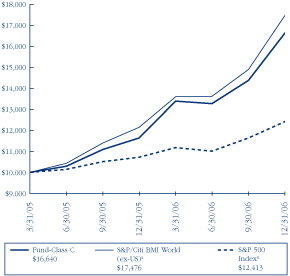
| S&P/Citigroup BMI World Property Index (ex.-U.S.)b | | | 28.20 | % | | | 43.90 | % | |
| S&P 500 Indexb | | | 12.75 | % | | | 15.80 | % | |
The performance data quoted represent past performance. Past performance is no guarantee of future results. The investment return and the principal value of an investment will fluctuate and shares, if redeemed, may be worth more or less than their original cost. Current performance may be lower or higher than the performance data quoted. Total returns of the fund current to the most recent month-end can be obtained by visiting our Web site at cohenandsteers.com. Performance quoted does not reflect the deduction of the maximum 4.5% initial sales charge on Class A shares or the 1% maximum contingent deferred sales charge on Class C shares. If such charges were included, returns would have been lower.
a Please note that distributions paid by the fund to shareholders are subject to recharacterization for tax purposes. The final tax treatment of these distributions is reported to shareholders after the close of each fiscal year.
b The S&P/Citigroup BMI World Property Index (excluding U.S.) is an unmanaged portfolio of approximately 269 constituents from 20 countries. The S&P 500 Index is an unmanaged index of common stocks that is frequently used as a measure of stock performance.
1
COHEN & STEERS INTERNATIONAL REALTY FUND, INC.
Investment Review
Strong fundamentals propelled international real estate stocks to new highs in 2006, despite volatility in the first half sparked by rising interest rates and fear of a global economic slowdown, compounded by an accelerating supply of international real estate shares through initial public offerings (IPOs) and secondary offerings. Concerns eased and the markets rallied in the second half as interest rates stabilized and the global economy showed signs of a mid-cycle slowdown rather than a recession. In a year when most asset classes performed well, real estate security returns were particularly noteworthy. For the year, the fund's performance (43.9%, 43.0% and 44.5% for Class A, C and I shares, respectively) was in line with the 43.9% returned by the S&P/Citigroup BMI World Index (ex-U.S.).
REIT legislation and real estate securitization dominated the news
The year's big story was significant progress toward the creation of REITs or REIT-like structures in key markets. U.K. REITs launched in January 2007 and nine companies converted on January 2, 2007. German and Italian structures are expected later in the year. At that point, nearly 75% of Europe's GDP will have access to REIT-like structures.
The second major theme was the acceleration in the securitization of real estate internationally, as real estate moved into the public markets. Investor participation in IPOs and follow-on offerings allowed companies to purchase more assets and to fund development pipelines. Although widespread throughout Europe and Asia, the level of activity in Germany was particularly noteworthy. German real estate stocks nearly doubled their presence, increasing from 1% of the benchmark to 1.8% during 2006, while the market capitalization of the benchmark grew from $360 billion to $561 billion during the year. We expect a sustained flow of assets from the private to the public market.
Limited new construction created a positive environment
2006 was characterized by attractive growth in both the economy and real estate demand in international markets. Moreover, supply was moderate, resulting in strong occupancy and rental growth in many markets. In London, Paris, Singapore and Hong Kong, the dearth of supply was driven, as it has been for many years, by limited land availability, government controls and restrictive building codes that constrained new development. At the same time, demand was positive, driven by employment and economic growth. This imbalance created a positive environment for real estate fundamentals, and occupancies and rents moved higher.
Most markets performed well
Against this backdrop, France's total return of 68.7% was fueled by the robust Paris office market and continued improvements to the REIT structure that allowed management teams to create significant value. U.K.
2
COHEN & STEERS INTERNATIONAL REALTY FUND, INC.
performance (50.5%) was driven by strong fundamentals—particularly in the office sector—and attractive valuations that did not fully reflect the benefits of the coming REIT structure. Belgian stocks (16.3%) suffered on a relative basis from lagging property fundamentals while in Austria (26.7%), investor concerns about significant equity issuance and sub par corporate governance restrained prices.
Real Estate Securities Total Returns In Local Currencies
2006
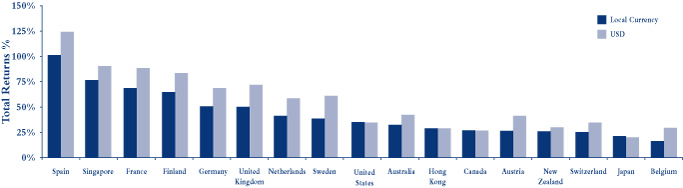
Asia Pacific was led by Singapore (75.7%), which, in the strongest part of its real estate cycle, saw office rents increasing meaningfully amid limited supply. Low unemployment and a growing tourism industry also contributed to Singapore's strong performance. Australia (33.1%) and Japan (21.3%) delivered attractive absolute returns but lagged the international markets as improving fundamentals had been reflected more fully in the valuations of these mature markets. Hong Kong (29.3%) underperformed the benchmark; however, we believe this market should catch up given its strong supply and demand characteristics and valuations that are, on average, well below private real estate values.1
Attractive fund performance in 2006
The fund benefited from overweight positions in virtually all top-performing markets (particularly France, the U.K., and Germany), as well as its underweight position and stock selection in Japan. Performance was diminished by overweight positions and stock selection in Hong Kong, where stocks underperformed as still-strong fundamentals eased from the exceptional levels of prior years, and underweight positions in Spain (99.1%), which saw considerable corporate M&A activity.
1 Country returns are in local currency.
3
COHEN & STEERS INTERNATIONAL REALTY FUND, INC.
Investment Outlook
We believe the general state of supply and demand for real estate internationally will continue to drive real estate security performance. Increasing rents and values in most property markets, notably in the office and residential sectors, bode well for 2007. Continued creation of and enhancements to REIT structures should also support performance over the longer term, in our view. Access to attractively priced capital should enable these companies to add incremental growth through acquisitions.
Of course, there are certain risks that exist when investing in real estate securities, including declining property values or declining rents resulting from legal or economic developments. Foreign securities carry their own risks, such as currency fluctuations, political and economic uncertainties and differences in accounting standards.
Having said that, we believe Germany and Hong Kong are attractive markets and we foresee slow but sustainable economic improvement in Germany after several decades of weak real estate returns. The expected introduction of REITs should drive a massive shift of assets from the private sector to the public markets. As a gateway to China, Hong Kong is a potent mix of high demand for space, limited supply of real estate and attractive valuations. Consequently, we will expect outperformance in both markets. We also favor the U.K., where strong fundamentals have driven rents, occupancies and asset valuations higher amid limited supply. The recently adopted REIT structure should benefit large, well-managed U.K. property companies as they take advantage of greater tax efficiency. Attractive stock valuations and diminished contingent tax liabilities may foster merger and acquisition activity in the U.K., along with potential IPO activity in the U.K. a nd other new REIT markets.
Performance in Asia Pacific should also remain strong, but we maintain our underweight positions in the more mature Australian and Japanese markets, where we see fewer attractively valued companies.
Our investment process focuses on the quantification of the real estate conditions and fundamental themes we discussed above. We construct our funds from the bottom-up, stock by stock, based on relative valuations. At this point, that leads us to be overweight in Hong Kong, where we continue to see the most appealing valuations around the globe, and the U.K., where we believe investors have yet to fully reward companies for their strong fundamentals and management teams, or for the tax efficiency that the new REIT structure will confer. We are also overweight in continental Europe, particularly Germany, where the benefits of REITs draw near. We remain underweight in Japan, reflecting the high valuations of J-REITs. However, we believe some of Japan's large property developers still represent some of the best values in the world. We will maintain our underweight position in Australia, as relatively good fundamentals are largely reflected in v aluations. Overall, we believe that attractive valuations during the early stage of a structural change, overlaid with solid property fundamentals, should continue to drive attractive total returns for international real estate securities.
4
COHEN & STEERS INTERNATIONAL REALTY FUND, INC.
Sincerely,
 | |  | |
|
| MARTIN COHEN | | ROBERT H. STEERS | |
|
| Co-chairman | | Co-chairman | |
|
 | |  | |
|
| JOSEPH M. HARVEY | | JAMES S. CORL | |
|
| Portfolio Manager | | Portfolio Manager | |
|
 | |  | |
|
| W. JOSEPH HOULIHAN | | GERIOS J.M. ROVERS | |
|
| Portfolio Manager | | Portfolio Manager | |
|

DAVID J. OAKES
Portfolio Manager
The views and opinions in the preceding commentary are as of the date stated and are subject to change. This material represents an assessment of the market environment at a specific point in time, should not be relied upon as investment advice and is not intended to predict or depict performance of any investment.
Visit Cohen & Steers online at cohenandsteers.com
For more information about any of our funds, visit cohenandsteers.com, where you'll find daily net asset values, fund fact sheets and portfolio highlights. You can also access newsletters, education tools and market updates covering REIT, utility and preferred securities sectors.
In addition, our Web site contains comprehensive information about our firm, including our most recent press releases, profiles of our senior investment professionals, and an overview of our investment approach.
5
COHEN & STEERS INTERNATIONAL REALTY FUND, INC.
Performance Review (Unaudited)
Cohen & Steers International Realty Fund—Class A
Growth of a $10,000 Investment
Cohen & Steers International Realty Fund—Class C
Growth of a $10,000 Investment
Cohen & Steers International Realty Fund—Class I
Growth of a $100,000 Investment

6
COHEN & STEERS INTERNATIONAL REALTY FUND, INC.
Performance Review (Unaudited)—(Continued)
Average Annual Total Returns For Periods Ending December 31, 2006
| | | Class A
Shares | | Class C
Shares | | Class I
Shares | |
1 Year (with
sales charge) | | | 37.41 | %b | | | 41.99 | %c | | | — | | |
1 Year (without
sales charge) | | | 43.88 | % | | | 42.99 | % | | | 44.45 | % | |
Since Inceptiond
(with sales charge) | | | 31.04 | %b | | | 33.73 | % | | | — | | |
Since Inceptiond
(without sales charge) | | | 34.53 | % | | | 33.73 | % | | | 35.01 | % | |
The performance data quoted represent past performance. Past performance is no guarantee of future results. The investment return and principal value of an investment will fluctuate and shares, when redeemed, may be worth more or less than their original cost. Current performance may be lower or higher than the performance data quoted. Performance information current to the most recent month-end can be obtained by visiting our Web site at cohenandsteers.com. Fund performance during certain periods reflects strong market performance and/or strong performance of stocks held during those periods. This performance may not be repeated. The performance graph and table do not reflect the deduction of taxes that a shareholder would pay on fund distributions or the redemption of fund shares.
a The comparative indexes are not adjusted to reflect expenses or other fees that the SEC requires to be reflected in the fund's performance. The fund's performance assumes the reinvestment of all dividends and distributions. For more information, including charges and expenses, please read the prospectus carefully before you invest.
b Reflects a 4.50% front-end sales charge.
c Reflects a contingent deferred sales charge of 1%.
d Inception date of March 31, 2005.
7
COHEN & STEERS INTERNATIONAL REALTY FUND, INC.
Expense Example (Unaudited)
As a shareholder of the fund, you incur two types of costs: (1) transaction costs, including sales charges (loads) on purchase payments and redemption fees and (2) ongoing costs including management fees; distribution and/or service (12b-1) fees and other fund expenses. This example is intended to help you understand your ongoing costs (in dollars) of investing in the fund and to compare these costs with the ongoing costs of investing in other mutual funds.
The example is based on an investment of $1,000 invested at the beginning of the period and held for the entire period 07/01/06–12/31/06.
Actual Expenses
The first line of the table below provides information about actual account values and expenses. You may use the information in this line, together with the amount you invested, to estimate the expenses that you paid over the period. Simply divide your account value by $1,000 (for example, an $8,600 account value divided by $1,000 = 8.6), then multiply the result by the number in the first line under the heading entitled "Expenses Paid During Period" to estimate the expenses you paid on your account during this period.
Hypothetical Example for Comparison Purposes
The second line of the table below provides information about hypothetical account values and hypothetical expenses based on the fund's actual expense ratio and an assumed rate of return of 5% per year before expenses, which is not the fund's actual return. The hypothetical account values and expenses may not be used to estimate the actual ending account balance or expenses you paid for the period. You may use this information to compare the ongoing cost of investing in the fund and other funds. To do so, compare this 5% hypothetical example with the 5% hypothetical examples that appear in the shareholder reports of the other funds.
Please note that the expenses shown in the table are meant to highlight your ongoing costs only and do not reflect any transactional costs, such as sales charges (loads) and redemption fee. Therefore, the second line of the table is useful in comparing ongoing costs only, and will not help you determine the relative total costs of owning different funds. In addition, if these transactional costs were included, your costs would have been higher.
8
COHEN & STEERS INTERNATIONAL REALTY FUND, INC.
Expense Example (Unaudited)—(Continued)
| | | Beginning
Account Value
07/01/06 | | Ending
Account Value
12/31/06 | | Expenses Paid
During Period*
07/01/06–
12/31/06 | |
| Class A | |
| Actual (25.85% return) | | $ | 1,000.00 | | | $ | 1,258.50 | | | $ | 9.22 | | |
| Hypothetical (5% annual return before expenses) | | $ | 1,000.00 | | | $ | 1,017.04 | | | $ | 8.24 | | |
| Class C | |
| Actual (25.38% return) | | $ | 1,000.00 | | | $ | 1,253.80 | | | $ | 12.90 | | |
| Hypothetical (5% annual return before expenses) | | $ | 1,000.00 | | | $ | 1,013.76 | | | $ | 11.52 | | |
| Class I | |
| Actual (26.04% return) | | $ | 1,000.00 | | | $ | 1,260.40 | | | $ | 7.29 | | |
| Hypothetical (5% annual return before expenses) | | $ | 1,000.00 | | | $ | 1,018.75 | | | $ | 6.51 | | |
* Expenses are equal to the fund's Class A, Class C and Class I annualized expense ratio of 1.62%, 2.27%, and 1.28%, respectively, multiplied by the average account value over the period, multiplied by 184/365 (to reflect the one-half year period).
9
COHEN & STEERS INTERNATIONAL REALTY FUND, INC.
DECEMBER 31, 2006
Top Ten Holdings
(Unaudited)
| Security | | Market
Value | | % of
Net
Assets | |
| Mitsubishi Estate Co., Ltd. | | $ | 159,169,783 | | | | 6.9 | % | |
| Westfield Group | | | 139,589,262 | | | | 6.0 | | |
| Mitsui Fudosan Co., Ltd. | | | 139,141,213 | | | | 6.0 | | |
| Land Securities Group PLC | | | 110,053,822 | | | | 4.7 | | |
| British Land Co., PLC | | | 109,573,774 | | | | 4.7 | | |
| Cheung Kong Holdings Ltd. | | | 91,198,164 | | | | 3.9 | | |
| Hongkong Land Holdings Ltd. (USD) | | | 68,180,468 | | | | 2.9 | | |
| Henderson Land Development Company Ltd. | | | 68,149,853 | | | | 2.9 | | |
| Hysan Development Company Ltd. | | | 68,022,625 | | | | 2.9 | | |
| Slough Estates PLC | | | 65,734,488 | | | | 2.8 | | |
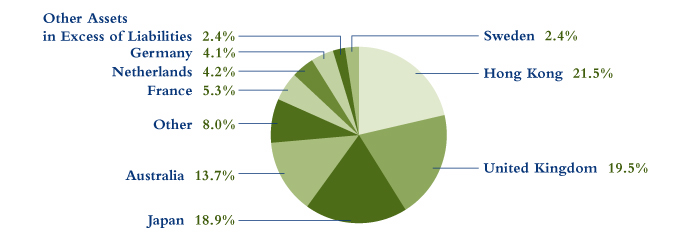
Country Breakdown
(Based on Net Assets)
(Unaudited)
10
COHEN & STEERS INTERNATIONAL REALTY FUND, INC.
SCHEDULE OF INVESTMENTS
December 31, 2006
| | | | | Number
of Shares | | Value | |
| COMMON STOCK | | | 97.6 | % | | | | | | | | | |
| AUSTRALIA | | | 13.7 | % | | | | | | | | | |
| DIVERSIFIED | | | 3.0 | % | | | | | | | | | |
| GPT Group | | | | | | | 11,050,000 | | | $ | 48,844,983 | | |
| Stockland | | | | | | | 3,200,000 | | | | 20,914,620 | | |
| | | | | | | | 69,759,603 | | |
| INDUSTRIAL | | | 1.5 | % | | | | | | | | | |
| ING Industrial Fund | | | | | | | 13,000,000 | | | | 24,319,876 | | |
| Macquarie Goodman Group | | | | | | | 1,850,000 | | | | 11,098,263 | | |
| | | | | | | | 35,418,139 | | |
| OFFICE | | | 2.4 | % | | | | | | | | | |
| ING Office Fund | | | | | | | 24,500,000 | | | | 29,588,788 | | |
| Investa Property Group | | | | | | | 4,400,000 | | | | 8,717,582 | | |
| Tishman Speyer Office Fund | | | | | | | 9,237,000 | | | | 18,155,155 | | |
| | | | | | | | 56,461,525 | | |
| SHOPPING CENTER | | | 6.8 | % | | | | | | | | | |
| CFS Gandel Retail Trust | | | | | | | 9,800,000 | | | | 18,024,020 | | |
| Westfield Group | | | | | | | 8,425,000 | | | | 139,589,262 | | |
| | | | | | | | 157,613,282 | | |
| TOTAL AUSTRALIA | | | | | | | | | | | 319,252,549 | | |
| AUSTRIA | | | 0.6 | % | | | | | | | | | |
| DIVERSIFIED | | | | | | | | | | | | | |
| Immofinanz Immobilien Anlagen AG | | | | | | | 1,024,642 | | | | 14,607,851 | | |
| CANADA | | | 0.4 | % | | | | | | | | | |
| SHOPPING CENTER | | | | | | | | | | | | | |
| Primaris Retail REIT | | | | | | | 560,000 | | | | 9,066,415 | | |
| FINLAND | | | 1.2 | % | | | | | | | | | |
| DIVERSIFIED | | | | | | | | | | | | | |
| Citycon Oyj | | | | | | | 1,388,413 | | | | 9,255,512 | | |
| Sponda Oyj | | | | | | | 1,132,886 | | | | 17,945,596 | | |
| TOTAL FINLAND | | | | | | | | | | | 27,201,108 | | |
See accompanying notes to financial statements.
11
COHEN & STEERS INTERNATIONAL REALTY FUND, INC.
SCHEDULE OF INVESTMENTS—(Continued)
December 31, 2006
| | | | | Number
of Shares | | Value | |
| FRANCE | | | 5.3 | % | | | | | | | | | |
| DIVERSIFIED | | | 4.4 | % | | | | | | | | | |
| Fonciere des Regions | | | | | | | 148,685 | | | $ | 29,048,204 | | |
Societe Immobiliere de Location pour L'Industrie et
le Commerce (Silic) | | | | | | | 102,546 | | | | 15,431,708 | | |
| Unibail | | | | | | | 231,264 | | | | 56,507,341 | | |
| | | | | | | | 100,987,253 | | |
| SHOPPING CENTER | | | 0.9 | % | | | | | | | | | |
| Klepierre | | | | | | | 65,656 | | | | 12,393,697 | | |
| Mercialys Promesse | | | | | | | 230,496 | | | | 9,188,841 | | |
| | | | | | | | 21,582,538 | | |
| TOTAL FRANCE | | | | | | | | | | | 122,569,791 | | |
| GERMANY | | | 4.1 | % | | | | | | | | | |
| APARTMENT | | | 1.7 | % | | | | | | | | | |
| Gagfah SA | | | | | | | 427,690 | | | | 13,566,671 | | |
| Patrizia Immobilien AG | | | | | | | 847,650 | | | | 25,243,297 | | |
| | | | | | | | 38,809,968 | | |
| DIVERSIFIED | | | 1.2 | % | | | | | | | | | |
| IVG Immobilien AG | | | | | | | 666,257 | | | | 28,618,690 | | |
| OFFICE | | | 1.0 | % | | | |
| Eurocastle Investment Ltd | | | | | | | 439,868 | | | | 22,413,005 | | |
| SHOPPING CENTER | | | 0.2 | % | | | | | | | | | |
| Dawnay Day Treveria PLC | | | | | | | 2,836,842 | | | | 4,643,519 | | |
| TOTAL GERMANY | | | | | | | | | | | 94,485,182 | | |
| HONG KONG | | | 21.5 | % | | | | | | | | | |
| DIVERSIFIED | | | 17.6 | % | | | | | | | | | |
| Cheung Kong Holdings Ltd. | | | | | | | 7,400,800 | | | | 91,198,164 | | |
| Great Eagle Holdings Ltd. | | | | | | | 11,250,000 | | | | 32,397,825 | | |
| Hang Lung Properties Ltd. | | | | | | | 16,400,609 | | | | 41,031,569 | | |
| Henderson Land Development Company Ltd. | | | | | | | 12,200,000 | | | | 68,149,853 | | |
| Hysan Development Company Ltd. | | | | | | | 26,000,019 | | | | 68,022,625 | | |
| Kerry Properties Ltd. | | | | | | | 6,053,600 | | | | 28,290,033 | | |
| Sun Hung Kai Properties Ltd. | | | | | | | 5,000,700 | | | | 57,475,615 | | |
| Wharf Holdings Ltd. | | | | | | | 6,200,000 | | | | 22,876,464 | | |
| | | | | | | | 409,442,148 | | |
See accompanying notes to financial statements.
12
COHEN & STEERS INTERNATIONAL REALTY FUND, INC.
SCHEDULE OF INVESTMENTS—(Continued)
December 31, 2006
| | | | | Number
of Shares | | Value | |
| OFFICE | | | 3.2 | % | | | | | | | | | |
| Champion REIT | | | | | | | 10,999,252 | | | $ | 5,316,996 | | |
| Hongkong Land Holdings Ltd. (USD) | | | | | | | 17,130,771 | | | | 68,180,468 | | |
| | | | | | | | 73,497,464 | | |
| SHOPPING CENTER | | | 0.7 | % | | | | | | | | | |
| Link REIT | | | | | | | 7,800,710 | | | | 16,126,328 | | |
| TOTAL HONG KONG | | | | | | | | | | | 499,065,940 | | |
| ITALY | | | 1.0 | % | | | | | | | | | |
| DIVERSIFIED | | | | | | | | | | | | | |
| Beni Stabili S.p.A. | | | | | | | 14,462,372 | | | | 23,081,086 | | |
| JAPAN | | | 18.9 | % | | | | | | | | | |
| DIVERSIFIED | | | 17.0 | % | | | | | | | | | |
| Kenedix Realty Investment Corp. | | | | | | | 3,850 | | | | 22,225,537 | | |
| Mitsubishi Estate Co., Ltd. | | | | | | | 6,150,000 | | | | 159,169,783 | | |
| Mitsui Fudosan Co., Ltd. | | | | | | | 5,700,000 | | | | 139,141,213 | | |
| NTT Urban Development Corp. | | | | | | | 10,000 | | | | 19,326,919 | | |
| Sumitomo Realty & Development Co., Ltd. | | | | | | | 800,000 | | | | 25,679,593 | | |
| TOC Co., Ltd. | | | | | | | 3,326,500 | | | | 16,771,564 | | |
| United Urban Investment Corp. | | | | | | | 1,750 | | | | 11,499,517 | | |
| | | | | | | | 393,814,126 | | |
| SHOPPING CENTER | | | 1.9 | % | | | | | | | | | |
| AEON Mall Co., Ltd. | | | | | | | 610,000 | | | | 34,445,611 | | |
| Japan Retail Fund Investment Corp. | | | | | | | 1,150 | | | | 9,373,556 | | |
| | | | | | | | 43,819,167 | | |
| TOTAL JAPAN | | | | | | | | | | | 437,633,293 | | |
| NETHERLANDS | | | 4.2 | % | | | | | | | | | |
| DIVERSIFIED | | | 0.7 | % | | | | | | | | | |
| Wereldhave NV | | | | | | | 120,040 | | | | 15,988,494 | | |
| INDUSTRIAL | | | 0.9 | % | | | | | | | | | |
| ProLogis European Properties | | | | | | | 1,050,986 | | | | 20,810,313 | | |
See accompanying notes to financial statements.
13
COHEN & STEERS INTERNATIONAL REALTY FUND, INC.
SCHEDULE OF INVESTMENTS—(Continued)
December 31, 2006
| | | | | Number
of Shares | | Value | |
| OFFICE | | | 0.4 | % | | | | | | | | | |
| VastNed Offices/Industrial NV | | | | | | | 283,602 | | | $ | 11,137,474 | | |
| SHOPPING CENTER | | | 2.2 | % | | | | | | | | | |
| Rodamco Europe NV | | | | | | | 374,772 | | | | 49,867,556 | | |
| TOTAL NETHERLANDS | | | | | | | | | | | 97,803,837 | | |
| NORWAY | | | 1.0 | % | | | | | | | | | |
| OFFICE | | | | | | | | | | | | | |
| Norwegian Property ASA | | | | | | | 2,321,732 | | | | 24,203,326 | | |
| SINGAPORE | | | 2.1 | % | | | | | | | | | |
| DIVERSIFIED | | | 1.6 | % | | | | | | | | | |
| CapitaLand Ltd. | | | | | | | 5,900,900 | | | | 23,853,679 | | |
| Singapore Land Ltd. | | | | | | | 2,100,000 | | | | 11,775,061 | | |
| | | | | | | | 35,628,740 | | |
| OFFICE | | | 0.5 | % | | | | | | | | | |
| Capitacommercial Trust | | | | | | | 7,100,000 | | | | 12,128,443 | | |
| TOTAL SINGAPORE | | | | | | | | | | | 47,757,183 | | |
| SPAIN | | | 0.5 | % | | | | | | | | | |
| DIVERSIFIED | | | | | | | | | | | | | |
| Riofisa SA | | | | | | | 225,132 | | | | 10,906,709 | | |
| SWEDEN | | | 2.4 | % | | | | | | | | | |
| DIVERSIFIED | | | 1.1 | % | | | | | | | | | |
| Kungsleden AB | | | | | | | 1,747,177 | | | | 26,797,389 | | |
| OFFICE | | | 1.3 | % | | | | | | | | | |
| Fabege AB | | | | | | | 1,126,607 | | | | 30,197,764 | | |
| TOTAL SWEDEN | | | | | | | | | | | 56,995,153 | | |
| SWITZERLAND | | | 1.2 | % | | | | | | | | | |
| DIVERSIFIED | |
| PSP Swiss Property AG | | | | | | | 471,575 | | | | 27,090,890 | | |
See accompanying notes to financial statements.
14
COHEN & STEERS INTERNATIONAL REALTY FUND, INC.
SCHEDULE OF INVESTMENTS—(Continued)
December 31, 2006
| | | | | Number
of Shares | | Value | |
| UNITED KINGDOM | | | 19.5 | % | | | | | | | | | |
| DIVERSIFIED | | | 13.4 | % | | | | | | | | | |
| British Land Co., PLC | | | | | | | 3,264,998 | | | $ | 109,573,774 | | |
| Development Securities PLC | | | | | | | 595,897 | | | | 8,109,030 | | |
| Hammerson PLC | | | | | | | 1,468,321 | | | | 45,338,337 | | |
| Helical Bar PLC | | | | | | | 1,764,481 | | | | 16,376,015 | | |
| Land Securities Group PLC | | | | | | | 2,419,597 | | | | 110,053,822 | | |
| Quintain Estates & Development PLC | | | | | | | 1,357,294 | | | | 22,722,333 | | |
| | | | | | | | 312,173,311 | | |
| INDUSTRIAL | | | 3.6 | % | | | | | | | | | |
| Brixton PLC | | | | | | | 1,502,675 | | | | 16,947,297 | | |
| Slough Estates PLC | | | | | | | 4,273,997 | | | | 65,734,488 | | |
| | | | | | | | 82,681,785 | | |
| OFFICE | | | 1.5 | % | | | | | | | | | |
| Derwent Valley Holdings PLC | | | | | | | 419,497 | | | | 17,224,244 | | |
| Great Portland Estates PLC | | | | | | | 1,321,750 | | | | 17,947,694 | | |
| | | | | | | | 35,171,938 | | |
| SHOPPING CENTER | | | 1.0 | % | | | | | | | | | |
| Liberty International PLC | | | | | | | 835,308 | | | | 22,832,052 | | |
| TOTAL UNITED KINGDOM | | | | | | | | | | | 452,859,086 | | |
| TOTAL COMMON STOCK (Identified cost—$1,858,397,474) | | | | | | | | | | | 2,264,579,399 | | |
| | | | | Principal
Amount | | | |
| COMMERCIAL PAPER | | | 2.4 | % | | | | | | | | | |
General Electric Capital Corp., 4.15%, due 1/2/07
(Identified cost—$55,391,614) | | | | | | $ | 55,398,000 | | | | 55,391,614 | | |
| TOTAL INVESTMENTS (Identified cost—$1,913,789,088) | | | 100.0 | % | | | | | | | 2,319,971,013 | | |
| OTHER ASSETS IN EXCESS OF LIABILITIES | | | 0.0 | % | | | | | | | 580,830 | | |
| NET ASSETS | | | 100.0 | % | | | | | | $ | 2,320,551,843 | | |
See accompanying notes to financial statements.
15
COHEN & STEERS INTERNATIONAL REALTY FUND, INC.
SCHEDULE OF INVESTMENTS—(Continued)
December 31, 2006
Glossary of Portfolio Abbreviations
REIT Real Estate Investment Trust
USD United States Dollar
Note: Percentages indicated are based on the net assets of the fund.
See accompanying notes to financial statements.
16
COHEN & STEERS INTERNATIONAL REALTY FUND, INC.
STATEMENT OF ASSETS AND LIABILITIES
December 31, 2006
| ASSETS: | |
| Investments in securities, at value (Identified cost—$1,913,789,088) | | $ | 2,319,971,013 | | |
| Foreign currency (Identified cost—$1,200,573) | | | 1,204,323 | | |
| Receivable for fund shares sold | | | 44,750,592 | | |
| Dividends and interest receivable | | | 3,550,314 | | |
| Receivable for investment securities sold | | | 2,304,225 | | |
| Other assets | | | 18,234 | | |
| Total Assets | | | 2,371,798,701 | | |
| LIABILITIES: | |
| Payable for investment securities purchased | | | 47,291,217 | | |
| Payable to investment advisor | | | 1,705,524 | | |
| Payable for fund shares redeemed | | | 1,285,209 | | |
| Payable to administrator | | | 107,717 | | |
| Payable for distribution fees | | | 80,163 | | |
| Payable for shareholder servicing fees | | | 28,357 | | |
| Payable for directors' fees | | | 4,207 | | |
| Other liabilities | | | 744,464 | | |
| Total Liabilities | | | 51,246,858 | | |
| NET ASSETS | | $ | 2,320,551,843 | | |
| NET ASSETS consist of: | |
| Paid-in capital | | $ | 1,938,560,581 | | |
| Dividends in excess of net investment income | | | (37,088,746 | ) | |
| Accumulated undistributed net realized gain | | | 12,950,466 | | |
| Net unrealized appreciation | | | 406,129,542 | | |
| | | $ | 2,320,551,843 | | |
See accompanying notes to financial statements.
17
COHEN & STEERS INTERNATIONAL REALTY FUND, INC.
STATEMENT OF ASSETS AND LIABILITIES—(Continued)
December 31, 2006
| CLASS A SHARES: | |
| NET ASSETS | | $ | 921,000,766 | | |
| Shares issued and outstanding ($0.001 par value common stock outstanding) | | | 49,837,056 | | |
| Net asset value and redemption price per share | | $ | 18.48 | | |
| Maximum offering price per share ($18.48 ÷ 0.955)a | | $ | 19.35 | | |
| CLASS C SHARES: | |
| NET ASSETS | | $ | 688,064,388 | | |
| Shares issued and outstanding ($0.001 par value common stock outstanding) | | | 37,318,110 | | |
| Net asset value and offering price per shareb | | $ | 18.44 | | |
| CLASS I SHARES: | |
| NET ASSETS | | $ | 711,486,689 | | |
| Shares issued and outstanding ($0.001 par value common stock outstanding) | | | 38,462,010 | | |
| Net asset value, offering and redemption price per share | | $ | 18.50 | | |
a On investments of $100,000 or more, the offering price is reduced.
b Redemption price per share is equal to the net asset value per share less any applicable deferred sales charge which varies with the length of time shares are held.
See accompanying notes to financial statements.
18
COHEN & STEERS INTERNATIONAL REALTY FUND, INC.
STATEMENT OF OPERATIONS
Year Ended December 31, 2006
| Investment Income: | |
| Dividend income (net of $3,010,427 of foreign withholding tax) | | $ | 28,882,997 | | |
| Interest income | | | 962,531 | | |
| Total Income | | | 29,845,528 | | |
| Expenses: | |
| Investment advisory fees | | | 9,875,183 | | |
| Distribution fees—Class A | | | 951,504 | | |
| Distribution fees—Class C | | | 2,259,050 | | |
| Shareholder servicing fees—Class A | | | 380,602 | | |
| Shareholder servicing fees—Class C | | | 753,017 | | |
| Administration fees | | | 790,472 | | |
| Custodian fees and expenses | | | 753,600 | | |
| Transfer agent fees | | | 601,233 | | |
| Registration and filing fees | | | 376,868 | | |
| Professional fees | | | 152,636 | | |
| Shareholder reporting expenses | | | 146,477 | | |
| Directors' fees and expenses | | | 54,044 | | |
| Line of credit fees | | | 28,669 | | |
| Miscellaneous | | | 272,335 | | |
| Net Expense | | | 17,395,690 | | |
| Net Investment Income | | | 12,449,838 | | |
| Net Realized and Unrealized Gain (Loss) on Investments: | |
| Net realized gain (loss) on: | |
| Investments | | | 30,093,315 | | |
| Foreign currency transactions | | | (2,358,178 | ) | |
| Net realized gains | | | 27,735,137 | | |
| Net change in unrealized appreciation (depreciation) on: | |
| Investments | | | 383,077,926 | | |
| Foreign currency translations | | | (51,240 | ) | |
| Net change in unrealized appreciation | | | 383,026,686 | | |
| Total net realized and unrealized gain on investments | | | 410,761,823 | | |
| Net Increase in Net Assets Resulting from Operations | | $ | 423,211,661 | | |
See accompanying notes to financial statements.
19
COHEN & STEERS INTERNATIONAL REALTY FUND, INC.
STATEMENT OF CHANGES IN NET ASSETS
| | | For the
Year Ended
December 31, 2006 | | For the Period
March 31, 2005a
through
December 31, 2005 | |
| Change in Net Assets: | |
| From Operations: | |
| Net investment income | | $ | 12,449,838 | | | $ | 693,890 | | |
| Net realized gain | | | 27,735,137 | | | | 1,027,992 | | |
| Net change in unrealized appreciation | | | 383,026,686 | | | | 23,102,856 | | |
| Net increase in net assets resulting from operations | | | 423,211,661 | | | | 24,824,738 | | |
| Dividends and Distributions to Shareholders from: | |
| Net investment income: | |
| Class A | | | (21,290,215 | ) | | | (323,527 | ) | |
| Class C | | | (13,994,061 | ) | | | (64,631 | ) | |
| Class I | | | (18,596,373 | ) | | | (752,226 | ) | |
| Net realized gain on investments: | |
| Class A | | | (3,907,785 | ) | | | (316,743 | ) | |
| Class C | | | (2,983,495 | ) | | | (210,681 | ) | |
| Class I | | | (3,127,535 | ) | | | (508,917 | ) | |
| Total dividends and distributions to shareholders | | | (63,899,464 | ) | | | (2,176,725 | ) | |
| Capital Stock Transactions: | |
| Increase in net assets from fund share transactions | | | 1,658,109,653 | | | | 280,381,705 | | |
| Total increase in net assets | | | 2,017,421,850 | | | | 303,029,718 | | |
| Net Assets: | |
| Beginning of period | | | 303,129,993 | | | | 100,275 | | |
| End of periodb | | $ | 2,320,551,843 | | | $ | 303,129,993 | | |
a Commencement of operations.
b Including dividends in excess of net investment income of $37,088,746 and $872,888, respectively.
See accompanying notes to financial statements.
20
COHEN & STEERS INTERNATIONAL REALTY FUND, INC.
FINANCIAL HIGHLIGHTS
The following table includes selected data for a share outstanding throughout each period and other performance information derived from the financial statements. It should be read in conjunction with the financial statements and notes thereto.
| | | Class A | |
| Per Share Operating Performance: | | For the
Year Ended
December 31, 2006 | | For the Period
March 31, 2005a
through
December 31, 2005 | |
| Net asset value, beginning of period | | $ | 13.28 | | | $ | 11.46 | | |
| Income from investment operations: | |
| Net investment incomeb | | | 0.20 | g | | | 0.07 | | |
| Net realized and unrealized gain on investments | | | 5.59 | | | | 1.86 | | |
| Total from investment operations | | | 5.79 | | | | 1.93 | | |
| Less dividends and distributions to shareholders from: | |
| Net investment income | | | (0.50 | ) | | | (0.06 | ) | |
| Net realized gain on investments | | | (0.09 | ) | | | (0.05 | ) | |
| Total dividends and distributions to shareholders | | | (0.59 | ) | | | (0.11 | ) | |
| Redemption fees retained by the fund | | | 0.00 | c | | | 0.00 | c | |
| Net increase in net asset value | | | 5.20 | | | | 1.82 | | |
| Net asset value, end of period | | $ | 18.48 | | | $ | 13.28 | | |
| Total investment returnd | | | 43.88 | % | | | 16.88 | %f | |
| Ratios/Supplemental Data: | |
| Net assets, end of period (in millions) | | $ | 921.0 | | | $ | 91.6 | | |
| Ratio of expenses to average daily net assets (before expense reduction) | | | 1.61 | % | | | 1.86 | %e | |
| Ratio of expenses to average daily net assets (net of expense reduction) | | | 1.61 | % | | | 1.70 | %e | |
| Ratio of net investment income to average daily net assets (before expense reduction) | | | 1.26 | % | | | 0.56 | %e | |
| Ratio of net investment income to average daily net assets (net of expense reduction) | | | 1.26 | % | | | 0.72 | %e | |
| Portfolio turnover rate | | | 30 | % | | | 35 | %f | |
a Commencement of operations.
b Calculated based on the average shares outstanding during the period.
c Less than $0.005 per share.
d Does not reflect sales charges, which would reduce return.
e Annualized.
f Not annualized.
g 18.1% of gross income was attributable to a special dividend paid by Great Eagle Holdings Ltd.
See accompanying notes to financial statements.
21
COHEN & STEERS INTERNATIONAL REALTY FUND, INC.
FINANCIAL HIGHLIGHTS—(Continued)
| | | Class C | |
| Per Share Operating Performance: | | For the
Year Ended
December 31, 2006 | | For the Period
March 31, 2005a
through
December 31, 2005 | |
| Net asset value, beginning of period | | $ | 13.26 | | | $ | 11.46 | | |
| Income from investment operations: | |
| Net investment incomeb | | | 0.10 | g | | | 0.01 | | |
| Net realized and unrealized gain on investments | | | 5.58 | | | | 1.87 | | |
| Total from investment operations | | | 5.68 | | | | 1.88 | | |
| Less dividends and distributions to shareholders from: | |
| Net investment income | | | (0.41 | ) | | | (0.03 | ) | |
| Net realized gain on investments | | | (0.09 | ) | | | (0.05 | ) | |
| Total dividends and distributions to shareholders | | | (0.50 | ) | | | (0.08 | ) | |
| Redemption fees retained by the fund | | | 0.00 | c | | | 0.00 | c | |
| Net increase in net asset value | | | 5.18 | | | | 1.80 | | |
| Net asset value, end of period | | $ | 18.44 | | | $ | 13.26 | | |
| Total investment returnd | | | 42.99 | % | | | 16.37 | %f | |
| Ratios/Supplemental Data: | |
| Net assets, end of period (in millions) | | $ | 688.1 | | | $ | 61.4 | | |
| Ratio of expenses to average daily net assets (before expense reduction) | | | 2.26 | % | | | 2.50 | %e | |
| Ratio of expenses to average daily net assets (net of expense reduction) | | | 2.26 | % | | | 2.35 | %e | |
| Ratio of net investment income to average daily net assets (before expense reduction) | | | 0.63 | % | | | (0.09 | )%e | |
| Ratio of net investment income to average daily net assets (net of expense reduction) | | | 0.63 | % | | | 0.07 | %e | |
| Portfolio turnover rate | | | 30 | % | | | 35 | %f | |
a Commencement of operations.
b Calculated based on the average shares outstanding during the period.
c Less than $0.005 per share.
d Does not reflect sales charges, which would reduce return.
e Annualized.
f Not annualized.
g 18.1% of gross income was attributable to a special dividend paid by Great Eagle Holdings Ltd.
See accompanying notes to financial statements.
22
COHEN & STEERS INTERNATIONAL REALTY FUND, INC.
FINANCIAL HIGHLIGHTS—(Continued)
| | | Class I | |
| Per Share Operating Performance: | | For the
Year Ended
December 31, 2006 | | For the Period
March 31, 2005a
through
December 31, 2005 | |
| Net asset value, beginning of period | | $ | 13.28 | | | $ | 11.46 | | |
| Income from investment operations: | |
| Net investment incomeb | | | 0.26 | f | | | 0.11 | | |
| Net realized and unrealized gain on investments | | | 5.59 | | | | 1.85 | | |
| Total from investment operations | | | 5.85 | | | | 1.96 | | |
| Less dividends and distributions to shareholders from: | |
| Net investment income | | | (0.54 | ) | | | (0.09 | ) | |
| Net realized gain on investments | | | (0.09 | ) | | | (0.05 | ) | |
| Total dividends and distributions to shareholders | | | (0.63 | ) | | | (0.14 | ) | |
| Redemption fees retained by the fund | | | 0.00 | c | | | 0.00 | c | |
| Net increase in net asset value | | | 5.22 | | | | 1.82 | | |
| Net asset value, end of period | | $ | 18.50 | | | $ | 13.28 | | |
| Total investment return | | | 44.45 | % | | | 17.14 | %e | |
| Ratios/Supplemental Data: | |
| Net assets, end of period (in millions) | | $ | 711.5 | | | $ | 150.2 | | |
| Ratio of expenses to average daily net assets (before expense reduction) | | | 1.25 | % | | | 1.57 | %d | |
| Ratio of expenses to average daily net assets (net of expense reduction) | | | 1.25 | % | | | 1.35 | %d | |
| Ratio of net investment income to average daily net assets (before expense reduction) | | | 1.60 | % | | | 1.00 | %d | |
| Ratio of net investment income to average daily net assets (net of expense reduction) | | | 1.60 | % | | | 1.22 | %d | |
| Portfolio turnover rate | | | 30 | % | | | 35 | %e | |
a Commencement of operations.
b Calculated based on the average shares outstanding during the period.
c Less than $0.005 per share.
d Annualized.
e Not annualized.
f 18.1% of gross income was attributable to a special dividend paid by Great Eagle Holdings Ltd.
See accompanying notes to financial statements.
23
COHEN & STEERS INTERNATIONAL REALTY FUND, INC.
NOTES TO FINANCIAL STATEMENTS
Note 1. Significant Accounting Policies
Cohen & Steers International Realty Fund, Inc. (the fund) was incorporated under the laws of the State of Maryland on November 23, 2004 and is registered under the Investment Company Act of 1940, as amended, as a nondiversified, open-end management investment company. The fund's investment objective is total return. The fund had no operations until January 11, 2005 when it sold 10 shares each of Class A, B, C, and 8,720 shares of Class I for $100,275 to Cohen & Steers Capital Management, Inc. (The Class B shares were subsequently transferred to Class I and Class B shares are presently not offered). Investment operations commenced on March 31, 2005. The authorized shares of the fund are divided into three classes designated Class A, C, and I shares. Each of the fund's shares has equal dividend, liquidation and voting rights (except for matters relating to distributions and shareholder servicing of such shares).
The following is a summary of significant accounting policies consistently followed by the fund in the preparation of its financial statements. The policies are in conformity with accounting principles generally accepted in the United States of America (GAAP). The preparation of the financial statements in accordance with GAAP requires management to make estimates and assumptions that affect the reported amounts of assets and liabilities at the date of the financial statements and the reported amounts of income and expenses during the reporting period. Actual results could differ from those estimates.
Portfolio Valuation: Investments in securities that are listed on the New York Stock Exchange are valued, except as indicated below, at the last sale price reflected at the close of the New York Stock Exchange on the business day as of which such value is being determined. If there has been no sale on such day, the securities are valued at the mean of the closing bid and asked prices for the day or, if no asked price is available, at the bid price.
Securities not listed on the New York Stock Exchange (NYSE) but listed on other domestic or foreign securities exchanges or admitted to trading on the National Association of Securities Dealers Automated Quotations, Inc. (Nasdaq) national market system are valued in a similar manner. Securities traded on more than one securities exchange are valued at the last sale price on the business day as of which such value is being determined as reflected on the tape at the close of the exchange representing the principal market for such securities.
Readily marketable securities traded in the over-the-counter market, including listed securities whose primary market is believed by Cohen & Steers Capital Management, Inc. (the advisor) to be over-the-counter, but excluding securities admitted to trading on the Nasdaq National List, are valued at the official closing prices as reported by Nasdaq, the National Quotation Bureau, or such other comparable sources as the Board of Directors deem appropriate to reflect their fair market value. If there has been no sale on such day, the securities are valued at the mean of the closing bid and asked prices for the day, or if no asked price is available, at the bid price. However, certain fixed-income securities may be valued on the basis of prices provided by a pricing service when such prices are believed by the Board of Directors to reflect the fair market value of such securities. Where securities are traded
24
COHEN & STEERS INTERNATIONAL REALTY FUND, INC.
NOTES TO FINANCIAL STATEMENTS—(Continued)
on more than one exchange and also over-the-counter, the securities will generally be valued using the quotations the Board of Directors believes most closely reflect the value of such securities.
Portfolio securities primarily traded on foreign markets are generally valued at the preceding closing values of such securities on their respective exchanges or if after the close of the foreign markets, but prior to the close of business on the day the securities are being valued, market conditions change significantly, certain foreign securities may be fair valued pursuant to procedures established by the Board of Directors.
Securities for which market prices are unavailable, or securities for which the advisor determines that bid and/or asked price does not reflect market value, will be valued at fair value pursuant to procedures approved by the fund's Board of Directors. Circumstances in which market prices may be unavailable include, but are not limited to, when trading in a security is suspended, the exchange on which the security is traded is subject to an unscheduled close or disruption or material events occur after the close of the exchange on which the security is principally traded. In these circumstances, the fund determines fair value in a manner that fairly reflects the market value of the security on the valuation date based on consideration of any information or factors it deems appropriate. These may include recent transactions in comparable securities, information relating to the specific security and developments in the markets. In particular, portfolio securities primarily traded on foreign markets are generally valued at the preceding closing values of such securities on their respective exchanges or if after the close of the foreign markets, but prior to the close of trading on the NYSE on the day the securities are being valued, developments occur that are expected to materially affect the value of such securities, such values may be adjusted to reflect the estimated fair value of such securities as of the close of trading on the NYSE using a pricing service and/or procedures approved by the fund's Board of Directors.
The fund's use of fair value pricing may cause the net asset value of fund shares to differ from the net asset value that would be calculated using market quotations. Fair value pricing involves subjective judgments and it is possible that the fair value determined for a security may be materially different than the value that could be realized upon the sale of that security.
Short-term debt securities, which have a maturity date of 60 days or less, are valued at amortized cost, which approximates value.
Security Transactions and Investment Income: Security transactions are recorded on trade date. Realized gains and losses on investments sold are recorded on the basis of identified cost. Interest income is recorded on the accrual basis. Discounts are accreted and premiums are amortized over the life of the respective securities. Dividend income is recorded on the ex-dividend date except for certain dividends on foreign securities, which are recorded as soon as the fund is informed after the ex-dividend date. The fund records distributions received in excess of income from underlying investments as a reduction of cost of investments and/or realized gain. Income, expenses (other than expenses attributable to a specific class), and realized and unrealized gains or losses on investments are allocated to each class of shares based on its relative net assets.
25
COHEN & STEERS INTERNATIONAL REALTY FUND, INC.
NOTES TO FINANCIAL STATEMENTS—(Continued)
Foreign Currency Translation and Forward Foreign Currency Contracts: The books and records of the fund are maintained in U.S. dollars as follows: (1) the foreign currency market value of investment securities, other assets and liabilities and forward foreign currency contracts (forward contracts) are translated at the exchange rates prevailing at the end of the period; and (2) purchases, sales, income and expenses are translated at the exchange rates prevailing on the respective dates of such transactions. The resultant exchange gains and losses are recorded as realized and unrealized gain/loss on foreign exchange transactions. Pursuant to U.S. federal income tax regulations, certain foreign exchange gains/losses included in realized and unrealized gain/loss are included in or are a reduction of ordinary income for federal income tax purposes. The fund does not is olate that portion of the results of operations arising as a result of changes in the foreign exchange rates from the changes in the market prices of the securities. Forward contracts are valued daily at the appropriate exchange rates. The resultant unrealized exchange gains and losses are recorded as unrealized foreign currency gain or loss. The fund records realized gains or losses on delivery of the currency or at the time the forward contract is extinguished (compensated) by entering into a closing transaction prior to delivery.
Foreign Securities: The fund may directly purchase securities of foreign issuers. Investing in securities of foreign issuers involves special risks not typically associated with investing in securities of U.S. issuers. The risks include possible revaluation of currencies, the ability to repatriate funds, less complete financial information about companies and possible future adverse political and economic developments. Moreover, securities of many foreign issuers and their markets may be less liquid and their prices more volatile than those of securities of comparable U.S. issuers.
Dividends and Distributions to Shareholders: Dividends from net investment income and capital gain distributions are determined in accordance with U.S. federal income tax regulations, which may differ from GAAP. Dividends from net investment income are declared and paid semi-annually. Net realized capital gains, unless offset by any available capital loss carryforward, are distributed to shareholders annually. Dividends and distributions to shareholders are recorded on the ex-dividend date and are automatically reinvested in full and fractional shares of the fund based on the net asset value per share at the close of business on the ex-dividend date unless the shareholder has elected to have them paid in cash.
Federal Income Taxes: It is the policy of the fund to continue to qualify as a regulated investment company, if such qualification is in the best interest of the shareholders, by complying with the requirements of Subchapter M of the Internal Revenue Code applicable to regulated investment companies, and by distributing substantially all of its taxable earnings to its shareholders. Accordingly, no provision for federal income or excise tax is necessary.
Note 2. Investment Advisory and Administration Fees and Other Transactions with Affiliates
Investment Advisory Fees: The advisor serves as the fund's investment advisor pursuant to an investment advisory agreement (the advisory agreement). Under the terms of the advisory agreement, the advisor provides the
26
COHEN & STEERS INTERNATIONAL REALTY FUND, INC.
NOTES TO FINANCIAL STATEMENTS—(Continued)
fund with the day-to-day investment decisions and generally manages the fund's investments in accordance with the stated policies of the fund, subject to the supervision of the fund's Board of Directors. For the services provided to the fund, the advisor receives a monthly fee, accrued daily and paid monthly, at the annual rate of 0.95% of the average daily net assets of the fund up to and including $1.5 billion and 0.85% of the average daily net asset above $1.5 billion.
For the year ended December 31, 2006, the advisor has contractually agreed to waive its fee and/or reimburse the fund for expenses incurred to the extent necessary to maintain the fund's operating expenses at 1.70% for the Class A shares, 2.35% for the Class C shares and 1.35% for the Class I shares.
Under a subadvisory agreement between the advisor and Houlihan Rovers S.A. (the subadvisor), an affiliate of the advisor, the subadvisor is responsible for managing the fund's investments in certain non-U.S. real estate securities. For its services provided under the subadvisory agreement, the advisor (not the fund) pays the subadvisor a monthly fee at the annual rate of 0.30% of the average daily net assets of the fund. For the year ended December 31, 2006, the advisor paid the subadvisor $3,118,479.
Administration Fees: The fund has entered into an administration agreement with the advisor under which the advisor performs certain administrative functions for the fund and receives a fee, accrued daily and paid monthly, at the annual rate of 0.06% of the fund's average daily net assets. For the year ended December 31, 2006, the fund paid the advisor $623,696 in fees under this administration agreement. Additionally, the fund has retained State Street Bank and Trust Company as sub-administrator under a fund accounting and administration agreement.
Distribution Fees: Shares of the fund are distributed by Cohen & Steers Securities, LLC (the distributor), an affiliated entity of the advisor. The fund has adopted a distribution plan (the plan) pursuant to Rule 12b-1 under the Investment Company Act of 1940. The plan provides that the fund will pay the distributor a fee at an annual rate of up to 0.25% of the average daily net assets attributable to the Class A shares and up to 0.75% of the average daily net assets attributable to the Class C shares.
For the year ended December 31, 2006, the fund has been advised that the distributor received $869,171 in sales commissions from the sale of Class A shares and that the distributor also received $104,597 of contingent deferred sales charges relating to redemptions of Class C shares. The distributor has advised the fund that proceeds from the contingent deferred sales charge on the Class C shares are paid to the distributor and are used by the distributor to defray its expenses related to providing distribution-related services to the fund in connection with the sale of the Class C shares, including payments to dealers and other financial intermediaries for selling Class C shares and interest and other financing costs associated with Class C shares.
Shareholder Servicing Fees: The fund has adopted a shareholder services plan which provides that the fund may obtain the services of qualified financial institutions to act as shareholder servicing agents for their customers. For these services, the fund may pay the shareholder servicing agent a fee, accrued daily and paid monthly, at an
27
COHEN & STEERS INTERNATIONAL REALTY FUND, INC.
NOTES TO FINANCIAL STATEMENTS—(Continued)
annual rate of up to 0.10% of the average daily net asset value of the fund's Class A shares and up to 0.25% of the average daily net asset value of the fund's Class C shares.
Directors' and Officers' Fees: Certain directors and officers of the fund are also directors, officers, and/or employees of the advisor. The fund does not pay compensation to any affiliated directors and officers except for the Chief Compliance Officer, who received $13,421 from the fund for the year ended December 31, 2006.
Note 3. Purchases and Sales of Securities
Purchases and sales of securities, excluding short-term investments, for the year ended December 31, 2006 totaled $1,872,359,564 and $312,984,901, respectively.
Note 4. Income Tax Information
The tax character of dividends and distributions paid was as follows:
| | | For the Year
Ended
December 31, 2006 | | For the Period
March 31, 2005*
through
December 31, 2005 | |
| Ordinary income | | $ | 62,681,868 | | | $ | 2,176,725 | | |
| Long-term capital gain | | | 1,217,596 | | | | — | | |
| Total dividends and distributions | | $ | 63,899,464 | | | $ | 2,176,725 | | |
As of December 31, 2006, the tax-basis components of accumulated earnings and the federal tax cost were as follows:
| Gross unrealized appreciation | | $ | 637,750,101 | | |
| Gross unrealized depreciation | | | (324,656,354 | ) | |
| Net unrealized appreciation | | $ | 313,093,747 | | |
| Undistributed ordinary income | | $ | 65,711,671 | | |
| Undistributed long-term capital gains | | $ | 4,166,862 | | |
| Cost for federal income tax purposes | | $ | 2,006,877,266 | | |
As of December 31, 2006, the fund had temporary book/tax differences primarily attributable to the mark-to-market of passive foreign investment companies (PFICs) and permanent book/tax differences primarily attributable to sales of PFICs and foreign currency losses. To reflect reclassifications arising from the permanent
* Commencement of operations.
28
COHEN & STEERS INTERNATIONAL REALTY FUND, INC.
NOTES TO FINANCIAL STATEMENTS—(Continued)
differences, paid-in capital was charged $24,541, accumulated net realized gain was charged $5,190,412 and dividends in excess of net investment income was credited $5,214,953.
Note 5. Capital Stock
The fund is authorized to issue 200 million shares of capital stock, at a par value of $0.001 per share. The Board of Directors of the fund may increase or decrease the aggregate number of shares of common stock that the fund has authority to issue. Transactions in fund shares were as follows:
| | | For the
Year Ended
December 31, 2006 | | For the Period
March 31, 2005a
through
December 31, 2005 | |
| | | Shares | | Amount | | Shares | | Amount | |
| CLASS A: | |
| Sold | | | 46,467,246 | | | $ | 751,852,467 | | | | 7,009,246 | | | $ | 85,114,447 | | |
Issued as reinvestment of
dividends and distributions | | | 790,327 | | | | 13,986,265 | | | | 29,652 | | | | 387,984 | | |
| Redeemed | | | (4,318,940 | ) | | | (67,382,581 | ) | | | (140,485 | ) | | | (1,753,046 | ) | |
Redemption fees retained by
the fundb | | | — | | | | 45,337 | | | | — | | | | 1,824 | | |
| Net increase | | | 42,938,633 | | | $ | 698,501,488 | | | | 6,898,413 | | | $ | 83,751,209 | | |
| CLASS C: | |
| Sold | | | 33,421,539 | | | $ | 534,794,092 | | | | 4,671,986 | | | $ | 57,212,816 | | |
Issued as reinvestment of
dividends and distributions | | | 418,972 | | | | 7,471,231 | | | | 6,732 | | | | 88,101 | | |
| Redeemed | | | (1,149,560 | ) | | | (18,310,143 | ) | | | (51,569 | ) | | | (639,735 | ) | |
Redemption fees retained by
the fundb | | | — | | | | 33,909 | | | | — | | | | 857 | | |
| Net increase | | | 32,690,951 | | | $ | 523,989,089 | | | | 4,627,149 | | | $ | 56,662,039 | | |
29
COHEN & STEERS INTERNATIONAL REALTY FUND, INC.
NOTES TO FINANCIAL STATEMENTS—(Continued)
| | | For the
Year Ended
December 31, 2006 | | For the Period
March 31, 2005a
through
December 31, 2005 | |
| | | Shares | | Amount | | Shares | | Amount | |
| CLASS I: | |
| Sold | | | 29,457,416 | | | $ | 472,400,076 | | | | 11,330,663 | | | $ | 140,337,487 | | |
Issued as reinvestment of
dividends and distributions | | | 1,103,766 | | | | 19,357,953 | | | | 95,403 | | | | 1,247,618 | | |
| Redeemed | | | (3,406,325 | ) | | | (56,177,768 | ) | | | (127,633 | ) | | | (1,618,220 | ) | |
Redemption fees retained by
the fundb | | | — | | | | 38,815 | | | | — | | | | 1,572 | | |
| Net increase | | | 27,154,857 | | | $ | 435,619,076 | | | | 11,298,433 | | | $ | 139,968,457 | | |
a Commencement of operations
b The fund may charge a 1% redemption fee on shares sold within six months of the time of purchase.
Note 6. Borrowings
The fund, in conjunction with other Cohen & Steers funds, is a party to a $150,000,000 syndicated credit agreement (the credit agreement) with State Street Bank and Trust Company, as administrative agent and operations agent, and the lenders identified in the credit agreement, which expires December 2007. The fund pays a commitment fee of 0.10% per annum on its proportionate share of the unused portion of the credit agreement.
During the year ended December 31, 2006, the fund did not utilize the line of credit.
Note 7. Other
In the normal course of business, the fund enters into contracts that provide general indemnifications. The fund's maximum exposure under these arrangements is dependent on claims that may be made against the fund in the future and, therefore, cannot be estimated; however, based on experience, the risk of material loss from such claims is considered remote.
In July 2006, the Financial Accounting Standards Board (FASB) issued Interpretation 48, Accounting for Uncertainty in Income Taxes – an interpretation of FASB Statement 109 (FIN 48). FIN 48 clarifies the accounting
30
COHEN & STEERS INTERNATIONAL REALTY FUND, INC.
NOTES TO FINANCIAL STATEMENTS—(Continued)
for income taxes by prescribing the minimum recognition threshold a tax position must meet before being recognized in the financial statements. FIN 48 is effective for fiscal years beginning after December 15, 2006. The fund will adopt FIN 48 no later than June 29, 2007 and the impact to the fund's financial statements, if any, is currently being assessed.
In September 2006, Statement of Financial Accounting Standards No. 157, Fair Value Measurements (SFAS 157), was issued and is effective for fiscal years beginning after November 15, 2007. SFAS 157 defines fair value, establishes a framework for measuring fair value and expands disclosures about fair value measurements. Management is currently evaluating the impact the adoption of SFAS 157 will have on the Fund's financial statements.
Note 8. Subsequent Event
On January 16, 2007, the fund's shareholders approved new subadvisory agreements between the advisor and Houlihan Rovers, S.A., Cohen & Steers Asia Limited and Cohen & Steers UK Limited, all affiliates of the advisor.
31
COHEN & STEERS INTERNATIONAL REALTY FUND, INC.
REPORT OF INDEPENDENT REGISTERED PUBLIC ACCOUNTING FIRM
To the Board of Directors and Shareholders of
Cohen & Steers International Realty Fund, Inc.
In our opinion, the accompanying statement of assets and liabilities, including the schedule of investments, and the related statements of operations and of changes in net assets and the financial highlights present fairly, in all material respects, the financial position of Cohen & Steers International Realty Fund, Inc. (the "Fund") at December 31, 2006, the results of its operations for the year then ended, and the changes in its net assets and the financial highlights for the year then ended and the period from March 31, 2005 (commencement of operations) through December 31, 2005, in conformity with accounting principles generally accepted in the United States of America. These financial statements and financial highlights (hereafter referred to as "financial statements") are the responsibility of the Fund's management; our responsibility is to express an opinion on these financial statements based on our audits. We conducted our audi ts of these financial statements in accordance with the standards of the Public Company Accounting Oversight Board (United States). Those standards require that we plan and perform the audit to obtain reasonable assurance about whether the financial statements are free of material misstatement. An audit includes examining, on a test basis, evidence supporting the amounts and disclosures in the financial statements, assessing the accounting principles used and significant estimates made by management, and evaluating the overall financial statement presentation. We believe that our audits, which included confirmation of securities at December 31, 2006 by correspondence with the custodian and brokers, provide a reasonable basis for our opinion.
PricewaterhouseCoopers LLP
New York, New York
February 16, 2007
32
COHEN & STEERS INTERNATIONAL REALTY FUND, INC.
PROXY RESULTS
Cohen & Steers International Realty Fund, Inc. shareholders voted on the following proposals at the special shareholder meeting held on January 16, 2007. The description of each proposal and number of shares voted are as follows:
| | | Shares Voted
For | | Shares Voted
Against | | Abstain | |
To approve a new Subadvisory Agreement between Cohen & Steers
Capital Management, Inc. and Houlihan Rovers, S.A. | | | 43,097,251 | | | | 542,692 | | | | 2,470,053 | | |
| | | Shares Voted
For | | Shares Voted
Against | | Abstain | |
To approve a new Subadvisory Agreement between Cohen & Steers
Capital Management, Inc. and Cohen & Steers Asia Limited | | | 43,135,749 | | | | 535,363 | | | | 2,438,884 | | |
| | | Shares Voted
For | | Shares Voted
Against | | Abstain | |
To approve a new Subadvisory Agreement between Cohen & Steers
Capital Management, Inc. and Cohen & Steers UK Limited | | | 42,937,564 | | | | 547,157 | | | | 2,625,274 | | |
33
COHEN & STEERS INTERNATIONAL REALTY FUND, INC.
TAX INFORMATION—2006 (Unaudited)
Pursuant to the Jobs and Growth Relief Reconciliation Act of 2003, the fund designates qualified dividend income of $9,858,269. Also, the fund designates a long-term capital gain distribution of $1,217,596 at the 15% rate or the maximum allowable.
The fund has elected, pursuant to section 853 of the Internal Revenue Code, to pass through foreign taxes of $2,909,402. The fund generated net foreign source income of $31,872,905 with respect to this election.
OTHER INFORMATION
A description of the policies and procedures that the fund uses to determine how to vote proxies relating to portfolio securities is available (i) without charge, upon request, by calling 800-330-7348, (ii) on our Web site at cohenandsteers.com or (iii) on the Securities and Exchange Commission's Web site at http://www.sec.gov. In addition, the fund's proxy voting record for the most recent 12-month period ended June 30 is available (i) without charge, upon request, by calling 800-330-7348 or (ii) on the SEC's Web site at http://www.sec.gov.
The fund files its complete schedule of portfolio holdings with the SEC for the first and third quarters of each fiscal year on Form N-Q. The fund's Forms N-Q are available (i) without charge, upon request by calling 800-330-7348, or (ii) on the SEC's Web site at http://www.sec.gov. In addition, the Forms N-Q may be reviewed and copied at the SEC's Public Reference Room in Washington, DC. Information on the operation of the Public Reference Room may be obtained by calling 800-SEC-0330.
Please note that the distributions paid by the fund to shareholders are subject to recharacterization for tax purposes. The fund may also pay distributions in excess of the fund's net investment company taxable income and this excess would be a tax-free return of capital distributed from the fund's assets. To the extent this occurs, the fund's shareholders of record will be notified of the estimated amount of capital returned to shareholders for each such distribution and this information will also be available at cohenandsteers.com. The final tax treatment of all distributions is reported to shareholders on their 1099-DIV forms, which are mailed after the close of each calendar year. Distributions of capital decrease the fund's total assets and, therefore, could have the effect of increasing the fund's expense ratio. In addition, in order to make these distributions, the fund may have to sell portfolio securities at a less than opportune ti me.
34
COHEN & STEERS INTERNATIONAL REALTY FUND, INC.
APPROVAL OF SUBADVISORY AGREEMENTS
The board of directors of the fund, including a majority of the directors who are not parties to the fund's investment advisory agreement or subadvisory agreements, or interested persons of any such party ("Independent Directors"), has the responsibility under the 1940 Act to approve these agreements for initial two year terms and their continuation annually thereafter at a meeting of the board called for the purpose of voting on the approvals or continuations.
At meetings held in person on June 6, 2006 and September 19, 2006, the Subadvisory Agreement between Cohen & Steers Capital Management, Inc. (the "Advisor") and Cohen & Steers Asia Limited (the "CNS Asia Agreement"), and the Subadvisory Agreement between the Advisor and Cohen & Steers UK Limited (the "CNS UK Subadvisory Agreement"), were discussed and were each unanimously approved for a two-year term by the fund's board, including the Independent Directors. The approvals at the September 19, 2006 meeting were done primarily by reference to information provided for and discussions during the June 6, 2006 meeting, of which the substance had not changed materially since the June 6, 2006 meeting. At each meeting, the Independent Directors were represented by independent counsel, who assisted them in their deliberations during the meeting and executive session.
Also at the board meetings held on June 6, 2006 and September 19, 2006, representatives of the Advisor discussed with the board that the parent company of the Advisor had entered into an agreement with Houlihan Rovers, S.A. ("Houlihan Rovers") (which was then 50% owned by the Advisor's parent company) for the Advisor's parent company to acquire the remaining interest in Houlihan Rovers (the "Acquisition"). Since the Acquisition was deemed to cause an "assignment" under the 1940 Act of the current Subadvisory Agreement between the Advisor and Houlihan Rovers (the "Houlihan Subadvisory Agreement"), resulting in termination of the Houlihan Subadvisory Agreement, the board, including the Independent Directors, discussed and unanimously approved for an initial two-year term a new subadvisory agreement with Houlihan Rovers (the "New Houlihan Subadvisory Agreement"), to take effect upon the consummation of the Acquisition. The fund's board, includi ng a majority of the Independent Directors, also approved an interim subadvisory agreement (the "Interim Houlihan Subadvisory Agreement" and collectively with the New Houlihan Subadvisory Agreement, CNS Asia Subadvisory Agreement and CNS UK Subadvisory Agreement, the "Agreements"), to take effect in the event the Acquisition is completed prior to stockholder approval of the New Houlihan Subadvisory Agreement.
Representatives of the Advisor confirmed for the directors that the New Houlihan Subadvisory Agreement was identical in all respects to the Houlihan Subadvisory Agreement, except for the effective dates and that the subadvisory fees paid by the Advisor (not the fund) to Houlihan Rovers under the New Houlihan Subadvisory Agreement would be less than the fees paid under the Houlihan Subadvisory Agreement. The terms of the Interim Houlihan Subadvisory Agreement, and the fees paid thereunder, are substantively identical in all respects to the Houlihan Subadvisory Agreement, except for the fee escrow and termination provisions and the time period covered by the agreements. The board discussed with senior management of the Advisor the rationale for the Acquisition. The directors inquired of senior management of the Advisor the implications of the Acquisition for Houlihan Rovers
35
COHEN & STEERS INTERNATIONAL REALTY FUND, INC.
and the ability of Houlihan Rovers to provide services of the same nature, extent and quality as those to be provided under the Houlihan Subadvisory Agreement. In particular, the board inquired as to the impact of the Acquisition on Houlihan Rovers' personnel, management, facilities and financial capabilities and received assurances in this regard from senior management of the Advisor that the same personnel discussed for providing services under the Houlihan Subadvisory Agreement would continue to do so after the Acquisition and that the Acquisition would not adversely affect Houlihan Rovers' ability to operate its business in a manner currently conducted and to provide services to the fund.
In considering whether to approve the Agreements, the board reviewed materials provided by the Advisor and fund counsel which included, among other things, fee, expense and performance information compared to peer funds prepared by an independent data provider ("Peer Funds"), supplemental performance and summary information prepared by the Advisor, sales and redemption data for the fund and a legal memorandum outlining the legal duties of the board. The board also spoke directly with representatives of the independent data provider and met with investment advisory personnel from the Advisor. The board considered factors relating to the selection of Cohen & Steers Asia Limited ("CNS Asia"), Houlihan Rovers and Cohen & Steers UK Limited ("CNS UK") and the approval of the subadvisory fees, as applicable, when reviewing the Agreements. In particular, the board considered the following:
(i) The nature, extent and quality of services to be provided by Houlihan Rovers, CNS Asia and CNS UK. The directors reviewed the services that Houlihan Rovers provides to the fund, including selecting portfolio securities and providing a continuous investment program for the fund with respect to investments in Europe; providing investment research and management; purchasing, retaining and selling securities for the fund; and placing orders for the execution of the fund's portfolio transactions. The directors also discussed with the Advisor representatives the amount of time Houlihan Rovers dedicates to the fund and the type of transactions that were being done on behalf of the fund. The directors also considered the services that CNS Asia would provide to the fund, including, but not limited to, providing investment advisory and research services with respect to real estate securities issued by companies located in the Asia Pacific region, and the services that CNS UK would provide to the fund, including providing investment advisory and research services and working with Houlihan Rovers and the Advisor in managing the fund's investments in Europe; CNS and CNS UK also would collaborate with the Advisor on overall portfolio allocation for the fund including, in connection therewith, supervise the fund's investments and conduct a continuous program of investment, evaluation and, if appropriate, sale and reinvestment of the fund's assets. The directors also discussed with Advisor representatives the amount of time CNS Asia and CNS UK would dedicate to the fund and the types of transactions that would be done on behalf of the fund. The directors then considered the allocation of responsibilities among the Advisor, Houlihan Rovers, CNS Asia and CNS UK.
The board considered the education, background and experience of Houlihan Rovers' personnel and the favorable history and reputation of the Houlihan Rovers portfolio managers for the fund, finding that this has had, and would likely continue to have, a favorable impact on the success of the fund. The directors concluded that the nature, quality and extent of services provided by Houlihan Rovers to the fund would continue to be adequate and
36
COHEN & STEERS INTERNATIONAL REALTY FUND, INC.
appropriate following the Acquisition. In addition, the board took into consideration the education, background and experience of CNS Asia's and CNS UK's personnel. They also concluded that the services to be provided by CNS Asia and CNS UK would be adequate and appropriate.
(ii) Investment performance of the fund, Houlihan Rovers, CNS Asia and CNS UK. The board reviewed the investment performance of the fund, including the fund's historical performance, as well as performance compared to Peer Funds and performance compared to appropriate benchmark indices. The board noted that the fund's performance was at the median of the Peer Funds in the specialty real estate category. The board also noted that the fund was currently outperforming its blended benchmark. The board gave consideration to the fact that the independent data provider had a limited universe of international real estate funds to include in the Peer Funds and the relatively short one-year period of the performance comparison.
The board determined that Houlihan Rovers would continue to be an appropriate subadvisor for the fund and that the fund's performance was satisfactory. Because CNS Asia and CNS UK were newly established advisors, they did not have performance information for the board to review.
(iii) Cost of the services to be provided and profits to be realized from the relationship with the fund. The board noted that each of Houlihan Rovers' fee, CNS Asia's fee and CNS UK's fee under the relevant Agreement is paid by the Advisor (not the fund). The board reviewed Houlihan Rovers', CNS Asia's and CNS UK's subadvisory fee from the Advisor in respect of two other Cohen & Steers funds concurrently with those for the fund. The board noted that under the fund's management agreement with the Advisor, the fund pays the Advisor a monthly investment advisory fee computed at the annual rate of 0.95% of the average daily net assets of the fund. The board noted, however, that the Advisor had waived a portion of its fees during the reporting period, resulting in a net advisory fee of 0.76% and a net management fee (including both advisory and affiliated administ rative fees) of 0.82%.
The fees to be paid to Houlihan Rovers under the New Houlihan Subadvisory Agreement were lower than the fees paid to Houlihan Rovers under the Houlihan Subadvisory Agreement, and, if necessary, the Interim Houlihan Subadvisory Agreement, in light of the proposals to appoint CNS Asia and CNS UK as subadvisors for the funds. The sub-advisory fees were based on the allocation of responsibilities among the Advisor, Houlihan Rovers, CNS Asia and CNS UK.
In reviewing the investment advisory fee, the board considered the investment advisory fees of the Peer Funds and noted that the fund's contractual fee was at the Peer Fund median (though, after the Advisor's waiver, the fee was substantially below the Peer Fund median). The fund's total expense ratio was above the Peer Fund median (though after the Advisor's waiver, the expense ratio was at the Peer Fund median). It was noted that the Advisor expects the expense ratio would decline with additional assets. The board concluded that the fund's expense structure is competitive in the peer group.
The board took into consideration other benefits to be derived by Houlihan Rovers, CNS Asia and CNS UK in connection with the Agreements, noting particularly the research and related services, within the meaning of
37
COHEN & STEERS INTERNATIONAL REALTY FUND, INC.
Section 28(e) of the Securities Exchange Act of 1934, as amended, that Houlihan Rovers, CNS Asia and CNS UK may receive by allocating the fund's brokerage transactions.
(iv) The extent to which economies of scale would be realized as the fund grows and whether fee levels would reflect such economies of scale. The board noted that the fund's advisory fee schedule does not contain any breakpoints. The board considered the fund's asset size and determined that there were not at this time significant economies of scale that were not being shared with stockholders.
(v) Comparison of services to be rendered and fees to be paid to those under other subadvisory contracts. As discussed above in (i) and (iii), the board compared both the services rendered to and the fees paid by the fund to those under other investment advisory contracts of other investment advisers managing Peer Funds. The board compared both the services rendered and the fees paid under the New Houlihan Subadvisory Agreements to Houlihan Rovers' other advisory contracts with institutional and other clients. The board acknowledged that differences in fees paid by other clients seemed to be consistent with the differences in services provided or to be provided and determined that on a comparative basis the fees under the New Houlihan Subadvisory Agreement were reasonable in relation to the services provided, and concluded the same for CNS Asia and CNS UK.
No single factor was cited as determinative to the decision of the board. Rather, after weighing all of the considerations and conclusions discussed above, the board, including the Independent Directors, unanimously approved the Agreements.
38
COHEN & STEERS INTERNATIONAL REALTY FUND, INC.
MANAGEMENT OF THE FUND
The business and affairs of the fund are managed under the direction of the board of directors. The board of directors approves all significant agreements between the fund and persons or companies furnishing services to it, including the fund's agreements with its advisor, administrator, custodian and transfer agent. The management of the fund's day-to-day operations is delegated to its officers, the advisor and the fund's administrator, subject always to the investment objective and policies of the fund and to the general supervision of the board of directors.
The directors and officers of the fund and their principal occupations during the past five years are set forth below. The statement of additional information (SAI) includes additional information about fund directors and is available, without charge, upon request by calling 1-800-330-7348.
| Name, Address and Age* | | Position(s) Held
With Fund | | Term of
Office | | Principal Occupation
During Past 5 Years
(Including Other
Directorships Held) | | Number of
Funds Within
Fund
Complex
Overseen by
Director
(Including
the Fund) | | Length
of Time
Served** | |
| Interested Directors1 | |
|
Robert H. Steers
Age: 53 | | Director and Co-Chairman | | Until next election of directors | | Co-Chairman and Co-Chief Executive Officer of Cohen & Steers Capital Management, Inc. (CSCM), the fund's investment manager, and its parent company, Cohen & Steers, Inc. (CNS) since 2004. Vice President and Director, Cohen & Steers Securities, LLC (CSSL), the Cohen & Steers open-end funds' distributor. Prior thereto, Chairman of CSCM and the Cohen & Steers funds. | | | 20 | | | 1991 to present | |
|
Martin Cohen
Age: 58 | | Director and Co-Chairman | | Until next election of directors | | Co-Chairman and Co-Chief Executive Officer of CSCM and CNS. Vice President and Director of CSSL. Prior thereto, President of the CSCM and the Cohen & Steers funds. | | | 20 | | | 1991 to present | |
|
| Disinterested Directors | |
|
Bonnie Cohen2
Age: 64 | | Director | | Until next election of directors | | Consultant. Prior thereto, Undersecretary of State, United States Department of State. Director of Wellsford Real Properties, Inc. | | | 20 | | | 2001 to present | |
|
* The address for each director is 280 Park Avenue, New York, NY 10017.
** The length of time served represents the year in which the director was first elected or appointed to any fund in the Cohen & Steers fund complex.
1 "Interested person", as defined in the 1940 Act, of the fund because of affiliation with CSCM.
2 Martin Cohen and Bonnie Cohen are not related.
39
COHEN & STEERS INTERNATIONAL REALTY FUND, INC.
(table continued from previous page)
| Name, Address and Age* | | Position(s) Held
With Fund | | Term of
Office | | Principal Occupation
During Past 5 Years
(Including Other
Directorships Held) | | Number of
Funds Within
Fund
Complex
Overseen by
Director
(Including
the Fund) | | Length
of Time
Served** | |
George Grossman
Age: 52 | | Director | | Until next election of directors | | Attorney-at-law | | | 20 | | | 1993 to present | |
|
Richard E. Kroon
Age: 64 | | Director | | Until next election of directors | | Member of Investment Subcommittee, Monmouth University; retired Chairman and Managing Partner of the Sprout Group venture capital funds, then an affiliate of Donaldson, Lufkin & Jenrette Securities Corporation; and former Chairman of the National Venture Capital Association. | | | 20 | | | 2004 to present | |
|
Richard J. Norman
Age: 63 | | Director | | Until next election of directors | | Private Investor. President of the Board of Directors of Maryland Public Television, Board Member of the Salvation Army. Prior thereto, Investment Representative of Morgan Stanley Dean Witter. | | | 20 | | | 2001 to present | |
|
Frank K. Ross
Age: 63 | | Director | | Until next election of directors | | Professor of Accounting, Howard University; Board member of Pepco Holdings, Inc. (electric utility). Formerly, Midatlantic Area Managing Partner for Audit and Risk Advisory Services at KPMG LLP and Managing Partner of its Washington, DC office. | | | 20 | | | 2004 to present | |
|
Willard H. Smith Jr.
Age: 70 | | Director | | Until next election of directors | | Board member of Essex Property Trust Inc., Realty Income Corporation and Crest Net Lease, Inc. Managing Director at Merrill Lynch & Co., Equity Capital Markets Division from 1983 to 1995. | | | 20 | | | 1996 to present | |
|
C. Edward Ward Jr.
Age: 60 | | Director | | Until next election of directors | | Member of the Board of Trustees of Directors Manhattan College, Riverdale, New York. Formerly head of closed-end fund listings for the New York Stock Exchange. | | | 20 | | | 2004 to present | |
|
* The address for each director is 280 Park Avenue, New York, NY 10017.
** The length of time served represents the year in which the director was first elected or appointed to any fund in the Cohen & Steers fund complex.
40
COHEN & STEERS INTERNATIONAL REALTY FUND, INC.
The officers of the fund (other than Messrs. Cohen and Steers, whose biographies are provided above), their address, their ages and their principal occupations for at least the past five years are set forth below.
| Name, Address and Age* | | Position(s) Held
With Fund | | Principal Occupation During Past 5 Years | | Length
of Time
Served** | |
Adam M. Derechin
Age: 42 | | President and Chief Executive Officer | | Chief Operating Officer of CSCM (since 2003) and CNS (since 2004). Prior to that, Senior Vice President of CSCM and Vice President and Assistant Treasurer of the Cohen & Steers funds. | | Since 2005 | |
|
Joseph M. Harvey
Age: 43 | | Vice President | | President of CSCM (since 2003) and CNS (since 2004). Prior to that, Senior Vice President and Director of Investment Research of CSCM. | | Since 2004 | |
|
James S. Corl
Age: 39 | | Vice President | | Executive Vice President of CSCM and CNS since 2004. Prior to that, Senior Vice President of CSCM. | | Since 2004 | |
|
David J. Oakes
Age: 28 | | Vice President | | Senior Vice President of CSCM since 2005 and Vice President and securities analyst prior thereto. Prior thereto, securities analyst at Goldman Sachs & Co. | | Since 2005 | |
|
John E. McLean
Age: 35 | | Secretary | | Vice President and Associate General Counsel of CSCM since September 2003. Prior to that, Vice President, Law and Regulation, J&W Seligman & Co. Incorporated (money manager). | | Since 2004 | |
|
James Giallanza
Age: 40 | | Treasurer | | Senior Vice President of CSCM since September 2006. Prior thereto, Deputy Head of the US Funds Administration and Treasurer & CFO of various mutual funds within the Legg Mason (formally Citigroup Asset Management) fund complex from August 2004 to September 2006; Director/Controller of the US wholesale business at UBS Global Asset Management (U.S.) from September 2001 to July 2004. | | Since 2006 | |
|
Lisa D. Phelan
Age: 38 | | Chief Compliance Officer | | Vice President & Director of Compliance of CSCM since January 2006. Chief Compliance Officer of CSSL since 2004. Prior to that, Compliance Officer of CSCM since 2004. Chief Compliance Officer, Avatar Associates & Overture Asset Managers, 2003-2004. First VP, Risk Management, Prudential Securities, Inc. 2000-2003. | | Since 2006 | |
|
* The address of each officer is 280 Park Avenue, New York, NY 10017
** Officers serve one-year terms. The length of time served represents the year in which the officer was first elected to that position in any fund in the Cohen & Steers fund complex. All of the officers listed above are officers of one or more of the other funds in the complex.
41
COHEN & STEERS INTERNATIONAL REALTY FUND, INC.
Meet the Cohen & Steers family of open-end funds:

• Designed for investors seeking maximum total return, investing primarily in REITs
• Symbol: CSRSX

• Designed for institutional investors seeking maximum total return, investing primarily
in REITs
• Symbol: CSRIX

• Designed for investors seeking high current income, investing primarily in REITs
• Symbols: CSEIX, CSBIX, CSCIX, CSDIX

• Designed for investors seeking maximum capital appreciation, investing in a limited number of REITs and other real estate securities
• Symbols: CSFAX, CSFBX, CSFCX, CSSPX

• Designed for investors seeking maximum total return, investing primarily in international real estate securities
• Symbols: IRFAX, IRFCX, IRFIX

• Designed for investors seeking maximum total return, investing primarily in utilities
• Symbols: CSUAX, CSUBX, CSUCX, CSUIX

• Designed for investors seeking high current income and long-term growth of income and capital appreciation, investing primarily in dividend paying common stocks and
preferred stocks
• Symbols: DVFAX, DVFCX, DVFIX

• Designed for investors seeking maximum total return, investing primarily in real estate securities located in the Asia Pacific region
• Symbols: APFAX, APFCX, APFIX

• Designed for investors seeking maximum
total return, investing primarily in global real
estate securities
• Symbol: GRSIX
Please consider the investment objectives, risks, charges and expenses of the fund carefully before investing. A prospectus containing this and other information can be obtained by calling 800-330-7348 or by visiting cohenandsteers.com. Please read the prospectus carefully before investing.
Cohen & Steers Securities, LLC, Distributor
42
COHEN & STEERS INTERNATIONAL REALTY FUND, INC.
OFFICERS AND DIRECTORS
Robert H. Steers
Director and co-chairman
Martin Cohen
Director and co-chairman
Bonnie Cohen
Director
George Grossman
Director
Richard E. Kroon
Director
Richard J. Norman
Director
Frank K. Ross
Director
Willard H. Smith Jr.
Director
C. Edward Ward, Jr.
Director
Adam M. Derechin
President and chief executive officer
Joseph M. Harvey
Vice president
James S. Corl
Vice president
David J. Oakes
Vice president
John E. McLean
Secretary
James Giallanza
Treasurer
Lisa D. Phelan
Chief compliance officer
KEY INFORMATION
Investment Advisor
Cohen & Steers Capital Management, Inc.
280 Park Avenue
New York, NY 10017
(212) 832-3232
Fund Subadministrator and Custodian
State Street Bank and Trust Company
1 Lincoln Street
Boston, MA 02111
Transfer Agent
Boston Financial Data Services, Inc.
66 Brooks Drive
Braintree, MA 02184
(800) 437-9912
Legal Counsel
Stroock & Stroock & Lavan LLP
180 Maiden Lane
New York, NY 10038
Distributor
Cohen & Steers Securities, LLC
280 Park Avenue
New York, NY 10017
Nasdaq Symbol: Class A—IRFAX
C—IRFCX
I— IRFIX
Web site: cohenandsteers.com
This report is authorized for delivery only to shareholders of Cohen & Steers International Realty Fund, Inc. unless accompanied or preceded by the delivery of a currently effective prospectus setting forth details of the fund. Past performance is of course no guarantee of future results and your investment may be worth more or less at the time you sell.
43
COHEN & STEERS
INTERNATIONAL REALTY FUND
280 PARK AVENUE
NEW YORK, NY 10017

ANNUAL REPORT
DECEMBER 31, 2006
Item 2. Code of Ethics.
The registrant has adopted a Code of Ethics that applies to its Principal Executive Officer and Principal Financial Officer. The registrant undertakes to provide to any person without charge, upon request, a copy of the Code of Ethics. Such request can be made by calling 800-330-7348 or writing to the Secretary of the registrant, 280 Park Avenue, New York, NY 10017.
Item 3. Audit Committee Financial Expert.
The registrant’s board has determined that Frank K. Ross, a member of the board’s audit committee, is an “audit committee financial expert”. Mr. Ross is “independent,” as such term is defined in this Item.
Item 4. Principal Accountant Fees and Services.
(a) – (d) Aggregate fees billed to the registrant for the last two fiscal years for professional services rendered by the registrant’s principal accountant were as follows:
| | 2006 | | 2005 | |
Audit Fees | | $ | 57,717 | | $ | 66,000 | |
Audit-Related Fees | | — | | — | |
Tax Fees | | 13,500 | | 12,975 | |
All Other Fees | | — | | — | |
| | | | | | | |
Tax fees were billed in connection with the preparation of tax returns, calculation and designation of dividends and other miscellaneous tax services.
Aggregate fees billed by the registrant’s principal accountant for the last two fiscal years for non-audit services provided to the registrant’s investment adviser (not including a sub-adviser whose role is primarily portfolio management and is subcontracted or overseen by another investment adviser) and any entity controlling, controlled by, or under common control with the investment adviser that provides ongoing services to the registered investment company, where the engagement relates directly to the operations and financial reporting of the registrant, were as follows:
| | 2006 | | 2005 | |
| | | | | |
Audit-Related Fees | | — | | — | |
Tax Fees | | — | | — | |
All Other Fees | | $ | 65,000 | | $ | 85,000 | |
| | | | | | | |
These other fees were billed in connection with internal control reviews.
(e)(1) The audit committee is required to pre-approve audit and non-audit services performed for the registrant by the principal accountant. The audit committee also is required to pre-approve non-audit services performed by the registrant’s principal accountant for the registrant’s investment adviser and any sub-adviser (not including any sub-adviser whose role is primarily portfolio management and is subcontracted with or overseen by another investment adviser) and/or to any entity controlling, controlled by or under common control with the registrant’s investment adviser that provides ongoing services to the registrant, if the engagement for services relates directly to the operations and financial reporting of the registrant.
The audit committee may delegate pre-approval authority to one or more of its members who are independent members of the board of directors of the registrant. The member or members to whom such authority is delegated shall report any pre-approval decisions to the audit committee at its next scheduled meeting. The audit committee may not delegate its responsibility to pre-approve services to be performed by the registrant’s principal accountant to the investment adviser.
(e) (2) No services included in (b) – (d) above were approved by the audit committee pursuant to paragraphs (c)(7)(i)(C) of Rule 2-01 of Regulation S-X.
(f) Not applicable.
(g) For the fiscal years ended December 31, 2006 and December 31, 2005, the aggregate fees billed by the registrant’s principal accountant for non-audit services rendered to the registrant and for non-audit services rendered to the registrant’s investment adviser (not including any sub-adviser whose role is primarily portfolio management and is subcontracted with or overseen by another investment adviser) and/or to any entity controlling, controlled by or under common control with the registrant’s investment adviser that provides ongoing services to the registrant were $78,500 and $97,975, respectively.
(h) The registrant’s audit committee considered whether the provision of non-audit services that were rendered to the registrant’s investment adviser (not including any sub-adviser whose role is primarily portfolio management and is subcontracted with or overseen by another investment adviser) and/or to any entity controlling, controlled by or under common control with the registrant’s investment adviser that provides ongoing services to the registrant that were not required to be pre-approved pursuant to paragraph (c)(7)(ii) of Rule 2-01 of Regulation S-X was compatible with maintaining the principal accountant’s independence.
Item 5. Audit Committee of Listed Registrants.
Not applicable.
Item 6. Schedule of Investments.
Included in Item 1 above.
Item 7. Disclosure of Proxy Voting Policies and Procedures for Closed-End Management Investment Companies.
Not applicable.
Item 8. Portfolio Managers of Closed-End Investment Companies.
Not applicable.
Item 9. Purchases of Equity Securities by Closed-End Management Investment Company and Affiliated Purchasers.
Not applicable.
Item 10. Submission of Matters to a Vote of Security Holders.
The board of directors of the registrant has adopted a Nominating Committee Charter which provides that the Nominating Committee (the “Committee”) will consider and evaluate nominee candidates properly submitted by shareholders on the same basis as it considers and evaluates candidates recommended by other sources. The shareholder must submit any such recommendation in writing to the registrant, to the attention of the Secretary, at the address of the principal executive offices of the registrant. A copy of the qualifications and procedures that must be met or followed by shareholders to properly submit a nominee candidate to the Committee may be obtained by submitting a request in writing to the Secretary of the registrant.
Item 11. Controls and Procedures.
(a) The registrant’s principal executive officer and principal financial officer have concluded that the registrant’s disclosure controls and procedures are reasonably designed to ensure that information required to be disclosed by the registrant in this Form N-CSR was recorded, processed, summarized and reported within the time periods specified in the Securities and Exchange Commission’s rules and forms, based upon such officers’ evaluation of these controls and procedures as of a date within 90 days of the filing date of this report.
(b) There were no changes in the registrant’s internal control over financial reporting that occurred during the second fiscal quarter of the period covered by this report that have materially affected, or are reasonably likely to materially affect, the registrant’s internal control over financial reporting.
Item 12. Exhibits.
(a)(1) Not applicable.
(a) (2) Certifications of principal executive officer and principal financial officer as required by Rule 30a-2(a) under the Investment Company Act of 1940.
(b) Certifications of chief executive officer and chief financial officer as required by Rule 30a- 2(b) under the Investment Company Act of 1940.
SIGNATURES
Pursuant to the requirements of the Securities Exchange Act of 1934 and the Investment Company Act of 1940, the registrant has duly caused this report to be signed on its behalf by the undersigned, thereunto duly authorized.
COHEN & STEERS INTERNATIONAL REALTY FUND, INC.
| By: | /s/ Adam M. Derechin | | |
| | Name: Adam M. Derechin | |
| | Title: President and Chief Executive Officer | |
| | | |
| Date: February 28, 2007 | |
Pursuant to the requirements of the Securities Exchange Act of 1934 and the Investment Company Act of 1940, this report has been signed below by the following persons on behalf of the registrant and in the capacities and on the dates indicated.
| By: | /s/ Adam M. Derechin | |
| | Name: | Adam M. Derechin |
| | Title: | President and Chief Executive Officer |
| | | (principal executive officer) |
| | |
| By: | /s/ James Giallanza | |
| | Name: | James Giallanza |
| | Title: | Treasurer |
| | | (principal financial officer) |
| | |
| | |
| Date: February 28, 2007 | |
| | | | | | | |