UNITED STATES
SECURITIES AND EXCHANGE COMMISSION
Washington, D.C. 20549
FORM N-CSR
CERTIFIED SHAREHOLDER REPORT OF REGISTERED
MANAGEMENT INVESTMENT COMPANIES
Investment Company Act file number | 811-21677 |
|
Cohen & Steers International Realty Fund, Inc. |
(Exact name of registrant as specified in charter) |
|
280 Park Avenue, New York, NY | | 10017 |
(Address of principal executive offices) | | (Zip code) |
|
Adam M. Derechin
Cohen & Steers Capital Management, Inc.
280 Park Avenue
New York, New York 10017 |
(Name and address of agent for service) |
|
Registrant’s telephone number, including area code: | (212) 832-3232 | |
|
Date of fiscal year end: | December 31 | |
|
Date of reporting period: | December 31, 2009 | |
| | | | | | | | |
Item 1. Reports to Stockholders.
COHEN & STEERS INTERNATIONAL REALTY FUND, INC.
To Our Shareholders:
We would like to share with you our report for the year ended December 31, 2009. The net asset values (NAV) per share at that date were $10.48, $10.42, and $10.51 for Class A, Class C and Class I shares, respectively.
The total returns, including income and change in NAV, for the Fund and the comparative benchmarks were:
| | | Six Months Ended
December 31, 2009 | | Year Ended
December 31, 2009 | |
| Cohen & Steers International Realty Fund—Class A | | | 20.71 | % | | | 35.48 | % | |
| Cohen & Steers International Realty Fund—Class C | | | 20.30 | % | | | 34.69 | % | |
| Cohen & Steers International Realty Fund—Class I | | | 20.85 | % | | | 35.96 | % | |
| FTSE EPRA/NAREIT Developed Ex-U.S. Real Estate Indexa | | | 22.29 | % | | | 44.56 | % | |
| S&P Developed Ex-U.S. Property Indexa | | | 22.88 | % | | | 42.77 | % | |
| S&P 500 Indexa | | | 22.59 | % | | | 26.46 | % | |
The performance data quoted represent past performance. Past performance is no guarantee of future results. The investment return and the principal value of an investment will fluctuate and shares, if redeemed, may be worth more or less than their original cost. Current performance may be lower or higher than the performance data quoted. Current total returns of the Fund can be obtained by visiting our Web site at cohenandsteers.com. Performance quoted does not reflect the deduction of the maximum 4.5% initial sales charge on Class A shares or the 1% maximum contingent deferred sales charge on Class C shares. If such charges were included, returns would have been lower.
Please note that the distributions paid by the Fund to shareholders are subject to recharacterization for tax purposes. These recharacterizations could result in the Fund paying distributions in excess of its investment company taxable income and this excess would be a tax-free return of capital distributed from the Fund's assets.
Investment Review
In 2009, international real estate securities markets began to rebound from the financial and credit market crises that began in 2008. After a challenging first two months, markets rallied, with momentum slowing in the fourth quarter. For the year, international real estate securities outperformed the broad equity markets as measured by the MSCI World Index,b which had a total return of +30.8%.
a The FTSE EPRA/NAREIT Developed Ex-U.S. Real Estate Index is an unmanaged portfolio of approximately 172 constituents from 20 countries. The S&P Developed Ex-U.S. Property Index is an unmanaged portfolio of approximately 260 constituents from 20 countries. The S&P 500 Index is an unmanaged index of common stocks that is frequently used as a general measure of stock market performance.
b The MSCI World Index is a free float-adjusted market-capitalization index that is designed to measure global developed market equity performance.
1
COHEN & STEERS INTERNATIONAL REALTY FUND, INC.
Valuations began to rise in March when listed real estate companies demonstrated their access to multiple sources of capital. The recapitalization trend moved around the world—Australian listed property trusts, followed by U.K. REITs and then U.S. REITs. Cohen & Steers was instrumental in these capital raisings, and was a cornerstone investor in many of the offerings. Low interest rates also had an enormous impact: they gave weak companies the time to renegotiate loans and repair their balance sheets. This staved off the collapse of the real estate market, but it also deferred "fire sale" acquisition opportunities.
U.K. cap rates declined
The United Kingdom (which had a total return of +16.5% in the year)c advanced in the second quarter, aided by the capital raisings that began in February. However, the rally leveled off in June, once major REITs' capital needs had been met and investors refocused on fundamentals, which remained weak. Third- and fourth-quarter property transactions indicated that valuations of high-quality commercial real estate had stabilized, and cap rates declined considerably. Buyers were drawn by relatively high yields in one of the world's financial capitals and, in the case of foreign buyers, by the weak pound, which enhanced affordability.
France paced Europe's rally
France (+50.0%) had the strongest performance of Europe's major economies. For many years rents were indexed to the cost of construction, which benefited office and retail properties. Indexation turned negative in the second half of the year, however, which has put downward pressure on rents.
Over the course of the year Germany (+19.7%), Europe's largest economy, dropped sharply and then reversed course, aided by government stimulus spending and construction investment. As of September, industrial orders had risen for seven consecutive months.
In news, Spain launched its version of the REIT model (SOCIMI) in June. Unlike most REIT structures, it includes a corporate income tax (18%); however, dividends paid to individuals will be tax-exempt.
Asia Pacific outperformed the U.S. and Europe
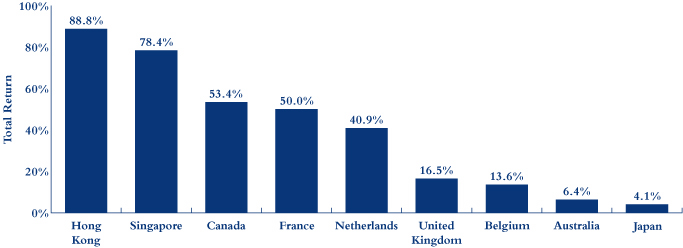
Hong Kong property stocks (+88.8%) benefited from declining lending rates and limited residential supply, along with a brightening economic outlook. Shares of developers had sizable gains as the volume of residential units grew and selling prices increased. The stocks of landlords advanced, aided by signs that office rents had seen the worst of their declines.
Japan (+4.1%) began to rebound after a weak start. In the first half of the year financially weaker J-REITs, which had declined on bankruptcy worries, saw a sharp turnaround amid indications that the government was willing to extend credit to distressed companies
c Country returns are in local currencies as measured by the FTSE EPRA/NAREIT Developed Ex-U.S. Real Estate Index.
2
COHEN & STEERS INTERNATIONAL REALTY FUND, INC.
Australia (+6.4%) strengthened in the wake of recapitalizations and benefited further as the country's economy turned a positive corner sooner than expected. In the fourth quarter, in response to strong economic growth, the country's central bank increased short-term interest rates three times, to 3.75%.
Singapore (+78.4%) saw brightening economic prospects as well as a rebound in residential transaction volume, aided by developers' price cuts and new mortgage offerings from local banks. The market's office stocks performed well despite supply concerns and a continued decline in rents; demand held up better than expected, with resilient lease renewal.
International Total Returns in Local Currencies
January 1, 2009-December 31, 2009
Fund performance
The Fund had a gain in the improved environment for international real estate stocks, but underperformed its benchmarks for the year. Factors that detracted from relative performance included stock selection in Japan. This partly reflected our underweight in certain J-REITs that we viewed as less attractive based on their balance sheets, but which benefited from the government's decision to help them refinance.
Our underweight in Austria (which had a total return of +121.7% within the index) also hindered performance. We were affected by not owning stocks of companies with material corporate governance issues, which we deemed generally risky, but which rebounded with the market nonetheless.
We were overweight the United Kingdom and underweight France, which hampered returns, as did stock selection in both markets. Our U.K. position included overweights in some major real estate companies that underperformed despite their successful capital raisings. We maintain a favorable long-term view of this market.
3
COHEN & STEERS INTERNATIONAL REALTY FUND, INC.
The main positive contributors to performance were our stock selection and overweight in Hong Kong. We had a modest allocation to Brazil (which is not included in the index), which had a strong gain in the period. Our underweights in Belgium and Switzerland and allocation to Norway (+289.4%) also aided performance, as did our allocation to in Australia.
U.S. dollar-based investors benefited from currency movements, with most major currencies appreciating against the dollar.
Investment Outlook
We expect 2010 to be a year of moderate economic growth and continued stabilization in global capital markets. The deleveraging in real estate markets that began in 2009 will likely continue, which could put some constraints on growth. Further capital raising will most likely be for acquisitions. In this environment of low interest rates and relatively high cap rates, well-capitalized REITs may have acquisition opportunities that will be immediately accretive to funds from operations and net asset values. We believe this is the beginning of the acquisition and fundamental recovery phases of the total return cycle.
At present there is very limited new construction in most markets, which speaks to the potential for greater net operating income in 2010 and 2011. Acquisitions, rent growth and organic growth offer the possibility for earnings to accelerate, which will be particularly important if central banks raise interest rates. Private companies in need of capital may decide to go public and launch a new initial public offering cycle.
European outlook is generally positive
There has been significant cap-rate compression across prime U.K. assets, and the trend should continue. This reflects a rebound in London office rents, a relatively benign supply backdrop and demand for high-quality properties from foreign investors. While a modest increase in supply is projected for 2010—mostly in the City—the development pipeline in London stands at a 20-year low. We believe rents in West End and City offices will rise substantially over 2010 on the back of this low availability. The outlook for retail rents is more subdued, as U.K. consumer growth remains sluggish.
France's somewhat insulated economy and strong consumers gave it some downside protection in the recession, yet early indicators suggest that its participation in the recovery is better than expected. The rental declines for prime Paris office space have moderated, easing concerns about a dramatic downturn. We believe that fundamentals point to long-term growth. Retailers and office property owners should see relatively resilient income streams, although the contribution to rents from indexation is fading (more so for office companies).
The Netherlands is home to attractive pan-European mall owners with strong balance sheets, and we favor those with visible cash flows and good management teams. Germany's rebound indicates that it could have the best economic backdrop within Europe in 2010, which would give some aid to currently weak real estate fundamentals. High leverage among listed real estate companies remains a concern.
4
COHEN & STEERS INTERNATIONAL REALTY FUND, INC.
Japan faces challenges but offers opportunity
In Japan our focus remains on property companies with good balance sheets. We are cautious toward J-REITs, favoring those with strong sponsors. Over time, J-REITs should be able to expand their portfolios, earning more favor from their ability to make acquisitions amid scarce capital. Still, given falling rents and rising vacancies, dividend growth will be difficult to achieve.
Hong Kong's economy is gradually recovering. In the office sector, property values have already shown signs of a rebound, while the decline in rents has moderated significantly. We believe a bottom is near and that significant rental growth could occur in 2010 and especially 2011. Residential prices stand to benefit over time from economic recovery and the availability of fixed-rate mortgage plans.
Australia's unemployment rate fell slightly in November, and the majority of job growth was full-time. We remain positive on the country's relative economic strength and view its office sector as the largest beneficiary. Stock valuations are attractive, in our view.
In Singapore, we are turning more positive on sectors driven by a recovery in external demand, including offices and hotels. After the strong rally in the residential sector in 2009, the government is imposing tightening measures on the mass market; we favor developers with a higher luxury component, which should be less affected by policy measures.
5
COHEN & STEERS INTERNATIONAL REALTY FUND, INC.
Sincerely,
 | |  | |
|
| MARTIN COHEN | | ROBERT H. STEERS | |
|
| Co-chairman | | Co-chairman | |
|
 | |  | |
|
| JOSEPH M. HARVEY | | SCOTT CROWE | |
|
| Portfolio Manager | | Portfolio Manager | |
|
 | |  | |
|
| GERIOS J.M. ROVERS | | LUKE SULLIVAN | |
|
| Portfolio Manager | | Portfolio Manager | |
|
The views and opinions in the preceding commentary are subject to change. This material represents an assessment of the market environment at a specific point in time, should not be relied upon as investment advice and is not intended to predict or depict performance of any investment.
Visit Cohen & Steers online at cohenandsteers.com
For more information about any of our funds, visit cohenandsteers.com, where you will find daily net asset values, fund fact sheets and portfolio highlights. You can also access newsletters, education tools and market updates covering the global real estate, listed infrastructure, utilities, large cap value and preferred securities sectors.
In addition, our Web site contains comprehensive information about our firm, including our most recent press releases, profiles of our senior investment professionals and an overview of our investment approach.
6
COHEN & STEERS INTERNATIONAL REALTY FUND, INC.
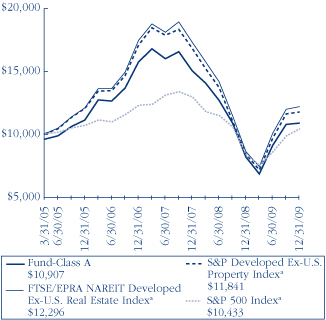
Performance Review (Unaudited)
Cohen & Steers International Realty Fund—Class A
Growth of a $10,000 Investment
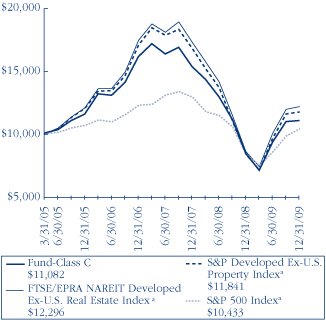
Cohen & Steers International Realty Fund—Class C
Growth of a $10,000 Investment
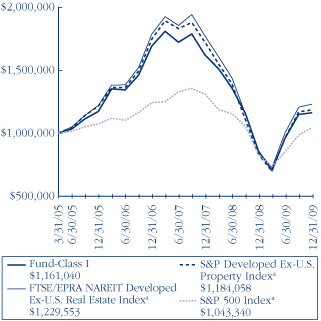
Cohen & Steers International Realty Fund—Class I
Growth of a $1,000,000 Investment
7
COHEN & STEERS INTERNATIONAL REALTY FUND, INC.
Performance Review (Unaudited)—(Continued)
Average Annual Total Returns For Periods Ended December 31, 2009
| | | Class A Shares | | Class C Shares | | Class I Shares | |
| 1 Year (with sales charge) | | | 29.38 | %b | | | 33.69 | %c | | | — | | |
| 1 Year (without sales charge) | | | 35.48 | % | | | 34.69 | % | | | 35.96 | % | |
| Since Inceptiond (with sales charge) | | | 1.84 | % | | | 2.19 | % | | | — | | |
| Since Inceptiond (without sales charge) | | | 2.83 | % | | | 2.19 | % | | | 3.19 | % | |
The performance data quoted represent past performance. Past performance is no guarantee of future results. The investment return and principal value of an investment will fluctuate and shares, when redeemed, may be worth more or less than their original cost. Current performance may be lower or higher than the performance data quoted. Current total returns of the Fund can be obtained by visiting our Web site at cohenandsteers.com. The performance graph and table do not reflect the deduction of taxes that a shareholder would pay on Fund distributions or the redemption of Fund shares.
The expense ratios for each class of shares as disclosed in the May 1, 2009 prospectuses were as follows: Class A—1.54%; Class C—2.19% and Class I—1.19%.
a The comparative indices are not adjusted to reflect expenses or other fees that the SEC requires to be reflected in the Fund's performance. The Fund's performance assumes the reinvestment of all dividends and distributions. For more information, including charges and expenses, please read the prospectus carefully before you invest.
b Reflects a 4.50% front-end sales charge.
c Reflects a contingent deferred sales charge of 1%.
d Inception date of March 31, 2005.
8
COHEN & STEERS INTERNATIONAL REALTY FUND, INC.
Expense Example (Unaudited)
As a shareholder of the Fund, you incur two types of costs: (1) transaction costs, including sales charges (loads) on purchase payments and redemption fees; and (2) ongoing costs including management fees; distribution and/or service (12b-1) fees; and other Fund expenses. This example is intended to help you understand your ongoing costs (in dollars) of investing in the Fund and to compare these costs with the ongoing costs of investing in other mutual funds.
The example is based on an investment of $1,000 invested at the beginning of the period and held for the entire period July 1, 2009—December 31, 2009.
Actual Expenses
The first line of the following table provides information about actual account values and expenses. You may use the information in this line, together with the amount you invested, to estimate the expenses that you paid over the period. Simply divide your account value by $1,000 (for example, an $8,600 account value divided by $1,000 = 8.6), then multiply the result by the number in the first line under the heading entitled "Expenses Paid During Period" to estimate the expenses you paid on your account during this period.
Hypothetical Example for Comparison Purposes
The second line of the following table provides information about hypothetical account values and hypothetical expenses based on the Fund's actual expense ratio and an assumed rate of return of 5% per year before expenses, which is not the Fund's actual return. The hypothetical account values and expenses may not be used to estimate the actual ending account balance or expenses you paid for the period. You may use this information to compare the ongoing cost of investing in the Fund and other funds. To do so, compare this 5% hypothetical example with the 5% hypothetical examples that appear in the shareholder reports of other funds.
Please note that the expenses shown in the table are meant to highlight your ongoing costs only and do not reflect any transactional costs, such as sales charges (loads) and redemption fees. Therefore, the second line of the table is useful in comparing ongoing costs only, and will not help you determine the relative total costs of owning different funds. In addition, if these transactional costs were included, your costs would have been higher.
9
COHEN & STEERS INTERNATIONAL REALTY FUND, INC.
Expense Example (Unaudited)—(Continued)
| | | Beginning
Account Value
July 1, 2009 | | Ending
Account Value
December 31, 2009 | | Expenses Paid
During Period*
July 1, 2009–
December 31, 2009 | |
| Class A | |
| Actual (20.71% return) | | $ | 1,000.00 | | | $ | 1,207.10 | | | $ | 9.07 | | |
| Hypothetical (5% annual return before expenses) | | $ | 1,000.00 | | | $ | 1,016.99 | | | $ | 8.29 | | |
| Class C | |
| Actual (20.30% return) | | $ | 1,000.00 | | | $ | 1,203.00 | | | $ | 12.66 | | |
| Hypothetical (5% annual return before expenses) | | $ | 1,000.00 | | | $ | 1,013.71 | | | $ | 11.57 | | |
| Class I | |
| Actual (20.85% return) | | $ | 1,000.00 | | | $ | 1,208.50 | | | $ | 7.13 | | |
| Hypothetical (5% annual return before expenses) | | $ | 1,000.00 | | | $ | 1,018.75 | | | $ | 6.51 | | |
* Expenses are equal to the Fund's Class A, Class C and Class I annualized expense ratio of 1.63%, 2.28% and 1.28%, respectively, multiplied by the average account value over the period, multiplied by 184/365 (to reflect the one-half year period).
10
COHEN & STEERS INTERNATIONAL REALTY FUND, INC.
DECEMBER 31, 2009
Top Ten Holdings
(Unaudited)
| Security | | Value | | % of
Net
Assets | |
| Sun Hung Kai Properties Ltd. | | $ | 107,222,392 | | | | 7.9 | % | |
| Unibail-Rodamco | | | 72,886,097 | | | | 5.3 | | |
| Westfield Group | | | 67,983,759 | | | | 5.0 | | |
| Mitsubishi Estate Co., Ltd. | | | 64,926,764 | | | | 4.8 | | |
| Mitsui Fudosan Co., Ltd. | | | 59,078,144 | | | | 4.3 | | |
| Land Securities Group PLC | | | 46,368,906 | | | | 3.4 | | |
| Stockland | | | 42,649,540 | | | | 3.1 | | |
| CapitaLand Ltd. | | | 40,113,817 | | | | 2.9 | | |
| Hongkong Land Holdings Ltd. (USD) | | | 38,537,631 | | | | 2.8 | | |
| Henderson Land Development Company Ltd. | | | 33,550,473 | | | | 2.5 | | |
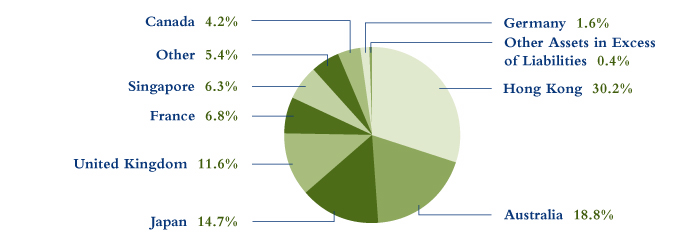
Country Breakdown
(Based on Net Assets)
(Unaudited)
11
COHEN & STEERS INTERNATIONAL REALTY FUND, INC.
SCHEDULE OF INVESTMENTS
December 31, 2009
| | | | | Number
of Shares | | Value | |
| COMMON STOCK | | | 99.6 | % | | | | | | | | | |
| AUSTRALIA | | | 18.8 | % | | | | | | | | | |
| DIVERSIFIED | | | 9.2 | % | | | | | | | | | |
| BGP Holdings PLC (EUR)a,b | | | | | | | 55,752,507 | | | $ | 0 | | |
| Dexus Property Groupa | | | | | | | 28,456,412 | | | | 21,589,203 | | |
| FKP Property Groupa | | | | | | | 15,677,679 | | | | 11,053,896 | | |
| GPT Groupa | | | | | | | 32,118,316 | | | | 17,259,185 | | |
| Mirvac Groupa | | | | | | | 23,581,553 | | | | 32,902,176 | | |
| Stocklanda | | | | | | | 12,105,280 | | | | 42,649,540 | | |
| | | | | | | | 125,454,000 | | |
| INDUSTRIAL | | | 3.1 | % | | | | | | | | | |
| Goodman Groupa | | | | | | | 54,499,984 | | | | 30,833,077 | | |
| ING Industrial Funda,b | | | | | | | 26,321,514 | | | | 11,265,558 | | |
| | | | | | | | 42,098,635 | | |
| OFFICE | | | 1.5 | % | | | | | | | | | |
| Commonwealth Property Office Funda | | | | | | | 15,625,314 | | | | 13,533,290 | | |
| ING Office Funda | | | | | | | 13,049,679 | | | | 7,417,765 | | |
| | | | | | | | 20,951,055 | | |
| RETAIL | | | 5.0 | % | | | | | | | | | |
| Westfield Groupa | | | | | | | 6,074,368 | | | | 67,983,759 | | |
| TOTAL AUSTRALIA | | | | | | | | | | | 256,487,449 | | |
| AUSTRIA | | | 0.6 | % | | | | | | | | | |
| DIVERSIFIED | | | 0.1 | % | | | | | | | | | |
| CA Immobilien Anlagen AGa,b | | | | | | | 19,261 | | | | 217,651 | | |
| Conwert Immobilien Invest SEa,b | | | | | | | 107,998 | | | | 1,320,209 | | |
| | | | | | | | 1,537,860 | | |
| OFFICE | | | 0.5 | % | | | | | | | | | |
| Atrium European Real Estate Ltd.a | | | | | | | 901,675 | | | | 6,068,664 | | |
| TOTAL AUSTRIA | | | | | | | | | | | 7,606,524 | | |
See accompanying notes to financial statements.
12
COHEN & STEERS INTERNATIONAL REALTY FUND, INC.
SCHEDULE OF INVESTMENTS—(Continued)
December 31, 2009
| | | | | Number
of Shares | | Value | |
| BRAZIL | | | 1.4 | % | | | | | | | | | |
| DIVERSIFIED | | | 0.5 | % | | | | | | | | | |
| PDG Realty SA Empreendimentos e Participacoes | | | | | | | 650,136 | | | $ | 6,478,954 | | |
| RESIDENTIAL | | | 0.4 | % | | | | | | | | | |
| MRV Engenharia e Participacoes SA | | | | | | | 701,085 | | | | 5,677,943 | | |
| RETAIL | | | 0.5 | % | | | | | | | | | |
| BR Malls Participacoes SAb | | | | | | | 554,318 | | | | 6,845,398 | | |
| TOTAL BRAZIL | | | | | | | | | | | 19,002,295 | | |
| CANADA | | | 4.2 | % | | | | | | | | | |
| DIVERSIFIED | | | 0.5 | % | | | | | | | | | |
| Brookfield Asset Management | | | | | | | 303,007 | | | | 6,776,625 | | |
| OFFICE | | | 0.9 | % | | | | | | | | | |
| Brookfield Properties Corp. | | | | | | | 971,713 | | | | 11,777,162 | | |
| RESIDENTIAL | | | 1.5 | % | | | | | | | | | |
| Boardwalk REIT | | | | | | | 359,376 | | | | 12,731,157 | | |
| Melcor Developments Ltd. | | | | | | | 730,416 | | | | 7,860,432 | | |
| | | | | | | | 20,591,589 | | |
| RETAIL | | | 1.3 | % | | | | | | | | | |
| Primaris Retail REIT | | | | | | | 677,820 | | | | 10,460,405 | | |
| RioCan Real Estate Investment Trust | | | | | | | 393,720 | | | | 7,472,718 | | |
| | | | | | | | 17,933,123 | | |
| TOTAL CANADA | | | | | | | | | | | 57,078,499 | | |
| FINLAND | | | 0.8 | % | | | | | | | | | |
| DIVERSIFIED | |
| Sponda Oyja,b | | | | | | | 2,801,038 | | | | 10,933,492 | | |
| FRANCE | | | 6.8 | % | | | | | | | | | |
| DIVERSIFIED | |
| Gecina SAa | | | | | | | 61,313 | | | | 6,666,846 | | |
| ICADEa | | | | | | | 142,864 | | | | 13,678,152 | | |
| Unibail-Rodamcoa | | | | | | | 331,783 | | | | 72,886,097 | | |
| | | | | | | | 93,231,095 | | |
See accompanying notes to financial statements.
13
COHEN & STEERS INTERNATIONAL REALTY FUND, INC.
SCHEDULE OF INVESTMENTS—(Continued)
December 31, 2009
| | | | | Number
of Shares | | Value | |
| GERMANY | | | 1.6 | % | | | | | | | | | |
| DIVERSIFIED | | | 0.9 | % | | | | | | | | | |
| IVG Immobilien AGa,b | | | | | | | 1,658,282 | | | $ | 12,652,439 | | |
| OFFICE | | | 0.2 | % | | | | | | | | | |
| Alstria Office AGa | | | | | | | 298,936 | | | | 3,179,786 | | |
| RESIDENTIAL | | | 0.5 | % | | | | | | | | | |
| Deutsche Wohnen AGa,b | | | | | | | 682,043 | | | | 6,525,071 | | |
| TOTAL GERMANY | | | | | | | | | | | 22,357,296 | | |
| HONG KONG | | | 30.2 | % | | | | | | | | | |
| DIVERSIFIED | | | 23.1 | % | | | | | | | | | |
| Agile Property Holdings Ltd.a | | | | | | | 2,242,338 | | | | 3,260,704 | | |
| China Resources Land Ltd.a | | | | | | | 7,034,200 | | | | 15,869,541 | | |
| Glorious Property Holdings Ltd.b | | | | | | | 36,866,852 | | | | 16,689,794 | | |
| Great Eagle Holdings Ltd.a | | | | | | | 4,485,021 | | | | 11,629,688 | | |
| Guangzhou R&F Properties Co., Ltd.a | | | | | | | 3,425,515 | | | | 5,992,244 | | |
| Hang Lung Properties Ltd.a | | | | | | | 7,115,000 | | | | 27,893,299 | | |
| Henderson Land Development Company Ltd.a | | | | | | | 4,474,399 | | | | 33,550,473 | | |
| Hysan Development Company Ltd.a | | | | | | | 4,595,430 | | | | 13,005,438 | | |
| Kerry Properties Ltd.a | | | | | | | 2,063,400 | | | | 10,436,722 | | |
| KWG Property Holding Ltd.a | | | | | | | 9,157,848 | | | | 6,974,980 | | |
| New World China Land Ltd.a | | | | | | | 18,933,145 | | | | 7,155,500 | | |
| New World Development Ltd.a | | | | | | | 15,936,800 | | | | 32,469,669 | | |
| Shimao Property Holdings Ltd.a | | | | | | | 7,782,900 | | | | 14,591,927 | | |
| Sun Hung Kai Properties Ltd.a | | | | | | | 7,211,080 | | | | 107,222,392 | | |
| Wharf Holdings Ltd.a | | | | | | | 1,418,000 | | | | 8,137,909 | | |
| | | | | | | | 314,880,280 | | |
| HOTEL | | | 0.3 | % | | | | | | | | | |
| Shangri-La Asia Ltd.a | | | | | | | 1,889,100 | | | | 3,539,385 | | |
| OFFICE | | | 2.8 | % | | | | | | | | | |
| Hongkong Land Holdings Ltd. (USD)a | | | | | | | 7,824,771 | | | | 38,537,631 | | |
| RESIDENTIAL | | | 2.3 | % | | | | | | | | | |
| China Overseas Land & Investment Ltd.a | | | | | | | 15,357,340 | | | | 32,138,784 | | |
See accompanying notes to financial statements.
14
COHEN & STEERS INTERNATIONAL REALTY FUND, INC.
SCHEDULE OF INVESTMENTS—(Continued)
December 31, 2009
| | | | | Number
of Shares | | Value | |
| RETAIL | | | 1.7 | % | | | | | | | | | |
| Link REITa | | | | | | | 8,934,468 | | | $ | 22,706,235 | | |
| TOTAL HONG KONG | | | | | | | | | | | 411,802,315 | | |
| JAPAN | | | 14.7 | % | | | | | | | | | |
| DIVERSIFIED | | | 12.6 | % | | | | | | | | | |
| Kenedix Realty Investment Corp.a | | | | | | | 3,733 | | | | 10,220,574 | | |
| Mitsubishi Estate Co., Ltd.a | | | | | | | 4,066,600 | | | | 64,926,764 | | |
| Mitsui Fudosan Co., Ltd.a | | | | | | | 3,494,049 | | | | 59,078,144 | | |
| NTT Urban Development Corp.a | | | | | | | 803 | | | | 536,032 | | |
| Sumitomo Realty & Development Co., Ltd.a | | | | | | | 1,405,300 | | | | 26,528,538 | | |
| Tokyo Tatemono Co., Ltd.a | | | | | | | 2,277,000 | | | | 8,758,991 | | |
| Top REITa | | | | | | | 339 | | | | 1,505,627 | | |
| | | | | | | | 171,554,670 | | |
| OFFICE | | | 0.7 | % | | | | | | | | | |
| DA Office Investment Corp.a | | | | | | | 2,701 | | | | 5,737,774 | | |
| Japan Real Estate Investment Corp.a | | | | | | | 592 | | | | 4,364,110 | | |
| | | | | | | | 10,101,884 | | |
| RESIDENTIAL | | | 0.6 | % | | | | | | | | | |
| Goldcrest Co., Ltd.a | | | | | | | 312,205 | | | | 8,742,428 | | |
| RETAIL | | | 0.8 | % | | | | | | | | | |
| AEON Mall Co., Ltd.a | | | | | | | 534,865 | | | | 10,362,364 | | |
| TOTAL JAPAN | | | | | | | | | | | 200,761,346 | | |
| NETHERLANDS | | | 1.0 | % | | | | | | | | | |
| RETAIL | |
| Corio NVa | | | | | | | 199,333 | | | | 13,580,529 | | |
| NORWAY | | | 0.6 | % | | | | | | | | | |
| OFFICE | |
| Norwegian Property ASAa,b | | | | | | | 3,322,746 | | | | 7,683,437 | | |
| SINGAPORE | | | 6.3 | % | | | | | | | | | |
| DIVERSIFIED | | | 3.4 | % | | | | | | | | | |
| Allgreen Properties Ltd.a | | | | | | | 4,199,200 | | | | 3,643,621 | | |
| CapitaLand Ltd.a | | | | | | | 13,522,000 | | | | 40,113,817 | | |
| Keppel Land Ltd.a | | | | | | | 1,189,449 | | | | 2,939,270 | | |
| | | | | | | | 46,696,708 | | |
See accompanying notes to financial statements.
15
COHEN & STEERS INTERNATIONAL REALTY FUND, INC.
SCHEDULE OF INVESTMENTS—(Continued)
December 31, 2009
| | | | | Number
of Shares | | Value | |
| INDUSTRIAL | | | 0.4 | % | | | | | | | | | |
| AIM AMP Capital Industrial REIT | | | | | | | 34,219,529 | | | $ | 5,236,999 | | |
| OFFICE | | | 0.9 | % | | | | | | | | | |
| CapitaCommercial Trusta | | | | | | | 15,316,237 | | | | 12,683,220 | | |
| RETAIL | | | 1.6 | % | | | | | | | | | |
| CapitaMall Trusta | | | | | | | 8,709,200 | | | | 11,116,178 | | |
| CapitaMalls Asia Ltd.b | | | | | | | 5,554,600 | | | | 10,042,840 | | |
| | | | | | | | 21,159,018 | | |
| TOTAL SINGAPORE | | | | | | | | | | | 85,775,945 | | |
| SWEDEN | | | 1.0 | % | | | | | | | | | |
| DIVERSIFIED | | | 0.8 | % | | | | | | | | | |
| Fabege ABa | | | | | | | 1,734,401 | | | | 10,857,017 | | |
| OFFICE | | | 0.2 | % | | | | | | | | | |
| Wihlborgs Fastigheter ABa | | | | | | | 176,027 | | | | 3,244,741 | | |
| TOTAL SWEDEN | | | | | | | | | | | 14,101,758 | | |
| UNITED KINGDOM | | | 11.6 | % | | | | | | | | | |
| DIVERSIFIED | | | 8.2 | % | | | | | | | | | |
| British Land Co., PLCa | | | | | | | 1,874,607 | | | | 14,435,193 | | |
| Hammerson PLCa | | | | | | | 4,865,937 | | | | 33,119,720 | | |
| Land Securities Group PLCa | | | | | | | 4,212,830 | | | | 46,368,906 | | |
| London & Stamford Property Ltd. | | | | | | | 2,729,761 | | | | 5,290,935 | | |
| Unite Group PLCa,b | | | | | | | 2,541,787 | | | | 12,289,148 | | |
| | | | | | | | 111,503,902 | | |
| INDUSTRIAL | | | 0.7 | % | | | | | | | | | |
| Segro PLCa | | | | | | | 1,838,807 | | | | 10,199,457 | | |
| OFFICE | | | 1.6 | % | | | | | | | | | |
| Derwent London PLCa | | | | | | | 691,653 | | | | 14,697,609 | | |
| Great Portland Estates PLCa | | | | | | | 1,407,945 | | | | 6,517,138 | | |
| | | | | | | | 21,214,747 | | |
| RESIDENTIAL | | | 0.2 | % | | | | | | | | | |
| Grainger PLCa | | | | | | | 1,673,708 | | | | 3,449,836 | | |
See accompanying notes to financial statements.
16
COHEN & STEERS INTERNATIONAL REALTY FUND, INC.
SCHEDULE OF INVESTMENTS—(Continued)
December 31, 2009
| | | | | Number
of Shares | | Value | |
| SELF STORAGE | | | 0.9 | % | | | | | | | | | |
| Big Yellow Group PLCa,b | | | | | | | 2,217,665 | | | $ | 12,633,564 | | |
| TOTAL UNITED KINGDOM | | | | | | | | | | | 159,001,506 | | |
| TOTAL COMMON STOCK (Identified cost—$1,201,795,005) | | | | | | | | | | | 1,359,403,486 | | |
| SHORT-TERM INVESTMENTS | | | 0.3 | % | | | | | | | | | |
| MONEY MARKET FUNDS | |
| Federated Government Obligations Fund, 0.06%c | | | | | | | 1,900,000 | | | | 1,900,000 | | |
| State Street Institutional Liquid Reserves Fund, 0.16%c | | | | | | | 1,900,000 | | | | 1,900,000 | | |
TOTAL SHORT-TERM INVESTMENTS
(Identified cost—$3,800,000) | | | | | | | | | | | 3,800,000 | | |
| TOTAL INVESTMENTS (Identified cost—$1,205,595,005) | | | 99.9 | % | | | | | | | 1,363,203,486 | | |
| OTHER ASSETS IN EXCESS OF LIABILITIES | | | 0.1 | % | | | | | | | 1,413,154 | | |
| NET ASSETS | | | 100.0 | % | | | | | | $ | 1,364,616,640 | | |
Glossary of Portfolio Abbreviations
EUR Euro Currency
REIT Real Estate Investment Trust
USD United States Dollar
Note: Percentages indicated are based on the net assets of the Fund.
a Fair valued security. This security has been valued at its fair value as determined in good faith under procedures established by and under the general supervision of the Fund's Board of Directors. Aggregate fair value securities represent 91.3% of net assets of the Fund, all of which have been fair valued pursuant to foreign security fair value pricing procedures approved by the Board of Directors.
b Non-income producing security.
c Rate quoted represents the seven day yield of the fund.
See accompanying notes to financial statements.
17
COHEN & STEERS INTERNATIONAL REALTY FUND, INC.
STATEMENT OF ASSETS AND LIABILITIES
December 31, 2009
| ASSETS: | |
| Investments in securities, at value (Identified cost—$1,205,595,005) | | $ | 1,363,203,486 | | |
| Cash | | | 67,525 | | |
| Foreign currency, at value (Identified cost—$128,469) | | | 128,322 | | |
| Receivable for: | |
| Dividends and interest | | | 4,514,415 | | |
| Fund shares sold | | | 2,883,905 | | |
| Investment securities sold | | | 617,108 | | |
| Other assets | | | 62,892 | | |
| Total Assets | | | 1,371,477,653 | | |
| LIABILITIES: | |
| Payable for: | |
| Investment securities purchased | | | 2,475,801 | | |
| Fund shares redeemed | | | 2,281,317 | | |
| Investment advisory fees | | | 1,117,085 | | |
| Administration fees | | | 70,553 | | |
| Distribution fees | | | 16,134 | | |
| Shareholder servicing fees | | | 5,761 | | |
| Directors' fees | | | 1,012 | | |
| Other liabilities | | | 893,350 | | |
| Total Liabilities | | | 6,861,013 | | |
| NET ASSETS | | $ | 1,364,616,640 | | |
| NET ASSETS consist of: | |
| Paid-in-capital | | $ | 2,814,111,856 | | |
| Dividends in excess of net investment income | | | (45,683,378 | ) | |
| Accumulated net realized loss | | | (1,561,445,824 | ) | |
| Net unrealized appreciation | | | 157,633,986 | | |
| | | $ | 1,364,616,640 | | |
See accompanying notes to financial statements.
18
COHEN & STEERS INTERNATIONAL REALTY FUND, INC.
STATEMENT OF ASSETS AND LIABILITIES—(Continued)
December 31, 2009
| CLASS A SHARES: | |
| NET ASSETS | | $ | 423,098,594 | | |
| Shares issued and outstanding ($0.001 par value common stock outstanding) | | | 40,382,444 | | |
| Net asset value and redemption price per share | | $ | 10.48 | | |
| Maximum offering price per share ($10.48 ÷ 0.955)a | | $ | 10.97 | | |
| CLASS C SHARES: | |
| NET ASSETS | | $ | 254,649,833 | | |
| Shares issued and outstanding ($0.001 par value common stock outstanding) | | | 24,448,405 | | |
| Net asset value and offering price per shareb | | $ | 10.42 | | |
| CLASS I SHARES: | |
| NET ASSETS | | $ | 686,868,213 | | |
| Shares issued and outstanding ($0.001 par value common stock outstanding) | | | 65,362,149 | | |
| Net asset value, offering, and redemption price per share | | $ | 10.51 | | |
a On investments of $100,000 or more, the offering price is reduced.
b Redemption price per share is equal to the net asset value per share less any applicable deferred sales charge of 1% on shares held for less than one year.
See accompanying notes to financial statements.
19
COHEN & STEERS INTERNATIONAL REALTY FUND, INC.
STATEMENT OF OPERATIONS
For the Year Ended December 31, 2009
| Investment Income: | |
| Dividend income (net of $4,743,210 of foreign withholding tax) | | $ | 41,642,628 | | |
| Other income | | | 211,611 | | |
| Total Income | | | 41,854,239 | | |
| Expenses: | |
| Investment advisory fees | | | 11,163,551 | | |
| Distribution fees—Class A | | | 907,958 | | |
| Distribution fees—Class C | | | 1,821,052 | | |
| Transfer agent fees and expenses | | | 1,301,888 | | |
| Administration fees | | | 1,096,147 | | |
| Custodian fees and expenses | | | 1,019,801 | | |
| Shareholder servicing fees—Class A | | | 363,183 | | |
| Shareholder servicing fees—Class C | | | 607,017 | | |
| Shareholder reporting expenses | | | 298,912 | | |
| Professional fees | | | 133,674 | | |
| Line of credit fees | | | 111,172 | | |
| Registration and filing fees | | | 88,589 | | |
| Directors' fees and expenses | | | 52,830 | | |
| Miscellaneous | | | 134,326 | | |
| Total Expenses | | | 19,100,100 | | |
| Net Investment Income | | | 22,754,139 | | |
| Net Realized and Unrealized Gain (Loss): | |
| Net realized loss on: | |
| Investments | | | (164,176,427 | ) | |
| Foreign currency transactions | | | (4,535,749 | ) | |
| Net realized loss | | | (168,712,176 | ) | |
| Net change in unrealized appreciation (depreciation) on: | |
| Investments | | | 478,895,089 | | |
| Foreign currency translations | | | 327,479 | | |
| Net change in unrealized appreciation (depreciation) | | | 479,222,568 | | |
| Net realized and unrealized gain | | | 310,510,392 | | |
| Net Increase in Net Assets Resulting from Operations | | $ | 333,264,531 | | |
See accompanying notes to financial statements.
20
COHEN & STEERS INTERNATIONAL REALTY FUND, INC.
STATEMENT OF CHANGES IN NET ASSETS
| | | For the
Year Ended
December 31, 2009 | | For the
Year Ended
December 31, 2008 | |
| Change in Net Assets: | |
| From Operations: | |
| Net investment income | | $ | 22,754,139 | | | $ | 48,934,598 | | |
| Net realized loss | | | (168,712,176 | ) | | | (1,210,132,316 | ) | |
| Net change in unrealized appreciation (depreciation) | | | 479,222,568 | | | | (333,498,345 | ) | |
Net increase (decrease) in net assets resulting
from operations | | | 333,264,531 | | | | (1,494,696,063 | ) | |
| Dividends and Distributions to Shareholders from: | |
| Net investment income: | |
| Class A | | | (33,743,706 | ) | | | — | | |
| Class C | | | (18,987,585 | ) | | | — | | |
| Class I | | | (55,732,392 | ) | | | — | | |
| Tax return of capital: | |
| Class A | | | — | | | | (11,032,153 | ) | |
| Class C | | | — | | | | (4,782,400 | ) | |
| Class I | | | — | | | | (12,841,888 | ) | |
| Total dividends and distributions to shareholders | | | (108,463,683 | ) | | | (28,656,441 | ) | |
| Capital Stock Transactions: | |
| Decrease in net assets from Fund share transactions | | | (41,768,341 | ) | | | (981,132,769 | ) | |
| Total increase (decrease) in net assets | | | 183,032,507 | | | | (2,504,485,273 | ) | |
| Net Assets: | |
| Beginning of year | | | 1,181,584,133 | | | | 3,686,069,406 | | |
| End of yeara | | $ | 1,364,616,640 | | | $ | 1,181,584,133 | | |
a Includes dividends in excess of net investment income of $45,683,378 and $10,738,925, respectively.
See accompanying notes to financial statements.
21
COHEN & STEERS INTERNATIONAL REALTY FUND, INC.
FINANCIAL HIGHLIGHTS
The following table includes selected data for a share outstanding throughout each period and other performance information derived from the financial statements. It should be read in conjunction with the financial statements and notes thereto.
| | | Class A | |
| | | For the Year Ended December 31, | | For the Period
March 31, 2005a
through | |
| Per Share Operating Performance: | | 2009 | | 2008 | | 2007 | | 2006 | | December 31, 2005 | |
| Net asset value, beginning of period | | $ | 8.41 | | | $ | 16.17 | | | $ | 18.48 | | | $ | 13.28 | | | $ | 11.46 | | |
| Income from investment operations: | |
| Net investment incomeb | | | 0.18 | | | | 0.25 | | | | 0.25 | | | | 0.20 | c | | | 0.07 | | |
| Net realized and unrealized gain (loss) | | | 2.77 | | | | (7.87 | ) | | | (1.09 | ) | | | 5.59 | | | | 1.86 | | |
| Total from investment operations | | | 2.95 | | | | (7.62 | ) | | | (0.84 | ) | | | 5.79 | | | | 1.93 | | |
| Less dividends and distributions to shareholders from: | |
| Net investment income | | | (0.88 | ) | | | — | | | | (0.95 | ) | | | (0.50 | ) | | | (0.06 | ) | |
| Net realized gain | | | — | | | | — | | | | (0.53 | ) | | | (0.09 | ) | | | (0.05 | ) | |
| Tax return of capital | | | — | | | | (0.14 | ) | | | — | | | | — | | | | — | | |
Total dividends and distributions to
shareholders | | | (0.88 | ) | | | (0.14 | ) | | | (1.48 | ) | | | (0.59 | ) | | | (0.11 | ) | |
| Redemption fees retained by the Fund | | | 0.00 | d | | | 0.00 | d | | | 0.01 | | | | 0.00 | d | | | 0.00 | d | |
| Net increase (decrease) in net asset value | | | 2.07 | | | | (7.76 | ) | | | (2.31 | ) | | | 5.20 | | | | 1.82 | | |
| Net asset value, end of period | | $ | 10.48 | | | $ | 8.41 | | | $ | 16.17 | | | $ | 18.48 | | | $ | 13.28 | | |
| Total investment returne | | | 35.48 | % | | | –47.43 | % | | | –4.64 | % | | | 43.88 | % | | | 16.88 | %g | |
| Ratios/Supplemental Data: | |
| Net assets, end of period (in millions) | | $ | 423.1 | | | $ | 372.5 | | | $ | 1,475.2 | | | $ | 921.0 | | | $ | 91.6 | | |
Ratio of expenses to average daily net assets
(before expense reduction) | | | 1.66 | %h | | | 1.54 | % | | | 1.46 | % | | | 1.61 | % | | | 1.86 | %f | |
Ratio of expenses to average daily net assets
(net of expense reduction) | | | 1.66 | %h | | | 1.54 | % | | | 1.46 | % | | | 1.61 | % | | | 1.70 | %f | |
Ratio of net investment income to average daily net
assets (before expense reduction) | | | 1.92 | % | | | 1.87 | % | | | 1.31 | % | | | 1.26 | % | | | 0.56 | %f | |
Ratio of net investment income to average daily net
assets (net of expense reduction) | | | 1.92 | % | | | 1.87 | % | | | 1.31 | % | | | 1.26 | % | | | 0.72 | %f | |
| Portfolio turnover rate | | | 190 | % | | | 88 | % | | | 67 | % | | | 30 | % | | | 35 | %g | |
a Commencement of operations.
b Calculation based on average shares outstanding.
c 18.1% of gross income was attributable to a special dividend paid by Great Eagle Holdings Ltd.
d Amount is less than $0.005.
e Does not reflect sales charges, which would reduce return.
f Annualized.
g Not annualized.
h Reflects Fund level ratio for non-class specific expenses.
See accompanying notes to financial statements.
22
COHEN & STEERS INTERNATIONAL REALTY FUND, INC.
FINANCIAL HIGHLIGHTS—(Continued)
| | | Class C | |
| | | For the Year Ended December 31, | | For the Period
March 31, 2005a
through | |
| Per Share Operating Performance: | | 2009 | | 2008 | | 2007 | | 2006 | | December 31, 2005 | |
| Net asset value, beginning of period | | $ | 8.36 | | | $ | 16.13 | | | $ | 18.44 | | | $ | 13.26 | | | $ | 11.46 | | |
| Income from investment operations: | |
| Net investment incomeb | | | 0.12 | | | | 0.16 | | | | 0.12 | | | | 0.10 | c | | | 0.01 | | |
| Net realized and unrealized gain (loss) | | | 2.75 | | | | (7.84 | ) | | | (1.07 | ) | | | 5.58 | | | | 1.87 | | |
| Total from investment operations | | | 2.87 | | | | (7.68 | ) | | | (0.95 | ) | | | 5.68 | | | | 1.88 | | |
| Less dividends and distributions to shareholders from: | |
| Net investment income | | | (0.81 | ) | | | — | | | | (0.84 | ) | | | (0.41 | ) | | | (0.03 | ) | |
| Net realized gain | | | — | | | | — | | | | (0.53 | ) | | | (0.09 | ) | | | (0.05 | ) | |
| Tax return of capital | | | — | | | | (0.09 | ) | | | — | | | | — | | | | — | | |
Total dividends and distributions to
shareholders | | | (0.81 | ) | | | (0.09 | ) | | | (1.37 | ) | | | (0.50 | ) | | | (0.08 | ) | |
| Redemption fees retained by the Fund | | | 0.00 | d | | | 0.00 | d | | | 0.01 | | | | 0.00 | d | | | 0.00 | d | |
| Net increase (decrease) in net asset value | | | 2.06 | | | | (7.77 | ) | | | (2.31 | ) | | | 5.18 | | | | 1.80 | | |
| Net asset value, end of period | | $ | 10.42 | | | $ | 8.36 | | | $ | 16.13 | | | $ | 18.44 | | | $ | 13.26 | | |
| Total investment returne | | | 34.69 | % | | | –47.83 | % | | | –5.23 | % | | | 42.99 | % | | | 16.37 | %f | |
| Ratios/Supplemental Data: | |
| Net assets, end of period (in millions) | | $ | 254.6 | | | $ | 281.0 | | | $ | 1,074.9 | | | $ | 688.1 | | | $ | 61.4 | | |
Ratio of expenses to average daily net assets
(before expense reduction) | | | 2.31 | %h | | | 2.19 | % | | | 2.12 | % | | | 2.26 | % | | | 2.50 | %g | |
Ratio of expenses to average daily net assets
(net of expense reduction) | | | 2.31 | %h | | | 2.19 | % | | | 2.12 | % | | | 2.26 | % | | | 2.35 | %g | |
Ratio of net investment income (loss) to average daily
net assets (before expense reduction) | | | 1.29 | % | | | 1.23 | % | | | 0.63 | % | | | 0.63 | % | | | (0.09 | )%g | |
Ratio of net investment income to average daily net
assets (net of expense reduction) | | | 1.29 | % | | | 1.23 | % | | | 0.63 | % | | | 0.63 | % | | | 0.07 | %g | |
| Portfolio turnover rate | | | 190 | % | | | 88 | % | | | 67 | % | | | 30 | % | | | 35 | %f | |
a Commencement of operations.
b Calculation based on average shares outstanding.
c 18.1% of gross income was attributable to a special dividend paid by Great Eagle Holdings Ltd.
d Amount is less than $0.005.
e Does not reflect sales charges, which would reduce return.
f Not annualized.
g Annualized.
h Reflects Fund level ratio for non-class specific expenses.
See accompanying notes to financial statements.
23
COHEN & STEERS INTERNATIONAL REALTY FUND, INC.
FINANCIAL HIGHLIGHTS—(Continued)
| | | Class I | |
| | | For the Year Ended December 31, | | For the Period
March 31, 2005a
through | |
| Per Share Operating Performance: | | 2009 | | 2008 | | 2007 | | 2006 | | December 31, 2005 | |
| Net asset value, beginning of period | | $ | 8.43 | | | $ | 16.19 | | | $ | 18.50 | | | $ | 13.28 | | | $ | 11.46 | | |
| Income from investment operations: | |
| Net investment incomeb | | | 0.21 | | | | 0.31 | | | | 0.30 | | | | 0.26 | c | | | 0.11 | | |
| Net realized and unrealized gain (loss) | | | 2.78 | | | | (7.90 | ) | | | (1.08 | ) | | | 5.59 | | | | 1.85 | | |
| Total from investment operations | | | 2.99 | | | | (7.59 | ) | | | (0.78 | ) | | | 5.85 | | | | 1.96 | | |
| Less dividends and distributions to shareholders from: | |
| Net investment income | | | (0.91 | ) | | | — | | | | (1.01 | ) | | | (0.54 | ) | | | (0.09 | ) | |
| Net realized gain | | | — | | | | — | | | | (0.53 | ) | | | (0.09 | ) | | | (0.05 | ) | |
| Tax return of capital | | | — | | | | (0.17 | ) | | | — | | | | — | | | | — | | |
Total dividends and distributions to
shareholders | | | (0.91 | ) | | | (0.17 | ) | | | (1.54 | ) | | | (0.63 | ) | | | (0.14 | ) | |
| Redemption fees retained by the Fund | | | 0.00 | d | | | 0.00 | d | | | 0.01 | | | | 0.00 | d | | | 0.00 | d | |
| Net increase (decrease) in net asset value | | | 2.08 | | | | (7.76 | ) | | | (2.31 | ) | | | 5.22 | | | | 1.82 | | |
| Net asset value, end of period | | $ | 10.51 | | | $ | 8.43 | | | $ | 16.19 | | | $ | 18.50 | | | $ | 13.28 | | |
| Total investment return | | | 35.96 | % | | | –47.26 | % | | | –4.32 | % | | | 44.45 | % | | | 17.14 | %e | |
| Ratios/Supplemental Data: | |
| Net assets, end of period (in millions) | | $ | 686.9 | | | $ | 528.0 | | | $ | 1,136.0 | | | $ | 711.5 | | | $ | 150.2 | | |
Ratio of expenses to average daily net assets
(before expense reduction) | | | 1.31 | %g | | | 1.19 | % | | | 1.12 | % | | | 1.25 | % | | | 1.57 | %f | |
Ratio of expenses to average daily net assets
(net of expense reduction) | | | 1.31 | %g | | | 1.19 | % | | | 1.12 | % | | | 1.25 | % | | | 1.35 | %f | |
Ratio of net investment income to average daily net
assets (before expense reduction) | | | 2.23 | % | | | 2.36 | % | | | 1.61 | % | | | 1.60 | % | | | 1.00 | %f | |
Ratio of net investment income to average daily net
assets (net of expense reduction) | | | 2.23 | % | | | 2.36 | % | | | 1.61 | % | | | 1.60 | % | | | 1.22 | %f | |
| Portfolio turnover rate | | | 190 | % | | | 88 | % | | | 67 | % | | | 30 | % | | | 35 | %e | |
a Commencement of operations.
b Calculation based on average shares outstanding.
c 18.1% of gross income was attributable to a special dividend paid by Great Eagle Holdings Ltd.
d Amount is less than $0.005.
e Not annualized.
f Annualized.
g Reflects Fund level ratio for non-class specific expenses.
See accompanying notes to financial statements.
24
COHEN & STEERS INTERNATIONAL REALTY FUND, INC.
NOTES TO FINANCIAL STATEMENTS
Note 1. Significant Accounting Policies
Cohen & Steers International Realty Fund, Inc. (the Fund) was incorporated under the laws of the State of Maryland on November 23, 2004 and is registered under the Investment Company Act of 1940, as amended, as a nondiversified, open-end management investment company. The Fund's investment objective is total return. The authorized shares of the Fund are divided into three classes designated Class A, C and I shares. Each of the Fund's shares has equal dividend, liquidation and voting rights (except for matters relating to distributions and shareholder servicing of such shares).
The following is a summary of significant accounting policies consistently followed by the Fund in the preparation of its financial statements. The policies are in conformity with accounting principles generally accepted in the United States of America (GAAP). The preparation of the financial statements in accordance with GAAP requires management to make estimates and assumptions that affect the reported amounts of assets and liabilities at the date of the financial statements and the reported amounts of income and expenses during the reporting period. Actual results could differ from those estimates.
Portfolio Valuation: Investments in securities that are listed on the New York Stock Exchange are valued, except as indicated below, at the last sale price reflected at the close of the New York Stock Exchange on the business day as of which such value is being determined. If there has been no sale on such day, the securities are valued at the mean of the closing bid and asked prices for the day or, if no asked price is available, at the bid price.
Securities not listed on the New York Stock Exchange but listed on other domestic or foreign securities exchanges are valued in a similar manner. Securities traded on more than one securities exchange are valued at the last sale price on the business day as of which such value is being determined as reflected on the tape at the close of the exchange representing the principal market for such securities. If after the close of a foreign market, but prior to the close of business on the day the securities are being valued, market conditions change significantly, certain foreign securities may be fair valued pursuant to procedures established by the Board of Directors.
Readily marketable securities traded in the over-the-counter market, including listed securities whose primary market is believed by Cohen & Steers Capital Management, Inc. (the advisor) to be over-the-counter, are valued at the official closing prices as reported by sources as the Board of Directors deem appropriate to reflect their fair market value. If there has been no sale on such day, the securities are valued at the mean of the closing bid and asked prices for the day, or if no asked price is available, at the bid price. However, certain fixed-income securities may be valued on the basis of prices provided by a pricing service when such prices are believed by the Board of Directors to reflect the fair market value of such securities.
Securities for which market prices are unavailable, or securities for which the advisor determines that bid and/or asked price does not reflect market value, will be valued at fair value pursuant to procedures approved by the Fund's Board of Directors. Circumstances in which market prices may be unavailable include, but are not limited to, when trading in a security is suspended, the exchange on which the security is traded is subject to an unscheduled close or disruption or material events occur after the close of the exchange on which the security is principally traded. In these circumstances,
25
COHEN & STEERS INTERNATIONAL REALTY FUND, INC.
NOTES TO FINANCIAL STATEMENTS—(Continued)
the Fund determines fair value in a manner that fairly reflects the market value of the security on the valuation date based on consideration of any information or factors it deems appropriate. These may include, but are not limited to, recent transactions in comparable securities, information relating to the specific security and developments in the markets.
The Fund's use of fair value pricing may cause the net asset value of Fund shares to differ from the net asset value that would be calculated using market quotations. Fair value pricing involves subjective judgments and it is possible that the fair value determined for a security may be materially different than the value that could be realized upon the sale of that security.
Short-term debt securities with a maturity date of 60 days or less are valued at amortized cost, which approximates value. Investments in open-end mutual funds are valued at their closing net asset value.
Fair value is defined as the price that the Fund would receive to sell an investment or pay to transfer a liability in an orderly transaction with an independent buyer in the principal market, or in the absence of a principal market the most advantageous market for the investment or liability. The hierarchy of inputs that are used in determining the fair value of the Fund's investments is summarized below.
• Level 1—quoted prices in active markets for identical investments
• Level 2—other significant observable inputs (including quoted prices for similar investments, interest rates, credit risk, etc.)
• Level 3—significant unobservable inputs (including the Fund's own assumptions in determining the fair value of investments)
The inputs or methodology used for valuing securities are not necessarily an indication of the risk associated with investing in those securities.
The following is a summary of the inputs used as of December 31, 2009 in valuing the Fund's investments carried at value. 91.3% of net assets of the Fund were fair valued pursuant to foreign fair value pricing procedures approved by the Board of Directors.
| | | Total | | Quoted Prices In
Active Market for
Identical Assets
(Level 1) | | Significant
Other Observable
Inputs
(Level 2) | | Significant
Unobservable
Inputs
(Level 3) | |
| Common Stock—Brazil | | $ | 19,002,295 | | | $ | 19,002,295 | | | $ | — | | | | — | | |
| Common Stock—Canada | | | 57,078,499 | | | | 57,078,499 | | | | — | | | | — | | |
| Common Stock—Hong Kong | | | 411,802,315 | | | | 16,689,794 | | | | 395,112,521 | | | | — | | |
| Common Stock—Singapore | | | 85,775,945 | | | | 15,279,839 | | | | 70,496,106 | | | | — | | |
| Common Stock—United Kingdom | | | 159,001,506 | | | | 5,290,935 | | | | 153,710,571 | | | | — | | |
| Common Stock—Other Countries | | | 626,742,926 | | | | — | | | | 626,742,926 | | | | — | | |
| Money Market Funds | | | 3,800,000 | | | | — | | | | 3,800,000 | | | | — | | |
| Total Investments | | $ | 1,363,203,486 | | | $ | 113,341,362 | | | $ | 1,249,862,124 | | | | — | | |
26
COHEN & STEERS INTERNATIONAL REALTY FUND, INC.
NOTES TO FINANCIAL STATEMENTS—(Continued)
Security Transactions, Investment Income and Expense Allocations: Security transactions are recorded on trade date. Realized gains and losses on investments sold are recorded on the basis of identified cost. Interest income is recorded on the accrual basis. Discounts are accreted and premiums are amortized over the life of the respective securities. Dividend income is recorded on the ex-dividend date, except for certain dividends on foreign securities, which are recorded as soon as the Fund is informed after the ex-dividend date. Income, expenses (other than expenses attributable to a specific class), and realized and unrealized gains or losses on investments are allocated to each class of shares based on its relative net assets.
Foreign Currency Translations: The books and records of the Fund are maintained in U.S. dollars as follows: (1) the foreign currency market value of investment securities, other assets and liabilities and foreign currency contracts are translated at the exchange rates prevailing at the end of the period; and (2) purchases, sales, income and expenses are translated at the exchange rates prevailing on the respective dates of such transactions. The resultant exchange gains and losses are recorded as realized and unrealized gain/loss on foreign exchange transactions. Pursuant to U.S. federal income tax regulations, certain foreign exchange gains/losses included in realized and unrealized gain/loss are included in or are a reduction of ordinary income for federal income tax purposes. The Fund does not isolate that portion of the results of operations arising as a resul t of changes in the foreign exchange rates from the changes in the market prices of the securities.
Foreign Securities: The Fund may directly purchase securities of foreign issuers. Investing in securities of foreign issuers involves special risks not typically associated with investing in securities of U.S. issuers. The risks include possible revaluation of currencies, the ability to repatriate funds, less complete financial information about companies and possible future adverse political and economic developments. Moreover, securities of many foreign issuers and their markets may be less liquid and their prices more volatile than those of securities of comparable U.S. issuers.
Dividends and Distributions to Shareholders: Dividends from net investment income and capital gain distributions are determined in accordance with U.S. federal income tax regulations, which may differ from GAAP. Dividends from net investment income, if any, are declared and paid semi-annually. Net realized capital gains, unless offset by any available capital loss carryforward, are typically distributed to shareholders at least annually. Dividends and distributions to shareholders are recorded on the ex-dividend date and are automatically reinvested in full and fractional shares of the Fund based on the net asset value per share at the close of business on the payable date unless the shareholder has elected to have them paid in cash.
Income Taxes: It is the policy of the Fund to continue to qualify as a regulated investment company, if such qualification is in the best interest of the shareholders, by complying with the requirements of Subchapter M of the Internal Revenue Code applicable to regulated investment companies, and by distributing substantially all of its taxable earnings to its shareholders. Accordingly, no provision for federal income or excise tax is necessary. Management has analyzed the Fund's tax positions taken on federal income tax returns as well as its tax positions in non-U.S. jurisdictions where it trades for all open tax years and has concluded that as of December 31, 2009, no provisions for income tax would be required in the Fund's financial statements. The Fund's tax positions for the
27
COHEN & STEERS INTERNATIONAL REALTY FUND, INC.
NOTES TO FINANCIAL STATEMENTS—(Continued)
tax years for which the applicable statutes of limitations have not expired are subject to examination by the Internal Revenue Service, state departments of revenue and by foreign tax authorities.
Note 2. Investment Advisory and Administration Fees and Other Transactions with Affiliates
Investment Advisory Fees: The advisor serves as the Fund's investment advisor pursuant to an investment advisory agreement (the investment advisory agreement). Under the terms of the investment advisory agreement, the advisor provides the Fund with the day-to-day investment decisions and generally manages the Fund's investments in accordance with the stated policies of the Fund, subject to the supervision of the Fund's Board of Directors.
For the services provided to the Fund, the advisor receives a fee, accrued daily and paid monthly, at the annual rate of 0.95% of the average daily net assets of the Fund up to and including $1.5 billion and 0.85% of the average daily net asset above $1.5 billion.
Under subadvisory agreements between the advisor and each of Cohen & Steers Asia Limited, Cohen & Steers UK Limited and Cohen & Steers Europe S.A. (collectively the subadvisors), affiliates of the advisor, the subadvisors are responsible for managing the Fund's investments in certain non-U.S. real estate securities. For their services provided under the subadvisory agreement, the advisor (not the Fund) pays the subadvisors. Effective October 1, 2009, the advisor allocates 50% of the advisory fee received from the Fund among itself and each subadvisor based on the portion of the Fund's average assets managed by the advisor and each subadvisor. The advisor retains the remaining 50% of the advisory fee received from the Fund. Prior to October 1, 2009, the advisor paid the subadvisors 27.5%, 10.0% and 10.0%, respectively, of the advisory fee received by the advisor from the Fund. For the year ended December 31, 2009, the advisor paid the subadvisors $3,317,357, $978,119 and $978,119, respectively.
Administration Fees: The Fund has entered into an administration agreement with the advisor under which the advisor performs certain administrative functions for the Fund and receives a fee, accrued daily and paid monthly, at the annual rate of 0.06% of the Fund's average daily net assets. For the year ended December 31, 2009, the Fund paid the advisor $705,077 in fees under this administration agreement. Additionally, the Fund pays State Street Bank and Trust Company as sub-administrator under a fund accounting and administration agreement.
Distribution Fees: Shares of the Fund are distributed by Cohen & Steers Securities, LLC (the distributor), an affiliated entity of the advisor. The Fund has adopted a distribution plan (the plan) pursuant to Rule 12b-1 under the Investment Company Act of 1940. The plan provides that the Fund will pay the distributor a fee accrued daily and paid monthly at an annual rate of up to 0.25% of the average daily net assets attributable to the Class A shares and up to 0.75% of the average daily net assets attributable to the Class C shares.
For year ended December 31, 2009, the Fund has been advised that the distributor received $41,297 in sales commissions from the sale of Class A shares and that the distributor also received $208 and $31,220 of contingent
28
COHEN & STEERS INTERNATIONAL REALTY FUND, INC.
NOTES TO FINANCIAL STATEMENTS—(Continued)
deferred sales charges relating to redemptions of Class A and Class C shares, respectively. The distributor has advised the Fund that proceeds from the contingent deferred sales charges on these classes are paid to the distributor and are used by the distributor to defray its expenses related to providing distribution related services to the Fund in connection with the sale of these classes, including payments to dealers and other financial intermediaries for selling these classes and interest and other financing costs associated with these classes.
Shareholder Servicing Fees: For shareholder services, the Fund pays the distributor a fee, accrued daily and paid monthly, at an annual rate of up to 0.10% of the average daily net asset value of the Fund's Class A shares and up to 0.25% of the average daily net asset value of the Fund's Class C shares. The distributor is responsible for paying qualified financial institutions for shareholder services.
Directors' and Officers' Fees: Certain directors and officers of the Fund are also directors, officers, and/or employees of the advisor. The Fund does not pay compensation to any affiliated directors and officers except for the Chief Compliance Officer, who received $23,937 from the Fund for the year ended December 31, 2009.
Note 3. Purchases and Sales of Securities
Purchases and sales of securities, excluding short-term investments, for the year ended December 31, 2009, totaled $2,196,483,616 and $2,307,041,626, respectively.
Note 4. Income Tax Information
The tax character of dividends and distributions paid was as follows:
| | | For the Year Ended
December 31, | |
| | | 2009 | | 2008 | |
| Ordinary income | | $ | 108,463,683 | | | $ | — | | |
| Tax return of capital | | | — | | | | 28,656,441 | | |
| Total dividends and distributions | | $ | 108,463,683 | | | $ | 28,656,441 | | |
As of December 31, 2009, the tax-basis components of accumulated earnings and the federal tax cost were as follows:
| Gross unrealized appreciation | | $ | 123,887,162 | | |
| Gross unrealized depreciation | | | (172,341,916 | ) | |
| Net unrealized depreciation | | $ | (48,454,754 | ) | |
| Undistributed ordinary income | | $ | 18,588,809 | | |
| Cost for federal income tax purposes | | $ | 1,411,658,240 | | |
29
COHEN & STEERS INTERNATIONAL REALTY FUND, INC.
NOTES TO FINANCIAL STATEMENTS—(Continued)
As of December 31, 2009, the Fund had a net capital loss carryforward of $1,416,957,528, of which $844,294,458 will expire on December 31, 2016 and $572,663,070 will expire on December 31, 2017. This carryforward may be used to offset future capital gains to the extent provided by regulations. Included in the net capital loss carryforward is $1,587,467 of capital loss carryforwards that were acquired from the Fund's merger with Cohen & Steers European Realty Shares, Inc. ("EUR") (See Note 8). Federal tax rules limit the Fund's use of these capital loss carryforwards. It is possible that all or a portion of these losses will not be able to be utilized prior to their expiration. During the year ended December 31, 2009, the Fund forfeited $7,622,839 of capital loss carryforwards acquired from EUR. In addition, the Fund incurred capital losses of $2,697,220 after October 31, 2009, which are not recognized for tax purposes until the following fiscal year.
As of December 31, 2009, the Fund had temporary book/tax differences primarily attributable to wash sales on portfolio securities and passive foreign investment companies and permanent book/tax differences primarily attributable to passive foreign investment companies, merger related items and net realized gain on an in kind redemption. To reflect reclassifications arising from the permanent differences, paid-in capital was credited $2,750,685, accumulated net realized loss was charged $53,515,776 and dividends in excess of net investment income was credited $50,765,091. Net assets were not affected by this reclassification.
Note 5. Capital Stock
The Fund is authorized to issue 800 million shares of capital stock, at a par value of $0.001 per share. The Board of Directors of the Fund may increase or decrease the aggregate number of shares of common stock that the Fund has authority to issue. Transactions in Fund shares were as follows:
| | | For the
Year Ended
December 31, 2009 | | For the
Year Ended
December 31, 2008 | |
| | | Shares | | Amount | | Shares | | Amount | |
| CLASS A: | |
| Sold | | | 12,257,141 | | | $ | 118,651,505 | | | | 17,743,823 | | | $ | 237,347,108 | | |
Acquisition of Cohen & Steers
European Realty Shares | | | 124,283 | | | | 1,418,073 | | | | — | | | | — | | |
Issued as reinvestment of
dividends and distributions | | | 2,181,085 | | | | 22,108,069 | | | | 535,897 | | | | 7,167,857 | | |
| Redeemed | | | (18,481,114 | ) | | | (160,550,679 | ) | | | (65,187,025 | ) | | | (802,165,573 | ) | |
Redemption fees retained by
the Funda | | | — | | | | 25,845 | | | | — | | | | 135,827 | | |
| Net decrease | | | (3,918,605 | ) | | $ | (18,347,187 | ) | | | (46,907,305 | ) | | $ | (557,514,781 | ) | |
30
COHEN & STEERS INTERNATIONAL REALTY FUND, INC.
NOTES TO FINANCIAL STATEMENTS—(Continued)
| | | For the
Year Ended
December 31, 2009 | | For the
Year Ended
December 31, 2008 | |
| | | Shares | | Amount | | Shares | | Amount | |
| CLASS C: | |
| Sold | | | 2,001,326 | | | $ | 20,406,072 | | | | 3,986,172 | | | $ | 56,909,051 | | |
Acquisition of Cohen & Steers
European Realty Shares | | | 96,615 | | | | 1,094,640 | | | | — | | | | — | | |
Issued as reinvestment of
dividends and distributions | | | 1,103,133 | | | | 11,139,977 | | | | 169,946 | | | | 2,267,105 | | |
| Redeemed | | | (12,351,086 | ) | | | (103,038,920 | ) | | | (37,212,448 | ) | | | (458,585,393 | ) | |
Redemption fees retained by
the Funda | | | — | | | | 17,901 | | | | — | | | | 88,069 | | |
| Net decrease | | | (9,150,012 | ) | | $ | (70,380,330 | ) | | | (33,056,330 | ) | | $ | (399,321,168 | ) | |
| CLASS I: | |
| Sold | | | 20,986,629 | | | $ | 204,333,113 | | | | 33,312,670 | | | $ | 432,935,881 | | |
Acquisition of Cohen & Steers
European Realty Shares | | | 205,360 | | | | 2,351,368 | | | | — | | | | — | | |
Issued as reinvestment of
dividends and distributions | | | 4,845,522 | | | | 49,244,968 | | | | 839,174 | | | | 11,253,327 | | |
| Redeemed | | | (20,477,410 | ) | | | (177,044,004 | ) | | | (41,664,901 | ) | | | (468,616,279 | ) | |
| Redeemed in kindb | | | (2,828,928 | ) | | | (31,966,883 | ) | | | — | | | | — | | |
Redemption fees retained by
the Funda | | | — | | | | 40,614 | | | | — | | | | 130,251 | | |
| Net increase(decrease) | | | 2,731,173 | | | $ | 46,959,176 | | | | (7,513,057 | ) | | $ | (24,296,820 | ) | |
a The Fund may charge a 2% redemption fee on shares sold within 60 days of the time of purchase. Redemption fees are paid directly to the Fund.
b Certain shareholders of the Fund were permitted to redeem shares in-kind. As a result, the Fund realized a net gain of $8,255,646 for financial reporting purposes.
Note 6. Borrowings
The Fund, in conjunction with other Cohen & Steers open-end funds, is a party to a $200,000,000 syndicated credit agreement (the credit agreement) with State Street Bank and Trust Company, as administrative agent and operations agent, and the lenders identified in the credit agreement, which expires January 29, 2010. (The credit
31
COHEN & STEERS INTERNATIONAL REALTY FUND, INC.
NOTES TO FINANCIAL STATEMENTS—(Continued)
agreement was subsequently renewed under similar terms and expires January 28, 2011). The Fund pays a commitment fee of 0.15% per annum on its proportionate share of the unused portion of the credit agreement.
During the year ended December 31, 2009, the Fund did not borrow under the credit agreement.
Note 7. Other
In the normal course of business, the Fund enters into contracts that provide general indemnifications. The Fund's maximum exposure under these arrangements is dependent on claims that may be made against the Fund in the future and, therefore, cannot be estimated; however, based on experience, the risk of material loss from such claims is considered remote.
Note 8. Merger
On June 9, 2009, the Board of Directors of both the Fund and EUR, also an open end investment company, approved a proposal for the Fund to acquire EUR. The purpose of the transaction was to combine two funds managed by the advisor with comparable investment objectives and strategies, and the investment portfolio of EUR was the principal asset acquired by the Fund. The Fund acquired all the net assets of EUR based on the respective valuations as of the close of business on September 18, 2009. The acquisition was accomplished by a tax-free exchange of 260,464 Class A shares worth $1,418,072; 201,846 Class C shares worth $1,094,640 and 431,168 Class I shares worth $2,351,368 of EUR for 124,283 Class A shares, 96,615 Class C shares and 205,360 Class I shares of the Fund. The net assets of EUR and the Fund immediately before the acquisition were $4,864,080 (including $813,505 of net unrealized appreciation) and $1,415,001,697, respectively. The c ombined net assets of the Fund immediately following the acquisition were $1,419,865,778. For financial reporting purposes, assets received and shares issued by the Fund were recorded at fair value; however the cost basis of the investments received from EUR was carried forward to align ongoing reporting of the Fund's realized and unrealized gains and losses with amounts distributable to shareholders for tax purposes.
Assuming the acquisition had been completed on January 1, 2009, the Fund's pro-forma results of operations for the year ended December 31, 2009, are as follows:
| Net investment income | | $ | 22,796,354 | | |
| Net realized and unrealized gain | | | 308,029,554 | | |
| Net increase in net assets resulting from operations | | $ | 330,825,908 | | |
Because the combined investment portfolios have been managed as a single integrated portfolio since the acquisition was completed, it is not practicable to separate the amounts of changes in net assets attributable to EUR that have been included in the Fund's statement of operations.
32
COHEN & STEERS INTERNATIONAL REALTY FUND, INC.
NOTES TO FINANCIAL STATEMENTS—(Continued)
Note 9. Subsequent Events
Events and transactions occurring after December 31, 2009 and through the date that the financial statements were issued, February 16, 2010, have been evaluated in the preparation of the financial statements.
33
COHEN & STEERS INTERNATIONAL REALTY FUND, INC.
REPORT OF INDEPENDENT REGISTERED PUBLIC ACCOUNTING FIRM
To the Board of Directors and Shareholders of
Cohen & Steers International Realty Fund, Inc.
In our opinion, the accompanying statement of assets and liabilities, including the schedule of investments, and the related statements of operations and of changes in net assets and the financial highlights present fairly, in all material respects, the financial position of Cohen & Steers International Realty Fund, Inc. (the "Fund") at December 31, 2009, the results of its operations for the year then ended, the changes in its net assets for each of the two years in the period then ended and the financial highlights for each of the periods presented, in conformity with accounting principles generally accepted in the United States of America. These financial statements and financial highlights (hereafter referred to as "financial statements") are the responsibility of the Fund's management. Our responsibility is to express an opinion on these financial statements based on our audits. We conducted our audits of these financial statements in accordance with the standards of the Public Company Accounting Oversight Board (United States). Those standards require that we plan and perform the audit to obtain reasonable assurance about whether the financial statements are free of material misstatement. An audit includes examining, on a test basis, evidence supporting the amounts and disclosures in the financial statements, assessing the accounting principles used and significant estimates made by management, and evaluating the overall financial statement presentation. We believe that our audits, which included confirmation of securities at December 31, 2009 by correspondence with the custodian and brokers, provide a reasonable basis for our opinion.
PricewaterhouseCoopers LLP
New York, New York
February 16, 2010
34
COHEN & STEERS INTERNATIONAL REALTY FUND, INC.
TAX INFORMATION—2009 (Unaudited)
Pursuant to the Jobs and Growth Relief Reconciliation Act of 2003, the Fund designates qualified dividend income of $13,893,763.
The Fund has elected, pursuant to section 853 of the Internal Revenue Code, to pass through foreign taxes of $4,240,661. The Fund generated net foreign source income of $44,756,325 with respect to this election.
OTHER INFORMATION
A description of the policies and procedures that the Fund uses to determine how to vote proxies relating to portfolio securities is available (i) without charge, upon request, by calling 800-330-7348, (ii) on our Web site at cohenandsteers.com or (iii) on the Securities and Exchange Commission's Web site at http://www.sec.gov. In addition, the Fund's proxy voting record for the most recent 12-month period ended June 30 is available (i) without charge, upon request, by calling 800-330-7348 or (ii) on the SEC's Web site at http://www.sec.gov.
The Fund files its complete schedule of portfolio holdings with the SEC for the first and third quarters of each fiscal year on Form N-Q. The Fund's Forms N-Q are available (i) without charge, upon request by calling 800-330-7348, or (ii) on the SEC's Web site at http://www.sec.gov. In addition, the Forms N-Q may be reviewed and copied at the SEC's Public Reference Room in Washington, DC. Information on the operation of the Public Reference Room may be obtained by calling 800-SEC-0330.
Please note that the distributions paid by the Fund to shareholders are subject to recharacterization for tax purposes. The Fund may also pay distributions in excess of the Fund's net investment company taxable income and this excess would be a tax-free return of capital distributed from the Fund's assets. The final tax treatment of all distributions is reported to shareholders on their 1099-DIV forms, which are mailed after the close of each calendar year.
35
COHEN & STEERS INTERNATIONAL REALTY FUND, INC.
MANAGEMENT OF THE FUND
The business and affairs of the Fund are managed under the direction of the Board of Directors. The Board of Directors approves all significant agreements between the Fund and persons or companies furnishing services to it, including the Fund's agreements with its advisor, administrator, sub-administrator, custodian and transfer agent. The management of the Fund's day-to-day operations is delegated to its officers, the advisor, administrator and sub-administrator, subject always to the investment objective and policies of the Fund and to the general supervision of the Board of Directors.
The Board of Directors and officers of the Fund and their principal occupations during at least the past five years are set forth below. The statement of additional information (SAI) includes additional information about Fund directors and is available, without charge, upon request by calling 800-330-7348.
| Name, Address1 and Age | | Position(s) Held
with Fund | | Term of
Office2 | | Principal Occupation
During At Least
The Past 5 Years
(Including Other
Directorships Held) | | Number of
Funds Within
Fund
Complex
Overseen by
Director
(Including
the Fund) | | Length
of Time
Served3 | |
| Interested Directors4 | |
|
| Robert H. Steers Age: 56 | | Director and Co-Chairman | | Until next election of directors | | Co-Chairman and Co-Chief Executive Officer of Cohen & Steers Capital Management, Inc. (the Advisor) since 2003 and its parent, Cohen & Steers, Inc. since 2004. Vice President of Cohen & Steers Securities, LLC, the Fund's Distributor. | | | 18 | | | | 1991 | to present | |
|
| Martin Cohen Age: 61 | | Director and Co-Chairman | | Until next election of directors | | Co-Chairman and Co-Chief Executive Officer of the Advisor since 2003 and Cohen & Steers, Inc. since 2004. Prior to that, President of the Advisor; Vice President of the Distributor. | | | 18 | | | | 1991 | to present | |
|
(table continued on next page)
36
COHEN & STEERS INTERNATIONAL REALTY FUND, INC.
(table continued from previous page)
| Name, Address1 and Age | | Position(s) Held
with Fund | | Term of
Office2 | | Principal Occupation
During At Least
The Past 5 Years
(Including Other
Directorships Held) | | Number of
Funds Within
Fund
Complex
Overseen by
Director
(Including
the Fund) | | Length
of Time
Served3 | |
| Disinterested Directors | |
|
| Bonnie Cohen5 Age: 67 | | Director | | Until next election of directors | | Consultant. Board Member United States Department of Defense Business Board; Vice-chair Global Heritage Fund; Chair of the Advisory Committee, The Posse Foundation, DC; Finance Chair, District of Columbia Public Libraries. Government service: former Undersecretary of State for Management, US Department of State; previously Assistant Secretary of Interior for Policy Management and Budget, US Department of Interior. Private employment includes Senior Vice President National Trust for Historic Preservation, Treasurer UMWA Health and Retirement Funds. | | | 18 | | | | 2001 | to present | |
|
| George Grossman Age: 56 | | Director | | Until next election of directors | | Attorney-at-law | | | 18 | | | | 1993 | to present | |
|
| Richard E. Kroon Age: 67 | | Director | | Until next election of directors | | Member of Investment Committee, Monmouth University. Retired Chairman and Managing Partner of Sprout Group venture capital funds, then an affiliate of Donaldson, Lufkin and Jenrette Securities Corporation; and former chairman of the National Venture Capital Association. | | | 18 | | | | 2004 | to present | |
|
(table continued on next page)
37
COHEN & STEERS INTERNATIONAL REALTY FUND, INC.
(table continued from previous page)
| Name, Address1 and Age | | Position(s) Held
with Fund | | Term of
Office2 | | Principal Occupation
During At Least
The Past 5 Years
(Including Other
Directorships Held) | | Number of
Funds Within
Fund
Complex
Overseen by
Director
(Including
the Fund) | | Length
of Time
Served3 | |
| Richard J. Norman Age: 66 | | Director | | Until next election of directors | | Private Investor. Advisory Board Member of the Salvation Army, Member: DC Dept. of Corrections Chaplain's Corps. Prior thereto, Investment Representative of Morgan Stanley Dean Witter. | | | 18 | | | | 2001 | to present | |
|
| Frank K. Ross Age: 66 | | Director | | Until next election of directors | | Professor of Accounting, Howard University. Board member of Pepco Holdings, Inc. (electric utility). Formerly, Midatlantic Area Managing Partner for Audit and Risk Advisory Services at KPMG LLP and Managing Partner of its Washington DC office. | | | 18 | | | | 2004 | to present | |
|
| Willard H. Smith Jr. Age: 73 | | Director | | Until next election of directors | | Board member of Essex Property Trust Inc. Managing Director at Merrill Lynch & Co., Equity Capital Markets Division from 1983 to 1995. | | | 18 | | | | 1996 | to present | |
|
| C. Edward Ward Jr. Age: 63 | | Director | | Until next election of directors | | Member of the Board of Trustees of Directors Manhattan College, Riverdale, New York. Formerly head of closed-end fund listings for the New York Stock Exchange. | | | 18 | | | | 2004 | to present | |
|
1 The address for each director is 280 Park Avenue, New York, NY 10017.
2 On March 12, 2008, the Board of Directors adopted a mandatory retirement policy stating a Director must retire from the Board on December 31st of the year in which he or she turns 75 years of age.
3 The length of time served represents the year in which the director was first elected or appointed to any fund in the Cohen & Steers fund complex.
4 "Interested person", as defined in the 1940 Act, of the fund because of affiliation with the advisor (Interested Directors).
5 Martin Cohen and Bonnie Cohen are not related.
38
COHEN & STEERS INTERNATIONAL REALTY FUND, INC.
The officers of the fund (other than Messrs. Cohen and Steers, whose biographies are provided above), their address, their ages and their principal occupations for at least the past five years are set forth below.
| Name, Address and Age1 | | Position(s) Held
with Fund | | Principal Occupation During At Least The Past 5 Years | | Length
of Time
Served2 | |
| Adam M. Derechin Age: 45 | | President and Chief Executive Officer | | Chief Operating Officer of CSCM (since 2003) and CNS (since 2004). Prior to that, Senior Vice President of CSCM and Vice President and Assistant Treasurer of the Cohen & Steers funds. | | Since 2005 | |
|
| Joseph M. Harvey Age: 46 | | Vice President | | President and Chief Investment Officer of CSCM (since 2003) and President of CNS (since 2004). Prior to that, Senior Vice President and Director of Investment Research of CSCM. | | Since 2004 | |
|
| Scott Crowe Age: 32 | | Vice President | | Senior Vice President and Global Research Strategist of the Advisor since 2007. Prior thereto, Executive Director at UBS and head of U.S. REITs and a global strategist. He also worked at UBS Warburg as a real estate analyst. | | Since 2008 | |
|
| Francis C. Poli Age: 47 | | Secretary | | Executive Vice President, Secretary and General Counsel of CSCM and CNS since March 2007. Prior thereto, General Counsel of Allianz Global Investors of America LP. | | Since 2007 | |
|
| James Giallanza Age: 43 | | Treasurer and Chief Financial Officer | | Senior Vice President of CSCM since September 2006. Prior thereto, Deputy Head of the US Funds Administration and Treasurer & CFO of various mutual funds within the Legg Mason (formally Citigroup Asset Management) fund complex from August 2004 to September 2006; Director/Controller of the US wholesale business at UBS Global Asset Management (U.S.) from September 2001 to July 2004. | | Since 2006 | |
|
| Lisa D. Phelan Age: 41 | | Chief Compliance Officer | | Senior Vice President and Director of Compliance of CSCM since 2007 and prior to that, Vice President since 2006. Chief Compliance Officer of CSSL since 2004. Prior to that, Compliance Officer of CSCM since 2004. Chief Compliance Officer, Avatar Associates & Overture Asset Managers, 2003-2004. | | Since 2006 | |
|
1 The address of each officer is 280 Park Avenue, New York, NY 10017.
2 Officers serve one-year terms. The length of time served represents the year in which the officer was first elected to that position in any fund in the Cohen & Steers fund complex. All of the officers listed above are officers of one or more of the other funds in the complex.
39
COHEN & STEERS INTERNATIONAL REALTY FUND, INC.
Meet the Cohen & Steers family of open-end funds:
COHEN & STEERS
GLOBAL REALTY SHARES
• Designed for investors seeking total return, investing primarily in global real estate equity securities
• Symbols: CSFAX, CSFBX, CSFCX, CSSPX
COHEN & STEERS
INSTITUTIONAL GLOBAL REALTY SHARES
• Designed for institutional investors seeking total return, investing primarily in global real estate securities
• Symbol: GRSIX
COHEN & STEERS
REALTY SHARES
• Designed for investors seeking total return, investing primarily in REITs
• Symbol: CSRSX
COHEN & STEERS
INSTITUTIONAL REALTY SHARES
• Designed for institutional investors seeking total return, investing primarily in REITs
• Symbol: CSRIX
COHEN & STEERS
REALTY INCOME FUND
• Designed for investors seeking maximum total return, investing primarily in real estate securities with an emphasis on both income and capital appreciation
• Symbols: CSEIX, CSBIX, CSCIX, CSDIX
COHEN & STEERS
INTERNATIONAL REALTY FUND
• Designed for investors seeking total return, investing primarily in international real estate securities
• Symbols: IRFAX, IRFCX, IRFIX
COHEN & STEERS
ASIA PACIFIC REALTY SHARES
• Designed for investors seeking total return, investing primarily in real estate securities located in the Asia Pacific region
• Symbols: APFAX, APFCX, APFIX
COHEN & STEERS
GLOBAL INFRASTRUCTURE FUND
• Designed for investors seeking total return, investing primarily in global infrastructure securities
• Symbols: CSUAX, CSUBX, CSUCX, CSUIX
COHEN & STEERS
DIVIDEND VALUE FUND
• Designed for investors seeking high current income and long-term growth of income and capital appreciation, investing primarily in dividend paying common stocks and preferred stocks
• Symbols: DVFAX, DVFCX, DVFIX
Please consider the investment objectives, risks, charges and expenses of the fund carefully before investing. A prospectus containing this and other information can be obtained by calling 800-330-7348 or by visiting cohenandsteers.com. Please read the prospectus carefully before investing.
Cohen & Steers Securities, LLC, Distributor
40
COHEN & STEERS INTERNATIONAL REALTY FUND, INC.
OFFICERS AND DIRECTORS
Robert H. Steers
Director and co-chairman
Martin Cohen
Director and co-chairman
Bonnie Cohen
Director
George Grossman
Director
Richard E. Kroon
Director
Richard J. Norman
Director
Frank K. Ross
Director
Willard H. Smith Jr.
Director
C. Edward Ward, Jr.
Director
Adam M. Derechin
President and chief executive officer
Joseph M. Harvey
Vice president
Scott Crowe
Vice president
Francis C. Poli
Secretary
James Giallanza
Treasurer and chief financial officer
Lisa D. Phelan
Chief compliance officer
KEY INFORMATION
Investment Advisor
Cohen & Steers Capital Management, Inc.
280 Park Avenue
New York, NY 10017
(212) 832-3232
Fund Subadministrator and Custodian
State Street Bank and Trust Company
One Lincoln Street
Boston, MA 02111
Transfer Agent
Boston Financial Data Services, Inc.
30 Dan Road
Canton, MA 02021
(800) 437-9912
Legal Counsel
Stroock & Stroock & Lavan LLP
180 Maiden Lane
New York, NY 10038
Distributor
Cohen & Steers Securities, LLC
280 Park Avenue
New York, NY 10017
Nasdaq Symbol: Class A—IRFAX
C—IRFCX
I— IRFIX
Web site: cohenandsteers.com
This report is authorized for delivery only to shareholders of Cohen & Steers International Realty Fund, Inc. unless accompanied or preceded by the delivery of a currently effective prospectus setting forth details of the Fund. Past performance is of course no guarantee of future results and your investment may be worth more or less at the time you sell.
41

eDelivery NOW AVAILABLE
Stop traditional mail delivery; receive your shareholder reports and prospectus online.
Sign up at cohenandsteers.com
COHEN & STEERS
INTERNATIONAL REALTY FUND
280 PARK AVENUE
NEW YORK, NY 10017
ANNUAL REPORT
DECEMBER 31, 2009
IRFAXAR
Item 2. Code of Ethics.
On October 1, 2009, the registrant has adopted an Amended and Restated Code of Ethics that applies to its Principal Executive Officer and Principal Financial Officer. The material changes to the Code of Ethics that apply to the registrant’s principal executive officer, principal financial officer, principal accounting officer or controller, or persons performing similar functions were (i) a shortened preclearance window, (ii) the implementation of a 30-day holding period to sell securities at a profit, (iii) limitations on the frequency of trading, and (iv) a preclearance requirement for exchange traded funds. The registrant undertakes to provide to any person without charge, upon request, a copy of the Code of Ethics. Such request can be made by calling 800-330-7348 or writing to the Secretary of the registrant, 280 Park Avenue, New York, NY 10017.
Item 3. Audit Committee Financial Expert.
The registrant’s board has determined that Frank K. Ross, a member of the board’s audit committee, is an “audit committee financial expert”. Mr. Ross is “independent,” as such term is defined in Form N-CSR.
Item 4. Principal Accountant Fees and Services.
(a) – (d) Aggregate fees billed to the registrant for the last two fiscal years for professional services rendered by the registrant’s principal accountant were as follows:
| | 2009 | | 2008 | |
Audit Fees | | $ | 52,500 | | $ | 52,500 | |
Audit-Related Fees | | 0 | | 0 | |
Tax Fees | | 6,250 | | 21,635 | |
All Other Fees | | — | | — | |
| | | | | | | |
Tax fees were billed in connection with the preparation of tax returns, calculation and designation of dividends and other miscellaneous tax services.
Aggregate fees billed by the registrant’s principal accountant for the last two fiscal years for non-audit services provided to the registrant’s investment advisor (not including any sub-advisor whose role is primarily portfolio management and is subcontracted or overseen by another investment advisor) and any entity controlling, controlled by, or under common control with the investment advisor that provides ongoing services to the registered investment company, where the engagement relates directly to the operations and financial reporting of the registrant, were as follows:
| | 2009 | | 2008 | |
Audit-Related Fees | | — | | — | |
Tax Fees | | — | | — | |
All Other Fees | | — | | $ | 110,000 | |
| | | | | | |
These other fees were billed in connection with internal control reviews.
(e)(1) The audit committee is required to pre-approve audit and non-audit services performed for the registrant by the principal accountant. The audit committee also is required to pre-approve non-audit services performed by the registrant’s principal accountant for the registrant’s investment advisor and any sub-advisor (not including any sub-advisor whose role is primarily portfolio management and is subcontracted with or overseen by another investment advisor) and/or to any entity controlling, controlled by or under common control with the registrant’s investment advisor that provides ongoing services to the registrant, if the engagement for services relates directly to the operations and financial reporting of the registrant.
The audit committee may delegate pre-approval authority to one or more of its members who are independent members of the board of directors of the registrant. The member or members to whom such authority is delegated shall report any pre-approval decisions to the audit committee at its next scheduled meeting. The audit committee may not delegate its responsibility to pre-approve services to be performed by the registrant’s principal accountant to the investment advisor.
(e) (2) No services included in (b) – (d) above were approved by the audit committee pursuant to paragraphs (c)(7)(i)(C) of Rule 2-01 of Regulation S-X.
(f) Not applicable.
(g) For the fiscal years ended December 31, 2009 and December 31, 2008, the aggregate fees billed by the registrant’s principal accountant for non-audit services rendered to the registrant and for non-audit services rendered to the registrant’s investment advisor (not including any sub-advisor whose role is primarily portfolio management and is subcontracted with or overseen by another investment advisor) and/or to any entity controlling, controlled by or under common control with the registrant’s investment advisor that provides ongoing services to the registrant were $6,250 and $131,635, respectively.
(h) The registrant’s audit committee considered whether the provision of non-audit services that were rendered to the registrant’s investment advisor (not including any sub-advisor whose role is primarily portfolio management and is subcontracted with or overseen by another investment advisor) and/or to any entity controlling, controlled by or under common control with the registrant’s investment advisor that provides ongoing services to the registrant that were not required to be pre-approved pursuant to paragraph (c)(7)(ii) of Rule 2-01 of Regulation S-X was compatible with maintaining the principal accountant’s independence.
Item 5. Audit Committee of Listed Registrants.
Not applicable.
Item 6. Schedule of Investments.
Included in Item 1 above.
Item 7. Disclosure of Proxy Voting Policies and Procedures for Closed-End Management Investment Companies.
Not applicable.
Item 8. Portfolio Managers of Closed-End Investment Companies.
Not applicable.
Item 9. Purchases of Equity Securities by Closed-End Management Investment Company and Affiliated Purchasers.
Not applicable.
Item 10. Submission of Matters to a Vote of Security Holders.
Not applicable.
Item 11. Controls and Procedures.
(a) The registrant’s principal executive officer and principal financial officer have concluded that the registrant’s disclosure controls and procedures are reasonably designed to ensure that information required to be disclosed by the registrant in this Form N-CSR was recorded, processed, summarized and reported within the time periods specified in the Securities and Exchange Commission’s rules and forms, based upon such officers’ evaluation of these controls and procedures as of a date within 90 days of the filing date of this report.
(b) There were no changes in the registrant’s internal control over financial reporting that occurred during the second fiscal quarter of the period covered by this report that have materially affected, or are reasonably likely to materially affect, the registrant’s internal control over financial reporting.
Item 12. Exhibits.
(a)(1) Amended and Restated Code of Ethics.
(a) (2) Certifications of principal executive officer and principal financial officer as required by Rule 30a-2(a) under the Investment Company Act of 1940.
(b) Certifications of chief executive officer and chief financial officer as required by Rule 30a- 2(b) under the Investment Company Act of 1940.
SIGNATURES
Pursuant to the requirements of the Securities Exchange Act of 1934 and the Investment Company Act of 1940, the registrant has duly caused this report to be signed on its behalf by the undersigned, thereunto duly authorized.
COHEN & STEERS INTERNATIONAL REALTY FUND, INC. |
|
|
| By: | /s/ Adam M. Derechin | |
| | Name: Adam M. Derechin |
| | Title: President and Chief Executive Officer |
| | |
| Date: March 1, 2010 |
Pursuant to the requirements of the Securities Exchange Act of 1934 and the Investment Company Act of 1940, this report has been signed below by the following persons on behalf of the registrant and in the capacities and on the dates indicated.
| By: | /s/ Adam M. Derechin | |
| | Name: | Adam M. Derechin |
| | Title: | President and Chief Executive Officer |
| | | (principal executive officer) |
| | | |
| By: | /s/ James Giallanza | |
| | Name: | James Giallanza |
| | Title: | Treasurer |
| | | (principal financial officer) |
| | | |
| | | |
| Date: March 1, 2010 |
| | | | |