UNITED STATES
SECURITIES AND EXCHANGE COMMISSION
Washington, D.C. 20549
FORM N-CSR
CERTIFIED SHAREHOLDER REPORT OF REGISTERED
MANAGEMENT INVESTMENT COMPANIES
Investment Company Act file number | 811-21677 |
|
Cohen & Steers International Realty Fund, Inc. |
(Exact name of registrant as specified in charter) |
|
280 Park Avenue, New York, NY | | 10017 |
(Address of principal executive offices) | | (Zip code) |
|
Adam M. Derechin
Cohen & Steers Capital Management, Inc.
280 Park Avenue
New York, New York 10017 |
(Name and address of agent for service) |
|
Registrant’s telephone number, including area code: | (212) 832-3232 | |
|
Date of fiscal year end: | December 31 | |
|
Date of reporting period: | June 30, 2011 | |
| | | | | | | | |
Item 1. Reports to Stockholders.
COHEN & STEERS INTERNATIONAL REALTY FUND, INC.
To Our Shareholders:
We would like to share with you our report for the six months ended June 30, 2011. The net asset values (NAV) per share at that date were $11.14, $11.03 and $11.20 for Class A, Class C and Class I shares, respectively.
The total returns, including income and change in NAV, for the Fund and its comparative benchmarks were:
| | | Six Months Ended
June 30, 2011 | |
| Cohen & Steers International Realty Fund—Class A | | | 1.78 | % | |
| Cohen & Steers International Realty Fund—Class C | | | 1.53 | % | |
| Cohen & Steers International Realty Fund—Class I | | | 1.95 | % | |
| FTSE EPRA/NAREIT Developed Ex-U.S. Real Estate Index—Neta | | | 3.09 | % | |
| S&P 500 Indexa | | | 6.02 | % | |
The performance data quoted represent past performance. Past performance is no guarantee of future results. The investment return and the principal value of an investment will fluctuate and shares, if redeemed, may be worth more or less than their original cost. Current performance may be lower or higher than the performance data quoted. Current total returns of the Fund can be obtained by visiting our Web site at cohenandsteers.com. Performance quoted does not reflect the deduction of the maximum 4.5% initial sales charge on Class A shares or the 1% maximum contingent deferred sales charge on Class C shares. If such charges were included, returns would have been lower.
The Fund implements fair value pricing when the daily change in a specific U.S. market index exceeds a predetermined percentage. Fair value pricing adjusts the valuation of non-U.S. holdings to account for such index change following the close of foreign markets. This standard practice has been adopted by a majority of the fund industry to deter investors from arbitraging funds with a large percentage of non-U.S. holdings. In the event fair value pricing is implemented on the first and/or last day of a performance measurement period, the Fund's return may diverge from the relative performance of its benchmark index, which does not use fair value pricing. An investor cannot invest directly in an index.
Please note that distributions paid by the Fund to shareholders are subject to recharacterization for tax purposes and are taxable up to the amount of the Fund's investment company taxable income and net realized gains. Distributions in excess of the Fund's investment company taxable income and realized gains are a return of capital distributed from the Fund's assets.
a The FTSE EPRA/NAREIT Developed Ex-U.S. Real Estate Index is an unmanaged portfolio of approximately 182 constituents from 20 countries and is net of dividend withholding taxes. The S&P 500 Index is an unmanaged index of common stocks that is frequently used as a general measure of stock market performance.
1
COHEN & STEERS INTERNATIONAL REALTY FUND, INC.
Investment Review
International real estate securities achieved positive returns in the six months ended June 30, 2011. Europe generally benefited from continued improvement in real estate fundamentals, low capital costs and rising property values, while Asia Pacific struggled with natural disaster and policy tightening.
Real estate securities, along with financial markets in general, faced frequent volatility resulting from rising uncertainty about the global recovery. Stocks came under pressure in March following the earthquake in Japan, and then again in June amid renewed fears of a Greek default and disappointing U.S. economic reports. The period ended on a positive note following news of passage of an austerity plan by Greece's parliament and encouraging U.S. manufacturing data.
Europe gained despite sovereign concerns
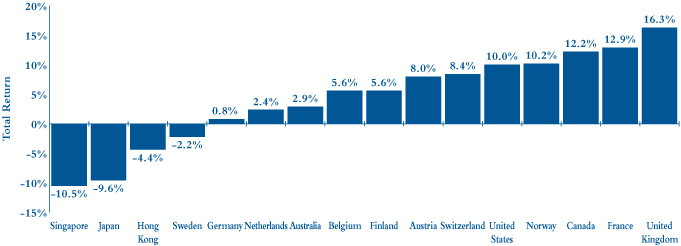
The U.K. (+16.3% total returnb) had exceptional returns in the period, benefiting from strong rental growth in London and a development cycle that stands to benefit from accelerating demand. The macro environment was also supportive, with interest rates expected to continue running below inflation in the near term.
On the continent, investors were primarily focused on Greece's growing budget crisis. Fears of contagion weighed on companies with exposure to southern Europe, although this was somewhat mollified in late June as the market became hopeful that an agreement would be reached on a new financial assistance package. Northern economies remained in substantially better shape, although inflation was an increasing concern.
France (+12.9%) had generally robust performance across the board, benefiting from falling cap rates for many prime assets in northern Europe. The French retail sector also got a boost from signs that indexation would turn positive in 2012. Switzerland (+8.4%), Austria (+8.0%) and Finland (+5.6%) also did well, while the Netherlands (+2.4%) and Sweden (–2.2%) trailed.
Germany (+0.8%) had mostly strong returns except for Gagfah, whose shares declined sharply amid litigation with the City of Dresden. Berlin released its two-year residential Mietspiegel (rent index) at a higher-than-expected increase of 7.9% over 2009 levels, implying strong rental growth in what has been a supply-constrained market.
Asia Pacific roiled by natural disaster and policy tightening
In Hong Kong (–4.4%), developers declined as rising inflation and growing public discontent about housing affordability resulted in higher policy risk for curbing the residential market. Developers with exposure to China suffered to a greater degree, as policy tightening was even more stringent on the mainland. At the same time, the country's low unemployment and strong economic growth, combined with low commercial supply, helped landlords perform relatively better, especially those with portfolios that were perceived to be more defensive.
b Country returns are in local currencies as measured by the FTSE EPRA/NAREIT Developed Real Estate Index.
2
COHEN & STEERS INTERNATIONAL REALTY FUND, INC.
Japan (–9.6%) appeared to be on a recovery path until the March 9 earthquake, which inflected heavy damage in the northern region, but left Tokyo relatively unscathed. REITs outperformed early on, as investors flocked to the relative security of long-term leases in a high-risk environment. REITs were also beneficiaries of the Bank of Japan's asset-purchase program as part of the government's efforts to lower risk premiums. Developers declined sharply immediately following the quake, but outperformed in the second quarter, boosted by unexpected resilience in residential demand.
Australia (+2.9%) was a bright spot in the region, benefiting from the central bank's decision not to raise interest rates, despite rising inflation pressures. The decision was made possible by reduced economic activity resulting from the Queensland floods, as well as a strong Australian dollar and subdued consumer spending.
Singapore (–10.5%), similar to Hong Kong, was weighed down by the performance of developers, which saw heavy losses amid heightened inflation and policy tightening. Historic gains by the opposition party in the May election brought expectations of more tightening measures and an increased focus on low- and middle-income housing affordability. S-REITs did substantially better, benefiting from strong economic growth, low unemployment and rising retail spending. The country also executed a land swap with Malaysia, opening the area surrounding Marina Bay for development, including significant new office supply.
Strong returns from Canada
Canada (+12.2%) benefited from a positive macro environment, including low interest rates and a robust job market. The Calgary office and residential markets saw notable improvement amid an influx of capital to the oil-rich Alberta region. Also, Conservatives unexpectedly won a majority of seats in the May elections, giving them greater power to pass new tax cuts for businesses.
A Solid First Half for Non-Asia Real Estate Securities
Total return (%) by country, January 1-June 30, 2011
3
COHEN & STEERS INTERNATIONAL REALTY FUND, INC.
Fund performance
The Fund had a positive return for the period, but underperformed its benchmark. Stock selection in Australia weighed on relative returns due in part to our allocation to residential developers that declined in anticipation of falling house prices. Stock selection in Hong Kong and Canada also detracted from returns. Our underweight in Switzerland was a negative factor due to relative performance of individual companies and substantial appreciation in the Swiss franc. Our out-of-index allocations to Russia and Brazil underperformed during the period.
Stock selection in Germany contributed positively to relative returns, due mostly to strong performance by Deutsche Wohnen. The Fund also benefited from our underweight in Japan early in the period, shifting to an overweight following the events in March, as we viewed the selloff as offering attractive entry points in companies with solid long-term growth prospects. Other contributors included our overweights in the U.K., Norway and Finland.
Investment Outlook
Fiscal challenges likely to weigh on Europe
While economic growth for the U.K. remains below potential, we believe property companies with heavy concentration in higher-growth London will continue to benefit from gains in employment and discretionary spending, particularly for prime assets. Office space in the West End remains in strong demand, and we're seeing greater competition among retailers for premium storefronts at the best malls.
The economic divide between northern and southern Europe will likely remain a meaningful factor for many years, as austerity measures in fiscally stressed countries stifle demand. Moreover, rising inflation may accelerate the European Central Bank's next rate hike, further complicating the efforts of these countries to close their budget gaps. We continue to favor companies with significant exposure to high-growth economies, such as Germany, Sweden and Finland.
We retain our favorable outlook for the Paris office and residential markets, while Germany's thriving manufacturing sector and employment levels should continue to drive strong demand for office, retail and housing. In the Netherlands, we continue to see opportunities in smaller-city offices, which offer historically high yield spreads.
Asia Pacific fundamentals are strong, but inflation remains a concern
We have reduced our allocation to Hong Kong, as continued policy tightening, rising mortgage rates, and inflation are likely to negatively affect the residential market. Our focus remains on office and retail owners, which we believe are well positioned to benefit from solid economic growth and low unemployment. We continue to stay strongly underweight residential developers.
4
COHEN & STEERS INTERNATIONAL REALTY FUND, INC.
In Japan, we have shifted our allocation toward developers, as we believe strong recovery in condo sales will drive profit growth over the next 12 to 24 months, benefiting from normalization of home buying activity, government incentives and low interest rates. While we view J-REITs as less attractive on a relative basis, they have been successful at raising capital to fund acquisitions, which should help stabilize dividends in the future.
Australia's mining industries have benefited from the recent boom in commodities, but the rest of the country has suffered the headwinds of a strong Australian dollar and high interest rates. Despite this, we believe another interest rate hike is coming due to rising inflation pressures. We favor office owners over retail and residential companies.
Singapore should continue to see strong economic growth, but developers will likely suffer from tighter margins and decreased transaction volume due to tightening policies. In the office sector, the longer-term supply picture became clearer as details of the land swap deal with Malaysia were announced. We remain positive on demand and expect rents to grow alongside the economy, but the constant stream of supply over the next few years may cause rental growth to be more gradual.
5
COHEN & STEERS INTERNATIONAL REALTY FUND, INC.
Sincerely,
 | |  | |
|
| MARTIN COHEN | | ROBERT H. STEERS | |
|
| Co-chairman | | Co-chairman | |
|
 | |  | |
|
| JOSEPH M. HARVEY | | SCOTT CROWE | |
|
| Portfolio Manager | | Portfolio Manager | |
|
 | |  | |
|
| GERIOS J.M. ROVERS | | LUKE SULLIVAN | |
|
| Portfolio Manager | | Portfolio Manager | |
|
The views and opinions in the preceding commentary are as of the date stated and are subject to change. This material represents an assessment of the market environment at a specific point in time, should not be relied upon as investment advice and is not intended to predict or depict performance of any investment.
Visit Cohen & Steers online at cohenandsteers.com
For more information about any of our funds, visit cohenandsteers.com, where you will find daily net asset values, fund fact sheets and portfolio highlights. You can also access newsletters, education tools and market updates covering the global real estate, listed infrastructure, utilities, large cap value and preferred securities sectors.
In addition, our Web site contains comprehensive information about our firm, including our most recent press releases, profiles of our senior investment professionals and an overview of our investment approach.
6
COHEN & STEERS INTERNATIONAL REALTY FUND, INC.
Performance Review (Unaudited)
Average Annual Total Returns For Periods Ended June 30, 2011
| | | Class A Shares | | Class C Shares | | Class I Shares | |
| 1 Year (with sales charge) | | | 24.52 | %a | | | 28.72 | %b | | | — | | |
| 1 Year (without sales charge) | | | 30.39 | % | | | 29.72 | % | | | 30.96 | % | |
| 5 Years (with sales charge) | �� | | –1.17 | %a | | | –0.90 | % | | | — | | |
| 5 Years (without sales charge) | | | –0.26 | % | | | –0.90 | % | | | 0.09 | % | |
| Since Inceptionc (with sales charge) | | | 3.76 | %a | | | 3.88 | % | | | — | | |
| Since Inceptionc (without sales charge) | | | 4.53 | % | | | 3.88 | % | | | 4.90 | % | |
The performance data quoted represent past performance. Past performance is no guarantee of future results. The investment return and principal value of an investment will fluctuate and shares, if redeemed, may be worth more or less than their original cost. Current performance may be lower or higher than the performance data quoted. Performance information current to the most recent month-end can be obtained by visiting our Web site at cohenandsteers.com. The performance table does not reflect the deduction of taxes that a shareholder would pay on Fund distributions or the redemption of Fund shares. During certain periods presented above, the advisor waived fees and/or reimbursed expenses. Without this arrangement, performance would have been lower.
The expense ratios for each class of shares as disclosed in the May 1, 2011 prospectuses were as follows: Class A—1.61%; Class C—2.26% and Class I—1.26%.
a Reflects a 4.50% front-end sales charge.
b Reflects a contingent deferred sales charge of 1%.
c Inception date of March 31, 2005.
7
COHEN & STEERS INTERNATIONAL REALTY FUND, INC.
Expense Example (Unaudited)
As a shareholder of the Fund, you incur two types of costs: (1) transaction costs, including sales charges (loads) on purchase payments and redemption fees; and (2) ongoing costs including management fees; distribution and/or service (12b-1) fees; and other Fund expenses. This example is intended to help you understand your ongoing costs (in dollars) of investing in the Fund and to compare these costs with the ongoing costs of investing in other mutual funds.
The example is based on an investment of $1,000 invested at the beginning of the period and held for the entire period January 1, 2011—June 30, 2011.
Actual Expenses
The first line of the following table provides information about actual account values and expenses. You may use the information in this line, together with the amount you invested, to estimate the expenses that you paid over the period. Simply divide your account value by $1,000 (for example, an $8,600 account value divided by $1,000 = 8.6), then multiply the result by the number in the first line under the heading entitled "Expenses Paid During Period" to estimate the expenses you paid on your account during this period.
Hypothetical Example for Comparison Purposes
The second line of the following table provides information about hypothetical account values and hypothetical expenses based on the Fund's actual expense ratio and an assumed rate of return of 5% per year before expenses, which is not the Fund's actual return. The hypothetical account values and expenses may not be used to estimate the actual ending account balance or expenses you paid for the period. You may use this information to compare the ongoing cost of investing in the Fund and other funds. To do so, compare this 5% hypothetical example with the 5% hypothetical examples that appear in the shareholder reports of other funds.
Please note that the expenses shown in the table are meant to highlight your ongoing costs only and do not reflect any transactional costs, such as sales charges (loads) and redemption fees. Therefore, the second line of the table is useful in comparing ongoing costs only, and will not help you determine the relative total costs of owning different funds. In addition, if these transactional costs were included, your costs would have been higher.
8
COHEN & STEERS INTERNATIONAL REALTY FUND, INC.
Expense Example (Unaudited) — (Continued)
| | | Beginning
Account Value
January 1, 2011 | | Ending
Account Value
June 30, 2011 | | Expenses Paid
During Perioda
January 1, 2011–
June 30, 2011 | |
| Class A | |
| Actual (1.78% return) | | $ | 1,000.00 | | | $ | 1,017.80 | | | $ | 8.00 | | |
| Hypothetical (5% annual return before expenses) | | $ | 1,000.00 | | | $ | 1,016.86 | | | $ | 8.00 | | |
| Class C | |
| Actual (1.53% return) | | $ | 1,000.00 | | | $ | 1,015.30 | | | $ | 11.24 | | |
| Hypothetical (5% annual return before expenses) | | $ | 1,000.00 | | | $ | 1,013.64 | | | $ | 11.23 | | |
| Class I | |
| Actual (1.95% return) | | $ | 1,000.00 | | | $ | 1,019.50 | | | $ | 6.26 | | |
| Hypothetical (5% annual return before expenses) | | $ | 1,000.00 | | | $ | 1,018.60 | | | $ | 6.26 | | |
a Expenses are equal to the Fund's Class A, Class C and Class I annualized expense ratio of 1.60%, 2.25% and 1.25%, respectively, multiplied by the average account value over the period, multiplied by 181/365 (to reflect the one-half year period).
9
COHEN & STEERS INTERNATIONAL REALTY FUND, INC.
JUNE 30, 2011
Top Ten Holdings
(Unaudited)
| Security | | Value | | % of
Net
Assets | |
| Sun Hung Kai Properties Ltd. | | $ | 91,294,043 | | | | 6.2 | % | |
| Mitsui Fudosan Co., Ltd. | | | 89,680,412 | | | | 6.1 | | |
| Unibail-Rodamco | | | 80,897,988 | | | | 5.5 | | |
| Westfield Group | | | 76,910,686 | | | | 5.3 | | |
| Mitsubishi Estate Co., Ltd. | | | 64,576,784 | | | | 4.4 | | |
| Hongkong Land Holdings Ltd. (USD) | | | 56,384,141 | | | | 3.9 | | |
| British Land Co., PLC | | | 39,909,461 | | | | 2.7 | | |
| GPT Group | | | 37,202,886 | | | | 2.5 | | |
| Brookfield Office Properties (USD) | | | 36,985,884 | | | | 2.5 | | |
| Hammerson PLC | | | 36,770,603 | | | | 2.5 | | |
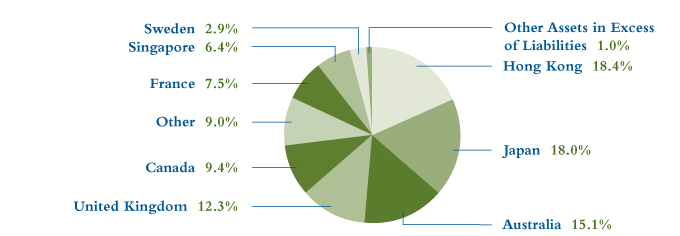
Country Breakdown
(Based on Net Assets)
(Unaudited)
10
COHEN & STEERS INTERNATIONAL REALTY FUND, INC.
SCHEDULE OF INVESTMENTS
June 30, 2011 (Unaudited)
| | | | | Number
of Shares | | Value | |
| COMMON STOCK | | 99.0% | | | | | | | | | |
| AUSTRALIA | | 15.1% | | | | | | | | | |
| DIVERSIFIED | | 6.3% | | | | | | | | | |
| BGP Holdings PLC (EUR)a,b,c | | | | | 55,752,507 | | | $ | 0 | | |
| Dexus Property Groupb | | | | | 14,989,572 | | | | 14,201,120 | | |
| FKP Property Groupb | | | | | 10,707,771 | | | | 8,074,875 | | |
| GPT Groupb | | | | | 10,944,438 | | | | 37,202,886 | | |
| Mirvac Groupb | | | | | 5,714,039 | | | | 7,685,351 | | |
| Stocklandb | | | | | 6,861,195 | | | | 25,166,712 | | |
| | | | | | | | 92,330,944 | | |
| INDUSTRIAL | | 2.5% | | | | | | | | | |
| Goodman Groupb | | | | | 47,880,428 | | | | 36,298,315 | | |
| OFFICE | | 1.0% | | | | | | | | | |
| Commonwealth Property Office Fundb | | | | | 14,620,281 | | | | 14,763,245 | | |
| RETAIL | | 5.3% | | | | | | | | | |
| Westfield Groupb | | | | | 8,251,745 | | | | 76,910,686 | | |
| TOTAL AUSTRALIA | | | | | | | 220,303,190 | | |
| AUSTRIA | | 0.9% | | | | | | | | | |
| DIVERSIFIED | | 0.5% | | | | | | | | | |
| CA Immobilien Anlagen AGb,c | | | | | 377,654 | | | | 6,853,806 | | |
| RETAIL | | 0.4% | | | | | | | | | |
| Atrium European Real Estate Ltd.b | | | | | 1,029,421 | | | | 6,779,116 | | |
| TOTAL AUSTRIA | | | | | | | 13,632,922 | | |
| BRAZIL | | 0.9% | | | | | | | | | |
| HOTEL | | 0.3% | | | | | | | | | |
| BHG SA—Brazil Hospitality Groupc | | | | | 352,139 | | | | 4,535,286 | | |
| OFFICE | | 0.6% | | | | | | | | | |
| BR Properties SA | | | | | 835,752 | | | | 9,371,518 | | |
| TOTAL BRAZIL | | | | | | | 13,906,804 | | |
See accompanying notes to financial statements.
11
COHEN & STEERS INTERNATIONAL REALTY FUND, INC.
SCHEDULE OF INVESTMENTS—(Continued)
June 30, 2011 (Unaudited)
| | | | | Number
of Shares | | Value | |
| CANADA | | 9.4% | | | | | | | | | |
| DIVERSIFIED | | 1.5% | | | | | | | | | |
| Dundee Real Estate Investment Trust, 144Ad | | | | | 635,466 | | | $ | 21,413,909 | | |
| OFFICE | | 2.5% | | | | | | | | | |
| Brookfield Office Properties (USD) | | | | | 1,918,355 | | | | 36,985,884 | | |
| RESIDENTIAL | | 2.4% | | | | | | | | | |
| Boardwalk REIT | | | | | 376,122 | | | | 18,832,424 | | |
| Melcor Developments Ltd. | | | | | 502,000 | | | | 8,067,811 | | |
| Northern Property Real Estate Investment Trust | | | | | 241,113 | | | | 7,642,516 | | |
| | | | | | | | 34,542,751 | | |
| RETAIL | | 3.0% | | | | | | | | | |
| Primaris Retail REIT | | | | | 516,732 | | | | 11,278,147 | | |
| RioCan REIT | | | | | 1,241,421 | | | | 33,389,456 | | |
| | | | | | | | 44,667,603 | | |
| TOTAL CANADA | | | | | | | 137,610,147 | | |
| FINLAND | | 1.0% | | | | | | | | | |
| DIVERSIFIED | | | | | | | | | | | |
| Sponda Oyjb | | | | | 2,531,615 | | | | 14,724,433 | | |
| FRANCE | | 7.5% | | | | | | | | | |
| DIVERSIFIED | | | | | | | | | | | |
| Gecina SAb | | | | | 204,849 | | | | 28,621,939 | | |
| Unibail-Rodamcob | | | | | 350,131 | | | | 80,897,988 | | |
| | | | | | | | 109,519,927 | | |
| GERMANY | | 2.7% | | | | | | | | | |
| DIVERSIFIED | | 0.2% | | | | | | | | | |
| IVG Immobilien AGb,c | | | | | 293,394 | | | | 2,297,928 | | |
| OFFICE | | 0.6% | | | | | | | | | |
| Alstria Office REIT AG | | | | | 558,881 | | | | 8,428,795 | | |
| RESIDENTIAL | | 1.9% | | | | | | | | | |
| Deutsche Wohnen AG | | | | | 1,619,557 | | | | 28,183,200 | | |
| TOTAL GERMANY | | | | | | | 38,909,923 | | |
See accompanying notes to financial statements.
12
COHEN & STEERS INTERNATIONAL REALTY FUND, INC.
SCHEDULE OF INVESTMENTS—(Continued)
June 30, 2011 (Unaudited)
| | | | | Number
of Shares | | Value | |
| HONG KONG | | 18.4% | | | | | | | | | |
| DIVERSIFIED | | 10.2% | | | | | | | | | |
| Hang Lung Properties Ltd.b | | | | | 3,709,000 | | | $ | 15,297,905 | | |
| Hysan Development Co., Ltd.b | | | | | 2,609,000 | | | | 12,993,282 | | |
| Sun Hung Kai Properties Ltd.b | | | | | 6,262,080 | | | | 91,294,043 | | |
| Wharf Holdings Ltd.b | | | | | 4,152,800 | | | | 28,959,624 | | |
| | | | | | | | 148,544,854 | | |
| HOTEL | | 0.4% | | | | | | | | | |
| Shangri-La Asia Ltd.b | | | | | 2,563,358 | | | | 6,306,301 | | |
| OFFICE | | 3.9% | | | | | | | | | |
| Hongkong Land Holdings Ltd. (USD)b | | | | | 7,906,771 | | | | 56,384,141 | | |
| RESIDENTIAL | | 2.7% | | | | | | | | | |
| China Overseas Land & Investment Ltd.b | | | | | 14,811,340 | | | | 31,901,735 | | |
| Country Garden Holdings Co.b | | | | | 17,324,000 | | | | 7,609,173 | | |
| | | | | | | | 39,510,908 | | |
| RETAIL | | 1.2% | | | | | | | | | |
| Link REITb | | | | | 5,172,000 | | | | 17,700,752 | | |
| TOTAL HONG KONG | | | | | | | 268,446,956 | | |
| INDONESIA | | 0.4% | | | | | | | | | |
| RESIDENTIAL | | | | | | | | | | | |
| Summarecon Agung Tbk PTb | | | | | 44,159,246 | | | | 5,884,028 | | |
| JAPAN | | 18.0% | | | | | | | | | |
| DIVERSIFIED | | 15.0% | | | | | | | | | |
| Mitsubishi Estate Co., Ltd.b | | | | | 3,679,600 | | | | 64,576,784 | | |
| Mitsui Fudosan Co., Ltd.b | | | | | 5,207,049 | | | | 89,680,412 | | |
| Nomura Real Estate Holdingsb | | | | | 1,103,400 | | | | 18,397,151 | | |
| Sumitomo Realty & Development Co., Ltd.b | | | | | 1,312,000 | | | | 29,322,705 | | |
| Tokyu Land Corp.b | | | | | 2,461,563 | | | | 10,458,165 | | |
| United Urban Investment Corp.b | | | | | 6,305 | | | | 7,260,769 | | |
| | | | | | | | 219,695,986 | | |
See accompanying notes to financial statements.
13
COHEN & STEERS INTERNATIONAL REALTY FUND, INC.
SCHEDULE OF INVESTMENTS—(Continued)
June 30, 2011 (Unaudited)
| | | | | Number
of Shares | | Value | |
| OFFICE | | 2.0% | | | | | | | | | |
| Nippon Building Fundb | | | | | 1,792 | | | $ | 17,511,563 | | |
| ORIX JREITb | | | | | 2,103 | | | | 11,621,214 | | |
| | | | | | | | 29,132,777 | | |
| RESIDENTIAL | | 1.0% | | | | | | | | | |
| Advance Residence Investmentb | | | | | 6,971 | | | | 14,590,080 | | |
| TOTAL JAPAN | | | | | | | 263,418,843 | | |
| NETHERLANDS | | 0.5% | | | | | | | |
| RETAIL | | | | | | | | | | | |
| Corio NVb | | | | | 101,136 | | | | 6,697,918 | | |
| NORWAY | | 0.8% | |
| OFFICE | | | | | | | | | | | |
| Norwegian Property ASAb | | | | | 5,673,978 | | | | 11,866,647 | | |
| PHILIPPINES | | 1.0% | | | | | | | | | |
| RETAIL | | | | | | | | | | | |
| SM Prime Holdingsb | | | | | 53,858,200 | | | | 14,685,955 | | |
| RUSSIA | | 0.3% | | | | | | | | | |
| DIVERSIFIED | | | | | | | | | | | |
| AFI Development PLC GDRc | | | | | 5,010,637 | | | | 4,509,573 | | |
| SINGAPORE | | 6.4% | | | | | | | | | |
| HOTEL | | 0.8% | | | | | | | | | |
| CDL Hospitality Trustsb | | | | | 6,679,000 | | | | 11,211,193 | | |
| INDUSTRIAL | | 2.2% | | | | | | | | | |
| Global Logistic Properties Ltd.b,c | | | | | 19,436,991 | | | | 32,653,544 | | |
| OFFICE | | 1.5% | | | | | | | | | |
| CapitaCommercial Trustb | | | | | 18,426,237 | | | | 21,796,965 | | |
| RETAIL | | 1.9% | | | | | | | | | |
| CapitaMall Trustb | | | | | 14,885,000 | | | | 22,688,688 | | |
| CapitaMalls Asia Ltd.b | | | | | 4,967,495 | | | | 5,964,031 | | |
| | | | | | | | 28,652,719 | | |
| TOTAL SINGAPORE | | | | | | | 94,314,421 | | |
See accompanying notes to financial statements.
14
COHEN & STEERS INTERNATIONAL REALTY FUND, INC.
SCHEDULE OF INVESTMENTS—(Continued)
June 30, 2011 (Unaudited)
| | | | | Number
of Shares | | Value | |
| SWEDEN | | 2.9% | | | | | | | | | |
| DIVERSIFIED | | | | | | | | | | | |
| Castellum ABb | | | | | 1,238,349 | | | $ | 18,542,611 | | |
| Fabege ABb | | | | | 1,532,475 | | | | 15,403,062 | | |
| Klovern AB | | | | | 1,629,727 | | | | 8,141,936 | | |
| | | | | | | | 42,087,609 | | |
| SWITZERLAND | | 0.5% | | | | | | | | | |
| OFFICE | | | | | | | | | | | |
| PSP Swiss Property AGb,c | | | | | 80,600 | | | | 7,656,739 | | |
| UNITED KINGDOM | | 12.3% | | | | | | | | | |
| DIVERSIFIED | | 7.6% | | | | | | | | | |
| British Land Co., PLCb | | | | | 4,081,948 | | | | 39,909,461 | | |
| Hammerson PLCb | | | | | 4,756,102 | | | | 36,770,603 | | |
| Land Securities Group PLCb | | | | | 2,575,331 | | | | 35,230,644 | | |
| | | | | | | | 111,910,708 | | |
| INDUSTRIAL | | 2.2% | | | | | | | | | |
| Segro PLCb | | | | | 6,382,955 | | | | 32,003,173 | | |
| OFFICE | | 2.5% | | | | | | | | | |
| Derwent London PLCb | | | | | 420,846 | | | | 12,333,015 | | |
| Great Portland Estates PLCb | | | | | 3,382,657 | | | | 23,677,790 | | |
| | | | | | | | 36,010,805 | | |
| TOTAL UNITED KINGDOM | | | | | | | 179,924,686 | | |
TOTAL COMMON STOCK
(Identified cost—$1,200,048,630) | | | | | | | 1,448,100,721 | | |
| SHORT-TERM INVESTMENTS | | 0.3% | | | | | | | | | |
| MONEY MARKET FUNDS | | | | | | | | | | | |
| BlackRock Liquidity Funds: FedFund, 0.01%e | | | | | 750,000 | | | | 750,000 | | |
| Federated Government Obligations Fund, 0.01%e | | | | | 3,500,346 | | | | 3,500,346 | | |
TOTAL SHORT-TERM INVESTMENTS
(Identified cost—$4,250,346) | | | | | | | 4,250,346 | | |
See accompanying notes to financial statements.
15
COHEN & STEERS INTERNATIONAL REALTY FUND, INC.
SCHEDULE OF INVESTMENTS—(Continued)
June 30, 2011 (Unaudited)
| | | | | | | Value | |
| TOTAL INVESTMENTS (Identified cost—$1,204,298,976) | | | 99.3 | % | | | | | | $ | 1,452,351,067 | | |
| OTHER ASSETS IN EXCESS OF LIABILITIES | | | 0.7 | | | | | | | | 9,947,400 | | |
| NET ASSETS | | | 100.0 | % | | | | | | $ | 1,462,298,467 | | |
Glossary of Portfolio Abbreviations
EUR Euro Currency
GDR Global Depositary Receipt
REIT Real Estate Investment Trust
USD United States Dollar
Note: Percentages indicated are based on the net assets of the Fund.
a Illiquid security. Aggregate holdings equal 0.0% of net assets of the Fund.
b Fair valued security. This security has been valued at its fair value as determined in good faith under procedures established by and under the general supervision of the Fund's Board of Directors. Aggregate fair value securities represent 85.3% of the net assets of the Fund, all of which have been fair valued pursuant to foreign fair value pricing procedures approved by the Board of Directors.
c Non-income producing security.
d Resale is restricted to qualified institutional investors. Aggregate holdings equal 1.5% of net assets of the Fund, of which 0.0% are illiquid.
e Rate quoted represents the seven day yield of the fund.
See accompanying notes to financial statements.
16
COHEN & STEERS INTERNATIONAL REALTY FUND, INC.
STATEMENT OF ASSETS AND LIABILITIES
June 30, 2011 (Unaudited)
| ASSETS: | |
| Investments in securities, at value (Identified cost—$1,204,298,976) | | $ | 1,452,351,067 | | |
| Cash | | | 96,983 | | |
| Foreign currency, at value (Identified cost—$1,320,822) | | | 1,324,247 | | |
| Receivable for: | |
| Investment securities sold | | | 13,120,565 | | |
| Fund shares sold | | | 5,548,063 | | |
| Dividends | | | 4,033,509 | | |
| Other assets | | | 13,224 | | |
| Total Assets | | | 1,476,487,658 | | |
| LIABILITIES: | |
| Payable for: | |
| Dividends declared | | | 4,573,432 | | |
| Fund shares redeemed | | | 4,205,605 | | |
| Investment securities purchased | | | 3,440,508 | | |
| Investment advisory fees | | | 1,125,993 | | |
| Administration fees | | | 71,115 | | |
| Distribution fees | | | 12,212 | | |
| Shareholder servicing fees | | | 4,355 | | |
| Directors' fees | | | 3,989 | | |
| Other liabilities | | | 751,982 | | |
| Total Liabilities | | | 14,189,191 | | |
| NET ASSETS | | $ | 1,462,298,467 | | |
| NET ASSETS consist of: | |
| Paid-in capital | | $ | 2,832,076,222 | | |
| Dividends in excess of net investment income | | | (64,213,257 | ) | |
| Accumulated net realized loss | | | (1,553,654,654 | ) | |
| Net unrealized appreciation | | | 248,090,156 | | |
| | | $ | 1,462,298,467 | | |
See accompanying notes to financial statements.
17
COHEN & STEERS INTERNATIONAL REALTY FUND, INC.
STATEMENT OF ASSETS AND LIABILITIES—Continued
June 30, 2011 (Unaudited)
| CLASS A SHARES: | |
| NET ASSETS | | $ | 314,746,714 | | |
| Shares issued and outstanding ($0.001 par value common stock outstanding) | | | 28,245,401 | | |
| Net asset value and redemption price per share | | $ | 11.14 | | |
| Maximum offering price per share ($11.14 ÷ 0.955)a | | $ | 11.66 | | |
| CLASS C SHARES: | |
| NET ASSETS | | $ | 196,213,572 | | |
| Shares issued and outstanding ($0.001 par value common stock outstanding) | | | 17,781,380 | | |
| Net asset value and offering price per shareb | | $ | 11.03 | | |
| CLASS I SHARES: | |
| NET ASSETS | | $ | 951,338,181 | | |
| Shares issued and outstanding ($0.001 par value common stock outstanding) | | | 84,957,244 | | |
| Net asset value, offering, and redemption price per share | | $ | 11.20 | | |
a On investments of $100,000 or more, the offering price is reduced.
b Redemption price per share is equal to the net asset value per share less any applicable deferred sales charge of 1% on shares held for less than one year.
See accompanying notes to financial statements.
18
COHEN & STEERS INTERNATIONAL REALTY FUND, INC.
STATEMENT OF OPERATIONS
For the Six Months Ended June 30, 2011 (Unaudited)
| Investment Income: | |
| Dividend income (net of $2,365,003 of foreign withholding tax) | | $ | 28,655,949 | | |
| Expenses: | |
| Investment advisory fees | | | 6,671,860 | | |
| Distribution fees—Class A | | | 397,588 | | |
| Distribution fees—Class C | | | 770,733 | | |
| Custodian fees and expenses | | | 799,452 | | |
| Administration fees | | | 548,280 | | |
| Transfer agent fees and expenses | | | 439,447 | | |
| Shareholder servicing fees—Class A | | | 159,035 | | |
| Shareholder servicing fees—Class C | | | 256,911 | | |
| Professional fees | | | 73,693 | | |
| Shareholder reporting expenses | | | 70,109 | | |
| Registration and filing fees | | | 59,661 | | |
| Directors' fees and expenses | | | 57,719 | | |
| Line of credit fees | | | 24,013 | | |
| Miscellaneous | | | 43,024 | | |
| Total Expenses | | | 10,371,525 | | |
| Net Investment Income | | | 18,284,424 | | |
| Net Realized and Unrealized Gain (Loss): | |
| Net realized gain (loss) on: | |
| Investments | | | 40,188,356 | | |
| Foreign currency transactions | | | (569,714 | ) | |
| Net realized gain | | | 39,618,642 | | |
| Net change in unrealized appreciation (depreciation) on: | |
| Investments | | | (31,870,311 | ) | |
| Foreign currency translations | | | 56,033 | | |
| Net change in unrealized appreciation (depreciation) | | | (31,814,278 | ) | |
| Net realized and unrealized gain | | | 7,804,364 | | |
| Net Increase in Net Assets Resulting from Operations | | $ | 26,088,788 | | |
See accompanying notes to financial statements.
19
COHEN & STEERS INTERNATIONAL REALTY FUND, INC.
STATEMENT OF CHANGES IN NET ASSETS (Unaudited)
| | | For the
Six Months Ended
June 30, 2011 | | For the
Year Ended
December 31, 2010 | |
| Change in Net Assets: | |
| From Operations: | |
| Net investment income | | $ | 18,284,424 | | | $ | 27,909,783 | | |
| Net realized gain | | | 39,618,642 | | | | 13,073,400 | | |
| Net change in unrealized appreciation (depreciation) | | | (31,814,278 | ) | | | 122,270,448 | | |
| Net increase in net assets resulting from operations | | | 26,088,788 | | | | 163,253,631 | | |
| Dividends to Shareholders from Net Investment Income: | |
| Class A | | | (3,833,854 | ) | | | (22,839,494 | ) | |
| Class C | | | (1,731,383 | ) | | | (14,267,748 | ) | |
| Class I | | | (13,193,786 | ) | | | (53,912,657 | ) | |
| Total dividends to shareholders | | | (18,759,023 | ) | | | (91,019,899 | ) | |
| Capital Stock Transactions: | |
Increase (decrease) in net assets from Fund share
transactions | | | 77,683,694 | | | | (59,565,364 | ) | |
| Total increase in net assets | | | 85,013,459 | | | | 12,668,368 | | |
| Net Assets: | |
| Beginning of period | | | 1,377,285,008 | | | | 1,364,616,640 | | |
| End of perioda | | $ | 1,462,298,467 | | | $ | 1,377,285,008 | | |
a Includes dividends in excess of net investment income of $64,213,257 and $63,738,658, respectively.
See accompanying notes to financial statements.
20
COHEN & STEERS INTERNATIONAL REALTY FUND, INC.
FINANCIAL HIGHLIGHTS (Unaudited)
The following table includes selected data for a share outstanding throughout each period and other performance information derived from the financial statements. It should be read in conjunction with the financial statements and notes thereto.
| | | Class A | |
| | | For the Six
Months Ended | | For Year Ended December 31, | |
| Per Share Operating Performance: | | June 30, 2011 | | 2010 | | 2009 | | 2008 | | 2007 | | 2006 | |
| Net asset value, beginning of period | | $ | 11.08 | | | $ | 10.48 | | | $ | 8.41 | | | $ | 16.17 | | | $ | 18.48 | | | $ | 13.28 | | |
| Income from investment operations: | |
| Net investment incomea | | | 0.14 | | | | 0.22 | b | | | 0.18 | | | | 0.25 | | | | 0.25 | | | | 0.20 | c | |
Net realized and unrealized
gain (loss) | | | 0.06 | | | | 1.13 | | | | 2.77 | | | | (7.87 | ) | | | (1.09 | ) | | | 5.59 | | |
Total from investment
operations | | | 0.20 | | | | 1.35 | | | | 2.95 | | | | (7.62 | ) | | | (0.84 | ) | | | 5.79 | | |
Less dividends and distributions to
shareholders from: | |
| Net investment income | | | (0.14 | ) | | | (0.75 | ) | | | (0.88 | ) | | | — | | | | (0.95 | ) | | | (0.50 | ) | |
| Net realized gain | | | — | | | | — | | | | — | | | | — | | | | (0.53 | ) | | | (0.09 | ) | |
| Tax return of capital | | | — | | | | — | | | | — | | | | (0.14 | ) | | | — | | | | — | | |
Total dividends and
distributions to
shareholders | | | (0.14 | ) | | | (0.75 | ) | | | (0.88 | ) | | | (0.14 | ) | | | (1.48 | ) | | | (0.59 | ) | |
| Redemption fees retained by the Fund | | | 0.00 | d | | | 0.00 | d | | | 0.00 | d | | | 0.00 | d | | | 0.01 | | | | 0.00 | d | |
Net increase (decrease) in
net asset value | | | 0.06 | | | | 0.60 | | | | 2.07 | | | | (7.76 | ) | | | (2.31 | ) | | | 5.20 | | |
| Net asset value, end of period | | $ | 11.14 | | | $ | 11.08 | | | $ | 10.48 | | | $ | 8.41 | | | $ | 16.17 | | | $ | 18.48 | | |
| Total investment returne | | | 1.78 | %f | | | 13.48 | % | | | 35.48 | % | | | –47.43 | % | | | –4.64 | % | | | 43.88 | % | |
| Ratios/Supplemental Data: | |
| Net assets, end of period (in millions) | | $ | 314.7 | | | $ | 330.3 | | | $ | 423.1 | | | $ | 372.5 | | | $ | 1,475.2 | | | $ | 921.0 | | |
Ratio of expenses to average
daily net assets | | | 1.60 | %g,h | | | 1.61 | %g | | | 1.66 | %g | | | 1.54 | % | | | 1.46 | % | | | 1.61 | % | |
Ratio of net investment income to
average daily net assets | | | 2.45 | %g,h | | | 2.10 | %g | | | 1.92 | % | | | 1.87 | % | | | 1.31 | % | | | 1.26 | % | |
| Portfolio turnover rate | | | 51 | %f | | | 84 | % | | | 190 | % | | | 88 | % | | | 67 | % | | | 30 | % | |
a Calculation based on average shares outstanding.
b 25.2% of gross income was attributable to dividends paid by Unibail-Rodamco.
c 18.1% of gross income was attributable to a special dividend paid by Great Eagle Holdings Ltd.
d Amount is less than $0.005.
e Does not reflect sales charges, which would reduce return.
f Not annualized.
g Reflects Fund level ratio for non-class specific expenses plus class specific expenses.
h Annualized.
See accompanying notes to financial statements.
21
COHEN & STEERS INTERNATIONAL REALTY FUND, INC.
FINANCIAL HIGHLIGHTS (Unaudited)—(Continued)
| | | Class C | |
| | | For the Six
Months Ended | | For Year Ended December 31, | |
| Per Share Operating Performance: | | June 30, 2011 | | 2010 | | 2009 | | 2008 | | 2007 | | 2006 | |
| Net asset value, beginning of period | | $ | 10.97 | | | $ | 10.42 | | | $ | 8.36 | | | $ | 16.13 | | | $ | 18.44 | | | $ | 13.26 | | |
| Income from investment operations: | |
| Net investment incomea | | | 0.10 | | | | 0.14 | b | | | 0.12 | | | | 0.16 | | | | 0.12 | | | | 0.10 | c | |
Net realized and unrealized
gain (loss) | | | 0.06 | | | | 1.13 | | | | 2.75 | | | | (7.84 | ) | | | (1.07 | ) | | | 5.58 | | |
Total from investment
operations | | | 0.16 | | | | 1.27 | | | | 2.87 | | | | (7.68 | ) | | | (0.95 | ) | | | 5.68 | | |
Less dividends and distributions to
shareholders from: | |
| Net investment income | | | (0.10 | ) | | | (0.72 | ) | | | (0.81 | ) | | | — | | | | (0.84 | ) | | | (0.41 | ) | |
| Net realized gain | | | — | | | | — | | | | — | | | | — | | | | (0.53 | ) | | | (0.09 | ) | |
| Tax return of capital | | | — | | | | — | | | | — | | | | (0.09 | ) | | | — | | | | — | | |
Total dividends and
distributions to
shareholders | | | (0.10 | ) | | | (0.72 | ) | | | (0.81 | ) | | | (0.09 | ) | | | (1.37 | ) | | | (0.50 | ) | |
| Redemption fees retained by the Fund | | | 0.00 | d | | | 0.00 | d | | | 0.00 | d | | | 0.00 | d | | | 0.01 | | | | 0.00 | d | |
Net increase (decrease) in
net asset value | | | 0.06 | | | | 0.55 | | | | 2.06 | | | | (7.77 | ) | | | (2.31 | ) | | | 5.18 | | |
| Net asset value, end of period | | $ | 11.03 | | | $ | 10.97 | | | $ | 10.42 | | | $ | 8.36 | | | $ | 16.13 | | | $ | 18.44 | | |
| Total investment returne | | | 1.53 | %f,g | | | 12.72 | % | | | 34.69 | % | | | –47.83 | % | | | –5.23 | % | | | 42.99 | % | |
| Ratios/Supplemental Data: | |
| Net assets, end of period (in millions) | | $ | 196.2 | | | $ | 220.5 | | | $ | 254.6 | | | $ | 281.0 | | | $ | 1,074.9 | | | $ | 688.1 | | |
Ratio of expenses to average
daily net assets | | | 2.25 | %h,i | | | 2.26 | %h | | | 2.31 | %h | | | 2.19 | % | | | 2.12 | % | | | 2.26 | % | |
Ratio of net investment income to
average daily net assets | | | 1.77 | %h,i | | | 1.40 | %h | | | 1.29 | % | | | 1.23 | % | | | 0.63 | % | | | 0.63 | % | |
| Portfolio turnover rate | | | 51 | %f | | | 84 | % | | | 190 | % | | | 88 | % | | | 67 | % | | | 30 | % | |
a Calculation based on average shares outstanding.
b 25.2% of gross income was attributable to dividends paid by Unibail-Rodamco.
c 18.1% of gross income was attributable to a special dividend paid by Great Eagle Holdings Ltd.
d Amount is less than $0.005.
e Does not reflect sales charges, which would reduce return.
f Not annualized.
g The net asset value (NAV) disclosed in this report reflects adjustments in accordance with accounting principles generally accepted in the United States of America and as such, differs from the NAV reported on June 30, 2011. The total return reported is based on the unadjusted NAV which was the official NAV for executing transactions on June 30, 2011.
h Reflects Fund level ratio for non-class specific expenses plus class specific expenses.
i Annualized.
See accompanying notes to financial statements.
22
COHEN & STEERS INTERNATIONAL REALTY FUND, INC.
FINANCIAL HIGHLIGHTS (Unaudited)—(Continued)
| | | Class I | |
| | | For the Six
Months Ended | | For Year Ended December 31, | |
| Per Share Operating Performance: | | June 30, 2011 | | 2010 | | 2009 | | 2008 | | 2007 | | 2006 | |
| Net asset value, beginning of period | | $ | 11.14 | | | $ | 10.51 | | | $ | 8.43 | | | $ | 16.19 | | | $ | 18.50 | | | $ | 13.28 | | |
| Income from investment operations: | |
| Net investment incomea | | | 0.16 | | | | 0.25 | b | | | 0.21 | | | | 0.31 | | | | 0.30 | | | | 0.26 | c | |
Net realized and unrealized
gain (loss) | | | 0.06 | | | | 1.15 | | | | 2.78 | | | | (7.90 | ) | | | (1.08 | ) | | | 5.59 | | |
Total from investment
operations | | | 0.22 | | | | 1.40 | | | | 2.99 | | | | (7.59 | ) | | | (0.78 | ) | | | 5.85 | | |
Less dividends and distributions to
shareholders from: | |
| Net investment income | | | (0.16 | ) | | | (0.77 | ) | | | (0.91 | ) | | | — | | | | (1.01 | ) | | | (0.54 | ) | |
| Net realized gain | | | — | | | | — | | | | — | | | | — | | | | (0.53 | ) | | | (0.09 | ) | |
| Tax return of capital | | | — | | | | — | | | | — | | | | (0.17 | ) | | | — | | | | — | | |
Total dividends and
distributions
to shareholders | | | (0.16 | ) | | | (0.77 | ) | | | (0.91 | ) | | | (0.17 | ) | | | (1.54 | ) | | | (0.63 | ) | |
| Redemption fees retained by the Fund | | | 0.00 | d | | | 0.00 | d | | | 0.00 | d | | | 0.00 | d | | | 0.01 | | | | 0.00 | d | |
Net increase (decrease) in
net asset value | | | 0.06 | | | | 0.63 | | | | 2.08 | | | | (7.76 | ) | | | (2.31 | ) | | | 5.22 | | |
| Net asset value, end of period | | $ | 11.20 | | | $ | 11.14 | | | $ | 10.51 | | | $ | 8.43 | | | $ | 16.19 | | | $ | 18.50 | | |
| Total investment return | | | 1.95 | %e | | | 13.95 | % | | | 35.96 | % | | | –47.26 | % | | | –4.32 | % | | | 44.45 | % | |
| Ratios/Supplemental Data: | |
| Net assets, end of period (in millions) | | $ | 951.3 | | | $ | 826.5 | | | $ | 686.9 | | | $ | 528.0 | | | $ | 1,136.0 | | | $ | 711.5 | | |
Ratio of expenses to average
daily net assets | | | 1.25 | %f,g | | | 1.26 | %f | | | 1.31 | %f | | | 1.19 | % | | | 1.12 | % | | | 1.25 | % | |
Ratio of net investment income to
average daily net assets | | | 2.85 | %f,g | | | 2.41 | %f | | | 2.23 | % | | | 2.36 | % | | | 1.61 | % | | | 1.60 | % | |
| Portfolio turnover rate | | | 51 | %e | | | 84 | % | | | 190 | % | | | 88 | % | | | 67 | % | | | 30 | % | |
a Calculation based on average shares outstanding.
b 25.2% of gross income was attributable to dividends paid by Unibail-Rodamco.
c 18.1% of gross income was attributable to a special dividend paid by Great Eagle Holdings Ltd.
d Amount is less than $0.005.
e Not annualized.
f Reflects Fund level ratio for non-class specific expenses.
g Annualized.
See accompanying notes to financial statements.
23
COHEN & STEERS INTERNATIONAL REALTY FUND, INC.
NOTES TO FINANCIAL STATEMENTS (Unaudited)
Note 1. Significant Accounting Policies
Cohen & Steers International Realty Fund, Inc. (the Fund) was incorporated under the laws of the State of Maryland on November 23, 2004 and is registered under the Investment Company Act of 1940, as amended, as a nondiversified, open-end management investment company. The Fund's investment objective is total return. The authorized shares of the Fund are divided into three classes designated Class A, C and I shares. Each of the Fund's shares has equal dividend, liquidation and voting rights (except for matters relating to distributions and shareholder servicing of such shares).
The following is a summary of significant accounting policies consistently followed by the Fund in the preparation of its financial statements. The policies are in conformity with accounting principles generally accepted in the United States of America (GAAP). The preparation of the financial statements in accordance with GAAP requires management to make estimates and assumptions that affect the reported amounts of assets and liabilities at the date of the financial statements and the reported amounts of income and expenses during the reporting period. Actual results could differ from those estimates.
Portfolio Valuation: Investments in securities that are listed on the New York Stock Exchange are valued, except as indicated below, at the last sale price reflected at the close of the New York Stock Exchange on the business day as of which such value is being determined. If there has been no sale on such day, the securities are valued at the mean of the closing bid and asked prices on such day or, if no asked price is available, at the bid price.
Securities not listed on the New York Stock Exchange but listed on other domestic or foreign securities exchanges are valued in a similar manner. Securities traded on more than one securities exchange are valued at the last sale price on the business day as of which such value is being determined as reflected on the tape at the close of the exchange representing the principal market for such securities. If after the close of a foreign market, but prior to the close of business on the day the securities are being valued, market conditions change significantly, certain foreign securities may be fair valued pursuant to procedures established by the Board of Directors.
Readily marketable securities traded in the over-the-counter market, including listed securities whose primary market is believed by Cohen & Steers Capital Management, Inc. (the advisor) to be over-the-counter, are valued at the official closing prices as reported by sources as the Board of Directors deem appropriate to reflect their fair market value. If there has been no sale on such day, the securities are valued at the mean of the closing bid and asked prices on such day, or if no asked price is available, at the bid price. However, certain fixed-income securities may be valued on the basis of prices provided by a pricing service when such prices are believed by the advisor, pursuant to delegation by the Board of Directors, to reflect the fair market value of such securities.
Securities for which market prices are unavailable, or securities for which the advisor determines that the bid and/or asked price or a counterparty valuation price does not reflect market value, will be valued at fair value
24
COHEN & STEERS INTERNATIONAL REALTY FUND, INC.
NOTES TO FINANCIAL STATEMENTS (Unaudited)—(Continued)
pursuant to procedures approved by the Fund's Board of Directors. Circumstances in which market prices may be unavailable include, but are not limited to, when trading in a security is suspended, the exchange on which the security is traded is subject to an unscheduled close or disruption or material events occur after the close of the exchange on which the security is principally traded. In these circumstances, the Fund determines fair value in a manner that fairly reflects the market value of the security on the valuation date based on consideration of any information or factors it deems appropriate. These may include, but are not limited to, recent transactions in comparable securities, information relating to the specific security and developments in the markets.
The Fund's use of fair value pricing may cause the net asset value of Fund shares to differ from the net asset value that would be calculated using market quotations. Fair value pricing involves subjective judgments and it is possible that the fair value determined for a security may be materially different than the value that could be realized upon the sale of that security.
Short-term debt securities with a maturity date of 60 days or less are valued at amortized cost, which approximates value. Investments in open-end mutual funds are valued at their closing net asset value.
Fair value is defined as the price that the Fund would receive to sell an investment or pay to transfer a liability in an orderly transaction with an independent buyer in the principal market, or in the absence of a principal market the most advantageous market for the investment or liability. The hierarchy of inputs that are used in determining the fair value of the Fund's investments is summarized below.
• Level 1—quoted prices in active markets for identical investments
• Level 2—other significant observable inputs (including quoted prices for similar investments, interest rates, credit risk, etc.)
• Level 3—significant unobservable inputs (including the Fund's own assumptions in determining the fair value of investments)
The inputs or methodology used for valuing securities are not necessarily an indication of the risk associated with investing in those securities.
When foreign fair value pricing procedures are utilized, securities are categorized as Level 2. The utilization of these procedures results in transfers between Level 1 and Level 2. 85.3% of net assets of the Fund were fair valued pursuant to foreign fair value pricing procedures approved by the Board of Directors. The following is a summary of the inputs used as of June 30, 2011 in valuing the Fund's investments carried at value:
| | | Total | | Quoted Prices In
Active Market for
Identical Assets
(Level 1) | | Significant
Other Observable
Inputs
(Level 2) | | Significant
Unobservable
Inputs
(Level 3)* | |
| Common Stock—Brazil | | $ | 13,906,804 | | | $ | 13,906,804 | | | $ | — | | | | — | | |
| Common Stock—Canada | | | 137,610,147 | | | | 137,610,147 | | | | — | | | | — | | |
25
COHEN & STEERS INTERNATIONAL REALTY FUND, INC.
NOTES TO FINANCIAL STATEMENTS (Unaudited)—(Continued)
| | | Total | | Quoted Prices In
Active Market for
Identical Assets
(Level 1) | | Significant
Other Observable
Inputs
(Level 2) | | Significant
Unobservable
Inputs
(Level 3)* | |
| Common Stock—Germany | | $ | 38,909,923 | | | $ | 36,611,995 | | | $ | 2,297,928 | | | | — | | |
| Common Stock—Russia | | | 4,509,573 | | | | 4,509,573 | | | | — | | | | — | | |
| Common Stock—Sweden | | | 42,087,609 | | | | 8,141,936 | | | | 33,945,673 | | | | — | | |
| Common Stock—Other Countries | | | 1,211,076,665 | | | | — | | | | 1,211,076,665 | | | | — | | |
| Money Market Funds | | | 4,250,346 | | | | — | | | | 4,250,346 | | | | — | | |
| Total Investments | | $ | 1,452,351,067 | | | $ | 200,780,455 | | | $ | 1,251,570,612 | | | | — | | |
* BGP Holdings PLC was acquired via a spinoff and has been fair valued at zero pursuant to the Fund's fair value procedures and classified as a Level 3 security. Its likelihood of having value in the future is remote.
Security Transactions, Investment Income and Expense Allocations: Security transactions are recorded on trade date. Realized gains and losses on investments sold are recorded on the basis of identified cost. Interest income is recorded on the accrual basis. Discounts are accreted and premiums are amortized over the life of the respective securities. Dividend income is recorded on the ex-dividend date, except for certain dividends on foreign securities, which are recorded as soon as the Fund is informed after the ex-dividend date. Income, expenses (other than expenses attributable to a specific class), and realized and unrealized gains or losses on investments are allocated to each class of shares based on its relative net assets.
Foreign Currency Translations: The books and records of the Fund are maintained in U.S. dollars as follows: (1) the foreign currency market value of investment securities, other assets and liabilities and foreign currency contracts are translated at the exchange rates prevailing at the end of the period; and (2) purchases, sales, income and expenses are translated at the exchange rates prevailing on the respective dates of such transactions. The resultant exchange gains and losses are recorded as realized and unrealized gain/loss on foreign exchange transactions. Pursuant to U.S. federal income tax regulations, certain foreign exchange gains/losses included in realized and unrealized gain/loss are included in or are a reduction of ordinary income for federal income tax purposes. The Fund does not isolate that portion of the results of operations arising as a result of changes in the foreign exchange rates from the changes in the market prices of the securities.
Foreign Securities: The Fund may directly purchase securities of foreign issuers. Investing in securities of foreign issuers involves special risks not typically associated with investing in securities of U.S. issuers. The risks include possible revaluation of currencies, the ability to repatriate funds, less complete financial information about companies and possible future adverse political and economic developments. Moreover, securities of many foreign issuers and their markets may be less liquid and their prices more volatile than those of securities of comparable U.S. issuers.
26
COHEN & STEERS INTERNATIONAL REALTY FUND, INC.
NOTES TO FINANCIAL STATEMENTS (Unaudited)—(Continued)
Dividends and Distributions to Shareholders: Dividends from net investment income and capital gain distributions are determined in accordance with U.S. federal income tax regulations, which may differ from GAAP. Dividends from net investment income, if any, are declared and paid semi-annually. Net realized capital gains, unless offset by any available capital loss carryforward, are typically distributed to shareholders at least annually. Dividends and distributions to shareholders are recorded on the ex-dividend date and are automatically reinvested in full and fractional shares of the Fund based on the net asset value per share at the close of business on the payable date unless the shareholder has elected to have them paid in cash. Distributions paid by the Fund are subject to recharacterization for tax purposes.
Income Taxes: It is the policy of the Fund to continue to qualify as a regulated investment company, if such qualification is in the best interest of the shareholders, by complying with the requirements of Subchapter M of the Internal Revenue Code applicable to regulated investment companies, and by distributing substantially all of its taxable earnings to its shareholders. Accordingly, no provision for federal income or excise tax is necessary. Dividend and interest income from holdings in non-U.S. securities is recorded net of non-U.S. taxes paid. Gains realized by the Fund on the sale of securities in certain non-U.S. markets are subject to non-U.S. taxes. The Fund records a liability based on any unrealized gains on securities held in these markets in order to estimate the potential non-U.S. taxes due upon the sale of these securities. Management has analyzed the Fund's tax positions taken on federal income tax returns as well as its tax positions in non-U.S. jurisdictions where it trades for all open tax years and has concluded that as of June 30, 2011, no additional provisions for income tax would be required in the Fund's financial statements. The Fund's tax positions for the tax years for which the applicable statutes of limitations have not expired are subject to examination by the Internal Revenue Service, state departments of revenue and by foreign tax authorities.
Note 2. Investment Advisory and Administration Fees and Other Transactions with Affiliates
Investment Advisory Fees: The advisor serves as the Fund's investment advisor pursuant to an investment advisory agreement (the investment advisory agreement). Under the terms of the investment advisory agreement, the advisor provides the Fund with day-to-day investment decisions and generally manages the Fund's investments in accordance with the stated policies of the Fund, subject to the supervision of the Board of Directors.
For the services provided to the Fund, the advisor receives a fee, accrued daily and paid monthly, at the annual rate of 0.95% of the average daily net assets of the Fund up to and including $1.5 billion and 0.85% of the average daily net assets above $1.5 billion.
27
COHEN & STEERS INTERNATIONAL REALTY FUND, INC.
NOTES TO FINANCIAL STATEMENTS (Unaudited)—(Continued)
Under subadvisory agreements between the advisor and each of Cohen & Steers Asia Limited, Cohen & Steers UK Limited and Cohen & Steers Europe S.A. (collectively the subadvisors), affiliates of the advisor, the subadvisors are responsible for managing the Fund's investments in certain non-U.S. real estate securities. For their services provided under the subadvisory agreement, the advisor (not the Fund) pays the subadvisors. The advisor allocates 50% of the advisory fee received from the Fund among itself and each subadvisor based on the portion of the Fund's average assets managed by the advisor and each subadvisor.
Administration Fees: The Fund has entered into an administration agreement with the advisor under which the advisor performs certain administrative functions for the Fund and receives a fee, accrued daily and paid monthly, at the annual rate of 0.06% of the Fund's average daily net assets. For the six months ended June 30, 2011, the Fund paid the advisor $421,381 in fees under this administration agreement. Additionally, the Fund pays State Street Bank and Trust Company as co-administrator under a fund accounting and administration agreement.
Distribution Fees: Shares of the Fund are distributed by Cohen & Steers Securities, LLC (the distributor), an affiliated entity of the advisor. The Fund has adopted a distribution plan (the plan) pursuant to Rule 12b-1 under the Investment Company Act of 1940. The plan provides that the Fund will pay the distributor a fee accrued daily and paid monthly at an annual rate of up to 0.25% of the average daily net assets attributable to the Class A shares and up to 0.75% of the average daily net assets attributable to the Class C shares.
For the six months ended June 30, 2011, the Fund has been advised that the distributor received $25,263 in sales commissions from the sale of Class A shares and that the distributor also received $3,870 of contingent deferred sales charges relating to redemptions of Class C shares. The distributor has advised the Fund that proceeds from the contingent deferred sales charges on Class C shares are paid to the distributor and are used by the distributor to defray its expenses related to providing distribution related services to the Fund in connection with the sale of this class, including payments to dealers and other financial intermediaries for selling this class and interest and other financing costs associated with this class.
Shareholder Servicing Fees: For shareholder services, the Fund pays the distributor a fee, accrued daily and paid monthly, at an annual rate of up to 0.10% of the average daily net asset value of the Fund's Class A shares and up to 0.25% of the average daily net asset value of the Fund's Class C shares. The distributor is responsible for paying qualified financial institutions for shareholder services.
28
COHEN & STEERS INTERNATIONAL REALTY FUND, INC.
NOTES TO FINANCIAL STATEMENTS (Unaudited)—(Continued)
Directors' and Officers' Fees: Certain directors and officers of the Fund are also directors, officers, and/or employees of the advisor. The Fund does not pay compensation to any affiliated directors and officers except for the Chief Compliance Officer, who received $11,272 from the Fund for the six months ended June 30, 2011.
Note 3. Purchases and Sales of Securities
Purchases and sales of securities, excluding short-term investments, for the six months ended June 30, 2011, totaled $793,311,470 and $720,539,112, respectively.
Note 4. Income Tax Information
As of June 30, 2011, the federal tax cost and net unrealized appreciation on securities were as follows:
| Cost for federal income tax purposes | | $ | 1,204,298,976 | | |
| Gross unrealized appreciation | | $ | 254,701,515 | | |
| Gross unrealized depreciation | | | (6,649,424 | ) | |
| Net unrealized appreciation | | $ | 248,052,091 | | |
As of December 31, 2010, the Fund had a net capital loss carryforward of $1,476,306,863, of which $844,140,494 will expire on December 31, 2016, $572,102,309 will expire on December 31, 2017 and $60,064,060 will expire on December 31, 2018. This carryforward may be used to offset future capital gains to the extent provided by regulations. Included in the net capital loss carryforward is $1,433,503 of capital loss carryforwards that were acquired from the Fund's merger with Cohen & Steers European Realty Shares, Inc. ("EUR"). Federal tax rules limit the Fund's use of these capital loss carryforwards. The Regulated Investment Company Modernization Act of 2010 (the "Act") requires that capital loss carryforwards incurred after the effective date of the Act be used before those previously incurred, thereby increasing the chances that all or a portion of these losses will not be able to be utilized prior to their expiration. In addition, the Fund incurred capital losses of $2,166,505 after October 31, 2010, that it has elected to treat as arising in the following fiscal year.
29
COHEN & STEERS INTERNATIONAL REALTY FUND, INC.
NOTES TO FINANCIAL STATEMENTS (Unaudited)—(Continued)
Note 5. Capital Stock
The Fund is authorized to issue 800 million shares of capital stock, at a par value of $0.001 per share. The Board of Directors of the Fund may increase or decrease the aggregate number of shares of common stock that the Fund has authority to issue. Transactions in Fund shares were as follows:
| | | For the
Six Months Ended
June 30, 2011 | | For the
Year Ended
December 31, 2010 | |
| | | Shares | | Amount | | Shares | | Amount | |
| Class A: | |
| Sold | | | 3,113,931 | | | $ | 34,605,555 | | | | 8,245,371 | | | $ | 85,516,699 | | |
Issued as reinvestment of
dividends | | | 267,300 | | | | 2,977,721 | | | | 1,605,038 | | | | 16,581,041 | | |
| Redeemed | | | (4,942,499 | ) | | | (54,823,349 | ) | | | (20,426,184 | ) | | | (218,373,943 | ) | |
Redemption fees retained
by the Funda | | | — | | | | 2,843 | | | | — | | | | 33,881 | | |
| Net decrease | | | (1,561,268 | ) | | $ | (17,237,230 | ) | | | (10,575,775 | ) | | $ | (116,242,322 | ) | |
| Class C: | |
| Sold | | | 581,399 | | | $ | 6,406,561 | | | | 1,432,704 | | | $ | 14,976,373 | | |
Issued as reinvestment of
dividends | | | 93,688 | | | | 1,034,313 | | | | 822,710 | | | | 8,411,857 | | |
| Redeemed | | | (2,992,655 | ) | | | (32,846,065 | ) | | | (6,604,871 | ) | | | (68,072,801 | ) | |
Redemption fees retained
by the Funda | | | — | | | | 1,885 | | | | — | | | | 19,886 | | |
| Net decrease | | | (2,317,568 | ) | | $ | (25,403,306 | ) | | | (4,349,457 | ) | | $ | (44,664,685 | ) | |
| Class I: | |
| Sold | | | 17,313,768 | | | $ | 193,644,026 | | | | 22,789,678 | | | $ | 244,978,970 | | |
Issued as reinvestment of
dividends | | | 908,353 | | | | 10,173,557 | | | | 4,416,921 | | | | 46,073,491 | | |
| Redeemed | | | (7,486,865 | ) | | | (83,500,796 | ) | | | (18,346,760 | ) | | | (189,769,079 | ) | |
Redemption fees retained
by the Funda | | | — | | | | 7,443 | | | | — | | | | 58,261 | | |
| Net increase | | | 10,735,256 | | | $ | 120,324,230 | | | | 8,859,839 | | | $ | 101,341,643 | | |
a A 2% redemption fee may be charged on shares sold within 60 days of the time of purchase. Redemption fees are paid directly to the Fund. Effective March 1, 2011, the Fund no longer charges redemption fees.
30
COHEN & STEERS INTERNATIONAL REALTY FUND, INC.
NOTES TO FINANCIAL STATEMENTS (Unaudited)—(Continued)
Note 6. Borrowings
The Fund, in conjunction with other Cohen & Steers funds, is a party to a $200,000,000 syndicated credit agreement (the credit agreement) with State Street Bank and Trust Company, as administrative agent and operations agent, and the lenders identified in the credit agreement, which expires January 27, 2012. The Fund pays a commitment fee of 0.125% per annum on its proportionate share of the unused portion of the credit agreement. (For the period January 1, 2011 through January 28, 2011, the commitment fee was 0.15%).
During the six months ended June 30, 2011, the Fund did not borrow under the credit agreement.
Note 7. Other
In the normal course of business, the Fund enters into contracts that provide general indemnifications. The Fund's maximum exposure under these arrangements is dependent on claims that may be made against the Fund in the future and, therefore, cannot be estimated; however, based on experience, the risk of material loss from such claims is considered remote.
Note 8. Subsequent Events
Events and transactions occurring after June 30, 2011 and through the date that the financial statements were issued, have been evaluated in the preparation of the financial statements and no additional disclosure is required.
31
COHEN & STEERS INTERNATIONAL REALTY FUND, INC.
OTHER INFORMATION
A description of the policies and procedures that the Fund uses to determine how to vote proxies relating to portfolio securities is available (i) without charge, upon request, by calling 800-330-7348, (ii) on our Web site at cohenandsteers.com or (iii) on the Securities and Exchange Commission's Web site at http://www.sec.gov. In addition, the Fund's proxy voting record for the most recent 12-month period ended June 30 is available by August 31 of each year (i) without charge, upon request, by calling 800-330-7348 or (ii) on the SEC's Web site at http://www.sec.gov.
The Fund files its complete schedule of portfolio holdings with the SEC for the first and third quarters of each fiscal year on Form N-Q. The Fund's Forms N-Q are available (i) without charge, upon request by calling 800-330-7348, or (ii) on the SEC's Web site at http://www.sec.gov. In addition, the Forms N-Q may be reviewed and copied at the SEC's Public Reference Room in Washington, DC. Information on the operation of the Public Reference Room may be obtained by calling 800-SEC-0330.
Please note that the distributions paid by the Fund to shareholders are subject to recharacterization for tax purposes. The Fund may also pay distributions in excess of the Fund's net investment company taxable income and this excess could be a tax free return of capital distributed from the Fund's assets. The final tax treatment of all distributions is reported to shareholders on their 1099-DIV forms, which are mailed after the close of each calendar year.
APPROVAL OF INVESTMENT ADVISORY AGREEMENT
The Board of Directors of the Fund, including a majority of the directors who are not parties to the Fund's investment advisory and subadvisory agreements (the "Advisory Agreements"), or interested persons of any such party ("Independent Directors"), has the responsibility under the 1940 Act to approve the Fund's Advisory Agreements for their initial two year term and their continuation annually thereafter at a meeting of the Board of Directors called for the purpose of voting on the approval or continuation. At a telephonic meeting held on June 14, 2011 and at a meeting held in person on June 21-22, 2011, the Advisory Agreements were discussed and were unanimously continued for a term ending June 30, 2012 by the Fund's Board of Directors, including the Independent Directors. The Independent Directors were represented by independent counsel who assisted them in their deliberations during the meeting and executive session.
In considering whether to continue the Advisory Agreements, the Board of Directors reviewed materials provided by the Fund's investment advisor (the "Investment Advisor") and Fund counsel which included, among other things, fee, expense and performance information compared to peer funds ("Peer Funds") and performance comparisons to a larger category universe, prepared by an independent data provider; summary information prepared by the Investment Advisor; and a memorandum outlining the legal duties of the Board of Directors. The Board of Directors also spoke directly with representatives of the independent data provider and met with investment advisory personnel. In addition, the Board of Directors considered information provided from time to time by the Investment Advisor throughout the year at meetings of the Board of Directors, including presentations by portfolio
32
COHEN & STEERS INTERNATIONAL REALTY FUND, INC.
managers relating to the investment performance of the Fund and the investment strategies used in pursuing the Fund's objective. In particular, the Board of Directors considered the following:
(i) The nature, extent and quality of services provided by the Investment Advisor and the Subadvisors: The Board of Directors reviewed the services that the Investment Advisor and the sub-investment advisors (the "Subadvisors") provide to the Fund, including, but not limited to, making the day-to-day investment decisions for the Fund, and, for the Investment Advisor, generally managing the Fund's investments in accordance with the stated policies of the Fund. The Board of Directors also discussed with officers and portfolio managers of the Fund the types of transactions that were being done on behalf of the Fund. Additionally, the Board of Directors took into account the services provided by the Investment Advisor and the Subadvisors to other funds, including those that have investment objectives and strategies similar to the Fund. The Board of Directors next considered the education, background and experience of the Investment Advisor's and Subadvisors' personnel, noting particularly that the favorable history and reputation of the portfolio managers for the Fund has had, and would likely continue to have, a favorable impact on the Fund. The Board of Directors further noted the Investment Advisor's and Subadvisors' ability to attract qualified and experienced personnel. After consideration of the above factors, among others, the Board of Directors concluded that the nature, extent and quality of services provided by the Investment Advisor and the Subadvisors are adequate and appropriate.
(ii) Investment performance of the Fund and the Investment Advisor and Subadvisors: The Board of Directors considered the investment performance of the Fund versus Peer Funds and compared to a relevant benchmark. The Board of Directors noted that the Fund underperformed the medians of the Peer Funds for the one- and five-year periods and performed at the peer group median for the three-year period ended March 31, 2011. The Board of Directors also noted that the Fund had underperformed its benchmark for the one-, three- and five-year periods ended March 31, 2011. The Board of Directors engaged in discussions with the Investment Advisor regarding the contributors and detractors to the Fund's performance during the periods. The Board of Directors also considered supplemental information provided by the Investment Advisor, including a narrative summary of various factors affecting performance and the Investment Advisor's performance in managing other real estate funds. The Board of Directors determined to closely monitor the Fund's performance and requested that the Investment Advisor provide updates for this purpose.
(iii) Cost of the services to be provided and profits to be realized by the Investment Advisor from the relationship with the Fund: Next, the Board of Directors considered the advisory fees and administrative fees payable by the Fund, as well as the Fund's expense ratio. As part of its analysis, the Board of Directors gave consideration to the fee and expense analyses provided by the independent data provider. The Board of Directors noted that actual management fees and net expense ratio were higher than the medians of the Peer Funds, and the contractual management fees were at the peer group median for the Peer Funds. The Board of Directors noted that the Fund has a breakpoint of 10 basis points on assets over $1.5 billion; however, the reduced fee is not currently applicable. The Board of Directors considered that although the actual management fees and net expense ratios were higher than the medians for the Peer Funds, the range of fees and expenses among the Peer Funds was condensed and a number of Peer Funds were waiving fees or reimbursing expenses. The Board of Directors then
33
COHEN & STEERS INTERNATIONAL REALTY FUND, INC.
considered the administrative services provided by the Investment Advisor, including compliance and accounting services, and further noted that the Fund pays an administration fee to the Investment Advisor. The Board of Directors concluded that the Fund's expense structure is generally satisfactory and determined to monitor the Fund's expenses.
The Board of Directors also reviewed information regarding the profitability to the Investment Advisor of its relationship with the Fund. The Board of Directors considered the level of the Investment Advisor's profits and whether the profits were reasonable for the Investment Advisor. Since the Subadvisors are paid by the Investment Advisor and not by the Fund and are subsidiaries of the Investment Advisor, and the Board of Directors considered the profitability of the Investment Advisor as a whole, the Board of Directors did not consider the Subadvisors' separate profitability to be relevant to their considerations. The Board of Directors took into consideration other benefits to be derived by the Investment Advisor in connection with the Advisory Agreements, noting particularly the research and related services, within the meaning of Section 28(e) of the Securities Exchange Act of 1934, as amended, that the Investment Advisor receives by allocating the Fund's brokerage transactions. The Board of Directors also considered the fees received by the Investment Advisor under the Administration Agreement, and noted the significant services received, such as compliance, accounting and operational services and furnishing office space and facilities for the Fund, and providing persons satisfactory to the Board of Directors to serve as officers of the Fund, and that these services were beneficial to the Fund. The Board of Directors concluded that the profits realized by the Investment Advisor from its relationship with the Fund were reasonable and consistent with fiduciary duties.
(iv) The extent to which economies of scale would be realized as the Fund grows and whether fee levels would reflect such economies of scale: The Board of Directors noted that the Fund's advisory fee schedule contains a breakpoint of 10 basis points once the Fund's assets reach $1.5 billion. The Board of Directors considered the Fund's asset size and determined that there were not at this time significant economies of scale that were not being shared with shareholders.
(v) Comparison of services rendered and fees paid to those under other investment advisory contracts, such as contracts of the same and other investment advisers or other clients: As discussed above in (iii), the Board of Directors compared the fees paid under the Advisory Agreements to those under other investment advisory contracts of other investment advisers managing Peer Funds. The Board of Directors also considered the services rendered, fees paid and profitability under the Advisory Agreements to the Investment Advisor's other advisory contracts with institutional and other clients with similar investment mandates, including subadvised mutual funds and proprietary funds. The Board of Directors also considered the entrepreneurial risk and financial exposure assumed by the Investment Advisor in developing and managing the Fund that the Investment Advisor does not have with institutional and other clients. The Board of Directors determined that on a comparative basis the fees under the Advisory Agreements were reasonable in relation to the services provided.
No single factor was cited as determinative to the decision of the Board of Directors. Rather, after weighing all of the considerations and conclusions discussed above, the Board of Directors, including the Independent Directors, unanimously approved the continuation of the Advisory Agreements.
34
COHEN & STEERS INTERNATIONAL REALTY FUND, INC.
Cohen & Steers Privacy Policy
| Facts | | What Does Cohen & Steers Do With Your Personal Information? | |
|
| Why? | | Financial companies choose how they share your personal information. Federal law gives consumers the right to limit some but not all sharing. Federal law also requires us to tell you how we collect, share, and protect your personal information. Please read this notice carefully to understand what we do. | |
|
| What? | | The types of personal information we collect and share depend on the product or service you have with us. This information can include:
• Social Security number and account balances
• Transaction history and account transactions
• Purchase history and wire transfer instructions | |
|
| How? | | All financial companies need to share customers' personal information to run their everyday business. In the section below, we list the reasons financial companies can share their customers' personal information; the reasons Cohen & Steers chooses to share; and whether you can limit this sharing. | |
|
| Reasons we can share your personal information | | Does Cohen & Steers
share? | | Can you limit this
sharing? | |
For our everyday business purposes—
such as to process your transactions, maintain your account(s), respond to court orders and legal investigations, or reports to credit bureaus | | Yes | | No | |
|
For our marketing purposes—
to offer our products and services to you | | Yes | | No | |
|
| For joint marketing with other financial companies— | | no | | We don't share | |
|
For our affiliates' everyday business purposes—
information about your transactions and experiences | | No | | We don't share | |
|
For our affiliates' everyday business purposes—
information about your creditworthiness | | No | | We don't share | |
|
| For our affiliates to market to you— | | no | | We don't share | |
|
| For non-affiliates to market to you— | | no | | We don't share | |
|
Questions? Call 800.330.7348
35
COHEN & STEERS INTERNATIONAL REALTY FUND, INC.
Cohen & Steers Privacy Policy—(Continued)
| Who we are | | | |
| Who is providing this notice? | | Cohen & Steers Capital Management, Inc., Cohen & Steers Asia Limited, Cohen & Steers UK Limited, Cohen & Steers Europe SA, Cohen & Steers Securities, LLC, Cohen & Steers Private Funds, and Cohen & Steers Open and Closed-End Funds (collectively, "Cohen & Steers"). | |
|
| What we do | | | |
| How does Cohen & Steers protect my personal information? | | To protect your personal information from unauthorized access and use, we use security measures that comply with federal law. These measures include computer safeguards and secured files and buildings. We restrict access to your information to those employees who need it to perform their jobs, and also require companies that provide services on our behalf to protect your information. | |
|
| How does Cohen & Steers collect my personal information? | | We collect your personal information, for example, when you
• Open an account or buy securities from us
• Provide account information or give us your contact information
• Make deposits or withdrawals from your account
We also collect your personal information from other companies. | |
|
| Why can't I limit all sharing? | | Federal law gives you the right to limit only
• sharing for affiliates' everyday business purposes—information about your creditworthiness
• affiliates from using your information to market to you
• sharing for non-affiliates to market to you
State law and individual companies may give you additional rights to limit sharing. | |
|
| Definitions | | | |
| Affiliates | | Companies related by common ownership or control. They can be financial and nonfinancial companies.
• Cohen & Steers does not share with affiliates. | |
|
| Non-affiliates | | Companies not related by common ownership or control. They can be financial and nonfinancial companies
• Cohen & Steers does not share with non-affiliates so they can market to you. | |
|
| Joint marketing | | A formal agreement between nonaffiliated financial companies that together market financial products or services to you.
• Cohen & Steers does not jointly market. | |
|
36
COHEN & STEERS INTERNATIONAL REALTY FUND, INC.
Cohen & Steers Investment Solutions
COHEN & STEERS
GLOBAL REALTY SHARES
• Designed for investors seeking total return, investing primarily in global real estate equity securities
• Symbols: CSFAX, CSFBX*, CSFCX, CSSPX
COHEN & STEERS
INSTITUTIONAL GLOBAL REALTY SHARES
• Designed for institutional investors seeking total return, investing primarily in global real estate securities
• Symbol: GRSIX
COHEN & STEERS REALTY INCOME FUND
• Designed for investors seeking total return, investing primarily in real estate securities with an emphasis on both income and capital appreciation
• Symbols: CSEIX, CSBIX*, CSCIX, CSDIX
COHEN & STEERS
INTERNATIONAL REALTY FUND
• Designed for investors seeking total return, investing primarily in international real estate securities
• Symbols: IRFAX, IRFCX, IRFIX
COHEN & STEERS
EMERGING MARKETS REAL ESTATE FUND
• Designed for investors seeking total return, investing primarily in emerging market real estate securities
• Symbols: APFAX, APFCX, APFIX
COHEN & STEERS REALTY SHARES
• Designed for investors seeking total return, investing primarily in REITs
• Symbol: CSRSX
COHEN & STEERS
INSTITUTIONAL REALTY SHARES
• Designed for institutional investors seeking total return, investing primarily in REITs
• Symbol: CSRIX
COHEN & STEERS
GLOBAL INFRASTRUCTURE FUND
• Designed for investors seeking total return, investing primarily in global infrastructure securities
• Symbols: CSUAX, CSUBX*, CSUCX, CSUIX
COHEN & STEERS
DIVIDEND VALUE FUND
• Designed for investors seeking high current income and long-term growth of income and capital appreciation, investing primarily in dividend paying common stocks and preferred stocks
• Symbols: DVFAX, DVFCX, DVFIX
COHEN & STEERS
PREFERRED SECURITIES AND INCOME FUND
• Designed for investors seeking total return (high current income and capital appreciation), investing primarily in preferred and debt securities
• Symbols: CPXAX, CPXCX, CPXIX
Distributed by Cohen & Steers Securities, LLC.
COHEN & STEERS
GLOBAL REALTY MAJORS ETF
• Designed for investors who seek a relatively low-cost "passive" approach for investing in a portfolio of real estate equity securities of companies in a specified index
• Symbol: GRI
Distributed by ALPS Distributors, Inc.
ISHARES COHEN & STEERS
REALTY MAJORS INDEX FUND
• Designed for investors who seek a relatively low-cost "passive" approach for investing in a portfolio of real estate equity securities of companies in a specified index
• Symbol: ICF
Distributed by SEI Investments Distribution Co.
* Class B shares are no longer offered except through dividend reinvestment and permitted exchanges by existing Class B shareholders.
Please consider the investment objectives, risks, charges and expenses of the fund carefully before investing. A prospectus containing this and other information can be obtained by calling 800-330-7348 or by visiting cohenandsteers.com. Please read the prospectus carefully before investing.
37
COHEN & STEERS INTERNATIONAL REALTY FUND, INC.
OFFICERS AND DIRECTORS
Robert H. Steers
Director and co-chairman
Martin Cohen
Director and co-chairman
Michael G. Clark
Director
Bonnie Cohen
Director
George Grossman
Director
Richard E. Kroon
Director
Richard J. Norman
Director
Frank K. Ross
Director
Willard H. Smith Jr.
Director
C. Edward Ward, Jr.
Director
Adam M. Derechin
President and chief executive officer
Joseph M. Harvey
Vice president
Scott Crowe
Vice president
Francis C. Poli
Secretary
James Giallanza
Treasurer and chief financial officer
Lisa D. Phelan
Chief compliance officer
KEY INFORMATION
Investment Advisor
Cohen & Steers Capital Management, Inc.
280 Park Avenue
New York, NY 10017
(212) 832-3232
Fund Co-administrator and Custodian
State Street Bank and Trust Company
One Lincoln Street
Boston, MA 02111
Transfer Agent
Boston Financial Data Services, Inc.
30 Dan Road
Canton, MA 02021
(800) 437-9912
Legal Counsel
Stroock & Stroock & Lavan LLP
180 Maiden Lane
New York, NY 10038
Distributor
Cohen & Steers Securities, LLC
280 Park Avenue
New York, NY 10017
Nasdaq Symbol: Class A—IRFAX
C—IRFCX
I— IRFIX
Web site: cohenandsteers.com
This report is authorized for delivery only to shareholders of Cohen & Steers International Realty Fund, Inc. unless accompanied or preceded by the delivery of a currently effective prospectus setting forth details of the Fund. Past performance is no guarantee of future results and your investment may be worth more or less at the time you sell.
38


eDelivery NOW AVAILABLE
Stop traditional mail delivery; receive your shareholder reports and prospectus online.
Sign up at cohenandsteers.com
COHEN & STEERS
INTERNATIONAL REALTY FUND
280 PARK AVENUE
NEW YORK, NY 10017
SEMIANNUAL REPORT
JUNE 30, 2011
IRFAXSAR
Item 2. Code of Ethics.
Not applicable.
Item 3. Audit Committee Financial Expert.
Not applicable.
Item 4. Principal Accountant Fees and Services.
Not applicable.
Item 5. Audit Committee of Listed Registrants.
Not applicable.
Item 6. Schedule of Investments.
Included in Item 1 above.
Item 7. Disclosure of Proxy Voting Policies and Procedures for Closed-End Management Investment Companies.
Not applicable.
Item 8. Portfolio Managers of Closed-End Investment Companies.
Not applicable.
Item 9. Purchases of Equity Securities by Closed-End Management Investment Company and Affiliated Purchasers.
Not applicable.
Item 10. Submission of Matters to a Vote of Security Holders.
Not applicable.
Item 11. Controls and Procedures.
(a) The registrant’s principal executive officer and principal financial officer have concluded that the registrant’s disclosure controls and procedures are reasonably designed to ensure that information required to be disclosed by the registrant in this Form N-CSR was recorded, processed, summarized and reported within the time periods specified in the Securities and Exchange Commission’s rules and forms, based upon such officers’ evaluation of these controls and procedures as of a date within 90 days of the filing date of this report.
(b) There were no changes in the registrant’s internal control over financial reporting that occurred during the second fiscal quarter of the period covered by this report that have materially affected, or are reasonably likely to materially affect, the registrant’s internal control over financial reporting.
Item 12. Exhibits.
(a)(1) Not applicable.
(a)(2) Certifications of principal executive officer and principal financial officer as required by Rule 30a-2(a) under the Investment Company Act of 1940.
(a)(3) Not applicable.
(b) Certifications of chief executive officer and chief financial officer as required by Rule 30a- 2(b) under the Investment Company Act of 1940.
SIGNATURES
Pursuant to the requirements of the Securities Exchange Act of 1934 and the Investment Company Act of 1940, the registrant has duly caused this report to be signed on its behalf by the undersigned, thereunto duly authorized.
COHEN & STEERS INTERNATIONAL REALTY FUND, INC.
By: | /s/ Adam M. Derechin | |
Name: Adam M. Derechin Title: President and Chief Executive Officer | |
|
| | |
Date: August 31, 2011 | |
| | | |
Pursuant to the requirements of the Securities Exchange Act of 1934 and the Investment Company Act of 1940, this report has been signed below by the following persons on behalf of the registrant and in the capacities and on the dates indicated.
By: | /s/ Adam M. Derechin | |
Name: | Adam M. Derechin | |
Title: | President and Chief Executive Officer | |
| (Principal Executive Officer) | |
| |
By: | /s/ James Giallanza | |
Name: | James Giallanza | |
Title: | Treasurer and Chief Financial Officer | |
| (Principal Financial Officer) | |
| |
| |
Date: August 31, 2011 | |
| | | |