UNITED STATES
SECURITIES AND EXCHANGE COMMISSION
Washington, D.C. 20549
FORM N-CSR
CERTIFIED SHAREHOLDER REPORT OF REGISTERED
MANAGEMENT INVESTMENT COMPANIES
Investment Company Act file number | 811-21677 |
|
Cohen & Steers International Realty Fund, Inc. |
(Exact name of registrant as specified in charter) |
|
280 Park Avenue, New York, NY | | 10017 |
(Address of principal executive offices) | | (Zip code) |
|
Tina M. Payne
Cohen & Steers Capital Management, Inc.
280 Park Avenue
New York, New York 10017 |
(Name and address of agent for service) |
|
Registrant’s telephone number, including area code: | (212) 832-3232 | |
|
Date of fiscal year end: | December 31 | |
|
Date of reporting period: | June 30, 2013 | |
| | | | | | | | |
Item 1. Reports to Stockholders.
COHEN & STEERS INTERNATIONAL REALTY FUND, INC.
To Our Shareholders:
We would like to share with you our report for the six months ended June 30, 2013. The net asset values (NAV) per share at that date were $10.89, $10.78 and $10.94 for Class A, Class C and Class I shares, respectively.
The total returns, including income and change in NAV, for the Fund and its comparative benchmarks were:
| | | Six Months
ended
June 30, 2013 | |
Cohen & Steers International Realty Fund—Class A | | | –2.44 | % | |
Cohen & Steers International Realty Fund—Class C | | | –2.80 | % | |
Cohen & Steers International Realty Fund—Class I | | | –2.36 | % | |
FTSE EPRA/NAREIT Developed Ex-U.S. Real Estate Index—neta | | | –1.19 | % | |
S&P 500 Indexa | | | 13.82 | % | |
The performance data quoted represent past performance. Past performance is no guarantee of future results. The investment return and the principal value of an investment will fluctuate and shares, if redeemed, may be worth more or less than their original cost. Current performance may be lower or higher than the performance data quoted. Current total returns of the Fund can be obtained by visiting our website at cohenandsteers.com. All share class returns assume the reinvestment of all dividends and distributions at NAV. Fund performance figures reflect fee waivers and/or expense reimbursements, without which the performance would have been lower. Performance quoted does not reflect the deduction of the maximum 4.5% initial sales charge on Class A shares or the 1% maximum contingent deferred sales charge on Class C shares. If such charges were included, returns would have been lower. Index performance does not reflect the deduction of any fees, taxes or expenses. An investor cannot invest directly in an index. Performance figures for periods shorter than one year are not annualized.
The Fund implements fair value pricing when the daily change in a specific U.S. market index exceeds a predetermined percentage. Fair value pricing adjusts the valuation of certain non-U.S. holdings to account for such index change following the close of foreign markets. This standard practice has been adopted by a majority of the fund industry. In the event fair value pricing is implemented on the first and/or last day of a performance measurement period, the Fund's return may diverge from the relative performance of its benchmark index, which does not use fair value pricing.
Please note that distributions paid by the Fund to shareholders are subject to recharacterization for tax purposes and are taxable up to the amount of the Fund's investment company taxable income and net realized gains. Distributions in excess of the Fund's investment company taxable income and realized gains are a return of capital distributed from the Fund's assets.
a The FTSE EPRA/NAREIT Developed Ex-U.S. Real Estate Index is an unmanaged portfolio of approximately 187 constituents from 19 countries and is net of dividend withholding taxes. The S&P 500 Index is an unmanaged index of common stocks that is frequently used as a general measure of stock market performance.
1
COHEN & STEERS INTERNATIONAL REALTY FUND, INC.
Investment Review
International real estate securities declined modestly in the first half of 2013, rising by double digits through mid-May, only to give back those gains late in the period. Performance diverged widely across all regions, reflecting differences in economic trends, monetary policy and the fundamentals of individual property markets. However, net returns for non-U.S. markets were broadly hindered by depreciation in all major currencies relative to the U.S. dollar.
The group's strong performance from 2012 carried over into the New Year amid improvements in U.S. jobs and housing data and signs of stabilization in China's economy. Markets also responded positively to resolutions on the three major political challenges facing the U.S.—the fiscal cliff, the debt ceiling and sequestration—easing the immediate fears about the country's economy and providing businesses with much-needed clarity on tax policy. By contrast, Europe continued to struggle with sovereign-debt woes and challenging economic conditions, although real estate securities in the region were generally resilient.
The rally continued in April amid news that the Bank of Japan (BoJ) would pursue aggressive monetary easing in an attempt to stimulate growth and lift the country's economy out of deflation. A decline in Europe's sovereign bond yields added to investor confidence, as Italy announced the formation of a coalition government after weeks of uncertainty following its inconclusive general election.
In May, investors began to warm to the idea of a European economic recovery in the near future, helped by an interest-rate cut from the European Central Bank (ECB) and a decision by the EU to give governments more time to meet their deficit-reduction targets. However, markets tumbled heading into June, as investors speculated that the U.S. Federal Reserve could taper its quantitative easing program sooner than expected if the U.S. economy continued to strengthen. U.S. Treasury yields moved sharply higher in response, leading to a global selloff in interest-rate-sensitive assets. Markets recouped some of their losses in the final week after several members of the Federal Reserve suggested that investors had overreacted to its previous statement.
Europe had pockets of strength despite economic challenges
The U.K. (9.5% total returnb) outperformed amid a return to positive economic growth in the first quarter, followed in the second quarter by further signs of improvement. Many of the smaller, more-leveraged companies had significant gains, while landlords with prime assets in London also fared well, benefiting from strong investor demand for centrally located properties.
Germany (–6.1%) declined as manufacturing activity cooled amid a slowdown in exports. Residential fundamentals remained strong, as seen in Deutsche Wohnen's accelerating rent growth in the first quarter. However, anticipation of a large IPO from Deutsche Annington weighed on the apartment sector, as investors sold similar stocks to raise capital for the offering.
Sweden (6.7%) had across-the-board gains, while the opposite was true in Switzerland (–3.9%). In France (–1.9%), weak consumer spending and an increasingly difficult economic backdrop
b Country returns (excluding the U.S.) are in local currencies as measured by the FTSE EPRA/NAREIT Developed Ex-U.S. Real Estate Index.
2
COHEN & STEERS INTERNATIONAL REALTY FUND, INC.
contributed to a modest decline for the period. Meanwhile, the Netherlands (1.7%) benefited from gains in Wereldhave, which made progress in cutting costs and simplifying its operations. As of June 24, 2013, the FTSE EPRA/NAREIT Real Estate Index Series switched its classification of Unibail-Rodamco from France to the Netherlands.
Asia Pacific dominated by Japan stimulus and China slowdown
Japan (33.0%) surged through the first four months of the period amid growing expectations of quantitative easing—expectations that the BoJ exceeded in its April announcement. However, investor optimism waned in May amid doubts that the government would be able to push through necessary fiscal reforms. Both developers and J-REITs generally thrived during the period, although there was a wide dispersion of returns among both types of companies. In addition, the BoJ's aggressive easing measures resulted in substantial depreciation in the yen relative to the U.S. dollar, diminishing returns for U.S.-based investors.
The prospect of better economic growth in Japan rippled across Asia Pacific, although this was countered by fears that China's economy was decelerating more rapidly than markets expected. Australia (8.5%) was among the most affected by China concerns, as slowing exports to China, sliding commodity prices and a weakening domestic economy drove the Australian dollar down 13% to a three-year low against the U.S. dollar. And yet, real estate securities in the country produced positive local returns, helped by further monetary easing by the Reserve Bank of Australia and undemanding valuations relative to companies' underlying asset values.
In Hong Kong (–7.0%), shares of developers generally declined amid higher mortgage rates and new housing-related tightening measures, including a new schedule for stamp taxes on home purchases that in some cases doubled the previous tax rate. Landlords fared better overall, helped by stabilizing demand and strong consumer spending during the Chinese New Year. However, rising interest rates led to concerns of higher capitalization rates and lower capital values.
Singapore (–7.0%) continued to struggle with a sluggish domestic economy, as well as growth concerns in China, where a number of Singapore-based companies maintain a significant presence. In addition, rising U.S. Treasury yields had an outsized impact on Singapore given S-REITs' relatively high distribution rates and limited opportunities to grow cash flows in the near term.
After two strong years, Canada underperformed
Canada (–4.7%) consistently lagged the global real estate market throughout the period, weighed down by muted growth in the economy and household credit, as well as the Bank of Canada's modest bias toward eventual tightening. Returns for Canadian REITs were also restrained by lower projected dividend growth relative to other higher-yielding markets such as Australia, Japan and Singapore.
Fund performance
The Fund had a negative return during the period and underperformed its benchmark. Our underweight in Japan early in the period—followed by a shift to an overweight position—detracted from performance. However, the negative effect of this timing was partly mitigated by favorable stock selection, reflecting our focus on Japanese developers and our overweight in Nippon Prologis REIT, the
3
COHEN & STEERS INTERNATIONAL REALTY FUND, INC.
recent spinoff of U.S.-based industrial REIT Prologis. In addition, currency factors related to Japan provided a material benefit relative to the index.
Other factors that contributed to relative performance included our underweight in Switzerland and stock selection in Australia. In addition, our underweights in Singapore and Canada, and our overweight in the U.K. had a positive effect on returns, although stock selection in each of these three countries detracted from performance.
Investment Outlook
Europe seeing improvement, but challenging conditions are likely to persist
Recent economic data have signaled a potential inflection point in Europe's decline, and a recovery in the second half of the year is now more likely, in our view. However, given the lack of improvement in employment and credit growth, we believe further monetary stimulus will be necessary, potentially including additional quantitative easing from the ECB. Even in the event of a modest economic recovery, we expect real estate fundamentals will remain challenged for the foreseeable future.
In this environment, we see potential for attractive risk-adjusted returns in companies that own high-quality real estate in major city centers, many of which offer a reasonable dividend yield and trade at a discount to their underlying assets. In addition to the defensive characteristics of these markets, including high barriers to entry and relatively stable operating conditions, we believe they are also well-positioned to benefit from a recovery, as tenant demand typically accelerates first in the most-desirable areas before filtering into secondary markets. We are also finding opportunities where management teams are implementing strong turnaround strategies, which we believe should accelerate in an improving economic environment.
We continue to view London offices as attractive, particularly in Central London and the West End, where interest from institutional investors remains strong given the demand for income and the need for diversification into real assets. We also favor owners of high-quality shopping centers in the core of Europe, which could see positive rent growth due to indexation (the annual rent adjustments based on inflation). In addition, we like Scandinavia and Germany, which feature healthier economic growth, a better fiscal outlook and a more-active lending environment relative to other parts of Europe.
Increasingly positive on Japan, while Australia and Hong Kong remain attractive
We have taken an increasingly favorable view of Japan, particularly of its developers, which we believe offer attractive valuations and the potential to benefit from rising asset values amid the BoJ's aggressive monetary easing. While office fundamentals remain challenged, we see a recovery materializing, and we expect to see improvement in rent growth as business sentiment gradually improves. Among J-REITs, we believe second-tier companies with attractive dividend yields and stronger growth prospects will do well as the market searches for higher-yielding names.
In Australia, we believe companies that own industrial and nondiscretionary retail properties remain compelling in relation to their net asset values. We also note that the cyclical residential sector appears to be in the early stages of a recovery from a low base following recent policy easing. The Reserve
4
COHEN & STEERS INTERNATIONAL REALTY FUND, INC.
Bank of Australia has cut interest rates by 200 basis points since late 2011 after lagging the rest of the world in easing monetary policy, and we expect it to maintain a neutral-to-easing monetary bias.
Our focus in Hong Kong is on office and retail landlords with good-quality assets, strong pricing power and attractive earnings-growth potential. Office rents may have bottomed, in our view, despite tepid demand, while we expect retail owners to deliver steady growth, supported by improving tourism and domestic consumption. Meanwhile, valuations for residential developers have fallen to levels that are quite undemanding, in our view, reflecting tightening liquidity and the potential for additional housing purchase restrictions. We see opportunities in select developer stocks that we believe have been oversold.
Singapore continues to see sluggish economic growth, and we expect rent growth to remain muted in the near term. Market volatility has also delayed the public listings of three S-REIT IPOs that were announced in May, reflecting an uncertain capital-market environment. We are modestly positive on select Singapore office REITs, which are seeing a trough in rents and vacancies, and feature attractive valuations relative to their peers.
5
COHEN & STEERS INTERNATIONAL REALTY FUND, INC.
Sincerely,
| | | | | 
| | 
| |
| | | | | MARTIN COHEN | | ROBERT H. STEERS | |
| | | | | Co-chairman | | Co-chairman | |
| | | | | 
| | 
| |
| | | | | JOSEPH M. HARVEY | | JON CHEIGH | |
| | | | | Portfolio Manager | | Portfolio Manager | |
| | | | | 
| | 
| |
| | | | | GERIOS J.M. ROVERS | | LUKE SULLIVAN | |
| | | | | Portfolio Manager | | Portfolio Manager | |
| | | | | 
| | 
| |
| | | | | ROGIER QUIRIJNS | | WILLIAM LEUNG | |
| | | | | Portfolio Manager | | Portfolio Manager | |
The views and opinions in the preceding commentary are subject to change and are as of the date of publication. There is no guarantee that any market forecast set forth in the commentary will be realized. This material represents an assessment of the market environment at a specific point in time, should not be relied upon as investment advice and is not intended to predict or depict performance of any investment.
Visit Cohen & Steers online at cohenandsteers.com
For more information about any of our funds, visit cohenandsteers.com, where you will find net asset values, fund fact sheets and portfolio highlights. You can also access newsletters, education tools and market updates covering the global real estate, commodities, global natural resource equities, listed infrastructure, utilities, large cap value and preferred securities sectors.
In addition, our website contains comprehensive information about our firm, including our most recent press releases, profiles of our senior investment professionals and an overview of our investment approach.
6
COHEN & STEERS INTERNATIONAL REALTY FUND, INC.
Performance Review (Unaudited)
Average Annual Total Returns—For Periods Ended June 30, 2013
| | | Class A Shares | | Class C Shares | | Class I Shares | |
1 Year (with sales charge) | | | 12.07 | %a | | | 15.54 | %b | | | — | | |
1 Year (without sales charge) | | | 17.35 | % | | | 16.54 | % | | | 17.74 | % | |
5 Years (with sales charge) | | | 0.06 | %a | | | 0.32 | % | | | — | | |
5 Years (without sales charge) | | | 0.98 | % | | | 0.32 | % | | | 1.32 | % | |
Since Inceptionc (with sales charge) | | | 3.68 | %a | | | 3.58 | % | | | — | | |
Since Inceptionc (without sales charge) | | | 4.26 | % | | | 3.58 | % | | | 4.61 | % | |
The performance data quoted represent past performance. Past performance is no guarantee of future results. The investment return and principal value of an investment will fluctuate and shares, if redeemed, may be worth more or less than their original cost. Current performance may be lower or higher than the performance data quoted. Performance information current to the most recent month end can be obtained by visiting our website at cohenandsteers.com. All share class returns assume the reinvestment of all dividends and distributions at NAV. The performance table does not reflect the deduction of taxes that a shareholder would pay on Fund distributions or the redemption of Fund shares. During certain periods presented above, the advisor waived fees and/or reimbursed expenses. Without this arrangement, performance would have been lower.
The annualized gross and net expense ratios, respectively, for each class of shares as disclosed in the May 1, 2013 prospectuses were as follows: Class A—1.56% and 1.35%; Class C—2.21% and 2.00%; and Class I—1.27% and 1.00%. Beginning January 1, 2013 and through June 30, 2015, the advisor has contractually agreed to waive its fee and/or reimburse the Fund for expenses incurred (excluding applicable distribution and shareholder servicing fees for Class A and Class C shares, acquired fund fees and expenses and extraordinary expenses) to the extent necessary to maintain the Fund's total annual operating expenses as a percentage of average net assets at 1.35% for Class A shares, 2.00% for Class C shares and 1.00% for Class I shares. This contractual agreement can be amended at any time by agreement of the Fund and the advisor and will terminate automatically in the event of termination of the investment advisory agreement between the advisor and the Fund.
a Reflects a 4.50% front-end sales charge.
b Reflects a contingent deferred sales charge of 1%.
c Inception date of March 31, 2005.
7
COHEN & STEERS INTERNATIONAL REALTY FUND, INC.
Expense Example
(Unaudited)
As a shareholder of the Fund, you incur two types of costs: (1) transaction costs, including sales charges (loads) on purchase payments; and (2) ongoing costs including management fees; distribution and/or service (12b-1) fees; and other Fund expenses. This example is intended to help you understand your ongoing costs (in dollars) of investing in the Fund and to compare these costs with the ongoing costs of investing in other mutual funds.
The example is based on an investment of $1,000 invested at the beginning of the period and held for the entire period January 1, 2013—June 30, 2013.
Actual Expenses
The first line of the following table provides information about actual account values and expenses. You may use the information in this line, together with the amount you invested, to estimate the expenses that you paid over the period. Simply divide your account value by $1,000 (for example, an $8,600 account value divided by $1,000 = 8.6), then multiply the result by the number in the first line under the heading entitled "Expenses Paid During Period" to estimate the expenses you paid on your account during this period.
Hypothetical Example for Comparison Purposes
The second line of the following table provides information about hypothetical account values and hypothetical expenses based on the Fund's actual expense ratio and an assumed rate of return of 5% per year before expenses, which is not the Fund's actual return. The hypothetical account values and expenses may not be used to estimate the actual ending account balance or expenses you paid for the period. You may use this information to compare the ongoing cost of investing in the Fund and other funds. To do so, compare this 5% hypothetical example with the 5% hypothetical examples that appear in the shareholder reports of other funds.
Please note that the expenses shown in the table are meant to highlight your ongoing costs only and do not reflect any transaction costs, such as sales charges (loads). Therefore, the second line of the table is useful in comparing ongoing costs only, and will not help you determine the relative total costs of owning different funds. In addition, if these transactional costs were included, your costs would have been higher.
8
COHEN & STEERS INTERNATIONAL REALTY FUND, INC.
Expense Example (Unaudited)—(Continued)
| | | Beginning
Account Value
January 1, 2013 | | Ending
Account Value
June 30, 2013 | | Expenses Paid
During Perioda
January 1, 2013–
June 30, 2013 | |
Class A | |
Actual (–2.44% return) | | $ | 1,000.00 | | | $ | 975.60 | | | $ | 6.61 | | |
Hypothetical (5% annual return before
expenses) | | $ | 1,000.00 | | | $ | 1,018.10 | | | $ | 6.76 | | |
Class C | |
Actual (–2.80% return) | | $ | 1,000.00 | | | $ | 972.00 | | | $ | 9.78 | | |
Hypothetical (5% annual return before
expenses) | | $ | 1,000.00 | | | $ | 1,014.88 | | | $ | 9.99 | | |
Class I | |
Actual (–2.36% return) | | $ | 1,000.00 | | | $ | 976.40 | | | $ | 4.90 | | |
Hypothetical (5% annual return before
expenses) | | $ | 1,000.00 | | | $ | 1,019.84 | | | $ | 5.01 | | |
a Expenses are equal to the Fund's Class A, Class C and Class I annualized expense ratios of 1.35%, 2.00% and 1.00%, respectively, multiplied by the average account value over the period, multiplied by 181/365 (to reflect the one-half year period). If the Fund had borne all of its expenses that were assumed by the advisor, the annualized expense ratios would have been 1.60%, 2.25% and 1.33%, respectively.
9
COHEN & STEERS INTERNATIONAL REALTY FUND, INC.
June 30, 2013
Top Ten Holdings
(Unaudited)
Security | | Value | | % of
Net
Assets | |
Mitsubishi Estate Co., Ltd. | | $ | 64,289,018 | | | | 7.2 | | |
Sun Hung Kai Properties Ltd. | | | 43,625,766 | | | | 4.9 | | |
Sumitomo Realty & Development Co., Ltd. | | | 42,567,851 | | | | 4.8 | | |
Mitsui Fudosan Co., Ltd. | | | 41,193,198 | | | | 4.6 | | |
Westfield Group | | | 37,330,372 | | | | 4.2 | | |
Land Securities Group PLC | | | 35,902,191 | | | | 4.0 | | |
Unibail-Rodamco | | | 33,714,646 | | | | 3.8 | | |
Wharf Holdings Ltd. | | | 30,781,548 | | | | 3.5 | | |
Hongkong Land Holdings Ltd. (USD) | | | 28,859,297 | | | | 3.3 | | |
Japan Real Estate Investment Corp. | | | 22,311,888 | | | | 2.5 | | |
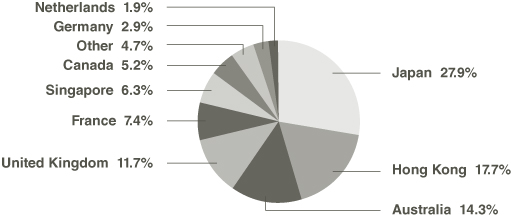
Country Breakdown
(Based on Net Assets)
(Unaudited)
10
COHEN & STEERS INTERNATIONAL REALTY FUND, INC.
SCHEDULE OF INVESTMENTS
June 30, 2013 (Unaudited)
| | | | | Number
of Shares | | Value | |
COMMON STOCK | | 98.6% | | | | | | | | | |
AUSTRALIA | | 14.3% | | | | | | | | | |
REAL ESTATE | |
DIVERSIFIED | | 7.2% | | | | | | | | | |
BGP Holdings PLC (EUR)a,b,c | | | | | 56,622,235 | | | $ | 0 | | |
Cromwell Property Group | | | | | 12,023,140 | | | | 10,720,868 | | |
Dexus Property Group | | | | | 11,216,336 | | | | 10,975,952 | | |
Goodman Group | | | | | 3,863,253 | | | | 17,241,713 | | |
GPT Group | | | | | 1,509,677 | | | | 5,301,792 | | |
Mirvac Group | | | | | 13,179,800 | | | | 19,346,004 | | |
| | | | | | | | 63,586,329 | | |
OFFICE | | 0.7% | | | | | | | | | |
Commonwealth Property Office Fund | | | | | 6,138,019 | | | | 6,174,877 | | |
RETAIL | | 6.4% | | | | | | | | | |
Charter Hall Retail REIT | | | | | 1,795,196 | | | | 6,255,244 | | |
Federation Centres Ltd. | | | | | 6,306,375 | | | | 13,668,963 | | |
Westfield Group | | | | | 3,568,033 | | | | 37,330,372 | | |
| | | | | | | | 57,254,579 | | |
TOTAL AUSTRALIA | | | | | | | 127,015,785 | | |
AUSTRIA | | 0.1% | | | | | | | | | |
REAL ESTATE—RETAIL | |
Atrium European Real Estate Ltd. | | | | | 221,280 | | | | 1,152,116 | | |
BERMUDA | | 0.5% | | | | | | | | | |
REAL ESTATE—HOTEL | |
Orient-Express Hotels Ltd., Class A (USD)c | | | | | 387,294 | | | | 4,709,495 | | |
CANADA | | 5.2% | | | | | | | | | |
REAL ESTATE | |
DIVERSIFIED | | 3.4% | | | | | | | | | |
Canadian Real Estate Investment Trust | | | | | 283,070 | | | | 11,721,687 | | |
Dundee Industrial Real Estate Investment Trust | | | | | 656,746 | | | | 5,670,109 | | |
H&R Real Estate Investment Trust | | | | | 635,060 | | | | 13,308,665 | | |
| | | | | | | | 30,700,461 | | |
OFFICE | | 1.8% | | | | | | | | | |
Allied Properties Real Estate Investment Trust | | | | | 521,444 | | | | 15,870,897 | | |
TOTAL CANADA | | | | | | | 46,571,358 | | |
See accompanying notes to financial statements.
11
COHEN & STEERS INTERNATIONAL REALTY FUND, INC.
SCHEDULE OF INVESTMENTS—(Continued)
June 30, 2013 (Unaudited)
| | | | | Number
of Shares | | Value | |
FINLAND | | 0.4% | | | | | | | | | |
REAL ESTATE—DIVERSIFIED | |
Sponda Oyj | | | | | 778,648 | | | $ | 3,668,967 | | |
FRANCE | | 7.4% | | | | | | | | | |
REAL ESTATE | |
DIVERSIFIED | | 1.5% | | | | | | | | | |
Fonciere des Regions | | | | | 91,335 | | | | 6,852,598 | | |
Gecina SA | | | | | 58,292 | | | | 6,447,921 | | |
| | | | | | | | 13,300,519 | | |
RETAIL | | 5.9% | | | | | | | | | |
Klepierre | | | | | 470,173 | | | | 18,531,373 | | |
Unibail-Rodamco | | | | | 144,701 | | | | 33,714,646 | | |
| | | | | | | | 52,246,019 | | |
TOTAL FRANCE | | | | | | | 65,546,538 | | |
GERMANY | | 2.9% | | | | | | | | | |
REAL ESTATE | |
RESIDENTIAL | | 1.9% | | | | | | | | | |
Deutsche Wohnen AG | | | | | 1,008,283 | | | | 17,120,663 | | |
RETAIL | | 1.0% | | | | | | | | | |
Deutsche Euroshop AG | | | | | 213,856 | | | | 8,511,026 | | |
TOTAL GERMANY | | | | | | | 25,631,689 | | |
HONG KONG | | 17.7% | | | | | | | | | |
REAL ESTATE | |
DIVERSIFIED | | 11.0% | | | | | | | | | |
Agile Property Holdings Ltd. | | | | | 2,608,000 | | | | 2,800,993 | | |
New World Development Co., Ltd. | | | | | 7,236,303 | | | | 10,001,633 | | |
Shimao Property Holdings Ltd. | | | | | 1,932,990 | | | | 3,848,011 | | |
Sino Land Co., Ltd. | | | | | 4,484,646 | | | | 6,279,389 | | |
Sun Hung Kai Properties Ltd. | | | | | 3,380,256 | | | | 43,625,766 | | |
Wharf Holdings Ltd. | | | | | 3,658,900 | | | | 30,781,548 | | |
| | | | | | | | 97,337,340 | | |
OFFICE | | 3.2% | | | | | | | | | |
Hongkong Land Holdings Ltd. (USD) | | | | | 4,200,771 | | | | 28,859,297 | | |
See accompanying notes to financial statements.
12
COHEN & STEERS INTERNATIONAL REALTY FUND, INC.
SCHEDULE OF INVESTMENTS—(Continued)
June 30, 2013 (Unaudited)
| | | | | Number
of Shares | | Value | |
RESIDENTIAL | | 1.1% | | | | | | | | | |
Country Garden Holdings Co. | | | | | 19,006,441 | | | $ | 9,875,640 | | |
RETAIL | | 2.4% | | | | | | | | | |
Link REIT | | | | | 4,328,500 | | | | 21,318,674 | | |
TOTAL HONG KONG | | | | | | | 157,390,951 | | |
JAPAN | | 27.9% | | | | | | | | | |
REAL ESTATE | |
DIVERSIFIED | | 18.2% | | | | | | | | | |
Activia Properties | | | | | 945 | | | | 7,441,470 | | |
Mitsubishi Estate Co., Ltd. | | | | | 2,414,307 | | | | 64,289,018 | | |
Mitsui Fudosan Co., Ltd. | | | | | 1,400,597 | | | | 41,193,198 | | |
Nomura Real Estate Holdings | | | | | 297,425 | | | | 6,579,456 | | |
Sumitomo Realty & Development Co., Ltd. | | | | | 1,067,479 | | | | 42,567,851 | | |
| | | | | | | | 162,070,993 | | |
INDUSTRIAL | | 1.8% | | | | | | | | | |
Industrial & Infrastructure Fund Investment Corp. | | | | | 1,638 | | | | 15,937,387 | | |
OFFICE | | 5.0% | | | | | | | | | |
Japan Excellent | | | | | 1,706 | | | | 9,615,386 | | |
Japan Prime Realty Investment Corp. | | | | | 4,002 | | | | 12,246,491 | | |
Japan Real Estate Investment Corp. | | | | | 1,999 | | | | 22,311,888 | | |
| | | | | | | | 44,173,765 | | |
RETAIL | | 2.9% | | | | | | | | | |
AEON Mall Co., Ltd. | | | | | 314,600 | | | | 7,793,630 | | |
Japan Retail Fund Investment Corp. | | | | | 8,576 | | | | 17,916,386 | | |
| | | | | | | | 25,710,016 | | |
TOTAL JAPAN | | | | | | | 247,892,161 | | |
NETHERLANDS | | 1.9% | | | | | | | | | |
REAL ESTATE | |
DIVERSIFIED | | 0.5% | | | | | | | | | |
Wereldhave NV | | | | | 62,676 | | | | 4,070,543 | | |
RETAIL | | 1.4% | | | | | | | | | |
Corio NV | | | | | 312,261 | | | | 12,423,278 | | |
TOTAL NETHERLANDS | | | | | | | 16,493,821 | | |
See accompanying notes to financial statements.
13
COHEN & STEERS INTERNATIONAL REALTY FUND, INC.
SCHEDULE OF INVESTMENTS—(Continued)
June 30, 2013 (Unaudited)
| | | | | Number
of Shares | | Value | |
NORWAY | | 1.0% | | | | | | | | | |
REAL ESTATE—OFFICE | |
Norwegian Property ASA | | | | | 6,969,867 | | | $ | 8,835,180 | | |
PHILIPPINES | | 0.3% | | | | | | | | | |
REAL ESTATE—RETAIL | |
SM Prime Holdings | | | | | 6,339,995 | | | | 2,392,174 | | |
SINGAPORE | | 6.3% | | | | | | | | | |
REAL ESTATE | |
DIVERSIFIED | | 1.5% | | | | | | | | | |
Capitaland Ltd. | | | | | 5,243,000 | | | | 12,740,387 | | |
HOTEL | | 0.7% | | | | | | | | | |
CDL Hospitality Trusts | | | | | 1,169 | | | | 1,568 | | |
City Developments Ltd. | | | | | 746,000 | | | | 6,297,594 | | |
| | | | | | | | 6,299,162 | | |
INDUSTRIAL | | 2.3% | | | | | | | | | |
Ascendas REIT | | | | | 2,291,000 | | | | 4,030,714 | | |
Global Logistic Properties Ltd. | | | | | 7,460,991 | | | | 16,187,554 | | |
| | | | | | | | 20,218,268 | | |
RETAIL | | 1.8% | | | | | | | | | |
CapitaMall Trust | | | | | 4,291,545 | | | | 6,754,739 | | |
CapitaMalls Asia Ltd. | | | | | 2,531,010 | | | | 3,644,255 | | |
Suntec Real Estate Investment Trust | | | | | 4,727,000 | | | | 5,873,787 | | |
| | | | | | | | 16,272,781 | | |
TOTAL SINGAPORE | | | | | | | 55,530,598 | | |
SWEDEN | | 1.0% | | | | | | | | | |
REAL ESTATE | |
DIVERSIFIED | | 0.1% | | | | | | | | | |
Fastighets AB Balder, Class Bc | | | | | 65,050 | | | | 470,456 | | |
OFFICE | | 0.9% | | | | | | | | | |
Fabege AB | | | | | 402,381 | | | | 3,957,147 | | |
Hufvudstaden AB | | | | | 363,986 | | | | 4,353,004 | | |
| | | | | | | | 8,310,151 | | |
TOTAL SWEDEN | | | | | | | 8,780,607 | | |
See accompanying notes to financial statements.
14
COHEN & STEERS INTERNATIONAL REALTY FUND, INC.
SCHEDULE OF INVESTMENTS—(Continued)
June 30, 2013 (Unaudited)
| | | | | Number
of Shares | | Value | |
SWITZERLAND | | | 0.0% | | | | | | | | | | |
REAL ESTATE—OFFICE | |
PSP Swiss Property AG | | | | | 357 | | | $ | 30,917 | | |
UNITED KINGDOM | | | 11.7% | | | | | | | | | | |
REAL ESTATE | |
DIVERSIFIED | | | 7.3% | | | | | | | | | | |
Hammerson PLC | | | | | 2,076,968 | | | | 15,393,630 | | |
Helical Bar PLC | | | | | 1,219,520 | | | | 4,692,716 | | |
Land Securities Group PLC | | | | | 2,670,262 | | | | 35,902,191 | | |
Londonmetric Property PLC | | | | | 3,570,364 | | | | 5,631,266 | | |
St. Modwen Properties PLC | | | | | 804,603 | | | | 3,305,377 | | |
| | | | | | | | 64,925,180 | | |
INDUSTRIAL | | | 1.1% | | | | | | | | | | |
Segro PLC | | | | | 2,163,945 | | | | 9,189,173 | | |
OFFICE | | | 2.3% | | | | | | | | | | |
Derwent London PLC | | | | | 366,835 | | | | 12,832,563 | | |
Great Portland Estates PLC | | | | | 947,017 | | | | 7,655,541 | | |
| | | | | | | | 20,488,104 | | |
SELF STORAGE | | | 1.0% | | | | | | | | | | |
Big Yellow Group PLC | | | | | 1,536,200 | | | | 8,986,112 | | |
TOTAL UNITED KINGDOM | | | | | | | 103,588,569 | | |
TOTAL COMMON STOCK
(Identified cost—$725,419,540) | | | | | | | 875,230,926 | | |
| | | | | Number
of Rights | | | |
RIGHTS—HONG KONG | | | 0.0% | | | | | | | | | | |
REAL ESTATE—HOTEL | |
New World Development—Share Stapled Unitsa,b,c | | | | | 90,454 | | | | 0 | | |
TOTAL RIGHTS
(Identified cost—$0) | | | | | | | 0 | | |
TOTAL INVESTMENTS (Identified cost—$725,419,540) | | | 98.6 | % | | | | | | | 875,230,926 | | |
OTHER ASSETS IN EXCESS OF LIABILITIES | | | 1.4 | % | | | | | | | 12,208,844 | | |
NET ASSETS | | | 100.0 | % | | | | | | $ | 887,439,770 | | |
See accompanying notes to financial statements.
15
COHEN & STEERS INTERNATIONAL REALTY FUND, INC.
SCHEDULE OF INVESTMENTS—(Continued)
June 30, 2013 (Unaudited)
Glossary of Portfolio Abbreviations
EUR Euro Currency
REIT Real Estate Investment Trust
USD United States Dollar
Note: Percentages indicated are based on the net assets of the Fund.
a Illiquid security. Aggregate holdings equal 0.0% of the net assets of the Fund.
b Fair valued security. This security has been valued at its fair value as determined in good faith under procedures established by and under the general supervision of the Fund's Board of Directors. Aggregate fair valued securities represent 0.0% of the net assets of the Fund.
c Non-income producing security.
See accompanying notes to financial statements.
16
COHEN & STEERS INTERNATIONAL REALTY FUND, INC.
SCHEDULE OF INVESTMENTS—(Continued)
June 30, 2013 (Unaudited)
| Sector Summary | | % of
Net Assets | |
| Diversified | | | 51.1 | | |
| Retail | | | 22.2 | | |
| Office | | | 14.9 | | |
| Industrial | | | 5.2 | | |
| Residential | | | 3.0 | | |
| Other | | | 1.4 | | |
| Hotel | | | 1.2 | | |
| Self Storage | | | 1.0 | | |
| | | 100.0 | | |
See accompanying notes to financial statements.
17
COHEN & STEERS INTERNATIONAL REALTY FUND, INC.
STATEMENT OF ASSETS AND LIABILITIES
June 30, 2013 (Unaudited)
ASSETS: | |
Investments in securities, at value (Identified cost—$725,419,540) | | $ | 875,230,926 | | |
Foreign currency, at value (Identified cost—$2,637,748) | | | 2,638,290 | | |
Receivable for: | |
Investment securities sold | | | 37,969,874 | | |
Dividends | | | 3,574,064 | | |
Fund shares sold | | | 1,549,926 | | |
Other assets | | | 9,129 | | |
Total Assets | | | 920,972,209 | | |
LIABILITIES: | |
Payable for: | |
Investment securities purchased | | | 14,057,431 | | |
Due to custodian | | | 11,694,465 | | |
Fund shares redeemed | | | 4,425,818 | | |
Dividends declared | | | 1,924,800 | | |
Investment advisory fees | | | 478,850 | | |
Shareholder servicing fees | | | 268,475 | | |
Administration fees | | | 44,904 | | |
Distribution fees | | | 14,418 | | |
Directors' fees | | | 4,539 | | |
Other liabilities | | | 618,739 | | |
Total Liabilities | | | 33,532,439 | | |
NET ASSETS | | $ | 887,439,770 | | |
NET ASSETS consist of: | |
Paid-in capital | | $ | 2,311,951,428 | | |
Dividends in excess of net investment income | | | (55,116,540 | ) | |
Accumulated net realized loss | | | (1,519,145,076 | ) | |
Net unrealized appreciation | | | 149,749,958 | | |
| | | $ | 887,439,770 | | |
See accompanying notes to financial statements.
18
COHEN & STEERS INTERNATIONAL REALTY FUND, INC.
STATEMENT OF ASSETS AND LIABILITIES—(Continued)
June 30, 2013 (Unaudited)
CLASS A SHARES: | |
NET ASSETS | | $ | 178,506,925 | | |
Shares issued and outstanding ($0.001 par value common stock
outstanding) | | | 16,396,329 | | |
Net asset value and redemption price per share | | $ | 10.89 | | |
Maximum offering price per share ($10.89 ÷ 0.955)a | | $ | 11.40 | | |
CLASS C SHARES: | |
NET ASSETS | | $ | 119,227,589 | | |
Shares issued and outstanding ($0.001 par value common stock
outstanding) | | | 11,058,740 | | |
Net asset value and offering price per shareb | | $ | 10.78 | | |
CLASS I SHARES: | |
NET ASSETS | | $ | 589,705,256 | | |
Shares issued and outstanding ($0.001 par value common stock
outstanding) | | | 53,891,893 | | |
Net asset value, offering, and redemption price per share | | $ | 10.94 | | |
a On investments of $100,000 or more, the offering price is reduced.
b Redemption price per share is equal to the net asset value per share less any applicable contingent deferred sales charge of 1% on shares held for less than one year.
See accompanying notes to financial statements.
19
COHEN & STEERS INTERNATIONAL REALTY FUND, INC.
STATEMENT OF OPERATIONS
For the Six Months Ended June 30, 2013 (Unaudited)
Investment Income: | |
Dividend income (net of $1,470,771 of foreign withholding tax) | | $ | 17,161,909 | | |
Expenses: | |
Investment advisory fees | | | 4,695,119 | | |
Distribution fees—Class A | | | 264,129 | | |
Distribution fees—Class C | | | 492,593 | | |
Shareholder servicing fees—Class A | | | 105,652 | | |
Shareholder servicing fees—Class C | | | 164,198 | | |
Shareholder servicing fees—Class I | | | 255,771 | | |
Custodian fees and expenses | | | 500,450 | | |
Administration fees | | | 397,030 | | |
Transfer agent fees and expenses | | | 280,750 | | |
Shareholder reporting expenses | | | 96,676 | | |
Professional fees | | | 59,145 | | |
Registration and filing fees | | | 54,434 | | |
Directors' fees and expenses | | | 29,705 | | |
Line of credit fees | | | 7,623 | | |
| Miscellaneous | | | 50,413 | | |
Total Expenses | | | 7,453,688 | | |
Reduction of Expenses (See Note 2) | | | (1,484,884 | ) | |
Net Expenses | | | 5,968,804 | | |
Net Investment Income | | | 11,193,105 | | |
Net Realized and Unrealized Gain (Loss): | |
Net realized gain (loss) on: | |
Investments | | | 81,008,567 | | |
Foreign currency transactions | | | (299,418 | ) | |
Net realized gain | | | 80,709,149 | | |
Net change in unrealized appreciation (depreciation) on: | |
Investments | | | (113,255,038 | ) | |
Foreign currency translations | | | (32,564 | ) | |
Net change in unrealized appreciation (depreciation) | | | (113,287,602 | ) | |
Net realized and unrealized loss | | | (32,578,453 | ) | |
Net Decrease in Net Assets Resulting from Operations | | $ | (21,385,348 | ) | |
See accompanying notes to financial statements.
20
COHEN & STEERS INTERNATIONAL REALTY FUND, INC.
STATEMENT OF CHANGES IN NET ASSETS (Unaudited)
| | | For the
Six Months Ended
June 30, 2013 | | For the
Year Ended
December 31, 2012 | |
Change in Net Assets: | |
From Operations: | |
Net investment income | | $ | 11,193,105 | | | $ | 19,932,870 | | |
Net realized gain | | | 80,709,149 | | | | 61,018,605 | | |
Net change in unrealized appreciation
(depreciation) | | | (113,287,602 | ) | | | 241,800,938 | | |
Net increase (decrease) in net assets
resulting from operations | | | (21,385,348 | ) | | | 322,752,413 | | |
Dividends to Shareholders from: | | | | | | | | | |
Net investment income: | |
Class A | | | (2,179,459 | ) | | | (14,129,434 | ) | |
Class C | | | (1,065,900 | ) | | | (7,918,425 | ) | |
Class I | | | (8,129,539 | ) | | | (45,594,934 | ) | |
Total dividends to shareholders | | | (11,374,898 | ) | | | (67,642,793 | ) | |
Capital Stock Transactions: | | | | | | | | | |
Decrease in net assets from Fund share
transactions | | | (92,063,917 | ) | | | (378,728,896 | ) | |
Total decrease in net assets | | | (124,824,163 | ) | | | (123,619,276 | ) | |
Net Assets: | |
Beginning of period | | | 1,012,263,933 | | | | 1,135,883,209 | | |
End of perioda | | $ | 887,439,770 | | | $ | 1,012,263,933 | | |
a Includes dividends in excess of net investment income of $55,116,540 and $54,934,747, respectively.
See accompanying notes to financial statements.
21
COHEN & STEERS INTERNATIONAL REALTY FUND, INC.
FINANCIAL HIGHLIGHTS (Unaudited)
The following table includes selected data for a share outstanding throughout each period and other performance information derived from the financial statements. It should be read in conjunction with the financial statements and notes thereto.
| | | Class A | |
| | | For the Six | | For the Year Ended December 31, | |
| | | Months Ended | | | |
Per Share Operating Performance: | | June 30, 2013 | | 2012 | | 2011 | | 2010 | | 2009 | | 2008 | |
Net asset value, beginning of
period | | $ | 11.30 | | | $ | 8.98 | | | $ | 11.08 | | | $ | 10.48 | | | $ | 8.41 | | | $ | 16.17 | | |
Income (loss) from investment
operations: | |
Net investment incomea | | | 0.12 | | | | 0.18 | | | | 0.21 | | | | 0.22 | b | | | 0.18 | | | | 0.25 | | |
Net realized and unrealized
gain (loss) | | | (0.40 | ) | | | 2.87 | | | | (2.08 | ) | | | 1.13 | | | | 2.77 | | | | (7.87 | ) | |
Total income (loss) from
investment operations | | | (0.28 | ) | | | 3.05 | | | | (1.87 | ) | | | 1.35 | | | | 2.95 | | | | (7.62 | ) | |
Less dividends and distributions
to shareholders from: | |
Net investment income | | | (0.13 | ) | | | (0.73 | ) | | | (0.23 | ) | | | (0.75 | ) | | | (0.88 | ) | | | — | | |
Tax return of capital | | | — | | | | — | | | | (0.00 | )c | | | — | | | | — | | | | (0.14 | ) | |
Total dividends and
distributions to
shareholders | | | (0.13 | ) | | | (0.73 | ) | | | (0.23 | ) | | | (0.75 | ) | | | (0.88 | ) | | | (0.14 | ) | |
Redemption fees retained by the
Fund | | | — | | | | — | | | | 0.00 | c | | | 0.00 | c | | | 0.00 | c | | | 0.00 | c | |
Net increase (decrease) in net
asset value | | | (0.41 | ) | | | 2.32 | | | | (2.10 | ) | | | 0.60 | | | | 2.07 | | | | (7.76 | ) | |
Net asset value, end of period | | $ | 10.89 | | | $ | 11.30 | | | $ | 8.98 | | | $ | 11.08 | | | $ | 10.48 | | | $ | 8.41 | | |
Total investment returnd,e | | | –2.44 | %f | | | 34.50 | % | | | –17.06 | % | | | 13.48 | % | | | 35.48 | % | | | –47.43 | % | |
See accompanying notes to financial statements.
22
COHEN & STEERS INTERNATIONAL REALTY FUND, INC.
FINANCIAL HIGHLIGHTS (Unaudited)—(Continued)
| | | Class A | |
| | | For the Six | | For the Year Ended December 31, | |
| | | Months Ended | | | |
Ratios/Supplemental Data: | | June 30, 2013 | | 2012 | | 2011 | | 2010 | | 2009 | | 2008 | |
Net assets, end of period
(in millions) | | $ | 178.5 | | | $ | 219.1 | | | $ | 212.4 | | | $ | 330.3 | | | $ | 423.1 | | | $ | 372.5 | | |
Ratio of expenses to average
daily net assets (before
expense reduction) | | | 1.60 | %g | | | 1.56 | %h | | | 1.61 | %h | | | 1.61 | %h | | | 1.66 | %h | | | 1.54 | % | |
Ratio of expenses to average
daily net assets (net of
expense reduction) | | | 1.35 | %g | | | 1.56 | %h | | | 1.61 | %h | | | 1.61 | %h | | | 1.66 | %h | | | 1.54 | % | |
Ratio of net investment income to
average daily net assets
(before expense reduction) | | | 1.84 | %g | | | 1.75 | %h | | | 1.96 | %h | | | 2.10 | %h | | | 1.92 | % | | | 1.87 | % | |
Ratio of net investment income to
average daily net assets (net
of expense reduction) | | | 2.09 | %g | | | 1.75 | %h | | | 1.96 | %h | | | 2.10 | %h | | | 1.92 | % | | | 1.87 | % | |
Portfolio turnover rate | | | 47 | %f | | | 76 | % | | | 106 | % | | | 84 | % | | | 190 | % | | | 88 | % | |
a Calculation based on average shares outstanding.
b 25.2% of gross income was attributable to dividends paid by Unibail-Rodamco.
c Amount is less than $0.005.
d Return assumes the reinvestment of all dividends and distributions at NAV.
e Does not reflect sales charges, which would reduce return.
f Not annualized.
g Annualized.
h Non-class specific expenses are calculated at the Fund level and class specific expenses are calculated at the class level.
See accompanying notes to financial statements.
23
COHEN & STEERS INTERNATIONAL REALTY FUND, INC.
FINANCIAL HIGHLIGHTS (Unaudited)—(Continued)
| | | Class C | |
| | | For the Six | | For the Year Ended December 31, | |
| | | Months Ended | | | |
Per Share Operating Performance: | | June 30, 2013 | | 2012 | | 2011 | | 2010 | | 2009 | | 2008 | |
Net asset value, beginning of
period | | $ | 11.19 | | | $ | 8.90 | | | $ | 10.97 | | | $ | 10.42 | | | $ | 8.36 | | | $ | 16.13 | | |
Income (loss) from investment
operations: | |
Net investment incomea | | | 0.08 | | | | 0.11 | | | | 0.14 | | | | 0.14 | b | | | 0.12 | | | | 0.16 | | |
Net realized and unrealized
gain (loss) | | | (0.39 | ) | | | 2.84 | | | | (2.05 | ) | | | 1.13 | | | | 2.75 | | | | (7.84 | ) | |
Total income (loss) from
investment operations | | | (0.31 | ) | | | 2.95 | | | | (1.91 | ) | | | 1.27 | | | | 2.87 | | | | (7.68 | ) | |
Less dividends and distributions
to shareholders from: | |
Net investment income | | | (0.10 | ) | | | (0.66 | ) | | | (0.16 | ) | | | (0.72 | ) | | | (0.81 | ) | | | — | | �� |
Tax return of capital | | | — | | | | — | | | | (0.00 | )c | | | — | | | | — | | | | (0.09 | ) | |
Total dividends and
distributions to
shareholders | | | (0.10 | ) | | | (0.66 | ) | | | (0.16 | ) | | | (0.72 | ) | | | (0.81 | ) | | | (0.09 | ) | |
Redemption fees retained by the
Fund | | | — | | | | — | | | | 0.00 | c | | | 0.00 | c | | | 0.00 | c | | | 0.00 | c | |
Net increase (decrease) in net
asset value | | | (0.41 | ) | | | 2.29 | | | | (2.07 | ) | | | 0.55 | | | | 2.06 | | | | (7.77 | ) | |
Net asset value, end of period | | $ | 10.78 | | | $ | 11.19 | | | $ | 8.90 | | | $ | 10.97 | | | $ | 10.42 | | | $ | 8.36 | | |
Total investment returnd,e | | | –2.80 | %f | | | 33.59 | % | | | –17.57 | % | | | 12.72 | % | | | 34.69 | % | | | –47.83 | % | |
See accompanying notes to financial statements.
24
COHEN & STEERS INTERNATIONAL REALTY FUND, INC.
FINANCIAL HIGHLIGHTS (Unaudited)—(Continued)
| | | Class C | |
| | | For the Six | | For the Year Ended December 31, | |
| | | Months Ended | | | |
Ratios/Supplemental Data: | | June 30, 2013 | | 2012 | | 2011 | | 2010 | | 2009 | | 2008 | |
Net assets, end of period
(in millions) | | $ | 119.2 | | | $ | 134.1 | | | $ | 135.4 | | | $ | 220.5 | | | $ | 254.6 | | | $ | 281.0 | | |
Ratio of expenses to average
daily net assets (before
expense reduction) | | | 2.25 | %g | | | 2.21 | %h | | | 2.26 | %h | | | 2.26 | %h | | | 2.31 | %h | | | 2.19 | % | |
Ratio of expenses to average
daily net assets (net of
expense reduction) | | | 2.00 | %g | | | 2.21 | %h | | | 2.26 | %h | | | 2.26 | %h | | | 2.31 | %h | | | 2.19 | % | |
Ratio of net investment income to
average daily net assets
(before expense reduction) | | | 1.22 | %g | | | 1.07 | %h | | | 1.29 | %h | | | 1.40 | %h | | | 1.29 | % | | | 1.23 | % | |
Ratio of net investment income to
average daily net assets (net
of expense reduction) | | | 1.47 | %g | | | 1.07 | %h | | | 1.29 | %h | | | 1.40 | %h | | | 1.29 | % | | | 1.23 | % | |
Portfolio turnover rate | | | 47 | %f | | | 76 | % | | | 106 | % | | | 84 | % | | | 190 | % | | | 88 | % | |
a Calculation based on average shares outstanding.
b 25.2% of gross income was attributable to dividends paid by Unibail-Rodamco.
c Amount is less than $0.005.
d Return assumes the reinvestment of all dividends and distributions at NAV.
e Does not reflect sales charges, which would reduce return.
f Not annualized.
g Annualized.
h Non-class specific expenses are calculated at the Fund level and class specific expenses are calculated at the class level.
See accompanying notes to financial statements.
25
COHEN & STEERS INTERNATIONAL REALTY FUND, INC.
FINANCIAL HIGHLIGHTS (Unaudited)—(Continued)
| | | Class I | |
| | | For the Six | | For the Year Ended December 31, | |
| | | Months Ended | | | |
Per Share Operating Performance: | | June 30, 2013 | | 2012 | | 2011 | | 2010 | | 2009 | | 2008 | |
Net asset value, beginning of
period | | $ | 11.36 | | | $ | 9.02 | | | $ | 11.14 | | | $ | 10.51 | | | $ | 8.43 | | | $ | 16.19 | | |
Income (loss) from investment
operations: | |
Net investment incomea | | | 0.14 | | | | 0.21 | | | | 0.24 | | | | 0.25 | b | | | 0.21 | | | | 0.31 | | |
Net realized and unrealized
gain (loss) | | | (0.41 | ) | | | 2.90 | | | | (2.09 | ) | | | 1.15 | | | | 2.78 | | | | (7.90 | ) | |
Total income (loss) from
investment operations | | | (0.27 | ) | | | 3.11 | | | | (1.85 | ) | | | 1.40 | | | | 2.99 | | | | (7.59 | ) | |
Less dividends and distributions
to shareholders from: | |
Net investment income | | | (0.15 | ) | | | (0.77 | ) | | | (0.27 | ) | | | (0.77 | ) | | | (0.91 | ) | | | — | | |
Tax return of capital | | | — | | | | — | | | | (0.00 | )c | | | — | | | | — | | | | (0.17 | ) | |
Total dividends and
distributions to
shareholders | | | (0.15 | ) | | | (0.77 | ) | | | (0.27 | ) | | | (0.77 | ) | | | (0.91 | ) | | | (0.17 | ) | |
Redemption fees retained by the
Fund | | | — | | | | — | | | | 0.00 | c | | | 0.00 | c | | | 0.00 | c | | | 0.00 | c | |
Net increase (decrease) in net
asset value | | | (0.42 | ) | | | 2.34 | | | | (2.12 | ) | | | 0.63 | | | | 2.08 | | | | (7.76 | ) | |
Net asset value, end of period | | $ | 10.94 | | | $ | 11.36 | | | $ | 9.02 | | | $ | 11.14 | | | $ | 10.51 | | | $ | 8.43 | | |
Total investment returnd | | | –2.36 | %e | | | 34.97 | % | | | –16.83 | % | | | 13.95 | % | | | 35.96 | % | | | –47.26 | % | |
See accompanying notes to financial statements.
26
COHEN & STEERS INTERNATIONAL REALTY FUND, INC.
FINANCIAL HIGHLIGHTS (Unaudited)—(Continued)
| | | Class I | |
| | | For the Six | | For the Year Ended December 31, | |
| | | Months Ended | | | |
Ratios/Supplemental Data: | | June 30, 2013 | | 2012 | | 2011 | | 2010 | | 2009 | | 2008 | |
Net assets, end of period
(in millions) | | $ | 589.7 | | | $ | 659.1 | | | $ | 788.1 | | | $ | 826.5 | | | $ | 686.9 | | | $ | 528.0 | | |
Ratio of expenses to average
daily net assets (before
expense reduction) | | | 1.33 | %f | | | 1.27 | %g | | | 1.26 | %g | | | 1.26 | %g | | | 1.31 | %g | | | 1.19 | % | |
Ratio of expenses to average
daily net assets (net of
expense reduction) | | | 1.00 | %f | | | 1.27 | %g | | | 1.26 | %g | | | 1.26 | %g | | | 1.31 | %g | | | 1.19 | % | |
Ratio of net investment income to
average daily net assets
(before expense reduction) | | | 2.16 | %f | | | 2.04 | %g | | | 2.30 | %g | | | 2.41 | %g | | | 2.23 | % | | | 2.36 | % | |
Ratio of net investment income to
average daily net assets (net
of expense reduction) | | | 2.49 | %f | | | 2.04 | %g | | | 2.30 | %g | | | 2.41 | %g | | | 2.23 | % | | | 2.36 | % | |
Portfolio turnover rate | | | 47 | %e | | | 76 | % | | | 106 | % | | | 84 | % | | | 190 | % | | | 88 | % | |
a Calculation based on average shares outstanding.
b 25.2% of gross income was attributable to dividends paid by Unibail-Rodamco.
c Amount is less than $0.005.
d Return assumes the reinvestment of all dividends and distributions at NAV.
e Not annualized.
f Annualized.
g Non-class specific expenses are calculated at the Fund level and class specific expenses are calculated at the class level.
See accompanying notes to financial statements.
27
COHEN & STEERS INTERNATIONAL REALTY FUND, INC.
NOTES TO FINANCIAL STATEMENTS (Unaudited)
Note 1. Significant Accounting Policies
Cohen & Steers International Realty Fund, Inc. (the Fund) was incorporated under the laws of the State of Maryland on November 23, 2004 and is registered under the Investment Company Act of 1940, as amended (the 1940 Act), as a non-diversified, open-end management investment company. The Fund's investment objective is total return. The authorized shares of the Fund are divided into three classes designated Class A, C and I shares. Each of the Fund's shares has equal dividend, liquidation and voting rights (except for matters relating to distributions and shareholder servicing of such shares).
The following is a summary of significant accounting policies consistently followed by the Fund in the preparation of its financial statements. The policies are in conformity with accounting principles generally accepted in the United States of America (GAAP). The preparation of the financial statements in accordance with GAAP requires management to make estimates and assumptions that affect the reported amounts of assets and liabilities at the date of the financial statements and the reported amounts of income and expenses during the reporting period. Actual results could differ from those estimates.
Portfolio Valuation: Investments in securities that are listed on the New York Stock Exchange (NYSE) are valued, except as indicated below, at the last sale price reflected at the close of the NYSE on the business day as of which such value is being determined. If there has been no sale on such day, the securities are valued at the mean of the closing bid and ask prices on such day or, if no ask price is available, at the bid price.
Securities not listed on the NYSE but listed on other domestic or foreign securities exchanges are valued in a similar manner. Securities traded on more than one securities exchange are valued at the last sale price reflected at the close of the exchange representing the principal market for such securities on the business day as of which such value is being determined. If after the close of a foreign market, but prior to the close of business on the day the securities are being valued, market conditions change significantly, certain foreign securities may be fair valued pursuant to procedures established by the Board of Directors.
Readily marketable securities traded in the over-the-counter market, including listed securities whose primary market is believed by Cohen & Steers Capital Management, Inc. (the advisor) to be over-the-counter, are valued at the last sale price on the valuation date as reported by sources deemed appropriate by the Board of Directors to reflect their fair market value. If there has been no sale on such day, the securities are valued at the mean of the closing bid and ask prices on such day or, if no ask price is available, at the bid price.
Short-term debt securities with a maturity date of 60 days or less are valued at amortized cost, which approximates value. Investments in open-end mutual funds are valued at their closing net asset value.
The policies and procedures approved by the Fund's Board of Directors delegate authority to make fair value determinations to the advisor, subject to the oversight of the Board of Directors. The advisor has established a valuation committee (Valuation Committee) to administer, implement and oversee the fair valuation process according to the policies and procedures approved annually by the
28
COHEN & STEERS INTERNATIONAL REALTY FUND, INC.
NOTES TO FINANCIAL STATEMENTS (Unaudited)—(Continued)
Board of Directors. Among other things, these procedures allow the Fund to utilize independent pricing services, quotations from securities and financial instrument dealers and other market sources to determine fair value.
Securities for which market prices are unavailable will be valued at fair value, as determined in good faith by the Valuation Committee, pursuant to procedures approved by the Fund's Board of Directors. Circumstances in which market prices may be unavailable include, but are not limited to, when trading in a security is suspended, the exchange on which the security is traded is subject to an unscheduled close or disruption or material events occur after the close of the exchange on which the security is principally traded. In these circumstances, the Fund determines fair value in a manner that fairly reflects the market value of the security on the valuation date based on consideration of any information or factors it deems appropriate. These may include, but are not limited to, recent transactions in comparable securities, information relating to the specific security and developments in the markets.
Foreign equity fair value pricing procedures utilized by the Fund may cause certain foreign securities to be fair valued on the basis of fair value factors provided by a pricing service to reflect any significant market movements between the time the Fund values such securities and the earlier closing of foreign markets.
The Fund's use of fair value pricing may cause the net asset value of Fund shares to differ from the net asset value that would be calculated using market quotations. Fair value pricing involves subjective judgments and it is possible that the fair value determined for a security may be materially different than the value that could be realized upon the sale of that security.
Fair value is defined as the price that the Fund would expect to receive upon the sale of an investment or expect to pay to transfer a liability in an orderly transaction with an independent buyer in the principal market or, in the absence of a principal market, the most advantageous market for the investment or liability. The hierarchy of inputs that are used in determining the fair value of the Fund's investments is summarized below.
• Level 1—quoted prices in active markets for identical investments
• Level 2—other significant observable inputs (including quoted prices for similar investments, interest rates, credit risk, etc.)
• Level 3—significant unobservable inputs (including the Fund's own assumptions in determining the fair value of investments)
The inputs or methodology used for valuing securities are not necessarily an indication of the risk associated with investing in those securities.
For movements between the levels within the fair value hierarchy, the Fund has adopted a policy of recognizing the transfer at the end of the period in which the underlying event causing the movement occurred. Changes in valuation techniques may result in transfers into or out of an assigned level within the disclosure hierarchy. As of June 30, 2013, there were $708,194,053 of securities transferred between Level 1 and Level 2, which resulted from not utilizing foreign equity fair value pricing procedures by the Fund as of June 30, 2013.
29
COHEN & STEERS INTERNATIONAL REALTY FUND, INC.
NOTES TO FINANCIAL STATEMENTS (Unaudited)—(Continued)
The following is a summary of the inputs used as of June 30, 2013 in valuing the Fund's investments carried at value:
| | | Total | | Quoted Prices
In Active
Markets for
Identical
Investments
(Level 1) | | Other
Significant
Observable
Inputs
(Level 2) | | Significant
Unobservable
Inputs
(Level 3) | |
| Common Stock | | $ | 875,230,926 | | | $ | 875,230,926 | | | $ | — | | | $ | — | a | |
Rights—Hong Kong | | | — | | | | — | | | | — | | | | — | b | |
Total Investmentsc | | $ | 875,230,926 | | | $ | 875,230,926 | | | $ | — | | | $ | — | | |
a BGP Holdings PLC was acquired via a spinoff and has been fair valued, by the Valuation Committee, at zero pursuant to the Fund's fair value procedures and classified as a Level 3 security.
b New World Development—Share Stapled Units rights were acquired via a rights distribution and have been fair valued, by the Valuation Committee, at zero pursuant to the Fund's fair value procedures and classified as a Level 3 security.
c Portfolio holdings are disclosed individually on the Schedule of Investments.
Security Transactions, Investment Income and Expense Allocations: Security transactions are recorded on trade date. Realized gains and losses on investments sold are recorded on the basis of identified cost. Interest income is recorded on the accrual basis. Discounts are accreted and premiums are amortized over the life of the respective securities. Dividend income is recorded on the ex-dividend date, except for certain dividends on foreign securities, which are recorded as soon as the Fund is informed after the ex-dividend date. Distributions from Real Estate Investment Trusts ("REITs") are recorded as ordinary income, net realized capital gain or return of capital based on information reported by the REITs and management's estimates of such amounts based on historical information. These estimates are adjusted when the actual source of distributions is disclosed by the REITs and actual amounts may differ from the estimated amounts. Income, expenses (other than expenses attributable to a specific class) and realized and unrealized gains or losses on investments are allocated to each class of shares based on its relative net assets.
Foreign Currency Translation: The books and records of the Fund are maintained in U.S. dollars. Investment securities and other assets and liabilities denominated in foreign currencies are translated into U.S. dollars based upon prevailing exchange rates on the date of valuation. Purchases and sales of investment securities and income and expense items denominated in foreign currencies are translated into U.S. dollars based upon prevailing exchange rates on the respective dates of such transactions. The Fund does not isolate that portion of the results of operations resulting from fluctuations in foreign exchange rates on investments from the fluctuations arising from changes in market prices of securities held. Such fluctuations are included with the net realized and unrealized gain or loss on investments.
30
COHEN & STEERS INTERNATIONAL REALTY FUND, INC.
NOTES TO FINANCIAL STATEMENTS (Unaudited)—(Continued)
Net realized foreign exchange gains or losses arise from sales of foreign currencies, currency gains or losses realized between the trade and settlement dates on securities transactions, and the difference between the amounts of dividends, interest, and foreign withholding taxes recorded on the Fund's books and the U.S. dollar equivalent of the amounts actually received or paid. Net unrealized foreign exchange gains and losses arise from changes in the values of assets and liabilities, other than investments in securities, on the date of valuation, resulting from changes in exchange rates. Pursuant to U.S. federal income tax regulations, certain foreign currency gains/losses included in realized and unrealized gains/losses are included in or are a reduction of ordinary income for federal income tax purposes.
Foreign Securities: The Fund may directly purchase securities of foreign issuers. Investing in securities of foreign issuers involves special risks not typically associated with investing in securities of U.S. issuers. The risks include possible revaluation of currencies, the ability to repatriate funds, less complete financial information about companies and possible future adverse political and economic developments. Moreover, securities of many foreign issuers and their markets may be less liquid and their prices more volatile than securities of comparable U.S. issuers.
Dividends and Distributions to Shareholders: Dividends from net investment income and capital gain distributions are determined in accordance with U.S. federal income tax regulations, which may differ from GAAP. Dividends from net investment income, if any, are declared and paid semi-annually. Net realized capital gains, unless offset by any available capital loss carryforward, are typically distributed to shareholders at least annually. Dividends and distributions to shareholders are recorded on the ex-dividend date and are automatically reinvested in full and fractional shares of the Fund based on the net asset value per share at the close of business on the payable date, unless the shareholder has elected to have them paid in cash. Distributions paid by the Fund are subject to recharacterization for tax purposes.
Income Taxes: It is the policy of the Fund to continue to qualify as a regulated investment company, if such qualification is in the best interest of the shareholders, by complying with the requirements of Subchapter M of the Internal Revenue Code applicable to regulated investment companies, and by distributing substantially all of its taxable earnings to its shareholders. Accordingly, no provision for federal income or excise tax is necessary. Dividend and interest income from holdings in non-U.S. securities is recorded net of non-U.S. taxes paid. Security and foreign currency transactions and any gains realized by the Fund on the sale of securities in certain non-U.S. markets are subject to non-U.S. taxes. The Fund records a liability based on any unrealized gains on securities held in these markets in order to estimate the potential non-U.S. taxes due upon the sale of these securities. Management has analyzed the Fund's tax positions taken on federal income tax returns as well as its tax positions in non-U.S. jurisdictions in which it trades for all open tax years and has concluded that as of June 30, 2013, no additional provisions for income tax are required in the Fund's financial statements. The Fund's tax positions for the tax years for which the applicable statutes of limitations have not expired are subject to examination by the Internal Revenue Service, state departments of revenue and by foreign tax authorities.
31
COHEN & STEERS INTERNATIONAL REALTY FUND, INC.
NOTES TO FINANCIAL STATEMENTS (Unaudited)—(Continued)
Note 2. Investment Advisory and Administration Fees and Other Transactions with Affiliates
Investment Advisory Fees: The advisor serves as the Fund's investment advisor pursuant to an investment advisory agreement (the investment advisory agreement). Under the terms of the investment advisory agreement, the advisor provides the Fund with day-to-day investment decisions and generally manages the Fund's investments in accordance with the stated policies of the Fund, subject to the supervision of the Board of Directors.
For the services provided to the Fund, the advisor receives a fee, accrued daily and paid monthly, at the annual rate of 0.95% of the average daily net assets of the Fund up to and including $1.5 billion and 0.85% of the average daily net assets above $1.5 billion.
Beginning January 1, 2013, and through June 30, 2015, the advisor has contractually agreed to waive its fee and/or reimburse the Fund for expenses incurred (excluding distribution and shareholder servicing fees applicable to Class A and Class C shares, acquired fund fees and expenses and extraordinary expenses) to the extent necessary to maintain the Fund's total annual operating expenses as a percentage of average net assets at 1.35% for Class A shares, 2.00% for Class C shares and 1.00% for Class I shares. This contractual agreement can be amended at any time by agreement of the Fund and the advisor. For the six months ended June 30, 2013, fees waived and/or expenses reimbursed totaled $1,484,884.
Under subadvisory agreements between the advisor and each of Cohen & Steers Asia Limited and Cohen & Steers UK Limited (collectively, the subadvisors), affiliates of the advisor, the subadvisors are responsible for managing the Fund's investments in certain non-U.S. real estate securities. For their services provided under the subadvisory agreements, the advisor (not the Fund) pays the subadvisors. The advisor allocates 50% of the advisory fee received from the Fund among itself and each subadvisor based on the portion of the Fund's average daily assets managed by the advisor and each subadvisor.
Administration Fees: The Fund has entered into an administration agreement with the advisor under which the advisor performs certain administrative functions for the Fund and receives a fee, accrued daily and paid monthly, at the annual rate of 0.06% of the average daily net assets of the Fund. For the six months ended June 30, 2013, the Fund incurred $296,534 in fees under this administration agreement. Additionally, the Fund pays State Street Bank and Trust Company as co-administrator under a fund accounting and administration agreement.
Distribution Fees: Shares of the Fund are distributed by Cohen & Steers Securities, LLC (the distributor), an affiliated entity of the advisor. The Fund has adopted a distribution plan (the plan) pursuant to Rule 12b-1 under the 1940 Act. The plan provides that the Fund will pay the distributor a fee, accrued daily and paid monthly, at an annual rate of up to 0.25% of the average daily net assets attributable to Class A shares and up to 0.75% of the average daily net assets attributable to Class C shares.
There is a maximum initial sales charge of 4.50% for Class A shares. There is a contingent deferred sales charge (CDSC) of 1.00% on Class C shares, which applies if redemption occurs within one year from purchase. For the six months ended June 30, 2013, the Fund has been advised that the distributor received $4,572 in sales commissions from the sale of Class A shares and $0 and $1,853 of CDSC relating to redemptions of Class A and Class C shares, respectively. The distributor has advised the
32
COHEN & STEERS INTERNATIONAL REALTY FUND, INC.
NOTES TO FINANCIAL STATEMENTS (Unaudited)—(Continued)
Fund that proceeds from the CDSC on these classes are used by the distributor to defray its expenses related to providing distribution-related services to the Fund in connection with the sale of these classes, including payments to dealers and other financial intermediaries for selling these classes and interest and other financing costs associated with these classes.
Shareholder Servicing Fees: For shareholder services, the Fund pays the distributor a fee, accrued daily and paid monthly, at an annual rate of up to 0.10% of the average daily net assets of the Fund's Class A and Class I shares and up to 0.25% of the average daily net assets of the Fund's Class C shares. The distributor is responsible for paying qualified financial institutions for shareholder services.
Directors' and Officers' Fees: Certain directors and officers of the Fund are also directors, officers and/or employees of the advisor. The Fund does not pay compensation to directors and officers affiliated with the advisor except for the Chief Compliance Officer, who received compensation from the advisor, which was reimbursed by the Fund, in the amount of $6,267 for the six months ended June 30, 2013.
Note 3. Purchases and Sales of Securities
Purchases and sales of securities, excluding short-term investments, for the six months ended June 30, 2013, totaled $457,908,621 and $566,226,909, respectively.
Note 4. Income Tax Information
As of June 30, 2013, the federal tax cost and unrealized appreciation and depreciation in value of securities held were as follows:
Cost for federal income tax purposes | | $ | 725,419,540 | | |
Gross unrealized appreciation | | $ | 167,910,490 | | |
Gross unrealized depreciation | | | (18,099,104 | ) | |
Net unrealized appreciation | | $ | 149,811,386 | | |
As of December 31, 2012, the Fund had a net capital loss carryforward of $1,524,403,393, which may be used to offset future capital gains. These losses are comprised of a short-term capital loss carryover of $48,354,178 recognized during the year ended December 31, 2011, which, under current federal income tax rules, may offset capital gains recognized in any future period but must be utilized prior to using the balance of its short-term capital loss carryovers, of which $844,140,318 will expire on December 31, 2016, $572,102,309 will expire on December 31, 2017 and $59,806,588 will expire on December 31, 2018. Included in the net capital loss carryforward is $1,433,327 of capital loss carryforwards that were acquired from the Fund's merger with Cohen & Steers European Realty Shares, Inc. Federal tax rules limit the Fund's use of these capital loss carryforwards.
33
COHEN & STEERS INTERNATIONAL REALTY FUND, INC.
NOTES TO FINANCIAL STATEMENTS (Unaudited)—(Continued)
Note 5. Capital Stock
The Fund is authorized to issue 800 million shares of capital stock, at a par value of $0.001 per share. The Board of Directors of the Fund may increase or decrease the aggregate number of shares of common stock that the Fund has authority to issue. Transactions in Fund shares were as follows:
| | | For the
Six Months Ended
June 30, 2013 | | For the
Year Ended
December 31, 2012 | |
| | | Shares | | Amount | | Shares | | Amount | |
Class A: | |
Sold | | | 1,632,140 | | | $ | 18,892,856 | | | | 3,975,936 | | | $ | 40,333,695 | | |
Issued as reinvestment
of dividends | | | 171,444 | | | | 1,867,027 | | | | 1,124,177 | | | | 12,068,376 | | |
Redeemed | | | (4,792,991 | ) | | | (56,855,616 | ) | | | (9,376,008 | ) | | | (95,550,526 | ) | |
Net decrease | | | (2,989,407 | ) | | $ | (36,095,733 | ) | | | (4,275,895 | ) | | $ | (43,148,455 | ) | |
Class C: | |
Sold | | | 361,560 | | | $ | 4,135,632 | | | | 610,297 | | | $ | 6,288,018 | | |
Issued as reinvestment
of dividends | | | 64,701 | | | | 697,477 | | | | 476,067 | | | | 5,085,364 | | |
Redeemed | | | (1,347,369 | ) | | | (15,431,468 | ) | | | (4,323,804 | ) | | | (43,774,471 | ) | |
Net decrease | | | (921,108 | ) | | $ | (10,598,359 | ) | | | (3,237,440 | ) | | $ | (32,401,089 | ) | |
Class I: | |
Sold | | | 6,297,551 | | | $ | 74,356,890 | | | | 13,115,267 | | | $ | 132,081,431 | | |
Issued as reinvestment
of dividends | | | 629,396 | | | | 6,885,594 | | | | 3,557,985 | | | | 38,240,509 | | |
Redeemed | | | (11,072,377 | ) | | | (126,612,309 | ) | | | (45,999,740 | ) | | | (473,501,292 | ) | |
Net decrease | | | (4,145,430 | ) | | $ | (45,369,825 | ) | | | (29,326,488 | ) | | $ | (303,179,352 | ) | |
Note 6. Borrowings
The Fund, in conjunction with other Cohen & Steers open-end funds, is a party to a $200,000,000 syndicated credit agreement (the credit agreement) with State Street Bank and Trust Company, as administrative agent and operations agent, and the lenders identified in the credit agreement, which expires January 24, 2014. The Fund pays a commitment fee of 0.10% per annum on its proportionate share of the unused portion of the credit agreement.
During the six months ended June 30, 2013, the Fund did not borrow under the credit agreement.
34
COHEN & STEERS INTERNATIONAL REALTY FUND, INC.
NOTES TO FINANCIAL STATEMENTS (Unaudited)—(Continued)
Note 7. Other
In the normal course of business, the Fund enters into contracts that provide general indemnifications. The Fund's maximum exposure under these arrangements is dependent on claims that may be made against the Fund in the future and, therefore, cannot be estimated; however, based on experience, the risk of material loss from such claims is considered remote.
Note 8. Subsequent Events
Management has evaluated events and transactions occurring after June 30, 2013 through the date that the financial statements were issued, and has determined that no additional disclosure in the financial statements is required.
35
COHEN & STEERS INTERNATIONAL REALTY FUND, INC.
OTHER INFORMATION
A description of the policies and procedures that the Fund uses to determine how to vote proxies relating to portfolio securities is available (i) without charge, upon request, by calling 800-330-7348, (ii) on our website at cohenandsteers.com or (iii) on the Securities and Exchange Commission's (the SEC) website at http://www.sec.gov. In addition, the Fund's proxy voting record for the most recent 12-month period ended June 30 is available by August 31 of each year (i) without charge, upon request, by calling 800-330-7348 or (ii) on the SEC's website at http://www.sec.gov.
The Fund files its complete schedule of portfolio holdings with the SEC for the first and third quarters of each fiscal year on Form N-Q. The Fund's Forms N-Q are available (i) without charge, upon request, by calling 800-330-7348 or (ii) on the SEC's website at http://www.sec.gov. In addition, the Forms N-Q may be reviewed and copied at the SEC's Public Reference Room in Washington, DC. Information on the operation of the Public Reference Room may be obtained by calling 800-SEC-0330.
Please note that distributions paid by the Fund to shareholders are subject to recharacterization for tax purposes. The Fund may also pay distributions in excess of the Fund's net investment company taxable income and this excess could be a tax free return of capital distributed from the Fund's assets. The final tax treatment of all distributions is reported to shareholders on their 1099-DIV forms, which are mailed after the close of each calendar year.
APPROVAL OF INVESTMENT ADVISORY AND SUBADVISORY AGREEMENTS
The Board of Directors of the Fund, including a majority of the directors who are not parties to the Fund's investment advisory and subadvisory agreements (the Advisory Agreements), or interested persons of any such party (Independent Directors), has the responsibility under the 1940 Act to approve the Fund's Advisory Agreements for their initial two year term and their continuation annually thereafter at a meeting of the Board of Directors called for the purpose of voting on the approval or continuation. At a telephonic meeting held on June 12, 2013 and at a meeting held in person on June 18, 2013, the Advisory Agreements were discussed and were unanimously continued for a term ending June 30, 2014 by the Fund's Board of Directors, including the Independent Directors. The Independent Directors were represented by independent counsel who assisted them in their deliberations during the meeting and executive session.
In considering whether to continue the Advisory Agreements, the Board of Directors reviewed materials provided by the Investment Advisor and Fund counsel which included, among other things, fee, expense and performance information compared to peer funds (Peer Funds) and performance comparisons to a larger category universe, prepared by an independent data provider; summary information prepared by the Investment Advisor; and a memorandum outlining the legal duties of the Board of Directors. The Board of Directors also spoke directly with representatives of the independent data provider and met with investment advisory personnel. In addition, the Board of Directors considered information provided from time to time by the Investment Advisor throughout the year at meetings of the Board of Directors, including presentations by portfolio managers relating to the investment performance
36
COHEN & STEERS INTERNATIONAL REALTY FUND, INC.
of the Fund and the investment strategies used in pursuing the Fund's objective. In particular, the Board of Directors considered the following:
(i) The nature, extent and quality of services to be provided by the Investment Advisor and the Subadvisors: The Board of Directors reviewed the services that the Investment Advisor and the sub-investment advisors (the Subadvisors) provide to the Fund, including, but not limited to, making the day-to-day investment decisions for the Fund, and, for the Investment Advisor, generally managing the Fund's investments in accordance with the stated policies of the Fund. The Board of Directors also discussed with officers and portfolio managers of the Fund the types of transactions that were being done on behalf of the Fund. Additionally, the Board of Directors took into account the services provided by the Investment Advisor and the Subadvisors to other funds, including those that have investment objectives and strategies similar to the Fund. The Board of Directors next considered the education, background and experience of the Investment Advisor's and Subadvisors' personnel, noting particularly that the favorable history and reputation of the portfolio managers for the Fund has had, and would likely continue to have, a favorable impact on the Fund. The Board of Directors further noted the Investment Advisor's and Subadvisors' ability to attract qualified and experienced personnel. The Board of Directors also considered the administrative services provided by the Investment Advisor, including compliance and accounting services. After consideration of the above factors, among others, the Board of Directors concluded that the nature, extent and quality of services provided by the Investment Advisor and the Subadvisors are adequate and appropriate.
(ii) Investment performance of the Fund and the Investment Advisor and Subadvisors: The Board of Directors considered the investment performance of the Fund versus Peer Funds and compared to a relevant benchmark. The Board of Directors noted that the Fund underperformed the medians of the Peer Funds for the one- and three-year periods, ranking in the third quintile and five out of five funds, respectively; the Fund performed at the peer group median for the five-year period ended March 31, 2013, ranking third out of five funds. The Board of Directors also noted that the Fund had underperformed its benchmark for the one-, three- and five-year periods ended March 31, 2013. The Board of Directors engaged in discussions with the Investment Advisor regarding the contributors and detractors to the Fund's performance during the periods. The Board of Directors also considered supplemental information provided by the Investment Advisor, including a narrative summary of various factors affecting performance, recent changes to the global real estate investment team, and the Investment Advisor's performance in managing other real estate funds. At the Investment Advisor's request, a supplemental peer group was compiled consisting of Class I share (or equivalent) international real estate funds, as a result of a shift by distribution partners offering the lowest fee share classes to their clients. The Board of Directors determined to continue to closely monitor the Fund's performance and requested that the Investment Advisor provide updates for this purpose.
(iii) Cost of the services to be provided and profits to be realized by the Investment Advisor from the relationship with the Fund: Next, the Board of Directors considered the advisory fees and administrative fees payable by the Fund, as well as total expense ratios. As part of its analysis, the Board of Directors gave consideration to the fee and expense analyses provided by the independent data provider. The Board of Directors noted that actual management fee, contractual management fee and total expense ratio were higher than the medians of the Peer Funds, ranking in the fifth quintile for
37
COHEN & STEERS INTERNATIONAL REALTY FUND, INC.
each. The Board of Directors noted that the Fund has a breakpoint of 10 basis points on assets over $1.5 billion; however, the reduced fee is not currently applicable. The Board of Directors considered that although the actual management fee, contractual management fee and total expense ratio were higher than the medians for the Peer Funds, if the fee waiver and expense reimbursement arrangement that became effective on January 1, 2013 was factored, the Fund's total expense ratio would fall below the median of the Peer Funds. The Board of Directors then considered the administrative services provided by the Investment Advisor, including compliance and accounting services, and further noted that the Fund pays an administration fee to the Investment Advisor. The Board of Directors concluded that the Fund's expense structure was generally satisfactory and determined to monitor the Fund's expenses.
The Board of Directors also reviewed information regarding the profitability to the Investment Advisor of its relationship with the Fund. The Board of Directors considered the level of the Investment Advisor's profits and whether the profits were reasonable for the Investment Advisor. Since the Subadvisors are paid by the Investment Advisor and not by the Fund and are affiliates of the Investment Advisor, and the Board of Directors considered the profitability of the Investment Advisor as a whole, the Board of Directors did not consider the Subadvisors' separate profitability to be relevant to their considerations. The Board of Directors took into consideration other benefits to be derived by the Investment Advisor in connection with the Advisory Agreements, noting particularly the research and related services, within the meaning of Section 28(e) of the Securities Exchange Act of 1934, as amended, that the Investment Advisor receives by allocating the Fund's brokerage transactions. The Board of Directors also considered the fees received by the Investment Advisor under the Administration Agreement, and noted the significant services received, such as compliance, accounting and operational services and furnishing office space and facilities for the Fund, and providing persons satisfactory to the Board of Directors to serve as officers of the Fund, and that these services were beneficial to the Fund. The Board of Directors concluded that the profits realized by the Investment Advisor from its relationship with the Fund were reasonable and consistent with the Investment Advisor's fiduciary duties.
(iv) The extent to which economies of scale would be realized as the Fund grows and whether fee levels would reflect such economies of scale: The Board of Directors noted that the Fund's advisory fee schedule contains a breakpoint of 10 basis points once the Fund's assets reached $1.5 billion. The Board of Directors considered the Fund's asset size and determined that there were not at this time significant economies of scale that were not being shared with shareholders.
(v) Comparison of services rendered and fees paid to those under other investment advisory contracts, such as contracts of the same and other investment advisers or other clients: As discussed above in (iii), the Board of Directors compared the fees paid under the Advisory Agreements to those under other investment advisory contracts of other investment advisers managing Peer Funds. The Board of Directors also considered the services rendered, fees paid and profitability under the Advisory Agreements to those under the Investment Advisor's other advisory agreements and advisory contracts with institutional and other clients with similar investment mandates. The Board of Directors also considered the entrepreneurial risk and financial exposure assumed by the Investment Advisor in
38
COHEN & STEERS INTERNATIONAL REALTY FUND, INC.
developing and managing the Fund that the Investment Advisor does not have with institutional and other clients. The Board of Directors determined that on a comparative basis the fees under the Advisory Agreements were reasonable in relation to the services provided.
No single factor was cited as determinative to the decision of the Board of Directors. Rather, after weighing all of the considerations and conclusions discussed above, the Board of Directors, including the Independent Directors, unanimously approved the continuation of the Advisory Agreements.
39
COHEN & STEERS INTERNATIONAL REALTY FUND, INC.
Cohen & Steers Privacy Policy
Facts | | What Does Cohen & Steers Do With Your Personal Information? | |
Why? | | Financial companies choose how they share your personal information. Federal law gives consumers the right to limit some but not all sharing. Federal law also requires us to tell you how we collect, share, and protect your personal information. Please read this notice carefully to understand what we do. | |
What? | | The types of personal information we collect and share depend on the product or service you have with us. This information can include:
• Social Security number and account balances
• Transaction history and account transactions
• Purchase history and wire transfer instructions | |
How? | | All financial companies need to share customers' personal information to run their everyday business. In the section below, we list the reasons financial companies can share their customers' personal information; the reasons Cohen & Steers chooses to share; and whether you can limit this sharing. | |
Reasons we can share your personal information | | Does Cohen & Steers
share? | | Can you limit this
sharing? | |
For our everyday business purposes—
such as to process your transactions, maintain your account(s), respond to court orders and legal investigations, or reports to credit bureaus | | Yes | | No | |
For our marketing purposes—
to offer our products and services to you | | Yes | | No | |
For joint marketing with other financial companies— | | No | | We don't share | |
For our affiliates' everyday business purposes—
information about your transactions and experiences | | No | | We don't share | |
For our affiliates' everyday business purposes—
information about your creditworthiness | | No | | We don't share | |
For our affiliates to market to you— | | No | | We don't share | |
For non-affiliates to market to you— | | No | | We don't share | |
Questions? Call 800.330.7348
40
COHEN & STEERS INTERNATIONAL REALTY FUND, INC.
Cohen & Steers Privacy Policy—(Continued)
Who we are | | | |
Who is providing this notice? | | Cohen & Steers Capital Management, Inc., Cohen & Steers Asia Limited, Cohen & Steers UK Limited, Cohen & Steers Europe SPRL, Cohen & Steers Securities, LLC, Cohen & Steers Private Funds and Cohen & Steers Open and Closed-End Funds (collectively, Cohen & Steers). | |
What we do | | | |
How does Cohen & Steers protect my personal information? | | To protect your personal information from unauthorized access and use, we use security measures that comply with federal law. These measures include computer safeguards and secured files and buildings. We restrict access to your information to those employees who need it to perform their jobs, and also require companies that provide services on our behalf to protect your information. | |
How does Cohen & Steers collect my personal information? | | We collect your personal information, for example, when you:
• Open an account or buy securities from us
• Provide account information or give us your contact information
• Make deposits or withdrawals from your account
We also collect your personal information from other companies. | |
Why can't I limit all sharing? | | Federal law gives you the right to limit only:
• sharing for affiliates' everyday business purposes—information about your creditworthiness
• affiliates from using your information to market to you
• sharing for non-affiliates to market to you
State law and individual companies may give you additional rights to limit sharing. | |
Definitions | | | |
Affiliates | | Companies related by common ownership or control. They can be financial and nonfinancial companies.
• Cohen & Steers does not share with affiliates. | |
Non-affiliates | | Companies not related by common ownership or control. They can be financial and nonfinancial companies.
• Cohen & Steers does not share with non-affiliates. | |
Joint marketing | | A formal agreement between non-affiliated financial companies that together market financial products or services to you.
• Cohen & Steers does not jointly market. | |
41
COHEN & STEERS INTERNATIONAL REALTY FUND, INC.
Cohen & Steers Investment Solutions
COHEN & STEERS GLOBAL REALTY SHARES
• Designed for investors seeking total return, investing primarily in global real estate equity securities
• Symbols: CSFAX, CSFBX*, CSFCX, CSSPX
COHEN & STEERS INSTITUTIONAL REALTY SHARES
• Designed for institutional investors seeking total return, investing primarily in REITs
• Symbol: CSRIX
COHEN & STEERS REALTY INCOME FUND
• Designed for investors seeking total return, investing primarily in real estate securities with an emphasis on both income and capital appreciation
• Symbols: CSEIX, CSBIX*, CSCIX, CSDIX
COHEN & STEERS INTERNATIONAL REALTY FUND
• Designed for investors seeking total return, investing primarily in international real estate securities
• Symbols: IRFAX, IRFCX, IRFIX
COHEN & STEERS
EMERGING MARKETS REAL ESTATE FUND
• Designed for investors seeking total return, investing primarily in emerging market real estate securities
• Symbols: APFAX, APFCX, APFIX
COHEN & STEERS REALTY SHARES
• Designed for investors seeking total return, investing primarily in REITs
• Symbol: CSRSX
COHEN & STEERS
INSTITUTIONAL GLOBAL REALTY SHARES
• Designed for institutional investors seeking total return, investing primarily in global real estate securities
• Symbol: GRSIX
COHEN & STEERS GLOBAL INFRASTRUCTURE FUND
• Designed for investors seeking total return, investing primarily in global infrastructure securities
• Symbols: CSUAX, CSUBX*, CSUCX, CSUIX
COHEN & STEERS DIVIDEND VALUE FUND
• Designed for investors seeking long-term growth of income and capital appreciation, investing primarily in dividend paying common stocks and preferred stocks
• Symbols: DVFAX, DVFCX, DVFIX
COHEN & STEERS
PREFERRED SECURITIES AND INCOME FUND
• Designed for investors seeking total return (high current income and capital appreciation), investing primarily in preferred and debt securities
• Symbols: CPXAX, CPXCX, CPXIX
COHEN & STEERS REAL ASSETS FUND
• Designed for investors seeking total return and the maximization of real returns during inflationary environments by investing primarily in real assets
• Symbols: RAPAX, RAPCX, RAPIX, RAPRX, RAPZX
Distributed by Cohen & Steers Securities, LLC.
COHEN & STEERS GLOBAL REALTY MAJORS ETF
• Designed for investors who seek a relatively low-cost "passive" approach for investing in a portfolio of real estate equity securities of companies in a specified index
• Symbol: GRI
Distributed by ALPS Distributors, Inc.
ISHARES COHEN & STEERS
REALTY MAJORS INDEX FUND
• Designed for investors who seek a relatively low-cost "passive" approach for investing in a portfolio of real estate equity securities of companies in a specified index
• Symbol: ICF
Distributed by SEI Investments Distribution Co.
* Class B shares are no longer offered except through dividend reinvestment and permitted exchanges by existing Class B shareholders.
Please consider the investment objectives, risks, charges and expenses of the fund carefully before investing. A summary prospectus and prospectus containing this and other information can be obtained by calling 800-330-7348 or by visiting cohenandsteers.com. Please read the summary prospectus and prospectus carefully before investing.
42
COHEN & STEERS INTERNATIONAL REALTY FUND, INC.
OFFICERS AND DIRECTORS
Robert H. Steers
Director and co-chairman
Martin Cohen
Director and co-chairman
Michael G. Clark
Director
Bonnie Cohen
Director
George Grossman
Director
Richard E. Kroon
Director
Richard J. Norman
Director
Frank K. Ross
Director
C. Edward Ward, Jr.
Director
Adam M. Derechin
President and chief executive officer
Joseph M. Harvey
Vice president
Jon Cheigh
Vice president
Francis C. Poli
Secretary
James Giallanza
Treasurer and chief financial officer
Lisa D. Phelan
Chief compliance officer
KEY INFORMATION
Investment Advisor
Cohen & Steers Capital Management, Inc.
280 Park Avenue
New York, NY 10017
(212) 832-3232
Co-administrator and Custodian
State Street Bank and Trust Company
One Lincoln Street
Boston, MA 02111
Transfer Agent
Boston Financial Data Services, Inc.
30 Dan Road
Canton, MA 02021
(800) 437-9912
Legal Counsel
Ropes & Gray LLP
1211 Avenue of the Americas
New York, NY 10036
Distributor
Cohen & Steers Securities, LLC
280 Park Avenue
New York, NY 10017
Nasdaq Symbol: Class A—IRFAX
C—IRFCX
I—IRFIX
Website: cohenandsteers.com
This report is authorized for delivery only to shareholders of Cohen & Steers International Realty Fund, Inc. unless accompanied or preceded by the delivery of a currently effective prospectus setting forth details of the Fund. Performance data quoted represent past performance. Past performance is no guarantee of future results and your investment may be worth more or less at the time you sell your shares.
43
COHEN & STEERS
INTERNATIONAL REALTY FUND
280 PARK AVENUE
NEW YORK, NY 10017
eDelivery NOW AVAILABLE
Stop traditional mail delivery; receive your shareholder reports and prospectus online.
Sign up at cohenandsteers.com

Semiannual Report June 30, 2013
Cohen & Steers International Realty Fund
Item 2. Code of Ethics.
Not applicable.
Item 3. Audit Committee Financial Expert.
Not applicable.
Item 4. Principal Accountant Fees and Services.
Not applicable.
Item 5. Audit Committee of Listed Registrants.
Not applicable.
Item 6. Schedule of Investments.
Included in Item 1 above.
Item 7. Disclosure of Proxy Voting Policies and Procedures for Closed-End Management Investment Companies.
Not applicable.
Item 8. Portfolio Managers of Closed-End Investment Companies.
Not applicable.
Item 9. Purchases of Equity Securities by Closed-End Management Investment Company and Affiliated Purchasers.
Not applicable.
Item 10. Submission of Matters to a Vote of Security Holders.
None.
Item 11. Controls and Procedures.
(a) The registrant’s principal executive officer and principal financial officer have concluded, based upon their evaluation of the registrant’s disclosure controls and procedures as conducted within 90 days of the filing date of this report, that these disclosure controls and procedures provide reasonable assurance that material information required to be disclosed by the registrant in the report it files or submits on Form N-CSR is recorded, processed, summarized and reported within the time periods specified in the Securities and Exchange Commission’s rules and forms
and that such material information is accumulated and communicated to the registrant’s management, including its principal executive officer and principal financial officer, as appropriate, in order to allow timely decisions regarding required disclosure.
(b) There were no changes in the registrant’s internal control over financial reporting that occurred during the second fiscal quarter of the period covered by this report that have materially affected, or are reasonably likely to materially affect, the registrant’s internal control over financial reporting.
Item 12. Exhibits.
(a)(1) Not applicable.
(a)(2) Certifications of principal executive officer and principal financial officer as required by Rule 30a-2(a) under the Investment Company Act of 1940.
(a)(3) Not applicable.
(b) Certifications of chief executive officer and chief financial officer as required by Rule 30a- 2(b) under the Investment Company Act of 1940.
SIGNATURES
Pursuant to the requirements of the Securities Exchange Act of 1934 and the Investment Company Act of 1940, the registrant has duly caused this report to be signed on its behalf by the undersigned, thereunto duly authorized.
COHEN & STEERS INTERNATIONAL REALTY FUND, INC.
By: | /s/ Adam M. Derechin | |
| Name: Adam M. Derechin | |
| Title: President and Chief Executive Officer | |
| |
Date: August 23, 2013 | |
Pursuant to the requirements of the Securities Exchange Act of 1934 and the Investment Company Act of 1940, this report has been signed below by the following persons on behalf of the registrant and in the capacities and on the dates indicated.
By: | /s/ Adam M. Derechin | |
| Name: | Adam M. Derechin | | |
| Title: | President and Chief Executive Officer | | |
| | (Principal Executive Officer) | | |
| |
By: | /s/ James Giallanza | |
| Name: | James Giallanza | |
| Title: | Treasurer and Chief Financial Officer | |
| | (Principal Financial Officer) | |
| |
| |
Date: August 23, 2013 | |
| | | | | |