Table of Contents
As filed with the Securities and Exchange Commission on May 13, 2008
Registration No. 333-146853
UNITED STATES SECURITIES AND EXCHANGE COMMISSION
Washington, D.C. 20549
AMENDMENT NO. 5 TO
Form S-1
REGISTRATION STATEMENT
UNDER
THE SECURITIES ACT OF 1933
AUSAM ENERGY CORPORATION
(Exact Name of Registrant as Specified in Its Charter)
| Alberta, Canada (State or Other Jurisdiction of Incorporation or Organization) | 1311 (Primary Standard Industrial Classification Code Number) | 98-0552537 (I.R.S. Employer Identification Number) |
1430, 1122 — 4th Street S.W.
Calgary, Alberta T2R 1M1
(403) 215-2380
(Address, Including Zip Code, and Telephone Number, including Area Code, of Registrant’s Principal Executive Offices)
| Mark G. Avery, Chief Executive Officer and President Ausam Energy Corporation 1430, 1122 — 4th Street S.W. Calgary, Alberta T2R 1M1 (403) 215-2380 (NAME, Address, Including Zip Code, and Telephone Number, Including Area Code, of Agent for Service) | Copies to: T. Mark Kelly Vinson & Elkins L.L.P. 1001 Fannin, Suite 2300 Houston, Texas 77002 (713) 758-2222 |
Approximate date of commencement of proposed sale to the public: As soon as practicable after this Registration Statement becomes effective.
If any of the securities being registered on this form are to be offered on a delayed or continuous basis pursuant to Rule 415 under the Securities Act of 1933, check the following box. þ
If this Form is filed to register additional securities for an offering pursuant to Rule 462(b) under the Securities Act, check the following box and list the Securities Act registration statement number of the earlier effective registration statement for the same offering. o
If this Form is a post-effective amendment filed pursuant to Rule 462(c) under the Securities Act, check the following box and list the Securities Act registration statement number of the earlier effective registration statement for the same offering. o
If this Form is a post-effective amendment filed pursuant to Rule 462(d) under the Securities Act, check the following box and list the Securities Act registration statement number of the earlier effective registration statement for the same offering. o
If delivery of the prospectus is expected to be made pursuant to Rule 434, please check the following box. o
Indicate by check mark whether the registrant is a large accelerated filer, an accelerated filer, a non-accelerated filer, or a smaller reporting company. See the definitions of “large accelerated filer,” “accelerated filer” and “smaller reporting company” inRule 12b-2 of the Exchange Act. (Check one):
Large accelerated filer o | Accelerated filer o | Non-accelerated filer o | Smaller reporting company þ | ||||||
| (Do not check if a smaller reporting company) |
CALCULATION OF REGISTRATION FEE
| Proposed Maximum | Proposed Maximum | |||||||||||
| Title of Each Class of | Amount to be | Offering Price per | Aggregate Offering | Amount of | ||||||||
| Securities to be Registered | Registered(1) | Share(2) | Price(1)(2) | Registration Fee | ||||||||
| Common shares, without par value | 48,007,111 | $2.76 | $132,499,626 | $5,207(2) | ||||||||
| (1) | Includes (i) 10,371,216 common shares issuable upon exercise of warrants at various exercise prices; (ii) 10,657,914 common shares to be issued upon conversion of the registrant’s outstanding convertible debenture; (iii) up to 3,024,251 additional common shares to be issued upon exercise of options at various exercise prices; and (iv) 23,953,730 outstanding common shares. |
| (2) | Estimated solely for the purpose of calculating the registration fee pursuant to Rule 457(o) under the Securities Act of 1933 based on the maximum aggregate offering price of the Registrant’s common shares. A registration fee of $4,173 was paid with the original filing, an additional $57 was paid with the filing of Amendment No. 1 and $977.24 is paid with the filing of this Amendment No. 5. |
The Registrant hereby amends this Registration Statement on such date or dates as may be necessary to delay its effective date until the Registrant shall file a further amendment that specifically states that this registration statement shall thereafter become effective in accordance with Section 8(a) of the Securities Act of 1933 or until the registration statement shall become effective on such date as the Securities and Exchange Commission acting pursuant to said Section 8(a), may determine.
Table of Contents
| The information in this prospectus is not complete and may be changed. We may not sell these securities until the registration statement filed with the Securities and Exchange Commission is effective. This prospectus is not an offer to sell these securities and is not soliciting an offer to buy these securities in any state where the offer or sale is not permitted. |
SUBJECT TO COMPLETION, DATED MAY 13, 2008
PROSPECTUS
48,007,111 Shares
Ausam Energy Corporation
Common Shares
This prospectus relates to the offer and sale, from time to time, of up to 48,007,111 common shares (“Common Shares”) of Ausam Energy Corporation, an Alberta corporation, held by or issuable to the selling shareholders listed beginning on page 66 of this prospectus. The Common Shares being offered by the selling shareholders are currently issued and outstanding, issuable upon conversion of outstanding convertible debt securities, issuable upon exercise of outstanding options, or issuable upon exercise of outstanding warrants. See “Selling Shareholders”.
Ausam will not receive any proceeds from the sale of the shares by the selling shareholders. All the proceeds from the sale of shares will be for the respective account of each selling shareholder.
For a description of the plan of distribution of the shares, please see page 72 of this prospectus. Pursuant to such plan of distribution, until such time as our Common Shares are listed on the American Stock Exchange (“AMEX”) sales of Common Stock by selling shareholders will fall within a range of prices from $0.79 (CDN$0.80) to $2.76 (CDN$2.79). The range of prices for the Common Shares since September 15, 2004 is $0.59 (CDN$0.60) to $7.40 (CDN$7.49). If and when our listing on AMEX is approved, we expect that shares will be sold at the prevailing market prices of the Common Shares existing from time to time.
Our Common Shares are listed on the TSX Venture Exchange (the “TSXV”) under the symbol “AZE” and we plan to file an application to list our Common Shares in the United States on the American Stock Exchange (“AMEX”), although we cannot be certain that the AMEX will approve our application. Our current share price and market capitalization are below the minimum required for admission to trading on AMEX. On May 9, 2008, the last reported sale price for our common shares on the TSX Venture Exchange was CDN$1.70 or $1.68. At present there is no established public trading market in the United States for our Common Shares.
Investing in our Common Shares involves risks. Please read “Risk Factors” beginning on page 6.
This prospectus has not been filed in respect of, and will not qualify, any distribution of the Common Shares in any province or territory of Canada.
Neither the Securities and Exchange Commission nor any state securities commission has approved or disapproved of these securities or determined if this prospectus is truthful or complete. Any representation to the contrary is a criminal offense.
May 13, 2008
TABLE OF CONTENTS
| 1 | ||||||||
| 5 | ||||||||
| 6 | ||||||||
| 15 | ||||||||
| 16 | ||||||||
| 16 | ||||||||
| 18 | ||||||||
| 19 | ||||||||
| 23 | ||||||||
| 42 | ||||||||
| 52 | ||||||||
| 58 | ||||||||
| 63 | ||||||||
| 64 | ||||||||
| 64 | ||||||||
| 66 | ||||||||
| 72 | ||||||||
| 74 | ||||||||
| 75 | ||||||||
| 80 | ||||||||
| 80 | ||||||||
| 80 | ||||||||
| F-1 | ||||||||
| A-1 | ||||||||
| Consent of KPMG LLP | ||||||||
You should rely only on the information contained in this prospectus. We have not authorized any other person to provide you with different information. If anyone provides you with different or inconsistent information, you should not rely on it. We are not making an offer to sell these securities in any jurisdiction where an offer or sale is not permitted. You should assume that the information appearing in this prospectus is accurate as of the date on the front cover of this prospectus only. Our business, financial condition, results of operations and prospects may have changed since that date.
Unless otherwise specified or the context otherwise requires, all dollar amounts in this prospectus are expressed in U.S. dollars. Canadian dollars, when used, are expressed with the symbol “CDN$”. Australian dollars, when used, are expressed with the symbol “AU$.” Unless otherwise specified, where dollars are shown on a converted basis, the conversion is based upon an exchange ratio of $1.00 = CDN$1.01180, the exchange rate in effect on May 9, 2008, except for dollars set forth in or derived from the financial statements, where the exchange rate is derived as of the date of the financial statements.
Table of Contents
PROSPECTUS SUMMARY
This summary highlights information contained elsewhere in this prospectus. You should read the entire prospectus carefully, including the detailed information contained under the heading “Risk Factors”, the consolidated financial statements and the accompanying notes to those financial statements included elsewhere in this prospectus. Unless otherwise indicated or required by the context, (i) “we”, “us”, “our”, and “Ausam” refer to Ausam Energy Corporation and its subsidiaries and predecessors, (ii) “SKH Purchase” refers to our February 2007 acquisition from SKH Management L.P. and four affiliated investment partnerships (“SKH” or the “Vendors”) of approximately 60,158 acres (46,852 net acres) controlling 19 prospects in the United States (the “SKH Prospects”), (iii) “Debenture” refers to our 9% senior secured convertible debenture, (iv) “warrants” refers to the warrants to purchase Common Shares issued to investors in connection with certain financing transactions or to our placement agents in connection with the offering of Common Shares, convertible debentures and certain other debt securities as partial compensation for their services, (v) all dollar amounts appearing in this prospectus are stated in U.S. dollars unless specifically noted in Canadian dollars (“CDN$”) or Australian dollars (“AU$”), and (vi) all financial data included in this prospectus has been prepared in accordance with generally accepted accounting principles in the United States unless otherwise specifically noted. We have provided definitions for some of the natural gas and oil industry terms used in this prospectus in the “Glossary of Natural Gas and Oil Terms” onpage A-1 of this prospectus.
AUSAM ENERGY CORPORATION
Our Business
We have been engaged in oil and natural gas exploration and development along the Gulf Coast of the United States (“U.S.”) since 2006 and in Australia since January 2000. In early 2006, management and our board of directors decided to seek financing to acquire the SKH Prospects and so reposition our company for exploration and production in the U.S. onshore Gulf Coast. During 2005 and 2006 we completed a series of private financing transactions, including the issuance of the Debenture, that were specifically designed to permit us to initiate the Gulf Coast effort by consummating the SKH Purchase and drilling the prospects thereby acquired.
Beginning in 2000 our initial strategy had been to enter the Australian oil and gas exploration and development industry through the acquisition of prospective acreage, development of discrete prospects and the application of underbalanced drilling and completion techniques (“UBD”), to specific hydrocarbon prone formations in known onshore oil and gas provinces of Australia. Our plan developed to include the identification of producing fields that would be suited to UBD, gaining control of, or participating in, the target fields and adjacent acreage; and then applying UBD to those features with certain formation and field characteristics. Pursuing this plan, we assembled approximately 800,000 net acres in the highly prospective Surat/Bowen Basin of Queensland, Australia.
During 2004, we established a corporate office in Calgary, Alberta, Canada, and, through a reverse takeover of Northlinks Limited on the TSX Venture Exchange (“TXSV”) and a series of private placements, raised more than CDN$24 million at prices ranging from CDN$0.75 to CDN$0.90 per pre-consolidation common share (or in certain cases, units), or CDN$3.75 to CDN$4.50 per Common Share (or unit). Subscribers for units included institutional investors, as well as several private investors with a history of investing in the oil and gas industry. We used the majority of the capital to drill fifteen wells in Australia in pursuit of commercial gas production.
During late 2005, we were offered opportunities for us to invest in, or participate with,and/or acquire certain companies and assets owned, or controlled by, certain shareholders. One of these shareholders, who is also an investor in SKH, proposed the SKH transaction to us. At the time, this shareholder was not a control person of either Ausam or SKH. After a thorough evaluation of the portfolio of prospects owned by SKH, we determined that the SKH Prospects clearly offered diversity of risk and potential up-side that exceed the potential returns offered by our existing and other previously identified opportunities in Australia.
1
Table of Contents
Our board of directors has determined that we should sell or dispose of our Australian assets, and we have engaged an Australian investment bank to explore strategic options with respect to our Australian subsidiary and assets. As of December 31, 2007, we have proved reserves and production from our United States assets and are no longer deemed a “development-stage company.”
Our Strategy
The completion of the SKH Purchase represents a significant change in our strategy. We now have a diverse suite of prospects suited to conventional drilling and representing a range of potential sizes and a number of different play types and risk profiles located in Texas, Louisiana, Mississippi, Alabama, and Arkansas, instead of strictly focusing our efforts on the application of advanced drilling techniques on prospects and in mature gas fields in Australia. We intend initially to concentrate on the farmout and subsequent drilling of lower-risk prospects in the U.S. in order to establish cash flow either from operations or from the sale of developed prospects to third parties. At the same time, we are marketing the larger higher-risk prospects to parties with localized expertise, with the objective of accelerating the drilling timetable of potentially higher impact prospects while risk adjusting our participation interest, and exposure to drilling risk, per prospect.
Further, given that we now own 21 prospects in the U.S. (2 of which have now been developed), in 18 of which we own approximately 100% interest, we are in a position to farmout a portion of our interest or to trade percentage interests in our prospects for interests in other prospects, with the expectation of increasing the number of prospects and reducing the overall risk of the prospect portfolio. We intend to operate some, but not all, of the SKH Prospects, enabling us to recover a portion of our drilling overhead and attendant administrative costs. We also expect to sell or relinquish some prospects that we deem either too high-risk or not economically attractive. Due to our ongoing relationship with SKH as described below under “Business — The SKH Purchase”, we will have access to additional prospects that we may elect to acquire under commercial industry terms. In addition, we expect to evaluate prospects brought to us from time to time by third parties, including our shareholders, and acquire interests in those we deem attractive.
We do not intend or expect to maintain 100% ownership in any of our United States properties and we are actively seeking industry partners. Actual drilling results as well as the evaluation of and participation in other drilling opportunities will change the scope and timing of our plans. We intend to closely manage the timing and participation interest of our drilling program in order to optimize the use of existing funds. Given the scope of the proposed drilling program and the opportunities owned by us, we expect that additional funds will be required.
In order to fund the initial development of our prospects, we have entered into an agreement, described in “Recent Developments” below, which provided us with a source of additional financing. This financing, by itself, will not be sufficient to fund our entire proposed drilling program. The funds we have on hand together with funds expected to be received from farmout arrangements are considered by management to be sufficient to finance the majority of the short term drilling and exploration program as well as operating expenses.
In March 2008, we determined to dispose of our Australia assets through a sale or merger with another company.
In the event our drilling program results in commercial quantities of natural gas and oil, we will need to obtain additional funds for processing facilities, infrastructure and potentially for development drilling. We cannot be certain we will be able to raise additional funds through equity or debt offerings on terms that are satisfactory to our shareholders, the Debenture holder or management.
Recent Developments
On July 5, 2007, we issued a $25,000,000 (equivalent to CDN$26,500,000 at the then-current exchange rate of $1=CDN$1.06) 9% senior secured convertible debenture due July 3, 2012 (the “Debenture”) and an aggregate of 4,461,100 warrants (the “Debenture Warrants”) to the Huff Energy Fund L.P. (“Huff”). The principal amount of the Debenture is convertible into Common Shares at CDN$3.00 per Common Share (after
2
Table of Contents
the September 2007 consolidation described below), subject to adjustment of the conversion price under certain conditions. The Debenture Warrants may be exercised to purchase Common Shares until the close of business on July 3, 2012 at a price of CDN$3.00 per Common Share (as adjusted for the September 2007 consolidation described below), subject to adjustment of the conversion price under certain conditions. Also, Huff received 190,968 Common Shares as a commitment fee.
In connection with this transaction (the “Huff Transaction”), Huff was granted registration rights with respect to the Common Shares issued to it in the transaction and the Common Shares which Huff may acquire upon exercise of its Debenture Warrants and conversion of the Debenture. Under the terms of the Debenture, we may pay the interest due for any period ending on or prior to June 29, 2009 by a deemed increase in the principal amount of the Debenture. If we do this, the Debenture would be convertible into 10,071,955 Common Shares on June 30, 2009 assuming current exchange rates. If our Common Shares become listed on the AMEX and the trading volume there is greater than on the TSXV, the exchange rate becomes fixed at CDN$1=0.9340, which would result in 10,657,914 Common Shares being issued upon conversion of the Debenture.
On July 8, 2007, we redeemed 3,333,333 First Preferred Shares, Series 2, which were all of the preferred shares that were then issued and outstanding. Under the terms of issuance, the First Preferred Shares, Series 2, were redeemed for $3.00 per share. Mr. William Hitchcock, chairman of our board of directors, held 1,666,666 of the First Preferred Shares, Series 2.
On September 7, 2007, we raised $677,080 through the sale of units at a price of $2.70 per unit, each such unit being comprised of one Common Share and one half of one warrant (the “Common Unit Warrants”). The Common Unit Warrants may be exercised to purchase Common Shares at a price of CDN$3.25 per Common Share (after the September 2007 consolidation described below) for two years from the date of issuance.
On September 26, 2007, all issued and outstanding Common Shares were consolidated on a basis of one new Common Share for each five previously issued and outstanding Common Shares. At the same time, the symbol under which we trade on the TSXV was changed from “AUZ” to “AZE.”
On September 30, 2007, the principal amount of the Debenture was deemed to have increased by $556,250 as payment of the quarterly interest due. On December 31, 2007, the principal amount of the Debenture was deemed to have increased by $575,016 as payment of the quarterly interest due, and on March 31, 2008 the principal amount of the Debenture was deemed to have increased by $587,953 as payment of the quarterly interest due. As of March 31, 2008, the principal amount of the Debenture was $26,719,219.
Corporate Information
We are a public oil and gas exploration and production company trading on the TSXV under the symbol “AZE”, with oil and gas properties and operations in the United States and Australia. On July 30, 2004, through a reverse takeover (the “RTO”), we acquired all of the outstanding shares of Ausam Resources Pty Ltd (“ARL”), an Australian unlisted public oil and gas company, and subsequently became a listed Canadian based oil and gas company. During 2006, we drilled and participated in four wells in Australia and on September 22, 2006 we executed an agreement relating to the acquisition of certain oil and gas leases (the “Leases”) containing the SKH Prospects. On February 8, 2007, we closed the SKH Purchase and also closed financing transactions aggregating approximately $46 million. On July 5, 2007 we closed the Huff Transaction involving the issuance of the Debenture. On September 7, 2007, we closed on a private placement of common share units which raised $677,080. During 2007, we participated in three wells in the U.S. and five wells in Australia.
Our principal office is located at 1430, 1122 Fourth Street SW, Calgary, Alberta T2R 1M1 Canada. The telephone number of our principal office is +1(403) 215-2380. Additional information can be found on our web site at www.ausamenergy.com.
3
Table of Contents
Risk Factors
Although we are optimistic about the potential results from drilling the SKH Prospects, we do not have large established oil and gas reserves and we have never made a profit. Although we intend to exert efforts to make profits in the future, there is no assurance that we will ever make profits from our business as our business is subject to a number of risk factors, including all of the risks normally associated with a small company with limited operating history in the oil and natural gas exploration, development and production business.
Because of the size of our asset portfolio, drilling all of our prospects by ourselves would require significantly more capital than we have available. We expect to farm out or sell interests in our prospects to decrease the amount of capital required, but our ability to complete any such farmouts or sales will depend on industry conditions at the time, which are beyond our ability to predict. We expect to raise funds through the issuance of additional equity or debt, but we may not be able to do so on terms that we would find acceptable due to market conditions, including the market interest in oil and gas investments.
Our assets are located in two distinct regions: (i) onshore in the U.S. states of Texas, Louisiana, Mississippi, Alabama and Arkansas and (ii) onshore in the Australian states of Queensland, Victoria, Western Australia and South Australia. The prices that we could obtain for any natural gas that we find and can produce will be determined by market conditions in those regions, which pricing is beyond our ability to control. Regional natural gas prices can vary significantly and such variations could have a material effect on our ability to operate profitably in a given region.
Although our Common Shares have been traded on the TSXV since September 2004, there is limited liquidity in the market for our Common Shares. Sales of small numbers of Common Shares have, in the past, resulted in large swings in the market price of Common Shares. Certain individuals and entities own or control relatively large blocks of shares, the disposal of which could have material adverse impacts on the market price of Common Shares.
A broader discussion of some of the potential risks associated with investment in our company is included in the “RISK FACTORS” section of this document.
4
Table of Contents
THE OFFERING
The Common Shares to be registered hereunder constitute 23,953,730 shares of our currently issued and outstanding Common Shares, together with those Common Shares which are to be issued pursuant to (i) the exercise of currently outstanding warrants to purchase Common Shares; (ii) the conversion of the Debenture, including the increase in principal amount of the Debenture due to interest that may accrue through March 31, 2009; and (iii) the exercise of options currently issued under our Stock Option Plan (the “Stock Option Plan”) as approved by our shareholders on July 5, 2007.
5
Table of Contents
RISK FACTORS
The following are certain risk factors related to our business. The following information is a summary only of certain risk factors and is qualified in its entirety by reference to, and must be read in conjunction with, the detailed information appearing elsewhere in this prospectus.
There can be no assurance that our future exploration and development efforts will result in the discovery and development of additional commercial accumulations of oil and natural gas.
The properties and permits held by us are located in areas historically prospective for oil and natural gas. However, no assurances can be made that any well will produce commercial quantities of hydrocarbons. Furthermore, although there is pipeline infrastructure located in these areas, our ability to market any production will depend in part on the successful negotiation of contracts at prices acceptable to us and on available capacity in the pipeline infrastructure.
Our business is subject to the risks normally encountered in the oil and natural gas industry such as: the marketability of, and prices for, oil and natural gas; competition with companies having greater resources; acquisition, exploration and production risks; the need for capital; fluctuations in the market price and demand for oil and natural gas; and regulation of the oil and natural gas industry by various levels of government. The success of exploration or development projects cannot be assured. Our future performance will depend significantly on the ability, expertise, judgment, discretion, integrity and good faith of our management.
Our Future Profitability is Dependent Upon Our Finding Oil or Natural Gas in Commercial Quantities
Oil and natural gas operations involve many risks that even a combination of experience, knowledge and careful evaluation may not be able to overcome. Our long-term commercial success depends on our ability to find, acquire, develop and commercially produce oil and natural gas reserves. Without the continual addition of new reserves, any existing reserves we may have at any particular time and the production therefrom will decline over time as such existing reserves are exploited. A future increase in our reserves will depend not only on our ability to explore and develop any properties we may have from time to time, but also on our ability to select and acquire suitable producing properties or exploration prospects. No assurance can be given that we will be able to continue to locate satisfactory properties for acquisition or participation. Moreover, even if such acquisitions or participations are identified, we may determine that current markets, terms of acquisition and participation or pricing conditions make such acquisitions or participations uneconomic. There is no assurance that commercial quantities of oil and natural gas will be discovered or acquired by us.
Future oil and natural gas exploration may involve unprofitable efforts, not only from dry wells, but also from wells that are productive but do not produce sufficient net revenues to return a profit after drilling, operating and other costs. Completion of a well does not assure a profit on the investment or recovery of drilling, completion and operating costs. In addition, drilling hazards or environmental damage could greatly increase the cost of operations, and various field operating conditions may adversely affect the production from successful wells. These conditions include delays in obtaining governmental approvals or consents, shut-ins of connected wells resulting from extreme weather conditions, insufficient storage or transportation capacity or other geological and mechanical conditions. While diligent well supervision and effective maintenance operations can contribute to maximizing production rates over time, production delays and declines from normal field operating conditions cannot be eliminated and can be expected to adversely affect revenue and cash flow levels to varying degrees.
Drilling for and producing oil and natural gas are high-risk activities
Oil and natural gas exploration development and production operations are subject to all the risks and hazards typically associated with such operations, including hazards such as fire, explosion, blowouts, cratering, sour gas releases and spills, each of which could result in substantial damage to oil and natural gas wells, production facilities, other property and the environment or in personal injury or death. In accordance with industry practice, we arenot fully insured against all of these risks, nor are all such risks insurable. Although we maintain liability insurance in amounts that we consider consistent with industry practice, the
6
Table of Contents
nature of these risks is such that liabilities could exceed policy limits, in which event we could incur significant costs that could have a material adverse effect upon our financial condition. Oil and natural gas production operations are also subject to all the risks typically associated with such operations, including encountering unexpected formations or pressures, premature decline of reservoirs, the invasion of water into producing formations, and other types of reservoir damage. Losses resulting from the occurrence of any of these risks could have a material adverse effect on future results of operations, liquidity and financial condition.
Competition is Intense in the Oil and Natural Gas Industry, which May Adversely Affect Our Profitability
The petroleum industry is competitive in all its phases. We compete with numerous other participants in the search for, and the acquisition of, oil and natural gas properties and in the marketing of oil and natural gas. Our competitors include oil and natural gas companies that have substantially greater financial resources, staff and facilities than we do. Our ability to increase reserves in the future will depend not only on our ability to explore and develop our present properties, but also on our ability to select and acquire suitable producing properties or prospects for exploratory drilling. Competitive factors in the distribution and marketing of oil and natural gas include price and methods and reliability of delivery.
Required Expenditures to Comply With Environmental Laws and Regulations May Restrict Our Ability to Operate Profitably
Our business involving the acquisition, development and exploitation of natural gas and oil properties is subject to extensive and stringent federal, state and local laws and regulations governing the discharge of materials into the environment or otherwise relating to environmental protection. Our operations are subject to the same environmental laws and regulations as other similarly situated companies in the natural gas and oil industry. These laws and regulations may:
| • | require the acquisition of various permits before drilling commences; | |
| • | require the installation of expensive pollution control equipment; | |
| • | restrict the types, quantities and concentration of various substances that can be released into the environment in connection with drilling and production activities; | |
| • | limit or prohibit drilling activities on lands lying within wilderness, wetlands and other protected areas; | |
| • | require remedial measures to prevent pollution from historical and ongoing operations, such as pit closure and plugging of abandoned wells; | |
| • | impose substantial liabilities for pollution resulting from our operations; and | |
| • | with respect to operations affecting federal lands or leases, require preparation of a Resource Management Plan, an Environmental Assessment,and/or an Environmental Impact Statement. |
These laws, rules and regulations may also restrict the rate of natural gas and oil production below the rate that would otherwise be possible. The regulatory burden on the natural gas and oil industry increases the cost of doing business in the industry and consequently affects profitability. Additionally, changes in environmental laws and regulations occur frequently, and any changes that result in more stringent and costly waste handling, disposal andclean-up requirements for the natural gas and oil industry could have a significant impact on our operating costs. We believe that operation of our wells is in substantial compliance with all current applicable environmental laws and regulations and that our continued compliance with existing requirements will not have a material adverse impact on our financial condition and results of operations. However, we cannot predict how future environmental laws and regulations may impact our properties or our operations. For the year ended December 31, 2007, we did not incur any material capital expenditures for installation or remediation or pollution control equipment at any of our facilities. As of the date of this prospectus, we are not aware of any environmental issues or claims that will require material capital expenditures during 2008 that will otherwise have a material impact on our financial position or results of operations. For additional information, please see “Business — Environmental Matters and Regulations” below.
7
Table of Contents
Other Regulatory Burdens Specific to the Natural Gas and Oil Industry May Limit Our Operations or Affect Our Profitability
The natural gas and oil industry is extensively regulated by numerous federal, state and local authorities. Legislation affecting the natural gas and oil industry is under constant review for amendment or expansion, frequently increasing the regulatory burden. Also, numerous departments and agencies, both federal and state, are authorized by statute to issue rules and regulations binding on the natural gas and oil industry and its individual members, some of which carry substantial penalties for failure to comply. Although the regulatory burden on the natural gas and oil industry increases our cost of doing business and, consequently, affects our profitability, these burdens generally do not affect us any differently or to any greater or lesser extent than they affect other companies in the industry with similar types, quantities and locations of production.
Legislation continues to be introduced in Congress and development of regulations continues in the Department of Homeland Security and other agencies concerning the security of industrial facilities, including natural gas and oil facilities. Our operations may be subject to such laws and regulations. Presently, it is not possible to accurately estimate the costs we could incur to comply with any such facility security laws or regulations, but such expenditures could be substantial.
Drilling and Production. Our operations are subject to various types of regulation at the federal, state and local levels. These types of regulation include requiring permits for the drilling of wells, drilling bonds and reports concerning operations. Most states, and some counties and municipalities, in which we operate also regulate one or more of the following:
| • | the location of wells; | |
| • | the method of drilling and casing wells; | |
| • | the surface use and restoration of properties upon which wells are drilled; | |
| • | use of roads; | |
| • | the plugging and abandoning of wells; and | |
| • | notice to surface owners and other third parties. |
State laws regulate the size and shape of drilling and spacing units or proration units governing the pooling of natural gas and oil properties. Some states allow forced pooling or integration of tracts to facilitate exploitation while other states rely on voluntary pooling of lands and leases. In some instances, forced pooling or unitization may be implemented by third parties and may reduce our interest in the unitized properties. In addition, state conservation laws establish maximum rates of production from natural gas and oil wells, generally prohibit the venting or flaring of natural gas and impose requirements regarding the ratability of production. These laws and regulations may limit the amount of natural gas and oil we can produce from our wells or limit the number of wells or the locations at which we can drill. Moreover, each state generally imposes a production or severance tax with respect to the production and sale of oil, natural gas and natural gas liquids within its jurisdiction.
Regulations Specific to Natural Gas. The availability, terms and cost of transportation significantly affect sales of natural gas. The interstate transportation and sale for resale of natural gas is subject to federal regulation, including regulation of the terms, conditions and rates for interstate transportation, storage and various other matters, primarily by the Federal Energy Regulatory Commission (“FERC”). Federal and state regulations govern the price and terms for access to natural gas pipeline transportation. FERC regulations for interstate natural gas transmission in some circumstances may also affect the intrastate transportation of natural gas.
In August 2005, Congress enacted the Energy Policy Act of 2005 (“EP Act 2005”). Among other matters, EP Act 2005 amends the Natural Gas Act (“NGA”) to make it unlawful for any entity, as defined in the EP Act 2005, including otherwise non-jurisdictional producers such as us, to use any deceptive or manipulative device or contrivance in connection with the purchase or sale of natural gas or the purchase or sale of transportation services subject to regulation by FERC, in contravention of rules prescribed by the FERC. On
8
Table of Contents
January 19, 2006, the FERC issued rules implementing the provision. The rules make it unlawful in connection with the purchase or sale of natural gas subject to the jurisdiction of the FERC, or the purchase or sale of transportation services subject to the jurisdiction of the FERC, for any entity, directly or indirectly, to use or employ any device, scheme, or artifice to defraud; to make any untrue statement of material fact or omit to make any such statement necessary to make the statements made not misleading; or to engage in any act or practice that operates as a fraud or deceit upon any person. The EP Act 2005 also gives the FERC authority to impose civil penalties for violations of the NGA up to $1,000,000 per day per violation. The EP Act 2005 reflects a significant expansion of the FERC’s enforcement authority. We do not anticipate that we will be affected by the EP Act 2005 any differently than other producers of natural gas.
Although natural gas prices are currently unregulated, Congress historically has been active in the area of natural gas regulation. We cannot predict whether new legislation to regulate natural gas might be proposed, what proposals, if any, might actually be enacted by Congress or the various state legislatures, and what effect, if any, the proposals might have on the operations of the underlying properties. Sale of condensate and natural gas liquids are not currently regulated and are made at market prices.
Regulation by Individual States. The various states regulate the drilling for, and the production, gathering and sale of, natural gas, including imposing severance taxes and requirements for obtaining drilling permits. States also regulate the method of developing new fields, the spacing and operation of wells and the prevention of waste of natural gas resources. States may regulate rates of production and may establish maximum daily production allowables from natural gas wells based on market demand or resource conservation, or both. States do not regulate wellhead prices or engage in other similar direct economic regulation, but there can be no assurance that they will not do so in the future. The effect of these regulations may be to limit the amounts of natural gas that may be produced from our wells, and to limit the number of wells or locations we can drill.
The petroleum industry is also subject to compliance with various other federal, state and local regulations and laws. Some of those laws relate to occupational safety, resource conservation and equal employment opportunity. We do not believe that compliance with these laws will have a material adverse effect upon our shareholders, but there is a risk that we could be wrong about this.
We are Subject to Market Forces Regarding the Sale of Gas Production in the United States
We are currently producing natural gas in the United States from one well. This natural gas is currently being sold under the terms of the joint operating agreement with our joint venture partner. In the event that our joint venture partner is unwilling to sell our share of production, we would have to find a purchaser for relatively small amounts of natural gas. We cannot assure that we will obtain such contracts or that the terms will be beneficial to us.
We are Subject to Market Forces Regarding the Sale of Gas Production in Australia
Natural gas from our producing property in Australia is sold under a gas sales agreement with our joint venture partner. In the event that they are unable to sell our share of production, we would have to find a purchaser for relatively small amounts of natural gas. We cannot assure that we will obtain such contracts or that the terms will be beneficial to us.
Our Market is Limited for Gas We Produce in Australia
All of our production in Australia is located in Queensland. If the eastern Australian market for gas does not continue to develop and grow, the market’s gas prices may soften, which would negatively impact our revenues from gas production from our Australian properties.
Our Ownership of Exploration Rights in Queensland is Subject to Governmental Approval
Oil and gas exploration in Queensland, Australia is conducted under Authorities to Prospect (“ATPs”) which are granted at the discretion of the Queensland Minister for the Department of Natural Resources and
9
Table of Contents
Water (the “Minister”). Each ATP requires that exploration work commitments be met, and is generally subject to renewal every four years. It is customary to negotiate variances from the initial work plan with the Department of Natural Resources and Water, but they are under no obligation to approve such variances. Renewal of an ATP is at the discretion of the Minister, and failure to fulfill the initially proposed work plan is a factor that would be considered. On renewal of an ATP, the Minister may require reduction of the area to which the ATP applies. We cannot assure that our ATPs will be renewed. Non-renewal or loss of an ATP could adversely affect our exploration and development plans, results of operations, financial condition or cash flows.
We are Subject to Current and Potential Competing Supplies of Gas in Australia
Alternative large-scale supplies of natural gas, whether from within or outside of Queensland, could significantly affect the future supply of natural gas in the Queensland market, which is the area of our primary focus in Australia.
We are subject to political and economic risks with respect to our Australian operations.
In Australia, we conduct oil and natural gas exploration, development and production activities, which may be subject to:
| • | political and economic uncertainties, including changes, sometimes frequent or marked, in governmental energy and environmental policies or the personnel administering them; | |
| • | cancellation or modification of contract rights, and | |
| • | royalty and tax increases and other risks arising out of governmental sovereignty over the areas in which we conduct our operations. |
Consequently, our Australian operations may be substantially affected by several factors beyond our control, any one of which could negatively affect our financial results. Further, in the event of a legal dispute in Australia, we may be subject to the exclusive jurisdiction of Australian courts or we may not be successful in subjectingnon-U.S. persons to the jurisdiction of courts in the U.S., either of which could adversely affect the outcome of a dispute.
Limited Availability of Drilling Equipment, Personnel, and Access Could Delay Our Drilling Program
Oil and natural gas exploration and development activities are dependent on the availability of drilling, completion, and a variety of other related equipment as well as skilled operations personnel in the particular areas where such activities will be conducted. Demand for such limited equipment and personnel or access restrictions to particular sites may affect the availability of such equipment and personnel to us and may delay exploration and development activities. To the extent that we are not the operator of our oil and gas properties, we will be dependent on such operators for the timing of activities related to such properties and will be largely unable to direct or control the activities of third-party operators.
Our Business Plan Requires Obtaining Substantial Additional Capital
We anticipate making substantial capital expenditures for the acquisition, exploration, development and production of oil and natural gas reserves in the future. There can be no assurance that debt or equity financing or cash generated by operations will be available or sufficient to meet these requirements or for other corporate purposes or, if debt or equity financing is available, that it will be on terms acceptable to us. Our inability to access sufficient capital for our operations could have a material adverse effect on our financial condition, results of operations, or prospects.
Our Business Plan Calls for Sale or Farmout of Working Interests to Third Parties, Which May Not Happen
Our business plan contemplates that we will sell or farmout a portion of each prospect. It is our goal to sell larger percentages of our higher-risk prospects. If we are unable to sell or farmout a particular prospect,
10
Table of Contents
we would have to either raise additional capital to fund the drilling of a larger percentage of that prospect, sell the prospect to a third party, or re-assign the leases covering the prospect to SKH.
Our Reserve Estimates Depend on Many Assumptions That May Be Inaccurate
Minimal reserves are currently attributed to our assets. There are numerous uncertainties inherent in estimating quantities of reserves and cash flows to be derived therefrom, including many factors that will be beyond our control. The expected monetary value of our unproved properties is independently evaluated. This evaluation includes a number of assumptions relating to factors such as initial production rates, production decline rates, ultimate recovery of reserves, timing and amount of capital expenditures, marketability of production, future prices of oil and natural gas, operating costs and royalties and other government levies that may be imposed over the producing life of the reserves. These assumptions are based on price forecasts in use as of the date that the evaluation is prepared and many of these assumptions are subject to change and are beyond our control. Actual production and cash flows derived therefrom will vary from the evaluation, and such variations could be material. The evaluation is based almost entirely on the assumed success of exploitation activities intended to be undertaken in future years.
Our Profitability Depends on the Prices We Can Obtain For Oil and Natural Gas, Which Are Largely Beyond Our Control
Both oil and natural gas prices are unstable and are subject to fluctuation. Any material decline in prices could result in a reduction of our net production revenue when production occurs. The economics of producing from some wells may change as a result of lower prices, which could result in a reduction in the commercial volume of any reserves attributed to us. We might also elect not to produce from certain wells in the event of lower prices. All of these factors could result in a material decrease in our net production revenue causing a reduction in our oil and gas acquisition, development and exploration activities. In addition, bank borrowings available to us will be in part determined by our borrowing base, which is dependent upon the reserves attributed to us. Although we currently have no debt other than the Debenture, we may obtain, or attempt to obtain, additional debt financing in the future. In that event, a sustained material decline in prices from historical average prices could reduce our borrowing base, therefore reducing the bank credit available to us, or which could require that a portion, or all, of our bank debt be repaid.
The marketability and price of oil and natural gas that may be acquired or discovered by us will be affected by numerous factors beyond our control. Our ability to market our natural gas may depend upon our ability to acquire space on pipelines that deliver natural gas to commercial markets. We may also be affected by deliverability uncertainties related to the proximity of our reserves to pipelines and processing facilities, and related to operation problems with such pipelines and facilities as well as extensive government regulation relating to price, taxes, royalties, land tenure, allowable production, and many other aspects of the oil and natural gas business.
Payments on Current Indebtedness and Future Changes in Capital Structure Could Affect Our Operations
As of the date of this prospectus, our only outstanding debt is the Debenture and trade payables. We are permitted to incur significant additional indebtedness, including secured indebtedness, in the future if specified conditions are satisfied. Current or future indebtedness could negatively affect us in several ways, including but not limited to, the following: such debt could require us to dedicate a substantial portion of our cash flow to the payment of interest; such debt could subject us to a higher financial risk in an economic downturn due to substantial debt service costs; such debt could limit our ability to obtain financing or raise equity capital in the future; and such debt could place us at a competitive disadvantage to the extent that we are more highly leveraged than some of our peers. Higher levels of indebtedness would increase these risks.
Our exploration and development program will require substantial ongoing capital resources, depending on the level of drilling and the cost of services. Our existing operations will also require ongoing capital
11
Table of Contents
expenditures. In addition, if we decide to pursue additional acquisitions, our capital expenditures will increase both to complete such acquisitions and to explore and develop any newly acquired properties.
Substantial acquisitions or other transactions could require significant additional capital and could change our risk and property profile. Acquisition prospects are difficult to assess and may pose additional risks to our operations. If we are unable to raise substantial amounts of additional capital, we may not be able to maximize our business plan. In order to maximize our business plan, we will need to raise substantial amounts of new capital. If we experience difficulties in raising equity or debt capital, we may be required to scale back our business plan by limiting acquisitions and our drilling and development program.
The Value of Assets on Our Books May Be Subject to Write-Downs
We have incurred a write-down of the carrying values of our properties in the past and could incur additional write-downs in the future. Under the full cost method of accounting, Securities and Exchange Commission (“SEC”) accounting rules require that we review the carrying value of our oil and gas properties on acountry-by-country basis for possible write-down or impairment. Under these rules, capitalized costs of proved reserves may not exceed a ceiling calculated as the present value of estimated future net revenues from those proved reserves, determined using a 10% per year discount and unescalated prices in effect as of the end of each fiscal quarter. Capital costs in excess of the ceiling must be permanently written down. Prior to June 30, 2007, we did not have meaningful reserves, so we have treated the ceiling test calculation as not material for earlier periods.
There Are Risks Related to Our Title to Our Assets
In areas of the United States in which we operate, title to mineral interests is highly fragmented and often different from ownership of the surface estate. In many instances, title opinions on our oil and gas acreage are not obtained if in our judgment it would be uneconomical or impractical to do so. Although we examine title to acreage prior to acquisition in those cases in which the economic significance of the acreage justifies the cost, there can be no assurance that losses will not result from title defects or from defects in the assignment of leasehold rights.
We Have Only a Limited Time to Evaluate Prospects
Under the terms of the Participation and Right of First Offer Agreement Amendment 1 (the “Participation Agreement”), if we do not commence drilling operations on a Test Well in a prospect (as defined in the Participation Agreement) on or before February 8, 2010, we have to assign the leases comprising that prospect back to SKH.
We Have a History of Significant Losses and Are Not Currently Profitable
We have incurred significant net losses since our inception and we may incur additional net losses in the future. We have not been profitable since we started our business. We incurred net losses of $30,150,143, $3,769,084 and $9,444,728 for the years ended December 31, 2007, 2006 and 2005, respectively. Our capital has been employed in an expanding natural gas and oil exploration and development program with a focus on finding commercially economic natural gas and oil reserves and producing from those reserves over the long term rather than generating immediate net income. The uncertainties described in this section may impede our ability to ultimately find, develop and exploit natural gas and oil reserves. As a result, we may not be able to achieve or sustain profitability or positive cash flows from operating activities in the future.
We May Not Be Able to Meet Our Cash Requirements Without Obtaining Additional Capital; If We Are Unable to Do So, We May Not Be Able to Continue as a Going Concern
Our financial statements have been prepared assuming that we will continue as a going concern. As of December 31, 2007, we had $9,397,522 in cash and cash equivalents. We expect that this amount, together with income from producing properties, will meet our cash requirements through November of 2008. However, in order for us to continue as a going concern beyond this point, we will likely be required to obtain capital
12
Table of Contents
from external sources. As a result, the audit opinion on our consolidated financial statements dated December 31, 2007, includes a qualifying paragraph regarding our ability to continue as a going concern as described in Note 1 to the consolidated financial statements.
We will continue to seek additional capital. If external financing sources are not available or are inadequate to fund our operations, we may have to postpone or curtail our drilling program, which could result in lower future revenues from production.
Our Management Consists of Few People
We depend to a large extent on the services of a limited number of senior management personnel and directors. The loss of any of these personnel could adversely affect our operations and financial performance. We do not carry key man life insurance on any of our personnel.
There May Be Deficiencies in Our Internal Controls Over Financial Reporting
We have only 18 employees and consultants. Control deficiencies have been identified within our accounting and financial function and our financial information systems over segregation of duties and user access respectively. Specifically, certain duties are not properly segregated due to the small number of individuals employed in this area. In practice, certain senior staff could initiate, input and change entries in the central accounting system. At this time, we rely on high level controls involving senior management’s analytical review, detailed knowledge of our business and personnel, and audit committee review to provide oversight of these functions.
There is a Limited Public Market for Our Common Shares
Although our Common Shares have been listed on the TSXV since September 2004, there is limited liquidity in the market for our Common Shares. As a result, a trade involving a large number of Common Shares could have an exaggerated effect on the reported market price of our Common Shares. A holder of our Common Shares may not be able to liquidate the investment in a short time period or at the market prices that currently exist at the time the holder decides to sell. The purchase and sale of relatively small Common Share positions may result in disproportionately large increases or decreases in the price of our Common Shares. We will apply to list our Common Shares on the AMEX, but we cannot be certain that our application will be approved. Our current share price and market capitalization are below the minimum required for admission to trading on AMEX.
Our Common Share Price Has Been Volatile in the Past and May Be So in the Future
The trading price of our Common Shares is subject to wide fluctuations in response to a variety of factors, including, but not limited to, quarterly variations in operating results, announcements of drilling activity, economic conditions in the natural gas and oil industry, general economic conditions or other events or factors that are beyond our control. See “Price Range of Common Shares”.
In addition, the stock market in general and the market for natural gas and oil exploration companies in particular have experienced extreme price and volume fluctuations that have often been unrelated or disproportionate to the operating results or asset values of those companies. These broad market and industry factors may seriously impact the market price and trading volume of our Common Shares regardless of our actual operating performance. In the past, following periods of volatility in the overall market and in the market price of a company’s securities, securities class action litigation has been instituted against these companies. If this type of litigation were instituted against us following a period of volatility in the trading price of our Common Shares, it could result in substantial costs and a diversion of our management’s attention and resources, which could have a materially adverse impact on our operations.
13
Table of Contents
The Issuance of Common Shares May Dilute Ownership Interest of Current Shareholders
The future issuance of a substantial number of Common Shares into the public market, or the perception that such issuance could occur, could adversely affect the prevailing market price of our Common Shares. A decline in the price of our Common Shares could make it more difficult to raise funds through future offerings of our Common Shares or securities convertible into Common Shares. Following the effectiveness of the registration statement of which this prospectus is a part, we believe that substantially all of our outstanding Common Shares as well as Common Shares issued upon conversion and exercise of the Debenture, outstanding options and warrants will be able to be sold without requiring further action under the United States federal securities laws.
Also, our ability to issue an unlimited number of our Common Shares under our articles of incorporation may result in dilution or make it more difficult to effect a change in control of Ausam, which could adversely affect the price of our Common Shares. Unlike most corporations formed in the United States, our articles of incorporation chartered under the laws of the Province of Alberta, Canada permit the board of directors to issue an unlimited number of new Common Shares without shareholder approval, subject only to the rules of the TSXV or any other stock exchange on which our Common Shares trade. The issuance of a large number of shares could be effected by our directors to thwart a takeover attempt or offer for us by a third party, even if doing so would benefit our shareholders, which could result in the shares being valued less in the market. The issuance, or the threat of issuance, of large numbers of Common Shares, at prices that are dilutive to the outstanding shares could also result in the shares being valued less in the market. Under the Debenture, we are prohibited from issuing shares at below the market price, or the fair value of the shares if our shares are not then being traded on any exchange.
Under the policies of the TSXV, we are prohibited from issuing shares at a discount to the market price except within TSXV guidelines and with TSXV approval. The TSXV may require shareholder approval for a private placement of Common Shares that appears to be undertaken as a defensive tactic to a takeover bid.
Issuance of Common Shares upon conversion of the Debenture for no additional consideration will dilute the ownership interest of existing shareholders and could adversely affect the market price of our Common Shares.
Because of Our International Operations, Our Results May Be Affected By Fluctuations in Value of Foreign Currency
Following the SKH Purchase, we are engaged in business in the United States, Canada and Australia. We may incur losses or suffer a reduction in revenues from time to time as the value of the currencies of these countries fluctuates in relation to each other. We do not currently hedge our foreign currency fluctuation risk, although we may do so in the future. Although we do not engage in a derivative hedge program, we attempt to match the currency in which we obtain financing with the currency of expected expenditures. If we are unable to successfully match the currency of expenditures with the currency obtained from financing, we could suffer losses due to currency fluctuations.
As described in “Description of Indebtedness,” the Debenture contains a term regarding a fixed exchange rate that will be used under certain circumstances to calculate the conversion price. This exchange rate may be less favorable to us than the market rate existing at the time of conversion.
We May Be Unable to Obtain a Stock Exchange Listing in the United States
Our Common Shares are currently listed for trading on the TSXV. We will apply for a listing on the AMEX, but we cannot be certain that our application will be approved. Our current share price and market capitalization are below the minimum required for admission to trading on the AMEX.
14
Table of Contents
CAUTIONARY STATEMENTS REGARDING FORWARD-LOOKING STATEMENTS
Some of the information included in this prospectus contains “forward-looking statements”. “Forward-looking statements” can be identified by the use of forward-looking words, including “may”, “expect”, “anticipate”, “plan”, “project”, “believe”, “estimate”, “intend”, “will”, “should” or other similar words. “Forward-looking statements” may include statements that relate to, among other things:
| • | Our financial position; | |
| • | Business strategy and budgets; | |
| • | Anticipated capital expenditures; | |
| • | Drilling of wells; | |
| • | Natural gas and oil reserves; | |
| • | Timing and amount of future production of natural gas and oil; | |
| • | Operating costs and other expenses; | |
| • | Cash flow and anticipated liquidity; | |
| • | Prospect development; and | |
| • | Property acquisitions and sales. |
Although we believe the expectations reflected in such forward-looking statements are reasonable, we cannot assure you that such expectations will occur. These forward-looking statements involve known and unknown risks, uncertainties and other factors that may cause our actual results, performance or achievements to be materially different from actual future results expressed or implied by the forward-looking statements. These factors include among others:
| • | Lowand/or declining prices for natural gas and oil; | |
| • | Natural gas and oil price volatility; | |
| • | The risks associated with exploration, including cost overruns and the drilling of non-economic wells or dry holes; | |
| • | Ability to raise capital to fund capital expenditures; | |
| • | The ability to find, acquire, market, develop and produce new natural gas and oil properties; | |
| • | Uncertainties in the estimation of proved reserves and in the projection of future rates of production and timing of development expenditures; | |
| • | Operating hazards attendant to the natural gas and oil business; | |
| • | Downhole drilling and completion risks that are generally not recoverable from third parties or insurance; | |
| • | Potential mechanical failure or under-performance of significant wells or pipeline mishaps; | |
| • | Weather conditions; | |
| • | Availability and cost of material and equipment; | |
| • | Delays in anticipatedstart-up dates; | |
| • | Actions or inactions of third-party operators of our properties; | |
| • | Ability to find and retain skilled personnel; | |
| • | Strength and financial resources of competitors; | |
| • | Federal and state regulatory developments and approvals; |
15
Table of Contents
| • | Environmental risks; | |
| • | Worldwide economic conditions; and | |
| • | Operational and financial risks associated with foreign exploration and production. |
You should not unduly rely on these forward-looking statements in this prospectus, as they speak only as of the date of this prospectus. Except as required by law, we undertake no obligation to publicly release any revisions to these forward-looking statements to reflect events or circumstances occurring after the date of this prospectus or to reflect the occurrence of unanticipated events. See the information under the heading “Risk Factors” in this prospectus for some of the important factors that could affect our financial performance or could cause actual results to differ materially from estimates contained in forward-looking statements.
USE OF PROCEEDS
We will not receive any of the proceeds from the sale of the Common Shares by the selling shareholders under this prospectus. All proceeds from the sale of those shares will be for the respective accounts of the selling shareholders.
PRICE RANGE OF COMMON SHARES
Our Common Shares are listed on the TSXV under the symbol “AZE.” We will apply to list our Common Shares on the AMEX, but we cannot be certain that the AMEX will approve our application, and our share price and market capitalization are currently below the minimum price required by the AMEX for listing. The following table sets forth the high and low sale prices of our Common Shares as reported on the TSXV for the periods presented. The prices in the table below have been adjusted to reflect the share consolidation that took place on September 26, 2007.
| High (CDN$) | Low (CDN$) | |||||||
2008 | ||||||||
| Second Quarter through May 9 | 1.70 | 0.60 | ||||||
| First Quarter | 1.70 | 0.80 | ||||||
2007 | ||||||||
| Fourth Quarter | 2.85 | 1.11 | ||||||
| Third Quarter | 2.95 | 1.85 | ||||||
| Second Quarter | 2.90 | 1.80 | ||||||
| First Quarter | 3.15 | 1.95 | ||||||
2006 | ||||||||
| Fourth Quarter | 2.85 | 1.20 | ||||||
| Third Quarter | 2.20 | 1.30 | ||||||
| Second Quarter | 2.90 | 1.05 | ||||||
| First Quarter | 3.65 | 1.40 | ||||||
2005 | ||||||||
| Fourth Quarter | 5.50 | 2.00 | ||||||
| Third Quarter | 6.05 | 4.25 | ||||||
| Second Quarter | 5.25 | 3.95 | ||||||
| First Quarter | 7.50 | 4.00 | ||||||
As of May 9, 2008, there were 77 holders of record of our Common Shares. The last reported sale price of our Common Shares on the TSXV on May 9, 2008 was CDN$1.70, or $1.68.
As of May 9, 2008, a total of 3,024,251 Common Shares were subject to outstanding stock options granted under the Ausam Energy Stock Option Plan, 2,092,832 shares of which have vested but have not been
16
Table of Contents
exercised. Additionally, 10,148,161 Common Shares were issuable pursuant to outstanding warrants, all of which warrants were exercisable as of such date.
As of May 9, 2008, we had outstanding a Debenture with a face value of $26,719,219. The holder of the Debenture has the right to convert it into Common Shares at any time at a conversion price of CDN$3.00 per share. In the event that (i) the30-day volume weighted average price (“VWAP”) of our Common Shares exceeds CDN$4.50 and (ii) our average share volume exceeds 200,000 shares per day for a 30 day period, we can require the holder of the Debenture to convert it to Common Shares at CDN$3.00 per share. If the outstanding Debenture were converted into Common Shares today, we would issue 9,011,502 Common Shares using an exchange rate of $1.00 = CDN$1.01180. We have the right to pay interest on the Debenture by a deemed increase in the principal amount through March 31, 2009. If we elect to do so, the face value of the Debenture on that date would be $29,863,475, and conversion at the May 9, 2008 exchange rate would result in the issuance of 10,071,955 Common Shares.
As of May 9, 2008, we had outstanding a total of 10,371,216 warrants which could be converted into Common Shares as shown in the table below.
| Number of Common | ||||||||
| Funds We Would Receive | Shares Issued | |||||||
Number of Warrants | Exercise Price | Expiration Date | on Exercise | on Exercise | ||||
| 3,276,655 | CDN$3.25 | February 9, 2009 | CDN $10,649,129 | 3,276,655 | ||||
| 2,061,666 | CDN$3.75 | February 9, 2009 | CDN $7,731,248 | 2,061,666 | ||||
| 125,685 | CDN$3.25 | September 7, 2009 | CDN $408,476 | 125,685 | ||||
| 4,907,210 | CDN$3.00 | July 3, 2012 | CDN $14,721,630 | 4,907,210 |
17
Table of Contents
DIVIDEND HISTORY
We have never declared or paid any cash dividends on our Common Shares. We anticipate that we will retain future earnings, if any, to satisfy our operational and other cash needs and do not anticipate paying any cash dividends on our Common Shares in the foreseeable future. In addition, our Debenture prohibits us from paying cash dividends as long as such Debenture remains outstanding unless the holders of 662/3% of the principal amount of Debenture then outstanding approve.
Pursuant to the provisions of theBusiness Corporations Act(Alberta), we are prohibited from declaring or paying a dividend if there are reasonable grounds for believing that (1) we are, or would after the payment be, unable to pay our liabilities as they become due or (2) the realizable value of our assets would thereby be less than the aggregate of our liabilities and stated capital of all classes.
For a discussion of Canadian laws, decrees and regulations that restrict the import or export of capital, affect the remittance of dividends or other payments to non-resident holders of our Common Shares, or relate to taxes, including withholding provisions, to which U.S. holders of our common shares are subject, as well as pertinent provisions of the tax treaty between Canada and the U.S., please see “Material Income Tax Consequences”.
18
Table of Contents
SELECTED HISTORICAL CONSOLIDATED FINANCIAL AND OPERATING DATA
We have set forth below certain summary historical consolidated financial and operating data for the periods indicated for us and our wholly-owned subsidiaries ARL and Noram Resources, Inc. (“Noram”). The historical consolidated financial data for the years ended December 31, 2005, 2006 and 2007 and the balance sheet data as of December 31, 2006 and 2007 have been derived from our audited consolidated financial statements.
You should read the following summary financial data in conjunction with “Management’s Discussion and Analysis of Financial Condition and Results of Operations” and our consolidated financial statements and related notes appearing elsewhere in this prospectus.
Because of the SKH Purchase, the Huff Transaction and the anticipated rapid drilling of our exploration prospects, our historical results of operations andperiod-to-period comparisons of these results and certain financial data may not be meaningful or indicative of future results.
Balance Sheet Data
| December 31, | ||||||||||||
| 2007 | 2006 | 2005 | ||||||||||
Assets | ||||||||||||
| Current | ||||||||||||
| Cash and cash equivalents | $ | 9,397,522 | $ | 2,865,157 | $ | 7,405,760 | ||||||
| Accounts receivable | 484,225 | 110,108 | 22,146 | |||||||||
| Loan receivable from related party | — | — | 359,996 | |||||||||
| Prepaid expenses, deposits, and inventory | 159,327 | 83,257 | 14,269 | |||||||||
| Deferred costs | — | 683,956 | — | |||||||||
| Deferred financing costs | 1,839,907 | — | — | |||||||||
| Advances to Joint Venture Partner | — | 412,079 | 539,691 | |||||||||
| Property and Equipment | 46,297,134 | 8,760,711 | 3,799,471 | |||||||||
| $ | 58,178,115 | $ | 12,915,268 | $ | 12,141,333 | |||||||
Liabilities and Unitholders’ Equity | ||||||||||||
| Current | ||||||||||||
| Accounts payable and accrued liabilities | ||||||||||||
| Financing fees | $ | — | $ | — | $ | — | ||||||
| Legal and Professional | 829,854 | 400,777 | 252,134 | |||||||||
| Trade | 1,336,476 | 959,782 | 344,489 | |||||||||
| Loan payable | — | — | — | |||||||||
| Advances from Joint Venture Partners, net | 34,871 | — | — | |||||||||
| Asset retirement obligations | 180,726 | 166,185 | 140,845 | |||||||||
| Convertible debt | 17,216,340 | — | — | |||||||||
| Shareholders’ Equity | ||||||||||||
| Preferred shares, no par value, unlimited | — | — | — | |||||||||
| Common shares, no par value, unlimited(1) | 67,531,695 | 25,923,002 | 24,649,132 | |||||||||
| Share purchase warrants | 11,118,660 | 272,592 | 1,051,031 | |||||||||
| Additional paid — in capital | 9,257,863 | 4,358,771 | 1,978,420 | |||||||||
| Accumulated other comprehensive income | 2,927,374 | 734,619 | (143,342 | ) | ||||||||
| Deficit | (52,255,744 | ) | (19,900,460 | ) | (16,131,376 | ) | ||||||
| Shareholders’ Equity | 38,579,849 | 11,388,524 | 11,403,865 | |||||||||
| $ | 58,178,115 | $ | 12,915,268 | $ | 12,141,333 | |||||||
| (1) | Issued and outstanding: December 31, 2007: 30,368,335; December 31, 2006: 10,939,553; December 31, 2005: 10,064,553; December 31, 2004: 7,701,367. |
19
Table of Contents
Income Statement Data
| Year Ended December 31, | ||||||||||||
| 2007 | 2006 | 2005 | ||||||||||
| Oil and Gas Revenue | $ | 371,921 | $ | — | $ | — | ||||||
| Operating expense | (82,185 | ) | — | — | ||||||||
| Depreciation, depletion and amortization | (19,915,907 | ) | (37,054 | ) | (27,930 | ) | ||||||
| Asset write-down | — | (1,535,208 | ) | (5,508,975 | ) | |||||||
| General and administration expenses(1) | (8,553,588 | ) | (2,480,065 | ) | (2,820,347 | ) | ||||||
| Due diligence and acquisition related expenses | — | — | (1,367,961 | ) | ||||||||
| Financing | (938,418 | ) | — | — | ||||||||
| Interest on convertible debentures | (1,132,722 | ) | — | — | ||||||||
| Interest | (4,729 | ) | — | — | ||||||||
| Accretion of convertible debentures | (425,248 | ) | — | — | ||||||||
| Interest and other income | 530,734 | 252,003 | 280,485 | |||||||||
| Net loss before cumulative effect of change in accounting principles | (30,150,143 | ) | (3,800,324 | ) | (9,444,728 | ) | ||||||
| Cumulative effect of adoption of SFAS 123R | — | 31,240 | — | |||||||||
| Net loss | (30,150,143 | ) | (3,769,084 | ) | (9,444,728 | ) | ||||||
| Redemption of preferred shares in excess of cost | (1,868,204 | ) | — | — | ||||||||
| Dividend on preferred shares | (336,937 | ) | — | — | ||||||||
| Net loss applicable to common stock | $ | (32,355,284 | ) | $ | (3,769,084 | ) | $ | (9,444,728 | ) | |||
| Deficit | ||||||||||||
| Deficit, beginning of period | $ | (19,900,460 | ) | $ | (16,131,376 | ) | $ | (6,686,648 | ) | |||
| Net loss | (30,150,143 | ) | (3,769,084 | ) | (9,444,728 | ) | ||||||
| Redemption price of | ||||||||||||
| preferred shares in excess of cost | (1,868,204 | ) | — | — | ||||||||
| Dividend on preferred shares(2) | (336,937 | ) | — | — | ||||||||
| Deficit accumulated during the development stage, end of period | $ | (52,255,744 | ) | $ | (19,900,460 | ) | $ | (16,131,376 | ) | |||
| (1) | Including non-cash compensation of: December 31, 2007: $1,487,111; December 31, 2006: $266,918; December 31, 2005: $993,193. | |
| (2) | No dividends have been declared or paid on Common Shares. |
Per share information
| Year Ended December 31, | ||||||||||||
| 2007 | 2006 | 2005 | ||||||||||
| Net loss per share before cumulative change in accounting principles | ||||||||||||
| Basic and diluted | $ | (1.15 | ) | $ | (0.37 | ) | $ | (1.05 | ) | |||
| Cumulative effect of change in accounting principles | ||||||||||||
| Basic and diluted | — | — | — | |||||||||
| Net loss per common share | ||||||||||||
| Basic and diluted | $ | (1.15 | ) | $ | (0.37 | ) | $ | (1.05 | ) | |||
| Weighted average number of common shares outstanding | ||||||||||||
| Basic | 28,113,395 | 10,283,303 | 8,962,646 | |||||||||
| Diluted | 28,113,395 | 10,283,303 | 8,962,646 | |||||||||
20
Table of Contents
Summary Cash Flow Data
| Year Ended December 31, | ||||||||||||
| 2007 | 2006 | 2005 | ||||||||||
| Net cash used for operations | $ | (6,751,524 | ) | $ | (2,377,419 | ) | $ | (2,666,956 | ) | |||
| Net cash provided by financing activities | $ | 38,271,054 | $ | 1,906,458 | $ | 8,343,813 | ||||||
| Net cash provided by (used for) investing activities | $ | (27,764,243 | ) | $ | (4,408,195 | ) | $ | (5,022,639 | ) | |||
Disclosure of Oil and Gas Operations
Reserve Data. We employed GLJ Petroleum Consultants, Ltd. to prepare an independent reserves report on our properties as at December 31, 2007. In this report, GLJ assigned proved reserves to one permit in Australia and to two properties in the United States.
Estimated Proved Reserves:
| At December 31, | ||||||||||||
| 2007 | 2006 | 2005 | ||||||||||
| Australia: | ||||||||||||
| Natural Gas (Mmcf) | 203 | 127 | — | |||||||||
| Oil & NGL (MBbls) | — | 2 | — | |||||||||
| Total (Mboe) | 34 | 23 | — | |||||||||
PV-10 (M$) | 217 | 106 | — | |||||||||
| Standardized measure of discounted future cash flows (M$) | 217 | 106 | — | |||||||||
| United States | ||||||||||||
| Natural Gas (Mmcf) | 340 | — | — | |||||||||
| Oil & NGL (MBbls) | 9 | — | — | |||||||||
| Total (Mboe) | 66 | — | — | |||||||||
PV-10 (M$) | 2,493 | — | — | |||||||||
| Standardized measure of discounted future cash flows (M$) | 2,493 | — | — | |||||||||
OurPV-10 measure and the standardized measure of discounted future net cash flows do not purport to present the fair value of our natural gas and oil reserves. Future production will vary from the estimates when different pricing assumptions are made due to changes in economic limits of production. Actual production from properties with proved reserves may vary significantly from those estimated. We do not, as a matter of course, make public projections as to future revenues, cash flow, earnings or other financial results. While the amounts presented are necessarily presented with numerical specificity, the actual results achieved will differ from the estimates and such differences may be material. The accuracy of any reserves and production estimate is a function of the quality and quantity of available data and of engineering interpretation and judgment. While reserves and production estimates presented are considered reasonable, it should be understood that reservoir performance subsequent to the date of the estimate may justify revision, either upward or downward.
Production. The following tables set forth information regarding our net production of oil, natural gas and natural gas liquids and certain price and cost information for each of the last three fiscal years, by geographic segment.
In the tables below, calculation of Boe measures are performed by using the approximate energy equivalent ratio of 6 Mcf of natural gas to one barrel of oil and are included solely for the convenience of investors in comparing our results to those of other companies who report similar measures. The measure we use to calculate Boe may not be the same as similarly titled measures presented by others. The term Boe may not be informative, particularly if used in isolation, because it is based on energy equivalence at the burner tip and does not represent value equivalence at the wellhead. The price we receive for natural gas, in particular, is significantly different in the United States and Queensland, the two markets in which we have production. As
21
Table of Contents
a result, the economic value of a Boe is dependent upon a number of factors which vary depending on the location of the production, including the ratio of natural gas to oil or natural gas liquids, the expense of transporting different types of production to market, and the sales price received in the different markets.
Production Data:
| Year Ended December 31, | ||||||||||||
| 2007 | 2006 | 2005 | ||||||||||
| Australia: | ||||||||||||
| Natural Gas (Mcf) | 48,402 | — | — | |||||||||
| Oil & NGL (Bbls) | 603 | — | — | |||||||||
| Combined Equivalent Volumes (Bbls) | 8,670 | — | — | |||||||||
| Average Daily Combined Equivalent Volumes (Boe/d) | 35 | — | — | |||||||||
| United States: | ||||||||||||
| Natural Gas (Mcf) | 24,935 | — | — | |||||||||
| Oil & NGL (Bbls) | 692 | — | — | |||||||||
| Combined Equivalent Volumes (Bbls) | 4,848 | — | — | |||||||||
| Average Daily Combined Equivalent Volumes (Boe/d) | 71 | — | — | |||||||||
Average Prices:
| Year Ended December 31, | ||||||||||||
| 2007 | 2006 | 2005 | ||||||||||
| Australia: | — | |||||||||||
| Natural Gas (per Mcf) | $ | 2.50 | — | — | ||||||||
| Oil & NGL (per Bbl) | $ | 69.14 | — | — | ||||||||
| Combined Equivalent (per Boe) | $ | 18.52 | — | — | ||||||||
| United States: | ||||||||||||
| Natural Gas (per Mcf) | $ | 7.17 | — | — | ||||||||
| Oil & NGL (per Bbl) | $ | 89.93 | — | — | ||||||||
| Combined Equivalent (per Boe) | $ | 49.73 | — | — | ||||||||
Expenses per Boe:
| Year Ended December 31, | ||||||||||||
| 2007 | 2006 | 2005 | ||||||||||
| Australia: | ||||||||||||
| Production Costs(1) | $ | 8.92 | — | — | ||||||||
| United States: | ||||||||||||
| Lease Operating Expense(1) | $ | 1.01 | — | — | ||||||||
| (1) | We do not operate the permit in Australia or the unit in the United States on which we have production. We are billed for expenses by the operators. For the year ended December 31, 2007, we were billed $77,303 for production costs in Australia and $4,882 for lease operating expenses in the United States. Expenses per Boe are calculated by dividing the amount of expenses billed by the operator by the total combined equivalent volumes produced during the year. |
Productive Wells and Acreage. As of May 9, 2008, we had 2 gross producing wells (0.495 net) in Australia and 2 gross producing well (0.58 net) in the United States.
22
Table of Contents
MANAGEMENT’S DISCUSSION AND ANALYSIS OF
FINANCIAL CONDITION AND RESULTS OF OPERATIONS
FINANCIAL CONDITION AND RESULTS OF OPERATIONS
Overview
We are a public oil and gas exploration and production company trading on the TSXV under the symbol “AZE”, with operations and oil and gas properties in the U.S. and Australia, and a corporate office in Canada. On July 30, 2004, we, through a RTO, acquired all of the outstanding shares of ARL, an Australian unlisted public oil and gas company. During 2006, we drilled and participated in four wells in Australia and on September 22, 2006 we executed an agreement relating to the acquisition of the Leases containing the SKH Prospects. On February 8, 2007, we closed the transaction to acquire the Leases and SKH Prospects as well as approximately $46 million in financing. On July 5, 2007, we issued a $25,000,000 Debenture to fund our drilling operations in the United States. On September 7, 2007, we closed on a private placement of common share units which raised $677,080 in additional financing. On September 26, 2007, we consolidated our Common Shares on the basis of one new Common Share for each five previously issued and outstanding common shares, with fractional shares rounded up to the nearest whole share.
Much of the discussion in this section reflects the fact that we are a much different company than we were at the end of our fiscal year in December 2006. As a result of the SKH Purchase and the two related financings, the primary focus of our business is now in the U.S. rather than Australia. The U.S. market, at least in the Gulf Coast region, is characterized by strong energy demand and available infrastructure for the transportation of natural gas to market. Our prospects in Texas and Louisiana, and one in Mississippi are all located within two miles of existing pipelines allowing us the opportunity to more readily connect any commercial production to the market. The prospect in Arkansas and two of the prospects in Mississippi are located between two and ten miles from pipeline infrastructure, which will require additional time and cost to connect any commercial production. The actual amount of time and the cost associated with the construction of any gathering or connecting pipeline to a market accessible pipeline can not be reliably determined until such time as commercial production is established and in the event commercial production is established. Our prospect in Alabama is an oil prospect whose commerciality is independent of pipeline access.
The oil and gas industry is subject to wide fluctuations in pricing that are largely driven by factors outside of the control of the industry. After a period of relatively low prices, which resulted in a decline in available equipment, fewer personnel entering the industry, and low drilling and exploration rates, we are currently in a phase of relatively high prices with resulting shortages of and higher costs for, equipment and experienced personnel. Higher demand for drilling equipment and the attendant skilled personnel will cause an incremental increase in cost and increase the risk of delays in our proposed drilling program. Actual costs and any potential delay can not be reliably determined until such time as a proposed drilling program is confirmed as an actual drilling program, which is dependent upon, but not limited to the completion of detailed drill site title opinion documentation, the sale of interests in the proposed prospect to be drilled, the availability of capital to us and to any of the other participants in the drilling program as well as the availability of suitable drilling equipment, services, and attendant personnel.
Under the terms of our agreement with SKH, at the time of drilling of a Test Well on any prospect, we will convey to SKH a 25% interest in the prospect area that is outside of the spacing unit that contains the Test Well (the “Test Well Unit”). Further, when a Test Well achieves Payout, we will assign to SKH a 25% interest in the Test Well and the Test Well Unit. In order to carry out these obligations, we are required to maintain at least a 25% interest in each prospect and any sale of a prospect will be subject to the same back-in terms. These terms, while not unusual in the industry, may restrict our ability to sell or farmout prospects. See “Business — The SKH Agreement.”
In the event our drilling of a prospect is delayed until February 8, 2010, we have the obligation to reassign the leases that comprise that prospect to SKH. As a result of any such re-assignment, we would lose our interest in that prospect, including any delay rentals or other costs we had incurred on the prospect prior to re-assignment.
23
Table of Contents
The current market cycle features a large differential between the price realized for oil and natural gas on an energy equivalent basis, which has the effect of increasing the effort devoted to oil prospects and oil- prospective regions. A lack of large onshore prospects has caused many of the larger companies to focus their efforts on offshore and on international plays. We believe that these trends will benefit us by decreasing competition for natural gas prospects and, in the event we are able to find commercial quantities of hydrocarbons on our prospects, through increased availability of onshore infrastructure capacity.
Further, the trend toward continued improvements in seismic acquisition, processing, re-processing and data interpretation are also expected to benefit our efforts to locate commercial quantities of hydrocarbons on our, as well as on third party prospects by improving our knowledge of subsurface geology. In certain instances, seismic “markers” have been identified which we believe are indicative of the presence of hydrocarbons, which should decrease drilling risk. The petroliferous nature of the U.S. Gulf Coast, the access to more and better seismic data, and the recent sustained increase in the price of natural gas encourages exploration for commercial hydrocarbons at greater depths. Additionally, the increasing awareness, or broadly reported concerns, regarding climate change, or the perception of climate change, has encouraged the wider use of natural gas power generation in preference to liquid, or solid, hydrocarbons.
In order to meet U.S. domestic demands for energy, and a popular demand for reduced CO2 emissions, there is broader interest in the production and delivery of alternative fuels as well as the proposed increase in receipt and delivery of liquid natural gas (“LNG”), both of which, as well as other potential energy sources, would be in competition with our efforts to drill for, produce and deliver conventionally extracted natural gas. The import of significant volumes of LNG may increase the supply of natural gas to the market. Until such time as a number of LNG terminals are constructed and operational, and depending upon where those potential terminals may be in operation, and most importantly depending upon what is the overall supply and demand character of the market, we will be unable to reliably determine what impact the import of a significant volume of LNG may have on our operations.
In March 2008, our board reached the decision that we should sell or dispose of our Australian assets and focus solely on our United States assets. We will also, as part of the change in focus and in order to reduce overhead, close our Calgary office during the second quarter of 2008.
Results of Operations
Operational Overview: United States — Corporate
During late 2005, we were approached by a number of our shareholders with opportunities located along the Gulf Coast of the U.S. After extensive evaluation and analysis of the opportunities presented and a review of our assets and operations in Australia, our board of directors determined that it was in our shareholders’ best interests to obtain additional capital for both (i) the acquisition of one of the U.S. opportunities presented in order to diversify our portfolio and (ii) the exploitation of the Mosaic farmin in Australia.
On September 22, 2006, we executed an asset purchase agreement relating to the acquisition of the SKH Prospects for total consideration of $35 million (see “The SKH Purchase” below). The $35 million purchase price was comprised of $15 million cash and $20 million (based on the value at that date) in our shares. The SKH Purchase closed on February 8, 2007 and on February 9, 2007 we purchased an additional prospect from SKH. On November 16, 2007, we farmed into an additional prospect owned by an unrelated third party for a total of 21 prospects in the U.S.
In connection with the SKH Purchase, we incorporated Noram to carry out our operations in the U.S. During the first quarter of 2007, Noram established an office in Houston, Texas. The Houston office now has 12 employees and consultants actively working on the rapid exploitation of the SKH Prospects. To date, we have participated in three wells in the U.S. and expect to spud an additional four wells during 2008.
Operational Overview: United States — Drilling
Patch I (Starr County, Texas) The Patch I well was spudded on June 10, 2007 and targeted the Reklaw and Queen City Channel formations at an anticipated total depth of 10,000 feet. It reached a total depth of
24
Table of Contents
9,800 feet (approximately 3,000 metres) on July 2, 2007. Although hydrocarbons were present, logging and sidewall cores indicated that the well may not be commercial due to reservoir quality, and the well was plugged and abandoned. The well cost approximately $2.4 million.
Wethorford (Liberty County, Texas) The RDH Farms #1 well, located on our Wethorford prospect, was spudded on June 28, 2007 and is operated by Ballard Exploration Inc. The well targeted the Yegua/Cook Mountain formations at an anticipated total depth of 14,000 feet. The well was drilled to a total depth of 13,826 feet and encountered two prospective zones. Open-hole log analysis suggests that both prospective zones contain gas. The two zones are the 1st and 3rd sands of the Cook Mountain formation. The well has entered production with first sale of gas from only the deeper zone, the 3rd sand, commencing on October 24, 2007. We retained a 45% working interest (net revenue interest of approximately 33.8%) in the RDH Farms #1 through Noram and have expended approximately $2.5 million to date. The well has produced approximately 329 MMcf and 8,558 bbls of condensate (gross production) through March 31, 2008.
Quatre (Calcasieu Parish, Louisiana) The Fisher Lindsey #1 well, located on the Quatre prospect, was spudded on November 12, 2007 and is operated by Browning Oil Company, Inc. The well intersected the Hackberry Sands formations at a depth of 10,762 feet. We hold a 16.8% working interest before casing point, 12.6% interest after casing point, through Noram by way of a farmin agreement. The well was cased and perforated on January 8, 2008 and we expect that it will undergo an extended production test. Surface facilities have been constructed and a pipeline right-of-way is being selected. The well entered production on May 2, 2008. We have expended approximately $.97 million to date on the well.
Operational Overview: Australia — Corporate
General
Our original strategy for operating in Australia was based on our expectation that significant reserves of natural gas could be produced through the use of techniques, such as underbalanced drilling, that had not yet been widely adopted by the Australian oil and gas industry. We felt that natural gas was significantly underpriced and that, especially in the Queensland market, the price would strengthen over time due to decreased supply and increased demand. We acquired interests in a diverse portfolio of permits located in Queensland (our primary area of interest in Australia), Western Australia, Victoria and South Australia and negotiated farmin arrangements that permitted us to drill development wells in already producing fields in order to minimize our risk. Although we have limited production in Queensland as a result of the Mosaic farmin arrangements summarized below, the development drilling in PL71 in Queensland resulted in one dry hole and one lost well bore following equipment failure.
Despite having participated in 15 wells in four different basins in Australia over the past seven years, our results to date have been disappointing, with only one well in Queensland currently in production. Recent seismic acquisition, processing and interpretation in ATP 754P located in Queensland has resulted in eight oil prospects and leads, the exploration of which will require either additional capital or locating one or more farm-in partners.
Our board of directors has determined to dispose of our Australian interests, and we have hired an investment bank in Australia, Origin Capital Group, to explore our strategic options with regard to our assets in Australia. Options we are considering include, but are not limited to, (i) sale of ARL or its assets; and (ii) merger of ARL with a third party. As part of this divestiture, we will close our Brisbane office during the third quarter of 2008.
Mosaic Farmin (PL 119, PPL 58, and ATP 471P — Queensland)
In May 2006, we entered into an agreement with Mosaic Oil NL (“Mosaic”) and Santos Limited (“Santos”) under which we could earn up to 35% interest in PL 119 (Downlands and Downlands East gas fields), the Bainbilla Block of ATP 471P (Brynog oil prospect) and PPL 58 (Downlands pipeline license), all located in southeast Queensland’s Surat / Bowen Basin. Our maximum 35% interest was to be earned through spending up to approximately $5.9 million (AU$6.5 million) in new seismic acquisition and drilling up to four
25
Table of Contents
wells in two stages. Mosaic remains the operator of these permits, although we have input and veto rights on well design, well locations and the order of the wells to be drilled.
As of May 31, 2007, we believed that we had completed Stage 1 of the Mosaic farmin agreement by spending approximately $4.2 million (AU$5.0 million) to earn a 26.9% interest in the farmin area. As part of Stage 1, we reimbursed Mosaic and Santos approximately $0.4 million (AU$0.5 million) for the cost of acquired 2D seismic data in the Bainbilla Block, which borders permit ATP 470P (Ausam 45%) and drilled the Downlands-4, Downlands South-1 and Brynog-1 wells. Production from the Downlands-4 well commenced in May 2007. Following negotiation with Mosaic on the status of Stage 1 of the Mosaic Farmin, it was agreed that we have earned 24.748% interest in PL 119 and ATP 471P Bainbilla Block and we will receive a refund of AU$129,343 in overpayments on the Downlands South-1 well. We have elected not to continue with Stage 2 of the Mosaic farmin agreement, which would require an additional expenditure of $1.3 million (AU$1.5 million) to earn up to a 35% interest in the subject permits.
Rawson Farmin (ATP 552P — Queensland)
We entered into a farmin agreement with Rawson Resources Limited (“Rawson”) in ATP 552P in the Surat/Bowen Basin, Queensland. ATP 552P is a 42,600 acre (67 sections) permit along trend with the Fairymount and Alton oil fields. We and Rawson funded 50% of the Bellbird West-1 well in return for each earning a 25% interest in the permit. We and Rawson have the option to farmout a portion of our interests in ATP 552P. Great Artesian Oil and Gas Limited, the beneficial owner of the permit, retains the remaining 50% interest. We were the operator of the Bellbird West-1 well which was drilled in conventionally in July and August 2006, and drilled out under-balanced in November 2006 before being plugged and abandoned as a dry hole. The permit is under evaluation as the adjacent fault separated anticline contains two additional well locations that are up-dip to the Bellbird-1 well, which produced oil but at non-commercial rates.
Rawson Farmin (PEL 107 — South Australia)
We entered into a second farmin agreement with Rawson to participate in Rawson’s farmin of the western part of PEL 107 in South Australia. Under the terms of the agreement, Ausam paid 20% of the cost of the Appadare-1 well in order to earn a 10% interest in the western half of the permit. The Appadare-1 well was spudded in January 2007 and was drilled to a depth of 1,922 meters (6,306 feet). The well was plugged and abandoned after the target zone in the Patchawarra formation was discovered to be water-wet. The total cost of the well was approximately $1.4 million (AU$1.5 million), of which we paid approximately $270,000 (AU$300,000).
EP 23, EP 321, EP 407 (Western Australia)
During the first quarter of 2007, we were approached by two parties to farmin to the Warro gas prospect in EP 321 and EP 407. We subsequently reached an agreement to sell our interests but the sale has not yet closed. The permits incur nominal costs to maintain and limited financial liability in the event that these permits are relinquished. We were advised by the West Australian Mines Department that our lease of EP 23 had expired as of June 9, 2007. There was no penalty for relinquishing permit EP 23.
Operational Overview: Australia — Drilling and Seismic
Kyeen Creek-1 (ATP 470P — Queensland)
During the first quarter of 2006, the Kyeen Creek-1 well was drilled (Ausam 35.0%, Santos Ltd. 6.5%, Origin 58.5% and operator) in ATP 470P, which is a 68,500 acre (107 sections) permit located in the Surat/Bowen Basin. The well was a commitment/exploration well and consequently was drilled conventionally. The Kyeen Creek-1 well confirmed structural closure as well as gas in the Triassic Basal Rewan reservoir, which produced on test, and oil shows in the deeper Timbury Hills formation. However, the Permian reservoirs were deemed to be non-commercial at the Kyeen Creek-1 well location. The well was logged and sidewall cores were taken from the Triassic Basal Rewan, Permian Upper and Lower Tinowon, and Timbury Hills formations. Upon analysis, it was determined that Kyeen Creek-1 did not have any reservoir quality sands developed
26
Table of Contents
within the targeted Upper or Lower Tinowon sandstone intervals, with no gas shows, fluorescence or net pay mapped. Kyeen Creek-1 was plugged back to the casing shoe allowing access to the surface casing for a future underbalanced re-drill of the gas charged Basal Rewan.
Appadare-1 (PEL 107 — South Australia)
The Appadare-1 well (Beach Petroleum, operator) was drilled as an exploration well in January 2007 under the Rawson farmin described above, targeting the Patchawarra Formation. The well was plugged and abandoned when the target zone proved to be water-wet.
Downlands South-1 (PL 119 — Queensland)
The Downlands South-1 well was spudded on March 12, 2007 as an appraisal well under the Mosaic farmin agreement. The well was drilled to a total depth of 1,887 meters (6,190 feet). After logging and conducting an open-hole DST, the well was plugged and abandoned.
Brynog-1 (ATP 471P Bainbilla Block — Queensland)
The Brynog-1 well was spudded on March 26, 2007 as an exploration well under the Mosaic farmin agreement to test the Permian Tinowon sandstone. Casing was set at 2,086 meters (6,844 feet) and the objective section was drilled underbalanced with nitrogen to a total depth of 2,153 meters (7,064 feet). The well was plugged and abandoned after failing to intersect reservoir-quality sands.
Seismic Acquisition (ATP 754P — Queensland)
We and Origin Energy Resources Limited (“Origin Energy”, operator) each hold 50% interest in permit ATP 754P, which covers approximately 680,000 gross acres (340,000 acres net to us). The permit was renewed effective August 1, 2007, the terms of which renewal require drilling a well within the first four years. During the first half of 2006, we completed a new240-kilometer 2D seismic acquisition, processing and initial interpretation program over seven current leads as well as extensions of pre-existing seismic lines to improve understanding of the permit’s geology. Interpretation and evaluation of this new 2D data has eliminated two former leads, better defined five leads, and identified three new leads in the western portion of ATP 754P. The ATP 754P joint venture has subsequently acquired an additional 90 kilometers of seismic over the three new leads. Origin has proposed drilling a well in the second or third quarter of 2008 at a cost of $1.4 million (AU$1.6 million), of which we would pay 50% unless we farmed out our interest.
PEP 166 — Victoria
During February 2006, the Loy Yang-2 exploration/commitment well was drilled in PEP 166, which is in the Onshore Gippsland Basin, Victoria. The operator was PetroTech, a subsidiary of Lakes Oil NL (“Lakes”). We currently have a 25% interest in PEP 166, an 877,000 acre permit. We reduced our percentage interest from 50% to 25% in an 8,650-acre envelope (the “Loy Yang Block”) covering the Loy Yang Dome prospect in exchange for Lakes funding 100% of the costs to drill, frac, test and complete the Loy Yang-2 well. Lakes announced that the well was cased and suspended at a depth of 1,443 meters (4,734 feet). We reduced our interest in the remainder of PEP 166, which is outside of the Loy Yang farmin area, from 50% to 25% in exchange for $45,000 (AU$50,000) and being carried through the drilling of two wells, the Hazelwood-1 and the Boola Boola-2. The Hazelwood-1 well was spudded on April 16, 2007, and was drilled to a total depth of 2,081 meters (6,827 feet). Log interpretations indicated that the primary target reservoirs were not present or poorly developed, and the well was plugged and abandoned.
The Boola-Boola-2 well spudded on June 2, 2007. On July 2, 2007, drilling of the well was terminated at a total depth of 1,887 metres (6,191 feet). The section below 1,500 metres (4,920 feet) was partially funded by Greenearth Energy to obtain geothermal data. The well was unsuccessful in finding hydrocarbons and was plugged and abandoned. Lakes and Greenearth Energy have the option to re-enter the well should they decide that a test of deeper intervals is warranted. We believe that neither well is commercial.
27
Table of Contents
Proposed Drilling Program — United States
We drilled three prospects in 2007, and expect to drill four prospects (three of which we currently own and one of which we anticipate that we will farm into) and acquire significant amounts of new seismic data during 2008. We expect to drill, sell, or relinquish the remaining prospects plus additional development wells in 2009 and 2010. We do not have any contractual commitments with respect to the drilling of these wells. We do not intend to maintain 100% ownership in any of these prospects. We expect to drill the prospects in joint venture with partners who are experienced in the oil and gas business. Our drilling program is subject to change based upon a wide range of factors including equipment availability, weather, joint venture partners, and regulatory issues.
As of the date of this prospectus, our budget projects that we will receive approximately $2.6 million from partners as re-imbursement of prospect acquisition costs and approximately $14.7 million to help fund drilling costs during 2008. In the event that we are unable to enter into binding agreements with drilling partners, or if our drilling partners fail to fund their commitments, we may have to either delay drilling of a well until we have found replacement partners or to fund the entire amount of the well ourselves.
As of December 31, 2007, we had $9.4 million in cash. These funds, together with funds expected to be received from production and funds expected to be received from farmout arrangements, are considered by management to be sufficient to finance the majority of the short term drilling and exploration program, seismic acquisition, and operating expenses as outlined above.
Actual drilling results as well as the evaluation of and participation in other drilling opportunities may change the scope and timing of our plans. We intend to closely manage the timing and participation interest of our drilling program in order to optimize the use of existing funds. Additional funds would be required if we pursued the entire program at our current participation interest. However, we do not intend or expect to maintain 100% ownership in any of our U.S. properties and we are actively seeking industry partners. We expect to raise additional funds as needed by way of offerings of equity, debt or a combination thereof.
Proposed Drilling Program — Australia
Origin Energy has proposed the drilling of a well to test the Mardi oil prospect in ATP 754P during the third quarter of 2008. We have not received a final AFE for the well, but initial estimates would place the cost at AU$1.6 million, or AU$800,000 for our 50% share. We expect to have disposed of our interest in ARL prior to being required to fund this well. In the event we have not done so, we intend to seek farmout partners to reduce our interest in this well. We have budgeted no funds for drilling or seismic operations in Australia during 2008.
Critical Accounting Policies and Estimates
Full-Cost Method of Accounting for Oil and Gas Operations
The accounting for our business is subject to special accounting rules that are unique to the oil and gas industry. There are two allowable methods of accounting for oil and gas business activities: the successful-efforts method and the full-cost method. There are several significant differences between these methods. Under the successful-efforts method, costs such as geological and geophysical (G&G), exploratory dry holes and delay rentals are expensed as incurred, where under the full-cost method these types of charges would be capitalized to their respective full-cost pool. In the measurement of impairment of oil and gas properties, the successful-efforts method of accounting follows the guidance provided in Statement of Financial Accounting Standards (SFAS) No. 144, “Accounting for the Impairment or Disposal of Long-Lived Assets,” where the first measurement for impairment is to compare the net book value of the related asset to its undiscounted future cash flows using commodity prices consistent with management expectations. Under the full-cost method, the net book value (full-cost pool) is compared to the future net cash flows discounted at 10 percent using commodity prices in effect on the last day of the reporting period (ceiling limitation). If the full-cost pool is in excess of the ceiling limitation, the excess amount is charged through income.
28
Table of Contents
We have elected to use the full-cost method to account for our investment in oil and gas properties. Under this method, we capitalize all acquisition, exploration and development costs for the purpose of finding oil and gas reserves, including salaries, benefits and other internal costs directly attributable to these finding activities. Although some of these costs will ultimately result in no additional reserves, we expect the benefits of successful wells to more than offset the costs of any unsuccessful ones. In addition, gains or losses on the sale or other disposition of oil and gas properties are not recognized unless the gain or loss would significantly alter the relationship between capitalized costs and proved reserves of oil and natural gas attributable to a country. As a result, we believe that the full-cost method of accounting better reflects the true economics of exploring for and developing oil and gas reserves. Generally, the application of the full-cost method of accounting for oil and gas property results in higher capitalized costs and higher depreciation, depletion and amortization (“DD&A”) rates compared to similar companies applying the successful efforts methods of accounting.
Reserve Estimates
Our estimate of proved reserves is based on the quantities of oil and gas which geological and engineering data demonstrate, with reasonable certainty, to be recoverable in future years from known reservoirs under existing economic and operating conditions. We report all estimated proved reserves held under production sharing arrangements utilizing the “economic interest” method. The accuracy of any reserve estimate is a function of the quality of available data, engineering and geological interpretation, and judgment. For example, we must estimate the amount and timing of future operating costs, severance taxes, development costs, and workover costs, all of which may in fact vary considerably from actual results. In addition, as prices and cost levels change from year to year, the estimate of proved reserves also changes. Any significant variance in these assumptions could materially affect the estimated quantity and value of our reserves. As such, our reserve engineers review and revise our reserve estimates at least annually.
Despite the inherent imprecision in these engineering estimates, our reserves are used throughout our financial statements. For example, since we use the units-of-production method to amortize our oil and gas properties, the quantity of reserves could significantly impact our DD&A expense. Our oil and gas properties are also subject to a “ceiling” limitation based in part on the quantity of our proved reserves.
In accordance with TSXV policy, we engage GLJ Petroleum Consultants, an independent petroleum engineering firm, to prepare annual reserve reports for our properties to NI51-101 standards. During 2007, 2006, 2005 and 2004, their report covered the reserve value of all of our properties. For 2007, their report was also prepared in accordance with Securities and Exchange Commission guidelines.
Costs Excluded
Under the full-cost method of accounting, oil and gas properties include costs that are excluded from capitalized costs being amortized. These amounts represent investments in unproved properties. We exclude these costs on acountry-by-country basis until proved reserves are found or until it is determined that the costs are impaired. All costs excluded are reviewed at least quarterly by our accounting, exploration and engineering staffs to determine if impairment has occurred. Nonproducing leases are evaluated based on the progress of our exploration program to date. Exploration costs are transferred to the DD&A pool upon completion of drilling individual wells. If geological and geophysical (G&G) costs cannot be associated with specific properties, they are included in the amortization base as incurred. The amount of any impairment is transferred to the capitalized costs being amortized (the DD&A pool) or a charge is made against earnings for those operations where a proved reserve base has not yet been established. Impairments transferred to the DD&A pool increase the DD&A rate for that country. For operations where a reserve base has not yet been established, all costs associated with a permit would be considered quarterly for impairment upon full evaluation of such permit. This evaluation considers among other factors, seismic data, requirements to relinquish acreage, drilling results, remaining time in the commitment period, remaining capital plans, and political, economic, and market conditions.
29
Table of Contents
Asset Retirement Obligation
We have certain obligations to remove tangible equipment and restore land at the end of oil and gas production operations. Our removal and restoration obligations are primarily associated with plugging and abandoning wells. Estimating the future restoration and removal costs is difficult and requires management to make estimates and judgments because many of the removal obligations are years in the future and contracts and regulations often have vague descriptions of what constitutes removal. Asset removal technologies and costs are constantly changing, as are regulatory, political, environmental, safety and public relations considerations.
Inherent in the present value calculation are numerous assumptions and judgments including the ultimate settlement amounts, inflation factors, credit adjusted discount rates, timing of settlement, and changes in the legal, regulatory, environmental and political environments. To the extent future revisions to these assumptions impact the present value of the existing Asset Retirement Obligation liability, a corresponding adjustment is made to the oil and gas property balance.
Income Taxes
Our oil and gas exploration and production operations are currently located in two countries. As a result, we are subject to taxation on our income in numerous jurisdictions. We record deferred tax assets and liabilities to account for the expected future tax consequences of events that have been recognized in our financial statements and our tax returns. We routinely assess the realizability of our deferred tax assets. If we conclude that it is more likely than not that some portion or all of the deferred tax assets will not be realized under accounting standards, the tax asset would be reduced by a valuation allowance. We consider future taxable income in making such assessments. Numerous judgments and assumptions are inherent in the determination of future taxable income, including factors such as future operating conditions (particularly as related to prevailing oil and gas prices). To date, we have not achieved positive earnings and have assessed a 100% valuation allowance against any deferred tax assets.
In June 2006, the FASB issued Financial Interpretation No. 48, “Accounting for Uncertainty in Income Taxes” (FIN 48), which clarifies the accounting for uncertainty in income taxes recognized in a company’s financial statements in accordance with FASB Statement No. 109, “Accounting for Income Taxes.” The interpretation prescribes a recognition threshold and measurement attribute criteria for the financial statement recognition and measurement of a tax position taken or expected to be taken in a tax return. The interpretation also provides guidance on derecognition, classification, interest and penalties, accounting in interim periods, disclosure and transition.
We adopted the provisions of FIN 48 on January 1, 2007. The adoption of FIN 48 did not impact our consolidated financial condition, results of operations or cash flows. At January 1, 2008, we had unrecognized tax benefits of $1.2 million, of which approximately $0.8 million of non-capital losses will expire in January, 2008.
We are currently open to audit under the statute of limitations by the Canada Revenue Agency for the years ending December 31, 2000 through 2007. Our United States’ subsidiary, Noram, is currently open to audit under the statute of limitations by the Internal Revenue Service for the years ending December 31, 2006 and 2007. Our Australian subsidiary, ARL, is currently open to audit under the statute of limitations by the Australian Tax Office for the years ending December 31, 2003 through 2007.
We and our subsidiaries may from time to time be assessed interest or penalties by major tax jurisdictions, although to date there have been no such assessments. In the event an assessment for interestand/or penalties is received, it will be classified in our financial statements as general and administrative expense.
We regularly assess and, if required, will establish accruals for tax contingencies that could result from assessments of additional tax by taxing jurisdictions in countries where we operate.
30
Table of Contents
Stock-Based Compensation
Consistent with our desire to reflect the ultimate cost of stock-based compensation on the income statement, we have adopted the provisions ofSFAS No. 123-R “Share-Based Payment.” Stock-based compensation awards that vest during the year are reflected in our net income. Awards granted in future periods will be valued on the date of grant and expensed using a straight-line basis over the required service period.
We chose to adopt the statement under the “Modified Retrospective” approach as prescribed underSFAS No. 123-R. Under this approach, we are required to expense all options and stock-based compensation that vested during the year of adoption based on the fair value of the stock compensation determined on the date of grant. Please refer to “Compensation Discussion and Analysis — Stock Option Plan” and Management — Executive Compensation — Summary Compensation Table — Stock Option Grants and Exercises” for a description of our Stock Option Plan and certain costs associated with it.
Also, inherent in expensing stock options and other stock-based compensation underSFAS No. 123-R are several judgments and estimates that must be made. These include determining the underlying valuation methodology for stock compensation awards and the related inputs utilized in each valuation, such as the expected stock price volatility of our Common Shares, expected term of the employee option, expected dividend yield, the expected risk-free interest rate, the underlying stock price and the exercise price of the option. Changes to these assumptions could result in different valuations for individual share awards and will be carefully scrutinized for each material grant. For option valuations, we utilize the Black-Scholes option pricing model.
Change in Accounting Policies
As of July 1, 2007, we determined that our functional currency should be U.S. dollars. Other than as described in Stock-Based Compensation above, there were no other changes in accounting policies during 2006 or to date in 2007. In accordance with Securities and Exchange Commission rules, the financial statements included in this form are in accordance with U.S. Generally Accepted Accounting Principles (“U.S. GAAP”). Our previously issued financial statements were prepared in accordance with Canadian Generally Accepted Accounting Principles (“Canadian GAAP”).
31
Table of Contents
Selected Financial Information
| As of The Year Ended | ||||||||||||
| December 31, | December 31, | December 31 | ||||||||||
| 2007 | 2006 | 2005 | ||||||||||
| Oil and Gas Revenue | $ | 371,921 | $ | — | $ | — | ||||||
| Operating Cost | (82,185 | ) | — | — | ||||||||
| Depreciation, depletion and amortization | (19,915,907 | ) | (37,054 | ) | (27,930 | ) | ||||||
| Asset write down | — | (1,535,208 | ) | (5,508,975 | ) | |||||||
| General and administration | (8,553,588 | ) | (2,480,065 | ) | (2,820,347 | ) | ||||||
| Due diligence and acquisition related expenses | — | — | (1,367,961 | ) | ||||||||
| Financing | (938,418 | ) | — | — | ||||||||
| Interest on convertible debentures | (1,132,722 | ) | — | — | ||||||||
| Accretion of convertible debentures | (425,248 | ) | — | — | ||||||||
| Interest expense | (4,729 | ) | — | — | ||||||||
| Interest and other income | 530,734 | 252,003 | 280,485 | |||||||||
| Net loss before cumulative effective of change in accounting principles | (30,150,143 | ) | (3,800,324 | ) | (9,444,728 | ) | ||||||
| Cumulative effect of adoption of SFAS 123R | — | 31,240 | — | |||||||||
| Net loss | $ | (30,150,143 | ) | $ | (3,769,084 | ) | $ | (9,444,728 | ) | |||
| Total assets | $ | 58,178,115 | $ | 12,915,268 | $ | 12,141,333 | ||||||
| Working capital | $ | 7,874,744 | $ | 1,697,963 | $ | 7,205,548 | ||||||
| Shareholders’ equity | $ | 38,579,849 | $ | 11,388,524 | $ | 11,403,865 | ||||||
We incurred a net loss for the year ended December 31, 2007 of $30,150,143 compared to a loss for the year ended December 31, 2006 of $3,769,084 and a loss of $9,444,728 during 2005. The dramatic increase primarily reflects asset impairment write-downs on assets in Australia and the United State and depletion, although it also reflects a large increase in General and administration expenses due to increased salaries, legal and professional fees relating to corporate transactions, the change from Canadian GAAP to US GAAP, and the opening of the Houston office. The decreased net loss in 2006 reflects a significant reduction in the asset write down recorded during the year compared with 2005. During 2007, we had properties enter production, so impairments to asset value are reflected in additions to the depreciation, depletion and amortization pool. For 2007, the amount of $19,915,907 is impairment, depreciation, depletion and amortization of asset values of $9,446,672 from our Australian properties and $10,446,853 in the United States and $22,382 from Canada. The United States amounts include the dry hole at T-Patch 1, drilling costs of the RDH Farms #1 well and the determination that we would be unlikely to drill a well at either Saudi or Peach Creek. It also includes the write down of our Duval County, Texas prospects whose market value was determined to be lower than their book value. This compared to a write down plus depreciation, depletion and amortization of $1,572,262 that was recorded during 2006, and $5,536,905 during 2005. In 2005, our regular impairment review following the drilling results in ATP 682P and PL 71 as well as the results of the attempted farm-out of EP 23, EP 321, and EP 407 in Western Australia during 2005 resulted in our writing off the asset value of those properties. Other major costs during 2005 were due diligence and acquisition related expenses with respect to an unsuccessful corporate transaction, travel and other costs associated with financings, and the effects of the recognition of stock options as an expense during 2005.
Interest and Other Income
Interest and other income was $530,734 for the year ended December 31, 2007 compared to $252,003 for the year ended December 31, 2006, and compared to $280,485 for the year ended December 31, 2005. The fluctuation in interest and other income is due to changing amounts of funds on deposit during these periods.
32
Table of Contents
General and Administrative
General and administrative costs increased markedly during the year ended December 31, 2007 to $8,553,558 compared to $2,480,065 for the year ended December 31, 2006 and $2,820,347 for the year ended December 31, 2005 because we incurred large legal and professional fees relating to corporate transactions and filings, and changing the basis of our accounting from Canadian GAAP to US GAAP, foreign exchange losses, incurred travel costs relating to fund raising, and established and staffed an office in Houston. Salary and consulting fee expense for 2007 was $2,760,684 against $969,166 for all of 2006, reflecting the activity level in the United States.
Due Diligence and Acquisition Related Expenses
Due diligence and acquisition related expenses during the year ended December 31, 2005 were $1,367,961. These costs and expenses relate to the investigation and due diligence associated with a potential corporate acquisition in Australia, which was not consummated. These costs comprised independent reserve engineering fees, financing fees, legal and tax fees, fees for independent consultants and travel costs.
Stock Option Expense
Stock option expense of $1,487,111 was incurred during the year ended December 31, 2007 due to additional grants on April 4, 2007 and September 5, 2007. Stock option expense was $266,918 for the year ended December 31, 2006, compared to $993,193 for 2005. The decrease for 2006 reflects the fact that no options were granted during the year.
Asset Write Down
We conduct impairment reviews on our properties on a quarterly basis. A write-down of $8,211,403 was applied to our Australian assets during 2007 to reflect the write down of the entire portfolio of Australian properties with the exception of ATP754P which was written down to the estimated proceeds from a sale. The write down is included in depreciation, depletion and amortization for 2007. During 2006, the result of this review was an asset write down of $1,535,208 to reflect impairment in the carrying value of certain of our oil and gas assets.
During 2005, we conducted an impairment review on all of our properties following the drilling results in ATP 682P and PL 71 as well as the results of the attempted farm-out of EP 23, EP 321, and EP 407 during 2005. The result of this review was an asset write down of $5,508,975 to reflect impairment in the carrying value of our oil and gas assets. Areas where we have relinquished or intend to relinquish exploration permits have been fully written off. The asset write down principally applied to PL71 and ATP682P in the Surat /Bowen Basin in Queensland and the EP 23, EP 321, and EP 407 permits in Western Australia.
During 2007 we also conducted an impairment review of our assets in the United States, resulting in a write down of $9,511,587, reflecting the impairment of our T-Patch 1 prospect following the drilling of a dry hole, the costs of the RDH Farms #1 well and the determination that we would be unlikely to drill a well at either Saudi or Peach Creek and that our estimate of the market value of our Duval County, Texas prospects (Hoffman Creek, Z-Sand and Rosita) was lower than their book value. The $9,511,587 for 2007 is included in depreciation, depletion and amortization.
Depreciation, Depletion and Amortization
Depletion commenced in 2007, as a result of the commencement of production from the Mosaic farmin and the RDH Farms #1 well. Depreciation, depletion and amortization expense for the year ended December 31, 2007 was $19,915,907. This amount in 2007 includes asset impairment of $8,211,403 for Australia and $9,511,588 for the US discussed above; $2,115,444 in depletion and depreciation of oil and gas properties through production and $76,207 in depreciation of office furniture and fixtures. The amounts for December 31, 2006 of $37,054 and $27,930 for 2005 only include depreciation of office furniture and fixtures. The increase to $76,207 in 2007 was attributed to opening of the Houston office. Depreciation and depletion
33
Table of Contents
of oil and gas properties increased to $2,115,444 in 2007 compared to nil in 2006 and 2005 as there was no oil and gas production in those years.
Total Assets
During 2007 our primary focus changed from Australia to the United States. We closed the SKH Purchase at a cost of $43,343,274 and acquired an additional prospect from SKH in February 2007, providing us with 20 prospects on which we expended $7,177,573 in exploration costs during the year ended December 31, 2007. The SKH Purchase, drilling cost, additional leasehold capitalized cost of $3,676,236, increase in deferred financing cost of $1,839,907, and cash of $6,532,365 less additional accumulated depreciation, depletion and amortization of $19,915,907 accounted for $42,653,448 of the $45,262,847 increase in our total assets from $12,915,268 at December 31, 2006 to $58,178,115 at December 31, 2007. We also farmed into the Quatre prospect on which we expended $973,201, including the drilling and completion of the Fisher-Lindsey-1 well. Net cash proceeds from the Huff Transaction which closed in July 2007 along with issuance of Common Shares and warrants to purchase Common Shares also increased our assets.
Working Capital
Our working capital increase from $1,697,963 at December 31, 2006 to $7,874,744 at December 31, 2007 was mainly attributable to cash proceeds from the Huff Transaction and the issuance of Common Shares and warrants to purchase Common Shares.
Shareholders’ Equity
Shareholders’ equity increased from $11, 388,524 at December 31, 2006 to $38,579,849 at December 31, 2007. This increase was attributable to the issuance of Common Shares and warrants to purchase Common Shares associated with the Common Share and Preferred Share financings, the SKH Purchase and the Huff Transaction in the net amount of $52,460,471 of which $28,357,672 represents Common Shares issued as a component of the SKH Purchase, an increase in additional paid-in capital as a result of stock based compensation and the beneficial conversion feature related to the Debenture. The aggregate increase was offset by a loss for the period of $30,150,143 and a change in accumulated other comprehensive income of $2,192,755.
Liquidity and Financial Condition; Going Concern Qualification
We do not currently have sufficient cash on hand or generate sufficient cash flow from operations to fund all of our exploration and development activities or potential acquisitions. We have therefore relied and will continue to rely upon the sale of equity and debt securities to provide additional financing. There can be no assurance that financing, whether debt or equity, will be available to us in the amount required at any particular time or for any period and, if available, that it can be obtained on terms satisfactory to us.
Our financial statements have been prepared assuming that we will continue as a going concern. The audit opinion on our consolidated financial statements dated December 31, 2007, includes a qualifying paragraph regarding our ability to continue as a going concern as described in Note 1 to the consolidated financials. In the event we are unable to obtain additional capital, we may have to postpone or curtail our drilling program, which could result in lower future revenues from production.
As of December 31, 2006, we had $2,865,157 in cash. On February 8, 2007, additional funds totaling approximately $46 million were received or secured upon the closing of the SKH Purchase and related financings. Of this amount, $15 million was used as the cash portion of the acquisition. As part of the financing, we issued preferred share units for proceeds totaling $11,978,000 and secured convertible debt facilities of up to $17,800,000.
As of June 30, 2007, we had $1,469,750 in cash and other current assets of $442,041. The Huff Transaction provided liquidity and enabled us to redeem the outstanding First Preferred Shares, Series 2 in
34
Table of Contents
July 2007, as well as proceed with drilling the T-Patch-1, RDH Farms #1, and Fisher Lindsey #1 wells. As of December 31, 2007, we had $9,397,522 in cash and other current assets of $643,552.
Cash and current assets on hand will not be sufficient to fund our entire proposed drilling program. The funds we have on hand together with funds expected to be received from production, funds already advanced to the joint ventures and funds received with respect to farmin agreements are considered by management to be sufficient to finance our short term drilling and exploration program, seismic acquisition program and operating expenses.
Currently, we have no contractual commitments for the drilling of the four wells in the 2008 drilling program. The proposed 2008 drilling program aggregate cost is budgeted for $24,275,000, of which $14,656,250 is expected to be funded by working interest partners with the remaining $9,618,750 being funded by us. We do not have contractual commitments from our prospective partners and have not received funds from them for the wells we propose to drill. We do not expect to receive binding commitments or funds until shortly before drilling commences on each prospect. If we do not receive funds from working interest partners, we will either postpone drilling the well, find replacement partners, or fund the additional expenses ourselves. The drilling program as currently proposed will evaluate three of the SKH Prospects and contemplates one farmin with a third party that is currently being negotiated. Additional development wells may be drilled depending on results.
Additional capital is expected to be generated through the placement of working interests to partners for each of our prospects, which results in our recovery of costs associated with the acquisition and development of each prospect. The reduced working interest also lessens the amount of capital we are required to provide for drilling. If we are not able to place working interest in prospects with partners, we will either raise additional capital to fund the drilling of a larger percentage of the prospects, sell the prospects to 3rd parties or return the prospects to SKH in accordance with the Participation Agreement. Further, cash flow is expected to be generated through successful efforts. Outside of these organic sources of capital, we expect to attract new investment from our existing shareholders as well as through private placements with new investors as we have done throughout our brief history.
We may need to obtain additional funds for processing facilities and infrastructure in the event our 2008 drilling program finds significant commercial quantities of natural gas and oil. We cannot be certain we will be able to raise additional funds on terms that are satisfactory.
Actual drilling results as well as the evaluation of and participation in other drilling opportunities will change the scope and timing of our plans. We intend to closely manage the timing and participation interest of our drilling program in order to optimize the use of existing funds. Additional funds would be required if we pursued the entire program at our current participation interest. However, we do not intend or expect to maintain 100% ownership in any of our U.S. properties and we are actively seeking certain industry partners with drilling and operations experience relevant to each prospect.
Our working capital position at December 31, 2007 was $7,874,744 compared to working capital at December 31, 2006 of $1,697,963. The cash position at December 31, 2007 was $9,397,522 compared to $2,865,157 at December 31, 2006. The increases in both working capital and cash reflect the changes in our company from the SKH Purchase, the Huff Transaction, and the issuance of Common Shares and warrants to purchase Common Shares during 2007.
During the year ended December 31, 2007, there was a cash outflow from operations of $6,751,524 compared to a cash outflow from operations of $2,377,419 during the year ended December 31, 2006. This increase is primarily due to drilling activity in Australia during the first half of 2007, the creation and staffing of a Houston office and the level of activity in the United States. The change from 2005 to 2006 is primarily attributable to the absence in 2006 of funds used in 2005 with respect to the investigation and due diligence associated with an unsuccessful potential corporate transaction in Australia.
During the year ended December 31, 2005, there was a cash outflow from operations of $2,666,956 compared to a cash outflow from operations of $1,433,033 during the year ended December 31, 2004. This increase is due to increased operating expenses following the RTO in 2004, increased staff, the operation of
35
Table of Contents
two locations (Calgary and Brisbane), and funds used with respect to the investigation and due diligence associated with a potential corporate transaction.
Financing activities for the year ended December 31, 2007 yielded cash of $38,271,054 including $11,980,451 from the issuance of preferred shares that were redeemed at September 30, 2007, $17,440,013 from issue of common shares and warrants and $25,000,000 from the issue of convertible debt and warrants. During the year ended December 31, 2006, cash inflows from financing activities totaled $1,906,458, primarily from $1,568,875 of proceeds from the issue during October 2006 of Units (the “October 2006 Units”), at $2.00 per October 2006 Unit to arms’ length purchasers for total gross proceeds of $1,750,000. Cash share issue costs relating to the share issue were $22,413. Each October 2006 Unit consists of one of our Common Shares and one warrant (“Noram Warrant”) exchangeable for one common share of Noram Resources, Inc. at no extra cost in the event that the acquisition of the SKH Prospects under the agreement executed on September 22, 2006, failed to close on or prior to January 31, 2007. After being extended by agreement with the Noram Warrant holders, the Noram Warrants expired unexercised on February 8, 2007. Proceeds of the private placement were used to fund the SKH Purchase as well as to complete the final title work, permitting and drill site preparations necessary in advance of the proposed drilling program. During 2006, $359,996 was received from the repayment of a loan to an officer and director (see “Related Party Transactions”). During 2006, $683,956 of deferred costs was incurred on expenses relating to the SKH Purchase and related financings.
During the year ended December 31, 2005, cash inflows from financing activities totaled $8,343,813, primarily from $8,944,440 net proceeds from the exercise of warrants and the issue during June/July 2005 of Units at CDN$4.50 per Unit (each “Unit” comprised one Common Share and one half of one share purchase warrant where each warrant entitled the holder to acquire one Common Share at a price of CDN$6.00 until December 1, 2006 and where each of the shares and warrants comprising Units were subject to a four month hold period). Cash share issue costs relating to this financing totaled $302,385. In addition, during 2005, $359,996 was advanced to an officer and director (see “Related Party Transactions”).
During the year ended December 31, 2007, we used cash of $28,211,193 for capital asset additions, primarily the SKH Purchase, which together with a decrease in advances to joint venture partners resulted in cash used for investing activities of $27,764,243. Investing activities, of $4,408,195 during the year ended December 31, 2006 was composed primarily of capital expenditures of $4,101,975 (being drilling costs of the Kyeen Creek-1, Bellbird West-1 and Downlands-4 wells, and seismic costs with respect to ATP754P and ATP471P), and a net reduction of $127,612 in advances to our joint venture partners in Australia with respect to exploration and drilling, offset by changes in related working capital.
Investing activities during the year ended December 31, 2005 totaled $5,022,639, and included capital expenditures of $5,341,072, being the cost of drilling three wells (the Namarah-7 and Parknook-7 development wells in PL71 (Ausam funded 100% of the wells and owns a 20% interest in the permit) and the exploratory/development well Ungabilla-1 in ATP754P); the initial costs associated with 240 kilometers of new 2D seismic in ATP 754P; and costs for a regional geophysical and geological study of the Taroom Trough and our Queensland permits in the Surat/Bowen Basin, Queensland, Australia. The regional study was performed to identify, evaluate and rank exploration targets in our permits.
Equity
As at December 31, 2006, there were 54,697,764 pre-consolidation common shares issued and outstanding. On June 30, 2007, there were outstanding 149,629,984 pre-consolidation common shares and 16,666,666 pre-consolidation First Preferred Shares Series 2. There was a 1:5 reverse share consolidation on September 26, 2007 and all outstanding preferred shares were redeemed in July 2007. As of December 31, 2007 and May 9, 2008, there were 30,368,337 Common Shares issued and outstanding. For purposes of financial statement presentation, share numbers have been adjusted to reflect the reverse share consolidation.
36
Table of Contents
Noram Warrants
As at December 31, 2006, there were 875,000 warrants issued and outstanding, exchangeable for one common share of Noram at no extra cost should the SKH Purchase announced on September 22, 2006 fail to close by a certain date. Noram is a wholly-owned subsidiary of Ausam that, as a condition of closing of the October 2006 private placement, was assigned a 20% interest in the leases that contain the Iola prospect, which is one of the prospects that was acquired from SKH as part of the SKH Purchase. Under the terms of the Noram Warrants, if the SKH Purchase transaction was successfully completed prior to January 31, 2007, Noram would remain our wholly-owned subsidiary and the Noram Warrants would automatically expire. If the SKH Purchase failed to close prior to January 31, 2007, or such other date as the parties agreed, all of the Noram Warrants would automatically be exchanged according to their terms and the holders of the Noram Warrants would become the owners of all of the issued and outstanding shares of Noram.
After being extended by agreement with the Noram Warrant holders, the Noram Warrants expired unexercised on February 8, 2007 with the closing of the SKH Purchase.
Escrowed Shares
Common Shares issued pursuant to the RTO and issued pursuant to the SKH Purchase, and all Common Shares and Options of our principal security holders are subject to a Tier 2 Value Escrow pursuant to the rules of the TSXV (the “Escrow”). Pursuant to the Escrow, the first release of the securities subject to Escrow (the “Escrow Securities”) is on the date of the TSXV bulletin confirming final acceptance of the SKH Purchase. The remainder of the Escrow Securities shall be released 15% at a time, at six-month intervals over a36-month period. At December 31, 2006 1,569,558 pre-consolidation common shares were subject to Escrow. Following the SKH Purchase, at April 30, 2007, 67,995,668 pre-consolidation common shares were subject to Escrow. The numbers of shares set forth in the paragraph are not adjusted for the 1:5 reverse consolidation effected on September 26, 2007.
As of the date of this prospectus, 9,996,873 post-consolidation Common Shares are subject to escrow.
Related Party Transactions
The following summarizes related party transactions since January 1, 2006:
As at December 31, 2005, the loan receivable comprised CDN$367,034 of advances to Mark G. Avery, Chief Executive Officer and a director. A promissory note, secured by a pledge of Common Shares, was signed for the indebtedness, which specified interest at bank prime and full repayment by December 31, 2005. During 2006, CDN$19,310 (2005 — CDN$4,889) of interest was charged on this loan, which is included in interest income. A new promissory note in the amount of CDN$397,087, secured by a pledge of Common Shares, was signed on March 31, 2006 for the indebtedness outstanding at that time, which specified interest at bank prime and full repayment by September 20, 2006. We agreed to extend the repayment terms until December 31, 2006 and during December 2006, the loan was fully repaid.
Mr. William M. Hitchcock, Chairman of the Board of Directors, either directly or through companies controlled by him, participated in and acted as a broker for a financing that was completed on October 2, 2006 and also participated in and acted as a broker for three financings completed on February 8, 2007 and, either directly or through companies controlled by him, earned commissions, fees and broker
37
Table of Contents
warrants on funds raised by him, either directly or through companies controlled by him. A summary of these transactions follows:
| Number of | ||||||||||||||||||
| Shares | ||||||||||||||||||
| acquired/ | Common Share | Commissions/ | ||||||||||||||||
| amount of | warrants | Fees/ | Broker | |||||||||||||||
Date | Type of share/nature of transaction | facility | acquired | Dividends | warrants | |||||||||||||
| October 2, 2006 | Common Share unit offering | 279,955 | — | $ | 45,000 | (1) | — | |||||||||||
| February 8, 2007 | Common Share unit offering | 370,370 | 309,946 | (4) | $ | 339,105 | (1) | 623,806 | (1)(4) | |||||||||
| February 8, 2007 | First Preferred Shares, Series 2 unit offering | 2,166,666 | 1,148,333 | (5) | $ | 195,000 | (1) | 320,000 | (1)(5) | |||||||||
| February 8, 2007 | Convertible debt facility | $ | 12,800,000 | — | $ | 700,000 | (2) | — | ||||||||||
| February 8, 2007 | Acquisition success fee | 117,647 | (3) | — | — | — | ||||||||||||
| February 26. 2007 | Redemption of First Preferred Shares, Series 2 | (500,000 | ) | — | — | — | ||||||||||||
| May 14, 2007 | Quarterly Dividend on First Preferred Shares, Series 2 | — | — | $ | 103,452 | — | ||||||||||||
| July 8, 2007 | Redemption of First Preferred Shares, Series 2 | (1,666,666 | ) | — | — | — | ||||||||||||
| July 9, 2007 | Final Dividend on First Preferred Shares, Series 2 | — | — | $ | 66,847 | — | ||||||||||||
| (1) | Paid/issued to Pembroke Financial Partners, LLC. | |
| (2) | Paid to Pembroke Capital, LLC. | |
| (3) | Mr. Hitchcock earned a fee in connection with the Acquisition in the amount of $300,000, payable in 117,647 Common Shares of the Corporation. | |
| (4) | Exercisable at CDN$3.25 per Common Share until February 8, 2009. | |
| (5) | Exercisable at CDN$3.75 per Common Share until February 8, 2009. |
All related party transactions were in the normal course of operations and have been measured at exchange amounts established and agreed to by the related parties and which are similar to those that we would expect to have negotiated with third parties in similar circumstances.
Contractual Obligations
We had the following future contractual obligations as of the end of our latest fiscal year:
| Payments due by period | ||||||||||||||||||||||||
| Less than | More than | |||||||||||||||||||||||
Contractual Obligations | Total | 1 year | 1-3 Years | 3-5 years | 5 years | |||||||||||||||||||
| Long-Term Debt Obligations | $ | — | $ | — | $ | — | $ | — | $ | — | ||||||||||||||
| Lease Maintenance | 1,122,000 | 1,122,000 | — | — | — | |||||||||||||||||||
| Capital Lease Obligations | — | — | — | — | — | |||||||||||||||||||
| Operating Lease Obligations on | ||||||||||||||||||||||||
| Office Space | 791,362 | 198,213 | 350,406 | 242,743 | — | |||||||||||||||||||
| Purchase Obligations | — | — | — | — | — | |||||||||||||||||||
| Other Long-Term Liabilities(1) | 180,726 | 180,726 | — | — | — | |||||||||||||||||||
| Total | $ | 2,094,088 | $ | 378,939 | $ | 350,470 | $ | 242,743 | $ | — | ||||||||||||||
| (1) | Reflects asset retirement obligations |
38
Table of Contents
Quantitative and Qualitative Disclosure about Market Risk
The primary objective of the following information is to provide forward-looking quantitative and qualitative information about our potential exposure to market risks. The term “market risk” refers to the risk of loss arising from adverse changes in natural gas and crude oil prices and interest rates. The disclosures are not meant to be precise indicators of expected future losses, but rather indicators of reasonably possible losses. This forward-looking information provides indicators of how we view and manage our ongoing market risk exposures.
Commodity Price Risk
Our major market risk exposure is in the pricing applicable to our natural gas and crude oil production. Realized pricing is primarily driven by the spot market prices applicable to our natural gas production and the prevailing price for crude oil. Pricing for natural gas production has been volatile and unpredictable for several years and we expect this volatility to continue in the future. The prices we receive for production depend on many factors, most of which are out of our control.
We have not entered into hedging arrangements with respect to any of our production and do not currently intend to do so. If, in the future, we determine that it is advisable to do so, such hedging activities will be intended to hold natural gas prices at targeted levels and to manage our exposure to natural gas price fluctuations. We do not, and do not intend to, hold or issue derivative instruments for speculative trading purposes.
Our current natural gas production in Australia is priced based on the local spot market price in Queensland, which is currently lower than the price we would expect to receive for the same amount of production in the United States, and we receive funds in Australian dollars.
Foreign Currency Exposure
We are engaged in business in the United States, Canada, and Australia. We may incur losses or suffer a reduction in revenues from time to time as the value of the currencies of these countries fluctuates in relation to each other. We do not currently hedge our foreign currency fluctuation risk and have no current intent to engage in such transactions, although we may do so in the future. Although we do not engage in a derivative hedge program, we attempt to match the currency in which we obtain financing with the currency of expected expenditures. To the extent that we are unable to do so, we may incur losses due to the relative price fluctuations among currencies.
Currently, we maintain most of our funds in United States dollar accounts and expect most of our expenses to be denominated in United States dollars. Our exposure to increases in value in the Australian dollar is offset to a certain extent by the fact that we have some natural gas production for which we are paid in Australian dollars. Furthermore, as a result of our reduced scope of operations and our intent to divest ourselves of our Australian assets, our exposure to Australian currency risk is not significant. We are exposed to increases in the value in the Canadian dollar to the limited extent of our operations in that country.
The conversion price of the Debenture is set in Canadian dollars. The Debenture contains a provision that, under certain circumstances, will result in the use of a fixed exchange rate to calculate the conversion price. This fixed exchange rate may be less favorable to us than the market exchange rate existing on the date of conversion.
Interest Rate Risk
As of the date of this prospectus, we have an outstanding Debenture in the amount of $26,719,219 which bears interest at the fixed rate of 9% and is due on July 3, 2012. To the extent that interest rates fall in the future, we may be unable to prepay the Debenture and replace it with debt securities bearing a lower interest rate. In the event that interest rates rise and we need to issue additional debt securities, we may have to pay a materially higher rate of interest to do so. We do not currently have any debt that has a floating or variable interest rate.
39
Table of Contents
We do not currently engage in interest rate swap agreements and do not intend to do so in the future.
Caution Regarding Estimates
The reader is further cautioned that the preparation of financial statements in accordance with GAAP requires management to make certain judgments that affect the reported amounts of assets, liabilities, revenues and expenses. Estimating reserves is also critical to several accounting estimates and requires judgments and decisions based upon available geological, geophysical, engineering and economic data. These estimates may change, having either a negative or positive effect on net earnings as further information becomes available, and as the economic environment changes.
Caution Regarding Forward-Looking Statements
This MD&A includes forward looking or outlook information within the meaning of applicable securities laws. Forward-looking statements may involve, but are not limited to, comments with respect to our objectives for 2008 and beyond, our drilling plans, our expectations for our financial condition and the results of, or outlook for, our operations. All statements other than statements of historical fact contained herein are forward-looking statements, including, without limitation, statements regarding our future capital projects and commitments, the cost thereof, our financial position, or our business strategy and objectives.
We believe the expectations reflected in such forward looking statements to be reasonable. However no assurance can be given that such expectations will prove to be correct. By their nature, forward-looking statements require us to make assumptions and are subject to inherent risks and uncertainties including those discussed herein. There is significant risk that predictions and other forward-looking statements will not prove to be accurate. We caution readers to not place undue reliance on our forward-looking statements as a number of factors could cause actual future results, plans, conditions, actions or events to differ materially from the plans, targets, expectations, estimates or intentions expressed in the forward-looking statements. We do not undertake to update any forward-looking statements except as required by law.
The information contained herein, including the information set forth under “Risk Factors” herein, identifies factors that could affect our operating results and performance. We caution that the list of risk factors identified is not exhaustive and that when relying on forward-looking statements to make decisions with respect to our common shares, investors and others should carefully consider these factors, as well as other uncertainties and potential events, and the inherent uncertainty of forward-looking statements. The forward-looking statements contained herein are made as of the date hereof and are expressly qualified in their entirety by this cautionary statement.
Assumptions are made in setting our business plan. Key assumptions include that the oil and natural gas market remains stable, that we and our joint venture partners can secure access to drilling rigs and other service providers as required and that we will have adequate financing to carry out our business plans.
Disclosure Controls and Procedures
We have designed disclosure controls and procedures to ensure that information required to be disclosed by us is accumulated and communicated to our management as appropriate to allow timely decisions regarding required disclosure. Our Chief Executive Officer (“CEO”) and Chief Financial Officer (“CFO”) have concluded, based on their evaluation as of December 31, 2007, that our disclosure controls and procedures are effective to provide reasonable assurance that material information related to our company is made known to them by employees or third party consultants working for our company. It should be noted that while our CEO and CFO believe that our disclosure controls and procedures will provide a reasonable level of assurance and that they are effective, they do not expect that the disclosure controls and procedures will prevent all errors and fraud. A control system, no matter how well conceived or operated, can provide only reasonable, and not absolute assurance that the objectives of the control system are met.
40
Table of Contents
Prior to becoming a registrant with the Securities and Exchange Commission, we operated under the requirements of Multi-Lateral Instrument52-109 which requires management to perform an evaluation of the design of, and, as of December 31, 2007, the operating effectiveness of, our disclosure controls and procedures. Currently, our CEO and CFO are required to evaluate the design and operating effectiveness of these controls underRule 13a-15 or15d-15 of the Securities Exchange Act of 1934. The major difference between the two standards is that under Multi-Lateral Instrument52-109, the evaluation could be performed annually, while underRule 13a-15 or15d-15 the evaluation must be performed quarterly.
Based on our internal processes, the small size of our company and the close working relationships amongst the senior executives, directors and legal counsel, we conclude that our disclosure controls and procedures are effective. We believe that the deficiencies that were noted with respect to segregation of duties and user access controls are in connection with financial reporting and do not have any adverse impact on our disclosure controls. As of January 1, 2008, we have adopted a process of disclosure controls and procedures and internal controls over financial reporting that comply withRules 13a-15 and15d-15 of the Securities Exchange Act of 1934.
Internal Control Over Financial Reporting
The CEO and CFO are responsible for designing internal controls over financial reporting or causing them to be designed under their supervision in order to provide reasonable assurance regarding the reliability of financial reporting and the preparation of financial statements for external purposes in accordance with U.S. GAAP. The design of our internal control over financial reporting was assessed as of the date of this Management’s Discussion and Analysis. Management will test the effectiveness of our internal controls once we are required to comply with Securities and Exchange Commission standards.
The weakness in our internal controls over financial reporting, discussed below, results in a more than remote likelihood that a material misstatement would not be prevented or detected. Management and the board of directors work to mitigate the risk of a material misstatement in financial reporting, however, there can be no assurance that this risk can be reduced to less than a remote likelihood of a material misstatement.
We have only 18 employees or consultants. Control deficiencies have been identified within our accounting and financial function and our financial information systems over segregation of duties and user access respectively. Specifically, certain duties are not properly segregated due to the small number of individuals employed in this area. However, management has concluded that considering the employees involved and the control procedures in place, including management and Audit Committee oversight, risks associated with such lack of segregation are not significant enough to justify the expense associated with adding employees to clearly segregate duties. Management is aware that in-house expertise to deal with complex taxation, accounting and reporting issues may not be sufficient. We utilize outside assistance and advice on new accounting pronouncements and complex accounting and reporting issues, which is common with companies of a similar size. Management is of the opinion that none of these control deficiencies has resulted in a misstatement to the financial statements. However, these deficiencies may be considered a material weakness resulting in a more-than remote likelihood that a material misstatement of our annual or interim financial statements would not be prevented or detected. As we grow, we plan to expand the number of individuals involved in the accounting function. At the present time, the CEO, CFO, and Vice President, Compliance oversee all material transactions and related accounting records. In addition, the Audit Committee reviews on a quarterly basis the financial statements and our key risks and queries management about significant transactions.
41
Table of Contents
BUSINESS
General Development of the Business
We were incorporated pursuant to theBusiness Corporation Act(Alberta) on July 10, 1997, under the name Northlinks Limited (“Northlinks”) and were originally organized as a junior capital pool corporation. In January 1998, Northlinks closed its initial public offering and was listed on the Alberta Stock Exchange, which is now the TSXV. At the end of 2002, the directors of Northlinks determined that there were limited growth opportunities for its business and other strategic alternatives should be pursued for Northlinks. This included a change of business, restructuring and the sale of existing assets.
In early January 2004, ARL, an Australian public, but unlisted, corporation, implemented the decision to seek a public listing. The objective was to provide greater access to capital for aggressive development of its gas and oil prospects and leads, to establish a platform for corporate growth, and to offer liquidity to all its shareholders.
Effective July 31, 2004, by way of a RTO, Ausam, formerly Northlinks, acquired all of the issued and outstanding shares of ARL. As consideration, we issued 20,056,837 common shares on the basis of one common share for every five ARL shares. In early September 2004, we commenced trading on the TSXV under the symbol “AUZ”. In addition to the listing, we completed three financings during 2004, raising gross proceeds of approximately $12,900,000. All of the financings were done at $3.75 per Common Share or unit. Funds were raised in these offerings in Canada, the United States, the United Kingdom and Europe. We have two wholly owned subsidiaries, ARL, incorporated in Australia, and Noram, incorporated in Texas.
We are engaged in the business of oil and gas exploration. Through our Australian subsidiary ARL, we have been applying proven North American drilling and completion techniques that have not traditionally been used in the Australian energy industry to targets in Queensland, Victoria and Western Australia. Our operations in the United States are carried out by Noram. Our growth strategy includes the organic development of our current holdings and selective corporate transactions.
Our head office is located at #1430, 1122 — 4th Street S.W., Calgary, Alberta, T2R 1M1 and our registered office is 4500 Bankers Hall East, 855 2nd Street S.W., Calgary, Alberta, T2P 4K7.
The SKH Purchase
On September 22, 2006 we entered into an agreement with SKH relating to the acquisition of the Leases and the SKH Prospects for an aggregate purchase price of approximately $35 million (the “Purchase Price”) with the Purchase Price being comprised of cash consideration of up to $15 million and 12,683,429 Common Shares of valued at approximately $20 million (based on a negotiated price of CDN$1.65 per share). A condition of the closing of the SKH Purchase was that we were required to raise a minimum of $45 million to finance the cash portion of the consideration payable in respect of the SKH Purchase and in part to fund the proposed drilling and development program associated with the Leases and SKH Prospects.
In order to facilitate our raising the funds necessary to close the SKH Purchase, SKH assigned Noram a 20% interest in the leases that contain the Iola prospect.
The SKH Purchase and a private placement closed on February 8, 2007. We issued 6,185,368 units (“SKH Purchase Units”) at a price of $2.70 (CDN$3.20) per SKH Purchase Unit, each SKH Purchase Unit consisting of one Common Share and one half of one Common Share purchase warrant (the “Unit Warrants”), each whole Unit Warrant entitling the holder thereof to purchase one Common Share at a price of CDN$3.25 for a period of 24 months from the date of issuance, for gross proceeds of $16,700,494; 3,993,333 series 2 units (“Series 2 Units”) at a price of $3.00 per Series 2 Unit, each such Series 2 Unit consisting of one first preferred share, series 2 (“First Preferred Shares, Series 2”) and one half of one Common Share purchase warrant (the “Series 2 Warrants”), each whole Series 2 Warrant entitling the holder thereof to purchase one Common Share at a price of CDN$3.75 for a period of 24 months from the date of issuance, for gross proceeds of $11,978,000. The First Preferred Shares, Series 2 had an 8% coupon, a term of one year and, upon expiry of such term, would convert to common shares on a one to one basis. Holders of the First
42
Table of Contents
Preferred Shares, Series 2 were entitled to one vote for each share held at all annual and special meetings of our shareholders. In total, 5,089,351 warrants to purchase common shares were issued. Aggregate gross proceeds from the offering of SKH Purchase Units and Series 2 Units were approximately $28,678,000.
We also secured convertible debt facilities allowing us to access up to $17,800,000 in financing with a 10% coupon and a conversion price of CDN$3.50, resulting in total financing of approximately $46 million (CDN$51 million at then-current exchange rates). Approximately $15 million was used to pay the cash portion of the acquisition price. Upon closing the Huff Transaction, we redeemed all of the First Preferred Shares, Series 2, and the secured convertible debt facility expired unused on June 8, 2007.
We also entered into a Participation and Right of First Refusal Agreement with SKH, which has been amended and superseded by the Participation Agreement as of January 25, 2008. The Participation Agreement provides us with a right of first offer on any sale of any of SKH’s back-in interests to outside parties and a right of first offer on any sale of new prospects or leases that SKH generates in the 36 months following closing of the SKH Purchase.
Prior to drilling a well upon one of the SKH Prospects, we will create a “Test Well Unit.” Upon the spudding of a Test Well, the Participation Agreement requires us to assign a 25% interest in the leases that comprise the prospect which are outside of the Test Well Unit. In addition, once the Test Well has achieved “Payout,” we must assign a 25% interest in the Test Well and the Test Well Unit to SKH.
At the end of 36 months from the closing of the SKH Purchase (i.e., February 7, 2010), the Participation Agreement requires us to assign the SKH Prospects constituting all UnTested Prospects to SKH together with the assets that relate to such prospects. An “UnTested Prospect” is a prospect on which we have not commenced drilling a well to a depth adequate to test the formation to between us and SKH. Thereafter, SKH may not sell, transfer, assign, exchange, voluntarily surrender or otherwise dispose of such UnTested Prospects (a “Subject Transfer”) to any person unless such sale, transfer, assignment, exchange, voluntary surrender or other disposition is a Permitted Transferee (as defined in the Participation Agreement). In the event that SKH plans to pursue a Subject Transfer, it shall provide a Transfer Notice (as defined in the Participation Agreement) to us of such intention prior to accepting any Subject Transfer proposal. We shall have a period of 15 days after receipt of a Transfer Notice from SKH to exercise an option to purchase such assets on the same terms and conditions contained in the Transfer Notice or to make a counteroffer (the “Counteroffer”). If SKH accepts the Counteroffer, we and SKH will have 30 days in which to negotiate in good faith and execute a mutually acceptable purchase agreement. If SKH rejects the Counteroffer, SKH shall be entitled for a period of one year, to sell or otherwise dispose of the Subject Transfer to a third party. The terms and conditions of such transfer to a third party must be equal or more favorable to SKH, as determined by SKH.
To date, we have tested two of the SKH Prospects. We expect to test an additional three of the SKH Prospects during 2008. We also may determine that certain prospects have too high a risk relative to the potential reward to justify the expense of testing it through the drilling of a well. We will sell those prospects (which will remain subject to the back-in provisions of the Participation Agreement) to third parties or re-assign them to SKH. Other than our rights under the Participation Agreement with respect to subsequent transfers by SKH, such re-assignment would result in the loss of our rights to, and all of our interest in, the subject prospects.
Strategy
We are a junior oil and natural gas corporation engaged in the exploration for, and the development and production of, natural gas and crude oil as well as corporate acquisitions in the oil and gas industry in the United States and Australia. ARL was formed in 1999 to acquire and develop previously discovered, but undeveloped gas resources in Australia. Up to June 2004, prior to the RTO, ARL had invested approximately AU$15,000,000 identifying, assessing, and acquiring gas resources and prospects that are located onshore Australia and near under-utilized transportation infrastructure with access to ready markets.
Despite having participated in 15 wells in four different basins in Australia over the past seven years, our results to date have been disappointing, with only one well currently in production. Recent seismic work has
43
Table of Contents
developed some additional oil prospects, the exploration of which will require either additional capital or locating one or more farm-in partners. We have hired an investment bank in Australia, Origin Capital Group, to explore our options with regard to our assets in Australia.
The completion of the SKH Purchase represents a significant change in our strategy. We now have a diverse suite of prospects representing a number of different play types and risk profiles along the Gulf Coast region of the United States, instead of drilling prospects in Australia through the application of advanced drilling and completion techniques. We intend to develop the United States opportunities by initially drilling the lower-risk prospects in order to generate cash flow either from operations or from the sale of developed prospects to third parties. At the same time, we will market the larger higher-risk prospects to parties with localized expertise and accept a reduced participation interest per prospect in order to accelerate the drilling and evaluation of the prospect portfolio on a risk-adjusted basis.
Further, given that we now own 21 prospects in the United States, 15 of which we own approximately 100% interest in, we are in a position to trade percentage interests in our prospects for interests in other prospects, resulting in more prospects and reduced risk. We intend to operate some, but not all, of the SKH Prospects, enabling us to recover a portion of our overhead and administrative costs. Due to our ongoing relationship with SKH as described below under “Business — The SKH Purchase”, we will have access to additional prospects that we may elect to acquire under commercial industry terms. In addition, we expect to evaluate prospects brought to us from time to time by third parties, including our shareholders, and acquire interests in those we deem attractive.
Additional funds would be required if we were to drill our prospect portfolio at our current participation interest as outlined above. We do not intend or expect to maintain 100% ownership in any of our United States properties and we are actively seeking industry partners. Actual drilling results as well as the evaluation of and participation in other drilling opportunities will change the scope and timing of our plans. We intend to closely manage the timing and participation interest of our drilling program in order to optimize the use of existing funds. Given the scope of the proposed drilling program and the opportunities owned by us, we expect that additional funds will be required.
In order to fund the initial development of our prospects, we entered into the Huff Transaction, which provided us with a source of additional financing. This financing, by itself, will not be sufficient to fund our entire proposed drilling program. The funds we have on hand together with funds expected to be received from farmout arrangements are considered by management to be sufficient to finance the majority of the short term drilling and exploration program as well as operating expenses.
In the event our drilling program results in commercial quantities of natural gas and oil, we will need to obtain additional funds for processing facilities and infrastructure. We cannot be certain we will be able to raise additional funds through equity or debt offerings on terms that are satisfactory to our shareholders, the Debenture holder or management.
As at May 9, 2008, Ausam and its subsidiaries employed 18 people in Calgary, Alberta, Canada; Brisbane, Queensland, Australia; and Houston, Texas.
Recent Developments
The following is a summary of significant events in the development of our business over the past three years:
2004
In addition to our restructuring and refinancing completed in August 2004, during the first quarter of 2004, prior to the RTO, ARL drilled two exploratory/commitment wells, both located in the Surat/Bowen Basin in Queensland, Australia. The Palmerston-1 well was drilled conventionally in ATP 682P, encountered an approximately10-meter section of over-pressured gas, and was cased and suspended pending further evaluation. The Weribone-2 well in ATP 470P was drilled conventionally to above the objective, drilled
44
Table of Contents
underbalanced vertically through the objective, tested at approximately 300 Mcf/d and was cased and suspended pending further evaluation.
2005
During 2005, we drilled three wells; theNamarah-7 andParknook-7 gas development wells in PL 71, and theUngabilla-1 exploratory/commitment well in ATP 754P, all operated by Origin and located in the Surat Basin of Queensland, Australia. None were commercial.
In July 2005, we completed an CDN$8,000,000 private placement at CDN$4.50 per unit, where each unit comprised one Common Share and one-half Common Share purchase warrant. Monies raised were used to finance our development and exploration program.
During the fourth quarter, a rigorous impairment review was conducted on all of our properties following the drilling results in ATP 682P and PL 71 as well as the results of the attempted farm-out of EP 23, EP 321, and EP 407 during 2005. The result of this review was an asset write down of $5,508,975 to reflect impairment in the carrying value of our oil and gas assets. Areas where we have relinquished or intend to relinquish exploration permits have been fully written off. The asset write down principally applied to PL71 and ATP682P in the Surat /Bowen Basin in Queensland and the EP 23, EP 321, and EP 407 permits in Western Australia.
2006
Corporate
During 2006, we entered into three farmin agreements. The first is a farmin agreement with Rawson Resources Limited (“Rawson”) in ATP 552P in the Surat/Bowen Basin, Queensland. ATP 552P is a 42,600 acre (67 section) permit along trend with the Fairymount and Alton oil fields. Under the agreement, we and Rawson each agreed to fund 50% of the Bellbird West-1 well in return for each earning a 25% interest in the permit. On November 26, 2006, the well reached TD without encountering commercial hydrocarbons and was plugged and abandoned as a dry hole.
The second farmin agreement was the Mosaic Farmin (PL 119, PPL 58, and ATP 471P) where we entered into an agreement with Mosaic Oil NL (“Mosaic”) and Santos Limited (“Santos”) under which we can earn up to a 35% interest in PL 119 (Downlands and Downlands East gas fields), the Bainbilla Block of ATP 471P (Brynog oil prospect) and PPL 58 (Downlands pipeline license), all located in southeast Queensland’s Surat / Bowen Basin. Our maximum 35% interest was to be earned through spending up to approximately CDN$5,500,000 in new seismic acquisition and drilling of up to four wells in two stages. PL 119 is situated just north of the Surat Township, Queensland and contains the Downlands-2 and Downlands East-1 gas producing wells and the Downlands-3 oil discovery. The Bainbilla Block of ATP 471P surrounds PL 119 on three sides and contains the Spring Grove-2 oil discovery and the Brynog oil prospect. PPL 58 includes the spur line connecting the Downlands gas fields to the market via the main north-south pipeline to the Wallumbilla gas plant.
The third farmin agreement was with Rawson to participate in Rawson’s farmin of the western part of PEL 107 in South Australia. We paid 20% of the cost of the Appadare-1 well in order to earn a 10% interest in the western half of the permit.
During the second quarter of 2006, we executed a drilling contract with Australian Drilling Services (“ADS”) to relocate the ADS Rig 6 from Western Australia to the eastern states by coordinating the proposed drilling programmes of a group of peer companies, including Mosaic, that are operating in Queensland, New South Wales and South Australia.
On September 22, 2006, we announced that we had signed the Asset Purchase Agreement. Under the terms of the Asset Purchase Agreement, we acquired rights to certain oil and gas properties in Texas, Louisiana, Mississippi, Alabama and Arkansas from SKH Management L.P., SKH Management II L.P., SKH Management III LLC, SKH Energy Fund, L.P. and Antares Exploration Fund, L.P. (collectively, “SKH”). The
45
Table of Contents
transaction closed in February 2007. For further details of the Asset Purchase Agreement, see “Management’s Discussion and Analysis of Financial Condition and Results of Operations — The SKH Purchase and Drilling Program.”
On October 2, 2006, we completed a private placement of 875,000 Common Shares at a price of CDN$2.00 per Common Share for gross proceeds of CDN$1,750,000.
Drilling and Seismic
During the first half of 2006, a new240-kilometer 2D seismic acquisition program in ATP 754P was completed, the data processed and the initial interpretations completed. The seismic data was acquired over seven current leads as well as extensions of pre-existing seismic lines to improve understanding of the permit’s geology. Interpretation and evaluation of this new 2D data has eliminated two former leads, better defined five leads, and identified three new leads in the western portion of ATP 754P.
During the first quarter of 2006, the Kyeen Creek-1 well was drilled (Ausam 35.0%, Santos Ltd. 6.5%, Origin 58.5% and operator) in ATP 470P, which is a 68,500 acre (107 section) permit located in the Surat/Bowen Basin. The well was a commitment/exploration well and consequently was drilled conventionally. The Kyeen Creek-1 well confirmed structural closure as well as gas in the Triassic Basal Rewan reservoir, which produced on test, and oil shows in the deeper Timbury Hills formation. However, the Permian reservoirs were deemed to be non-commercial at the Kyeen Creek-1 well location. The well was logged and sidewall cores were taken from the Triassic Basal Rewan, Permian Upper and Lower Tinowon, and Timbury Hills formations for further evaluation. Kyeen Creek-1 was plugged back to the casing shoe allowing access to the surface casing for a future underbalanced re-drill of the gas charged Basal Rewan.
In September, we and our joint venture partners drilled the Downlands-4 well. Interpretation of wireline logs and associated hydrocarbon shows whilst drilling indicated approximately 4 meters of net gas pay within the interval from 1,836 to 1,841 meters (6,024 to 6,040 feet) in the primary target Permian Tinowon Sandstone. The Downlands-4 well was completed and entered production in May 2007. Downlands-4 was the first well of our PL 119 and ATP 471P Bainbilla Block Farmin Stage 1 program. We funded the first AU$1,500,000 of the Downlands-4 well costs and then contribute pro-rata for costs above AU$1,500,000.
2007 and 2008
United States
Corporate
On February 9, 2007, we simultaneously completed the previously discussed acquisition of leasehold rights to certain oil and gas properties in Texas, Louisiana, Mississippi, Alabama and Arkansas from SKH. This transaction is described above under “The SKH Purchase.”
In connection with the SKH Purchase, we closed several private placements consisting of 6,185,369 Common Shares, 3,993,333 First Preferred Shares, Series 2 and 5,089,351 warrants to purchase Common Shares, for aggregate gross proceeds of $28,680,494. We also secured convertible debt facilities totaling up to $17.5 million. No funds were drawn under these facilities and they were terminated on June 8, 2007.
46
Table of Contents
The following is a brief description of the SKH Prospects plus two subsequently acquired prospects, which in total comprise 56,845 gross acres (44,836 net acres) as at the date of this prospectus. It should be noted that we do not currently intend to drill either the Saudi or Peach Creek prospects, and have taken write-downs of 100% of their value. The three Duval County prospects (Hoffman Creek, Rosita, and Z-Sand) have been written down to our current estimate of their market value. The T-Patch 1 prospect has been drilled and the well was plugged and abandoned as non-commercial.
| County/ | Primary Objective | Est. Depth | ||||||||||||
Prospects | State | Parish | Net Acres | Formation | (feet) | Expected Product | ||||||||
| Iola | Texas | Grimes | 12,751 | Bossier Sand | 22,000 | Gas | ||||||||
| Nolte Marsh | Texas | Liberty | 120 | Yegua/Cook Mt. | 14,000 | Gas & liquids | ||||||||
| Wethorford | Texas | Liberty | 209 | Yegua/Cook Mt. | 14,000 | Gas & liquids | ||||||||
| Wiseman | Texas | Liberty | 361 | Yegua/Cook Mt. | 14,000 | Gas & liquids | ||||||||
| T-Patch 1,2,3, 4 | Texas | Starr | 6,236 | Reklaw, QC Channel | 9,400-10,600 | Gas | ||||||||
| Maben | Mississippi | Oktibbeha | 549 | Upper Knox | 15,500 | Gas | ||||||||
| Bideman Gully | Louisiana | Acadia | 2,565 | Upper Wilcox | 19,000 | Gas | ||||||||
| N. Constitution | Texas | Jefferson | 787 | Yegua | 16,000 | Gas & liquids | ||||||||
| Z Sand | Texas | Duval | 210 | Wilcox “Z” Sand | 17,000 | Gas | ||||||||
| Rosita | Texas | Duval | 456 | Wilcox “S” Sand | 15,000 | Gas | ||||||||
| Saudi | Mississippi | Perry | 4,815 | Norphlet | 23,000 | Gas | ||||||||
| Plantation | Mississippi | Lowndes | 5,388 | Ordovician | 13,000 | Gas | ||||||||
| Sugar Grove | Arkansas | Logan | 4,665 | Arbuckle | 17,000 | Gas | ||||||||
| Hoffman Creek | Texas | Duval | 975 | Wilcox | 18,000 | Gas | ||||||||
| S. Womack Hill | Alabama | Clarke | 1,464 | Smackover | 12,500 | Gas | ||||||||
| Oak Grove | Louisiana | Bienville | 3,098 | Bossier Sand | 17,000 | Gas | ||||||||
| Peach Creek | Texas | Wharton | 80 | Jackson Sand | 8,000 | Gas | ||||||||
| Quatre | Louisiana | Calcasieu | 108 | Hackberry Sands | 10,200 | Gas | ||||||||
Total | 44,836 | |||||||||||||
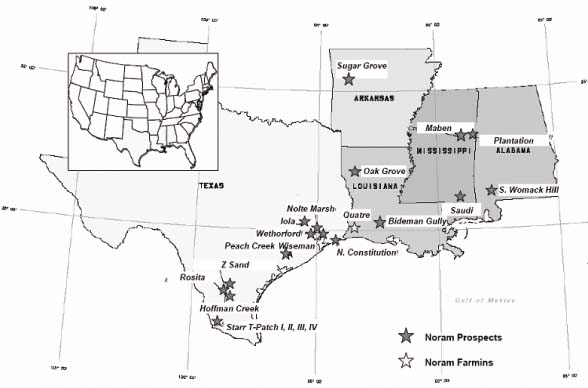
The map above gives the approximate locations of our Prospects
47
Table of Contents
Drilling
TheT-Patch I well was spudded on June 10, 2007 and targeted the Reklaw and Queen City Channel formations at an anticipated total depth of 10,000 feet. It reached a total depth of 9,800 feet (approximately 3,000 metres) on July 2, 2007. Although hydrocarbons were present, logging and sidewall cores indicated that the well may not be commercial due to reservoir quality, and the well was plugged and abandoned. The well cost approximately $2.4 million. At this time, we are negotiating with third parties who have expressed an interest in re-entering and completing the well.
The RDH Farms #1 well, located on our Wethorford prospect, was spudded on June 28, 2007 and is operated by Ballard Exploration Inc. The well targeted the Yegua/Cook Mountain formations at an anticipated total depth of 14,000 feet. The well was drilled to a total depth of 13,826 feet and encountered two prospective zones, the 1st and 3rd sands of the Cook Mountain formation. Open-hole well log analysis indicates both zones contain gas. The well has undergone extended production testing from only the lower zone, the 3rd sand, which was fracced on January 8, 2008. The first sale of gas was on October 24, 2007. We hold a 45% working interest in the RDH Farms #1 through Noram and have expended approximately $2.2 million to date.
The Fisher Lindsey #1 well, located on the Quatre prospect, was spudded on November 12, 2007 and is operated by Browning Oil Company, Inc. The well was drilled to a total depth of 11,150 feet and intersected the Hackberry Sands formations at a measured depth of 10,762 feet. We held a 16.8% working interest before casing point and have a 12.6% interest after casing point by way of a farmin agreement between Noram and J.L. Allen & Company. The well has cost approximately $4.5 million to date of which Noram has contributed $799,163.
During 2008, we expect to spud wells in three additional SKH Prospects and farm into one additional prospect from a third party. The total budget for our expected share of the proposed drilling program is $6.6 million. In addition, we expect to acquire additional seismic data over three other SKH Prospects. We anticipate this seismic program will be funded by third parties in exchange for the right to participate in the drilling of these prospects. We are in negotiations to acquire interests in additional leases in the SKH Prospects and in other prospects presented by independent third parties. The acquisition of additional leases will be paid out of current working capital or through the issuance of additional equity or debt. We are also negotiating with potential partners regarding participation in the SKH Prospects in order to advance the drilling program in the United States and risk adjust our participation interest. If we are unable to secure such partners, portions of the program may be deferred.
Australia
Overview of Properties
ARL holds the following interests in exploration permits and production licenses in the Australian states of Queensland, Victoria, and Western Australia:
Permit | State | Gross Acres | Net Acres | |||||||
| ATP 470P | Queensland | 68,500 | 30,825 | |||||||
| ATP 552P | Queensland | 30,727 | 7,682 | |||||||
| ATP 754P | Queensland | 681,918 | 340,959 | |||||||
| PL 119 and ATP 471P (Bainbilla Block) | Queensland | 107,223 | 26,536 | |||||||
| PL 71 | Queensland | 33,104 | 6,621 | |||||||
| PEP 166 | Victoria | 880,555 | 220,139 | |||||||
| EP 321 and EP 407 | Western Australia | 585,637 | 541,714 | |||||||
Drilling
TheAppadare-1 well was drilled in January 2007 and was plugged and abandoned after the target zone was discovered to be water-wet. The total cost of the well was $1.4 million (AU$1.5 million), of which we paid approximately $270,000 (AU$300,000).
48
Table of Contents
The Downlands South-1 well was spudded in PL 119 on March 11, 2007 and drilled to a depth of 1,887 meters (6,191 feet). Although the well intersected the target Tinowon formation 45 meters (148 feet) high to prognosis, a drill stem test showed very little flow and the formation is believed to have very low permeability at this site. The well was plugged and abandoned. The Downlands Sourth-1 well cost approximately $850,000 (AU$1.0 million) and was funded 100% by us in accordance with the terms of the Mosaic farmin agreement. Following negotiation with Mosaic on the status of Stage I of the Mosaic Farmin, Ausam agreed to accept that it has earned 24.748% interest in PL 119 and ATP 471P Bainbilla Block and receive a refund of AU$129,343 in overpayments on the Downlands South-1 well.
TheBrynog-1 exploration well was spudded in ATP 471P Bainbilla Block on March 26, 2007. The well was drilled conventionally to a depth of 2,086 meters (6,844 feet) and then drilled underbalanced to a total depth of 2,153 meters (7,064 feet). The well failed to intersect reservoir-quality sands in the target Tinowon formation and was plugged and abandoned. on April 12, 2007. The Brynog-1 well cost approximately $1.2 million (AU$1.4 million), was funded 100% by us in accordance with the terms of the Mosaic farmin agreement. The Brynog-1 well provided additional data supporting the stratigraphic Formosa Downs prospect located in the northwest portion of ATP 470P where we own 45%.
In PEP 166 in Victoria, Lakes drilled the Hazelwood-1 and Boola Boola-2 wells, both of which were dry holes. These wells were funded by Lakes under a farmout agreement with us that resulted in a reduction of our interest in the permit from 50% to 25%.
Production
The Downlands-4 well and tie-in to the Downlands gas field production facilities in PPL 119 in Queensland was completed in April 2007. Production from the Downlands-4 well commenced in May 2007. Following negotiations with Mosaic, it has been agreed that we have earned a 24.748% pro-rata portion of production from the Downlands gas field. We have elected not to proceed with Stage 2 of the Mosaic Farmin.
Environmental Matters and Regulation
Environmental laws and regulations that could have a material impact on our operations include, but are not limited to, the following:
National Environmental Policy Act. Natural gas and oil exploitation and production activities on federal lands are subject to the National Environmental Policy Act, or NEPA. NEPA requires federal agencies, including the Department of Interior, to evaluate major agency actions having the potential to significantly impact the environment. In the course of such evaluations, an agency will typically prepare an Environmental Assessment to assess the potential direct, indirect and cumulative impacts of a proposed project and, if necessary, will prepare a more detailed Environmental Impact Statement that may be made available for public review and comment. All of our current exploitation and production activities, as well as proposed exploitation and development plans, on federal lands require governmental permits that are subject to the requirements of NEPA. This process has the potential to delay or limit the development of natural gas and oil projects.
Waste Handling. The Resource Conservation and Recovery Act, or RCRA, and comparable state laws, regulate the generation, transportation, treatment, storage, disposal and cleanup of “hazardous wastes” as well as the disposal of non-hazardous wastes. Under the auspices of the U.S. Environmental Protection Agency, or EPA, individual states administer some or all of the provisions of RCRA, sometimes in conjunction with their own, more stringent requirements. While drilling fluids, produced waters, and many other wastes associated with the exploitation, development, and production of crude oil, natural gas, or geothermal energy constitute “solid wastes,” which are regulated under the less stringent non-hazardous waste provisions, there is no assurance that the EPA or individual states will not in the future adopt more stringent and costly requirements for the handling of non-hazardous wastes or categorize some non-hazardous wastes as hazardous. We believe that we are in compliance with the requirements of RCRA and related state and local laws and regulations, and that we hold all necessary permits and other authorizations to the extent that our wells and the associated operations require them.
49
Table of Contents
Although we do not believe the current costs of managing wastes generated by operation of our wells to be significant, any legislative or regulatory reclassification of natural gas and oil exploitation and production wastes could increase our costs to manage and dispose of such wastes.
Hazardous Substances Releases. The Comprehensive Environmental Response, Compensation and Liability Act (CERCLA), also known as “Superfund,” and analogous state laws, impose joint and several liability, without regard to fault or legality of conduct, on persons who are considered to be responsible for the release of a “hazardous substance” into the environment. These persons include the owner or operator of the site where the release occurred and companies that disposed or arranged for the disposal of the hazardous substance at the site. Under CERCLA, such persons may be liable for costs of cleaning up the hazardous substances that have been released into the environment, for damages to natural resources and for the costs of certain health studies. In addition, it is not uncommon for neighboring landowners and other third parties to file claims for personal injury and property damage allegedly caused by the hazardous substances released into the environment. While materials are generated in the course of operation of our wells that may be regulated as hazardous substances, we have not received any pending notifications that we may be potentially responsible for cleanup costs under CERCLA.
We currently own interests in properties that have been used for natural gas and oil exploration in the past. Although we believe that operating and waste disposal practices have been used that were standard in the industry at the time, hazardous substances, wastes, or petroleum hydrocarbons have been released on or under the properties owned or leased by us, or on or under other locations, including off-site locations, where such substances have been taken for disposal. In addition, some of these properties have been operated by third parties or by previous owners or operators whose treatment and disposal of hazardous substances, wastes, or hydrocarbons was not under our control. These properties and the substances disposed or released on them may be subject to CERCLA, RCRA and analogous state laws. Under such laws, we could be required to remove previously disposed substances and wastes, remediate contaminated property, or perform remedial plugging or pit closure operations to prevent future contamination.
Water Discharges. The Federal Water Pollution Control Act, also known as the Clean Water Act and analogous state laws impose restrictions and strict controls on the discharge of pollutants, including produced waters and other natural gas and oil wastes, into waters of the United States. The discharge of pollutants into regulated waters is prohibited, except in accordance with the terms of a permit issued by EPA or the relevant state. The Clean Water Act also prohibits the discharge of dredge and fill material in regulated waters, including wetlands, unless authorized by a permit issued by the U.S. Army Corps of Engineers. Federal and state regulatory agencies can impose administrative, civil and criminal penalties for non-compliance with discharge permits or other requirements of the Clean Water Act and analogous state laws and regulations. We believe we are in compliance with the requirements of the Clean Water Act.
Air Emissions. The Clean Air Act, and associated state laws and regulations, regulate emissions of various air pollutants through the issuance of permits and the imposition of other requirements. In addition, EPA has developed, and continues to develop, stringent regulations governing emissions of toxic air pollutants at specified sources. In order to build new production facilities, we may be required to obtain permits before work can begin. These regulations may increase the costs of compliance for some facilities, and federal and state regulatory agencies can impose administrative, civil and criminal penalties for non-compliance. We believe that we are in compliance with the requirements of the Clean Air Act.
OSHA. We are subject to the requirements of the federal Occupational Safety and Health Act (OSHA) and comparable state statutes. The OSHA hazard communication standard, EPA community right-to-know regulations under the Title III of CERCLA and similar state statutes require that we organizeand/or disclose information about hazardous materials used or produced in our operations. We believe that we are in compliance with these applicable requirements and with other OSHA and comparable requirements.
50
Table of Contents
Other Laws and Regulation. The Kyoto Protocol to the United Nations Framework Convention on Climate Change became effective in February 2005. Under the Protocol, participating nations are required to implement programs to reduce emissions of certain gases, generally referred to as greenhouse gases, that are suspected of contributing to global warming. Methane, a primary component of natural gas, and carbon dioxide, a byproduct of the burning of oil and natural gas, are examples of greenhouse gases regulated by the Kyoto Protocol. Although the United States is not participating in the Kyoto Protocol, the current session of Congress is considering climate change legislation, with multiple bills having already been introduced that proposed to restrict greenhouse gas emissions. Also, several states, although not those in which our properties are located, have already adopted regulatory initiatives or legislation to reduce emissions of greenhouse gases. For example, California recently adopted the “California Global Warming Solutions Act of 2006,” which requires the California Air Resources Board to achieve a 25% reduction in emissions of greenhouse gases from sources in California by 2020. Additionally, on April 2, 2007, the U.S. Supreme Court issued its decision in Massachusetts, et al. v. EPA, holding that the Federal Clean Air Act provides EPA with the authority to regulate emissions of carbon dioxide and other greenhouse gases from mobile sources. The Supreme Court also determined that EPA had failed to provide an adequate statutory basis for its refusal to regulate greenhouse gases from such sources. The Supreme Court reversed a decision rendered by the U.S. Circuit Court of Appeals for the District of Columbia and remanded the case to the Circuit Court for further proceedings consistent with its ruling, which will presumably require EPA to determine whether greenhouse gases from mobile sources present an endangerment to public health or welfare. Passage of climate control legislation by Congress or a determination by EPA that public health or welfare is endangered by emission of carbon dioxide from mobile sources may result in federal regulation of carbon dioxide emissions and other greenhouse gases. Currently, operation of our properties is not adversely impacted by existing state and local climate change initiatives and, at this time, it is not possible to accurately estimate how potential future laws or regulations addressing greenhouse gas emissions would impact our business.
We believe that we are currently in compliance with the statutory and regulatory provisions governing our operations. However, we do business and own properties in a number of different geographical areas and are therefore subject to the jurisdicition of a large number of different authorities at different levels of government. We can give no assurance that we will be able to comply with future changes in the statutes and regulations.
51
Table of Contents
MANAGEMENT
Directors, Officers and Certain Named Individuals
Our directors and executive officers and their ages as of May 9, 2008 are as follows:
Name | Age | Position | ||||
| William M. Hitchcock | 68 | Chairman of the Board of Directors | ||||
| Mark G. Avery | 49 | Chief Executive Officer, President and Director | ||||
| Ralph D. Davis | 61 | Chief Financial Officer | ||||
| Richard G. Lummis | 48 | Vice President — Compliance, Secretary and Director | ||||
| Robert Eriksson | 32 | Director | ||||
| Barry Borak | 54 | Director | ||||
| Alastair J. Robertson | 55 | Director | ||||
The following table provides information about the business background of our directors and executive officers:
| Name and Jurisdiction of | Principal Occupation Business or Employment at Present | |||
Residence | and Held During Last Five Years | Director Since | ||
| William M. Hitchcock Texas, U.S.A. | Chairman of the Board of Directors of Ausam Energy Corporation since July 5, 2007; Managing Partner of Pembroke Financial Partnership, a NASD Broker/Dealer since January 1996; President of Avalon Financial, Inc. a private investment company since December 1996; Director of Thoratec Corporation from May 1996 to May 2007. Mr. Hitchcock also serves on the advisory board of two SKH partnerships. Over the years Mr. Hitchcock has served on a number of public company boards, both in the United States and Canada, including Plains Resources Inc. He also serves as a trustee for a number of philanthropic organizations. | July 5, 2007 | ||
| Mark G. Avery President, Chief Executive Officer and a Director Texas, U.S.A. | President and Chief Executive Officer of Ausam Energy Corporation since June 7, 2004; Chairman of Ausam Energy Corporation from June 7, 2004 to July 5, 2007; Executive Chairman of Ausam Resources Pty Ltd. since October 2002; Chairman of Ausam Resources Pty Ltd. since August 2000. | June 7, 2004 | ||
| Ralph D. Davis Chief Financial Officer | Chief Financial Officer of Ausam Energy Corporation since April 1, 2008; Chief Financial Officer of Noram Resources, Inc. since December 2007; Financial Consultant from September 2004 until December 2007; Managing Director of Siemens Industrial Turbo-Machinery from May 2003 until September 2004; Financial Director of Alstom Power Industrial Turbines from September 1999 until May 2003. | |||
| Richard G. Lummis Vice President, Compliance, Corporate Secretary and a Director Alberta, Canada | Vice President, Compliance and Corporate Secretary of Ausam Energy Corporation since April 1, 2007, prior thereto Executive Vice President of Ausam Energy Corporation since June 7, 2004; Executive Director of Ausam Resources Limited since November 2000; principal of Lummis Group Consulting from June 1993 to November 2000. | June 7, 2004 |
52
Table of Contents
| Name and Jurisdiction of | Principal Occupation Business or Employment at Present | |||
Residence | and Held During Last Five Years | Director Since | ||
| Alastair J. Robertson Director Alberta, Canada | Independent businessman; Chief Financial Officer of Ausam Energy Corporation from June 2004 until April 1, 2008; Director of Ausam Energy Corporation since August 1997; Chief Executive Officer of Northlinks Limited from 1997 to June 2004. | August 21, 1997 | ||
| Robert Eriksson Director Stockholm, Sweden | Head of Investor Relations for Vostok Nafta Investment Ltd. and Vostok Gas since April 2006; currently involved in Investor Relations activities with the Lundin Group of Companies, including Lundin Mining Corporation and Tanganyika Oil, since April 2006. Prior thereto, self-employed in investor relations/corporate communications from January 2002 to April 2006. Prior thereto, Business and Finance Reporter and Bureau Chief for Swedish business daily Finanstidningen’s North American Bureau (San Francisco) from October 1998 to October 2001. | July 5, 2007 | ||
| Barry Borak Director New Jersey, U.S.A. | Principal of Huff Asset Management LLC since March 2007; Vice President of Decision Economics from July 2005 to January 2007; Vice President with Foresight Resources from July 2003 to May 2005; Managing Director of Babson Capital from July 1997 to May 2003. | July 6, 2007 |
William M. Hitchcock, Robert Eriksson and Barry Borak serve as members of the Compensation Committee, the Reserves Committee and the Audit Committee of the board of directors. Messrs. Eriksson and Borak are considered as independent directors. We use the standards of the American Stock Exchange to determine independence of our directors. Mr. Borak was appointed to the board following the closing of the Huff Transaction pursuant to the terms of the Debenture. Mr. Eriksson is chairman of the Compensation Committee, Mr. Hitchcock is chairman of the Reserves Committee and Mr. Borak is chairman of the Audit Committee. Mr. Borak is also chairman of the Compliance and Disclosure Committee, of which Messrs. Avery, Robertson and Lummis are members. Messrs. Eriksson and Borak serve on the Nominating Committee.
Executive Compensation — Summary Compensation Table
| Change in | ||||||||||||||||||||||||||||||||||||
| Pension Value | ||||||||||||||||||||||||||||||||||||
| and | ||||||||||||||||||||||||||||||||||||
| Nonqualified | ||||||||||||||||||||||||||||||||||||
| Non-Equity | Deferred | |||||||||||||||||||||||||||||||||||
| Name and Principal | Stock | Option | Incentive Plan | Compensation | All Other | |||||||||||||||||||||||||||||||
Position | Year | Salary | Bonus | Awards | Awards | Compensation | Earnings | Compensation | Total | |||||||||||||||||||||||||||
| ($) | ($) | ($) | ($)(1) | ($) | ($) | ($) | ($) | |||||||||||||||||||||||||||||
| (a) | (b) | (c) | (d) | (e) | (f) | (g) | (h) | (i) | ||||||||||||||||||||||||||||
| Mark G. Avery | 2007 | 258,300 | 126,572 | 469,064 | — | — | — | 853,936 | ||||||||||||||||||||||||||||
Chief Executive | 2006 | 154,525 | — | — | — | — | — | — | 154,252 | |||||||||||||||||||||||||||
Officer(2),(3) | 2005 | 144,725 | — | — | 414,070 | — | — | — | 558,795 | |||||||||||||||||||||||||||
| Alastair J. Robertson | 2007 | 203,526 | 74,661 | — | 245,487 | — | — | — | 523,674 | |||||||||||||||||||||||||||
Chief Financial | 2006 | 127,152 | — | — | — | — | — | — | 127,152 | |||||||||||||||||||||||||||
Officer(4) | 2005 | 119,088 | — | — | 278,080 | — | — | — | 397,168 | |||||||||||||||||||||||||||
| Ralph D. Davis | 2007 | 19,992 | — | — | — | — | — | — | 19,992 | |||||||||||||||||||||||||||
Chief Financial | 2006 | — | — | — | — | — | — | — | — | |||||||||||||||||||||||||||
Officer(4) | 2005 | — | — | — | — | — | — | — | — | |||||||||||||||||||||||||||
| Richard G. Lummis | 2007 | 176,032 | — | — | 175,260 | — | — | — | 351,292 | |||||||||||||||||||||||||||
Vice President —Compliance | 2006 | 132,450 | — | — | — | — | — | — | 132,450 | |||||||||||||||||||||||||||
and Secretary(3),(5) | 2005 | 124,050 | — | — | 139,040 | — | — | — | 263,090 | |||||||||||||||||||||||||||
53
Table of Contents
| Change in | ||||||||||||||||||||||||||||||||||||
| Pension Value | ||||||||||||||||||||||||||||||||||||
| and | ||||||||||||||||||||||||||||||||||||
| Nonqualified | ||||||||||||||||||||||||||||||||||||
| Non-Equity | Deferred | |||||||||||||||||||||||||||||||||||
| Name and Principal | Stock | Option | Incentive Plan | Compensation | All Other | |||||||||||||||||||||||||||||||
Position | Year | Salary | Bonus | Awards | Awards | Compensation | Earnings | Compensation | Total | |||||||||||||||||||||||||||
| ($) | ($) | ($) | ($)(1) | ($) | ($) | ($) | ($) | |||||||||||||||||||||||||||||
| (a) | (b) | (c) | (d) | (e) | (f) | (g) | (h) | (i) | ||||||||||||||||||||||||||||
| Curtis E. Weddle | 2007 | 139,400 | — | — | 402,122 | — | — | — | 541,522 | |||||||||||||||||||||||||||
Vice President — Engineering | 2006 | — | — | — | — | — | — | — | — | |||||||||||||||||||||||||||
of Noram(6),(7) | 2005 | — | — | — | — | — | — | — | — | |||||||||||||||||||||||||||
| Todd A. Regalado | 2007 | 139,400 | — | — | 402,122 | — | — | — | 541,522 | |||||||||||||||||||||||||||
Vice President — Operations | 2006 | — | — | — | — | — | — | — | — | |||||||||||||||||||||||||||
of Noram(6),(8) | 2005 | — | — | — | — | — | — | — | — | |||||||||||||||||||||||||||
| (1) | Number of options reflects the 1:5 reverse share consolidation on September 26, 2007. The value shown in the table is calculated using the Black-Scholes option model. As of the date of this prospectus, all options are significantly out of the money. | |
| (2) | On March 31, 2004 Mr. Avery received Common Shares of Ausam Resources Pty Ltd in lieu of salary which were subsequently exchanged for 44,800 Common Shares. | |
| (3) | At March 31, 2004 Mr. Avery was owed AU$34,214 and Mr. Lummis was owed AU$413,146 with respect to deferred directors’ fees and expenses. On April 23, 2004 these amounts were converted into common shares of Ausam Resources Pty Ltd., which were subsequently exchanged by Mr. Avery for 9,124 Common Shares and by Mr. Lummis for 110,172 Common Shares. Also on March 31, 2004, an LLC owned by Mr. Lummis and Mr. Avery was owed AU$46,289 with respect to expenses. On April 23, 2004 the debt was converted to common shares of Ausam Resources Pty Ltd., which was subsequently exchanged for 12,344 Common Shares. | |
| (4) | Consulting fees of $61,462 were paid to 857706 Alberta Ltd.; Mr. Robertson is the sole shareholder of 857706 Alberta Ltd. Mr. Robertson resigned as our Chief Financial Officer effective April 1, 2008, and Mr. Davis assumed the role of Chief Financial Officer on that date. | |
| (5) | Received 14,167 Common Shares in lieu of salary and bonus through debt conversion effective July 30, 2004. | |
| (6) | During 2006 and through June 30, 2007, Tsalagi Management, Inc. was paid $302,324 and $285,110, respectively, for the provision of consulting services to Noram. Tsalagi Management, Inc. is owned 50% by Mr. Weddle and 50% by Mr. Regalado. | |
| (7) | On July 1, 2007, Mr. Weddle became an employee of Noram with an annual salary of $250,000 and a car allowance of $1,100 per month. | |
| (8) | On July 1, 2007, Mr. Regalado became an employee of Noram with an annual salary of $250,000 and a car allowance of $1,100 per month. |
As of April 1, 2007, Mark Avery’s salary was increased to $275,000 per year with a $1,000 per month car allowance. Mr. Robertson’s annual salary was increased to CDN$240,000 with a CDN$1,000 per month car allowance. Mr. Lummis’ annual salary was increased to CDN$200,000 with a CDN$1,000 per month car allowance.
Our subsidiaries also have certain employees with salaries in excess of $100,000 per year. Mr. Curtis E. Weddle III, Vice President, Engineering of Noram is currently paid an annual salary of $250,000 with a $1,100 per month car allowance; Mr. Todd A. Regalado, Vice President, Operations of Noram is currently paid an annual salary of $250,000 with a $1,100 per month car allowance; Mr. Arnold P. Milton, Vice President, Exploration of Noram is currently paid an annual salary of $225,000 with a car allowance of $1,100 per month; and Mr. Frank C. Lytle, Vice President, Land of Noram is currently paid an annual salary of $175,000 with a car allowance of $1,100 per month. In Australia, Mr. Edward Surka entered into a consulting contract with ARL to provide management services as Exploration Manager, Australia. This agreement terminated on March 31, 2008. He received AU$1,200 per day under this agreement. In 2007, this amount equaled AU$274,200 ($241,406), while in 2006 he received AU$293,187 ($258,122).
54
Table of Contents
Stock Option Grants and Exercises
Outstanding Equity Awards at Fiscal Year-End
| Stock Awards | ||||||||||||||||||||||||||||||||||
| Equity | ||||||||||||||||||||||||||||||||||
| Incentive | ||||||||||||||||||||||||||||||||||
| Equity | Plan | |||||||||||||||||||||||||||||||||
| Option Awards | Incentive | Awards: | ||||||||||||||||||||||||||||||||
| Equity | Market | Plan Awards: | Market | |||||||||||||||||||||||||||||||
| Incentive | Number | Value | Number | or Payout | ||||||||||||||||||||||||||||||
| Plan | of | of | of Unearned | Value of | ||||||||||||||||||||||||||||||
| Number of | Number of | Awards: | Shares | Shares | Shares, | Unearned | ||||||||||||||||||||||||||||
| Securities | Securities | Number | or Units | or Units | Units or | Shares, | ||||||||||||||||||||||||||||
| Underlying | Underlying | of Securities | of Stock | of Stock | Other | Units or | ||||||||||||||||||||||||||||
| Unexercised | Unexercised | Underlying | That | That | Rights That | Other | ||||||||||||||||||||||||||||
| Options | Options | Unexercised | Option | Option | Have | Have | Have | Rights That | ||||||||||||||||||||||||||
| (#) | (#) | Unearned | Exercise | Expiration | Not | Not | Not | Have | ||||||||||||||||||||||||||
Name | Exercisable | Unexercisable | Options | Price | Date | Vested | Vested | Vested | not Vested | |||||||||||||||||||||||||
| (a) | (b) | (c) | (#) | (CDN$) | (f) | (#) | ($) | (#) | (CDN$) | |||||||||||||||||||||||||
| (d) | (e) | (g) | (h) | (i) | (j) | |||||||||||||||||||||||||||||
| Mark G. Avery | 165,000 | — | — | 3.75 | August 6, 2009 | — | — | — | — | |||||||||||||||||||||||||
| 70,000 | — | — | 6.50 | February 10, 2010 | — | — | — | — | ||||||||||||||||||||||||||
| 40,000 | — | — | 5.75 | July 28, 2010 | — | — | — | — | ||||||||||||||||||||||||||
| 214,111 | 107,056 | — | 2.375 | April 4, 2012 | — | — | — | — | ||||||||||||||||||||||||||
| Alastair J. Robertson | 20,000 | — | — | 3.75 | August 6, 2009 | — | — | — | — | |||||||||||||||||||||||||
| 30,000 | — | — | 3.75 | September 29, 2009 | — | — | — | — | ||||||||||||||||||||||||||
| 80,000 | — | — | 5.75 | July 28, 2010 | — | — | — | — | ||||||||||||||||||||||||||
| 168,084 | — | — | 2.375 | April 4, 2012 | — | — | — | — | ||||||||||||||||||||||||||
| Richard G. Lummis | 105,000 | — | — | 3.75 | August 6, 2009 | — | — | — | — | |||||||||||||||||||||||||
| 40,000 | — | — | 5.75 | July 28, 2010 | — | — | — | — | ||||||||||||||||||||||||||
| 80,000 | 40,000 | — | 2.375 | April 4, 2012 | — | — | — | — | ||||||||||||||||||||||||||
| Keith C. Hill | 20,000 | — | — | 5.50 | November 9, 2009 | — | — | — | — | |||||||||||||||||||||||||
| 20,000 | — | — | 5.75 | July 28, 2010 | — | — | — | — | ||||||||||||||||||||||||||
| 60,000 | — | — | 2.375 | April 4, 2012 | — | — | — | — | ||||||||||||||||||||||||||
| Graeme G. Phipps | 40,000 | — | — | 3.25 | August 6, 2009 | — | — | — | — | |||||||||||||||||||||||||
| 60,000 | — | — | 2.375 | April 4, 2012 | — | — | — | — | ||||||||||||||||||||||||||
Since the end of our fiscal year, on January 25, 2008, Mr. Ralph D. Davis was awarded options to acquire 125,000 Common Shares at a price of CDN$1.65. On April 4, 2007, Mr. Avery was awarded options to acquire 321,167 Common Shares, Mr. Robertson options to acquire 168,084 Common Shares, and Mr. Lummis options to acquire 120,000 Common Shares. All of these options are exercisable at a price of CDN$2.375 per share with one-third vesting immediately, one-third vesting on April 4, 2008, and one-third vesting on April 4, 2009. In addition, Mr. Hill and Mr. Phipps, who were serving as directors at the time, were each granted options to purchase 60,000 Common Shares exercisable at a price of CDN$2.375 per share, which vested immediately. As of the date of this prospectus, there have been no exercises of outstanding stock options.
Equity Compensation Plan Information (as of April 30, 2008)
| Number of Securities | ||||||||||||
| Remaining Available | ||||||||||||
| for Future Issuance | ||||||||||||
| Number of Securities to be | Weighted-average | Under Equity | ||||||||||
| Issued Upon Exercise of | Exercise Price of | Compensation Plans | ||||||||||
| Outstanding Options, | Outstanding Options, | (Excluding Securities | ||||||||||
Plan Category | Warrants and Rights | Warrants and Rights | Reflected in Column (a)) | |||||||||
| (a) | (b) | (c) | ||||||||||
| Equity compensation plans approved by security holders | 3,024,251 | $ | 2.93 | 12,582 | ||||||||
| Equity compensation plans not approved by security holders | 0 | 0 | 0 | |||||||||
| Total | ||||||||||||
55
Table of Contents
Stock Appreciation Rights, Restricted Shares and Long Term Incentive Plans
We have no stock appreciation rights, restricted shares or long term incentive plans other than the Stock Option Plan. Also, we have no pension or retirement plans currently in place.
Employment Agreements and Termination of Employment and Change of Control Arrangements
Mark G. Avery has entered into a full time executive employment agreement with us to be our President and Chief Executive Officer with an annual salary of $275,000 as of April 1, 2007 and is eligible for a performance bonus (the “Avery Agreement”). Mr. Avery also receives a monthly car allowance of $1,000 per month. Richard G. Lummis has entered into a full time executive employment agreement with the Corporation to be the Vice President, Compliance and Corporate Secretary of the Corporation with an annual salary of CDN$200,000 as of April 1, 2007 and is eligible for a performance bonus (the “Lummis Agreement”). Ralph D. Davis entered into a full time executive employment agreement effective December 1, 2007 with the Corporation to be the Chief Financial Officer of Noram with an annual salary of $240,000. Mr. Davis assumed the role of Chief Financial Officer of Ausam as of April 1, 2008 (the Avery Agreement, Lummis Agreement, and Davis Agreement, together, are referred to as the “Executive Agreements”). Mr. Lummis and Mr. Davis also receive a car allowance of CDN$1,000 per month. If any Executive Agreement is terminated due to the death of the respective executive, then one year’s annual base salary will be paid to the executive’s spouse or legal representative.
As part of the our transition to a company focused solely on operations in the United States, Alastair J. Robertson resigned as Chief Financial Officer effective April 1, 2008. Under the terms of his employment agreement, he received a one-time payment of CDN$281,000. Mr. Robertson has entered into a consulting agreement with us to provide advice on an as-needed basis to assist in the transition of accounting functions from our Calgary office to our Houston office.
Each Executive Agreement continues indefinitely until terminated in accordance with its terms or as mutually agreed between the respective executive and the Corporation. The Corporation may terminate any of the Executive Agreements for just cause. Termination for any reason other than just cause entitles the respective executive to choose compensation in lieu of notice of either: (i) the current annual base salary plus the average amount paid or payable as bonus, if any, less required withholdings; or (ii) the vesting of all Options granted to the respective executive. In the case of change of control or change in responsibilities, each executive has the right for a period of six months following any event causing the change of control or change of responsibilities to terminate the respective Executive Agreement and to be paid both types of the foregoing compensation.
Mr. Keith C. Hill and Mr. Graeme G. Phipps both served as our directors from 2004 to 2007 and hold options granted during their service. Both men have entered into consulting agreements with us to provide advice on an as-needed basis. These agreements have the effect of keeping options in place which might otherwise have expired 90 days after the end of their service as directors. No fees have been paid to date under their consulting agreements.
Compensation of Directors
For fiscal year ended December 31, 2007.
| Change in | ||||||||||||||||||||||||||||
| Pension Value | ||||||||||||||||||||||||||||
| and | ||||||||||||||||||||||||||||
| Non-equity | Nonqualified | |||||||||||||||||||||||||||
| Fees Earned | Incentive Plan | Deferred | ||||||||||||||||||||||||||
| or Paid | Stock | Option | Compensation | Compensation | All Other | Total | ||||||||||||||||||||||
Name | in Cash ($) | Awards ($) | Awards ($) | ($) | Earnings ($) | Compensation ($) | ($) | |||||||||||||||||||||
| (a) | (b) | (c) | (d) | (e) | (f) | (g) | (h) | |||||||||||||||||||||
William M. Hitchcock,Chairman | 32,000 | — | 293,355 | — | — | — | 325,355 | |||||||||||||||||||||
| Mark G Avery | — | — | — | — | — | — | — | |||||||||||||||||||||
| Alastair J. Robertson | — | — | — | — | — | — | — | |||||||||||||||||||||
56
Table of Contents
| Change in | ||||||||||||||||||||||||||||
| Pension Value | ||||||||||||||||||||||||||||
| and | ||||||||||||||||||||||||||||
| Non-equity | Nonqualified | |||||||||||||||||||||||||||
| Fees Earned | Incentive Plan | Deferred | ||||||||||||||||||||||||||
| or Paid | Stock | Option | Compensation | Compensation | All Other | Total | ||||||||||||||||||||||
Name | in Cash ($) | Awards ($) | Awards ($) | ($) | Earnings ($) | Compensation ($) | ($) | |||||||||||||||||||||
| (a) | (b) | (c) | (d) | (e) | (f) | (g) | (h) | |||||||||||||||||||||
| Richard G. Lummis | — | — | — | — | — | — | — | |||||||||||||||||||||
| Robert Eriksson | 24,500 | — | 220,016 | — | — | — | 244,516 | |||||||||||||||||||||
| Barry Borak | 22,500 | — | 220,016 | — | — | — | 242,516 | |||||||||||||||||||||
| Keith C. Hill | 11,250 | — | 87,630 | — | — | — | 98,880 | |||||||||||||||||||||
| Graeme G. Phipps | 11,250 | — | 87,630 | — | — | — | 98,880 | |||||||||||||||||||||
The above table reflects directors’ compensation as of December 31, 2007. Messrs. Avery, Robertson, and Lummis are executive officers whose compensation in that capacity is reflected in the Executive Compensation table.
On April 4, 2007 we installed a new plan for compensating directors who are not also executive officers. Each of our outside directors, other than the Chairman, receives an annual retainer of $15,000 for acting as a director of the Corporation. The Chairman of the Board, an independent director, will be paid $30,000 and Committee Chairs are paid $6,000 per annum. In addition, we will pay a meeting fee of $1,000 to each outside director for each meeting and committee meeting attended.
We grant options to assist us in compensating, attracting, retaining and motivating our directors and to closely align their personal interests with those of our other Shareholders. Accordingly, on September 5, 2007, we granted the Chairman of the Board 160,000 stock options and Messrs Eriksson and Borak each 120,000 stock options. These options are all exercisable at a price of CDN$2.40 per share with one-third vesting immediately, one-third on September 5, 2008, and one-third on September 5, 2009.
Before the introduction of the formal director compensation program on April 4, 2007, directors did not receive fees or other cash compensation as directors. Directors were reimbursed for actual expenses reasonably incurred in connection with the performance of their duties as directors and were eligible to receive Options granted from time to time. Officers of the Corporation who were also directors of the Corporation did receive compensation in their capacities as officers of the Corporation. The directors were reimbursed for expenses and were granted incentive stock options prior to the introduction of the formal director compensation program in 2007.
Keith C. Hill and Graeme G. Phipps, who were directors and elected not to stand for election as directors at the annual and special meeting of shareholders on July 5, 2007, have entered into consulting agreements with us to provide advisory services on an as-needed basis. Although such agreements have the effect of permitting them to retain options previously granted to them during their service as directors, neither one has received consulting fees either during the most recently completed financial year or subsequently, up to and including the date of this prospectus.
Directors’ and Officers’ Liability Insurance
We maintain a standard Directors’ and Officers’ Liability insurance policy in the amount of CDN$10 million.
Compensation Committee Interlocks and Insider Participation
The Compensation Committee of the Board of Directors consists of William M. Hitchcock, Robert Eriksson, and Barry Borak. None of these individuals has been an officer or employee of Ausam.
Code of Ethics
The Ausam Energy Corporation Code of Business Conduct is set forth on our website at www.ausamenergy.com.
57
Table of Contents
COMPENSATION DISCUSSION AND ANALYSIS
Compensation Objectives
Our primary goal with respect to executive compensation has been to attract and retain the most talented and dedicated executives and independent directors possible. We also attempt to link annual cash incentives and the judicious use of option grants to the achievement of performance objectives and to align executives’ incentives with creation of shareholder value. To achieve these goals, our compensation committee will evaluate individual executive performance with a goal of setting compensation levels it believes are comparable with executives in other companies of similar size and stage of development engaged in the acquisition, development, and exploitation of oil and natural gas properties while also considering our relative performance and our own strategic goals.
Compensation Committee
Our compensation committee consists of William M. Hitchcock, Robert Eriksson and Barry Borak, none of whom serve as an executive officer. The compensation committee reviews and approves the compensation and benefits of our executive officers, establishes and reviews general policies related to our compensation and benefits and administers our Stock Option Plan. Although we have no formal policy for establishing the compensation of our executive officers, we expect that the compensation committee will, as it has in the past, review the compensation levels of our peer group of companies in determining appropriate compensation levels. To date, the peer group of companies has been chosen by an independent third party consultant. The companies selected included: Heritage Oil Corp., Storm Cat Energy, Churchill Energy, Antrim Energy, Caspian Energy, Bow Valley Energy, Capital Energy, Zapata Energy, Bonterra Energy Trust, Oilexco, and Gentry Energy. The companies were selected on the basis of low production ( <4,000 boe/d) but potential high exploration upside.
Elements of Compensation
Executive compensation currently consists of the following elements:
Base Salary. Base salaries established for our executive officers were generally established by negotiation with the individual officer and by comparison to the compensation packages of similarly positioned officers of other companies in our industry.
Incentive Bonus. Some of the employment agreements with our executive officers (which are described below) provide for annual payments of cash bonuses. The amount of such bonuses is determined at the discretion of the board of directors and there are not defined metrics for calculating such bonuses. Certain of the agreements contain a minimum bonus clause if the employee uses his best efforts on our behalf.
Stock Option Plan. Our executives are eligible to participate in the Stock Option Plan as described below, and in some instances received grants of options upon execution of their employment agreements.
Other Compensation. Our executives receive certain other benefits, including reimbursement for business and entertainment expenses. They are also eligible to participate in our employee benefit plans, which presently include medical and dental insurance plans, group life, short- and long-term disability insurance. Certain executives receive automobile allowances to compensate them for the use of their personal vehicles. Our executives receive paid vacation, holiday, and leave time. The compensation committee may revise, amend or add to the executive officers’ benefits and perquisites as it deems advisable. We believe that the benefit and perquisite packages that we offer are comparable to those typically provided senior executives of competing companies of comparable size in our industry.
Employment Agreements
We have written employment agreements in place with certain of our executives. The description below is a summary of the most important terms and is not intended to be exhaustive. This discussion is qualified in its
58
Table of Contents
entirety by the copies of the employment agreements which are filed with the SEC as exhibits to the registration statement of which this prospectus is a part.
Mark G. Avery. Mr. Avery entered into an employment agreement to serve as our President and Chief Executive Officer effective April 1, 2007 which provides for an annual salary of $275,000. Mr. Avery is eligible for an annual cash bonus whose target amount is 100% of his base salary at our discretion, but with a minimum bonus of 20% of his annual salary in the event that we determine that he has used his best efforts to achieve our objectives. Mr. Avery also receives a car allowance of $1,000 per month as compensation for using his personal vehicle.
Richard G. Lummis. Mr. Lummis entered into an employment agreement to serve as our Vice President, Legal and Compliance and Corporate Secretary effective April 1, 2007 at an annual salary of CDN$200,000 per year. Mr. Lummis also receives a car allowance of CDN$1,000 per month as compensation for using his personal vehicle.
Curtis E. Weddle III. Mr. Weddle is employed by Noram as Vice President, Engineering at a salary of $250,000 per year. Mr. Weddle is eligible for an annual cash bonus whose target amount is 100% of his base salary at the discretion of Noram, but with a minimum bonus of 25% of his annual salary in the event that Noram determines that he has used his best efforts to achieve the company’s objectives. Mr. Weddle also receives a car allowance of $1,100 per month as compensation for using his personal vehicle.
Todd A. Regalado. Mr. Regalado is employed by Noram as Vice President, Operations at a salary of $250,000 per year. Mr. Regalado is eligible for an annual cash bonus whose target amount is 100% of his base salary at the discretion of Noram, but with a minimum bonus of 25% of his annual salary in the event that Noram determines that he has used his best efforts to achieve the company’s objectives. Mr. Regalado also receives a car allowance of $1,100 per month as compensation for using his personal vehicle.
Arnold P. Milton. Mr. Milton is employed by Noram as Vice President, Exploration at a salary of $225,000 per year. Mr. Milton is eligible for an annual cash bonus whose target amount is 100% of his base salary at the discretion of Noram, but with a minimum bonus of 25% of his annual salary in the event that Noram determines that he has used his best efforts to achieve the company’s objectives. Mr. Milton also receives a car allowance of $1,000 per month as compensation for using his personal vehicle.
Frank C. Lytle. Mr. Lytle is employed by Noram as Vice President, Land at a salary of $175,000 per year. Mr. Lytle is eligible for an annual cash bonus whose target amount is 100% of his base salary at the discretion of Noram, but with a minimum bonus of 25% of his annual salary in the event that Noram determines that he has used his best efforts to achieve the company’s objectives. Mr. Lytle also receives a car allowance of $1,100 per month as compensation for using his personal vehicle.
Ralph D. Davis. Mr. Davis is employed as our Chief Financial Officer at a salary of $210,000 per year. He is also the Chief Financial Officer of Noram. Mr. Davis is eligible for an annual cash bonus whose target amount is 100% of his base salary at our discretion, but with a minimum bonus of 25% of his annual salary in the event that we determine that he has used his best efforts to achieve our objectives. Mr. Davis also receives a car allowance of $1,000 per month as compensation for using his personal vehicle.
Stock Option Plan
Our shareholders approved our Stock Option Plan at the most recent annual and special meeting of shareholders on July 5, 2007. The basic provisions of the plan are as follows:
The aggregate number of Common Shares reserved for issuance under the Option Plan is 10% of the outstanding Common Shares from time to time. We currently have 30,368,337 Common Shares issued and outstanding. As of the date of this prospectus, 2,879,251 options have been granted in accordance with the Option Plan (representing 9.5% of the outstanding Common Shares) and 157,583 options remain issuable thereunder (representing approximately 0.5% of the outstanding Common Shares).
Issuance of options under the Option Plan is restricted such that:
1. the aggregate number of Common Shares reserved for issuance on exercise of options, within any 12 month period, granted to any one of our consultants may not exceed 2% of the outstanding Common Shares;
59
Table of Contents
2. the aggregate number of Common Shares reserved for issuance on an exercise of options, in any 12 month period, granted to one of our employees conducting Investor Relations Activities, as such term is defined in the TSXV Corporate Finance Manual, may not exceed 2% of the outstanding Common Shares;
3. the maximum number of Common Shares reserved for issuance pursuant to options granted to Insiders, as such term is defined in the TSXV Corporate Finance Manual, at any time may not exceed 10% of the number of outstanding Common Shares; and
4. the maximum number of Common Shares issuable on exercise of options granted to insiders in a 12 month period shall not exceed 10% of the number of outstanding Common Shares;
provided that, for the purposes of paragraphs (3) and (4) above, an entitlement granted prior to the grantee becoming an Insider may be excluded in determining the number of Common Shares issuable to Insiders.
Exercise Price
The exercise price of options granted under the Stock Option Plan shall be determined by the board of directors, but shall not be less than the closing market price of the Common Shares on the trading day immediately prior to the time of the grant of the option (or, if no trades occurred on such day, then the next previous day on which trading took place) less the maximum discount permitted under the policies of the TSXV or such other price as may be agreed to by the Corporation and approved by the TSXV. In the event that the Corporation proposes to reduce the exercise price of options granted to a participant who is an insider of the Corporation at the time of the proposed amendment, such amendment shall not be effective until disinterested shareholder approval has been obtained in respect of the reduction of the exercise price if required by the rules and policies of the TSXV then in effect.
Term of Options
All options granted under the Option Plan shall expire not later than the fifth anniversary of the date such options were granted and may be exercised by the participant as to varying percentages, on a cumulative basis, during the terms thereof as the board of directors shall determine.
Vesting of Options
The period over which any option may be exercised will be determined at the time of the granting of the option by the board of directors or such committee of the board as the board may designate at the time of grant. Vesting is determined by the board at the time options are granted but in any event options issued to consultants performing Investor Relations Activities must vest in stages over 12 months with no more than one quarter of such options vesting in any three month period.
Cessation of Entitlement to Options
In the event a holder of options who is one of our directors, officers, employees or consultants ceases to hold such position for any reason other than death, permanent disability, or normal retirement or termination for cause, such participant shall have the right to exercise any such options within a period of 30 days following the effective date of such resignation in the case of a participant who is engaged in Investor Relations Activities and ceases to be employed to provide Investor Relations Activities and within a period of 90 days following the effective date of such resignation in every other case but in no event later than the normal expiry date of the options, but for not more than the number of options for which the participant could have exercised any such option immediately prior to such resignation or termination and any such option not fully exercised at the end of such period shall then terminate.
If a participant is dismissed or terminated as a director, officer, employee or consultant (as the case may be by us or by one of our subsidiaries) for cause, all unexercised options of that participant under the Stock Option Plan shall immediately terminate forthwith without further notice to the participant, notwithstanding the original term or vesting of the options granted to such participant under the Stock Option Plan.
60
Table of Contents
In the event of the normal retirement or permanent disability of a participant (as determined by the board of directors), the participant may exercise such part of the option as is exercisable immediately prior to the time of such termination within a period of 30 days following such termination in the case of a participant who is engaged in Investor Relations Activities and ceases to be employed to provide Investor Relations Activities and within a period of 90 days following such termination in every other case but in no event later than the normal expiry date of the option and any such option not fully exercised at the end of such period shall then terminate.
In the event of the death of any participant prior to the expiry of outstanding options granted to such participant, the executors or personal representatives of the participant shall have the right to exercise any such option within 180 days of the participant’s death, but in no event later than the normal expiry date of the option and for not more than the number of options for which the participant could have exercised any such option immediately prior to the participant’s death, and any such option not fully exercised at the end of such period shall then terminate.
Transferability
An option granted under the Stock Option Plan shall not be transferable or assignable (whether absolutely or by way of mortgage, pledge or other charge) by a participant other than by will or other testamentary instrument or the laws of succession and may be exercisable during the lifetime of the participant only by the participant.
Amendments
Our board of directors may from time to time amend or revise the terms of the Stock Option Plan or may discontinue the Stock Option Plan at any time, provided that no such action may in any manner adversely affect the rights under any options earlier granted to a participant under the Stock Option Plan without the consent of that participant.
Change of Control
All options will be exercisable in whole on an earlier date upon the occurrence of a proposal by us or any other person or corporation to implement a transaction that would, if implemented, result in the following:
1. the acquisition by any person or corporation, or any persons or corporations acting jointly or in concert (as determined by theSecurities Act (Alberta)), whether directly or indirectly, of our voting securities which, together with all other of our voting securities held by such persons or corporations, constitutes, in the aggregate, more than 40% of all of our outstanding voting securities;
2. an amalgamation, arrangement or other form of business combination of us with another corporation which results in the holders of voting securities of that other corporation holding, in the aggregate, more than 40% of all outstanding voting securities of the corporation resulting from the business combination; or
3. the sale, lease or exchange of all or substantially all of our property, other than in the ordinary course of business or to a subsidiary, to another person or corporation.
Potential Payments upon Termination or Change in Control
Our employment agreements with our executives contain provisions for payments to be made upon termination of employment or in the event of a change of control. This discussion is qualified in its entirety by the provisions of the employment agreements copies of which are filed as exhibits to the registration statement of which this prospectus is a part, but the general provisions are as follows:
We can terminate the executive’s employment at any time for Just Cause (as defined in the agreement) without notice to the executive and without payment to the executive of any compensation or severance in lieu
61
Table of Contents
of notice. Upon termination of employment for Just Cause we will pay to the executive any pay that has accrued prior to the termination.
If we terminate the executive’s employment for any reason other than Just Cause, at the executive’s option, we either provide to the executive pay in lieu of notice equal to his annual base salary, plus the average amount paid or payable as bonus, if any, to the executive over the preceding two years, less required withholdings; or any options granted to the Executive shall immediately vest, subject to applicable law. In either case, we will also pay to the executive any pay accrued prior to termination.
If the executive is working outside of his country of citizenship at the time of termination, he will be repatriated to his country of citizenship and we will pay all reasonable expenses.
In the event of the death of the executive, we will pay to the executive’s spouse or legal representative any accrued pay plus one times the annual Base Salary paid or payable over the immediately preceding year, less required withholdings.
In the event that the executive suffers a permanent disability, we can terminate his employment upon the giving of 30 days’ notice provided that such termination does not adversely affect the executive’s entitlement to long-term disability benefits under our employee benefit plan. We will also pay the executive any accrued pay prior to termination.
The executive has the right, for a period of six months following any event causing a Change of Control and a Change in Responsibilities (as those terms are defined in the agreement), to elect to terminate his employment with us by providing notice, following which we will pay to the executive the amounts as if he were terminated without Just Cause; repatriate him (if relevant); and any and all options granted to the executive shall immediately vest, subject to applicable law.
Employee Benefits
Our employees, including our executive officers, are entitled to various employee benefits. These include medical and dental care insurance plans, life, accidental death and dismemberment insurance, disability insurance, and paid time off.
62
Table of Contents
SECURITY OWNERSHIP OF CERTAIN BENEFICIAL OWNERS AND MANAGEMENT
The following table sets forth certain information about the beneficial ownership of common shares as of May 9, 2008 by:
| • | Each of our directors; | |
| • | Our executive officers named in the Summary Compensation Table above; | |
| • | All of our directors and executive officers as a group; and | |
| • | Each person known to us to be the beneficial owner of more than 5% of our outstanding common shares. |
For purposes of the following table, a person is deemed to be the beneficial owner of securities that can be acquired by that person within 60 days from May 9, 2008 upon the exercise of warrants or options or upon the conversion of convertible securities. Each beneficial owner’s percentage is determined by assuming that options, warrants or conversion rights that are held by that person regardless of price, but not those held by any other person, and which are exercisable within 60 days from May 9, 2008 have been exercised.
Unless otherwise indicated and subject to community property laws where applicable, we believe that all persons named in the following table have sole voting and investment power over all shares reported as beneficially owned by them.
The information in the following table is based upon information supplied by officers, directors, certain named individuals and principal shareholders. Applicable percentages are based on 30,368,337 common shares outstanding on May 9, 2008, subject to adjustment for each beneficial owner as described above.
| Common | ||||||||||||||||||||||||
| Shares from | ||||||||||||||||||||||||
| Name and Address of | Common | Conversion of | Percent of | |||||||||||||||||||||
Beneficial Owner | Shares | Options(1) | Warrants | Debenture(2) | Total | Class | ||||||||||||||||||
| SKH Group(3) | 12,683,428 | — | — | — | 12,683,428 | 41.8 | % | |||||||||||||||||
| The Huff Energy Fund L.P. | 190,968 | — | 4,461,100 | 9,011,502 | 13,663,570 | 31.2 | % | |||||||||||||||||
| Strome Alpha Master Fund Ltd | 1,963,834 | — | 925,926 | — | 2,889,760 | 9.2 | % | |||||||||||||||||
| William M. Hitchcock(4) | 975,018 | 53,333 | 1,458,279 | — | 2,486,630 | 7.8 | % | |||||||||||||||||
| Kinloch Rice Fields LLC | 1,634,163 | — | 740,741 | — | 2,374,904 | 7.6 | % | |||||||||||||||||
| Mark G. Avery(5) | 405,219 | 489,111 | — | — | 894,330 | 2.9 | % | |||||||||||||||||
| Alastair J. Robertson | 21,136 | 298,084 | — | — | 319,220 | 1.0 | % | |||||||||||||||||
| Richard G. Lummis(6) | 484,870 | 225,000 | — | — | 709,870 | 2.3 | % | |||||||||||||||||
| Barry Borak(7) | — | 40,000 | — | — | 40,000 | 0.1 | % | |||||||||||||||||
| Robert Eriksson | 136,200 | 40,000 | — | — | 176,200 | 0.6 | % | |||||||||||||||||
| Ralph D. Davis | — | 41,667 | — | — | 41,667 | 0.1 | % | |||||||||||||||||
| All Directors and Officers as a Group(8) | 2,022,443 | 1,187,195 | 1,458,279 | — | 4,667,917 | 14.1 | % | |||||||||||||||||
| (1) | Options exercisable within 60 days from the date of the prospectus in the absence of extraordinary events such as a change in control. |
| (2) | Number of Common Shares upon conversion of $26,719,219 principal amount Debenture at CDN$3.00 per Common Share, using an exchange rate of $1=CDN$1.01180. |
| (3) | The SKH Group consists of Antares Exploration Fund LP, SKH Energy Fund LP, SKH Management II LP, and SKH Management III LLC. | |
| (4) | Mr. Hitchcock’s beneficial ownership includes securities held by AG Edwards and by Pembroke Capital LLC. |
63
Table of Contents
| (5) | Mr. Avery’s beneficial ownership is deemed to include 50% of the securities held by Camden Partners LLC and 25% of the securities held of record by GHXX Investments Ltd. | |
| (6) | Mr. Lummis’ beneficial ownership is deemed to include 50% of the securities held by Camden Partners LLC. | |
| (7) | Mr. Borak is a principal of Huff Asset Management LLC. He disclaims beneficial ownership of securities held by The Huff Energy Fund LP. | |
| (8) | Exclusive of executive officers of Noram and ARL. |
DESCRIPTION OF CAPITAL STOCK
The following description of our capital stock does not purport to be complete and is subject to, and qualified in its entirety by, our articles of incorporation and bylaws, which are exhibits to the registration statement of which this prospectus forms a part.
Our articles of incorporation permit us to issue an unlimited number of Common Shares and an unlimited number of first preferred shares, issuable in series.
Common Shares
As of May 9, 2008, we had outstanding 30,368,337 Common Shares and no first preferred shares issued and outstanding. We also have reserved 3,024,251 Common Shares for issuance upon exercise or conversion of outstanding options, 10,371,216 Common Shares for issuance upon exercise of outstanding warrants and 10,657,914 Common Shares for issuance upon conversion of the outstanding Debenture.
We intend to apply to list our Common Shares on the AMEX, but we cannot be certain that our application will be granted.
Holders of Common Shares are entitled to one vote per share with respect to matters voted upon by such holders. Holders of Common Shares do not have preemptive rights or the right to cumulate votes in the election of directors. A special meeting of shareholders may be called by resolution of the board of directors or by registered or beneficial holders of not less than 5% of the outstanding voting shares. At any meeting of shareholders, a quorum shall be two or more persons present in person and entitled to vote thereat and holding or representing by proxy not less than five percent of the votes entitled to be cast thereat. In the absence of a quorum for the transaction of business at any such meeting, those present and entitled to vote shall constitute a quorum for the purpose only of adjourning such meeting. Those present and entitled to vote at any such adjourned meeting shall constitute a quorum for the transaction of business at such meeting.
Holders of Common Shares are entitled to participate equally on a per share basis in any dividends on Common Shares that our board of directors may declare from time to time out of our funds legally available for the payment of dividends. However, we have never declared or paid any cash dividends on our Common Shares. We do not intend to pay any cash dividends on our Common Shares for the foreseeable future.
The transfer agent and registrar for our Common Shares is Olympia Trust Company, Calgary, Alberta, Canada.
DESCRIPTION OF INDEBTEDNESS
On July 3, 2007, we entered into the Debenture with Huff and issued a $25,000,000 (equivalent to CDN$29,000,000 assuming a then-current exchange ratio of 1.16 or CDN$25,224,500 using the exchange rate on April 7, 2008) face value 9% senior secured convertible debenture and an aggregate of 4,461,100 Debenture Warrants. The principal amount of the Debenture is convertible into Common Shares at CDN$3.00 per Common Share subject to adjustment of the conversion price under certain conditions. The Debenture Warrants are exercisable into Common Shares at a price of CDN$3.00 per common share for five years subject to adjustment of the exercise price under certain conditions. As of the date of this prospectus, the principal amount of the Debenture is $26,719,219.
64
Table of Contents
At Huff’s option, the principal amount of the Debenture is convertible into Common Shares at a conversion price of CDN$3.00 per Common Share at any time during the term of the Debenture. Ausam may, at any time after thirty months from issuance, require Huff to convert the principal amount in the event that the30-day volume-weighted average price (“VWAP”) of the Common Shares is above CDN$4.50 and that the average trading volume for such 30 day period meets or exceeds 200,000 Common Shares per day.
We have the right to pay interest due on the Debenture by a deemed increase in the principal amount through March 31, 2009. If we elect to do so, the face value of the Debenture on that date would be $29,863,475, and conversion at the current exchange rate would result in the issuance of 10,043,883 Common Shares. For the periods ending September 30, 2007, December 31, 2007 and March 31, 2008 we have elected to exercise this right.
Huff has the right to appoint a member of the board of Directors. Mr. Barry Borak is currently serving on the board of directors as Huff’s designee.
Huff received 190,968 Common Shares pursuant to the Huff Transaction as a commitment fee.
Under the terms of the Debenture, in the event the30-day average number of Common Shares traded on an exchange in the United States is greater than the30-day average number of Common Shares traded on a Canadian exchange, the conversion price will be converted at a rate of 0.9340 United States dollars per Canadian dollar. This rate may be materially different from the open market exchange rate on the date of conversion.
In the event of default at maturity the interest rate will increase according to the terms of the debenture and Huff is entitled to receive additional warrants to purchase Common Shares. The interest rate is to increase by 1% per annum for each quarter thereafter that the principal remains unpaid. In addition, in the event of default at maturity, the holder of the Debenture is to receive additional warrants to purchase Common Shares equal to 2% of the outstanding Common Shares for each additional quarter thereafter that the principal of the Debenture is not paid. Such warrants shall be exercisable at the then current market price of the Common Shares.
The principal amount is subject to adjustment in certain circumstances including: (i) a sale of the Company or substantially all of its assets without the consent of Huff; and (ii) at maturity if the Debenture is not converted prior thereto. At maturity, if the VWAP of the Common Shares is below CDN$3.00 there is no adjustment to the principal amount. If the VWAP of the Common Shares is above CDN$3.00 the principal amount will be increased. The maximum amount of cash payable pursuant to such an adjustment of the principal amount is $37,500,000 and any balance will be satisfied through the issuance of Common Shares at the then prevailing market price. Since our current intent is to force conversion of the Debenture if the minimum VWAP and trading volume requirements are met, this provision will only have practical consequence if the VWAP of the Common Shares is greater than the conversion price of CDN$3.00 per Common Share but we are not entitled to force conversion because the VWAP per Common Share is less than CDN$4.50 or the trading volumes are less than 200,000 Common Shares per day.
We have no other debt other than payables incurred in the ordinary course of business.
65
Table of Contents
SELLING SHAREHOLDERS
The following is a listing of the persons who may sell their Common Shares pursuant to this prospectus. Persons designated with the symbol † acquired their shares directly from us in private placement transactions. A description of the private placement transactions for the past three years is set forth in Part II, Item 15 of this Registration Statement.
Holders of Common Shares
| Number of | Percentage of | |||||||
Name | Common Shares Held | Class if ›1% | ||||||
| 857706 Alberta Ltd†(1) | 120 | — | ||||||
| Burton Ahrens† | 9,259 | — | ||||||
| Michael C. Ainbinder† | 6,160 | — | ||||||
| Altair Corporation†(2) | 40,000 | — | ||||||
| Antares Exploration Fund LP†(3) | 6,806,203 | 22.4 | % | |||||
| John Antoci† | 38,000 | — | ||||||
| John M. Antoci† | 40,000 | — | ||||||
| Antrim Resources Inc†(4) | 7,778 | — | ||||||
| C Marshall Ashmore† | 28,000 | — | ||||||
| Alan Aufhammer & Jacquie Aufhammer† | 9,260 | — | ||||||
| Mark Galbreath Avery† | 336,275 | 1.1 | % | |||||
| Nathan M. Avery† | 20,000 | — | ||||||
| Gordon Bethune† | 92,593 | — | ||||||
| Jeffrey Keith Bowers | 667 | — | ||||||
| Lewis E. Brazelton III† | 40,000 | — | ||||||
| Broomdale Inc.†(5) | 120 | — | ||||||
| Bufflehead Exploration Inc†(6) | 6,147 | — | ||||||
| Samuel Bulych | 1,320 | — | ||||||
| Camden Partners LLC†(7) | 128,818 | — | ||||||
| Cape May Limited Partnership†(8) | 20,000 | — | ||||||
| Crestview Capital Master LLC†(9) | 140,000 | — | ||||||
| Jack R. Crissup | 4,800 | — | ||||||
| Deans Issue Trust†(10) | 40,000 | — | ||||||
| Helen Dittmer† | 120 | — | ||||||
| Dolomite Resources Incorporated†(11) | 5,600 | — | ||||||
| William P. Dubose Jr | 9,260 | — | ||||||
| William S. Farish Jr† | 92,806 | — | ||||||
| William S. Farish† | 84,054 | — | ||||||
| First Tobin Family LLC†(12) | 20,000 | — | ||||||
| Research Capital Corporation ITF Fulton Financial Corp.†(13) | 5,000 | — | ||||||
| Suzanne A. Gerlach ITF Gerlach Family Trust† | 37,037 | — | ||||||
| Stanley Gerlach & Linda Gerlach TTEE Stan Gerlach Inc FBO Linda Bozart Gerlach† | 37,037 | — | ||||||
| Stanley Gerlach & Linda Gerlach Ttee Stan Gerlach Inc FBO Stanley Wayne Gerlach† | 54,444 | — | ||||||
| GHXX Investments Ltd†(14) | 18,140 | — | ||||||
| Diane Mae Gibson | 111 | — | ||||||
Global Natural Resources IIIc/o Wellington Management Company LLP†(15) | 317,256 | 1.0 | % | |||||
66
Table of Contents
| Number of | Percentage of | |||||||
Name | Common Shares Held | Class if ›1% | ||||||
| Goldman Sachs & Co†(15) | 800 | — | ||||||
| G. Watts Humphrey | 75,845 | — | ||||||
| UBS Financial Services Cdn FBO Hal Pettigrew IRA | 150,000 | — | ||||||
| Carson M. Hamblen† | 25,660 | — | ||||||
| Henry R. Hamman† | 20,000 | — | ||||||
| Douglas P. Heller† | 69,194 | — | ||||||
| George K. Hickox Jr† | 39,194 | — | ||||||
| William M. Hitchcock† | 488,018 | 1.6 | % | |||||
| AG Edwards ITF William M Hitchcock† | 279,956 | — | ||||||
| Susan G. Hucik | 4,800 | — | ||||||
| Ralph E. Huebner Jr† | 1,600 | — | ||||||
| The Huff Energy Fund LP†(16) | 190,969 | — | ||||||
| Stuart E. Huston | 6,336 | — | ||||||
| Elizabeth Jaffar | 60,000 | — | ||||||
| Terral Jordan† | 37,037 | — | ||||||
| J S Avery 2002 Family Trust†(17) | 890 | — | ||||||
| Stephen R. Kahn† | 154,061 | — | ||||||
| Keith Keenan & Lannie Keenan† | 27,996 | — | ||||||
| T. Prescott Kessey† | 400 | — | ||||||
| Kinloch Rice Fields LLC†(18) | 1,634,164 | 5.4 | % | |||||
| Tracy Lambert† | 334 | — | ||||||
| Tracy Lynn Lambert† | 3,000 | — | ||||||
| Alexander M. Laughlin Jr† | 10,000 | — | ||||||
| Alexander Laughlin† | 25,000 | — | ||||||
| Alexander M. Laughlin† | 92,593 | — | ||||||
| David W. Laughlin† | 96,574 | — | ||||||
| Jonathan Lawrence† | 27,778 | — | ||||||
| Barry E. Leavitt† | 4,671 | — | ||||||
| Legacy Trust†(19) | 192,661 | — | ||||||
| Louise A. Havens Trust†(20) | 40,000 | — | ||||||
| Fred R. Lummis Jr† | 52,832 | — | ||||||
| David R. Lummis† | 12,700 | — | ||||||
| Richard Gano Lummis† | 420,461 | 1.4 | % | |||||
| Thomas J Maloney TTEE Maloney Annuity Trust† | 74,074 | — | ||||||
| Roxanne McCarty† | 2,000 | — | ||||||
| Mitchell Asset Management†(21) | 224,383 | — | ||||||
| J. Todd Mitchell† | 504,867 | 1.7 | % | |||||
| J. Todd Mitchell† | 66,667 | — | ||||||
| F. Stephen Mooney† | 96,331 | — | ||||||
| Mryd LLC(22) | 222,223 | — | ||||||
| Musslewhite & Associates†(23) | 12,320 | — | ||||||
| Chima Nkemdirim† | 1,111 | — | ||||||
| Clarke Ohrstrom† | 185,185 | — | ||||||
| Paul Pennington† | 21,000 | — | ||||||
| Paul Pennington† | 25,062 | — | ||||||
67
Table of Contents
| Number of | Percentage of | |||||||
Name | Common Shares Held | Class if ›1% | ||||||
| Graeme Phipps† | 2,666 | — | ||||||
| Pinoil Corporation†(24) | 1,667 | — | ||||||
| Placer Creek Investors (Bermuda) LP C/O Wellington Management Company LLP†(15) | 100,360 | — | ||||||
| Placer Creek Partners LP†(15) | 70 | — | ||||||
| Placer Creek Partners, LP†(15) | 156,960 | — | ||||||
| RBC Dain Rauscher Inc.†(25) | 20,000 | — | ||||||
| Alastair Robertson† | 21,136 | — | ||||||
| Robert E Robotti† | 35,200 | — | ||||||
| RR Ohrstrom Trust Dtd 5/20/68†(26) | 37,500 | — | ||||||
| Robert T. Rylee III† | 4,000 | — | ||||||
| Ryton Pty Ltd ATF Ryton Super Fund C/O A O Sheppard†(27) | 12,000 | — | ||||||
| Second Tobin Family LLC†(28) | 20,000 | — | ||||||
| Warren M Shimmerlik† | 8,000 | — | ||||||
| Matthew R Simmons† | 52,800 | — | ||||||
| SKH Energy Fund LP†(3) | 2,247,004 | 7.4 | % | |||||
| SKH Management II LP†(3) | 671,610 | 2.2 | % | |||||
| SKH Management III LLC†(3) | 2,958,615 | 9.7 | % | |||||
| Cameron O. Smith† | 97,592 | — | ||||||
| Stuart G. Smith & Marianne W. Smith† | 104,800 | — | ||||||
| Spindrift Partners LP†(15) | 18,971 | — | ||||||
| Strome Alpha Master Fund Ltd†(29) | 1,851,852 | 6.1 | % | |||||
| Strome Alpha Master Fund Ltd†(29) | 111,982 | — | ||||||
| Nathaniel A. Taylor | 13,998 | — | ||||||
| Deltec Bank & Trust Limited For Thomas County Properties NV†(30) | 296,297 | — | ||||||
| Dwight Thurston | 777 | — | ||||||
| Joan F. Tobin† | 75,000 | — | ||||||
| Maurice B. Tobin† | 20,000 | — | ||||||
GLO Trust Dtd12-28-61 FBO Phyllis C Townsend & Lili Townsend†(31) | 185,185 | — | ||||||
| R. Beauregard Turner† | 37,037 | — | ||||||
| Reed Beauregard Turner† | 75,000 | — | ||||||
| Monika Von Eichel† | 20,000 | — | ||||||
| York I LLC†(32) | 370,371 | 1.2 | % | |||||
| William C. Crane Trust FBO Elizabeth B Griffin†(33) | 148,148 | — | ||||||
| 23,953,730 | ||||||||
Warrant Holders
| Number of | ||||||||||||||
| Common Shares | ||||||||||||||
| Number of | Exercise | Issuable on | ||||||||||||
Name | Warrants | Price(1) | Expiration Date | Exercise | ||||||||||
| Strome Alpha Master Fund, Ltd.(29)† | 925,926 | 3.25 | February 8, 2009 | 925,926 | ||||||||||
| Suzanne A. Gerlach ITF Gerlach Family Trust, dated 7-1-91† | 18,518 | 3.25 | February 8, 2009 | 18,518 | ||||||||||
68
Table of Contents
| Number of | ||||||||||||||
| Common Shares | ||||||||||||||
| Number of | Exercise | Issuable on | ||||||||||||
Name | Warrants | Price(1) | Expiration Date | Exercise | ||||||||||
| S. Gerlach & L. Gerlach TTEE Stan Gerlach, Inc. FBO Linda Bozart Gerlach† | 18,518 | 3.25 | February 8, 2009 | 18,518 | ||||||||||
| S. Gerlach & L. Gerlach TTEE Stan Gerlach, Inc. FBO Stanley Wayne Gerlach† | 27,222 | 3.25 | February 8, 2009 | 27,222 | ||||||||||
| John M. Antoci† | 20,000 | 3.25 | February 8, 2009 | 20,000 | ||||||||||
| Louise A. Havens Trust(20)† | 20,000 | 3.25 | February 8, 2009 | 20,000 | ||||||||||
| Alan and Jacquie Aufhammer† | 4,630 | 3.25 | February 8, 2009 | 4,630 | ||||||||||
| Monika von Eichel† | 10,000 | 3.25 | February 8, 2009 | 10,000 | ||||||||||
| Joan F. Tobin† | 37,500 | 3.25 | February 8, 2009 | 37,500 | ||||||||||
| Maurice B. Tobin† | 10,000 | 3.25 | February 8, 2009 | 10,000 | ||||||||||
| First Tobin Family LLC(12)† | 10,000 | 3.25 | February 8, 2009 | 10,000 | ||||||||||
| Second Tobin Family LLC(28)† | 10,000 | 3.25 | February 8, 2009 | 10,000 | ||||||||||
| William C. Crane Trust FBO Elizabeth B. Griffin(33)† | 74,074 | 3.25 | February 8, 2009 | 74,074 | ||||||||||
| R. Beauregard Turner† | 18,518 | 3.25 | February 8, 2009 | 18,518 | ||||||||||
GLOTrust 12-28-61 FBO Phyllis C. Townsend & Lili Townsend(31)† | 92,592 | 3.25 | February 8, 2009 | 92,592 | ||||||||||
| William P. DuBose Jr.† | 4,630 | 3.25 | February 8, 2009 | 4,630 | ||||||||||
| David W. Laughlin† | 37,037 | 3.25 | February 8, 2009 | 37,037 | ||||||||||
| Alexander M. Laughlin† | 46,296 | 3.25 | February 8, 2009 | 46,296 | ||||||||||
| William M. Hitchcock† | 185,185 | 3.25 | February 8, 2009 | 185,185 | ||||||||||
Deans Issue Trust U/A12-4-85(10)† | 20,000 | 3.25 | February 8, 2009 | 20,000 | ||||||||||
| Hal Pettigrew Rollover IRA† | 75,000 | 3.25 | February 8, 2009 | 75,000 | ||||||||||
| Terral Jordan† | 19,118 | 3.25 | February 8, 2009 | 19,118 | ||||||||||
| Gary R. Petersen† | 27,778 | 3.25 | February 8, 2009 | 27,778 | ||||||||||
| Thomas J. Maloney TTEE Maloney Annuity Trust† | 37,037 | 3.25 | February 8, 2009 | 37,037 | ||||||||||
| Kinloch Rice Fields, LLC(18)† | 740,741 | 3.25 | February 8, 2009 | 740,741 | ||||||||||
| MRYD, LLC(22)† | 111,111 | 3.25 | February 8, 2009 | 111,111 | ||||||||||
| Douglas P. Heller† | 15,000 | 3.25 | February 8, 2009 | 15,000 | ||||||||||
| Clarke Ohrstrom† | 92,592 | 3.25 | February 8, 2009 | 92,592 | ||||||||||
| Burton Ahrens† | 4,630 | 3.25 | February 8, 2009 | 4,630 | ||||||||||
| Cameron O. Smith† | 46,296 | 3.25 | February 8, 2009 | 46,296 | ||||||||||
| York I LLC(32)† | 185,185 | 3.25 | February 8, 2009 | 185,185 | ||||||||||
| Deltec Bank & Trust Limited for Thomas County Properties NV(30)† | 148,148 | 3.25 | February 8, 2009 | 148,148 | ||||||||||
| Pembroke Capital LLC(34)† | 124,761 | 3.25 | February 8, 2009 | 124,761 | ||||||||||
| Mooney Enterprises LLC(35)† | 833,333 | 3.75 | February 8, 2009 | 833,333 | ||||||||||
| Nordnet Bank AB(36)† | 80,000 | 3.75 | February 8, 2009 | 80,000 | ||||||||||
| William M. Hitchcock† | 1,083,333 | 3.75 | February 8, 2009 | 1,083,333 | ||||||||||
| Pembroke Capital LLC(34)† | 65,000 | 3.75 | February 8, 2009 | 65,000 | ||||||||||
| COSCO Capital Management LLC(37) | 3,056 | 3.25 | February 8, 2009 | 3,056 | ||||||||||
| Stephan Kim† | 8,000 | 3.25 | February 8, 2009 | 8,000 | ||||||||||
| Northeast Securities(38)† | 11,556 | 3.25 | February 8, 2009 | 11,556 | ||||||||||
69
Table of Contents
| Number of | ||||||||||||||
| Common Shares | ||||||||||||||
| Number of | Exercise | Issuable on | ||||||||||||
Name | Warrants | Price(1) | Expiration Date | Exercise | ||||||||||
| Janice Murphy† | 18,000 | 3.25 | February 8, 2009 | 18,000 | ||||||||||
| Orie Lee Tawes† | 18,000 | 3.25 | February 8, 2009 | 18,000 | ||||||||||
| Altair Corporation(2)† | 20,000 | 3.25 | September 7, 2009 | 20,000 | ||||||||||
| John Antoci† | 19,000 | 3.25 | September 7, 2009 | 19,000 | ||||||||||
| C. Marshall Ashmore† | 14,000 | 3.25 | September 7, 2009 | 14,000 | ||||||||||
| Gordon Bethune† | 46,296 | 3.25 | September 7, 2009 | 46,296 | ||||||||||
| Cape May Limited Partnership(8)† | 10,000 | 3.25 | September 7, 2009 | 10,000 | ||||||||||
| Fulton Financial Corp.(39)† | 2,500 | 3.25 | September 7, 2009 | 2,500 | ||||||||||
| Jonathan Lawrence† | 13,889 | 3.25 | September 7, 2009 | 13,889 | ||||||||||
| Huff Energy Fund LP(16)† | 4,461,100 | 3.00 | July 3, 2012 | 4,461,100 | ||||||||||
| Private Energy Securities, Inc.(40) | 446,110 | 3.00 | July 3, 2012 | 446,110 | ||||||||||
| 10,371,216 | 10,371,216 | |||||||||||||
| (1) | All Warrant exercise prices are expressed in CDN$. |
Natural Persons Exercising Votingand/or Dispositive Power over Common Shares and Warrants
| (1) | Alastair Robertson, former CFO and director of Ausam | |
| (2) | Jon Antoci | |
| (3) | Members of the SKH Group. Shares may be voted by Paul Sigmund, Keith Hatch, and Michael Lance | |
| (4) | Stephen Greer, a former director of Ausam | |
| (5) | George P. Morris | |
| (6) | M. Kent Mitchell | |
| (7) | Richard G. Lummis and Mark G. Avery, officers and directors of Ausam | |
| (8) | Tom Zug | |
| (9) | Stu Flink | |
| (10) | David W. Laughlin | |
| (11) | J. Todd Mitchell | |
| (12) | Joan Tobin | |
| (13) | Gage Jull | |
| (14) | Nathan M. Avery | |
| (15) | Karl E. Bandtel | |
| (16) | William R. Huff | |
| (17) | Jonathan S. Avery | |
| (18) | David W. Laughlin | |
| (19) | Harry H. Cullen | |
| (20) | Peter H. Havens | |
| (21) | J. Todd Mitchell |
70
Table of Contents
| (22) | David W. Laughlin | |
| (23) | Charles B. Musslewhite, Jr | |
| (24) | Owen Pinnell, a former director of Ausam | |
| (25) | Lewis E. Brazelton III | |
| (26) | David W. Laughlin | |
| (27) | Anthony O. Sheppard, a director of ARL | |
| (28) | Joan Tobin | |
| (29) | Mark Strome | |
| (30) | David W. Laughlin | |
| (31) | David W. Laughlin | |
| (32) | David W. Laughlin | |
| (33) | David W. Laughlin | |
| (34) | William M. Hitchcock, Chairman of Ausam | |
| (35) | F. Steven Mooney | |
| (36) | Bo Ostlund | |
| (37) | Cameron O. Smith. COSCO Capital Management LLC received cash and warrants as compensation for investment banking services. | |
| (38) | Orie Lee Tawes, Northeast Securities received warrants as compensation for investment banking services. Some of these warrants were issued to Stephen Kim, Janice Murphy, and Orie Lee Tawes. | |
| (39) | Gage Jull | |
| (40) | Cameron O. Smith. Private Energy Securities, Inc. received cash and warrants as compensation for investment banking services. |
Option Holders
| Maximum Number | ||||||||||||||
| of Common Shares | ||||||||||||||
| Number of | Exercise | Issuable on | ||||||||||||
Name | Options | Price(1) | Expiration Date | Exercise | ||||||||||
| Philip R. Allen | 10,000 | 2.40 | September 5, 2012 | 10,000 | ||||||||||
| Mark G. Avery | 165,000 | 3.75 | August 6, 2009 | 165,000 | ||||||||||
| 70,000 | 6.50 | February 9, 2010 | 70,000 | |||||||||||
| 40,000 | 5.75 | July 28, 2010 | 40,000 | |||||||||||
| 321,167 | 2.375 | April 4, 2012 | 321,167 | |||||||||||
| Ruth Black | 15,000 | 3.75 | August 6, 2009 | 15,000 | ||||||||||
| 15,000 | 5.75 | July 28, 2012 | 15,000 | |||||||||||
| 30,000 | 2.375 | April 4, 2012 | 30,000 | |||||||||||
| Barry Borak | 120,000 | 2.40 | September 5, 2012 | 120,000 | ||||||||||
| Ralph D. Davis | 125,000 | 1.65 | January 25, 2013 | 125,000 | ||||||||||
| Robert Eriksson | 120,000 | 2.40 | September 5, 2012 | 120,000 | ||||||||||
| Keith C. Hill | 20,000 | 5.50 | November 9, 2009 | 20,000 | ||||||||||
| 20,000 | 5.75 | July 28, 2010 | 20,000 | |||||||||||
| 60,000 | 2.375 | April 4, 2012 | 60,000 | |||||||||||
| William M. Hitchcock | 160,000 | 2.40 | September 5, 2012 | 160,000 | ||||||||||
| Robert Keens | 30,000 | 1.65 | January 25, 2013 | 30,000 | ||||||||||
71
Table of Contents
| Maximum Number | ||||||||||||||
| of Common Shares | ||||||||||||||
| Number of | Exercise | Issuable on | ||||||||||||
Name | Options | Price(1) | Expiration Date | Exercise | ||||||||||
| Richard G. Lummis | 105,000 | 3.75 | August 6, 2009 | 105,000 | ||||||||||
| 40,000 | 5.75 | July 28, 2010 | 40,000 | |||||||||||
| 120,000 | 2.375 | April 4, 2012 | 120,000 | |||||||||||
| Frank C. Lytle | 100,000 | 2.40 | September 5, 2012 | 100,000 | ||||||||||
| Arnold P. Milton | 200,000 | 2.375 | April 4, 2012 | 200,000 | ||||||||||
| Graeme G. Phipps | 40,000 | 3.75 | August 6, 2009 | 40,000 | ||||||||||
| 60,000 | 2.375 | April 4, 2012 | 60,000 | |||||||||||
| Todd A. Regalado | 200,000 | 2.375 | April 4, 2012 | 200,000 | ||||||||||
| 60,000 | 2.40 | September 5, 2012 | 60,000 | |||||||||||
| Alastair J. Robertson | 20,000 | 3.75 | August 6, 2009 | 20,000 | ||||||||||
| 30,000 | 3.75 | September 29, 2009 | 30,000 | |||||||||||
| 80,000 | 5.75 | July 28, 2010 | 80,000 | |||||||||||
| 168,084 | 2.375 | April 4, 2012 | 168,084 | |||||||||||
| Anthony O. Sheppard | 20,000 | 3.75 | August 6, 2009 | 20,000 | ||||||||||
| 20,000 | 5.75 | July 28, 2010 | 20,000 | |||||||||||
| 40,000 | 2.375 | April 4, 2012 | 40,000 | |||||||||||
| Edward J. Surka | 20,000 | 6.50 | March 7, 2010 | 20,000 | ||||||||||
| 40,000 | 5.75 | July 28, 2010 | 40,000 | |||||||||||
| 60,000 | 2.375 | April 4, 2012 | 60,000 | |||||||||||
| Curtis E. Weddle III | 200,000 | 2.375 | April 4, 2012 | 200,000 | ||||||||||
| 60,000 | 2.40 | September 5, 2012 | 60,000 | |||||||||||
| John Whiteman | 20,000 | 2.375 | April 4, 2012 | 20,000 | ||||||||||
| 3,024,251 | ||||||||||||||
| (1) | Options are priced in CDN$. |
Debenture Holders
| Number of | ||||||||||||
| Common Shares | ||||||||||||
| Expiration | Issuable on | |||||||||||
Name | Face Value | Date | Conversion | |||||||||
| Huff Energy Fund LP(1) | $ | 26,719,219 | July 3, 2012 | 9,011,502 | (2) | |||||||
| (1) | The Debenture is convertible into Common Shares at a price of CDN$3.00 per Common Share. The exchange rate used for this calculation is $1=CDN$1.01180. |
| (2) | This prospectus is registering 10,657,914 Common Shares issuable on conversion. The difference reflects interest which may accrue on the Debenture through March 31, 2009, and the use of a fixed exchange rate of CDN$1=$0.934. |
PLAN OF DISTRIBUTION
We are registering under this prospectus (i) all of our Common Shares that are now outstanding and (ii) certain Common Shares that will be issued upon exercise of outstanding warrants and options and the convertible Debenture. We will not receive any of the proceeds of the sale of the Common Shares offered by this prospectus. The Common Shares may be sold from time to time to purchasers:
| • | Directly by the selling shareholders; or |
72
Table of Contents
| • | Through underwriters, broker-dealers or agents who may receive compensation in the form of discounts, concessions or commissions from the selling shareholders or the purchasers of the Common Shares from the selling shareholders. |
The selling shareholders and any underwriters, brokers, dealers or agents that participate in the distribution of the Common Shares may be deemed to be “underwriters” within the meaning of the Securities Act, and any discounts, concessions, commissions or fees received by them and any profit on the resale of the common shares sold by them may be deemed to be underwriting discounts and commissions.
If the common shares are sold through underwriters or broker-dealers, the selling shareholders will be responsible for any underwriting discounts or commissions or agent’s commissions.
The common shares may be sold in one or more transactions at:
| • | Fixed prices; | |
| • | Prevailing market prices at the time of sale; | |
| • | Prices related to prevailing market prices; | |
| • | Varying prices determined at the time of sale; or | |
| • | Negotiated prices. |
These sales may be affected in transactions:
| • | On any national securities exchange or quotation service on which the common shares may be listed or quoted at the time of the sale, including the TSXV and the American Stock Exchange; | |
| • | In the over-the-counter market; | |
| • | In transactions otherwise than on such exchanges or services or in the over-the-counter market; | |
| • | Through the writing and exercise of options, whether these options are listed on any options exchange or otherwise; | |
| • | Through the settlement of short sales; or | |
| • | Through any combination of the foregoing. |
These transactions may include block transactions or crosses. Crosses are transactions in which the same broker acts as an agent on both sides of the trade. In connection with sales of the Common Shares, the selling shareholders may enter into hedging transactions with broker-dealers. These broker-dealers may in turn engage in short sales of the Common Shares in the course of hedging their positions. The selling shareholders may also sell the Common Shares short and deliver Common Shares to close out short positions; provided that, the short sales are made after the registration statement is declared effective, or loan or pledge Common Shares to broker-dealers that in turn may sell the Common Shares.
The selling shareholders may pledge or grant a security interest in some or all of the Common Shares owned by them, and if they default in the performance of their secured obligations, the pledgees or secured parties may offer and sell the Common Shares from time to time pursuant to the prospectus. The selling shareholders also may transfer or donate the Common Shares in other circumstances, in which case the transferees, donees or other successors in interest will be the selling beneficial owners for purposes of the prospectus.
To our knowledge, there are currently no plans, arrangements or understandings between any selling shareholders and any underwriter, broker-dealer or agent regarding the sale of the Common Shares by the selling shareholders. Selling shareholders may choose not to sell any or all of the Common Shares offered by them pursuant to this prospectus. In addition, we cannot assure you that any such selling shareholder will not transfer, devise or gift the Common Shares offered hereby by other means not described in this prospectus. Any Common Shares that qualify for sale pursuant to Rule 144 or Rule 144A under the Securities Act may be sold under Rule 144 or Rule 144A rather than pursuant to this prospectus. There can be no assurance that any
73
Table of Contents
selling shareholder will sell any or all of the Common Shares registered pursuant to this registration statement of which this prospectus forms a part.
Our Common Shares are listed for trading on the TSXV under the symbol “AZE.” We will make an application to be traded in the United States on the American Stock Exchange, but cannot be certain that our application will be granted.
The selling shareholders and any other person participating in such distribution will be subject to applicable provisions of the Exchange Act and the rules and regulations promulgated thereunder, including Regulation M, which may limit the timing of purchases and sales of any of Common Shares by the selling shareholders and any other participating person. In addition, Regulation M may restrict the ability of any person engaged in the distribution of the Common Shares to engage in market-making activities with respect to the Common Shares. This may affect the marketability of the Common Shares and the ability of any person or entity to engage in market-making activities with respect to Common Shares.
To the best of our knowledge, no selling shareholders that are affiliated with a registered broker-dealer acquired securities in a manner other than in the ordinary course of its business or, at the time of acquisition, with any arrangement or understanding with any person to distribute the securities. Pembroke Capital LLC has advised us that it is a U.S. registered broker-dealer; however, it received these securities as compensation for investment banking services.
We have agreed to pay substantially all of the expenses incidental to the registration of the Common Shares covered by this prospectus to the public other than commissions, fees and discounts of underwriters, brokers, dealers and agents.
To comply with the securities laws of some jurisdictions, if applicable, the holders of Common Shares may offer and sell the Common Shares in such jurisdictions only through registered or licensed brokers or dealers. In addition, under certain circumstances, in some jurisdictions the Common Shares may not be offered or sold unless they have been registered or qualified for sale in the applicable jurisdiction or an exemption from registration or qualification requirements is available and is complied with.
If required, at the time of a particular offering of Common Shares by a selling shareholder, a supplement to this prospectus will be circulated setting forth the name or names of any underwriters, broker-dealers or agents, any discounts, commissions or other terms constituting compensation for underwriters and any discounts, commissions or concessions allowed or reallowed or paid to agents or broker-dealers. We have no obligation to any selling shareholder to arrange an underwriting, or assist in providing for any proposed sale, of any of the Common Shares offered hereby.
We have agreed with some of the selling shareholders to keep the registration statement of which this prospectus forms a part effective for specified periods of time or until the occurrence of certain events. We may under certain circumstances suspend the use of this prospectus, upon notice to the selling shareholders, to update the registration statement of which this prospectus forms a part with periodic information or material non-public information as required by the Securities Act. We have agreed with some of the selling shareholders to use our reasonable efforts to limit these suspended periods to those required by the Securities Act or limit them to contractually specified limits.
Once sold under the registration statement of which this prospectus forms a part, the Common Shares will be freely tradeable in the hands of persons other than our affiliates.
CERTAIN RELATIONSHIPS AND RELATED PERSON TRANSACTIONS
None of our directors or executive officers, nor any associate of any such director or executive officer is indebted to us, nor has any indebtedness of such persons been the subject of a guarantee, support agreement, letter of credit or other similar arrangement or understanding provided by us.
74
Table of Contents
Certain of our directors or executive officers, or their known associates or affiliates, had a material interest, direct or indirect, in transactions since the beginning of our last financial year which have materially affected us.
Mr. William M. Hitchcock, Chairman of the Board of Directors, was instrumental in presenting the SKH Transaction to us as one of several possibilities. At the time, he was not an affiliate or control person of Ausam. Once our management and board of directors had determined to proceed with the transaction, Mr. Hitchcock, through a company controlled by him, participated in and acted as a broker for a financing that was completed on October 2, 2006 and also participated in and acted as a broker for three financings completed on February 8, 2007 and, either directly or through companies controlled by him, earned commissions, fees and broker warrants on funds raised by him. A summary of these transactions follows:
| Number of | ||||||||||||||||||
| Common | ||||||||||||||||||
| Shares | ||||||||||||||||||
| Acquired/ | Common Share | |||||||||||||||||
| Amount | Warrants | Commissions/ | Broker | |||||||||||||||
Date | Type of Share/Nature of Transaction | of facility | Acquired | Fees/Dividends | Warrants | |||||||||||||
| October 2, 2006 | Common Share unit offering | 279,955 | — | $ | 45,000 | (1) | — | |||||||||||
| February 8, 2007 | Common Share unit offering | 370,370 | 309,946 | (4) | $ | 339,105 | (1) | 623,806 | (1)(4) | |||||||||
| February 8, 2007 | First Preferred Shares, Series 2 unit offering | 2,166,666 | 1,148,333 | (5) | $ | 195,000 | (1) | 320,000 | (1)(5) | |||||||||
| February 8, 2007 | Convertible debt facility | $ | 12,800,000 | — | $ | 700,000 | (2) | — | ||||||||||
| February 8, 2007 | Acquisition success fee | 117,647 | (3) | — | — | — | ||||||||||||
| February 26. 2007 | Redemption of First Preferred Shares, Series 2 | (500,000 | ) | — | — | — | ||||||||||||
| May 14, 2007 | Quarterly Dividend on First Preferred Shares, Series 2 | — | — | $ | 103,452 | — | ||||||||||||
| July 8, 2007 | Redemption of First Preferred Shares, Series 2 | (1,666,666 | ) | |||||||||||||||
| (1) | Paid/issued to Pembroke Financial Partners, LLC. | |
| (2) | Paid to Pembroke Capital, LLC. | |
| (3) | Mr. Hitchcock earned a fee in connection with the Acquisition in the amount of $300,000, payable in 117,647 Common Shares of the Corporation. | |
| (4) | Exercisable at CDN$3.25 per Common Share until February 8, 2009. | |
| (5) | Exercisable at CDN$3.50 per Common Share until February 8, 2009. |
As at December 31, 2005, the loan receivable comprised CDN$367,034 of advances to Mark G. Avery, Chief Executive Officer and a director. A promissory note, secured by shares of the Company, was signed for the indebtedness, which specified interest at bank prime and full repayment by December 31, 2005. During 2006, CDN$19,310 (2005 — CDN$4,889) of interest was charged on this loan, which is included in interest income. A new promissory note in the amount of CDN$397,087, secured by shares of the Company, was signed on March 31, 2006 for the indebtedness outstanding at that time, which specifies interest at bank prime and full repayment by September 20, 2006. We agreed to extend the repayment terms until December 31, 2006 and during December 2006, the loan was fully repaid.
MATERIAL INCOME TAX CONSEQUENCES
A brief description of certain provisions of the tax treaty between Canada and the United States is included below, together with a brief discussion of certain taxes, including withholding provisions, to which U.S. shareholders are subject under existing laws and regulations of Canada and the United States. The consequences, if any, of state and local taxes are not considered. The following information is general and security holders should seek the advice of their own tax advisors, tax counsel or accountants with respect to the applicability or effect on their own individual circumstances of not only the matters referred to herein, but also any state or local taxes.
75
Table of Contents
Canadian Federal Income Tax Consequences Associated with our Common Shares
General. The following is a summary of the principal Canadian federal income tax consequences generally applicable in respect of the ownership of our common shares. The tax consequences to any particular holder of our common shares will vary according to the status of that holder as an individual, trust, corporation or member of a partnership, the jurisdiction in which that holder is subject to taxation, the place where that holder is resident and, generally, that holder’s particular circumstances. This summary is applicable only to holders who are resident in the United States and are subject to United States tax, are not (and have never been) resident in Canada, hold their shares as capital property and do not (and will not) use or hold their shares in, or in the course of, carrying on business in Canada. For purposes of this discussion, a non-resident holder means a holder of our common shares who does not reside in Canada.
The following general discussion in respect of taxation is based upon management’s understanding of the rules. No opinion was requested by us, or has been provided by our counsel or auditors, with respect to the Canadian income tax consequences described in the following discussion.
Dividend Withholding. We have not paid dividends on our common shares in any of the past three years and have no plans to pay dividends in the foreseeable future. Canadian federal tax legislation would require a 25% withholding from any dividends paid or deemed to be paid to our non-resident shareholders. However, shareholders resident in the United States and subject to United States tax would generally have this rate reduced to 15% pursuant to the tax treaty between Canada and the United States. The withholding tax rate on the gross amount of dividends is reduced to 5% if the beneficial owner of the dividend is a U.S. corporation which owns at least 10% of our voting stock.
The amount of stock dividends paid to non-residents of Canada would be subject to withholding tax at the same rate as cash dividends. The amount of a stock dividend (for tax purposes) would generally be equal to the amount by which ourpaid-up capital had increased by reason of the payment of such dividend. We will furnish additional tax information to shareholders in the event of such a stock dividend.
Capital Gains. A non-resident who holds common shares as capital property generally will not be subject to Canadian taxes on capital gains realized on the disposition of such shares unless the shares are “taxable Canadian property” within the meaning of the Income Tax Act (Canada), and no relief is afforded under any applicable tax treaty. Common shares listed on a prescribed stock exchange generally will not be taxable Canadian property of a shareholder unless, at any time during the five-year period immediately preceding a disposition of such shares, not less than 25% of the issued shares of any class or series of our capital stock belonged to persons with whom the shareholder did not deal at arm’s length, or to the shareholder together with such persons or unless the shares were acquired by the holder in one of several tax deferred exchanges for shares which were themselves taxable Canadian property.
A non-resident shareholder whose common shares constitute taxable Canadian property and who is a resident of the United States for purposes of the tax treaty between Canada and the United States generally would be exempt from Canadian tax on any capital gain realized on a disposition of those shares in any event, provided the shares do not derive their value principally from Canadian real property (including Canadian resource properties). Management is of the view that common shares do not derive their value principally from Canadian real property.
United States Federal Income Tax Consequences Associated with our Common Stock
The following is a general discussion of certain material United States federal income tax consequences that may apply to a holder of our common shares. This discussion is based on the Internal Revenue Code of 1986, as amended, which we refer to as the Code, Treasury Department regulations promulgated under the Code, published Internal Revenue Service, or IRS, rulings, published administrative positions of the IRS, and court decisions that are currently applicable, any or all of which could materially and adversely change at any time, possibly on a retroactive basis. In addition, the discussion does not consider the potential effects, both adverse and beneficial, of any proposed legislation which, if enacted, could be applied at any time, possibly on a retroactive basis. The following discussion is not intended to be, nor should it be construed to be, legal or
76
Table of Contents
tax advice to any holder or prospective holder of our common shares. No opinion was requested by us, or is provided by our counsel, with respect to the United States federal income tax consequences described in the following discussion. Accordingly, holders and prospective holders of our common shares should consult their own tax advisors about the United States federal, state, local andnon-U.S. tax consequences of purchasing, owning and disposing of our common shares.
United States Federal Income Taxation of U.S. Holders
In General. As used in this discussion, a “U.S. Holder” means a holder of our common shares who is (1) a citizen or individual resident of the United States, (2) a corporation or entity taxable as a corporation for United States federal income tax purposes that is created or organized in or under the laws of the United States or of any political subdivision thereof or the District of Columbia, (3) an estate whose income is taxable in the United states irrespective of source or (4) a trust if a court within the United States is able to exercise primary jurisdiction over the administration of the trust and one or more United States persons have the authority to control all substantial decisions of the trust. An individual may be treated as a resident of the United States for federal income tax purposes with respect to a calendar year if the individual is present in the United States on at least 31 days in that calendar year and at least 183 days during that calendar year and the two preceding calendar years (counting, for this purpose, each day present in the first preceding year as1/3 of a day and each day present in the second preceding year as1/6 of a day).
This summary does not address the tax consequences to, and U.S. Holder does not include, persons subject to specific provisions of federal income tax law, such as tax-exempt organizations, qualified retirement plans, individual retirement accounts and other tax-deferred accounts, financial institutions, insurance companies, real estate investment trusts, regulated investment companies, broker-dealers, persons or entities that have a “functional currency” other than the U.S. Dollar, shareholders subject to the alternative minimum tax, shareholders who hold our common shares as part of a straddle, hedging or a conversion transaction, constructive sale or other arrangement involving more than one position, partnerships and other pass-through entities and persons holding an interest in such entities, and shareholders who acquired their common shares through the exercise of employee stock options or otherwise as compensation for services. This summary is limited to U.S. Holders who own our common shares as capital assets (generally, property held for investment). This summary does not address the consequences to a person or entity holding an interest in a shareholder or the consequences to a person of the ownership, exercise or disposition of any options, warrants or other rights to acquire our common shares. If a partnership (including an entity treated as a partnership for United States federal income tax purposes) holds our common shares, the tax treatment of a partner generally will depend upon the status of the partner and upon the activities of the partnership. If you are a partnership, or a partner in a partnership, holding common shares, you should consult your tax advisor.
Distributions on Our Common Shares. We have never paid any cash dividends on our common shares and do not anticipate paying any cash dividends in the foreseeable future. However, if U.S. Holders receive dividend distributions (including constructive dividends) with respect to our common shares such holders would be required to include in gross income for United States federal income tax purposes the gross amount of such distributions equal to the U.S. Dollar value of such distributions on the date of receipt (based on the exchange rate on such date) to the extent that we have current or accumulated earnings and profits, without reduction for any Canadian income tax withheld from such distributions. Such Canadian tax withheld may be credited, subject to certain limitations, against the U.S. Holder’s United States federal income tax liability or, alternatively, may be deducted in computing the U.S. Holder’s United States federal taxable income by those who itemize deductions. See “Foreign Tax Credit”, below. To the extent that distributions exceed our current or accumulated earnings and profits, they will be treated first as a return of capital up to the U.S. Holder’s adjusted basis in our common shares (and not subject to tax) and thereafter as gain from the sale or exchange of the common shares (which is taxable as capital gain). Subject to certain exceptions, dividends paid on our common shares generally will not be eligible for the dividends-received deduction available to corporations receiving dividends from certain United States corporations.
Dividends, if any, paid on our common shares to a U.S. Holder who is an individual, trust or estate (a “U.S. Individual Holder”) will be treated as “qualified dividend income” that is taxable to such U.S. Individual
77
Table of Contents
Holder at preferential rates (through 2010) provided that (i) we are eligible for the benefits of a comprehensive income tax treaty with the United States that has been determined to be satisfactory for this purpose (theU.S.-Canadian Treaty is included for this purpose); (ii) we are not a passive foreign investment company or “PFIC” for the taxable year during which the dividend is paid or the immediately preceding taxable year (which we do not believe we are or have been or will be); (iii) the U.S. Individual Holder has owned the common shares for more than 60 days in the121-day period beginning 60 days before the date on which the common shares become ex-dividend; and (iv) the U.S. Individual Holder is not under an obligation to make related payments with respect to positions in substantially similar or related property.
Special rules may apply to any “extraordinary dividend” paid by us. An extraordinary dividend is, generally, a dividend equal to or in excess of 10 percent of a shareholder’s adjusted basis (or fair market value in certain circumstances) in a share of common stock. If we pay an “extraordinary dividend” on our common shares that is treated as “qualified dividend income”, then any loss derived by a U.S. Individual Holder from the sale or exchange of such common shares will be treated as long-term capital loss to the extent of such dividend.
Foreign Tax Credit. A U.S. Holder who pays (or has withheld from distributions) Canadian income tax with respect to the ownership of our common shares may be entitled, at the U.S. Holder’s election, to either a deduction or a tax credit for such foreign tax paid or withheld. Furthermore, a U.S. Holder that is a domestic corporation that owns 10% or more of our voting stock may be eligible to claim a deemed paid foreign tax credit based on thenon-U.S. income taxes paid by us. Generally, it will be more advantageous to claim a credit because a credit reduces United States federal income taxes on a dollar-for-dollar basis, while a deduction merely reduces the taxpayer’s income subject to tax. This election is made on ayear-by-year basis and applies to all foreign income taxes (or taxes in lieu of income tax) paid by (or withheld from) the U.S. Holder during the year.
There are significant and complex limitations which apply to the foreign tax credit, among which is the general limitation that the credit cannot exceed the proportionate share of the U.S. Holder’s United States federal income tax liability that the U.S. Holder’s foreign source income bears to the U.S. Holder’s worldwide taxable income. There are further limitations based on the type of income. In addition, any foreign tax credits may be subject to special treaty limitations. The availability of the foreign tax credit, the deemed paid foreign tax credit, and the application of the limitations on the credit are fact-specific and holders and prospective holders of our common shares should consult their own tax advisors regarding their individual circumstances.
Sale, Exchange or other Disposition of Common Shares. Assuming we do not constitute a PFIC for any taxable year, a U.S. Holder generally will recognize taxable gain or loss upon a sale, exchange or other disposition of our common shares in an amount equal to the difference between the amount realized by the U.S. Holder from such sale, exchange or other disposition and the U.S. Holder’s tax basis in such shares. Subject to the discussion of extraordinary dividends above, such gain or loss will be treated as long-term capital gain or loss if the U.S. Holder’s holding period is greater than one year at the time of the sale, exchange or other disposition. Preferential tax rates for long term capital gains may apply to U.S. Individual Holders who satisfy minimum holding period and other requirements. There are currently no preferential tax rates for long term capital gains for a U.S. Holder that is a corporation. A U.S. Holder’s ability to deduct capital losses is subject to certain limitations.
Special Rules. In the following circumstances, the above sections of the discussion may not describe the United States federal income tax consequences resulting from the holding, receipt of dividends and disposition of common shares. Management does not believe that we are a “PFIC” or a “controlled foreign corporation” as those terms are defined below.
Passive Foreign Investment Company. Anon-U.S. entity treated as a corporation for United States federal income tax purposes will be a PFIC for any taxable year in which, after taking into account the income and assets of the corporation and certain subsidiaries pursuant to a “look through” rule, either (1) 75% or more of its gross income is “passive income” such as interest, dividends and certain rents and royalties or (2) at least 50% of the average value of its assets is attributable to assets that produce passive income or are held for the production of passive income. Management does not believe that we are a PFIC, or will be a
78
Table of Contents
PFIC in the future, because we are engaged primarily in the business of natural gas and oil exploration and development. We have not received 75% or more of our gross income from passive sources, nor has 50% or more of the fair market value of our assets been held for the production of passive income. The taxation of a U.S. shareholder who owns stock in a PFIC is extremely complex and is beyond the scope of this discussion. U.S. persons should consult with their own tax advisors regarding the impact of these rules if we are or were to become a PFIC.
Controlled Foreign Corporation. A controlled foreign corporation or CFC is a foreign corporation more than 50% of the stock of which, by vote or value, is owned, directly, indirectly or constructively, by one or more U.S. shareholders who each owns, directly, indirectly or constructively, 10% or more of the total combined voting power of all classes of stock of the foreign corporation (each a “CFC Shareholder”). If we were a CFC, a CFC Shareholder would be treated as receiving as current dividends that CFC Shareholder’s allocable share of certain types of income earned by us. Additionally, such a CFC Shareholder would recognize ordinary income, rather than capital gain, on the sale of its common shares to the extent of that CFC Shareholder’s allocable share of our earnings and profits. Management does not believe that we are a CFC because shareholders who directly, indirectly or constructively control 10% or more of the total voting power of our outstanding common shares do not own more than 50% of our common shares.
United States Federal Income Taxation ofNon-U.S. Holders
In General. For purposes of this discussion, a beneficial owner of our common shares that is not a U.S. Holder (other than a partnership or entity treated as a partnership for United States federal income tax purposes) is aNon-U.S. Holder.
Distributions on our Common Shares. Distributions we pay to aNon-U.S. Holder will not be subject to United States federal income tax or withholding tax if theNon-U.S. Holder is not engaged in a U.S. trade or business. If theNon-U.S. Holder is engaged in a U.S. trade or business, distributions we pay will be subject to United States federal income tax at regular graduated rates if those distributions are effectively connected with thatNon-U.S. Holder’s U.S. trade or business and, if an income tax treaty applies, are attributable to a permanent establishment maintained by thatNon-U.S. Holder in the United States. In addition, a “branch profits tax” may be imposed at a 30% rate, or a lower rate under an applicable income tax treaty, on dividends received by anon-U.S. Holder that is a corporation that are effectively connected with its conduct of a trade or business in the United States.
Sale, Exchange or other Disposition of Common Shares. Non-U.S. Holders generally will not be taxed on any gain recognized on a disposition of our common stock unless the gain is effectively connected with theNon-U.S. Holder’s conduct of a trade or business in the United States and, if an income tax treaty applies, is attributable to a permanent establishment maintained by thenon-U.S. Holder in the United States. If theNon-U.S. Holder is engaged in a U.S. trade or business and the gain is effectively connected with that trade or business (and if a tax treaty applies, is attributable to a permanent establishment maintained by suchNon-U.S. Holder in the United States), such gain will be subject to United States federal income tax at regular graduated rates and, if theNon-U.S. Holder is a corporation, the branch profits tax described above may also apply. ANon-U.S. Holder who is an individual and who is present in the United States for 183 days or more in the taxable year of the disposition and meets other requirements also will be subject to United States federal income tax on gain recognized on a disposition of our common stock.
Information Reporting and Backup Withholding Tax. In general, dividend payments or other taxable distributions made within the United States will be subject to information reporting and U.S. backup withholding tax if a U.S. Individual Holder fails to provide an accurate taxpayer identification number certified under penalties of perjury as well as certain other information on an IRSForm W-9, or otherwise establishes an exemption from backup withholding.
Non-U.S. Holders may be required to establish their exemption from information reporting and backup withholding by certifying theirnon-U.S. status under penalties of perjury on an IRSForm W-8BEN,W-8ECI orW-8IMY as applicable.
79
Table of Contents
If aNon-U.S. Holder sells shares to or through the U.S. office of a U.S. or foreign broker, the payment of the proceeds generally will be subject to information reporting requirements and backup withholding unless theNon-U.S. Holder properly certifies itsnon-U.S. status under penalties of perjury or otherwise establishes an exemption. Information reporting requirements and backup withholding generally will not apply to any payment of the proceeds of the sale of common shares effected outside the United States by a foreign office of a broker; however, U.S. information reporting requirements (but not backup withholding requirements) will apply to payment of the sales proceeds if the broker is a United States person or has certain other contacts with the United States.
Backup withholding is not an additional tax. Rather, a holder generally may obtain a refund of any amounts withheld under the backup withholding rules that exceed such holder’s United States federal income tax liability by timely filing a properly completed claim for refund with the U.S. Internal Revenue Service.
LEGAL MATTERS
The validity of the common shares offered by this prospectus will be passed upon for us by Bennett Jones LLP, Calgary, Alberta, Canada.
EXPERTS
Our consolidated financial statements as of December 31, 2007 and December 31, 2006 and each of the three years then ended included in this prospectus have been audited by KPMG LLP, chartered accountants, as stated in their report appearing herein and elsewhere in this registration statement, and have been so included in reliance upon the report of such firm given upon their authority as experts in auditing and accounting.
Information included in this prospectus regarding our estimated proved reserves of oil and natural gas is based upon a report by GLJ Petroleum Consultants Ltd. based upon guidelines established by the United States Securities and Exchange Commission in reliance on the authority of GLJ Petroleum Consultants Ltd. as experts in these matters.
WHERE YOU CAN FIND MORE INFORMATION
We have filed with the SEC a registration statement onForm S-1 regarding the common shares. This prospectus does not contain all of the information found in the registration statement. For further information regarding us and the common shares offered by this prospectus, you may desire to review the full registration statement, including its exhibits. The registration statement, including the exhibits, may be inspected and copied at the public reference facilities maintained by the SEC at 100 F Street, N.E, Room 1580, Washington, D.C. 20549. Copies of this material can also be obtained upon written request from the Public Reference Section of the SEC at 100 F Street, N.E, Room 1580, Washington, D.C. 20549, at prescribed rates or from the SEC’s web site on the Internet athttp://www.sec.gov. Please call the SEC at1-800-SEC-0330 for further information on public reference rooms.
As a result of the offering, we will file with or furnish to the SEC periodic reports and other information. These reports and other information may be inspected and copied at the public reference facilities maintained by the SEC or obtained from the SEC’s website as provided above. Our website on the Internet is located athttp://www.ausamenergy.com and we expect to make our periodic reports and other information filed with or furnished to the SEC available, free of charge, through our website, as soon as reasonably practicable after those reports and other information are electronically filed with or furnished to the SEC. Information on our website or any other website is not incorporated by reference into this prospectus and does not constitute a part of this prospectus.
80
Table of Contents
Additional information can also be found on the Internet athttp://www.sedar.com, which contains most filings made with Canadian Securities Administrators. You should be aware, though, that these filings were generally prepared in accordance with Canadian GAAP and that share numbers may not reflect the 5:1 consolidation that took effect on September 26, 2007.
We intend to furnish or make available to our shareholders annual reports containing our audited financial statements prepared in accordance with U.S. GAAP. We also intend to furnish or make available to our shareholders quarterly reports containing our unaudited interim financial information, including the information required byForm 10-Q, for the first three fiscal quarters of each fiscal year.
81
Table of Contents
AUSAM ENERGY CORPORATION
AUSAM ENERGY CORPORATION — Consolidated Financial Statements For the Years ended December 31, 2007, 2006, and 2005 | ||||
| F-3 | ||||
| F-4 | ||||
| F-5 | ||||
| F-7 | ||||
| F-8 | ||||
| F-9 | ||||
AUSAM ENERGY CORPORATION — Consolidated Financial Statements For the Nine Months Ended September 30, 2007 (Restated) and 2006 | ||||
| F-31 | ||||
| F-32 | ||||
| F-33 | ||||
| F-34 | ||||
| F-35 | ||||
| F-36 |
F-1
Table of Contents
AUSAM ENERGY CORPORATION
CONSOLIDATED FINANCIAL STATEMENTS
FOR THE YEARS ENDED DECEMBER 31, 2007, 2006, and 2005
F-2
Table of Contents
Report of Independent Registered Public Accounting Firm
The Board of Directors and Shareholders
Ausam Energy Corporation:
We have audited the accompanying consolidated balance sheets of Ausam Energy Corporation and subsidiaries as of December 31, 2007 and 2006, and the related consolidated statements of operations and accumulated deficit, comprehensive loss, changes in shareholders’ equity, and cash flows for each of the years in the three-year period ended December 31, 2007. These consolidated financial statements are the responsibility of the Company’s management. Our responsibility is to express an opinion on these consolidated financial statements based on our audits. As discussed in note 18 to the consolidated financial statements, the Company has restated its earning per share disclosure to correct an error in accounting principle.
We conducted our audits in accordance with the standards of the Public Company Accounting Oversight Board (United States). Those standards require that we plan and perform the audit to obtain reasonable assurance about whether the financial statements are free of material misstatement. An audit includes examining, on a test basis, evidence supporting the amounts and disclosures in the financial statements. An audit also includes assessing the accounting principles used and significant estimates made by management, as well as evaluating the overall financial statement presentation. We believe that our audits provide a reasonable basis for our opinion.
In our opinion, the consolidated financial statements referred to above present fairly, in all material respects, the financial position of Ausam Energy Corporation and subsidiaries as of December 31, 2007 and 2006, and the results of their operations and their cash flows for each of the years in the three-year period ended December 31, 2007, in conformity with U.S. generally accepted accounting principles.
The accompanying consolidated financial statements have been prepared assuming that the Company will continue as a going concern. As discussed in note 1 to the consolidated financial statements, the Company has suffered recurring losses from operations and has a net capital deficiency that raise substantial doubt about its ability to continue as a going concern. Management’s plans in regard to these matters are also described in note 1. The consolidated financial statements do not include any adjustments that might result from the outcome of this uncertainty.
As discussed in note 18, the Company has restated the basic and diluted earnings per share disclosure to include the redemption price of preferred shares in excess of cost and the dividends on preferred shares in the net loss per share before cumulative affect of change in accounting principle and net loss per common share. This restatement was required to correct an error in accounting principle in previously filed financial statements.
/s/ KPMG LLP
Calgary, Canada
April 8, 2008 except as to Note 18
which is as of May 2, 2008
F-3
Table of Contents
Consolidated Financial Statements of
AUSAM ENERGY CORPORATION
Consolidated Balance Sheets
(in US dollars)
AUSAM ENERGY CORPORATION
Consolidated Balance Sheets
(in US dollars)
| December 31, | December 31, | |||||||
| 2007 | 2006 | |||||||
ASSETS | ||||||||
Current | ||||||||
| Cash and cash equivalents | $ | 9,397,522 | $ | 2,865,157 | ||||
| Accounts receivable | 484,225 | 110,108 | ||||||
| Prepaid expenses and deposits | 159,327 | 83,257 | ||||||
| 10,041,074 | 3,058,522 | |||||||
| Deferred Costs (note 6) | — | 683,956 | ||||||
| Deferred financing costs (note 10) | 1,839,907 | — | ||||||
| Advances to joint venture partners, net | — | 412,079 | ||||||
| Oil and gas properties utilizing the full cost method of accounting: | ||||||||
| Proved and depletable oil and gas properties, net of depletion (note 3) | 2,811,049 | — | ||||||
| Unevaluated oil and gas properties, not subject to depletion, net of impairment (note 3) | 43,256,628 | 8,670,586 | ||||||
| Other property and equipment (note 3) | 229,456 | 90,125 | ||||||
| $ | 58,178,114 | $ | 12,915,268 | |||||
| LIABILITIES AND SHAREHOLDERS’ EQUITY | ||||||||
Current | ||||||||
| Accounts payable and accrued liabilities | ||||||||
| Legal and professional | $ | 829,851 | $ | 400,777 | ||||
| Trade | 1,336,476 | 959,782 | ||||||
| 2,166,327 | 1,360,559 | |||||||
| Advances from joint venture partners, net | 34,871 | — | ||||||
| Asset retirement obligations (note 7) | 180,726 | 166,185 | ||||||
| Convertible debentures (note 9) | 17,216,340 | — | ||||||
Shareholders’ Equity | ||||||||
| Preferred shares, no par value, unlimited; shares issued and outstanding: nil (note 8b) | — | — | ||||||
| Common shares (note 8a) | 67,531,696 | 25,923,002 | ||||||
| No par value, shares authorized: unlimited; shares issued and outstanding: 30,368,335 (December 31, 2006 — 10,939,553) | ||||||||
| Share purchase warrants (note 8c) | 11,118,660 | 272,592 | ||||||
| Additional paid-in capital (note 8e) | 9,257,863 | 4,358,771 | ||||||
| Accumulated other comprehensive income | 2,927,375 | 734,619 | ||||||
| Deficit | (52,255,744 | ) | (19,900,460 | ) | ||||
| 38,579,850 | 11,388,524 | |||||||
| $ | 58,178,114 | $ | 12,915,268 | |||||
| Subsequent events (note 17) | ||||||||
| Commitments (note 15) | ||||||||
See accompanying notes to the consolidated financial statements.
F-4
Table of Contents
Consolidated Financial Statements of
AUSAM ENERGY CORPORATION
Consolidated Statements of Operations and Accumulated Deficit
(in US dollars)
AUSAM ENERGY CORPORATION
Consolidated Statements of Operations and Accumulated Deficit
(in US dollars)
| Year Ended | Year Ended | Year Ended | ||||||||||
| December 31, | December 31, | December 31, | ||||||||||
| 2007 | 2006 | 2005 | ||||||||||
| Oil and gas revenue | $ | 371,921 | $ | — | $ | — | ||||||
| Operating costs before depreciation, depletion and amortization | (82,185 | ) | — | — | ||||||||
| Depreciation, depletion and amortization | (19,915,907 | ) | (37,054 | ) | (27,930 | ) | ||||||
| Asset write-down | — | (1,535,208 | ) | (5,508,975 | ) | |||||||
| General and administration expenses | ||||||||||||
| (including non-cash compensation of $1,487,111 (2006 — $266,918, 2005 — $993,193) | (8,553,588 | ) | (2,480,065 | ) | (2,820,347 | ) | ||||||
| Due diligence and acquisition related expenses | — | — | (1,367,961 | ) | ||||||||
| Financing | (938,418 | ) | — | — | ||||||||
| Interest on convertible debentures | (1,132,722 | ) | — | — | ||||||||
| Accretion of convertible debentures | (425,248 | ) | — | — | ||||||||
| Interest | (4,729 | ) | — | — | ||||||||
| Interest and other income | 530,734 | 252,003 | 280,485 | |||||||||
| Net loss before cumulative effect of change in accounting principle | (30,150,143 | ) | (3,800,324 | ) | (9,444,728 | ) | ||||||
| Cumulative effect of adoption of SFAS 123R (Note 2(h)) | — | 31,240 | — | |||||||||
| Net loss | (30,150,143 | ) | (3,769,084 | ) | (9,444,728 | ) | ||||||
| Redemption of preferred shares in excess of cost | (1,868,204 | ) | — | — | ||||||||
| Dividend on preferred shares | (336,937 | ) | — | — | ||||||||
| Net loss applicable to common stock | $ | (32,355,284 | ) | $ | (3,769,084 | ) | $ | (9,444,728 | ) | |||
| Deficit, beginning of year | ||||||||||||
| Deficit, beginning of year | $ | (19,900,460 | ) | $ | (16,131,376 | ) | $ | (6,686,648 | ) | |||
| Net loss | (30,150,143 | ) | (3,769,084 | ) | (9,444,728 | ) | ||||||
| Redemption price of preferred shares in excess of cost | (1,868,204 | ) | — | |||||||||
| Dividend on preferred shares | (336,937 | ) | — | |||||||||
| Deficit, end of year | $ | (52,255,744 | ) | $ | (19,900,460 | ) | $ | (16,131,376 | ) | |||
| Net loss per share before cumulative effect of change in accounting principle | ||||||||||||
| Basic and diluted Restated (Note 18) | $ | (1.15 | ) | $ | (0.37 | ) | $ | (1.05 | ) | |||
| Net loss per common share | ||||||||||||
| Basic and diluted Restated (Note 18) | $ | (1.15 | ) | $ | (0.37 | ) | $ | (1.05 | ) | |||
| Weighted average number of common shares outstanding | ||||||||||||
| Basic | 28,113,395 | 10,283,303 | 8,962,646 | |||||||||
| Diluted | 28,113,395 | 10,283,303 | 8,962,646 | |||||||||
F-5
Table of Contents
Consolidated Statements of Comprehensive Loss
(in US dollars)
(in US dollars)
Year Ended December 31 | 2007 | 2006 | 2005 | |||||||||
| Net Loss | $ | (30,150,143 | ) | $ | (3,769,084 | ) | $ | (9,444,728 | ) | |||
| Unrealized gains (loss) recorded on translation of assets and liabilities of foreign operations | 2,192,756 | 877,961 | 230,940 | |||||||||
| Comprehensive loss | $ | (27,957,387 | ) | $ | (2,891,123 | ) | $ | (9,213,788 | ) | |||
See accompanying notes to the consolidated financial statements.
F-6
Table of Contents
Consolidated Financial Statements of
AUSAM ENERGY CORPORATION
Consolidated Statements of Cash Flows
(in US dollars)
AUSAM ENERGY CORPORATION
Consolidated Statements of Cash Flows
(in US dollars)
| Year Ended | Year Ended | Year Ended | ||||||||||
| December 31, | December 31, | December 31, | ||||||||||
| 2007 | 2006 | 2005 | ||||||||||
| Cash provided by (used for): | ||||||||||||
Operating activities | ||||||||||||
| Net Loss | $ | (30,150,143 | ) | $ | (3,769,084 | ) | $ | (9,444,728 | ) | |||
| Cumulative change in accounting principle | — | (31,240 | ) | — | ||||||||
| Add (deduct) non-cash items: | ||||||||||||
| Depreciation, depletion and accretion | 19,915,907 | 37,054 | 27,930 | |||||||||
| Asset write down | — | 1,535,208 | 5,508,975 | |||||||||
| Stock based compensation | 1,487,111 | 266,918 | 993,193 | |||||||||
| Accretion of long term debt | 425,248 | — | — | |||||||||
| Interest added to principal | 1,132,722 | — | — | |||||||||
| Changes in non-cash operating working capital | ||||||||||||
| Interest and accounts receivable | (374,117 | ) | (87,962 | ) | 45,467 | |||||||
| Inventory | — | 7,232 | 456 | |||||||||
| Prepaid expenses and deposits | (76,070 | ) | (76,220 | ) | (63 | ) | ||||||
| Accounts payable and accrued liabilities | 887,819 | (259,325 | ) | 201,814 | ||||||||
| Cash flows provided by (used for) operating activities | (6,751,524 | ) | (2,377,419 | ) | (2,666,956 | ) | ||||||
Financing activities | ||||||||||||
| Proceeds from issue of common shares and warrants | 17,440,013 | 1,568,875 | 8,944,440 | |||||||||
| Proceeds from issue of preferred shares and warrants | 11,980,451 | — | — | |||||||||
| Share issue costs | (2,180,966 | ) | (22,413 | ) | (302,385 | ) | ||||||
| Redemption of preferred shares | (11,980,000 | ) | — | — | ||||||||
| Dividend on preferred shares | (336,937 | ) | — | — | ||||||||
| Proceeds from issue of convertible debt and warrants | 25,000,000 | — | — | |||||||||
| Issue costs relating to convertible debt and warrants | (1,651,507 | ) | — | — | ||||||||
| Decrease/(increase) in loan receivable from related party | — | 359,996 | (298,242 | ) | ||||||||
| Change in non cash working capital | ||||||||||||
| Issue costs relating to convertible debt | — | — | — | |||||||||
| Cash flows provided by (used for) financing activities | 38,271,054 | 1,906,458 | 8,343,813 | |||||||||
Investing activities | ||||||||||||
| Capital asset additions | (28,211,193 | ) | (4,101,975 | ) | (5,341,072 | ) | ||||||
| Decrease/(increase) in advances to joint venture partners | 446,950 | 127,612 | 318,433 | |||||||||
| Increase in deferred costs | (433,832 | ) | ||||||||||
| Cash flows provided by (used for) investing activities | (27,764,243 | ) | (4,408,195 | ) | (5,022,639 | ) | ||||||
| Effect of currency translation on cash balances and cash flows | 2,777,078 | 338,553 | 260,540 | |||||||||
| Increase (decrease) in cash and cash equivalents | 6,532,365 | (4,540,603 | ) | 914,759 | ||||||||
| Cash and cash equivalents, beginning of year | 2,865,157 | 7,405,760 | 6,491,001 | |||||||||
| Cash and cash equivalents, end of year | $ | 9,397,522 | $ | 2,865,157 | $ | 7,405,760 | ||||||
| SUPPLEMENTAL CASH FLOW INFORMATION | ||||||||||||
| Interest paid | $ | 4,729 | — | — | ||||||||
| NON-CASH ITEMS | ||||||||||||
| Common shares issued for oil and gas properties | 28,357,672 | — | — | |||||||||
| Common shares issued for acquisition fee | 263,036 | — | — | |||||||||
| Common shares issued for financing commitment fee | 421,849 | — | — | |||||||||
| Interest on convertible debt added to principal | $ | 1,132,722 | — | — | ||||||||
| CASH AND CASH EQUIVALENTS CONSIST OF: | ||||||||||||
| Cash in bank | $ | 526,723 | $ | 558,932 | $ | 183,087 | ||||||
| Term deposits | 8,870,799 | 2,306,225 | 7,222,673 | |||||||||
| $ | 9,397,522 | $ | 2,865,157 | $ | 7,405,760 | |||||||
See accompanying notes to the consolidated financial statements.
F-7
Table of Contents
Consolidated Financial Statements of
AUSAM ENERGY CORPORATION
Consolidated Statements of Changes in Shareholders’ Equity
(in US dollars)
AUSAM ENERGY CORPORATION
Consolidated Statements of Changes in Shareholders’ Equity
(in US dollars)
| Share | Accumulated | |||||||||||||||||||||||||||||||||||||||
| purchase | Additional | Other | Total | |||||||||||||||||||||||||||||||||||||
| Common Stock | Preferred shares | warrants | paid-in | Accumulated | Comprehensive | Shareholders’ | ||||||||||||||||||||||||||||||||||
| Shares | Amount | Shares | Amount | Number | Amount | capital | Deficit | Income | Equity | |||||||||||||||||||||||||||||||
| $ | $ | $ | $ | $ | $ | $ | ||||||||||||||||||||||||||||||||||
Balance, December 31, 2005 | 10,064,553 | 24,649,132 | — | — | 1,164,336 | 1,051,031 | 1,978,420 | (16,131,376 | ) | (143,342 | ) | 11,403,865 | ||||||||||||||||||||||||||||
| Issue of common shares for cash | 875,000 | 1,296,283 | 1,296,283 | |||||||||||||||||||||||||||||||||||||
| Issue costs | (22,413 | ) | (22,413 | ) | ||||||||||||||||||||||||||||||||||||
| Warrants expired | (1,164,336 | ) | (1,051,031 | ) | 1,051,031 | — | ||||||||||||||||||||||||||||||||||
| Noram warrants issued | 875,000 | 272,592 | 272,592 | |||||||||||||||||||||||||||||||||||||
| Stock based compensation | 266,919 | 266,919 | ||||||||||||||||||||||||||||||||||||||
| Assignment of lease | 1,093,641 | 1,093,641 | ||||||||||||||||||||||||||||||||||||||
| Cumulative translation adjustment | 877,961 | 877,961 | ||||||||||||||||||||||||||||||||||||||
| Change in accounting policy | (31,240 | ) | 31,240 | — | ||||||||||||||||||||||||||||||||||||
| Net (loss) | (3,800,324 | ) | (3,800,324 | ) | ||||||||||||||||||||||||||||||||||||
Balance, December 31, 2006 | 10,939,553 | 25,923,002 | — | — | 875,000 | 272,592 | 4,358,771 | (19,900,460 | ) | 734,619 | 11,388,524 | |||||||||||||||||||||||||||||
| Issue of common shares and common share warrants for cash pursuant to private placements at $2.70/unit | 6,436,739 | 14,714,754 | 3,218,369 | 2,725,259 | 17,440,013 | |||||||||||||||||||||||||||||||||||
| Issue of preferred shares and common share warrants for cash pursuant to private placements at $3.00/unit | 3,993,333 | 10,358,185 | 1,996,667 | 1,622,266 | 11,980,451 | |||||||||||||||||||||||||||||||||||
| Redemption price of preferred shares, in excess of cost | (1,868,204 | ) | (1,868,204 | ) | ||||||||||||||||||||||||||||||||||||
| Dividend on preferred shares | (336,937 | ) | (336,937 | ) | ||||||||||||||||||||||||||||||||||||
| Broker/agent warrants issued | (162,660 | ) | (50,932 | ) | 694,482 | 694,589 | 480,997 | |||||||||||||||||||||||||||||||||
| Issue costs | (1,985,957 | ) | (195,008 | ) | (678,298 | ) | (2,859,263 | ) | ||||||||||||||||||||||||||||||||
| Redemption of preferred shares | (3,993,333 | ) | (10,112,245 | ) | (10,112,245 | ) | ||||||||||||||||||||||||||||||||||
| Acquisition fee | 117,647 | 263,036 | 263,036 | |||||||||||||||||||||||||||||||||||||
| Acquisition of properties | 12,683,429 | 28,357,672 | 28,357,672 | |||||||||||||||||||||||||||||||||||||
| Issue of common share warrants for cash pursuant to convertible debt offering | 4,461,099 | 6,754,844 | 6,754,844 | |||||||||||||||||||||||||||||||||||||
| Issue of common shares for commitment fee relating to convertible debt offering | 190,968 | 421,849 | 421,849 | |||||||||||||||||||||||||||||||||||||
| Beneficial conversion feature of convertible debt | 2,589,567 | 2,589,567 | ||||||||||||||||||||||||||||||||||||||
| Noram warrants expired | (875,000 | ) | (272,592 | ) | 272,592 | — | ||||||||||||||||||||||||||||||||||
| Stock based compensation | 2,036,933 | 2,036,933 | ||||||||||||||||||||||||||||||||||||||
| Cumulative translation adjustment | 2,192,756 | 2,192,756 | ||||||||||||||||||||||||||||||||||||||
| Net (loss) | (30,150,143 | ) | (30,150,143 | ) | ||||||||||||||||||||||||||||||||||||
| — | ||||||||||||||||||||||||||||||||||||||||
Balance, December 31, 2007 | 30,368,335 | 67,531,696 | — | — | 10,370,617 | 11,118,660 | 9,257,863 | (52,255,744 | ) | 2,927,375 | 38,579,850 | |||||||||||||||||||||||||||||
See accompanying notes to the consolidated financial statements.
F-8
Table of Contents
Notes to Consolidated Financial Statements
| 1. | Nature of Operations and Going Concern |
Ausam Energy Corporation (the “Company” or “Ausam”) is incorporated under the Business Corporations Act (Alberta). Its principal activities relate to oil and gas exploration and development in the United States and Australia.
A portion of the Company’s exploration, development and production activities are conducted jointly with others. These consolidated financial statements reflect only the Company’s proportionate working interest in such activities.
Although Ausam has commenced production, the Company still incurs negative cash flows from operations, and at this time all exploration activities and overhead expenses are financed by way of equity and convertible debt.
The Company’s ability to continue as a going concern is dependent upon obtaining the necessary financing to complete development activities and generate profitable operations from its oil and natural gas interests in the future. The Company’s financial statements as at and for the year ended December 31, 2007 have been prepared on a going concern basis, which contemplates the realization of assets and the settlement of liabilities and commitments in the normal course of business. The Company incurred a net loss of $30.2 million, used $6.7 million of cash flow in its operating activities for the year ended December 31, 2007, and had an accumulated deficit accumulated of $52.3 million as at December 31, 2007. The Company expects to incur substantial expenditures to further its capital investment programs and the Company’s existing cash balance and cash flow from operating activities may not be sufficient to satisfy its current obligations, including liquidated damages obligations, and meet its capital investment commitments.
To provide additional financing for the Company’s ongoing operations, the Company secured $25 million in financing on July 4, 2007, of which $10 million was used to redeem preferred shares. As at December 31, 2007, the Company has working capital of $7.9 million which is available for the Company’s future operations.
The Company is building a portfolio of oil and natural gas production, development and exploration opportunities using the funds raised from equity and convertible debt during 2007 and from future operating activities.
Should the going concern assumption not be appropriate and the Company is not able to realized its assets and settle its liabilities and commitments in the normal course of operations, these consolidated financial statements would require adjustments to the amounts and classifications of assets and liabilities, and these adjustments could be significant.
The consolidated financial statements do not give effect to any adjustments that might be necessary if the Company is unable to continue as a going concern.
| 2. | Significant Accounting Policies |
The consolidated financial statements have been prepared in accordance with generally accepted accounting principles in the United States of America (“GAAP”). The preparation of financial statements in accordance with GAAP requires the use of estimates and assumptions that affect the reported amounts of assets and liabilities and disclosures of contingent assets and liabilities at the date of the consolidated financial statements, and revenues and expenses during the reporting period. The Company believes that the information and disclosures presented are adequate to ensure the information presented is not misleading.
| a) | Basis of consolidation |
These consolidated financial statements include the accounts of the Company and its wholly-owned subsidiaries. All significant intercompany accounts and transactions have been eliminated. The Company proportionately consolidates its undivided interest in oil and gas exploration and development joint ventures.
F-9
Table of Contents
Notes to Consolidated Financial Statements — (Continued)
| b) | Foreign currency translation |
Effective July 1, 2007 the functional currency of the Company and its US subsidiary was changed from the Canadian dollar to the US dollar. As such, revenue and expense transactions denominated in currencies other than the Company’s functional currency are translated into US dollars at the average exchange rates in effect at the time of such transactions. Monetary assets and liabilities are translated at current rates at the balance sheet date. Gains or losses resulting from these translation adjustments are included in other income or expense.
Prior to July 1, 2007 the functional currency of the Company and its US subsidiary was the Canadian dollar. As such, revenue and expense transactions denominated in currencies other than the Company’s functional currency were translated into Canadian dollars at the average exchange rates in effect at the time of such transactions. Monetary assets and liabilities were translated at current rates at the balance sheet date. Gains or losses resulting from these translation adjustments were included in other income or expense. As the Company’s reporting currency is the U.S. dollar, the Canadian dollar consolidated financial statements were translated into U.S. dollars using the current rate method of translation. Gains or losses resulting from this translation are included in accumulated other comprehensive income.
The functional currency of the subsidiary in Australia is the Australian dollar. The Company’s Australian operations are translated into US dollars using the current rate method. Under this method, assets and liabilities are translated at period-end exchange rates and items included in the statements of operations and retained earnings and cash flows are translated at the rates in effect at the time of the transaction. The gain or loss on translation is charged to accumulated other comprehensive income in shareholders equity. Amounts payable and receivable in foreign currencies are translated to the reporting currency at exchange rates in effect at each balance sheet date. Resulting exchange differences are recognized in determining the profit or loss for the period.
| c) | Oil and natural gas properties |
The Company uses the full cost method of accounting for its investment in oil and natural gas properties. Separate cost centers are maintained for each country in which the Company incurs costs. Under this method, the Company capitalizes all acquisition, exploration and development costs incurred for the purpose of finding oil and natural gas reserves, including salaries, benefits and other internal costs directly attributable to these activities. Costs associated with production and general corporate activities, however, are expensed in the period incurred. Interest costs related to unproved properties and properties under development are also capitalized to oil and natural gas properties. Proceeds from the disposition of oil and natural gas properties are accounted for as a reduction of capitalized costs, with no gain or loss recognized unless such disposition would alter the depletion and depreciation rate by 20% or more.
Following the discovery of reserves and the commencement of production, the Company computes depletion of oil and natural gas properties on a quarterly basis using the unit-of-production method based upon production and estimates of proved reserve quantities. Unproved properties are excluded from the depletion base until evaluated. The cost of exploratory dry wells is transferred to proved properties and thus subject to depletion immediately upon determination that a well is dry in those countries where proved reserves exist. Future development costs are added to the depletion base.
Commencing in 2007, the Company performs a ceiling test calculation each quarter in accordance withRegulation S-XRule 4-10 of the United States Securities and Exchange Commission (the “SEC”). In performing its quarterly ceiling test, the Company limits, on acountry-by-country basis, the capitalized costs of proved oil and natural gas properties, net of accumulated depletion and deferred income taxes, to the estimated future net cash flows from proved oil and natural gas reserves discounted at ten percent, net of related tax effects, plus the lower of cost or fair value of unproved properties included in the costs being amortized. If capitalized costs exceed this limit, the excess is charged as additional depletion expense. The Company calculates future net cash flows by applying end-of-the-period prices except in those instances where
F-10
Table of Contents
Notes to Consolidated Financial Statements — (Continued)
future natural gas or oil sales are covered by physical contract terms providing for higher or lower amounts. As the Company did not have significant proved reserves as at December 31, 2006 a ceiling test was not applied.
Unproved properties are assessed quarterly for possible impairments. If an impairment has occurred, the impairment is transferred to proved properties. For prospects where a reserve base has not yet been established, the impairment is charged to earnings.
Depreciation
Other assets, which comprise office equipment, computer equipment and software, leasehold improvements and furniture and fixtures, are recorded at cost and are depreciated over their useful life. The depreciation rates are as follows:
| Office equipment, leasehold improvements and furniture and fixtures | 20.0 | % | ||
| Computer equipment and software | 33.3 | % |
Amortization of leasehold improvements are computed using the straight-line method over the shorter of the lease term or the estimated useful lives of the related assets, currently over 5 years.
| c) | Asset retirement obligations |
An asset retirement obligation is recorded as a liability in the period in which a legal obligation is incurred as a result of an acquisition, construction, developmentand/or normal use of the assets. The associated asset retirement costs are capitalized as part of the carrying amount of the long-lived asset and depleted and depreciated using a unit-of-production method over the estimated gross proved reserves. Subsequent to the initial measurement of the asset retirement obligations, the obligations are adjusted at the end of each year to reflect the passage of time and changes in the estimated future cash flows underlying the obligation.
| d) | Measurement uncertainty |
Amounts recorded for petroleum and natural gas properties and asset retirement obligations are based upon estimated future costs, cash flows and other relevant assumptions. By their nature, these estimates are subject to measurement uncertainty, and the impact on the financial statements of future periods could be material.
| e) | Income taxes |
The Company follows the liability method of accounting for income taxes. Deferred income taxes are calculated based on temporary differences arising from the difference between the tax basis of an asset or liability and its carrying value on the balance sheet using tax rates anticipated to apply in the periods when the temporary differences are expected to reverse. The effect on deferred taxes for a change in tax rates is recognized in income in the period of the change. Deferred income tax assets are recognized to the extent that realization of such assets is more likely than not. Valuation allowances are established when necessary to reduce deferred income tax assets to the amount that, in the opinion of management, is more likely than not to be realized.
In June 2006, the FASB issued Financial Interpretation No. 48, “Accounting for Uncertainty in Income Taxes” (FIN 48), which clarifies the accounting for uncertainty in income taxes recognized in a company’s financial statements in accordance with FASB Statement No. 109, “Accounting for Income Taxes.” The interpretation prescribes a recognition threshold and measurement attribute criteria for the financial statement recognition and measurement of a tax position taken or expected to be taken in a tax return. The interpretation also provides guidance on derecognition, classification, interest and penalties, accounting in interim periods, disclosure and transition.
F-11
Table of Contents
Notes to Consolidated Financial Statements — (Continued)
The Company adopted the provisions of FIN 48 on January 1, 2007. The adoption of FIN 48 did not impact the consolidated financial condition, results of operations or cash flows. At January 1, 2008, the Company had unrecognized tax benefits of $1.2 million, of which approximately $0.8 million of non capital losses will expire in January, 2008.
The Company is currently open to audit under the statute of limitations by the Canada Revenue Agency for the years ending December 31, 2001 through 2007. The Company’s United States’ subsidiary is currently open to audit under the statute of limitations by the Internal Revenue Service for the years ending December 31, 2006 and 2007. The Company’s Australian subsidiary is currently open to audit under the statute of limitations by the Australian Tax Office for the years ending December 31, 2004 through 2007.
The Company and its subsidiaries may from time to time be assessed interest or penalties by major tax jurisdictions, although to date their have been no such assessments. In the event an assessment for interestand/or penalties is received, it will be classified in the financial statements as general and administrative expense.
| f) | Stock-based compensation plan |
Effective January 1, 2002, the Company adopted Statement of Financial Accounting (“SFAS”) No. 123, “Accounting for stock-based compensation” under the prospective transition methodology described in SFAS No. 148, “Accounting for Stock-Based Compensation — Transition and Disclosure”. SFAS 123R requires forfeitures to be estimated at the time of grant and revised, if necessary, in subsequent periods if actual forfeitures differ from those estimates. Previously, the Company accounted for forfeitures as they occurred. As a result, the Company recorded a cumulative effect of a change in accounting principle in the consolidated statements of operations of $31,240 as at January 1, 2006.
The Company follows the fair-value method of accounting for stock options granted to directors, officers and employees pursuant to SFAS 123R. Stock-based compensation expense is included in general and administrative expense with a corresponding increase to contributed surplus. Compensation expense for options granted is based on the estimated fair value at the time of grant and the expense is recognized over the vesting period of the option.
| g) | Cash and cash equivalents |
Cash equivalents are highly liquid, short-term investments that are readily convertible to known amounts of cash and have original maturities of three months or less from their date of purchase. They are carried at cost plus accrued interest, which approximates fair value.
| h) | Loss per share |
Basic loss per share calculations are based on the loss attributable to common shareholders for the period divided by the weighted average number of common shares issued and outstanding during the period. The diluted loss per share calculation is based on the weighted average number of common shares outstanding during the period, plus the effects of dilutive common share equivalents. This method requires that the dilutive effect of outstanding options and warrants issued should be calculated using the treasury stock method. This method assumes that all common share equivalents have been exercised at the beginning of the period (or at the time of issuance, if later), and that the funds obtained thereby were used to purchase common shares of the Company at the average trading price of common shares during the period. For years ended December 31, 2007, 2006 and 2005 the inclusion of the Company’s stock options and warrants in the computation of diluted loss per share would have an anti-dilutive effect on loss per share and therefore options and warrants are excluded from the computation.
F-12
Table of Contents
Notes to Consolidated Financial Statements — (Continued)
Recent U.S. Accounting Pronouncements
In February 2006, the Financial Accounting Standards Board (“FASB”) issued SFAS No. 155, “Accounting for Certain Hybrid Financial Instruments — an amendment of FASB statements No. 133 and 140” (“SFAS No. 155”). SFAS No. 155 resolves issues surrounding the application of the bifurcation requirements to beneficial interests in securitized financial assets. In general, this statement permits fair value remeasurement for any hybrid financial instrument that contains an embedded derivative that otherwise would require bifurcation. SFAS No. 155 is effective for all financial instruments acquired or issued after the beginning of an entity’s first fiscal year that begins after September 15, 2006 and has not had a material impact on the Company’s financial statements.
On June 28, 2006 the FASB ratified the consensuses reached by the Task Force on Emerging Issues Task Force (“EITF”) IssueNo. 06-3, How Taxes Collected from Customers and Remitted to Governmental Authorities Should Be Presented in the Income (That Is, Gross versus Net Presentation). This Issue requires any tax assessed by a governmental authority that is directly imposed on a revenue-producing transaction between a seller and a customer is presented in the Statements of Income on a net basis (excluded from revenues). The consensuses in this Issue should be applied to financial reports for interim and annual reporting periods beginning after December 15, 2006. Management has determined that the requirements of this guidance does not have a material impact on its financial statements.
In February 2007, the Financial Accounting Standards Board (“FASB”) issued SFAS No. 159, “The Fair Value Option for Financial Assets and Financial Liabilities (including an amendment of FASB Statement No. 115)” (“SFAS No. 159”). The statement would create a fair value option under which an entity may irrevocably elect fair value as the initial and subsequent measurement attribute for certain financial assets and financial liabilities on acontract-by-contract basis, with changes in fair value recognized in earnings as those changes occur. This Statement is effective as of the beginning of an entity’s first fiscal year that begins after November 15, 2007. Management is in the process of reviewing the requirements of this recent statement.
The following accounting pronouncements have also been recently issued:
Statement 161, which amends FASB Statement No. 133, Accounting for Derivative Instruments and Hedging Activities, requires companies with derivative instruments to disclose information about how and why a company uses derivative instruments, how derivative instruments and related hedged items are accounted for under Statement 133, and how derivative instruments and related hedged items affect a company’s financial position, financial performance, and cash flows. The required disclosures include the fair value of derivative instruments and their gains or losses in tabular format, information about credit-risk-related contingent features in derivative agreements, counterparty credit risk, and the company’s strategies and objectives for using derivative instruments. The Statement expands the current disclosure framework in Statement 133. Statement 161 is effective prospectively for periods beginning on or after November 15, 2008. The Company plans to provide these additional disclosures in the first quarter of 2009.
SFAS No. 160 —Noncontrolling Interests in Consolidated Financial Statements — An amendment of ARB No. 51. This Statement requires an entity to clearly identify and report ownership interests in subsidiaries held by parties other than the parent in the consolidated statement of financial position within equity but separate from the parent’s equity. The Statement also requires that the amount of consolidated net income attributable to the parent and to the noncontrolling interest be identified and presented on the face of the consolidated income statement; changes in a parent’s ownership interest be accounted for as equity transactions; and when a subsidiary is deconsolidated, any retained noncontrolling equity investment in the former subsidiary and the gain or loss on the deconsolidation be measured at fair value. This Statement is effective for the Company beginning January 1, 2009. The Company is currently evaluating the provisions of this new standard and has not determined the impact of adopting at this time.
SFAS No. 141 (Revised 2007) —Business Combinations. This Statement requires an acquirer to recognize the assets acquired, the liabilities assumed, contractual contingencies, and contingent consideration
F-13
Table of Contents
Notes to Consolidated Financial Statements — (Continued)
at their fair values as of the acquisition date. This Statement also requires acquisition costs to be expensed as incurred, restructuring costs to be expensed in the period subsequent to the acquisition date, and changes in deferred tax asset valuation allowances and income tax uncertainties after the acquisition date to impact tax expense. This Statement also requires the acquirer of an acquisition achieved in stages to recognize the identifiable assets and liabilities, as well as the noncontrolling interest in the acquiree, at the full amounts of their fair values. This Statement is effective for the Company for business combinations completed after December 31, 2008.
SFAS No. 157 —Fair Value Measurements. In September 2006, the FASB issued SFAS No. 157, Fair Value Measurements. SFAS No. 157 defines fair value, establishes a framework for measuring fair value, and requires enhanced disclosures about fair value measurements. SFAS No. 157 requires companies to disclose the fair value of their financial instruments according to a fair value hierarchy as defined in the standard. Additionally, companies are required to provide enhanced disclosure regarding financial instruments in one of the categories, including a reconciliation of the beginning and ending balances separately for each major category of assets and liabilities. In February 2008, the FASB issued FASB Staff Position (FSP) No. FAS 157-2, which delays by one year the effective date of SFAS No. 157 for certain types of non-financial assets and non-financial liabilities. As a result, SFAS No. 157 will be effective for financial statements issued for fiscal years beginning after November 15, 2007, or the Company’s fiscal year beginning January 1, 2008, for financial assets and liabilities carried at fair value on a recurring basis, and on January 1, 2009, for non-recurring non-financial assets and liabilities that are recognized or disclosed at fair value. The Company adopted SFAS No. 157 on January 1, 2008, for financial assets and liabilities carried at fair value on a recurring basis, with no material impact on its consolidated financial statements. The Company is currently unable to determine what impact the application of SFAS No. 157 on January 1, 2009, for non-recurring non-financial assets and liabilities that are recognized or disclosed at fair value, will have on its consolidated financial statements.
F-14
Table of Contents
Notes to Consolidated Financial Statements — (Continued)
| 3. | Oil and gas properties utilizing the full cost method of accounting |
The following table provides a summary of the proved and depletable oil and gas properties and the unevaluated oil and gas properties, not subject to depletion.
| December 31, | December 31, | |||||||
| 2007 | 2006 | |||||||
| $ | $ | |||||||
| Oil and Gas Properties: | ||||||||
| Proved | ||||||||
United States | ||||||||
| Cost | 12,979,900 | (1) | — | |||||
| Less: Accumulated depreciation, depletion and amortization | (10,408,877 | ) | — | |||||
| 2,571,023 | — | |||||||
Australia | ||||||||
| Cost | 9,042,940 | (3) | — | |||||
| Less: Accumulated depreciation, depletion and amortization | (8,802,914 | ) | — | |||||
| 240,026 | — | |||||||
| Total proved properties | 2,811,049 | $ | — | |||||
| Unevaluated | ||||||||
United States | ||||||||
| Acquisition cost | 40,337,463 | 1,046,797 | ||||||
| Exploration and leasehold carrying costs | 1,025,885 | — | ||||||
| Total United States | 41,363,348 | (2) | 1,046,797 | |||||
Australia | ||||||||
| Acquisition cost | — | — | ||||||
| Exploration cost | 10,588,280 | 16,318,789 | ||||||
| 10,588,280 | 16,318,789 | |||||||
| Less: Accumulated impairment | (8,695,000 | ) | (8,695,000 | ) | ||||
Total Australia | 1,893,280 | (4) | 7,623,789 | |||||
| Total oil and gas properties unevaluated — net | 43,256,628 | $ | 8,670,586 | |||||
| (1) | Consists of 2 prospects which are expected to be relinquished under a purchase agreement, and the acquisition and drilling cost of 3 wells, all of which were included in the depletion and amortization and ceiling test calculations in 2007. | |
| (2) | Consists of 16 prospects, comprising $41.4 million in oil and gas properties cost. It is anticipated that there will be three wells drilled on three prospects during 2008 and, subject to drilling success, the acquisition cost of $12.3 million plus the additional cost to drill and complete the wells will be included in the depletion and amortization calculation upon their completion and be depleted on a unit of production basis thereafter. The remaining unevaluated properties acquisition cost in the amount of $29.1 million will be evaluated, sold or relinquished in 2008, 2009 and 2010. The drilling program is subject to change depending on the success of the program, the Company’s success in farming out part of its interest in the prospects and the Company’s ability to access funds through debt and equity to fund the program. |
| (3) | Consists of exploration and drilling expenditures on a producing property and exploration costs of certain other permits which were added to the depletion and ceiling test calculation in Australia. (See Note 17b — Subsequent events) |
F-15
Table of Contents
Notes to Consolidated Financial Statements — (Continued)
| (4) | Consists of estimated recoverable exploration expenditures on certain permits in Australia. (See Note 17b — Subsequent events). The basis for the determination of the carrying value of the Australian properties consists of proved reserves plus management’s best estimate of the realizable value of the unevaluated properties. |
The Company excluded from the depletion and ceiling test calculation costs of $43.3 million (2006 — nil) relating to undeveloped properties.
During the year ended December 31, 2007 $1,384,462 (2006 — nil) of administration expenses, including stock based compensation, were capitalized.
| Depreciable | December 31, | December 31, | ||||||||||
| Life-Years | 2007 | 2006 | ||||||||||
| Office equipment, leasehold improvements and furniture and fittings | 5 | $ | 211,643 | $ | 151,258 | |||||||
| Computer equipment and software | 3 | 175,233 | 20,079 | |||||||||
| 386,876 | 171,337 | |||||||||||
| Less: Accumulated deprecation | (157,420 | ) | (81,213 | ) | ||||||||
| Other plant and equipment — net | $ | 229,456 | $ | 90,124 | ||||||||
| 4. | Asset write down |
During 2007, as a result of the assessment of carrying values of the Company’s properties in the United States and Australia, a ceiling test and asset write down of $17.7 million was recorded (2006 — $1.5 million) to reflect impairment in the carrying value of Company’s oil and gas assets, and is included in depletion expense. The write down is summarized as follows:
| United States | Australia | Total | ||||||||||
| 2007 | $ | 9,511,587 | $ | 8,211,403 | $ | 17,722,990 | ||||||
During 2006, an asset write down of $1,535,208 was recorded to reflect impairment in the carrying value of certain of the Company’s oil and gas properties in Australia.
| 5. | Advances to joint venture partners |
This amount represent funds advanced on cash calls on approved Authorization for Expenditures (“AFEs”) to the operators of the joint ventures in which Ausam has an interest in Queensland, Australia. It comprises unspent funds advanced to the operator of the property relating to the Company’s share of future drilling and exploration activities.
| 6. | Deferred costs |
At December 31, 2006, these costs totaling $683,956 comprised legal, professional, financing and other directly related costs with respect to the acquisition of leasehold rights to certain oil and gas properties in Texas, Louisiana, Mississippi, Alabama and Arkansas, and the related financings which closed on February 8, 2007. These costs were allocated to share issue costs ($434,099) and petroleum and natural gas properties ($249,857) in 2007.
F-16
Table of Contents
Notes to Consolidated Financial Statements — (Continued)
7. Asset Retirement Obligation
The following table presents the reconciliation of the beginning and ending aggregate carrying amount of the obligation associated with the retirement of oil and gas properties.
| December 31, | December 31, | December 31, | ||||||||||
| 2007 | 2006 | 2005 | ||||||||||
| Asset retirement obligation, beginning of year | $ | 166,185 | $ | 140,845 | $ | 66,021 | ||||||
| Obligations incurred, net | 4,053 | 23,446 | 70,624 | |||||||||
| Accretion expense | 10,488 | 1,214 | — | |||||||||
| Change due to exchange rates | — | 680 | 4,200 | |||||||||
| Asset retirement obligation, end of year | $ | 180,726 | $ | 166,185 | $ | 140,845 | ||||||
The undiscounted amount of cash flows, required over the estimated reserve life of the underlying assets, to settle the obligation, adjusted for inflation, is estimated at $182,000. The obligation was calculated using a credit-adjusted risk free discount rate of 9 percent. The majority of expenditures are expected to be incurred in 2008.
| 8. | Share Capital |
| a) | Authorized |
Unlimited number of common shares without nominal or par value and unlimited number of preferred shares, issuable in series.
| Shares | Amount | |||||||
Balance, December 31, 2005 | 10,064,553 | $ | 24,649,132 | |||||
| Issue of common shares for cash | 875,000 | 1,296,283 | ||||||
| Issue costs | — | (22,413 | ) | |||||
Balance, December 31, 2006 | 10,939,553 | 25,923,002 | ||||||
| Issue of common shares and common share warrants for cash pursuant to private placements at $2.70/unit | 6,436,739 | 14,714,754 | ||||||
| Issue costs | — | (2,148,618 | ) | |||||
| Acquisition fee | 117,647 | 263,036 | ||||||
| Acquisition of properties | 12,683,429 | 28,357,672 | ||||||
| Issue of common shares for commitment fee relating to convertible debt offering | 190,968 | 421,849 | ||||||
Balance, December 31, 2007 | 30,368,335 | $ | 67,531,696 | |||||
| b) | Issued — preferred shares |
| Shares | Amount | |||||||
Balance, December 31, 2006 | — | $ | — | |||||
| Issued for cash | 3,993,333 | 10,358,185 | ||||||
| Issue costs | (245,940 | ) | ||||||
| Redeemed during the period | (3,993,333 | ) | (10,112,245 | ) | ||||
Balance, December 31, 2007 | — | $ | — | |||||
The First Preferred Shares, Series 2 were issued at a price of $3.00 (CDN$3.55) per Series 2 Unit, each such Series 2 Unit consisting of one First Preferred Shares, Series 2 and one half of one common share
F-17
Table of Contents
Notes to Consolidated Financial Statements — (Continued)
purchase warrant (the “Series 2 Warrants”), each whole Series 2 Warrant entitling the holder thereof to purchase one Common Share at a price of CDN$3.75 for a period of 24 months from the date of issuance. The preferred shares have an 8% coupon, accrued and payable quarterly, a one year term ending on February 8, 2008 and, upon expiry of such term, convert to Common Shares on a one to one basis.
The holders of First Preferred Shares, Series 2 have the right, at any time and from time to time within the Term, to convert their First Preferred Shares, Series 2 into Common Shares of the Company on the basis of one common chare for each First Preferred Share, Series 2; and at any time and from time to time during the Term, after 30 days’ notice from the Company (the “Notice Date”), be required to convert all or a portion of its First Preferred Shares, Series 2 into Common Shares on the basis of one Common Share for each First Preferred Share, Series 2, in the event that the30-day volume-weighted average trading price of the then outstanding Common Shares calculated with respect to the 30 days prior to the Notice Date remains at or above CDN$4.50.
At the option of the board of directors of the Company and in compliance with the provisions of theBusiness Corporations Act(Alberta), the First Preferred Shares, Series 2 or any part thereof, shall be subject to redemption or purchase, at any time or from time to time, at $3.00 per First Preferred Share, Series 2 plus any declared but unpaid dividends. During the six months ended June 30, 2007 two redemptions occurred. On July 8, 2007 all remaining preferred shares were redeemed at $3.00 per share.
| c) | Issued — share purchase warrants |
| Shares | Amount | |||||||
Balance, December 31, 2005 | 1,164,336 | $ | 1,051,031 | |||||
| Expired | (1,164,336 | ) | (1,051,031 | ) | ||||
| Issued for cash (Note 8c) | 875,000 | 272,592 | ||||||
Balance, December 31, 2006 | 875,000 | 272,592 | ||||||
| Issued for cash in connection with common share unit offering | 3,092,684 | 2,583,410 | ||||||
| Issued for cash in connection with preferred share unit offering | 1,996,667 | 1,622,266 | ||||||
| Broker/agent warrants issued | 248,372 | 213,593 | ||||||
| Noram warrants expired | (875,000 | ) | (272,592 | ) | ||||
| Issued for cash in connection with convertible debt offering | 4,461,099 | 6,754,844 | ||||||
| Issue costs | (678,298 | ) | ||||||
| Broker/agent warrants issued | 446,110 | 480,996 | ||||||
| Issued for cash in connection with common share unit offering | 125,685 | 141,849 | ||||||
Balance, December 31, 2007 | 10,370,617 | $ | 11,118,660 | |||||
As part of the common and preferred share unit private placements completed in February 2007, the Company issued 5,089,351 share purchase warrants, exercisable at between CDN$3.25 and 3.75 per common share until February 8, 2009. In connection with the convertible debenture issued on July 5, 2007, the Company issued 4,461,099 share purchase warrants, exercisable at CDN$3.00 until July 3, 2012. The fair value of the warrants was estimated using the Black-Scholes option-pricing model utilizing the relative fair value approach.
| d) | Issued — Noram warrants |
As at December 31, 2006 there were 875,000 warrants issued and outstanding, exchangeable for one common share of Noram Resources, Inc. (“Noram”) at no extra cost should the acquisition announced on September 22, 2006 fail to close by a certain date. Noram is a wholly owned subsidiary of Ausam that, as a condition of closing of the October 2006 private placement, was assigned a 20% interest in of one of the
F-18
Table of Contents
Notes to Consolidated Financial Statements — (Continued)
leases to be acquired from SKH as part of the transaction. As the transaction was successfully completed February 8, 2007, Noram remained a wholly owned subsidiary of Ausam and the warrants expired unexercised. The fair value of the warrants was determined to be the premium paid on a unit basis above the weighted average trading price of the common shares.
(e) Stock options
The only equity compensation plan approved by the Company’s stockholders is its Stock Option Plan, under which the Company’s board of directors is authorized to issue options or other rights to acquire up to 10% of the outstanding common shares of the Company’s common stock, issuable upon exercise of these additional stock options.
The Company has granted options to purchase common shares to certain directors, officers, employees and consultants. Each option permits the holder to purchase one common share at the stated exercise price. The options vest over two years and have a term of five years or end of service to the Company, which ever occurs first. At the time of grant, the exercise price equals the market price.
The compensation cost that has been charged against income for this plan was $1,487,111, $266,918 and $993,193 for 2007, 2006 and 2005 respectively. No income tax benefit has been recognized in the income statement for share-based compensation arrangements for 2007, 2006 or 2005.
Changes in the number of options, with their weighted average exercise prices, are summarized below:
| 2007 | 2006 | |||||||||||||||
| Weighted Average | Weighted Average | |||||||||||||||
| Exercise Price | Exercise Price | |||||||||||||||
| Number | CDN$ | Number | CDN$ | |||||||||||||
| Outstanding, beginning of year | 800,000 | 4.80 | 880,000 | 4.80 | ||||||||||||
| Granted | 1,489,251 | 2.38 | — | — | ||||||||||||
| Granted | 630,000 | 2.40 | — | — | ||||||||||||
| Forfeited | (40,000 | ) | (80,000 | ) | ||||||||||||
| Outstanding, end of year | 2,879,251 | 3.02 | 800,000 | 4.80 | ||||||||||||
| Options exercisable, end of year | 1,466,417 | 3.50 | 678,333 | 4.60 | ||||||||||||
The Company’s non-vested options consist of options granted under the Company’s stock option plan. A summary of the status of non-vested stock options as at December 31, 2007 and changes during the year is presented below.
| Weighted-Average | Weighted-Average | |||||||||||||||
| Grant Date | Grant Date | |||||||||||||||
| Fair Value | Fair Value | |||||||||||||||
| Number | (CDN$) | Number | (CDN$) | |||||||||||||
| Outstanding, beginning of year | 132,000 | 3.60 | 428,333 | 3.20 | ||||||||||||
| Granted | 1,411,421 | 2.38 | — | — | ||||||||||||
| Vested | (110,587 | ) | 3.60 | (216,333 | ) | 2.95 | ||||||||||
| Forfeited | (20,000 | ) | 4.75 | (80,000 | ) | 1.75 | ||||||||||
| Outstanding, end of year | 1,412,834 | 2.38 | 132,000 | 3.60 | ||||||||||||
F-19
Table of Contents
Notes to Consolidated Financial Statements — (Continued)
The following table summarizes information about the stock options as at December 31, 2007:
| Weighted | Weighted | |||||||||||||||||||||||||||||||||
| Average | Weighted | Average | Weighted | |||||||||||||||||||||||||||||||
| Number | Remaining | Average | Number | Remaining | Average | |||||||||||||||||||||||||||||
| Exercise | Outstanding, | Contractual | Exercise | Aggregate | Exercisable, | Contractual | Exercise | Aggregate | ||||||||||||||||||||||||||
| Price | December 31, | Life | Price | Intrinsic | December 31, | Life | Price | Intrinsic | ||||||||||||||||||||||||||
(CDN$) | 2007 | (Years) | (CDN$) | Value | 2007 | (Years) | (CDN$) | Value | ||||||||||||||||||||||||||
| $2.38 | 1,489,251 | 4.3 | — | 496,417 | 4.3 | — | ||||||||||||||||||||||||||||
| $2.40 | 630,000 | 4.7 | — | 210,000 | 4.7 | — | ||||||||||||||||||||||||||||
| $3.75 | 395,000 | 1.6 | — | 395,000 | 1.6 | — | ||||||||||||||||||||||||||||
| $5.50 | 20,000 | 1.8 | — | 20,000 | 1.8 | — | ||||||||||||||||||||||||||||
| $5.75 | 255,000 | 2.6 | — | 255,000 | 2.6 | — | ||||||||||||||||||||||||||||
| $6.50 | 90,000 | 2.2 | — | 90,000 | 2.2 | — | ||||||||||||||||||||||||||||
| 2,879,251 | 3.7 | 3.02 | — | 1,466,417 | 3.1 | 3.50 | — | |||||||||||||||||||||||||||
The aggregate intrinsic value in the preceding table represents the total pre-tax intrinsic value based on the Company’s closing stock price of CDN $1.25 as of December 31, 2007 which would have been received by the stock option holders had all stock option holders exercised their option as of that date. There were no in-the money options as of December 31, 2007, based on the closing market value of the Company’s common shares at that date.
The total fair value of shares vested during the years 2007, 2006 and 2005 was $1,366,404, $590,230 and $607,643 respectively.
The total intrinsic value of options exercised during the years ended December 31, 2007, 2006 and 2005 was $0 respectively.
As of December 31, 2007, there was $2,220,104 of total unrecognized compensation cost related to non-vested share-based compensation arrangements granted under the Plan. That cost is expected to be recognized over a weighted-average period of 2.4 years.
No options to acquire shares of common stock were granted during 2006. During 2007 and 2005 the Company determined the fair value of stock options issued using the modified Black-Scholes option pricing model under the following assumptions:
| December 31, | December 31, | |||
| 2007 | 2005 | |||
| Volatility in the price of the Company’s shares | 71% to 100% | 71% | ||
| Expected dividends | 0% | 0% | ||
| Estimated hold period prior to exercise | 5 years | 5 years | ||
| Risk-free interest rate | 4.0 to 4.3% | 3.0% | ||
| Weighted average fair value per option | $1.55 | $3.6 |
Expected volatilities are based on implied volatilities from historical volatility of the Company’s stock, and other factors. The Company uses historical data to estimate option exercise and employee termination within the valuation model; separate groups of employees that have similar historical exercise behavior are considered separately for valuation purposes. The expected term of options granted is derived from the output of the option valuation model and represents the period of time that options granted are expected to be outstanding; the range given below results from certain groups of employees exhibiting different behavior. The risk-free rate for periods within the contractual life of the option is based on the Canadian dollar yield curve in effect at the time of grant.
F-20
Table of Contents
Notes to Consolidated Financial Statements — (Continued)
| f) | Additional Paid-In Capital |
The following table sets out the changes in additional paid-in capital related to the stock based compensation expense, beneficial conversion feature relating to convertible debt, broker/agent warrants and expired warrants:
Balance at December 31, 2005 | $ | 1,978,420 | ||
| Stock based compensation | 266,919 | |||
| Assignment of lease(1) | 1,093,641 | |||
| Expired warrants | 1,051,031 | |||
| Change in accounting policy | (31,240 | ) | ||
Balance at December 31, 2006 | 4,358,771 | |||
| Stock based compensation | 2,036,933 | |||
| Beneficial conversion feature of convertible debt | 2,589,567 | |||
| Expired warrants | 272,592 | |||
Balance at December 31, 2007 | $ | 9,257,863 | ||
| (1) | 20% of an oil and gas property lease was assigned to the Company for no cash consideration. |
| g) | Per share amounts |
Per share amounts are calculated using the weighted average number of common shares outstanding during the period. The weighted average number and the diluted weighted average number due to options and warrants outstanding, of common shares outstanding during the years ending at December 31, 2007, December 31, 2006 and December 31, 2005 are as follows:
| 2007 | 2006 | 2005 | ||||||||||
| Weighted average number of common shares outstanding during the year | 28,113,395 | 10,283,303 | 8,962,646 | |||||||||
| Diluted weighted average number of common shares outstanding during the year | 28,113,395 | 10,283,303 | 8,962,646 | |||||||||
For 2007, 2006 and 2005 the following stock options and share purchase warrants were excluded from the calculation of diluted weighted average number of share outstanding since the effect is non-dilutive:
2007 — 2,879,251 stock options and 10,370,617 share purchase warrants
2006 — 800,000 stock options and 875,000 share purchase warrants
2005 — 880,000 stock options and 1,164,336 share purchase warrants
In addition, for 2007, common shares issuable upon the conversion option on the Convertible Debt were excluded from the calculation of diluted weighted average number of shares outstanding since the effect is non-dilutive.
| h) | Escrow shares |
Common Shares issued pursuant to the Company’s initial reverse takeover transaction in 2004 and issued pursuant to the United States properties acquisition (the “Acquisition”), and all Common Shares and Options of the principal securityholders of the Corporation are subject to a Tier 2 Value Escrow pursuant to the rules of the TSXV (the “Escrow”). Pursuant to the Escrow, the first release of the securities subject to Escrow (the “Escrow Securities”) was in April 2007, upon the date of the TSXV bulletin confirming final acceptance of the Acquisition. The remainder of the Escrow Securities shall be released 15% at a time, at six-month intervals over a36-month period. At December 31, 2007, 11,332,610 common shares are subject to Escrow.
F-21
Table of Contents
Notes to Consolidated Financial Statements — (Continued)
| i) | Share information |
On September 26, 2007, following prior shareholder approval, the Company consolidated its share capital on a 1 for 5 basis. All share information reflects this consolidation.
| 9. | Convertible debt |
a) On July 4, 2007 the Company closed $25 million in financing though the issuance of a 9% Convertible Senior Secured Debenture (the “Debenture”) and common share warrants. The principal terms and conditions of the Debenture are: Term — 5 years; Interest — 9% per year, payable in kind from the issuance of additional Debentures for the first two years and, if paid in kind, to be added to the total amount outstanding; and Conversion — the principal amount of the Debentures are convertible into common shares at the US equivalent of CDN$3.00 per common share at any time during the term of the debenture. The Company may, at any time after thirty months from issuance, require the holder to convert in the event that the30-day volume-weighted average trading price is above CDN$4.50 and that the average trading volume for such 30 day period meets or exceeds 200,000 shares per day. In connection with the Debenture, the Company issued 4,461,099 share purchase warrants, exercisable at CDN$3.00 until July 3, 2012. The fair values of the Debenture and the warrants were estimated on a relative fair value approach basis.
A beneficial conversion feature (“BCF”) was identified in the amount of $2,589,567 during the assessment of the accounting treatment of the Debenture. This BCF has been deducted from the face amount of the Debenture and is included in Additional Paid in Capital (Note 8e). The net fair value of the debenture is being accreted over its five year term.
The following table sets out the changes in convertible debt during the period:
| Balance at December 31, 2006 | $ | — | ||
| Proceeds | 15,657,588 | |||
| Capitalized interest | 1,135,992 | |||
| Accretion | 422,760 | |||
| Balance at December 31, 2007 | $ | 17,216,340 | ||
b) On February 8, 2007 the Company secured convertible debt facilities allowing Ausam to access up to $17.8 million in financing with a 10% coupon and a conversion price into Common shares at CDN$3.50 per common share. The term of the facilities expires upon the earlier of 120 days from the date of execution of the agreements (June 8, 2007) or five business days after the date on which Ausam raises funds in excess of $17.8 million from the sale of its Australian assets or through the sale and issuance of securities of Ausam. Financing fees of $914,522 were paid in connection with the facilities and are included in financing costs in the statement of operations. No funds were drawn under the facilities and the facilities expired on June 8, 2007.
| 10. | Deferred financing costs |
Deferred financing costs comprise costs associated with the Debenture and are being amortized over the 5 year term of the debenture using the effective interest method.
| 11. | Segmented information: |
The Company’s reportable segments are United States and Australia. The Company is primarily engaged in the exploration and production of oil and natural gas. Initial assets were acquired in the United States on October 2, 2006 and significant additional assets were acquired on February 8, 2007. The Australian operations commenced in 1999, upon the inception of the Company. Corporate comprises the Company’s corporate office in Calgary, Canada.
F-22
Table of Contents
Notes to Consolidated Financial Statements — (Continued)
| Year Ended December 31, 2007 | ||||||||||||||||
| Australia | United States | Corporate | Total | |||||||||||||
| Oil and gas revenue | $ | 130,808 | $ | 241,113 | $ | — | $ | 371,921 | ||||||||
| Interest income | 23,326 | — | 507,408 | 530,734 | ||||||||||||
| Net loss | (9,955,647 | ) | (12,527,860 | ) | (7,666,636 | ) | (30,150,143 | ) | ||||||||
| Financing | 938,418 | 938,418 | ||||||||||||||
| Interest and accretion of convertible debt | — | — | 1,562,699 | 1,562,699 | ||||||||||||
| Depreciation, depletion and amortization expense | 9,446,672 | 10,446,853 | 22,382 | 19,915,907 | ||||||||||||
| Property and equipment — net | 2,167,847 | 44,118,853 | 10,433 | 46,297,133 | ||||||||||||
| Year Ended December 31, 2006 | ||||||||||||||||
| Australia | United States | Corporate | Total | |||||||||||||
| Interest income | $ | 112,003 | $ | — | $ | 140,000 | $ | 252,003 | ||||||||
| Net loss | (2,042,240 | ) | (319,774 | ) | (1,407,070 | ) | (3,769,084 | ) | ||||||||
| Depreciation, depletion and amortization expense | 17,106 | — | 19,946 | 37,054 | ||||||||||||
| Asset write down | 1,535,208 | — | — | 1,535,208 | ||||||||||||
| Property and equipment | 7,608,021 | 1,123,611 | 29,079 | 8,760,711 | ||||||||||||
Prior to 2006, the Company only had one operating segment, which was Australia.
| 12. | Due diligence and acquisition related costs |
During 2005, due diligence and acquisition related costs represent expenses incurred with respect to the investigation and due diligence performed with respect to a potential corporate acquisition in Australia which was not completed.
| 13. | Taxes |
Tax expense:
The combined provision for taxes in the consolidated statement of operations and accumulated deficit reflect an effective tax rate which differs from the expected statutory tax rate. Differences were accounted for as follows:
| 2007 | 2006 | 2005 | ||||||||||
| Loss before taxes | $ | (30,150,143 | ) | $ | (3,769,084 | ) | $ | (9,444,728 | ) | |||
| Statutory income tax rate | 32.12 | % | 34.50 | % | 37.60 | % | ||||||
| Expected income taxes recoverable | (9,684,226 | ) | (1,300,334 | ) | (3,551,218 | ) | ||||||
| Add (deduct): | ||||||||||||
| Difference in foreign statutory rates | (522,543 | ) | 551,103 | 458,881 | ||||||||
| Non-deductible expenditures Non cash compensation | 654,263 | 92,087 | 373,441 | |||||||||
| Other | 149,463 | (8,559 | ) | 113,310 | ||||||||
| Valuation allowance | 9,403,043 | 665,703 | 2,605,586 | |||||||||
| Income taxes recoverable | $ | — | $ | — | $ | — | ||||||
F-23
Table of Contents
Notes to Consolidated Financial Statements — (Continued)
The components of the net deferred income tax asset, as at December 31, 2007 and December 31, 2006, no portion of which has been recorded in these financial statements, are as follows:
| 2007 | 2006 | 2005 | ||||||||||
| Deferred income tax asset: | ||||||||||||
| Losses not utilized | $ | 15,038,326 | $ | 7,876,811 | $ | 5,446,934 | ||||||
| Share issue costs/other | (1,231,243 | ) | 716,449 | 990,146 | ||||||||
| Property, plant and equipment | 708,181 | (2,251,803 | ) | (1,071,835 | ) | |||||||
| Deferred income tax asset before valuation allowance | 14,515,264 | 6,341,457 | 5,365,245 | |||||||||
| Valuation allowance | (14,515,264 | ) | (6,341,457 | ) | (5,365,245 | ) | ||||||
| Net deferred income tax asset | $ | — | $ | — | $ | — | ||||||
In Australia, the Company has non-capital losses available for income tax purposes of approximately $27 million (2006 — $20.9 million) which are available to reduce taxable income in future years. In addition, the Company has capital losses available for income tax purposes of approximately $2.5 million (2006 — $0.9 million) which are available to reduce taxable capital gains in future years. The non-capital and capital losses have indefinite life.
In Canada, the Company has non-capital losses available for income tax purposes in Canada of approximately $10.3 million (2006 — $4.0 million) which are available to reduce taxable income in future years, and expire between 2014 and 2027.
In the United States, the Company has non-capital losses available for income tax purposes in the United States of approximately $9.7 million (2006 — $0.3 million) which are available to reduce taxable income in future years, and expire in 2026 and 2027.
| 14. | Financial instruments: |
Fair value of financial instruments:
The Company’s financial instruments recognized in the balance sheet consist of cash and cash equivalents, accounts receivable, accounts payable, and accrued liabilities. The fair value of these financial instruments approximate their carrying amounts due to their short terms to maturity.
Interest rate risk:
The Company is exposed to fluctuations in interest rates with respect to its cash and short-term investment balance.
Foreign exchange rate risk:
The Company is exposed to fluctuations in Canadian and Australian foreign exchange rates with respect to its cash and short-term investment balance and also foreign currency denominated liabilities.
| 15. | Capital commitments: |
In the United States, in order to maintain exploration and drilling rights on its properties, the Company is required to pay lease rentals to lease holders. In Australia, In order to maintain current rights of tenure to exploration and mining tenements the Company has exploration expenditure requirements up until expiry of the leases. These obligations are subject to renegotiation upon expiry of the leases. The Company has lease rental commitments in the United States and discretionary exploration expenditure requirements in Australia up until expiry of the leases. This table does not include leases or permits where the Company intends to
F-24
Table of Contents
Notes to Consolidated Financial Statements — (Continued)
relinquish its rights, and the amounts are not provided for in the financial statements. Lease rental payments have been estimated for only the next 12 month period, since the continuation of these rentals will be conditional upon exploration and drilling success and are assessed on an ongoing basis. The following summarizes commitments as December 31, 2007:
| Year Ended December 31, 2007 | ||||
| Not later than one year | $ | 1,122,000 | ||
| Later than one year but not later than 2 years | — | |||
| Later than 2 years but not later than 5 years | — | |||
| $ | 1,122,000 | |||
In addition future minimum annual operating lease payments for office space and equipment are as follows:
| 2008 | $ | 198,213 | ||
| 2009 | 176,417 | |||
| 2010 | 173,989 | |||
| 2011 | 173,989 | |||
| 2012 | 68,754 | |||
| Thereafter | — | |||
| $ | 791,362 | |||
Operating lease expenses for the years ended December 31, 2007, 2006 and 2005 were $170,878, $86,190, and $70,103 respectively.
| 16. | Related party transactions |
The following summarizes related party transactions during 2007, 2006 and 2005:
a) Prior to becoming a director on July 5, 2007, a director of the Company participated in and acted as a principal and a broker for a financing that was completed on October 2, 2006 and also participated in and acted as a principal and a broker for three financings completed on February 8, 2007 and, either directly or through companies controlled by him, earned commissions, fees, and broker warrants on funds raised by him. A summary of these transactions follows:
Date | Type of Share/Nature of Transaction | Commissions/ Fees/Dividends | Broker Warrants | |||||
| October 2, 2006 | Common share unit offering | $45,000(1) | — | |||||
| February 8, 2007 | Common share unit offering | $339,105(1) | 124,761 | (1)(4) | ||||
| February 8, 2007 | First Preferred Shares, Series 2 unit offering | $195,000(1) | 65,000 | (1)(5) | ||||
| February 8, 2007 | Convertible debt facility | $700,000(2) | — | |||||
| February 8, 2007 | Acquisition success fee | 117,647 Common shares(3) | — | |||||
| May 14, 2007 | Dividend paid on First Preferred Shares, Series 2 | $103,452 | — | |||||
| July 9, 2007 | Dividend paid on First Preferred Shares, Series 2 | $66,847 | — | |||||
| (1) | Paid/issued to Pembroke Financial Partners, LLC, a company controlled by the director. | |
| (2) | Paid to Pembroke Capital, LLC, a company controlled by the director. |
F-25
Table of Contents
Notes to Consolidated Financial Statements — (Continued)
| (3) | Earned in connection with the US properties acquisition in the amount of US$300,000, payable in 117,647 Common shares of the Company. | |
| (4) | Exercisable at CDN$3.25 per Common share until February 8, 2009. | |
| (5) | Exercisable at CDN$3.75 per Common share until February 8, 2009. |
b) During the year ending December 31, 2007, the Company paid $18,436 (2006 — nil; 2005 — nil) to a company controlled by a director with respect to the use of office space in the United States.
c) As at December 31, 2005, the loan receivable comprised $359,996 of advances to a director and officer. A promissory note, secured by shares of the Company, was signed for the indebtedness, which specified interest at bank prime and full repayment by December 31, 2005. During 2006, $19,310 (2005 — $4,889) of interest was charged on this loan, which is included in interest income. A new promissory note in the amount of CDN$ 397,087, secured by shares of the Company, was signed on March 31, 2006 for the indebtedness outstanding at that time, which specifies interest at bank prime and full repayment by September 20, 2006. The Company agreed to extend the repayment terms until December 31, 2006 and during December 2006, the loan was fully repaid.
d) During the year ended December 31, 2005 Ausam paid $39,431 of management and consulting fees to companies where two directors and an officer of the Company are the shareholders of the respective companies. These fees are included in general and administrative costs.
All related party transactions were in the normal course of operations and have been measured at exchange amounts established and agreed to by the related parties and which are similar to those that Ausam would expect to have negotiated with third parties in similar circumstances.
| 17. | Subsequent events |
a) On January 25, 2008 the directors of the Company approved the granting of 155,000 stock options to key employees, exercisable at a price of CDN$1.65, and exercisable until January 25, 2013.
b) In March, 2008 the directors of the Company approved a plan to dispose of the sharesand/or assets of its wholly owned Australian subsidiary, Ausam Resources Pty Ltd (“ARL”). As part of this plan, the Company engaged an investment advisor and another party in Australia to actively market and sell the shares or assets of ARL. The disposal is expected to be completed by June 30, 2008.
The carrying value of the assets and liabilities of ARL at December 31, 2007 are summarized as follows.
| Currents assets | $ | 141,162 | ||
| Property plant and equipment, net | 2,167,847 | |||
| Current liabilities | (227,229 | ) | ||
| Asset retirement obligation | (69,408 | ) | ||
| Net assets | $ | 2,012,372 | ||
| 18. | Restatement of December 31, 2007 Consolidated Financial Statements |
The Company’s prior December 31, 2007 financial statements did not reflect the effect on the loss per share calculation of the redemption price of preferred shares in excess of cost or the dividend on preferred shares. As a result, the Company is restating its net loss per share before cumulative effect of change in accounting principle and its net loss per common share for the year ended December 31, 2007 to reflect the effect of the redemption price of preferred shares in excess of cost and the dividends of the preferred shares.
F-26
Table of Contents
Notes to Consolidated Financial Statements — (Continued)
This error had the following effect on the loss per share calculation on the Consolidated Statement of Operations and Accumulated Deficit at December 31, 2007 as follows:
| For the Year Ended December 31, 2007 | ||||||||||||
| Loss | Shares | Per-Share | ||||||||||
| (Numerator) | (Denominator) | Amount | ||||||||||
| Loss before cumulative effect of change in accounting principle | $ | (30,150,143 | ) | |||||||||
| Less: Redemption of preferred shares in excess of cost | (1,868,204 | ) | ||||||||||
| Less: Dividend on preferred shares | (336,937 | ) | ||||||||||
| Net loss per share before cumulative change in accounting principle | ||||||||||||
Basic and diluted | ||||||||||||
| Loss applicable to common shareholders | $ | (32,355,284 | ) | 28,113,395 | $ | (1.15 | ) | |||||
| As originally reported | $ | (1.07 | ) | |||||||||
| Total effect of change to loss per share | ||||||||||||
| Basic and diluted | $ | (0.08 | ) | |||||||||
| Net loss per common share | ||||||||||||
Basic and diluted | ||||||||||||
| Loss applicable to common shareholders | $ | (32,355,284 | ) | 28,113,395 | $ | (1.15 | ) | |||||
| As originally reported | $ | (1.07 | ) | |||||||||
| Total effect of change to loss per share | ||||||||||||
| Basic and diluted | $ | (0.08 | ) | |||||||||
SUPPLEMENTARY DISCLOSURES ABOUT OIL AND GAS PRODUCTION ACTIVITIES
(UNAUDITED)
(UNAUDITED)
The following information about the Company’s oil and gas producing activities is presented in accordance with U.S. Statement of Financial Accounting Standards No. 69, “Disclosures About Oil and Gas Producing Activities”.
| A. | Reserve Quantity Information |
Our net proved reserves and changes in those reserves are disclosed below. The net proved reserves represent management’s best estimate of proved oil and natural gas reserves after royalties. Reserve estimates for each property are prepared each year by independent qualified reserves consultants. Estimates of crude oil and natural gas proved reserves are determined through analysis of geological and engineering data, and demonstrate reasonable certainty that they are recoverable from known reservoirs under economic and operating conditions that existed at year end.
| Total | Australia | United States | ||||||||||||||||||||||
| Oil is in mbl and natural gas is in mmcf | Oil | Gas | Oil | Gas | Oil | Gas | ||||||||||||||||||
December 31, 2006 | — | — | — | — | — | — | ||||||||||||||||||
| Extensions and discoveries | 10.6 | 616.3 | 0.9 | 251.4 | 9.7 | 364.9 | ||||||||||||||||||
| Production | (1.3 | ) | (73.3 | ) | (0.6 | ) | (48.4 | ) | (0.7 | ) | (24.9 | ) | ||||||||||||
December 31, 2007 | 9.3 | 543.0 | 0.3 | 203.0 | 9.0 | 340.0 | ||||||||||||||||||
The Company has no proved undeveloped reserves.
F-27
Table of Contents
Notes to Consolidated Financial Statements — (Continued)
| B. | Capitalized Costs |
| Accumulated | ||||||||||||||||
| DD&A and | ||||||||||||||||
| Valuation | Capitalized | |||||||||||||||
| Unevaluated | Proved | Allowances | Costs | |||||||||||||
December 31, 2005 | ||||||||||||||||
| Australia | $ | 10,865,936 | $ | — | $ | (7,159,792 | ) | $ | 3,706,144 | |||||||
| United States | — | — | — | — | ||||||||||||
| Total Capitalized costs | 10,865,936 | — | (7,159,792 | ) | 3,706,144 | |||||||||||
December 31, 2006 | ||||||||||||||||
| Australia | 16,318,789 | — | (8,695,000 | ) | 7,623,789 | |||||||||||
| United States | 1,046,797 | — | — | 1,046,797 | ||||||||||||
| Total Capitalized costs | 17,365,586 | — | (8,695,000 | ) | 8,670,586 | |||||||||||
December 31, 2007 | ||||||||||||||||
| Australia | 10,588,280 | 9,042,940 | (17,497,914 | ) | 2,133,306 | |||||||||||
| United States | 41,363,348 | 12,979,900 | (10,408,877 | ) | 43,934,371 | |||||||||||
| Total Capitalized costs | $ | 51,951,628 | $ | 22,022,840 | $ | (27,906,791 | ) | $ | 46,067,677 | |||||||
| C. | Costs Incurred |
| Australia | United States | Total | ||||||||||
Total Costs Incurred before DD&A | ||||||||||||
Year ended December 31, 2005 | ||||||||||||
| Property Acquisition Costs | ||||||||||||
| Proved | $ | — | $ | — | $ | — | ||||||
| Unevaluated | — | — | — | |||||||||
| Exploration costs | 5,341,072 | — | 5,341,072 | |||||||||
| Development costs | — | — | — | |||||||||
Total costs incurred | 5,341,072 | — | 5,341,072 | |||||||||
Year ended December 31, 2006 | ||||||||||||
| Property Acquisition Costs | ||||||||||||
| Proved | — | — | — | |||||||||
| Unevaluated | — | 1,123,611 | 1,123,611 | |||||||||
| Exploration costs | 5,376,039 | — | 5,376,039 | |||||||||
| Development costs | — | — | — | |||||||||
Total costs incurred | 5,376,039 | 1,123,611 | 6,499,650 | |||||||||
Year ended December 31, 2007 | ||||||||||||
| Property Acquisition Costs | ||||||||||||
| Proved | — | — | — | |||||||||
| Unevaluated | — | 47,750,968 | 47,750,968 | |||||||||
| Exploration costs | 3,389,245 | 6,540,173 | 9,929,418 | |||||||||
| Development costs | — | — | — | |||||||||
Total costs incurred | $ | 3,389,245 | $ | 54,291,141 | $ | 57,680,386 | ||||||
F-28
Table of Contents
Notes to Consolidated Financial Statements — (Continued)
| D. | Results of Operations for Producing Activities |
| Australia | United States | Total | ||||||||||
Year ended December 31, 2007 | ||||||||||||
| Net sales | $ | 130,808 | $ | 241,113 | $ | 371,921 | ||||||
| Production costs | 77,303 | 4,882 | 82,185 | |||||||||
| Depreciation, Depletion, Amortization and Valuation provisions | 8,802,914 | 10,408,877 | 19,211,791 | |||||||||
Loss from operations | $ | (8,749,409 | ) | $ | (10,172,646 | ) | $ | (18,922,055 | ) | |||
The Company had no production in 2006 or 2005.
| E. | Standardized Measure of Discounted Future Net Cash Flows and Changes Therein |
The following disclosure is based on estimates of net proved reserves and the period during which they are expected to be produced. Future cash inflows are computed by applying year-end prices to our after royalty share of estimated annual future production from proved oil and gas reserves. Future development and production costs to be incurred in producing and further developing the proved reserves are based on year-end cost indicators. Future income taxes are computed by applying year-end statutory tax rates. These rates reflect allowable deductions and tax credits, and are applied to the estimated pre-tax future net cash flows.
Discounted future net cash flows are calculated using 10% mid-period discount factors. The calculations assume the continuation of existing economic, operating and contractual conditions. However, such arbitrary assumptions have not proved to be the case in the past. Other assumptions could give rise to substantially different results.
We believe this information does not in any way reflect the current economic value of our oil and gas producing properties or the present value of their estimated future cash flows as:
no economic value is attributed to probable and possible reserves;
use of a 10% discount rate is arbitrary; and
prices change constantly from year-end levels.
There has been no recognition of future income tax on the net realization of the income from the reserves in each geographic segment due to the tax basis of the proved producing properties in each geographic segment exceeding the expected income therefrom.
| December 31, 2007 | ||||||||||||
US$ in thousands | Australia | United States | Total | |||||||||
| Future Cash Inflows | 505 | 3,259 | 3,764 | |||||||||
| Future Production Costs | 131 | 511 | 642 | |||||||||
| Future Development and Capital Costs | — | 17 | 17 | |||||||||
| Future Abandonment and Site Restoration Costs | 75 | 45 | 120 | |||||||||
| Future Income Tax | — | — | — | |||||||||
| Future Net Cash Flows | 298 | 2,686 | 2,984 | |||||||||
| 10% Discount Factor | 81 | 193 | 274 | |||||||||
Standardized Measure | 217 | 2,493 | 2,710 | |||||||||
We had no material proved reserves as of December 31, 2006
F-29
Table of Contents
AUSAM ENERGY CORPORATION
CONSOLIDATED FINANCIAL STATEMENTS
FOR THE NINE MONTHS ENDED SEPTEMBER 30, 2007 (Restated) AND 2006 (unaudited)
F-30
Table of Contents
Consolidated Financial Statements of
AUSAM ENERGY CORPORATION — a development stage enterprise
Consolidated Balance Sheets (unaudited)
AUSAM ENERGY CORPORATION — a development stage enterprise
Consolidated Balance Sheets (unaudited)
| Restated | ||||||||
| (Note 12) | ||||||||
| September 30, | December 31, | |||||||
| 2007 | 2006 | |||||||
ASSETS | ||||||||
Current | ||||||||
| Cash and cash equivalents | $ | 13,578,567 | $ | 2,865,157 | ||||
| Accounts receivable | 224,569 | 110,108 | ||||||
| Prepaid expenses and deposits | 243,669 | 83,257 | ||||||
| 14,046,805 | 3,058,522 | |||||||
| Deferred Costs (note 4) | — | 683,956 | ||||||
| Deferred financing costs (note 8) | 1,806,978 | — | ||||||
| Advances to joint venture partners, net | — | 412,079 | ||||||
| Oil and gas properties utilizing the full cost method of accounting: | ||||||||
| Proved oil and gas properties, net of depletion (note 3a and 7) | 312,862 | — | ||||||
| Unevaluated oil and gas properties, not subject to depletion, net of impairment (note 3a and 7) | 61,408,434 | 8,670,586 | ||||||
| Other property and equipment (note 3b and 7) | 193,459 | 90,125 | ||||||
| $ | 77,768,538 | $ | 12,915,268 | |||||
| LIABILITIES AND SHAREHOLDERS’ EQUITY | ||||||||
Current | ||||||||
| Accounts payable and accrued liabilities | ||||||||
| Financing fees | $ | 85,429 | $ | — | ||||
| Legal and professional | 720,818 | 400,777 | ||||||
| Trade | 1,243,003 | 959,782 | ||||||
| 2,049,250 | 1,360,559 | |||||||
| Advances from joint venture partners, net | 162,737 | — | ||||||
| Asset retirement obligations (note 9) | 472,617 | 166,185 | ||||||
| Convertible debt (note 7) | 16,378,982 | — | ||||||
Shareholders’ Equity | ||||||||
| Preferred shares, no par value, unlimited; shares issued and outstanding: nil (note 5b) | — | — | ||||||
| Common shares (note 5a) | 67,535,831 | 25,923,002 | ||||||
| No par value, shares authorized: unlimited; shares issued and outstanding: 30,368,335 (December 31, 2006 — 10,939,553) | ||||||||
| Share purchase warrants (note 5c) | 11,120,234 | 272,592 | ||||||
| Additional paid-in capital (note 6) | 8,913,760 | 4,358,771 | ||||||
| Accumulated other comprehensive income | 2,794,661 | 734,619 | ||||||
| Deficit (accumulated during development stage) | (31,659,534 | ) | (19,900,460 | ) | ||||
| 58,704,952 | 11,388,524 | |||||||
| $ | 77,768,538 | $ | 12,915,268 | |||||
See accompanying notes to these interim consolidated financial statements.
F-31
Table of Contents
Consolidated Financial Statements of
AUSAM ENERGY CORPORATION — a development stage enterprise
Consolidated Statements of Operations and Accumulated Deficit (unaudited)
AUSAM ENERGY CORPORATION — a development stage enterprise
Consolidated Statements of Operations and Accumulated Deficit (unaudited)
| Cumulative | ||||||||||||
| Nine Months | Nine Months | Period from | ||||||||||
| Ended | Ended | Inception | ||||||||||
| September 30, | September 30, | (December 15, | ||||||||||
| 2007 | 2006 | 1999) | ||||||||||
| Oil and gas revenue | $ | 143,264 | $ | — | $ | 143,264 | ||||||
| Operating costs | (67,865 | ) | — | (67,865 | ) | |||||||
| General and administration expenses (including non-cash compensation of $1,692,830 (2006 — $345,947, Cumulative — $3,418,333) | (6,372,164 | ) | (1,751,744 | ) | (16,552,388 | ) | ||||||
| Due diligence and acquisition related expenses | — | — | (1,367,961 | ) | ||||||||
| Financing | (939,658 | ) | — | (941,332 | ) | |||||||
| Interest on long term debt | (556,290 | ) | — | (556,290 | ) | |||||||
| Accretion of long term debt | (167,104 | ) | — | (158,669 | ) | |||||||
| Interest | (4,647 | ) | — | (169,420 | ) | |||||||
| Asset write-down | — | — | (8,694,999 | ) | ||||||||
| Depreciation, depletion and accretion | (1,977,557 | ) | (24,052 | ) | (2,067,974 | ) | ||||||
| Interest and other income | 388,088 | 193,962 | 1,063,413 | |||||||||
| Net loss | (9,553,933 | ) | (1,581,835 | ) | $ | (29,370,221 | ) | |||||
| Redemption of preferred shares in excess of cost | (1,868,204 | ) | — | |||||||||
| Dividend on preferred shares | (336,937 | ) | — | |||||||||
| Net loss applicable to common stock | $ | (11,759,074 | $ | (1,581,835 | ) | |||||||
| Deficit, beginning of period | ||||||||||||
| Deficit, beginning of period | $ | (19,900,460 | ) | $ | (16,131,376 | ) | ||||||
| Net loss | (9,553,933 | ) | (1,581,835 | ) | ||||||||
| Redemption price of preferred shares in excess of cost | (1,868,204 | ) | — | |||||||||
| Dividend on preferred shares | (336,937 | ) | — | |||||||||
| Deficit, end of period | $ | (31,659,534 | ) | $ | (17,713,211 | ) | ||||||
| Basic and diluted loss per share Restated (Note 12) | $ | (0.43 | ) | $ | (0.16 | ) | ||||||
| Basic | 27,310,818 | 10,064,553 | ||||||||||
| Diluted | 27,310,818 | 10,064,553 | ||||||||||
See accompanying notes to these interim consolidated financial statements.
F-32
Table of Contents
Consolidated Financial Statements of
AUSAM ENERGY CORPORATION — a development stage enterprise
Consolidated Statements of Comprehensive Loss (unaudited)
AUSAM ENERGY CORPORATION — a development stage enterprise
Consolidated Statements of Comprehensive Loss (unaudited)
| Nine Months Ended | Nine Months Ended | |||||||
| September 30, 2007 | September 30, 2006 | |||||||
| Net Loss | $ | (9,553,933 | ) | $ | (1,581,835 | ) | ||
| Unrealized gains (loss) recorded on translation of assets and liabilities of self-sustaining operations | 2,060,042 | (1,430,875 | ) | |||||
| Comprehensive loss | $ | (7,493,891 | ) | $ | (3,012,710 | ) | ||
See accompanying notes to these interim consolidated financial statements.
F-33
Table of Contents
Consolidated Financial Statements of
AUSAM ENERGY CORPORATION — a development stage enterprise
Consolidated Statements of Cash Flows (unaudited)
AUSAM ENERGY CORPORATION — a development stage enterprise
Consolidated Statements of Cash Flows (unaudited)
| Nine Months | Nine Months | Cumulative Period | ||||||||||
| Ended | Ended | from Date of | ||||||||||
| September 30, | September 30, | Inception | ||||||||||
| 2007 | 2006 | Dec 15 1999 | ||||||||||
| Cash provided by (used for): | ||||||||||||
| Operations | ||||||||||||
| Net Loss | $ | (9,553,933 | ) | $ | (1,581,835 | ) | $ | (29,454,393 | ) | |||
| Add (deduct) non-cash items: | ||||||||||||
| Depreciation, depletion and accretion | 1,977,557 | 24,052 | 2,067,974 | |||||||||
| Asset write down | — | — | 8,694,999 | |||||||||
| Stock based compensation | 1,692,830 | 345,947 | 3,418,333 | |||||||||
| Accretion of long term debt | 167,104 | — | 167,104 | |||||||||
| Interest added to principal | 556,290 | — | 556,290 | |||||||||
| Interest converted to equity | — | — | 22,650 | |||||||||
| Shares issued for services | — | — | 186,054 | |||||||||
| Changes in operating assets and liabilities Accounts | ||||||||||||
| receivable | (114,461 | ) | 38,074 | (224,569 | ) | |||||||
| Inventory | — | (7,232 | ) | — | ||||||||
| Prepaid expenses | (160,412 | ) | 15,327 | (243,669 | ) | |||||||
| Accounts payable and accrued liabilities | 304,768 | (218,565 | ) | 1,086,941 | ||||||||
| Cash flows used for operations | (5,130,256 | ) | (1,384,232 | ) | (13,722,286 | ) | ||||||
| Financing activities | ||||||||||||
| Proceeds from issue of common shares and warrants | 17,444,857 | — | 46,994,100 | |||||||||
| Proceeds from issue of preferred shares and warrants | 11,980,451 | — | 11,980,451 | |||||||||
| Share issue costs | (2,180,966 | ) | — | (4,437,424 | ) | |||||||
| Redemption of preferred shares | (11,980,000 | ) | — | (11,980,000 | ) | |||||||
| Dividend on preferred shares | (336,937 | ) | — | (336,937 | ) | |||||||
| Proceeds from issue of convertible debt and warrants | 25,000,000 | — | 25,000,000 | |||||||||
| Issue costs relating to convertible debt and warrants | (1,326,522 | ) | — | (1,326,522 | ) | |||||||
| Decrease in loan receivable from related party | — | 224,694 | — | |||||||||
| Increase in deferred costs | — | (16,056 | ) | — | ||||||||
| 38,600,883 | 208,638 | 65,893,668 | ||||||||||
| Investing activities | ||||||||||||
| Capital asset additions | (25,751,655 | ) | (3,703,603 | ) | (40,520,942 | ) | ||||||
| Cash acquired upon acquisition | — | — | 17,168 | |||||||||
| Decrease/(increase) in advances to joint venture partners | 574,816 | (235,365 | ) | (162,737 | ) | |||||||
| (25,176,839 | ) | (3,938,968 | ) | (40,666,511 | ) | |||||||
| Effect of currency translation on cash balances and cash flows | 2,419,621 | 404,855 | 2,073,695 | |||||||||
| Increase (decrease) in cash and cash equivalents | 10,713,410 | (4,709,706 | ) | 13,578,567 | ||||||||
| Cash and cash equivalents, beginning of period | 2,865,157 | 7,405,760 | — | |||||||||
| Cash and cash equivalents, end of period | $ | 13,578,567 | $ | 2,696,054 | $ | 13,578,567 | ||||||
SUPPLEMENTAL CASH FLOW INFORMATION | ||||||||||||
| Interest paid | $ | 4,647 | $ | — | $ | 4,647 | ||||||
NON-CASH ITEMS | ||||||||||||
| Common shares issued for oil and gas properties | 28,357,672 | — | 28,357,672 | |||||||||
| Interest on convertible debt added to principal | 556,290 | — | 556,290 | |||||||||
| Accretion of long term debt | 167,104 | — | 167,104 | |||||||||
CASH AND CASH EQUIVALENTS CONSIST OF: | ||||||||||||
| Cash in bank | $ | 664,929 | $ | 626,845 | ||||||||
| Term deposits | 12,913,638 | 2,069,209 | ||||||||||
| $ | 13,578,567 | $ | 2,696,054 | |||||||||
See accompanying notes to these interim consolidated financial statements.
F-34
Table of Contents
Consolidated Financial Statements of
AUSAM ENERGY CORPORATION — a development stage enterprise
Consolidated Statements of Changes in Shareholders’ Equity (unaudited)
For the nine months ended September 30, 2007
AUSAM ENERGY CORPORATION — a development stage enterprise
Consolidated Statements of Changes in Shareholders’ Equity (unaudited)
For the nine months ended September 30, 2007
| Accumulated | ||||||||||||||||||||||||||||||||||||||||
| Share Purchase | Additional | Other | Total | |||||||||||||||||||||||||||||||||||||
| Common Stock | Preferred Shares | Warrants | Paid-in | Accumulated | Comprehensive | Shareholders’ | ||||||||||||||||||||||||||||||||||
| Shares | Amount | Shares | Amount | Number | Amount | Capital | Deficit | Income | Equity | |||||||||||||||||||||||||||||||
| $ | $ | $ | $ | $ | $ | $ | ||||||||||||||||||||||||||||||||||
Balance December 31, 2005 | 10,064,553 | 24,649,132 | — | — | 1,164,336 | 1,051,031 | 1,978,420 | (16,131,376 | ) | (143,344 | ) | 11,403,865 | ||||||||||||||||||||||||||||
| Issue of common shares for cash | 875,000 | 1,296,283 | 1,296,283 | |||||||||||||||||||||||||||||||||||||
| Issue costs | (22,413 | ) | (22,413 | ) | ||||||||||||||||||||||||||||||||||||
| Warrants expired | (1,164,336 | ) | (1,051,031 | ) | 1,051,031 | — | ||||||||||||||||||||||||||||||||||
| Noram warrants issued | 875,000 | 272,592 | 272,592 | |||||||||||||||||||||||||||||||||||||
| Stock based compensation | 266,919 | 266,919 | ||||||||||||||||||||||||||||||||||||||
| Assignment of lease | 1,093,641 | 1,093,641 | ||||||||||||||||||||||||||||||||||||||
| Cumulative translation adjustment | 877,961 | 877,961 | ||||||||||||||||||||||||||||||||||||||
| Change in accounting policy | (31,240 | ) | 31,240 | — | ||||||||||||||||||||||||||||||||||||
| Net (loss) | (3,800,324 | ) | (3,800,324 | ) | ||||||||||||||||||||||||||||||||||||
Balance December 31, 2006 | 10,939,553 | 25,923,002 | — | — | 875,000 | 272,592 | 4,358,771 | (19,900,460 | ) | 734,617 | 11,388,524 | |||||||||||||||||||||||||||||
| Issue of common shares and common share warrants for cash pursuant to private placements at $2.70/unit | 6,185,368 | 14,117,712 | 3,092,684 | 2,583,410 | 16,701,122 | |||||||||||||||||||||||||||||||||||
| Issue of preferred shares and common share warrants for cash pursuant to private placements at $3.00/unit | 3,993,333 | 10,358,185 | 1,996,667 | 1,622,266 | 11,980,451 | |||||||||||||||||||||||||||||||||||
| Redemption price of preferred shares, in excess of cost | (293,557 | ) | (293,557 | ) | ||||||||||||||||||||||||||||||||||||
| Broker/agent warrants issued | (162,660 | ) | (50,932 | ) | 248,372 | 213,593 | — | |||||||||||||||||||||||||||||||||
| Issue costs | (1,961,908 | ) | (195,008 | ) | (2,156,916 | ) | ||||||||||||||||||||||||||||||||||
| Redemption of preferred shares | (660,000 | ) | (1,653,955 | ) | (1,653,955 | ) | ||||||||||||||||||||||||||||||||||
| Acquisition fee | 117,647 | 263,036 | 263,036 | |||||||||||||||||||||||||||||||||||||
| Acquisition of properties | 12,683,429 | 28,357,672 | 28,357,672 | |||||||||||||||||||||||||||||||||||||
| Noram warrants expired | (875,000 | ) | (272,592 | ) | 272,592 | — | ||||||||||||||||||||||||||||||||||
| Stock based compensation | 1,167,983 | 1,167,983 | ||||||||||||||||||||||||||||||||||||||
| Cumulative translation adjustment | 1,628,636 | 1,628,636 | ||||||||||||||||||||||||||||||||||||||
| Dividend on preferred shares | (315,032 | ) | (315,032 | ) | ||||||||||||||||||||||||||||||||||||
| Net (loss) | (6,405,733 | ) | (6,405,733 | ) | ||||||||||||||||||||||||||||||||||||
Balance June 30, 2007 | 29,925,997 | 66,536,853 | 3,333,333 | 8,458,290 | 5,337,723 | 4,419,269 | 5,799,346 | (26,914,782 | ) | 2,363,253 | 60,662,232 | |||||||||||||||||||||||||||||
| Issue of common shares and common share warrants for cash pursuant to private placements at $2.70/unit | 251,372 | 601,178 | 126,283 | 142,556 | 743,734 | |||||||||||||||||||||||||||||||||||
| Issue of common share warrants for cash pursuant to convertible debt offering | 4,461,100 | 6,754,845 | 6,754,845 | |||||||||||||||||||||||||||||||||||||
| Equity portion of convertible debt offering | ||||||||||||||||||||||||||||||||||||||||
| Issue of common shares for commitment fee relating to convertible debt offering | 190,968 | 421,849 | 421,849 | |||||||||||||||||||||||||||||||||||||
| Beneficial conversion feature on convertible debt | 2,589,567 | 2,589,567 | ||||||||||||||||||||||||||||||||||||||
| Broker/agent warrants issued | 446,110 | 481,862 | 481,862 | |||||||||||||||||||||||||||||||||||||
| Issue costs | (24,049 | ) | (678,298 | ) | (702,347 | ) | ||||||||||||||||||||||||||||||||||
| Redemption of preferred shares | (3,333,333 | ) | (8,458,290 | ) | (8,458,290 | ) | ||||||||||||||||||||||||||||||||||
| Redemption price of preferred shares, in excess of cost | (1,574,647 | ) | (1,574,647 | ) | ||||||||||||||||||||||||||||||||||||
| Dividend on preferred shares | (21,905 | ) | (21,905 | ) | ||||||||||||||||||||||||||||||||||||
| Stock based compensation | 524,847 | 524,847 | ||||||||||||||||||||||||||||||||||||||
| Cumulative translation adjustment | 431,408 | 431,408 | ||||||||||||||||||||||||||||||||||||||
| Net (loss) | (3,148,200 | ) | (3,148,200 | ) | ||||||||||||||||||||||||||||||||||||
Balance September 30, 2007 Restated (Note 12) | 30,368,337 | 67,535,831 | — | — | 10,371,216 | 11,120,234 | 8,913,760 | (31,659,534 | ) | 2,794,661 | 58,704,952 | |||||||||||||||||||||||||||||
See accompanying notes to these interim consolidated financial statements.
F-35
Table of Contents
Consolidated Financial Statements of
AUSAM ENERGY CORPORATION — a development stage enterprise
(unaudited)
Notes to Consolidated Financial Statements
For the nine months ended September 30, 2007 and 2006
(in United States dollars, except as stated)
AUSAM ENERGY CORPORATION — a development stage enterprise
(unaudited)
Notes to Consolidated Financial Statements
For the nine months ended September 30, 2007 and 2006
(in United States dollars, except as stated)
| 1. | Future Operations and Basis of Presentation |
Ausam Energy Corporation (the “Company” or “Ausam”) is incorporated under the Business Corporations Act (Alberta). The Company is considered to be a development stage enterprise as it has yet to generate significant revenue from operations. Its principal activities relate to oil and gas exploration and development in Australia and the United States.
A portion of the Company’s exploration, development and production activities are conducted jointly with others. These consolidated financial statements reflect only the Company’s proportionate working interest in such activities.
Presently Ausam has no significant production and therefore has incurred negative cash flows from operations, and at this time all exploration activities and overhead expenses are financed by way of equity. Continuing operations and the recovery of petroleum and natural gas property costs is dependent on Ausam’s ability to identify commercial oil and gas reserves, generate profitable operations and access sufficient funds to complete development activities.
The Company’s ability to continue as a going concern is dependent upon obtaining the necessary financing to complete development activities and generate profitable operations from its oil and natural gas interests in the future. The Company’s financial statements as at and for the nine months ended September 30, 2007 have been prepared on a going concern basis, which contemplates the realization of assets and the settlement of liabilities and commitments in the normal course of business. The Company incurred a net loss of $3.8 million, used $2.4, million of cash flow in its operating activities for the year ended December 31, 2006, and had an accumulated deficit accumulated during the development stage of $31.7 million as at September 30, 2007. The Company expects to incur substantial expenditures to further its capital investment programs and the Company’s existing cash balance and cash flow from operating activities may not be sufficient to satisfy its current obligations, including liquidated damages obligations, and meet its capital investment commitments.
To provide additional financing for the Company’s ongoing operations, the Company secured $25 million in financing on July 4, 2007, of which $10 million was used to redeem preferred shares, and the remainder of which will provide additional financing for the Company’s future operations.
The Company’s intention is to build a portfolio of oil and natural gas production, development and exploration opportunities using the capital raised during 2006 and 2007 and future operating activities.
Should the going concern assumption not be appropriate and the Company is not able to realize its assets and settle its liabilities and commitments in the normal course of operations, these consolidated financial statements would require adjustments to the amounts and classifications of assets and liabilities, and these adjustments could be significant.
The consolidated financial statements do not give effect to any adjustments that might be necessary if the Company is unable to continue as a going concern.
The unaudited interim consolidated financial statements reflect all adjustments which are, in the opinion of management, necessary for a fair statement of the results for the interim periods presented. The unaudited consolidated financial information furnished herein reflects all adjustments, which in the opinion of management, are necessary to fairly state the Company’s consolidated financial position and the results of its consolidated operations for the periods presented. The interim financial statements should be read in conjunction with the Company’s consolidated financial statements and notes thereto for the fiscal year ended
F-36
Table of Contents
Consolidated Financial Statements of
AUSAM ENERGY CORPORATION — a development stage enterprise
(unaudited)
Notes to Consolidated Financial Statements — (Continued)
For the nine months ended September 30, 2007 and 2006
(in United States dollars, except as stated)
December 31, 2006. The Company assumes that the users of the interim financial information herein have read or have access to the audited financial statements for the preceding fiscal year and that the adequacy of additional disclosure needed for a fair presentation may be determined in that context. Accordingly, footnote disclosure, which would substantially duplicate the disclosure contained in the Company’s consolidated financial statements and notes thereto for the fiscal year ended December 31, 2006, has been omitted. The results of operations for the nine months ended September 30, 2007 are not necessarily indicative of results that may be expected for the fiscal year ending December 31, 2007.
| 2. | Significant Accounting Policies |
The accounting policies used for the interim consolidated financial statements in accordance with US GAAP are the same as those used to prepare the annual financial statements, except as noted below.
| a) | Foreign currency translation |
Effective July 1, 2007 the functional currency of the Company was changed from the Canadian dollar to the US dollar. As such, revenue and expense transactions denominated in currencies other than the Company’s functional currency are translated into US dollars at the average exchange rates in effect at the time of such transactions. Monetary assets and liabilities are translated at current rates at the balance sheet date. Gains or losses resulting from these translation adjustments are included in other income or expense.
The functional currency of the subsidiary in Australia is the Australian dollar. The Company’s Australian operations are considered self-sustaining and are translated into US dollars using the current rate method. Under this method, assets and liabilities are translated at period-end exchange rates and items included in the statements of operations and retained earnings and cash flows are translated at the rates in effect at the time of the transaction. The gain or loss on translation is charged to accumulated other comprehensive income in shareholders equity. Amounts payable and receivable in foreign currencies are translated to the reporting currency at exchange rates in effect at each balance sheet date. Resulting exchange differences are recognized in determining the profit or loss for the period.
Prior July 1, 2007 the functional currency of the Company was the Canadian dollar. As such, revenue and expense transactions denominated in currencies other than the Company’s functional currency were translated into Canadian dollars at the average exchange rates in effect at the time of such transactions. Monetary assets and liabilities were translated at current rates at the balance sheet date. Gains or losses resulting from these translation adjustments were included in other income or expense. As the Company’s reporting currency is the U.S. dollar, the Canadian dollar consolidated financial statements were translated into U.S. dollars using the current rate method of translation. Gains or losses resulting from this translation are included in accumulated other comprehensive income.
| b) | Income taxes |
In June 2006, the FASB issued Financial Interpretation No. 48, “Accounting for Uncertainty in Income Taxes” (FIN 48), which clarifies the accounting for uncertainty in income taxes recognized in a company’s financial statements in accordance with FASB Statement No. 109, “Accounting for Income Taxes.” The interpretation prescribes a recognition threshold and measurement attribute criteria for the financial statement recognition and measurement of a tax position taken or expected to be taken in a tax return. The interpretation also provides guidance on derecognition, classification, interest and penalties, accounting in interim periods, disclosure and transition.
F-37
Table of Contents
Consolidated Financial Statements of
AUSAM ENERGY CORPORATION — a development stage enterprise
(unaudited)
Notes to Consolidated Financial Statements — (Continued)
For the nine months ended September 30, 2007 and 2006
(in United States dollars, except as stated)
The Company adopted the provisions of FIN 48 on January 1, 2007. The adoption of FIN 48 did not impact the consolidated financial condition, results of operations or cash flows. At January 1, 2007, the Company had unrecognized tax benefits of $1.2 million, of which approximately $0.8 million of non capital losses will expire in January, 2008.
The Company is currently open to audit under the statute of limitations by the Canada Revenue Agency for the years ending December 31, 2000 through 2006. The Company’s United States’ subsidiary is currently open to audit under the statute of limitations by the Internal Revenue Service for the year ending December 31, 2006. The Company’s Australian subsidiary is currently open to audit under the statute of limitations by the Australian Tax Office for the years ending December 31, 2003 through 2006.
The Company and its subsidiaries may from time to time be assessed interest or penalties by major tax jurisdictions, although to date there have been no such assessments. In the event an assessment for interestand/or penalties is received, it will be classified in the financial statements as general and administrative expense.
| 3. | Property and Equipment |
| a. | Oil and gas properties utilizing the full cost method of accounting |
The following table provides a summary of the proved oil and gas properties and the unevaluated oil and gas properties, not subject to depletion.
| Cumulative since | ||||||||||||
| Inception | ||||||||||||
| September 30, | December 31, | December 15, | ||||||||||
| 2007 | 2006 | 1999 | ||||||||||
| $ | $ | $ | ||||||||||
| Oil and Gas Properties: | ||||||||||||
| Proved | ||||||||||||
Australia | ||||||||||||
| Cost | 2,085,398 | — | 2,085,398 | |||||||||
| Less: Accumulated depreciation, depletion and amortization | (1,772,536 | ) | — | (1,772,536 | ) | |||||||
| Total Proved properties | 312,862 | — | 312,862 | |||||||||
| Unproved | ||||||||||||
United States | ||||||||||||
| Acquisition cost | 46,199,183 | (1) | 1,046,797 | 46,199,183 | ||||||||
| Exploration cost | 5,338,755 | — | 5,338,755 | |||||||||
| Total United States | 51,537,938 | 1,046,797 | 51,537,938 | |||||||||
F-38
Table of Contents
Consolidated Financial Statements of
AUSAM ENERGY CORPORATION — a development stage enterprise
(unaudited)
Notes to Consolidated Financial Statements — (Continued)
For the nine months ended September 30, 2007 and 2006
(in United States dollars, except as stated)
| Cumulative since | ||||||||||||
| Inception | ||||||||||||
| September 30, | December 31, | December 15, | ||||||||||
| 2007 | 2006 | 1999 | ||||||||||
| $ | $ | $ | ||||||||||
| Unproved | ||||||||||||
Australia | ||||||||||||
| Acquisition cost | — | — | — | |||||||||
| Exploration cost | 18,565,496 | (2) | 16,318,789 | 18,565,496 | ||||||||
| Total Australia | 18,565,496 | 16,318,789 | 18,565,496 | |||||||||
| Less: Accumulated impairment | (8,695,000 | ) | (8,695,000 | ) | (8,695,000 | ) | ||||||
| Total Australia | 9,870,496 | 7,623,789 | 9,870,496 | |||||||||
Total oil and gas propertiesunproved-net | 61,408,434 | 8,670,586 | 61,408,434 | |||||||||
| (1) | Consist of 20 prospects of which 2 will be included in the depletion and amortization computation in the 4th quarter of 2007, comprising $2,607,834 in oil and gas properties acquisition cost and $5,292,268 in exploration cost. It is anticipated that there will be 6 wells drilled on other prospects during 2008 and, subject to drilling success, the acquisition cost of $21,795,782 and exploration cost of $46,507 plus the additional cost to drill and complete the wells will be included in the depletion and amortization calculation upon their completion, and be depleted on a unit of production basis thereafter. The remaining unproved properties acquisition cost in the amount of $21,795,567 will be evaluated in 2009 and 2010. The drilling program is subject to change depending on the success of the program, the company’s success in farming out part of its interest in the prospects, and the company’s ability to access funds through debt and equity to fund the program. | |
| (2) | Consist of exploration expenditures on permits in Queensland, Australia. It is anticipated that a portion of these properties will be included the depletion and amortization computation at such time following the discovery of reserves and the commencement of oil and gas production on the individual properties, and will be depleted on a unit of production basis. |
The Company excluded from the depletion calculation costs of $70.1 million (2006 — nil) relating to undeveloped properties and included $0.1 million (2006 — nil) of future development costs in the depletion calculation.
During the periods no administration expenses were capitalized.
| 4. | Deferred costs |
At December 31, 2006, these costs totaled $683,956 and comprised legal, professional, financing and other directly related costs with respect to the acquisition of leasehold rights to certain oil and gas properties in Texas, Louisiana, Mississippi, Alabama and Arkansas, and the related financings which closed on February 8, 2007. These costs were allocated to share issue costs ($434,099) and petroleum and natural gas properties ($249,857) in 2007.
F-39
Table of Contents
Consolidated Financial Statements of
AUSAM ENERGY CORPORATION — a development stage enterprise
(unaudited)
Notes to Consolidated Financial Statements — (Continued)
For the nine months ended September 30, 2007 and 2006
(in United States dollars, except as stated)
| 5. | Share Capital |
| a) | Authorized |
Unlimited number of common shares without nominal or par value and unlimited number of preferred shares, issuable in series.
Issued — common shares
| Shares | Amount | |||||||
Balance, December 31, 2005 | 10,064,553 | $ | 24,649,132 | |||||
| Issue of common shares for cash | 875,000 | 1,296,283 | ||||||
| Issue costs | — | (22,413 | ) | |||||
Balance, December 31, 2006 | 10,939,553 | 25,923,002 | ||||||
| Issue of common shares and common share warrants for cash pursuant to private placements at $2.70/unit | 6,185,368 | 14,117,712 | ||||||
| Issue costs | — | (2,124,568 | ) | |||||
| Acquisition fee | 117,647 | 263,036 | ||||||
| Acquisition of properties | 12,683,429 | 28,357,672 | ||||||
| Balance, June 30, 2007 | 29,925,997 | 66,536,853 | ||||||
| Issue of common shares and common share warrants for cash pursuant to private placements at $2.70/unit | 251,372 | 601,178 | ||||||
| Issue of common shares for commitment fee relating to convertible debt offering | 190,968 | 421,849 | ||||||
| Issue costs | — | (24,049 | ) | |||||
Balance, September 30, 2007 | 30,368,337 | $ | 67,535,831 | |||||
| b) | Issued — preferred shares |
| Shares | Amount | |||||||
Balance, December 31, 2006 | $ | — | $ | — | ||||
| Issued for cash | 3,993,333 | 10,358,185 | ||||||
| Issue costs | (245,940 | ) | ||||||
| Redeemed during the period | (3,993,333 | ) | (10,112,245 | ) | ||||
Balance, September 30, 2007 | $ | — | $ | — | ||||
The First Preferred Shares, Series 2 were issued at a price of $3.00 (CDN$3.55) per Series 2 Unit, each such Series 2 Unit consisting of one First Preferred Shares, Series 2 and one half of one common share purchase warrant (the “Series 2 Warrants”), each whole Series 2 Warrant entitling the holder thereof to purchase one Common Share at a price of CDN$3.75 for a period of 24 months from the date of issuance. The preferred shares have an 8% coupon, accrued and payable quarterly, a one year term ending on February 8, 2008 and, upon expiry of such term, convert to Common Shares on a one to one basis.
F-40
Table of Contents
Consolidated Financial Statements of
AUSAM ENERGY CORPORATION — a development stage enterprise
(unaudited)
Notes to Consolidated Financial Statements — (Continued)
For the nine months ended September 30, 2007 and 2006
(in United States dollars, except as stated)
The holders of First Preferred Shares, Series 2 have the right, at any time and from time to time within the Term, to convert their First Preferred Shares, Series 2 into Common Shares of the Company on the basis of one common chare for each First Preferred Share, Series 2; and at any time and from time to time during the Term, after 30 days’ notice from the Company (the “Notice Date”), be required to convert all or a portion of its First Preferred Shares, Series 2 into Common Shares on the basis of one Common Share for each First Preferred Share, Series 2, in the event that the30-day volume-weighted average trading price of the then outstanding Common Shares calculated with respect to the 30 days prior to the Notice Date remains at or above CDN$4.50.
At the option of the board of directors of the Company and in compliance with the provisions of theBusiness Corporations Act(Alberta), the First Preferred Shares, Series 2 or any part thereof, shall be subject to redemption or purchase, at any time or from time to time, at $3.00 per First Preferred Share, Series 2 plus any declared but unpaid dividends. During the six months ended June 30, 2007 two redemptions occurred. On July 8, 2007 all remaining preferred shares were redeemed at $3.00 per share.
| c) | Issued — share purchase warrants |
| Shares | Amount | |||||||
Balance, December 31, 2005 | 1,164,336 | $ | 1,051,031 | |||||
| Expired | (1,164,336 | ) | (1,051,031 | ) | ||||
| Issued for cash (Note 8c) | 875,000 | 272,592 | ||||||
Balance, December 31, 2006 | 875,000 | 272,592 | ||||||
| Issued for cash in connection with common share unit offering | 3,092,684 | 2,583,410 | ||||||
| Issued for cash in connection with preferred share unit offering | 1,996,667 | 1,622,266 | ||||||
| Broker/agent warrants issued | 248,372 | 213,593 | ||||||
| Noram warrants expired | (875,000 | ) | (272,592 | ) | ||||
Balance, June 30, 2007 | 5,337,723 | 4,419,269 | ||||||
| Issued for cash in connection with convertible debt offering | 4,461,100 | 6,754,845 | ||||||
| Issue costs | (678,298 | ) | ||||||
| Broker/agent warrants issued | 446,110 | 481,862 | ||||||
| Issued for cash in connection with common share unit offering | 126,283 | 142,556 | ||||||
Balance, September 30, 2007 | 10,371,216 | $ | 11,120,234 | |||||
As part of the private placements completed in February 2007, the Company issued 5,089,351 share purchase warrants, exercisable at between $CDN 3.25 and 3.75 per common share until February 8, 2009. In connection with the convertible debenture issued on July 5, 2007, the Company issued 4,461,100 share purchase warrants, exercisable at $CDN 3.00 until July 3, 2012. The fair value of the warrants was estimated using the Black-Scholes option-pricing model utilizing the relative fair value approach.
| d) | Issued — Noram warrants |
As at December 31, 2006 there were 875,000 warrants issued and outstanding, exchangeable for one common share of Noram Resources, Inc. (“Noram”) at no extra cost should the acquisition announced on
F-41
Table of Contents
Consolidated Financial Statements of
AUSAM ENERGY CORPORATION — a development stage enterprise
(unaudited)
Notes to Consolidated Financial Statements — (Continued)
For the nine months ended September 30, 2007 and 2006
(in United States dollars, except as stated)
September 22, 2006 fail to close by a certain date. Noram is a wholly owned subsidiary of Ausam that, as a condition of closing of the October 2006 private placement, was assigned a 20% interest in of one of the leases to be acquired from SKH as part of the transaction. As the transaction was successfully completed February 8, 2007, Noram remained a wholly owned subsidiary of Ausam and the warrants expired unexercised. If the transaction had failed to close prior to February 9, 2007, as amended, all of the warrants would automatically have been exchanged according to their terms and the holders of the warrants would become the owners of all of the issued and outstanding shares of Noram. The fair value of the warrants was determined to be the premium paid on a unit basis above the weighted average trading price of the common shares.
| (e) | Stock options |
The only equity compensation plan approved by the Company’s stockholders is its Stock Option Plan, under which the Company’s board of directors is authorized to issue options or other rights to acquire up to 10% of the outstanding common shares of the Company’s common stock, issuable upon exercise of these additional stock options.
The Company has granted options to purchase common shares to certain directors, officers, employees and consultants. Each option permits the holder to purchase one common share at the stated exercise price. The options vest over three years and have a term of five years, or end of service to the Company, which ever occurs first. At the time of grant, the exercise price equals the market price.
The compensation cost that has been charged against income for this plan was $1,692,830 and $345,947 for the nine months ended September 30, 2007 and 2006 respectively. No income tax benefit has been recognized in the income statement for share-based compensation arrangements for 2007 or 2006.
Changes in the number of options, with their weighted average exercise prices, are summarized below:
| For the 9 Months Ended | ||||||||||||||||
| September 30, | September 30, | |||||||||||||||
| 2007 | 2006 | |||||||||||||||
| Weighted Average | Weighted Average | |||||||||||||||
| Number | Exercise Price | Number | Exercise Price | |||||||||||||
| # | CDN$ | # | CDN$ | |||||||||||||
| Outstanding, beginning of period | 800,000 | 4.80 | 880,000 | 4.55 | ||||||||||||
| Granted | 2,119,251 | 2.38 | — | — | ||||||||||||
| Forfeited | (40,000 | ) | 4.75 | (80,000 | ) | 4.75 | ||||||||||
| Outstanding, end of period | 2,879,251 | 3.00 | 800,000 | 4.80 | ||||||||||||
| Options exercisable, end of period | 1,646,417 | 3.50 | 671,667 | 4.60 | ||||||||||||
F-42
Table of Contents
Consolidated Financial Statements of
AUSAM ENERGY CORPORATION — a development stage enterprise
(unaudited)
Notes to Consolidated Financial Statements — (Continued)
For the nine months ended September 30, 2007 and 2006
(in United States dollars, except as stated)
The following table summarizes information about the stock options as at September 30, 2007:
| Options Outstanding | Options Exercisable | |||||||||||||||||||||
| Weighted | Weighted | Weighted | ||||||||||||||||||||
| Average | Weighted | Average | Average | |||||||||||||||||||
| Number | Remaining | Average | Number | Remaining | Exercise | |||||||||||||||||
| Outstanding, | Contractual | Exercise Price | Exercisable, | Contractual | Price | |||||||||||||||||
| Sept 30, 2007 | Life (Years) | (CDN$) | Sept 30, 2007 | Life (years) | (CDN$) | |||||||||||||||||
| 630,000 | 4.9 | 2.40 | 210,000 | 4.9 | 2.40 | |||||||||||||||||
| 1,489,251 | 4.4 | 2.38 | 676,417 | 4.4 | 2.38 | |||||||||||||||||
| 395,000 | 1.9 | 3.75 | 395,000 | 1.9 | 3.75 | |||||||||||||||||
| 20,000 | 2.2 | 5.50 | 20,000 | 2.2 | 5.50 | |||||||||||||||||
| 255,000 | 1.9 | 5.75 | 255,000 | 1.9 | 5.75 | |||||||||||||||||
| 90,000 | 2.6 | 6.50 | 90,000 | 2.6 | 6.50 | |||||||||||||||||
| 2,879,251 | 4.0 | 3.00 | 1,646,417 | 4.0 | 3.50 | |||||||||||||||||
As of September 30, 2007, there was $1,603,636 of total unrecognized compensation cost related to non-vested share-based compensation arrangements granted under the Plan. That cost is expected to be recognized over a weighted-average period of 17 months.
During 2007 the Company determined the fair value of stock options issued using the modified Black-Scholes option pricing model under the following assumptions:
| 2007 | ||||
| 9 months ended September 30 | ||||
| Volatility in the price of the Company’s shares | 71% to 100% | |||
| Expected dividends | 0% | |||
| Estimated hold period prior to exercise | 3 years | |||
| Weighted average risk-free interest rate | 4.1% | |||
| Weighted average fair value per option (CDN$) | $1.30 | |||
Expected volatilities are based on implied volatilities from historical volatility of the Company’s stock, and other factors. The Company uses historical data to estimate option exercise and employee termination within the valuation model; separate groups of employees that have similar historical exercise behavior are considered separately for valuation purposes. The expected term of options granted is derived from the output of the option valuation model and represents the period of time that options granted are expected to be outstanding; the range given below results from certain groups of employees exhibiting different behavior. The risk-free rate for periods within the contractual life of the option is based on the Canadian dollar yield curve in effect at the time of grant.
| f) | Per share amounts |
Per share amounts are calculated using the weighted average number of common shares outstanding during the period. The weighted average number and the diluted weighted average number due to options and
F-43
Table of Contents
Consolidated Financial Statements of
AUSAM ENERGY CORPORATION — a development stage enterprise
(unaudited)
Notes to Consolidated Financial Statements — (Continued)
For the nine months ended September 30, 2007 and 2006
(in United States dollars, except as stated)
warrants outstanding, of common shares outstanding during the nine months ending on September 30, 2007 and September 30, 2006 are as follows:
| 2007 | 2006 | |||||||
| Weighted average number of common shares outstanding during the period | 27,310,818 | 10,064,553 | ||||||
| Diluted weighted average number of common shares outstanding during the period | 27,310,818 | 10,064,553 | ||||||
For 2007 and 2006, the following stock options and share purchase warrants were excluded from the calculation of diluted weighted average number of share outstanding since the effect is non-dilutive:
2007 — 2,879,251 stock options and 10,370,618 share purchase warrants; 2006 — 800,000 stock options and 1,164,336 share purchase warrants.
| g) | Escrow shares |
Common Shares issued pursuant to the Company’s initial reverse takeover transaction in 2004 and issued pursuant to the United States properties acquisition (the “Acquisition”), and all Common Shares and Options of the principal securityholders of the Corporation are subject to a Tier 2 Value Escrow pursuant to the rules of the TSXV (the “Escrow”). Pursuant to the Escrow, the first release of the securities subject to Escrow (the “Escrow Securities”) was in April 2007, upon the date of the TSXV bulletin confirming final acceptance of the Acquisition. The remainder of the Escrow Securities shall be released 15% at a time, at six-month intervals over a36-month period. At September 30, 2007, 13,599,133 common shares are subject to Escrow.
| h) | Share information |
On September 26, 2007, following prior shareholder approval, the Company consolidated its share capital on a 1 for 5 basis. All share information reflects this consolidation.
| 6. | Additional Paid-In Capital |
The following table sets out the changes in additional paid-in capital related to stock based compensation expense and expired warrants:
Balance at December 31, 2006 | $ | 4,358,771 | ||
| Stock based compensation | 1,692,830 | |||
| Expired warrants | 272,592 | |||
| Beneficial conversion feature on convertible debt | 2,589,567 | |||
Balance at September 30, 2007 | $ | 8,913,760 | ||
| 7. | Convertible debt |
a) On July 4, 2007 the Company closed $25 million in financing though the issuance of a 9% Convertible Senior Secured Debenture (the “Debenture”) and common share warrants. The principal terms and conditions of the Debenture are: Term — 5 years; Interest — 9% per year, payable in kind from the issuance of additional Debentures for the first two years; and Conversion — the principal amount of the Debentures are convertible into common shares at the US equivalent of CDN$3.00 per common share at any time during the term of the
F-44
Table of Contents
Consolidated Financial Statements of
AUSAM ENERGY CORPORATION — a development stage enterprise
(unaudited)
Notes to Consolidated Financial Statements — (Continued)
For the nine months ended September 30, 2007 and 2006
(in United States dollars, except as stated)
debenture. The Company may, at any time after thirty months from issuance, require the holder to convert in the event that the30-day volume-weighted average trading price is above CDN$4.50 and that the average trading volume for such 30 day period meets or exceeds 200,000 shares per day. In connection with the Debenture, the Company issued 4,461,099 share purchase warrants, exercisable at $CDN 3.00 until July 3, 2012. The fair values of the Debenture and the warrants were estimated on a relative fair value approach basis. The Debenture is secured by way of a security interest in all of the assets of the Company.
The following table sets out the changes in convertible debt during the period:
| Proceeds | $ | 15,655,588 | ||
| Capitalized interest | 556,290 | |||
| Accretion | 167,104 | |||
| Balance at September 30, 2007 | $ | 16,378,982 | ||
On February 8, 2007 the Company secured convertible debt facilities allowing Ausam to access up to $17.8 million in financing with a 10% coupon and a conversion price into Common shares at CDN$3.50 per common share. The term of the facilities expires upon the earlier of 120 days from the date of execution of the agreements (June 8, 2007) or five business days after the date on which Ausam raises funds in excess of $17.8 million from the sale of its Australian assets or through the sale and issuance of securities of Ausam. Financing fees of $914,522 were paid in connection with the facilities and are included in financing costs in the statement of operations. No funds were drawn under the facilities and the facilities expired on June 8, 2007.
| 8. | Deferred financing costs |
Deferred financing costs comprise costs associated with the Debenture and are being amortized over the 5 year term of the debenture using the effective interest method.
| 9. | Asset Retirement Obligation |
The following table presents the reconciliation of the beginning and ending aggregate carrying amount of the obligation associated with the retirement of oil and gas properties.
| September 30, | September 30, | |||||||
| 2007 | 2006 | |||||||
| Asset retirement obligation, beginning of period | $ | 166,185 | $ | 140,845 | ||||
| Obligations incurred | 262,912 | — | ||||||
| Accretion expense | 10,994 | — | ||||||
| Change due to exchange rates | 32,526 | 2,365 | ||||||
| Asset retirement obligation, end of period | $ | 472,617 | $ | 143,210 | ||||
The undiscounted amount of cash flows, required over the estimated reserve life of the underlying assets, to settle the obligation, adjusted for inflation, is estimated at $437,823. The obligation was calculated using a credit-adjusted risk free discount rate of 9 percent. The majority of expenditures are expected to be incurred between 2009 and 2017.
F-45
Table of Contents
Consolidated Financial Statements of
AUSAM ENERGY CORPORATION — a development stage enterprise
(unaudited)
Notes to Consolidated Financial Statements — (Continued)
For the nine months ended September 30, 2007 and 2006
(in United States dollars, except as stated)
| 10. | Segmented information |
The Company’s reportable segments are United States and Australia. The Company is primarily engaged in the exploration and production of oil and natural gas. The United States assets were acquired on February 8, 2007, and the Australia operations commenced in 1999, upon the inception of the Company. Corporate comprises the Company’s corporate office in Calgary, Canada.
| Nine Months Ended September 30, 2007 | ||||||||||||||||
| Australia | United States | Corporate | Total | |||||||||||||
| Oil and gas revenue | $ | 143,264 | $ | — | $ | — | $ | 143,264 | ||||||||
| Interest and other income | 21,372 | — | 366,716 | 388,088 | ||||||||||||
| Net loss | (2,270,176 | ) | (1,189,603 | ) | (6,094,154 | ) | (9,553,933 | ) | ||||||||
| Financing | — | — | 939,658 | 939,658 | ||||||||||||
| Interest and accretion of convertible debt | — | — | 723,394 | 723,394 | ||||||||||||
| Depreciation, depletion and accretion expense | 1,933,059 | 29,462 | 15,036 | 1,977,557 | ||||||||||||
| Property and equipment | 9,589,260 | 52,307,716 | 17,779 | 61,914,755 | ||||||||||||
Prior to October 2006, the Company only had one operating segment, which was Australia.
| 11. | Related party transactions |
The following summarizes related party transactions during 2007 and 2006:
a) Prior to becoming a director on July 5, 2007, a director of the Company participated in and acted as a principal and a broker for a financing that was completed on October 2, 2006 and also participated in and acted as a principal and a broker for three financings completed on February 8, 2007 and, either directly or through companies controlled by him, earned commissions, fees, and broker warrants on funds raised by him. A summary of these transactions follows:
| Commissions/ | Broker | |||||||||
Date | Type of Share/Nature of Transaction | Fees/Dividends | Warrants | |||||||
| October 2, 2006 | Common share unit offering | $45,000 | (1) | — | ||||||
| February 8, 2007 | Common share unit offering | $339,105 | (1) | 124,761 | (1)(4) | |||||
| February 8, 2007 | First Preferred Shares, Series 2 unit offering | $195,000 | (1) | 65,000 | (1)(5) | |||||
| February 8, 2007 | Convertible debt facility | $700,000 | (2) | — | ||||||
| February 8, 2007 | Acquisition success fee | 117,647 Common shares | (3) | — | ||||||
| May 14, 2007 | Dividend paid on First Preferred Shares, Series 2 | $103,452 | — | |||||||
| July 9, 2007 | Dividend paid on First Preferred Shares, Series 2 | $66,847 | — | |||||||
| (1) | Paid/issued to Pembroke Financial Partners, LLC, a company controlled by the director. | |
| (2) | Paid to Pembroke Capital, LLC, a company controlled by the director. | |
| (3) | Earned in connection with the US properties acquisition in the amount of US$300,000, payable in 117,647 Common shares of the Company. | |
| (4) | Exercisable at CDN$3.25 per Common share until February 8, 2009. |
F-46
Table of Contents
Consolidated Financial Statements of
AUSAM ENERGY CORPORATION — a development stage enterprise
(unaudited)
Notes to Consolidated Financial Statements — (Continued)
For the nine months ended September 30, 2007 and 2006
(in United States dollars, except as stated)
| (5) | Exercisable at CDN$3.75 per Common share until February 8, 2009. |
b) During the nine months ending September 30, 2007, the Company paid $15,436 to a company controlled by a director with respect to the use of office space in the United States.
c) As at September 30, 2006, a loan receivable comprised $135,302 of advances to a director and officer. A promissory note, secured by shares of the Company, was signed for the indebtedness, which specified interest at bank prime and full repayment by December 31, 2006. During the nine months ended September 30, 2006, $18,054 of interest was charged on this loan, which is included in interest income. During December 2006, the loan was fully repaid.
All related party transactions were in the normal course of operations and have been measured at exchange amounts established and agreed to by the related parties and which are similar to those that Ausam would expect to have negotiated with third parties in similar circumstances.
| 12. | Restatement of September 30, 2007 Consolidated Financial Statements |
The Company’s prior September 30, 2007 financial statements did not reflect the beneficial conversion feature on the debenture dated July 6, 2007. As a result the company is restating the Consolidated Balance Sheet as at September 30, 2007 and Consolidated Statements of Changes in Shareholders’ Equity for the nine months ended September 30, 2007 to reflect the beneficial conversion feature of the convertible debenture (Note 7).
This error had the following effect on the Consolidated Balance Sheet, Liabilities and Shareholders’ Equity at September 30, 2007 as follows:
| As Originally | As | |||||||||||
| Reported | Adjusted | Change | ||||||||||
| Convertible debt | $ | 18,968,549 | $ | 16,378,982 | $ | (2,589,567 | ) | |||||
| Additional paid in capital | 6,324,193 | 8,913,760 | 2,589,567 | |||||||||
| Total effect of change to the Consolidated Balance Sheet at September 30, 2007 | $ | 0 | ||||||||||
Also, the Company’s September 30, 2007 financial statements did not reflect the effect on the loss per share calculation of the redemption price of preferred shares in excess of cost or the dividend on preferred shares. As a result the Company is restating its basic and diluted loss per share for the nine months ended September 30, 2007 to reflect the effect of the redemption price of preferred shares in excess of cost and the dividends on preferred shares.
F-47
Table of Contents
Consolidated Financial Statements of
AUSAM ENERGY CORPORATION — a development stage enterprise
(unaudited)
Notes to Consolidated Financial Statements — (Continued)
For the nine months ended September 30, 2007 and 2006
(in United States dollars, except as stated)
This error had the following effect on the loss per share calculation on the Consolidated Statement of Operations and Accumulated Deficit at September 30, 2007 as follows:
| For the Nine Months Ended September 30, 2007 | ||||||||||||
| Loss | Shares | Per-Share | ||||||||||
| (Numerator) | (Denominator) | Amount | ||||||||||
| Loss before cumulative effect of change in accounting principle | $ | (9,553,933 | ) | |||||||||
| Less: Redemption of preferred shares in excess of cost | (1,868,204 | ) | ||||||||||
| Less: Dividend on preferred shares | (336,937 | ) | ||||||||||
| Net loss per common share | ||||||||||||
| Basic and diluted | ||||||||||||
| Loss applicable to common shareholders | $ | (11,759,074 | ) | 27,310,818 | $ | (0.43 | ) | |||||
| As originally reported | $ | (0.35 | ) | |||||||||
| Total effect of change to loss per share | ||||||||||||
| Basic and diluted | $ | (0.08 | ) | |||||||||
F-48
Table of Contents
GLOSSARY OF NATURAL GAS AND OIL TERMS
AU$. Australian dollars.
AFE. Authorization for Expenditure. A document used to estimate the cost of drilling a well or installing major equipment facilities in an oil field. The AFE is submitted to partners in the activity for their authorization and approval of the expenditure. The AFE is a budgetary device; when the project is complete, the operator collects invoices of actual work done and compares it to the AFE, should the project come in under budget, he refunds the balance. If the project has cost overruns, the operator submits additional invoices to the participants.
Bbl. One stock tank barrel, or 42 U.S. gallons liquid volume, used herein in reference to crude oil or other liquid hydrocarbons.
Bod. One stock tank barrel per day.
BOE. One barrel of oil equivalent determined using the ratio of six Mcf of natural gas to one Bbl of crude oil, which approximates the relative energy content between crude natural gas and oil.
Bcf. One billion cubic feet of natural gas.
Bwd. Barrels of water per day.
CDN$. Canadian dollars.
Completion. The installation of permanent equipment for the production of oil or gas, or in the case of a dry hole, the reporting of abandonment to the appropriate agency.
Developed acreage. The number of acres that are allocated or assignable to producing wells or wells capable of production.
Development well. A well drilled within the proved area of a natural gas and oil reservoir to the depth of a stratigraphic horizon known to be productive.
Dry hole or well. A well found to be incapable of producing hydrocarbons in sufficient quantities such that proceeds from the sale of such production exceeds production expenses and taxes.
DST. A drill stem test is a procedure for testing a formation through drill pipe. Often defined as a temporary completion of a well to determine the fluid content of a reservoir and its ability to produce. Formation fluid is recovered in the drill pipe through temporary relief of backpressure imposed on the formation.
Exploration. The search for accumulations of natural gas and oil reserves by any geologic, geophysical, or other means.
Exploratory well. A well drilled to find and produce natural gas and oil reserves not classified as proved, to find a new reservoir in a field previously found to be productive of natural gas and oil in another reservoir or to extend a known reservoir.
Farmin. An agreement where a company joins a joint venture in return for paying for future joint venture operations. The reciprocal side of a Farmout agreement.
Farmout agreement. An agreement between a leaseholder and a party willing to drill natural gas and oil wells on a leasehold property in exchange for assignments from the leaseholder of part or all of the leasehold interests. The agreement is an executory contract in that performance will take place in the future. A farmout agreement will typically (1) outline the future drilling obligations and (2) provide the framework in which the leaseholder will effect the future leasehold assignments, assuming the drilling obligations are met. The leaseholder typically reserves overriding royalty interests at the time that the leaseholder finally executes an assignment.
Field. An area consisting of single reservoir or multiple reservoirs all grouped on or related to the same individual geological structural featureand/or stratigraphic condition.
A-1
Table of Contents
Gross acres or gross wells. The total acres or wells, as the case may be, in which a working interest is owned.
Horizon. A geological layer or strata that may or may not contain oil or natural gas.
Junior Capital Pool Corporation. A junior capital pool (JCP) was a type of corporate structure which allowed a company to issue stock to the public without specifying how the funds would be used. The purpose of a junior capital pool was to provide an easy way forstart-up companies to raise capital from the public. Under a junior capital pool corporatestart-up plan, the principals of a company had to invest a minimum of $100,000 into the company before the junior capital pool can offered shares to the public. The concept for the junior capital pool originated in Alberta, Canada, primarily due to wide-spread speculation regarding the area’s oil reserves, and, by its very nature, a junior capital pool corporation was considered a risky investment by most investors. The junior capital pool concept was only legal in the country of Canada and has since been replaced by the capital pool company program.
MBod. One thousand stock tank barrels per day.
Mcf. One thousand cubic feet of natural gas.
Mcfd. One thousand cubic feet of natural gas per day.
Mcfe. One thousand cubic feet of natural gas equivalent determined using the ratio of six Mcf of natural gas to one Bbl of oil, which approximates the relative energy content between natural gas and oil.
MBbl. One thousand stock tank barrels, or 42,000 U.S. gallons liquid volume, used herein in reference to crude oil or other liquid hydrocarbons.
MMcf. One million cubic feet of natural gas.
MMcfd. One million cubic feet of natural gas per day.
MMcfe. One million cubic feet of natural gas equivalent determined using the ratio of six Mcf of natural gas to one Bbl of oil, which approximates the relative energy content between natural gas and oil.
Net acres or net wells. The sum of the fractional working interests owned in gross acres or gross wells.
NYMEX. The New York Mercantile Exchange, which is the primary exchange on which natural gas futures contracts are traded.
PV(10). When used with respect to natural gas and oil reserves, the estimated future gross revenue to be generated from the production of proved reserves, net of estimated production and future development costs, using prices and costs in effect as of the date indicated, without giving effect to non-property related expenses such as general and administrative expenses, debt service and future income tax expenses or to depreciation, depletion and amortization, discounted using an annual discount rate of 10%.
Productive well. A well that is, or is capable of, producing hydrocarbons in sufficient quantifies such that proceeds from the sale of such production exceed production expenses and taxes.
Proved developed oil and gas reserves. Proved developed oil and gas reserves are reserves that can be expected to be recovered through existing wells with existing equipment and operating methods. Additional oil and gas expected to be obtained through the application of fluid injection or other improved recovery techniques for supplementing the natural forces and mechanisms of primary recovery should be included as “proved developed reserves” only after testing by a pilot project or after the operation of an installed program has confirmed through production response that increased recovery will be achieved.
Proved developed nonproducing reserves. Proved developed reserves expected to be recovered from zones behind casing in existing wells.
Proved oil and gas reserves. Proved oil and gas reserves are the estimated quantities of crude oil, natural gas, and natural gas liquids which geological and engineering data demonstrate with reasonable certainty to be recoverable in future years from known reservoirs under existing economic and operating
A-2
Table of Contents
conditions, i.e., prices and costs as of the date the estimate is made. Prices include consideration of changes in existing prices provided only by contractual arrangements, but not on escalations based upon future conditions.
(i) Reservoirs are considered proved if economic producibility is supported by either actual production or conclusive formation test. The area of a reservoir considered proved includes (A) that portion delineated by drilling and defined by gas-oiland/or oil-water contacts, if any; and (B) the immediately adjoining portions not yet drilled, but which can be reasonably judged as economically productive on the basis of available geological and engineering data. In the absence of information on fluid contacts, the lowest known structural occurrence of hydrocarbons controls the lower proved limit of the reservoir.
(ii) Reserves which can be produced economically through application of improved recovery techniques (such as fluid injection) are included in the “proved” classification when successful testing by a pilot project, or the operation of an installed program in the reservoir, provides support for the engineering analysis on which the project or program was based.
(iii) Estimates of proved reserves do not include the following:
(A) oil that may become available from known reservoirs but is classified separately as “indicated additional reserves”;
(B) crude oil, natural gas, and natural gas liquids, the recovery of which is subject to reasonable doubt because of uncertainty as to geology, reservoir characteristics, or economic factors;
(C) crude oil, natural gas, and natural gas liquids, that may occur in undrilled prospects; and
(D) crude oil, natural gas, and natural gas liquids, that may be recovered from oil shales, coal, gilsonite and other such sources.
Proved undeveloped reserves. Proved undeveloped oil and gas reserves are reserves that are expected to be recovered from new wells on undrilled acreage, or from existing wells where a relatively major expenditure is required for recompletion. Reserves on undrilled acreage shall be limited to those drilling units offsetting productive units that are reasonably certain of production when drilled. Proved reserves for other undrilled units can be claimed only where it can be demonstrated with certainty that there is continuity of production from the existing productive formation. Under no circumstances should estimates, for proved undeveloped reserves be attributable to any acreage for which an application of fluid injection or other improved recovery technique is contemplated, unless such techniques have been proved effective by actual tests in the area and in the same reservoir.
Recompletion. The completion for production of an existing well bore in another formation from that in which the well has been previously completed.
Reservoir. A porous and permeable underground formation containing a natural accumulation of producible oiland/or natural gas that is confined by impermeable rock or water barriers and is individual and separate from other reservoirs.
Royalty interest. An interest in an oil or natural gas property entitling the owner to a share of oil and gas production free of costs of production.
Tcf. Trillion cubic feet of natural gas.
3-D (three dimensional) seismic. Geophysical data that depicts the subsurface strata in three dimensions.3-D seismic data typically provides a more detailed and accurate interpretation of the subsurface strata than two dimensional seismic data.
2-D (two dimensional) seismic. The method by which a cross-section of the earth’s subsurface is created through the interpretation of reflected seismic data collected along a single source profile.
A-3
Table of Contents
Undeveloped acreage. Lease acreage on which wells have not been drilled or completed to a point that would permit the production of commercial quantities of natural gas regardless of whether such acreage contains proved reserves.
Working interest. The operating interest which gives the owner the right to drill, produce and conduct operating activities on the property and a share of production. A working interest pays its share of the costs of drilling and production, as compared to an overriding royalty or royalty interest, which does not pay any costs associated with drilling or production.
Workover. Operations on a producing well to restore or increase production from the currently producing formation.
A-4
Table of Contents
PART II
INFORMATION NOT REQUIRED IN PROSPECTUS
| Item 13. | Other Expenses of Issuance and Distribution |
Set forth below are the expenses expected to be incurred in connection with the issuance and distribution of the securities registered hereby. With the exception of the Securities and Exchange Commission registration fee, the amounts set forth below are estimates.
| Registration fee | $ | 5,207 | ||
| Printing expenses | 210,000 | |||
| Fees and expenses of legal counsel | 233,400 | |||
| Accounting fees and expenses | 764,300 | |||
| Miscellaneous | 0 | |||
| Total | $ | 1,212,907 | ||
| Item 14. | Indemnification of Directors and Officers. |
TheBusiness Corporations Act(Alberta) and our bylaws provide that we will indemnify each of our directors and officers and any person who acts or acted at our request as a director or officer of a body corporate of which we are or were a shareholder or creditor, and the heirs and legal representatives of each of them, against all costs, charges and expenses reasonably incurred by such director, officer or person, and their respective heirs or legal representatives, in respect of any action or proceeding to which any of them is made a party by reason of such director, officer or person being or having served in that position, if: (1) the director, officer or person acted honestly and in good faith with a view to the best interests of us; and (2) in the case of a criminal or administrative action or proceeding that is enforced by a monetary penalty, the director, officer or person had reasonable grounds for believing that his conduct was lawful. As used above, “costs, charges and expenses” includes but is not limited to the fees, charges and disbursements of legal counsel on an as-between-asolicitor-and-the-solicitor’s-own-client basis and an amount paid to settle an action or satisfy a judgment.
The above indemnities will continue in effect after the director or officer resigns his position or his position is terminated for any reason.
Insofar as indemnification for liabilities arising under the Securities Act of 1933 (“Securities Act”) may be permitted to directors, officers or persons controlling us under the indemnification arrangements described above, the Securities and Exchange Commission is of the opinion that this indemnification is against public policy as expressed in the Securities Act and is therefore unenforceable.
We maintain Directors’ and Officers’ Liability coverage in the amount of CDN$10,000,000.
| Item 15. | Recent Sales of Unregistered Securities. |
During the three years preceding the date of this registration statement, we have sold the following securities without registration under the Securities Act:
On November 10, 2004, we closed financings with gross proceeds totalling CDN$7.7 million by way of brokered and non-brokered private placements to accredited investors in Canada, Europe and the United States at CDN$3.75 per Unit. Ausam issued 2,055,108 common shares and 1,027,554 warrants in the financings. Each unit comprised one Common Share and one half of one Common Share purchase warrant where each warrant entitled the holder to acquire one Common Share at a price of CDN$5.00 per share at any time during the twelve months after issuance. Each of the Common Shares and warrants comprising Units were subject to a4-month hold period. On all of these financings Ausam paid aggregate commissions of CDN$423,695 or
II-1
Table of Contents
5.5% of the total amount raised and also issued options to acquire 611,477 common shares at an exercise price of $0.75 per share for a period of 18 months from the date of closing. The brokered portion of the financing, handled by Dundee Securities Corporation, was CDN$4.5 million. These issuances were exempt from registration under the Securities Act pursuant to Section 4(2) of the Securities Act.
On July 21, 2005, pursuant to a private placement to accredited investors, we issued 1,779,057 units, at a price of CDN$4.50 per unit, to purchasers for total gross proceeds of CDN$8,005,755. Each unit consisted of one Common Share and one half of one Common Share purchase warrant where each warrant entitled the holder to acquire one Common Share at a price of CDN$6.00 per share at any time during the twelve months after issuance. We paid aggregate commissions of CDN$297,389 and issued options to acquire 55,378 Common Shares at an exercise price of CDN$6.00 prior to December 1, 2006 to Roche Securities Limited, Private Energy Securities, Inc., and Hythe Securities Limited in connection with this placement. These issuances were exempt from registration under the Securities Act pursuant to Section 4(2) of the Securities Act.
On October 3, 2006, pursuant to a private placement to accredited investors, we issued 4,375,000 units, at a price of CDN$0.40 per Unit, to arms’ length purchasers for total gross proceeds of CDN$1,750,000. Each unit consisted of one pre-consolidation common share in the capital of the Company and one warrant exchangeable for one common share of Noram Resources, Inc. (“Noram”) at no extra cost should the acquisition announced on September 22, 2006, involving the Company, SKH Management L.P., SKH Management II L.P., SKH Management III LLC., SKH Energy Fund, L.P., and Antares Exploration Fund, L.P. fail to close on or prior to January 31, 2007. This term was subsequently extended and the warrants exercised on the closing of the acquisition in February 2007. Commissions of CDN$45,000 were paid to Pembroke Financial Partners in connection with this issuance. These issuances were exempt from registration under the Securities Act pursuant to Section 4(2) of the Securities Act.
On February 8, 2007, we closed a private placement to accredited investors consisting of 6,185,368 units at a price of $2.70 per unit, each unit consisting of one common share in the capital of the Company and one half of one Common Share purchase warrant, each such warrant entitling the holder thereof to purchase one Common Share at a price of CDN$3.25 for a period of 24 months from the date of issuance, for gross proceeds of $16,700,494; 3,993,333 series 2 units (“Series 2 Units”) at a price of $3.00 per Series 2 Unit, each such Series 2 Unit consisting of one first preferred share, series 2 in the capital of the Company (“First Preferred Shares, Series 2”) and one half of one Common Share purchase warrant (the “Series 2 Warrants”), each whole Series 2 Warrant entitling the holder thereof to purchase one Common Share at a price of CDN$3.75 for a period of 24 months from the date of issuance, for gross proceeds of $11,978,000. The First Preferred Shares, Series 2 had a 8% coupon, a term of one year and, upon expiry of such term, would convert to Common Shares on a one to one basis. Holders of the First Preferred Shares, Series 2 were entitled to one vote for each share held at all annual and special meetings of the shareholders of the Company. In total, 5,089,351 warrants to purchase Common Shares were issued. Aggregate gross proceeds from the offering of units and Series 2 Units was approximately $28,680,494. The Company has also secured convertible debt facilities allowing us to access up to $17,800,000 in financing with a 10% coupon and a conversion price of CDN$3.50, resulting in total financing of approximately $46,000,000. Commissions were paid to Research Capital Corporation (CDN$700,000); Pembroke Financial Partners (CDN$534,105); Private Equity Securities Inc. (CDN$8,250); and Northeast Securities (CDN$150,000). These issuances were made to accredited investors and were exempt from registration under the Securities Act pursuant to Section 4(2) of the Securities Act.
On February 8, 2007, we also closed the SKH Purchase, in conjunction with which we issued 12,683,429 Common Shares as partial consideration for the assets acquired. The negotiated value of the Common Shares issued was CDN$1.75 per Common Share.
On July 3, 2007, Ausam entered into an agreement with The Huff Energy Fund, L.P. to issue up to $25,000,000 in 9% Senior Secured Convertible Debenture due July 3, 2012 and an aggregate of 4,461,100 warrants. The Debenture are convertible into Common Shares at CDN$3.00 per Common Share under certain conditions. The warrants may be exercised to purchase Common Shares at a price of CDN$3.00 per Common
II-2
Table of Contents
Share for two years. Commissions of $1,250,000 were paid to COSCO Capital Management LLC in connection with this transaction. In addition, COSCO Capital Management LLC received 223,055 warrants to purchase Common Shares exercisable at a price of CDN$3.00 per Common Share for 24 months from the date of issuance. These issuances were made to accredited investors and were exempt from registration under the Securities Act pursuant to Section 4(2) of the Securities Act.
On September 10, 2007, we closed a private placement to accredited investors consisting of 251,370 units at a price of $2.70 per unit, each unit consisting of one Common Share in the capital of the Company and one half of one Common Share purchase warrant, each such warrant entitling the holder thereof to purchase one Common Share at a price of CDN$3.25 for a period of 24 months from the date of issuance, for gross proceeds of $678,700. All units were sold to accredited investors. No commissions were paid. These issuances were made to accredited investors and were exempt from registration under the Securities Act pursuant to Section 4(2) of the Securities Act. Also, on the same date, we issued 117,647 Common Shares to William M. Hitchcock as payment of an acquisition fee relating to the SKH Purchase.
Options to purchase a total of 2,999,251 shares of our Common Shares have been issued under the Ausam Energy Corporation Option Plan, of which no options to purchase shares have been exercised, options to purchase 120,000 shares have expired unexercised, and options to purchase 2,879,251 shares remain outstanding, of which options to purchase 1,646,417 shares have vested. These issuances were exempt under Section 4(2) of the Securities Act and Rule 701 issued under the Securities Act.
| Item 16. | Exhibits |
��
The following documents are filed as exhibits to this registration statement:
Exhibit Number | Description | |||
| 3 | .1 | Articles of Incorporation of Ausam Energy Corporation | ||
| 3 | .2 | Bylaws of Ausam Energy Corporation | ||
| 4 | .1 | Subscription Agreement dated as of July 3, 2007 among Ausam Energy Corporation, Noram Resources, Inc. and The Huff Energy Fund L.P. | ||
| 4 | .2 | Form of Warrant Certificate dated July 3, 2007 for warrants issued to The Huff Energy Fund, L.P. | ||
| 4 | .3 | Form of Debenture for $25,000,000 9% Senior Secured Convertible Debenture due July 3, 2012 issued by Ausam Energy Corporation and Noram Resources, Inc. | ||
| 4 | .4 | Form of Warrant Certificate dated as of February 9, 2007 for warrants issued in connection with issuance of First Preferred Shares, Series 2 | ||
| 4 | .5 | Form of Warrant Certificates dated as of February 9, 2007 for warrants issued in connection with issuance of Common Shares on February 9, 2007 | ||
| 4 | .6 | Form of Warrant Certificates dated as of September 7, 2007 for warrants issued in connection with issuance of Common Shares on September 7, 2007 | ||
| 4 | .7 | Specimen Common Shares certificate | ||
| 5 | .1 | Opinion of Bennett Jones LLP | ||
| 10 | .1 | Ausam Energy Corporation Option Plan | ||
| 10 | .2 | Employment Agreement with Mark G. Avery | ||
| 10 | .3 | Employment Agreement with Alastair J. Robertson | ||
| 10 | .4 | Employment Agreement with Richard G. Lummis | ||
| 10 | .5 | Employment Agreement with Curtis E. Weddle III | ||
| 10 | .6 | Employment Agreement with Todd A. Regalado | ||
| 10 | .7 | Employment Agreement with Arnold Milton | ||
| 10 | .8 | Employment Agreement with Frank Lytle | ||
| 10 | .9 | Asset Purchase Agreement dated September 21, 2006 between SKH Management L.P., SKH Management II L.P., SKH Management III LLC, SKH Energy Fund L.P. and Antares Exploration Fund, L.P. and Ausam Energy Corporation | ||
| Schedule A Lands and Petroleum and Natural Gas Rights | ||||
| Schedule B Form of Conveyance | ||||
| Schedule C Value Allocation | ||||
| Schedule D Disclosure Schedule | ||||
| Schedule E Interim Report | ||||
II-3
Table of Contents
Exhibit Number | Description | |||
| Schedule F Form of Participation Agreement | ||||
| Schedule G Tax Partnership Provisions and Form of Joint Operating Agreement | ||||
| Schedule H Certificate of Accredited Investor Status | ||||
| 10 | .10 | Registration Rights Agreement with The Huff Energy Fund L.P. | ||
| 10 | .11 | Employment Agreement with Ralph D. Davis | ||
| 10 | .12 | Farmin Agreement between Ausam Resources Pty LTD, Mosaic Oil NL, and Santos (BOL) Pty Ltd | ||
| 10 | .13 | Participation and Right of First Offer Agreement dated January 25, 2008 among Ausam Energy Corporation, SKH Management L.P., SKH Management II, L.P., SKH Management III LLC, SKH Energy Fund L.P., and Antares Exploration Fund L.P. | ||
| 21 | .1 | Subsidiaries of Ausam Energy Corporation | ||
| 23 | .1* | Consent of KPMG LLP | ||
| 23 | .2 | Consent of Bennett Jones LLP (included in Exhibit 5.1) | ||
| 23 | .3 | Consent of GLJ Petroleum Consultants Ltd. | ||
| 24 | .1 | Power of Attorney (included on signature page) | ||
| * | Filed with Amendment No. 5 |
| Item 17. | Undertakings |
Insofar as indemnification by the registrant for liabilities arising under the Securities Act may be permitted to directors, officers and controlling persons of the registrant pursuant to the foregoing provisions, or otherwise, the registrant has been advised that in the opinion of the Securities and Exchange Commission such indemnification is against public policy as expressed in the Securities Act and is, therefore, unenforceable. In the event that a claim for indemnification against such liabilities (other than the payment by the registrant of expenses incurred or paid by a director, officer, or controlling person of the registrant in the successful defense of any action, suit or proceeding) is asserted by such director, officer, or controlling person in connection with the securities being registered hereunder, the registrant will, unless in the opinion of its counsel the matter has been settled by controlling precedent, submit to a court of appropriate jurisdiction the question whether such indemnification by it is against public policy as expressed in the Securities Act and will be governed by the final adjudication of such issue.
The undersigned registrant hereby undertakes:
(1) To file, during any period in which offers or sales are being made, a post-effective amendment to this registration statement:
(i) To include any prospectus required by Section 10(a)(3) of the Securities Act of 1933;
(ii) To reflect in the prospectus any facts or events arising after the effective date of the registration statement (or the most recent post-effective amendment thereof) which, individually or in the aggregate, represent a fundamental change in the information set forth in the registration statement. Notwithstanding the foregoing, any increase or decrease in volume of securities offered (if the total dollar value of securities offered would not exceed that which was registered) and any deviation from the low or high end of the estimated maximum offering range may be reflected in the form of prospectus filed with the Commission pursuant to Rule 424(b) if, in the aggregate, the changes in volume and price represent no more than a 20% change in the maximum aggregate offering price set forth in the “Calculation of Registration Fee” table in the effective registration statement;
(iii) To include any material information with respect to the distribution not previously disclosed in the registration statement or any material change to such information in the registration statement;
(2) That, for the purpose of determining any liability under the Securities Act of 1933, each such post-effective amendment shall be deemed to be a new registration statement relating to the securities
II-4
Table of Contents
offered therein, and the offering of such securities at that time shall be deemed to be the initial bona fide offering thereof.
(3) To remove from registration by means of a post-effective amendment any of the securities being registered which remain unsold at the termination of the offering.
(4) Each prospectus filed pursuant to Rule 424(b) as part of a registration statement relating to an offering shall be deemed to be part of and included in the registration statement as of the date it is first used after effectiveness, provided, however, that no statement made in a registration statement or prospectus that is part of the registration statement or made in a document incorporated or deemed incorporated by reference into the registration statement or prospectus that is part of the registration statement will, as to a purchaser with a time of contract of sale prior to such first use, supersede or modify any statement that was made in the registration statement or prospectus that was part of the registration statement or made in any such document immediately prior to such date of first use.
II-5
Table of Contents
SIGNATURES
Pursuant to the requirements of the Securities Act of 1933, as amended, the Registrant has duly caused this Registration Statement to be signed on its behalf by the undersigned, thereunto duly authorized, in the City of Calgary, Alberta on May 12, 2008.
AUSAM ENERGY CORPORATION
| By: | /s/ Mark G. Avery |
Name: Mark G. Avery
| Title: | Chief Executive Officer and President |
Pursuant to the requirements of the Securities Act of 1933, as amended, this Registration Statement has been signed below by the following persons in the capacities and on the dates indicated.
Signature | Title | Date | ||||
/s/ Mark G. Avery Mark G. Avery | Chief Executive Officer, President and Director (Principal Executive Officer) | May 12, 2008 | ||||
/s/ Alastair J. Robertson* Alastair J. Robertson | Director | May 12, 2008 | ||||
/s/ Richard G. Lummis Richard G. Lummis | Director | May 12, 2008 | ||||
/s/ William M. Hitchcock* William M. Hitchcock | Director | May 12, 2008 | ||||
/s/ Robert Eriksson* Robert Eriksson | Director | May 12, 2008 | ||||
/s/ Barry Borak* Barry Borak | Director | May 12, 2008 | ||||
| *By | /s/ Richard G. Lummis Richard G. Lummis, Attorney-in-fact | May 12, 2008 | ||||
/s/ Ralph D. Davis Ralph D. Davis | Chief Financial Officer (Principal Financial and Accounting Officer) | May 12, 2008 | ||||
II-6
Table of Contents
Index to Exhibits
Exhibit Number | Description | |||
| 3 | .1 | Articles of Incorporation of Ausam Energy Corporation | ||
| 3 | .2 | Bylaws of Ausam Energy Corporation | ||
| 4 | .1 | Subscription Agreement dated as of July 3, 2007 among Ausam Energy Corporation, Noram Resources, Inc. and The Huff Energy Fund L.P. | ||
| 4 | .2 | Form of Warrant Certificate dated July 3, 2007 for warrants issued to The Huff Energy Fund, L.P. | ||
| 4 | .3 | Form of Debenture for $25,000,000 9% Senior Secured Convertible Debenture due July 3, 2012 issued by Ausam Energy Corporation and Noram Resources, Inc. | ||
| 4 | .4 | Form of Warrant Certificate dated as of February 9, 2007 for warrants issued in connection with issuance of First Preferred Shares, Series 2 | ||
| 4 | .5 | Form of Warrant Certificates dated as of February 9, 2007 for warrants issued in connection with issuance of Common Shares on February 9, 2007 | ||
| 4 | .6 | Form of Warrant Certificates dated as of September 7, 2007 for warrants issued in connection with issuance of Common Shares on September 7, 2007 | ||
| 4 | .7 | Specimen Common Shares certificate | ||
| 5 | .1 | Opinion of Bennett Jones LLP | ||
| 10 | .1 | Ausam Energy Corporation Option Plan | ||
| 10 | .2 | Employment Agreement with Mark G. Avery | ||
| 10 | .3 | Employment Agreement with Alastair J. Robertson | ||
| 10 | .4 | Employment Agreement with Richard G. Lummis | ||
| 10 | .5 | Employment Agreement with Curtis E. Weddle III | ||
| 10 | .6 | Employment Agreement with Todd A. Regalado | ||
| 10 | .7 | Employment Agreement with Arnold Milton | ||
| 10 | .8 | Employment Agreement with Frank Lytle | ||
| 10 | .9 | Asset Purchase Agreement dated September 21, 2006 between SKH Management L.P., SKH Management II L.P., SKH Management III LLC, SKH Energy Fund L.P. and Antares Exploration Fund, L.P. and Ausam Energy Corporation | ||
| Schedule A Lands and Petroleum and Natural Gas Rights | ||||
| Schedule B Form of Conveyance | ||||
| Schedule C Value Allocation | ||||
| Schedule D Disclosure Schedule | ||||
| Schedule E Interim Report | ||||
| Schedule F Form of Participation Agreement | ||||
| Schedule G Tax Partnership Provisions and Form of Joint Operating Agreement | ||||
| Schedule H Certificate of Accredited Investor Status | ||||
| 10 | .10 | Registration Rights Agreement with The Huff Energy Fund L.P. | ||
| 10 | .11 | Employment Agreement with Ralph D. Davis | ||
| 10 | .12 | Farmin Agreement between Ausam Resources Pty Ltd, Mosaic Oil NL, and Santors (BOL) Pty Ltd | ||
| 10 | .13 | Participation and Right of First Offer Agreement dated January 25, 2008 among Ausam Energy Corporation, SKH Management L.P., SKH Management II, L.P., SKH Management III LLC, SKH Energy Fund L.P., and Antares Exploration Fund L.P. | ||
| 21 | .1 | Subsidiaries of Ausam Energy Corporation | ||
| 23 | .1* | Consent of KPMG LLP | ||
| 23 | .2 | Consent of Bennett Jones LLP (included in Exhibit 5.1) | ||
| 23 | .3 | Consent of GLJ Petroleum Consultants Ltd. | ||
| 24 | .1 | Power of Attorney (included on signature page). | ||
| * | Filed with Amendment No. 5 |
II-7