Exhibit 99.5
MANAGEMENT’S DISCUSSION AND ANALYSIS
Management’s discussion and analysis (“MD&A”) of the financial condition and results of operations of Harvest Energy Trust should be read in conjunction with our audited consolidated financial statements and accompanying notes for the years ended December 31, 2007 and 2006, our MD&A for the year ended December 31, 2007 as well as our interim consolidated financial statements and notes for the three and nine month periods ended September 30, 2008 and 2007. The information and opinions concerning our future outlook are based on information available at November 12, 2008.
In this MD&A, reference to “Harvest”, “we”, “us” or “our” refers to Harvest Energy Trust and all of its controlled entities on a consolidated basis. All references are to Canadian dollars unless otherwise indicated. Tabular amounts are in thousands of dollars unless otherwise stated. Natural gas volumes are converted to barrels of oil equivalent (“boe”) using the ratio of six thousand cubic feet (“mcf”) of natural gas to one barrel of oil (“bbl”). Boes may be misleading, particularly if used in isolation. A boe conversion ratio of 6 mcf to 1 bbl is based on an energy equivalent conversion method primarily applicable at the burner tip and does not represent a value equivalent at the wellhead. In accordance with Canadian practice, petroleum and natural gas revenues are reported on a gross basis, before deduction of Crown and other royalties. In addition to disclosing reserves under the requirements of National Instrument 51-101, we also disclose our reserves on a company interest basis which is not a term defined under National Instrument 51-101. This information may not be comparable to similar measures by other issuers.
In this MD&A, we use certain financial reporting measures that are commonly used as benchmarks within the petroleum and natural gas industry such as Earnings From Operations, Cash General and Administrative Expenses and Operating Netbacks and with respect to the refining industry, Earnings from Operations and Gross Margin which are each defined in this MD&A. These measures are not defined under Canadian generally accepted accounting principles (“GAAP”) and should not be considered in isolation or as an alternative to conventional GAAP measures. Certain of these measures are not necessarily comparable to a similarly titled measure of another issuer. When these measures are used, they are defined as “Non-GAAP measures” and should be given careful consideration by the reader. Please refer to the discussion under the heading “Non-GAAP Measures” at the end of this MD&A for a detailed discussion of these measures.
FORWARD-LOOKING INFORMATION
This MD&A highlights significant business results and statistics from our consolidated financial statements for the three and nine month periods ended September 30, 2008 and the accompanying notes thereto. In the interest of providing our Unitholders and potential investors with information regarding Harvest, including our assessment of our future plans and operations, this MD&A contains forward-looking statements that involve risks and uncertainties. Such risks and uncertainties include, but are not limited to, risks associated with conventional petroleum and natural gas operations; risks associated with refining and marketing operations, the volatility in commodity prices and currency exchange rates; risks associated with realizing the value of acquisitions; general economic, market and business conditions; changes in environmental legislation and regulations; the availability of sufficient capital from internal and external sources and such other risks and uncertainties described from time to time in our regulatory reports and filings made with securities regulators.
Forward-looking statements in this MD&A include, but are not limited to the forward looking statements made in the “Outlook” section as well as statements made throughout with reference to, production volumes, refinery throughput volumes, royalty rates, operating costs, commodity prices, administrative costs, price risk management activity, acquisitions and dispositions, capital spending, reserve estimates, distributions, access to credit facilities, capital taxes, income taxes, cash from operating activities and regulatory changes. For this purpose, any statements that are contained herein that are not statements of historical fact may be deemed to be forward-looking statements. Forward-looking statements often contain terms such as “may”, “will”, “should”, “anticipate”, “expects”, and similar expressions.
1
Readers are cautioned not to place undue reliance on forward-looking statements as there can be no assurance that the plans, intentions or expectations upon which they are based will occur. Although we consider such information reasonable, at the time of preparation, it may prove to be incorrect and actual results may differ materially from those anticipated. We assume no obligation to update forward-looking statements should circumstances, estimates or opinions change, except as required by law. Forward-looking statements contained in this MD&A are expressly qualified by this cautionary statement.
Consolidated Financial and Operating Highlights – Third Quarter 2008
| | |
| • | Cash from operating activities was $133.5 million during the Third Quarter of 2008 and $191.0 million for the same period in the prior year compared to the more traditional non-GAAP measure of cash from operating activities before changes in non-cash working capital and settlement of asset retirement obligations of $208.9 million for the Third Quarter of 2008 and $136.2 million for the same period in 2007. |
| | |
| • | During the Third Quarter, monthly distributions were maintained at $0.30 per Trust Unit representing a payout ratio of 104% of cash from operating activities and 66% of cash from operating activities before changes in non-cash working capital and settlement of asset retirement obligations. |
| | |
| • | Upstream operating cash flow of $296.5 million as compared to $149.7 million in the prior year reflects the strength of commodity prices in 2008 with average daily production of 54,926 boe/d as compared to 59,961 boe/d in the prior year. |
| | |
| • | Upstream capital spending of $69.1 million drilling 67 wells with a success ratio of 100% including 18 wells in southeast Saskatchewan and 8 horizontal wells in the Lloydminster/Hayter area. |
| | |
| • | Downstream operating cash flow of $47.2 million reflecting reliable refinery operations with reduced levels of throughput enhancing profitability by minimizing the volume of high sulphur fuel oil produced. |
| | |
| • | Balance sheet liquidity maintained with $400 million of undrawn committed credit lines available and no material debt maturities prior to April 2010. |
2
SELECTED INFORMATION
The table below provides a summary of our financial and operating results for three and nine month periods ended September 30, 2008 and 2007.
| | | | | | | | | | | | | | | | | |
| | | | | |
| | Three Months Ended September 30 | | Nine Months Ended September 30 | |
| | | | | | | | | | | | | | |
| | | | | | | | | | | | | |
($000s except where noted) | | 2008 | | 2007 | | Change | | 2008 | | 2007 | | Change | |
| | | | | | | | | | | | | | |
| | | | | | | | | | | | | | | | | |
Revenue, net(1) | | | 1,597,195 | | | 1,031,514 | | 55 | % | | 4,596,625 | | | 3,190,476 | | 44 | % |
| | | | | | | | | | | | | | | | | |
Cash From Operating Activities | | | 133,493 | | | 191,049 | | (30 | %) | | 472,147 | | | 553,315 | | (15 | %) |
Per Trust Unit, basic | | $ | 0.87 | | $ | 1.31 | | (34 | %) | $ | 3.11 | | $ | 4.09 | | (24 | %) |
Per Trust Unit, diluted | | $ | 0.84 | | $ | 1.22 | | (31 | %) | $ | 2.95 | | $ | 3.74 | | (21 | %) |
| | | | | | | | | | | | | | | | | |
Net Income(2) | | | 295,788 | | | 11,811 | | 2,404 | % | | 133,379 | | | 87,909 | | 52 | % |
Per Trust Unit, basic | | $ | 1.93 | | $ | 0.08 | | 2,313 | % | $ | 0.88 | | $ | 0.65 | | 35 | % |
Per Trust Unit, diluted | | $ | 1.73 | | $ | 0.08 | | 2,063 | % | $ | 0.88 | | $ | 0.65 | | 35 | % |
| | | | | | | | | | | | | | | | | |
Distributions declared | | | 138,511 | | | 166,271 | | (17 | %) | | 410,678 | | | 465,598 | | (12 | %) |
Distributions declared, per Trust Unit | | $ | 0.90 | | $ | 1.14 | | (21 | %) | $ | 2.70 | | $ | 3.42 | | (21 | %) |
Distributions declared as a percentage Of Cash From Operating Activities | | | 104 | % | | 87 | % | 17 | % | | 87 | % | | 84 | % | 3 | % |
| | | | | | | | | | | | | | | | | |
Bank debt | | | | | | | | | | | 1,199,773 | | | 1,205,119 | | 0 | % |
77/8% Senior Notes | | | | | | | | | | | 260,120 | | | 241,628 | | 8 | % |
Convertible Debentures(3) | | | | | | | | | | | 824,771 | | | 650,440 | | 27 | % |
Total long-term debt(3) | | | | | | | | | | | 2,284,664 | | | 2,097,187 | | 9 | % |
| | | | | | | | | | | | | | | | | |
Total assets | | | | | | | | | | | 5,659,227 | | | 5,585,651 | | 1 | % |
| | | | | | | | | | | | | | | | | |
UPSTREAM OPERATIONS | | | | | | | | | | | | | | | | | |
Daily Production | | | | | | | | | | | | | | | | | |
Light to medium oil (bbl/d) | | | 25,210 | | | 27,401 | | (8 | %) | | 25,362 | | | 27,342 | | (7 | %) |
Heavy oil (bbl/d) | | | 11,485 | | | 14,217 | | (19 | %) | | 12,182 | | | 14,845 | | (18 | %) |
Natural gas liquids (bbl/d) | | | 2,627 | | | 2,219 | | 18 | % | | 2,575 | | | 2,350 | | 10 | % |
Natural gas (mcf/d) | | | 93,628 | | | 96,737 | | (3 | %) | | 96,394 | | | 98,682 | | (2 | %) |
Total daily sales volumes (boe/d) | | | 54,926 | | | 59,961 | | (8 | %) | | 56,184 | | | 60,984 | | (8 | %) |
| | | | | | | | | | | | | | | | | |
Operating Netback ($/boe) | | | 60.38 | | | 28.69 | | 110 | % | | 56.08 | | | 28.95 | | 94 | % |
| | | | | | | | | | | | | | | | | |
Cash capital expenditures | | | 69,098 | | | 73,323 | | (6 | %) | | 188,337 | | | 270,031 | | (30 | %) |
| | | | | | | | | | | | | | | | | |
DOWNSTREAM OPERATIONS | | | | | | | | | | | | | | | | | |
Average daily throughput (bbl/d) | | | 99,127 | | | 103,983 | | (5 | %) | | 103,832 | | | 111,052 | | (7 | %) |
Aggregate throughput (mbbl) | | | 9,120 | | | 9,566 | | (5 | %) | | 28,449 | | | 30,317 | | (6 | %) |
| | | | | | | | | | | | | | | | | |
Average Refining Margin (US$/bbl) | | | 10.47 | | | 3.08 | | 240 | % | | 8.38 | | | 10.57 | | (21 | %) |
| | | | | | | | | | | | | | | | | |
Cash capital expenditures | | | 17,199 | | | 12,468 | | 38 | % | | 31,845 | | | 27,222 | | 17 | % |
| | | | | | | | | | | | | | | | | | |
| |
(1) | Revenues are net of royalties. |
| |
(2) | Net Income includes a future income tax expense of $149.5 million and $32.5 million for the three and nine months ended September 30, 2008 respectively (future income tax recovery of $54.4 million and future tax expense of $123.3 million for the three and nine months ended September 30, 2007) and an unrealized net gain from risk management activities of $359.7 million and a net loss of $6.3 million for the three and nine months ended September 30, 2008 respectively (loss of $21.9 million and loss of $25.0 million for the three and nine months ended September 30, 2007). |
| |
(3) | Includes current portion of Convertible Debentures. |
3
REVIEW OF OVERALL PERFORMANCE
Harvest is an integrated energy trust with our petroleum and natural gas operations focused on the operation and further development of assets in western Canada (“upstream operations”) and our refining and marketing business focused on the safe operation of a medium gravity sour crude hydrocracking refinery and a retail and wholesale petroleum marketing business both located in the Province of Newfoundland and Labrador (“downstream operations”).
During the Third Quarter of 2008, cash from operating activities of $133.5 million is comprised of cash flow contributions of $296.5 million and $47.2 million from the upstream and downstream operations, respectively, offset by a $72.4 million increase in working capital requirements, $94.5 million of cash settlements from our risk management activities and $43.2 million of financing and other costs. The year-over-year $57.6 million reduction in cash flow from operating activities is primarily attributed to a $130.2 million change in working capital requirements, a $92.7 million increase in cash settlements from our price risk management contracts and a $51.7 million drop in realized foreign exchange gains offset by a $146.8 increase in the contribution from our upstream operations along with a $70.6 million improvement from our downstream operations.
Our monthly distributions of $0.30 per Trust Unit during the Third Quarter represent 104% of our cash from operating activities and 66% of cash from operating activities before changes in non-cash working capital and settlement of asset retirement obligations. We have declared monthly distributions of $0.30 per Trust Unit for November and December of 2008 as well as January and February of 2009. Unitholder participation in our distribution reinvestment programs has generated $35.2 million of equity capital in the Third Quarter reflecting a 25% average level of participation.
Cash flow provided from our upstream operations totaled $296.5 million during the Third Quarter of 2008 as compared to $149.7 million in the prior year. The primary factors associated with the improvement were the strength of Canadian crude oil prices during 2008 which reflected a 57% increase in the WTI benchmark price, a stable Canadian dollar relative to the US dollar and much tighter heavy oil differentials. During the quarter, our average realized price of $90.15 per boe was 3% lower than the $93.29 in the prior quarter and significantly improved compared to $54.15 in the prior year while our average daily production of 54,926 boe/d during the quarter and 55,574 in the Second Quarter of 2008 reflects a natural decline from 59,961 in the Third Quarter of 2007. Midway through the Third Quarter of 2008, we bolstered our production with the acquisition of light/medium oil and natural gas assets producing approximately 2,650 boe/d. Our operating costs averaged $14.51 per boe during the quarter essentially unchanged from $14.45 in the Second Quarter of 2008 with lower spending spread over a reduced volume during the Third Quarter of 2008. Our netback averaged $60.38 per boe during the quarter as compared to $62.99 in the Second Quarter of 2008 and $28.69 in the Third Quarter of the prior year.
Cash flow from our downstream operations of $47.2 million was a substantial improvement over the breakeven performance in the prior quarter and the cash flow deficiency of $23.4 million in the Third Quarter of 2007. As compared with the prior year, the current quarter reflects a substantial improvement in distillate margins along with an improved yield of distillate products and a reduced yield of lower valued high sulphur fuel oil (“HSFO”). Our average cost of crude oil feedstock relative to the WTI benchmark price was also much improved in the current quarter as compared to the prior year. Offsetting these improvements was a much weaker margin for gasoline products as well as a higher cost for purchased energy to provide heat to the refining processes. During the quarter, our average refining margin was US$10.47 per barrel of throughput, a US$4.81 improvement over the prior quarter and a US$7.39 improvement over the Third Quarter of the prior year. While we achieved very reliable refinery operations with no unplanned disruptions, our throughput averaged 99,127 bbls/d during the quarter as crude oil feedstock was reduced to minimize the production of HSFO as compared to throughput of 103,983 bbls/d in the Third Quarter of the prior year when throughput was constrained as the refinery entered a significant turnaround.
At the end of September 2008, we had $400.2 million of available credit under our $1.6 billion Extendible Revolving Credit Facility with our bank debt to annualized earnings before interest, taxes, depreciation and amortization (“EBITDA”) ratio at 1.5 times.
4
Business Segments
The following table presents selected financial information for our two business segments:
| | | | | | | | | | | | | |
| | |
| | Three Months Ended September 30 | |
| | | | | | |
| | 2008 | | 2007 | |
| | | | | |
| | | | | | | | | | | | | |
(in $000s) | | Upstream | | Downstream | | Total | | Upstream | | Downstream | | Total | |
| | | | | | | | | | | | | | |
Revenue(1) | | 382,297 | | 1,214,898 | | 1,597,195 | | 241,902 | | 789,612 | | 1,031,514 | |
| | | | | | | | | | | | | |
Earnings (Loss) From Operations(2) | | 195,380 | | 30,509 | | 225,889 | | 41,026 | | (39,610 | ) | 1,416 | |
Capital expenditures | | 69,098 | | 17,199 | | 86,297 | | 73,323 | | 12,468 | | 85,791 | |
Total assets(3) | | 3,982,397 | | 1,670,107 | | 5,659,227 | | 4,085,988 | | 1,499,663 | | 5,585,651 | |
| | | | | | | | | | | | | | |
| | | | | | | | | | | | | |
| | | |
| | Nine Months Ended September 30 | |
| | | | | | |
| | 2008 | | 2007 | |
| | | | | |
| | | | | | | | | | | | | |
(in $000s) | | Upstream | | Downstream | | Total | | Upstream | | Downstream | | Total | |
| | | | | | | | | | | | | | |
Revenue(1) | | 1,092,182 | | 3,504,443 | | 4,596,625 | | 716,432 | | 2,474,044 | | 3,190,476 | |
Earnings From Operations(2) | | 507,059 | | 22,556 | | 529,615 | | 112,726 | | 154,924 | | 267,650 | |
Capital expenditures | | 188,337 | | 31,845 | | 220,182 | | 270,031 | | 27,222 | | 297,253 | |
Total assets(3) | | 3,982,397 | | 1,670,107 | | 5,659,227 | | 4,085,988 | | 1,499,663 | | 5,585,651 | |
| | | | | | | | | | | | | | |
| |
(1) | Revenues are net of royalties. |
| |
(2) | These are non-GAAP measures; please refer to “Non-GAAP Measures” in this MD&A. |
| |
(3) | Total assets on a consolidated basis as at September 30, 2008 include $6.7 million (2007 - $22.2 million) relating to the fair value of risk management contracts. |
Our upstream and downstream operations are each discussed separately in the sections that follow. Additionally, we have included a section entitled ‘Risk Management, Financing and Other’ that discusses, among other things, our cash flow risk management program.
5
UPSTREAM OPERATIONS
Third Quarter Highlights
| | |
| • | Operating cash flow of $296.5 million, an improvement of $146.8 million over the Third Quarter of the prior year, reflecting the year-over-year strength of crude oil prices as well as a tightening of quality differentials. |
| | |
| • | Average daily production of 54,926 boe/d as compared to production of 55,574 boe/d in the Second Quarter of 2008 reflecting our stable production of light to medium oil and natural gas. |
| | |
| • | Aggregate operating cost expenditures were approximately 9% lower than the Third Quarter of the prior year while our unit operating costs of $14.51 are essentially unchanged from $14.54 in the prior year as the average daily production in the Third Quarter of 2007 was approximately 5,000 boe/d greater than the Third Quarter of 2008. |
| | |
| • | Operating netback of $60.38 per boe, representing a $31.69 (110%) increase over the prior year, attributed primarily to substantially higher commodity prices. |
| | |
| • | Completed two acquisitions for aggregate cash consideration of $167.6 million, acquiring 2,650 boe/d of production representing an average cost per flowing barrel of approximately $63,000 comprised of 1,645 bbls/d of light oil and 6,200 mcf/d of natural gas. |
| | |
| • | Capital spending of $69.1 million included the drilling of 67 wells (34.7 on a net basis) with a 100% success rate which brings the total wells drilled in 2008 to 165 (102.1 net wells) |
Summary of Financial and Operating Results
| | | | | | | | | | | | | | | | | | | |
| | |
| | Three Months Ended September 30 | | Nine Months Ended September 30 | |
(in $000s except where noted) | | 2008 | | 2007 | | Change | | 2008 | | 2007 | | Change | |
| | | | | | | | | | | | | | |
|
Revenues | | | 455,565 | | | 298,708 | | | 53 | % | | 1,304,664 | | | 876,435 | | | 49 | % |
Royalties | | | (73,268 | ) | | (56,806 | ) | | 29 | % | | (212,482 | ) | | (160,003 | ) | | 33 | % |
| | | | | | | | | | | | | | | | | | | | |
Net revenues | | | 382,297 | | | 241,902 | | | 58 | % | | 1,092,182 | | | 716,432 | | | 52 | % |
| | | | | | | | | | | | | | | | | | | |
Operating expenses | | | 73,314 | | | 80,189 | | | (9 | %) | | 218,729 | | | 224,818 | | | (3 | %) |
General and administrative | | | 2,148 | | | 4,159 | | | (48 | %) | | 26,766 | | | 30,324 | | | (12 | %) |
Transportation and marketing | | | 3,855 | | | 3,412 | | | 13 | % | | 10,232 | | | 9,599 | | | 7 | % |
Depreciation, depletion, amortization and accretion | | | 107,600 | | | 113,116 | | | (5 | %) | | 329,396 | | | 338,965 | | | (3 | %) |
| | | | | | | | | | | | | | | | | | | | |
| | | | | | | | | | | | | | | | | | | |
Earnings From Operations(1) | | | 195,380 | | | 41,026 | | | 376 | % | | 507,059 | | | 112,726 | | | 350 | % |
| | | | | | | | | | | | | | | | | | | |
Cash capital expenditures (excluding acquisitions) | | | 69,098 | | | 73,323 | | | (6 | %) | | 188,337 | | | 270,031 | | | (30 | %) |
Property and business acquisitions, net of dispositions | | | 132,130 | | | 139,378 | | | (5 | %) | | 127,581 | | | 148,530 | | | (14 | %) |
| | | | | | | | | | | | | | | | | | | |
Daily sales volumes | | | | | | | | | | | | | | | | | | | |
Light to medium oil (bbl/d) | | | 25,210 | | | 27,401 | | | (8 | %) | | 25,362 | | | 27,342 | | | (7 | %) |
Heavy oil (bbl/d) | | | 11,485 | | | 14,217 | | | (19 | %) | | 12,182 | | | 14,845 | | | (18 | %) |
Natural gas liquids (bbl/d) | | | 2,627 | | | 2,219 | | | 18 | % | | 2,575 | | | 2,350 | | | 10 | % |
Natural gas (mcf/d) | | | 93,628 | | | 96,737 | | | (3 | %) | | 96,394 | | | 98,682 | | | (2 | %) |
Total (boe/d) | | | 54,926 | | | 59,961 | | | (8 | %) | | 56,184 | | | 60,984 | | | (8 | %) |
| | | | | | | | | | | | | | | | | | | | |
(1) These are non-GAAP measures; please refer to “Non-GAAP Measures” in this MD&A.
6
Commodity Price Environment
| | | | | | | | | | | | | | | | | | | |
| | | | | |
|
| | Three Months Ended September 30 | | Nine Months Ended September 30 | |
| | | | | |
Benchmarks | | 2008 | | 2007 | | Change | | 2008 | | 2007 | | Change | |
| | | | | | | | | | | | | | |
|
West Texas Intermediate crude oil (US$ per barrel) | | | 117.98 | | | 75.38 | | | 57 | % | | 113.29 | | | 66.19 | | | 71 | % |
Edmonton light crude oil ($ per barrel) | | | 121.59 | | | 79.66 | | | 53 | % | | 114.94 | | | 72.89 | | | 58 | % |
Bow River blend crude oil ($ per barrel) | | | 105.12 | | | 55.79 | | | 88 | % | | 95.74 | | | 52.20 | | | 83 | % |
AECO natural gas daily ($ per mcf) | | | 7.74 | | | 5.18 | | | 49 | % | | 8.62 | | | 6.55 | | | 32 | % |
Canadian / U.S. dollar exchange rate | | | 0.960 | | | 0.957 | | | 0 | % | | 0.982 | | | 0.907 | | | 8 | % |
| | | | | | | | | | | | | | | | | | | | |
During the Third Quarter 2008 the average West Texas Intermediate (“WTI”) benchmark price increased 57% over the Third Quarter 2007 and for the nine months ended September 30, 2008 the average price was 71% higher than in the prior year. The average Edmonton light crude oil price (“Edmonton Par”) has also increased over the past twelve months to average $121.59 during the Third Quarter, an increase of 53% over the same period of the prior year and $114.94/bbl for the nine months ended September 30, 2008, an increase of 58% over the prior year. On a year-to-date basis, the increase in value of Edmonton Par throughout 2008 has been less dramatic than that of WTI due to the strength of the Canadian dollar relative to the US dollar in 2008, which has increased by 8% for the nine months ended September 30 relative to the first nine months of the prior year.
Heavy oil differentials fluctuate based on a combination of factors including the level of heavy oil inventories, pipeline capacity to deliver heavy crude to U.S. markets and the seasonal demand for heavy oil. During the Third Quarter of 2008, the Bow River heavy oil differential relative to Edmonton Par tightened to an average of 13.5% compared to 30.0% in the Third Quarter of 2007. During the nine months ended September 30, 2008, heavy oil differentials have been consistently tighter than the first nine months of the prior year due to reduced supply due to pipeline disruptions early in the year coupled with production shortfalls and strong demand during the following spring and summer months.
| | | | | | | | | | | | | | | | |
| | 2008 | | | | 2007 | | | | 2006 |
| | | | | | | | | | |
Differential Benchmarks | | Q3 | | Q2 | | Q1 | | Q4 | | Q3 | | Q2 | | Q1 | | Q4 |
| | | | | | | | | | | | | | | | | |
Bow River Blend differential to Edmonton Par | | 13.5% | | 17.1% | | 20.2% | | 34.2% | | 30.0% | | 29.4% | | 25.4% | | 30.3% |
| | | | | | | | | | | | | | | | | |
Compared to the prior year, the average AECO natural gas price was 49% and 32% higher during the three and nine months ended September 30, 2008, respectively. Natural gas prices have strengthened in 2008 relative to 2007 due to a general strengthening of commodity prices.
Realized Commodity Prices(1)
The following table summarizes our average realized price by product for the three and nine month periods ended September 30, 2008 and 2007.
| | | | | | | | | | | | | | | | | | | |
| | | | | | | | | | | | | | | | | | | |
| | Three Months Ended September 30 | | Nine Months Ended September 30 | |
| | | | | |
| | 2008 | | 2007 | | Change | | 2008 | | 2007 | | Change | |
| | | | | | | | | | | | | | |
Light to medium oil ($/bbl) | | | 110.70 | | | 68.10 | | | 63 | % | | 102.15 | | | 62.02 | | | 65 | % |
Heavy oil ($/bbl) | | | 99.21 | | | 48.95 | | | 103 | % | | 87.75 | | | 45.70 | | | 92 | % |
Natural gas liquids ($/bbl) | | | 88.17 | | | 61.63 | | | 43 | % | | 85.16 | | | 57.55 | | | 48 | % |
Natural gas ($/mcf) | | | 8.44 | | | 5.67 | | | 49 | % | | 9.16 | | | 7.10 | | | 29 | % |
Average realized price ($/boe) | | | 90.15 | | | 54.15 | | | 66 | % | | 84.75 | | | 52.64 | | | 61 | % |
| | | | | | | | | | | | | | | | | | | | |
(1) Realized commodity prices exclude the impact of price risk management activities.
During the three and nine months ended September 30, 2008, our average realized price was 66% and 61% higher, respectively, than the comparable periods in 2007 with every product realizing a higher average price than in the prior year.
7
Our realized price for light to medium oil sales increased 63% in the Third Quarter of 2008 compared to the Third Quarter of 2007, reflecting the 53% increase in Edmonton Par pricing coupled with improved quality differentials realized on our light to medium oil production relative to the Edmonton Par price. During the nine months ended September 30, 2008, our realized price for light to medium oil sales was 65% higher than the same period in 2007 which also reflects the 58% increase in Edmonton Par pricing over the prior year as well as improved quality differentials.
Harvest’s heavy oil price increased 103% in the Third Quarter of 2008 relative to the Third Quarter of 2007, reflecting the 88% increase in the average posted Bow River price for the same periods. Similarly, our average heavy oil price for the year-to-date is 92% higher than the prior year, reflecting the increase of 83% in the Bow River posted price for the first nine months of 2008 relative to the first nine months of 2007. Harvest realized an increased heavy oil price relative to the Bow River posted price in the Third Quarter as production shortfalls and increased refinery demand for heavier grades of oil put upward pressure on pricing.
The average realized price for our natural gas production was 49% higher in the Third Quarter of 2008 as compared to the Third Quarter of 2007 reflecting the same increase in AECO daily pricing over the same period, while during the first nine months of 2008, we realized a natural gas sales price that was 29% higher than in the prior year, reflecting the AECO daily pricing increase of 32%.
Sales Volumes
The average daily sales volumes by product were as follows:
| | | | | | | | | | | | | | | | |
| | | | | | | | | | | | | | | | |
| | Three Months Ended September 30 | | | | |
| | | | | | | |
| | 2008 | | 2007 | | | | |
| | | | | | | | | |
| | Volume | | Weighting | | Volume | | Weighting | | % Volume Change | |
| | | | | | | | | | | | |
Light to medium oil (bbl/d)(1) | | | 25,210 | | | 46 | % | | 27,401 | | 46 | % | | (8 | %) | |
Heavy oil (bbl/d) | | | 11,485 | | | 21 | % | | 14,217 | | 24 | % | | (19 | %) | |
Natural gas liquids (bbl/d) | | | 2,627 | | | 5 | % | | 2,219 | | 4 | % | | 18 | % | |
| | | | | | | | | | | | | | | | | |
Total liquids (bbl/d) | | | 39,322 | | | 72 | % | | 43,837 | | 74 | % | | (10 | %) | |
Natural gas (mcf/d) | | | 93,628 | | | 28 | % | | 96,737 | | 26 | % | | (3 | %) | |
| | | | | | | | | | | | | | | | | |
Total oil equivalent (boe/d) | | | 54,926 | | | 100 | % | | 59,961 | | 100 | % | | (8 | %) | |
| | | | | | | | | | | | | | | | | |
| | | | | | | | | | | | | | | | |
| | | | | | |
| | Nine Months Ended September 30 | | | | |
| | | | | | | |
| | 2008 | | 2007 | | | | |
| | | | | | | | | |
| | Volume | | Weighting | | Volume | | Weighting | | % Volume Change | |
| | | | | | | | | | | | |
Light to medium oil (bbl/d)(1) | | | 25,362 | | | 45 | % | | 27,342 | | 45 | % | | (7 | %) | |
Heavy oil (bbl/d) | | | 12,182 | | | 22 | % | | 14,845 | | 24 | % | | (18 | %) | |
Natural gas liquids (bbl/d) | | | 2,575 | | | 5 | % | | 2,350 | | 4 | % | | 10 | % | |
| | | | | | | | | | | | | | | | | |
Total liquids (bbl/d) | | | 40,119 | | | 72 | % | | 44,537 | | 73 | % | | (10 | %) | |
Natural gas (mcf/d) | | | 96,394 | | | 28 | % | | 98,682 | | 27 | % | | (2 | %) | |
| | | | | | | | | | | | | | | | | |
Total oil equivalent (boe/d) | | | 56,184 | | | 100 | % | | 60,984 | | 100 | % | | (8 | %) | |
| | | | | | | | | | | | | | | | | |
(1) Harvest classifies our oil production, except that produced from Hay River, as light to medium and heavy according to NI 51-101 guidance. The oil produced from Hay River has an average API of 24o (medium grade) and is classified as a light to medium oil, however, it benefits from a heavy oil royalty regime and therefore would be classified as heavy oil according to NI 51-101.
8
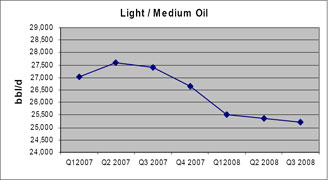
Harvest’s Third Quarter 2008 light/medium oil production was 25,210 bbl/d, a 2,191 bbl/d or 8% reduction from the same period in the prior year, and a reduction of 155 bbl/d or 1% from the Second Quarter of 2008. The 8% reduction is mainly attributed to steeper than expected declines experienced as the initial flush production from wells completed in early 2007 stabilized. In the Third Quarter of 2008, light/medium production has continued to remain relatively consistent with the two prior quarters as increased water cuts and production lost to downtime have been substantially offset by new wells and the production from two acquisitions completed during the quarter. Production at our largest area, Hay River, has remained constant over the past two quarters reflecting our First Quarter initiatives to increase water injection and improve recovery. Relative to the first nine months of 2007, Harvest’s year-to-date light/medium oil production has declined by 7% due to steeper than anticipated declines throughout 2007 and a lower level of drilling activity in 2008.
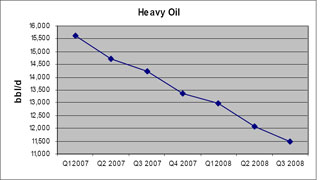
Our heavy oil production has decreased steadily over the past twelve months resulting in a 19% reduction with Third Quarter 2008 production of 11,485 bbl/d as compared to 14,217 bbl/d in the Third Quarter of 2007. This reduction is largely the result of increased water cuts experienced on our larger producing wells in the west central Saskatchewan and Lloydminster areas coupled with normal declines elsewhere. In the Third Quarter of 2008, we continued normal decline. On a year-to-date basis, cold and wet weather related operational problems, as well as shut-ins to accommodate nearby drilling, contributed to the decrease in volumes from 14,845 bbl/d during the first nine months of 2007 to 12,182 bbl/d during the first nine months of 2008.
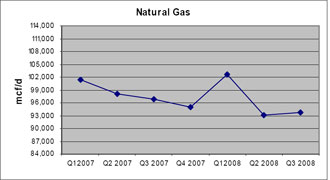
Our Third Quarter of 2008 natural gas production decreased by 3% relative to the Third Quarter of 2007, averaging 93,628 mcf/d. Relative to the Second Quarter of 2008, our Third Quarter natural gas production has increased by 1%, primarily due to the incremental production associated with the acquisitions completed during the Third Quarter. Relative to the Third Quarter of the prior year our natural gas production has encountered disruptions from various third party processing facility turnarounds, which has been partially offset by flush production from new wells drilled early in 2008 which have since stabilized. Harvest’s 2008 year-to-date production is 2% lower than the same period in 2007 due to continued declines and production disruptions throughout the Fourth Quarter of 2007 and Second Quarter 2008 offset by incremental production resulting from our 2008 winter drilling program and acquisitions completed in the Third Quarter of 2008.
9
Revenues
| | | | | | | | | | | | | | | | | | | |
| | | | | |
| | Three Months Ended September 30 | | Nine Months Ended September 30 | |
| | | | | |
| | | | | |
(000s) | | 2008 | | 2007 | | Change | | 2008 | | 2007 | | Change | |
| | | | | | | | | | | | | | |
Light to medium oil sales | | $ | 256,744 | | $ | 171,674 | | | 50 | % | $ | 709,825 | | $ | 462,964 | | | 53 | % |
Heavy oil sales | | | 104,826 | | | 64,026 | | | 64 | % | | 292,883 | | | 185,196 | | | 58 | % |
Natural gas sales | | | 72,690 | | | 50,424 | | | 44 | % | | 241,873 | | | 191,357 | | | 26 | % |
Natural gas liquids sales and other | | | 21,305 | | | 12,584 | | | 69 | % | | 60,083 | | | 36,918 | | | 63 | % |
| | | | | | | | | | | | | | | | | | | | |
Total sales revenue | | | 455,565 | | | 298,708 | | | 53 | % | | 1,304,664 | | | 876,435 | | | 49 | % |
Royalties | | | (73,268 | ) | | (56,806 | ) | | 29 | % | | (212,482 | ) | | (160,003 | ) | | 33 | % |
| | | | | | | | | | | | | | | | | | | | |
Net Revenues | | $ | 382,297 | | $ | 241,902 | | | 58 | % | $ | 1,092,182 | | $ | 716,432 | | | 52 | % |
| | | | | | | | | | | | | | | | | | | | |
Our revenue is impacted by changes to production volumes, commodity prices and currency exchange rates. Third Quarter of 2008 total sales revenue of $455.6 million is $156.9 million higher than the same period in the prior year, of which $182.2 million is attributed to higher realized prices offset by a $25.3 million negative variance in respect of lower production volumes. The price increase reflects the 53% increase in Edmonton Par pricing and 49% in AECO natural gas pricing in the Third Quarter of 2008 as compared to the Third Quarter of 2007, while our decreased production volume is attributed to the higher than anticipated decline rates experienced from recently completed wells coupled with various operational difficulties and a reduction in 2008 capital spending. On a year-to-date basis, our total sales revenue of $1,304.7 million is $428.2 million higher than for the comparable period in 2007, comprised of $493.0 million of additional revenue attributed to higher prices offset by a reduction in revenue of $64.8 million resulting from decreased production volumes.
Light to medium oil sales revenue for the Third Quarter of 2008 was $85.1 million higher than in the comparative period due to a $98.8 million favourable price variance offset by a $13.7 million unfavourable volume variance. The price variance reflects a 53% increase in Edmonton par pricing relative to the Third Quarter of the prior year plus improved differentials, while the negative volume variance reflects normal declines coupled with lower drilling activity in the winter of 2008 as compared to the prior year. For the nine months ended September 30, 2008, light to medium oil sales revenue was $246.9 million higher than the prior year-to-date, attributed to $278.8 million in increased revenues resulting from increased commodity pricing offset by a $31.9 million reduction due to a decline in production.
Third Quarter of 2008 heavy oil sales revenue of $104.8 million was $40.8 million higher than in the prior year due to a $53.1 million favourable price variance resulting from a 16.5% improvement in heavy oil differentials relative to the prior year coupled with the impact of the 57% increase in WTI, offset by a $12.3 million unfavourable volume variance reflecting a natural decline rate. The same factors apply to the variances in the first nine months of 2008 relative to 2007, where heavy oil sales revenue has increased by $107.7 million resulting from a favourable price variance of $140.3 million offset by an unfavorable volume variance of $32.6 million.
Natural gas sales revenue increased by $22.3 million in the Third Quarter of 2008 compared to the same period in 2007 due to a $23.9 million favourable price variance offset by a $1.6 million unfavourable volume variance. The favourable price variance reflects the $2.77/mcf increase in our realized natural gas prices resulting from a 49% increase in the AECO daily price relative to the prior year. During the first nine months of 2008, natural gas sales revenue was $50.5 million higher than the first nine months of the prior year, resulting from increased revenue of $54.3 million attributed to the increase in AECO pricing of 32% offset by a reduction in revenue of $3.8 million resulting from lower volumes.
In the Third Quarter of 2008, natural gas liquids and other sales revenue increased by $8.7 million compared to the Third Quarter of the prior year resulting from a $6.4 million favourable price variance and a $2.3 million favourable volume variance. Similarly, year-to-date natural gas liquids and other sales revenues increased by $23.2 million compared to the first nine months of 2007 resulting from a $19.5 million favourable price variance coupled with a $3.7 million favourable volume variance. Generally, the natural gas liquids volume variance will be aligned with our production of natural gas while the price variances will be aligned with the prices realized for our oil production.
10
Royalties
We pay Crown, freehold and overriding royalties to the owners of mineral rights from which production is generated. These royalties vary for each property and product and our Crown royalties are based on a sliding scale dependent on production volumes and commodity prices.
For the Third Quarter of 2008 net royalties as a percentage of gross revenue were 16.1% (19.0% in the Third Quarter of 2007) and aggregated to $73.3 million (2007 - $56.8 million). Our royalty rate for the Third Quarter of 2008 was slightly lower than the expected rate of 17% primarily due to reductions in freehold mineral taxes. Our royalties for the first nine months of 2008 were $212.5 million, resulting in a rate of 16.3% compared to $160.0 million and a rate of 18.3%, respectively, for the first nine months of 2007 as the prior year rate had increased in respect of a one-time adjustment of additional crown royalties that were assessed on our Hay River property.
Operating Expenses
| | | | | | | | | | | | | | | | |
| | | |
| | Three Months Ended September 30 | |
| | | | | | | | |
| | | | | | | |
| | 2008 | | 2007 | | Per BOE
Change | |
| | | | | |
(000s except per boe amounts) | | Total | | Per BOE | | Total | | Per BOE | |
| | | | | | | | | | | | |
Operating expense | | | | | | | | | | | | | | | | |
Power and fuel | | $ | 18,622 | | $ | 3.69 | | $ | 19,569 | | $ | 3.55 | | | 4 | % |
Well Servicing | | | 14,474 | | | 2.86 | | | 15,621 | | | 2.83 | | | 1 | % |
Repairs and maintenance | | | 13,356 | | | 2.64 | | | 13,852 | | | 2.51 | | | 5 | % |
Lease rentals and property taxes | | | 6,548 | | | 1.30 | | | 6,032 | | | 1.09 | | | 19 | % |
Processing and other fees | | | 2,629 | | | 0.52 | | | 3,373 | | | 0.61 | | | (15 | %) |
Labour – internal | | | 6,314 | | | 1.25 | | | 5,489 | | | 1.00 | | | 25 | % |
Labour – contract | | | 4,455 | | | 0.88 | | | 3,861 | | | 0.70 | | | 26 | % |
Chemicals | | | 3,115 | | | 0.62 | | | 3,004 | | | 0.54 | | | 15 | % |
Trucking | | | 2,664 | | | 0.53 | | | 2,781 | | | 0.50 | | | 6 | % |
Other | | | 1,137 | | | 0.22 | | | 6,607 | | | 1.21 | | | (82 | %) |
| | | | | | | | | | | | | | | | | |
Total operating expense | | $ | 73,314 | | $ | 14.51 | | $ | 80,189 | | $ | 14.54 | | | 0 | % |
| | | | | | | | | | | | | | | | | |
| | | | | | | | | | | | | | | | |
| | | | | | | | | | | | | | | | | |
Transportation and marketing expense | | $ | 3,855 | | $ | 0.76 | | $ | 3,412 | | $ | 0.62 | | | 23 | % |
| | | | | | | | | | | | | | | | | |
| | | | | | | | | | | | | | | | |
| | | |
| | Nine Months Ended September 30 | |
| | | | | | | | |
| | | | | | | |
| | 2008 | | 2007 | | Per BOE
Change | |
| | | | | |
(000s except per boe amounts) | | Total | | Per BOE | | Total | | Per BOE | |
| | | | | | | | | | | | |
Operating expense | | | | | | | | | | | | | | | | |
Power and fuel | | $ | 59,756 | | $ | 3.88 | | $ | 49,349 | | $ | 2.96 | | | 31 | % |
Well Servicing | | | 38,875 | | | 2.53 | | | 47,639 | | | 2.87 | | | (12 | %) |
Repairs and maintenance | | | 37,235 | | | 2.42 | | | 38,190 | | | 2.30 | | | 5 | % |
Lease rentals and property taxes | | | 21,161 | | | 1.37 | | | 15,846 | | | 0.96 | | | 43 | % |
Processing and other fees | | | 8,226 | | | 0.53 | | | 11,785 | | | 0.71 | | | (25 | %) |
Labour – internal | | | 18,405 | | | 1.20 | | | 17,615 | | | 1.06 | | | 13 | % |
Labour – contract | | | 12,487 | | | 0.81 | | | 11,656 | | | 0.70 | | | 16 | % |
Chemicals | | | 12,947 | | | 0.84 | | | 11,533 | | | 0.69 | | | 22 | % |
Trucking | | | 8,371 | | | 0.54 | | | 8,906 | | | 0.53 | | | 2 | % |
Other | | | 1,266 | | | 0.09 | | | 12,299 | | | 0.72 | | | (88 | %) |
| | | | | | | | | | | | | | | | | |
Total operating expense | | $ | 218,729 | | $ | 14.21 | | $ | 224,818 | | $ | 13.50 | | | 5 | % |
| | | | | | | | | | | | | | | | | |
| | | | | | | | | | | | | | | | |
| | | | | | | | | | | | | | | | | |
Transportation and marketing expense | | $ | 10,232 | | $ | 0.66 | | $ | 9,599 | | $ | 0.58 | | | 14 | % |
| | | | | | | | | | | | | | | | | |
11
Third Quarter 2008 operating costs totaled $73.3 million, a decrease of $6.9 million from operating costs incurred in the Third Quarter of 2007. On a per barrel basis, operating costs have remained relatively constant, averaging $14.51 in the Third Quarter of 2008 compared to $14.54 in the prior year. The largest components of operating expense are power and fuel costs, well servicing and repairs and maintenance costs. Well servicing and repairs and maintenance costs continue to reflect the high demand for oilfield services, although with reduced activity compared to the same period in the prior year, these costs have remained relatively stable. On a year-to-date basis, operating costs totaled $218.7 million ($14.21/boe) for the first nine months of 2008, compared to $224.8 million ($13.50/boe) for the first nine months of 2007. This 5% per boe increase is attributed to reduced production volumes.
Power and fuel costs, comprised primarily of electric power costs, represented approximately 25% of our total operating costs during the Third Quarter of 2008. The Alberta electric power price of $80.36/MWh in the Third Quarter of 2008 was 13% lower than the average Third Quarter 2007 price of $92.00/MWh and this reduction is reflected in our 4% per boe reduction in power and fuel costs compared to the same period of the prior year, the total dollar savings offset by lower production volumes. On a year to date basis, the average Alberta electric power price for the first nine months of 2008 was $88.21/MWh as compared to $68.53/MWh during the first nine months of 2007, a 29% increase. To manage our exposure to electric power price fluctuations we have electric power price risk management contracts in place which resulted in a gain of $1.8 million and $7.0 million for the three and nine months ended September 30, 2008, respectively, compared to gains of $2.8 million and $2.7 million in the same periods of the prior year. The following table details the electric power costs per boe before and after the impact of our price risk management program.
| | | | | | | | | | | | | | | | | | | |
| | | | | |
| | Three Months Ended September 30 | | Nine Months Ended September 30 | |
| | | | | | |
(per boe) | | 2008 | | 2007 | | Change | | 2008 | | 2007 | | Change | |
| | | | | | | | | | | | | | |
Electric power and fuel costs | | $ | 3.69 | | $ | 3.55 | | | 4 | % | $ | 3.88 | | $ | 2.96 | | | 31 | % |
Realized gains on electricity risk management contracts | | | (0.36 | ) | | (0.51 | ) | | (29 | %) | | (0.45 | ) | | (0.16 | ) | | 181 | % |
| | | | | | | | | | | | | | | | | | | | |
Net electric power costs | | $ | 3.33 | | $ | 3.04 | | | 10 | % | $ | 3.43 | | $ | 2.80 | | | 23 | % |
| | | | | | | | | | | | | | | | | | | | |
Alberta Power Pool electricity price (per MWh) | | $ | 80.36 | | $ | 92.00 | | | (13 | %) | $ | 88.21 | | $ | 68.53 | | | 29 | % |
| | | | | | | | | | | | | | | | | | | | |
Approximately 52% of our estimated Alberta electricity usage is protected by fixed price purchase contracts at an average price of $56.69/MWh through December 2008. These contracts moderate the impact of future price swings in electric power as will capital projects undertaken that contribute to improving our efficient use of electric power.
Third Quarter 2008 transportation and marketing expense was $3.9 million or $0.76 per boe, an increase of 23% per boe from $3.4 million or $0.62 per boe in the Third Quarter of 2007. On a year-to-date basis, transportation and marketing expense has increased 14% per boe as compared to the first nine months of the prior year, from $9.6 million or $0.58/boe in 2007 to $10.2 million or $0.66/boe in 2008. These costs relate primarily to delivery of natural gas to Alberta’s natural gas sales hub, the AECO Storage Hub, and to a lesser extent, our costs of trucking clean crude oil to pipeline receipt points. As a result, the total dollar amount of costs fluctuate in relation with our natural gas production volumes while the cost per boe typically remains relatively constant. The increased transportation and marketing expense in the Third Quarter of 2008 is primarily due to increased clean oil trucking costs associated with the two acquisitions completed in the quarter.
Operating Netback
| | | | | | | | | | | | | |
| | | | | |
| | Three Months Ended September 30 | | Nine Months Ended September 30 | |
| | | | | |
(per boe) | | 2008 | | 2007 | | 2008 | | 2007 | |
| | | | | | | | | | |
Revenues | | $ | 90.15 | | $ | 54.15 | | $ | 84.75 | | $ | 52.64 | |
Royalties | | | (14.50 | ) | | (10.30 | ) | | (13.80 | ) | | (9.61 | ) |
Operating expense | | | (14.51 | ) | | (14.54 | ) | | (14.21 | ) | | (13.50 | ) |
Transportation and marketing expense | | | (0.76 | ) | | (0.62 | ) | | (0.66 | ) | | (0.58 | ) |
| | | | | | | | | | | | | | |
Operating netback(1) | | $ | 60.38 | | $ | 28.69 | | $ | 56.08 | | $ | 28.95 | |
| | | | | | | | | | | | | | |
| |
(1) | These are non-GAAP measures; please refer to “Non-GAAP Measures” in this MD&A. |
12
Harvest’s operating netback represents the net amount realized on a per boe basis after deducting directly related costs. In the Third Quarter of 2008, our operating netback increased by $31.69/boe or 110% over the Third Quarter of 2007. The increase in our operating netback is primarily attributed to a $36.00/boe increase in realized commodity prices, reflecting the increase in Edmonton Par, Bow River and AECO pricing over the prior year, offset by an increase in royalties of $4.20/boe resulting from higher realized prices. For the nine months ended September 30, 2008, Harvest’s operating netback was $56.08/boe, an increase of $27.13/boe or 94% compared to the same period in the prior year, attributed to significantly increased commodity prices offset by increased royalties and operating expenses.
General and Administrative (“G&A”) Expense
| | | | | | | | | | | | | | | | | | | |
| | | | | |
| | Three Months Ended September 30 | | Nine Months Ended September 30 | |
| | | | | | |
| | | | | |
(000s except per boe) | | 2008 | | 2007 | | Change | | 2008 | | 2007 | | Change | |
| | | | | | | | | | | | | | |
Cash G&A | | $ | 8,557 | | $ | 8,330 | | | 3 | % | $ | 25,344 | | $ | 24,048 | | | 5 | % |
Unit based compensation expense (recovery) | | | (6,410 | ) | | (4,171 | ) | | 54 | % | | 1,422 | | | 6,276 | | | (77 | %) |
| | | | | | | | | | | | | | | | | | | | |
Total G&A | | $ | 2,148 | | $ | 4,159 | | | (48 | %) | $ | 26,766 | | $ | 30,324 | | | (12 | %) |
| | | | | | | | | | | | | | | | | | | | |
| | | | | | | | | | | | | | | | | | | |
Cash G&A per boe ($/boe) | | $ | 1.69 | | $ | 1.51 | | | 12 | % | $ | 1.65 | | $ | 1.44 | | | 15 | % |
| | | | | | | | | | | | | | | | | | | | |
For the three months ended September 30, 2008, Cash G&A costs increased by $0.2 million (or 3%) compared to the same period in 2007, reflecting consistent employee costs in a continued tight market for technically qualified staff in the western Canadian petroleum and natural gas industry. Generally, approximately 75% of our Cash G&A expenses are related to salaries and other employee related costs. For the nine months ended September 30, 2008, Harvest’s Cash G&A was $25.3 million, an increase of 5% over the first nine months of the prior year due primarily to increased employee and consulting costs during the First Quarter of 2008.
Our unit based compensation plans provide the employee with the option of settling outstanding awards with cash. As a result, unit based compensation expense is determined using the intrinsic method, being the difference between the Trust Unit trading price and the strike price of the unit awards adjusted for the proportion that is vested. The market price of our Trust Units was $24.75 at June 30, 2008 and on September 30, 2008, the price was $17.92. This decrease in unit trading price resulted in the Third Quarter of 2008 unit based compensation expense reflecting a recovery of $6.4 million. Similarly, total unit based compensation expense decreased $2.2 million in the Third Quarter of 2008 compared to the same period in 2007 as the market price of Harvest Trust Units decreased by $6.83 per unit in the Third Quarter of 2008 which was greater than the $6.18 per unit decrease in the Third Quarter of 2007. For the year-to-date, total unit-based compensation expense of $1.4 million has been recorded, a 77% reduction compared to the same period in the prior year due to a reduced market price of Harvest Trust Units.
Depletion, Depreciation, Amortization and Accretion Expense
| | | | | | | | | | | | | | | | | | | |
| | | | | |
| | Three Months Ended September 30 | | Nine Months Ended September 30 | |
| | | | | | |
(000s except per boe) | | 2008 | | 2007 | | Change | | 2008 | | 2007 | | Change | |
| | | | | | | | | | | | | | |
Depletion, depreciation and amortization | | $ | 99,607 | | $ | 104,643 | | | (5 | %) | $ | 305,231 | | $ | 313,573 | | | (3 | %) |
Depletion of capitalized asset retirement costs | | | 3,295 | | | 3,926 | | | (16 | %) | | 10,273 | | | 11,926 | | | (14 | %) |
Accretion on asset retirement obligation | | | 4,698 | | | 4,546 | | | 3 | % | | 13,892 | | | 13,466 | | | 3 | % |
| | | | | | | | | | | | | | | | | | | | |
Total depletion, depreciation, amortization and accretion | | $ | 107,600 | | $ | 113,115 | | | (5 | %) | $ | 329,396 | | $ | 338,965 | | | (3 | %) |
Per boe | | $ | 21.29 | | $ | 20.51 | | | 4 | % | $ | 21.40 | | $ | 20.36 | | | 5 | % |
| | | | | | | | | | | | | | | | | | | | |
Our overall depletion, depreciation, amortization and accretion (“DDA&A”) expense for the three and nine months ended September 30, 2008 was $5.5 million and $9.6 million lower, respectively, compared to the same periods in the prior year. The decrease is attributed to lower production volumes partially offset by slightly higher finding and development costs that have increased our depletion rate compared to the same periods of the prior year.
13
| | | | | | | | | | | | | |
Capital Expenditures | | | | | | | | | | | | | |
|
| | | | | | | | | | | | | |
| | Three Months Ended September 30 | | Nine Months Ended September 30 | |
| | | | | | |
(000s) | | 2008 | | 2007 | | 2008 | | 2007 | |
| | | | | | | | | | | | | | |
Land and undeveloped lease rentals | | $ | 1,183 | | $ | 645 | | $ | 3,331 | | $ | 1,066 | |
Geological and geophysical | | | 1,523 | | | 1,340 | | | 5,470 | | | 7,064 | |
Drilling and completion | | | 45,349 | | | 38,619 | | | 118,635 | | | 133,608 | |
Well equipment, pipelines and facilities | | | 18,317 | | | 30,031 | | | 52,984 | | | 119,607 | |
Capitalized G&A expenses | | | 2,672 | | | 2,440 | | | 7,805 | | | 6,891 | |
Furniture, leaseholds and office equipment | | | 54 | | | 248 | | | 112 | | | 1,795 | |
| | | | | | | | | | | | | | |
Development capital expenditures excluding acquisitions and non-cash items | | | 69,098 | | | 73,323 | | | 188,337 | | | 270,031 | |
Non-cash capital additions (recoveries) | | | (1,294 | ) | | (1,042 | ) | | 61 | | | (1,053 | ) |
| | | | | | | | | | | | | | |
Total development capital expenditures excluding acquisitions | | $ | 67,804 | | $ | 72,281 | | $ | 188,398 | | $ | 268,978 | |
| | | | | | | | | | | | | | |
Drilling activity in the Third Quarter was primarily focused on low risk oil development opportunities in some of our more active areas. At southeast Saskatchewan, Harvest drilled 18 gross (12.0) net wells as we continued to pursue light oil in the Tilston and Souris Valley formations using horizontal wells. At Lloydminster and Hayter, we drilled a total of 8 gross (7.0 net) infill horizontal wells to access incremental heavy oil from both the Lloydminster and Dina formations. In southeast Alberta we drilled 18 gross (4.6 net wells) with the majority of the net wells exploiting gas and oil opportunities in Glauconitic channel sands that traverse the area. At Markerville we drilled 11 gross (5.0 net) gas wells primarily for Edmonton sands allowing us to continue to optimize production into our operated gathering system in the area.
The following summarizes Harvest’s participation in gross and net wells drilled during the three months ended September 30, 2008:
| | | | | | | | | | | | | | | | | | | |
| | | | | | | |
| | Total Wells | | Successful Wells | | Abandoned Wells | |
Area | | Gross1 | | Net | | Gross | | Net | | Gross | | Net | |
| | | | | | | | | | | | | | |
| | | | | | | | | | | | | | | | | | | |
Southeast Saskatchewan | | 18.0 | | | 12.0 | | | 18.0 | | | 12.0 | | | - | | | - | | |
Southeast Alberta | | 18.0 | | | 4.6 | | | 18.0 | | | 4.6 | | | - | | | - | | |
Red Earth | | - | | | - | | | - | | | - | | | - | | | - | | |
Suffield | | - | | | - | | | - | | | - | | | - | | | - | | |
Lloydminster/Hayter | | 8.0 | | | 7.0 | | | 8.0 | | | 7.0 | | | - | | | - | | |
Rimbey | | 4.0 | | | 2.5 | | | 4.0 | | | 2.5 | | | - | | | - | | |
Markerville | | 11.0 | | | 5.0 | | | 11.0 | | | 5.0 | | | - | | | - | | |
Other Areas | | 8.0 | | | 3.6 | | | 8.0 | | | 3.6 | | | - | | | - | | |
| | | | | | | | | | | | | | | | | | | | |
Total | | 67.0 | | | 34.7 | | | 67.0 | | | 34.7 | | | - | | | - | | |
| | | | | | | | | | | | | | | | | | | | |
(1) Excludes 4 additional wells that we have an overriding royalty interest in.
The following summarizes Harvest’s participation in gross and net wells drilled during the nine months ended September 30, 2008:
| | | | | | | | | | | | | | | | | | | |
| | | | | | | | | | | | | | | | | | | |
| | Total Wells | | Successful Wells | | Abandoned Wells | |
Area | | Gross1 | | Net | | Gross | | Net | | Gross | | Net | |
| | | | | | | | | | | | | | | | | | | | |
| | | | | | | | | | | | | | | | | | | |
Southeast Saskatchewan | | 38.0 | | | 30.0 | | | 38.0 | | | 30.0 | | | - | | | - | | |
Southeast Alberta | | 26.0 | | | 9.9 | | | 26.0 | | | 9.9 | | | - | | | - | | |
Red Earth | | 12.0 | | | 11.3 | | | 12.0 | | | 11.3 | | | - | | | - | | |
Suffield | | 8.0 | | | 8.0 | | | 8.0 | | | 8.0 | | | - | | | - | | |
Lloydminster/Hayter | | 17.0 | | | 16.0 | | | 17.0 | | | 16.0 | | | - | | | - | | |
Rimbey | | 17.0 | | | 5.4 | | | 17.0 | | | 5.4 | | | - | | | - | | |
Markerville | | 34.0 | | | 14.4 | | | 34.0 | | | 14.4 | | | - | | | - | | |
Other Areas | | 13.0 | | | 7.1 | | | 13.0 | | | 7.1 | | | - | | | - | | |
| | | | | | | | | | | | | | | | | | | | |
Total | | 165.0 | | | 102.1 | | | 165.0 | | | 102.1 | | | - | | | - | | |
| | | | | | | | | | | | | | | | | | | | |
(1) Excludes 14 additional wells that we have an overriding royalty interest in.
14
Acquisitions and Divestitures
In late July, we acquired a private oil and natural gas company for cash consideration of $36.8 million. The associated production was approximately 390 bbl/d of light oil in an area immediately adjacent to our existing operations in Red Earth plus 2,300 mcf/d of natural gas from a shallow gas play in north central Alberta. An independent engineering report prepared effective April 1, 2008 estimated proved and probable reserves of 1,800 mboe.
In early September, we acquired conventional oil and gas properties in the Peace River Arch area of northern Alberta with approximately 1,900 boe of daily production for cash consideration of $130.8 million plus the transfer of some minor Alberta gas interests which produced approximately 85 boe/d during the first half of 2008. During the first half of 2008, the acquired properties averaged production of approximately 1,255 barrels of medium gravity oil and natural gas liquids plus 3,900 mcf/d of natural gas. An independent engineering report prepared effective December 31, 2007 estimated proved reserves at 7,260 mboe and proved plus probable reserves at 9,899 mboe.
During the Third Quarter, we disposed of various non-operated properties in the Pouce Coupe area for cash consideration of $36.8 million plus some freehold mineral interests in southeast Saskatchewan. These properties had average daily production of approximately 2,800 mcf/d of natural gas and 14 boe/d of natural gas liquids.
Asset Retirement Obligation (“ARO”)
In connection with property acquisitions and development expenditures, we record the fair value of the ARO as a liability in the same year the expenditures occur. The associated asset retirement costs are capitalized as part of the carrying amount of the assets and are depleted and depreciated over our estimated net proved reserves. Once the initial ARO is measured, it is adjusted at the end of each period to reflect the passage of time as well as changes in the estimated future cash flows of the underlying obligation. Our asset retirement obligation increased by $5.8 million during the Third Quarter of 2008 as a result of accretion expense of $4.7 million, new liabilities recorded of $4.1 million offset by $3.0 million of actual asset retirement expenditures incurred.
15
DOWNSTREAM OPERATIONS
Third Quarter Highlights
| | |
| • | Cash from downstream operations totaled $47.2 million, a substantial improvement from the breakeven performance of the prior quarter and the $23.4 million cash flow deficiency of the Third Quarter in 2007. |
| | |
| • | Refining margin of US$10.47 per barrel reflects a US$7.39 increase over the Third Quarter of the prior year and a US$4.81 increase relative to the Second Quarter of 2008 primarily attributed to higher discounts for our medium sour crude oil feedstock. |
| | |
| • | Our cost of feedstock was US$11.40 per barrel lower than the WTI benchmark price as compared to a US$2.08 discount in the Third Quarter of the prior year and a US$1.52 discount in the Second Quarter of 2008. |
| | |
| • | Refinery operations maintained a reduced level of throughput in July and August in an effort to improve refining margins by minimizing production of high sulphur fuel oil (HSFO) which comprised 26% of our refined product yield as compared to over 29% in the prior year. September’s production averaged 103,650 bbl/d. |
| | |
| • | Operating costs of $2.02 per barrel of throughput as compared to $2.12 in the Third Quarter of the prior year and $2.21 in the Second Quarter of 2008 reflecting a relative reduction in expenditures of approximately $2 million. |
| | |
| • | Our cost of purchased energy of $3.72 per barrel of throughput is trending lower as compared to $4.23 and $3.27 in the First and Second Quarters of this year, respectively and is significantly higher than $2.34 in the Third Quarter of the prior year reflecting a significantly higher commodity price environment. |
| | | | | | | | | | | | | |
Summary of Financial and Operational Results | | | | | | | | | | |
| | | | | | | | | | | | | |
| | | | | | | | | | | | | |
| | Three Months Ended September 30 | | Nine Months Ended September 30 | |
| | | | | | | | | | | | | | |
(in $000’s except where noted below) | | 2008 | | 2007 | | 2008 | | 2007 | |
| | | | | | | | | | |
| | | | | | | | | | | | | |
Revenues | | | 1,214,898 | | | 789,612 | | | 3,504,443 | | | 2,474,044 | |
Purchased feedstock for processing and products purchased for resale | | | 1,099,963 | | | 747,010 | | | 3,220,513 | | | 2,087,948 | |
| | | | | | | | | | | | | | |
Gross Margin(1) | | | 114,935 | | | 42,602 | | | 283,930 | | | 386,096 | |
| | | | | | | | | | | | | |
Costs and expenses | | | | | | | | | | | | | |
Operating expense | | | 23,357 | | | 24,775 | | | 74,868 | | | 76,720 | |
Purchased energy expense | | | 33,958 | | | 22,340 | | | 106,985 | | | 64,677 | |
Turnaround and catalyst expense | | | 1,011 | | | 6,622 | | | 1,011 | | | 6,622 | |
Marketing expense | | | 8,560 | | | 10,673 | | | 26,558 | | | 27,075 | |
General and administrative expense | | | 345 | | | 522 | | | 1,514 | | | 1,224 | |
Depreciation and amortization expense | | | 17,195 | | | 17,280 | | | 50,438 | | | 54,854 | |
| | | | | | | | | | | | | | |
Earnings (loss) from operations(1) | | | 30,509 | | | (39,610 | ) | | 22,556 | | | 154,924 | |
| | | | | | | | | | | | | |
Cash capital expenditures | | | 17,199 | | | 12,468 | | | 31,845 | | | 27,222 | |
| | | | | | | | | | | | | |
Feedstock volume (bbl/day)(2) | | | 99,127 | | | 103,983 | | | 103,832 | | | 111,052 | |
| | | | | | | | | | | | | |
Yield (000’s barrels) | | | | | | | | | | | | | |
Gasoline and related products | | | 2,757 | | | 3,073 | | | 8,801 | | | 9,762 | |
Ultra low sulphur diesel and jet fuel | | | 3,985 | | | 3,596 | | | 12,001 | | | 11,829 | |
High sulphur fuel oil | | | 2,348 | | | 2,785 | | | 7,448 | | | 8,480 | |
| | | | | | | | | | | | | | |
Total | | | 9,090 | | | 9,454 | | | 28,250 | | | 30,071 | |
| | | | | | | | | | | | | | |
| | | | | | | | | | | | | |
| | | | | | | | | | | | | | |
Average Refining Margin (US$/bbl)(3) | | | 10.47 | | | 3.08 | | | 8.38 | | | 10.57 | |
| | | | | | | | | | | | | | |
| |
(1) | These are non-GAAP measures; please refer to “Non-GAAP Measures” in this MD&A |
| |
(2) | Barrels per day are calculated using total barrels of crude oil feedstock and Vacuum Gas Oil. |
| |
(3) | Average refining margin is calculated based on per barrel of feedstock throughput |
16
Refining Benchmark Prices
The North American refining industry has numerous pricing indicators against which to compare refinery gross margin performance. Typically, these gross margin indicators include prices for refined products such as Reformulated Blendstock for Oxygenate Blending gasoline (“RBOB gasoline”) and heating oil. The New York Mercantile Exchange (“NYMEX”) “2-1-1 Crack Spread” is such an indicator and is calculated assuming that the processing of two barrels of light sweet crude oil (defined as a WTI quality) yields one barrel of RBOB gasoline and one barrel of heating oil both of which are delivered to the New York market where product prices are set in relation to NYMEX RBOB gasoline and NYMEX heating oil prices. The following average prices, gross margin indicators and currency exchange rates are provided as reference points with which to index our refinery’s performance:
| | | | | | | | | | | | | | | | | | | |
| | | | | | | | | | | | | | | | | | | |
| | Three Months Ended September 30 | | Nine Months Ended September 30 | |
| | | | | | |
| | 2008 | | 2007 | | | Change | 2008 | | 2007 | | | Change |
| | | | | | | | | | | | | | |
WTI crude oil (US$/bbl) | | 117.98 | | 75.38 | | | 57% | 113.29 | | 66.19 | | | 71% |
Brent crude oil (US$/bbl) | | 116.87 | | 74.87 | | | 56% | 111.07 | | 67.10 | | | 66% |
Basrah Official Sales Price Discount (US$/bbl) | | (6.70) | | (5.03) | | | 33% | (7.52) | | (5.89) | | | 28% |
RBOB gasoline (US$/bbl/gallon) | | 123.91/2.95 | | 87.02/2.07 | | | 42% | 120.57/2.87 | | 83.80/2.00 | | | 44% |
Heating Oil (US$/bbl/gallon) | | 138.66/3.30 | | 87.86/2.09 | | | 58% | 134.13/3.19 | | 79.30/1.89 | | | 69% |
High Sulphur Fuel Oil (US$/bbl) | | 96.03 | | 57.19 | | | 68% | 83.75 | | 49.14 | | | 70% |
2-1-1 Crack Spread (US$/bbl) | | 13.31 | | 12.06 | | | 10% | 14.06 | | 15.36 | | | (9%) |
Canadian / US dollar exchange rate | | 0.960 | | 0.957 | | | 0% | 0.982 | | 0.907 | | | 8% |
| | | | | | | | | | | | | | | | | | | | |
During the Third Quarter of 2008, the 2-1-1 Crack Spread increased US$1.25/bbl as compared to the same period in the prior year reflecting an US$8.20/bbl increase in the Heating Oil Crack Spread to US$20.68/bbl offset by a decrease of US$5.71 in the RBOB Crack Spread to US$5.93/bbl. For the nine month period ended September 30, 2008, the 2-1-1 Crack Spread decreased by US$1.30/bbl as compared to the prior year due to a US$10.33/bbl decrease in the RBOB Crack Spread to US$7.28/bbl offset by a US$7.73/bbl increase in the Heating Oil Crack Spread to US$20.84/bbl.
Harvest’s refining margin differs from that represented by the 2-1-1 Crack Spread indicator due to the refined product mix produced by the refinery as well as the type of crude oil feedstock processed. Our refinery produces approximately 25% - 30% high sulphur fuel oil (“HSFO”), a product not represented in the NYMEX 2-1-1 Crack Spread. HSFO typically sells at a discount to WTI and has a negative contribution to our refining margin. Our refinery also processes a medium gravity sour crude oil, purchased at a discount to WTI, rather than a WTI quality of light sweet crude oil represented in the 2-1-1 Crack Spread. To optimize the throughput of our Isomax hydrocracker unit, we typically purchase approximately 5,000 – 10,000 bbl/d of vacuum gas oil (“VGO”) which may sell at a price that is either a premium or discount to WTI.
17
Downstream Gross Margin
The following summarizes Harvest downstream gross margin contributions for each of the three and nine months ended September 30, 2008 and 2007 segregated between refining activities and marketing and other related businesses.
| | | | | | | | | | | | | |
| | |
| | Three Months Ended September 30 | |
| | | | |
| | 2008 | | 2007 | |
| | | | | | |
(000’s of Canadian dollars) | | Refining | | Marketing | | Total | | Refining | | Marketing | | Total | |
| | | | | | | | | | | | | | |
| | | | | | | | | | | | | |
Sales revenue(1) | | 1,187,890 | | 220,402 | | 1,214,898 | | 764,075 | | 158,292 | | 789,612 | |
Cost of feedstock for processing and products for resale(1) | | 1,088,455 | | 204,902 | | 1,099,963 | | 733,302 | | 146,463 | | 747,010 | |
| | | | | | | | | | | | | |
Gross margin(2) | | 99,435 | | 15,500 | | 114,935 | | 30,773 | | 11,829 | | 42,602 | |
| | | | | | | | | | | | | |
| | | | | | | | | | | | | |
Average Refining Margin (US$/bbl) | | 10.47 | | | | | | 3.08 | | | | | |
| | | | | | | | | | | | | |
| | | | | | | | | | | | | |
| | | |
| | Nine Months Ended September 30 | |
| | | | |
| | 2008 | | 2007 | |
| | | | | | |
(000’s of Canadian dollars) | | Refining | | Marketing | | Total | | Refining | | Marketing | | Total | |
| | | | | | | | | | | | | | |
| | | | | | | | | | | | | |
Sales revenue(1) | | 3,425,471 | | 544,698 | | 3,504,443 | | 2,404,522 | | 364,986 | | 2,474,044 | |
Cost of feedstock for processing and products for resale(1) | | 3,182,804 | | 503,435 | | 3,220,513 | | 2,051,188 | | 332,224 | | 2,087,948 | |
| | | | | | | | | | | | | |
Gross margin(2) | | 242,667 | | 41,263 | | 283,930 | | 353,334 | | 32,762 | | 386,096 | |
| | | | | | | | | | | | | |
| | | | | | | | | | | | | |
Average Refining Margin (US$/bbl) | | 8.38 | | | | | | 10.57 | | | | | |
| | | | | | | | | | | | | |
| |
(1) | Downstream sales revenue and cost of products for processing and resale are net of intra-segment sales of $193.4 million and $465.7 million for the three and nine months ended September 30, 2008 respectively ($132.8 million and $295.5 million – three and nine months ended September 30, 2007) reflecting the refined products produced by the refinery and sold by Marketing Division. |
| |
(2) | These are non-GAAP measures; please refer to “Non-GAAP Measures” in this MD&A. |
Harvest’s refining margin comprises sales of refined petroleum products that realize a premium price relative to WTI while it purchases crude oil and VGO as feedstock which is typically purchased at a discount relative to WTI. During the Third Quarter of 2008, our refining margin totaled $99.4 million, or US$10.47/bbl which is a 223% increase compared to the margin of $30.8 million or US$3.08/bbl realized during the Third Quarter of 2007. This increase is attributed to a significant improvement in the discount on feedstock costs relative to WTI in the Third Quarter of 2008 as compared to the same period in 2007, marginally offset by a reduction in the refined product sales prices relative to WTI between the Third Quarters of 2008 and 2007.
For the nine months ended September 30, 2008, Harvest’s refining margin totaled $242.7 million, a reduction of $110.7 million compared to the first nine months of the prior year, reflecting an average refining margin of US$8.38/bbl in 2008 as compared to US$10.57/bbl in 2007. The US$2.19/bbl year-over-year decrease in our average refining margin is due to lower gasoline and HSFO crack spreads, only partially offset by improved crack spreads on distillate products and an improved discount on our cost of feedstock relative to WTI.
18
The following summarizes our refining margin per barrel relative to our cost of feedstock and the WTI benchmark from the period January 2007 to September 2008:
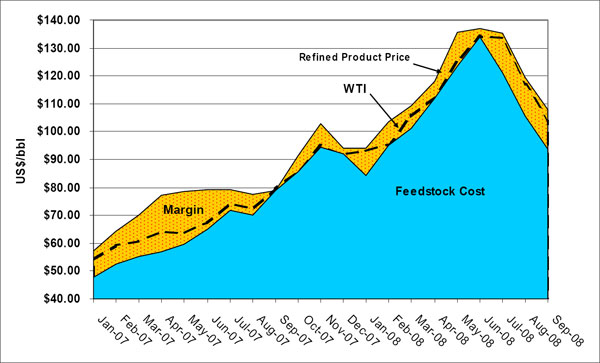
Relative to the average Third Quarter 2008 2-1-1 Crack Spread of US$13.31, our average refining margin of US$10.47/bbl is US$2.84/bbl lower as compared to being US$8.98/bbl lower than the 2-1-1 Crack Spread in the Third Quarter of the prior year. The relative improvement in our refining margin is primarily attributed to the higher discount on our purchases of medium gravity sour crude oil feedstock relative to WTI. In the Third Quarter of 2008, the average cost of our crude oil feedstock was US$105.01, a discount of US$12.97/bbl relative to WTI as compared to an average cost of US$71.85/bbl and a discount of US$3.53/bbl in the prior year.
On a year-to-date basis, our average refining margin of US$8.38/bbl was US$5.68/bbl lower than the average 2-1-1 Crack Spread of US$14.06 for the first nine months of 2008. This compares to an average refining margin of US$10.57/bbl which was US$4.79/bbl lower than the 2-1-1 Crack Spread for the nine months ended September 30, 2007. The US$0.89/bbl increase in differential from the 2-1-1 Crack Spread is primarily attributed to increased discounts for HSFO coupled with lower crack spreads on RBOB gasoline, partially offset by higher crack spreads on distillates and increased discounts on our cost of feedstock.
Harvest’s marketing and related businesses is comprised of the retail and wholesale distribution of gasoline, diesel, jet and other transportation fuels as well as home heating fuels and related appliances and the revenues from our marine services including tugboat revenues. During the three and nine months ended September 30, 2008, the gross margin contributed by our marketing division increased by 31% and 26%, respectively, as compared to the prior year primarily due to a significant increase in the price of sulphur, which is sold through a profit sharing agreement with a third party processor. The profit sharing contribution from our sulphur sales is $2.6 million for the three months ended September 30, 2008 (three months ended September 30, 2007 - $0.2 million) and $8.3 million for the nine months ended September 30, 2008 (nine months ended September 30, 2007 - $0.3 million).
19
Refined Product Sales Revenue
All of our gasoline and distillate products are sold to Vitol pursuant to the Supply and Offtake Agreement with the exception of products sold in Newfoundland through our marketing division and effective January 20, 2008, our HSFO which is now sold to a wholly-owned affiliate of one of the world’s largest integrated oil and natural gas producers. Prior to January 20, 2008, our HSFO had also been sold to Vitol. The Supply and Offtake Agreement has pricing terms that reflect market prices based on an average delay of ten days which results in our sales to Vitol and our cost of refinery feedstock purchased from Vitol being priced on a slightly different time period than the prices at the time of delivery. With the exception of the sales to Vitol, our refined products are sold at prices that reflect market prices at the time that the product is delivered to the purchaser. For more information on the Supply and Offtake Agreement with Vitol, see the description in our Annual Information Form for the year ended December 31, 2007 as filed on SEDAR atwww.sedar.com.
A comparison of our refinery yield, product pricing and revenue for each of the three and nine months ended September 30, 2008 and 2007 is presented below.
| | | | | | | | | | | | | |
| | | |
| | Three Months Ended September 30 | |
| | | | |
| | 2008 | | 2007 | |
| | | | | | |
| | Refinery
Revenues | Volume | Sales
Price(1) | | Refinery
Revenues | Volume | Sales
Price(1) | |
| | | | | | | | | | | | | | |
| | (000’s of Cdn $) | (000s of bbls) | (US$ per bbl/
US$ per US gal) | | (000’s of Cdn $) | (000s of bbls) | (US$ per bbl/
US$ per US gal) | |
| | | | | | | | | | | | | |
Gasoline products | | 408,292 | | 3,329 | | 117.74/2.80 | | 249,628 | | 2,800 | | 85.32/2.03 | |
Distillates | | 545,610 | | 3,841 | | 136.37/3.25 | | 344,521 | | 3,719 | | 88.65/2.11 | |
High sulphur fuel oil | | 233,988 | | 2,267 | | 99.09 | | 169,926 | | 2,791 | | 58.27 | |
| | | | | | | | | | | | | |
| | 1,187,890 | | 9,437 | | 120.84 | | 764,075 | | 9,310 | | 78.54 | |
| | | | | | | | | | | | | |
Inventory adjustment | | | | (347 | ) | | | | | 144 | | | |
| | | | | | | | | | | | | |
Total production | | | | 9,090 | | | | | | 9,454 | | | |
Yield (as a % of Feedstock)(2) | | 100 | % | | | | | 99 | % | | |
| | | | | | | | | | | |
| | | | | | | | | | | | | |
|
| | | |
| | Nine Months Ended September 30 | |
| | | | |
| | 2008 | | 2007 | |
| | | | | | |
| | Refinery
Revenues | Volume | Sales
Price(1) | | Refinery
Revenues | Volume | Sales
Price(1) | |
| | | | | | | | | | | | | | |
| | (000’s of Cdn $) | (000s of bbls) | (US$ per bbl/
US$ per US gal) | | (000’s of Cdn $) | (000s of bbls) | (US$ per bbl/
US$ per US gal) | |
| | | | | | | | | | | | | |
Gasoline products | | 1,130,160 | | 9,567 | | 116.00/2.76 | | 861,246 | | 9,343 | | 83.61/1.99 | |
Distillates | | 1,664,774 | | 11,901 | | 137.37/3.27 | | 1,072,177 | | 11,785 | | 82.52/1.96 | |
High sulphur fuel oil | | 630,537 | | 7,235 | | 85.58 | | 471,099 | | 8,484 | | 50.36 | |
| | | | | | | | | | | | | |
| | 3,425,471 | | 28,703 | | 117.19 | | 2,404,522 | | 29,612 | | 73.65 | |
| | | | | | | | | | | | | |
Inventory adjustment | | | | (453 | ) | | | | | 459 | | | |
| | | | | | | | | | | | | |
Total production | | | | 28,250 | | | | | | 30,071 | | | |
Yield (as a % of Feedstock)(2) | | 99 | % | | | | | 99 | % | | |
| | | | | | | | | | | |
| |
(1) | Average product sales prices are based on the deliveries at our refinery loading facilities |
| |
(2) | After adjusting for changes in inventory held for resale |
Our refinery sales revenue is dependent on the sales value of the refined products produced as well as the yield of refined products produced from the various crude oil feedstocks. We analyze our sales revenue from refined product sales relative to the premium (or discount) compared to industry benchmark prices for specific refined products as well as relative to the WTI benchmark price. Although our yield can be altered slightly by adjusting refinery operations to react to market conditions and seasonal demand, product yields are primarily impacted by the type of crude oil feedstock processed and refinery performance. For the three months ended September 30, 2008, our refinery yield was comprised of 30% gasoline products, 44% distillates and 26% HSFO as compared to 33%, 38% and 29%, respectively, in the prior year. For the nine months ended September 30, 2008, our refinery yield was comprised of 31% gasoline products, 43% distillates and 26% HSFO compared to 33%, 39% and 28% for the same products, respectively during 2007. The shift in product yield in 2008 relative to 2007 from HSFO and gasoline to higher valued distillates is attributed to running less crude oil and more VGO, running a different crude oil slate, and the reduction of crude oil throughput volumes in July and August of 2008 to the level sufficient to eliminate the production of vacuum tower bottoms (“VTB’s”) in excess of our visbreaker unit capacity, thereby eliminating the need to downgrade middle distillate valued streams to blend the excess VTB’s into HSFO.
20
The aggregate average sales price for our refined products was US$120.84/bbl during the Third Quarter of 2008, representing premium to WTI of US$2.86/bbl as compared to an average selling price of US$78.54/bbl realized in the Third Quarter of the prior year with a premium to WTI of US$3.16/bbl. The reduction of US$0.30/bbl in our sales price relative to WTI aggregates to a $2.9 million reduction in sales revenue and gross margin.
During the Third Quarter of 2008, the US$117.74/bbl average sales price for our gasoline products reflects a US$0.24/bbl discount to WTI, as compared to the US$9.94/bbl premium over WTI realized in 2007. This discount relative to WTI in the Third Quarter of 2008 reflects the weaker RBOB gasoline Crack Spreads evident in the Fourth Quarter of 2008.
For distillates, our average sales price was US$136.37/bbl during the Third Quarter of 2008, a US$18.39/bbl premium over WTI, as compared to a US$13.27/bbl premium realized in the Third Quarter of 2007. Included in our Third Quarter 2008 distillate revenue are approximately 1.6 million barrels of distillate product that were sold in Europe for which we received $2.4 million of incremental revenue (US$1.47 per barrel) pursuant to our profit sharing arrangement with Vitol.
The average sales price of our HSFO of US$99.09/bbl reflects a US$18.89/bbl discount to WTI as compared to a US$17.11/bbl discount in the Third Quarter of 2007, representing a $4.0 million reduction in sales revenue and gross margin as compared to the prior year. The average sales price of our HSFO in the Third Quarter of 2008 represents a US$18.45 improvement over the US$37.34 discount realized in the Second Quarter of 2008. The US$5.12 improvement in our distillate pricing relative to WTI and the shift in product yield from gasoline and HSFO to distillates was insufficient to fully offset the impact of the US$10.18 and US$1.78 price reductions relative to WTI for our gasoline products and HSFO, respectively.
During the nine months ended September 30, 2008, our average aggregate selling price for refined products was US$117.19/bbl, representing a premium to the average WTI price of US$3.90/bbl compared to an average selling price of US$73.65/bbl and a premium to WTI of US$7.46/bbl during 2007, a reduction of US$3.56/bbl. This reduction is attributed to an 84% reduction in the gasoline premium relative to WTI and a 75% increase in the discount on HSFO relative to WTI, partially offset by improved premiums relative to WTI on distillate products of 47% and the shift in product yield from gasoline and HSFO to distillates.
The following chart summarizes Harvest’s refining margin by product per barrel over the past seven quarters:
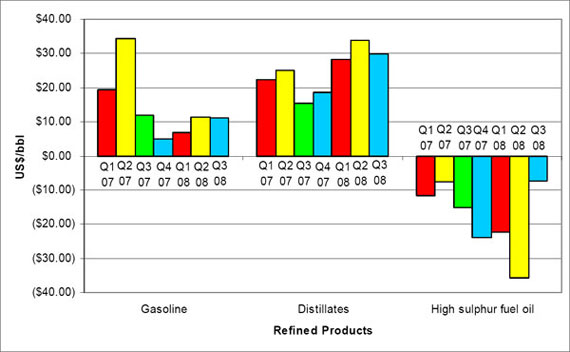
21
Refinery Feedstock
We purchase our refinery feedstock from Vitol pursuant to the terms of the Supply and Offtake Agreement whereby the price of feedstock floats with WTI for the period from initial pricing through to the date it is charged to the refinery subject to an average ten day delay similar to the product sales pricing formulas. This method of pricing results in our costs being based on a slightly different time period than the monthly average WTI benchmark price. The WTI benchmark price averaged US$133.48 for the month of July 2008, US$116.69 for August 2008 and US$103.76 for September 2008 as compared to the average for the three months ended September 2008 of US$117.98. This volatility in WTI results in it being difficult to compare the economics of individual crude costs on a quarterly basis when our consumption of crude types varies from month to month and the aggregation of feedstock costs, including their discount relative to WTI, is priced based on benchmark pricing ten days after consumption.
A comparison of crude oil and VGO feedstock processed for the three and nine months ended September 30, 2008 and 2007 is presented below.
| | | | | | | | | | | | | | | |
| | | |
| | Three Months Ended September 30 | |
| | | | |
| | 2008 | | 2007 | |
| | | | | | |
| | Cost of
Feedstock | Volume | | Cost per
Barrel(1) | Cost of
Feedstock | Volume | | Cost per
Barrel(1) |
| | | | | | | | | | | | | | |
| | (000’s of Cdn $) | (000s of bbls) | | (US$/bbl) | (000’s of Cdn $) | (000s of bbls) | | (US$/bbl) |
| | | | | | | | | | | | | |
Iraqi | | 390,848 | | 3,573 | | | 105.01 | | 478,504 | | 6,384 | | | 71.73 | |
Russian | | 277,250 | | 2,489 | | | 106.93 | | 85,304 | | 1,125 | | | 72.57 | |
Venezuelan | | 223,918 | | 2,093 | | | 102.70 | | 90,792 | | 1,210 | | | 71.81 | |
| | | | | | | | | | | | | | | |
Crude Oil Feedstock | | 892,016 | | 8,155 | | | 105.01 | | 654,600 | | 8,719 | | | 71.85 | |
Vacuum Gas Oil | | 120,505 | | 965 | | | 119.88 | | 78,060 | | 847 | | | 88.20 | |
| | | | | | | | | | | | | | | |
| | 1,012,521 | | 9,120 | | | 106.58 | | 732,660 | | 9,566 | | | 73.30 | |
| | | | | | | | | | | | | | | |
Other costs | | 75,934 | | | | | | | 642 | | | | | | |
| | | | | | | | | | | | | | | |
| | 1,088,455 | | | | | | | 733,302 | | | | | | |
| | | | | | | | | | | | | | | |
| | | | | | | | | | | | | | | |
| | | |
| | Nine Months Ended September 30 | |
| | | | |
| | 2008 | | 2007 | |
| | | | | | |
| | Cost of
Feedstock | Volume | | Cost per
Barrel(1) | Cost of
Feedstock | Volume | | Cost per
Barrel(1) |
| | | | | | | | | | | | | | |
| | (000’s of Cdn $) | (000s of bbls) | | (US$/bbl) | (000’s of Cdn $) | (000s of bbls) | | (US$/bbl) |
| | | | | | | | | | | | | | | |
Iraqi | | 1,614,974 | | 15,101 | | | 105.02 | | 1,337,812 | | 20,179 | | | 60.13 | |
Russian | | 557,234 | | 5,194 | | | 105.35 | | 237,311 | | 3,371 | | | 63.85 | |
Venezuelan | | 580,289 | | 5,352 | | | 106.47 | | 263,293 | | 4,089 | | | 58.40 | |
| | | | | | | | | | | | | | | |
Crude Oil Feedstock | | 2,752,497 | | 25,647 | | | 105.39 | | 1,838,416 | | 27,639 | | | 60.33 | |
Vacuum Gas Oil | | 346,470 | | 2,802 | | | 121.43 | | 212,407 | | 2,678 | | | 71.94 | |
| | | | | | | | | | | | | | | |
| | 3,098,967 | | 28,449 | | | 106.97 | | 2,050,823 | | 30,317 | | | 61.35 | |
| | | | | | | | | | | | | | | |
Other costs | | 83,837 | | | | | | | 365 | | | | | | |
| | | | | | | | | | | | | | | |
| | 3,182,804 | | | | | | | 2,051,188 | | | | | | |
| | | | | | | | | | | | | | | |
| |
(1) | Cost of feedstock includes all costs of transporting the crude oil to refinery in Newfoundland |
During the Third Quarter of 2008, our feedstock was comprised of 88,641 bbl/d of medium sour crude oil and 10,486 bbl/d of VGO as compared to 94,774 bbl/d of crude oil and 9,209 bbl/d of VGO in the prior year. While the refinery experienced limited unplanned downtime during the Third Quarter of 2008, our daily volume of crude oil throughput decreased by 6,133 bbl/d due to a decision to improve overall gross margin by reducing crude oil feedstock volumes to the level sufficient to eliminate the production of vacuum tower bottoms (“VTB’s”) in excess of our visbreaker unit capacity, thereby eliminating the need to downgrade middle distillate valued streams to blend the excess VTB’s into HSFO. To offset the reduced crude oil throughput, VGO purchases were increased to maintain ISOMAX rates at the highest possible levels and maximize the gross margin contribution from this process unit.
The cost of our crude oil feedstock averaged US$105.01/bbl during the Third Quarter of 2008 representing a US$12.97/bbl discount from WTI as compared to a cost of US$71.85/bbl and a discount of US$3.53/bbl, respectively, in the prior year. While the increased discount to WTI of US$9.44/bbl aggregates to an $80.2 million decrease in crude oil feedstock costs, the year-over-year US$42.60 increase in the WTI price added $361.9 million to our crude oil feedstock cost during the Third Quarter of 2008. In aggregate, the US$105.01/bbl average cost of feedstock during the Third Quarter of 2008 represents a 46% increase over the average cost in the prior year, which impacts our working capital and increases our “Time Value of Money” charges paid to Vitol as part of the Supply and Offtake agreement. The cost of feedstock reflects numerous factors beyond changes in WTI such as the crude oil slate processed during the period, the Official Selling Price (“OSP”) as set by the Oil Marketing Company of the Republic of Iraq, the costs of transporting the crude feedstock to our refinery and the ten day delay in pricing as a result of the Supply and Offtake pricing formula.
22
The average cost of purchased VGO during the Third Quarter of 2008 was US$119.88/bbl representing a premium of US$1.90/bbl relative to the WTI benchmark price as compared to US$88.20/bbl and a US$12.82/bbl premium, respectively, in the prior year. The higher premium in 2007 is attributed to supply and demand disruptions in that year in the very tightly balanced VGO market. We processed 1.0 million barrels of VGO during the Third Quarter of 2008, as such the US$10.92/bbl lower premium aggregates to an $11.0 million decrease in feedstock costs and similarly, an $11.0 million increase in gross margin compared to the Third Quarter of 2007.
During the first nine months of 2008, the total cost of feedstock was US$106.97/bbl, an increase of US$45.62/bbl over the first nine months of 2007 during which the total cost averaged US$61.35/bbl. This increase is primarily attributed to the 71% increase in WTI during the first nine months of 2008 relative to the first nine months of 2007, coupled with a US$2.39/bbl increase in the premium paid for VGO relative to WTI, partially offset by a US$2.04/bbl increase in the average discount realized to WTI on crude oil purchases.
Operating Expenses
The following summarizes the operating costs from the refinery and marketing division for the three and nine months ended September 30, 2008 and 2007:
| | | | | | | | | | | | | | | | | | | |
| | | |
| | Three Months Ended September 30 | |
| | | | | | |
| | 2008 | | 2007 | |
| | | | | | | | | | | | | | |
(000’s of Canadian dollars) | | Refining | | Marketing | | Total | | Refining | | Marketing | | Total | |
| | | | | | | | | | | | | | |
| | | | | | | | | | | | | | | | | | | |
Operating expense | | | 18,458 | | | 4,899 | | | 23,357 | | | 20,262 | | | 4,513 | | | 24,775 | |
Turnaround and catalyst | | | 1,011 | | | - | | | 1,011 | | | 6,622 | | | - | | | 6,622 | |
Purchased energy | | | 33,958 | | | - | | | 33,958 | | | 22,340 | | | - | | | 22,340 | |
| | | | | | | | | | | | | | | | | | | |
| | | 53,427 | | | 4,899 | | | 58,326 | | | 49,224 | | | 4,513 | | | 53,737 | |
| | | | | | | | | | | | | | | | | | | |
| | | | | | | | | | | | | | | | | | | |
| | | |
| | Nine Months Ended September 30 | |
| | | | | | |
| | 2008 | | 2007 | |
| | | | | | | | | | | | | | |
(000’s of Canadian dollars) | | Refining | | Marketing | | Total | | Refining | | Marketing | | Total | |
| | | | | | | | | | | | | | | | | | | | |
| | | | | | | | | | | | | | | | | | | |
Operating expense | | | 60,022 | | | 14,846 | | | 74,868 | | | 63,415 | | | 13,305 | | | 76,720 | |
Turnaround and catalyst | | | 1,011 | | | - | | | 1,011 | | | 6,622 | | | - | | | 6,622 | |
Purchased energy | | | 106,985 | | | - | | | 106,985 | | | 64,677 | | | - | | | 64,677 | |
| | | | | | | | | | | | | | | | | | | |
| | | 168,018 | | | 14,846 | | | 182,864 | | | 134,714 | | | 13,305 | | | 148,019 | |
| | | | | | | | | | | | | | | | | | | |
The largest component of refining operating expense is wages, salaries and benefits which totaled $12.5 million during the Third Quarter of 2008 (2007 - - $13.1 million) while the other significant components were maintenance and repairs costs of $2.0 million (2007 - $2.5 million), insurance of $1.5 million (2007 - $1.5 million) and professional services of $1.6 million (2007 - $1.5 million). Refining operating expenses were $2.02/bbl during the Third Quarter of 2008 as compared to $2.12/bbl in the Third Quarter of 2007 reflecting a relative reduction in expenditures of $1.8 million somewhat offset by reduced throughput.
On a year-to-date basis, downstream operating costs were $74.9 million in 2008, a decrease of $1.9 million from the first nine months of 2007. Refining operating expenses were $2.11/bbl as compared to $2.09/bbl in the prior year due primarily to reduced throughput. The Marketing division’s operating expenses have increased by $1.5 million primarily due to scheduled tug boat maintenance in June 2008.
23
Turnaround and catalyst expenditures of $0.4 million and $0.6 million respectively (2007 - $2.6 million and $4.0 million, respectively), relate to planned equipment certifications scheduled during the shutdown to implement the visbreaker unit project modifications.
Purchased energy, consisting of low sulphur fuel oil and electricity, is required to provide heat and power to refinery operations. Our purchased energy for the three and nine months ended September 30, 2008 was $3.72 and $3.76 per barrel of throughput, respectively, as compared to $2.34/bbl and $2.13/bbl for the three and nine month periods ended September 30, 2007. In the Third Quarter of 2008, we purchased approximately 355,000 barrels of fuel oil at an average price of US$85.03/bbl as compared to approximately 283,000 barrels purchased in the Third Quarter of 2007 at an average price of US$67.23/bbl. The $11.6 million increase in the cost of purchased fuel oil is due to a $6.5 million favourable price variance and a $5.1 million favourable volume variance. Our electricity costs remained substantially unchanged during the Third Quarter of 2008 at $2.5 million as compared to $2.4 million in the prior year.
Marketing Expense
During the three and nine months ended September 30, 2008, marketing expense was comprised of $0.9 million and $2.5 million, respectively, of marketing fees (based on US $0.08/bbl) to acquire feedstock (three and nine months ended September 30, 2007 - $0.8 million and $2.8 million) and $7.7 million and $24.1 million, respectively, of “Time Value of Money” charges (three and nine months ended September 30, 2007 - $9.9 million and $24.3 million) both pursuant to the terms of the Supply and Offtake Agreement. The decreased “Time Value of Money” charge is mainly the result of a lower LIBOR rate in the Third Quarter of 2008 as compared to the prior year which was somewhat offset by a larger crude oil inventory investment due to the higher WTI benchmark price during 2008. As at September 30, 2008, Harvest has commitments totaling approximately $859.9 million in respect of future crude oil feedstock purchases and related transportation from Vitol.
Capital Expenditures
Capital spending for the three and nine month periods ended September 30, 2008 totaled $17.2 million and $31.8 million respectively. The largest component of our 2008 downstream capital program relates to the enhancement of our visbreaker capacity, estimated at $28.5 million, of which approximately $10.5 million was incurred in the Third Quarter ($16.4 million year-to-date).
Depreciation and Amortization Expense
The following summarizes the depreciation and amortization expense for the three and nine months ended September 30, 2008 and 2007:
| | | | | | | | | | | | | | | | | | | |
| | | |
| | Three Months Ended September 30 | |
| | | | | | | | | | | | | | |
| | 2008 | | 2007 | |
| | | | | | |
(000’s of Canadian dollars) | | Refining | | Marketing | | Total | | Refining | | Marketing | | Total | |
| | | | | | | | | | | | | | | | | | | | |
| | | | | | | | | | | | | | | | | | | |
Tangible assets | | | 15,045 | | | 652 | | | 15,697 | | | 15,250 | | | 503 | | | 15,753 | |
Intangible assets | | | 1,159 | | | 339 | | | 1,498 | | | 1,163 | | | 364 | | | 1,527 | |
| | | | | | | | | | | | | | | | | | | |
| | | 16,204 | | | 991 | | | 17,195 | | | 16,413 | | | 867 | | | 17,280 | |
| | | | | | | | | | | | | | | | | | | |
| | | | | | | | | | | | | | | | | | | |
| | | |
| | Nine Months Ended September 30 | |
| | | | | | |
| | 2008 | | 2007 | |
| | | | | | | | | | | | | | |
(000’s of Canadian dollars) | | Refining | | Marketing | | Total | | Refining | | Marketing | | Total | |
| | | | | | | | | | | | | | | | | | | | |
| | | | | | | | | | | | | | | | | | | |
Tangible assets | | | 44,225 | | | 1,817 | | | 46,042 | | | 48,544 | | | 1,468 | | | 50,012 | |
Intangible assets | | | 3,400 | | | 996 | | | 4,396 | | | 3,688 | | | 1,154 | | | 4,842 | |
| | | | | | | | | | | | | | | | | | | |
| | | 47,625 | | | 2,813 | | | 50,438 | | | 52,232 | | | 2,622 | | | 54,854 | |
| | | | | | | | | | | | | | | | | | | |
The process units are amortized over an average useful life of 20 to 30 years. The intangible assets, consisting of engineering drawings, customer lists and fuel supply contracts, are amortized over a period of 20 years, 10 years and the term of the expected cash flows, respectively.
24
Goodwill
As the downstream assets are held in a self-sustaining subsidiary with a US dollar functional currency, the value of the goodwill is adjusted at the end of each accounting period to reflect the current US dollar exchange rate. We assess goodwill for impairment annually, or more frequently if events or changes in circumstances warrant. There has been no charge for impairment to goodwill since the date of acquisition.
25
RISK MANAGEMENT, FINANCING AND OTHER
Cash Flow Risk Management
With respect to our cash flow risk management program, our MD&A for the year ended December 31, 2007 included a comprehensive discussion of our approach to analyzing our cash flow at risk relative to changes in crude oil prices, natural gas prices, the US/Canadian dollar exchange rate and certain refined product prices. See the “Cash Flow Risk Management” in our MD&A for the year ended December 31, 2007 filed on SEDAR atwww.sedar.com. The details of our commodity price contracts outstanding at September 30, 2008 are included in the notes to our consolidated financial statements which are also filed on SEDAR atwww.sedar.com.
While strong commodity prices experienced throughout 2008 have resulted in record operating cash flow from our upstream activities, this has also resulted in significant realized losses on our price risk management contracts. The table below provides a summary of the gains and losses realized on our price risk management contracts for each of the three month and nine month periods ended September 30, 2008 and 2007:
| | | | | | | | | | | | | | | | | | | |
| | | | | |
| | Three Months Ended September 30 | | Nine Months Ended September 30 | |
| | | | | |
|
(000s) | | 2008 | | 2007 | | Change | | 2008 | | 2007 | | Change | |
| | | | | | | | | | | | | | | | | | | | |
Crude oil | | $ | (17,568 | ) | $ | (12,922 | ) | | 36 | % | $ | (41,255 | ) | $ | (19,675 | ) | | 110 | % |
Refined product | | | (78,648 | ) | | - | | | n/a | | | (195,738 | ) | | - | | | n/a | |
Natural gas | | | (67 | ) | | 6,275 | | | (101 | %) | | (325 | ) | | 6,566 | | | (105 | %) |
Currency exchange rates | | | (33 | ) | | 2,051 | | | (102 | %) | | 5,125 | | | 1,450 | | | 253 | % |
Electric Power | | | 1,818 | | | 2,803 | | | (35 | %) | | 6,977 | | | 2,743 | | | 154 | % |
| | | | | | | | | | | | | | | | | | | | |
Total | | $ | (94,498 | ) | $ | (1,793 | ) | | 5,170 | % | $ | (225,216 | ) | $ | (8,916 | ) | | 2,426 | % |
| | | | | | | | | | | | | | | | | | | | |
During the first nine months of 2008, the net realized loss on price risk management contracts aggregated to $225.2 million as compared to $8.9 million in the prior year. This increase is primarily due to the increased losses related to our crude oil and refined product pricing contracts offset somewhat by increased gains on currency exchange rate and electric power contracts. During this period, WTI averaged US$113.29 in 2008 as compared to US$66.19 in 2007, while the contracted prices capped our WTI price exposure at an average of US$75.06 on approximately 29,000 bbls/d in 2008 while in 2007 our crude oil price contracts had price caps of approximately US$56.00 and included approximately 70% participation on prices above US$56.00 on approximately 28,000 bbls/d. For the balance of 2008, we have capped our WTI price exposure on 26,075 bbls/d at an average of US$80.86, while providing a floor price of US$53.85. Our exposure in 2009 is capped on 20,000 bbls/d at an average of US$85.09, with a floor price of US$61.94. As discussed in our 2007 year end MD&A, our WTI price risk management is comprised of both WTI price contracts as well as the refined product price contracts for heating oil and fuel oil, as refined product prices are essentially comprised of a WTI benchmark price plus the related crack spread, in our case, either a NYMEX heating oil or Platt’s fuel oil crack spread. Relative to our average 32,637 bbls/d of daily production of crude oil and natural gas liquids, net of royalties, during the Third Quarter of 2008, our price risk management contracts left 6,562 bbls/d of net production exposed to WTI prices above US$80.86.
26
In respect of refined products, we also had pricing contracts in place for 12,000 bbl/d of NYMEX heating oil and 8,000 bbl/d of Platts heavy fuel oil for the Third Quarter of 2008 and the cash settlements of these contracts aggregated to $78.5 million during the quarter. In addition, we had contracts in place on 6,000 bbl/d of NYMEX heating oil crack spread, 2,000 bbl/d of Platts heavy fuel oil crack spread and 6,000 bbl/d of NYMEX RBOB gasoline crack spread which were settled with cash payments of $0.1 million during the Third Quarter of 2008. As of September 30, 2008, we had the following refined product price contracts in place:
| | |
| For the period from October 2008 through December 2008 |
| | |
| • | 12,000 bbl/d of NYMEX heating oil, |
| | |
| • | 8,000 bbl/d of Platts heavy fuel oil, |
| | |
| • | 6,000 bbl/d of NYMEX heating oil crack spread |
| | |
| • | 2,000 bbl/d of Platts heavy fuel oil crack spread, and |
| | |
| • | 6,000 bbl/d of NYMEX RBOB gasoline comprised of an RBOB crack contract and a WTI price contract. |
| | |
| For the period from January 2009 through June 2009 |
| | |
| • | 12,000 bbl/d of NYMEX heating oil, and |
| | |
| • | 8,000 bbl/d of Platts heavy fuel oil. |
At the end of September 2008, we had a modest 776 GJ/d of natural gas price contracts in place through December 2008.
With respect to currency exchange rates, we had an exchange rate collar in place that collared an exchange rate of Cdn$1.00 to Cdn$1.055 per US$1.00 on US$10 million per month. The settlements on the exchange rate collar settled with a nominal payment by Harvest in the Third Quarter of 2008. The exchange rate collar extends through December 2008.
During the Third Quarter of 2008, the settlement of our fixed price power contracts for 35 MWh at $56.69 per MWh resulted in $1.8 million received by Harvest as the Alberta electric power prices averaged $80.36 per MWh during the period. This fixed price contract continues for 35 MWh through December 2008.
The following is a summary of net unrealized gains and losses recorded for our price risk management contracts for each of the three and nine month periods ended September 30, 2008 and 2007:
| | | | | | | | | | | | | | | | | | | |
| | | | | |
| | Three Months Ended September 30 | Nine Months Ended September 30 |
| | | | | | | | | | | | | |
|
(000s) | | 2008 | | 2007 | | Change | | 2008 | | 2007 | | Change | |
| | | | | | | | | | | | | | | | | | | | |
Crude oil | | $ | 48,474 | | $ | (2,836 | ) | | (1,809 | %) | $ | 13,351 | | $ | (14,205 | ) | | (194 | %) |
Refined product | | | 316,116 | | | (15,697 | ) | | (2,114 | %) | | (7,001 | ) | | (24,348 | ) | | (71 | %) |
Natural gas | | | 413 | | | (5,183 | ) | | (108 | %) | | 180 | | | (644 | ) | | (128 | %) |
Currency exchange rates | | | (1,024 | ) | | 6,600 | | | (116 | %) | | (9,160 | ) | | 17,666 | | | (152 | %) |
Electric Power | | | (4,325 | ) | | (4,819 | ) | | (10 | %) | | (3,701 | ) | | (3,511 | ) | | 5 | % |
| | | | | | | | | | | | | | | | | | | | |
Total | | $ | 359,654 | | $ | (21,935 | ) | | (1,740 | %) | $ | (6,331 | ) | $ | (25,042 | ) | | (75 | %) |
| | | | | | | | | | | | | | | | | | | | |
At the end of 2007, the mark-to-market deficiency on our refined product and WTI price contracts was $138.8 million and $24.9 million, respectively, while the mark-to-market value of our natural gas, currency exchange rate and electrical power price contracts aggregated to $14.0 million. As of September 30, 2008, the mark-to-market deficiency on our refined product and WTI price contracts was $157.7 million while the mark-to-market value of our natural gas, currency exchange rate and electrical power price contracts aggregated to $1.3 million. The unrealized gain on our refined product and WTI price contracts in the Third Quarter of 2008 is due to the decrease in forward commodity prices at September 30, 2008 as compared to those at June 30, 2008, which has resulted in a partial recovery of the unrealized losses on our refined product and WTI price contracts recorded during the first six months of 2008.
27
In October 2008, the settlement of our price risk management contracts resulted in cash receipts of $1.5 million in respect of our refined product and WTI price contracts and $1.1 million in respect of our Alberta power price contracts, offset by cash payments of $1.3 million in respect of our currency exchange rate contract. On October 31, 2008, the WTI forward price curve was approximately US$30.00 lower than on September 30, 2008 which combined with other fluctuations in forward refined product prices has resulted in our mark-to-market deficiency at the end of October being approximately $154.0 million lower than at the end of September.
| | | | | | | | | | | | | | | | | | | |
Interest Expense | | | | | |
|
| | |
| | Three Months Ended September 30 | Nine Months Ended September 30 |
| |
| | | | | | | | | | | | | |
(000s) | | 2008 | | 2007 | | Change | | 2008 | | 2007 | | Change | |
| |
Interest on short term debt | | | | | | | | | | | | | | | | | | | |
Bank loan | | $ | - | | $ | - | | | - | % | $ | - | | $ | 1,275 | | | (100 | %) |
Convertible Debentures | | | 32 | | | 606 | | | (95 | %) | | 233 | | | 1,900 | | | (88 | %) |
Amortization of deferred finance charges – short term debt | | | - | | | - | | | - | % | | - | | | 1,811 | | | (100 | %) |
| | | | | | | | | | | | | | | | | | | | |
| | | 32 | | | 606 | | | (95 | %) | | 233 | | | 4,986 | | | (95 | %) |
| | | | | | | | | | | | | | | | | | | | |
| | | | | | | | | | | | | | | | | | | |
Interest on long-term debt | | | | | | | | | | | | | | | | | | | |
Bank loan | | | 12,514 | | | 16,373 | | | (24 | %) | | 40,959 | | | 52,903 | | | (23 | %) |
Convertible Debentures | | | 19,290 | | | 13,193 | | | 46 | % | | 49,899 | | | 43,587 | | | 14 | % |
77/8% Senior Notes | | | 5,584 | | | 5,523 | | | 1 | % | | 16,231 | | | 17,328 | | | (6 | %) |
Amortization of deferred finance charges – long term debt | | | 675 | | | 675 | | | 0 | % | | 2,024 | | | 2,022 | | | 0 | % |
| | | | | | | | | | | | | | | | | | | | |
| | | 38,063 | | | 35,764 | | | 6 | % | | 109,113 | | | 115,840 | | | (6 | %) |
| | | | | | | | | | | | | | | | | | | | |
Total interest expense | | $ | 38,095 | | $ | 36,370 | | | 5 | % | $ | 109,346 | | $ | 120,826 | | | (10 | %) |
| | | | | | | | | | | | | | | | | | | | |
Interest expense, including the amortization of related financing costs, increased $1.7 million and decreased $11.5 million in the three and nine month periods ended September 30, 2008, respectively, as compared to the same periods in the prior year. The 5% increase in the Third Quarter of 2008 over the Third Quarter of 2007 is primarily attributed to the increase in interest expense incurred on convertible debentures, offset by a reduction of interest on our bank borrowings. On a year-to-date basis, our total interest expense has decreased by 10% compared to the prior year, as interest on our bank borrowings has decreased by $13.2 million due to a lower average borrowing cost, while total interest expense on convertible debentures has increased as a result of our 2008 convertible debenture offering.
At September 30, 2008, we had drawn approximately $1,199.8 million of bank borrowings as compared to $1,279.5 million at December 31, 2007 and $1,035.3 million at June 30, 2008. The year-to-date decrease in our outstanding bank borrowings is primarily attributed to applying the net proceeds from the 7.5% Convertible Debenture offering completed in the Second Quarter 2008 against our outstanding debt, offset by the acquisitions completed in the Third Quarter 2008. The interest on our $1.6 billion Extendible Revolving Credit Facility is at a floating rate based on 70 basis points over bankers’ acceptances for Canadian dollar borrowings. During the three and nine month periods ended September 30, 2008, interest charges on bank loans aggregated to $12.5 million and $41.0 million, reflecting effective interest rates of 3.92% and 4.21% respectively. Further details on our credit facilities are included under “Liquidity and Capital Resources”.
The interest on our Convertible Debentures totaled $19.3 million and $50.1 million during the three and nine months ended September 30, 2008 respectively, representing a $5.5 million and $4.6 million increase over the same periods in the prior year. The increase is due to the April 25 issuance of $250 million face value of 7.5% Convertible Debentures due 2015. Details on the Convertible Debentures outstanding are fully described in Note 12 to the audited consolidated financial statements for the year ended December 31, 2007 filed on SEDAR at www.sedar.com. During the three and nine months ended September 30, 2008, there were $15,000 and $24.4 million of principal amount of Convertible Debentures converted to 1,083 and 1,177,957 Trust Units, respectively, including the settlement of $24.2 million principal amount of 10.5% Convertible Debentures that matured on January 31, 2008 with 1,166,593 Trust Units. Interest on the Convertible Debentures is based on the effective yield of the debt component of the Convertible Debentures, and as a result, the interest expense recorded is greater than the cash interest paid.
28
The interest on our 77/8% Senior Notes totaled $5.6 million and $16.2 million for the three and nine month periods ended September 30, 2008, representing a $0.1 million increase and a $1.1 million decrease over the same periods in the prior year. The year-to-date decrease is due to the strength of the Canadian dollar during these periods as compared to the relative periods in the prior year, as the interest on these notes is denominated in U.S. dollars. Similar to our Convertible Debentures, interest expense is based on the effective yield, and as a result, the interest expense recorded is greater than the cash interest paid.
Included in short and long term interest expense is the amortization of the discount on the 77/8% Senior Notes, the accretion on the debt component balance of the Convertible Debentures to face value at maturity, as well as the amortization of commitment fees and legal costs incurred for our credit facility, all totaling $0.7 million and $2.0 million for the three and nine month periods ended September 30, 2008 respectively.
Currency Exchange
Currency exchange gains and losses are attributed to the changes in the value of the Canadian dollar relative to the U.S. dollar on our U.S. dollar denominated 77/8% Senior Notes as well as any other U.S. dollar cash balances. Since December 31, 2007, the Canadian dollar has modestly weakened compared to the U.S dollar, resulting in a year-to-date unrealized foreign exchange loss of $15.1 million. Of this unrealized loss, $17.8 million relates to the 77/8% Senior Notes, offset by $3.2 million of unrealized foreign exchange gains attributed to downstream transactions. Realized foreign exchange losses of $6.1 million and $7.3 million for the three and nine months ended September 30, 2008, respectively, have resulted from the settlement of US dollar denominated transactions. In the Third Quarter of 2007 we repaid our U.S. dollar denominated LIBOR bank loans that were incurred in connection with our purchase of North Atlantic, realizing a foreign exchange gain of $43.5 million in the quarter and $47.1 million year-to-date in respect of this loan.
Our downstream operations are considered a self-sustaining operation with a U.S. dollar functional currency. The foreign exchange gains and losses incurred by our downstream operations relate to Canadian dollar transactions converted to U.S. dollars as their functional currency is U.S. dollars. The cumulative translation adjustment recognized in other comprehensive income represents the translation of our downstream operation’s U.S. dollar functional currency financial statements to Canadian dollars using the current rate method. During the Third Quarter of 2008, the weakening of the Canadian dollar relative to the U.S. dollar resulted in a $56.6 million cumulative translation gain (nine months ended September 30, 2008 – gain of $102.6 million) as the stronger U.S. dollar results in an increase in the relative value of the net assets in our downstream operations.
Future Income Tax
At the end of 2007, we had a net future income tax provision on our balance sheet totaling $86.6 million comprised of a $270.5 million provision for our mutual fund trust and other “flow through” entities and a net asset of $183.9 million for our corporate entities. For the three and nine months ended September 30, 2008, we have recorded a future income tax expense of $149.5 million and $32.5 million, respectively, to reflect the changes in both the temporary differences held in our corporate entities and for changes in our forecasted temporary differences for our “flow through entities” as well as legislative tax rate changes both as of January 1, 2011. At September 30, 2008 we have a net future tax liability on our balance sheet totaling $127.9 million comprised of a $218.9 million net asset for our corporate entities offset by a $346.8 million provision for our mutual fund trust and other “flow through” entities. The future income tax asset recorded by our corporate entities will fluctuate during each accounting period to reflect changes in the respective temporary differences between the book value and tax basis of their assets as well as further legislative tax rate changes.
Currently, the principal source of our corporate entities’ temporary differences is the difference between our net book value of our property, plant and equipment versus our unclaimed tax pools and the recognition for accounting purposes of a mark-to-market deficiency on our risk management contracts.
29
Contractual Obligations and Commitments
We have contractual obligations and commitments entered into in the normal course of operations including purchase of assets and services, operating agreements, transportation commitments, sales commitments, royalty obligations, and land lease obligations. These obligations are of a recurring and consistent nature and impact cash flow in an ongoing manner. We also have contractual obligations and commitments that are of a less routine nature as disclosed in the following table:
| | | | | | | | | | | | | | | | |
| | Maturity | |
| | |
Annual Contractual Obligations(000s) | Total | | Less than 1 year | | 1-3 years | | 4-5 years | | After 5 years | |
| |
Long-term debt(2) | | $ | 1,465,823 | | $ | - | | $ | 1,199,773 | | $ | 266,050 | | $ | - | |
Interest on long-term debt(4) | | | 145,694 | | | 18,319 | | | 110,901 | | | 16,474 | | | - | |
Interest on Convertible Debentures(3) | | | 342,291 | | | 16,427 | | | 130,402 | | | 123,563 | | | 71,899 | |
Operating and premise leases | | | 21,925 | | | 1,861 | | | 12,745 | | | 7,071 | | | 248 | |
Purchase commitments(5) | | | 34,939 | | | 28,019 | | | 6,920 | | | - | | | - | |
Asset retirement obligations(6) | | | 1,029,168 | | | 17,856 | | | 17,350 | | | 27,437 | | | 966,525 | |
Transportation(7) | | | 5,803 | | | 749 | | | 3,818 | | | 1,189 | | | 47 | |
Pension contributions | | | 30,503 | | | 286 | | | 3,631 | | | 5,301 | | | 21,285 | |
Feedstock commitments | | | 859,853 | | | 859,853 | | | - | | | - | | | - | |
| | | | | | | | | | | | | | | | | |
Total | | $ | 3,935,999 | | $ | 943,370 | | $ | 1,485,540 | | $ | 447,085 | | $ | 1,060,004 | |
| | | | | | | | | | | | | | | | | |
| |
(1) | As at September 30, 2008, we had entered into physical and financial contracts for upstream production with average deliveries of approximately 6,075 bbl/d for the remainder of 2008. We have also entered into financial contracts for downstream production of refined products with average deliveries of approximately 34,000 bbl/d for the remainder of 2008 and 20,000 bbl/d for the first half of 2009. We have also entered into financial contracts to minimize our exposure to fluctuating electricity prices. Please see Note 14 to the consolidated financial statements for further details. |
| |
(2) | Assumes that the outstanding Convertible Debentures either convert at the holders’ option or are redeemed for Trust Units at our option. |
| |
(3) | Assumes no conversions and redemption by Harvest for Trust Units at the end of the second redemption period. Only cash commitments are presented. |
| |
(4) | Assumes constant foreign exchange rate. |
| |
(5) | Relates to drilling commitments, AFE commitments and downstream purchase commitments. |
| |
(6) | Represents the undiscounted obligation by period. |
| |
(7) | Relates to firm transportation commitment on the Nova pipeline. |
We have a number of operating leases for moveable field equipment, vehicles and office space and our commitments under those leases are noted in our annual contractual obligations table above. The leases require periodic lease payments and are recorded as either operating costs or G&A. We also finance our annual insurance premiums, whereby a portion of the annual premium is deferred and paid monthly over the balance of the term.
Related Party Transactions
During the three and nine month periods ended September 30, 2008, Vitol purchased $200.2 million and $272.6 million respectively (three and nine month periods ended September 30, 2007, $128.5 million and $259.7 million, respectively) of Iraqi crude oil pursuant to the terms and conditions of the Supply and Offtake Agreement from a company in which a director of Harvest holds a minority equity interest. As at September 30, 2008, $3.4 million related to these purchases is included in Harvest’s accounts payable and accrued liabilities. Additionally, $218.0 million is included in the total feedstock commitments disclosed at September 30, 2008. Subsequent to September 30, 2008, no further commitments have been incurred relating to crude oil purchases by Vitol from this private company.
CHANGE IN ACCOUNTING POLICIES
Effective January 1, 2008, we have adopted the requirements of the Canadian Institute of Chartered Accountants (“CICA”) Section 3862 Financial Instruments – Disclosures, Section 3863 Financial Instruments – Presentation, and Section 1535 Capital Disclosures. The additional disclosures required as a result of adopting these new standards can be found in the notes to our consolidated financial statements for the three and nine months ended September 30, 2008.
In June 2007, the CICA issued Section 3031 – Inventories, which replaces the existing standard for inventories. This new standard provides additional disclosure requirements for inventories, and requires that inventories be valued at the lower of cost and net realizable value. The standard is effective for Harvest beginning January 1, 2008. Application of this new standard did not have a material impact on our financial statements.
30
LIQUIDITY AND CAPITAL RESOURCES
During the first nine months of 2008, cash flow from operating activities was $472.1 million, including a $98.9 million reduction in respect of changes in non-cash working capital. The non-cash working capital requirement is primarily due to increases of $77.4 million and $51.9 million in accounts receivable and downstream inventories, respectively, offset by a $38.6 million increase in accounts payable. Cash flow from operating activities before changes in non-cash working capital and asset retirement expenditures totaled $577.8 million for the first nine months of 2008. We declared distributions of $410.7 million, incurred $220.2 million for capital expenditures and raised $106.5 million with our distribution re-investment plans resulting a net cash flow of $53.4 million excluding working capital adjustments. Our bank borrowings totaled $1,199.8 million at the end of the Third Quarter of 2008 as compared to $1,279.5 million at the end of 2007 essentially unchanged as the net proceeds from our issuance of $250 million of principal amount 7.5% Convertible Debentures on April 25, 2008 has been substantially offset by $127.6 million of net acquisition/disposition activity and the $98.9 million investment in non-cash working capital.
At the end of September 2008, we had $400.2 million of available borrowing capacity under our $1.6 billion Extendible Revolving Credit Facility as compared to $564.7 million at the beginning of the quarter. We continue to defer our request to extend the maturity date of our credit facility which currently has a maturity date of April 2010. With our cash flow risk management program, we enter pricing contracts and have limited our counterparties to the lenders in our syndicated credit facilities as the security provided in our credit agreement extends to these pricing contracts. This practice eliminates the potential requirement for margin calls and/or the pledging of collateral as well as limits the negotiation of events of default, all of which contribute to ensuring that these contracts improve our liquidity rather than exacerbate credit concerns.
Since December 31, 2007, the significant changes to our capital structure were:
| | |
| • | Issuance of $250 million principal amount of 7.50% Debentures due 2015 for aggregate cash consideration of $239.5 million, |
| | |
| • | Issuance of 4,976,758 trust units pursuant to Harvest’s Premium DistributionTM and Distribution Reinvestment and Optional Trust Unit Purchase Plan (the “DRIP Plans”) raising $106.5 million, and |
| | |
| • | Issuance of 1,177,957 trust units on the conversion of $24.4 million of principal amount of Convertible Debentures including 1,166,593 in respect of the maturing of $24.2 million of principal amount of 10.5% convertible Debentures due January 31, 2008. |
The following table summarizes our capital structure as at September 30, 2008 as well as at December 31, 2007:
| | | | | | | |
(in millions)
DEBT | | September 30, 2008 | | December 31, 2007 | |
| |
Three Year Extendible Revolving Credit Facility | | $ | 1,199.8 | | $ | 1,279.5 | |
| | | | | | | | |
| | | | | | | |
7 7/8% Senior Notes Due 2011 (US$250 million) | | | 266.1 | (1) | | 247.8 | (1) |
| | | | | | | | |
| | | | | | | |
Convertible Debentures, at principal amount | | | | | | | |
10.5% Debentures Due 2008 | | | - | | | 24.3 | |
9% Debentures Due 2009 | | | 0.9 | | | 1.0 | |
8% Debentures Due 2009 | | | 1.6 | | | 1.7 | |
6.5% Debentures Due 2010 | | | 37.1 | | | 37.1 | |
6.4% Debentures Due 2012 | | | 174.6 | | | 174.6 | |
7.25% Debentures Due 2013 | | | 379.3 | | | 379.3 | |
7.25% Debentures Due 2014 | | | 73.2 | | | 73.2 | |
7.50% Debentures Due 2015 | | | 250.0 | | | - | |
| | | | | | | | |
Total Convertible Debentures | | | 916.7 | | | 691.2 | |
| | | | | | | |
Total Debt | | | 2,382.6 | | | 2,218.5 | |
| | | | | | | | |
|
TRUST UNITS | | | | | | | |
154,507,676 issued at September 30, 2008 | | | 3,866.1 | | | | |
148,291,170 issued at December 31, 2007 | | | | | | 3,736.1 | |
| | | | | | | |
| | | | | | | | |
TOTAL OF DEBT AND TRUST UNITS | | $ | 6,248.7 | | $ | 5,954.6 | |
| | | | | | | | |
(1) Face value converted at the period end exchange rate.
31
A full description of terms and covenants our $1.6 billion Extendible Revolving Credit Agreement, 77/8% Senior Notes as well as our Convertible Debentures are contained in the notes to our audited consolidated financial statements for the year ended December 31, 2007 and the Liquidity and Capital Resources section of our MD&A for the year ended December 31, 2007 filed on SEDAR atwww.sedar.com.
The credit facility contains floating interest rates that are expected to range between 65 and 115 basis points over bankers’ acceptance rates (currently 70 bps) depending on the ratio of our secured senior debt (excludes 77/8% Senior Notes and convertible debentures) to earnings before interest, taxes, depletion, amortization and other non-cash amounts (“EBITDA”) with availability under this facility subject to:
| |
Secured senior debt to EBITDA | 3.0 to 1.0 or less |
Total Debt to EBITDA | 3.5 to 1.0 or less |
Secured senior debt to capitalization | 50% or less |
Total Debt to capitalization | 55% or less |
At September 30, 2008, our Bank Debt to annualized EBITDA was 1.5 to 1.0, Total Debt (excludes convertible debentures) to annualized EBITDA was 1.8 to 1.0, while the secured senior debt to Total Capitalization was 25% and Total Debt to Total Capitalization was 31%.
The 77/8% Senior Notes contain certain covenants which among other things restrict our secured indebtedness to an amount less than 65% of the present value of future net revenues from our proved petroleum and natural gas reserves discounted at an annual rate of 10%. At the end 2007, this covenant limited secured indebtedness to approximately $1.85 billion.
The most restrictive term of the Convertible Debentures limits the issuance of additional Convertible Debentures if the principal amount of all issued and outstanding Convertible Debentures immediately after the issuance exceed 25% of the total market capitalization, being an aggregate of the principal amount of all issued and outstanding Convertible Debentures plus an amount equal to the current market price of all of the issued and outstanding Trust Units. At September 30, 2008, these covenants would preclude the issuance of additional convertible debentures based on our then market capitalization.
Concurrent with the closing of the North Atlantic acquisition, we entered into a Supply and Offtake Agreement with Vitol Refining S.A. (“Vitol”), a third party related to the vendor of North Atlantic. The agreement provides for ownership of substantially all of the crude oil feedstock and refined product inventory at the refinery be retained by Vitol and granted Vitol the right and obligation to provide and deliver crude oil feedstock to the refinery as well as the right and obligation to purchase all refined products produced by the refinery. Effective January 2008, the sale of HSFO was removed from the Supply and Offtake Agreement and sold directly to a wholly-owned affiliate of one of the world’s largest integrated oil and natural gas producers. For a more complete description of this Supply and Offtake Agreement, see the description of the Supply and Offtake Agreement in our Annual Information Form for the year ended December 31, 2007 filed on SEDAR atwww.sedar.com. At the end of September 2008, we estimate that Vitol held inventories of VGO, crude oil feedstock (both delivered and in-transit) and refined products for resale valued at approximately $859.9 million which would have otherwise have been assets of Harvest. Effective April 19, 2008, both Harvest and Vitol Refining S.A. may terminate the Supply and Offtake Agreement by providing six month written notice.
32
Year-to-date in 2008, the trading value of our trust units ranged from a high of $26.00 in February to a low of $8.33 in October. This volatility in our trading value while reflecting weakness in refining margins has been significantly impacted by the global credit crunch, general slowing of worldwide economies, a financial de-leveraging of the equity markets and a roll back of commodity prices. At the end September 2008 approximately 70% of our Unitholders were non-residents of Canada which is up slightly from 66% at the end of 2007. The following summarizes the trading value of our trust units during 2008:
| | | | | | | | | | |
| | | | | | | | | | | |
| | | | | | | | | | |
| | Trading Price | | | | |
| | | | | | |
Month | | High | | Low | | Volume | |
| | | | | | | | |
TSX Trading | | | | | | | | | | |
January 2008 | | $ | 23.56 | | $ | 20.48 | | | 10,474,631 | |
February 2008 | | $ | 26.00 | | $ | 22.49 | | | 8,552,342 | |
March 2008 | | $ | 24.13 | | $ | 22.00 | | | 9,638,750 | |
April 2008 | | $ | 24.94 | | $ | 22.23 | | | 11,965,637 | |
May 2008 | | $ | 25.67 | | $ | 22.15 | | | 14,019,461 | |
June 2008 | | $ | 25.77 | | $ | 23.32 | | | 9,263,955 | |
July 2008 | | $ | 24.60 | | $ | 19.32 | | | 10,210,064 | |
August 2008 | | $ | 21.75 | | $ | 18.90 | | | 12,078,163 | |
September 2008 | | $ | 21.12 | | $ | 15.99 | | | 9,834,707 | |
October 2008 | | $ | 17.69 | | $ | 8.33 | | | 26,521,040 | |
November 1 – 7, 2008 | | $ | 13.27 | | $ | 11.47 | | | 3,135,049 | |
| | | | | | | | | | |
| | | | | | | | | | | |
NYSE Trading (in US$) | | | | | | | | | | |
| | | | | | | | | | | |
January 2008 | | $ | 23.24 | | $ | 20.00 | | | 18,167,009 | |
February 2008 | | $ | 25.70 | | $ | 22.51 | | | 15,108,961 | |
March 2008 | | $ | 24.49 | | $ | 21.44 | | | 17,099,323 | |
April 2008 | | $ | 24.82 | | $ | 22.06 | | | 20,845,245 | |
May 2008 | | $ | 26.08 | | $ | 21.75 | | | 24,871,749 | |
June 2008 | | $ | 25.28 | | $ | 23.05 | | | 16,892,369 | |
July 2008 | | $ | 24.30 | | $ | 18.80 | | | 23,625,243 | |
August 2008 | | $ | 20.55 | | $ | 17.73 | | | 17,597,112 | |
September 2008 | | $ | 20.01 | | $ | 15.17 | | | 24,126,064 | |
October 2008 | | $ | 16.69 | | $ | 7.00 | | | 65,647,621 | |
November 1 – 7, 2008 | | $ | 11.55 | | $ | 9.67 | | | 9,264,969 | |
| | | | | | | | | | |
On October 20, 2008, the Toronto Stock Exchange approved our Normal Course Issuer Bid to purchase for cancellation, subject to daily limits, up to 10% of the outstanding Trust Units and Convertible Debentures not held by insiders on the open market at the prevailing market prices at the time of such purchase. While we believe that, from time to time, the market prices for these securities may not reflect the underlying value, purchases by Harvest may increase the proportionate interest of all remaining security holders while providing increased liquidity to security holders wishing to sell their securities. To date, their have been no such purchases.
Through a combination of cash from operating activities, unused credit capacity and the working capital provided by the Supply and Offtake Agreement, it is anticipated that we will have adequate liquidity to fund future operations and forecasted capital expenditures although cash from operating activities used to fund ongoing operations may reduce the amount of future distributions paid to unitholders.
Harvest is an integrated energy trust with a declining asset base in our upstream operations and a “near perpetual” asset in our downstream operations. The future of our upstream operations relies on the successful exploitation of our existing reserves, future development activities and strategic acquisitions to replace existing production and add additional reserves, as well as future petroleum and natural gas prices. With a prudent maintenance program, our downstream assets are expected to have a long life with growth in profitability available by upgrading HSFO, enhancing our refining processes to handle a heavier more sour feedstock and/or expanding our refining capacity which is expected to benefit from the incremental economics of available with our existing infrastructure. Future development activities and modest acquisitions in our upstream business as well as the maintenance program in our downstream business will likely be funded by our cash generated from operating activities while we will generally rely on funding more significant acquisitions and growth initiatives from some combination of cash from operating activities, issuances of Trust Units and incremental debt. To the extent that we finance acquisitions and growth initiatives from cash from operating activities, the amount of our distributions to Unitholders may be reduced. Should capital markets or incremental debt not be available to us, our ability to make the necessary expenditures to maintain or expand our assets may be impaired and result in reductions to future distributions paid to Unitholders. In our upstream business, it is not possible to distinguish between expenditures to maintain productive capacity and spending to increase productive capacity due to the numerous factors impacting reserve reporting and the natural decline in reservoirs. Accordingly, maintenance capital is not disclosed separately.
33
Our distributions will generally exceed the net income reported in our financial statements as a result of significant non-cash charges recorded in our income statement. In the first nine months of 2008, we recorded a $379.8 million provision in respect of depreciation and depletion based primarily on our historic costs of property, plant and equipment that does not accurately represent the fair value or replacement cost of the assets, nor do they affect cash generated in the current period. This charge results in significant differences to net income with no impact on cash from operating activities. Accordingly, we anticipate that over time our net income may fluctuate significantly from our cash flow from operating activities as well as distributions to unitholders. During the first nine months of 2008, our distributions to unitholders exceeded our net income of $133.4 million by $277.3 million as compared to the prior year where our distributions to unitholders exceeded our net income of $87.9 million by $377.7 million. In instances where our distributions exceed our net earnings, a portion of the distribution may represent a return of capital rather than a distribution of earnings. For the first nine months of 2008, our distributions declared totaled $410.7 million, representing 87% of cash from operating activities.
Management, together with the Board of Directors of Harvest, continually assess the level of our monthly distributions in light of commodity price expectations, currency exchange rates, production and throughput projections, operating cost forecasts, debt leverage and spending plans. Since November 2007, we have declared a monthly distribution of $0.30 per Trust Unit through February 2009, a distribution level that reflects our expectations of future commodity prices and currency exchange rates as well as our future production and throughput volumes and operating costs.
Prior to January 1, 2011, the Trust is subject to tax on its taxable income less the portion that is paid or payable to the Unitholders at the end of each taxation year. For 2008, we anticipate that our distributions to Unitholders will be 100% taxable and that the Trust will have no taxable income. The following table summarizes the distributions declared, the proceeds from our distribution reinvestment programs as well as distributions as a percentage of cash from operating activities for the three and nine months ended September 30, 2008 and 2007:
| | | | | | | | | | | | | | | | | | | |
| | | | | |
| | Three Months Ended September 30 | | Nine Months Ended September 30 | |
| | | | | | |
(000s except per Trust Unit amounts) | 2008 | | 2007 | | Change | | 2008 | | 2007 | | Change | |
| | | | | | | | | | | | | | |
Distributions declared | | $ | 138,511 | | $ | 166,271 | | | (17 | %) | $ | 410,678 | | $ | 465,598 | | | (12 | %) |
Per Trust Unit | | $ | 0.90 | | $ | 1.14 | | | (21 | %) | $ | 2.70 | | $ | 3.42 | | | (21 | %) |
Distribution reinvestment proceeds | | $ | 35,153 | | $ | 47,670 | | | (26 | %) | $ | 106,515 | | $ | 135,414 | | | (21 | %) |
Distributions as a percentage of cash from operating activities | | | 104 | % | | 87 | % | | 17 | % | | 87 | % | | 84 | % | | 3 | % |
| | | | | | | | | | | | | | | | | | | | |
Throughout the first nine months of 2008, we declared monthly distributions of $0.30 per Trust Unit to Unitholders, compared to a $0.38 per Trust Unit distribution for the same period in 2007. For the three and nine months ended September 30, 2008, the total amount of distributions declared was $138.5 million and $410.7 million, respectively, which is 104% and 87%, respectively, of our cash from operating activities. The decrease in distributions declared of $27.8 million for the three months ended September 30, 2008 and $54.9 million for the nine months ended September 30, 2008 is primarily due to the decrease of $0.08 in the monthly distribution declared per Trust Unit, offset by an increase of approximately 8.1 million Trust Units outstanding.
34
OUTLOOK
For the full year of 2008, we forecast production volumes from our upstream operations to be at the low end of our guidance of 56,000 to 57,000 boe/d with operating costs expected to average $14.50 per boe with electric power and well servicing comprising approximately 50% of our costs. The price on approximately 65% of our expected Alberta electric power consumption is fixed at $56.69 per MWh through to the end of 2008. We continue to forecast our 2008 capital spending will total approximately $250 million in our upstream operations.
For our downstream operations, we expect that during the Fourth Quarter of 2008, our refinery throughput will average approximately 109,000 bbl/d and that our operating costs will continue to average approximately $2.00/bbl while we expect the cost of purchased energy to drop by approximately $5 million as compared to previous quarters, primarily due to anticipated weakness in the price of lower sulphur fuel oil consumed to provide heat to our refining processes. The completion of the visbreaker project early in the Fourth Quarter is expected to result in an improved yield of gasoline and distillate products, increase visbreaker unit throughput by approximately 2,000 bbl/d, and extend the visbreaker run-time between unit shutdowns for heater decoking. During 2008, we expect capital spending in our downstream operations will aggregate to $54 million.
During the Fourth Quarter of 2008, we expect a generally weaker commodity price environment will result in lower cash flow from our upstream operations and a significant reduction in the cash settlements from our price risk management program. As referred to the Cash Flow Risk Management section of this MD&A, we have contracts in place on 26,075 bbl/d of our WTI cash flow exposure for the Fourth Quarter 2008 which provide floors to our WTI price exposure at approximately US$53.85. With respect to our cash flow exposure related to refined product crack spreads, we have contracts in place for approximately 30% of our expected Fourth Quarter exposure. We also have currency exchange contracts on US$10.0 million per month through to December 2008 which caps our participation in Canadian dollar weakness beyond US$0.9479 per Cdn$1.00 which represents approximately 10% of our exposure to fluctuations in the US dollar to Canadian dollar exchange rate, prior to considering the offsetting exposure of our US dollar denominated 77/8% Senior Notes.
In July 2008, SNC Lavalin completed a preliminary evaluation of a broad range of refinery reconfigurations with the most economic case increasing throughput capacity to 190,000 bbl/d, comprised of a blend of heavy to medium gravity sour crude oil at a cost of approximately $2 billion in nominal 2008 dollars. SNC Lavalin’s evaluation has also confirmed some low risk/high return enhancement opportunities to (1) increase the Isomax throughput to 42,000 bbl/d from 37,000 bbl/d, (2) increase the capacity of the crude unit to 120,000 bbl/d from 115,000 bbl/d, (3) revamp the crude unit and vacuum tower to improve the VGO recovery, (4) improve process heater energy efficiency, and, (5) enhance crude oil storage and blending capability. While the enhancement opportunities may be financed from operating cash flow, we engaged a financial advisor to search for a partner to provide financing for the $2 billion reconfiguration project. While the $2 billion reconfiguration project remains viable, we have now elected to defer the project and partnering process in light of the current uncertainty in global capital markets and a volatile commodity pricing environment.
For 2009, we are forecasting that our upstream operations will produce between 52,000 and 53,000 boe/d with a capital budget of $260 million, excluding acquisitions and dispositions, and expect operating costs to be approximately $15.00 per boe. Our capital budget includes the drilling of approximately 125 wells focusing primarily on our assets in British Columbia and Saskatchewan, plus a continued emphasis on our enhanced oil recovery projects and infrastructure investment. Following on the success of our reservoir pressure maintenance program at Hay River BC this year, our 2009 plans for this area will focus on a significant drilling program with 59 wells. In southeast Saskatchewan, we plan to continue to build on our development of Tilston, Souris Valley and Bakken trends with an estimated 46 wells to be drilled. We expect our 2009 production profile to consist of approximately 55% light to medium oil, 20% heavy oil and 25% natural gas.
Our downstream average daily throughput is expected to be approximately 112,000 bbl/d in 2009 with anticipated operating costs ranging from $2.00 to $2.20 per barrel. The 2009 capital spending plan aggregates to $62 million including $20 million on enhancement opportunities/strategic projects.
35
For the first six months of 2009, we have contracts in place on 20,000 bbl/d of our WTI cash flow exposure which provide floors to our WTI price exposure at approximately US$61.94 as well as refined product crack spread protection on approximately 18% of our expected exposure. We do not have any currency exchange rate contracts or electric power price contracts beyond December 2008.
While we do not forecast commodity prices nor refining margins, the following table reflects the sensitivity of our 2009 operations to changes in the following key factors to our business:
| | | | | | | | | | |
| | Assumption | | Change | | Impact on Cash Flow | |
| | | | | | | | |
WTI oil price (US$/bbl) | | $ | 67.00 | | $ | 5.00 | | $ | 0.19 / Unit | |
CAD/USD exchange rate | | $ | 0.80 | | $ | 0.05 | | $ | 0.43 / Unit | |
AECO daily natural gas price | | $ | 8.00 | | $ | 1.00 | | $ | 0.18 / Unit | |
Refinery crack spread (US$/bbl) | | $ | 9.80 | | $ | 1.00 | | $ | 0.33 / Unit | |
Upstream operating expenses (per boe) | | $ | 15.00 | | $ | 1.00 | | $ | 0.12 / Unit | |
| | | | | | | | | | | |
Overall, we expect that based on current commodity price expectations, our 2009 cash from operating activities will be sufficient to fund our planned capital expenditures as well as maintain our present level of distributions. We expect that the participation level in our distribution re-investment programs will range between 20% and 25% with non-Canadian ownership of our trust units being approximately 65% to 70%.
We manage our exposure to fluctuations in interest rates by maintaining a mix of short and longer term financing with the short term financing typically carrying floating interest rates and longer term financing (our 77/8% Senior Notes and convertible debentures) carrying fixed rates of interest. Our short term financing consists of borrowings under our credit facilities and totals $1,199.8 million at September 30, 2008 which represents approximately 50% of our total debt. As a result, approximately 50% of our interest rate exposure is floating and 50% is fixed. Currently, our most significant exposure to increasing interest rates is through the re-pricing of credit if we extend (or renew) our credit facilities or enter into additional longer term financings. We have decided to defer extending the April 2010 maturity date on our $1.6 billion Extendible Revolving Credit Facility due the current condition of the global credit markets. With respect to further reducing our borrowings under our credit facility, we continue to monitor the high yield market as well as opportunities to issue additional trust units and convertible debentures.
Upon the maturing of our convertible debentures, we may elect to satisfy these obligation by issuing units rather than settling the obligations in cash with the maturity dates spread on the $916.7 million of principal amount of convertible debentures outstanding as follows: 2009 - $2.5 million; 2010 - $37.1 million; 2012 – $174.6 million; 2013 - $379.3 million; 2014 - $73.2 million and 2015 - $250 million. While not necessarily impacting 2008, we anticipate that as these convertible debentures mature, or are converted into trust units before their maturity date, we will be able to retire $916.7 million of principal amount of unsecured debt with equity issuances.
In our upstream business, we will continue to evaluate opportunities to acquire producing oil and/or natural gas properties as well as offer selected properties for divestment while striving to maintain or enhance our productive capability and improve our unit operating costs. In addition, we intend to be an active participant in the consolidation of the Canadian energy industry, including other royalty trusts.
As the changes to Canada’s Income Tax Act to apply a 31.5% tax on distributions from publicly traded mutual fund trusts, including Harvest, have now been enacted with an effective date of January 1, 2011, we continue to search and validate various capital structures, balancing the benefits of the remaining years of tax efficient distributions against the longer term benefits of continuing with a growth strategy beyond the announced “normal growth” limitations.
36
SUMMARY OF QUARTERLY RESULTS
The following table and discussion highlights our Third Quarter of 2008 relative to the preceding seven quarters:
| | | | | | | | | | | | | | | | | | | | | | | | | |
| | | | | | | | | | | | | | | | | | | | | | | | | | |
| | | | | 2008 | | | | | | | | 2007 | | | | | 2006 | |
| | | | | | | | | | | | | | | | | | | | |
(000s except where noted) | | Q3 | | Q2 | | Q1 | | Q4 | | Q3 | | Q2 | | Q1 | | Q4 | |
| | | | | | | | | | | | | | | | | | |
Revenue, net of royalties | | $ | 1,597,195 | | $ | 1,622,079 | | $ | 1,377,352 | | $ | 879,124 | | $ | 1,031,514 | | $ | 1,133,450 | | $ | 1,025,512 | | $ | 682,744 | |
| | | | | | | | | | | | | | | | | | | | | | | | | |
Net income (loss) | | $ | 295,788 | | $ | (162,063 | ) | $ | (346 | ) | $ | (113,585 | ) | $ | 11,811 | | $ | 6,248 | | $ | 69,850 | | $ | 1,533 | |
Per Trust Unit, basic1 | | $ | 1.93 | | $ | (1.07 | ) | $ | - | | $ | (0.77 | ) | $ | 0.08 | | $ | 0.05 | | $ | 0.55 | | $ | 0.01 | |
Per Trust Unit, diluted1 | | $ | 1.73 | | $ | (1.07 | ) | $ | - | | $ | (0.77 | ) | $ | 0.08 | | $ | 0.05 | | $ | 0.55 | | $ | 0.01 | |
| | | | | | | | | | | | | | | | | | | | | | | | | |
Cash from operating activities | | $ | 133,493 | | $ | 210,534 | | $ | 128,119 | | $ | 87,998 | | $ | 191,049 | | $ | 251,218 | | $ | 111,048 | | $ | 140,543 | |
Per Trust Unit, basic | | $ | 0.87 | | $ | 1.39 | | $ | 0.85 | | $ | 0.60 | | $ | 1.31 | | $ | 1.88 | | $ | 0.87 | | $ | 1.21 | |
Per Trust Unit, diluted | | $ | 0.84 | | $ | 0.83 | | $ | 0.83 | | $ | 0.60 | | $ | 1.22 | | $ | 1.67 | | $ | 0.84 | | $ | 1.16 | |
| | | | | | | | | | | | | | | | | | | | | | | | | |
Distributions per Unit, declared | | $ | 0.90 | | $ | 0.90 | | $ | 0.90 | | $ | 0.98 | | $ | 1.14 | | $ | 1.14 | | $ | 1.14 | | $ | 1.14 | |
| | | | | | | | | | | | | | | | | | | | | | | | | |
Total long term debt | | $ | 2,284,664 | | $ | 2,105,998 | | $ | 2,209,451 | | $ | 2,172,417 | | $ | 2,097,187 | | $ | 1,987,352 | | $ | 2,436,018 | | $ | 2,488,524 | |
Total assets | | $ | 5,659,227 | | $ | 5,637,879 | | $ | 5,574,528 | | $ | 5,451,683 | | $ | 5,585,651 | | $ | 5,613,333 | | $ | 5,800,346 | | $ | 5,745,558 | |
| |
(1) | The sum of the interim periods does not equal the total per year amount as there were large fluctuations in the weighted average number of Trust Units outstanding in each individual quarter. |
Net revenues are comprised of revenues net of royalties from our upstream operations as well as sales of refined products from our downstream operations. Accordingly, since the acquisition of the downstream operations in the Fourth Quarter of 2006, our revenues have increased substantially and then throughout 2007 have remained relatively stable until the Fourth Quarter of 2007 when the refinery throughput decreased due to a planned shutdown for more than half of the quarter. Throughout 2008, net revenues have been the highest in Harvest’s history due to strong commodity prices.
The growth in cash from operating activities is closely aligned with the trend in commodity prices for our upstream operations and reflects the cyclical nature of the downstream segment. In the Third Quarter of 2008, cash from operating activities has decreased from the previous quarter reflecting increased working capital requirements in our downstream business, a $2.60/bbl decrease in our upstream operating netback, which was partially offset by improved refining margins.
Net income reflects both cash and non-cash items. Changes in non-cash items, including future income tax, DDA&A expense, unrealized foreign exchange gains and losses, unrealized gains and losses on risk management contracts and Trust Unit right compensation expense cause net income to vary significantly from period to period. In the Second Quarter of 2007 Bill C-52 was substantively enacted, which imposed a new tax on distributions from publicly traded income trusts resulting in a large future income tax expense in the quarter. In the Fourth Quarter of 2007 Bill C-28 implemented reductions in the federal corporate income tax rates which will also apply to the tax on distributions from publicly traded mutual fund trusts, resulting in a significant future income tax recovery in the quarter. In the First Quarter of 2008, future income tax recovery of $21.8 million was recorded as a result of the excess depreciation expense recorded over the amount of tax pool claims to be made; an additional recovery of $95.2 million was recorded in the Second Quarter of 2008 and an expense of $149.5 million was recorded in the Third Quarter of 2008. Changes in the fair value of our risk management contracts have also contributed to the volatility in net income (loss) over the preceding eight quarters. For these reasons, our net income (loss) does not reflect the same trends as net revenues or cash from operating activities, nor is it expected to.
Total assets over the last eight quarters have remained relatively stable since our acquisition of North Atlantic in the Fourth Quarter of 2006. The stability reflects moderate acquisition activity offset by a reduction in net book value associated with depletion and depreciation charges. The changes in total long term financial liabilities is primarily due to the impact of our acquisitions, offset by the issuance of Trust Units and the net cash surplus of cash from operating activities over distributions to Unitholders.
37
CRITICAL ACCOUNTING ESTIMATES
There are a number of critical estimates underlying the accounting policies applied when preparing the consolidated financial statements due to timing differences between when certain activities are settled and when these activities are recognized for accounting purposes. Changes in these estimates could have a material impact on our reported results. These estimates are described in detail in our MD&A for the year ended December 31, 2007 as filed on SEDAR atwww.sedar.com. There have been no significant changes to any of our critical accounting estimates in our consolidated financial statements for the three and nine month periods ended September 30, 2008 from those described in our annual MD&A.
RECENT CANADIAN ACCOUNTING AND RELATED PRONOUNCEMENTS
Convergence of Canadian GAAP with International Financial Reporting Standards
In early 2008, Canada’s Accounting Standards Board (“AcSB”) announced that Canadian public reporting issuers will be required to report under International Financial Reporting Standards (“IFRS”) beginning January 1, 2011. The adoption of IFRS is intended to bring more transparency and a higher degree of global comparability as IFRS has been adopted in more than 100 countries. In preparation of this move to IFRS, Harvest has retained an advisor who has completed a diagnostic review identifying the areas of Harvest’s financial reporting likely to be most significantly affected by the transition. Harvest has also assigned staff to lead the conversion project with project sponsorship from the senior executive team and has assembled an IFRS steering committee consisting of senior personnel from various functional areas within the organization. During the Third Quarter of 2008, we have drafted our detailed project plan, and during the Fourth Quarter of 2008, the focus of the IFRS conversion project will be on finalization of our detailed project plan and the determination of Harvest accounting policies under IFRS using the diagnostic review that has been completed as a basis.
In February 2008, the CICA issued Section 3064, Goodwill and Intangible Assets, replacing Section 3062 Goodwill and Other Intangible Assets and Section 3450, Research and Development Costs. The new Section will be effective on January 1, 2009. Section 3062 establishes standards for the recognition, measurement, presentation and disclosure of goodwill and intangible assets subsequent to its initial recognition. Standards concerning goodwill are unchanged from the standards included in the previous Section 3062. We are currently evaluating the impact of the adoption of this new section, however do not expect a material impact on our Consolidated Financial Statements.
OPERATIONAL AND OTHER BUSINESS RISKS
Our financial and operating performance is subject to risks and uncertainties which include, but are not limited to: upstream operations, downstream operations, reserve estimates, commodity prices, ability to obtain financing, environmental, health and safety risk, regulatory risk, disruptions in the supply of crude oil and delivery of refined products, employee relations, and other risks specifically discussed previously in this MD&A. We intend to continue executing our business plan to create value for Unitholders by paying stable monthly distributions and increasing the net asset value per Trust Unit. All of our risk management activities are carried out under policies approved by the Board of Directors of Harvest Operations, and are intended to mitigate the risks noted above as follows:
The following summarizes the more significant risks of our upstream and downstream operations. See our Annual Information Form for a full description of these risks as well as risks associated with our royalty trust structure.
Operation of oil and natural gas properties:
| | |
| • | Applying a proactive management approach to our properties; |
| | |
| • | Selectively adding skilled and experienced employees and providing encouragement and opportunities to maintain and improve technical competence; and |
38
Operation of a refining and petroleum marketing business:
| | |
| • | Maintaining a proactive approach to managing the supply of feedstock and sale of refined products to ensure the continuity of supply of crude oil to the refinery and the delivery of refined products from the refinery; |
| | |
| • | Allocating sufficient resources to ensure good relations are maintained with our non-unionized and unionized work force; and |
Estimates of the quantity of recoverable reserves:
| | |
| • | Acquiring oil and natural gas properties that have high-quality reservoirs combined with mature, predictable and reliable production and thus reduce technical uncertainty; |
| | |
| • | Subjecting all property acquisitions to rigorous operational, geological, financial and environmental review; and |
| | |
| • | Pursuing a capital expenditure program to reduce production decline rates, improve operating efficiency and increase ultimate recovery of the resource-in-place. |
Commodity price exposures:
| | |
| • | Maintaining a risk-management policy and committee to continuously review effectiveness of existing actions, identify new or developing issues and devise and recommend to the Board of Directors of Harvest Operations action to be taken; |
| | |
| • | Executing risk management contracts with a portfolio of credit-worthy counterparties; |
| | |
| • | Maintaining an efficient cost structure to maximize product netbacks; and |
| | |
| • | Limiting the period of exposure to price fluctuations between crude oil prices and product prices by entering into contracts such that crude oil feedstock will be priced based on the price at or near the time of delivery to the refinery, which may be as much as 24 days subsequent to the time the feedstock is initially loaded onto the shipping vessel, thereby minimizing the time between the pricing of the feedstock and the refined products with the objective of maintaining margins. |
Financial risk:
| | |
| • | Monitoring financial markets to ensure the cost of debt and equity capital is kept as low as reasonably possible; |
| | |
| • | Retaining a portion of cash flows to finance capital expenditures and future property acquisitions; and |
| | |
| • | Carrying adequate insurance to cover property and business interruption losses. |
Environmental, health and safety risks:
| | |
| • | Adhering to our safety programs and keeping abreast of current industry practices for both the oil and natural gas industry as well as the refining industry; and |
| | |
| • | Committing funds on an ongoing basis toward the remediation of potential environmental issues. |
Changing government policy, including revisions to royalty legislation, income tax laws, and incentive programs related to the oil and natural gas industry:
| | |
| • | Retaining an experienced, diverse and actively involved Board of Directors to ensure good corporate governance; and |
| | |
| • | Engaging technical specialists when necessary to advise and assist with the implementation of policies and procedures to assist in dealing with the changing regulatory environment. |
CHANGES IN REGULATORY ENVIRONMENT
For a detailed discussion of the most recent changes to our regulatory environment, please refer to our MD&A for the year ended December 31, 2007 as filed on SEDAR atwww.sedar.com.
39
NON-GAAP MEASURES
Throughout this MD&A we have referred to certain measures of financial performance that are not specifically defined under Canadian GAAP. Cash G&A and Operating Netbacks are non-GAAP measures used extensively in the Canadian energy trust sector for comparative purposes. Cash G&A are G&A expenses excluding the effect of our unit based compensation plans, while Operating Netbacks are always reported on a per boe basis, and include gross revenue, royalties, operating expenses, and transportation and marketing expenses. Gross Margin is commonly used in the refining industry to reflect the net funds received from the sale of refined products after considering the cost to purchase the feedstock and is calculated by deducting purchased products for resale and processing from total revenue. Earnings From Operations is also commonly used in the petroleum and natural gas and refining industries to reflect operating results before items not directly related to operations.
ADDITIONAL INFORMATION
Further information about us, including our Annual Information Form, can be accessed under our public filings found on SEDAR atwww.sedar.com or atwww.harvestenergy.ca. Information can also be found by contacting our Investor Relations department at (403) 265-1178 or at 1-866-666-1178.
40