UNITED STATES
SECURITIES AND EXCHANGE COMMISSION
Washington, D.C. 20549
FORM N-CSR
CERTIFIED SHAREHOLDER REPORT OF REGISTERED MANAGEMENT INVESTMENT COMPANIES
Investment Company Act file number 811-21681
Guggenheim Enhanced Equity Income Fund
(Exact name of registrant as specified in charter)
227 West Monroe Street, Chicago, IL 60606
(Address of principal executive offices) (Zip code)
Amy J. Lee
227 West Monroe Street, Chicago, IL 60606
(Name and address of agent for service)
Registrant’s telephone number, including area code: (312) 827-0100
Date of fiscal year end: December 31
Date of reporting period: January 1, 2019 to December 31, 2019
Item 1. Reports to Stockholders.
The registrant’s annual report transmitted to shareholders pursuant to Rule 30e-1 under the Investment Company Act of 1940, as amended (the “Investment Company Act”), is as follows:
Section 19(a) NoticesGuggenheim Enhanced Equity Income Fund’s (the “Fund”) reported amounts and sources of distributions are estimates and are not being provided for tax reporting purposes. The actual amounts and sources for tax reporting purposes will depend upon the Fund’s investment experience during the year and may be subject to changes based on the tax regulations. The Fund will provide a Form 1099-DIV each calendar year that will explain the character of these dividends and distributions for federal income tax purposes.
| | | | | | | | | | |
| December 31, 2019 |
| | Total Cumulative Distribution | | % Breakdown of the Total Cumulative | |
| | For the Fiscal Year | | Distributions for the Fiscal Year | |
| | Net | Net | | | | Net | Net | | |
| | Realized | Realized | | | | Realized | Realized | | |
| Net | Short-Term | Long-Term
| | Total per | Net | Short-Term
| Long-Term | | Total per |
| Investment | Capital | Capital | Return of | Common | Investment | Capital | Capital | Return of | Common |
| Income | Gains | Gains | Capital | Share | Income | Gains | Gains | Capital | Share |
| $0.0000 | $0.0000 | $0.0000 | $0.9600 | $0.9600 | 0.00% | 0.00% | 0.00% | 100.00% | 100.00% |
If the Fund has distributed more than its income and net realized capital gains, a portion of the distribution may be a return of capital. A return of capital may occur, for example, when some or all of a shareholder’s investment in a Fund is returned to the shareholder. A return of capital distribution does not necessarily reflect a Fund’s investment performance and should not be confused with “yield” or “income.”
Section 19(a) notices for the Fund are available on the Fund’s website at guggenheiminvestments.com/gpm.
Section 19(b) Disclosure
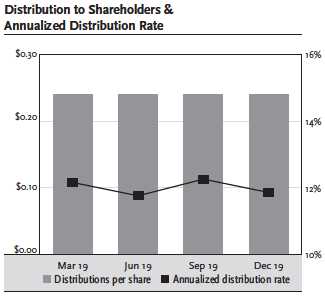
The Fund, acting pursuant to a Securities and Exchange Commission (“SEC”) exemptive order and with the approval of the Fund’s Board of Trustees (the “Board”), has adopted a plan, consistent with its investment objectives and policies to support a level distribution of income, capital gains and/or return of capital (the “Plan”). In accordance with the Plan, the Fund currently distributes a fixed amount per share, $0.2400, on a quarterly basis.
The fixed amounts distributed per share are subject to change at the discretion of the Fund’s Board. Under its Plan, the Fund will distribute all available investment income to its shareholders, consistent with its primary investment objectives and as required by the Internal Revenue Code of 1986, as amended (the “Code”). If sufficient investment income is not available on a quarterly basis, the Fund will distribute capital gains and/or return of capital to shareholders in order to maintain a level distribution. Each quarterly distribution to shareholders is expected to be at the fixed amount established by the Board, except for extraordinary distributions and potential distribution rate increases or decreases to enable the Fund to comply with the distribution requirements imposed by the Code.
Shareholders should not draw any conclusions about the Fund’s investment performance from the amount of these distributions or from the terms of the Plan. The Fund’s total return performance on net asset value is presented in its financial highlights table.
The Board may amend, suspend or terminate the Fund’s Plan without prior notice if it deems such actions to be in the best interests of the Fund or its shareholders. The suspension or termination of the Plan could have the effect of creating a trading discount (if the Fund’s stock is trading at or above net asset value) or widening an existing trading discount. The Fund is subject to risks that could have an adverse impact on its ability to maintain level distributions. Examples of potential risks include, but are not limited to, economic downturns impacting the markets, decreased market volatility, companies suspending or decreasing corporate dividend distributions and changes in the Code. Please refer to the Fund’s prospectus and its website, guggenheiminvestments.com/gpm for a more complete description of its risks.
GUGGENHEIMINVESTMENTS.COM/GPM
...YOUR LINK TO THE LATEST, MOST UP-TO-DATE INFORMATION ABOUT GUGGENHEIM ENHANCED EQUITY INCOME FUND
The shareholder report you are reading right now is just the beginning of the story.
Online at guggenheiminvestments.com/gpm, you will find:
| • | Daily, weekly and monthly data on share prices, distributions and more |
| • | Portfolio overviews and performance analyses |
| • | Announcements, press releases and special notices |
| • | Fund and adviser contact information |
Guggenheim Partners Investment Management, LLC and Guggenheim Funds Investment Advisors, LLC are constantly updating and expanding shareholder information services on the Fund’s website in an ongoing effort to provide you with the most current information about how your Fund’s assets are managed and the results of our efforts. It is just one more small way we are working to keep you better informed about your investment in the Fund.
| | |
| (Unaudited) | December 31, 2019 |
DEAR SHAREHOLDER:
We thank you for your investment in the Guggenheim Enhanced Equity Income Fund (“GPM” or the “Fund”). This report covers the Fund’s performance for the 12-month period ended December 31, 2019.
The Fund’s primary investment objective is to seek a high level of current income and gains with a secondary objective of long-term capital appreciation. Guggenheim Partners Investment Management LLC (“GPIM” or the “Sub-Adviser”) seeks to achieve the Fund’s investment objective by obtaining broadly diversified exposure to the equity markets and utilizing an option writing strategy developed by GPIM. The Fund may seek to obtain exposure to equity markets through investments in individual equity securities, through investments in exchange-traded funds (“ETFs”) or other investment funds that track equity market indices, and/or through derivative instruments that replicate the economic characteristics of exposure to equity securities or markets.
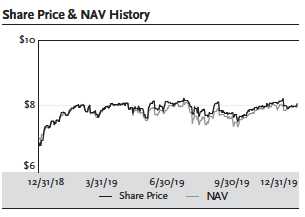
All Fund returns cited—whether based on net asset value (“NAV”) NAV or market price—assume the reinvestment of all distributions. For the 12-month period ended December 31, 2019, the Fund provided a total return based on market price of 34.15% and a total return net of fees based on NAV of 28.83%. As of December 31, 2019, the Fund’s closing market price of $8.06 per share represented a premium of 1.00% to its NAV of $7.98 per share.
Past performance is not a guarantee of future results. All NAV returns include the deduction of management fees, operating expenses, and all other Fund expenses. The market price of the Fund’s shares fluctuates from time to time, and may be higher or lower than the Fund’s NAV.
In each quarter of the period, the Fund paid a distribution of $0.24 per share. The most recent distribution represents an annualized distribution rate of 11.91% based on the Fund’s closing market price of $8.06 as of December 31, 2019. There is no guarantee of any future distribution or that the current returns and distribution rate will be maintained. The Fund’s distribution rate is not constant and the amount of distributions, when declared by the Fund’s Board of Trustees, is subject to change based on the performance of the Fund. Please see Note 2(d) on page 38 for more information on distributions for the period.
Guggenheim Funds Investment Advisors, LLC (“GFIA” or the “Adviser”) serves as the investment adviser to the Fund. GPIM serves as the Fund’s Sub-Adviser and is responsible for the management of the Fund’s portfolio of investments. Both the Adviser and the Sub-Adviser are affiliates of Guggenheim Partners, LLC (“Guggenheim”), a global diversified financial services firm.
We encourage shareholders to consider the opportunity to reinvest their distributions from the Fund through the Dividend Reinvestment Plan (“DRIP”), which is described in detail on page 55 of this report. When shares trade at a discount to NAV, the DRIP takes advantage of the discount by reinvesting the quarterly dividend distribution in common shares of the Fund purchased in the market at a price less than NAV. Conversely, when the market price of the Fund’s common shares is at a premium above NAV,
GPM l GUGGENHEIM ENHANCED EQUITY INCOME FUND ANNUAL REPORT l 5
| | |
| (Unaudited) continued | December 31, 2019 |
the DRIP reinvests participants’ dividends in newly-issued common shares at the greater of NAV per share or 95% of the market price per share. The DRIP provides a cost-effective means to accumulate additional shares and enjoy the potential benefits of compounding returns over time.
To learn more about the Fund’s performance and investment strategy for the 12 months ended December 31, 2019, we encourage you to read the Economic and Market Overview and the Questions & Answers sections of this report, which begin on page 7.
We appreciate your investment and look forward to serving your investment needs in the future. For the most up-to-date information on your investment, please visit the Fund’s website at guggenheiminvestments.com/gpm.
Sincerely,
Guggenheim Funds Investment Advisors, LLC
Guggenheim Enhanced Equity Income Fund
January 31, 2020
6 l GPM l GUGGENHEIM ENHANCED EQUITY INCOME FUND ANNUAL REPORT| | |
| ECONOMIC AND MARKET OVERVIEW (Unaudited) | December 31, 2019 |
Recent U.S. economic data demonstrates that the expansion is being helped by lower interest rates. New home sales have risen at a double-digit, year-over-year pace for four consecutive months since August, spurred by lower mortgage rates but also base effects. Manufacturing production rose in both November and December, corroborating the signal seen in improving manufacturing surveys. Monthly non-farm payroll gains averaged 184,000 jobs in the fourth quarter of 2019, above underlying labor force growth. Income gains and a positive wealth effect are also flowing through into retail sales, where “core” sales recovered in December 2019 after three months of declines.
The latest evidence suggests that the U.S. Federal Reserve’s (the “Fed”) easing efforts have given the U.S. economy the extra gas it needs to extend the cycle. Furthermore, the new year kicks off with some clarity on U.S.- China trade policy. The eleventh-hour Phase one U.S.- China trade agreement may give U.S. companies some comfort that they can expect tariffs on either side to remain where they are for now. This should help support U.S. manufacturing activity, especially if China steps up purchases of U.S. goods as promised.
Over the next several months, we expect the Fed will stay on hold as it watches incoming data to ensure that the current level of fed funds remains appropriate. Monetary policy acts on the economy with a timing lag, so the effects of the last rate cut in October 2019 might not be apparent until mid-2020. More economic data improvements may come as low rates flow through to consumers and to the credit markets.
While the Fed successfully pushed off a recession in 2019, 2020 arrives with several risks worth watching, including the U.S. presidential election, U.S.- Europe trade negotiations, the potential for a military conflict between the U.S. and Iran, and rising corporate and local government defaults in China.
The opinions and forecasts expressed may not actually come to pass. This information is subject to change at any time, based on market and other conditions, and should not be construed as a recommendation of any specific security or strategy.
GPM l GUGGENHEIM ENHANCED EQUITY INCOME FUND ANNUAL REPORT l 7
| | |
| QUESTIONS & ANSWERS (Unaudited) | December 31, 2019 |
The Guggenheim Enhanced Equity Income Fund (the “Fund” or “GPM”) is managed by a team of seasoned professionals at Guggenheim Partners Investment Management, LLC (“GPIM” or the “Sub-Adviser”). This team includes Farhan Sharaff, Assistant Chief Investment Officer, Equities; Jayson Flowers, Senior Managing Director and Head of Equity and Derivative Strategies; Qi Yan, Managing Director and Portfolio Manager; and Daniel Cheeseman, Director and Portfolio Manager. In the following interview, the investment team discusses the market environment and the Fund’s performance for the 12-month period ended December 31, 2019.
Please describe the Fund’s investment objective and explain how GPIM’s investment strategy seeks to achieve it.
The Fund’s primary investment objective is to seek a high level of current income and gains with a secondary objective of long-term capital appreciation. Under normal market conditions, the Fund invests at least 80% of its net assets, plus the amount of any borrowings for investment purposes, in equity securities. GPIM seeks to achieve the Fund’s investment objective by obtaining broadly diversified exposure to the equity markets and utilizing an option-writing strategy developed by GPIM (the “portable alpha model”). The Fund may seek to obtain exposure to equity markets through investments in individual equity securities, through investments in exchange-traded funds (“ETFs”) or other investment funds that track equity market indices, and/or through derivative instruments that replicate the economic characteristics of exposure to equity securities or markets.
The Fund utilizes leverage to seek to deliver excess returns from the portable alpha model while maintaining a risk profile similar to the large cap U.S. equity market, presenting the potential benefit of greater income and a focus on capital appreciation. Although the use of financial leverage by the Fund may create an opportunity for increased return for the Fund’s common shares, it may also result in additional risks and may magnify the effect of any losses. There can be no assurance that a leveraging strategy will be successful during any period during which it is employed.
Can you describe the options strategy in more detail?
The Fund has the ability to write call options on the ETFs or on indices that the ETFs may track, which will typically be at- or out-of-the-money. GPIM’s strategy typically targets one-month options, although options of any strike price or maturity may be used. The Fund may, but does not have to, write options on 100% of the equity holdings in its portfolio. The typical hedge ratio (i.e., the percentage of the Fund’s equity holdings on which options are written) for the Fund is 67%, which is designed to produce a portfolio that, inclusive of leverage, has a beta of one to broad market indices. The hedge ratio, however, may be adjusted depending on the investment team’s view of the market and GPIM’s macroeconomic views. Changing the hedge ratio will impact the beta (represents the systematic risk of a portfolio and measures its sensitivity to a benchmark) of the portfolio resulting in a portfolio that has either higher or lower risk-adjusted exposure to broad market equities.
GPIM may engage in selling call options on indices, which could include securities that are not specifically held by the Fund. An option on an index is considered covered if the Fund also holds shares
8 l GPM l GUGGENHEIM ENHANCED EQUITY INCOME FUND ANNUAL REPORT| | |
| QUESTIONS & ANSWERS (Unaudited) continued | December 31, 2019 |
of a passively managed ETF that fully replicates the respective index and has a value at least equal to the notional value of the option written.
The Fund may also write call options on securities, including ETFs, that are not held by the Fund, or on indices other than the indices tracked by the ETFs held by the Fund. As such transactions would involve uncovered option writing, they may be subject to more risks compared to the Fund’s covered call option strategies involving writing options on securities, including ETFs, held by the Fund or indices tracked by the ETFs held by the Fund. When the Fund writes uncovered call options, it will earmark or segregate cash or liquid securities in accordance with applicable guidance provided by the staff of the U.S. Securities and Exchange Commission (“SEC”).
The Fund seeks to achieve its primary investment objective of seeking a high level of current income through premiums received from selling options and dividends paid on securities owned by the Fund. Although the Fund will receive premiums from the options written, by writing a covered call option, the Fund forgoes any potential increase in value of the underlying securities above the strike price specified in an option contract through the expiration date of the option.
How are managed assets allocated?
The Fund seeks to have ~67% of total assets (~100% of net assets) invested in the 500 individual stocks comprising the S&P 500 in equal weights (i.e., the S&P 500 Equal Weight Index) and ~33% of total assets (~50% of net assets) invested in a basket of broad index ETFs (S&P 500, Russell 2000, and NASDAQ-100). The hedge ratio remains ~67%, with options primarily written on indices tracked by the ETFs in which the Fund invests.
The long equity exposure (100% of net assets) comes from an allocation to the stocks, equally weighted and rebalanced quarterly, in the S&P 500 Equal Weight Index (the “Equal Weight Index”). The exposure to the Equal Weight Index is expected to provide a higher level of beta than the capitalization weighted S&P 500 Index, as the Equal Weight Index has outperformed the market-capitalization weighted S&P 500 Index by an average of 1.8% annually since its introduction in 1990.
The other 50% of net assets is allocated in accordance with GPIM’s portable alpha model, which in this strategy currently consists of ETFs tracking the S&P 500, Russell 2000, and NASDAQ-100 Indices paired with options written for a notional amount of 100% of net assets against the S&P 500, Russell 2000, and NASDAQ-100 Indices. This portfolio will be actively rebalanced to maintain a constant net market exposure similar to the large cap U.S. equity market, which GPIM believes will allow the Fund to dynamically capture the volatility risk premium in both rising and falling equity markets.
How did the Fund perform for the 12-month period ended December 31, 2019?
All Fund returns cited—whether based on net asset value (“NAV”) or market price—assume the reinvestment of all distributions. For the 12-month period ended December 31, 2019, the Fund provided a total return based on market price of 34.15% and a total return net of fees based on NAV of 28.83%. As of December 31, 2019, the Fund’s closing market price of $8.06 per share represented a premium of
GPM l GUGGENHEIM ENHANCED EQUITY INCOME FUND ANNUAL REPORT l 9
| | |
| QUESTIONS & ANSWERS (Unaudited) continued | December 31, 2019 |
1.00% to its NAV of $7.98 per share. As of December 31, 2018, the Fund’s closing market price of $6.78 per share represented a discount of 3.0% to its NAV of $6.99 per share.
Past performance is not a guarantee of future results. All NAV returns include the deduction of management fees, operating expenses, and all other Fund expenses. The market price of the Fund’s shares fluctuates from time to time, and may be higher or lower than the Fund’s NAV.
What were the Fund’s distributions during the period?
In each quarter of the period, the Fund paid a distribution of $0.24 per share. The most recent distribution represents an annualized distribution rate of 11.91% based on the Fund’s closing market price of $8.06 as of December 31, 2019.
The Fund adopted a managed distribution policy effective with the June 30, 2017 distribution, under which the Fund will pay a quarterly distribution in a fixed amount until such amount is modified by the Fund’s Board of Trustees. If sufficient net investment income is not available, the distribution will be supplemented by capital gains and, to the extent necessary, return of capital. For the year ended December 31, 2019, 100% of the distributions were characterized as a return of capital. The Fund will provide a Form 1099-DIV each calendar year that will explain the character of these distributions for U.S. federal income tax purposes.
There is no guarantee of any future distribution or that the current returns and distribution rate will be maintained. The Fund’s distribution rate is not constant and the amount of distributions, when declared by the Fund’s Board of Trustees, is subject to change based on the performance of the Fund. Please see Note 2(d) on page 38 for more information on distributions for the period.
How did other markets perform in this environment for the 12-month period ended December 31, 2019?
| Index | Total Return |
Chicago Board Options Exchange Volatility Index (“VIX”) | -50.94% |
Dow Jones Industrial Average | 25.34% |
NASDAQ-100 Index | 39.46% |
Russell 2000 Index | 25.52% |
S&P 500 Equal Weight Index | 29.24% |
S&P 500 Index | 31.49% |
Discuss market volatility over the period.
A persistent trend in the 11-year bull market has been low volatility levels. 2019 was no exception, as most of the year the VIX traded below its long-term average. It was at its highest at the beginning of 2019, when equities and credit sectors had just finished a wild ride down to bear market territory amid a severe lack of liquidity. At the time, Guggenheim’s view was that market volatility would be on the rise. Through June 2019, volatility did not turn substantially higher despite negative headlines, but the level remained above the five-year average.
10 l GPM l GUGGENHEIM ENHANCED EQUITY INCOME FUND ANNUAL REPORT| | |
| QUESTIONS & ANSWERS (Unaudited) continued | December 31, 2019 |
Volatility jumped most in early August 2019, when U.S.- China trade relations were fraying and the 2-year/10-year Treasury yield curve inverted, often seen as a recession indicator. The VIX rise was not matched proportionately by the decline in the S&P 500, which many market watchers interpreted as a bullish signal—indeed the S&P 500 rallied another 10% from the end of August 2019, while the VIX fell to its lows of the year. With the VIX averaging about 16 for the year, concern grew that investors were becoming more complacent about downside market risks. Still, it appears the Fed has successfully staved off recession and extended the expansion. Weakness in manufacturing data has bottomed out, the consumer is in good shape, and the labor market remains extraordinarily resilient. The recovery in the U.S. is also helping to drive a pickup in global economic activity.
The rally over the past year, GPIM believes, has been driven almost exclusively by the expansion in the market’s P/E multiple, which in turn, has raised concern that valuation levels are looking a bit elevated relative to underlying earnings growth. After very little earnings growth during 2019, earnings will need to become the key driver of forward returns.
Despite the strong gains over the course of last year, GPIM continues to believe the bull market remains intact and further upside is likely in the year ahead. While a repeat of the strong 2019 performance is not likely, the macro environment should remain supportive of moderate gains.
What most influenced the Fund’s performance?
For the period, the return on the underlying portfolio holdings contributed most to performance. The Fund was helped from the allocation to ETFs that track the S&P 500 as well as other indices, with the NASDAQ-100 Index notably outperforming the S&P 500. The Fund’s long equity exposure is tied to the S&P 500 Equal Weight Index, which underperformed the cap-weighted S&P 500 Index.
The Fund’s derivative use, consisting mostly of options sold to generate income and gains, also contributed to return, even as the implied-realized volatility spread that the Fund attempts to capture was tight over much of the period. In between spells of heightened volatility in early January and August of 2019, the VIX traded near historic lows, with realized volatility even lower, as the S&P 500 continued its upward climb.
The Fund typically does better in a sustained volatility environment, whether at a low or a high level, rather than in a sharp market move, such as that in the fourth quarter of 2018.
Can you discuss the Fund’s approach to leverage?
Leverage was a contributor to return during the period, as the Fund’s total return was above that of the cost of leverage. There is no guarantee that the Fund’s leverage strategy will be successful, and the Fund’s use of leverage may cause the Fund’s NAV and market price of common shares to be more volatile. Please see Note 7 on page 43 for more information on the Fund’s credit facility agreement.
Our approach to leverage is dynamic, and we tend to have a higher level of leverage when we are more constructive on equity market returns in accordance with our macroeconomic outlook and when we believe volatility is most attractive. Leverage at the end of the period was about 31% of the Fund’s total managed assets.
GPM l GUGGENHEIM ENHANCED EQUITY INCOME FUND ANNUAL REPORT l 11
| | |
| QUESTIONS & ANSWERS (Unaudited) continued | December 31, 2019 |
The Fed is expected to keep monetary policy stable over the course of the year, inflationary pressure is likely to remain muted, the rate of unemployment should remain near multi-decade lows, and modest gains in productivity should continue to bolster wages. The combination of low unemployment, rising wages and low interest rates should be supportive of consumption—the main driver of U.S. economic growth.
Index Definitions
Indices are unmanaged, reflect no expenses and it is not possible to invest directly in an index.
CBOE (Chicago Board Options Exchange) Volatility Index, often referred to as the VIX (its ticker symbol), the fear index or the fear gauge, is a measure of the implied volatility of S&P 500 Index options. It represents a measure of the market’s expectation of stock market volatility over the next 30-day period. Quoted in percentage points, the VIX represents the expected daily movement in the S&P 500 Index over the next 30-day period, which is then annualized.
Dow Jones Industrial Average® is a price-weighted average of 30 significant stocks traded on the New York Stock Exchange and the Nasdaq.
NASDAQ-100® Index includes 100 of the largest domestic and international non-financial securities listed on the Nasdaq Stock Market based on market capitalization. The Index reflects companies across major industry groups including computer hardware and software, telecommunications, retail/wholesale trade and biotechnology. It does not contain securities of financial companies including investment companies.
Russell 2000® Index measures the performance of the small-cap segment of the U.S. equity universe.
S&P 500® Equal Weight Index has the same constituents as the S&P 500, but each company is assigned a fixed equal weight.
S&P 500® is an unmanaged, capitalization-weighted index of 500 stocks. The index is designed to measure performance of the broad domestic economy through changes in the aggregate market value of 500 stocks representing all major industries.
Risks and Other Considerations
Investing involves risk, including the possible loss of principal and fluctuation of value. Stock markets can be volatile. Investments in securities of small and medium capitalization companies may involve greater risk of loss and more abrupt fluctuations in market price than investments in larger companies. There are risks associated with options. As the writer of a covered call option, the Fund forgoes, during the option’s life, the opportunity to profit from increases in the market value of the security covering the call option above the sum of the premium and the strike price of the call but has retained the risk of loss should the price of the underlying security decline. A writer of a put option is exposed to the risk of loss if fair value of the underlying securities declines, but profits only to the extent of the premium received if the underlying security increases in value. The writer of an option has no control over the time when it may be required to fill its obligation as writer of the option. Once an option writer has received an
12 l GPM l GUGGENHEIM ENHANCED EQUITY INCOME FUND ANNUAL REPORT| | |
| QUESTIONS & ANSWERS (Unaudited) continued | December 31, 2019 |
exercise notice, it cannot effect a closing purchase transaction in order to terminate its obligation under the option and must deliver the underlying security at the exercise price. The Fund’s use of leverage involves risk. Although the use of financial leverage by the Fund may create an opportunity for increased return for the common shares, it also results in additional risks and can magnify the effect of any losses. There can be no assurance that a leveraging strategy will be successful during any period during which it is employed.
The views expressed in this report reflect those of the portfolio managers only through the report period as stated on the cover. These views are expressed for informational purposes only and are subject to change at any time, based on market and other conditions, and may not come to pass. These views may differ from views of other investment professionals at Guggenheim and should not be construed as research, investment advice or a recommendation of any kind regarding the Fund or any issuer or security, do not constitute a solicitation to buy or sell any security and should not be considered specific legal, investment or tax advice. The information provided does not take into account the specific objectives, financial situation or particular needs of any specific investor.
The views expressed in this report may also include forward looking statements that involve risk and uncertainty, and there is no guarantee that any predictions will come to pass. Actual results or events may differ materially from those projected, estimated, assumed or anticipated in any such forward-looking statements. Important factors that could result in such differences, in addition to the other factors noted with such forward-looking statements, include general economic conditions such as inflation, recession and interest rates.
There can be no assurance that the Fund will achieve its investment objectives or that any investment strategies or techniques discussed herein will be effective. The value of the Fund will fluctuate with the value of the underlying securities. Historically, closed-end funds often trade at a discount to their net asset value. Performance data quoted represents past performance, which is no guarantee of future results and current performance may be lower or higher than the figures shown.
Please see guggenheiminvestments.com/gpm for a detailed discussion about Fund risks and considerations.
This material is not intended as a recommendation or as investment advice of any kind, including in connection with rollovers, transfers, and distributions. Such material is not provided in a fiduciary capacity, may not be relied upon for or in connection with the making of investment decisions, and does not constitute a solicitation of an offer to buy or sell securities. All content has been provided for informational or educational purposes only and is not intended to be and should not be construed as legal or tax advice and/or a legal opinion. Always consult a financial, tax and/or legal professional regarding your specific situation.
GPM l GUGGENHEIM ENHANCED EQUITY INCOME FUND ANNUAL REPORT l 13
| | |
| FUND SUMMARY (Unaudited) | December 31, 2019 |
| | |
| Fund Statistics | |
Share Price | $8.06 |
Net Asset Value | $7.98 |
Premium to NAV | 1.00% |
Net Assets ($000) | $385,659 |
| | | | | |
AVERAGE ANNUAL TOTAL RETURNS1 | | | | |
| FOR THE PERIODS ENDED DECEMBER 31, 2019 | | | |
| One | Three | Five | Ten |
| Year | Year | Year | Year |
Guggenheim Enhanced | | | | |
Equity Income Fund | | | | |
| NAV | 28.83% | 10.55% | 8.98% | 9.67% |
| Market | 34.15% | 12.67% | 11.07% | 11.36% |
Performance data quoted represents past performance, which is no guarantee of future results and current performance may be lower or higher than the figures shown. All NAV returns include the deduction of management fees, operating expenses and all other Fund expenses. The deduction of taxes that a shareholder would pay on Fund distributions or the redemption of Fund shares is not reflected in the total returns. For the most recent month-end performance figures, please visit guggenheiminvestments.com/gpm. The investment return and principal value of an investment will fluctuate with changes in market conditions and other factors so that an investor’s shares, when sold, may be worth more or less than their original cost.
| |
1 Performance prior to June 22, 2010, under the name Old Mutual/Claymore Long-Short Fund was achieved through an investment strategy of a long-short strategy and an opportunistic covered call writing strategy by the previous investment sub-adviser, Analytic Investors, LLC, and factors in the Fund’s fees and expenses. |
| | |
| Portfolio Breakdown | % of Net Assets |
Common Stocks | |
| Consumer, Non-cyclical | 20.8% |
| Financial | 19.0% |
| Consumer, Cyclical | 13.9% |
| Industrial | 13.0% |
| Technology | 10.5% |
| Communications | 6.1% |
| Energy | 5.7% |
| Other | 9.4% |
Exchange-Traded Funds | 45.2% |
Money Market Fund | 2.6% |
| Total Investments | 146.2% |
Options Written | -1.2% |
Other Assets & Liabilities, net | -45.0% |
| Net Assets | 100.0% |
14 l GPM l GUGGENHEIM ENHANCED EQUITY INCOME FUND ANNUAL REPORT| | |
| FUND SUMMARY (Unaudited) concluded | December 31, 2019 |
Portfolio breakdown is subject to change daily. For more information, please visit guggenheiminvestments.com/gpm. The above summaries are provided for informational purposes only and should not be viewed as recommendations. Past performance does not guarantee future results. All or a portion of the above distributions may be characterized as a return of capital. For the year ended December 31, 2019, 100% of the distributions were characterized as return of capital.
GPM l GUGGENHEIM ENHANCED EQUITY INCOME FUND ANNUAL REPORT l 15
| | | |
| SCHEDULE OF INVESTMENTS | | December 31, 2019 |
|
|
|
| Shares | Value |
|
COMMON STOCKS† – 98.4% | | |
| Consumer, Non-cyclical – 20.8% | | |
Conagra Brands, Inc.1 | 26,267 | $ 899,382 |
Corteva, Inc. | 28,141 | 831,848 |
Centene Corp.*,1 | 12,917 | 812,092 |
Eli Lilly & Co.1 | 6,134 | 806,192 |
Cigna Corp.1 | 3,926 | 802,828 |
IQVIA Holdings, Inc.* | 5,146 | 795,108 |
Zoetis, Inc. | 5,990 | 792,776 |
Anthem, Inc.1 | 2,624 | 792,527 |
Molson Coors Beverage Co. — Class B | 14,671 | 790,767 |
Brown-Forman Corp. — Class B1 | 11,675 | 789,230 |
WellCare Health Plans, Inc.* | 2,385 | 787,551 |
Mylan N.V.*,1 | 38,948 | 782,855 |
Align Technology, Inc.*,1 | 2,802 | 781,870 |
Teleflex, Inc. | 2,071 | 779,607 |
Kellogg Co.1 | 11,252 | 778,188 |
Constellation Brands, Inc. — Class A1 | 4,094 | 776,836 |
General Mills, Inc.1 | 14,447 | 773,781 |
Humana, Inc.1 | 2,111 | 773,724 |
Tyson Foods, Inc. — Class A | 8,474 | 771,473 |
Stryker Corp. | 3,674 | 771,320 |
HCA Healthcare, Inc.1 | 5,218 | 771,272 |
Mondelez International, Inc. — Class A | 14,002 | 771,230 |
Danaher Corp.1 | 5,019 | 770,316 |
IDEXX Laboratories, Inc.*,1 | 2,948 | 769,811 |
Campbell Soup Co.1 | 15,576 | 769,766 |
Kroger Co.1 | 26,538 | 769,337 |
DaVita, Inc.*,1 | 10,253 | 769,282 |
Johnson & Johnson1 | 5,273 | 769,172 |
UnitedHealth Group, Inc. | 2,611 | 767,582 |
Cintas Corp.1 | 2,847 | 766,071 |
JM Smucker Co. | 7,344 | 764,731 |
Archer-Daniels-Midland Co.1 | 16,493 | 764,451 |
United Rentals, Inc.* | 4,581 | 763,973 |
Robert Half International, Inc. | 12,094 | 763,736 |
Sysco Corp. | 8,924 | 763,359 |
Lamb Weston Holdings, Inc. | 8,864 | 762,570 |
Pfizer, Inc. | 19,448 | 761,973 |
Illumina, Inc.*,1 | 2,296 | 761,675 |
Monster Beverage Corp.* | 11,983 | 761,520 |
Global Payments, Inc.1 | 4,166 | 760,545 |
Intuitive Surgical, Inc.*,1 | 1,286 | 760,219 |
Merck & Company, Inc. | 8,358 | 760,160 |
See notes to financial statements.
16 l GPM l GUGGENHEIM ENHANCED EQUITY INCOME FUND ANNUAL REPORT| | | |
| SCHEDULE OF INVESTMENTS continued | | December 31, 2019 |
|
|
|
| Shares | Value |
|
COMMON STOCKS† – 98.4% (continued) | | |
| Consumer, Non-cyclical – 20.8% (continued) | | |
Amgen, Inc.1 | 3,149 | $ 759,129 |
Nielsen Holdings plc1 | 37,367 | 758,550 |
Coca-Cola Co.1 | 13,698 | 758,184 |
Kraft Heinz Co.1 | 23,590 | 757,947 |
Estee Lauder Companies, Inc. — Class A1 | 3,668 | 757,589 |
Laboratory Corporation of America Holdings*,1 | 4,475 | 757,036 |
Coty, Inc. — Class A1 | 67,280 | 756,900 |
Quest Diagnostics, Inc. | 7,086 | 756,714 |
Allergan plc1 | 3,958 | 756,651 |
MarketAxess Holdings, Inc. | 1,994 | 755,945 |
Cooper Companies, Inc.1 | 2,352 | 755,674 |
Thermo Fisher Scientific, Inc. | 2,326 | 755,648 |
Automatic Data Processing, Inc.1 | 4,430 | 755,315 |
McCormick & Company, Inc.1 | 4,450 | 755,298 |
Clorox Co.1 | 4,914 | 754,496 |
Becton Dickinson and Co.1 | 2,774 | 754,445 |
Kimberly-Clark Corp.1 | 5,484 | 754,324 |
Zimmer Biomet Holdings, Inc.1 | 5,034 | 753,489 |
Equifax, Inc.1 | 5,375 | 753,145 |
IHS Markit Ltd.* | 9,993 | 752,973 |
Moody’s Corp. | 3,171 | 752,827 |
CVS Health Corp.1 | 10,130 | 752,558 |
ResMed, Inc. | 4,852 | 751,915 |
AbbVie, Inc.1 | 8,487 | 751,439 |
S&P Global, Inc. | 2,749 | 750,615 |
Avery Dennison Corp.1 | 5,735 | 750,253 |
Rollins, Inc. | 22,624 | 750,212 |
Abbott Laboratories1 | 8,633 | 749,862 |
Bristol-Myers Squibb Co.1 | 11,681 | 749,803 |
Church & Dwight Company, Inc.1 | 10,651 | 749,191 |
Philip Morris International, Inc. | 8,804 | 749,132 |
PayPal Holdings, Inc.* | 6,925 | 749,077 |
Hormel Foods Corp.1 | 16,603 | 748,961 |
Dentsply Sirona, Inc.1 | 13,222 | 748,233 |
Varian Medical Systems, Inc.* | 5,267 | 747,967 |
STERIS plc | 4,907 | 747,925 |
Boston Scientific Corp.*,1 | 16,533 | 747,622 |
Edwards Lifesciences Corp.*,1 | 3,204 | 747,461 |
Colgate-Palmolive Co.1 | 10,852 | 747,051 |
AmerisourceBergen Corp. — Class A1 | 8,786 | 746,986 |
Verisk Analytics, Inc. — Class A | 4,997 | 746,252 |
Vertex Pharmaceuticals, Inc.* | 3,404 | 745,306 |
See notes to financial statements.
GPM l GUGGENHEIM ENHANCED EQUITY INCOME FUND ANNUAL REPORT l 17
| | | |
| SCHEDULE OF INVESTMENTS continued | | December 31, 2019 |
|
|
|
| Shares | Value |
|
COMMON STOCKS† – 98.4% (continued) | | |
| Consumer, Non-cyclical – 20.8% (continued) | | |
H&R Block, Inc.1 | 31,735 | $ 745,138 |
Biogen, Inc.*,1 | 2,511 | 745,089 |
Medtronic plc1 | 6,567 | 745,026 |
Hershey Co.1 | 5,066 | 744,601 |
Regeneron Pharmaceuticals, Inc.* | 1,980 | 743,450 |
Baxter International, Inc.1 | 8,879 | 742,462 |
Procter & Gamble Co.1 | 5,941 | 742,031 |
Altria Group, Inc.1 | 14,861 | 741,712 |
Universal Health Services, Inc. — Class B | 5,165 | 740,971 |
Quanta Services, Inc. | 18,155 | 739,090 |
PepsiCo, Inc. | 5,404 | 738,565 |
Gilead Sciences, Inc.1 | 11,334 | 736,483 |
McKesson Corp. | 5,302 | 733,373 |
Hologic, Inc.*,1 | 14,025 | 732,245 |
Alexion Pharmaceuticals, Inc.*,1 | 6,751 | 730,121 |
Gartner, Inc.*,1 | 4,728 | 728,585 |
Henry Schein, Inc.* | 10,884 | 726,181 |
Perrigo Company plc1 | 13,823 | 714,096 |
Incyte Corp.*,1 | 8,146 | 711,309 |
FleetCor Technologies, Inc.*,1 | 2,446 | 703,763 |
Cardinal Health, Inc.1 | 13,892 | 702,657 |
ABIOMED, Inc.*,1 | 4,099 | 699,248 |
| Total Consumer, Non-cyclical | | 80,419,002 |
| Financial – 19.0% | | |
American Tower Corp. — Class A REIT1 | 3,508 | 806,209 |
Crown Castle International Corp. REIT1 | 5,619 | 798,741 |
Healthpeak Properties, Inc. REIT1 | 23,115 | 796,774 |
Equinix, Inc. REIT1 | 1,351 | 788,579 |
Digital Realty Trust, Inc. REIT1 | 6,556 | 785,015 |
CBRE Group, Inc. — Class A*,1 | 12,795 | 784,205 |
Citigroup, Inc.1 | 9,758 | 779,567 |
Ventas, Inc. REIT | 13,432 | 775,564 |
Welltower, Inc. REIT1 | 9,476 | 774,947 |
Cboe Global Markets, Inc.1 | 6,454 | 774,480 |
Loews Corp.1 | 14,730 | 773,178 |
Public Storage REIT | 3,629 | 772,832 |
SL Green Realty Corp. REIT | 8,404 | 772,160 |
Regency Centers Corp. REIT | 12,239 | 772,159 |
Host Hotels & Resorts, Inc. REIT1 | 41,530 | 770,381 |
Alexandria Real Estate Equities, Inc. REIT1 | 4,764 | 769,767 |
Extra Space Storage, Inc. REIT1 | 7,288 | 769,759 |
See notes to financial statements.
18 l GPM l GUGGENHEIM ENHANCED EQUITY INCOME FUND ANNUAL REPORT| | | |
| SCHEDULE OF INVESTMENTS continued | | December 31, 2019 |
|
|
|
| Shares | Value |
|
COMMON STOCKS† – 98.4% (continued) | | |
| Financial – 19.0% (continued) | | |
Simon Property Group, Inc. REIT | 5,164 | $ 769,229 |
Allstate Corp.1 | 6,796 | 764,210 |
Nasdaq, Inc. | 7,135 | 764,159 |
SBA Communications Corp. REIT | 3,166 | 762,974 |
Bank of America Corp.1 | 21,645 | 762,337 |
First Republic Bank | 6,489 | 762,133 |
Goldman Sachs Group, Inc.1 | 3,313 | 761,758 |
Boston Properties, Inc. REIT1 | 5,518 | 760,711 |
Invesco Ltd.1 | 42,307 | 760,680 |
Kimco Realty Corp. REIT1 | 36,704 | 760,140 |
Alliance Data Systems Corp.1 | 6,774 | 760,043 |
JPMorgan Chase & Co.1 | 5,449 | 759,591 |
Weyerhaeuser Co. REIT | 25,150 | 759,530 |
Vornado Realty Trust REIT | 11,421 | 759,496 |
Morgan Stanley | 14,838 | 758,519 |
Realty Income Corp. REIT1 | 10,282 | 757,064 |
Zions Bancorp North America1 | 14,574 | 756,682 |
Visa, Inc. — Class A | 4,027 | 756,673 |
People’s United Financial, Inc. | 44,772 | 756,647 |
Duke Realty Corp. REIT | 21,791 | 755,494 |
Principal Financial Group, Inc. | 13,731 | 755,205 |
Citizens Financial Group, Inc. | 18,581 | 754,574 |
MetLife, Inc. | 14,797 | 754,203 |
Mid-America Apartment Communities, Inc. REIT | 5,712 | 753,184 |
Aon plc1 | 3,616 | 753,177 |
Apartment Investment & Management Co. — Class A REIT1 | 14,574 | 752,747 |
Willis Towers Watson plc1 | 3,727 | 752,630 |
UDR, Inc. REIT | 16,115 | 752,570 |
Travelers Companies, Inc. | 5,495 | 752,540 |
KeyCorp1 | 37,162 | 752,159 |
Iron Mountain, Inc. REIT1 | 23,598 | 752,068 |
Mastercard, Inc. — Class A | 2,518 | 751,850 |
Arthur J Gallagher & Co.1 | 7,893 | 751,650 |
BlackRock, Inc. — Class A1 | 1,495 | 751,537 |
Marsh & McLennan Companies, Inc.1 | 6,744 | 751,349 |
Everest Re Group Ltd. | 2,714 | 751,344 |
Federal Realty Investment Trust REIT1 | 5,834 | 751,011 |
Assurant, Inc.1 | 5,728 | 750,826 |
Intercontinental Exchange, Inc.1 | 8,111 | 750,673 |
SVB Financial Group* | 2,990 | 750,610 |
Prologis, Inc. REIT | 8,420 | 750,559 |
Chubb Ltd.1 | 4,821 | 750,437 |
See notes to financial statements.
GPM l GUGGENHEIM ENHANCED EQUITY INCOME FUND ANNUAL REPORT l 19
| | | |
| SCHEDULE OF INVESTMENTS continued | | December 31, 2019 |
|
|
|
| Shares | Value |
|
COMMON STOCKS† – 98.4% (continued) | | |
| Financial – 19.0% (continued) | | |
PNC Financial Services Group, Inc. | 4,699 | $ 750,101 |
Truist Financial Corp. | 13,307 | 749,450 |
Berkshire Hathaway, Inc. — Class B*,1 | 3,308 | 749,262 |
AvalonBay Communities, Inc. REIT1 | 3,573 | 749,258 |
E*TRADE Financial Corp. | 16,511 | 749,104 |
Progressive Corp. | 10,329 | 747,716 |
Bank of New York Mellon Corp.1 | 14,844 | 747,098 |
Essex Property Trust, Inc. REIT1 | 2,481 | 746,434 |
Wells Fargo & Co. | 13,859 | 745,614 |
State Street Corp. | 9,421 | 745,201 |
Franklin Resources, Inc.1 | 28,683 | 745,184 |
Regions Financial Corp. | 43,416 | 745,019 |
Equity Residential REIT1 | 9,202 | 744,626 |
American Express Co.1 | 5,977 | 744,077 |
M&T Bank Corp.1 | 4,383 | 744,014 |
Comerica, Inc.1 | 10,364 | 743,617 |
Cincinnati Financial Corp.1 | 7,069 | 743,305 |
Globe Life, Inc. | 7,058 | 742,855 |
Prudential Financial, Inc. | 7,919 | 742,327 |
Hartford Financial Services Group, Inc.1 | 12,207 | 741,819 |
Aflac, Inc.1 | 14,020 | 741,658 |
Ameriprise Financial, Inc.1 | 4,452 | 741,614 |
American International Group, Inc.1 | 14,447 | 741,565 |
WR Berkley Corp. | 10,717 | 740,545 |
Fifth Third Bancorp1 | 24,071 | 739,943 |
T. Rowe Price Group, Inc. | 6,050 | 737,132 |
Lincoln National Corp.1 | 12,480 | 736,445 |
Capital One Financial Corp.1 | 7,143 | 735,086 |
Raymond James Financial, Inc. | 8,203 | 733,840 |
U.S. Bancorp | 12,369 | 733,358 |
Western Union Co. | 27,376 | 733,129 |
Northern Trust Corp. | 6,900 | 733,056 |
Huntington Bancshares, Inc.1 | 48,564 | 732,345 |
CME Group, Inc. — Class A1 | 3,644 | 731,424 |
Discover Financial Services1 | 8,600 | 729,452 |
Unum Group | 24,570 | 716,461 |
Synchrony Financial | 19,779 | 712,242 |
Charles Schwab Corp. | 14,924 | 709,785 |
| Total Financial | | 73,114,451 |
| Consumer, Cyclical – 13.9% | | |
Macy’s, Inc.1 | 49,108 | 834,836 |
See notes to financial statements.
20 l GPM l GUGGENHEIM ENHANCED EQUITY INCOME FUND ANNUAL REPORT| | | |
| SCHEDULE OF INVESTMENTS continued | | December 31, 2019 |
|
|
|
| Shares | Value |
|
COMMON STOCKS† – 98.4% (continued) | | |
| Consumer, Cyclical – 13.9% (continued) | | |
Live Nation Entertainment, Inc.* | 11,586 | $ 828,051 |
Carnival Corp.1 | 15,711 | 798,590 |
Wynn Resorts Ltd.1 | 5,744 | 797,669 |
VF Corp. | 8,003 | 797,579 |
Nordstrom, Inc. | 19,423 | 794,983 |
Royal Caribbean Cruises Ltd. | 5,933 | 792,115 |
Gap, Inc.1 | 44,665 | 789,677 |
Kohl’s Corp.1 | 15,440 | 786,668 |
Norwegian Cruise Line Holdings Ltd.* | 13,364 | 780,591 |
American Airlines Group, Inc.1 | 27,127 | 778,002 |
Tapestry, Inc. | 28,738 | 775,064 |
Nike, Inc. — Class B | 7,625 | 772,489 |
Marriott International, Inc. — Class A1 | 5,100 | 772,293 |
Best Buy Company, Inc.1 | 8,792 | 771,938 |
Hilton Worldwide Holdings, Inc. | 6,954 | 771,268 |
Advance Auto Parts, Inc.1 | 4,803 | 769,248 |
Hanesbrands, Inc.1 | 51,768 | 768,755 |
Delta Air Lines, Inc.1 | 13,141 | 768,486 |
General Motors Co.1 | 20,911 | 765,343 |
Chipotle Mexican Grill, Inc. — Class A*,1 | 914 | 765,119 |
Copart, Inc.* | 8,412 | 764,987 |
L Brands, Inc.1 | 42,116 | 763,142 |
Home Depot, Inc.1 | 3,482 | 760,399 |
Walgreens Boots Alliance, Inc. | 12,879 | 759,346 |
WW Grainger, Inc.1 | 2,243 | 759,300 |
Hasbro, Inc.1 | 7,174 | 757,646 |
MGM Resorts International | 22,762 | 757,292 |
Aptiv plc1 | 7,969 | 756,816 |
TJX Companies, Inc. | 12,348 | 753,969 |
Lowe’s Companies, Inc.1 | 6,291 | 753,410 |
Genuine Parts Co.1 | 7,089 | 753,064 |
Dollar General Corp.1 | 4,821 | 751,980 |
Ross Stores, Inc. | 6,455 | 751,491 |
Target Corp. | 5,860 | 751,311 |
Ford Motor Co.1 | 80,765 | 751,114 |
PVH Corp. | 7,140 | 750,771 |
Costco Wholesale Corp.1 | 2,554 | 750,672 |
Yum! Brands, Inc.1 | 7,446 | 750,036 |
United Airlines Holdings, Inc.* | 8,512 | 749,822 |
Alaska Air Group, Inc.1 | 11,059 | 749,247 |
Dollar Tree, Inc.*,1 | 7,965 | 749,108 |
Ralph Lauren Corp. — Class A | 6,376 | 747,395 |
See notes to financial statements.
GPM l GUGGENHEIM ENHANCED EQUITY INCOME FUND ANNUAL REPORT l 21
| | | |
| SCHEDULE OF INVESTMENTS continued | | December 31, 2019 |
|
|
|
| Shares | Value |
|
COMMON STOCKS† – 98.4% (continued) | | |
| Consumer, Cyclical – 13.9% (continued) | | |
McDonald’s Corp.1 | 3,782 | $ 747,361 |
Leggett & Platt, Inc.1 | 14,697 | 747,049 |
NVR, Inc.* | 196 | 746,448 |
Newell Brands, Inc. | 38,806 | 745,851 |
Las Vegas Sands Corp. | 10,798 | 745,494 |
Tiffany & Co. | 5,576 | 745,232 |
Ulta Beauty, Inc.* | 2,941 | 744,485 |
Fastenal Co.1 | 20,131 | 743,841 |
Southwest Airlines Co. | 13,766 | 743,089 |
Harley-Davidson, Inc.1 | 19,959 | 742,275 |
Whirlpool Corp. | 5,023 | 741,043 |
O’Reilly Automotive, Inc.* | 1,689 | 740,221 |
Starbucks Corp.1 | 8,407 | 739,143 |
BorgWarner, Inc.1 | 17,020 | 738,328 |
Mohawk Industries, Inc.* | 5,404 | 736,997 |
LKQ Corp.*,1 | 20,644 | 736,991 |
Walmart, Inc. | 6,197 | 736,451 |
Tractor Supply Co. | 7,853 | 733,784 |
Capri Holdings Ltd.*,1 | 19,223 | 733,357 |
Cummins, Inc.1 | 4,085 | 731,052 |
PACCAR, Inc. | 9,090 | 719,019 |
AutoZone, Inc.*,1 | 603 | 718,360 |
DR Horton, Inc.1 | 13,601 | 717,453 |
PulteGroup, Inc. | 18,461 | 716,287 |
Lennar Corp. — Class A1 | 12,787 | 713,387 |
Darden Restaurants, Inc.1 | 6,450 | 703,115 |
CarMax, Inc.*,1 | 7,616 | 667,695 |
Under Armour, Inc. — Class A* | 19,671 | 424,894 |
Under Armour, Inc. — Class C* | 20,320 | 389,737 |
| Total Consumer, Cyclical | | 53,659,521 |
| Industrial – 13.0% | | |
Westrock Co. | 18,231 | 782,292 |
Sealed Air Corp. | 19,612 | 781,146 |
3M Co. | 4,416 | 779,071 |
Westinghouse Air Brake Technologies Corp.1�� | 9,918 | 771,620 |
J.B. Hunt Transport Services, Inc.1 | 6,597 | 770,398 |
Mettler-Toledo International, Inc.* | 968 | 767,895 |
PerkinElmer, Inc. | 7,898 | 766,896 |
Flowserve Corp.1 | 15,399 | 766,408 |
IDEX Corp. | 4,454 | 766,088 |
Amcor plc | 70,593 | 765,228 |
See notes to financial statements.
22 l GPM l GUGGENHEIM ENHANCED EQUITY INCOME FUND ANNUAL REPORT| | | |
| SCHEDULE OF INVESTMENTS continued | | December 31, 2019 |
|
|
|
| Shares | Value |
|
COMMON STOCKS† – 98.4% (continued) | | |
| Industrial – 13.0% (continued) | | |
Textron, Inc. | 17,157 | $ 765,202 |
Expeditors International of Washington, Inc.1 | 9,789 | 763,738 |
AO Smith Corp. | 16,024 | 763,384 |
CH Robinson Worldwide, Inc.1 | 9,738 | 761,511 |
Norfolk Southern Corp. | 3,922 | 761,378 |
Union Pacific Corp. | 4,211 | 761,307 |
Ball Corp.1 | 11,769 | 761,101 |
Masco Corp.1 | 15,857 | 760,977 |
TE Connectivity Ltd.1 | 7,931 | 760,107 |
Agilent Technologies, Inc.1 | 8,905 | 759,686 |
Old Dominion Freight Line, Inc. | 3,999 | 758,930 |
Waste Management, Inc. | 6,655 | 758,404 |
Fortive Corp.1 | 9,914 | 757,331 |
Caterpillar, Inc.1 | 5,122 | 756,417 |
Dover Corp.1 | 6,559 | 755,990 |
Xylem, Inc.1 | 9,591 | 755,675 |
Illinois Tool Works, Inc.1 | 4,205 | 755,344 |
Allegion plc1 | 6,060 | 754,712 |
Martin Marietta Materials, Inc.1 | 2,698 | 754,469 |
Eaton Corporation plc1 | 7,964 | 754,350 |
AMETEK, Inc.1 | 7,563 | 754,334 |
Kansas City Southern1 | 4,923 | 754,007 |
Raytheon Co. | 3,429 | 753,489 |
Roper Technologies, Inc. | 2,127 | 753,447 |
Amphenol Corp. — Class A1 | 6,958 | 753,064 |
Packaging Corporation of America | 6,714 | 751,901 |
Lockheed Martin Corp.1 | 1,929 | 751,114 |
Stanley Black & Decker, Inc. | 4,531 | 750,968 |
Vulcan Materials Co. | 5,213 | 750,620 |
Johnson Controls International plc1 | 18,434 | 750,448 |
Republic Services, Inc. — Class A | 8,362 | 749,486 |
United Technologies Corp. | 5,001 | 748,950 |
Deere & Co.1 | 4,321 | 748,657 |
Fortune Brands Home & Security, Inc.1 | 11,453 | 748,339 |
Emerson Electric Co.1 | 9,811 | 748,187 |
Garmin Ltd.1 | 7,651 | 746,432 |
Pentair plc1 | 16,259 | 745,800 |
Honeywell International, Inc. | 4,212 | 745,524 |
Huntington Ingalls Industries, Inc.1 | 2,967 | 744,361 |
Northrop Grumman Corp. | 2,163 | 744,007 |
Waters Corp.* | 3,184 | 743,942 |
Jacobs Engineering Group, Inc.1 | 8,280 | 743,792 |
See notes to financial statements.
GPM l GUGGENHEIM ENHANCED EQUITY INCOME FUND ANNUAL REPORT l 23
| | | |
| SCHEDULE OF INVESTMENTS continued | | December 31, 2019 |
|
|
|
| Shares | Value |
|
COMMON STOCKS† – 98.4% (continued) | | |
| Industrial – 13.0% (continued) | | |
Parker-Hannifin Corp. | 3,610 | $ 743,010 |
Rockwell Automation, Inc. | 3,664 | 742,583 |
CSX Corp.1 | 10,243 | 741,183 |
Snap-on, Inc. | 4,375 | 741,125 |
Ingersoll-Rand plc1 | 5,571 | 740,497 |
L3Harris Technologies, Inc. | 3,724 | 736,868 |
United Parcel Service, Inc. — Class B | 6,285 | 735,722 |
General Dynamics Corp.1 | 4,164 | 734,321 |
General Electric Co.1 | 65,737 | 733,625 |
FLIR Systems, Inc. | 14,020 | 730,021 |
Arconic, Inc.1 | 23,553 | 724,726 |
TransDigm Group, Inc. | 1,294 | 724,640 |
Boeing Co.1 | 2,182 | 710,808 |
Keysight Technologies, Inc.* | 6,915 | 709,686 |
FedEx Corp.1 | 4,500 | 680,445 |
| Total Industrial | | 50,307,184 |
| Technology – 10.5% | | |
Western Digital Corp. | 13,728 | 871,316 |
Advanced Micro Devices, Inc.* | 18,116 | 830,800 |
Skyworks Solutions, Inc. | 6,664 | 805,544 |
Apple, Inc.1 | 2,709 | 795,498 |
Leidos Holdings, Inc. | 8,117 | 794,573 |
NVIDIA Corp. | 3,328 | 783,078 |
Micron Technology, Inc.* | 14,560 | 783,037 |
KLA Corp.1 | 4,353 | 775,574 |
Lam Research Corp.1 | 2,644 | 773,106 |
Adobe, Inc.*,1 | 2,344 | 773,075 |
Intel Corp.1 | 12,899 | 772,005 |
ServiceNow, Inc.* | 2,731 | 771,016 |
Maxim Integrated Products, Inc. | 12,510 | 769,490 |
Broadridge Financial Solutions, Inc. | 6,227 | 769,284 |
Electronic Arts, Inc.*,1 | 7,130 | 766,546 |
Microchip Technology, Inc. | 7,302 | 764,666 |
Qorvo, Inc.* | 6,573 | 763,980 |
Autodesk, Inc.*,1 | 4,155 | 762,276 |
Cadence Design Systems, Inc.* | 10,975 | 761,226 |
Microsoft Corp. | 4,824 | 760,745 |
Akamai Technologies, Inc.*,1 | 8,802 | 760,317 |
Applied Materials, Inc.1 | 12,451 | 760,009 |
Accenture plc — Class A1 | 3,607 | 759,526 |
Synopsys, Inc.* | 5,453 | 759,058 |
See notes to financial statements.
24 l GPM l GUGGENHEIM ENHANCED EQUITY INCOME FUND ANNUAL REPORT| | | |
| SCHEDULE OF INVESTMENTS continued | | December 31, 2019 |
|
|
|
| Shares | Value |
|
COMMON STOCKS† – 98.4% (continued) | | |
| Technology – 10.5% (continued) | | |
Cerner Corp.1 | 10,321 | $ 757,458 |
Xilinx, Inc.1 | 7,747 | 757,424 |
ANSYS, Inc.*,1 | 2,936 | 755,756 |
Texas Instruments, Inc. | 5,887 | 755,243 |
Activision Blizzard, Inc.1 | 12,710 | 755,228 |
Seagate Technology plc1 | 12,687 | 754,877 |
Fortinet, Inc.* | 7,057 | 753,405 |
HP, Inc.1 | 36,632 | 752,788 |
salesforce.com, Inc.* | 4,626 | 752,373 |
Intuit, Inc.1 | 2,871 | 752,001 |
Fidelity National Information Services, Inc.1 | 5,395 | 750,390 |
Cognizant Technology Solutions Corp. — Class A1 | 12,094 | 750,070 |
Take-Two Interactive Software, Inc.* | 6,119 | 749,149 |
Citrix Systems, Inc.1 | 6,755 | 749,129 |
QUALCOMM, Inc. | 8,487 | 748,808 |
IPG Photonics Corp.*,1 | 5,154 | 746,918 |
DXC Technology Co.1 | 19,868 | 746,838 |
Broadcom, Inc.1 | 2,363 | 746,755 |
Xerox Holdings Corp. | 20,235 | 746,064 |
Analog Devices, Inc.1 | 6,276 | 745,840 |
Paychex, Inc. | 8,762 | 745,296 |
Jack Henry & Associates, Inc.1 | 5,111 | 744,519 |
International Business Machines Corp.1 | 5,554 | 744,458 |
MSCI, Inc. — Class A | 2,866 | 739,944 |
Zebra Technologies Corp. — Class A* | 2,892 | 738,733 |
Fiserv, Inc.*,1 | 6,385 | 738,298 |
Hewlett Packard Enterprise Co.1 | 46,504 | 737,553 |
NetApp, Inc. | 11,788 | 733,803 |
Oracle Corp. | 13,676 | 724,554 |
| Total Technology | | 40,359,417 |
| Communications – 6.1% | | |
ViacomCBS, Inc. — Class B | 19,293 | 809,727 |
Netflix, Inc.* | 2,497 | 807,954 |
Cisco Systems, Inc.1 | 16,456 | 789,230 |
Facebook, Inc. — Class A*,1 | 3,840 | 788,160 |
Twitter, Inc.*,1 | 24,530 | 786,187 |
Arista Networks, Inc.*,1 | 3,864 | 785,938 |
Amazon.com, Inc.*,1 | 423 | 781,636 |
Booking Holdings, Inc.*,1 | 378 | 776,310 |
DISH Network Corp. — Class A*,1 | 21,845 | 774,842 |
T-Mobile US, Inc.* | 9,878 | 774,633 |
See notes to financial statements.
GPM l GUGGENHEIM ENHANCED EQUITY INCOME FUND ANNUAL REPORT l 25
| | | |
| SCHEDULE OF INVESTMENTS continued | | December 31, 2019 |
|
|
|
| Shares | Value |
|
COMMON STOCKS† – 98.4% (continued) | | |
| Communications – 6.1% (continued) | | |
CDW Corp. | 5,411 | $ 772,907 |
Comcast Corp. — Class A1 | 17,106 | 769,257 |
AT&T, Inc.1 | 19,484 | 761,435 |
Juniper Networks, Inc.1 | 30,893 | 760,894 |
Charter Communications, Inc. — Class A*,1 | 1,568 | 760,605 |
eBay, Inc.1 | 21,011 | 758,707 |
Corning, Inc.1 | 25,938 | 755,055 |
Verizon Communications, Inc. | 12,259 | 752,702 |
VeriSign, Inc.* | 3,893 | 750,103 |
Motorola Solutions, Inc. | 4,645 | 748,495 |
Interpublic Group of Companies, Inc.1 | 32,369 | 747,724 |
F5 Networks, Inc.*,1 | 5,354 | 747,686 |
Walt Disney Co.1 | 5,093 | 736,601 |
Omnicom Group, Inc. | 9,086 | 736,147 |
NortonLifeLock, Inc. | 28,672 | 731,710 |
CenturyLink, Inc.1 | 54,813 | 724,080 |
Expedia Group, Inc.1 | 6,611 | 714,914 |
News Corp. — Class A | 41,455 | 586,174 |
Fox Corp. — Class A | 14,013 | 519,462 |
Discovery, Inc. — Class C*,1 | 16,643 | 507,445 |
Alphabet, Inc. — Class C*,1 | 278 | 371,692 |
Alphabet, Inc. — Class A*,1 | 275 | 368,332 |
Discovery, Inc. — Class A*,1 | 7,581 | 248,202 |
Fox Corp. — Class B | 6,420 | 233,688 |
News Corp. — Class B | 13,090 | 189,936 |
| Total Communications | | 23,628,570 |
| Energy – 5.7% | | |
Apache Corp.1 | 34,916 | 893,500 |
Concho Resources, Inc.1 | 9,466 | 828,938 |
Noble Energy, Inc. | 33,309 | 827,396 |
EOG Resources, Inc.1 | 9,875 | 827,130 |
Devon Energy Corp.1 | 31,749 | 824,521 |
Occidental Petroleum Corp. | 19,768 | 814,639 |
Cimarex Energy Co.1 | 15,508 | 814,015 |
Diamondback Energy, Inc. | 8,761 | 813,546 |
Baker Hughes Co.1 | 31,534 | 808,216 |
Cabot Oil & Gas Corp. — Class A1 | 46,302 | 806,118 |
Pioneer Natural Resources Co. | 5,325 | 806,045 |
Helmerich & Payne, Inc.1 | 17,711 | 804,611 |
Hess Corp.1 | 11,962 | 799,181 |
TechnipFMC plc1 | 37,273 | 799,133 |
See notes to financial statements.
26 l GPM l GUGGENHEIM ENHANCED EQUITY INCOME FUND ANNUAL REPORT| | | |
| SCHEDULE OF INVESTMENTS continued | | December 31, 2019 |
|
|
|
| Shares | Value |
|
COMMON STOCKS† – 98.4% (continued) | | |
| Energy – 5.7% (continued) | | |
Marathon Oil Corp.1 | 58,605 | $ 795,856 |
National Oilwell Varco, Inc. | 31,322 | 784,616 |
Kinder Morgan, Inc.1 | 36,904 | 781,258 |
Williams Companies, Inc. | 32,825 | 778,609 |
ConocoPhillips1 | 11,889 | 773,142 |
ONEOK, Inc. | 10,188 | 770,926 |
Schlumberger Ltd. | 19,114 | 768,383 |
Marathon Petroleum Corp.1 | 12,719 | 766,320 |
Chevron Corp.1 | 6,320 | 761,623 |
Halliburton Co.1 | 31,074 | 760,381 |
HollyFrontier Corp. | 14,853 | 753,196 |
Exxon Mobil Corp.1 | 10,768 | 751,391 |
Valero Energy Corp. | 7,947 | 744,237 |
Phillips 66 | 6,598 | 735,083 |
| Total Energy | | 22,192,010 |
| Utilities – 5.6% | | |
AES Corp.1 | 39,401 | 784,080 |
CenterPoint Energy, Inc.1 | 28,738 | 783,685 |
Southern Co. | 12,269 | 781,535 |
Eversource Energy1 | 9,165 | 779,667 |
Atmos Energy Corp. | 6,964 | 778,993 |
Pinnacle West Capital Corp.1 | 8,654 | 778,254 |
Exelon Corp.1 | 17,012 | 775,577 |
DTE Energy Co.1 | 5,970 | 775,324 |
Edison International1 | 10,255 | 773,330 |
Evergy, Inc. | 11,878 | 773,139 |
NiSource, Inc. | 27,733 | 772,087 |
WEC Energy Group, Inc. | 8,359 | 770,951 |
Alliant Energy Corp.1 | 14,085 | 770,731 |
American Water Works Company, Inc.1 | 6,254 | 768,304 |
CMS Energy Corp.1 | 12,223 | 768,093 |
Consolidated Edison, Inc.1 | 8,487 | 767,819 |
American Electric Power Company, Inc.1 | 8,098 | 765,342 |
Dominion Energy, Inc.1 | 9,217 | 763,352 |
Ameren Corp.1 | 9,937 | 763,162 |
NextEra Energy, Inc. | 3,146 | 761,835 |
Xcel Energy, Inc.1 | 11,973 | 760,166 |
Sempra Energy | 5,011 | 759,066 |
FirstEnergy Corp.1 | 15,547 | 755,584 |
Entergy Corp.1 | 6,301 | 754,860 |
Duke Energy Corp.1 | 8,274 | 754,671 |
See notes to financial statements.
GPM l GUGGENHEIM ENHANCED EQUITY INCOME FUND ANNUAL REPORT l 27
| | | |
| SCHEDULE OF INVESTMENTS continued | | December 31, 2019 |
|
|
|
| Shares | Value |
|
COMMON STOCKS† – 98.4% (continued) | | |
| Utilities – 5.6% (continued) | | |
NRG Energy, Inc.1 | 18,935 | $ 752,666 |
Public Service Enterprise Group, Inc. | 12,732 | 751,825 |
PPL Corp. | 20,916 | 750,466 |
| Total Utilities | | 21,494,564 |
| Basic Materials – 3.8% | | |
Mosaic Co.1 | 40,014 | 865,903 |
Albemarle Corp.1 | 11,188 | 817,171 |
CF Industries Holdings, Inc.1 | 16,515 | 788,426 |
Newmont Goldcorp Corp. | 18,054 | 784,446 |
Ecolab, Inc.1 | 4,019 | 775,627 |
Dow, Inc. | 13,992 | 765,782 |
LyondellBasell Industries N.V. — Class A1 | 8,049 | 760,470 |
Sherwin-Williams Co. | 1,303 | 760,353 |
Freeport-McMoRan, Inc. | 57,922 | 759,937 |
Air Products & Chemicals, Inc.1 | 3,231 | 759,253 |
Linde plc | 3,566 | 759,201 |
Eastman Chemical Co.1 | 9,488 | 752,019 |
FMC Corp.1 | 7,516 | 750,247 |
PPG Industries, Inc. | 5,604 | 748,078 |
Nucor Corp. | 13,201 | 742,952 |
International Paper Co.1 | 16,080 | 740,484 |
DuPont de Nemours, Inc. | 11,504 | 738,557 |
Celanese Corp. — Class A1 | 5,989 | 737,366 |
International Flavors & Fragrances, Inc.1 | 5,564 | 717,867 |
| Total Basic Materials | | 14,524,139 |
| Total Common Stocks | | |
| (Cost $347,428,431) | | 379,698,858 |
EXCHANGE-TRADED FUNDS† – 45.2% | | |
SPDR S&P 500 ETF Trust1,2 | 181,029 | 58,265,994 |
Invesco QQQ Trust Series 11,2 | 273,907 | 58,235,367 |
iShares Russell 2000 Index ETF1,2 | 349,280 | 57,865,218 |
| Total Exchange-Traded Funds | | |
| (Cost $135,750,270) | | 174,366,579 |
MONEY MARKET FUND† – 2.6% | | |
Dreyfus Treasury Securities Cash Management Fund — Institutional Class 1.44%3 | 9,967,991 | 9,967,991 |
| Total Money Market Fund | | |
| (Cost $9,967,991) | | 9,967,991 |
| Total Investments – 146.2% | | |
| (Cost $493,146,692) | | $ 564,033,428 |
See notes to financial statements.
28 l GPM l GUGGENHEIM ENHANCED EQUITY INCOME FUND ANNUAL REPORT| | |
| SCHEDULE OF INVESTMENTS continued | December 31, 2019 |
| | | |
| Contracts | Value |
|
LISTED OPTIONS WRITTEN† – (1.2)% | | |
Call options on: | | |
| BNP Paribas Russell 2000 Index Expiring January 2020 with strike price of $1,670 | | |
| (Notional Value $115,958,596)* | 695 | $ (1,436,565) |
| BNP Paribas S&P 500 Index Expiring January 2020 with strike price of $3,215 | | |
| (Notional Value $116,631,158)* | 361 | (1,512,590) |
| BNP Paribas NASDAQ-100 Index Expiring January 2020 with strike price of $8,700 | | |
| (Notional Value $116,149,871)* | 133 | (1,764,910) |
| Total Call Options Written | | |
| (Premiums received $4,147,927) | | (4,714,065) |
| Other Assets & Liabilities, net – (45.0)% | | (173,660,137) |
| Total Net Assets – 100.0% | | $ 385,659,226 |
| * | Non-income producing security. |
| † | Value determined based on Level 1 inputs — See Note 6. |
| 1 | All or a portion of these securities have been physically segregated in connection with borrowings. Asof December 31, 2019, the total market value of segregated securities was $247,357,359. |
| 2 | Security represents cover for outstanding options written. |
| 3 | Rate indicated is the 7-day yield as of December 31, 2019. |
| plc | Public Limited Company |
| REIT | Real Estate Investment Trust |
See Sector Classification in Other Information section.
The following table summarizes the inputs used to value the Fund’s investments at December 31, 2019 (See Note 6 in the Notes to Financial Statements):
| | | | | Level 2 | | | Level 3 | | | | |
| | Level 1 | | | Significant | | | Significant | | | | |
| | | Quoted | | | Observable | | | Unobservable | | | | |
| Investments in Securities (Assets) | | Prices | | | Inputs | | | Inputs | | | Total | |
Common Stocks | | $ | 379,698,858 | | | $ | — | | | $ | — | | | $ | 379,698,858 | |
Exchange-Traded Funds | | | 174,366,579 | | | | — | | | | — | | | | 174,366,579 | |
Money Market Fund | | | 9,967,991 | | | | — | | | | — | | | | 9,967,991 | |
Total Assets | | $ | 564,033,428 | | | $ | — | | | $ | — | | | $ | 564,033,428 | |
| | | | | Level 2 | | | Level 3 | | | | |
| | Level 1 | | | Significant | | | Significant | | | | |
| | | Quoted | | | Observable | | | Observable | | | | |
| Investments in Securities (Liabilities) | | Prices | | | Inputs | | | Inputs | | | Total | |
Options Written | | $ | 4,714,065 | | | $ | — | | | $ | — | | | $ | 4,714,065 | |
See notes to financial statements.
GPM l GUGGENHEIM ENHANCED EQUITY INCOME FUND ANNUAL REPORT l 29
| | |
| STATEMENT OF ASSETS AND LIABILITIES | December 31, 2019 |
|
| ASSETS: | | | |
Investments, at value (cost $493,146,692) | | $ | 564,033,428 | |
Cash | | | 761,574 | |
Receivables: | | | | |
| Investments sold | | | 2,966,991 | |
| Dividends | | | 862,206 | |
| Interest | | | 20,071 | |
Other assets | | | 5,879 | |
Total assets | | | 568,650,149 | |
| LIABILITIES: | | | | |
Borrowings | | | 175,000,000 | |
Options written, at value (premiums received $4,147,927) | | | 4,714,065 | |
Investments purchased payable | | | 2,306,328 | |
Interest payable on borrowings | | | 358,798 | |
Investment advisory fees payable | | | 378,415 | |
Other liabilities | | | 233,317 | |
Total liabilities | | | 182,990,923 | |
| NET ASSETS | | $ | 385,659,226 | |
| NET ASSETS CONSIST OF: | | | | |
Common stock, $0.01 par value per share; unlimited number of shares | | | | |
| authorized, 48,342,587 shares issued and outstanding | | $ | 483,426 | |
Additional paid-in capital | | | 322,728,848 | |
Total distributable earnings (loss) | | | 62,446,952 | |
| NET ASSETS | | $ | 385,659,226 | |
Shares outstanding ($0.01 par value with unlimited amount authorized) | | | 48,342,587 | |
Net asset value | | $ | 7.98 | |
See notes to financial statements.
30 l GPM l GUGGENHEIM ENHANCED EQUITY INCOME FUND ANNUAL REPORT| | |
| STATEMENT OF OPERATIONS | December 31, 2019 |
For the Year Ended December 31, 2019 | |
| | | | |
| INVESTMENT INCOME: | | | |
Dividends | | $ | 9,948,337 | |
Interest | | | 231,655 | |
| Total investment income | | | 10,179,992 | |
| EXPENSES: | | | | |
Interest expense | | | 5,133,907 | |
Investment advisory fees | | | 4,364,132 | |
Professional fees | | | 148,338 | |
Administration fees | | | 121,813 | |
Fund accounting fees | | | 113,730 | |
Printing fees | | | 112,140 | |
Trustees’ fees and expenses* | | | 99,360 | |
Custodian fees | | | 78,934 | |
Listing fees | | | 47,026 | |
Transfer agent fees | | | 20,966 | |
Insurance | | | 10,549 | |
Other expenses | | | 15,848 | |
| Total expenses | | | 10,266,743 | |
Net investment loss | | | (86,751 | ) |
| NET REALIZED AND UNREALIZED GAIN (LOSS): | | | | |
Net realized gain (loss) on: | | | | |
| Investments | | | 33,295,408 | |
| Options written | | | (40,264,445 | ) |
Net realized loss | | | (6,969,037 | ) |
Net change in unrealized appreciation (depreciation) on: | | | | |
| Investments | | | 96,948,801 | |
| Options written | | | 3,925,381 | |
Net change in unrealized appreciation (depreciation) | | | 100,874,182 | |
Net realized and unrealized gain | | | 93,905,145 | |
| Net increase in net assets resulting from operations | | $ | 93,818,394 | |
* Relates to Trustees not deemed “interested persons” within the meaning of Section 2(a)(19) of the 1940 Act.
See notes to financial statements.
GPM l GUGGENHEIM ENHANCED EQUITY INCOME FUND ANNUAL REPORT l 31
| | | |
| STATEMENTS OF CHANGES IN NET ASSETS | | December 31, 2019 |
| | |
| | Year Ended | | | Year Ended | |
| | December 31, 2019
| | | December 31, 2018 | |
| INCREASE (DECREASE) IN NET ASSETS FROM OPERATIONS: | | | | | | |
Net investment loss | | $ | (86,751 | ) | | $ | (531,613 | ) |
Net realized gain (loss) on investments | | | (6,969,037 | ) | | | 50,230,684 | |
Net change in unrealized appreciation (depreciation) on investments | | | 100,874,182 | | | | (100,947,811 | ) |
Net increase (decrease) in net assets resulting from operations | | | 93,818,394 | | | | (51,248,740 | ) |
| DISTRIBUTIONS: | | | | | | | | |
Distributions to shareholders | | | — | | | | (30,466,718 | ) |
Return of capital | | | (46,269,806 | ) | | | (15,695,856 | ) |
Total distributions | | | (46,269,806 | ) | | | (46,162,574 | ) |
| SHAREHOLDER TRANSACTIONS: | | | | | | | | |
Reinvestments of distributions | | | 1,641,660 | | | | 838,416 | |
Net increase in net assets resulting from shareholder transactions | | | 1,641,660 | | | | 838,416 | |
Net increase (decrease) in net assets | | | 49,190,248 | | | | (96,572,898 | ) |
| NET ASSETS: | | | | | | | | |
Beginning of period | | | 336,468,978 | | | | 433,041,876 | |
End of period | | $ | 385,659,226 | | | $ | 336,468,978 | |
See notes to financial statements.
32 l GPM l GUGGENHEIM ENHANCED EQUITY INCOME FUND ANNUAL REPORT| | |
| STATEMENT OF CASH FLOWS | December 31, 2019 |
For the Year Ended December 31, 2019 | |
| | | | |
| Cash Flows from Operating Activities: | | | |
| Net increase in net assets resulting from operations | | $ | 93,818,394 | |
| Adjustments to Reconcile Net Increase in Net Assets Resulting from Operations to | | | | |
| Net Cash Provided by Operating and Investing Activities: | | | | |
| Net change in unrealized (appreciation) depreciation on investments | | | (96,948,801 | ) |
| Net change in unrealized (appreciation) depreciation on options written | | | (3,925,381 | ) |
| Net realized gain on investments | | | (33,295,408 | ) |
| Net realized loss on options written | | | 40,264,445 | |
| Purchase of long-term investments | | | (118,205,266 | ) |
| Proceeds from sale of long-term investments | | | 178,718,124 | |
| Net proceeds from sale of short-term investments | | | 4,025,121 | |
| Corporate actions and other payments | | | 582,286 | |
| Premiums received on options written | | | 305,433,470 | |
| Cost of closed options written | | | (351,548,729 | ) |
| Decrease in interest receivable | | | 38,100 | |
| Increase in dividends receivable | | | (56,163 | ) |
| Increase in investments sold receivable | | | (2,757,161 | ) |
| Increase in other assets | | | (1,770 | ) |
| Increase in investments purchased payable | | | 2,306,328 | |
| Decrease in interest payable on borrowings | | | (117,489 | ) |
| Increase in investment advisory fees payable | | | 22,581 | |
| Decrease in other liabilities | | | (4,529 | ) |
| Net Cash Provided by Operating and Investing Activities | | $ | 18,348,152 | |
| Cash Flows From Financing Activities: | | | | |
| Distributions to common shareholders | | | (44,628,146 | ) |
| Proceeds from borrowings | | | 83,000,000 | |
| Payments made on borrowings | | | (56,000,000 | ) |
| Net Cash Used in Financing Activities | | | (17,628,146 | ) |
| Net increase in cash | | | 720,006 | |
| Cash at Beginning of Year | | | 41,568 | |
| Cash at End of Year | | $ | 761,574 | |
| Supplemental Disclosure of Cash Flow Information: | | | | |
| Cash paid during the year for interest | | $ | 5,251,396 | |
| Supplemental Disclosure of Non Cash Financing Activity: Dividend reinvestment | | $ | 1,641,660 | |
See notes to financial statements.
GPM l GUGGENHEIM ENHANCED EQUITY INCOME FUND ANNUAL REPORT l 33
| | |
| FINANCIAL HIGHLIGHTS | December 31, 2019 |
| | | | | | | | | | | | | | | | |
| | Year Ended | | | Year Ended | | | Year Ended | | | Year Ended | | | Year Ended | |
| | December 31, | | | December 31, | | | December 31, | | | December 31, | | | December 31, | |
| | 2019 | | | 2018 | | | 2017 | | | 2016 | | | 2015 | |
| Per Share Data: | | | | | | | | | | | | | | | |
Net asset value, beginning of period | | $ | 6.99 | | | $ | 9.01 | | | $ | 8.35 | | | $ | 8.37 | | | $ | 9.19 | |
Income from investment operations: | | | | | | | | | | | | | | | | | | | | |
Net investment income (loss)(a) | | | — | * | | | (0.01 | ) | | | 0.01 | | | | 0.06 | | | | 0.06 | |
Net gain (loss) on investments (realized and unrealized) | | | 1.95 | | | | (1.05 | ) | | | 1.61 | | | | 0.88 | | | | 0.08 | |
Total from investment operations | | | 1.95 | | | | (1.06 | ) | | | 1.62 | | | | 0.94 | | | | 0.14 | |
Less distributions from: | | | | | | | | | | | | | | | | | | | | |
Net investment income | | | — | | | | (0.03 | ) | | | (0.25 | ) | | | (0.47 | ) | | | (0.53 | ) |
Capital gains | | | — | | | | (0.60 | ) | | | (0.42 | ) | | | — | | | | — | |
Return of capital | | | (0.96 | ) | | | (0.33 | ) | | | (0.29 | ) | | | (0.49 | ) | | | (0.43 | ) |
Total distributions to shareholders | | | (0.96 | ) | | | (0.96 | ) | | | (0.96 | ) | | | (0.96 | ) | | | (0.96 | ) |
Net asset value, end of period | | $ | 7.98 | | | $ | 6.99 | | | $ | 9.01 | | | $ | 8.35 | | | $ | 8.37 | |
Market value, end of period | | $ | 8.06 | | | $ | 6.78 | | | $ | 8.90 | | | $ | 8.00 | | | $ | 7.68 | |
Total Return(b) | | | | | | | | | | | | | | | | | | | | |
Net asset value | | | 28.83 | % | | | -12.79 | % | | | 20.25 | % | | | 11.87 | % | | | 1.71 | % |
Market value | | | 34.15 | % | | | -14.24 | % | | | 24.34 | % | | | 17.86 | % | | | 0.28 | % |
| Ratios/Supplemental Data: | | | | | | | | | | | | | | | | | | | | |
Net assets, end of period (in thousands) | | $ | 385,659 | | | $ | 336,469 | | | $ | 433,042 | | | $ | 159,229 | | | $ | 159,669 | |
Ratio to average net assets of: | | | | | | | | | | | | | | | | | | | | |
Net investment income (loss), including interest expense | | | (0.02 | )% | | | (0.13 | )% | | | 0.14 | % | | | 0.78 | % | | | 0.69 | % |
Total expenses, including interest expense(c) | | | 2.74 | % | | | 2.64 | % | | | 2.34 | % | | | 2.16 | % | | | 2.03 | % |
Net expenses, including interest expense(c),(d),(e),(f) | | | 2.74 | % | | | 2.64 | % | | | 2.32 | % | | | 2.01 | % | | | 1.88 | % |
Portfolio turnover rate | | | 22 | % | | | 25 | % | | | 67 | % | | | 143 | % | | | 358 | % |
See notes to financial statements.
34 l GPM l GUGGENHEIM ENHANCED EQUITY INCOME FUND ANNUAL REPORT| | |
| FINANCIAL HIGHLIGHTS continued | December 31, 2019 |
| | | | | | | | | | | | | | | | |
| | Year Ended | | | Year Ended | | | Year Ended | | | Year Ended | | | Year Ended | |
| | December 31, | | | December 31, | | | December 31, | | | December 31, | | | December 31, | |
| | 2019 | | | 2018 | | | 2017 | | | 2016 | | | 2015 | |
| Senior Indebtedness: | | | | | | | | | | | | | | | |
Borrowings – committed facility agreement (in thousands) | | $ | 175,000 | | | $ | 148,000 | | | $ | 198,000 | | | $ | 72,000 | | | $ | 80,000 | |
Asset Coverage per $1,000 of borrowings(g) | | $ | 3,204 | | | $ | 3,273 | | | $ | 3,187 | | | $ | 3,212 | | | $ | 2,996 | |
| | |
(a) | Based on average shares outstanding. |
(b) | Total return is calculated assuming a purchase of a common share at the beginning of the period and a sale on the last day of the period reported either at net asset value (“NAV”) or market price per share. Dividends and distributions are assumed to be reinvested at NAV for NAV returns or the prices obtained under the Fund’s Dividend Reinvestment Plan for market value returns. Total return does not reflect brokerage commissions. |
(c) | Does not include expenses of the underlying funds in which the Fund invests. |
(d) | Excluding interest expense, the net expense ratios for the years ended December 31 would be: |
| | | | | |
| 2019 | 2018 | 2017 | 2016 | 2015 |
| 1.37% | 1.37% | 1.44%(f) | 1.46% | 1.44% |
| | |
(e) | Net expense information reflects the expense ratios after expense waivers, as applicable. |
(f) | Excluding interest and merger expenses, the net expense ratio for the year ended December 31, 2017 would be 1.37%. |
(g) | Calculated by subtracting the Fund’s total liabilities (not including borrowings) from the Fund’s total assets and dividing by the borrowings. |
* | Less than $0.01 per share. |
See notes to financial statements.
GPM l GUGGENHEIM ENHANCED EQUITY INCOME FUND ANNUAL REPORT l 35
| | |
| NOTES TO FINANCIAL STATEMENTS | December 31, 2019 |
Note 1 – Organization
Guggenheim Enhanced Equity Income Fund (the “Fund” or “GPM”) a Delaware statutory trust, is registered as a diversified, closed-end management investment company under the Investment Company Act of 1940, as amended (the “1940 Act”).
The Fund’s primary investment objective is to seek to provide a high level of current income and current gains, with a secondary objective of long-term capital appreciation. The Fund seeks to achieve its investment objective by obtaining broadly diversified exposure to the equity markets and utilizing a covered call strategy which will follow a proprietary dynamic rules-based methodology. The Fund seeks to earn income and gains both from dividends paid by the securities owned by the Fund and cash premiums received from selling options.
Note 2 – Significant Accounting Policies
The Fund operates as an investment company and, accordingly, follows the investment company accounting and reporting guidance of the Financial Accounting Standards Board (“FASB”) Accounting Standards Codification Topic 946 Financial Services – Investment Companies.
The following significant accounting policies are in conformity with U.S. generally accepted accounting principles (“U.S. GAAP”) and are consistently followed by the Fund. This requires management to make estimates and assumptions that affect the reported amount of assets and liabilities, contingent assets and liabilities at the date of the financial statements, and the reported amounts of revenues and expenses during the reporting period. Actual results could differ from these estimates. All time references are based on Eastern Time.
(a) Valuation of Investments
The Board of Trustees of the Fund (the “Board”) has adopted policies and procedures for the valuation of the Fund’s investments (the “Valuation Procedures”). Pursuant to the Valuation Procedures, the Board has delegated to a valuation committee, consisting of representatives from Guggenheim’s investment management, fund administration, legal and compliance departments (the “Valuation Committee”), the day-to-day responsibility for implementing the Valuation Procedures, including, under most circumstances, the responsibility for determining the fair value of the Fund’s securities and/or other assets.
Valuations of the Fund’s securities and other assets are supplied primarily by pricing services appointed pursuant to the processes set forth in the Valuation Procedures. The Valuation Committee convenes monthly, or more frequently as needed, to review the valuation of all assets which have been fair valued for reasonableness. The Fund’s officers, through the Valuation Committee and consistent with the monitoring and review responsibilities set forth in the Valuation Procedures, regularly review procedures used and valuations provided by the pricing services.
If the pricing service cannot or does not provide a valuation for a particular investment or such valuation is deemed unreliable, such investment is fair valued by the Valuation Committee.
Equity securities listed or traded on a recognized U.S. securities exchange or the National Association of Securities Dealers Automated Quotations (“NASDAQ”) National Market System shall generally be valued on the basis of the last sale price on the primary U.S. exchange or market on
36 l GPM l GUGGENHEIM ENHANCED EQUITY INCOME FUND ANNUAL REPORT| | |
| NOTES TO FINANCIAL STATEMENTS continued | December 31, 2019 |
which the security is listed or traded; provided, however, that securities listed on NASDAQ will be valued at the NASDAQ Official Closing Price, which may not necessarily represent the last sale price. If there is no sale on the valuation date, exchange-traded U.S. equity securities will be valued on the basis of the last bid price.
Open-end investment companies are valued at their net asset value per share (“NAV”) as of the close of business, on the valuation date. Exchange-traded funds and closed-end investment companies are valued at the last quoted sale price.
Exchange-traded options are valued at the mean of the bid and ask prices on the principal exchange on which they are traded. Over-the-counter (“OTC”) options are valued using a price provided by a pricing service.
Investments for which market quotations are not readily available are fair-valued as determined in good faith by Guggenheim Funds Investment Advisors, LLC (“GFIA” or the “Adviser”), subject to review and approval by the Valuation Committee, pursuant to methods established or ratified by the Board. Valuations in accordance with these methods are intended to reflect each security’s (or asset’s or liability’s) “fair value”. Each such determination is based on a consideration of all relevant factors, which are likely to vary from one pricing context to another. Examples of such factors may include, but are not limited to market prices; sale prices; broker quotes; and models which derive prices based on inputs such as prices of securities with comparable maturities and characteristics, or based on inputs such as anticipated cash flows or collateral, spread over U.S. Treasury securities, and other information analysis.
(b) Investment Transactions and Investment Income
Investment transactions are accounted for on the trade date. Realized gains and losses on investments are determined on the identified cost basis. Proceeds from lawsuits related to investment holdings are recorded as realized gains in the Fund. Dividend income is recorded on the ex-dividend date, net of applicable taxes withheld by foreign countries, if any. Taxable non-cash dividends are recorded as dividend income. Interest income, including amortization of premiums and accretion of discounts, is accrued on a daily basis. Dividend income from Real Estate Investment Trusts (“REITs”) is recorded based on the income included in the distributions received from the REIT investments using published REIT classifications, including some management estimates when actual amounts are not available. Distributions received in excess of this estimated amount are recorded as a reduction of the cost of investments or reclassified to capital gains. The actual amounts of income, return of capital, and capital gains are only determined by each REIT after its fiscal year-end, and may differ from the estimated amounts.
(c) Currency Translations
The accounting records of the Fund are maintained in U.S. dollars. All assets and liabilities initially expressed in foreign currencies are converted into U.S. dollars at prevailing exchange rates. Purchases and sales of investment securities, dividend and interest income, and certain expenses are translated at the rates of exchange prevailing on the respective dates of such transactions. Changes in the relationship of these foreign currencies to the U.S. dollar can significantly affect the value of the investments and earnings of the Fund. Foreign investments may also subject the Fund
GPM l GUGGENHEIM ENHANCED EQUITY INCOME FUND ANNUAL REPORT l 37
| | |
| NOTES TO FINANCIAL STATEMENTS continued | December 31, 2019 |
to foreign government exchange restrictions, expropriation, taxation, or other political, social or economic developments, all of which could affect the market and/or credit risk of the investments.
The Fund does not isolate that portion of the results of operations resulting from changes in the foreign exchange rates on investments from the fluctuations arising from changes in the market prices of securities held. Such fluctuations are included with the net realized gain or loss and unrealized appreciation or depreciation on investments.
Reported net realized foreign exchange gains and losses arise from sales of foreign currencies and currency gains or losses realized between the trade and settlement dates on investment transactions. Net unrealized appreciation and depreciation arise from changes in the fair values of assets and liabilities other than investments in securities at the fiscal period end, resulting from changes in exchange rates.
(d) Distributions to Shareholders
The Fund declares and pays quarterly distributions to shareholders. Distributions to shareholders are recorded on the ex-dividend date. The amount and timing of distributions are determined in accordance with U.S. federal income tax regulations, which may differ from U.S. GAAP.
The Fund adopted a managed distribution policy (the “Distribution Policy”) effective with the June 30, 2017 distribution. Under the terms of the Distribution Policy, the Fund will pay a quarterly distribution in a fixed amount and will continue to do so until such amount is modified by the Board. If sufficient net investment income is not available, the distribution will be supplemented by short/long-term capital gains and, to the extent necessary, return of capital.
(e) Options
Upon the purchase of an option, the premium paid is recorded as an investment, the value of which is marked-to-market daily. If a purchased option expires, the Fund realizes a loss in the amount of the cost of the option. When the Fund enters into a closing sale transaction, it realizes a gain or loss depending on whether the proceeds from the closing sale transaction are greater or less than the cost of the option. If the Fund exercises a put option, it realizes a gain or loss from the sale of the underlying security and the proceeds from such sale will be decreased by the premium originally paid. When the Fund exercises a call option, the cost of the security purchased by the Fund upon exercise increases by the premium originally paid.
When the Fund writes (sells) an option, an amount equal to the premium received is entered in that Fund’s accounting records as an asset and equivalent liability. The amount of the liability is subsequently marked-to-market to reflect the current value of the option written. When a written option expires, or if the Fund enters into a closing purchase transaction, it realizes a gain (or loss if the cost of a closing purchase transaction exceeds the premium received when the option was sold).
(f) Indemnifications
Under the Fund’s organizational documents, its Trustees and Officers are indemnified against certain liabilities arising out of the performance of their duties to the Fund. In addition, throughout the normal course of business, the Fund enters into contracts that contain a variety of representations and warranties which provide general indemnifications. The Fund’s maximum
38 l GPM l GUGGENHEIM ENHANCED EQUITY INCOME FUND ANNUAL REPORT| | |
| NOTES TO FINANCIAL STATEMENTS continued | December 31, 2019 |
exposure under these arrangements is unknown, as this would involve future claims that may be made against the Fund and/or its affiliates that have not yet occurred. However, based on experience, the Fund expects the risk of loss to be remote.
Note 3 – Derivatives
As part of its investment strategy, the Fund utilizes a variety of derivative instruments. These investments involve, to varying degrees, elements of market risk and risks in excess of amounts recognized in the Statement of Assets and Liabilities. Valuation and accounting treatment of these instruments can be found under Significant Accounting Policies in Note 2 of these Notes to Financial Statements.
Derivatives are instruments whose values depend on, or are derived from, in whole or in part, the value of one or more other assets, such as securities, currencies, commodities or indices. Derivative instruments may be used to increase investment flexibility (including to maintain cash reserves while maintaining exposure to certain other assets), for risk management (hedging) purposes, to facilitate trading, to reduce transaction costs and to pursue higher investment returns. Derivative instruments may also be used to mitigate certain investment risks, such as foreign currency exchange rate risk, interest rate risk and credit risk. U.S. GAAP requires disclosures to enable investors to better understand how and why a Fund uses derivative instruments, how these derivative instruments are accounted for and their effects on the Fund’s financial position and results of operations.
The Fund utilized derivatives for the following purposes:
Hedge: an investment made in order to reduce the risk of adverse price movements in a security, by taking an offsetting position to protect against broad market moves.
Speculation: the use of an instrument to express macro-economic and other investment views.
Options Purchased and Written
A call option on a security gives the purchaser of the option the right to buy, and the writer of a call option the obligation to sell, the underlying security. The purchaser of a put option has the right to sell, and the writer of the put option the obligation to buy, the underlying security at any time during the option period. The risk associated with purchasing options is limited to the premium originally paid. As of December 31, 2019, there were no options purchased outstanding.
The risk in writing a call option is that a Fund may incur a loss if the market price of the underlying security increases and the option is exercised. The risk in writing a put option is that a Fund may incur a loss if the market price of the underlying security decreases and the option is exercised. In addition, there may be an imperfect correlation between the movement in prices of options and the underlying securities where a Fund may not be able to enter into a closing transaction because of an illiquid secondary market; or, for OTC options, a Fund may be at risk because of the counterparty’s inability to perform.
GPM l GUGGENHEIM ENHANCED EQUITY INCOME FUND ANNUAL REPORT l 39
| | |
| NOTES TO FINANCIAL STATEMENTS continued | December 31, 2019 |
The following table represents the Fund’s use and volume of call/put options written on a monthly basis:
| | | |
| | Average |
| Use | | Notional Amount |
| Call | Put |
Hedge, Speculation | $342,776,048 | $ — |
Derivative Investment Holdings Categorized by Risk Exposure
The following is a summary of the location of derivative investments on the Fund’s Statement of Assets and Liabilities as of December 31, 2019:
| | |
| Derivative Investment Type | Liability Derivatives |
Equity Contracts | Options written, at value |
The following table sets forth the fair value of the Fund’s derivative investments categorized by primary risk exposure at December 31, 2019:
| |
| Liability Derivative Investments Value |
| Options Written |
| Equity Risk |
| $4,714,065 |
The following is a summary of the location of derivative investments on the Fund’s Statement of Operations for the year ended December 31, 2019:
| | |
| Derivative Investment Type | Location of Gain (Loss) on Derivatives |
Equity Contracts | Net realized gain (loss) on options written Net change in unrealized appreciation (depreciation) on options written |
The following is a summary of the Fund’s realized gain (loss) and change in unrealized appreciation (depreciation) on derivative investments recognized on the Statement of Operations categorized by primary risk exposure for the year ended December 31, 2019:
| |
| Realized Gain (Loss) on Derivative Investments Recognized on the Statement of Operations |
| Options Written |
| Equity Risk |
| ($40,264,445) |
| Change in Unrealized Appreciation (Depreciation) on Derivative Investments |
| Recognized on the Statement of Operations |
| Options Written |
| Equity Risk |
| $3,925,381 |
In conjunction with the use of derivative instruments, the Fund is required to maintain collateral in various forms. Depending on the financial instrument utilized and the broker involved, the Fund uses margin deposits at the broker, cash and/or securities segregated at the custodian bank, discount notes or repurchase agreements allocated to the Fund as collateral.
The Fund has established counterparty credit guidelines and enters into transactions only with financial institutions of investment grade or better. The Fund monitors the counterparty credit risk.
40 l GPM l GUGGENHEIM ENHANCED EQUITY INCOME FUND ANNUAL REPORT| | |
| NOTES TO FINANCIAL STATEMENTS continued | December 31, 2019 |
Note 4 – Offsetting
In the normal course of business, the Fund enters into transactions subject to enforceable master netting arrangements or other similar arrangements. Generally, the right to offset in those agreements allows the Fund to counteract the exposure to a specific counterparty with collateral received from or delivered to that counterparty based on the terms of the arrangements. These arrangements provide for the right to liquidate upon the occurrence of an event of default, credit event upon merger or additional termination event.
In order to better define its contractual rights and to secure rights that will help the Fund mitigate its counterparty risk, the Fund may enter into an International Swaps and Derivatives Association, Inc. Master Agreement (“ISDA Master Agreement”) or similar agreement with its derivative contract counterparties. An ISDA Master Agreement is a bilateral agreement between a fund and a counterparty that governs over-the-counter (“OTC”) derivatives, including foreign exchange contracts, and typically contains, among other things, collateral posting terms and netting provisions in the event of a default and/or termination event. The provisions of the ISDA Master Agreement typically permit a single net payment in the event of a default (close-out netting) or similar event, including the bankruptcy or insolvency of the counterparty.
For derivatives traded under an ISDA Master Agreement, the collateral requirements are typically calculated by netting the mark-to-market amount for each transaction under such agreement and comparing that amount to the value of any collateral currently pledged by the Fund and the counterparty. For financial reporting purposes, cash collateral that has been pledged to cover obligations of the Fund and cash collateral received from the counterparty, if any, are reported separately on the Consolidated Statement of Assets and Liabilities as segregated cash with broker/receivable for variation margin, or payable for swap settlement/variation margin. Cash and/or securities pledged or received as collateral by the Fund in connection with an OTC derivative subject to an ISDA Master Agreement generally may not be invested, sold or rehypothecated by the counterparty or the Fund, as applicable, absent an event of default under such agreement, in which case such collateral generally may be applied towards obligations due to and payable by such counterparty or the Fund, as applicable. Generally, the amount of collateral due from or to a counterparty must exceed a minimum transfer amount threshold (e.g., $300,000) before a transfer is required to be made. To the extent amounts due to the Fund from its counterparties are not fully collateralized, contractually or otherwise, the Fund bears the risk of loss from counterparty nonperformance. The Fund attempts to mitigate counterparty risk by only entering into agreements with counterparties that they believe to be of good standing and by monitoring the financial stability of those counterparties.
For financial reporting purposes, the Fund does not offset derivative assets and derivative liabilities that are subject to netting arrangements in the Statement of Assets and Liabilities. The Fund does not have any derivative financial instruments that are subject to enforceable master netting arrangements as of December 31, 2019.
The Fund has the right to offset deposits against any related derivative liabilities outstanding with each counterparty with the exception of exchange-traded or centrally-cleared derivatives. The Fund does not have any deposits held by others in connection with derivative investments as of December 31, 2019.
GPM l GUGGENHEIM ENHANCED EQUITY INCOME FUND ANNUAL REPORT l 41
| | |
| NOTES TO FINANCIAL STATEMENTS continued | December 31, 2019 |
Note 5 – Fees and Other Transactions with Affiliates
Pursuant to an Investment Advisory Agreement between the Fund and the Adviser, the Adviser furnishes offices, necessary facilities and equipment, provides administrative services, oversees the activities of Guggenheim Partners Investment Management, LLC (“GPIM” or “Sub-Adviser”), provides personnel including certain officers required for the Fund’s administrative management and compensates the officers and trustees of the Fund who are affiliates of the Adviser. Both GFIA and GPIM are indirect wholly-owned subsidiaries of Guggenheim Partners, LLC (“Guggenheim”), a global diversified financial services firm.
Pursuant to a Sub-Advisory Agreement among the Fund, the Adviser and GPIM, GPIM under the supervision of the Board and the Adviser, provides a continuous investment program for the Fund’s portfolio; provides investment research; makes and executes recommendations for the purchase and sale of securities; and provides certain facilities and personnel.
Under the Advisory Agreement, GFIA is entitled to receive an investment advisory fee at an annual rate equal to 0.80% of the average daily value of the Fund’s total managed assets. Pursuant to the Sub-Advisory Agreement, the Adviser pays to GPIM a sub-advisory fee equal to 0.40% of the average daily value of the Fund’s total managed assets.
For purposes of calculating the fees payable under the foregoing agreements, average daily managed assets means the average daily value of the Fund’s total assets minus the sum of its accrued liabilities. Total assets means all of the Fund’s assets and is not limited to its investment securities. Accrued liabilities means all of the Fund’s liabilities other than borrowings for investment purposes.
Certain officers and trustees of the Fund may also be officers, directors and/or employees of the Adviser or GPIM. The Fund does not compensate its officers who are officers, directors and/or employees of the aforementioned firms.
MUFG Investor Services (US), LLC (“MUIS”) acts as the Fund’s administrator and accounting agent. As administrator and accounting agent, MUIS maintains the books and records of the Fund’s securities and cash. The Bank of New York Mellon Corp. (“BNY”) acts as the Fund’s custodian. As custodian, BNY is responsible for the custody of the Fund’s assets. For providing the aforementioned services, MUIS and BNY are entitled to receive a monthly fee equal to an annual percentage of the Fund’s average daily managed assets subject to certain minimum monthly fees and out of pocket expenses.
Note 6 – Fair Value Measurement
In accordance with U.S. GAAP, fair value is defined as the price that the Fund would receive to sell an investment or pay to transfer a liability in an orderly transaction with an independent buyer in the principal market, or in the absence of a principal market, the most advantageous market for the investment or liability. U.S. GAAP establishes a three-tier fair value hierarchy based on the types of inputs used to value assets and liabilities and requires corresponding disclosure. The hierarchy and the corresponding inputs are summarized below:
Level 1 — quoted prices in active markets for identical assets or liabilities.
Level 2 — significant other observable inputs (for example quoted prices for securities that are similar based on characteristics such as interest rates, prepayment speeds, credit risk, etc.).
42 l GPM l GUGGENHEIM ENHANCED EQUITY INCOME FUND ANNUAL REPORT| | |
| NOTES TO FINANCIAL STATEMENTS continued | December 31, 2019 |
Level 3 — significant unobservable inputs based on the best information available under the circumstances, to the extent observable inputs are not available, which may include assumptions.
The types of inputs available depend on a variety of factors, such as the type of security and the characteristics of the markets in which it trades, if any. Fair valuation determinations that rely on fewer or no observable inputs require greater judgment. Accordingly, fair value determinations for Level 3 securities require the greatest amount of judgment.
Independent pricing services are used to value a majority of the Fund’s investments. When values are not available from a pricing service, they will be determined under the valuation policies that have been reviewed and approved by the Board. In any event, values are determined using a variety of sources and techniques, including: market prices; broker quotes; and models which derive prices based on inputs such as prices of securities with comparable maturities and characteristics or based on inputs such as anticipated cash flows or collateral, spread over U.S. Treasury securities, and other information and analysis.
The inputs or methodologies used for valuing securities are not necessarily an indication of the risk associated with investing in those securities. The suitability of the techniques and sources employed to determine fair valuation are regularly monitored and subject to change.
Note 7 – Borrowings
The Fund has entered into a $250,000,000 committed credit facility agreement with an approved lender whereby the lender has agreed to provide secured financing to the Fund and the Fund agreed to provide the pledged collateral to the lender. Interest on the amount borrowed is based on the 1-month LIBOR plus 0.75%. As of December 31, 2019, there was $175,000,000 outstanding in connection with the Fund’s credit facility. The average daily amount of the borrowings on the credit facility during the year ended December 31, 2019, was $170,287,671 with a related average interest rate of 3.01%. The maximum amount outstanding during the year was $177,000,000. As of December 31, 2019, the market value of the securities segregated as collateral is $247,357,359.
The credit facility agreement governing the loan facility includes usual and customary covenants. These covenants impose on the Fund asset coverage requirements, collateral requirements, investment strategy requirements, and certain financial obligations. These covenants place limits or restrictions on the Fund’s ability to (i) enter into additional indebtedness with a party, other than to the counterparty, (ii) change its fundamental investment policy, or (iii) pledge to any other party, other than to the counterparty, securities owned or held by the Fund over which the counterparty has a lien. In addition, the Fund is required to deliver financial information to the counterparty within established deadlines, maintain an asset coverage ratio (as defined in Section 18(g) of the 1940 Act) greater than 300%, comply with the rules of the stock exchange on which its shares are listed, and maintain its classification as a “closed-end management investment company” as defined in the 1940 Act.
There is no guarantee that the Fund’s leverage strategy will be successful. The Fund’s use of leverage may cause the Fund’s NAV and market price of common shares to be more volatile and can magnify the effect of any losses.
GPM l GUGGENHEIM ENHANCED EQUITY INCOME FUND ANNUAL REPORT l 43
| | |
| NOTES TO FINANCIAL STATEMENTS continued | December 31, 2019 |
Note 8 – Federal Income Tax Information
The Fund intends to comply with the provisions of Subchapter M of the Internal Revenue Code applicable to regulated investment companies and will distribute substantially all taxable net investment income and capital gains sufficient to relieve the Fund from all, or substantially all, federal income, excise and state income taxes. Therefore, no provision for federal or state income tax or federal excise tax is required.
Tax positions taken or expected to be taken in the course of preparing the Fund’s tax returns are evaluated to determine whether the tax positions are “more-likely-than-not” of being sustained by the applicable tax authority. Tax positions not deemed to meet the more-likely-than-not threshold would be recorded as a tax benefit or expense in the current year. Management has analyzed the Fund’s tax positions taken, or to be taken, on U.S. federal income tax returns for all open tax years, and has concluded that no provision for income tax is required in the Fund’s financial statements. The Fund’s U.S. federal income tax returns are subject to examination by the Internal Revenue Service for a period of three years after they are filed.
The tax character of distributions paid during the year ended December 31, 2019 was as follows:
| | | | |
| Ordinary | Long-Term | Return | Total |
| Income | Capital Gain | of Capital | Distributions |
| $ – | $ – | $46,269,806 | $46,269,806 |
The tax character of distributions paid during the year ended December 31, 2018 was as follows:
| | | | |
| Ordinary | Long-Term | Return | Total |
| Income | Capital Gain | of Capital | Distributions |
| $1,374,019 | $29,092,699 | $15,695,856 | $46,162,574 |
Note: For U.S. federal income tax purposes, short-term capital gain distributions are treated as ordinary income distributions.
The tax components of distributable earnings/(loss) as of December 31, 2019 were as follows:
| | | | | |
| Undistributed | Undistributed | Net Unrealized | Accumulated | |
| Ordinary | Long-Term | Appreciation | Capital and | |
| Income | Capital Gain | (Depreciation) | Other Losses | Total |
| $ – | $ – | $69,952,849 | $(7,505,897) | $62,446,952 |
For U.S. federal income tax purposes, capital loss carryforwards represent realized losses of the Fund that may be carried forward and applied against future capital gains. Under the RIC Modernization Act of 2010, the Fund is permitted to carry forward capital losses incurred in taxable years beginning after December 22, 2010 for an unlimited period and such capital loss carryforwards will retain their character as either short-term or long-term capital losses. As of December 31, 2019, capital loss carryforwards for the Fund were as follows:
| | | | |
| | | Total |
| Unlimited | Capital Loss |
| | Long-Term | Carryforward |
| | $ – | $(6,404,457) |
44 l GPM l GUGGENHEIM ENHANCED EQUITY INCOME FUND ANNUAL REPORT| | |
| NOTES TO FINANCIAL STATEMENTS continued | December 31, 2019 |
Net investment income and net realized gains (losses) may differ for financial statement and tax purposes because of temporary or permanent book/tax differences. These differences are primarily due to investments in real estate investment trusts, losses deferred due to wash sales, return of capital distributions received, losses deferred due to straddles, and the “mark-to-market” of certain derivatives. Additional differences may result from the tax treatment of net operating losses. To the extent these differences are permanent and would require a reclassification between Paid in Capital and Total Distributable Earnings (Loss), such reclassifications are made in the period that the differences arise. These reclassifications have no effect on net assets or NAV per share.
The following adjustments were made on the Statement of Assets and Liabilities as of December 31, 2019 for permanent book/tax differences:
| | |
| Total |
| Paid In | Distributable |
| Capital | Earnings/(Loss) |
| $(77,273) | $77,273 |
At December 31, 2019, the cost of investments for U.S. federal income tax purposes, the aggregate gross unrealized appreciation for all investments for which there was an excess of value over tax cost and the aggregate gross unrealized depreciation for all investments for which there was an excess of tax cost over value, were as follows:
| | | | |
| Tax | Tax | Net Unrealized |
| Tax | Unrealized | Unrealized | Appreciation/ |
| Cost | Appreciation | Depreciation | (Depreciation) |
| $494,080,579 | $95,469,322 | $(25,516,473) | $69,952,849 |
Note 9 – Securities Transactions
For the year ended December 31, 2019, the cost of purchases and proceeds from sales of investment securities, excluding short-term investments and derivative transactions, were as follows:
| | |
| Purchases | Sales |
| $118,205,266 | $178,718,124 |
Note 10 – Capital
Common Shares
The Fund has unlimited amount of common shares, $0.01 par value, authorized 48,342,587 shares issued and outstanding. Transactions in common shares were as follows:
| | | |
| Year Ended | Year Ended |
| December 31, 2019 | December 31, 2018 |
Beginning shares | 48,133,460 | 48,036,872 |
Shares issued through dividend reinvestment | 209,127 | 96,588 |
Ending shares | 48,342,587 | 48,133,460 |
GPM l GUGGENHEIM ENHANCED EQUITY INCOME FUND ANNUAL REPORT l 45
| | |
| NOTES TO FINANCIAL STATEMENTS continued | December 31, 2019 |
Note 11 – Recent Accounting Pronouncements
In August 2018, the Financial Accounting Standards Board issued an Accounting Standards Update, ASU 2018-13, Fair Value Measurement (Topic 820), Disclosure Framework - Changes to the Disclosure Requirements for Fair Value Measurement (the “2018 ASU”) which adds, modifies and removes disclosure requirements related to certain aspects of fair value measurement. The 2018 ASU is effective for fiscal years, and interim periods within those fiscal years, beginning after December 15, 2019. Early adoption is permitted. As of December 31, 2019, the Fund has fully adopted the provisions of the 2018 ASU, which did not have a material impact on the Fund’s financial statements and related disclosures or impact the Fund’s net assets or results of operations.
Note 12 – Subsequent Events
The Fund evaluated subsequent events through the date the financial statements were available for issue and determined there were no material events that would require adjustment to or disclosure in the Fund’s financial statements.
46 l GPM l GUGGENHEIM ENHANCED EQUITY INCOME FUND ANNUAL REPORT| | |
| REPORT OF INDEPENDENT REGISTERED PUBLIC ACCOUNTING FIRM | December 31, 2019 |
To the Shareholders and the Board of Trustees of Guggenheim Enhanced Equity Income Fund
Opinion on the Financial Statements
We have audited the accompanying statement of assets and liabilities of Guggenheim Enhanced Equity Income Fund (the “Fund”), including the schedule of investments, as of December 31, 2019, and the related statements of operations and cash flows for the year then ended, the statements of changes in net assets for each of the two years in the period then ended, the financial highlights for each of the five years in the period then ended and the related notes (collectively referred to as the “financial statements”). In our opinion, the financial statements present fairly, in all material respects, the financial position of the Fund at December 31, 2019, the results of its operations and its cash flows for the year then ended, the changes in its net assets for each of the two years in the period then ended and its financial highlights for each of the five years in the period then ended, in conformity with U.S. generally accepted accounting principles.
Basis for Opinion
These financial statements are the responsibility of the Fund’s management. Our responsibility is to express an opinion on the Fund’s financial statements based on our audits. We are a public accounting firm registered with the Public Company Accounting Oversight Board (United States) (“PCAOB”) and are required to be independent with respect to the Fund in accordance with the U.S. federal securities laws and the applicable rules and regulations of the Securities and Exchange Commission and the PCAOB.
We conducted our audits in accordance with the standards of the PCAOB. Those standards require that we plan and perform the audit to obtain reasonable assurance about whether the financial statements are free of material misstatement, whether due to error or fraud. The Fund is not required to have, nor were we engaged to perform, an audit of the Fund’s internal control over financial reporting. As part of our audits, we are required to obtain an understanding of internal control over financial reporting, but not for the purpose of expressing an opinion on the effectiveness of the Fund’s internal control over financial reporting. Accordingly, we express no such opinion.
Our audits included performing procedures to assess the risks of material misstatement of the financial statements, whether due to error or fraud, and performing procedures that respond to those risks. Such procedures included examining, on a test basis, evidence regarding the amounts and disclosures in the financial statements. Our procedures included confirmation of securities owned as of December 31, 2019, by correspondence with the custodian. Our audits also included evaluating the accounting principles used and significant estimates made by management, as well as evaluating the overall presentation of the financial statements. We believe that our audits provide a reasonable basis for our opinion.
We have served as the auditor of one or more Guggenheim investment companies since 1979.
Tysons, Virginia
February 27, 2020
GPM l GUGGENHEIM ENHANCED EQUITY INCOME FUND ANNUAL REPORT l 47
| | |
| OTHER INFORMATION (Unaudited) | December 31, 2019 |
Expense Ratio Information
The expense ratios shown on the Financial Highlights page of this report do not reflect fees and expenses incurred indirectly by the Fund as a result of its investments in shares of other investment companies. If these fees were included in the expense ratio, the expense ratio would increase by 0.04% for the year ended December 31, 2019.
Federal Income Tax Information
This information is being provided as required by the Internal Revenue Code.
In January 2020, shareholders will be advised on IRS Form 1099 DIV or substitute 1099 DIV as to the federal tax status of the distributions received by shareholders in the calendar year 2019.
Sector Classification
Information in the “Schedule of Investments” is categorized by sectors using sector-level classifications used by Bloomberg Industry Classification System, a widely recognized industry classifica -tion system provider. In the Fund’s registration statement, the Fund has investment policies relating to concentration in specific industries. For purposes of these investment policies, the Fund usually classifies industries based on industry-level classifications used by widely recognized industry classification system providers such as Bloomberg Industry Classification System, Global Industry Classification Standards and Barclays Global Classification Scheme.
Trustees
The Trustees of the Guggenheim Enhanced Equity Income Fund and their principal business occupations during the past five years:
| | | | | | |
| | | | Number of | |
| Position(s) | Term of Office | | Portfolios in | |
| Name, Address* | Held | and Length of | Principal Occupation(s) | Fund Complex | Other Directorships |
| and Year of Birth | with Trust | Time Served** | During Past Five Years | Overseen | Held by Trustees |
Independent Trustees:
|
| Randall C. Barnes | Trustee | Since 2005 | Current: Private Investor (2001-present). | 157 | Current: Trustee, Purpose Investments |
(1951) | | | | | Funds (2013-present). |
| | | Former: Senior Vice President and Treasurer, PepsiCo, Inc. (1993-1997); | | |
| | | President, Pizza Hut International (1991-1993); Senior Vice President, | | Former: Managed Duration Investment |
| | | Strategic Planning and New Business Development, PepsiCo, Inc. (1987-1990). | | Grade Municipal Fund (2003-2016). |
| Angela | Trustee | Since 2019 | Current: Founder and Chief Executive Officer, B.O.A.R.D.S (2013-present). | 156 | Current: Hunt Companies, Inc. |
Brock-Kyle
| | | | | (2019-present). |
| | | Former: Senior Leader, TIAA (1987-2012). | | |
| | | | | Former: Infinity Property & Casualty |
| | | | | Corp. (2014-2018). |
48 l GPM l GUGGENHEIM ENHANCED EQUITY INCOME FUND ANNUAL REPORT| | |
| OTHER INFORMATION (Unaudited) continued | December 31, 2019 |
| | | | | | |
| | | | Number of | |
| Position(s) | Term of Office | | Portfolios in | |
| Name, Address* | Held | and Length of | Principal Occupation(s) | Fund Complex | Other Directorships |
| and Year of Birth | with Trust | Time Served** | During Past Five Years | Overseen | Held by Trustees |
| Independent Trustees continued: |
Donald A.
| Trustee and
| Since 2014 | Current: Retired. | 156 | Former: Midland Care, Inc. (2011-2016). |
Chubb, Jr.
| Chairman of | | | | |
| the Valuation | | Former: Business broker and manager of commercial real estate, Griffith & | | |
| Oversight | | Blair, Inc. (1997-2017). | | |
| Committee | | | | |
| Jerry B. Farley | Trustee and | Since 2014 | Current: President, Washburn University (1997-present). | 156 | Current: CoreFirst Bank & Trust |
(1946) | Chairman of | | | | (2000-present). |
| the Audit | | | | |
| Committee | | | | Former: Westar Energy, Inc. |
| | | | | | (2004-2018).
|
| Roman | Trustee and | Since 2011 | Current: Founder and Managing Partner, Roman Friedrich & Company | 156 | Former: Zincore Metals, Inc. |
Friedrich III
| Chairman of | | (1998-present). | | (2009- 2019). |
| the Contracts | |
| | |
| Review | |
| | |
| Committee | | | | |
Thomas F.
| Trustee and | Since 2019 | Current: President, Global Trends Investments (1996-present); Co-Chief | 156 | Current: US Global Investors (GROW) |
| Lydon, Jr. | Vice Chairman | | Executive Officer, ETF Flows, LLC (2019-present); Chief Executive | | (1995-present). |
| of the Contracts | | Officer, Lydon Media (2016-present). | | |
| Review | | | | Former: Harvest Volatility Edge |
| Committee | | | | Trust (3) (2017-2019). |
| Ronald A. Nyberg | Trustee and | Since 2005 | Current: Partner, Momkus, LLC (2016-present). | 157 | Current: PPM Funds (9) (2018-present); |
(1953) | Chairman of | | | | Edward-Elmhurst Healthcare System |
| the Nominating | | Former: Partner, Nyberg & Cassioppi, LLC (2000-2016); Executive Vice | | (2012-present); Western Asset Inflation- |
| and Governance | | President, General Counsel, and Corporate Secretary, Van Kampen | | Linked Opportunities & Income Fund |
| Committee | | Investments (1982-1999). | | (2004 – present); Western Asset |
| | | | | Inflation-Linked Income Fund (2003- |
| | | | | present). |
|
| | | | | Former: Managed Duration Investment |
| | | | | Grade Municipal Fund (2003-2016). |
GPM l GUGGENHEIM ENHANCED EQUITY INCOME FUND ANNUAL REPORT l 49
| | |
| OTHER INFORMATION (Unaudited) continued | December 31, 2019 |
| | | | | | |
| | | | Number of | |
| Position(s) | Term of Office | | Portfolios in | |
| Name, Address* | Held | and Length of | Principal Occupation(s) | Fund Complex | Other Directorships |
| and Year of Birth | with Trust | Time Served** | During Past Five Years | Overseen | Held by Trustees |
Independent Trustees continued:
|
| Sandra G. | Trustee | Since 2019 | Current: Retired. | 156 | Current: SPDR Series Trust (78) (2018- |
Sponem
| | | | | present); SPDR Index Shares Funds |
| | | Former: Senior Vice President and Chief Financial Officer, M.A. Mortenson | | (31) (2018-present); SSGA Active |
| | | Companies, Inc. (2007-2017). | | Trust (12) (2018-present); and SSGA
|
| | | | | Master Trust (1) (2018-present). |
| Ronald E. | Trustee, | Since 2005 | Current: Portfolio Consultant (2010-present); Member, Governing Council, | 156 | Current: Western Asset Inflation-Linked |
Toupin, Jr.
| Chairman of | | Independent Directors Council (2013-present); Governor, Board of Governors, | | Opportunities & Income Fund (2004- |
(1958)
| the Board | | Investment Company Institute (2018-present). | | present); Western Asset Inflation-Linked |
| and | | | | Income Fund (2003-present). |
| Chairman of | | Former: Member, Executive Committee, Independent Directors Council | | |
| the Executive | | (2016-2018); Vice President, Manager and Portfolio Manager, Nuveen Asset | | Former: Managed Duration Investment |
| Committee | | Management (1998-1999); Vice President, Nuveen Investment Advisory Corp. | | Grade Municipal Fund (2003-2016); |
| | | (1992-1999); Vice President and Manager, Nuveen Unit Investment Trusts | | |
| | | (1991-1999); and Assistant Vice President and Portfolio Manager, Nuveen | | |
| Unit Investment Trusts (1988-1999), each of John Nuveen & Co., Inc. (1982-1999). | | |
Interested Trustee:
|
| Amy J. Lee*** | Trustee, | Since 2018 | Current: Interested Trustee, certain other funds in the Fund Complex | 156 | None. |
(1961) | Vice President | (Trustee) | (2018-present); Chief Legal Officer, certain other funds in the Fund | | |
| and Chief | | Complex (2014-present); Vice President, certain other funds in the | | |
| Legal Officer | Since 2014 | Fund Complex (2007-present); Senior Managing Director, | | |
| | (Chief Legal | Guggenheim Investments (2012-present). | | |
| | Officer) | | | |
| | | Former: President and Chief Executive Officer, certain other funds in | | |
| | Since 2012 | the Fund Complex (2017-2019); Vice President, Associate General Counsel | | |
| | (Vice President) | and Assistant Secretary, Security Benefit Life Insurance Company and | | |
| | | Security Benefit Corporation (2004-2012). | | |
50 l GPM l GUGGENHEIM ENHANCED EQUITY INCOME FUND ANNUAL REPORT| | |
| OTHER INFORMATION (Unaudited) continued | December 31, 2019 |
| | |
| * | The business address of each Trustee is c/o Guggenheim Investments, 227 West Monroe Street, Chicago, IL 60606. |
| ** | Each Trustee serves an indefinite term, until his successor is duly elected and qualified. |
| | —Messrs. Barnes, Chubb and Ms. Brock-Kyle are Class I Trustees. The Class I Trustees are expected to stand for re-election at the Fund’s annual meeting of shareholders for the fiscal year ending December 31, 2020. |
| | —Messrs. Farley, Friedrich, Lydon, Jr. and Nyberg, are Class II Trustees. The Class II Trustees are expected to stand for re-election at the Fund’s annual meeting of share- holders for the fiscal year ending December 31, 2021. |
| | —Messr. Toupin and Mses. Lee and Sponem are Class III Trustees. The Class III Trustees are expected to stand for re-election at the Fund’s annual meeting of shareholders for the fiscal year ending December 31, 2022. |
***
| This Trustee is deemed to be an “interested person” of the Fund under the 1940 Act by reason of her position with the Fund’s Adviser and/or the parent of the Adviser. |
GPM l GUGGENHEIM ENHANCED EQUITY INCOME FUND ANNUAL REPORT l 51
| | |
| OTHER INFORMATION (Unaudited) continued | December 31, 2019 |
Officers
The Officers of the Guggenheim Enhanced Equity Income Fund, who are not Trustees, and their principal occupations during the past five years:
| | | | |
| Name, Address* | Position(s) held | Term of Office and | Principal Occupations |
| and Year of Birth | with the Trust | Length of Time Served** | During Past Five Years |
Officers:
|
| Brian E. Binder | President | Since 2018 | Current: President and Chief Executive Officer, certain other funds in the Fund Complex (2018-present); |
(1972) | and Chief | | President, Chief Executive Officer and Chairman of the Board of Managers, Guggenheim Funds Invest- |
| Executive Officer | | ment Advisors, LLC (2018-present); President and Chief Executive Officer, Security Investors, LLC (2018- |
| | | present); Board Member of Guggenheim Partners Fund Management (Europe) Limited (2018-present); |
| | | Senior Managing Director and Chief Administrative Officer, Guggenheim Investments (2018-present). |
|
| | | Former: Managing Director and President, Deutsche Funds, and Head of US Product, Trading and |
| | | Fund Administration, Deutsche Asset Management (2013-2018); Managing Director, Head of Business |
| | | Management and Consulting, Invesco Ltd. (2010-2012). |
| Joanna M. | Chief Compliance | Since 2012 | Current: Chief Compliance Officer, certain funds in the Fund Complex (2012-present); Senior Managing |
Catalucci
| Officer | | Director, Guggenheim Investments (2014-present). |
(1966)
| | | |
|
| | | Former: AML Officer, certain funds in the Fund Complex (2016-2017); Chief Compliance Officer and |
| | | Secretary, certain other funds in the Fund Complex (2008-2012); Senior Vice President & Chief |
| | | Compliance Officer, Security Investors, LLC and certain affiliates (2010-2012); Chief Compliance Officer |
| | | and Senior Vice President, Rydex Advisors, LLC and certain affiliates (2010-2011). |
| James M. Howley | Assistant Treasurer | Since 2006 | Current: Managing Director, Guggenheim Investments (2004-present); Assistant Treasurer, certain |
(1972) | | | other funds in the Fund Complex (2006-present). |
|
| | | Former: Manager, Mutual Fund Administration of Van Kampen Investments, Inc. (1996-2004). |
| Mark E. Mathiasen | Secretary | Since 2007 | Current: Secretary, certain other funds in the Fund Complex (2007-present); Managing Director, |
(1978) | | | Guggenheim Investments (2007-present). |
| Glenn McWhinnie | Assistant Treasurer | Since 2016 | Current: Vice President, Guggenheim Investments (2009-present); Assistant Treasurer, certain other |
(1969) | | | funds in the Fund Complex (2016-present). |
| Michael P. Megaris | Assistant Secretary | Since 2014 | Current: Assistant Secretary, certain other funds in the Fund Complex (2014-present); Director, |
(1984) | | | Guggenheim Investments (2012-present). |
52 l GPM l GUGGENHEIM ENHANCED EQUITY INCOME FUND ANNUAL REPORT| | |
| OTHER INFORMATION (Unaudited) continued | December 31, 2019 |
| | | | |
| Name, Address* | Position(s) held | Term of Office and | Principal Occupations |
| and Year of Birth | with the Trust | Length of Time Served** | During Past Five Years |
Officers continued:
|
| William Rehder | Assistant Vice | Since 2018 | Current: Managing Director, Guggenheim Investments (2002-present). |
(1967) | President | | |
| Kimberly J. Scott | Assistant Treasurer | Since 2012 | Current: Director, Guggenheim Investments (2012-present); Assistant Treasurer, certain other funds in |
(1974) | | | the Fund Complex (2012-present). |
|
| | | Former: Financial Reporting Manager, Invesco, Ltd. (2010-2011); Vice President/Assistant Treasurer, |
| | | Mutual Fund Administration for Van Kampen Investments, Inc./Morgan Stanley Investment |
| | | Management (2009-2010); Manager of Mutual Fund Administration, Van Kampen Investments, |
| | | Inc./Morgan Stanley Investment Management (2005-2009). |
| Bryan Stone | Vice President | Since 2014 | Current: Vice President, certain other funds in the Fund Complex (2014-present); Managing Director, |
(1979) | | | Guggenheim Investments (2013-present). |
|
| | | Former: Senior Vice President, Neuberger Berman Group LLC (2009-2013); Vice President, Morgan |
| | | Stanley (2002-2009). |
| John L. Sullivan | Chief Financial | Since 2010 | Current: Chief Financial Officer, Chief Accounting Officer and Treasurer, certain other funds in the Fund |
(1955) | Officer, Chief | | Complex (2010-present); Senior Managing Director, Guggenheim Investments (2010-present). |
| Accounting Officer | | |
| and Treasurer | | Former: Managing Director and Chief Compliance Officer, each of the funds in the Van Kampen |
| | | Investments fund complex (2004-2010); Managing Director and Head of Fund Accounting and |
| | | Administration, Morgan Stanley Investment Management (2002-2004); Chief Financial Officer and |
| | | Treasurer, Van Kampen Funds (1996-2004). |
GPM l GUGGENHEIM ENHANCED EQUITY INCOME FUND ANNUAL REPORT l 53
| | |
| OTHER INFORMATION (Unaudited) continued | December 31, 2019 |
| | | | |
| Name, Address* | Position(s) held | Term of Office and | Principal Occupations |
| and Year of Birth | with the Trust | Length of Time Served** | During Past Five Years |
Officers continued:
|
| Jon Szafran | Assistant Treasurer | Since 2017 | Current: Vice President, Guggenheim Investments (2017-present); Assistant Treasurer, certain other |
(1989) | | | funds in the Fund Complex (2017-present). |
|
| | | Former: Assistant Treasurer of Henderson Global Funds and Manager of US Fund Administration, |
| | | Henderson Global Investors (North America) Inc. (“HGINA”), (2017); Senior Analyst of US Fund |
| | | Administration, HGINA (2014-2017); Senior Associate of Fund Administration, Cortland Capital Market |
| | | Services, LLC (2013-2014); Experienced Associate, PricewaterhouseCoopers LLP (2012-2013). |
| * | The business address of each officer is c/o Guggenheim Investments, 227 West Monroe Street, Chicago, IL 60606. |
| ** | Each officer serves an indefinite term, until his or her successor is duly elected and qualified. The date reflects the commencement date upon which the officer held any officer position with the Fund. |
54 l GPM l GUGGENHEIM ENHANCED EQUITY INCOME FUND ANNUAL REPORT| | |
| DIVIDEND REINVESTMENT PLAN (Unaudited) | December 31, 2019 |
Unless the registered owner of common shares elects to receive cash by contacting Computershare Trust Company, N.A. (the “Plan Administrator”), all dividends declared on common shares of the Fund will be automatically reinvested by the Plan Administrator for shareholders in the Fund’s Dividend Reinvestment Plan (the “Plan”), in additional common shares of the Fund. Participation in the Plan is completely voluntary and may be terminated or resumed at any time without penalty by notice if received and processed by the Plan Administrator prior to the dividend record date; otherwise such termination or resumption will be effective with respect to any subsequently declared dividend or other distribution. Some brokers may automatically elect to receive cash on your behalf and may re-invest that cash in additional common shares of the Fund for you. If you wish for all dividends declared on your common shares of the Fund to be automatically reinvested pursuant to the Plan, please contact your broker.
The Plan Administrator will open an account for each common shareholder under the Plan in the same name in which such common shareholder’s common shares are registered. Whenever the Fund declares a dividend or other distribution (together, a “Dividend”) payable in cash, nonparticipants in the Plan will receive cash and participants in the Plan will receive the equivalent in common shares. The common shares will be acquired by the Plan Administrator for the participants’ accounts, depending upon the circumstances described below, either (i) through receipt of additional unissued but authorized common shares from the Fund (“Newly Issued Common Shares”) or (ii) by purchase of outstanding common shares on the open market (“Open-Market Purchases”) on the New York Stock Exchange or elsewhere. If, on the payment date for any Dividend, the closing market price plus estimated brokerage commission per common share is equal to or greater than the net asset value per common share, the Plan Administrator will invest the Dividend amount in Newly Issued Common Shares on behalf of the participants. The number of Newly Issued Common Shares to be credited to each participant’s account will be determined by dividing the dollar amount of the Dividend by the net asset value per common share on the payment date; provided that, if the net asset value is less than or equal to 95% of the closing market value on the payment date, the dollar amount of the Dividend will be divided by 95% of the closing market price per common share on the payment date. If, on the payment date for any Dividend, the net asset value per common share is greater than the closing market value plus estimated brokerage commission, the Plan Administrator will invest the Dividend amount in common shares acquired on behalf of the participants in Open-Market Purchases.
If, before the Plan Administrator has completed its Open-Market Purchases, the market price per common share exceeds the net asset value per common share, the average per common share purchase price paid by the Plan Administrator may exceed the net asset value of the common shares, resulting in the acquisition of fewer common shares than if the Dividend had been paid in Newly Issued Common Shares on the Dividend payment date. Because of the foregoing difficulty with respect to Open-Market Purchases, the Plan provides that if the Plan Administrator is unable to invest the full Dividend amount in Open-Market Purchases during the purchase period or if the market discount shifts to a market premium during the purchase period, the Plan Administrator may cease making Open-Market Purchases and may invest the uninvested portion of the Dividend amount in Newly Issued Common Shares at net asset value per common share at the close of business on the Last Purchase Date provided that, if the net asset value is less than or equal to 95% of the then current market price per common share; the dollar amount of the Dividend will be divided by 95% of the market price on the payment date.
GPM l GUGGENHEIM ENHANCED EQUITY INCOME FUND ANNUAL REPORT l 55
| | |
| DIVIDEND REINVESTMENT PLAN (Unaudited) continued | December 31, 2019 |
The Plan Administrator maintains all shareholders’ accounts in the Plan and furnishes written confirmation of all transactions in the accounts, including information needed by shareholders for tax records. Common shares in the account of each Plan participant will be held by the Plan Administrator on behalf of the Plan participant, and each shareholder proxy will include those shares purchased or received pursuant to the Plan. The Plan Administrator will forward all proxy solicitation materials to participants and vote proxies for shares held under the Plan in accordance with the instruction of the participants.
There will be no brokerage charges with respect to common shares issued directly by the Fund. However, each participant will pay a pro rata share of brokerage commission incurred in connection with Open-Market Purchases. The automatic reinvestment of Dividends will not relieve participants of any Federal, state or local income tax that may be payable (or required to be withheld) on such Dividends.
The Fund reserves the right to amend or terminate the Plan. There is no direct service charge to participants with regard to purchases in the Plan; however, the Fund reserves the right to amend the Plan to include a service charge payable by the participants.
All correspondence or questions concerning the Plan should be directed to the Plan Administrator, Computershare Trust Company, N.A., P.O. Box 30170 College Station, TX 77842-3170: Attention: Shareholder Services Department, Phone Number: (866) 488-3559 or online at www.computershare.com/investor.
56 l GPM l GUGGENHEIM ENHANCED EQUITY INCOME FUND ANNUAL REPORT| | |
| FUND INFORMATION | December 31, 2019 |
| | |
Board of Trustees
Randall C. Barnes Angela Brock-Kyle Donald A. Chubb, Jr. Jerry B. Farley Roman Friedrich III Amy J. Lee* Thomas F. Lydon Jr. Ronald A. Nyberg Sandra G. Sponem Ronald E. Toupin, Jr., Chairman
* This Trustee is an “interested person” (as defined in Section 2(a)(19) of the 1940 Act) (“Interested Trustee”) of the Fund because of her position as President of the Investment Adviser and Sub-Adviser.
Principal Executive Officers
Brian E. Binder President and Chief Executive Officer
Joanna M. Catalucci Chief Compliance Officer
Amy J. Lee Vice President and Chief Legal Officer
Mark E. Mathiasen Secretary
John L. Sullivan Chief Financial Officer, Chief Accounting Officer and Treasurer | Investment Adviser Guggenheim Funds Investment Advisors, LLC Chicago, IL Investment Sub-Adviser Guggenheim Partners Investment Management, LLC Santa Monica, CA
Administrator and Accounting Agent MUFG Investor Services (US), LLC Rockville, MD
Custodian The Bank of New York Mellon Corp. New York, NY
Legal Counsel Dechert LLP Washington, D.C.
Independent Registered Public Accounting Firm Ernst & Young LLP Tysons, VA |
GPM l GUGGENHEIM ENHANCED EQUITY INCOME FUND ANNUAL REPORT l 57
| | |
| FUND INFORMATION continued | December 31, 2019 |
Privacy Principles of Guggenheim Enhanced Equity Income Fund for Shareholders
The Fund is committed to maintaining the privacy of its shareholders and to safeguarding its non-public personal information. The following information is provided to help you understand what personal information the Fund collects, how we protect that information and why, in certain cases, we may share information with select other parties.
Generally, the Fund does not receive any non-public personal information relating to its shareholders, although certain non-public personal information of its shareholders may become available to the Fund. The Fund does not disclose any non-public personal information about its shareholders or former shareholders to anyone except as permitted by law or as is necessary in order to service shareholder accounts (for example, to a transfer agent or third party administrator).
The Fund restricts access to non-public personal information about the shareholders to Guggenheim Funds Investment Advisors, LLC employees with a legitimate business need for the information. The Fund maintains physical, electronic and procedural safeguards designed to protect the non-public personal information of its shareholders.
Questions concerning your shares of Guggenheim Enhanced Equity Income Fund?
| • | If your shares are held in a Brokerage Account, contact your Broker. |
| • | If you have physical possession of your shares in certificate form, contact the Fund’s Transfer Agent:
Computershare Trust Company N.A., P.O. Box 30170 College Station, TX 77842-3170; (866) 488-3559 or online at www.computershare.com/investor |
This report is sent to shareholders of Guggenheim Enhanced Equity Income Fund for their information. It is not a Prospectus, circular or representation intended for use in the purchase or sale of shares of the Fund or of any securities mentioned in this report.
A description of the Fund’s proxy voting policies and procedures related to portfolio securities is available without charge, upon request, by calling the Fund at (888) 991-0091.
Information regarding how the Fund voted proxies for portfolio securities, if applicable, during the most recent 12-month period ended June 30, is also available, without charge and upon request by calling (888) 991-0091, by visiting the Fund’s website at guggenheiminvestments.com/fmo or by accessing the Fund’s Form N-PX on the U.S. Securities and Exchange Commission’s (SEC) website at www.sec.gov.
The Fund files its complete schedule of portfolio holdings with the SEC for the first and third quarters of each fiscal year on Form N-Q. The Fund’s Form N-Q is available on the SEC website at www.sec.gov or at guggenheiminvestments.com/gpm. The Fund’s Form N-Q may also be viewed and copied at the SEC’s Public Reference Room in Washington, DC; information on the operation of the Public Reference Room may be obtained by calling (800) SEC-0330.
Notice to Shareholders
Notice is hereby given in accordance with Section 23(c) of the Investment Company Act of 1940, as amended, that the Fund from time to time may purchase shares of its common stock in the open market or in private transactions.
58 l GPM l GUGGENHEIM ENHANCED EQUITY INCOME FUND ANNUAL REPORT
This Page Intentionally Left Blank
ABOUT THE FUND MANAGERS
Guggenheim Partners Investment Management, LLC
Guggenheim Partners Investment Management, LLC (“GPIM”) is an indirect subsidiary of Guggenheim Partners, LLC, a diversified financial services firm. The firm provides capital markets services, portfolio and risk management expertise, wealth management, and investment advisory services. Clients of Guggenheim Partners, LLC subsidiaries are an elite mix of individuals, family offices, endowments, foundations, insurance companies and other institutions.
Investment Philosophy
GPIM’s investment philosophy is predicated upon the belief that thorough research and independent thought are rewarded with performance that has the potential to outperform benchmark indexes with both lower volatility and lower correlation of returns over time as compared to such benchmark indexes.
Investment Process
GPIM’s investment process is a collaborative effort between various groups including the Portfolio Construction Group, which utilize proprietary portfolio construction and risk modeling tools to determine allocation of assets among a variety of sectors, and its Sector Specialists, who are responsible for security selection within these sectors and for implementing securities transactions, including the structuring of certain securities directly with the issuers or with investment banks and dealers involved in the origination of such securities.
Guggenheim Funds Distributors, LLC |
227 West Monroe Street |
Chicago, IL 60606 |
Member FINRA/SIPC |
(02/20) |
NOT FDIC-INSURED l NOT BANK-GUARANTEED l MAY LOSE VALUE
CEF-GPM-AR-1219
Item 2. Code of Ethics.
| (a) | The registrant has adopted a code of ethics (the “Code of Ethics”) that applies to its principal executive officer, principal financial officer, principal accounting officer or controller, or persons performing similar functions. |
| (b) | No information need be disclosed pursuant to this paragraph. |
| (c) | The registrant has not amended its Code of Ethics during the period covered by the report presented in Item 1 hereto. |
| (d) | The registrant has not granted a waiver or an implicit waiver to its principal executive officer, principal financial officer, principal accounting officer or controller, or persons performing similar functions from a provision of its Code of Ethics during the period covered by this report. |
| (f) | (1) The registrant’s Code of Ethics is attached hereto as Exhibit (a)(1). |
(2) Not applicable.
(3) Not applicable.
Item 3. Audit Committee Financial Expert.
The registrant’s Board of Trustees has determined that it has at least one audit committee financial expert serving on its audit committee (the “Audit Committee”), Dr. Jerry B. Farley. Dr. Farley is “independent,” meaning that he is not an “interested person” of the Registrant (as that term is defined in Section 2(a)(19) of the Investment Company Act of 1940, as amended) and he does not accept any consulting, advisory, or other compensatory fee from the Registrant (except in his capacity as a Board or committee member). Dr. Farley qualifies as an audit committee financial expert by virtue of his experience at educational institutions, where his business responsibilities have included all aspects of financial management and reporting.
Under applicable securities laws, a person who is determined to be an audit committee financial expert will not be deemed an “expert” for any purpose, including without limitation for the purposes of Section 11 of the Securities Act of 1933, as a result of being designated or identified as an audit committee financial expert. The designation or identification of a person as an audit committee financial expert does not impose on such person any duties, obligations, or liabilities that are greater than the duties, obligations, and liabilities imposed on such person as a member of the Audit Committee and Board of Trustees in the absence of such designation or identification. The designation or identification of a person as an audit committee financial
expert does not affect the duties, obligations or liability of any other member of the Audit Committee or Board of Trustees.
Item 4. Principal Accountant Fees and Services.
(a) Audit Fees: the aggregate fees billed for professional services rendered by the principal accountant for the audit of the registrant’s annual financial statements or services that are normally provided by the accountant in connection with statutory and regulatory filings or engagements were $26,683 and $26,017 for the fiscal years ending December 31, 2019 and December 31, 2018, respectively.
(b) Audit-Related Fees: the aggregate fees billed for assurance and related services by the principal accountant that are reasonably related to the performance of the audit of the registrant’s financial statements and are not reported under paragraph 4(a) of this Item 4, were $0 and $0 for the fiscal years ending December 31, 2019 and December 31, 2018, respectively.
The registrant’s principal accountant did not bill for non-audit services that required approval by the Audit Committee pursuant to paragraph (c)(7)(ii) of Rule 2-01 of Regulation S-X during the registrant’s last two fiscal years.
(c) Tax Fees: the aggregate fees billed for professional services rendered by the principal accountant for tax compliance, tax advice and tax planning, including federal, state and local income tax return preparation and related advice and determination of taxable income and miscellaneous tax advice were $9,196 and $8,887 for the fiscal years ending December 31, 2019 and December 31, 2018, respectively.
The registrant’s principal accountant did not bill for non-audit services that required approval by the Audit Committee pursuant to paragraph (c)(7)(ii) of Rule 2-01 of Regulation S-X during the registrant’s last two fiscal years.
(d) All Other Fees: the aggregate fees billed for products and services provided by the principal accountant, other than the services reported in paragraphs (a) through (c) of this Item 4 were $0 and $0 for the fiscal years ending December 31, 2019 and December 31, 2018, respectively.
The registrant’s principal accountant did not bill for non-audit services that required approval by the Audit Committee pursuant to paragraph (c)(7)(ii) of Rule 2-01 of Regulation S-X during the registrant’s last two fiscal years.
(e) Audit Committee Pre-Approval Policies and Procedures.
(1) The registrant’s Audit Committee reviews, and in its sole discretion, pre-approves, pursuant to written pre-approval procedures (A) all engagements for audit and non-audit services to be provided by the principal accountant to the registrant and (B) all engagements for non-audit services to be provided by the principal accountant (1) to the registrant’s investment adviser (not including a sub-adviser whose role is primarily portfolio management and is sub-contracted or overseen by another investment adviser) and (2) to any entity controlling, controlled by or under common control with the registrant’s investment adviser that provides ongoing services to the
registrant; but in the case of the services described in subsection (B)(1) or (2), only if the engagement relates directly to the operations and financial reporting of the registrant; provided that such pre-approval need not be obtained in circumstances in which the pre-approval requirement is waived under rules promulgated by the Securities and Exchange Commission or New York Stock Exchange listing standards. Sections V.B.2 and V.B.3 of the Audit Committee’s revised Audit Committee Charter contain the Audit Committee’s Pre-Approval Policies and Procedures and such sections are included below.
V.B.2.Pre-approve any engagement of the independent auditors to provide any services, other than “prohibited non-audit services,” to the Trust, including the fees and other compensation to be paid to the independent auditors (unless an exception is available under Rule 2-01 of Regulation S-X).
| (a) | The categories of services to be reviewed and considered for pre-approval include the following (collectively, “Identified Services”): |
Audit Services
| • | Annual financial statement audits |
| • | Seed audits (related to new product filings, as required) |
| • | SEC and regulatory filings and consents |
Audit-Related Services
| • | Accounting consultations |
| • | Fund merger/reorganization support services |
| • | Other accounting related matters |
| • | Agreed upon procedures reports |
| • | Other internal control reports |
Tax Services
| o | Preparation of Federal and state income tax returns, including extensions |
| o | Preparation of calculations of taxable income, including fiscal year tax designations |
| o | Preparation of annual Federal excise tax returns (if applicable) |
| o | Preparation of calendar year excise distribution calculations |
| o | Calculation of tax equalization on an as-needed basis |
| o | Preparation of the estimated excise distribution calculations on an as-needed basis |
| o | Preparation of quarterly Federal, state and local and franchise tax estimated tax payments on an as-needed basis |
| o | Preparation of state apportionment calculations to properly allocate Fund taxable income among the states for state tax filing purposes |
| o | Provision of tax compliance services in India for Funds with direct investments in India |
| o | Assistance with management’s identification of passive foreign investment companies (PFICs) for tax purposes |
| • | Permissible non-recurring tax services upon request: |
| o | Assistance with determining ownership changes which impact a Fund’s utilization of loss carryforwards |
| o | Assistance with calendar year shareholder reporting designations on Form 1099 |
| o | Assistance with corporate actions and tax treatment of complex securities and structured products |
| o | Assistance with IRS ruling requests and calculation of deficiency dividends |
| o | Conduct training sessions for the Adviser’s internal tax resources |
| o | Assistance with Federal, state, local and international tax planning and advice regarding the tax consequences of proposed or actual transactions |
| o | Tax services related to amendments to Federal, state and local returns and sales and use tax compliance |
| o | RIC qualification reviews |
| o | Tax distribution analysis and planning |
| o | Tax authority examination services |
| o | Tax appeals support services |
| o | Tax accounting methods studies |
| o | Fund merger, reorganization and liquidation support services |
| o | Tax compliance, planning and advice services and related projects |
| (b) | The Committee has pre-approved Identified Services for which the estimated fees are less than $25,000. |
| (c) | For Identified Services with estimated fees of $25,000 or more, but less than $50,000, the Chair or any member of the Committee designated by the Chair is hereby authorized to pre-approve such services on behalf of the Committee. |
| (d) | For Identified Services with estimated fees of $50,000 or more, such services require pre-approval by the Committee. |
| (e) | All requests for Identified Services to be provided by the independent auditor that were pre-approved by the Committee shall be submitted to the Chief Accounting Officer (“CAO”) of the Trust by the independent auditor using the pre-approval request form attached as Appendix C to the Audit Committee Charter. The Trust’s CAO will determine whether such services are included within the list of services that have received the general pre-approval of the Committee. |
| (f) | The independent auditors or the CAO of the Trust (or an officer of the Trust who reports to the CAO) shall report to the Committee at each of its regular scheduled meetings all audit, audit-related and permissible non-audit services initiated since the last such report (unless the services were contained in the initial audit plan, as previously presented to, and approved by, the Committee). The report shall include a general description of the services and projected fees, and the means by which such services were approved by the Committee (including the particular category of Identified Services under which pre-approval was obtained). |
V.B.3. Pre-approve any engagement of the independent auditors, including the fees and other compensation to be paid to the independent auditors, to provide any non-audit services to the Adviser (or any “control affiliate” of the Adviser providing ongoing services to the Trust), if the engagement relates directly to the operations and financial reporting of the Trust (unless an exception is available under Rule 2-01 of Regulation S-X).
| (a) | The Chair or any member of the Committee designated by the Chair may grant the pre-approval for non-audit services to the Adviser (or any “control affiliate” of the Adviser providing ongoing services to the Trust) relating directly to the operations and financial reporting of the Trust for which the estimated fees are less than $25,000. All such delegated pre-approvals shall be presented to the Committee no later than the next Committee meeting. |
| (b) | For non-audit services to the Adviser (or any “control affiliate” of the Adviser providing ongoing services to the Trust) relating directly to the operations and financial reporting of the Trust for which the estimated fees are $25,000 or more, such services require pre-approval by the Committee. |
(2) None of the services described in each of Items 4(b) through (d) were approved by the Audit Committee pursuant to paragraph (c)(7)(i)(C) of Rule 2-01 of Regulation S-X.
(f) Not applicable.
| (g) | The aggregate non-audit fees billed by the registrant’s accountant for services rendered to the registrant, the registrant’s investment adviser (not including a sub-adviser whose role is primarily portfolio management and is sub-contracted with or overseen by another investment adviser) and/or any entity controlling, controlled by, or under common control with the adviser that provides ongoing services to the registrant were $9,196 and $8,887 for the fiscal years ending December 31, 2019 and December 31, 2018, respectively. |
(h) Not applicable.
Item 5. Audit Committee of Listed Registrants.
(a) The registrant has a separately designated standing Audit Committee established in accordance with Section 3(a)(58)(A) of the Securities Exchange Act of 1934, as amended. The audit committee of the registrant is composed of: Randall C. Barnes; Ronald A. Nyberg; Ronald E. Toupin, Jr; Donald A. Chubb, Jr.; Jerry B. Farley; Angela Brock-Kyle; Thomas F. Lydon, Jr.; Sandra G. Sponem; and Roman Friedrich III.
(b) Not applicable.
Item 6. Schedule of Investments.
The Schedule of Investments is included as part of Item 1.
Item 7. Disclosure of Proxy Voting Policies and Procedures for Closed-End Management Investment Companies.
The registrant has delegated the voting of proxies relating to its voting securities to the registrant’s investment sub-adviser, Guggenheim Partners Investment Management, LLC (“GPIM”). GPIM’s proxy voting policies and procedures are included as Exhibit (c) hereto.
Item 8. Portfolio Managers of Closed-End Management Investment Companies.
(a)(1) Guggenheim serves as sub-adviser for the registrant and is responsible for the day-to-day management of the registrant’s portfolio. Guggenheim uses a team approach to manage client portfolios. Day to day management of a client portfolio is conducted under the auspices of Guggenheim’s Portfolio Construction Group (“PCG”). PCG’s members include the Chief Investment Officer (“CIO”) and other key investment personnel. The PCG, in consultation with the CIO, provides direction for overall investment strategy. The PCG performs several duties as it relates to client portfolios including: determining both tactical and strategic asset allocations; and monitoring portfolio adherence to asset allocation targets; providing sector specialists with direction for overall investment strategy, which may include portfolio design and the rebalancing of portfolios; performing risk management oversight; assisting sector managers and research staff in determining the relative valuation of market sectors; and providing a forum for the regular discussion of the economy and the financial markets to enhance the robustness of Guggenheim’s strategic and tactical policy directives.
The following individuals at Guggenheim share primary responsibility for the management of the registrant’s portfolio and is provided as of December 31, 2019:
| Name | Since | Professional Experience During the Last Five Years |
| | | |
Farhan Sharaff | 2010 | Guggenheim Partners Investment Management, LLC.: Senior Managing Director and Assistant Chief Investment Officer - Equities – 7/10–Present. Former, MJX Capital Advisors: Chief Investment Officer – 2005-2009. | |
Daniel Cheeseman | 2014 | Guggenheim Partners Investment Management, LLC: Director, Portfolio Manager – 09/14-Present; Guggenheim Partners Investment Management, LLC: Director, Senior Research Analyst – 11/11-09/14; Morgan Stanley: Vice President – 03/10-11/11; Merrill Lynch: Vice President – 01/07-03/10. | |
Jayson Flowers | 2010 | Guggenheim Partners Investment Management, LLC.: Senior Managing Director, 12/05 – Present; Guggenheim Partners, LLC: Managing Director -2001–2005 | |
Qi Yan | 2016 | Guggenheim Partners Investment Management, LLC: Managing Director, 2014 – Present; Guggenheim Partners Investment Management, LLC: Director, 2011 to 2014 | |
(a)(2)(i-iii) Other Accounts Managed by the Portfolio Managers
The following tables summarize information regarding each of the other accounts managed by the Guggenheim portfolio managers as of December 31, 2019:
Farhan Sharaff:
| | | | | | | | |
Type of Account | | Number of Accounts | Total Assets in the Accounts | | Number of Accounts In Which the Advisory Fee is Based on Performance | | Total Assets in the Accounts In Which the Advisory Fee is Based on Performance |
Registered investment companies | | 24 | $2,954,716,773 | | 0 | | $0 |
Other pooled investment vehicles | | 3 | $30,872,072 | | 0 | | $0 |
Other accounts | | 0 | $0 | | 0 | | $0 |
Jayson Flowers:
| | | | | | | | |
Type of Account | | Number of Accounts | Total Assets in the Accounts | | Number of Accounts In Which the Advisory Fee is Based on Performance | | Total Assets in the Accounts In Which the Advisory Fee is Based on Performance |
Registered investment companies | | 16 | | | 0 | | $0 |
Other pooled investment vehicles | | 0 | $0 | | 0 | | $0 |
Other accounts | | 0 | $0 | | 0 | | $0 |
Daniel Cheeseman:
| | | | | | | | |
| | | | | | | | |
Type of Account | | Number of Accounts | Total Assets in the Accounts | | Number of Accounts In Which the Advisory Fee is Based on Performance | | Total Assets in the Accounts In Which the Advisory Fee is Based on Performance |
Registered investment companies | | 1 | $562,205,667 | | 0 | | $0 |
Other pooled investment vehicles | | 0 | $0 | | 0 | | $0 |
Other accounts | | 0 | $0 | | 0 | | $0 |
Qi Yan:
| | | | | | | | |
Type of Account | | Number of Accounts | Total Assets in the Accounts | | Number of Accounts In Which the Advisory Fee is Based on Performance | | Total Assets in the Accounts In Which the Advisory Fee is Based on Performance |
Registered investment companies | | 8 | $985,122,076 | | 0 | | $0 |
Other pooled investment vehicles | | 0 | $0 | | 0 | | $0 |
Other accounts | | 0 | $0 | | 0 | | $0 |
(a)(2)(iv) Potential Conflicts of Interest
Actual or apparent conflicts of interest may arise when a portfolio manager has day-to-day management responsibilities with respect to more than one fund or other account. More specifically, portfolio managers who manage multiple funds and/or other accounts may be presented with one or more of the following potential conflicts.
The management of multiple funds and/or other accounts may result in a portfolio manager devoting unequal time and attention to the management of each fund and/or other account. Guggenheim seeks to manage such competing interests for the time and attention of a portfolio manager by having the portfolio manager focus on a particular investment discipline. Specifically, the ultimate decision maker for security selection for each client portfolio is the Sector Specialist Portfolio Manager. They are responsible for analyzing and selecting specific securities that they believe best reflect the risk and return level as provided in each client’s investment guidelines.
Guggenheim may have clients with similar investment strategies. As a result, if an investment opportunity would be appropriate for more than one client, Guggenheim may be required to choose among those clients in allocating such opportunity, or to allocate less of such opportunity to a client than it would ideally allocate if it did not have to allocate to multiple clients. In addition, Guggenheim may determine that an investment opportunity is appropriate for a particular account, but not for another.
Allocation decisions are made in accordance with the investment objectives, guidelines, and restrictions governing the respective clients and in a manner that will not unfairly favor one client over another. Guggenheim’s allocation policy provides that investment decisions must never be based upon account performance or fee structure. Accordingly, Guggenheim’s allocation procedures are designed to ensure that investment opportunities are allocated equitably among different client accounts over time. The procedures also seek to ensure reasonable
efficiency in client transactions and to provide portfolio managers with flexibility to use allocation methodologies appropriate to Guggenheim’s investment disciplines and the specific goals and objectives of each client account.
In order to minimize execution costs and obtain best execution for clients, trades in the same security transacted on behalf of more than one client may be aggregated. In the event trades are aggregated, Guggenheim’s policy and procedures provide as follows: (i) treat all participating client accounts fairly; (ii) continue to seek best execution; (iii) ensure that clients who participate in an aggregated order will participate at the average share price with all transaction costs shared on a pro-rata basis based on each client’s participation in the transaction; (iv) disclose its aggregation policy to clients.
Guggenheim, as a fiduciary to its clients, considers numerous factors in arranging for the purchase and sale of clients’ portfolio securities in order to achieve best execution for its clients. When selecting a broker, individuals making trades on behalf of Guggenheim clients consider the full range and quality of a broker’s services, including execution capability, commission rate, price, financial stability and reliability. Guggenheim is not obliged to merely get the lowest price or commission but also must determine whether the transaction represents the best qualitative execution for the account.
In the event that multiple broker/dealers make a market in a particular security, Guggenheim’s Portfolio Managers are responsible for selecting the broker-dealer to use with respect to executing the transaction. The broker-dealer will be selected on the basis of how the transaction can be executed to achieve the most favorable execution for the client under the circumstances. In many instances, there may only be one counter-party active in a particular security at a given time. In such situations the Employee executing the trade will use his/her best effort to obtain the best execution from the counter-party.
Guggenheim and the registrant have adopted certain compliance procedures which are designed to address these types of conflicts. However, there is no guarantee that such procedures will detect each and every situation in which a conflict arises.
(a)(3) Portfolio Manager Compensation
Guggenheim compensates the portfolio managers for their management of the registrant’s portfolio. Compensation is evaluated based on their contribution to investment performance relative to pertinent benchmarks and qualitatively based on factors such as teamwork and client service efforts. Guggenheim’s staff incentives may include: a competitive base salary, bonus determined by individual and firm wide performance, equity participation, and participation opportunities in various Guggenheim investments. All Guggenheim employees are also eligible to participate in a 401(k) plan to which Guggenheim may make a discretionary match after the completion of each plan year.
(a)(4) Portfolio Manager Securities Ownership
The following table discloses the dollar range of equity securities of the registrant beneficially owned by each Guggenheim portfolio manager as of December 31, 2019:
| Name of Portfolio Manager | Dollar Amount of Equity Securities in Registrant |
| Farhan Sharaff | $0 |
| Jayson Flowers | $0 |
| Daniel Cheeseman | $0 |
| Qi Yan | $0 |
Item 9. Purchases of Equity Securities by Closed-End Management Investment Company and Affiliated Purchasers.
None.
Item 10. Submission of Matters to a Vote of Security Holders.
The registrant has not made any material changes to the procedures by which shareholders may recommend nominees to the registrant’s Board of Trustees.
Item 11. Controls and Procedures.
(a) The registrant’s principal executive officer and principal financial officer have evaluated the registrant’s disclosure controls and procedures (as defined in Rule 30a-3(c) under the Investment Company Act) as of a date within 90 days of this filing and have concluded based on such evaluation, as required by Rule 30a-3(b) under the Investment Company Act, that the registrant’s disclosure controls and procedures were effective, as of that date, in ensuring that information required to be disclosed by the registrant in this Form N-CSR was recorded, processed, summarized, and reported within the time periods specified in the Securities and Exchange Commission’s rules and forms.
(b) There were no changes in the registrant’s internal control over financial reporting (as defined in Rule 30a-3(d) under the Investment Company Act) that occurred during the period covered by this report that have materially affected, or are reasonably likely to materially affect, the registrant’s internal control over financial reporting.
Item 12. Disclosure of Securities Lending Activities for Closed-End Management Investment Companies.
| (a) | The registrant has not participated in securities lending activities during the period covered by this report. |
Item 13. Exhibits.
SIGNATURES
Pursuant to the requirements of the Securities Exchange Act of 1934 and the Investment Company Act of 1940, the registrant has duly caused this report to be signed on its behalf by the undersigned, thereunto duly authorized.
(Registrant) Guggenheim Enhanced Equity Income Fund
By: /s/ Brian E. Binder
Name: Brian E. Binder
Title: President and Chief Executive Officer
Date: March 6, 2020
Pursuant to the requirements of the Securities Exchange Act of 1934 and the Investment Company Act of 1940, this report has been signed by the following persons on behalf of the registrant and in the capacities and on the dates indicated.
By: /s/ Brian E. Binder
Name: Brian E. Binder
Title: President and Chief Executive Officer
Date: March 6, 2020
By: /s/ John L. Sullivan
Name: John L. Sullivan
Title: Chief Financial Officer, Chief Accounting Officer and Treasurer
Date: March 6, 2020