UNITED STATES
SECURITIES AND EXCHANGE COMMISSION
Washington, D.C. 20549
FORM N-CSR
CERTIFIED SHAREHOLDER REPORT OF REGISTERED MANAGEMENT
INVESTMENT COMPANIES
Investment Company Act file number 811-21682
Sterling Capital Variable Insurance Funds
(Exact name of registrant as specified in charter)
434 Fayetteville Street, 5th Floor
Raleigh, NC 27601-0575
(Address of principal executive offices) (Zip code)
James T. Gillespie, President
Sterling Capital Variable Insurance Funds
434 Fayetteville Street, 5th Floor
Raleigh, NC 27601-0575
(Name and address of agent for service)
Registrant’s telephone number, including area code: (800) 228-1872
Date of fiscal year end: December 31
Date of reporting period: December 31, 2014
Form N-CSR is to be used by management investment companies to file reports with the Commission not later than 10 days after the transmission to stockholders of any report that is required to be transmitted to stockholders under Rule 30e-1 under the Investment Company Act of 1940 (17 CFR 270.30e-1). The Commission may use the information provided on Form N-CSR in its regulatory, disclosure review, inspection, and policymaking roles.
A registrant is required to disclose the information specified by Form N-CSR, and the Commission will make this information public. A registrant is not required to respond to the collection of information contained in Form N-CSR unless the Form displays a currently valid Office of Management and Budget (“OMB”) control number. Please direct comments concerning the accuracy of the information collection burden estimate and any suggestions for reducing the burden to Secretary, Securities and Exchange Commission, 100 F Street, NE, Washington, DC 20549. The OMB has reviewed this collection of information under the clearance requirements of 44 U.S.C. § 3507.
Item 1. Reports to Stockholders.
The Report to Shareholders is attached herewith.
Sterling Capital Variable Insurance Funds
|
| 2 | ||||
| 3 | ||||
| 4 | ||||
| 5 | ||||
| 6 | ||||
| 7 | ||||
| 7 | ||||
| 8 | ||||
| 9 | ||||
| 14 | ||||
| 20 | ||||
| 26 | ||||
| 27 | ||||
| 28 | ||||
| 31 | ||||
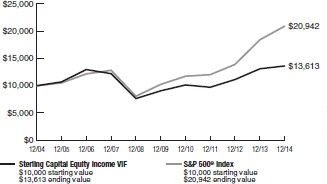
Sterling Capital Equity Income VIF
Performance Overview 12/31/2004 - 12/31/2014
Growth of a $10,000 investment
Portfolio Manager
George F. Shipp, CFA
Senior Managing Director and portfolio manager
Sterling Capital Management LLC
Average Annual Returns
| ||||||||||||
| 1 Year | 5 Years | 10 Years | ||||||||||
| ||||||||||||
Sterling Capital Equity Income VIF | 4.08% | 8.51% | 3.13% | |||||||||
| ||||||||||||
S&P 500® Index | 13.69% | 15.45% | 7.67% | |||||||||
| ||||||||||||
The chart represents a comparison of a hypothetical $10,000 investment in the indicated Fund versus a similar investment in the Fund’s benchmark, and includes the reinvestment of distributions. The returns include the Fund level expenses, but do not include fees charged by participating insurance companies. These charges and fees will reduce returns. Past performance does not guarantee future results. The performance data quoted represents past performance and current returns may be lower or higher. Total return figures include change in share price, reinvestment of dividends and capital gains, and do not reflect taxes that a shareholder would pay on Fund distributions or on the redemption of Fund shares. The value of the contract will fluctuate so that when redeemed, it may be worth more or less than the original investment.
Investment Considerations
Equity securities (stocks) are more volatile and carry more risk. The net asset value per share of the Fund will fluctuate as the value of the securities in the portfolio changes. Value-based investments are subject to the risk that the broad market may not recognize their intrinsic value.
Q. How did the Fund perform during the 12-month period between January 1, 2014 and December 31, 2014?
A. The Fund underperformed its benchmark, the S&P 500® Index.
Q. What factors affected the Fund’s performance?
A. The Fund holds only companies with established track records of consistently paying and raising their dividends.
The U.S. stock market in general performed well during the period, posting its sixth consecutive year of gains. Equity markets benefited from the Federal Reserve’s accommodative monetary policies that kept interest rates low, as well as from the relatively strong growth in the U.S. economy.
Even so, dividend growth and high returns on equity — two key components of the Fund’s strategy — were poor performing factors in 2014. While the U.S. economy posted strong growth, the same was not true for other developed economies. Overseas exposure was the single worst-performing factor for the Fund during the period, as the Fund’s holdings of large-cap multinationals were hurt by the weaker overseas markets.
The Fund underperformed its benchmark as equity income holdings generally lagged the broader equity market returns. This underperformance came about despite an above-benchmark 14% average increase in dividends from the Fund’s underlying holdings at year end.
The absence of real estate investment trusts and utilities in the Fund’s holdings also detracted from performance, as those were top performing sectors for the benchmark amid falling interest rates. Stock selection dragged on results as well, with holdings of a leading toy and game manufacturer detracting from relative performance as that company struggled to generate must-have industry hits in 2014. The Fund’s cash holdings weighed on relative returns compared to the strong gains
posted by the fully invested benchmark.
The Fund’s overweight position in the energy sector dragged on relative performance, as that was the stock market’s only negative sector in 2014 due to the dramatic decline in oil prices late in the period. However, stock selection in this sector more than offset the impacts of the sector weighting, on a relative basis. In particular, holdings of the nation’s largest pipeline system helped boost the Fund’s relative returns as the company made strategic moves to enhance future growth. While the Fund’s energy holdings outperformed the benchmark’s energy holdings, they still detracted from the Fund’s absolute performance.
Stock selection in the technology sector also contributed positively to the Fund’s relative performance. In particular, the Fund held shares of several of the market’s strongest performing companies, including a leading microchip manufacturer and the world’s leading software maker. Overweight positions in the healthcare and technology sectors also helped boost relative performance, as those sectors posted strong returns for the period. The Fund also benefited when a cable TV provider received a premium buyout offer during the period.
Portfolio composition is as of December 31, 2014, and is subject to change and risk.
The Fund is measured against the S&P 500® Index, a widely recognized, unmanaged index of common stocks. The index is unmanaged and does not reflect the deduction of expenses associated with a mutual fund, such as investment management and fund accounting fees. The Fund’s performance reflects the deduction of fees for these services. Investors cannot invest directly in an index, although they can invest in its underlying securities.
A portion of the Fund’s fees have been voluntarily reduced (See Note 4 in the Notes to the Financial Statements). If fees had not been reduced, the Fund’s total return for the periods would have been lower.
| 2 | ||||
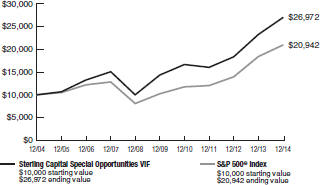
Sterling Capital Special Opportunities VIF
Performance Overview 12/31/2004 - 12/31/2014
Growth of a $10,000 investment
Portfolio Manager
George F. Shipp, CFA
Senior Managing Director and portfolio manager
Sterling Capital Management LLC
Average Annual Returns
| ||||||
| 1 Year | 5 Years | 10 Years | ||||||||||
| ||||||||||||
Sterling Capital Special Opportunities VIF | 15.99% | 13.53% | 10.43% | |||||||||
| ||||||||||||
S&P 500® Index | 13.69% | 15.45% | 7.67% | |||||||||
| ||||||||||||
The chart represents a comparison of a hypothetical $10,000 investment in the indicated Fund versus a similar investment in the Fund’s benchmark, and includes the reinvestment of distributions. The returns include the Fund level expenses, but do not include fees charged by participating insurance companies. These charges and fees will reduce returns. Past performance does not guarantee future results. The performance data quoted represents past performance and current returns may be lower or higher. Total return figures include change in share price, reinvestment of dividends and capital gains, and do not reflect taxes that a shareholder would pay on fund distributions or on the redemption of fund shares. The value of the contract will fluctuate so that when redeemed, it may be worth more or less than the original investment.
Investment Considerations
Equity securities (stocks) are more volatile and carry more risk. The net asset value per share of the Fund will fluctuate as the value of the securities in the portfolio changes. A concentrated portfolio may add a measure of volatility to performance, as major fluctuations in any one holding will likely affect the Fund more than a fund with greater diversification.
Q. How did the Fund perform during the 12-month period between January 1, 2014 and December 31, 2014?
A. The Fund outperformed its benchmark, the S&P 500® Index.
Q. What factors affected the Fund’s performance?
A. The U.S. stock market in general performed well during the period, posting its sixth consecutive year of gains. Equity markets benefited from the Federal Reserve’s accommodative monetary policies that kept interest rates low, as well as from the relatively strong growth in the U.S. economy.
The low-interest rate environment helped keep investors interested in equity markets, in our view. Confidence in the strength of the U.S. economy also meant that as investors looked for opportunities, they tended to favor growth-oriented stocks for most of the period under review. This trend benefited the Fund’s strategy of focusing on secular growth opportunities. In particular, holdings exposed to broadband, internet security, and the housing and construction industries’ rebound contributed positively to the Fund’s absolute return. The Fund’s absolute return also benefited from owning a satellite TV company that received a premium buyout offer during the period.
The Fund outperformed its benchmark in large part due to stock selection. Within health care holdings, shares in the nation’s leading genetics testing company, leading managed care insurer, and leading hospital company were the year’s three largest contributors to absolute
return and contributed strongly to relative results as well. Close to a third of the Fund’s holdings for the period were smaller- and mid-cap, non-benchmark holdings, many of which performed well in 2014. Among those holdings were two real estate investment trusts that posted particularly strong performance due in part to the low-interest rate environment, but also to meaningful occupancy improvements.
The Fund’s energy holdings detracted from relative returns. In particular, holdings of an exploration and production company suffered from the sharp decline in crude oil prices. A lack of exposure to utilities — the benchmark’s top performing sector — also dragged on performance, as did the Fund’s cash holdings relative to the strong growth of the fully invested benchmark.
Portfolio composition is as of December 31, 2014, and is subject to change and risk.
The Fund is measured against the S&P 500® Index, a widely recognized, unmanaged index of common stocks. The index is unmanaged and does not reflect the deduction of expenses associated with a mutual fund, such as investment management and fund accounting fees. The Fund’s performance reflects the deduction of fees for these services. Investors cannot invest directly in an index, although they can invest in its underlying securities.
A portion of the Fund’s fees have been voluntarily reduced (See Note 4 in the Notes to the Financial Statements). If fees had not been reduced, the Fund’s total return for the periods would have been lower.
| 3 | ||||
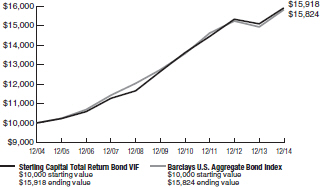
Sterling Capital Total Return Bond VIF
Performance Overview 12/31/2004 - 12/31/2014
Growth of a $10,000 investment
Portfolio Managers
Mark Montgomery, CFA
Senior Managing Director and portfolio manager
Sterling Capital Management LLC
Richard T. LaCoff
Senior Managing Director and portfolio manager
Sterling Capital Management LLC
Average Annual Returns
| ||||||||||||
| 1 Year | 5 Years | 10 Years | ||||||||||
| ||||||||||||
Sterling Capital Total Return Bond VIF | 5.44% | 4.71% | 4.76% | |||||||||
| ||||||||||||
Barclays U.S. Aggregate Bond Index | 5.97% | 4.45% | 4.71% | |||||||||
| ||||||||||||
The chart represents a comparison of a hypothetical $10,000 investment in the indicated Fund versus a similar investment in the Fund’s benchmark, and includes the reinvestment of distributions. The returns include the Fund level expenses, but do not include fees charged by participating insurance companies. These charges and fees will reduce returns. Past performance does not guarantee future results. The performance data quoted represents past performance and current returns may be lower or higher. Total return figures include change in share price, reinvestment of dividends and capital gains, and do not reflect taxes that a shareholder would pay on fund distributions or on the redemption of fund shares. The value of the contract will fluctuate so that when redeemed, it may be worth more or less than the original investment.
Investment Considerations
Bonds offer a relatively stable level of income, although bond prices will fluctuate providing the potential for principal gain or loss. Intermediate-term, higher-quality bonds generally offer less risk than longer-term bonds and a lower rate of return.
The Fund is subject to the risk that principal value tends to react in opposition to the movement of interest rates and that a rising interest rate environment increases the risk of loss of principal.
Q. How did the Fund perform during the 12-month period between January 1, 2014 and December 31, 2014?
A. The Fund underperformed its benchmark, the Barclays U.S. Aggregate Bond Index.
Q. What factors affected the Fund’s performance?
A. Fixed income markets benefited from a declining interest rate environment. Concerns about slowing global growth, as well as falling oil prices and low interest rates in many international markets, contributed to the decline in U.S. interest rates. Despite the strong economic growth in the United States, inflation remained in check. As a result, we believe investors largely overcame their concerns about a future rate increase by the Federal Reserve and drove up prices on U.S. treasuries.
The Fund lagged its benchmark slightly during the period. We decided to favor shorter duration securities relative to the benchmark as we assumed the Federal Reserve would take a less accommodating stance with its monetary policy. Likewise, our confidence in the ongoing improvement in the U.S. economy led us to take an overweight position in riskier assets, namely corporate bonds. While the economic forecast proved correct, slowing global growth and low overseas interest rates led investors to seek the relatively higher yields offered in U.S. markets, in our opinion. Moreover, we believe slowing global growth and falling oil prices drove investors to seek safety in higher quality assets, which caused credit spreads to widen as prices on Treasuries rose
faster than prices on corporate bonds.
The Fund’s relative performance benefited from intra-sector allocation decisions as well as stock selections. For example, within the corporate bond sector, we decided to hold an overweight position in financials (which outperformed the benchmark) and an underweight position in industrials (which lagged the benchmark). An overweight position to taxable municipal bonds within the government-related sector also boosted relative results, as that sub-sector outperformed for the period. Finally, the Fund’s allocation to commercial mortgage-backed securities within the securitized sector also contributed positively to relative performance.
Portfolio composition is as of December 31, 2014, and is subject to change and risk.
The Fund is measured against Barclays U.S. Aggregate Bond Index which is a market value-weighted performance benchmark for investment-grade fixed-rate debt issues, including government, corporate, asset-backed and mortgage-backed securities, with maturities of at least one year. The index is unmanaged and does not reflect the deduction of expenses associated with a mutual fund, such as investment management and fund accounting fees. The Fund’s performance reflects the deduction of fees for these services. Investors cannot invest directly in an index, although they can invest in its underlying securities.
A portion of the Fund’s fees have been voluntarily reduced (See Note 4 in the Notes to the Financial Statements). If fees had not been reduced, the Fund’s total return for the periods would have been lower.
| 4 | ||||
Sterling Capital Variable Insurance Funds
|
Summary of Portfolio Holdings (Unaudited)
December 31, 2014
Each Sterling Capital Variable Insurance Fund’s portfolio composition at December 31, 2014 was as follows:
Sterling Capital Equity Income VIF
| Percentage of net assets | ||||
Consumer Discretionary | 17.1 | % | |||
Consumer Staples | 14.2 | % | |||
Energy | 13.1 | % | |||
Financials | 8.2 | % | |||
Health Care | 21.1 | % | |||
Industrials | 8.0 | % | |||
Information Technology | 10.7 | % | |||
Materials | 2.1 | % | |||
Telecommunication Services | 3.8 | % | |||
Money Market Fund | 1.5 | % | |||
|
| ||||
| 99.8 | % | ||||
|
| ||||
Sterling Capital Special Opportunities VIF
| |||||
Consumer Discretionary | 18.1 | % | |||
Consumer Staples | 3.6 | % | |||
Energy | 6.1 | % | |||
Financials | 9.4 | % | |||
Health Care | 12.9 | % | |||
Industrials | 11.7 | % | |||
Information Technology | 32.6 | % | |||
Money Market Fund | 5.6 | % | |||
|
| ||||
| 100.0 | % | ||||
|
| ||||
Sterling Capital Total Return Bond VIF
| |||||
Asset Backed Securities | 10.5 | % | |||
Collateralized Mortgage Obligations | 10.2 | % | |||
Commercial Mortgage-Backed Securities | 17.2 | % | |||
Corporate Bonds | 34.8 | % | |||
Foreign Government Bonds | 0.9 | % | |||
Mortgage-Backed Securities | 10.8 | % | |||
Municipal Bonds | 9.9 | % | |||
Preferred Stocks | 1.2 | % | |||
U.S. Government Agencies | 0.1 | % | |||
U.S. Treasury Bonds | 1.9 | % | |||
U.S. Treasury Notes | 0.2 | % | |||
Money Market Fund | 1.6 | % | |||
|
| ||||
| 99.3 | % | ||||
|
| ||||
5
Sterling Capital Variable Insurance Funds
|
|
December 31, 2014
|
As a shareholder of the Sterling Capital Variable Insurance Funds, you incur two types of costs: (1) transaction costs, and (2) ongoing costs, including management fees and other Fund expenses.
These examples are intended to help you understand your ongoing costs (in dollars) of investing in the Sterling Capital Variable Insurance Funds and to compare these costs with the ongoing costs of investing in other mutual funds.
These examples are based on an investment of $1,000 invested at the beginning of the period and held for the entire period from July 1, 2014 through December 31, 2014.
Actual Example
The table below provides information about actual account values and actual expenses. You may use the information below, together with the amount you invested, to estimate the expenses that you paid over the period. Simply divide your account value by $1,000 (for example, an $8,600 account value divided by $1,000 = 8.6), then multiply the result by the number in the table under the heading entitled “Expenses Paid During Period” to estimate the expenses you paid on your account during this period.
| Beginning Account Value 7/1/14 | Ending Account Value 12/31/14 | Expenses Paid During Period 7/1/14 - 12/31/14* | Expense Ratio During Period 7/1/14 - 12/31/14 | |||||||||||||||||
Sterling Capital Equity Income VIF | $ | 1,000.00 | $ | 995.20 | $ | 5.88 | 1.17 | % | ||||||||||||
Sterling Capital Special Opportunities VIF | 1,000.00 | 1,023.10 | 6.12 | 1.20 | % | |||||||||||||||
Sterling Capital Total Return Bond VIF | 1,000.00 | 1,011.80 | 5.93 | 1.17 | % | |||||||||||||||
| * | Expenses are equal to the average account value times the Fund’s annualized expense ratio multiplied by 184 (the number of days in the most recent fiscal half-year) divided by 365 (the number of days in the fiscal year). Expenses shown do not include annuity contract fees. |
Hypothetical Example for Comparison Purposes
The table below provides information about hypothetical account values and hypothetical expenses based on each Sterling Capital Variable Insurance Fund’s actual expense ratio and an assumed rate of return of 5% per year before expenses, which is not the Funds’ actual return. The hypothetical account values and expenses may not be used to estimate the actual ending account balance or expenses you paid for the period. You may use this information to compare this 5% hypothetical example with the 5% hypothetical examples that appear in the shareholder reports of other funds.
Please note that the expenses shown in the table are meant to highlight your ongoing costs only and do not reflect any transactional costs. Therefore, the table is useful in comparing ongoing costs only, and will not help you determine the relative total costs of owning different funds. In addition, if these transactional costs were included, your costs would have been higher.
| Beginning Account Value 7/1/14 | Ending Account Value 12/31/14 | Expenses Paid During Period 7/1/14 - 12/31/14* | Expense Ratio During Period 7/1/14 - 12/31/14 | |||||||||||||||||
Sterling Capital Equity Income VIF | $ | 1,000.00 | $ | 1,019.31 | $ | 5.96 | 1.17 | % | ||||||||||||
Sterling Capital Special Opportunities VIF | 1,000.00 | 1,019.16 | 6.11 | 1.20 | % | |||||||||||||||
Sterling Capital Total Return Bond VIF | 1,000.00 | 1,019.31 | 5.96 | 1.17 | % | |||||||||||||||
| * | Expenses are equal to the average account value times the Fund’s annualized expense ratio multiplied by 184 (the number of days in the most recent fiscal half-year) divided by 365 (the number of days in the fiscal year). Expenses shown do not include annuity contract fees. |
6
Sterling Capital Equity Income VIF
|
|
December 31, 2014
|
Shares | Fair Value | |||||||
COMMON STOCKS — 98.3% | ||||||||
Consumer Discretionary — 17.1% | ||||||||
| 4,000 | Dunkin’ Brands Group, Inc. | $ 170,600 | ||||||
| 11,286 | Mattel, Inc. | 349,245 | ||||||
| 6,130 | McDonald’s Corp. | 574,381 | ||||||
| 5,700 | Omnicom Group, Inc. | 441,579 | ||||||
| 24,220 | Pearson PLC, ADR | 446,859 | ||||||
| 3,600 | Time Warner Cable, Inc. | 547,416 | ||||||
|
| |||||||
| 2,530,080 | ||||||||
|
| |||||||
Consumer Staples — 14.2% | ||||||||
| 10,000 | General Mills, Inc. | 533,300 | ||||||
| 6,290 | PepsiCo, Inc. | 594,782 | ||||||
| 4,800 | Philip Morris International, Inc. | 390,960 | ||||||
| 14,385 | Unilever PLC, ADR | 582,305 | ||||||
|
| |||||||
| 2,101,347 | ||||||||
|
| |||||||
Energy — 13.1% | ||||||||
| 5,000 | Chevron Corp. | 560,900 | ||||||
| 7,581 | Ensco PLC, Class A | 227,051 | ||||||
| 14,500 | Kinder Morgan, Inc. | 613,495 | ||||||
| 6,660 | Occidental Petroleum Corp. | 536,863 | ||||||
|
| |||||||
| 1,938,309 | ||||||||
|
| |||||||
Financials — 8.2% | ||||||||
| 7,000 | KKR & Co. LP | 162,470 | ||||||
| 11,000 | MetLife, Inc. | 594,990 | ||||||
| 4,402 | Travelers Cos., Inc. (The) | 465,952 | ||||||
|
| |||||||
| 1,223,412 | ||||||||
|
| |||||||
Health Care — 21.1% | ||||||||
| 9,635 | Abbott Laboratories | 433,768 | ||||||
| 6,630 | AbbVie, Inc. | 433,867 | ||||||
| 4,300 | Anthem, Inc. | 540,381 | ||||||
| 7,980 | Baxter International, Inc. | 584,854 | ||||||
| 6,200 | Novartis AG, ADR | 574,492 | ||||||
| 18,260 | Pfizer, Inc. | 568,799 | ||||||
|
| |||||||
| 3,136,161 | ||||||||
|
| |||||||
Shares | Fair Value | |||||||
COMMON STOCKS — (continued) | ||||||||
Industrials — 8.0% | ||||||||
| 23,400 | General Electric Co. | $ | 591,318 | |||||
| 5,300 | United Parcel Service, Inc., Class B | 589,201 | ||||||
|
| |||||||
| 1,180,519 | ||||||||
|
| |||||||
Information Technology — 10.7% |
| |||||||
| 18,000 | Maxim Integrated Products, Inc. | 573,660 | ||||||
| 9,190 | Microsoft Corp. | 426,875 | ||||||
| 7,830 | QUALCOMM, Inc. | 582,004 | ||||||
|
| |||||||
| 1,582,539 | ||||||||
|
| |||||||
Materials — 2.1% | ||||||||
| 5,000 | Scotts Miracle-Gro Co. (The), Class A | 311,600 | ||||||
|
| |||||||
Telecommunication Services — 3.8% |
| |||||||
| 12,195 | Verizon Communications, Inc. | 570,482 | ||||||
|
| |||||||
Total Common Stocks | 14,574,449 | |||||||
|
| |||||||
MONEY MARKET FUND — 1.5% | ||||||||
| 219,986 | Federated Treasury Obligations Fund, Institutional Shares | 219,986 | ||||||
|
| |||||||
Total Money Market Fund | 219,986 | |||||||
|
| |||||||
Total Investments — 99.8% | 14,794,435 | |||||||
Net Other Assets (Liabilities) — 0.2% | 30,272 | |||||||
|
| |||||||
NET ASSETS — 100.0% | $ | 14,824,707 | ||||||
|
| |||||||
ADR — American Depositary Receipt
See accompanying Notes to the Financial Statements.
7
Sterling Capital Special Opportunities VIF
|
Schedule of Portfolio Investments |
December 31, 2014
|
Shares | Fair Value | |||||||
COMMON STOCKS — 94.4% | ||||||||
Consumer Discretionary — 18.1% |
| |||||||
| 27,000 | Comcast Corp., Class A | $ | 1,566,270 | |||||
| 17,000 | DIRECTV(a) | 1,473,900 | ||||||
| 28,600 | Discovery Communications, Inc., | 964,392 | ||||||
| 63,000 | Ford Motor Co. | 976,500 | ||||||
|
| |||||||
| 4,981,062 | ||||||||
|
| |||||||
Consumer Staples — 3.6% | ||||||||
| 27,000 | Mondelez International, Inc., Class A | 980,775 | ||||||
|
| |||||||
Energy — 6.1% | ||||||||
| 18,000 | Cabot Oil & Gas Corp. | 532,980 | ||||||
| 8,500 | EOG Resources, Inc. | 782,595 | ||||||
| 9,000 | Halliburton Co. | 353,970 | ||||||
|
| |||||||
| 1,669,545 | ||||||||
|
| |||||||
Financials — 9.4% | ||||||||
| 8,616 | American Campus Communities, Inc., REIT | 356,358 | ||||||
| 14,000 | Capital One Financial Corp. | 1,155,700 | ||||||
| 15,500 | Och-Ziff Capital Management Group, LLC, Class A | 181,040 | ||||||
| 17,100 | Ryman Hospitality Properties, Inc., REIT | 901,854 | ||||||
|
| |||||||
| 2,594,952 | ||||||||
|
| |||||||
Health Care — 12.9% | ||||||||
| 17,000 | HCA Holdings, Inc.(a) | 1,247,630 | ||||||
| 7,800 | MEDNAX, Inc.(a) | 515,658 | ||||||
| 19,500 | Myriad Genetics, Inc.(a) | 664,170 | ||||||
| 11,000 | UnitedHealth Group, Inc. | 1,111,990 | ||||||
|
| |||||||
| 3,539,448 | ||||||||
|
| |||||||
Industrials — 11.7% | ||||||||
| 15,129 | Expeditors International of Washington, Inc. | 674,904 | ||||||
| 7,500 | J.B. Hunt Transport Services, Inc. | 631,875 | ||||||
| 24,000 | Nielsen NV | 1,073,520 | ||||||
Shares | Fair Value | |||||||
COMMON STOCKS — (continued) | ||||||||
Industrials — (continued) | ||||||||
| 13,000 | Verisk Analytics, Inc., Class A(a) | $ | 832,650 | |||||
|
| |||||||
| 3,212,949 | ||||||||
|
| |||||||
Information Technology — 32.6% |
| |||||||
| 40,000 | Activision Blizzard, Inc. | 806,000 | ||||||
| 17,000 | Akamai Technologies, Inc.(a) | 1,070,320 | ||||||
| 19,000 | Check Point Software | 1,492,830 | ||||||
| 59,500 | Cisco Systems, Inc. | 1,654,993 | ||||||
| 15,600 | Citrix Systems, Inc.(a) | 995,280 | ||||||
| 24,500 | eBay, Inc.(a) | 1,374,940 | ||||||
| 11,600 | Intuit, Inc. | 1,069,404 | ||||||
| 17,000 | NCR Corp.(a) | 495,380 | ||||||
|
| |||||||
| 8,959,147 | ||||||||
|
| |||||||
Total Common Stocks | 25,937,878 | |||||||
|
| |||||||
MONEY MARKET FUND — 5.6% | ||||||||
| 1,545,520 | Federated Treasury Obligations Fund, Institutional Shares | 1,545,520 | ||||||
|
| |||||||
Total Money Market Fund | 1,545,520 | |||||||
|
| |||||||
Total Investments — 100.0% | 27,483,398 | |||||||
Net Other Assets (Liabilities) — (0.0)% | (1,694 | ) | ||||||
|
| |||||||
NET ASSETS — 100.0% | $ | 27,481,704 | ||||||
|
| |||||||
| (a) | Represents non-income producing security. |
REIT — Real Estate Investment Trust
See accompanying Notes to the Financial Statements.
8
Sterling Capital Total Return Bond VIF
|
Schedule of Portfolio Investments |
December 31, 2014
|
Principal Amount | Fair Value | |||||||
ASSET BACKED SECURITIES — 10.5% | ||||||||
| $ 67,614 | Argent Securities, Inc. Pass Through Certificates, Series 2005-W3, | $ | 64,953 | |||||
| 246,000 | Avis Budget Rental Car Funding AESOP, LLC, Series 2014-2A, Class A, 2.500%, 2/20/21(b) | 245,987 | ||||||
| 30,000 | CarMax Auto Owner Trust, | 29,743 | ||||||
| 102,000 | CarMax Auto Owner Trust, | 101,690 | ||||||
| 140,000 | Chase Issuance Trust, | 142,412 | ||||||
| 200,000 | Discover Card Execution Note Trust, Series 2014-A4, Class A4, 2.120%, 12/15/21 | 200,446 | ||||||
| 100,000 | Ford Credit Auto Owner Trust 2014-REV2, Series 2014-2, Class A, 2.310%, 4/15/26(b) | 100,258 | ||||||
| 66,617 | Long Beach Mortgage Loan Trust, Series 2006-WL2, Class 2A3, 0.370%, 1/25/36(a) | 64,631 | ||||||
| 46,546 | Park Place Securities, Inc. Pass Through Certificates, Series 2005-WHQ1, Class M2, | 46,195 | ||||||
| 30,000 | SBA Tower Trust, Series 2014-1A, Class C, STEP, 2.898%, 10/15/44(b) | 30,079 | ||||||
| 133,258 | Securitized Asset Backed Receivables, LLC Trust, Series 2005-OP2, | 129,214 | ||||||
| 71,000 | World Omni Auto Receivables Trust, Series 2013-A, Class A3, 0.640%, 4/16/18 | 70,955 | ||||||
| 28,000 | World Omni Auto Receivables Trust, Series 2014-A, Class A3, 0.940%, 4/15/19 | 27,950 | ||||||
|
| |||||||
Total Asset Backed Securities | 1,254,513 | |||||||
|
| |||||||
COLLATERALIZED MORTGAGE OBLIGATIONS — 10.2% | ||||||||
| 45,448 | Adjustable Rate Mortgage Trust, Series 2004-5, Class 4A1, | 44,613 | ||||||
| 39,344 | Banc of America Alternative Loan Trust, Series 2004-10, Class 1CB1, 6.000%, 11/25/34 | 40,899 | ||||||
| 76,930 | Banc of America Funding Trust, Series 2006-2, Class 3A1, 6.000%, 3/25/36 | 77,140 | ||||||
| 43,819 | Countrywide Alternative Loan Trust, Series 2004-22CB, Class 1A1, 6.000%, 10/25/34 | 46,444 | ||||||
| 73,598 | Fannie Mae, Series 2011-99, Class CV, 4.500%, 3/25/26 | 81,095 | ||||||
| 58,656 | Freddie Mac, Series 3768, Class V, 4.000%, 11/15/23 | 63,123 | ||||||
| 56,440 | Freddie Mac, Series 4287, Class V, 4.500%, 10/1/26 | 62,656 | ||||||
| 76,791 | Freddie Mac, Series 4323, Class VA, 4.000%, 3/15/27 | 83,612 | ||||||
| 134,554 | Freddie Mac, Series 4077, Class PJ, 3.500%, 11/15/40 | 141,682 | ||||||
| 66,799 | Freddie Mac, Series 4328, Class KD, 3.000%, 8/15/43 | 68,608 | ||||||
| 47,055 | MASTR Alternative Loan Trust, | 49,373 | ||||||
| 39,781 | PHHMC Trust, Series 2007-6, | 39,953 | ||||||
| 9,149 | RAAC Trust, Series 2004-SP3, | 9,353 | ||||||
| 53,783 | RALI Trust, Series 2005-QR1, | 56,202 | ||||||
Principal Amount | Fair Value | |||||||
COLLATERALIZED MORTGAGE | ||||||||
| $ 35,531 | Residential Asset Securitization Trust, Series 2004-IP2, Class 4A, 2.462%, 12/25/34(a) | $ | 35,292 | |||||
| 62,012 | Specialty Underwriting & Residential Finance Trust, Series 2004-AA1, Class 1A1, 5.000%, 10/25/34 | 62,649 | ||||||
| 81,013 | Structured Adjustable Rate Mortgage Loan Trust, Series 2004-6, Class 4A1, 2.390%, 6/25/34(a) | 81,480 | ||||||
| 11,662 | Structured Asset Securities Corp. Trust, Series 2005-6, Class 5A1, 5.000%, 5/25/35 | 11,867 | ||||||
| 74,772 | Wells Fargo Mortgage Backed Securities Trust, Series 2004-BB, Class A2, 2.616%, 1/25/35(a) | 74,199 | ||||||
| 74,680 | Wells Fargo Mortgage Backed Securities Trust, Series 2005-AR16, Class 6A3, 2.605%, 10/25/35(a) | 74,935 | ||||||
| 14,113 | Wells Fargo Mortgage Backed Securities Trust, Series 2007-16, Class 1A1, 6.000%, 12/28/37 | 14,554 | ||||||
|
| |||||||
Total Collateralized Mortgage Obligations | 1,219,729 | |||||||
|
| |||||||
COMMERCIAL MORTGAGE-BACKED SECURITIES — 17.2% | ||||||||
| 74,665 | Banc of America Commercial Mortgage Trust, Series 2006-3, Class A4, 5.889%, 7/10/44(a) | 78,584 | ||||||
| 120,000 | Banc of America Commercial Mortgage Trust, Series 2006-5, Class A4, 5.414%, 9/10/47. | 125,532 | ||||||
| 4,638 | Banc of America Commercial Mortgage Trust, Series 2007-2, Class A2, 5.622%, 4/10/49(a) | 4,639 | ||||||
| 80,000 | Banc of America Commercial Mortgage Trust, Series 2007-5, Class A4, 5.492%, 2/10/51. | 85,384 | ||||||
| 73,000 | Banc of America Merrill Lynch Commercial Mortgage, Inc., | 72,980 | ||||||
| 40,000 | Banc of America Merrill Lynch Commercial Mortgage, Inc., Series 2005-3, Class AM, 4.727%, 7/10/43 | 40,504 | ||||||
| 93,460 | Bear Stearns Commercial Mortgage Securities Trust, Series 2007-Top26, Class A4, 5.471%, 1/12/45(a) | 100,104 | ||||||
| 60,000 | Bear Stearns Commercial Mortgage Securities Trust, Series 2007-PW18, Class A4, 5.700%, 6/11/50 | 65,217 | ||||||
| 82,000 | CD Commercial Mortgage Trust, Series 2007-CD4, Class A4, 5.322%, 12/11/49 | 86,818 | ||||||
| 86,314 | COMM Mortgage Trust, Series 2006-C7, Class A4, 5.756%, 6/10/46(a) | 90,471 | ||||||
| 30,000 | COMM Mortgage Trust, Series 2014-LC17, Class A5, 3.917%, 10/10/47. | 32,021 | ||||||
| 30,000 | COMM Mortgage Trust, Series 2014-CR20, Class A4, 3.590%, 11/1/47 | 31,203 | ||||||
| 117,000 | Commercial Mortgage Trust, Series 2005-GG5, Class AM, 5.277%, 4/10/37(a) | 119,551 | ||||||
| 124,741 | Credit Suisse First Boston Mortgage Securities Corp., Series 2005-C1, Class AJ, 5.075%, 2/15/38(a) | 124,707 | ||||||
| 131,579 | GMAC Commercial Mortgage Securities, Inc., Series 2006-C1, Class A4, 5.238%, 11/10/45(a) | 133,908 | ||||||
Continued
9
Sterling Capital Total Return Bond VIF
|
Schedule of Portfolio Investments — (continued) |
December 31, 2014
|
| Principal Amount | Fair Value | |||||||
| COMMERCIAL MORTGAGE-BACKED | |||||||
| $ | 56,000 | GS Mortgage Securities Trust, | $ 59,740 | |||||
| 35,000 | JPMBB Commercial Mortgage Securities Trust, Series 2014-C23, Class A5, 3.934%, 9/15/47 | 37,477 | ||||||
| 145,699 | LB-UBS Commercial Mortgage Trust, Series 2007-C1, Class A4, 5.424%, 2/15/40 | 156,022 | ||||||
| 51,092 | Merrill Lynch Mortgage Trust, | 55,592 | ||||||
| 16,000 | Morgan Stanley Bank of America Merrill Lynch Trust, | 17,063 | ||||||
| 107,451 | Morgan Stanley Capital I Trust, Series 2008-T29, Class A4, 6.278%, 1/11/43(a) | 119,852 | ||||||
| 80,000 | Morgan Stanley Capital I Trust, Series 2006-HQ8, Class AM, | 83,228 | ||||||
| 130,000 | Morgan Stanley Capital I Trust, Series 2007-IQ14, Class A5, | 140,589 | ||||||
| 41,053 | Wachovia Bank Commercial Mortgage Trust, Series 2007-C30, Class A3, 5.246%, 12/15/43 | 41,882 | ||||||
| 58,336 | Wachovia Bank Commercial Mortgage Trust, Series 2006-C27, Class A3, 5.765%, 7/15/45(a) | 61,100 | ||||||
| 61,000 | WF-RBS Commercial Mortgage Trust, Series 2014-C22, Class A5, 3.752%, 9/15/57 | 64,293 | ||||||
| 25,000 | WF-RBS Commercial Mortgage Trust, Series 2014-C23, Class A5, 3.917%, 10/15/57 | 26,692 | ||||||
| ||||||||
Total Commercial Mortgage-Backed Securities | 2,055,153 | |||||||
| ||||||||
| CORPORATE BONDS — 34.8% | |||||||
Consumer Discretionary — 3.7% | ||||||||
| 21,000 | 21st Century Fox America, Inc., 5.400%, 10/1/43 | 25,001 | ||||||
| 31,000 | ERAC USA Finance, LLC, 5.625%, 3/15/42(b) | 36,191 | ||||||
| 29,000 | Ford Motor Co., 7.450%, 7/16/31 | 39,370 | ||||||
| 47,000 | General Motors Financial Co., Inc., 2.750%, 5/15/16 | 47,764 | ||||||
| 41,000 | Lear Corp., 5.375%, 3/15/24 | 41,923 | ||||||
| 20,000 | Lowe’s Cos., Inc., 5.800%, 4/15/40 | 25,335 | ||||||
| 27,000 | NBC Universal Media, LLC, 5.950%, 4/1/41 | 34,720 | ||||||
| 25,000 | Omnicom Group, Inc., 3.650%, 11/1/24 | 25,012 | ||||||
| 26,000 | Royal Caribbean Cruises, Ltd., 11.875%, 7/15/15 | 27,300 | ||||||
| 37,000 | Time Warner Cable, Inc., 4.000%, 9/1/21 | 39,379 | ||||||
| 20,000 | Time Warner, Inc., 6.100%, 7/15/40 | 24,356 | ||||||
| 40,000 | Toll Brothers Finance Corp., 6.750%, 11/1/19 | 44,800 | ||||||
| 29,000 | Viacom, Inc., 5.850%, 9/1/43 | 32,250 | ||||||
| ||||||||
| 443,401 | ||||||||
| ||||||||
Consumer Staples — 0.9% | ||||||||
| 28,000 | Altria Group, Inc., 5.375%, 1/31/44 | 31,873 | ||||||
| 26,000 | CVS Health Corp., 6.125%, 9/15/39 | 33,596 | ||||||
| 25,000 | Lorillard Tobacco Co., 6.875%, 5/1/20 | 29,447 | ||||||
| 11,000 | Walgreens Boots Alliance, Inc., 2.700%, 11/18/19 | 11,056 | ||||||
| ||||||||
| 105,972 | ||||||||
| ||||||||
Energy — 4.9% | ||||||||
| 30,000 | Access Midstream Partners LP/ACMP Finance Corp., 6.125%, 7/15/22 | 31,875 | ||||||
| Principal Amount | Fair Value | |||||||
| CORPORATE BONDS — (continued) | |||||||
Energy — (continued) | ||||||||
| $ | 16,000 | Access Midstream Partners LP/ACMP Finance Corp., 4.875%, 3/15/24 | $ 16,240 | |||||
| 33,000 | Chesapeake Energy Corp., 3.481%, 4/15/19(a) | 32,340 | ||||||
| 35,000 | Continental Resources, Inc., 4.900%, 6/1/44 | 30,333 | ||||||
| 24,000 | Enable Midstream Partners LP, 5.000%, 5/15/44(b) | 22,608 | ||||||
| 18,000 | Energy Transfer Partners LP, 9.000%, 4/15/19 | 22,092 | ||||||
| 25,000 | EnLink Midstream Partners LP, 5.050%, 4/1/45 | 24,152 | ||||||
| 40,000 | Enterprise Products Operating, LLC, 5.950%, 2/1/41 | 47,028 | ||||||
| 33,000 | Freeport-McMoran Oil & Gas, LLC/FCX Oil & Gas, Inc., 6.500%, 11/15/20 | 35,722 | ||||||
| 32,000 | Kinder Morgan Energy Partners LP, 5.000%, 3/1/43 | 30,398 | ||||||
| 20,000 | Kinder Morgan, Inc., 2.000%, 12/1/17 | 19,876 | ||||||
| 30,000 | Kodiak Oil & Gas Corp., 8.125%, 12/1/19 | 30,525 | ||||||
| 28,000 | MarkWest Energy Partners LP/MarkWest | |||||||
Energy Finance Corp., 6.750%, 11/1/20 | 29,120 | |||||||
| 32,000 | NuStar Logistics LP, 8.150%, 4/15/18 | 35,891 | ||||||
| 29,000 | Oceaneering International, Inc., 4.650%, 11/15/24 | 28,395 | ||||||
| 33,000 | Petrobras International Finance Co., SA, 3.500%, 2/6/17 | 31,512 | ||||||
| 27,000 | Phillips 66, 5.875%, 5/1/42 | 31,093 | ||||||
| 26,000 | Regency Energy Partners LP/Regency Energy Finance Corp., 6.500%, 7/15/21 | 26,520 | ||||||
| 30,000 | Shell International Finance BV, 4.550%, 8/12/43 | 32,819 | ||||||
| 27,000 | Statoil ASA, 4.800%, 11/8/43 | 30,698 | ||||||
| ||||||||
| 589,237 | ||||||||
| ||||||||
Financials — 18.2% | ||||||||
| 33,000 | Ally Financial, Inc., 2.750%, 1/30/17 | 32,897 | ||||||
| 31,000 | Apollo Management Holdings LP, 4.000%, 5/30/24(b) | 31,550 | ||||||
| 30,000 | Ares Finance Co., LLC, | 29,466 | ||||||
| 45,000 | Aspen Insurance Holdings, Ltd., 4.650%, 11/15/23 | 46,740 | ||||||
| 39,000 | Associates Corp. of North America, 6.950%, 11/1/18 | 45,552 | ||||||
| 69,000 | Bank of America Corp., MTN, 6.875%, 4/25/18 | 79,252 | ||||||
| 25,000 | Bank of America Corp., MTN, 5.875%, 2/7/42 | 31,284 | ||||||
| 31,000 | Bank of America Corp., Series K, 8.000%, 7/29/49(a) | 33,286 | ||||||
| 54,000 | Bear Stearns Cos., LLC (The), 5.550%, 1/22/17 | 58,210 | ||||||
| 30,000 | CBRE Services, Inc., 5.250%, 3/15/25 | 30,600 | ||||||
| 40,000 | CIT Group, Inc., 4.250%, 8/15/17 | 40,800 | ||||||
| 26,000 | Citigroup, Inc., 5.875%, 1/30/42 | 32,704 | ||||||
| 46,000 | Corrections Corp. of America, REIT, 4.125%, 4/1/20 | 44,735 | ||||||
| 45,000 | CubeSmart LP, REIT, 4.800%, 7/15/22 | 49,415 | ||||||
| 32,000 | Excel Trust LP, REIT, 4.625%, 5/15/24 | 33,207 | ||||||
| 7,000 | Federal Realty Investment Trust, REIT, 2.750%, 6/1/23 | 6,742 | ||||||
| 29,000 | First Data Corp., 7.375%, 6/15/19(b) | 30,524 | ||||||
| 42,000 | General Electric Capital Corp., 5.300%, 2/11/21 | 47,963 | ||||||
| 24,000 | General Electric Capital Corp., GMTN, 6.875%, 1/10/39 | 33,948 | ||||||
| 31,000 | Goldman Sachs Group, Inc. (The), 6.250%, 2/1/41 | 39,188 | ||||||
Continued
10
Sterling Capital Total Return Bond VIF
|
Schedule of Portfolio Investments — (continued) |
December 31, 2014
|
| Principal Amount | Fair Value | |||||||
| CORPORATE BONDS — (continued) | |||||||
Financials — (continued) | ||||||||
| $ | 60,000 | Health Care REIT, Inc., 4.950%, 1/15/21 | $ 65,975 | |||||
| 40,000 | Healthcare Realty Trust, Inc., REIT, 3.750%, 4/15/23 | 39,261 | ||||||
| 47,000 | Healthcare Trust of America Holdings LP, REIT, 3.700%, 4/15/23 | 46,490 | ||||||
| 30,000 | Host Hotels & Resorts LP, REIT, | 29,923 | ||||||
| 40,000 | HSBC Finance Corp., 6.676%, 1/15/21 | 47,458 | ||||||
| 35,000 | International Lease Finance Corp., 4.875%, 4/1/15 | 35,254 | ||||||
| 35,000 | Jefferies Group, LLC, 8.500%, 7/15/19 | 41,942 | ||||||
| 42,000 | Jones Lang LaSalle, Inc., 4.400%, 11/15/22 | 43,588 | ||||||
| 25,000 | JPMorgan Chase & Co., Series 1, 7.900%, 4/29/49(a) | 26,908 | ||||||
| 30,000 | Liberty Mutual Group, Inc., 7.800%, 3/15/37(b) | 35,100 | ||||||
| 29,000 | Macquarie Bank, Ltd., | 33,478 | ||||||
| 19,000 | Massachusetts Mutual Life Insurance Co., 8.875%, 6/1/39(b) | 30,656 | ||||||
| 77,000 | Morgan Stanley, GMTN, | 87,706 | ||||||
| 92,000 | Murray Street Investment Trust I, STEP, 4.647%, 3/9/17 | 97,097 | ||||||
| 53,000 | National City Corp., 6.875%, 5/15/19 | 62,262 | ||||||
| 33,000 | National Rural Utilities Cooperative Finance Corp., 4.750%, 4/30/43(a) | 32,703 | ||||||
| 25,000 | Nationwide Mutual Insurance Co., 9.375%, 8/15/39(b) | 39,611 | ||||||
| 37,000 | Old Republic International Corp., 4.875%, 10/1/24 | 38,623 | ||||||
| 36,000 | Pacific LifeCorp, 5.125%, 1/30/43(b) | 39,592 | ||||||
| 25,000 | Prudential Financial, Inc., 8.875%, 6/15/38(a) | 29,188 | ||||||
| 27,000 | Prudential Financial, Inc., MTN, | 32,458 | ||||||
| 32,000 | Reinsurance Group of America, Inc., 5.625%, 3/15/17 | 34,605 | ||||||
| 30,000 | Retail Opportunity Investments Partnership LP, REIT, 5.000%, 12/15/23 | 32,520 | ||||||
| 37,000 | Royal Bank of Canada, GMTN, 2.200%, 7/27/18 | 37,411 | ||||||
| 30,000 | Royal Bank of Scotland Group PLC, 4.700%, 7/3/18 | 31,048 | ||||||
| 17,000 | Senior Housing Properties Trust, REIT, 6.750%, 4/15/20 | 19,210 | ||||||
| 45,000 | Simon Property Group LP, REIT, 10.350%, 4/1/19 | 58,859 | ||||||
| 30,000 | Sirius International Group, Ltd., 6.375%, 3/20/17(b) | 32,948 | ||||||
| 38,000 | SunTrust Banks, Inc., 3.500%, 1/20/17 | 39,613 | ||||||
| 25,000 | Symetra Financial Corp., 4.250%, 7/15/24 | 25,483 | ||||||
| 53,000 | TIAA Asset Management Finance Co., LLC, 2.950%, 11/1/19(b) | 53,103 | ||||||
| 26,000 | Transatlantic Holdings, Inc., 8.000%, 11/30/39 | 37,444 | ||||||
| 25,000 | Validus Holdings, Ltd., 8.875%, 1/26/40 | 34,938 | ||||||
| 25,000 | Wachovia Corp., 5.500%, 8/1/35 | 29,349 | ||||||
| ||||||||
| 2,179,867 | ||||||||
| ||||||||
Health Care — 1.3% | ||||||||
| 36,000 | DaVita HealthCare Partners, Inc., 6.625%, 11/1/20 | 37,800 | ||||||
| 28,000 | Fresenius US Finance II, Inc., 9.000%, 7/15/15(b) | 28,840 | ||||||
| 25,000 | Humana, Inc., 4.950%, 10/1/44 | 26,582 | ||||||
| Principal Amount | Fair Value | |||||||
| CORPORATE BONDS — (continued) | |||||||
Health Care — (continued) | ||||||||
| $ | 30,000 | Medtronic, Inc., 4.375%, 3/15/35(b) | $ 31,826 | |||||
| 25,000 | Ventas Realty LP, 5.700%, 9/30/43 | 29,991 | ||||||
| ||||||||
| 155,039 | ||||||||
| ||||||||
Industrials — 1.2% | ||||||||
| 24,000 | Burlington Northern Santa Fe, LLC, 4.950%, 9/15/41 | 26,696 | ||||||
| 36,000 | CNH Industrial Capital, LLC, 3.875%, 11/1/15 | 36,180 | ||||||
| 37,000 | United Rentals North America, Inc., 7.375%, 5/15/20 | 39,960 | ||||||
| 35,000 | Verisk Analytics, Inc., 5.800%, 5/1/21 | 39,434 | ||||||
| ||||||||
| 142,270 | ||||||||
| ||||||||
Materials — 2.3% | ||||||||
| 30,000 | Glencore Finance Canada, Ltd., 4.250%, 10/25/22(b) | 29,853 | ||||||
| 18,000 | International Paper Co., 7.300%, 11/15/39 | 23,866 | ||||||
| 36,000 | Louisiana-Pacific Corp., 7.500%, 6/1/20 | 37,890 | ||||||
| 40,000 | LYB International Finance BV, 4.875%, 3/15/44 | 41,151 | ||||||
| 32,000 | Mosaic Co. (The), 5.450%, 11/15/33 | 36,205 | ||||||
| 34,000 | PetroLogistics LP/PetroLogistics Finance Corp., 6.250%, 4/1/20 | 36,635 | ||||||
| 34,000 | Rockwood Specialties Group, Inc., 4.625%, 10/15/20 | 35,105 | ||||||
| 35,000 | West Fraser Timber Co., Ltd., 4.350%, 10/15/24(b) | 33,454 | ||||||
| ||||||||
| 274,159 | ||||||||
| ||||||||
Telecommunication Services — 1.5% | ||||||||
| 21,000 | British Telecommunications PLC, 9.625%, 12/15/30 | 32,971 | ||||||
| 35,000 | GTP Acquisition Partners I, LLC, 7.628%, 6/15/16(b) | 36,635 | ||||||
| 26,000 | Level 3 Financing, Inc., 9.375%, 4/1/19 | 27,430 | ||||||
| 64,000 | Verizon Communications, Inc., 6.550%, 9/15/43 | 81,994 | ||||||
| ||||||||
| 179,030 | ||||||||
| ||||||||
Utilities — 0.8% | ||||||||
| 30,000 | CMS Energy Corp., 4.700%, 3/31/43 | 31,972 | ||||||
| 23,000 | Progress Energy, Inc., 3.150%, 4/1/22 | 23,299 | ||||||
| 37,000 | PSEG Power, LLC, 2.450%, 11/15/18 | 37,059 | ||||||
| ||||||||
| 92,330 | ||||||||
| ||||||||
Total Corporate Bonds | 4,161,305 | |||||||
| ||||||||
| FOREIGN GOVERNMENT BONDS — 0.9% | |||||||
Mexico — 0.9% | ||||||||
| 32,000 | United Mexican States, 5.550%, 1/21/45 | 37,200 | ||||||
| 72,000 | United Mexican States, MTN, 4.750%, 3/8/44 | 75,060 | ||||||
| ||||||||
| 112,260 | ||||||||
| ||||||||
Total Foreign Government Bonds | 112,260 | |||||||
| ||||||||
| MORTGAGE-BACKED SECURITIES — 10.8% | |||||||
Fannie Mae — 6.1% | ||||||||
| 4,001 | 4.500%, 10/1/18, Pool #752030 | 4,203 | ||||||
| 6,838 | 5.000%, 10/1/25, Pool #255894 | 7,549 | ||||||
| 115,843 | 4.000%, 6/1/32, Pool #MA1089 | 124,918 | ||||||
Continued
11
Sterling Capital Total Return Bond VIF
|
Schedule of Portfolio Investments — (continued) |
December 31, 2014
|
| Principal Amount | Fair Value | |||||||
| MORTGAGE-BACKED SECURITIES — (continued) | |||||||
Fannie Mae — (continued) | ||||||||
| $ | 83,094 | 4.000%, 6/1/34, Pool #MA1922 | $ 89,343 | |||||
| 3,133 | 7.000%, 6/1/35, Pool #255820 | 3,583 | ||||||
| 11,562 | 5.000%, 11/1/35, Pool #842402 | 12,801 | ||||||
| 9,353 | 6.000%, 12/1/36, Pool #902054 | 10,644 | ||||||
| 86,522 | 5.500%, 8/1/37, Pool #995082 | 97,202 | ||||||
| 39,998 | 5.000%, 6/1/40, Pool #AD4927 | 44,317 | ||||||
| 35,264 | 5.000%, 6/1/40, Pool #AD7860 | 39,060 | ||||||
| 74,507 | 4.500%, 5/1/41, Pool #AI1023 | 80,909 | ||||||
| 22,973 | 4.500%, 11/1/41, Pool #AJ4994 | 24,957 | ||||||
| 76,623 | 4.000%, 1/1/42, Pool #AK0685 | 81,873 | ||||||
| 110,676 | 3.500%, 5/1/43, Pool #AB9368 | 115,501 | ||||||
| ||||||||
| 736,860 | ||||||||
| ||||||||
Freddie Mac — 3.5% | ||||||||
| 5,204 | 6.000%, 10/1/19, Pool #G11679 | 5,490 | ||||||
| 3,661 | 5.500%, 10/1/21, Pool #G12425 | 3,987 | ||||||
| 14,389 | 6.500%, 12/1/37, Pool #A69955 | 16,768 | ||||||
| 57,543 | 4.500%, 1/1/40, Pool #A90764 | 62,415 | ||||||
| 42,353 | 3.767%, 7/1/40, Pool #1B4948(a) | 44,697 | ||||||
| 121,882 | 5.000%, 7/1/40, Pool #A93070 | 134,934 | ||||||
| 112,864 | 4.000%, 11/1/41, Pool #Q04740 | 120,690 | ||||||
| 28,594 | 3.500%, 7/1/44, Pool #Q27286 | 29,764 | ||||||
| ||||||||
| 418,745 | ||||||||
| ||||||||
Ginnie Mae — 1.2% | ||||||||
| 93,589 | 4.500%, 6/15/39, Pool #701962 | 102,320 | ||||||
| 35,356 | 5.000%, 2/15/40, Pool #737037 | 39,150 | ||||||
| ||||||||
| 141,470 | ||||||||
| ||||||||
Total Mortgage-Backed Securities | 1,297,075 | |||||||
| ||||||||
| MUNICIPAL BONDS — 9.9% | |||||||
California — 2.9% | ||||||||
| 220,000 | Metropolitan Water District of Southern California, Build America Bonds, Water Utility Improvements Revenue, Callable 7/1/19 @ 100, 6.538%, 7/1/39 | 252,430 | ||||||
| 65,000 | State of California, Build America Bonds, School Improvements G.O., 7.625%, 3/1/40 | 99,772 | ||||||
| ||||||||
| 352,202 | ||||||||
| ||||||||
Colorado — 0.5% | ||||||||
| 55,000 | Colorado Housing & Finance Authority, Unemployment/Welfare Funding Revenue, Taxable, Series B, 1.600%, 5/15/16 | 55,702 | ||||||
| ||||||||
Connecticut — 0.5% | ||||||||
| 60,000 | State of Connecticut, Public Improvements G.O., Taxable, | 60,257 | ||||||
| ||||||||
District of Columbia — 0.5% | ||||||||
| 65,000 | George Washington University (The), Series 2012, 3.485%, 9/15/22 | 66,816 | ||||||
| ||||||||
Illinois — 1.1% | ||||||||
| 130,000 | State of Illinois, Public Improvements Revenue, Taxable, 2.931%, 6/15/22 | 129,623 | ||||||
| ||||||||
New Jersey — 0.3% | ||||||||
| 40,000 | New Jersey Economic Development Authority, School Facilities Construction, Refunding Revenue, Series 00, 1.648%, 3/1/18 | 39,413 | ||||||
| ||||||||
| Principal Amount | Fair Value | |||||||
| MUNICIPAL BONDS — (continued) | |||||||
New York — 2.3% | ||||||||
| $ | 100,000 | New York State Environmental Facilities Corp., State Revolving Funds, Refunding Revenue, Taxable, Series C, 2.745%, 6/15/22 | $ 99,100 | |||||
| 155,000 | New York, NY, Build America Bonds, Public Improvements G.O., 4.774%, 3/1/20 | 172,352 | ||||||
| ||||||||
| 271,452 | ||||||||
| ||||||||
Pennsylvania — 0.6% | ||||||||
| 70,000 | Philadelphia Authority for Industrial Development, Refunding Revenue, Taxable, 3.664%, 4/15/22 | 70,442 | ||||||
| ||||||||
Washington — 0.4% | ||||||||
| 45,000 | Port of Vancouver, WA, Refunding G.O., Limited Tax, Taxable, | 45,025 | ||||||
| ||||||||
Wisconsin — 0.8% | ||||||||
| 90,000 | Milwaukee County, WI, Pension Promissory Notes, Refunding G.O., Taxable, Callable 12/1/22 @ 100, 3.862%, 12/1/30 | 91,328 | ||||||
| ||||||||
Total Municipal Bonds | 1,182,260 | |||||||
| ||||||||
| U.S. GOVERNMENT AGENCIES — 0.1% | |||||||
Fannie Mae — 0.1% | ||||||||
| 4,000 | 6.250%, 5/15/29 | 5,573 | ||||||
| ||||||||
Total U.S. Government Agencies | 5,573 | |||||||
| ||||||||
| U.S. TREASURY BONDS — 1.9% | |||||||
| 212,000 | 3.125%, 2/15/43 | 227,618 | ||||||
| ||||||||
Total U.S. Treasury Bonds | 227,618 | |||||||
| ||||||||
| U.S. TREASURY NOTES — 0.2% | |||||||
| 28,000 | 0.875%, 7/15/17 | 27,967 | ||||||
| ||||||||
Total U.S. Treasury Notes | 27,967 | |||||||
| ||||||||
| Shares | ||||||||
| PREFERRED STOCKS — 1.2% | |||||||
Financials — 1.0% | ||||||||
| 2,059 | Citigroup Capital XIII, 7.875% | 54,728 | ||||||
| 1,137 | Lloyds Banking Group PLC, 7.750% | 29,312 | ||||||
| 1,341 | US Bancorp, Series F, 6.500% | 39,492 | ||||||
| ||||||||
| 123,532 | ||||||||
| ||||||||
Telecommunication | ||||||||
| 960 | Qwest Corp., 7.000% | 24,912 | ||||||
| ||||||||
Total Preferred Stocks | 148,444 | |||||||
| ||||||||
Continued
12
Sterling Capital Total Return Bond VIF
|
Schedule of Portfolio Investments — (continued) |
December 31, 2014
|
| Shares | Fair Value | |||||||
| MONEY MARKET FUND — 1.6% | |||||||
| 195,672 | Federated Treasury Obligations Fund, Institutional Shares | $195,672 | ||||||
| ||||||||
Total Money Market Fund | 195,672 | |||||||
| ||||||||
| Total Investments — 99.3% | 11,887,569 | ||||||
| Net Other Assets (Liabilities) — 0.7% | 79,774 | ||||||
| ||||||||
| NET ASSETS — 100.0% | $11,967,343 | ||||||
| ||||||||
| (a) | The interest rate for this variable rate note, which will change periodically, is based either on the prime rate or an index of market rates. The reflected rate is in effect as of December 31, 2014. The maturity date reflected is the final maturity date. |
| (b) | Rule 144A, Section 4(2) or other security that is restricted as to resale to qualified institutional investors. The Advisor, using Board approved procedures, has deemed these securities or a portion of these securities to be liquid. |
G.O. — General Obligation
GMTN — Global Medium Term Note
MTN — Medium Term Note
REIT — Real Estate Investment Trust
STEP — Step Coupon Bond
See accompanying Notes to the Financial Statements.
13
Sterling Capital Variable Insurance Funds
|
Statements of Assets and Liabilities December 31, 2014 |
| Sterling Capital Equity Income VIF | Sterling Capital Special Opportunities VIF | Sterling Capital Total Return Bond VIF | ||||||||||
Assets: | ||||||||||||
Investments at fair value (a) | $ | 14,794,435 | $ | 27,483,398 | $ | 11,887,569 | ||||||
Interest and dividends receivable | 26,099 | 13,467 | 92,703 | |||||||||
Receivable for investments sold | — | 111,661 | 140 | |||||||||
Receivable for capital shares issued | 13,116 | — | — | |||||||||
Prepaid expenses | 16,036 | 28,530 | 12,820 | |||||||||
|
|
|
|
|
| |||||||
Total Assets | 14,849,686 | 27,637,056 | 11,993,232 | |||||||||
|
|
|
|
|
| |||||||
Liabilities: | ||||||||||||
Payable for capital shares redeemed | 1,650 | 112,743 | 4,830 | |||||||||
Accrued expenses and other payables: | ||||||||||||
Investment advisory fees | 8,931 | 17,546 | 5,034 | |||||||||
Administration fees. | 1,168 | 2,134 | 921 | |||||||||
Accounting out-of-pocket fees | 1,419 | 1,356 | 5,750 | |||||||||
Audit fees | 7,086 | 12,752 | 5,474 | |||||||||
Printing fees | 3,000 | 5,398 | 2,318 | |||||||||
Other fees | 1,725 | 3,423 | 1,562 | |||||||||
|
|
|
|
|
| |||||||
Total Liabilities | 24,979 | 155,352 | 25,889 | |||||||||
|
|
|
|
|
| |||||||
Net Assets | $ | 14,824,707 | $ | 27,481,704 | $ | 11,967,343 | ||||||
|
|
|
|
|
| |||||||
Net Assets Consist of: | ||||||||||||
Capital | $ | 29,373,636 | $ | 14,463,331 | $ | 11,591,210 | ||||||
Undistributed net investment income | 19,896 | 46,794 | 203,459 | |||||||||
Accumulated realized gain (loss) | (16,320,267 | ) | 4,128,787 | (145,733 | ) | |||||||
Net unrealized appreciation | 1,751,442 | 8,842,792 | 318,407 | |||||||||
|
|
|
|
|
| |||||||
Net Assets | $ | 14,824,707 | $ | 27,481,704 | $ | 11,967,343 | ||||||
|
|
|
|
|
| |||||||
Shares of Beneficial Interest Outstanding (Unlimited number of shares authorized, no par value) | 1,383,855 | 1,438,448 | 1,214,722 | |||||||||
|
|
|
|
|
| |||||||
Net Asset Value — offering and redemption price per share | $ | 10.71 | $ | 19.11 | $ | 9.85 | ||||||
|
|
|
|
|
| |||||||
(a) Investments at cost. | $ | 13,042,993 | $ | 18,640,606 | $ | 11,569,162 | ||||||
See accompanying Notes to the Financial Statements.
14
Sterling Capital Variable Insurance Funds
|
Statements of Operations
|
For the Year Ended December 31, 2014
|
| Sterling Capital Equity Income VIF | Sterling Capital Special Opportunities VIF | Sterling Capital Total Return Bond VIF | ||||||||||
Investment Income: | ||||||||||||
Interest income. | $ | 14 | $ | — | $ | 468,087 | ||||||
Dividend income | 510,302 | 332,652 | 14,171 | |||||||||
Foreign taxes withheld | (4,084 | ) | (3,420 | ) | — | |||||||
|
|
|
|
|
| |||||||
Total investment income | 506,232 | 329,232 | 482,258 | |||||||||
|
|
|
|
|
| |||||||
Expenses: | ||||||||||||
Investment advisory fees (See Note 4) | 113,033 | 223,186 | 62,522 | |||||||||
Administration fees (See Note 4) | 14,878 | 26,810 | 11,522 | |||||||||
Accounting out-of-pocket fees | 6,856 | 7,834 | 33,184 | |||||||||
Audit fees | 16,916 | 30,526 | 12,952 | |||||||||
Custodian fees | 1,290 | 1,932 | 1,101 | |||||||||
Fund accounting fees (See Note 4) | 1,211 | 2,183 | 938 | |||||||||
Insurance fees | 21,827 | 36,765 | 17,558 | |||||||||
Interest expense (See Note 5) | 4 | 17 | — | |||||||||
Legal fees | 2,058 | 3,894 | 1,471 | |||||||||
Printing fees | 9,697 | 16,140 | 7,492 | |||||||||
Transfer agent fees (See Note 4) | 4,928 | 8,869 | 3,785 | |||||||||
Trustee fees | 1,751 | 3,148 | 1,347 | |||||||||
Other fees | 2,716 | 4,568 | 2,207 | |||||||||
|
|
|
|
|
| |||||||
Total expenses before waivers | 197,165 | 365,872 | 156,079 | |||||||||
Less expenses waived by the Investment Advisor (See Note 4) | (6,506 | ) | (974 | ) | (5,140 | ) | ||||||
|
|
|
|
|
| |||||||
Net expenses | 190,659 | 364,898 | 150,939 | |||||||||
|
|
|
|
|
| |||||||
Net investment income (loss) | 315,573 | (35,666 | ) | 331,319 | ||||||||
|
|
|
|
|
| |||||||
Realized and Unrealized Gain (Loss): | ||||||||||||
Net realized gain from investments | 521,171 | 4,251,491 | 76,550 | |||||||||
Change in unrealized appreciation/depreciation on investments | (202,727 | ) | 185,922 | 264,607 | ||||||||
|
|
|
|
|
| |||||||
Total realized and unrealized gain | 318,444 | 4,437,413 | 341,157 | |||||||||
|
|
|
|
|
| |||||||
Change in net assets from operations | $ | 634,017 | $ | 4,401,747 | $ | 672,476 | ||||||
|
|
|
|
|
| |||||||
See accompanying Notes to the Financial Statements.
15
Sterling Capital Variable Insurance Funds
|
Statements of Changes in Net Assets
|
Sterling Capital Equity Income VIF | ||||||||||
For the Year Ended December 31, 2014 | For the Year Ended December 31, | |||||||||
From Investment Activities: | ||||||||||
Operations: | ||||||||||
Net investment income (loss) | $ | 315,573 | $ | 233,488 | ||||||
Net realized gain | 521,171 | 4,139,865 | ||||||||
Change in unrealized appreciation/depreciation | (202,727 | ) | (1,515,250 | ) | ||||||
|
|
|
| |||||||
Change in net assets from operations | 634,017 | 2,858,103 | ||||||||
|
|
|
| |||||||
Distributions to Shareholders From: | ||||||||||
Net investment income | (324,023 | ) | (219,509 | ) | ||||||
Net realized gains | — | — | ||||||||
|
|
|
| |||||||
Change in net assets from shareholder distributions | (324,023 | ) | (219,509 | ) | ||||||
|
|
|
| |||||||
Capital Transactions: | ||||||||||
Proceeds from shares issued | 199,797 | 753,357 | ||||||||
Distributions reinvested | 324,023 | 219,509 | ||||||||
Value of shares redeemed | (3,335,454 | ) | (4,090,194 | ) | ||||||
|
|
|
| |||||||
Change in net assets from capital transactions | (2,811,634 | ) | (3,117,328 | ) | ||||||
|
|
|
| |||||||
Change in net assets | (2,501,640 | ) | (478,734 | ) | ||||||
Net Assets: | ||||||||||
Beginning of year | 17,326,347 | 17,805,081 | ||||||||
|
|
|
| |||||||
End of year | $ | 14,824,707 | $ | 17,326,347 | ||||||
|
|
|
| |||||||
Undistributed net investment income | $ | 19,896 | $ | 28,346 | ||||||
|
|
|
| |||||||
Share Transactions: | ||||||||||
Issued | 19,156 | 77,495 | ||||||||
Reinvested | 30,593 | 22,165 | ||||||||
Redeemed | (315,617 | ) | (416,988 | ) | ||||||
|
|
|
| |||||||
Change in Shares | (265,868 | ) | (317,328 | ) | ||||||
|
|
|
| |||||||
See accompanying Notes to the Financial Statements.
16
Sterling Capital Special Opportunities VIF | Sterling Capital Total Return Bond VIF | |||||||||||||||||||
For the Year Ended December 31, | For the Year Ended December 31, 2013 | For the Year Ended December 31, | For the Year Ended December 31, | |||||||||||||||||
| $ | (35,666 | ) | $ | 35,486 | $ | 331,319 | $ | 391,655 | ||||||||||||
| 4,251,491 | 3,698,673 | 76,550 | 5,981 | |||||||||||||||||
| 185,922 | 3,390,674 | 264,607 | (658,923 | ) | ||||||||||||||||
|
|
|
|
|
|
|
| |||||||||||||
| 4,401,747 | 7,124,833 | 672,476 | (261,287 | ) | ||||||||||||||||
|
|
|
|
|
|
|
| |||||||||||||
| (14,055 | ) | (22,471 | ) | (400,948 | ) | (486,121 | ) | |||||||||||||
| (3,713,805 | ) | (3,350,231 | ) | (155,009 | ) | (487,195 | ) | |||||||||||||
|
|
|
|
|
|
|
| |||||||||||||
| (3,727,860 | ) | (3,372,702 | ) | (555,957 | ) | (973,316 | ) | |||||||||||||
|
|
|
|
|
|
|
| |||||||||||||
| 647,469 | 385,700 | 431,387 | 959,746 | |||||||||||||||||
| 3,727,860 | 3,372,702 | 555,957 | 973,316 | |||||||||||||||||
| (7,221,400 | ) | (8,785,357 | ) | (2,504,286 | ) | (4,779,311 | ) | |||||||||||||
|
|
|
|
|
|
|
| |||||||||||||
| (2,846,071 | ) | (5,026,955 | ) | (1,516,942 | ) | (2,846,249 | ) | |||||||||||||
|
|
|
|
|
|
|
| |||||||||||||
| (2,172,184 | ) | (1,274,824 | ) | (1,400,423 | ) | (4,080,852 | ) | |||||||||||||
| 29,653,888 | 30,928,712 | 13,367,766 | 17,448,618 | |||||||||||||||||
|
|
|
|
|
|
|
| |||||||||||||
| $ | 27,481,704 | $ | 29,653,888 | $ | 11,967,343 | $ | 13,367,766 | |||||||||||||
|
|
|
|
|
|
|
| |||||||||||||
| $ | 46,794 | $ | 44,672 | $ | 203,459 | $ | 356,133 | |||||||||||||
|
|
|
|
|
|
|
| |||||||||||||
| 33,673 | 21,133 | 43,644 | 94,381 | |||||||||||||||||
| 194,882 | 190,119 | 56,161 | 97,842 | |||||||||||||||||
| (364,391 | ) | (479,938 | ) | (252,707 | ) | (467,223 | ) | |||||||||||||
|
|
|
|
|
|
|
| |||||||||||||
| (135,836 | ) | (268,686 | ) | (152,902 | ) | (275,000 | ) | |||||||||||||
|
|
|
|
|
|
|
| |||||||||||||
17
Sterling Capital Variable Insurance Funds
|
Financial Highlights
|
The financial highlights table is intended to help you understand the Funds’ financial performance for the past 5 years. Certain information reflects financial results for a single Fund share. The total returns in the table represent the rate that an investor would have earned (or lost) on an investment in the Fund (assuming reinvestment of all dividends and distributions).
| Investment Activities | Distributions | |||||||||||||||||||||||||||||||||||||
| Net Asset Value, Beginning of Year | Net investment income (loss)(a) | Net realized/ unrealized gains (losses) on investments | Total from Investment Activities | Net investment income | Net realized gains on investments | Total Distributions | ||||||||||||||||||||||||||||||||
Sterling Capital Equity Income VIF | ||||||||||||||||||||||||||||||||||||||
Year Ended December 31, 2014 | $ | 10.50 | 0.21 | 0.21 | 0.42 | (0.21 | ) | — | (0.21 | ) | ||||||||||||||||||||||||||||
Year Ended December 31, 2013 | $ | 9.05 | 0.13 | 1.44 | 1.57 | (0.12 | ) | — | (0.12 | ) | ||||||||||||||||||||||||||||
Year Ended December 31, 2012 | $ | 7.98 | 0.09 | 1.07 | 1.16 | (0.09 | ) | — | (0.09 | ) | ||||||||||||||||||||||||||||
Year Ended December 31, 2011 | $ | 8.41 | 0.09 | (0.43 | ) | (0.34 | ) | (0.09 | ) | — | (0.09 | ) | ||||||||||||||||||||||||||
Year Ended December 31, 2010 | $ | 7.61 | 0.09 | 0.81 | 0.90 | (0.10 | ) | — | (0.10 | ) | ||||||||||||||||||||||||||||
Sterling Capital Special Opportunities VIF | ||||||||||||||||||||||||||||||||||||||
Year Ended December 31, 2014 | $ | 18.84 | (0.02 | ) | 3.05 | 3.03 | (0.01 | ) | (2.75 | ) | (2.76 | ) | ||||||||||||||||||||||||||
Year Ended December 31, 2013 | $ | 16.78 | 0.02 | 4.33 | 4.35 | (0.01 | ) | (2.28 | ) | (2.29 | ) | |||||||||||||||||||||||||||
Year Ended December 31, 2012 | $ | 15.36 | 0.06 | (c) | 2.13 | 2.19 | (0.05 | ) | (0.72 | ) | (0.77 | ) | ||||||||||||||||||||||||||
Year Ended December 31, 2011 | $ | 16.60 | (0.01 | ) | (0.61 | ) | (0.62 | ) | — | (0.62 | ) | (0.62 | ) | |||||||||||||||||||||||||
Year Ended December 31, 2010 | $ | 14.29 | (0.04 | ) | 2.36 | 2.32 | (0.01 | ) | — | (0.01 | ) | |||||||||||||||||||||||||||
Sterling Capital Total Return Bond VIF | ||||||||||||||||||||||||||||||||||||||
Year Ended December 31, 2014 | $ | 9.77 | 0.26 | 0.27 | 0.53 | (0.32 | ) | (0.13 | ) | (0.45 | ) | |||||||||||||||||||||||||||
Year Ended December 31, 2013 | $ | 10.62 | 0.26 | (0.43 | ) | (0.17 | ) | (0.33 | ) | (0.35 | ) | (0.68 | ) | |||||||||||||||||||||||||
Year Ended December 31, 2012 | $ | 10.61 | 0.26 | 0.38 | 0.64 | (0.31 | ) | (0.32 | ) | (0.63 | ) | |||||||||||||||||||||||||||
Year Ended December 31, 2011 | $ | 10.73 | 0.36 | 0.28 | 0.64 | (0.39 | ) | (0.37 | ) | (0.76 | ) | |||||||||||||||||||||||||||
Year Ended December 31, 2010 | $ | 10.37 | 0.40 | 0.39 | 0.79 | (0.41 | ) | (0.02 | ) | (0.43 | ) | |||||||||||||||||||||||||||
| * | During the periods certain fees were voluntarily waived (See Note 4 in the Notes to the Financial Statements). If such reductions had not occurred, the ratios would have been as indicated. |
| (a) | Per share net investment income (loss) has been calculated using the average daily shares method. |
| (b) | Total return ratios assume reinvestment of distributions at net asset value. Total return ratios do not reflect charges pursuant to the terms of the insurance contracts funded by separate accounts that invest in the Fund’s shares. |
| (c) | For the year ended December 31, 2012, net investment income per share reflects a special dividend which amounted to $0.02 per share. Excluding the special dividend, the ratio of net investment income to average net assets would have been 0.25% per share. |
See accompanying Notes to the Financial Statements.
18
| Ratios/Supplemental Data | ||||||||||||||||||||||||||||||||||
Net Asset Value, End of Year | Total Return(b) | Net Assets, End of Year (000) | Ratio of net expenses to average net assets | Ratio of net income (loss) to average net assets | Ratio of expenses net assets* | Portfolio turnover rate | ||||||||||||||||||||||||||||
| $ | 10.71 | 4.08 | % | $ | 14,825 | 1.18 | % | 1.95 | % | 1.22 | % | 15.81 | % | |||||||||||||||||||||
| $ | 10.50 | 17.48 | % | $ | 17,326 | 1.16 | % | 1.32 | % | 1.27 | % | 113.45 | % | |||||||||||||||||||||
| $ | 9.05 | 14.53 | % | $ | 17,805 | 1.06 | % | 1.04 | % | 1.22 | % | 64.31 | % | |||||||||||||||||||||
| $ | 7.98 | (4.04 | )% | $ | 21,284 | 0.97 | % | 1.11 | % | 1.21 | % | 69.66 | % | |||||||||||||||||||||
| $ | 8.41 | 11.93 | % | $ | 28,318 | 0.94 | % | 1.22 | % | 1.21 | % | 63.34 | % | |||||||||||||||||||||
| $ | 19.11 | 15.99 | % | $ | 27,482 | 1.25 | % | (0.12 | )% | 1.26 | % | 21.08 | % | |||||||||||||||||||||
| $ | 18.84 | 26.81 | % | $ | 29,654 | 1.34 | % | 0.12 | % | 1.35 | % | 36.33 | % | |||||||||||||||||||||
| $ | 16.78 | 14.33 | % | $ | 30,929 | 1.28 | % | 0.34 | %(c) | 1.28 | % | 18.13 | % | |||||||||||||||||||||
| $ | 15.36 | (3.53 | )% | $ | 35,567 | 1.25 | % | (0.05 | )% | 1.25 | % | 26.68 | % | |||||||||||||||||||||
| $ | 16.60 | 16.24 | % | $ | 43,344 | 1.24 | % | (0.28 | )% | 1.27 | % | 39.24 | % | |||||||||||||||||||||
| $ | 9.85 | 5.44 | % | $ | 11,967 | 1.21 | % | 2.65 | % | 1.25 | % | 56.22 | % | |||||||||||||||||||||
| $ | 9.77 | (1.56 | )% | $ | 13,368 | 1.23 | % | 2.57 | % | 1.29 | % | 114.13 | % | |||||||||||||||||||||
| $ | 10.62 | 6.10 | % | $ | 17,449 | 1.16 | % | 2.39 | % | 1.20 | % | 144.71 | % | |||||||||||||||||||||
| $ | 10.61 | 6.10 | % | $ | 19,478 | 1.07 | % | 3.32 | % | 1.17 | % | 131.16 | % | |||||||||||||||||||||
| $ | 10.73 | 7.73 | % | $ | 21,397 | 1.07 | % | 3.70 | % | 1.20 | % | 140.32 | % | |||||||||||||||||||||
19
Sterling Capital Variable Insurance Funds
|
|
December 31, 2014
|
| 1. | Organization: |
Sterling Capital Variable Insurance Funds (the “Trust”) was organized on November 8, 2004, and is registered under the Investment Company Act of 1940, as amended (the “1940 Act”), as an open-end investment company established as a Massachusetts business trust. The Trust commenced operations on May 1, 2005 and presently offers shares of Sterling Capital Equity Income VIF, Sterling Capital Special Opportunities VIF, and Sterling Capital Total Return Bond VIF (referred to individually as a “Fund” and collectively as the “Funds”). The Trust is authorized to issue an unlimited number of shares of beneficial interest without par value. Shares of the Funds are offered through variable annuity contracts offered through the separate accounts of participating insurance companies. All Funds are “diversified” funds, as defined in the 1940 Act.
Under the Trust’s organizational documents, its Officers and Trustees are indemnified against certain liabilities arising out of the performance of their duties to the Trust. In addition, in the normal course of business, the Funds may enter into contracts with their vendors and others that provide for general indemnifications. The Funds’ maximum exposure under these arrangements is unknown, as this would involve future claims that may be made against the Funds. However, based on experience, the Funds expect that risk of loss to be remote.
| 2. | Significant Accounting Policies: |
The following is a summary of significant accounting policies followed by the Funds in preparation of their financial statements. The policies are in conformity with United States generally accepted accounting principles (“U.S. GAAP”). The preparation of these financial statements requires management to make estimates and assumptions that affect the reported amounts of assets and liabilities and disclosure of contingent assets and liabilities at the date of the financial statements and the reported amounts of income and expenses for the reporting period. Actual results could differ from those estimates.
Securities Valuation — Investments in securities, the principal market for which is a securities exchange or an over-the-counter market, are valued at their latest available sale price (except for those securities that are traded on NASDAQ, which will be valued at the NASDAQ official closing price) or in the absence of such a price, by reference to the latest available bid price in the principal market in which such securities are normally traded. The Funds may also use an independent pricing service approved by the Board of Trustees (the “Board”) to value certain securities, including the use of electronic and matrix techniques. Investments in open-end investment companies are valued at their respective net asset values as reported by such companies. The differences between cost and fair value of investments are reflected as either unrealized appreciation or depreciation. Securities for which market quotations are not readily available or deemed unreliable (e.g., an approved pricing service does not provide a price, a furnished price is in error, certain stale prices, or an event occurs that materially affects the furnished price) will be fair valued in accordance with procedures established in good faith under the general supervision of the Board. No securities were valued in accordance with these procedures as of December 31, 2014.
Fair Value Measurements — The objective of a fair value measurement is to determine the price that would be received to sell an asset or paid to transfer a liability in an orderly transaction between market participants at the measurement date (an exit price). Accordingly, the fair value hierarchy gives the highest priority to quoted prices (unadjusted) in active markets for identical assets or liabilities (Level 1) and the lowest priority to unobservable inputs (Level 3). The three levels of the fair value hierarchy are described as follows:
• Level 1 – quoted prices in active markets for identical securities
• Level 2 – based on other significant observable inputs (including quoted prices for similar securities, interest rates, prepayment speeds, credit risk, etc.)
• Level 3 – based on significant unobservable inputs (including the Fund’s own assumptions in determining the fair value of investments)
The inputs or methodology used for valuing securities are not necessarily an indication of the risk associated with investing in those securities. During the fiscal year ended December 31, 2014 there were no changes to the valuation policies and procedures.
20
Sterling Capital Variable Insurance Funds
|
Notes to Financial Statements — (continued) |
December 31, 2014
|
The summary of inputs used to determine the fair value of each Fund’s investments as of December 31, 2014 is as follows:
| Level 1– Quoted Prices | Level 2– Other Significant Observable Inputs | Level 3– Significant Unobservable Inputs | Total | |||||||||||
Assets: | ||||||||||||||
Investments in Securities | ||||||||||||||
Sterling Capital Equity Income VIF | $14,794,435(a) | $ — | $— | $14,794,435 | ||||||||||
Sterling Capital Special Opportunities VIF | 27,483,398(a) | — | — | 27,483,398 | ||||||||||
Sterling Capital Total Return Bond VIF | 344,116(b) | 11,543,453(a) | — | 11,887,569 | ||||||||||
| (a) | Industries, countries or security types are disclosed in the Schedules of Portfolio Investments. |
| (b) | Represents money market funds and preferred stocks. |
The Funds’ policy is to recognize transfers in and transfers out as of the beginning of the reporting period. There were no transfers between Levels during the fiscal year ended December 31, 2014.
Cash and Cash Equivalents — The Funds consider liquid assets deposited with a bank, and certain short term debt instruments with original maturities of three months or less to be cash equivalents. These investments represent amounts held with financial institutions that are readily accessible to pay Fund expenses or investments. The Funds invest their excess cash in the Federated Treasury Obligations Fund and may invest in a similar money market fund or other short-term investment.
Distributions to Shareholders — Dividends from net investment income are declared and paid quarterly for the Funds, with the exception of Sterling Capital Total Return Bond VIF, in which case dividends from net investment income are declared daily and paid monthly. Distributable net realized gains, if any, are declared and distributed at least annually. Distributions to shareholders that exceed net investment income and net realized gains for tax purposes are reported as distributions of capital.
Expenses and Allocation Methodology — Expenses directly attributable to a Fund are charged to that Fund. Expenses not directly attributable to a Fund are allocated proportionately among all Funds daily in relation to the net assets of each Fund or on another reasonable basis. Expenses that are attributable to both the Funds and Sterling Capital Funds are allocated across the Funds and Sterling Capital Funds, based upon relative net assets or on another reasonable basis.
Mortgage Dollar Rolls — Sterling Capital Total Return Bond VIF may sell mortgage-backed securities for delivery in the current month and simultaneously contract to repurchase substantially similar (same type, coupon and maturity) securities on a specific future date at an agreed-upon price. The market value of the securities that the Fund is required to purchase may decline below the agreed upon repurchase price of those securities. Pools of mortgages collateralizing those securities may have different prepayment histories than those sold. During the period between the sale and repurchase, the Fund will not be entitled to receive interest and principal payments on the securities sold. Proceeds of the sale will be invested in additional instruments for the Fund, and the income from these investments will generate income for the Fund. If such income does not exceed the income, capital appreciation and gain or loss that would have been realized on the securities sold as part of the dollar roll, the use of this technique will diminish the investment performance of the Fund compared with what the performance would have been without the use of dollar rolls. The Funds account for mortgage dollar roll transactions as purchases and sales. There were no mortgage dollar rolls as of December 31, 2014.
Security Transactions and Related Income — During the fiscal year, security transactions are accounted for no later than one business day after the trade date. For financial reporting purposes, however, security transactions as of the last business day of the reporting period are accounted for on the trade date. Interest income is recognized on the accrual basis and includes, where applicable, the amortization/accretion of premium or discount. Dividend income is recorded on the ex-dividend date. Gains or losses realized from sales of securities are determined by comparing the identified cost of the security lot sold with the net sales proceeds.
21
Sterling Capital Variable Insurance Funds
|
Notes to Financial Statements — (continued) |
December 31, 2014
|
When-Issued and Forward Commitments — The Funds may purchase securities on a “when-issued” basis. The Funds record when-issued securities on the trade date and pledge assets with a value at least equal to the purchase commitment for payment of the securities purchased. The value of the securities underlying when-issued or forward commitments to purchase securities, and any subsequent fluctuation in their value, is taken into account when determining the net asset value of the Funds commencing with the date the Funds agree to purchase the securities. The Funds do not accrue interest or dividends on “when-issued” securities until the underlying securities are received. There were no “when-issued” securities as of December 31, 2014.
| 3. | Purchases and Sales of Securities: |
Purchases and sales of securities (excluding U.S. government securities and securities maturing less than one year from acquisition) for the fiscal year ended December 31, 2014 were as follows:
| Purchases | Sales | |||
Sterling Capital Equity Income VIF | $2,476,714 | $ 5,223,704 | ||
Sterling Capital Special Opportunities VIF | 5,955,081 | 12,633,127 | ||
Sterling Capital Total Return Bond VIF | 4,444,464 | 5,025,616 |
Purchases and sales of U.S. government securities (excluding securities maturing less than one year from acquisition) for the fiscal year ended December 31, 2014 for the Sterling Capital Total Return Bond VIF were $2,491,642 and $2,622,273, respectively.
| 4. | Related Party Transactions: |
Under the terms of the investment advisory agreement, Sterling Capital Management LLC (“Sterling Capital” or the “Advisor”) is entitled to receive fees based on a percentage of the average daily net assets of the Funds. These fees are accrued daily and payable on a monthly basis and are reflected on the Statements of Operations as “Investment advisory fees.” Sterling Capital waived investment advisory fees and reimbursed certain expenses for the Funds referenced below which are not subject to recoupment and are included on the Statements of Operations as “Less expenses waived by the Investment Advisor.” Information regarding these transactions for the fiscal year ended December 31, 2014 is as follows:
| Contractual Fee Rate | ||
Sterling Capital Equity Income VIF | 0.70%1,2 | |
Sterling Capital Special Opportunities VIF | 0.75%2,3 | |
Sterling Capital Total Return Bond VIF | 0.50%2,4 |
| 1 | The contractual fee rate was 0.70% and the fee rate after voluntary waivers was 0.58% prior to May 1, 2014. |
| 2 | For a portion of the fiscal year ended December 31, 2014, Sterling Capital voluntarily reimbursed certain expenses of the Funds. Voluntary reimbursements of expenses are not subject to recoupment in subsequent fiscal periods, and may be discontinued at any time. |
| 3 | The contractual fee rate was 0.80% and the fee rate after voluntary waivers was 0.79% prior to May 1, 2014. |
| 4 | The contractual fee rate was 0.50% and the fee rate after voluntary waivers was 0.38% prior to May 1, 2014. |
Sterling Capital serves as the administrator to the Funds pursuant to an administration agreement. The Funds pay their portion of a fee to Sterling Capital for providing administration services based on the aggregate assets of the Funds and the Sterling Capital Funds, excluding the assets of Sterling Capital Strategic Allocation Conservative Fund, Sterling Capital Strategic Allocation Balanced Fund, and Sterling Capital Strategic Allocation Growth Fund, at a rate of 0.1075% on the first $3.5 billion of average net assets, 0.075% on the next $1 billion of average net assets; 0.06% on the next $1.5 billion of average net assets; and 0.04% of average net assets over $6 billion. Expenses incurred are reflected on the Statements of Operations as “Administration fees.” Pursuant to a sub-administration agreement with Sterling Capital, BNY Mellon Investment Servicing (US) Inc. (“BNY Mellon” or the “Sub-Administrator”), serves as the sub-administrator to the Funds subject to the general supervision of the Board and Sterling Capital. For these services, BNY Mellon is entitled to a fee payable by Sterling Capital.
BNY Mellon serves as the Funds’ fund accountant and transfer agent and receives compensation by the Funds for these services. Expenses incurred are reflected on the Statements of Operations as “Fund accounting fees” and “Transfer agent fees.”
The Trust has adopted a Variable Contract Owner Servicing Plan (the “service plan”) under which the Funds may pay a fee computed daily and paid monthly, at an annual rate of up to 0.25% of the average daily net assets of the Funds. A servicing agent may periodically waive all or a portion of its servicing fees. For the fiscal year ended December 31, 2014, the Funds did not participate in any service plan.
22
Sterling Capital Variable Insurance Funds
|
Notes to Financial Statements — (continued) |
December 31, 2014
|
Certain Officers and a Trustee of the Funds are affiliated with Sterling Capital or the Sub-Administrator. Such Officers and Trustee receive no compensation from the Funds for serving in their respective roles. Each of the Trustees who are not interested persons (as defined in the 1940 Act) of the Trust who serve on the Board are compensated at the annual rate of $44,000 plus $5,000 for each regularly scheduled quarterly meeting attended, $4,000 for each special meeting attended in person and $1,500 for each special meeting attended by telephone, plus reimbursement for certain out of pocket expenses. The Trustee who is an interested person, as defined in the 1940 Act, of the Trust, but not affiliated with Sterling Capital is compensated at the annual rate of $44,000 plus $4,000 for each regularly scheduled quarterly meeting attended, $3,200 for each special meeting attended in person and $1,200 for each special meeting attended by telephone, plus reimbursement for certain out of pocket expenses. Each Trustee serving on a Committee of the Board receives a fee of $4,000 for each Committee meeting attended in person and $3,000 for each Committee meeting attended by telephone, plus reimbursement for certain out of pocket expenses. Committee meeting fees are only paid when such Committee meetings are not held in conjunction with a regular board meeting. Additionally, the Chairman of the Board and the Audit Committee Chairman each receive an annual retainer of $15,000, and the Chairman of the Nominations Committee receives additional compensation at the rate of $1,000 for each meeting over which he or she presides as Chairman. The fees are allocated across the Trust and the Sterling Capital Funds based upon relative net assets.
At a meeting held on February 19-20, 2014, the Board approved several changes in Trustee compensation. These changes became effective on April 1, 2014. Pursuant to these changes, (i) each Trustee who is not an interested person of the Trust will be compensated at an annual rate of $70,000, (ii) the Chairman of the Board will receive an annual retainer of $20,000, and (iii) the Chairman of the Nominations Committee will receive an annual retainer of $6,000 in lieu of a fee for each meeting over which he or she presides as Chairman. Other than as noted above, Trustee compensation remains the same.
| 5. | Line of Credit: |
U.S. Bank, N.A. has made available a credit facility to each Fund, pursuant to a credit agreement (each, an “Agreement”) with respect to each Fund. The primary purpose of the Agreements is to allow the Funds to avoid security liquidations that Sterling Capital believes are unfavorable to shareholders. Under the Agreements, Sterling Capital Equity Income VIF, Sterling Capital Special Opportunities VIF and Sterling Capital Total Return Bond VIF have a commitment amount of $1,700,000, $2,600,000, and $1,200,000, respectively. Outstanding principal amounts under the Agreements bear interest at a rate per annum equal to the Prime Rate minus two percent (2%), but never at a rate of less than one percent (1%) per annum. The Agreements expire on March 30, 2015. During the fiscal year ended December 31, 2014, each of the following Funds utilized its line of credit:
| Average Interest Rate | Average Loan Balance | Number of Days Outstanding | Interest Expense Incurred | Maximum Amount Borrowed | ||||||
Sterling Capital Equity Income VIF | 1.25% | $15,714 | 7 | $ 4 | $ 24,000 | |||||
Sterling Capital Special Opportunities VIF | 1.25% | 80,000 | 6 | 17 | 116,000 |
| 6. | Federal Tax Information: |
It is the policy of each Fund to continue to qualify as a regulated investment company by complying with the provisions available to certain investment companies, as defined in applicable sections of the Internal Revenue Code of 1986, as amended, and to make distributions of net investment income and net realized capital gains sufficient to relieve it from all, or substantially all, federal income taxes. Accordingly, no provision for federal income tax is required in the Funds’ financial statements.
Management evaluates its tax positions to determine if the tax positions taken meet the minimum recognition threshold in connection with accounting for uncertainties in income tax positions taken or expected to be taken for the purposes of measuring and recognizing tax liabilities in the financial statements. Recognition of tax benefits of an uncertain tax position is required only when the position is “more likely than not” to be sustained assuming examination by taxing authorities. The Funds recognize interest and penalties, if any, related to unrecognized tax benefits as income tax expense. During the period, the Funds did not incur any interest or penalties.
Management has analyzed the Funds’ tax positions taken on federal income tax returns for all open tax years (current year and prior three tax years), and has concluded that no provision for federal income tax is required in the Funds’ financial statements. The Funds’ federal and state income and federal excise tax returns for tax years for which the applicable statutes of limitations have not expired are subject to examination by the Internal Revenue Service and state departments of revenue.
23
Sterling Capital Variable Insurance Funds
|
Notes to Financial Statements — (continued) |
December 31, 2014
|
Under the Regulated Investment Company Modernization Act of 2010, capital losses originating in taxable years beginning after December 22, 2010 (“post-enactment capital losses”) are carried forward indefinitely. Furthermore, post-enactment capital losses will retain their character as either short-term or long-term capital losses rather than being considered all short-term capital losses as under previous law.
At December 31, 2014, the following Funds had net capital loss carry forwards available to offset future net capital gains, if any, to the extent provided by the Treasury regulations. To the extent that these carry forwards are used to offset future capital gains, it is probable that the gains that are offset will not be distributed to shareholders.
| Amount With No Expiration* | ||||||||||||||
| Short-term Losses | Long-term Losses | Amount | Expires | |||||||||||
Sterling Capital Equity Income VIF | $ — | — | $13,056,364 | 2016 | ||||||||||
Sterling Capital Equity Income VIF | — | — | 3,263,903 | 2017 | ||||||||||
Sterling Capital Total Return Bond VIF | 53,393 | 24,708 | — | — | ||||||||||
| * | Post-Enactment Losses: Must be utilized prior to losses subject to expiration. |
Capital loss carryforwards utilized in the current year were $521,171 and $27,987 for Sterling Capital Equity Income VIF and Sterling Capital Total Return Bond VIF, respectively.
The character of income and gains distributed are determined in accordance with federal income tax regulations, which may differ from U.S. GAAP. These “book/tax” differences are either considered temporary or permanent in nature. To the extent these differences are permanent in nature (e.g., disposition of market discount and market premium bonds, paydown gains and losses, net operating loss, hybrids, REITs and the character of distributions), such amounts are reclassified within the composition of net assets based on their federal tax-basis treatment; temporary differences do not require reclassification. These reclassifications have no impact on net assets or net asset values per share.
As of December 31, 2014, these reclassifications were as follows:
| Decrease Paid-in-Capital | Increase (Decrease) Net Investment Income | Increase (Decrease) Realized Gain | ||||||||||
Sterling Capital Special Opportunities VIF | $ — | $51,843 | $(51,843 | ) | ||||||||
Sterling Capital Total Return Bond VIF | (47) | (83,045 | ) | 83,092 | ||||||||
The tax character of distributions paid to shareholders during the fiscal year ended December 31, 2014, were as follows:
| Distributions paid from | ||||||||||||
| Ordinary Income | Net Long-Term Gains | Total Distributions Paid | ||||||||||
Sterling Capital Equity Income VIF | $324,023 | $ — | $ 324,023 | |||||||||
Sterling Capital Special Opportunities VIF | 14,055 | 3,713,805 | 3,727,860 | |||||||||
Sterling Capital Total Return Bond VIF | 555,957 | — | 555,957 | |||||||||
The tax character of distributions paid to shareholders during the fiscal year ended December 31, 2013, were as follows:
| Distributions paid from | ||||||||||||
| Ordinary Income | Net Long-Term Gains | Total Distributions Paid | ||||||||||
Sterling Capital Equity Income VIF | $219,509 | $ — | $ 219,509 | |||||||||
Sterling Capital Special Opportunities VIF | 22,471 | 3,350,231 | 3,372,702 | |||||||||
Sterling Capital Total Return Bond VIF | 730,543 | 242,773 | 973,316 | |||||||||
24
Sterling Capital Variable Insurance Funds
|
Notes to Financial Statements — (continued) |
December 31, 2014
|
At December 31, 2014, the components of accumulated earnings (deficit) on a tax basis were as follows:
| Undistributed Ordinary Income | Undistributed Long Term Capital Gains | Accumulated Earnings | Accumulated Capital and Other Losses | Unrealized Appreciation (Depreciation)* | Total Accumulated Earnings (Deficit) | |||||||||||||||||||
Sterling Capital Equity Income VIF | $ 19,896 | $ — | $ 19,896 | $(16,320,267 | ) | $1,751,442 | $(14,548,929 | ) | ||||||||||||||||
Sterling Capital Special Opportunities VIF | 386,692 | 3,797,950 | 4,184,642 | — | 8,833,731 | 13,018,373 | ||||||||||||||||||
Sterling Capital Total Return Bond VIF | 204,059 | — | 204,059 | (78,101 | ) | 250,175 | 376,133 | |||||||||||||||||
| * | The primary differences between book basis and tax basis unrealized appreciation (depreciation) were due to the deferral of losses on wash sales, basis adjustments on real estate investment trusts, partnership interests and hybrid securities, and the deferral of market discount and premium until point of sale. |
At December 31, 2014, federal income tax cost, gross unrealized appreciation and gross unrealized depreciation on securities were as follows:
| Tax Cost | Gross Tax Unrealized Appreciation | Gross Tax Unrealized Depreciation | Net Tax Unrealized Appreciation | |||||||||||||
Sterling Capital Equity Income VIF | $13,042,993 | $2,251,179 | $(499,737 | ) | $1,751,442 | |||||||||||
Sterling Capital Special Opportunities VIF | 18,649,667 | 9,197,560 | (363,829 | ) | 8,833,731 | |||||||||||
Sterling Capital Total Return Bond VIF | 11,637,394 | 432,629 | (182,454 | ) | 250,175 | |||||||||||
| 7. | Subsequent Events: |
Management has evaluated the need for disclosure and/or adjustments resulting from subsequent events through the date the financial statements were issued, and has noted the following items:
Effective December 31, 2014, Thomas W. Lambeth retired from his role as Chair of the Board of Trustees. Drew Kagan has been appointed as Mr. Lambeth’s replacement.
Effective December 31, 2014, Kenneth Cotner retired from his role asTreasurer. Todd Miller has been appointed as Mr. Cotner’s replacement.
Effective January 1, 2015, the Chair of the Audit Committee changed from Drew Kagan to Alan Priest.
Effective January 1, 2015, the Fund’s Chief Compliance and Anti-Money Laundering Officer changed from Salvatore Faia to Brian Moran.
On February 24, 2015, the Board of Trustees approved the liquidation of each of the Funds and the winding up and termination of the Trust, which is expected to occur prior to April 30, 2015.
25
Report of Independent Registered Public Accounting Firm
The Board of Trustees and Shareholders of Sterling Capital Variable Insurance Funds:
We have audited the accompanying statement of assets and liabilities of the Sterling Capital Equity Income VIF, Sterling Capital Special Opportunities VIF and Sterling Capital Total Return VIF (collectively, the “Funds”), constituting the Sterling Capital Variable Insurance Funds, including the schedules of portfolio investments, as of December 31, 2014, and the related statements of operations for the year then ended, the statements of changes in net assets for each of the years in the two-year period then ended, and the financial highlights for each of the years in the five-year period then ended. These financial statements and financial highlights are the responsibility of the Funds’ management. Our responsibility is to express an opinion on these financial statements and financial highlights based on our audits.
We conducted our audits in accordance with the standards of the Public Company Accounting Oversight Board (United States). Those standards require that we plan and perform the audit to obtain reasonable assurance about whether the financial statements and financial highlights are free of material misstatement. An audit includes examining, on a test basis, evidence supporting the amounts and disclosures in the financial statements. Our procedures included confirmation of securities owned as of December 31, 2014, by correspondence with the custodian. An audit also includes assessing the accounting principles used and significant estimates made by management, as well as evaluating the overall financial statement presentation. We believe that our audits provide a reasonable basis for our opinion.
In our opinion, the financial statements and financial highlights referred to above present fairly, in all material respects, the financial position of each of the Funds comprising the Sterling Capital Variable Insurance Funds as of December 31, 2014, the results of their operations for the year then ended, the changes in their net assets for each of the years in the two-year period then ended, and the financial highlights for each of the years in the five-year period then ended, in conformity with U.S. generally accepted accounting principles.
As described in Note 7 to the financial statements, on February 24, 2015, the Board of Trustees approved the liquidation of each of the Funds comprising the Sterling Capital Variable Insurance Funds. As of this date, the Funds will cease operating as a going concern and change their basis of accounting from the going concern basis to the liquidation basis of accounting in accordance with U.S. generally accepted accounting principles.

Philadelphia, Pennsylvania
February 24, 2015
26
Sterling Capital Variable Insurance Funds
|
December 31, 2014
|
Notice to Shareholders (Unaudited)
All amounts and percentages below are based on financial information available as of the date of this annual report and, accordingly are subject to change. For each item it is the intention of the Funds to report the maximum amount permitted under the Internal Revenue Code and the regulations thereunder.
For the fiscal year ended December 31, 2014, each Fund is reporting the following items with regard to distributions paid during the year.
| Long-Term Capital Gain | Qualified Dividends Income % | (for corporate shareholders) Dividend Received Deduction % | U.S. Government Income | |||||||||||
Sterling Capital Equity Income VIF | $ — | 100.00% | 100.00% | — | ||||||||||
Sterling Capital Special Opportunities VIF | 3,713,805 | 99.96% | 99.95% | — | ||||||||||
Sterling Capital Total Return Bond VIF | — | 1.32% | 1.01% | 0.54% | ||||||||||
27
Sterling Capital Variable Insurance Funds
|
December 31, 2014
|
A description of the policies and procedures that the Funds use to determine how to vote proxies relating to portfolio securities is available (i) without charge, upon request, by calling 1-800-228-1872; and (ii) on the Securities and Exchange Commission’s (the “Commission”) website at http://www.sec.gov.
Information regarding how the Funds voted proxies relating to portfolio securities during the most recent 12-month period ended June 30th is available (i) without charge, upon request, by calling 1-800-228-1872 and (ii) on the Commission’s website at http://www.sec.gov.
The Funds file complete Schedules of Portfolio Holdings with the Commission for the first and third quarters of each fiscal year on Form N-Q. The Funds’ Form N-Q is filed with the Commission within 60 days of the end of the quarter to which it relates, and is available without charge on the Commission’s website at http://www.sec.gov, or may be reviewed and copied at the Commission’s Public Reference Room in Washington, D.C. Information on the operation of the Public Reference Room may be obtained by calling 1-800-SEC-0330.
28
BOARD CONSIDERATION OF ADVISORY AND SUB-ADVISORY AGREEMENTS (UNAUDITED)
The Board of Trustees conducted in-person meetings in August and November 2014 to consider the continuance of the investment advisory agreement between Sterling Capital Variable Insurance Funds (the “Trust”) and Sterling Capital Management LLC (“Sterling Capital” or the “Adviser”), the investment adviser to each series of the Trust (the “Funds”), for a new term running through January 31, 2016. The above referenced agreement is referred to herein as the “Advisory Agreement.”
The Trustees reviewed extensive material in connection with their consideration of the Advisory Agreement, including data from an independent provider of mutual fund data (as assembled by the Trust’s administrator), which, where applicable, included comparisons with industry averages for comparable funds for advisory fees, 12b-1 fees, and total fund expenses. The Trustees considered the contractual investment advisory fee levels for each Fund, as well as the fee waivers that Sterling Capital had agreed to implement for certain Funds. The Board was assisted in its review by independent legal counsel, who provided a memorandum detailing the legal standards for review of the Advisory Agreement. The Board received detailed presentations from Sterling Capital, including analysis of each Fund’s investment process and performance. The Board also received and considered information from Sterling Capital relating to its profitability in respect of each Fund, and from all Funds in the aggregate. As part of their deliberations, the Independent Trustees conducted several private meetings with their independent legal counsel, outside the presence of Sterling Capital and other Fund management.
In their deliberations regarding the Advisory Agreement, each Trustee attributed different weights to various factors involved in an analysis of the Advisory Agreement, and in each case no factor alone was considered determinative. The Trustees determined that the arrangement between the Trust and the Adviser, as provided in the Advisory Agreement, was fair and reasonable and that the continuance of the Advisory Agreement was in the best interests of each applicable Fund and its shareholders.
The Trustees considered the following factors, among others, in reaching their conclusions.
Nature, Extent and Quality of Services Provided by the Adviser
The Trustees received and considered information regarding the nature, extent, and quality of the services provided to each Fund under the Advisory Agreement. The Trustees took into account information furnished throughout the year at Trustee meetings, as well as materials furnished specifically in connection with the annual review process. The Trustees considered the background and experience of the Adviser’s senior management and the expertise of investment personnel of the Adviser responsible for the day-to-day management of each Fund. The Trustees considered the overall reputation, and the capabilities and commitment of the Adviser to provide high quality service to each Fund.
The Trustees received information concerning the investment philosophy and investment processes applied or to be applied by the Adviser in managing each Fund as well as the Adviser’s Form ADV. The Trustees also considered information regarding regulatory compliance and compliance with the investment policies of the Funds. The Trustees evaluated the Adviser’s trading practices and considered the procedures of the Adviser designed to fulfill the Adviser’s fiduciary duty to the Funds with respect to possible conflicts of interest, including the Adviser’s code of ethics (regulating the personal trading of its officers and employees).
Based on their review, the Trustees concluded that, with respect to the nature, extent and quality of services to be provided by the Adviser, the nature and extent of responsibilities was consistent with mutual fund industry norms, and that the quality of the services provided or to be provided by the Adviser was or was expected to be satisfactory or better.
Investment Performance
The Trustees considered the performance results of each Fund over various periods in absolute terms and relative to each Fund’s benchmark and peer group. In conducting their review, the Trustees focused particular attention on cases where a Fund’s longer-term performance compared unfavorably with peers.
After reviewing the performance of each Fund and taking into consideration the management style, investment strategies, and prevailing market conditions during the prior year and for longer periods, the Trustees concluded that the performance of each Fund was acceptable or better or that, in cases where performance issues were encountered, Sterling Capital had taken appropriate steps to address the situation.
Cost of Services, Including the Profits Realized by the Adviser and Affiliates
The Trustees considered peer group information with respect to the advisory fees charged by Sterling Capital to each of the Funds, taking into consideration both contractual and actual (i.e., after fee waivers) fee levels. The Trustees concluded that the investment advisory fees paid by the Funds fell within an acceptable range as compared to peer groups, and were fair and reasonable.
As part of their review, the Trustees considered benefits to Sterling Capital aside from investment advisory fees. The Trustees reviewed administration fees received by Sterling Capital and considered the fallout benefits to Sterling Capital such as the research services available to Sterling Capital by reason of brokerage commissions generated by the Funds’ turnover. The Trustees also considered benefits to Sterling Capital’s affiliates, including brokerage commissions received by a Sterling Capital affiliate for executing certain trades on behalf of the Sterling Capital Special Opportunities VIF and Sterling Capital Equity Income VIF. With respect to these
29
trades, the Trustees considered Sterling Capital’s assurances that such trades were effected in accordance with board approved procedures.
The Trustees also considered information from Sterling Capital regarding fees for separate accounts managed by Sterling Capital with investment objectives and strategies similar to those of comparable Funds. The Trustees noted that a representative of Sterling Capital explained that management of the Funds was a much more intensive process than management of separate accounts, including management of cash flows and the need to comply with extensive and complex restrictions set by applicable regulation or established in Fund disclosure documents, and therefore the Trustees concluded that the differences between the services that Sterling Capital provides to the Funds and those it provides to separate accounts substantially limit the probative value of comparisons to those other clients.
The Trustees also considered the reasonableness of current and proposed advisory fees in the context of the profitability of the Adviser. In determining whether the investment advisory fees were reasonable, the Trustees considered profitability information provided by the Adviser with respect to the services they provide to the Funds. With respect to such information, the Trustees recognized that such profitability data was generally unaudited and represented an Adviser’s own determination of its and its affiliates’ revenues from the contractual services provided or expected to be provided to the Funds, less expenses of providing such services. Expenses include direct and indirect costs and were calculated using an allocation methodology developed by the Adviser. The Trustees also recognized that it is difficult to make comparisons of profitability from fund investment advisory contracts, because comparative information is not generally publicly available and could be affected by numerous factors. Based on their review, the Trustees concluded that the profitability of the Adviser as a result of their relationships with the Funds was acceptable.
Based on the foregoing, the Trustees concluded that the fees proposed under the Advisory Agreements were fair and reasonable, in light of the services and benefits provided or expected to be provided to each Fund.
Economies of Scale
The Trustees also considered whether fee levels reflect economies of scale and whether economies of scale would be produced by the growth of the Funds’ assets. The Trustees found that the asset levels of each Fund were not currently so large as to warrant fee breakpoints.
30
Sterling Capital Variable Insurance Funds |
|
Information about Trustees and Officers (Unaudited)
Overall responsibility for the management of the Funds rests with its Board of Trustees (“Trustees”), who are elected by the Shareholders of the Funds. The Trustees elect the officers of the Funds to supervise actively its day-to-day operations. The names of the Trustees, birthdates, term of office and length of time served, principal occupations during the past five years, number of portfolios overseen and directorships held outside of the Funds are listed in the two tables immediately following. The business address of the persons listed below is 434 Fayetteville Street, Fifth floor, Raleigh, North Carolina 27601.
INDEPENDENT TRUSTEES
Name and Birthdate | Position(s) Held | Term of Office/ | Principal Occupation During the Past 5 Years | Number of Portfolios in Fund Complex Overseen by Trustee* | Other | |||||
Thomas W. Lambeth* Birthdate: 01/35 | Trustee, Chairman of the Board of Trustees | Indefinite, 08/92 — Present | From January 2001 to present, Senior Fellow, Z. Smith Reynolds Foundation | 24 | None | |||||
Drew T. Kagan Birthdate: 02/48 | Trustee | Indefinite, 08/00 — Present | Retired; from September 2010 to March 2013, Chairman, Montecito Advisors, Inc.; from December 2003 to September 2010, CEO, Montecito Advisors, Inc.; from March 1996 to December 2003, President, Investment Affiliate, Inc. | 24 | None | |||||
Laura C. Bingham Birthdate: 11/56 | Trustee | Indefinite, 02/01 — Present | From March 2013 to present, Partner, Newport Board Group; from July 2010 to February 2013, governance and leadership consultant; from July 1998 to June 2010, President of Peace College | 24 | None | |||||
Douglas R. Van Scoy Birthdate: 11/43 | Trustee | Indefinite, 05/04 — Present | Retired; from November 1974 to July 2001, employee of Smith Barney (investment banking), most recently as Director of Private Client Group and Senior Executive Vice President | 24 | None | |||||
James L. Roberts Birthdate: 11/42 | Trustee | Indefinite, 11/04 — Present | Retired; from November 2006 to present, Director, Grand Mountain Bancshares, Inc.; from January 1999 to December 2003, President, CEO and Director, Covest Bancshares, Inc. | 24 | None | |||||
* Effective December 31, 2014, Mr. Lambeth retired from the Board of Trustees. See Note 7 for more information.
31
Sterling Capital Variable Insurance Funds |
|
The following table shows information for the trustees who are, each, an “interested person” of the Funds as defined in the 1940 Act:
INTERESTED TRUSTEES
Name and Birthdate | Position(s) Held With the Funds | Term of Office/ Length of Time Served | Principal Occupation | Number of Portfolios in Fund Complex by Trustee* | Other Directorships Held by Trustee | |||||
Alexander W. McAlister** Birthdate: 03/60 | Trustee | Indefinite, 11/10 — Present | President, Sterling Capital Management LLC | 24 | Director, | |||||
Alan G. Priest*** Birthdate: 05/52 | Trustee | Indefinite, 7/12 — Present | Retired; from April 1993 to April 2012, Partner, Ropes & Gray LLP | 24 | None | |||||
| * | The Sterling Capital Fund Complex consists of two open-end investment management companies: Sterling Capital Funds and Sterling Capital Variable Insurance Funds. |
| ** | Mr. McAlister is treated by the Funds as an “interested person” (as defined in Section 2(a)(19) of the 1940 Act) of the Funds because he is an officer of the Advisor. |
| *** | Mr. Priest is treated by the Fund as an “interested person” (as defined in Section 2(a)(19) of the 1940 Act) of the Funds because he was a partner of a law firm that acted as counsel to the Funds during the past two fiscal years. |
The following table shows information for officers of the Funds:
Name and Birthdate | Position(s) Held | Term of Office/ Length of Time Served | Principal Occupation During the Past 5 Years | |||
James T. Gillespie Birthdate: 11/66 | President | Indefinite, 12/12 — Present | From March 2012 to present, Executive Director, Sterling Capital Management LLC; From June 2010 to March 2012, Director, Sterling Capital Management LLC and its predecessors; from August 2008 to June 2010, Vice President Relationship Management, JPMorgan Chase & Co.; from February 2005 to August 2008, Senior Vice President and Manager of Mutual Fund Administration, Sterling Capital Management LLC and its predecessors | |||
Kenneth R. Cotner* Birthdate: 02/59 | Treasurer | Indefinite, 12/12 — Present | From 2001 to present, Chief Operating Officer, from 2013 to 2014, Chief Compliance Officer, Sterling Capital Management LLC and its predecessors | |||
Todd M. Miller Birthdate: 09/71 | Vice President and Secretary | Indefinite, Vice President, 08/05 — Present; Secretary, 08/10 — Present | From June 2009 to present, Director, Sterling Capital Management LLC and its predecessors; from June 2005 to May 2009, Mutual Fund Administrator; from May 2001 to May 2005, Manager, BISYS Fund Services | |||
Krystle V. Edwards Birthdate: 02/86 | Vice President | Indefinite, 11/14 — Present | From May 2013 to present, Associate, Sterling Capital Management LLC; from March 2012-December 2012, Financial Advisor, First Command Financial Planning; from September 2009-May 2012, student at Campbell University School of Law | |||
32
Sterling Capital Variable Insurance Funds
|
|
Name and Birthdate | Position(s) Held With the Funds | Term of Office/ Length of Time Served | Principal Occupation During the Past 5 Years | |||
Salvatore Faia** Birthdate: 12/62 | Chief Compliance and Anti-Money Laundering Officer | Indefinite, 09/13 — Present | From 2004 to present, President and Founder of Vigilant Compliance Services; Director of Energy and Income Partnership since 2005 | |||
Andrew J. McNally Birthdate: 12/70 | Assistant Treasurer | Indefinite, Assistant Treasurer, 06/10 — Present; Treasurer, 04/07 — 06/10 | From January 2007 to present, Vice President and Senior Director, and from July 2000 to December 2006, Vice President and Director, Fund Accounting and Administration Department, BNY Mellon Investment Servicing (US) Inc. | |||
Julie M. Powers Birthdate: 10/69 | Assistant Secretary | Indefinite, 11/11 — Present | From November 2011 to present, Vice President; from March 2009 to October 2011, Senior Manager and Vice President; from August 2005 to February 2009, Manager and Assistant Vice President, Regulatory Administration Department, BNY Mellon Investment Servicing (US) Inc. | |||
| * | Effective December 31, 2014, Mr. Cotner retired as Treasurer of the Funds. See Note 7 for more information. |
| ** | Effective January 1, 2015, Brian M. Moran replaced Salvatore Faia as Chief Compliance and Anti-Money Laundering Officer. |
The Funds’ Statement of Additional Information includes additional information about the Funds’ Trustees and Officers. To receive your free copy of the Statement of Additional Information, call toll free: 1-800-228-1872.
33
Item 2. Code of Ethics.
| (a) | The registrant, as of the end of the period covered by this report, has adopted a code of ethics that applies to the registrant’s principal executive officer, principal financial officer, principal accounting officer or controller, or persons performing similar functions, regardless of whether these individuals are employed by the registrant or a third party (the “Code of Ethics”). |
| (c) | There have been no amendments, during the period covered by this report, to a provision of the Code of Ethics that applies to the registrant’s principal executive officer, principal financial officer, principal accounting officer or controller, or persons performing similar functions, regardless of whether these individuals are employed by the registrant or a third party, and that relates to any element of the code of ethics definition enumerated in Item 2(b) of Form N-CSR. |
| (d) | The registrant has not granted any waivers, including an implicit waiver, from a provision of the “code of ethics” that applies to the registrant’s principal executive officer, principal financial officer, principal accounting officer or controller, or persons performing similar functions, regardless of whether these individuals are employed by the registrant or a third party, that relates to one or more of the items set forth in Item 2(b) of Form N-CSR. |
Item 3. Audit Committee Financial Expert.
As of the end of the period covered by the report, the registrant’s board of trustees has determined that Drew Kagan is qualified to serve as an audit committee financial expert serving on its audit committee and that he is “independent,” as defined by Item 3 of Form N-CSR.
Item 4. Principal Accountant Fees and Services.
Audit Fees
| (a) | The aggregate fees billed for each of the last two fiscal years for professional services rendered by the principal accountant for the audit of the registrant’s annual financial statements or services that are normally provided by the accountant in connection with statutory and regulatory filings or engagements for those fiscal years are $61,595 in 2014 and $58,150 in 2013. |
Audit-Related Fees
| (b) | The aggregate fees billed in each of the last two fiscal years for assurance and related services by the principal accountant that are reasonably related to the performance of the audit of the registrant’s financial statements and are not reported under paragraph (a) of this Item are $0 in 2014 and $0 in 2013. |
Tax Fees
| (c) | The aggregate fees billed in each of the last two fiscal years for professional services rendered by the principal accountant for tax compliance, tax advice, and tax planning are $5,688 in 2014 and $7,400 in 2013 Fees for both 2014 and 2013 relate to the preparation of federal income and excise tax returns. |
All Other Fees
| (d) | The aggregate fees billed in each of the last two fiscal years for products and services provided by the principal accountant, other than the services reported in paragraphs (a) through (c) of this Item are $0 in 2014 and $0 in 2013. |
| (e)(1) | Except as permitted by Rule 2-01(c)(7)(i)(C) of Regulation S-X, the Trust’s Audit Committee must pre-approve all audit and non-audit services provided by the independent accountants relating to the operations or financial reporting of the funds. Prior to the commencement of any audit or non-audit services to a fund, the Audit Committee reviews the services to determine whether they are appropriate and permissible under applicable law. |
| (e)(2) | The percentage of services described in each of paragraphs (b) through (d) of this Item that were approved by the audit committee pursuant to paragraph (c)(7)(i)(C) of Rule 2-01 of Regulation S-X are as follows: |
(b) N/A
(c) 100%
(d) N/A
| (f) | The percentage of hours expended on the principal accountant’s engagement to audit the registrant’s financial statements for the most recent fiscal year that were attributed to work performed by persons other than the principal accountant’s full-time, permanent employees was zero percent. |
| (g) | The aggregate non-audit fees billed by the registrant’s accountant for services rendered to the registrant, and rendered to the registrant’s investment adviser (not including any sub-adviser whose role is primarily portfolio management and is subcontracted with or overseen by another investment adviser), and any entity controlling, controlled by, or under common control with the adviser that provides ongoing services to the registrant for each of the last two fiscal years of the registrant was $1,089,000 in 2014 and $2,229,000 in 2013. |
| (h) | The registrant’s audit committee of the board of trustees has considered whether the provision of non-audit services that were rendered to the registrant’s investment adviser (not including any sub-adviser whose role is primarily portfolio management and is subcontracted with or overseen by another investment adviser), and any entity controlling, controlled by, or under common control with the investment adviser that provides ongoing services to the registrant that were not pre-approved pursuant to paragraph (c)(7)(ii) of Rule 2-01 of Regulation S-X is compatible with maintaining the principal accountant’s independence. |
Item 5. Audit Committee of Listed Registrants.
Not applicable.
Item 6. Investments.
| (a) | Schedule of Investments in securities of unaffiliated issuers as of the close of the reporting period is included as part of the report to shareholders filed under Item 1 of this form. |
| (b) | Not applicable. |
| Item 7. | Disclosure of Proxy Voting Policies and Procedures for Closed-End Management Investment Companies. |
Not applicable.
Item 8. Portfolio Managers of Closed-End Management Investment Companies.
Not applicable.
| Item 9. | Purchases of Equity Securities by Closed-End Management Investment Company and Affiliated Purchasers. |
Not applicable.
Item 10. Submission of Matters to a Vote of Security Holders.
There have been no material changes to the procedures by which shareholders may recommend nominees to the registrant’s board of trustees, where those changes were implemented after the registrant last provided disclosure in response to the requirements of Item 407(c)(2)(iv) of Regulation S-K (17 CFR 229.407) (as required by Item 22(b)(15) of Schedule 14A (17 CFR 240.14a-101)), or this Item.
Item 11. Controls and Procedures.
| (a) | The registrant’s principal executive officer and principal financial officer have concluded, based on their evaluation of the effectiveness of the design and operation of the registrant’s disclosure controls and procedures (as defined in Rule 30a-3(c) under the Investment Company Act of 1940 (17 CFR 270.30a-3(c))) as of a date within 90 days of the filing date of this report, that the design and operation of such procedures are effective to provide reasonable assurance that information required to be disclosed by the registrant on Form N-CSR is recorded, processed, |
summarized and reported within the time periods specified in the Securities and Exchange Commission’s rules and forms, and that information required to be disclosed by the registrant in the reports that it files or submits on Form N-CSR is accumulated and communicated to the registrant’s management, including its principal executive officer and principal financial officer, as appropriate to allow timely decisions regarding required disclosure. |
| (b) | There were no changes in the registrant’s internal control over financial reporting (as defined in Rule 30a-3(d) under the 1940 Act (17 CFR 270.30a-3(d))) that occurred during the second fiscal quarter of the period covered by this report that have materially affected, or are reasonably likely to materially affect, the registrant’s internal control over financial reporting. |
Item 12. Exhibits.
| (a)(1) | The registrant’s Code of Ethics is attached hereto. |
| (a)(2) | Certifications pursuant to Rule 30a-2(a) under the 1940 Act and Section 302 of the Sarbanes-Oxley Act of 2002 are attached hereto. |
| (a)(3) | Not applicable. |
| (b) | Certifications pursuant to Rule 30a-2(b) under the 1940 Act and Section 906 of the Sarbanes- Oxley Act of 2002 are attached hereto. |
(12.other) Not applicable.
SIGNATURES
Pursuant to the requirements of the Securities Exchange Act of 1934 and the Investment Company Act of 1940, the registrant has duly caused this report to be signed on its behalf by the undersigned, thereunto duly authorized.
(Registrant) | Sterling Capital Variable Insurance Funds |
By (Signature and Title) | /s/ James T. Gillespie | |
James T. Gillespie, President | ||
(principal executive officer) |
Date | 02/26/15 |
Pursuant to the requirements of the Securities Exchange Act of 1934 and the Investment Company Act of 1940, this report has been signed below by the following persons on behalf of the registrant and in the capacities and on the dates indicated.
By (Signature and Title) | /s/ James T. Gillespie | |
James T. Gillespie, President | ||
(principal executive officer) |
Date | 02/26/15 |
By (Signature and Title) | /s/ Todd M. Miller | |
Todd M. Miller, Treasurer | ||
(principal financial officer) |
Date | 02/26/15 |