UNITED STATES
SECURITIES AND EXCHANGE COMMISSION
Washington, D.C. 20549
FORM N-CSR
CERTIFIED SHAREHOLDER REPORT OF REGISTERED
MANAGEMENT INVESTMENT COMPANIES
Investment Company Act file number 811-21682
| Sterling Capital Variable Insurance Funds |
(Exact name of registrant as specified in charter)
434 Fayetteville Street Raleigh, NC 27601-0575 |
(Address of principal executive offices) (Zip code)
E.G. Purcell III, President Sterling Capital Variable Insurance Funds 434 Fayetteville Street Raleigh, NC 27601-0575 |
(Name and address of agent for service)
Registrant’s telephone number, including area code: (800) 228-1872
Date of fiscal year end: December 31
Date of reporting period: December 31, 2011
Form N-CSR is to be used by management investment companies to file reports with the Commission not later than 10 days after the transmission to stockholders of any report that is required to be transmitted to stockholders under Rule 30e-1 under the Investment Company Act of 1940 (17 CFR 270.30e-1). The Commission may use the information provided on Form N-CSR in its regulatory, disclosure review, inspection, and policymaking roles.
A registrant is required to disclose the information specified by Form N-CSR, and the Commission will make this information public. A registrant is not required to respond to the collection of information contained in Form N-CSR unless the Form displays a currently valid Office of Management and Budget (“OMB”) control number. Please direct comments concerning the accuracy of the information collection burden estimate and any suggestions for reducing the burden to Secretary, Securities and Exchange Commission, 100 F Street, NE, Washington, DC 20549. The OMB has reviewed this collection of information under the clearance requirements of 44 U.S.C. § 3507.
| Item 1. | Reports to Stockholders. |
The Report to Shareholders is attached herewith.
| Sterling Capital Variable Insurance Funds |
Table of Contents
| 2 | ||
| 3 | ||
| 4 | ||
| 5 | ||
| 6 | ||
| 7 | ||
| 8 | ||
| 9 | ||
| 10 | ||
| 11 | ||
| 16 | ||
| 22 | ||
| 31 | ||
| 32 | ||
| 33 | ||
| 36 | ||
|
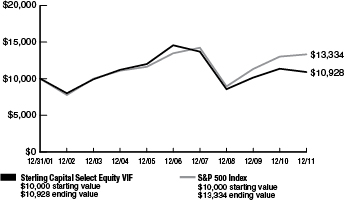
Sterling Capital Select Equity VIF (formerly known as BB&T Select Equity VIF)
Performance Overview 12/31/2001 - 12/31/2011
Growth of a $10,000 investment
Portfolio Manager
Stephen L. Morgan, CFA
Executive Director & Select Equity Portfolio Manager
Sterling Capital Management LLC
Average Annual Returns
| 1 Year | 5 Years | 10 Years | ||||||||||
Sterling Capital Select Equity VIF | -4.04% | -5.60% | 0.89% | |||||||||
S&P 500® Index | 2.11% | -0.25% | 2.92% | |||||||||
The chart represents a comparison of a hypothetical $10,000 investment in the indicated Fund versus a similar investment in the Fund’s benchmark, and includes the reinvestment of distributions. The returns include the Fund level expenses, but do not include fees charged by participating insurance companies. These charges and fees will reduce returns. Past performance does not guarantee future results. The performance data quoted represents past performance and current returns may be lower or higher. Total return figures include change in share price, reinvestment of dividends and capital gains, and do not reflect taxes that a shareholder would pay on fund distributions or on the redemption of fund shares. The value of the contract will fluctuate so that when redeemed, it may be worth more or less than the original investment.
Investment Concerns
Equity securities (stocks) are more volatile and carry more risk. The net asset value per share of the Fund will fluctuate as the value of the securities in the portfolio changes. Value-based investments are subject to the risk that the broad market may not recognize their intrinsic value.
Q. How did the Fund perform during the 12-month period between January 1, 2011 and December 31, 2011?
A. The Fund returned -4.04%. That compared to a 2.11% return for its benchmark, the S&P 500® Index.1
Q. What factors affected the Fund’s performance?
A. Equity markets were flat for the year. Markets demonstrated very high volatility as investors confronted multiple issues, including the slow U.S. economic recovery and the euro zone crisis. These negative factors were somewhat mitigated by attractive valuations for high-quality companies and the Federal Reserve’s accommodative monetary policy.2
During much of the year, the Fund held underweight positions in the utilities, consumer staples and telecommunications sectors. These sectors typically include higher yielding stocks, which performed relatively well in the sluggish economic environment. As a result, the Fund’s underweight positions dragged on performance relative to the benchmark index.2
Late in the third quarter, the Fund increased exposure to growth-
oriented stocks with defensive characteristics. These portfolio changes helped the Fund’s absolute and relative performance in the fourth quarter.2
An underweight position in the financial sector also aided the Fund’s performance relative to its benchmark, as risk-averse investors avoided the sector in a flight to safety. In addition, an overweight position in healthcare stocks boosted relative performance, as investors sought the sector’s attractive dividend yields and defensive qualities.2
| 1 | The Fund is measured against the S&P 500® Index, a widely recognized, unmanaged index of common stocks. The index is unmanaged and does not reflect the deduction of expenses associated with a mutual fund, such as investment management and fund accounting fees. The Fund’s performance reflects the deduction of fees for these services. Investors cannot invest directly in an index, although they can invest in its underlying securities. |
| 2 | Portfolio composition is as of December 31, 2011, and is subject to change. |
A portion of the Fund’s fees have been reduced. If fees had not been reduced, the Fund’s total return for the periods would have been lower.
| 2 | ||||
|
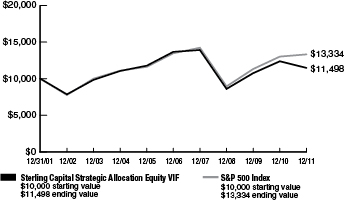
Sterling Capital Strategic Allocation Equity VIF (formerly known as BB&T Capital Manager Equity VIF)
Performance Overview 12/31/2001 - 12/31/2011
Growth of a $10,000 investment
Portfolio Management Team
Managed by Sterling Capital Balanced Portfolio Management Team
Average Annual Returns
| 1 Year | 5 Years | 10 Years | ||||||||||
Sterling Capital Strategic Allocation Equity VIF | -7.32% | -3.41% | 1.41% | |||||||||
S&P 500® Index | 2.11% | -0.25% | 2.92% | |||||||||
The chart represents a comparison of a hypothetical $10,000 investment in the indicated Fund versus a similar investment in the Fund’s benchmark, and includes the reinvestment of distributions. The returns include the Fund level expenses, but do not include fees charged by participating insurance companies. These charges and fees will reduce returns. Past performance does not guarantee future results. The performance data quoted represents past performance and current returns may be lower or higher. Total return figures include change in share price, reinvestment of dividends and capital gains, and do not reflect taxes that a shareholder would pay on fund distributions or on the redemption of fund shares. The value of the contract will fluctuate so that when redeemed, it may be worth more or less than the original investment.
Investment Concerns
Equity securities (stocks) are more volatile and carry more risk. The Fund is primarily concentrated in underlying funds and is therefore subject to the same risks the under lying funds and bears a portion of the expenses of the underlying funds. The underlying funds invest in equity securities. The net asset value per share of the Fund will fluctuate as the value of the securities in the portfolio changes.
Q. How did the Fund perform during the 12-month period between January 1, 2011 and December 31, 2011?
A. The Fund returned -7.32%. That compared to a 2.11% return for the S&P 500® Index.¹
Q. What factors affected the Fund’s performance?
A. At a global level, equities posted negative returns for the year. Investors were concerned about European sovereign debt problems and the risks posed to global economic growth. Nevertheless, U.S. stocks outperformed non-U.S. stocks as a result of the continued, albeit slow-paced, U.S. economic recovery.2
The Fund’s relative performance suffered from its allocations to non-U.S. developed equities and emerging markets equities, which represented 20% and 10% of its total portfolio, respectively. Together, those holdings were the Fund’s primary detractors. The Russell Developed ex-U.S. Index and the Russell Emerging Markets Index returned -12.65% and -19.40%, respectively, during the period.2
An overweight allocation to commodities relative to the benchmark also dragged on the Fund’s relative returns. Commodity-related investments, which made up 5% of the total portfolio during the period under review, returned -13.32% during the period, as measured by the Dow Jones-UBS Commodity Index.2
The Fund’s relative performance benefited from an overweight allocation in real estate investment trusts (“REITs”), which represented 5% of the total portfolio. The Dow Jones Equity All REIT Index returned 7.54% for the year.2
| 1 | The Fund is measured against the S&P 500® Index, a widely recognized, unmanaged index of common stocks. The index does not reflect the deduction of expenses associated with a mutual fund, such as investment management and fund accounting fees. The Fund’s performance reflects the deduction of fees for these services. Investors cannot invest directly in an index, although they can invest in its underlying securities. |
| 2 | Portfolio composition is as of December 31, 2011, and is subject to change. |
A portion of the Fund’s fees have been reduced. If fees had not been reduced, the Fund’s total return for the periods would have been lower.
| 3 | ||||
|
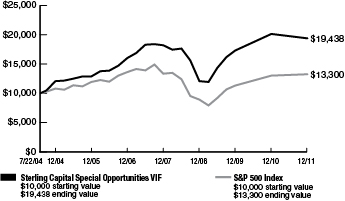
Sterling Capital Special Opportunities VIF (formerly known as BB&T Special Opportunities Equity VIF)
Performance Overview 7/22/2004 - 12/31/2011
Growth of a $10,000 investment
Portfolio Manager
George F. Shipp, CFA
Chief Investment Officer
Scott & Stringfellow, LLC
Average Annual Returns (Inception 7/22/2004)
| 1 Year | 5 Years | Since Inception | ||||||||||
Sterling Capital Special Opportunities VIF | -3.53% | 3.88% | 9.34% | |||||||||
S&P 500® Index | 2.11% | -0.25% | 3.92% | |||||||||
The chart represents a comparison of a hypothetical $10,000 investment in the indicated Fund versus a similar investment in the Fund’s benchmark, and includes the reinvestment of distributions. The inception date used for the S&P 500® Index was 07/31/04. The returns include the Fund level expenses, but do not include fees charged by participating insurance companies. These charges and fees will reduce returns. Past performance does not guarantee future results. The performance data quoted represents past performance and current returns may be lower or higher. Total return figures include change in share price, reinvestment of dividends and capital gains, and do not reflect taxes that a shareholder would pay on fund distributions or on the redemption of fund shares. The value of the contract will fluctuate so that when redeemed, it may be worth more or less than the original investment.
Investment Concerns
Equity securities (stocks) are more volatile and carry more risk. The net asset value per share of the Fund will fluctuate as the value of the securities in the portfolio changes. A concentrated portfolio may add a measure of volatility to performance, as major fluctuations in any one holding will likely affect the Fund more than a fund with greater diversification.
Q. How did the Fund perform during the 12-month period between January 1, 2011 and December 31, 2011?
A. The Fund returned -3.53%. That compared to a 2.11% return for its benchmark, the S&P 500® Index.¹
Q. What factors affected the Fund’s performance?
A. The 12-month period proved to be a see-saw year for stocks. Strong corporate profits boosted the market, particularly in the first third of the year. However, anxiety about European and U.S. sovereign credit downgrades caused investor sentiment to turn negative halfway through the period. Concerns about the potential negative impacts of fiscal austerity measures further contributed to investor unease.2
Earnings grew solidly, however, with an estimated 17% increase for the S&P 500® Index during 2011. The Fund’s holdings posted even better earnings, with an average 21% increase, excluding two companies that more than doubled their profit. Yet investor uncertainty and skepticism weighed heavily on markets. As a result, valuations declined, and the market’s price-to-earnings ratio fell about 15%.2
Large cap issues significantly outperformed smaller companies over the period, and the Fund lagged its benchmark due in part to specific small cap holdings. In particular, the Fund’s worst performers included a
manufacturer of meters to monitor electricity and gas consumption, a low-cost airline, a global fruit company and a defense electronics maker.2
The Fund’s historical preference for faster growing securities over high-yielding securities further contributed to its poor relative performance, as high-dividend paying stocks outperformed the market in 2011. However, ownership of a regulated utility company mitigated some of this negative impact.2
Strategic sector selection improved the Fund’s performance relative to its benchmark. Financials, basic materials and industrials were three of the worst performing sectors in 2011. The Fund held underweight positions in each of these sectors, relative to its benchmark.2
| 1 | The Fund is measured against the S&P 500® Index, a widely recognized, unmanaged index of common stocks. The index does not reflect the deduction of expenses associated with a mutual fund, such as investment management and fund accounting fees. The Fund’s performance reflects the deduction of fees for these services. Investors cannot invest directly in an index, although they can invest in its underlying securities. |
| 2 | Portfolio composition is as of December 31, 2011, and is subject to change. |
| 4 | ||||
|
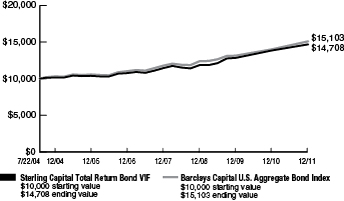
Sterling Capital Total Return Bond VIF (formerly known as BB&T Total Return Bond VIF)
Performance Overview 7/22/2004 - 12/31/2011
Growth of a $10,000 investment
Portfolio Manager
Mark Montgomery, CFA
Managing Director and Fixed Income Portfolio Manager
Sterling Capital Management LLC
Average Annual Returns (Inception 7/22/2004)
| 1 Year | 5 Years | Since Inception | ||||||||||
Sterling Capital Total Return Bond VIF | 6.10% | 6.43% | 5.32% | |||||||||
Barclays Capital U.S. Aggregate Bond Index | 7.84% | 37.01% | 5.72% | |||||||||
The chart represents a comparison of a hypothetical $10,000 investment in the indicated Fund versus a similar investment in the Fund’s benchmark, and includes the reinvestment of distributions. The inception date used for the Barclays Capital U.S. Aggregate Bond Index was 07/31/04. The returns include the Fund level expenses, but do not include fees charged by participating insurance companies. These charges and fees will reduce returns. Past performance does not guarantee future results. The performance data quoted represents past performance and current returns may be lower or higher. Total return figures include change in share price, reinvestment of dividends and capital gains, and do not reflect taxes that a shareholder would pay on fund distributions or on the redemption of fund shares. The value of the contract will fluctuate so that when redeemed, it may be worth more or less than the original investment.
Investment Concerns
Bonds offer a relatively stable level of income, although bond prices will fluctuate providing the potential for principal gain or loss. Intermediate-term, higher-quality bonds generally offer less risk than longer-term bonds and a lower rate of return.
The Fund is subject to the risk that principal value tends to react in opposition to the movement of interest rates and that a rising interest rate environment increases the risk of loss of principal.
Q. How did the Fund perform during the 12-month period between January 1, 2011 and December 31, 2011?
A. The Fund gained 6.10%. That compared to a 7.84% return for its benchmark, the Barclays Capital U.S. Aggregate Bond Index.1
Q. What factors affected the Fund’s performance?
A. Over the course of the period, investors grew increasingly concerned about the slower than expected growth of the U.S. economy and the continued issues surrounding the European sovereign debt crisis. Investors’ resulting flight to quality caused bonds yields to fall and bond prices to rise. These factors contributed to the Fund’s positive absolute return.2
The Fund’s relative performance suffered from its overweight exposure to the corporate sector. An increase in credit risk premiums in that sector depressed prices. Furthermore, the Fund’s allocation within the corporate sector favored financials, which further contributed to the Fund’s underperformance relative to the benchmark. The financial sector was particularly hard hit by investor concerns related to the European sovereign debt crisis.2
The Fund’s relative performance benefited from its overweight exposure to commercial mortgage-backed securities, which outperformed the broader fixed income market on a duration-adjusted basis. Additionally, an overweight exposure to municipal bonds helped the Fund benefit from a compression of municipal bond risk premiums, which helped this sector outperform the broader market.2
| 1 | The Fund is measured against Barclays Capital U.S. Aggregate Bond Index which is a market value-weighted performance benchmark for investment-grade fixed-rate debt issues, including government, corporate, asset-backed and mortgage-backed securities, with maturities of at least one year. The index is unmanaged and does not reflect the deduction of expenses associated with a mutual fund, such as investment management and fund accounting fees. The Fund’s performance reflects the deduction of fees for these services. Investors cannot invest directly in an index, although they can invest in its underlying securities. |
| 2 | Portfolio composition is as of December 31, 2011, and is subject to change. |
A portion of the Fund’s fees have been reduced. If fees had not been reduced, the Fund’s total return for the periods would have been lower.
| 5 | ||||
| Sterling Capital Variable Insurance Funds |
S ummary of Portfolio Holdings (Unaudited)
December 31, 2011
Each Sterling CapitalVariable Insurance Fund’s portfolio composition was as follows at December 31, 2011:
| Sterling Capital Select Equity VIF | Percentage of net assets | ||||
Consumer Discretionary | 9.2% | ||||
Consumer Staples | 9.7% | ||||
Energy | 13.4% | ||||
Financials | 12.4% | ||||
Health Care | 15.0% | ||||
Industrials | 9.5% | ||||
Information Technology | 21.7% | ||||
Materials | 4.0% | ||||
Telecommunication Services | 1.9% | ||||
Exchange Traded Funds | 1.0% | ||||
Cash Equivalents | 1.5% | ||||
|
| ||||
| 99.3% | |||||
|
| ||||
Sterling Capital Strategic Allocation Equity VIF | |||||
Sterling Capital Equity Income Fund, Institutional Class | 6.7% | ||||
Sterling Capital Equity Index Fund, Institutional Class | 1.0% | ||||
Sterling Capital International Fund, Institutional Class | 9.7% | ||||
Sterling Capital Mid Value Fund, Institutional Class | 9.1% | ||||
Sterling Capital Select Equity Fund, Institutional Class | 18.2% | ||||
Sterling Capital Small Value Fund, Institutional Class | 2.2% | ||||
Sterling Capital Special Opportunities Fund, Institutional Class | 4.2% | ||||
Sterling Capital U.S. Treasury Money Market Fund, Institutional Class | 1.4% | ||||
Non-Affiliated Investment Companies | 9.2% | ||||
Exchange Traded Funds | 38.5% | ||||
|
| ||||
| 100.2% | |||||
|
| ||||
Sterling Capital Special Opportunities VIF | |||||
Consumer Discretionary | 11.8% | ||||
Consumer Staples | 5.9% | ||||
Energy | 7.8% | ||||
Financials | 5.4% | ||||
Health Care | 23.2% | ||||
Industrials | 1.6% | ||||
Information Technology | 28.8% | ||||
Materials | 8.5% | ||||
Cash Equivalents | 7.9% | ||||
|
| ||||
| 100.9% | |||||
|
| ||||
Sterling Capital Total Return Bond VIF | |||||
Asset Backed Securities | 1.9% | ||||
Collateralized Mortgage Obligations | 11.2% | ||||
Commercial Mortgage-Backed Securities | 9.7% | ||||
Corporate Bonds | 34.6% | ||||
Mortgage-Backed Securities | 30.3% | ||||
Municipal Bonds | 5.9% | ||||
Preferred Stocks | 1.2% | ||||
U.S. Treasury Notes | 3.6% | ||||
Cash Equivalents | 2.3% | ||||
|
| ||||
| 100.7% | |||||
|
| ||||
6
| Sterling Capital Variable Insurance Funds |
December 31, 2011
As a shareholder of the Sterling Capital Variable Insurance Funds (formerly BB&T Variable Insurance Funds), you incur two types of costs: (1) transaction costs, and (2) ongoing costs, including management fees and other Fund expenses.
These examples are intended to help you understand your ongoing costs (in dollars) of investing in the Sterling Capital Variable Insurance Funds and to compare these costs with the ongoing costs of investing in other mutual funds.
These examples are based on an investment of $1,000 invested at the beginning of the period and held for the entire period from
July 1, 2011 through December 31, 2011.
Actual Example
The table below provides information about actual account values and actual expenses. You may use the information below, together with the amount you invested, to estimate the expenses that you paid over the period. Simply divide your account value by $1,000 (for example, an $8,600 account value divided by $1,000 = 8.6), then multiply the result by the number in the table under the heading entitled “Expenses Paid During Period” to estimate the expenses you paid on your account during this period.
| Beginning Account Value 7/1/11 | Ending Account Value 12/31/11 | Expenses Paid During Period 7/1/11 - 12/31/11* | Expense Ratio During Period 7/1/11 - 12/31/11 | |||||||||||||||||
Sterling Capital Select Equity VIF | $ | 1,000.00 | $ | 934.70 | $ | 4.83 | 0.99% | |||||||||||||
Sterling Capital Strategic Allocation Equity VIF | 1,000.00 | 887.80 | 3.33 | 0.70% | ||||||||||||||||
Sterling Capital Special Opportunities VIF | 1,000.00 | 923.00 | 6.20 | 1.28% | ||||||||||||||||
Sterling Capital Total Return Bond VIF | 1,000.00 | 1,032.60 | 5.48 | 1.07% | ||||||||||||||||
| * | Expenses are equal to the average account value times the Fund’s annualized expense ratio multiplied by 184 (the number of days in the most recent fiscal half-year) divided by 365 (the number of days in the fiscal year). Expenses shown do not include annuity contract fees. |
Hypothetical Example for Comparison Purposes
The table below provides information about hypothetical account values and hypothetical expenses based on each Sterling Capital Variable Insurance Fund’s actual expense ratio and an assumed rate of return of 5% per year before expenses, which is not the Funds’ actual return.The hypothetical account values and expenses may not be used to estimate the actual ending account balance or expenses you paid for the period. You may use this information to compare this 5% hypothetical example with the 5% hypothetical examples that appear in the shareholder reports of other funds.
Please note that the expenses shown in the table are meant to highlight your ongoing costs only and do not reflect any transactional costs. Therefore, the table is useful in comparing ongoing costs only, and will not help you determine the relative total costs of owning different funds. In addition, if these transactional costs were included, your costs would have been higher.
| Beginning Account Value 7/1/11 | Ending Account Value 12/31/11 | Expenses Paid During Period 7/1/11 - 12/31/11* | Expense Ratio During Period 7/1/11 - 12/31/11 | |||||||||||||||||
Sterling Capital Select Equity VIF | $ | 1,000.00 | $ | 1,020.21 | $ | 5.04 | 0.99 | % | ||||||||||||
Sterling Capital Strategic Allocation Equity VIF | 1,000.00 | 1,021.68 | 3.57 | 0.70 | % | |||||||||||||||
Sterling Capital Special Opportunities VIF | 1,000.00 | 1,018.75 | 6.51 | 1.28 | % | |||||||||||||||
Sterling Capital Total Return Bond VIF | 1,000.00 | 1,019.81 | 5.45 | 1.07 | % | |||||||||||||||
| * | Expenses are equal to the average account value times the Fund’s annualized expense ratio multiplied by 184 (the number of days in the most recent fiscal half-year) divided by 365 (the number of days in the fiscal year). Expenses shown do not include annuity contract fees. |
7
| Sterling Capital Select Equity VIF |
Schedule of Portfolio Investments
December 31, 2011
Shares | Fair Value | |||||
COMMON STOCKS (96.8%) | ||||||
Consumer Discretionary (9.2%) | ||||||
18,600 | Comcast Corp., Class A | $ | 441,006 | |||
6,300 | Kohl’s Corp. | 310,905 | ||||
15,000 | Lowe’s Cos., Inc. | 380,700 | ||||
7,260 | Target Corp. | 371,857 | ||||
12,000 | Walt Disney Co. (The) | 450,000 | ||||
|
| |||||
| 1,954,468 | ||||||
|
| |||||
| Consumer Staples (9.7%) | ||||||
4,040 | Coca-Cola Co. (The) | 282,679 | ||||
2,600 | CVS Caremark Corp. | 106,028 | ||||
4,860 | Kellogg Co. | 245,770 | ||||
4,470 | Kraft Foods, Inc., Class A. | 166,999 | ||||
7,800 | PepsiCo, Inc. | 517,530 | ||||
4,800 | Procter & Gamble Co. (The) | 320,208 | ||||
7,350 | Sysco Corp. | 215,575 | ||||
3,750 | Wal-Mart Stores, Inc. | 224,100 | ||||
|
| |||||
| 2,078,889 | ||||||
|
| |||||
| Energy (13.4%) | ||||||
7,440 | Baker Hughes, Inc. | 361,882 | ||||
9,170 | Cenovus Energy, Inc. | 304,444 | ||||
3,750 | Chevron Corp. | 399,000 | ||||
2,690 | ConocoPhillips | 196,020 | ||||
9,000 | Exxon Mobil Corp. | 762,840 | ||||
6,500 | Schlumberger, Ltd. | 444,015 | ||||
13,150 | Suncor Energy, Inc. | 379,115 | ||||
|
| |||||
| 2,847,316 | ||||||
|
| |||||
| Financials (12.4%) | ||||||
1,950 | American Express Co. | 91,981 | ||||
5,100 | Berkshire Hathaway, Inc., Class B(a) | 389,130 | ||||
15,300 | JPMorgan Chase & Co. | 508,725 | ||||
10,500 | MetLife, Inc. | 327,390 | ||||
3,600 | T. Rowe Price Group, Inc. | 205,020 | ||||
5,510 | Travelers Cos., Inc. (The) | 326,027 | ||||
15,500 | Wells Fargo & Co. | 427,180 | ||||
19,500 | Weyerhaeuser Co., REIT | 364,065 | ||||
|
| |||||
| 2,639,518 | ||||||
|
| |||||
| Health Care (15.0%) | ||||||
3,750 | Amgen, Inc. | 240,788 | ||||
9,490 | Express Scripts, Inc.(a) | 424,108 | ||||
4,430 | Johnson & Johnson | 290,519 | ||||
9,900 | Medtronic, Inc. | 378,675 | ||||
12,950 | Merck & Co., Inc. | 488,215 | ||||
13,400 | Pfizer, Inc. | 289,976 | ||||
12,860 | St. Jude Medical, Inc. | 441,098 | ||||
7,440 | Stryker Corp. | 369,842 | ||||
5,190 | UnitedHealth Group, Inc. | 263,029 | ||||
|
| |||||
| 3,186,250 | ||||||
|
| |||||
| Industrials (9.5%) | ||||||
4,290 | FedEx Corp. | 358,258 | ||||
38,600 | General Electric Co. | 691,326 | ||||
7,380 | Honeywell International, Inc. | 401,103 | ||||
990 | Union Pacific Corp. | 104,881 | ||||
Shares | Fair Value | |||||
COMMON STOCKS — (continued) | ||||||
| Industrials — (continued) | ||||||
17,900 | Xylem, Inc. | $ | 459,851 | |||
|
| |||||
| 2,015,419 | ||||||
|
| |||||
| Information Technology (21.7%) | ||||||
2,090 | Apple, Inc.(a) | 846,450 | ||||
20,600 | Cisco Systems, Inc. | 372,448 | ||||
15,200 | EMC Corp.(a) | 327,408 | ||||
660 | Google, Inc., Class A(a) | 426,294 | ||||
8,700 | Intel Corp. | 210,975 | ||||
1,800 | International Business Machines Corp. | 330,984 | ||||
27,600 | Microsoft Corp. | 716,496 | ||||
10,500 | Oracle Corp. | 269,325 | ||||
5,860 | QUALCOMM, Inc. | 320,542 | ||||
12,950 | TE Connectivity, Ltd. | 398,990 | ||||
13,700 | Texas Instruments, Inc. | 398,807 | ||||
|
| |||||
| 4,618,719 | ||||||
|
| |||||
| Materials (4.0%) | ||||||
7,080 | Alcoa, Inc. | 61,242 | ||||
5,550 | Barrick Gold Corp. | 251,138 | ||||
8,000 | E.I. du Pont de Nemours & Co. | 366,240 | ||||
4,650 | Freeport-McMoRan Copper & Gold, Inc. | 171,073 | ||||
|
| |||||
| 849,693 | ||||||
|
| |||||
| Telecommunication Services (1.9%) | ||||||
13,800 | AT&T, Inc. | 417,312 | ||||
|
| |||||
Total Common Stocks | 20,607,584 | |||||
|
| |||||
EXCHANGE TRADED FUNDS (1.0%) | ||||||
9,800 | Financial Select Sector SPDR Fund | 127,400 | ||||
2,400 | Utilities Select Sector SPDR Fund | 86,352 | ||||
|
| |||||
Total Exchange Traded Funds | 213,752 | |||||
|
| |||||
INVESTMENT COMPANY (1.5%) | ||||||
319,423 | Federated Treasury Obligations Fund, Institutional Shares | 319,423 | ||||
|
| |||||
Total Investment Company | 319,423 | |||||
|
| |||||
Total Investments — 99.3% | 21,140,759 | |||||
Net Other Assets (Liabilities) — 0.7% | 143,076 | |||||
|
| |||||
NET ASSETS — 100.0% | $ | 21,283,835 | ||||
|
| |||||
| (a) | Represents non-income producing security. |
REIT — Real Estate Investment Trust
SPDR — Standard and Poors Depositary Receipt
See accompanying notes to the financial statements.
8
| Sterling Capital Strategic Allocation Equity VIF |
Schedule of Portfolio Investments
December 31, 2011
Shares | Fair Value | |||||
AFFILIATED INVESTMENT COMPANIES (52.5%) | ||||||
24,835 | Sterling Capital Equity Income Fund, | $ | 367,808 | |||
6,607 | Sterling Capital Equity Index Fund, | 55,632 | ||||
125,310 | Sterling Capital International Fund, | 538,833 | ||||
38,986 | Sterling Capital Mid Value Fund, | 502,918 | ||||
90,720 | Sterling Capital Select Equity Fund, | 1,007,900 | ||||
11,128 | Sterling Capital Small Value Fund, | 122,965 | ||||
13,912 | Sterling Capital Special Opportunities Fund, | 234,133 | ||||
76,801 | Sterling Capital U.S. Treasury Money Market Fund, | 76,801 | ||||
|
| |||||
Total Affiliated Investment Companies | 2,906,990 | |||||
|
| |||||
NON-AFFILIATED INVESTMENT COMPANIES (9.2%) | ||||||
29,635 | Credit Suisse Commodity Return Strategy Fund(a) | 242,417 | ||||
13,774 | Harding, Loevner International Equity Portfolio | 184,024 | ||||
2,425 | Lazard Emerging Markets Equity Portfolio | 40,747 | ||||
1,464 | Oppenheimer Developing Markets Fund | 42,413 | ||||
|
| |||||
Total Non-Affiliated Investment Companies | 509,601 | |||||
|
| |||||
EXCHANGE TRADED FUNDS (38.5%) | ||||||
4,654 | iShares Dow Jones US Real Estate Index Fund | 264,301 | ||||
4,616 | iShares MSCI EAFE Small Cap Index Fund | 160,452 | ||||
4,363 | iShares MSCI EAFE Value Index Fund | 186,300 | ||||
11,649 | iShares MSCI Emerging Markets Index Fund | 441,963 | ||||
2,550 | iShares Russell 2000 Index Fund | 187,909 | ||||
8,941 | iShares Russell Midcap Growth Index Fund | 492,202 | ||||
3,193 | iShares S&P 500 Index Fund | 402,190 | ||||
|
| |||||
Total Exchange Traded Funds | 2,135,317 | |||||
|
| |||||
Total Investments — 100.2% | 5,551,908 | |||||
Net Other Assets (Liabilities) — (0.2)% | (8,331 | ) | ||||
|
| |||||
NET ASSETS — 100.0% | $ | 5,543,577 | ||||
|
| |||||
| (a) | Represents non-income producing security. |
See accompanying notes to the financial statements.
9
| Sterling Capital Special Opportunities VIF |
Schedule of Portfolio Investments
December 31, 2011
Shares | Fair Value | |||||||
| COMMON STOCKS (93.0%) | |||||||
| Consumer Discretionary (11.8%) | ||||||||
| 86,000 | Comcast Corp., Class A | $ | 2,039,060 | |||||
| 50,000 | Ford Motor Co.(a) | 538,000 | ||||||
| 27,500 | Yum! Brands, Inc. | 1,622,775 | ||||||
|
| |||||||
| 4,199,835 | ||||||||
|
| |||||||
Consumer Staples (5.9%) | ||||||||
| 90,000 | Dole Food Co., Inc.(a) | 778,500 | ||||||
| 17,000 | Energizer Holdings, Inc.(a) | 1,317,160 | ||||||
|
| |||||||
| 2,095,660 | ||||||||
|
| |||||||
Energy (7.8%) | ||||||||
| 15,000 | Apache Corp. | 1,358,700 | ||||||
| 11,000 | EOG Resources, Inc. | 1,083,610 | ||||||
| 10,000 | Halliburton Co. | 345,100 | ||||||
|
| |||||||
| 2,787,410 | ||||||||
|
| |||||||
Financials (5.4%) | ||||||||
| 40,000 | Charles Schwab Corp. (The) | 450,400 | ||||||
| 5,500 | CME Group, Inc. | 1,340,185 | ||||||
| 15,500 | Och-Ziff Capital Management Group LLC, Class A | 130,355 | ||||||
|
| |||||||
| 1,920,940 | ||||||||
|
| |||||||
Health Care (23.2%) | ||||||||
| 44,000 | Gilead Sciences, Inc.(a) | 1,800,920 | ||||||
| 19,000 | McKesson Corp. | 1,480,290 | ||||||
| 49,000 | Merck & Co., Inc. | 1,847,300 | ||||||
| 35,000 | Teva Pharmaceutical Industries, Ltd., ADR | 1,412,600 | ||||||
| 5,000 | Thermo Fisher Scientific, Inc.(a) | 224,850 | ||||||
| 29,000 | UnitedHealth Group, Inc. | 1,469,720 | ||||||
|
| |||||||
| 8,235,680 | ||||||||
|
| |||||||
Industrials (1.6%) | ||||||||
| 7,000 | FedEx Corp. | 584,570 | ||||||
|
| |||||||
Information Technology (28.8%) | ||||||||
| 150,000 | Activision Blizzard, Inc. | 1,848,000 | ||||||
| 50,000 | Adobe Systems, Inc.(a) | 1,413,500 | ||||||
Shares | Fair Value | |||||||
| COMMON STOCKS — (continued) | |||||||
| Information Technology — (continued) | ||||||||
| 84,000 | Cisco Systems, Inc. | $ | 1,518,720 | |||||
| 40,000 | Corning, Inc. | 519,200 | ||||||
| 92,000 | Dell, Inc.(a) | 1,345,960 | ||||||
| 46,000 | eBay, Inc.(a) | 1,395,180 | ||||||
| 33,000 | Harris Corp. | 1,189,320 | ||||||
| 19,000 | Intuit, Inc. | 999,210 | ||||||
|
| |||||||
| 10,229,090 | ||||||||
|
| |||||||
Materials (8.5%) | ||||||||
| 26,000 | Newmont Mining Corp. | 1,560,260 | ||||||
| 19,500 | Teck Resources, Ltd., Class B | 686,205 | ||||||
| 52,000 | Yamana Gold, Inc. | 763,880 | ||||||
|
| |||||||
| 3,010,345 | ||||||||
|
| |||||||
Total Common Stocks | 33,063,530 | |||||||
|
| |||||||
| INVESTMENT COMPANY (7.9%) | |||||||
| 2,816,655 | Federated Treasury Obligations Fund, Institutional Shares | 2,816,655 | ||||||
|
| |||||||
Total Investment Company | 2,816,655 | |||||||
|
| |||||||
| Total Investments — 100.9% | 35,880,185 | ||||||
| Net Other Assets (Liabilities) — (0.9)% | (313,541 | ) | |||||
|
| |||||||
| NET ASSETS — 100.0% | $ | 35,566,644 | |||||
|
| |||||||
| (a) | Represents non-income producing security |
ADR — American Depository Receipt
See accompanying notes to the financial statements.
10
| Sterling Capital Total Return Bond VIF |
Schedule of Portfolio Investments
December 31, 2011
Principal Amount | Fair Value | |||||||
| ASSET BACKED SECURITIES (1.9%) | |||||||
| $ | 95,000 | American Express Credit Account Master Trust, | $ | 96,858 | ||||
| 200,000 | Capital One Multi-Asset Execution Trust, | 199,626 | ||||||
| 85,000 | MBNA Credit Card Master Note Trust, | 84,943 | ||||||
|
| |||||||
Total Asset Backed Securities | 381,427 | |||||||
|
| |||||||
| COLLATERALIZED MORTGAGE | |||||||
| 108,556 | Adjustable Rate Mortgage Trust, | 101,017 | ||||||
| 62,188 | Banc of America Alternative Loan Trust, | 60,639 | ||||||
| 121,984 | Banc of America Funding Corp., | 114,300 | ||||||
| 71,829 | Countrywide Alternative Loan Trust, | 70,718 | ||||||
| 73,640 | Countrywide Home Loan Mortgage Pass Through Trust, | 75,466 | ||||||
| 90,399 | Credit Suisse First Boston Mortgage Securities Corp., | 91,327 | ||||||
| 177,186 | Fannie Mae, Series 2011-31, Class DA, 3.500%, 11/25/28(b) | 183,100 | ||||||
| 67,466 | Fannie Mae, Series 2003-33, Class A, 4.000%, 5/25/33(b) | 72,320 | ||||||
| 64,093 | Fannie Mae, Series 2003-33, Class AQ, 4.000%, 5/25/33(b) | 67,896 | ||||||
| 229,357 | Fannie Mae, Series 2009-70, Class PA, 5.000%, 8/25/35(b) | 235,815 | ||||||
| 100,033 | Fannie Mae, Series 2008-29, Class BG, 4.700%, 12/25/35(b) | 106,091 | ||||||
| 49,026 | First Horizon Asset Securities, Inc., | 50,808 | ||||||
| 59,801 | Freddie Mac, Series 2906, Class VC, 5.000%, 12/15/15(b) | 62,153 | ||||||
| 51,036 | Freddie Mac, Series 3773, Class AL, 3.250%, 6/15/25(b) | 53,136 | ||||||
| 65,935 | MASTR Alternative Loans Trust, Series 2004-13, Class 3A1, 6.500%, 1/25/35 | 66,492 | ||||||
| 105,692 | RAAC, Series 2004-SP3, Class AI5, 4.890%, 12/25/32(a) | 105,213 | ||||||
| 88,895 | Residential Accredit Loans, Inc., | 89,991 | ||||||
| 53,903 | Residential Asset Securitization Trust, | 46,211 | ||||||
| 142,046 | Structured Adjustable Rate Mortgage Loan Trust, | 121,791 | ||||||
| 77,132 | Structured Asset Securities Corp., Series | |||||||
2003-10, Class A, 6.000%, 4/25/33 | 80,622 | |||||||
| 51,590 | Structured Asset Securities Corp., | 51,184 | ||||||
| 130,044 | Wells Fargo Mortgage Backed Securities Trust, | 107,045 | ||||||
| 134,765 | Wells Fargo Mortgage Backed Securities Trust, | 115,647 | ||||||
Principal Amount | Fair Value | |||||||
| COLLATERALIZED MORTGAGE OBLIGATIONS | |||||||
| $ | 53,817 | Wells Fargo Mortgage Backed Securities Trust, | $ | 55,210 | ||||
|
| |||||||
Total Collateralized Mortgage Obligations | 2,184,192 | |||||||
|
| |||||||
| COMMERCIAL MORTGAGE-BACKED | |||||||
| 14,000 | Banc of America Merrill Lynch Commercial Mortgage, Inc., | 15,259 | ||||||
| 40,000 | Banc of America Merrill Lynch Commercial Mortgage, Inc., | 39,437 | ||||||
| 100,000 | Banc of America Merrill Lynch Commercial Mortgage, Inc., | 109,629 | ||||||
| 38,637 | Banc of America Merrill Lynch Commercial Mortgage, Inc., | 39,520 | ||||||
| 150,000 | Bear Stearns Commercial Mortgage Securities, | 161,350 | ||||||
| 95,000 | Citigroup/Deutsche Bank Commercial Mortgage Trust, | 99,629 | ||||||
| 95,000 | Citigroup/Deutsche Bank Commercial Mortgage Trust, | 104,073 | ||||||
| 90,000 | Credit Suisse First Boston Mortgage Securities Corp., | 91,384 | ||||||
| 139,000 | Credit Suisse First Boston Mortgage Securities Corp., | 134,957 | ||||||
| 75,000 | Credit Suisse Mortgage Capital Certificates, | 79,763 | ||||||
| 101,000 | DBUBS Mortgage Trust, Series 2011-LC2A, | 109,302 | ||||||
| 100,000 | LB-UBS Commercial Mortgage Trust, | 106,522 | ||||||
| 150,000 | LB-UBS Commercial Mortgage Trust, | 163,442 | ||||||
| 28,000 | Merrill Lynch/Countrywide Commercial Mortgage Trust, | 28,564 | ||||||
| 220,000 | Morgan Stanley Capital I, | 239,454 | ||||||
| 80,000 | Morgan Stanley Capital I, | 81,849 | ||||||
| 119,000 | Wachovia Bank Commercial Mortgage Trust, | 124,869 | ||||||
| 154,000 | Wachovia Bank Commercial Mortgage Trust, | 155,640 | ||||||
|
| |||||||
Total Commercial Mortgage-Backed Securities | 1,884,643 | |||||||
|
| |||||||
Continued
11
| Sterling Capital Total Return Bond VIF |
Schedule of Portfolio Investments — (continued)
December 31, 2011
Principal | Fair Value | |||||||
| CORPORATE BONDS (34.6%) | |||||||
| Consumer Discretionary (2.3%) | ||||||||
| $ | 74,000 | CBS Corp., 8.875%, 5/15/19(d) | $ | 95,045 | ||||
| 154,000 | Comcast Cable Communications Holdings, Inc., 9.455%, 11/15/22(d) | 219,434 | ||||||
| 27,000 | NBCUniversal Media LLC, 5.950%, 4/1/41 | 31,736 | ||||||
| 47,000 | Nordstrom, Inc., 6.250%, 1/15/18 | 55,588 | ||||||
| 49,000 | Walt Disney Co. (The), 1.350%, 8/16/16 | 49,136 | ||||||
|
| |||||||
| 450,939 | ||||||||
|
| |||||||
Consumer Staples (3.5%) | ||||||||
| 103,000 | Altria Group, Inc., 9.950%, 11/10/38 | 156,661 | ||||||
| 38,000 | Anheuser-Busch InBev Worldwide, Inc., 6.375%, 1/15/40 | 52,214 | ||||||
| 48,000 | Coca-Cola Co. (The), 3.150%, 11/15/20 | 50,376 | ||||||
| 48,000 | CVS Caremark Corp., 6.125%, 9/15/39 | 58,410 | ||||||
| 40,000 | J.M. Smucker Co. (The), 3.500%, 10/15/21 | 40,922 | ||||||
| 138,000 | Lorillard Tobacco Co., 6.875%, 5/1/20 | 154,206 | ||||||
| 48,000 | Procter & Gamble Co. (The), 1.450%, 8/15/16 | 48,563 | ||||||
| 87,000 | Wal-Mart Stores, Inc., 5.625%, 4/15/41 | 112,439 | ||||||
|
| |||||||
| 673,791 | ||||||||
|
| |||||||
Energy (3.9%) | ||||||||
| 65,000 | Baker Hughes, Inc., 3.200%, 8/15/21(c) | 67,160 | ||||||
| 74,000 | BP Capital Markets PLC, 3.200%, 3/11/16 | 77,554 | ||||||
| 38,000 | Encana Corp., 5.150%, 11/15/41 | 38,793 | ||||||
| 126,000 | Energy Transfer Partners LP, 9.000%, 4/15/19(d) | 149,873 | ||||||
| 39,000 | Halliburton Co., 4.500%, 11/15/41 | 40,002 | ||||||
| 38,000 | Noble Energy, Inc., 4.150%, 12/15/21 | 39,311 | ||||||
| 142,000 | NuStar Logistics LP, 7.650%, 4/15/18(d) | 168,588 | ||||||
| 36,000 | Occidental Petroleum Corp., 1.750%, 2/15/17 | 36,463 | ||||||
| 88,000 | Schlumberger Investment SA, 3.300%, 9/14/21(c) | 90,406 | ||||||
| 53,000 | Statoil ASA, 3.150%, 1/23/22 | 54,508 | ||||||
|
| |||||||
| 762,658 | ||||||||
|
| |||||||
Financials (13.7%) | ||||||||
| 31,000 | Aflac, Inc., 8.500%, 5/15/19 | 37,992 | ||||||
| 42,000 | American International Group, Inc., 4.875%, 9/15/16 | 39,745 | ||||||
| 60,000 | Berkshire Hathaway, Inc., 2.200%, 8/15/16 | 61,762 | ||||||
| 137,000 | Colonial Realty LP, 6.250%, 6/15/14(d) | 142,490 | ||||||
| 127,000 | Credit Suisse AG, 5.400%, 1/14/20 | 119,782 | ||||||
| 100,000 | Ford Motor Credit Co. LLC, 7.000%, 4/15/15 | 107,500 | ||||||
| 135,000 | General Electric Capital Corp., 2.950%, 5/9/16 | 138,845 | ||||||
| 82,000 | General Electric Capital Corp., GMTN, 6.875%, 1/10/39(d) | 98,239 | ||||||
| 47,000 | Goldman Sachs Group, Inc. (The), 7.500%, 2/15/19 | 51,907 | ||||||
| 65,000 | Goldman Sachs Group, Inc. (The), 5.250%, 7/27/21 | 63,410 | ||||||
| 92,000 | Health Care REIT, Inc., 4.950%, 1/15/21(d) | 87,974 | ||||||
| 100,000 | ING Bank NV, 4.000%, 3/15/16(c) | 96,624 | ||||||
| 92,000 | Jefferies Group, Inc., 8.500%, 7/15/19 | 93,380 | ||||||
| 48,000 | John Deere Capital Corp., MTN, 1.850%, 9/15/16 | 48,414 | ||||||
| 180,000 | JPMorgan Chase & Co., 4.350%, 8/15/21 | 181,783 | ||||||
| 47,000 | KeyCorp, MTN, 5.100%, 3/24/21 | 48,808 | ||||||
| 81,000 | Macquarie Bank, Ltd., 6.625%, 4/7/21(c) | 74,678 | ||||||
| 188,000 | Merrill Lynch & Co., Inc., MTN, 6.875%, 4/25/18 | 185,356 | ||||||
| 115,000 | MetLife, Inc., 6.750%, 6/1/16 | 132,484 | ||||||
| 40,000 | Morgan Stanley, 5.300%, 3/1/13 | 40,490 | ||||||
Principal | Fair Value | |||||||
| CORPORATE BONDS — (continued) | |||||||
Financials — (continued) | ||||||||
| $ | 95,000 | Morgan Stanley, 4.750%, 4/1/14 | $ | 93,583 | ||||
| 69,000 | Morgan Stanley, MTN, 6.625%, 4/1/18(d) | 68,134 | ||||||
| 31,000 | PNC Funding Corp., 2.700%, 9/19/16. | 31,557 | ||||||
| 47,000 | Prudential Financial, Inc., 8.875%, 6/15/38(a) | 53,815 | ||||||
| 101,000 | Scottrade Financial Services, Inc., 6.125%, 7/11/21(c) | 101,374 | ||||||
| 81,000 | Simon Property Group LP, REIT, 10.350%, 4/1/19 | 111,189 | ||||||
| 100,000 | SL Green Realty Corp., REIT, 5.000%, 8/15/18 . | 96,591 | ||||||
| 49,000 | SunTrust Banks, Inc., 3.500%, 1/20/17 | 49,253 | ||||||
| 66,000 | Toronto-Dominion Bank (The), 2.375%, 10/19/16 | 67,161 | ||||||
| 64,000 | Ventas Realty LP, REIT, 4.750%, 6/1/21(d) | 61,769 | ||||||
| 58,000 | WEA Finance LLC, 4.625%, 5/10/21(c) | 56,927 | ||||||
| 22,000 | XLIT, Ltd., 5.750%, 10/1/21 | 23,218 | ||||||
|
| |||||||
| 2,666,234 | ||||||||
|
| |||||||
Health Care (2.2%) | ||||||||
| 39,000 | Cigna Corp., 5.375%, 2/15/42 | 38,776 | ||||||
| 60,000 | DENTSPLY International, Inc., 2.750%, 8/15/16 | 60,576 | ||||||
| 17,000 | Gilead Sciences, Inc., 5.650%, 12/1/41 | 18,822 | ||||||
| 80,000 | Stryker Corp., 2.000%, 9/30/16 | 81,867 | ||||||
| 112,000 | Teva Pharmaceutical Finance IV, BV, 3.650%, 11/10/21 | 113,919 | ||||||
| 62,000 | Thermo Fisher Scientific, Inc., 2.250%, 8/15/16. | 63,207 | ||||||
| 52,000 | UnitedHealth Group, Inc., 4.625%, 11/15/41 | 54,675 | ||||||
|
| |||||||
| 431,842 | ||||||||
|
| |||||||
Industrials (2.1%) | ||||||||
| 52,000 | Burlington Northern Santa Fe LLC, 4.950%, 9/15/41 | 57,365 | ||||||
| 98,000 | Corrections Corp. of America, 6.250%, 3/15/13(d) | 98,000 | ||||||
| 57,000 | Textron, Inc., 4.625%, 9/21/16. | 58,420 | ||||||
| 115,000 | Verisk Analytics, Inc., 5.800%, 5/1/21(d) | 123,797 | ||||||
| 58,000 | Waste Management, Inc., 2.600%, 9/1/16 | 58,871 | ||||||
|
| |||||||
| 396,453 | ||||||||
|
| |||||||
Information Technology (0.6%) | ||||||||
| 66,000 | Intel Corp., 4.800%, 10/1/41 | 73,967 | ||||||
| 39,000 | Oracle Corp., 5.375%, 7/15/40 | 47,513 | ||||||
|
| |||||||
| 121,480 | ||||||||
|
| |||||||
Materials (2.3%) | ||||||||
| 49,000 | ArcelorMittal, 5.500%, 3/1/21 | 44,978 | ||||||
| 19,000 | Bemis Co., Inc., 4.500%, 10/15/21 | 20,128 | ||||||
| 25,000 | Ecolab, Inc., 5.500%, 12/8/41 | 27,704 | ||||||
| 158,000 | Sealed Air Corp., 6.875%, 7/15/33(c) | 138,250 | ||||||
| 83,000 | Vale Overseas, Ltd., 6.875%, 11/21/36 | 94,500 | ||||||
|
| |||||||
| 105,000 | Xstrata Finance Canada, Ltd., 5.800%, 11/15/16(c) | 114,542 | ||||||
|
| |||||||
| 440,102 | ||||||||
|
| |||||||
Telecommunication Services (3.1%) | ||||||||
| 85,000 | America Movil SAB de CV, 6.375%, 3/1/35 | 103,396 | ||||||
| 62,000 | AT&T, Inc., 3.875%, 8/15/21. | 65,581 | ||||||
| 100,000 | Crown Castle International Corp., 9.000%, 1/15/15(d) | 108,375 | ||||||
| 54,000 | Qwest Communications International, Inc., Series B, 7.500%, 2/15/14 | 54,204 | ||||||
| 98,000 | Telecom Italia Capital SA, 7.721%, 6/4/38 | 83,579 | ||||||
Continued
12
| Sterling Capital Total Return Bond VIF |
Schedule of Portfolio Investments — (continued)
December 31, 2011
Principal | Fair Value | |||||||
| CORPORATE BONDS — (continued) |
| ||||||
| Telecommunication Services — (continued) | ||||||||
| $ | 82,000 | Telefonica Emisiones SAU, 5.134%, 4/27/20(d) | $ | 77,024 | ||||
| 95,000 | Verizon Communications, Inc., 6.350%, 4/1/19 | 115,758 | ||||||
|
| |||||||
| 607,917 | ||||||||
|
| |||||||
| Utilities (0.9%) | ||||||||
| 72,000 | Duke Energy Carolinas LLC, 6.100%, 6/1/37 | 91,727 | ||||||
| 22,000 | PSEG Power LLC, 2.750%, 9/15/16 | 22,108 | ||||||
| 66,000 | Southern Co. (The), 1.950%, 9/1/16 | 66,623 | ||||||
|
| |||||||
| 180,458 | ||||||||
|
| |||||||
Total Corporate Bonds | 6,731,874 | |||||||
|
| |||||||
| MORTGAGE-BACKED SECURITIES (30.3%) |
| ||||||
| Fannie Mae(b) (14.2%) | ||||||||
| 11,273 | 4.500%, 10/1/18, Pool #752030 | 12,070 | ||||||
| 5,141 | 5.500%, 12/1/20, Pool #831138 | 5,594 | ||||||
| 18,516 | 5.500%, 5/1/21, Pool #895628 | 20,150 | ||||||
| 20,904 | 5.000%, 10/1/25, Pool #255894 | 22,776 | ||||||
| 122,231 | 4.000%, 12/1/25, Pool #AH0973 | 128,950 | ||||||
| 206,442 | 3.500%, 6/1/26, Pool #AB3171 | 216,077 | ||||||
| 17,711 | 5.500%, 2/1/27, Pool #256600 | 19,311 | ||||||
| 14,246 | 6.000%, 9/1/34, Pool #790912 | 15,831 | ||||||
| 6,632 | 7.000%, 6/1/35, Pool #255820 | 7,571 | ||||||
| 41,380 | 5.000%, 11/1/35, Pool #842402 | 44,737 | ||||||
| 38,447 | 6.000%, 12/1/36, Pool #902054 | 42,414 | ||||||
| 21,328 | 6.000%, 1/1/37, Pool #906095 | 23,528 | ||||||
| 17,292 | 6.000%, 4/1/37, Pool #914725 | 19,060 | ||||||
| 34,147 | 6.000%, 7/1/37, Pool #256800 | 37,638 | ||||||
| 128,269 | 6.000%, 7/1/37, Pool #940807 | 141,381 | ||||||
| 263,007 | 5.500%, 8/1/37, Pool #995082 | 287,344 | ||||||
| 5,422 | 6.000%, 9/1/37, Pool #955005 | 5,976 | ||||||
| 104,617 | 4.790%, 7/1/38, Pool #981430(a) | 112,057 | ||||||
| 39,913 | 5.500%, 7/1/38, Pool #934323. | 43,494 | ||||||
| 83,985 | 5.000%, 1/1/39, Pool #995245 | 90,786 | ||||||
| 106,022 | 4.500%, 6/1/40, Pool #AD6432 | 112,911 | ||||||
| 79,116 | 5.000%, 6/1/40, Pool #AD4927 | 85,560 | ||||||
| 212,262 | 5.000%, 6/1/40, Pool #AD7860 | 229,549 | ||||||
| 80,143 | 4.500%, 8/1/40, Pool #AE2305 | 85,351 | ||||||
| 137,511 | 5.000%, 9/1/40, Pool #AE0530 | 148,645 | ||||||
| 169,738 | 4.000%, 3/1/41, Pool #AH8824 | 178,520 | ||||||
| 91,812 | 4.500%, 3/1/41, Pool #AH8825 | 97,778 | ||||||
| 173,679 | 4.500%, 5/1/41, Pool #AI1023 | 184,964 | ||||||
| 214,653 | 4.500%, 5/1/41, Pool #AI1859 | 228,601 | ||||||
| 114,000 | 4.500%, 1/15/42(e) | 121,303 | ||||||
|
| |||||||
| 2,769,927 | ||||||||
|
| |||||||
| Freddie Mac(b) (10.4%) | ||||||||
| 22,664 | 6.000%, 10/1/19, Pool #G11679 | 24,579 | ||||||
| 11,003 | 5.500%, 10/1/21, Pool #G12425 | 11,919 | ||||||
| 17,263 | 5.500%, 7/1/35, Pool #A36540 | 18,793 | ||||||
| 8,155 | 6.000%, 7/1/35, Pool #A36304 | 9,005 | ||||||
| 23,325 | 5.500%, 2/1/36, Pool #G08111 | 25,367 | ||||||
| 37,319 | 5.500%, 4/1/37, Pool #G08192 | 40,545 | ||||||
| 155,015 | 5.500%, 5/1/37, Pool #G03240 | 168,584 | ||||||
| 21,812 | 5.000%, 6/1/37, Pool #G03094 | 23,462 | ||||||
| 107,536 | 6.000%, 8/1/37, Pool #A64401 | 118,478 | ||||||
| 57,625 | 6.000%, 8/1/37, Pool #A64981 | 63,380 | ||||||
| 19,916 | 5.669%, 9/1/37, Pool #1Q0319(a) | 21,510 | ||||||
| 69,847 | 6.500%, 12/1/37, Pool #A69955 | 78,373 | ||||||
| 13,142 | 5.500%, 1/1/38, Pool #A71523 | 14,278 | ||||||
Principal | Fair Value | |||||||
| MORTGAGE-BACKED SECURITIES — (continued) | |||||||
| Freddie Mac(b) — (continued) | ||||||||
| $ | 223,651 | 5.500%, 10/1/38, Pool #G04814 | $ | 242,983 | ||||
| 160,168 | 4.500%, 1/1/40, Pool #A90764 | 169,867 | ||||||
| 340,776 | 5.500%, 1/1/40, Pool #G06021 | 370,234 | ||||||
| 140,573 | 3.789%, 7/1/40, Pool #1B4948(a) | 147,903 | ||||||
| 229,446 | 5.000%, 7/1/40, Pool #A93070 | 246,770 | ||||||
| 72,109 | 5.000%, 7/1/40, Pool #C03487 | 77,554 | ||||||
| 142,425 | 4.000%, 9/1/40, Pool #A93643 | 149,594 | ||||||
|
| |||||||
| 2,023,178 | ||||||||
|
| |||||||
| Ginnie Mae (5.7%) | ||||||||
| 250,522 | 5.500%, 1/15/39, Pool #646685 | 281,406 | ||||||
| 40,618 | 4.500%, 3/15/39, Pool #697957 | 44,396 | ||||||
| 131,734 | 4.500%, 2/15/40, Pool #737031 | 143,701 | ||||||
| 78,977 | 5.000%, 2/15/40, Pool #737037 | 87,568 | ||||||
| 259,220 | 4.500%, 9/20/40, Pool #4801 | 283,474 | ||||||
| 74,000 | 5.000%, 1/15/42(e) | 81,967 | ||||||
| 160,000 | 5.500%, 1/15/42(e) | 179,575 | ||||||
|
| |||||||
| 1,102,087 | ||||||||
|
| |||||||
Total Mortgage-Backed Securities | 5,895,192 | |||||||
|
| |||||||
| MUNICIPAL BONDS (5.9%) | |||||||
| California (2.3%) | ||||||||
| 65,000 | California, Build America Bonds, School Improvements G.O., Taxable, 7.625%, 3/1/40 . | 80,407 | ||||||
| 80,000 | Los Angeles County Metropolitan Transportation Authority, Refunding Revenue, Senior Proposition A, First Tier, Callable 7/1/21 @ 100, 5.000%, 7/1/22 | 99,853 | ||||||
| 30,000 | Los Angeles Harbor Department Refunding Revenue, Series A, Callable 8/1/12 @ 100 (AMBAC), 5.500%, 8/1/14 | 30,761 | ||||||
| 220,000 | Metropolitan Water District of Southern California, Build America Bonds, Water Utility Improvements Revenue, Callable 7/1/19 @ 100, 6.538%, 7/1/39 | 245,760 | ||||||
|
| |||||||
| 456,781 | ||||||||
|
| |||||||
| Massachusetts (0.5%) | ||||||||
| 80,000 | Massachusetts, Refunding G.O., Series C (AMBAC), 5.500%, 12/1/24 New Mexico (0.3%) | 104,958 | ||||||
|
| |||||||
| 50,000 | New Mexico, Public Improvements Revenue, Series A1, 5.000%, 7/1/15 | 57,351 | ||||||
|
| |||||||
| New York (2.1%) | ||||||||
| 95,000 | New York City Municipal Water Finance Authority, Build America Bonds Taxable, Series EE, Refunding Notes, Callable 6/15/20 @ 100, 6.491%, 6/15/42 | 107,753 | ||||||
| 100,000 | New York State Dormitory Authority, General Purpose, Series A, University & College Improvements Revenue, 5.000%, 3/15/21 | 124,675 | ||||||
| 155,000 | New York, NY, Build America Bonds, Public Improvements G.O., Series G1, 4.774%, 3/1/20 | 173,474 | ||||||
|
| |||||||
| 405,902 | ||||||||
|
| |||||||
Continued
13
| Sterling Capital Total Return Bond VIF |
Schedule of Portfolio Investments — (continued)
December 31, 2011
Principal | Fair Value | |||||||
| MUNICIPAL BONDS — (continued) | |||||||
| Ohio (0.4%) | ||||||||
| $ 60,000 | Ohio State University (The), University & College Improvements Revenue, Series A, 5.000%, 12/1/15 | $ | 69,430 | |||||
|
| |||||||
| Texas (0.3%) | ||||||||
| 50,000 | Williamson County, TX, Limited Tax, Refunding G.O., 4.000%, 2/15/16 | 56,291 | ||||||
|
| |||||||
Total Municipal Bonds | 1,150,713 | |||||||
|
| |||||||
| U.S. TREASURY NOTES (3.6%) |
| ||||||
| 146,000 | 2.125%, 8/15/21 | 149,741 | ||||||
| 419,000 | 4.500%, 8/15/39 | 554,193 | ||||||
|
| |||||||
Total U.S. Treasury Notes | 703,934 | |||||||
|
| |||||||
Shares | ||||||||
| PREFERRED STOCKS (1.2%) |
| ||||||
| Financials (1.2%) | ||||||||
| 4,200 | Citigroup Capital XIII, 7.875% | 109,452 | ||||||
| 4,999 | Fifth Third Capital Trust VI, 7.250% | 126,575 | ||||||
|
| |||||||
Total Preferred Stocks | 236,027 | |||||||
|
| |||||||
Shares | Fair Value | |||||||
| INVESTMENT COMPANY (2.3%) | ||||||||
| 455,365 | Federated Treasury Obligations Fund, Institutional Shares | $ | 455,365 | |||||
|
| |||||||
Total Investment Company | 455,365 | |||||||
|
| |||||||
| Total Investments — 100.7% | 19,623,367 | ||||||
| Net Other Assets (Liabilities) — (0.7)% | (144,952 | ) | |||||
|
| |||||||
| NET ASSETS — 100.0% | $ | 19,478,415 | |||||
|
| |||||||
| (a) | The interest rate for this variable rate note, which will change periodically, is based either on the prime rate or an index of market rates. The reflected rate is in effect as of December 31, 2011. The maturity date reflected is the final maturity date. |
| (b) | On September 7, 2008, the Federal Housing Finance Agency (FHFA) placed Fannie Mae and Freddie Mac into conservatorship with FHFA as the conservator. The conservatorship is a statutory process designed to stabilize a troubled institution with the objective of returning the entities to normal business operations. |
| (c) | Rule 144A, Section 4(2) or other security which is restricted as to resale to qualified institutional investors. The Investment Advisor, using Board approved procedures, has deemed these securities or a portion of these securities to be liquid. |
| (d) | Represents that all or a portion of the security was pledged as collateral for securities purchased on a when-issued basis. |
| (e) | Represents securities purchased on a when-issued basis. At December 31, 2011, total cost of investments purchased on a when-issued basis was $381,155. |
AMBAC — American Municipal Bond Insurance Corp.
G.O. — General Obligation
GMTN — Global Medium Term Note
MTN — Medium Term Note
REIT — Real Estate Investment Trust
See accompanying notes to the financial statements.
14
(This page has been left blank intentionally.)
| Sterling Capital Variable Insurance Funds |
Statements of Assets and Liabilities
December 31, 2011
| Sterling Capital Select Equity VIF | Sterling Capital Strategic Allocation Equity VIF | Sterling Capital Special Opportunities VIF | Sterling Capital Total Return Bond VIF | |||||||||||||
Assets: | ||||||||||||||||
Investments: | ||||||||||||||||
Investments - unaffiliated, at cost | $ | 18,787,081 | $ | 2,480,890 | $ | 31,831,183 | $ | 19,091,503 | ||||||||
Investments - affiliated, at cost | — | 2,639,896 | — | — | ||||||||||||
|
|
|
|
|
|
|
| |||||||||
Total investments, at cost | 18,787,081 | 5,120,786 | 31,831,183 | 19,091,503 | ||||||||||||
Unrealized appreciation (depreciation) | 2,353,678 | 431,122 | 4,049,002 | 531,864 | ||||||||||||
|
|
|
|
|
|
|
| |||||||||
Investments, at value | 21,140,759 | 5,551,908 | 35,880,185 | 19,623,367 | ||||||||||||
Interest and dividends receivable | 37,435 | 1 | 43,887 | 151,681 | ||||||||||||
Receivable for investments sold | 320,551 | — | — | 8,026 | ||||||||||||
Receivable for capital shares issued | — | — | — | 92,216 | ||||||||||||
Prepaid expenses | 18,625 | 5,003 | 32,169 | 17,224 | ||||||||||||
|
|
|
|
|
|
|
| |||||||||
Total Assets | 21,517,370 | 5,556,912 | 35,956,241 | 19,892,514 | ||||||||||||
|
|
|
|
|
|
|
| |||||||||
Liabilities: | ||||||||||||||||
Cash overdraft | — | — | — | 51 | ||||||||||||
Payable for investments purchased | 186,420 | — | 225,522 | 382,075 | ||||||||||||
Payable for capital shares redeemed | 14,407 | 6,087 | 100,372 | 1,040 | ||||||||||||
Accrued expenses and other payables: | ||||||||||||||||
Investment advisory fees | 8,976 | 1,180 | 24,210 | 8,183 | ||||||||||||
Administration fees | 1,838 | — | 3,094 | 1,690 | ||||||||||||
Audit fees | 16,437 | 4,445 | 27,651 | 13,171 | ||||||||||||
Compliance service fees | 21 | 6 | 37 | 20 | ||||||||||||
Printing fees | 2,984 | 806 | 5,019 | 2,332 | ||||||||||||
Other fees | 2,452 | 811 | 3,692 | 5,537 | ||||||||||||
|
|
|
|
|
|
|
| |||||||||
Total Liabilities | 233,535 | 13,335 | 389,597 | 414,099 | ||||||||||||
|
|
|
|
|
|
|
| |||||||||
Net Assets: | $ | 21,283,835 | $ | 5,543,577 | $ | 35,566,644 | $ | 19,478,415 | ||||||||
|
|
|
|
|
|
|
| |||||||||
Net Assets Consist of: | ||||||||||||||||
Capital | $ | 41,444,792 | $ | 11,312,924 | $ | 30,148,063 | $ | 18,053,472 | ||||||||
Accumulated undistributed net investment income | — | 2,924 | 4,750 | 417,221 | ||||||||||||
Accumulated realized gain (loss) | (22,514,635 | ) | (6,203,393 | ) | 1,364,829 | 475,858 | ||||||||||
Net unrealized appreciation (depreciation) | 2,353,678 | 431,122 | 4,049,002 | 531,864 | ||||||||||||
|
|
|
|
|
|
|
| |||||||||
Net Assets | $ | 21,283,835 | $ | 5,543,577 | $ | 35,566,644 | $ | 19,478,415 | ||||||||
|
|
|
|
|
|
|
| |||||||||
Shares of Beneficial Interest Outstanding | ||||||||||||||||
(Unlimited number of shares authorized, no par value) | 2,668,058 | 902,611 | 2,315,775 | 1,836,447 | ||||||||||||
|
|
|
|
|
|
|
| |||||||||
Net Asset Value - offering and redemption price per share | $ | 7.98 | $ | 6.14 | $ | 15.36 | $ | 10.61 | ||||||||
|
|
|
|
|
|
|
| |||||||||
See accompanying notes to the financial statements.
16
| Sterling Capital Variable Insurance Funds |
Statements of Operations
For the year Ended December 31, 2011
| Sterling Capital Select Equity VIF | Sterling Capital Strategic Allocation Equity VIF | Sterling Capital Special Opportunities VIF | Sterling Capital Total Return Bond VIF | |||||||||||||
Investment Income: | ||||||||||||||||
Interest income | $ | — | $ | — | $ | — | $ | 851,033 | ||||||||
Dividend income - unaffiliated | 513,722 | 57,542 | 493,674 | 17,531 | ||||||||||||
Dividend income - affiliated | — | 33,590 | — | — | ||||||||||||
Foreign tax withholding | (5,169 | ) | — | (6,774 | ) | — | ||||||||||
Income from securities lending | 887 | — | 5,211 | 83 | ||||||||||||
|
|
|
|
|
|
|
| |||||||||
Total investment income | 509,440 | 91,132 | 492,111 | 868,647 | ||||||||||||
|
|
|
|
|
|
|
| |||||||||
Expenses: | ||||||||||||||||
Investment advisory fees (See Note 5) | 181,540 | 16,579 | 330,116 | 118,922 | ||||||||||||
Administration fees (See Note 5) | 25,106 | — | 42,144 | 20,230 | ||||||||||||
Audit fees | 20,941 | 5,675 | 35,088 | 16,741 | ||||||||||||
Compliance service fees (See Note 5) | 297 | 80 | 500 | 239 | ||||||||||||
Custodian fees. | 1,784 | 710 | 2,757 | 1,646 | ||||||||||||
Fund accounting fees (See Note 5) | 2,453 | 663 | 4,127 | 1,982 | ||||||||||||
Insurance fees | 20,681 | 5,690 | 29,948 | 16,487 | ||||||||||||
Interest expense (See Note 6) | — | — | 3 | — | ||||||||||||
Legal fees | 13,720 | 3,679 | 22,652 | 10,192 | ||||||||||||
Printing fees | 11,420 | 4,662 | 19,037 | 9,493 | ||||||||||||
Transfer agent fees (See Note 5) | 8,396 | 2,283 | 14,298 | 6,717 | ||||||||||||
Trustee fees | 2,029 | 554 | 3,356 | 1,623 | ||||||||||||
Other fees | 8,124 | 3,816 | 10,183 | 26,913 | ||||||||||||
|
|
|
|
|
|
|
| |||||||||
Total expenses before waivers | 296,491 | 44,391 | 514,209 | 231,185 | ||||||||||||
|
|
|
|
|
|
|
| |||||||||
Less expenses waived/reimbursed by the Investment Advisor (See Note 5) | (59,123 | ) | (6,254 | ) | (352 | ) | (20,017 | ) | ||||||||
|
|
|
|
|
|
|
| |||||||||
Net expenses | 237,368 | 38,137 | 513,857 | 211,168 | ||||||||||||
|
|
|
|
|
|
|
| |||||||||
Net investment income (loss) | 272,072 | 52,995 | (21,746 | ) | 657,479 | |||||||||||
|
|
|
|
|
|
|
| |||||||||
Realized and Unrealized Gain (Loss): | ||||||||||||||||
Net realized gain (loss) from: | ||||||||||||||||
Investment transactions - unaffiliated | 594,772 | 68,122 | 1,386,892 | 645,611 | ||||||||||||
Investment transactions - affiliated | — | (2,495 | ) | — | — | |||||||||||
Distributions from unaffiliated funds | — | 2,116 | — | — | ||||||||||||
Distributions from affiliated funds | — | 14,238 | — | — | ||||||||||||
Written Options | — | — | 74,015 | — | ||||||||||||
Change in unrealized appreciation/depreciation on: | ||||||||||||||||
Investments | (1,778,016 | ) | (569,273 | ) | (2,854,065 | ) | (148,416 | ) | ||||||||
Written Options | — | — | (26,729 | ) | — | |||||||||||
|
|
|
|
|
|
|
| |||||||||
Net realized and unrealized gain (loss) | (1,183,244 | ) | (487,292 | ) | (1,419,887 | ) | 497,195 | |||||||||
|
|
|
|
|
|
|
| |||||||||
Change in net assets from operations | $ | (911,172 | ) | $ | (434,297 | ) | $ | (1,441,633 | ) | $ | 1,154,674 | |||||
|
|
|
|
|
|
|
| |||||||||
See accompanying notes to the financial statements.
17
| Sterling Capital Variable Insurance Funds |
Statements of Changes in Net Assets
| Sterling Capital Select Equity VIF | Sterling Capital Strategic Allocation Equity VIF | |||||||||||||||
| For the Year Ended December 31, 2011 | For the Year Ended December 31, 2010 | For the Year Ended December 31, 2011 | For the Year Ended December 31, 2010 | |||||||||||||
From Investment Activities: | ||||||||||||||||
Operations: | ||||||||||||||||
Net investment income (loss) | $ | 272,072 | $ | 346,877 | $ | 52,995 | $ | 92,516 | ||||||||
Net realized gain (loss) | 594,772 | 1,473,764 | 81,981 | (1,016,139 | ) | |||||||||||
Change in unrealized appreciation/depreciation | (1,778,016 | ) | 1,254,956 | (569,273 | ) | 1,965,251 | ||||||||||
|
|
|
|
|
|
|
| |||||||||
Change in net assets from operations | (911,172 | ) | 3,075,597 | (434,297 | ) | 1,041,628 | ||||||||||
|
|
|
|
|
|
|
| |||||||||
Distributions to Shareholders: | ||||||||||||||||
Net investment income | (264,006 | ) | (349,287 | ) | (50,968 | ) | (117,201 | ) | ||||||||
Net realized gains from investment transactions | — | — | — | — | ||||||||||||
|
|
|
|
|
|
|
| |||||||||
Change in net assets from shareholders distributions | (264,006 | ) | (349,287 | ) | (50,968 | ) | (117,201 | ) | ||||||||
|
|
|
|
|
|
|
| |||||||||
Capital Transactions: | ||||||||||||||||
Proceeds from shares issued | 473,691 | 119,554 | 230,099 | 408,975 | ||||||||||||
Distributions reinvested | 264,006 | 349,287 | 50,968 | 117,201 | ||||||||||||
Value of shares redeemed | (6,596,389 | ) | (7,001,138 | ) | (1,922,281 | ) | (1,727,268 | ) | ||||||||
|
|
|
|
|
|
|
| |||||||||
Change in net assets from capital transactions | (5,858,692 | ) | (6,532,297 | ) | (1,641,214 | ) | (1,201,092 | ) | ||||||||
|
|
|
|
|
|
|
| |||||||||
Change in net assets | (7,033,870 | ) | (3,805,987 | ) | (2,126,479 | ) | (276,665 | ) | ||||||||
Net Assets: | ||||||||||||||||
Beginning of year | 28,317,705 | 32,123,692 | 7,670,056 | 7,946,721 | ||||||||||||
|
|
|
|
|
|
|
| |||||||||
End of year | $ | 21,283,835 | $ | 28,317,705 | $ | 5,543,577 | $ | 7,670,056 | ||||||||
|
|
|
|
|
|
|
| |||||||||
Accumulated undistributed net investment income | $ | — | $ | 236 | $ | 2,924 | $ | — | ||||||||
|
|
|
|
|
|
|
| |||||||||
Share Transactions: | ||||||||||||||||
Issued | 60,431 | 15,933 | 34,273 | 67,323 | ||||||||||||
Reinvested | 32,304 | 45,575 | 7,852 | 18,879 | ||||||||||||
Redeemed | (790,647 | ) | (915,381 | ) | (287,640 | ) | (285,890 | ) | ||||||||
|
|
|
|
|
|
|
| |||||||||
Change in Shares | (697,912 | ) | (853,873 | ) | (245,515 | ) | (199,688 | ) | ||||||||
|
|
|
|
|
|
|
| |||||||||
See accompanying notes to the financial statements.
18
| Sterling Capital Special Opportunities VIF | Sterling Capital Total Return Bond VIF | |||||||||||||
| For the Year Ended December 31, 2011 | For the Year Ended December 31, 2010 | For the Year Ended December 31, 2011 | For the Year Ended December 31, 2010 | |||||||||||
| $ | (21,746 | ) | $ | (110,418 | ) | $ | 657,479 | $ | 782,977 | |||||
| 1,460,907 | 4,579,201 | 645,611 | 770,050 | |||||||||||
| (2,880,794 | ) | 1,393,992 | (148,416 | ) | (9,535 | ) | ||||||||
|
|
|
|
|
|
|
| |||||||
| (1,441,633 | ) | 5,862,775 | 1,154,674 | 1,543,492 | ||||||||||
|
|
|
|
|
|
|
| |||||||
| — | (23,790 | ) | (714,012 | ) | (819,377 | ) | ||||||||
| (1,463,601 | ) | — | (678,181 | ) | (35,714 | ) | ||||||||
|
|
|
|
|
|
|
| |||||||
| (1,463,601 | ) | (23,790 | ) | (1,392,193 | ) | (855,091 | ) | |||||||
|
|
|
|
|
|
|
| |||||||
| 2,957,322 | 5,126,387 | 4,818,430 | 3,090,265 | |||||||||||
| 1,463,601 | 23,790 | 1,392,193 | 855,091 | |||||||||||
| (9,293,407 | ) | (7,806,727 | ) | (7,891,763 | ) | (5,298,937 | ) | |||||||
|
|
|
|
|
|
|
| |||||||
| (4,872,484 | ) | (2,656,550 | ) | (1,681,140 | ) | (1,353,581 | ) | |||||||
|
|
|
|
|
|
|
| |||||||
| (7,777,718 | ) | 3,182,435 | (1,918,659 | ) | (665,180 | ) | ||||||||
| 43,344,362 | 40,161,927 | 21,397,074 | 22,062,254 | |||||||||||
|
|
|
|
|
|
|
| |||||||
| $ | 35,566,644 | $ | 43,344,362 | $ | 19,478,415 | $ | 21,397,074 | |||||||
|
|
|
|
|
|
|
| |||||||
| $ | 4,750 | $ | — | $ | 417,221 | $ | 336,510 | |||||||
|
|
|
|
|
|
|
| |||||||
| 177,554 | 331,860 | 445,293 | 287,744 | |||||||||||
| 100,384 | 1,564 | 130,342 | 79,711 | |||||||||||
| (573,708 | ) | (532,383 | ) | (734,049 | ) | (499,141 | ) | |||||||
|
|
|
|
|
|
|
| |||||||
| (295,770 | ) | (198,959 | ) | (158,414 | ) | (131,686 | ) | |||||||
|
|
|
|
|
|
|
| |||||||
19
| Sterling Capital Variable Insurance Funds |
Financial Highlights
The financial highlights table is intended to help you understand the Funds’ financial performance for the past 5 years. Certain information reflects financial results for a single Fund share. The total returns in the table represent the rate that an investor would have earned (or lost) on an investment in the Fund (assuming reinvestment of all dividends and distributions).
| Investment Activities | Distributions | ||||||||||||||||||||||||||||||||||
| Net Asset Value, Beginning of Year | Net investment income (loss) | Net realized/ unrealized gains (losses) on investments | Total from Investment Activities | Net investment income | Net realized gains on investments | Total Distributions | |||||||||||||||||||||||||||||
Sterling Capital Select Equity VIF |
| ||||||||||||||||||||||||||||||||||
Year Ended December 31, 2011 | $ | 8.41 | 0.09 | (b) | (0.43 | ) | (0.34 | ) | (0.09 | ) | — | (0.09 | ) | ||||||||||||||||||||||
Year Ended December 31, 2010 | $ | 7.61 | 0.09 | (b) | 0.81 | 0.90 | (0.10 | ) | — | (0.10 | ) | ||||||||||||||||||||||||
Year Ended December 31, 2009 | $ | 6.49 | 0.07 | (b) | 1.12 | 1.19 | (0.07 | ) | — | (0.07 | ) | ||||||||||||||||||||||||
Year Ended December 31, 2008 | $ | 13.69 | 0.16 | (b) | (4.63 | ) | (4.47 | ) | (0.16 | ) | (2.57 | ) | (2.73 | ) | |||||||||||||||||||||
Year Ended December 31, 2007 | $ | 16.75 | 0.23 | (1.08 | ) | (0.85 | ) | (0.31 | ) | (1.90 | ) | (2.21 | ) | ||||||||||||||||||||||
Sterling Capital Strategic Allocation Equity VIF(c) |
| ||||||||||||||||||||||||||||||||||
Year Ended December 31, 2011 | $ | 6.68 | 0.05 | (b) | (0.54 | ) | (0.49 | ) | (0.05 | ) | — | (0.05 | ) | ||||||||||||||||||||||
Year Ended December 31, 2010 | $ | 5.90 | 0.07 | (b) | 0.81 | 0.88 | (0.10 | ) | — | (0.10 | ) | ||||||||||||||||||||||||
Year Ended December 31, 2009 | $ | 4.75 | 0.06 | (b) | 1.14 | 1.20 | (0.05 | ) | — | (0.05 | ) | ||||||||||||||||||||||||
Year Ended December 31, 2008 | $ | 10.33 | 0.09 | (b) | (3.50 | ) | (3.41 | ) | (0.10 | ) | (2.07 | ) | (2.17 | ) | |||||||||||||||||||||
Year Ended December 31, 2007 | $ | 11.65 | 0.25 | — | (d) | 0.25 | (0.30 | ) | (1.27 | ) | (1.57 | ) | |||||||||||||||||||||||
Sterling Capital Special Opportunities VIF |
| ||||||||||||||||||||||||||||||||||
Year Ended December 31, 2011 | $ | 16.60 | (0.01 | )(b) | (0.61 | ) | (0.62 | ) | — | (0.62 | ) | (0.62 | ) | ||||||||||||||||||||||
Year Ended December 31, 2010 | $ | 14.29 | (0.04 | )(b) | 2.36 | 2.32 | (0.01 | ) | — | (0.01 | ) | ||||||||||||||||||||||||
Year Ended December 31, 2009 | $ | 10.27 | (0.03 | )(b) | 4.47 | 4.44 | — | (0.42 | ) | (0.42 | ) | ||||||||||||||||||||||||
Year Ended December 31, 2008 | $ | 16.03 | 0.02 | (b) | (5.28 | ) | (5.26 | ) | (0.02 | ) | (0.48 | ) | (0.50 | ) | |||||||||||||||||||||
Year Ended December 31, 2007 | $ | 15.07 | (0.02 | ) | 2.02 | 2.00 | — | (1.04 | ) | (1.04 | ) | ||||||||||||||||||||||||
Sterling Capital Total Return Bond VIF |
| ||||||||||||||||||||||||||||||||||
Year Ended December 31, 2011 | $ | 10.73 | 0.36 | (b) | 0.28 | 0.64 | (0.39 | ) | (0.37 | ) | (0.76 | ) | |||||||||||||||||||||||
Year Ended December 31, 2010 | $ | 10.37 | 0.40 | (b) | 0.39 | 0.79 | (0.41 | ) | (0.02 | ) | (0.43 | ) | |||||||||||||||||||||||
Year Ended December 31, 2009 | $ | 9.94 | 0.41 | (b) | 0.42 | 0.83 | (0.40 | ) | — | (0.40 | ) | ||||||||||||||||||||||||
Year Ended December 31, 2008 | $ | 10.02 | 0.41 | (b) | (0.08 | ) | 0.33 | (0.41 | ) | — | (0.41 | ) | |||||||||||||||||||||||
Year Ended December 31, 2007 | $ | 9.83 | 0.31 | 0.31 | 0.62 | (0.43 | ) | — | (0.43 | ) | |||||||||||||||||||||||||
| * | During the periods certain fees were reduced. If such reductions had not occurred, the ratios would have been as indicated. |
| (a) | Total return ratios assume reinvestment of distributions at net asset value. Total return ratios do not reflect charges pursuant to the terms of the insurance contracts funded by separate accounts that invest in the Fund’s shares. |
| (b) | Per share net investment income (loss) has been calculated using the average daily shares method. |
| (c) | The expense ratios exclude the impact of fees/expenses paid by each underlying fund. |
| (d) | Amount is less than $0.005. |
See accompanying notes to the financial statements.
20
| Ratios/Supplemental Data | |||||||||||||||||||||||||||||||||
| Net Asset Value, End of Year | Total Return(a) | Net Assets, End of Year (000) | Ratio of net expenses to average net assets | Ratio of net investment income (loss) to average net assets | Ratio of expenses to average net assets* | Portfolio turnover rate | |||||||||||||||||||||||||||
| $ | 7.98 | (4.04 | )% | $ | 21,284 | 0.97 | % | 1.11 | % | 1.21 | % | 69.66 | % | ||||||||||||||||||||
| $ | 8.41 | 11.93 | % | $ | 28,318 | 0.94 | % | 1.22 | % | 1.21 | % | 63.34 | % | ||||||||||||||||||||
| $ | 7.61 | 18.50 | % | $ | 32,124 | 1.00 | % | 1.01 | % | 1.24 | % | 137.52 | % | ||||||||||||||||||||
| $ | 6.49 | (37.43 | )% | $ | 35,978 | 0.81 | % | 1.52 | % | 1.16 | % | 49.73 | % | ||||||||||||||||||||
| $ | 13.69 | (5.87 | )% | $ | 87,171 | 0.77 | % | 1.50 | % | 1.08 | % | 52.81 | % | ||||||||||||||||||||
| $ | 6.14 | (7.32 | )% | $ | 5,544 | 0.58 | % | 0.80 | % | 0.67 | % | 6.80 | % | ||||||||||||||||||||
| $ | 6.68 | 14.98 | % | $ | 7,670 | 0.40 | % | 1.21 | % | 0.68 | % | 64.81 | % | ||||||||||||||||||||
| $ | 5.90 | 25.24 | % | $ | 7,947 | 0.41 | % | 1.21 | % | 0.66 | % | 18.04 | % | ||||||||||||||||||||
| $ | 4.75 | (38.22 | )% | $ | 8,528 | 0.31 | % | 1.15 | % | 0.59 | % | 61.04 | % | ||||||||||||||||||||
| $ | 10.33 | 1.98 | % | $ | 18,495 | 0.18 | % | 2.27 | % | 0.51 | % | 40.70 | % | ||||||||||||||||||||
| $ | 15.36 | (3.53 | )% | $ | 35,567 | 1.25 | % | (0.05 | )% | 1.25 | % | 26.68 | % | ||||||||||||||||||||
| $ | 16.60 | 16.24 | % | $ | 43,344 | 1.24 | % | (0.28 | )% | 1.27 | % | 39.24 | % | ||||||||||||||||||||
| $ | 14.29 | 43.53 | % | $ | 40,162 | 1.26 | % | (0.28 | )% | 1.29 | % | 32.57 | % | ||||||||||||||||||||
| $ | 10.27 | (33.71 | )% | $ | 26,684 | 1.10 | % | 0.14 | % | 1.18 | % | 35.80 | % | ||||||||||||||||||||
| $ | 16.03 | 13.41 | % | $ | 35,620 | 1.06 | % | (0.16 | )% | 1.11 | % | 23.86 | % | ||||||||||||||||||||
| $ | 10.61 | 6.10 | % | $ | 19,478 | 1.07 | % | 3.32 | % | 1.17 | % | 131.16 | % | ||||||||||||||||||||
| $ | 10.73 | 7.73 | % | $ | 21,397 | 1.07 | % | 3.70 | % | 1.20 | % | 140.32 | % | ||||||||||||||||||||
| $ | 10.37 | 8.57 | % | $ | 22,062 | 0.94 | % | 4.09 | % | 1.24 | % | 109.12 | % | ||||||||||||||||||||
| $ | 9.94 | 3.38 | % | $ | 20,996 | 0.81 | % | 4.11 | % | 1.03 | % | 152.74 | % | ||||||||||||||||||||
| $ | 10.02 | 6.47 | % | $ | 14,064 | 0.77 | % | 4.42 | % | 1.01 | % | 252.64 | % | ||||||||||||||||||||
21
| Sterling Capital Variable Insurance Funds |
December 31, 2011
| 1. | Organization: |
Sterling Capital Variable Insurance Funds (formerly known as BB&T Variable Insurance Funds) (the “Trust”) was organized on November 8, 2004, and is registered under the Investment Company Act of 1940, as amended (the “1940 Act”), as an open-end investment company established as a Massachusetts business trust. The Trust commenced operations on May 1, 2005 and presently offers shares of Sterling Capital Select Equity VIF, Sterling Capital Strategic Allocation Equity VIF, Sterling Capital Special Opportunities VIF, and Sterling Capital Total Return Bond VIF (referred to individually as a “Fund” and collectively as the “Funds”). The Trust is authorized to issue an unlimited number of shares of beneficial interest without par value. Shares of the Funds are offered through variable annuity contracts offered through the separate accounts of participating insurance companies. All Funds are “diversified” funds.
Sterling Capital Strategic Allocation Equity VIF invests primarily in underlying mutual funds and exchange traded funds as opposed to individual securities. By owning shares of underlying investment companies (including exchange traded funds), Sterling Capital Strategic Allocation Equity VIF invests, to varying degrees, in securities of U.S. and non-U.S. companies, including small and medium sized companies, and in fixed-income securities. In addition, Sterling Capital Strategic Allocation Equity VIF’s exposure to underlying equity funds may include funds that invest in real estate or other similar securities and invest in derivatives.
Under the Trust’s organizational documents, its Officers and Trustees are indemnified against certain liabilities arising out of the performance of their duties to the Trust. In addition, in the normal course of business, the Funds may enter into contracts with their vendors and others that provide for general indemnifications. The Funds’ maximum exposure under these arrangements is unknown, as this would involve future claims that may be made against the Funds. However, based on experience, the Funds expect that risk of loss to be remote.
| 2. | Significant Accounting Policies: |
The following is a summary of significant accounting policies followed by the Funds in preparation of their financial statements. The policies are in conformity with United States generally accepted accounting principles (“U.S. GAAP”). The preparation of the financial statements requires management to make estimates and assumptions that affect the reported amounts of assets and liabilities and disclosure of contingent assets and liabilities at the date of the financial statements and the reported amounts of income and expenses for the reporting period. Actual results could differ from those estimates.
Securities Valuation — Investments in securities, the principal market for which is a securities exchange or an over-the-counter market, are valued at their latest available sale price (except for those securities that are traded on NASDAQ, which will be valued at the NASDAQ official closing price) or in the absence of such a price, by reference to the latest available bid price in the principal market in which such securities are normally traded. The Funds may also use an independent pricing service approved by the Board of Trustees (the “Board”) to value certain securities, including the use of electronic and matrix techniques. Short-term obligations without significant credit risk that mature in 60 days or less are valued at either amortized cost or original cost plus interest, which approximates fair value. Investments in open-end investment companies, including the underlying funds in which Sterling Capital Strategic Allocation Equity VIF invests, are valued at their respective net asset values as reported by such companies. Investments in closed-end investment companies and exchange traded funds are valued at their market values based upon the latest available sale price or, absent such a price, by reference to the latest available bid prices in the principal market in which such securities are normally traded. The differences between cost and fair value of investments are reflected as either unrealized appreciation or depreciation. Securities for which market quotations are not readily available or deemed unreliable (e.g., an approved pricing service does not provide a price, a furnished price is in error, certain stale prices, or an event occurs that materially affects the furnished price) will be fair valued in accordance with procedures established in good faith under the general supervision of the Board. No securities were valued in accordance with these procedures as of December 31, 2011.
Fair Value Measurements — The objective of a fair value measurement is to determine the price that would be received to sell an asset or paid to transfer a liability in an orderly transaction between market participants at the measurement date (an exit price). Accordingly, the fair value hierarchy gives the highest priority to quoted prices (unadjusted) in active markets for identical assets or liabilities (Level 1) and the lowest priority to unobservable inputs (Level 3). The three levels of the fair value hierarchy are described below:
22
| Sterling Capital Variable Insurance Funds |
Notes to Financial Statements — (continued)
December 31, 2011
• Level 1 – quoted prices in active markets for identical securities
• Level 2 – based on other significant observable inputs (including quoted prices for similar securities, interest rates, prepayment speeds, credit risk, etc.)
• Level 3 – based on significant unobservable inputs (including the Fund’s own assumptions in determining the fair value of investments)
The inputs or methodology used for valuing securities are not necessarily an indication of the risk associated with investing in those securities. During the year ended December 31, 2011 there were no significant changes to the valuation policies and procedures.
The summary of inputs used to determine the fair value of each Fund’s investments as of December 31, 2011 is as follows:
Investments in Securities | Level 1– Quoted Prices | Level 2– Other Significant Observable Inputs | Level 3– Significant Unobservable Inputs | Total | ||||||||||
Sterling Capital Select Equity VIF | $ | 21,140,759(a) | $ | — | $— | $ | 21,140,759 | |||||||
Sterling Capital Strategic Allocation Equity VIF | 5,551,908(a) | — | — | 5,551,908 | ||||||||||
Sterling Capital Special Opportunities VIF | 35,880,185(a) | — | — | 35,880,185 | ||||||||||
Sterling Capital Total Return Bond VIF | 455,365(b) | 19,168,002(a) | — | 19,623,367 | ||||||||||
| (a) | Industries or security types are disclosed in the Schedules of Portfolio Investments. |
| (b) | Represents investment companies. |
There were no transfers between Level 1 and Level 2 during the fiscal year ended December 31, 2011. The Fund’s policy is to recognize transfers in and transfers out as of the beginning of the reporting period.
In May 2011, the Financial Accounting Standards Board (“FASB”) issued Accounting Standards Update (“ASU”) No. 2011-04: Amendments to Achieve Common Fair Value Measurement and Disclosure Requirements in U.S. GAAP and International Financial Reporting Standards (“IFRS”). ASU No. 2011-04 includes common requirements for measurement of and disclosure about fair value between U.S. GAAP and IFRS. In addition, ASU No. 2011-04 will require reporting entities to disclose the following information for fair value measurements categorized within Level 3 of the fair value hierarchy: quantitative information about the unobservable inputs used in the fair value measurement, the valuation processes used by the reporting entity and a narrative description of the sensitivity of the fair value measurement to changes in unobservable inputs and the interrelationships between those unobservable inputs. Finally, ASU No. 2011-04 will require reporting entities to make disclosures about amounts and reasons for all transfers in and out of Level 1 and Level 2 fair value measurements. The new and revised disclosures are effective for interim and annual reporting periods beginning after December 15, 2011. At this time, management is evaluating the implications of ASU No. 2011-04 and its impact on the financial statements.
Securities Transactions and Related Income — During the period, security transactions are accounted for no later than one business day following the trade date. For financial reporting purposes, however, security transactions as of the last business day of the reporting period are accounted for on the trade date. Interest income is recognized on the accrual basis and includes, where applicable, the amortization/accretion of premium or discount. Dividend income is recorded on the ex-dividend date. Gains or losses realized from sales of securities are determined by comparing the identified cost of the security lot sold with the net sales proceeds.
When-Issued and Forward Commitments — The Funds may purchase securities on a “when-issued” basis. The Funds record when-issued securities on the trade date and pledge assets with a value at least equal to the purchase commitment for payment of the securities purchased. The value of the securities underlying when-issued or forward commitments to purchase securities, and any subsequent fluctuation in their value, is taken into account when determining the net asset value of the Funds commencing with the date the Funds agree to purchase the securities. The Funds do not accrue interest or dividends on “when-issued” securities until the underlying securities are received.
Mortgage Dollar Rolls — Sterling Capital Total Return Bond VIF may sell mortgage-backed securities for delivery in the current month and simultaneously contract to repurchase substantially similar (same type, coupon and maturity) securities on a specific future date at an agreed-upon price. The market value of the securities that the Fund is required to purchase may decline below the agreed upon repurchase price of those securities. Pools of mortgages collateralizing those securities may have different prepayment histories than those sold. During the period between the sale and repurchase, the Fund
23
| Sterling Capital Variable Insurance Funds |
Notes to Financial Statements — (continued)
December 31, 2011
will not be entitled to receive interest and principal payments on the securities sold. Proceeds of the sale will be invested in additional instruments for the Fund, and the income from these investments will generate income for the Fund. If such income does not exceed the income, capital appreciation and gain or loss that would have been realized on the securities sold as part of the dollar roll, the use of this technique will diminish the investment performance of the Fund compared with what the performance would have been without the use of dollar rolls. The Funds account for mortgage dollar roll transactions as purchases and sales.
In April 2011, the FASB issued ASU No. 2011-03: Reconsideration of Effective Control for Repurchase Agreements. ASU No. 2011-03 changes the assessment of effective control for repurchase agreements including dollar roll transactions. The new and revised disclosures are effective for interim and annual reporting periods beginning after December 15, 2011. At this time, management is evaluating the implications of ASU No. 2011-03 and its impact on the financial statements.
Option Contracts — Sterling Capital Special Opportunities VIF writes (sells) “covered” call options and may purchase options to close out options previously written by it. These transactions are entered into to hedge against changes in security prices (equity risk) or for the purposes of earning additional income (i.e., speculation).
The risk associated with purchasing an option is that the Fund pays a premium whether or not the option is exercised. Additionally, the Fund bears the risk of loss of the premium and change in value should the counterparty not perform under the contract. Put and call options purchased are accounted for in the same manner as other securities owned. The cost of securities acquired through the exercise of call options is increased by the premiums paid. The proceeds from securities sold through the exercise of put options are decreased by the premiums paid.
In writing an option, the Fund contracts with a specified counterparty to purchase (put option written) or sell (call option written) a specified quantity (notional amount) of an underlying asset at a specified price during a specified period upon demand of the counterparty. The risk associated with writing an option is that the Fund bears the market risk of an unfavorable change in the price of an underlying asset and is required to buy or sell an underlying asset under the contractual terms of the option at a price different from the current value. The Fund executes transactions in both listed and over-the-counter options. When purchasing over-the-counter options, the Fund bears the risk of economic loss from counterparty default, equal to the market value of the option. Listed options involve minimal counterparty risk since the listed options are guaranteed against default by the exchange on which they trade. Transactions in over-the-counter options expose the Fund to the risk of default by the counterparty to the transaction. In the event of default by the counterparty to the over-the-counter transaction, the Fund’s maximum amount of loss is the premium paid (as the purchaser) or the unrealized depreciation of the contract (as the writer).
Sterling Capital Special Opportunities VIF invested in written options to economically hedge the downside exposure by collecting a premium when sold against the equity holding. No written options were held at December 31, 2011. Details of written options activity for the fiscal year ended December 31, 2011 is as follows:
| Sterling Capital Special Opportunities VIF | ||||||||||
Covered Call Options | Number of Contracts | Premiums Received | ||||||||
Balance at beginning of year | 550 | $ | 80,679 | |||||||
Options written | 150 | 20,163 | ||||||||
Options closed | (150 | ) | (38,403 | ) | ||||||
Options expired | (400 | ) | (42,276 | ) | ||||||
Options exercised | (150 | ) | (20,163 | ) | ||||||
|
|
|
| |||||||
Balance at end of year | — | $ | — | |||||||
|
|
|
| |||||||
Derivative Instruments Categorized by Risk Exposure — The Fund’s derivative contracts held at December 31, 2011, if any, are not accounted for as hedging instruments under GAAP.
24
| Sterling Capital Variable Insurance Funds |
Notes to Financial Statements — (continued)
December 31, 2011
The effect of derivative instruments on the Statements of Operations for the fiscal year ended December 31, 2011:
| Sterling Capital Special Opportunities VIF | |||||
| Net Realized Gain | |||||
Equity Contracts | |||||
Written options | $ | 74,015 | |||
Net Change in Unrealized Appreciation (Depreciation) | |||||
Equity Contracts | |||||
Written options | $ | (26,729 | ) | ||
For the fiscal year ended December 31, 2011, the average quarterly balance of derivative financial instruments was as follows:
| Sterling Capital Special Opportunities VIF | |||||
Options Written (Equity Risk) | |||||
Average number of contracts | 38 | ||||
Average premium | $ | 5,041 | |||
Security Loans — During the fiscal year the Funds loaned securities secured by collateral in the form of securities issued or guaranteed by the U.S. Government or its agencies or instrumentalities, irrevocable letters of credit, U.S. dollar cash or other forms of collateral as was agreed to between the Trust and The Bank of New York Mellon, the lending agent (“BNY Mellon Bank”). A Fund may receive compensation for lending securities in the form of fees payable by the borrower or by retaining a portion of the income and earnings from the investment and reinvestment of cash collateral received and held on behalf of the Fund (after payment of a “broker rebate fee” to the borrower). In extremely low interest rate environments, the broker rebate fee may exceed the interest earned on the cash collateral which would result in a loss to the Fund. A Fund also continues to receive interest or dividends on the securities loaned. Although security loans are secured at all times by collateral, the loans may not be fully supported if, for example, the instruments in which cash collateral is invested decline in value or the borrower fails to provide additional collateral when required in a timely manner or at all. Concurrently with the delivery of a Fund’s securities to a borrower, BNY Mellon Bank is required to obtain from the borrower collateral equal to at least 102% of the market value of the securities loaned plus accrued interest in the case of U.S. securities, and at least 105% of the market value of the securities loaned plus accrued interest in the case of foreign securities. If at the close of trading on any business day the market value of the collateral is less than 100% of the market value of such loaned securities as of such business day, the borrower is required to deliver additional collateral which will cause the total collateral to be equal to not less than 102% of the market value of the securities loaned plus accrued interest in the case of U.S. securities and 105% of the market value of the securities loaned plus accrued interest in the case of foreign securities. A Fund bears all of the gains and losses on such investments. During the fiscal year, cash collateral received by a Fund was invested in BNY Mellon Institutional Cash Reserve Fund (“ICRF”), BNY Mellon Overnight Government Fund (formerly known as Series A) and Series B, an unregistered investment pool managed by BNY Mellon Bank, which was invested in repurchase agreements and Lehman Brothers floating rate medium term notes.
Effective July 1, 2010, the Trust, on behalf of each applicable Fund, entered into an agreement with BNY Mellon Bank and the Bank of New York Mellon Corporation (“BNYMC”) with respect to each Fund’s position in the BNY Mellon ICRF Series B, pursuant to which (i) BNYMC will support the value of certain defaulted securities issued by Lehman Brothers and held by BNY Mellon ICRF Series B, and (ii) if certain conditions are met, each Fund will have the right to sell the defaulted securities to BNYMC at a price equal to 80% of par value. During the year those conditions were met and on September 29, 2011 the Funds recorded the sale of the defaulted securities to BNYMC at a price equal to 80% of par value.
There may be risks of delay in recovery of the securities or even loss of rights in the collateral should the borrower of the securities fail financially. Another risk from securities lending is that the borrower may not provide additional collateral when
25
| Sterling Capital Variable Insurance Funds |
Notes to Financial Statements — (continued)
December 31, 2011
required or return the securities when due or when called for by the Fund. The Funds are indemnified from losses resulting from brokers failing to return securities. The securities lending agent may make payments to borrowers and placing brokers, who may not be affiliated, directly or indirectly, with the Trust, Sterling Capital Management LLC (“Sterling Capital” or the “Advisor”). In connection with lending securities, a Fund may pay reasonable administrative and custodial fees. Effective November 10, 2011, the Trust no longer participates in the securities lending program.
Expenses and Allocation Methodology — Expenses directly attributable to a Fund are charged to that Fund. Expenses not directly attributable to a Fund are allocated proportionately among all Funds daily in relation to the net assets of each Fund or on another reasonable basis. Expenses which are attributable to both the Funds and Sterling Capital Funds are allocated across the Funds and Sterling Capital Funds, based upon relative net assets or on another reasonable basis.
Distributions to Shareholders — Dividends from net investment income are declared and paid quarterly for the Funds, with the exception of Sterling Capital Total Return Bond VIF, in which case dividends from net investment income are declared daily and paid monthly. Distributable net realized gains, if any, are declared and distributed at least annually. Distributions to shareholders which exceed net investment income and net realized gains for tax purposes are reported as distributions of capital.
The character of income and gains distributed are determined in accordance with federal income tax regulations, which may differ from U.S. GAAP. These “book/tax” differences are either considered temporary or permanent in nature. To the extent these differences are permanent in nature (e.g., reclass of net operating losses, disposition of market discount and market premium bonds, paydown gains and losses, mortgage dollar roll gains and losses, investments in real estate investment trusts (REITs), regulated investment companies (RICs) and the character of distributions), such amounts are reclassified within the composition of net assets based on their federal tax-basis treatment; temporary differences do not require reclassification. These reclassifications have no impact on net assets or net asset values per share.
As of December 31, 2011, these reclassifications were as follows:
| Decrease Paid-in-Capital | Increase (Decrease) Net Investment Income | Increase (Decrease) Realized Gain (Loss) | |||||||||||||
Sterling Capital Select Equity VIF | $ | (923 | ) | $ | (8,302 | ) | $ | 9,225 | |||||||
Sterling Capital Strategic Allocation Equity VIF | — | 897 | (897 | ) | |||||||||||
Sterling Capital Special Opportunities VIF | (26,494 | ) | 26,496 | (2 | ) | ||||||||||
Sterling Capital Total Return Bond VIF | — | 137,244 | (137,244 | ) | |||||||||||
Credit Enhancements — Certain obligations held in the Funds have credit enhancement or liquidity features that may, under certain circumstances, provide for repayment of principal and interest on the obligation upon demand date, interest rate reset date or final maturity. These enhancements may include: letters of credit; liquidity guarantees; security purchase agreements; tender option purchase agreements; and third party insurance (i.e., AMBAC).
Federal Income Taxes — It is the policy of the Funds to continue to qualify as a regulated investment company by complying with the provisions available to certain investment companies, as defined in applicable sections of the Internal Revenue Code of 1986, as amended (the “Internal Revenue Code”), and to make distributions of net investment income and net realized capital gains sufficient to relieve it from all, or substantially all, federal income taxes. Accordingly, no provision for federal income tax is required.
| 3. | Purchases and Sales of Securities: |
Purchases and sales of securities (excluding U.S. Government Securities and securities maturing less than one year from acquisition) for the year ended December 31, 2011 were as follows:
| Purchases | Sales | |||||||
Sterling Capital Select Equity VIF | $ | 17,096,446 | $ | 23,354,835 | ||||
Sterling Capital Strategic Allocation Equity VIF | 449,342 | 2,037,574 | ||||||
Sterling Capital Special Opportunities VIF | 10,359,837 | 13,362,143 | ||||||
Sterling Capital Total Return Bond VIF | 10,638,446 | 11,548,266 | ||||||
26
| Sterling Capital Variable Insurance Funds |
Notes to Financial Statements — (continued)
December 31, 2011
Purchases and sales of U.S. Government Securities (excluding securities maturing less than one year from acquisition) for the fiscal year ended December 31, 2011 for the Sterling Capital Total Return Bond VIF were $15,464,114 and $15,087,559, respectively.
| 4. | Investments in Affiliated Issuers: |
A summary of Sterling Capital Strategic Allocation Equity VIF’s transactions in the shares of affiliated issuers during the fiscal year ended December 31, 2011 is set forth below:
| Shares Held at December 31, 2010 | Shares Purchased | Shares Sold | Shares Held at December 31, 2011 | Value at December 31, 2011 | Dividend Income January 1, 2011 - December 31, 2011 | Distributions and Net Realized Gain (Loss) January 1, 2011 - December 31, 2011 | |||||||||||||||||||||||||||||
Sterling Capital Equity Income Fund, Institutional Class | 35,249 | — | 10,414 | 24,835 | $ | 367,808 | $ | 7,069 | $ | 9,430 | |||||||||||||||||||||||||
Sterling Capital Equity Index Fund, Institutional Class | 8,757 | 97 | 2,247 | 6,607 | 55,632 | 822 | (3,674 | ) | |||||||||||||||||||||||||||
Sterling Capital International Fund, Institutional Class | 116,664 | 25,921 | 17,275 | 125,310 | 538,833 | 6,591 | 8,381 | ||||||||||||||||||||||||||||
Sterling Capital Mid Value Fund, Institutional Class | 60,431 | 224 | 21,669 | 38,986 | 502,918 | 4,629 | 31,415 | ||||||||||||||||||||||||||||
Sterling Capital Select Equity Fund, Institutional Class | 115,999 | — | 25,279 | 90,720 | 1,007,900 | 14,468 | (61,967 | ) | |||||||||||||||||||||||||||
Sterling Capital Small Value Fund, Institutional Class | 16,167 | 1,147 | 6,186 | 11,128 | 122,965 | — | 19,385 | ||||||||||||||||||||||||||||
Sterling Capital Special Opportunities Fund, Institutional Class | 18,042 | 252 | 4,382 | 13,912 | 234,133 | — | 8,773 | ||||||||||||||||||||||||||||
Sterling Capital U.S. Treasury Money Market Fund, Institutional Class | 155,712 | 27,374,575 | 27,453,486 | 76,801 | 76,801 | 11 | — | ||||||||||||||||||||||||||||
|
|
|
|
|
|
|
|
|
|
|
|
|
| ||||||||||||||||||||||
Total Affiliates | 527,021 | 27,402,216 | 27,540,938 | 388,299 | $ | 2,906,990 | $ | 33,590 | $ | 11,743 | |||||||||||||||||||||||||
|
|
|
|
|
|
|
|
|
|
|
|
|
| ||||||||||||||||||||||
| 5. | Related Party Transactions: |
Under the terms of the investment advisory agreement Sterling Capital is entitled to receive fees based on a percentage of the average daily net assets of the Funds. These fees are accrued daily and payable on a monthly basis and are reflected on the Statements of Operations as “Investment advisory fees.” Sterling Capital waived investment advisory fees and reimbursed certain expenses for the Funds referenced below which are not subject to recoupment and are included on the Statements of Operations as “Less expenses waived/reimbursed by the Investment Advisor.” Information regarding these transactions is as follows for the fiscal year ended December 31, 2011:
| Contractual Fee Rate | Fee Rate after Voluntary Waivers | |||||||||
Sterling Capital Select Equity VIF | 0.74% | 0.50% | 1 | |||||||
Sterling Capital Strategic Allocation Equity VIF | 0.25% | 0.16% | 1 | |||||||
Sterling Capital Special Opportunities VIF | 0.80% | 0.80% | ||||||||
Sterling Capital Total Return Bond VIF | 0.60% | 0.50% | 1 | |||||||
| 1 | For a portion of the fiscal year ended December 31, 2011 Sterling Capital voluntarily reimbursed certain expenses of the Funds. Voluntary reimbursements of expenses are not subject to recoupment in subsequent fiscal periods, and may be discontinued at any time. |
Pursuant to a sub-advisory agreement with Sterling Capital, Scott & Stringfellow LLC (Scott & Stringfellow), a wholly owned subsidiary of BB&T Corporation, serves as the sub-advisor to Sterling Capital Special Opportunities VIF, subject to the general supervision of the Board and Sterling Capital. For its services, Scott & Stringfellow is entitled to a fee, payable by Sterling Capital.
Sterling Capital serves as the administrator to the Funds pursuant to an administration agreement. The Funds except Sterling Capital Strategic Allocation Equity VIF pay their portion of a fee to Sterling Capital for providing administration services based on the aggregate assets of the Funds except Sterling Capital Strategic Allocation Equity VIF and the Sterling Capital
27
| Sterling Capital Variable Insurance Funds |
Notes to Financial Statements — (continued)
December 31, 2011
Funds, excluding the assets of Sterling Capital Strategic Allocation Conservative Fund, Sterling Capital Strategic Allocation Balanced Fund, Sterling Capital Strategic Allocation Growth Fund, Sterling Capital Strategic Allocation Equity Fund, Sterling Capital Corporate Fund and Sterling Capital Securitized Opportunities Fund, at a rate of 0.11% on the first $3.5 billion of average net assets; 0.075% on the next $1 billion of average net assets; 0.06% on the next $1.5 billion of average net assets; and 0.04% of average net assets over $6 billion. This fee is accrued daily and payable on a monthly basis. Expenses incurred are reflected on the Statements of Operations as “Administration fees.” Pursuant to a sub-administration agreement with Sterling Capital, BNY Mellon Investment Servicing (US) Inc. (“BNY Mellon” or the “Sub-Administrator”), serves as the sub-administrator to the Funds subject to the general supervision of the Board and Sterling Capital. For these services, BNY Mellon is entitled to a fee payable by Sterling Capital.
BNY Mellon serves as the Funds’ fund accountant and transfer agent and receives compensation by the Funds for these services. Expenses incurred are reflected on the Statements of Operations as “Fund accounting fees” and “Transfer agent fees.”
Sterling Capital’s Chief Compliance Officer (“CCO”) serves as the Funds’ CCO. The CCO’s compensation is reviewed and approved by the Funds’ Board and paid by Sterling Capital. However, the Funds reimburse Sterling Capital for their allocable portion of the CCO’s salary. Expenses incurred for the Funds are reflected on the Statements of Operations as “Compliance service fees.”
For the fiscal year ended December 31, 2011, the Funds paid $2,172 in brokerage fees to Scott & Stringfellow, related to the execution of purchases and sales of the Funds’ portfolio investments.
The Trust has adopted a Variable Contract Owner Servicing Plan (the “Service Plan”) under which the Funds may pay a fee computed daily and paid monthly, at an annual rate of up to 0.25% of the average daily net assets of the Funds. A servicing agent may periodically waive all or a portion of its servicing fees. For the fiscal year ended December 31, 2011 the Funds did not participate in any service plans.
Certain Officers and a Trustee of the Funds are affiliated with Sterling Capital or the Sub-Administrator. Such Officers and Trustee receive no compensation from the Funds for serving in their respective roles. Each of the Trustees who are not interested persons (as defined in the 1940 Act) of the Trust who serve on the Board are compensated at the annual rate of $40,000 plus $5,000 for each regularly scheduled quarterly meeting attended, $4,000 for each special meeting attended in person and $3,000 for each special meeting attended by telephone, plus reimbursement for certain out of pocket expenses. Each Trustee serving on a Committee of the Board receives a fee of $4,000 for each Committee meeting attended in person and $3,000 for each Committee meeting attended by telephone, plus reimbursement for certain out of pocket expenses. Additionally, the Chairman of the Board and the Audit Committee Chairman each receive an annual retainer of $15,000, and the Chairman of the Nominations Committee receives additional compensation at the rate of $1,000 for each meeting over which he or she presides as Chairman. The fees are allocated across the Funds and the Sterling Capital Funds based upon relative net assets.
| 6. | Line of Credit: |
U.S. Bank, N.A. has made available a credit facility to the Funds, pursuant to a Credit Agreement (the “Agreement”). The primary purpose of the Agreement is to allow the Funds to avoid security liquidations that Sterling Capital believes are unfavorable to shareholders. Outstanding principal amounts under the Agreement bear interest at a rate per annum equal to the Prime Rate minus two percent (2%), but never a net rate of less than one percent (1%) per annum. During the fiscal year ended December 31, 2011 the following Fund utilized the line of credit:
| Average Interest Rate | Average Loan Balance | Number of Days Outstanding | Interest Expense Incurred | Maximum Amount Borrowed | |||||||||||||||||||||
Sterling Capital Special Opportunities VIF | 1.25 | % | $ | 20,750 | 4 | $ | 3 | $ | 38,000 | ||||||||||||||||
| 7. | Federal Tax Information: |
Management evaluates its tax positions to determine if the tax positions taken meet the minimum recognition threshold in connection with accounting for uncertainties in income tax positions taken or expected to be taken for the purposes of measuring and recognizing tax liabilities in the financial statements. Recognition of tax benefits of an uncertain tax position is required only when the position is “more likely than not” to be sustained assuming examination by taxing authorities. The Funds recognize interest and penalties, if any, related to unrecognized tax benefits as income tax expense in the Statements of Operations. During the period, the Funds did not incur any interest or penalties.
28
| Sterling Capital Variable Insurance Funds |
Notes to Financial Statements — (continued)
December 31, 2011
Management has analyzed the Funds’ tax positions taken on federal income tax returns for all open tax years (current year and prior three tax years), and has concluded that no provision for federal income tax is required. The Funds’ federal and state income and federal excise tax returns for tax years for which the applicable statutes of limitations have not expired are subject to examination by the Internal Revenue Service and state departments of revenue.
At December 31, 2011, the following Funds had net capital loss carryforwards available to offset future net capital gains, if any, to the extent provided by the Treasury regulations. To the extent that these carryforwards are used to offset future capital gains, it is probable that the gains that are offset will not be distributed to shareholders.
| Amount | Expires | |||||||||
Sterling Capital Select Equity VIF | $ | 18,975,564 | 2016 | |||||||
Sterling Capital Select Equity VIF | 3,263,903 | 2017 | ||||||||
Sterling Capital Strategic Allocation Equity VIF | 2,264,206 | 2016 | ||||||||
Sterling Capital Strategic Allocation Equity VIF | 1,989,928 | 2017 | ||||||||
Sterling Capital Strategic Allocation Equity VIF | 1,467,590 | 2018 | ||||||||
Capital loss carryforwards utilized in the current year were $701,522 and $8,036 for Sterling Capital Select Equity VIF and Sterling Capital Strategic Allocation Equity VIF, respectively.
The Regulated Investment Company Modernization Act of 2010 (the “Act”) was signed into law on December 22, 2010. The Act makes changes to several tax rules impacting Regulated Investment Companies (“RICs”). The provisions of the Act were effective for Funds’ taxable year ending December 31, 2011. The Act allows for capital losses originating in taxable years beginning after December 22, 2010 (“post-enactment capital losses”) to be carried forward indefinitely. However, the Act requires any future capital gains to be first offset by post-enactment capital losses before using capital losses incurred in taxable years beginning prior to the effective date of the Act. As a result of this ordering rule, capital loss carryforwards incurred in taxable years beginning prior to the effective date of the Act have an increased likelihood to expire unused. Furthermore, post-enactment capital losses will retain their character as either short-term or long-term capital losses rather than being considered all short-term capital losses as under previous law. The Funds had no post-enactment capital loss carryforwards.
29
| Sterling Capital Variable Insurance Funds |
Notes to Financial Statements — (continued)
December 31, 2011
The tax character of distributions paid to shareholders during the fiscal year ended December 31, 2011, were as follows:
| Distributions paid from | |||||||||||||||
| Ordinary Income | Net Long-Term Gains | Total Distributions Paid* | |||||||||||||
Sterling Capital Select Equity VIF | $ | 264,006 | $ | — | $ | 264,006 | |||||||||
Sterling Capital Strategic Allocation Equity VIF | 50,968 | — | 50,968 | ||||||||||||
Sterling Capital Special Opportunities VIF | 44,822 | 1,418,779 | 1,463,601 | ||||||||||||
Sterling Capital Total Return Bond VIF | 1,031,540 | 360,653 | 1,392,193 | ||||||||||||
The tax character of distributions paid to shareholders during the fiscal year ended December 31, 2010, were as follows:
| Distributions paid from | |||||||||||||||
| Ordinary Income | Net Long-Term Gains | Total Distributions Paid* | |||||||||||||
Sterling Capital Select Equity VIF | $ | 349,287 | $ | — | $ | 349,287 | |||||||||
Sterling Capital Strategic Allocation Equity VIF | 117,201 | — | 117,201 | ||||||||||||
Sterling Capital Special Opportunities VIF | 23,790 | — | 23,790 | ||||||||||||
Sterling Capital Total Return Bond VIF | 819,377 | 35,714 | 855,091 | ||||||||||||
| * | Total Distributions Paid may differ from the Statements of Changes in Net Assets because distributions are recognized when actually paid for tax purposes. |
At December 31, 2011, the components of accumulated earnings (deficit) on a tax basis were as follows:
| Undistributed Ordinary Income | Undistributed Long Term Capital Gains | Accumulated Earnings | Accumulated Capital and Other Losses | Unrealized Appreciation (Depreciation)* | Total Accumulated Earnings(Deficit) | |||||||||||||||||||||||||
Sterling Capital Select Equity VIF | $ | — | $ | — | $ | — | $ | (22,239,467 | ) | $ | 2,078,510 | $ | (20,160,957 | ) | ||||||||||||||||
Sterling Capital Strategic Allocation Equity VIF | 2,924 | — | 2,924 | (5,721,724 | ) | (50,547 | ) | (5,769,347 | ) | |||||||||||||||||||||
Sterling Capital Special Opportunities VIF | — | 1,420,684 | 1,420,684 | — | 3,997,897 | 5,418,581 | ||||||||||||||||||||||||
Sterling Capital Total Return Bond VIF | 439,366 | 496,612 | 935,978 | — | 488,965 | 1,424,943 | ||||||||||||||||||||||||
| * | The primary differences between book basis and tax basis unrealized appreciation (depreciation) were due to the deferral of losses on wash sales and timing of income recognition related to investments in hybrid securities and partnerships, and the deferral of market discount and premium until point of sale. |
At December 31, 2011, federal income tax cost, gross unrealized appreciation and gross unrealized depreciation on securities were as follows:
| Tax Cost | Tax Gross Unrealized Appreciation | Tax Gross Unrealized Depreciation | Net Tax Gross Unrealized Appreciation (Depreciation) | |||||||||||||||||
Sterling Capital Select Equity VIF | $ | 19,062,249 | $ | 2,805,159 | $ | (726,649 | ) | $ | 2,078,510 | |||||||||||
Sterling Capital Strategic Allocation Equity VIF | 5,602,455 | 506,803 | (557,350 | ) | (50,547 | ) | ||||||||||||||
Sterling Capital Special Opportunities VIF | 31,882,288 | 5,844,148 | (1,846,251 | ) | 3,997,897 | |||||||||||||||
Sterling Capital Total Return Bond VIF | 19,134,402 | 691,635 | (202,670 | ) | 488,965 | |||||||||||||||
| 8. | Subsequent Events: |
Management has evaluated the need for disclosure and/or adjustments resulting from subsequent events through the date the financial statements were issued, and has noted no events that require recognition or disclosure in the financial statements.
30
Report of Independent Registered Public Accounting Firm
The Board of Trustees and Shareholders of
Sterling Capital Variable Insurance Funds:
We have audited the accompanying statements of assets and liabilities of the Sterling Capital Select Equity VIF (formerly BB&T Select Equity VIF), Sterling Capital Strategic Allocation Equity VIF, (formerly BB&T Capital Manager Equity VIF), Sterling Capital Special Opportunities VIF (formerly BB&T Special Opportunities Equity VIF) and Sterling Capital Total Return Bond VIF (formerly BB&T Total Return Bond VIF) (collectively, the “Funds”), four of the funds constituting Sterling Capital Variable Insurance Funds (formerly BB&T Variable Insurance Funds), including the schedules of portfolio investments, as of December 31, 2011, and the related statements of operations for the year then ended, the statements of changes in net assets for each of the years in the two-year period then ended, and the financial highlights for each of the years in the five-year period then ended. These financial statements and financial highlights are the responsibility of the Funds’ management. Our responsibility is to express an opinion on these financial statements and financial highlights based on our audits.
We conducted our audits in accordance with the standards of the Public Company Accounting Oversight Board (United States). Those standards require that we plan and perform the audit to obtain reasonable assurance about whether the financial statements and financial highlights are free of material misstatement. An audit includes, examining on a test basis, evidence supporting the amounts and disclosures in the financial statements. Our procedures included confirmation of securities owned as of December 31, 2011, by correspondence with the custodian, transfer agent of the underlying funds and brokers or by other appropriate auditing procedures. An audit also includes assessing the accounting principles used and significant estimates made by management, as well as evaluating the overall financial statement presentation. We believe that our audits provide a reasonable basis for our opinion.
In our opinion, the financial statements and the financial highlights referred to above present fairly, in all material respects, the financial position of each of the Funds comprising the Sterling Capital Variable Insurance Funds as of December 31, 2011, the results of their operations for the year then ended, the changes in their net assets for each of the years in the two-year period then ended, and the financial highlights for each of the years in the five-year period then ended, in conformity with U.S. generally accepted accounting principles.

Philadelphia, Pennsylvania
February 24, 2012
31
| Sterling Capital Variable Insurance Funds |
December 31, 2011
Notice to Shareholders (Unaudited)
All amounts and percentages below are based on financial information available as of the date of this annual report and, accordingly are subject to change. For each item it is the intention of the Funds to report the maximum amount permitted under the Internal Revenue Code and the regulations thereunder.
For the fiscal year ended December 31, 2011, each Fund is reporting the following items with regard to distributions paid during the year.
For the fiscal year ended December 31, 2011, in order to meet certain requirements of the Internal Revenue Code, we are advising you that certain distributions paid during the year from the following Funds are reported as:
| Long-Term Capital Gain | Qualified Dividend Income % | (for corporate shareholders) Dividends Received Deduction % | |||||||||||||
Sterling Capital Select Equity VIF | $ | — | 100.00% | 100.00% | |||||||||||
Sterling Capital Strategic Allocation Equity VIF | — | 100.00% | 78.27% | ||||||||||||
Sterling Capital Special Opportunities VIF | 1,418,779 | 100.00% | 100.00% | ||||||||||||
Sterling Capital Total Return Bond VIF | 360,653 | 0.00% | 0.00% | ||||||||||||
For the fiscal year ended December 31, 2011, the following Funds reported the following percentage of investment company taxable income, or if different the maximum allowable by tax law, as being derived from U.S. Treasury securities:
| U.S. Government Income | |||||
Sterling Capital Strategic Allocation Equity VIF | 0.01% | ||||
Sterling Capital Total Return Bond VIF | 1.81% | ||||
32
| Sterling Capital Variable Insurance Funds |
December 31, 2011 (Unaudited)
A description of the policies and procedures that the Funds use to determine how to vote proxies relating to portfolio securities is available (i) without charge, upon request, by calling 1-800-228-1872; and (ii) on the Securities and Exchange Commission’s (the “Commission”) website at http://www.sec.gov.
Information regarding how the Funds voted proxies relating to portfolio securities during the most recent 12-month period ended June 30th is available (i) without charge, upon request, by calling 1-800-228-1872 and (ii) on the Commission’s website at http://www.sec.gov.
The Funds file complete Schedules of Portfolio Holdings with the Commission for the first and third quarters of each fiscal year on Form N-Q. The Funds’ Form N-Q is filed with the Commission within 60 days of the end of the quarter to which it relates, and is available without charge on the Commission’s website at http://www.sec.gov, or may be reviewed and copied at the Commission’s Public Reference Room in Washington, D.C. Information on the operation of the Public Reference Room may be obtained by calling 1-800-SEC-0330.
33
BOARD CONSIDERATION OF ADVISORY AND SUB-ADVISORY AGREEMENTS (UNAUDITED)
The Board of Trustees, at a meeting held on August 25-26, 2011, formally considered the continuance of the Trust’s investment advisory agreement with Sterling Capital Management LLC (“Sterling Capital”), which serves as investment adviser to all of Sterling Capital Variable Insurance Funds (the “Funds”). At that same meeting, the Board of Trustees considered the continuance of sub-advisory agreement of Sterling Capital with Scott & Stringfellow, LLC (“Scott & Stringfellow”), with respect to the Sterling Capital Special Opportunities VIF. All of the above referenced agreements are collectively referred to herein as the “Advisory Agreements” and are performed by the “Advisers.”
The Trustees reviewed extensive material in connection with their consideration of the Advisory Agreements, including data from an independent provider of mutual fund data (as assembled by the Trust’s administrator), which included comparisons with industry averages for comparable funds for advisory fees, 12b-1 fees, and total fund expenses. The data reflected Sterling Capital fee waivers in place, as well as Sterling Capital’s contractual investment advisory fee levels. The Board was assisted in its review by independent legal counsel, who provided memoranda detailing the legal standards for review of the Advisory Agreements. The Board received a detailed presentation by Sterling Capital, which included a fund-by-fund analysis of investment processes and performance, and by Scott & Stringfellow. The Board also received fund-by-fund profitability information from Sterling Capital and Scott & Stringfellow. The Independent Trustees deliberated outside the presence of management and the Advisers.
In their deliberations regarding the Advisory Agreements, each Trustee attributed different weights to various factors involved in an analysis of the Advisory Agreements, and in each case no factor alone was considered determinative. The Trustees determined that the overall arrangements between the Trust and the Advisers, as provided in the Advisory Agreements, were fair and reasonable and that the continuance of the Advisory Agreements was in the best interests of each applicable Fund and its shareholders.
The matters addressed below were considered and discussed by the Trustees in reaching their conclusions.
Nature, Extent and Quality of Services Provided by the Advisers — The Trustees received and considered information regarding the nature, extent, and quality of the services provided to each Fund under the Advisory Agreements. The Trustees took into account information furnished throughout the year at Trustee meetings, as well as materials furnished specifically in connection with the annual review process. The Trustees considered the background and experience of each Adviser’s senior management and the expertise of investment personnel of each Adviser responsible for the day-to-day management of each Fund. The Trustees considered the overall reputation, and the capabilities and commitment of the Advisers to provide high quality service to the Funds, and the Trustees’ overall confidence in each Adviser’s integrity.
The Trustees received information concerning the investment philosophy and investment processes applied or to be applied by the Advisers in managing the Funds as well as each Adviser’s Form ADV. The Trustees also considered information regarding regulatory compliance and compliance with the investment policies of the Funds. The Trustees evaluated the trading practices of Scott & Stringfellow, which engages in affiliated brokerage for portfolio trades for the Special Opportunities VIF, which it sub-advises. The Trustees evaluated the procedures of the Advisers designed to fulfill the Advisers’ fiduciary duty to the Funds with respect to possible conflicts of interest, including the Advisers’ codes of ethics (regulating the personal trading of its officers and employees). Based on their review, the Trustees concluded that, with respect to the nature, extent and quality of services to be provided by the Advisers, the nature and extent of responsibilities was consistent with mutual fund industry norms, and that the quality of the services provided was satisfactory.
Investment Performance — The Trustees considered performance results of each Fund in absolute terms and relative to each Fund’s benchmark and peer group. In the Trustees’ review of performance, long- and short-term performance were considered. In conducting their review, the Trustees particularly focused on Funds where performance compared unfavorably with peers. The Trustees noted that the performance of the Select Equity VIF continued to be a source of concern for the Board. Although the Trustees concluded that Sterling Capital had taken appropriate steps to address the Fund’s continued underperformance, the Trustees determined to increase oversight of the Fund during the upcoming year, including enhanced reporting from Sterling Capital.
After reviewing the performance of each Fund, and taking into consideration the management style, investment strategies, and prevailing market conditions during the prior year and for longer periods, the Trustees concluded that the performance of each of the Funds was satisfactory or better or that, in cases where performance issues were encountered, Sterling Capital was appropriately addressing the situation.
Cost of Services, Including the Profits Realized by the Advisers and Affiliates — The Trustees considered peer group comparable information with respect to the advisory fees charged by Sterling Capital to each of the Funds, taking into consideration both contractual and actual (i.e., after fee waivers) fee levels. The Trustees concluded that the investment advisory fees paid by the Funds fell within an acceptable range as compared to peer groups, and were fair and reasonable, particularly in light of the fee waivers that are in place.
As part of their review, the Trustees considered benefits to Sterling Capital aside from investment advisory fees. The Trustees reviewed administration fees received by Sterling Capital and considered the fallout benefits to Sterling Capital such as the research services available to Sterling Capital by reason of brokerage commissions generated by the Funds’ turnover. The Trustees also considered benefits to Sterling Capital’s affiliates, including brokerage commissions received by Scott & Stringfellow for executing trades on
34
behalf of the Special Opportunities VIF. With respect to Scott & Stringfellow, the Trustees noted that brokerage commissions were paid at a standard commission rate, which was consistent with that used by Sterling Capital with respect to all equity funds of the Trust and that such brokerage arrangements were considered by Scott & Stringfellow to be advantageous.
The Trustees also considered information from Sterling Capital regarding fees for separate accounts managed by Sterling Capital with investment objectives and strategies similar to those of comparable Funds. The Trustees noted that a representative of Sterling Capital explained that management of the Funds was a much more intensive process than management of separate accounts, including daily fluctuations in the size of the Funds and the need to comply with extensive and complex restrictions set by applicable regulation or established in controlling disclosure documents, and therefore the Trustees concluded that the differences between the services that Sterling Capital provides to the Funds and those it provides to separate accounts substantially limit the probative value of comparisons to those other clients.
The Trustees also considered the reasonableness of the advisory fees in the context of the profitability of the Advisers. In determining whether all other investment advisory and sub-advisory fees (collectively, the “investment advisory fees”) were reasonable, the Trustees reviewed profitability information provided by Sterling Capital and Scott & Stringfellow with respect to investment advisory services. With respect to such information, the Trustees recognized that such profitability data was generally unaudited and represented an Adviser’s own determination of its and its affiliates’ revenues from the contractual services provided or expected to be provided to the Funds, less expenses of providing such services. Expenses include direct and indirect costs and were calculated using an allocation methodology developed by the Adviser. The Trustees also recognized that it is difficult to make comparisons of profitability from fund investment advisory and sub-advisory contracts, because comparative information is not generally publicly available and could be affected by numerous factors. Based on their review, the Trustees concluded that the profitability of the Advisers as a result of their relationships with the Funds was acceptable.
Based on the foregoing, the Trustees concluded that the investment advisory fees under the Advisory Agreements were fair and reasonable, in light of the services and benefits provided to each Fund.
Economies of Scale — The Trustees also considered whether fee levels reflect economies of scale and whether economies of scale would be produced by the growth of the Funds’ assets. The Trustees found that Sterling Capital had generally reduced the total expense ratios for the Funds through fee waivers. The Trustees found that the asset levels of the Funds were not currently so large as to warrant formal contractual breakpoints, and found that the fee waivers were a reasonable way to provide the benefits of economies of scale to shareholders of the Funds at this time.
35
| Sterling Capital Variable Insurance Funds |
Information about Trustees and Officers (Unaudited)
Overall responsibility for the management of the Funds rests with its Board of Trustees (“Trustees”), who are elected by the Shareholders of the Funds. The Trustees elect the officers of the Funds to supervise actively its day-to-day operations. The names of the Trustees, birthdates, term of office and length of time served, principal occupations during the past five years, number of portfolios overseen and directorships held outside of the Funds are listed in the two tables immediately following. The business address of the persons listed below is 434 Fayetteville Street, Fifth floor, Raleigh, North Carolina 27601.
INDEPENDENT TRUSTEES
Name and Birthdate | Position(s) Held With the Funds | Term of Office/ Length of Time Served | Principal Occupation During the Last 5 Years | Number of Portfolios in Fund Complex by Trustee* | Other Directorships Held by Trustee | |||||
Thomas W. Lambeth Birthdate: 01/35 | Trustee, Chairman of the Board of Trustees | Indefinite, 08/92 — Present | From January 2001 to present, Senior Fellow, Z. Smith Reynolds Foundation | 29 | None | |||||
Drew T. Kagan Birthdate: 02/48 | Trustee | Indefinite, 08/00 — Present | From September 2010 to present, Chairman, Montecito Advisors, Inc.; from December 2003 to September 2010, CEO, Montecito Advisors, Inc.; from March 1996 to December 2003, President, Investment Affiliate, Inc. | 29 | None | |||||
Laura C. Bingham Birthdate: 11/56 | Trustee | Indefinite, 02/01 — Present | From June 2010 to present independent consultant; from July 1998 to June 2010, President of Peace College | 29 | None | |||||
Douglas R. Van Scoy Birthdate: 11/43 | Trustee | Indefinite, 05/04 — Present | Retired; from November 1974 to July 2001, employee of Smith Barney (investment banking), most recently as Director of Private Client Group and Senior Executive Vice President | 29 | None | |||||
James L. Roberts Birthdate: 11/42 | Trustee | Indefinite, 11/04 — Present | Retired; from November 2006 to present, Director, Grand Mountain Bancshares, Inc.; from January 1999 to December 2003, President, CEO and Director, Coyest Bancshares, Inc. | 29 | None | |||||
36
| Sterling Capital Variable Insurance Funds |
The following table shows information for the trustee who is an “interested person” of the Funds as defined in the 1940 Act:
INTERESTED TRUSTEE
Name and Birthdate | Position(s) Held With the Funds | Term of Office/ Length of Time Served | Principal Occupation | Number of Portfolios in Fund Complex by Trustee* | Other Directorships Held by Trustee | |||||
Alexander W. McAlister** Birthdate: 03/60 | Trustee | Indefinite, 11/10 — Present | President, Sterling Capital Management LLC | 29 | Director, Sterling Capital Management LLC | |||||
| * | The Sterling Capital Fund Complex consists of two open-end investment management companies: Sterling Capital Funds and Sterling Capital Variable Insurance Funds. |
| ** | Mr. McAlister is treated by the Fund as an “interested person” (as defined in Section 2(a)(19) of the 1940 Act) of the Funds because he is the president of Sterling Capital Management LLC, the Funds’ advisor. |
The following table shows information for officers of Funds:
Name and Birthdate | Position(s) Held With the Funds | Term of Office/ Length of Time Served | Principal Occupation During the Last 5 Years | |||
E.G. Purcell, III Birthdate: 01/55 | President | Indefinite, President 11/08 — Present; Secretary, 11/08 — 08/10; Vice President, 11/00 — 11/08 | From 1995 to present, Executive Director, Sterling Capital Management LLC and its predecessors | |||
James T. Gillespie Birthdate: 11/66 | Treasurer | Indefinite, 06/10 — Present | From June 2010 to present, Director, Sterling Capital Management LLC and its predecessors; from August 2008 to June 2010, Vice President Relationship Management, JPMorgan Chase & Co.; from February 2005 to August 2008, Senior Vice President and Manager of Mutual Fund Administration, Sterling Capital Management LLC and its predecessors | |||
Todd M. Miller Birthdate: 09/71 | Vice President and Secretary | Indefinite, Vice President, 08/05 — Present; Secretary, 08/10 — Present | From June 2009 to present, Director, Sterling Capital Management LLC and its predecessors; from June 2005 to May 2009, Mutual Fund Administrator; from May 2001 to May 2005, manager, BISYS Fund Services | |||
37
| Sterling Capital Variable Insurance Funds |
Name and Birthdate | Position(s) Held With the Funds | Term of Office/ Length of Time Served | Principal Occupation During the Last 5 Years | |||
Clinton L. Ward Birthdate: 11/69 | Chief Compliance and Anti-Money Laundering Officer | Indefinite, 04/07 — Present | From July 2004 to present, Chief Compliance Officer and Executive Director, Sterling Capital Management LLC and its predecessors | |||
Andrew J. McNally Birthdate: 12/70 | Assistant Treasurer | Indefinite, Assistant Treasurer, 06/10 — Present; Treasurer, 04/07 — 06/10 | From January 2007 to present Vice President and Senior Director, and from July 2000 to December 2006, Vice President and Director, Fund Accounting and Administration Department, BNY Mellon Investment Servicing (US) Inc. | |||
The Funds’ Statement of Additional Information includes additional information about the Funds’ Trustees and Officers. To receive your free copy of the Statement of Additional Information, call toll free: 1-800-228-1872.
38
| Item 2. | Code of Ethics. |
| (a) | The registrant, as of the end of the period covered by this report, has adopted a code of ethics that applies to the registrant’s principal executive officer, principal financial officer, principal accounting officer or controller, or persons performing similar functions, regardless of whether these individuals are employed by the registrant or a third party (the “Code of Ethics”). |
| (c) | There have been no amendments, during the period covered by this report, to a provision of the Code of Ethics that applies to the registrant’s principal executive officer, principal financial officer, principal accounting officer or controller, or persons performing similar functions, regardless of whether these individuals are employed by the registrant or a third party, and that relates to any element of the code of ethics definition enumerated in Item 2(b) of Form N-CSR. |
| (d) | The registrant has not granted any waivers, including an implicit waiver, from a provision of the “code of ethics” that applies to the registrant’s principal executive officer, principal financial officer, principal accounting officer or controller, or persons performing similar functions, regardless of whether these individuals are employed by the registrant or a third party, that relates to one or more of the items set forth in Item 2(b) of Form N-CSR. |
| Item 3. | Audit Committee Financial Expert. |
As of the end of the period covered by the report, the registrant’s board of trustees has determined that Drew Kagan is qualified to serve as an audit committee financial expert serving on its audit committee and that he is “independent,” as defined by Item 3 of Form N-CSR.
| Item 4. | Principal Accountant Fees and Services. |
Audit Fees
| (a) | The aggregate fees billed for each of the last two fiscal years for professional services rendered by the principal accountant for the audit of the registrant’s annual financial statements or services that are normally provided by the accountant in connection with statutory and regulatory filings or engagements for those fiscal years are $68,000 in 2011 and $77,700 in 2010. |
Audit-Related Fees
| (b) | The aggregate fees billed in each of the last two fiscal years for assurance and related services by the principal accountant that are reasonably related to the performance of the audit of the registrant’s financial statements and are not reported under paragraph (a) of this Item are $0 in 2011 and $0 in 2010. |
Tax Fees
| (c) | The aggregate fees billed in each of the last two fiscal years for professional services rendered by the principal accountant for tax compliance, tax advice, and tax planning are $11,200 in 2011 and $14,000 in 2010. Fees for both 2011 and 2010 relate to the preparation of federal income and excise tax returns and review of capital gains distribution calculations. |
All Other Fees
| (d) | The aggregate fees billed in each of the last two fiscal years for products and services provided by the principal accountant, other than the services reported in paragraphs (a) through (c) of this Item are $0 in 2011 and $0 in 2010. |
| (e)(1) | Except as permitted by Rule 2-01(c)(7)(i)(C) of Regulation S-X, the Trust’s Audit Committee must pre-approve all audit and non-audit services provided by the independent accountants relating to the operations or financial reporting of the funds. Prior to the commencement of any audit or non-audit services to a fund, the Audit Committee reviews the services to determine whether they are appropriate and permissible under applicable law. |
| (e)(2) | The percentage of services described in each of paragraphs (b) through (d) of this Item that were approved by the audit committee pursuant to paragraph (c)(7)(i)(C) of Rule 2-01 of Regulation S-X are as follows: |
(b) N/A
(c) 100%
(d) N/A
| (f) | The percentage of hours expended on the principal accountant’s engagement to audit the registrant’s financial statements for the most recent fiscal year that were attributed to work performed by persons other than the principal accountant’s full-time, permanent employees was 0%. |
| (g) | The aggregate non-audit fees billed by the registrant’s accountant for services rendered to the registrant, and rendered to the registrant’s investment adviser (not including any sub-adviser whose role is primarily portfolio management and is subcontracted with or overseen by another investment adviser), and any entity controlling, controlled by, or under common control with the adviser that provides ongoing services to the registrant for each of the last two fiscal years of the registrant was $94,590 in 2011 and $54,000 in 2010. |
| (h) | The registrant’s audit committee of the board of trustees has considered whether the provision of non-audit services that were rendered to the registrant’s investment adviser (not including any sub-adviser whose role is primarily portfolio management and is subcontracted with or overseen by another investment adviser), and any entity controlling, controlled by, or under common control with the investment adviser that provides ongoing services to the registrant that were not pre-approved pursuant to paragraph (c)(7)(ii) of Rule 2-01 of Regulation S-X is compatible with maintaining the principal accountant’s independence. |
| Item 5. | Audit Committee of Listed Registrants. |
Not applicable.
| Item 6. | Investments. |
| (a) | Schedule of Investments in securities of unaffiliated issuers as of the close of the reporting period is included as part of the report to shareholders filed under Item 1 of this form. |
| (b) | Not applicable. |
| Item 7. | Disclosure of Proxy Voting Policies and Procedures for Closed-End Management Investment Companies. |
Not applicable.
| Item 8. | Portfolio Managers of Closed-End Management Investment Companies. |
Not applicable.
| Item 9. | Purchases of Equity Securities by Closed-End Management Investment Company and Affiliated Purchasers. |
Not applicable.
| Item 10. | Submission of Matters to a Vote of Security Holders. |
There have been no material changes to the procedures by which shareholders may recommend nominees to the registrant’s board of trustees, where those changes were implemented after the registrant last provided disclosure in response to the requirements of Item 407(c)(2)(iv) of Regulation S-K (17 CFR 229.407) (as required by Item 22(b)(15) of Schedule 14A (17 CFR 240.14a-101)), or this Item.
| Item 11. | Controls and Procedures. |
| (a) | The registrant’s principal executive officer and principal financial officer have concluded, based on their evaluation of the effectiveness of the design and operation of the registrant’s disclosure controls and procedures (as defined in Rule 30a-3(c) under the Investment Company Act of 1940 (17 CFR 270.30a-3(c))) as of a date within 90 days of the filing date of this report, that the design and operation of such procedures are effective to provide reasonable assurance that information required to be disclosed by the registrant on Form N-CSR is recorded, processed, |
summarized and reported within the time periods specified in the Securities and Exchange Commission’s rules and forms, and that information required to be disclosed by the registrant in the reports that it files or submits on Form N-CSR is accumulated and communicated to the registrant’s management, including its principal executive and principal financial officers, as appropriate to allow timely decisions regarding required disclosure. |
| (b) | There were no changes in the registrant’s internal control over financial reporting (as defined in Rule 30a-3(d) under the 1940 Act (17 CFR 270.30a-3(d))) that occurred during the second fiscal quarter of the period covered by this report that have materially affected, or are reasonably likely to materially affect, the registrant’s internal control over financial reporting. |
| Item 12. | Exhibits. |
| (a)(1) | The registrant’s Code of Ethics is attached hereto. | |
| (a)(2) | Certifications pursuant to Rule 30a-2(a) under the 1940 Act and Section 302 of the Sarbanes-Oxley Act of 2002 are attached hereto. | |
| (a)(3) | Not applicable. | |
| (b) | Certifications pursuant to Rule 30a-2(b) under the 1940 Act and Section 906 of the Sarbanes- Oxley Act of 2002 are attached hereto. | |
SIGNATURES
Pursuant to the requirements of the Securities Exchange Act of 1934 and the Investment Company Act of 1940, the registrant has duly caused this report to be signed on its behalf by the undersigned, thereunto duly authorized.
| (Registrant) Sterling Capital Variable Insurance Funds | ||||
| By (Signature and Title) | /s/ E.G. Purcell III | |
| E.G. Purcell III, President | ||
| (principal executive officer) | ||
| Date 2/23/12 | ||
Pursuant to the requirements of the Securities Exchange Act of 1934 and the Investment Company Act of 1940, this report has been signed below by the following persons on behalf of the registrant and in the capacities and on the dates indicated.
| By (Signature and Title) | /s/ E.G. Purcell III | |
E.G. Purcell III, President (principal executive officer) | ||
| Date 2/23/12 | ||
| By (Signature and Title) | /s/ James T. Gillespie | |
James T. Gillespie, Treasurer (principal financial officer) | ||
| Date 2/23/12 | ||