Table of Contents
UNITED STATES
SECURITIES AND EXCHANGE COMMISSION
Washington, D.C. 20549
FORM N-CSR
CERTIFIED SHAREHOLDER REPORT OF REGISTERED
MANAGEMENT INVESTMENT COMPANIES
Investment Company Act file number: 811-21682
BB&T Variable Insurance Funds
(Exact name of registrant as specified in charter)
434 Fayetteville Street Mall, 5th Floor
Raleigh, NC 27601-0575
(Address of principal executive offices) (Zip code)
E.G. Purcell, III, President
BB&T Variable Insurance Funds
434 Fayetteville Street Mall, 5th Floor
Raleigh, NC 27601-0575
(Name and address of agent for service)
Registrant’s telephone number, including area code: (800) 228-1872
Date of fiscal year end: December 31
Date of reporting period: December 31, 2009
Form N-CSR is to be used by management investment companies to file reports with the Commission not later than 10 days after the transmission to stockholders of any report that is required to be transmitted to stockholders under Rule 30e-1 under the Investment Company Act of 1940 (17 CFR 270.30e-1). The Commission may use the information provided on Form N-CSR in its regulatory, disclosure review, inspection, and policymaking roles.
A registrant is required to disclose the information specified by Form N-CSR, and the Commission will make this information public. A registrant is not required to respond to the collection of information contained in Form N-CSR unless the Form displays a currently valid Office of Management and Budget (“OMB”) control number. Please direct comments concerning the accuracy of the information collection burden estimate and any suggestions for reducing the burden to Secretary, Securities and Exchange Commission, 100 F Street, NE, Washington, DC 20549. The OMB has reviewed this collection of information under the clearance requirements of 44 U.S.C. § 3507.
Table of Contents
| Item 1. | Reports to Stockholders. |
The Report to Shareholders is attached herewith.
Table of Contents
Table of Contents
Fund Summary | ||
| 2 | ||
| 3 | ||
| 4 | ||
| 5 | ||
| 6 | ||
| 7 | ||
| 8 | ||
Schedules of Portfolio Investments | ||
| 9 | ||
| 10 | ||
| 11 | ||
| 12 | ||
| 13 | ||
| 18 | ||
| 24 | ||
| 34 | ||
| 35 | ||
| 36 | ||
| 39 | ||
Table of Contents
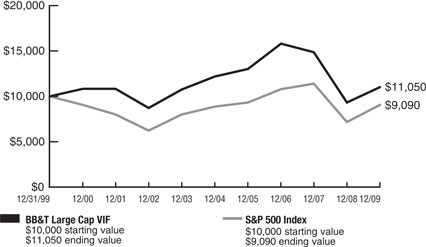
Performance Overview 12/31/1999 - 12/31/2009
Growth of a $10,000 investment
Portfolio Manager
Stephen L. Morgan, CFA
BB&T Asset Management, Inc.
Average Annual Returns
| 1 Year | 5 Year | 10 Years | ||||||
BB&T Large Cap VIF | 18.50 | % | -1.98 | % | 1.00% | |||
S&P 500 Index | 26.46 | % | 0.42 | % | -0.95% |
The chart represents a comparison of a hypothetical $10,000 investment in the indicated Fund versus a similar investment in the Fund’s benchmark, and includes the reinvestment of distributions. (The returns include the Fund level expenses, but exclude the insurance charges). Past performance does not guarantee future results. The value of the contract will fluctuate so that when redeemed, it may be worth more or less than the original investment.
Investment Concerns
Equity securities (stocks) are more volatile and carry more risk than other forms of investments, including investments in high-grade fixed income securities. The net asset value per share of the Fund will fluctuate as the value of the securities in the portfolio changes. Value-based investments are subject to the risk that the broad market may not recognize their intrinsic value.
Q. How did the Fund perform during the 12-month period between January 1, 2009 and December 31, 2009?
A. The Fund returned 18.50%. That compared to a 26.46% return for its benchmark, the S&P 500 Index.1
Q. What factors affected the Fund’s performance?
A. The stock market performed well in 2009 due to expectations of an economic recovery and easing financial stress. The Federal Reserve’s accommodative monetary policy helped to support economic growth. Consumer spending rebounded from its 2008 lows, which also contributed to an economic recovery.2
Negative stock performance during the first two months of the year dragged on the Fund’s absolute returns. Investors fled risky assets amid the economic turmoil and persistent problems in the financial system.2
Sector selection made a positive contribution to relative performance during the period. Specifically, an overweight position in financials and an underweight stake in telecommunications services contributed to relative performance. In addition, individual positions in shares of an Internet services firm, a producer of gold, silver and copper, and a financial services firm contributed to the Fund’s returns relative to its benchmark index.2
Overall stock selection dragged on relative performance during the period, however. Selection within the financials and consumer discretionary sectors was responsible for the majority of the underperformance. Positions in a financial services firm, a consumer products company, and an international oil and gas firm were the largest individual detractors from relative performance.2
| 1 | The Fund is measured against the S&P 500 Index, a widely recognized, unmanaged index of common stocks. The index is unmanaged and does not reflect the deduction of expenses associated with a mutual fund, such as investment management and fund accounting fees. The Fund’s performance reflects the deduction of fees for these services. Investors cannot invest directly in an index, although they can invest in its underlying securities. |
| 2 | Portfolio composition is as of December 31, 2009, and is subject to change. |
A portion of the Fund’s fees have been reduced. If fees had not been reduced, the Fund’s total return for the periods would have been lower.
2
Table of Contents
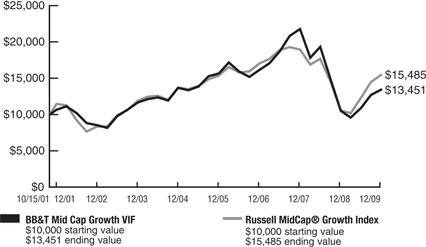
Performance Overview 10/15/2001 - 12/31/2009
Growth of a $10,000 investment
Portfolio Manager
Jeffrey J. Schappe
Chief Investment Officer
BB&T Asset Management, Inc.
Average Annual Returns (Inception 10/15/2001)
| 1 Year | 5 Year | Since Inception | ||||||
BB&T Mid Cap Growth VIF | 27.68 | % | -0.37 | % | 3.68% | |||
Russell MidCap® Growth Index | 46.29 | % | 2.40 | % | 5.50% |
The chart represents a comparison of a hypothetical $10,000 investment in the indicated Fund versus a similar investment in the Fund’s benchmark, and includes the reinvestment of distributions. The inception date used for the Russell MidCap® Growth Index was 10/31/01. (The returns include the Fund level expenses, but exclude the insurance charges). Past performance does not guarantee future results. The value of the contract will fluctuate so that when redeemed, it may be worth more or less than the original investment.
Investment Concerns
Mid-capitalization funds typically carry additional risks since smaller companies generally have a higher risk of failure, and historically, their stocks have experienced a greater degree of market volatility than stocks on average.
Equity securities (stocks) are more volatile and carry more risk than other forms of investments, including investments in high-grade fixed income securities. The net asset value per share of the Fund will fluctuate as the value of the securities in the portfolio changes.
Q. How did the Fund perform during the 12-month period between January 1, 2009 and December 31, 2009?
A. The Fund returned 27.68%. That compared to a 46.29% return for its benchmark, the Russell Midcap Growth® Index.1
Q. What factors affected the Fund’s performance?
A. The stock market performed well in 2009, due to expectations for an economic recovery and easing financial stress. The Federal Reserve’s accommodative monetary policy helped to support economic growth. Consumer spending rebounded from its 2008 lows, which also contributed to an economic recovery. Growth stocks performed especially well during the period. In particular, the information technology sector outperformed the overall market by a wide margin.2
Negative stock performance during the first two months of the year, when the economy had not yet shown any significant signs of recovery, dragged on the Fund’s absolute returns. Investors fled risky assets amid the economic turmoil and persistent problems in the financial system.2
Sector selection dragged on the Fund’s performance relative to its benchmark index. An overweight position in industrials and an underweight position in telecommunications services particularly detracted from relative returns. That said, underweight positions in utilities and consumer staples shares helped relative performance.2
Stock selection also reduced the Fund’s relative return. Specifically, positions in a regional financial services firm, a steel producer and a telecommunications firm detracted from relative performance. Conversely, positions in shares of a Chinese search engine, a mining and minerals development firm and a producer of gold, silver and copper boosted relative return.2
| 1 | The Fund is measured against the Russell MidCap® Growth Index, an unmanaged index which measures the performance of those securities in the Russell 1000 Index with higher price-to-book ratios and lower forecasted growth values. The index does not reflect the deduction of expenses associated with a mutual fund, such as investment management and fund accounting fees. The Fund’s performance reflects the deduction of fees for these services. Investors cannot invest directly in an index, although they can invest in its underlying securities. |
| 2 | Portfolio composition is as of December 31, 2009, and is subject to change. |
A portion of the Fund’s fees have been reduced. If fees had not been reduced, the Fund’s total return for the periods would have been lower.
3
Table of Contents
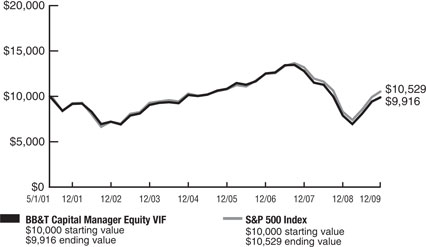
BB&T Capital Manager Equity VIF
Performance Overview 5/01/2001 - 12/31/2009
Growth of a $10,000 investment
Portfolio Management Team
Managed by the BB&T Balanced Portfolio Management Team
Average Annual Returns (Inception 5/01/2001)
| 1 Year | 5 Year | Since Inception | ||||||
BB&T Capital Manager Equity VIF | 25.24 | % | -0.49 | % | -0.10% | |||
S&P 500 Index | 26.46 | % | 0.42 | % | 0.60% |
The chart represents a comparison of a hypothetical $10,000 investment in the indicated Fund versus a similar investment in the Fund’s benchmark, and includes the reinvestment of distributions. The inception date used for the S&P 500 Index was 5/31/01. (The returns include the Fund level expenses, but exclude the insurance charges). Past performance does not guarantee future results. The value of the contract will fluctuate so that when redeemed, it may be worth more or less than the original investment.
Investment Concerns
Equity securities (stocks) are more volatile and carry more risk than other forms of investments, including investments in high-grade fixed income securities. The net asset value per share of the Fund will fluctuate as the value of the securities in the portfolio changes.
Q. How did the Fund perform during the 12-month period between January 1, 2009 and December 31, 2009?
A. The Fund returned 25.24%. That compared to a 26.46% return for the S&P 500 Index.1
Q. What factors affected the Fund���s performance?
A. The Fund normally invests in a combination of the BB&T Large Cap Fund, the BB&T Mid Cap Value Fund, the BB&T Mid Cap Growth Fund, the BB&T International Equity Fund, the BB&T Special Opportunities Fund, the BB&T Equity Income Fund, the BB&T Equity Index Fund, the BB&T U.S. Treasury Money Market Fund and various exchange-traded funds (collectively, “underlying Funds”).2
The stock market performed well in 2009. In the first two months of the year investors fled risky assets amid the economic turmoil and persistent problems in the financial system. Stocks generally performed poorly during that initial period, which dragged on the Fund’s absolute return. But aggressive global policy response to the economic crisis supported economic growth and helped increase investors’ appetite for risky assets, leading to a strong market rally. Consumer spending rebounded from its 2008 lows, which also contributed to the economic and market recovery.2
The Fund’s allocations to underlying Funds that invest in mid- and small-cap stocks contributed to relative returns, as mid- and small-cap shares outperformed the S&P 500. Mid-cap stocks comprise 32% of the Fund’s U.S. equity allocation, while small-cap stocks comprise 10%. An allocation to underlying Funds that invest in international stocks also made a positive contribution to relative performance, as foreign shares outperformed the benchmark index. International stocks comprise approximately 25% of the total equity allocation within the Fund.2
The Fund maintains a 60% allocation to underlying Funds that invest in value stocks, with a 40% allocation to underlying Funds that invest in growth stocks. The overweight allocation to value hurt relative returns during the period, as value shares’ performance lagged that of growth shares. The performance of the underlying equity Funds was also a net detractor from relative performance.2
| 1 | The Fund is measured against the S&P 500 Index, a widely recognized, unmanaged index of common stocks. The index does not reflect the deduction of expenses associated with a mutual fund, such as investment management and fund accounting fees. The Fund’s performance reflects the deduction of fees for these services. Investors cannot invest directly in an index, although they can invest in its underlying securities. |
| 2 | Portfolio composition is as of December 31, 2009, and is subject to change. |
A portion of the Fund’s fees have been reduced. If fees had not been reduced, the Fund’s total return for the periods would have been lower.
4
Table of Contents
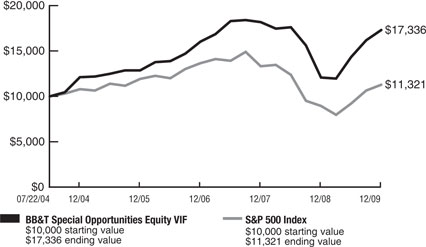
BB&T Special Opportunities Equity VIF
Performance Overview 7/22/2004 - 12/31/2009
Growth of a $10,000 investment
Portfolio Manager
George F. Shipp, CFA
Chief Investment Officer
Scott & Stringfellow LLC
Average Annual Returns (Inception 7/22/2004)
| 1 Year | 5 Year | Since Inception | ||||||
BB&T Special Opportunities Equity VIF | 43.53 | % | 7.42 | % | 10.63% | |||
S&P 500 Index | 26.46 | % | 0.42 | % | 2.32% |
The chart represents a comparison of a hypothetical $10,000 investment in the indicated Fund versus a similar investment in the Fund’s benchmark, and includes the reinvestment of distributions. The inception date used for the S&P 500 Index was 07/31/04. (The returns include the Fund level expenses, but exclude the insurance charges). Past performance does not guarantee future results. The value of the contract will fluctuate so that when redeemed, it may be worth more or less than the original investment.
Investment Concerns
Equity securities (stocks) are more volatile and carry more risk than other forms of investments, including investments in high-grade fixed income securities. The net asset value per share of the Fund will fluctuate as the value of the securities in the portfolio changes. A concentrated portfolio may add a measure of volatility to performance, as major fluctuations in any one holding will likely affect the Fund more than a fund with greater diversification.
Q. How did the Fund perform during the 12-month period between January 1, 2009 and December 31, 2009?
A. The Fund returned 43.53%. That compared to a 26.46% return for its benchmark, the S&P 500 Index.1
Q. What factors affected the Fund’s performance?
A. Global stock markets rebounded sharply off their March 2009 lows, in response to the somewhat coordinated response of monetary authorities to flood the system with liquidity and keep credit flowing. With money markets and similar deposit products providing near zero yields, investors sought out higher returns in fixed income and equity markets. The Federal Reserve’s supply of essentially free money encouraged greater risk-taking. As a result, shares of smaller companies tended to provide the strongest returns. Shares of more-stable blue-chip companies benefited less from the 2009 rally.2
Favorable sector and security selection aided the Fund’s return relative to its benchmark. Throughout the year, the Fund held underweight positions in telecommunications companies, utilities and financials (the market’s worst, second-worst and fourth-worst performing sectors, respectively), while remaining overweight in technology stocks (the market’s strongest sector in 2009).2
Among the strongest gainers in the portfolio were stocks of a health care information technology company, a global oil producer, a specialty chemicals company, an optical glass manufacturer and a microchip design firm. Shares of two energy services providers, a broadband facilitator and an online marketplace company also provided strong double-digit returns for the year. Gains in those securities more than offset below-market performance from other stocks held by the Fund, including shares of a national cable operator and a global fast-food franchisor.2
| 1 | The Fund is measured against the S&P 500 Index, a widely recognized, unmanaged index of common stocks. The index does not reflect the deduction of expenses associated with a mutual fund, such as investment management and fund accounting fees. The Fund’s performance reflects the deduction of fees for these services. Investors cannot invest directly in an index, although they can invest in its underlying securities. |
| 2 | Portfolio composition is as of December 31, 2009, and is subject to change. |
A portion of the Fund’s fees have been reduced. If fees had not been reduced, the Fund’s total return for the periods would have been lower.
5
Table of Contents
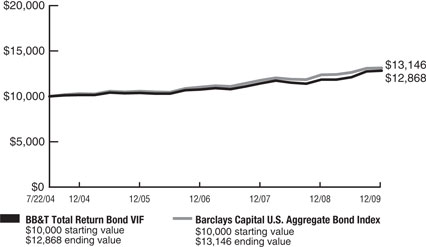
Performance Overview 7/22/2004 - 12/31/2009
Growth of a $10,000 investment
Portfolio Manager
Mark Montgomery, CFA
Managing Director and Fixed Income Portfolio Manager
Sterling Capital Management LLC
Average Annual Returns (Inception 7/22/2004)
| 1 Year | 5 Year | Since Inception | ||||||
BB&T Total Return Bond VIF | 8.57 | % | 4.81 | % | 4.74% | |||
Barclays Capital U.S. Aggregate Bond Index | 5.93 | % | 4.97 | % | 5.18% |
The chart represents a comparison of a hypothetical $10,000 investment in the indicated Fund versus a similar investment in the Fund’s benchmark, and includes the reinvestment of distributions. The inception date used for the Barclays Capital U.S. Aggregate Bond Index was 07/31/ 04. (The returns include the Fund level expenses, but exclude the insurance charges). Past performance does not guarantee future results. The value of the contract will fluctuate so that when redeemed, it may be worth more or less than the original investment.
Investment Concerns
Bonds offer a relatively stable level of income, although bond prices will fluctuate providing the potential for principal gain or loss. Intermediate-term, higher-quality bonds generally offer less risk than longer-term bonds and a lower rate of return.
The Fund is subject to the risk that principal value tends to react in opposition to the movement of interest rates and that a rising interest rate environment increases the risk of loss of principal.
Q. How did the Fund perform during the 12-month period between January 1, 2009 and December 31, 2009?
A. The Fund returned 8.57%. That compared to a 5.93% return for its benchmark, the Barclays Capital U.S. Aggregate Bond Index.1
Q. What factors affected the Fund’s performance?
A. High-quality corporate bonds, high-yield (“junk”) bonds and mortgage-backed and other structured securities all posted strong returns as confidence in the economy increased throughout the period. Government support programs such as the Public-Private Investment Fund and the Term Asset-Backed Securities Loan Facility helped bolster investors’ confidence and provide stability to the economy. In addition, Treasury and agency durations fell, boosting absolute returns.2
During the year, the Fund held overweight positions in several outperforming sectors, including corporate bonds, asset-backed securities, commercial mortgage-backed securities and private-label mortgages. Those larger-than-benchmark positions boosted returns relative to the index. The Fund’s underweight position in agency securities slightly reduced relative returns, on average.2
| 1 | The Fund is measured against Barclays Capital U.S. Aggregate Bond Index which is a market value-weighted performance benchmark for investment-grade fixed-rate debt issues, including government, corporate, asset-backed and mortgage-backed securities, with maturities of at least one year. The index is unmanaged and does not reflect the deduction of expenses associated with a mutual fund, such as investment management and fund accounting fees. The Fund’s performance reflects the deduction of fees for these services. Investors cannot invest directly in an index, although they can invest in its underlying securities. |
| 2 | Portfolio composition is as of December 31, 2009, and is subject to change. |
A portion of the Fund’s fees have been reduced. If fees had not been reduced, the Fund’s total return for the periods would have been lower.
6
Table of Contents
Summary of Portfolio Holdings (Unaudited)
December 31, 2009
Each BB&T Variable Insurance Fund’s portfolio composition was as follows at December 31, 2009:
| Percentage of net assets | ||
BB&T Large Cap VIF | ||
Consumer Discretionary | 6.9% | |
Consumer Staples | 11.4% | |
Energy | 13.9% | |
Financials | 12.7% | |
Health Care | 13.7% | |
Industrials | 10.9% | |
Information Technology | 17.9% | |
Materials | 5.9% | |
Telecommunication Services | 4.3% | |
Utilities | 2.0% | |
Cash Equivalents | 0.3% | |
| 99.9% | ||
BB&T Mid Cap Growth VIF | ||
Consumer Discretionary | 15.0% | |
Energy | 14.7% | |
Financials | 5.6% | |
Health Care | 7.3% | |
Industrials | 15.5% | |
Information Technology | 30.2% | |
Materials | 10.5% | |
Cash Equivalents | 5.4% | |
| 104.2% | ||
BB&T Capital Manager Equity VIF | ||
BB&T Equity Income Fund | 9.0% | |
BB&T Equity Index Fund | 0.8% | |
BB&T International Equity Fund | 21.1% | |
BB&T Large Cap Fund | 8.3% | |
BB&T Mid Cap Growth Fund | 8.9% | |
BB&T Mid Cap Value Fund | 13.1% | |
BB&T Special Opportunities Equity Fund | 4.8% | |
BB&T U.S. Treasury Money Market Fund | 2.0% | |
Exchange Traded Funds | 27.6% | |
Commodity Investment Company | 4.4% | |
| 100.0% | ||
BB&T Special Opportunities Equity VIF | ||
Consumer Discretionary | 6.0% | |
Consumer Staples | 2.7% | |
Energy | 5.7% | |
Financials | 1.6% | |
Health Care | 26.9% | |
Industrials | 5.2% | |
Information Technology | 31.4% | |
Materials | 2.2% | |
Cash Equivalents | 16.4% | |
| 98.1% | ||
BB&T Total Return Bond VIF | ||
Asset Backed Securities | 3.0% | |
Collateralized Mortgage Obligations | 10.8% | |
Commercial Mortgage-Backed Securities | 8.0% | |
Corporate Bonds | 37.5% | |
Fannie Mae | 19.3% | |
Foreign Government Bonds | 0.8% | |
Freddie Mac | 10.7% | |
Ginnie Mae | 5.8% | |
Municipal Bonds | 6.1% | |
U.S. Treasury Notes | 0.4% | |
Cash Equivalents | 0.1% | |
| 102.5% | ||
7
Table of Contents
Expense Example (Unaudited)
December 31, 2009
As a shareholder of the BB&T Variable Insurance Funds, you incur two types of costs: (1) transaction costs, and (2) ongoing costs, including management fees and other Fund expenses.
These examples are intended to help you understand your ongoing costs (in dollars) of investing in the BB&T Variable Insurance Funds and to compare these costs with the ongoing costs of investing in other mutual funds.
These examples are based on an investment of $1,000 invested at the beginning of the period and held for the entire period from July 1, 2009 through December 31, 2009.
Actual Example
The table below provides information about actual account values and actual expenses. You may use the information below, together with the amount you invested, to estimate the expenses that you paid over the period. Simply divide your account value by $1,000 (for example, an $8,600 account value divided by $1,000 = 8.6), then multiply the result by the number in the table under the heading entitled “Expenses Paid During Period” to estimate the expenses you paid on your account during this period.
| Beginning Account Value 7/1/09 | Ending Account Value 12/31/09 | Expenses Paid During Period 7/1/09 - 12/31/09* | Expense Ratio During Period 7/1/09 - 12/31/09 | |||||||
BB&T Large Cap VIF | $ | 1,000.00 | $ | 1,235.20 | $5.52 | 0.98% | ||||
BB&T Mid Cap Growth VIF | 1,000.00 | 1,230.50 | 6.02 | 1.07% | ||||||
BB&T Capital Manager Equity VIF | 1,000.00 | 1,219.10 | 2.13 | 0.38% | ||||||
BB&T Special Opportunities Equity VIF | 1,000.00 | 1,207.30 | 7.07 | 1.27% | ||||||
BB&T Total Return Bond VIF | 1,000.00 | 1,060.00 | 4.73 | 0.91% | ||||||
| * | Expenses are equal to the average account value times the Fund’s annualized expense ratio multiplied by the number of days in the most recent fiscal half-year divided by the number of days in the fiscal year. Expenses shown do not include annuity contract fees. |
Hypothetical Example for Comparison Purposes
The table below provides information about hypothetical account values and hypothetical expenses based on each BB&T Variable Insurance Fund’s actual expense ratio and an assumed rate of return of 5% per year before expenses, which is not the Fund’s actual return. The hypothetical account values and expenses may not be used to estimate the actual ending account balance or expenses you paid for the period. You may use this information to compare this 5% hypothetical example with the 5% hypothetical examples that appear in the shareholder reports of other funds.
Please note that the expenses shown in the table are meant to highlight your ongoing costs only and do not reflect any transactional costs. Therefore, the table is useful in comparing ongoing costs only, and will not help you determine the relative total costs of owning different funds. In addition, if these transactional costs were included, your costs would have been higher.
| Beginning Account Value 7/1/09 | Ending Account Value 12/31/09 | Expenses Paid During Period 7/1/09 - 12/31/09* | Expense Ratio During Period 7/1/09 - 12/31/09 | |||||||
BB&T Large Cap VIF | $ | 1,000.00 | $ | 1,020.27 | $4.99 | 0.98% | ||||
BB&T Mid Cap Growth VIF | 1,000.00 | 1,019.81 | 5.45 | 1.07% | ||||||
BB&T Capital Manager Equity VIF | 1,000.00 | 1,023.29 | 1.94 | 0.38% | ||||||
BB&T Special Opportunities Equity VIF | 1,000.00 | 1,018.80 | 6.46 | 1.27% | ||||||
BB&T Total Return Bond VIF | 1,000.00 | 1,020.62 | 4.63 | 0.91% | ||||||
| * | Expenses are equal to the average account value times the Fund’s annualized expense ratio multiplied by the number of days in the most recent fiscal half-year divided by the number of days in the fiscal year. Expenses shown do not include annuity contract fees. |
8
Table of Contents
Schedule of Portfolio Investments
December 31, 2009
| Shares | Fair Value | ||||
COMMON STOCKS (99.6%) | |||||
Consumer Discretionary (6.9%) | |||||
| 40,650 | Comcast Corp., Class A | $ | 685,359 | ||
| 13,700 | Genuine Parts Co. | 520,052 | |||
| 12,500 | Staples, Inc. | 307,375 | |||
| 22,200 | Walt Disney Co. (The) | 715,950 | |||
| 2,228,736 | |||||
Consumer Staples (11.4%) | |||||
| 18,200 | Campbell Soup Co. | 615,160 | |||
| 10,050 | CVS Caremark Corp. | 323,710 | |||
| 21,215 | Kraft Foods, Inc., Class A | 576,624 | |||
| 7,910 | PepsiCo, Inc. | 480,928 | |||
| 4,250 | Procter & Gamble Co. (The) | 257,678 | |||
| 13,610 | Sysco Corp. | 380,263 | |||
| 20,400 | Unilever PLC, ADR | 650,760 | |||
| 7,260 | Wal-Mart Stores, Inc. | 388,047 | |||
| 3,673,170 | |||||
Energy (13.9%) | |||||
| 7,200 | Anadarko Petroleum Corp. | 449,424 | |||
| 8,130 | Chevron Corp. | 625,929 | |||
| 15,290 | ConocoPhillips | 780,860 | |||
| 13,487 | Exxon Mobil Corp. | 919,679 | |||
| 11,175 | Schlumberger, Ltd. | 727,381 | |||
| 12,710 | Suncor Energy, Inc. | 448,790 | |||
| 6,110 | Transocean, Ltd.(a) | 505,908 | |||
| 4,457,971 | |||||
Financials (12.7%) | |||||
| 294 | Berkshire Hathaway, Inc. Class B(a) | 966,084 | |||
| 13,400 | JPMorgan Chase & Co. | 558,378 | |||
| 16,630 | MetLife, Inc. | 587,871 | |||
| 14,600 | State Street Corp. | 635,684 | |||
| 8,370 | Travelers Cos., Inc. (The) | 417,328 | |||
| 20,000 | U.S. Bancorp | 450,200 | |||
| 17,300 | Wells Fargo & Co. | 466,927 | |||
| 4,082,472 | |||||
Health Care (13.7%) | |||||
| 13,065 | Abbott Laboratories | 705,379 | |||
| 11,527 | Baxter International, Inc. | 676,404 | |||
| 9,450 | Johnson & Johnson | 608,675 | |||
| 17,000 | Medtronic, Inc. | 747,660 | |||
| 21,000 | Merck & Co., Inc. | 767,340 | |||
| 6,000 | Teva Pharmaceutical Industries, Ltd., ADR | 337,080 | |||
| 9,355 | WellPoint, Inc.(a) | 545,303 | |||
| 4,387,841 | |||||
Industrials (10.9%) | |||||
| 37,500 | ABB, Ltd., ADR(a) | 716,250 | |||
| 16,800 | Avery Dennison Corp. | 613,032 | |||
| 11,400 | Emerson Electric Co. | 485,640 | |||
| 38,750 | General Electric Co. | 586,288 | |||
| 6,390 | Lockheed Martin Corp. | 481,486 | |||
| 17,470 | Pall Corp. | 632,414 | |||
| 3,515,110 | |||||
Information Technology (17.9%) | |||||
| 34,800 | Applied Materials, Inc. | 485,112 | |||
| 26,000 | Cisco Systems, Inc.(a) | 622,440 | |||
| Shares | Fair Value | |||||
| COMMON STOCKS — (continued) | |||||
Information Technology — (continued) | ||||||
| 16,800 | Corning, Inc. | $ | 324,408 | |||
| 13,500 | eBay, Inc.(a) | 317,790 | ||||
| 546 | Google, Inc., Class A(a) | 338,509 | ||||
| 6,500 | Hewlett-Packard Co. | 334,815 | ||||
| 38,000 | Intel Corp. | 775,200 | ||||
| 3,150 | International Business Machines Corp. | 412,335 | ||||
| 37,500 | Microsoft Corp. | 1,143,375 | ||||
| 26,550 | Oracle Corp. | 651,537 | ||||
| 7,200 | QUALCOMM, Inc. | 333,072 | ||||
| 5,738,593 | ||||||
Materials (5.9%) | ||||||
| 22,500 | Barrick Gold Corp. | 886,050 | ||||
| 13,800 | E.I. du Pont de Nemours & Co. | 464,646 | ||||
| 6,600 | Monsanto Co. | 539,550 | ||||
| 1,890,246 | ||||||
Telecommunication Services (4.3%) | ||||||
| 21,300 | AT&T, Inc. | 597,039 | ||||
| 33,300 | Vodafone Group PLC, ADR | 768,897 | ||||
| 1,365,936 | ||||||
Utilities (2.0%) | ||||||
| 11,100 | Edison International | 386,058 | ||||
| 5,250 | Exelon Corp. | 256,568 | ||||
| 642,626 | ||||||
Total Common Stocks | 31,982,701 | |||||
| INVESTMENT COMPANY (0.3%) | |||||
| 98,368 | Federated Treasury Obligations Fund, Institutional Shares | 98,368 | ||||
Total Investment Company | 98,368 | |||||
| Principal Amount | ||||||
| SHORT TERM INVESTMENTS (0.0%) | ||||||
| $ | 29,800 | BNY Institutional Cash Reserve, Series B | 5,811 | |||
Total Short Term Investments | 5,811 | |||||
| Total Investments — 99.9% | 32,086,880 | ||||
| Net Other Assets (Liabilities) — 0.1% | 36,812 | ||||
| NET ASSETS — 100.0% | $ | 32,123,692 | |||
| (a) | Represents non-income producing security. |
ADR — American Depository Receipt
See accompanying notes to the financial statements.
9
Table of Contents
Schedule of Portfolio Investments
December 31, 2009
| Shares | Fair Value | ||||
COMMON STOCKS (98.8%) | |||||
Consumer Discretionary (15.0%) | |||||
| 1,200 | Amazon.com, Inc.(a) | $ | 161,424 | ||
| 6,450 | American Eagle Outfitters, Inc. | 109,521 | |||
| 8,035 | Cheesecake Factory (The)(a) | 173,476 | |||
| 5,860 | Darden Restaurants, Inc. | 205,510 | |||
| 4,900 | Dick’s Sporting Goods, Inc.(a) | 121,863 | |||
| 5,640 | JOS A Bank Clothiers, Inc.(a) | 237,952 | |||
| 4,500 | P.F. Chang’s China Bistro, Inc.(a) | 170,595 | |||
| 2,300 | Polo Ralph Lauren Corp. | 186,254 | |||
| 1,366,595 | |||||
Energy (14.7%) | |||||
| 5,790 | Alpha Natural Resources, Inc.(a) | 251,170 | |||
| 3,035 | Anadarko Petroleum Corp. | 189,445 | |||
| 14,900 | EXCO Resources, Inc. | 316,327 | |||
| 4,325 | National Oilwell Varco, Inc. | 190,689 | |||
| 4,390 | Petroleo Brasileiro SA, ADR | 209,315 | |||
| 3,850 | Southwestern Energy Co.(a) | 185,570 | |||
| 1,342,516 | |||||
Financials (5.6%) | |||||
| 625 | CME Group, Inc. | 209,969 | |||
| 5,900 | Piper Jaffray Cos.(a) | 298,599 | |||
| 508,568 | |||||
Health Care (7.3%) | |||||
| 6,510 | Alexion Pharmaceuticals, Inc.(a) | 317,818 | |||
| 2,300 | Celgene Corp.(a) | 128,064 | |||
| 12,250 | Mylan, Inc.(a)(b) | 225,768 | |||
| 671,650 | |||||
Industrials (15.5%) | |||||
| 6,985 | Aecom Technology Corp.(a) | 192,087 | |||
| 2,675 | C.H. Robinson Worldwide, Inc. | 157,103 | |||
| 4,525 | Duoyuan Global Water, Inc., ADR(a)(b) | 161,950 | |||
| 5,265 | Fluor Corp. | 237,136 | |||
| 10,650 | McDermott International, Inc.(a) | 255,706 | |||
| 11,470 | Orion Marine Group, Inc.(a) | 241,558 | |||
| 8,275 | Quanta Services, Inc.(a) | 172,451 | |||
| 1,417,991 | |||||
Information Technology (30.2%) | |||||
| 8,850 | Altera Corp. | 200,276 | |||
| 2,050 | Equinix, Inc.(a) | 217,608 | |||
| 6,150 | KLA-Tencor Corp. | 222,384 | |||
| 16,950 | Marvell Technology Group, Ltd.(a) | 351,713 | |||
| 13,125 | Nuance Communications, Inc.(a) | 203,962 | |||
| 8,830 | Red Hat, Inc.(a) | 272,847 | |||
| 8,550 | Rovi Corp.(a) | 272,488 | |||
| 3,600 | SINA Corp.(a)(b) | 162,648 | |||
| Shares | Fair Value | ||||||
| COMMON STOCKS — (continued) | ||||||
Information Technology — (continued) | |||||||
| 9,475 | VanceInfo Technologies, Inc., ADR(a) | $ | 182,015 | ||||
| 6,875 | Varian Semiconductor Equipment Associates, Inc.(a) | 246,675 | |||||
| 6,875 | Veeco Instruments, Inc.(a) | 227,150 | |||||
| 8,025 | Xilinx, Inc. | 201,106 | |||||
| 2,760,872 | |||||||
Materials (10.5%) | |||||||
| 2,415 | Air Products & Chemicals, Inc. | 195,760 | |||||
| 2,665 | Freeport-McMoRan Copper & Gold, Inc.(a) | 213,973 | |||||
| 4,490 | Nucor Corp. | 209,458 | |||||
| 9,700 | Teck Resources, Ltd., Class B(a) | 339,209 | |||||
| 958,400 | |||||||
Total Common Stocks | 9,026,592 | ||||||
| INVESTMENT COMPANY (1.8%) |
| |||||
| 163,214 | Federated Treasury Obligations Fund, Institutional Shares | 163,214 | |||||
Total Investment Company | 163,214 | ||||||
| Principal Amount | |||||||
| SECURITIES HELD AS COLLATERAL FOR | | |||||
| $ | 334,495 | Pool of Various Securities | 331,561 | ||||
Total Securities Held as Collateral for Securities on Loan (Cost $334,495) | 331,561 | ||||||
| Total Investments — 104.2% | 9,521,367 | |||||
| Net Other Assets (Liabilities) — (4.2)% | (385,900 | ) | ||||
| NET ASSETS — 100.0% | $ | 9,135,467 | ||||
| (a) | Represents non-income producing security. |
| (b) | Represents that all or a portion of the security was on loan as of December 31, 2009. |
ADR — American Depository Receipt
See accompanying notes to the financial statements.
10
Table of Contents
BB&T Capital Manager Equity VIF
Schedule of Portfolio Investments
December 31, 2009
| Shares | Fair Value | |||||
AFFILIATED INVESTMENT COMPANIES (68.0%) |
| |||||
| 58,718 | BB&T Equity Income Fund, Institutional Class | $ | 715,183 | |||
| 8,241 | BB&T Equity Index Fund, Institutional Class | 61,644 | ||||
| 326,146 | BB&T International Equity Fund, Institutional Class | 1,682,911 | ||||
| 62,020 | BB&T Large Cap Fund, Institutional Class | 658,028 | ||||
| 78,343 | BB&T Mid Cap Growth Fund, Institutional Class(a) | 705,869 | ||||
| 92,824 | BB&T Mid Cap Value Fund, Institutional Class | 1,044,267 | ||||
| 24,016 | BB&T Special Opportunities Equity Fund, Institutional Class(a) | 378,494 | ||||
| 159,013 | BB&T U.S. Treasury Money Market Fund, Institutional Class | 159,013 | ||||
Total Affiliated Investment Companies | 5,405,409 | |||||
EXCHANGE TRADED FUNDS (27.6%) |
| |||||
| 9,034 | iShares Russell 2000 Index Fund | 562,457 | ||||
| 14,587 | iShares S&P 500 Index Fund | 1,628,056 | ||||
Total Exchange Traded Funds | 2,190,513 | |||||
COMMODITY INVESTMENT COMPANY (4.4%) |
| |||||
| 41,184 | Credit Suisse Commodity Return Strategy Fund | 353,767 | ||||
Total Commodity Investment Company | 353,767 | |||||
Total Investments — 100.0% | 7,949,689 | |||||
Net Other Assets (Liabilities) — (0.0)% | (2,968 | ) | ||||
NET ASSETS — 100.0% | $ | 7,946,721 | ||||
| (a) | Represents non-income producing security. |
See accompanying notes to the financial statements.
11
Table of Contents
BB&T Special Opportunities Equity VIF
Schedule of Portfolio Investments
December 31, 2009
| Shares | Fair Value | ||||
COMMON STOCKS (81.7%) | |||||
Consumer Discretionary (6.0%) | |||||
| 87,000 | Comcast Corp., Class A | $ | 1,466,820 | ||
| 27,000 | Yum! Brands, Inc. | 944,190 | |||
| 2,411,010 | |||||
Consumer Staples (2.7%) | |||||
| 20,000 | Dole Food Co., Inc.(a) | 248,200 | |||
| 11,000 | Energizer Holdings, Inc.(a) | 674,080 | |||
| 2,569 | Ralcorp Holdings, Inc.(a) | 153,395 | |||
| 1,075,675 | |||||
Energy (5.7%) | |||||
| 12,000 | Apache Corp. | 1,238,040 | |||
| 10,000 | Halliburton Co. | 300,900 | |||
| 42,100 | Weatherford International, Ltd.(a) | 754,011 | |||
| 2,292,951 | |||||
Financials (1.6%) | |||||
| 1,900 | Markel Corp.(a) | 646,000 | |||
Health Care (26.9%) | |||||
| 29,000 | Allscripts-Misys Healthcare Solutions, Inc.(a)(b) | 586,670 | |||
| 21,000 | Baxter International, Inc. | 1,232,280 | |||
| 20,000 | Becton Dickinson & Co. | 1,577,200 | |||
| 60,000 | Bristol-Myers Squibb Co. | 1,515,000 | |||
| 30,000 | Gilead Sciences, Inc.(a) | 1,298,400 | |||
| 23,000 | McKesson Corp.(b) | 1,437,500 | |||
| 10,000 | MedCath Corp.(a) | 79,100 | |||
| 26,000 | Teva Pharmaceutical Industries, Ltd., ADR | 1,460,680 | |||
| 53,000 | UnitedHealth Group, Inc. | 1,615,440 | |||
| 10,802,270 | |||||
Industrials (5.2%) | |||||
| 14,000 | L-3 Communications Holdings, Inc. | 1,217,300 | |||
| 16,000 | SPX Corp. | 875,200 | |||
| 2,092,500 | |||||
Information Technology (31.4%) | |||||
| 80,000 | Activision Blizzard, Inc.(a) | 888,800 | |||
| 64,000 | Akamai Technologies, Inc.(a) | 1,621,120 | |||
| 215,000 | ARM Holdings PLC, ADR | 1,840,400 | |||
| 60,000 | Cisco Systems, Inc.(a)(b) | 1,436,400 | |||
| Shares | Fair Value | |||||
| COMMON STOCKS — (continued) | |||||
Information Technology — (continued) | ||||||
| 25,000 | Corning, Inc. | $ | 482,750 | |||
| 94,000 | Dell, Inc.(a)(b) | 1,349,840 | ||||
| 57,000 | eBay, Inc.(a) | 1,341,780 | ||||
| 30,000 | Harris Corp. | 1,426,500 | ||||
| 35,000 | Intuit, Inc.(a) | 1,074,850 | ||||
| 63,000 | Symantec Corp.(a) | 1,127,070 | ||||
| 12,589,510 | ||||||
Materials (2.2%) | ||||||
| 35,000 | Nalco Holding Co.(b) | 892,850 | ||||
Total Common Stocks | 32,802,766 | |||||
| INVESTMENT COMPANY (16.4%) | |||||
| 6,603,260 | Federated Treasury Obligations Fund, Institutional Shares | 6,603,260 | ||||
Total Investment Company | 6,603,260 | |||||
| Principal Amount | ||||||
| SHORT TERM INVESTMENTS (0.0%) | |||||
| $ | 37,343 | BNY Institutional Cash Reserve, Series B | 7,282 | |||
Total Short Term Investments | 7,282 | |||||
| Total Investments — 98.1% | 39,413,308 | ||||
| Net Other Assets (Liabilities) — 1.9% | 748,619 | ||||
| NET ASSETS — 100.0% | $ | 40,161,927 | |||
| (a) | Represents non-income producing security. |
| (b) | Security held as collateral for written call option. |
ADR — American Depository Receipt
See accompanying notes to the financial statements.
12
Table of Contents
Schedule of Portfolio Investments
December 31, 2009
| Principal Amount | Fair Value | |||||
| ASSET BACKED SECURITIES (3.0%) | |||||
| $ | 100,000 | American Express Credit Account Master Trust, Series 2007-8, Class B, 0.933%, 5/15/15* | $ | 95,800 | ||
| 250,000 | Bank of America Credit Card Trust, Series 2006-A6, Class A6, 0.263%, 11/15/13* | 246,902 | ||||
| 35,000 | Bank of America Credit Card Trust, Series 2008-A1, Class A1, 0.813%, 4/15/13* | 34,920 | ||||
| 98,000 | Chase Funding Mortgage Loan Asset-Backed Certificates, Series 2003-4, Class 1A5, STEP, 5.416%, 5/25/33(a) | 74,927 | ||||
| 79,000 | Honda Auto Receivables Owner Trust, Series 2009-2, Class A4, 4.430%, 7/15/15 | 83,191 | ||||
| 40,000 | MBNA Credit Card Master Note Trust, Series 2005-A4, Class A4, 0.273%, 11/15/12* | 39,869 | ||||
| 82,000 | World Omni Auto Receivables Trust, Series 2009-A, Class A4, 5.120%, 5/15/14 | 87,315 | ||||
Total Asset Backed Securities | 662,924 | |||||
| COLLATERALIZED MORTGAGE OBLIGATIONS | |||||
| 161,566 | Chase Mortgage Finance Corp., Series 2003-S7, Class A1, 0.631%, 8/25/18* | 149,124 | ||||
| 81,467 | Countrywide Home Loan Mortgage Pass Through Trust, Series 2004-7, Class 3A1, 4.050%, 5/25/34* | 75,309 | ||||
| 374,963 | Fannie Mae, Series 2009-70, Class PA, 5.000%, 8/25/35 | 395,979 | ||||
| 213,895 | Fannie Mae, Series 2009-86, Class CA, 4.500%, 9/25/24 | 223,378 | ||||
| 85,638 | Freddie Mac, Series 2906, Class VC, 5.000%, 12/15/15 | 90,828 | ||||
| 302,941 | Freddie Mac, Series 3578, Class AM, 4.500%, 9/15/16 | 315,326 | ||||
| 157,368 | MASTR Alternative Loans Trust, Series 2005-4, Class 4A1, 5.500%, 6/25/20 | 150,680 | ||||
| 57,783 | MASTR Asset Securitization Trust, Series 2004-1, Class 1A1, 5.000%, 2/25/34 | 57,644 | ||||
| 195,861 | RAAC, Series 2004-SP3, Class AI5, 4.890%, 12/25/32* | 187,262 | ||||
| 150,506 | RBSSP Resecuritization Trust, Series 2009-6, Class 2A1, 4.970%, 1/26/36*(b) | 141,385 | ||||
| 190,023 | Structured Adjustable Rate Mortgage Loan Trust, Series 2004-6, Class 4A1, 4.847%, 6/25/34* | 163,151 | ||||
| 123,229 | Structured Asset Securities Corp., Series 2005-6, Class 5A1, 5.000%, 5/25/35 | 117,818 | ||||
| 170,649 | Wells Fargo Mortgage Backed Securities Trust, Series 2004-BB, Class A2, 2.935%, 1/25/35* | 154,913 | ||||
| 182,730 | Wells Fargo Mortgage Backed Securities Trust, Series 2005-AR16, Class 6A3, 5.000%, 10/25/35* | 164,905 | ||||
Total Collateralized Mortgage Obligations (Cost $2,374,939) | 2,387,702 | |||||
| COMMERCIAL MORTGAGE-BACKED SECURITIES | |||||
| 150,000 | Bear Stearns Commercial Mortgage Securities, Series 2005-PWR8, Class A4, 4.674%, 6/11/41 | 143,491 | ||||
| 140,000 | Credit Suisse Mortgage Capital Certificates, Series 2009-RR1, Class A3A, 5.383%, 2/15/40(b) | 124,680 | ||||
| Principal Amount | Fair Value | |||||
| COMMERCIAL MORTGAGE-BACKED | |||||
| $ | 220,000 | CS First Boston Mortgage Securities Corp., Series 2005-C1, Class A3, 4.813%, 2/15/38 | $ | 219,647 | ||
| 76,740 | Greenwich Capital Commercial Funding Corp., Series 2005-GG3, Class A2, 4.305%, 8/10/42 | 76,598 | ||||
| 165,000 | JP Morgan Chase Commercial Mortgage Securities Corp., Series 2003-CB7, Class A4, 4.879%, 1/12/38* | 165,699 | ||||
| 360,000 | JP Morgan Chase Commercial Mortgage Securities Corp., Series 2005-CB11, Class A4, 5.335%, 8/12/37* | 355,254 | ||||
| 166,000 | JP Morgan Chase Commercial Mortgage Securities Corp., Series 2005-LDP1, Class A3, 4.865%, 3/15/46 | 163,886 | ||||
| 210,000 | JP Morgan Chase Commercial Mortgage Securities Corp., Series 2006-CB15, Class A4, 5.814%, 6/12/43* | 202,092 | ||||
| 28,000 | Merrill Lynch/Countrywide Commercial Mortgage Trust, Series 2006-3, Class A3, 5.389%, 7/12/46* | 27,298 | ||||
| 220,000 | Morgan Stanley Capital I, Series 2005-HQ6, Class A4A, 4.989%, 8/13/42 | 212,954 | ||||
| 67,000 | Wachovia Bank Commercial Mortgage Trust, Series 2007-C33, Class A3, 5.902%, 2/15/51* | 65,894 | ||||
Total Commercial Mortgage-Backed Securities | 1,757,493 | |||||
| CORPORATE BONDS (37.5%) | |||||
Consumer Discretionary (3.4%) | ||||||
| 154,000 | Comcast Cable Communications Holdings, Inc., 9.455%, 11/15/22 | 198,066 | ||||
| 141,000 | Historic TW, Inc., 9.125%, 1/15/13 | 163,607 | ||||
| 203,000 | Time Warner Cable, Inc., 6.750%, 6/15/39 | 212,603 | ||||
| 175,000 | Viacom, Inc., 5.625%, 9/15/19 | 182,718 | ||||
| 756,994 | ||||||
Consumer Staples (2.5%) | ||||
| 96,000 | Altria Group, Inc., 9.950%, 11/10/38 | 125,137 | ||
| 255,000 | Anheuser-Busch InBev Worldwide, Inc., 4.125%, 1/15/15(b) | 258,914 | ||
| 55,000 | Brown University, 4.570%, 9/1/19 | 54,743 | ||
| 117,000 | CVS Caremark Corp., 6.125%, 9/15/39 | 115,959 | ||
| 554,753 | ||||
Energy (2.3%) | ||||
| 145,000 | Boardwalk Pipelines LP, 5.750%, 9/15/19 | 142,971 | ||
| 68,000 | Peabody Energy Corp., Series B, 6.875%, 3/15/13 | 68,765 | ||
| 105,000 | Plains All American Pipeline LP, 8.750%, 5/1/19 | 123,805 | ||
| 130,000 | Smith International, Inc., 9.750%, 3/15/19 | 164,675 | ||
| 500,216 | ||||
Financials (17.2%) | ||||
| 220,000 | Aflac, Inc., 8.500%, 5/15/19 | 253,438 | ||
| 221,000 | American Express Co., 8.125%, 5/20/19 | 261,899 | ||
| 266,000 | Bank of America Corp., 5.125%, 11/15/14(c) | 275,786 | ||
| 161,000 | Bank of America Corp., 5.750%, 12/1/17 | 164,867 | ||
| 65,000 | Bank of America Corp., 7.625%, 6/1/19 | 75,195 |
| Continued | ||||
13
Table of Contents
BB&T Total Return Bond VIF
Schedule of Portfolio Investments — (continued)
December 31, 2009
| Principal Amount | Fair Value | |||||
| CORPORATE BONDS — (continued) | |||||
Financials — (continued) | ||||||
| $ | 210,000 | Bear Stearns Cos., LLC (The), 7.250%, 2/1/18(c) | $ | 241,049 | ||
| 74,000 | Caterpillar Financial Services Corp., MTN, 7.150%, 2/15/19 | 85,573 | ||||
| 105,000 | Credit Suisse, New York, 5.300%, 8/13/19 | 107,832 | ||||
| 158,000 | ERP Operating LP REIT, 5.125%, 3/15/16 | 154,022 | ||||
| 30,000 | GATX Financial Corp., 5.125%, 4/15/10 | 30,218 | ||||
| 348,000 | General Electric Capital Corp., MTN, 6.875%, 1/10/39 | 359,374 | ||||
| 101,000 | Goldman Sachs Group, Inc. (The), 7.500%, 2/15/19 | 117,746 | ||||
| 148,000 | Goldman Sachs Group, Inc. (The), 6.125%, 2/15/33(c) | 148,626 | ||||
| 96,000 | Goldman Sachs Group, Inc. (The), 6.750%, 10/1/37 | 98,677 | ||||
| 190,000 | Hyundai Capital Services, Inc., 6.000%, 5/5/15(b) | 198,391 | ||||
| 162,000 | Merrill Lynch & Co., Inc., MTN, 6.875%, 4/25/18 | 174,545 | ||||
| 115,000 | MetLife, Inc., 6.750%, 6/1/16 | 128,782 | ||||
| 273,000 | Morgan Stanley, MTN, Series F, 6.625%, 4/1/18(c) | 295,159 | ||||
| 177,000 | Prudential Financial, Inc., MTN, Series B, 5.100%, 9/20/14 | 184,546 | ||||
| 113,000 | Simon Property Group LP REIT, 6.750%, 5/15/14 | 120,422 | ||||
| 114,000 | Wachovia Corp., 5.625%, 10/15/16 | 116,564 | ||||
| 194,000 | Wells Fargo & Co., 5.625%, 12/11/17(c) | 201,790 | ||||
| 3,794,501 | ||||||
Health Care (0.7%) | ||||||
| 90,000 | Laboratory Corp. of America | 94,099 | ||||
| 60,000 | Zimmer Holdings, Inc., 5.750%, 11/30/39 | 58,818 | ||||
| 152,917 | ||||||
Industrials (3.4%) | ||||||
| 186,000 | Allied Waste North America, Inc., 6.875%, 6/1/17(c) | 197,392 | ||||
| 240,000 | Corrections Corp. of America, 6.250%, 3/15/13(c) | 241,200 | ||||
| 60,000 | Goodrich (BF) Corp., 6.290%, 7/1/16 | 64,363 | ||||
| 110,000 | L-3 Communications Corp., 5.875%, 1/15/15 | 109,863 | ||||
| 142,000 | Roper Industries, Inc., 6.250%, 9/1/19 | 147,831 | ||||
| 760,649 | ||||||
Information Technology (2.4%) | ||||||
| 45,000 | Agilent Technologies, Inc., 5.500%, 9/14/15 | 47,169 | ||||
| 75,000 | CA, Inc., 5.375%, 12/1/19 | 75,421 | ||||
| 107,000 | Fiserv, Inc., 6.125%, 11/20/12 | 116,509 | ||||
| 269,000 | Xerox Corp., 6.350%, 5/15/18 | 280,602 | ||||
| 519,701 | ||||||
Materials (2.1%) | ||||||
| 225,000 | ArcelorMittal, 9.850%, 6/1/19 | 291,015 | ||||
| 118,000 | International Paper Co., 7.300%, 11/15/39 | 125,182 | ||||
| 35,000 | Valspar Corp., 7.250%, 6/15/19 | 38,408 | ||||
| 454,605 | ||||||
Telecommunication Services (2.8%) | ||||||
| 103,000 | America Movil SAB de CV, 6.375%, 3/1/35 | 106,325 | ||||
| 109,000 | AT&T, Inc., 6.400%, 5/15/38(c) | 112,016 | ||||
| Principal Amount | Fair Value | |||||
| CORPORATE BONDS — (continued) | |||||
Telecommunication Services — (continued) | ||||||
| $ | 58,000 | Telecom Italia Capital SA, 7.175%, 6/18/19 | $ | 64,662 | ||
| 100,000 | Telecom Italia Capital SA, 7.721%, 6/4/38 | 115,133 | ||||
| 51,000 | Verizon Communications, Inc., 6.350%, 4/1/19 | 56,265 | ||||
| 146,000 | Verizon Communications, Inc., 7.350%, 4/1/39 | 169,376 | ||||
| 623,777 | ||||||
Utilities (0.7%) | ||||||
| 144,000 | Ohio Power Co., Series K, 6.000%, 6/1/16 | 152,664 | ||||
Total Corporate Bonds | 8,270,777 | |||||
| MORTGAGE-BACKED SECURITIES (35.7%) | |||||
Fannie Mae(d) (19.2%) | ||||||
| 17,666 | 4.500%, 10/1/18, Pool #752030 | 18,414 | ||||
| 12,408 | 5.500%, 11/1/20, Pool #843972 | 13,212 | ||||
| 8,324 | 5.500%, 12/1/20, Pool #831138 | 8,863 | ||||
| 31,371 | 5.500%, 5/1/21, Pool #895628 | 33,404 | ||||
| 33,005 | 5.500%, 6/1/21, Pool #831526 | 35,021 | ||||
| 174,585 | 5.500%, 4/1/22, Pool #914937 | 185,000 | ||||
| 118,952 | 5.000%, 12/1/22, Pool #967350 | 124,506 | ||||
| 368,655 | 5.000%, 5/1/23, Pool #976197 | 385,672 | ||||
| 39,806 | 5.000%, 10/1/25, Pool #255894 | 41,273 | ||||
| 40,683 | 5.500%, 2/1/27, Pool #256600 | 42,956 | ||||
| 188,998 | 5.500%, 1/1/34, Pool #757571 | 198,644 | ||||
| 33,567 | 6.000%, 9/1/34, Pool #790912 | 35,801 | ||||
| 48,308 | 6.500%, 9/1/34, Pool #796569 | 52,007 | ||||
| 19,116 | 7.000%, 6/1/35, Pool #255820 | 20,976 | ||||
| 85,250 | 5.000%, 11/1/35, Pool #842402 | 87,652 | ||||
| 18,236 | 5.500%, 2/1/36, Pool #256101 | 19,156 | ||||
| 234,405 | 6.000%, 6/1/36, Pool #886959 | 248,982 | ||||
| 50,814 | 5.500%, 12/1/36, Pool #922224 | 53,289 | ||||
| 223,078 | 5.500%, 12/1/36, Pool #928043 | 233,942 | ||||
| 48,763 | 6.000%, 12/1/36, Pool #902054 | 51,796 | ||||
| 119,178 | 5.500%, 1/1/37, Pool #256552 | 124,982 | ||||
| 46,800 | 6.000%, 1/1/37, Pool #906095 | 49,710 | ||||
| 91,059 | 5.000%, 3/1/37, Pool #911395 | 93,553 | ||||
| 44,341 | 6.000%, 4/1/37, Pool #914725 | 47,036 | ||||
| 65,930 | 6.000%, 7/1/37, Pool #256800 | 69,937 | ||||
| 476,877 | 6.500%, 7/1/37, Pool #941315 | 511,227 | ||||
| 267,455 | 5.500%, 9/1/37, Pool #888638 | 280,271 | ||||
| 239,058 | 6.000%, 9/1/37, Pool #952420 | 253,588 | ||||
| 11,302 | 6.000%, 9/1/37, Pool #955005 | 11,989 | ||||
| 326,357 | 4.832%, 7/1/38, Pool #981430* | 341,448 | ||||
| 78,388 | 5.500%, 7/1/38, Pool #934323 | 82,144 | ||||
| 179,342 | 6.000%, 5/1/39, Pool #935238 | 190,102 | ||||
| 274,619 | 6.000%, 9/1/39, Pool #AD0132 | 291,310 | ||||
| 4,237,863 | ||||||
Freddie Mac(d) (10.7%) | ||||||
| 51,143 | 6.000%, 10/1/19, Pool #G11679 | 54,658 | ||||
| 25,257 | 5.500%, 10/1/21, Pool #G12425 | 26,807 | ||||
| 46,428 | 5.000%, 1/1/22, Pool #J04202 | 48,610 | ||||
| 72,926 | 5.000%, 5/1/22, Pool #J04788 | 76,353 | ||||
| 177,488 | 5.000%, 8/1/22, Pool #J05384 | 185,830 | ||||
| 172,037 | 5.500%, 12/1/22, Pool #G13665 | 182,596 | ||||
| 228,192 | 5.500%, 1/1/23, Pool #G12966 | 241,735 | ||||
| 236,183 | 6.000%, 11/1/23, Pool #G13325 | 252,143 | ||||
| 27,794 | 5.500%, 7/1/35, Pool #A36540 | 29,221 | ||||
| 14,307 | 6.000%, 7/1/35, Pool #A36304 | 15,233 | ||||
| 15,340 | 5.500%, 12/1/35, Pool #A40359 | 16,128 | ||||
| 44,027 | 5.500%, 2/1/36, Pool #G08111 | 46,205 | ||||
| Continued |
14
Table of Contents
BB&T Total Return Bond VIF
Schedule of Portfolio Investments — (continued)
December 31, 2009
| Principal Amount | Fair Value | |||||
| MORTGAGE-BACKED SECURITIES — (continued) | |||||
Freddie Mac(d) — (continued) | ||||||
| $ | 25,559 | 5.500%, 4/1/36, Pool #A44445 | $ | 26,823 | ||
| 105,264 | 6.000%, 9/1/36, Pool #A52325 | 111,909 | ||||
| 17,054 | 5.500%, 12/1/36, Pool #A80368 | 17,898 | ||||
| 94,405 | 5.878%, 12/1/36, Pool #1J1390* | 100,277 | ||||
| 68,509 | 5.500%, 4/1/37, Pool #G08192 | 71,845 | ||||
| 46,199 | 6.000%, 4/1/37, Pool #A58853 | 49,072 | ||||
| 39,460 | 5.000%, 6/1/37, Pool #G03094 | 40,511 | ||||
| 40,973 | 5.729%, 9/1/37, Pool #1Q0319* | 43,533 | ||||
| 147,421 | 6.500%, 12/1/37, Pool #A69955 | 157,939 | ||||
| 24,473 | 5.500%, 1/1/38, Pool #A71523 | 25,665 | ||||
| 73,558 | 5.242%, 4/1/38, Pool #783255* | 77,331 | ||||
| 189,750 | 5.500%, 6/1/38, Pool #A77678 | 198,980 | ||||
| 134,708 | 5.500%, 7/1/38, Pool #A78982 | 141,261 | ||||
| 60,484 | 5.500%, 7/1/38, Pool #G04388 | 63,426 | ||||
| 51,516 | 6.000%, 9/1/38, Pool #A81453 | 54,677 | ||||
| 2,356,666 | ||||||
Ginnie Mae (5.8%) | ||||||
| 245,268 | 5.500%, 9/15/38, Pool #782405 | 257,296 | ||||
| 187,000 | 5.000%, 1/15/39(e) | 192,289 | ||||
| 449,173 | 5.500%, 1/15/39, Pool #646685 | 471,161 | ||||
| 181,969 | 5.500%, 1/15/39, Pool #692307 | 190,876 | ||||
| 160,000 | 5.500%, 1/15/40(e) | 167,600 | ||||
| 1,279,222 | ||||||
Total Mortgage-Backed Securities | 7,873,751 | |||||
| MUNICIPAL BONDS (6.1%) | |||||
California (3.0%) | ||||||
| 230,000 | California State, Refunding G.O., Taxable, 6.200%, 10/1/19 | 223,914 | ||||
| 190,000 | California State, Water Utility Improvements G.O., Taxable, 5.450%, 4/1/15 | 191,110 | ||||
| 30,000 | Los Angeles Harbor Department, Crossover Refunding Revenue, Series A, Callable 8/1/12 | |||||
@ 100 (AMBAC), 5.500%, 8/1/14 | 31,670 | |||||
| 220,000 | Metropolitan Water District of Southern California, Water Utility Improvements Revenue, Callable 7/1/19 @ 100, 6.538%, 7/1/39 | 223,073 | ||||
| 669,767 | ||||||
District of Columbia (0.4%) | ||||||
| 70,000 | Metropolitan Washington Airports Authority, Refunding Revenue Bonds, Series D (NATL-RE), 5.000%, 10/1/11 | 74,169 | ||||
Florida (0.6%) | ||||||
| 135,000 | Greater Orlando Aviation Authority, FL, Port, Airport & Marina Improvements Revenue, Series A, Callable 2/1/10 @ 101 (NATL-RE FGIC), 5.250%, 10/1/12 | 136,658 | ||||
Iowa (0.8%) | ||||||
| 250,000 | Iowa Student Loan Liquidity Corporation, Student Loan Revenue Bonds, Series E, Taxable, Callable 1/11/10 @ 100 (AMBAC, GTD STD LNS), 0.000%, 12/1/31*(a)(f) | 182,500 | ||||
| Principal Amount | Fair Value | |||||
MUNICIPAL BONDS — (continued) | ||||||
New Jersey (1.0%) | ||||||
| $300,000 | Higher Education Student Assistance Authority, NJ, Student Loan Revenue, Series A, Callable 1/14/10 @ 100 (NATL-RE, GTD STD LNS), 0.718%, 6/1/36*(a)(f) | $ | 210,000 | |||
New York (0.3%) | ||||||
| 70,000 | New York & New Jersey Port Authority, Port, Airport & Marina Improvements Revenue, Series 122, Callable 2/1/10 @ 100.50 (General Obligation of Authority), 5.500%, 7/15/15 | 70,460 | ||||
Total Municipal Bonds | 1,343,554 | |||||
U.S. GOVERNMENT AGENCIES (0.1%) | ||||||
Fannie Mae (0.1%) | ||||||
| 26,000 | 4.125%, 4/15/14 | 27,652 | ||||
Total U.S. Government Agencies | 27,652 | |||||
U.S. TREASURY NOTES (0.4%) |
| |||||
| 42,000 | 3.750%, 11/15/18 | 41,997 | ||||
| 50,000 | 4.500%, 5/15/38(c) | 48,961 | ||||
Total U.S. Treasury Notes | 90,958 | |||||
FOREIGN GOVERNMENT BONDS (0.8%) |
| |||||
Qatar (0.8%) | ||||||
| 160,000 | Qatar Government International Bond, 4.000%, 1/20/15(b) | 160,400 | ||||
Total Foreign Government Bonds | 160,400 | |||||
| Shares | ||||||
INVESTMENT COMPANY (0.1%) |
| |||||
| 26,025 | Federated Treasury Obligations Fund, Institutional Shares | 26,025 | ||||
Total Investment Company | 26,025 | |||||
| Principal Amount | ||||||
SHORT TERM INVESTMENTS (0.0%) |
| |||||
| $17,758 | BNY Institutional Cash Reserve, Series B | 3,463 | ||||
Total Short Term Investments | 3,463 | |||||
Total Investments — 102.5% | 22,604,699 | |||||
Net Other Assets (Liabilities) — (2.5)% | (542,445 | ) | ||||
NET ASSETS — 100.0% | $ | 22,062,254 | ||||
| * | The interest rate for this variable rate note, which will change periodically, is |
| Continued |
15
Table of Contents
BB&T Total Return Bond VIF
Schedule of Portfolio Investments — (continued)
December 31, 2009
| based either on the prime rate or an index of market rates. The reflected rate is in effect as of December 31, 2009. The maturity date reflected is the final maturity date. |
| (a) | Illiquid. |
| (b) | Rule 144A, Section 4(2) or other security which is restricted as to resale to institutional investors. The Investment Advisor, using board approved procedures, has deemed these securities or a portion of these securities to be liquid. |
| (c) | Represents that all or a portion of the security was pledged as collateral for securities purchased on a when-issued basis. |
| (d) | On September 7, 2008, the Federal Housing Finance Agency (FHFA) placed Fannie Mae and Freddie Mac into conservatorship with FHFA as the conservator. The conservatorship is a statutory process designed to stabilize a troubled institution with the objective of returning the entities to normal business operations. |
| (e) | Represents securities purchase on a when-issued basis. At December 31, 2009, total cost of investment purchased on a when-issued basis was $365,399. |
| (f) | Security was fair valued under methods approved by the Board of Trustees. |
AMBAC — American Municipal Bond Insurance Corp.
FGIC — Financial Guaranty Insurance Corp.
G.O. — General Obligation
GTD STD LNS — Guaranteed Student Loans
MTN — Medium Term Note
NATL — National
RE — Reinsurance
REIT — Real Estate Investment Trust
STEP — Step Coupon Bond
| See accompanying notes to the financial statements. |
16
Table of Contents
(This page has been left blank intentionally.)
Table of Contents
Statements of Assets and Liabilities
December 31, 2009
| BB&T Large Cap VIF | BB&T Mid Cap Growth VIF | BB&T Capital Manager Equity VIF | BB&T Special Opportunities Equity VIF | BB&T Total Return Bond VIF | |||||||||||||||
Assets: | |||||||||||||||||||
Investments: | |||||||||||||||||||
Investments-unaffiliated, at cost | $ | 29,210,142 | $ | 7,289,949 | $ | 2,851,901 | $ | 33,856,442 | $ | 21,914,884 | |||||||||
Investments-affiliated, at cost | — | — | 6,062,644 | — | — | ||||||||||||||
Total investments, at cost* | 29,210,142 | 7,289,949 | 8,914,545 | 33,856,442 | 21,914,884 | ||||||||||||||
Unrealized appreciation (depreciation) | 2,876,738 | 2,231,418 | (964,856 | ) | 5,556,866 | 689,815 | |||||||||||||
Investments, at value | 32,086,880 | 9,521,367 | 7,949,689 | 39,413,308 | 22,604,699 | ||||||||||||||
Cash | — | — | — | — | 3,015 | ||||||||||||||
Interest and dividends receivable | 61,698 | 6,364 | 22,084 | 40,708 | 182,753 | ||||||||||||||
Receivable for investments sold | — | — | — | — | 41,714 | ||||||||||||||
Receivable for capital shares issued | 51,212 | 8,592 | — | 892,598 | — | ||||||||||||||
Receivable from Advisor | — | — | 8 | — | — | ||||||||||||||
Prepaid and other assets | 22,720 | 5,061 | 5,466 | 23,634 | 16,203 | ||||||||||||||
Total Assets | 32,222,510 | 9,541,384 | 7,977,247 | 40,370,248 | 22,848,384 | ||||||||||||||
Liabilities: | |||||||||||||||||||
Call options written (premiums received $ — , $ — , $ — , $81,688 and $ — , respectively) | — | — | — | 102,750 | — | ||||||||||||||
Payable for investments purchased | — | — | — | — | 366,407 | ||||||||||||||
Payable for capital shares redeemed | 2,154 | 49,785 | 19,521 | — | 364,076 | ||||||||||||||
Payable for collateral received on loaned securities | — | 334,495 | — | — | — | ||||||||||||||
Payable to securities lending agent | 29,800 | — | — | 37,343 | 17,758 | ||||||||||||||
Accrued expenses: | |||||||||||||||||||
Investment advisory fees | 13,765 | 4,262 | — | 23,125 | 3,484 | ||||||||||||||
Administration fees | 2,750 | 853 | — | 3,158 | 1,980 | ||||||||||||||
Audit fees | 32,082 | 11,779 | 7,713 | 32,535 | 22,592 | ||||||||||||||
Compliance service fees | 33 | 13 | 8 | 32 | 22 | ||||||||||||||
Trustee fees | 4 | — | — | 1 | 1 | ||||||||||||||
Printing fees | 7,129 | 1,165 | 1,097 | 4,477 | 3,643 | ||||||||||||||
Other fees | 11,101 | 3,565 | 2,187 | 4,900 | 6,167 | ||||||||||||||
Total Liabilities | 98,818 | 405,917 | 30,526 | 208,321 | 786,130 | ||||||||||||||
Net Assets: | $ | 32,123,692 | $ | 9,135,467 | $ | 7,946,721 | $ | 40,161,927 | $ | 22,062,254 | |||||||||
Net Assets Consist of: | |||||||||||||||||||
Capital | $ | 53,836,704 | $ | 12,860,528 | $ | 14,155,240 | $ | 37,703,591 | $ | 21,088,193 | |||||||||
Accumulated undistributed net investment income | 2,646 | — | 24,675 | 23,776 | 247,723 | ||||||||||||||
Accumulated realized gains (losses) from investments and written options | (24,592,396 | ) | (5,956,479 | ) | (5,268,338 | ) | (3,101,244 | ) | 36,523 | ||||||||||
Net unrealized appreciation/(depreciation) on investments and written options | 2,876,738 | 2,231,418 | (964,856 | ) | 5,535,804 | 689,815 | |||||||||||||
Net Assets | $ | 32,123,692 | $ | 9,135,467 | $ | 7,946,721 | $ | 40,161,927 | $ | 22,062,254 | |||||||||
Shares of Beneficial Interest Outstanding (unlimited number of shares authorized, no par value) | 4,219,843 | 1,036,416 | 1,347,814 | 2,810,504 | 2,126,547 | ||||||||||||||
Net Asset Value — offering and redemption price per share | $ | 7.61 | $ | 8.81 | $ | 5.90 | $ | 14.29 | $ | 10.37 | |||||||||
| * | The BB&T Mid Cap Growth VIF includes securities on loan of $324,671. |
See accompanying notes to the financial statements.
18
Table of Contents
BB&T Variable Insurance Funds
Statements of Operations
For the Year Ended December 31, 2009
| BB&T Large Cap VIF | BB&T Mid Cap Growth VIF | BB&T Capital Manager Equity VIF | BB&T Special Opportunities Equity VIF | BB&T Total Return Bond VIF | ||||||||||||||||
Investment Income: | ||||||||||||||||||||
Interest income | $ | — | $ | — | $ | — | $ | — | $ | 1,113,012 | ||||||||||
Dividend income - unaffiliated | 631,047 | 66,255 | 62,192 | 330,761 | 842 | |||||||||||||||
Dividend income - affiliated | — | — | 60,063 | — | — | |||||||||||||||
Foreign tax withholding | (2,469 | ) | (885 | ) | — | (16,846 | ) | — | ||||||||||||
Income from securities lending | 428 | 11,243 | — | 1,074 | 65 | |||||||||||||||
Total investment income | 629,006 | 76,613 | 122,255 | 314,989 | 1,113,919 | |||||||||||||||
Expenses: | ||||||||||||||||||||
Investment advisory fees (See Note 4) | 231,501 | 83,801 | 18,848 | 256,525 | 132,859 | |||||||||||||||
Administration fees (See Note 4) | 31,546 | 11,484 | — | 32,351 | 22,364 | |||||||||||||||
Audit fees | 29,904 | 8,926 | 7,277 | 36,104 | 34,463 | |||||||||||||||
Compliance service fees (See Note 4) | 354 | 131 | 86 | 359 | 252 | |||||||||||||||
Custodian fees | 1,186 | 3,293 | 134 | 2,500 | 1,484 | |||||||||||||||
Fund accounting fees (See Note 4) | 3,128 | 1,132 | 754 | 3,207 | 2,214 | |||||||||||||||
Insurance fees | 30,638 | 14,167 | 7,015 | 21,090 | 15,641 | |||||||||||||||
Legal fees | 27,357 | 9,661 | 5,977 | 26,819 | 20,573 | |||||||||||||||
Printing fees | 14,394 | 5,257 | 3,225 | 13,197 | 11,216 | |||||||||||||||
Transfer agent fees (See Note 4) | 10,435 | 3,804 | 2,502 | 10,537 | 7,465 | |||||||||||||||
Trustee fees | 2,156 | 777 | 511 | 2,061 | 1,504 | |||||||||||||||
Other fees | 5,675 | 18,995 | 3,429 | 7,416 | 24,220 | |||||||||||||||
Total expenses before waivers | 388,274 | 161,428 | 49,758 | 412,166 | 274,255 | |||||||||||||||
Less expenses waived or reimbursed by the Investment Advisor (See Note 4) | (75,081 | ) | (41,130 | ) | (18,848 | ) | (8,352 | ) | (65,995 | ) | ||||||||||
Net expenses | 313,193 | 120,298 | 30,910 | 403,814 | 208,260 | |||||||||||||||
Net investment income (loss) | 315,813 | (43,685 | ) | 91,345 | (88,825 | ) | 905,659 | |||||||||||||
Realized/Unrealized Gains (Losses) on Investments, Futures Contracts and Written Options: | ||||||||||||||||||||
Net realized gains (losses) from: | ||||||||||||||||||||
Investment transactions - unaffiliated | (2,881,881 | ) | (2,766,996 | ) | (362,788 | ) | (714,218 | ) | 607,175 | |||||||||||
Investment transactions - affiliated | — | — | (1,659,087 | ) | — | — | ||||||||||||||
Distributions from affiliated funds | — | — | (2,343 | ) | — | — | ||||||||||||||
Futures contracts | — | — | — | — | (91,552 | ) | ||||||||||||||
Written Options | — | — | — | 234,616 | — | |||||||||||||||
Change in unrealized appreciation/depreciation on: | ||||||||||||||||||||
Investments | 7,480,460 | 5,448,758 | 3,540,237 | 12,392,096 | 407,793 | |||||||||||||||
Futures contracts | — | — | — | — | (7,651 | ) | ||||||||||||||
Written Options | — | — | — | (25,495 | ) | — | ||||||||||||||
Net realized/unrealized gains on investments, futures contracts and written options | 4,598,579 | 2,681,762 | 1,516,019 | 11,886,999 | 915,765 | |||||||||||||||
Change in net assets from operations | $ | 4,914,392 | $ | 2,638,077 | $ | 1,607,364 | $ | 11,798,174 | $ | 1,821,424 | ||||||||||
See accompanying notes to the financial statements.
19
Table of Contents
BB&T Variable Insurance Funds
Statements of Changes in Net Assets
| BB&T Large Cap VIF | BB&T Mid Cap Growth VIF | |||||||||||||||
| For the Year Ended December 31, 2009 | For the Year Ended December 31, 2008 | For the Year Ended December 31, 2009 | For the Year Ended December 31, 2008 | |||||||||||||
From Investment Activities: | ||||||||||||||||
Operations: | ||||||||||||||||
Net investment income (loss) | $ | 315,813 | $ | 921,379 | $ | (43,685 | ) | $ | (53,697 | ) | ||||||
Net realized gains (losses) from investments and distributions from affiliated funds | (2,881,881 | ) | (21,659,986 | ) | (2,766,996 | ) | (3,193,231 | ) | ||||||||
Change in unrealized appreciation/depreciation of investments, futures contracts and written options | 7,480,460 | (6,116,076 | ) | 5,448,758 | (11,790,950 | ) | ||||||||||
Change in net assets from operations | 4,914,392 | (26,854,683 | ) | 2,638,077 | (15,037,878 | ) | ||||||||||
Distributions to Shareholders: | ||||||||||||||||
Net investment income | (313,190 | ) | (921,328 | ) | — | — | ||||||||||
Net realized gains from investment transactions | — | (12,646,677 | ) | — | (4,536,802 | ) | ||||||||||
Change in net assets from shareholders distributions | (313,190 | ) | (13,568,005 | ) | — | (4,536,802 | ) | |||||||||
Capital Transactions: | ||||||||||||||||
Proceeds from shares issued | 378,413 | 757,706 | 374,914 | 1,884,461 | ||||||||||||
Distributions reinvested | 313,190 | 13,568,005 | — | 4,536,802 | ||||||||||||
Value of shares redeemed | (9,147,412 | ) | (25,096,108 | ) | (6,047,269 | ) | (8,063,186 | ) | ||||||||
Change in net assets from capital transactions | (8,455,809 | ) | (10,770,397 | ) | (5,672,355 | ) | (1,641,923 | ) | ||||||||
Change in net assets | (3,854,607 | ) | (51,193,085 | ) | (3,034,278 | ) | (21,216,603 | ) | ||||||||
Net Assets: | ||||||||||||||||
Beginning of year | 35,978,299 | 87,171,384 | 12,169,745 | 33,386,348 | ||||||||||||
End of year | $ | 32,123,692 | $ | 35,978,299 | $ | 9,135,467 | $ | 12,169,745 | ||||||||
Accumulated undistributed net investment income | $ | 2,646 | $ | 23 | $ | — | $ | — | ||||||||
Share Transactions: | ||||||||||||||||
Issued | 60,519 | 74,734 | 50,915 | 158,834 | ||||||||||||
Reinvested | 50,035 | 1,571,115 | — | 425,991 | ||||||||||||
Redeemed | (1,433,681 | ) | (2,468,697 | ) | (777,503 | ) | (647,597 | ) | ||||||||
Change in Shares | (1,323,127 | ) | (822,848 | ) | (726,588 | ) | (62,772 | ) | ||||||||
See accompanying notes to the financial statements.
20
Table of Contents
BB&T Variable Insurance Funds
Statements of Changes in Net Assets
| BB&T Capital Manager Equity VIF | BB&T Special Opportunities Equity VIF | BB&T Total Return Bond VIF | |||||||||||||||||||
| For the Year Ended December 31, 2009 | For the Year Ended December 31, 2008 | For the Year Ended December 31, 2009 | For the Year Ended December 31, 2008 | For the Year Ended December 31, 2009 | For the Year Ended December 31, 2008 | ||||||||||||||||
| $ | 91,345 | $ | 158,507 | $ | (88,825 | ) | $ | 47,029 | $ | 905,659 | $ | 800,840 | |||||||||
| (2,024,218) | (3,000,889 | ) | (479,602 | ) | (1,430,745 | ) | 515,623 | (282,156 | ) | ||||||||||||
| 3,540,237 | (3,419,265 | ) | 12,366,601 | (12,504,758 | ) | 400,142 | 86,113 | ||||||||||||||
| 1,607,364 | (6,261,647 | ) | 11,798,174 | (13,888,474 | ) | 1,821,424 | 604,797 | ||||||||||||||
| (64,463) | (182,681 | ) | — | (47,020 | ) | (885,440 | ) | (803,726 | ) | ||||||||||||
| — | (3,211,624 | ) | (1,073,282 | ) | (1,229,604 | ) | — | — | |||||||||||||
| (64,463) | (3,394,305 | ) | (1,073,282 | ) | (1,276,624 | ) | (885,440 | ) | (803,726 | ) | |||||||||||
| 108,008 | 659,807 | 8,823,846 | 9,492,235 | 6,016,047 | 11,509,087 | ||||||||||||||||
| 64,463 | 3,394,305 | 1,073,282 | 1,276,625 | 885,440 | 803,726 | ||||||||||||||||
| (2,296,851) | (4,364,667 | ) | (7,143,652 | ) | (4,539,850 | ) | (6,771,543 | ) | (5,181,198 | ) | |||||||||||
| (2,124,380) | (310,555 | ) | 2,753,476 | 6,229,010 | 129,944 | 7,131,615 | |||||||||||||||
| (581,479) | (9,966,507 | ) | 13,478,368 | (8,936,088 | ) | 1,065,928 | 6,932,686 | ||||||||||||||
| 8,528,200 | 18,494,707 | 26,683,559 | 35,619,647 | 20,996,326 | 14,063,640 | ||||||||||||||||
| $ | 7,946,721 | $ | 8,528,200 | $ | 40,161,927 | $ | 26,683,559 | $ | 22,062,254 | $ | 20,996,326 | ||||||||||
| $24,675 | $ | 136 | $ | 23,776 | $ | 9 | $ | 247,723 | $ | 210,356 | |||||||||||
| 24,605 | 92,711 | 704,058 | 638,272 | 591,456 | 1,158,126 | ||||||||||||||||
| 11,466 | 526,651 | 80,516 | 88,168 | 87,393 | 81,352 | ||||||||||||||||
| (483,790) | (613,433 | ) | (573,467 | ) | (348,611 | ) | (665,610 | ) | (529,896 | ) | |||||||||||
| (447,719) | 5,929 | 211,107 | 377,829 | 13,239 | 709,582 | ||||||||||||||||
See accompanying notes to the financial statements.
21
Table of Contents
BB&T Variable Insurance Funds
Financial Highlights
Selected data for a share of beneficial interest outstanding throughout the years indicated.
| Investment Activities | Distributions | ||||||||||||||
| Net Asset Value, Beginning of Year | Net investment income (loss) | Net realized/ unrealized gains (losses) on investments | Total from Investment Activities | Net investment income | Net realized gains on investments | Total Distributions | |||||||||
BB&T Large Cap VIF | |||||||||||||||
Year Ended December 31, 2009 | $ | 6.49 | 0.07(c) | 1.12 | 1.19 | (0.07) | — | (0.07) | |||||||
Year Ended December 31, 2008 | $ | 13.69 | 0.16(c) | (4.63) | (4.47) | (0.16) | (2.57) | (2.73) | |||||||
Year Ended December 31, 2007 | $ | 16.75 | 0.23 | (1.08) | (0.85) | (0.31) | (1.90) | (2.21) | |||||||
Year Ended December 31, 2006 | $ | 14.00 | 0.27 | 2.68 | 2.95 | (0.20) | — | (0.20) | |||||||
Year Ended December 31, 2005 | $ | 13.35 | 0.26 | 0.65 | 0.91 | (0.26) | — | (0.26) | |||||||
BB&T Mid Cap Growth VIF | |||||||||||||||
Year Ended December 31, 2009 | $ | 6.90 | (0.03)(c) | 1.94 | 1.91 | — | — | — | |||||||
Year Ended December 31, 2008 | $ | 18.29 | (0.03)(c) | (8.40) | (8.43) | — | (2.96) | (2.96) | |||||||
Year Ended December 31, 2007 | $ | 15.16 | (0.03) | 5.09 | 5.06 | — (d) | (1.93) | (1.93) | |||||||
Year Ended December 31, 2006 | $ | 15.67 | 0.03 | 0.44 | 0.47 | (0.07) | (0.91) | (0.98) | |||||||
Year Ended December 31, 2005 | $ | 13.70 | (0.04) | 2.01 | 1.97 | — | — | — | |||||||
BB&T Capital Manager Equity VIF(e) | |||||||||||||||
Year Ended December 31, 2009 | $ | 4.75 | 0.06(c) | 1.14 | 1.20 | (0.05) | — | (0.05) | |||||||
Year Ended December 31, 2008 | $ | 10.33 | 0.09(c) | (3.50) | (3.41) | (0.10) | (2.07) | (2.17) | |||||||
Year Ended December 31, 2007 | $ | 11.65 | 0.25 | — (d) | 0.25 | (0.30) | (1.27) | (1.57) | |||||||
Year Ended December 31, 2006 | $ | 10.51 | 0.16 | 1.45 | 1.61 | (0.12) | (0.35) | (0.47) | |||||||
Year Ended December 31, 2005 | $ | 9.99 | 0.17 | 0.50 | 0.67 | (0.15) | — | (0.15) | |||||||
BB&T Special Opportunities Equity VIF | |||||||||||||||
Year Ended December 31, 2009 | $ | 10.27 | (0.03)(c) | 4.47 | 4.44 | — | (0.42) | (0.42) | |||||||
Year Ended December 31, 2008 | $ | 16.03 | 0.02(c) | (5.28) | (5.26) | (0.02) | (0.48) | (0.50) | |||||||
Year Ended December 31, 2007 | $ | 15.07 | (0.02) | 2.02 | 2.00 | — | (1.04) | (1.04) | |||||||
Year Ended December 31, 2006 | $ | 12.70 | (0.02) | 3.07 | 3.05 | (0.01) | (0.67) | (0.68) | |||||||
Year Ended December 31, 2005 | $ | 12.12 | (0.03) | 0.79 | 0.76 | — | (0.18) | (0.18) | |||||||
BB&T Total Return Bond VIF | |||||||||||||||
Year Ended December 31, 2009 | $ | 9.94 | 0.41(c) | 0.42 | 0.83 | (0.40) | — | (0.40) | |||||||
Year Ended December 31, 2008 | $ | 10.02 | 0.41(c) | (0.08) | 0.33 | (0.41) | — | (0.41) | |||||||
Year Ended December 31, 2007 | $ | 9.83 | 0.31 | 0.31 | 0.62 | (0.43) | — | (0.43) | |||||||
Year Ended December 31, 2006 | $ | 9.92 | 0.50 | (0.17) | 0.33 | (0.42) | — | (0.42) | |||||||
Year Ended December 31, 2005 | $ | 10.08 | 0.33 | (0.10) | 0.23 | (0.36) | (0.03) | (0.39) | |||||||
| (a) | Total return ratios assume reinvestment of distributions at net asset value. |
Total return ratios do not reflect charges pursuant to the terms of the insurance contracts funded by separate accounts that invest in the Fund’s shares.
| (b) | During the period certain fees were reduced. If such reductions had not occurred, the ratios would have been as indicated. |
| (c) | Per share net investment income (loss) has been calculated using the average daily shares method. |
| (d) | Amount is less than $0.005. |
| (e) | The expense ratios exclude the impact of fees/expenses paid by each underlying fund. |
See accompanying notes to the financial statements.
22
Table of Contents
| Ratios/Supplemental Data | |||||||||||||||
Net Asset Value, End of Year | Total Return(a) | Net Assets, End of Year (000) | Ratio of net expenses to average net assets | Ratio of net investment income (loss) to average net assets | Ratio of expenses to average net assets(b) | Portfolio turnover rate | |||||||||
| $ | 7.61 | 18.50 | % | $ | 32,124 | 1.00% | 1.01% | 1.24% | 137.52% | ||||||
| $ | 6.49 | (37.43 | )% | $ | 35,978 | 0.81% | 1.52% | 1.16% | 49.73% | ||||||
| $ | 13.69 | (5.87 | )% | $ | 87,171 | 0.77% | 1.50% | 1.08% | 52.81% | ||||||
| $ | 16.75 | 21.28 | % | $ | 93,143 | 0.77% | 1.72% | 1.01% | 45.76% | ||||||
| $ | 14.00 | 6.90 | % | $ | 113,648 | 0.79% | 1.95% | 1.05% | 21.76% | ||||||
| $ | 8.81 | 27.68 | % | $ | 9,135 | 1.06% | (0.39)% | 1.43% | 186.48% | ||||||
| $ | 6.90 | (51.78 | )% | $ | 12,170 | 0.84% | (0.23)% | 1.17% | 205.82% | ||||||
| $ | 18.29 | 35.02 | % | $ | 33,386 | 0.80% | (0.22)% | 1.05% | 127.76% | ||||||
| $ | 15.16 | 3.26 | % | $ | 25,460 | 0.78% | 0.25% | 1.02% | 160.04% | ||||||
| $ | 15.67 | 14.38 | % | $ | 39,090 | 0.78% | (0.28)% | 1.10% | 113.04% | ||||||
| $ | 5.90 | 25.24 | % | $ | 7,947 | 0.41% | 1.21% | 0.66% | 18.04% | ||||||
| $ | 4.75 | (38.22 | )% | $ | 8,528 | 0.31% | 1.15% | 0.59% | 61.04% | ||||||
| $ | 10.33 | 1.98 | % | $ | 18,495 | 0.18% | 2.27% | 0.51% | 40.70% | ||||||
| $ | 11.65 | 15.82 | % | $ | 18,222 | 0.17% | 1.15% | 0.54% | 20.55% | ||||||
| $ | 10.51 | 6.77 | % | $ | 28,722 | 0.26% | 1.68% | 0.55% | 3.24% | ||||||
| $ | 14.29 | 43.53 | % | $ | 40,162 | 1.26% | (0.28)% | 1.29% | 32.57% | ||||||
| $ | 10.27 | (33.71 | )% | $ | 26,684 | 1.10% | 0.14% | 1.18% | 35.80% | ||||||
| $ | 16.03 | 13.41 | % | $ | 35,620 | 1.06% | (0.16)% | 1.11% | 23.86% | ||||||
| $ | 15.07 | 24.71 | % | $ | 21,294 | 1.06% | (0.05)% | 1.06% | 59.93% | ||||||
| $ | 12.70 | 6.29 | % | $ | 31,768 | 1.23% | (0.28)% | 1.23% | 42.15% | ||||||
| $ | 10.37 | 8.57 | % | $ | 22,062 | 0.94% | 4.09% | 1.24% | 109.12% | ||||||
| $ | 9.94 | 3.38 | % | $ | 20,996 | 0.81% | 4.11% | 1.03% | 152.74% | ||||||
| $ | 10.02 | 6.47 | % | $ | 14,064 | 0.77% | 4.42% | 1.01% | 252.64% | ||||||
| $ | 9.83 | 3.47 | % | $ | 6,767 | 0.77% | 4.34% | 0.88% | 188.24% | ||||||
| $ | 9.92 | 2.29 | % | $ | 18,777 | 1.00% | 3.38% | 1.12% | 196.66% | ||||||
23
Table of Contents
Notes to Financial Statements
December 31, 2009
| 1. | Organization: |
The BB&T Variable Insurance Funds (the “Trust”) was organized on November 8, 2004, and is registered under the Investment Company Act of 1940, as amended (the “1940 Act”), as an open-end investment company established as a Massachusetts business trust. The Trust commenced operations on May 1, 2005 and presently offers shares of the BB&T Large Cap VIF, the BB&T Mid Cap Growth VIF, the BB&T Capital Manager Equity VIF, the BB&T Special Opportunities Equity VIF, and the BB&TTotal Return BondVIF (referred to individually as a “Fund” and collectively as the “Funds”). TheTrust is authorized to issue an unlimited number of shares of beneficial interest without par value. Shares of the Funds are offered through variable annuity contracts offered through the separate accounts of participating insurance companies. The BB&T Capital Manager Equity VIF invests primarily in underlying mutual funds as opposed to individual securities.
Under the Trust’s organizational documents, its Officers and Trustees are indemnified against certain liabilities arising out of the performance of their duties to the Trust. In addition, in the normal course of business, the Funds may enter into contracts with their vendors and others that provide for general indemnifications. The Funds’maximum exposure under these arrangements is unknown as this would involve future claims that may be made against the Funds. However, based on experience, the Funds expect that risk of loss to be remote.
On November 17, 2009, the Board of Trustees ( the “Board”) of the Trust approved the liquidation and termination of the BB&T Mid Cap Growth VIF. Accordingly, the assets of the Fund will be liquidated by February 1, 2010, or such other date as determined by the officers of the Fund. After paying all of its outstanding obligations, taxes, and other liabilities (accrued or contingent), the Fund will distribute to its shareholders their pro rata share of the proceeds.
| 2. | Significant Accounting Policies: |
The following is a summary of significant accounting policies followed by the Funds in the preparation of their financial statements. The policies are in conformity with United States generally accepted accounting principles (“GAAP”). The preparation of financial statements requires management to make estimates and assumptions that affect the reported amounts of assets and liabilities and disclosure of contingent assets and liabilities at the date of the financial statements and the reported amounts of income and expenses for the reporting period. Actual results could differ from those estimates.
Securities Valuation — Investments in common stocks, commercial paper, corporate bonds, municipal securities, U.S. Government securities, U.S. Government agency securities, futures and options, the principal market for which is a securities exchange or an over-the-counter market, are valued at their latest available sale price (except for those securities that are traded on NASDAQ, which will be valued at the NASDAQ official closing price) or in the absence of such a price, by reference to the latest available bid price in the principal market in which such securities are normally traded. The Funds may also use an independent pricing service approved by the Board to value certain securities, including through the use of electronic and matrix techniques. Short-term obligations without significant credit risk that mature in 60 days or less are valued at either amortized cost or original cost plus interest, which approximates current value. Investments in open-end investment companies, including the underlying Funds in which the BB&T Capital Manager Equity VIF invests, are valued at their respective net asset values as reported by such companies. Investments in closed-end investment companies are valued at their market values based upon the latest available sale price or, absent such a price, by reference to the latest available bid prices in the principal market in which such securities are normally traded. The differences between cost and fair values of investments are reflected as either unrealized appreciation or depreciation. Securities for which market quotations are not readily available or deemed unreliable (e.g., an approved pricing service does not provide a price, a furnished price is in error, certain stale prices, or an event that materially affects the furnished price) will be valued at fair value determined in good faith by the Pricing Committee under the general supervision of the Board. The following Funds had securities valued by the Pricing Committee as of December 31, 2009:
| Fair Value | Percentage of Net Assets | ||||
BB&T Special Opportunities Equity VIF | $ | 600 | 0.002% | ||
BB&T Total Return Bond VIF | 392,500 | 1.78% | |||
Recent Accounting Standard — In January 2010, the Financial Accounting Standards Board issued Accounting Standards Update (“ASU”) No. 2010-06 “Improving Disclosures about Fair Value Measurements”. ASU 2010-06 clarifies existing disclosure and requires additional disclosures regarding fair value measurements. Effective for interim and annual reporting periods beginning after December 15, 2009, entities will be required to disclose significant transfers into and out of Level
24
Table of Contents
BB&T Variable Insurance Funds
Notes to Financial Statements — (continued)
December 31, 2009
1 and 2 measurements in the fair value hierarchy and the reasons for those transfers. Effective for fiscal years beginning after December 15, 2010, and for interim periods within those fiscal years, entities will need to disclose information about purchases, sales, issuances and settlements of Level 3 securities on a gross basis, rather than as a net number as currently required. Management is currently evaluating the impact ASU No. 2010-06 will have on its financial statement disclosures.
Fair Value Measurements — The objective of a fair value measurement is to determine the price that would be received to sell an asset or paid to transfer a liability in an orderly transaction between market participants at the measurement date (an exit price). Accordingly, the fair value hierarchy gives the highest priority to quoted prices (unadjusted) in active markets for identical assets or liabilities (Level 1) and the lowest priority to unobservable inputs (Level 3). The three levels of the fair value hierarchy are described below:
| • | Level 1 – quoted prices in active markets for identical securities |
| • | Level 2 – other significant observable inputs (including quoted prices for similar securities, interest rates, prepayment speeds, credit risk, etc.) |
| • | Level 3 – significant unobservable inputs (including the Fund’s own assumptions in determining the fair value of investments) |
The inputs or methodology used for valuing securities are not necessarily an indication of the risk associated with investing in those securities.
The summary of inputs used to determine the fair valuation of the Fund’s investments as of December 31, 2009 is as follows:
Assets: Investments in Securities | Level 1– Quoted Prices (a) | Level 2– Other Significant Observable Inputs (b) | Level 3– Significant Unobservable Inputs | Total | ||||||||
BB&T Large Cap VIF | $ | 32,081,069 | $ | 5,811 | $ | — | $ | 32,086,880 | ||||
BB&T Mid Cap Growth VIF | 9,189,806 | 331,561 | — | 9,521,367 | ||||||||
BB&T Capital Manager Equity VIF | 7,949,689 | — | — | 7,949,689 | ||||||||
BB&T Special Opportunities Equity VIF | 39,406,026 | 7,282 | — | 39,413,308 | ||||||||
Liabilities: Other Financial Instruments—Written Options | ||||||||||||
BB&T Special Opportunities Equity VIF | $ | 102,150 | $ | 600 | $ | — | $ | 102,750 | ||||
| (a) | Industries or security types as disclosed in the Schedules of Portfolio Investments. |
| (b) | Represents securities held as collateral for securities on loan. |
BB&T Total Return Bond VIF Assets: Investments in Securities | Level 1– Quoted Prices | Level 2– Other Significant Observable Inputs | Level 3– Significant Unobservable Inputs | Total | ||||||||
Asset Backed Securities | $ | — | $ | 662,924 | $ | — | $ | 662,924 | ||||
Collateralized Mortgages Obligations | — | 2,387,702 | — | 2,387,702 | ||||||||
Commercial Mortgage-Backed Securities | — | 1,757,493 | — | 1,757,493 | ||||||||
Corporate Bonds | — | 8,270,777 | — | 8,270,777 | ||||||||
Mortgage-Backed Securities | — | 7,873,751 | — | 7,873,751 | ||||||||
Municipal Bonds | — | 951,054 | 392,500 | 1,343,554 | ||||||||
U.S. Government Agencies | — | 27,652 | — | 27,652 | ||||||||
U.S. Treasury Notes | — | 90,958 | — | 90,958 | ||||||||
Foreign Government Bonds | — | 160,400 | — | 160,400 | ||||||||
Investment Company | 26,025 | — | — | 26,025 | ||||||||
Short Term Investments | — | 3,463 | — | 3,463 | ||||||||
Total | $ | 26,025 | $ | 22,186,174 | $ | 392,500 | $ | 22,604,699 | ||||
25
Table of Contents
BB&T Variable Insurance Funds
Notes to Financial Statements — (continued)
December 31, 2009
Following is a reconciliation of Level 3 investments for which significant unobservable inputs were used to determine fair value:
Securities Held As Collateral for Securities on Loan: | BB&T Large Cap VIF | BB&T Mid Cap Growth VIF | BB&T Special Opportunities Equity VIF | BB&T Total Return Bond VIF | |||||||||||
Balance as of 01/01/09 (Fair value) | $ | 2,682 | $ | 2,206 | $ | 6,566 | $ | — | |||||||
Net purchases/(sales) | (2,682 | ) | (2,206 | ) | (6,566 | ) | — | ||||||||
Municipal Bonds: | |||||||||||||||
Balance as of 01/01/09 (Fair value) | — | — | — | 375,002 | |||||||||||
Change in unrealized appreciation/(depreciation)* | — | — | — | 17,498 | |||||||||||
Balance as of 12/31/09 (Fair value) | $ | — | $ | — | $ | — | $ | 392,500 | |||||||
| * | Included in “Change in unrealized appreciation/depreciation on investments” in the Statements of Operations. |
Security Transactions and Related Income — During the period, security transactions are accounted for no later than one business day after trade date. For financial reporting purposes, however, security transactions are accounted for on trade date of the last business day of the reporting period. Interest income is recognized on the accrual basis and includes, where applicable, the amortization/accretion of premium or discount. Dividend income is recorded on the ex-dividend date. Gains or losses realized from sales of securities are determined by comparing the identified cost of the security lot sold with the net sales proceeds.
When-Issued and Forward Commitments — The Funds may purchase securities on a “when-issued” basis. The Funds record when-issued securities on the trade date and pledge assets with a value at least equal to the purchase commitment for payment of the securities purchased. The value of the securities underlying when-issued or forward commitments to purchase securities, and any subsequent fluctuation in their value, is taken into account when determining the net asset value of the Funds commencing with the date the Funds agree to purchase the securities. The Funds do not accrue interest or dividends on “when-issued” securities until the underlying securities are received.
Repurchase Agreements and Collateralized Loan Agreements — The Funds may enter into agreements with member banks of the Federal Deposit Insurance Corporation and with registered broker/dealers that BB&T Asset Management, Inc. (“BB&T AM”) or a sub-advisor deemed creditworthy under guidelines approved by the Board, subject to the seller’s agreement to repurchase such securities at a mutually agreed-upon date and price. The repurchase price generally equals the price paid by the Fund plus interest negotiated on the basis of current short-term rates, which may be more or less than the rate on the underlying Fund securities. The seller, under these types of agreements is required to maintain the value of collateral held pursuant to the agreement at not less than the repurchase price (including accrued interest). Securities subject to repurchase are held by the Funds’ custodian, or another qualified custodian, or in the Federal Reserve/Treasury book-entry system. In the event of counterparty default, the Fund has the right to use the collateral to offset losses incurred. There is a potential for loss to the Fund in the event the Fund is delayed or prevented from exercising its rights to dispose of the collateral securities, including the risk of a possible decline in fair value of the underlying securities during the period while the Fund seeks to assert its rights. The Funds did not hold any repurchase agreements as of December 31, 2009.
Mortgage Dollar Rolls — The BB&T Total Return Bond VIF may sell mortgage-backed securities for delivery in the current month and simultaneously contract to repurchase substantially similar (same type, coupon and maturity) securities on a specific future date at an agreed-upon price. The market value of the securities that the Fund is required to purchase may decline below the agreed upon repurchase price of those securities. Pools of mortgages collateralizing those securities may have different prepayment histories than those sold. During the period between the sale and repurchase, the Fund will not be entitled to receive interest and principal payments on the securities sold. Proceeds of the sale will be invested in additional instruments for the Fund, and the income from these investments will generate income for the Fund. If such income does not exceed the income, capital appreciation and gain or loss that would have been realized on the securities sold as part of the dollar roll, the use of this technique will diminish the investment performance of the Fund compared with what the performance would have been without the use of dollar rolls. The Funds account for mortgage dollar roll transactions as purchases and sales.
26
Table of Contents
BB&T Variable Insurance Funds
Notes to Financial Statements — (continued)
December 31, 2009
Financial Futures Contracts — The Funds (excluding the BB&T Capital Manager Equity VIF) may invest in financial futures contracts and options on financial futures contracts to gain exposure to, or economically hedge against, changes in the value of equity securities (equity risk), interest rates (interest rate risk), or foreign currencies (foreign currency exchange rate risk). Upon entering into a financial futures contract, the Fund is required to pledge to the broker an amount of cash and/or other assets equal to a certain percentage of the contract amount (initial margin deposit). Subsequent payments, known as “variation margin,” are made or received by the Fund each day, depending on the daily fluctuations in the fair value of the underlying security. The Fund recognizes a gain or loss equal to the daily variation margin. Should market conditions move unexpectedly, the Fund may not achieve the anticipated benefits of the financial futures contracts and may realize a loss. The use of futures transactions involves the risk of imperfect correlation in movements in the price of futures contracts and the underlying hedged assets. Exchange traded financial futures contracts involve minimal counterparty risk since financial futures contracts are guaranteed against default by the exchange on which they trade. The BB&T Total Return Bond VIF may invest in futures contracts for economically hedging duration. The BB&T Total Return Bond VIF did not have any open futures contracts as of December 31, 2009 and had limited activity in these transactions during the year.
Option Contracts — The Funds may write (sell) “covered” call options and purchase options to close out options previously written by it. The Funds may buy put options for the purposes of hedging. These transactions may be entered into to hedge against changes in interest rates (interest rate risk), security prices (equity risk), currency fluctuations (foreign currency exchange rate risk), and other market developments, or for the purposes of earning additional income (i.e., speculation).
The risk associated with purchasing an option is that the Fund pays a premium whether or not the option is exercised.Additionally, the Funds bear the risk of loss of the premium and change in fair value should the counterparty not perform under the contract. Put and call options purchased are accounted for in the same manner as other securities owned. The cost of securities acquired through the exercise of call options is increased by the premiums paid. The proceeds from securities sold through the exercise of put options are decreased by the premiums paid.
In writing an option, the Funds contract with a specified counterparty to purchase (put option written) or sell (call option written) a specified quantity (notional amount) of an underlying asset at a specified price during a specified period upon demand of the counterparty. The risk associated with writing an option is that the Funds bear the market risk of an unfavorable change in the price of an underlying asset and may be required to buy or sell an underlying asset under the contractual terms of the option at a price different from the current fair value. The Funds may execute transactions in both listed and over-the-counter options. When purchasing over-the-counter options, the Fund bears the risk of economic loss from counterparty default, equal to the market value of the option. Listed options involve minimal counterparty risk since the listed options are guaranteed against default by the exchange on which they trade. Transactions in over-the-counter options may expose the Funds to the risk of default by the counterparty to the transaction. In the event of default by the counterparty to the over-the-counter transaction, the Funds maximum amount of loss is the premium paid (as the purchaser) or the unrealized loss of the contract (as the writer).
The BB&T Special Opportunities Equity VIF invested in written options to economically hedge the downside exposure by collecting a premium when sold against the equity holding. The options contracts listed below are also indicative of activity for the year ended December 31, 2009:
Covered Call Options | BB&T Special Opportunities Equity VIF | ||||||
| Number of Contracts | Premiums Received | ||||||
Balance at beginning of period | 260 | $ | 14,833 | ||||
Options written | 9,768 | 891,497 | |||||
Options closed | (3,476 | ) | (264,830 | ) | |||
Options expired | (4,272 | ) | (314,657 | ) | |||
Options exercised | (1,320 | ) | (245,155 | ) | |||
Balance at end of period | 960 | $ | 81,688 | ||||
27
Table of Contents
BB&T Variable Insurance Funds
Notes to Financial Statements — (continued)
December 31, 2009
The following is a summary of written call options outstanding as of December 31, 2009:
Security | BB&T Special Opportunities Equity VIF | ||||
| Number of Contracts | Value | ||||
Allscripts-Misys Healthcare Solutions Inc., $20.00, 1/16/10 | 200 | $ | 20,000 | ||
Allscripts-Misys Healthcare Solutions Inc., $22.50, 1/16/10 | 90 | 2,250 | |||
Cisco Systems Inc., $25.00, 1/16/10 | 60 | 720 | |||
Cisco Systems Inc., $26.00, 1/16/10 | 60 | 180 | |||
Dell Inc., $20.00, 1/16/10* | 100 | 100 | |||
McKesson Corp.,$70.00, 1/16/10* | 100 | 500 | |||
Nalco Holding Co., $22.50, 1/16/10 | 200 | 64,000 | |||
Nalco Holding Co., $25.00, 1/16/10 | 150 | 15,000 | |||
| 960 | $ | 102,750 | |||
| * | Security was valued under methods approved by the Board of Trustees. |
Security Loans — The Funds may loan securities secured by collateral in the form of securities issued or guaranteed by the U.S. Government or its agencies or instrumentalities, irrevocable letters of credit, U.S. dollars, cash or other forms of collateral as may be agreed between the Trust and Mellon Bank, N.A., the lending agent (“Mellon”). A Fund may receive compensation for lending securities in the form of fees payable by the borrower or by retaining a portion of income and earnings from the investment and reinvestment of cash collateral received and held on behalf of the Fund (after payment of a “broker rebate fee” to the borrower). In extremely low interest rate environments, the broker rebate fee may exceed the interest earned on the cash collateral which would result in a loss to the Fund. A Fund also continues to receive interest or dividends on the securities loaned. Although security loans are secured at all times by collateral, the loans may not be fully supported if, for example, the instruments in which cash collateral is invested decline in value or the borrower fails to provide additional collateral when required in a timely manner or at all. Concurrently with the delivery of a Fund’s securities to a borrower, Mellon is required to obtain from the borrower collateral equal to at least 102% of the market value of the securities loaned plus accrued interest in the case of U.S. securities, and at least 105% of the market value of the securities loaned plus accrued interest in the case of foreign securities. If at the close of trading on any business day the market value of the collateral is less than 100% of the market value of such loaned securities as of such business day, the borrower is required to deliver additional collateral which will cause the total collateral to be equal to not less than 102% of the market value of the securities loaned plus accrued interest in the case of U.S. securities and 105% of the market value of the securities loaned plus accrued interest in the case of foreign securities. A Fund bears all of the gains and losses on such investments. Cash collateral received by a Fund at December 31, 2009 was invested in the BNY Institutional Cash Reserve Fund (“ICRF”) Series A and B, an unregistered investment pool managed by Mellon, which was invested in repurchase agreements and Lehman Brothers.
The net asset value of a Fund may be affected by an increase or decrease in the value of the securities loaned or by an increase or decrease in the value of the ICRF or any other investment vehicle in which cash collateral may be invested. At December 31, 2009, the ICRF held investments in Lehman Brothers (Series B), which was in default. The default resulted in the value of the ICRF being less than the amount of collateral owed back to the borrowing brokers. The difference between the value of the collateral investments in the ICRF and what is owed to the borrowing brokers negatively impacted the NAV’s of certain Funds at December 31, 2009 by the following amounts per share:
| NAV Impact | ||
BB&T Large Cap VIF | $0.01 | |
BB&T Special Opportunities Equity VIF | 0.01 | |
BB&T Total Return Bond VIF | 0.01 |
There may be risks of delay in recovery of the securities or even loss of rights in the collateral should the borrower of the securities fail financially. Another risk from securities lending is that the borrower may not provide additional collateral when required or return the securities when due or when called for by the Fund. The Funds are indemnified from losses resulting from brokers failing to return securities. As the securities lending agent for the Funds, Mellon receives for its services 20% of the revenues earned on the securities lending activities and incurs all expenses. The securities lending agent may make
28
Table of Contents
BB&T Variable Insurance Funds
Notes to Financial Statements — (continued)
December 31, 2009
payments to borrowers and placing brokers, who may not be affiliated, directly or indirectly, with the Trust, the adviser or the distributor. In connection with lending securities, a Fund may pay reasonable administrative and custodial fees. The value of the securities on loan, the related collateral and the liability to return the collateral at December 31, 2009, are shown on the Statements of Assets and Liabilities. At December 31, 2009, the following Fund had loans outstanding:
| Value of Loaned Securities | Cost of Collateral | Value of Collateral | Average Value on Loan for the Year ended December 31, 2009 | |||||||||
BB&T Mid Cap Growth VIF | $ | 324,671 | $ | 334,495 | $ | 331,561 | $ | 358,874 | ||||
Credit Enhancements — Certain obligations held in the Funds have credit enhancement or liquidity features that may, under certain circumstances, provide for repayment of principal and interest on the obligation upon demand date, interest rate reset date or final maturity. These enhancements may include: letters of credit; liquidity guarantees; security purchase agreements; tender option purchase agreements; and third party insurance (i.e., AMBAC).
Distributions to Shareholders — Dividends from net investment income are declared and paid quarterly for the Funds, with the exception of the BB&T Total Return Bond VIF, in which case dividends from net investment income are declared daily and paid monthly. Distributable net realized gains, if any, are declared and distributed at least annually. Distributions to shareholders which exceed net investment income and net realized gains for tax purposes are reported as distributions of capital.
The character of income and gains distributed are determined in accordance with federal income tax regulations, which may differ from GAAP. These “book/tax” differences are either considered temporary or permanent in nature. To the extent these differences are permanent in nature (e.g., reclass of net operating losses, market discounts, gain/loss, paydowns and distributions), such amounts are reclassified within the composition of net assets based on their federal tax-basis treatment; temporary differences do not require reclassification. These reclassifications have no impact on net assets or net asset values per share.
As of December 31, 2009, these reclassifications were as follows:
| Decrease Paid-in-Capital | Increase/ (Decrease) Net Investment Income(Loss) | Increase/ (Decrease) Realized Gain(Loss) | ||||||||||
BB&T Mid Cap Growth VIF | $ | (21,143 | ) | $ | 43,685 | $ | (22,542 | ) | ||||
BB&T Capital Manager Equity VIF | — | (2,343 | ) | 2,343 | ||||||||
BB&T Special Opportunities Equity VIF | — | 112,592 | (112,592 | ) | ||||||||
BB&T Total Return Bond VIF | — | 17,148 | (17,148 | ) | ||||||||
Federal Income Taxes — It is the policy of the Funds to continue to qualify as a regulated investment company by complying with the provisions available to certain investment companies, as defined in applicable sections of the Internal Revenue Code of 1986, as amended (the “Internal Revenue Code”), and to make distributions of net investment income and net realized capital gains sufficient to relieve it from all, or substantially all, federal income taxes. Accordingly, no provision for federal income tax is required.
Expenses and Allocation Methodology — Expenses directly attributable to a Fund are charged to that Fund. Expenses not directly attributable to a Fund are allocated proportionately among all Funds daily in relation to the net assets of each Fund or on another reasonable basis. Expenses which are attributable to both the Funds and the BB&T Funds are allocated across the Funds and BB&T Funds, based upon relative net assets or on another reasonable basis.
| 3. | Purchases and Sales of Securities: |
Purchases and sales of securities (excluding U.S. Government Securities and securities maturing less than one year from acquisition) for the year ended December 31, 2009 were as follows:
| Purchases | Sales | |||||
BB&T Large Cap VIF | $ | 41,525,886 | $ | 48,213,575 | ||
BB&T Mid Cap Growth VIF | 19,887,811 | 24,862,898 | ||||
BB&T Capital Manager Equity VIF | 1,329,318 | 3,231,248 | ||||
BB&T Special Opportunities Equity VIF | 9,397,954 | 11,894,829 | ||||
BB&T Total Return Bond VIF | 16,132,020 | 11,198,372 | ||||
29
Table of Contents
BB&T Variable Insurance Funds
Notes to Financial Statements — (continued)
December 31, 2009
Purchases and sales of U.S. Government Securities (excluding securities maturing less than one year from acquisition) for the year ended December 31, 2009 for the BB&T Total Return Bond VIF were $11,418,703 and $12,097,744, respectively.
Restricted Securities — A restricted security is a security which has been purchased through a private offering and cannot be resold to the general public without prior registration under the Securities Act of 1933 (the “1933 Act”) or pursuant to the resale limitations provided by Rule 144 under the 1933 Act or an exemption from the registration requirements of the 1933 Act. Whether a restricted security is illiquid is determined pursuant to guidelines established by the Board of Trustees. Not all restricted securities are considered illiquid.
| 4. | Related Party Transactions: |
Investment advisory services are provided to the Funds by BB&T AM. Under the terms of the investment advisory agreement, BB&T AM is entitled to receive fees based on a percentage of the average daily net assets of the Funds. These fees are accrued daily and payable on a monthly basis and are reflected on the Statements of Operations as “Investment advisory fees”. BB&T AM waived investment advisory fees and certain expenses of the Funds referenced below which are not subject to recoupment and are included on the Statements of Operations as “Less expenses waived or reimbursed by the Investment Advisor”. Information regarding these transactions is as follows for the year ended December 31, 2009:
| Contractual Fee Rate | Fee Rate after Voluntary Waivers1 | |||
BB&T Large Cap VIF | 0.74% | 0.50% | ||
BB&T Mid Cap Growth VIF | 0.74% | 0.38% | ||
BB&T Capital Manager Equity VIF | 0.25% | 0.00% | ||
BB&T Special Opportunities Equity VIF | 0.80% | 0.77% | ||
BB&T Total Return Bond VIF | 0.60% | 0.30% |
| 1 | For the year ended December 31, 2009, BB&T AM voluntarily agreed to limit the investment advisory fees paid by the Fund. All voluntary waivers are not subject to recoupment in subsequent fiscal periods and may be discontinued at any time. |
Pursuant to a sub-advisory agreement with BB&TAM, Scott & Stringfellow LLC, a wholly owned subsidiary of BB&T Corporation, serves as the sub-advisor to the BB&T Special Opportunities Equity VIF, subject to the general supervision of the Board and BB&T AM. Pursuant to a sub-advisory agreement with BB&T AM, Sterling Capital Management LLC, a wholly owned subsidiary of BB&T Corporation, serves as the sub-advisor to the BB&T Total Return Bond VIF, subject to the general supervision of the Board and BB&T AM. For their services, the sub-advisors are entitled to a fee payable by BB&T AM.
BB&T AM serves as the administrator to the Funds pursuant to the administration agreement effective as of April 23, 2007. The Funds pay their portion of a fee to BB&T AM for providing administration services based on the aggregate assets of the Funds and the BB&T Funds at a rate of 0.11% on the first $3.5 billion of average net assets; 0.075% on the next $1 billion of average net assets; 0.06% on the next $1.5 billion of average net assets; and 0.04% of average net assets over $6 billion. This fee is accrued daily and payable on a monthly basis. Expenses incurred are reflected on the Statements of Operations as “Administration fees”. Pursuant to a sub-administration agreement with BB&T AM, PNC Global Investment Servicing (U.S.) Inc. (“PNC GIS”), serves as the sub-administrator to the Funds subject to the general supervision of the Board and BB&T AM. For these services, PNC GIS is entitled to a fee payable by BB&T AM.
PNC GIS serves as the Funds’ fund accountant and transfer agent and receives compensation by the Funds for these services. Expenses incurred are reflected on the Statement of Operations as “Fund accounting fees” and “Transfer agent fees”.
BB&TAM’s Chief Compliance Officer (“CCO”) serves as the Funds’ CCO. The CCO’s compensation is reviewed and approved by the Funds’ Board and paid by BB&T AM. However, the Funds reimburse BB&T AM for their allocable portion of the CCO’s salary. Expenses incurred for the Funds are reflected on the Statements of Operations as “Compliance service fees”.
30
Table of Contents
BB&T Variable Insurance Funds
Notes to Financial Statements — (continued)
December 31, 2009
For the year ended December 31, 2009, the Funds paid $32,105 in brokerage fees to Scott & Stringfellow LLC, a wholly owned subsidiary of BB&T Corporation, on the execution of purchases and sales of the Funds’ portfolio investments.
The Trust has adopted a Variable Contract Owner Servicing Plan (the “Service Plan”) under which the Funds may pay a fee computed daily and paid monthly, at an annual rate of up to 0.25% of the average daily net assets of the Fund. A servicing agent may periodically waive all or a portion of its servicing fees. For the Year ended December 31, 2009 the Funds did not participate in any service plans.
Certain Officers and a Trustee of the Funds are affiliated with the adviser, the administrator, or the sub-administrator. Such Officers and Trustee receive no compensation from the Funds for serving in their respective roles. Each of the Trustees who are not interested persons (as defined in the 1940 Act) of the Trust who serve on the Board are compensated at the annual rate of $30,000 plus $5,000 for each regularly scheduled quarterly meeting attended, $4,000 for each special meeting attended in person and $3,000 for each special meeting attended by telephone. Each Trustee serving on a Committee of the Board of Trustees receives a fee of $4,000 for each Committee meeting attended in person and $3,000 for each Committee meeting attended by telephone, plus reimbursement for certain out of pocket expenses. Additionally, the Chairman of the Board and Audit Committee Chairman each receive an annual retainer of $10,000, and the Chairman of the Nominations Committee receives $1,000 for each meeting attended. The fees are allocated across the Funds and the BB&T Funds based upon relative net assets.
| 5. | Line of Credit: |
U.S. Bank, N.A. has made available a credit facility to the Funds, pursuant to a Credit Agreement (the “Agreement”). The primary purpose of the Agreement is to allow the Funds to avoid security liquidations that BB&T AM believes are unfavorable to shareholders. Outstanding principal amounts under the Agreement bear interest at a rate per annum equal to the Prime Rate minus two percent (2%), but never a net rate of less than two percent (2%) per annum. The line of credit was not used during the year ended December 31, 2009.
| 6. | Federal Tax Information: |
Management evaluates its tax positions to determine if the tax positions taken meet the minimum recognition threshold in connection with accounting for uncertainties in income tax positions taken or expected to be taken for the purposes of measuring and recognizing tax liabilities in the financial statements. Recognition of tax benefits of an uncertain tax position is required only when the position is “more likely than not” to be sustained assuming examination by taxing authorities. The Funds recognize interest and penalties, if any, related to unrecognized tax benefits as income tax expense in the Statements of Operations. During the period, the Funds did not incur any interest or penalties.
Management has analyzed the Funds’ tax positions taken on federal income tax returns for all open tax years (current and prior three tax years), and has concluded that no provision for federal income tax is required in the Funds’ financial statements. The Funds’ federal and state income and federal excise tax returns for tax years for which the applicable statutes of limitations have not expired are subject to examination by the Internal Revenue Service and state departments of revenue.
At December 31, 2009 the following Funds have net capital loss carryforwards available to offset future net capital gains, if any, to the extent provided by the Treasury regulations. To the extent that these carryforward are used to offset future capital gains, it is possible that the gains that are offset will not be distributed to shareholders.
| Amount | Expires | ||||
BB&T Large Cap VIF | $ | 21,055,133 | 2016 | ||
BB&T Large Cap VIF | 3,263,903 | 2017 | |||
BB&T Mid Cap Growth VIF | 609,632 | 2016 | |||
BB&T Mid Cap Growth VIF | 5,178,561 | 2017 | |||
BB&T Capital Manager Equity VIF | 2,272,242 | 2016 | |||
BB&T Capital Manager Equity VIF | 1,989,928 | 2017 | |||
BB&T Special Opportunities Equity VIF | 2,988,566 | 2017 | |||
The BB&T Total Return Bond VIF utilized $215,593 in capital loss carryforward.
31
Table of Contents
BB&T Variable Insurance Funds
Notes to Financial Statements — (continued)
December 31, 2009
The tax character of distributions paid to shareholders during the year ended December 31, 2009, were as follows:
| Distributions paid from | |||||||||
| Ordinary Income | Net Long-Term Gains | Total Distributions Paid* | |||||||
BB&T Large Cap VIF | $ | 313,190 | $ | — | $ | 313,190 | |||
BB&T Capital Manager Equity VIF | 64,463 | — | 64,463 | ||||||
BB&T Special Opportunities Equity VIF | 336,383 | 736,899 | 1,073,282 | ||||||
BB&T Total Return Bond VIF | 885,440 | — | 885,440 | ||||||
The tax character of distributions paid to shareholders during the year ended December 31, 2008, were as follows:
| Distributions paid from | |||||||||
| Ordinary Income | Net Long-Term Gains | Total Distribution Paid* | |||||||
BB&T Large Cap VIF | $ | 1,160,944 | $ | 12,407,061 | $ | 13,568,005 | |||
BB&T Mid Cap Growth VIF | 1,251,675 | 3,285,127 | 4,536,802 | ||||||
BB&T Capital Manager Equity VIF | 296,392 | 3,097,913 | 3,394,305 | ||||||
BB&T Special Opportunities Equity VIF | 605,227 | 671,397 | 1,276,624 | ||||||
BB&T Total Return Bond VIF | 803,726 | — | 803,726 | ||||||
| * | Total Distributions Paid may differ from the Statements of Changes in Net Assets because distributions are recognized when actually paid for tax purposes. |
Under current tax law, capital losses after October 31 of a Fund’s fiscal year may be deferred and treated as occurring on the first business day of the following fiscal year for tax purposes. The following Fund had deferred post October capital losses, which will be treated on the first business day of the fiscal year ending December 31, 2010:
| Post- October Losses | |||
BB&T Capital Manager Equity VIF | $ | 74,216 | |
As of December 31, 2009, the components of accumulated earnings (deficit) on a tax basis were as follows:
| Undistributed Ordinary Income | Undistributed Long Term Capital Gains | Accumulated Earnings | Accumulated Capital and Other Losses | Unrealized Appreciation (Depreciation)* | Total Accumulated Earnings(Deficit) | ||||||||||||||||
BB&T Large Cap VIF | $ | 2,346 | $ | — | $ | 2,346 | $ | (24,319,036 | ) | $ | 2,603,678 | $ | (21,713,012 | ) | |||||||
BB&T Mid Cap Growth VIF | — | — | — | (5,788,193 | ) | 2,063,132 | (3,725,061 | ) | |||||||||||||
BB&T Capital Manager Equity VIF | 24,675 | — | 24,675 | (4,336,386 | ) | (1,896,808 | ) | (6,208,519 | ) | ||||||||||||
BB&T Special Opportunities Equity VIF | 22,721 | — | 22,721 | (2,988,566 | ) | 5,424,181 | 2,458,336 | ||||||||||||||
BB&T Total Return Bond VIF | 247,649 | 35,710 | 283,359 | — | 690,702 | 974,061 | |||||||||||||||
| * | The primary differences between book basis and tax basis unrealized appreciation/(depreciation) were due to the deferral of losses on wash sales, basis adjustments on partnership and the deferral of market discount and premium until point of sale. |
At December 31, 2009, the cost, gross unrealized appreciation and gross unrealized depreciation on securities for federal income tax purposes were as follows:
| Tax Cost | Tax Unrealized Appreciation | Tax Unrealized Depreciation | Net Unrealized Appreciation (Depreciation) | |||||||||||
BB&T Large Cap VIF | $ | 29,483,202 | $ | 3,462,020 | $ | (858,342 | ) | $ | 2,603,678 | |||||
BB&T Mid Cap Growth VIF | 7,458,235 | 2,379,920 | (316,788 | ) | 2,063,132 | |||||||||
BB&T Capital Manager Equity VIF | 9,846,497 | 17,260 | (1,914,068 | ) | (1,896,808 | ) | ||||||||
BB&T Special Opportunities Equity VIF | 33,968,065 | 6,322,368 | (877,125 | ) | 5,445,243 | |||||||||
BB&T Total Return Bond VIF | 21,913,997 | 962,603 | (271,901 | ) | 690,702 | |||||||||
32
Table of Contents
BB&T Variable Insurance Funds
Notes to Financial Statements — (continued)
December 31, 2009
| 7. | Subsequent Events: |
Management’s evaluation of the impact of all subsequent events on the Funds financial statements was completed through February 25, 2010, the date the financial statements were issued.
As described in Note 1, the Board approved a proposal to liquidate the BB&T Mid Cap Growth VIF by February 1, 2010, at which time the net assets of the Fund were liquidated and each investor’s shares were redeemed at net asset value.
33
Table of Contents
Report of Independent Registered Public Accounting Firm
The Shareholders and Board of Trustees of
BB&T Variable Insurance Funds:
We have audited the accompanying statements of assets and liabilities of the BB&T Large Cap VIF, BB&T Mid Cap Growth VIF, BB&T Capital Manager Equity VIF, BB&T Special Opportunities Equity Fund VIF, and BB&T Total Return Bond VIF (collectively, the “Funds”), five of the funds constituting BB&T Variable Insurance Funds, including the schedules of portfolio investments, as of December 31, 2009, and the related statements of operations for the year then ended, the statements of changes in net assets for each of the years in the two-year period then ended, and the financial highlights for each of the years in the five-year period then ended. These financial statements and financial highlights are the responsibility of the Funds’ management. Our responsibility is to express an opinion on these financial statements and financial highlights based on our audits.
We conducted our audits in accordance with the standards of the Public Company Accounting Oversight Board (United States). Those standards require that we plan and perform the audit to obtain reasonable assurance about whether the financial statements and financial highlights are free of material misstatement. An audit includes examining, on a test basis, evidence supporting the amounts and disclosures in the financial statements. Our procedures included confirmation of securities owned as of December 31, 2009, by correspondence with the custodian, transfer agent of the underlying funds and brokers or by other appropriate auditing procedures where replies from brokers were not received. An audit also includes assessing the accounting principles used and significant estimates made by management, as well as evaluating the overall financial statement presentation. We believe that our audits provide a reasonable basis for our opinion.
In our opinion, the financial statements and financial highlights referred to above presents fairly, in all material respects, the financial position of the Funds as of December 31, 2009, the results of their operations for the year then ended, the changes in their net assets for each of the years in the two-year period then ended, and the financial highlights for each of the years in the five-year period then ended, in conformity with U.S. generally accepted accounting principles.
The accompanying financial statements have been prepared assuming that the Funds will continue as a going concern. As discussed in notes 1 and 7 to the financial statements, on November 17, 2009, the Board of Trustees of BB&T Variable Insurance Funds approved the liquidation and termination of the BB&T Mid Cap Growth VIF effective February 1, 2010. The financial statements do not include any adjustments that might result from the decision to liquidate the BB&T Mid Cap Growth Fund.

New York, NY
February 25, 2010
34
Table of Contents
BB&T Variable Insurance Funds
December 31, 2009
Notice to Shareholders (Unaudited)
All designations are based on financial information available as of the date of this annual report and, accordingly are subject to change. For each item it is the intention of the Funds to designate the maximum amount permitted under the Internal Revenue Code and the regulations thereunder.
For the fiscal year ended December 31, 2009, each Fund is designating the following items with regard to distributions paid during the year.
For the fiscal year ended December 31, 2009, in order to meet certain requirements of the Internal Revenue Code, we are advising you that certain distributions paid during the year from the following Funds are designated as:
| (a) Long-Term Capital Gain | (b) Qualified Dividend Income % | (c) (for corporate shareholders) Dividends Received Deduction % | (d) (for foreign shareholders) Qualified Short-Term Capital Gain % | (e) (for foreign shareholders) Qualified Interest Income % | |||||||
BB&T Large Cap VIF | $ | — | 100.00% | 100.00% | — | 0.20% | |||||
BB&T Capital Manager Equity VIF | — | 91.34% | 13.58% | — | 0.36% | ||||||
BB&T Special Opportunities Equity VIF | 736,899 | 84.26% | 73.87% | 100.00% | — | ||||||
BB&T Total Return Bond VIF | — | — | — | — | 99.64% | ||||||
| (a) | Each Fund designates the maximum amount allowable but not less than the amounts shown above as a capital gain dividend in accordance with Section 852(b)(3)(C) of the Internal Revenue Code. |
| (b) | Each Fund designates the maximum amount allowable, but not less than the percentages shown above as ordinary income dividends paid during the year as qualified dividend income in accordance with Section 854 of the Internal Revenue Code. |
| (c) | Each Fund designates the maximum amount allowable but not less than the percentages shown above of ordinary income dividends paid during the year as eligible for the corporate dividends received deduction in accordance with Section 854 of the Internal Revenue Code. |
| (d) | Each Fund designates the maximum amount allowable but not less than the percentages shown above as a short-term capital gain dividend in accordance with Sections 871(k)(2) and 881(e) of the Internal Revenue Code. |
| (e) | Each Fund designates the maximum amount allowable but not less than the percentages shown above as interest-related dividends in accordance with Sections 871(k)(1) and 881(e) of the Internal Revenue Code. |
Capital gain dividends distributed during the fiscal year ended December 31, 2009 are generally subject to the maximum tax rate of 15%. In addition, Qualified Dividend Income is generally subject to a maximum rate of 15%.
The information reported herein may differ from the information and distributions paid to the shareholders subject to tax reporting.
For the fiscal year ended December 31, 2009, the following Funds designated the following percentage of investment company taxable income, or if different the maximum allowable by tax law, as being derived from U.S. Treasury securities:
| U.S. Government Income | ||
BB&T Special Opportunities Equity VIF | 4.30% | |
BB&T Total Return Bond VIF | 3.90% |
35
Table of Contents
BB&T Variable Insurance Funds
December 31, 2009
A description of the policies and procedures that the Funds use to determine how to vote proxies relating to portfolio securities is available (i) without charge, upon request, by calling 1-800-228-1872; and (ii) on the Securities and Exchange Commission’s (the “Commission”) website at http://www.sec.gov.
Information regarding how the Funds voted proxies relating to portfolio securities during the most recent 12-month period ended June 30th is available (i) without charge, upon request, by calling 1-800-228-1872 and (ii) on the Commission’s website at http://www.sec.gov.
The Funds file complete Schedules of Portfolio Holdings with the Commission for the first and third quarters of each fiscal year on Form N-Q. The Funds’ Forms N-Q are available without charge on the Commission’s website at http://www.sec.gov, or may be reviewed and copied at the Commission’s Public Reference Room in Washington, D.C. Information on the operation of the Public Reference Room may be obtained by calling 1-800-SEC-0330.
36
Table of Contents
BOARD CONSIDERATION OF ADVISORY AND SUB-ADVISORY AGREEMENTS (UNAUDITED)
The Board of Trustees, at a meeting held on August 24-25, 2009, formally considered the continuance of the Trust’s investment advisory agreement with BB&T Asset Management, Inc. (“BB&TAM”), which serves as investment adviser to all of the BB&T Variable Insurance Funds. At that same meeting, the Board of Trustees considered the continuance of sub-advisory agreements of BB&TAM with Scott & Stringfellow, LLC (“Scott & Stringfellow”), with respect to the Special Opportunities Equity VIF, and Sterling Capital Management LLC (“Sterling Capital”), with respect to the Total Return Bond VIF. All of the above referenced agreements are collectively the “Advisory Agreements” and are performed by the “Advisers”; the action considered was the “Continuance” of the Advisory Agreements.
The Trustees reviewed extensive material in connection with their consideration of the Continuance, including data from an independent provider of mutual fund data (as assembled by the Funds’ administrator), which included comparisons with industry averages for comparable funds for advisory fees and total fund expenses. The data reflected BB&TAM fee waivers in place, as well as BB&TAM’s contractual investment advisory fee levels. The Board was assisted in its review by independent legal counsel, who provided a memorandum detailing the legal standards for review of the Advisory Agreements. The Board received a detailed presentation by BB&TAM, which included a fund-by-fund analysis of performance and investment processes.
Presentations were also provided by each entity utilized by BB&TAM as a sub-adviser. The Board also received fund-by-fund profitability information from BB&TAM, Scott & Stringfellow and Sterling Capital. The Independent Trustees also deliberated outside the presence of management and the Advisers.
In their deliberations, each Trustee attributed different weights to various factors involved in an analysis of the Continuance, and no factor alone was considered determinative. The Trustees determined that the overall arrangements between the Trust and the Advisers, as provided in the Advisory Agreements, were fair and reasonable and that the Continuance of the Advisory Agreements was in the best interests of each Fund and its shareholders.
The matters addressed below were considered and discussed by the Trustees in reaching their conclusions.
Nature, Extent and Quality of Services Provided by the Adviser and Sub-Advisers
The Trustees received and considered information regarding the nature, extent, and quality of the services provided to each Fund under the Advisory Agreements. The Trustees took into account information furnished throughout the year at Trustee meetings, as well as materials furnished specifically in connection with the annual review process. The Trustees considered the background and experience of each Adviser’s senior management and the expertise of investment personnel of each Adviser responsible for the day-to-day management of each Fund. The Trustees considered the overall reputation, and the capabilities and commitment of the Advisers to provide high-quality service to the Trust, and the Trustees’ overall confidence in each Adviser’s integrity.
The Trustees received information concerning the investment philosophy and investment processes applied by the Advisers in managing the Funds as well as each Adviser’s Form ADV. The Trustees also considered information regarding regulatory compliance and compliance with the investment policies of the Funds. The Trustees evaluated the trading practices of Scott & Stringfellow, which engages in affiliated brokerage portfolio for trades for the Fund it sub-advises. The Trustees received information demonstrating a declining level of affiliated brokerage transactions by Scott & Stringfellow over the past year. The Trustees evaluated the procedures of the Advisers designed to fulfill the Advisers’ fiduciary duty to the Funds with respect to possible conflicts of interest, including the Advisers’ codes of ethics (regulating the personal trading of its officers and employees).
Based on their review, the Trustees concluded that, with respect to the quality and nature of services to be provided by the Advisers, the scope of responsibilities was consistent with mutual fund industry norms, and that the quality of the services was satisfactory.
Investment Performance
The Trustees considered performance results of each Fund in absolute terms and relative to each Fund’s benchmark index and peer group. With regard to the equity Funds, it was noted that the Special Opportunities Equity VIF had outperformed the Fund’s benchmark index over the one- and three-year periods. It was noted that the Mid Cap Growth VIF had outperformed the Fund’s benchmark index over the one- and three-year periods, but underperformed the benchmark index on a year-to-date basis. It was noted that the Large Cap VIF had performance that compared unfavorably to its benchmark index over the one-year and three-year periods. With respect to the Capital Manager Equity VIF, it was noted that the Fund had lagged that of its benchmark over the one- and three-year periods due to BB&TAM’s conservative approach to portfolio construction.
In the Trustees’ review of performance, long and short-term performance were considered. In conducting their review, the Trustees particularly focused on Funds where performance compared unfavorably to peers over the most recent one year period. The Trustees noted that, although the performance of the Large Cap VIF continued to lag its peer group, BB&TAM’s Chief Investment Officer had increased his oversight of the portfolio management team, investment process, and portfolio composition. It was also noted that the Chief Investment Officer had similarly increased oversight with respect to the Mid Cap Growth VIF. With respect to the Large Cap VIF and Mid Cap Growth VIF, it was the consensus of the Trustees that the Fund would be the subject of increased focus and review at upcoming meetings of the Board.
37
Table of Contents
After reviewing the performance of each Fund, and taking into consideration the management style, investment strategies, and prevailing market conditions during the prior year and for longer periods, the Trustees concluded that the performance of each of the Funds was acceptable or better or that in cases where performance issues were encountered, the Adviser was appropriately addressing the situation.
Cost of Services, Including the Profits Realized by the Advisers and Affiliates
The Trustees considered peer group comparable information with respect to the advisory fees charged by BB&TAM to each of the Funds, taking into consideration both contractual and actual (i.e., after waiver) fee levels. The Trustees concluded that the investment advisory fees fell within an acceptable range as compared to peer groups, particularly in light of the fee waivers that are in place.
As part of their review, the Trustees considered benefits to BB&TAM aside from investment advisory fees. The Trustees reviewed administration fees received by BB&TAM and considered the fallout benefits to BB&TAM such as the research services available to the Advisers by reason of brokerage commissions generated by the Funds’ turnover. The Trustees also considered benefits to BB&TAM’s affiliates, including brokerage commissions received by Scott & Stringfellow for executing trades on behalf of the Special Opportunities Equity VIF and sub-advisory fees received by BB&TAM’s affiliate, Sterling Capital, for its management of the Total Return Bond VIF, and by Scott & Stringfellow for its management of the Special Opportunities Equity VIF. With respect to Scott & Stringfellow, the Trustees noted that brokerage commissions were paid at a standard commission rate, which was consistent with that used by BB&TAM, and that such brokerage arrangements were considered by Scott & Stringfellow to be advantageous.
The Trustees also considered information from BB&TAM regarding fees for separate accounts managed by BB&TAM with investment objectives and strategies similar to those of comparable Funds. The Trustees noted that the fees for separate accounts were generally lower than those for the Funds. The Trustees noted that a representative of BB&TAM explained that management of the Funds was a much more intensive process than management of separate accounts, including daily fluctuations in the size of the Funds and the need to comply with extensive and complex restrictions set by applicable regulation or established in controlling disclosure documents.
The Trustees also considered the reasonableness of advisory fees, and, where relevant, the profitability of the Advisers. In determining whether all other investment advisory and sub-advisory fees (collectively, the “investment advisory fees”) were reasonable, the Trustees reviewed profitability information provided by the Advisers with respect to investment advisory services. With respect to such information, the Trustees recognized that such profitability data was generally unaudited and represented an Adviser’s own determination of its and its affiliates’ revenues from the contractual services provided to the Funds, less expenses of providing such services. Expenses include direct and indirect costs and were calculated using an allocation methodology developed by the Advisers. The Trustees also recognized that it is difficult to make comparisons of profitability from fund investment advisory and sub-advisory contracts, because comparative information is not generally publicly available and could be affected by numerous factors. Based on their review, the Trustees concluded that the profitability to BB&TAM, Scott & Stringfellow and Sterling Capital as a result of their relationships with the Funds was acceptable. The Board also concluded that the fees under the Advisory Agreements were fair and reasonable, in light of the services and benefits provided to each Fund.
Economies of Scale
The Trustees also considered whether fee levels reflect economies of scale and whether economies of scale would be produced by the growth of the Trust’s assets. The Trustees found that BB&TAM had generally reduced fund total expense ratios through fee waivers. The Trustees noted decreases in asset levels on a complex-wide basis during the past two years. The Trustees found that the asset levels of the Trust were not currently so large as to warrant formal contractual breakpoints, and found that the fee waivers were a reasonable way to provide the benefits of economies of scale to shareholders at this time.
38
Table of Contents
BB&T Variable Insurance Funds
Information about Trustees and Officers (Unaudited)
Overall responsibility for the management of the Funds rests with its Board of Trustees (“Trustees”), who are elected by the Shareholders of the Funds. The Trustees elect the officers of the Funds to supervise actively its day-to-day operations. The names of the Trustees, birth date, term of office and length of time served, principal occupations during the past five years, number of portfolios overseen and directorships held outside of the Funds are listed in the two tables immediately following. The business address of the persons listed below is 434 Fayetteville Street Mall, 5th Floor, Raleigh, North Carolina 27601.
Name and Birthdate | Position(s) Held With the Funds | Term of Office and Length of Time Served | Principal Occupation During the Past 5 Years | Number of Portfolios in Fund Complex Overseen by Trustee* | Other Directorships Held by Trustee | |||||
Thomas W. Lambeth Birthdate: 01/35 | Trustee, Chairman of the Board of Trustees | Indefinite, 08/92 — Present | From January 2001 to present, Senior Fellow, Z. Smith Reynolds Foundation | 30 | None | |||||
Drew T. Kagan Birthdate: 02/48 | Trustee | Indefinite, 08/00 — Present | From December 2003 to present, CEO, Montecito Advisors, Inc. | 30 | Director, Montecito Advisors, Inc. | |||||
Laura C. Bingham Birthdate: 11/56 | Trustee | Indefinite, 02/01 — Present | From July 1998 to present, President of Peace College | 30 | None | |||||
Douglas R. Van Scoy Birthdate: 11/43 | Trustee | Indefinite, 05/04 — Present | Retired; from November 1974 to July 2001, employee of Smith Barney (investment banking), most recently as the Deputy Director of Private Client Group and Senior Executive Vice President | 30 | None | |||||
James L. Roberts Birthdate: 11/42 | Trustee | Indefinite, 11/04 — Present | Retired; from November 2006 to present, Director, Grand Mountain Bancshares, Inc. | 30 | None | |||||
39
Table of Contents
BB&T Variable Insurance Funds
The following table shows information for the trustee who is an “interested person” of Funds as defined in the 1940 Act:
Name and Birthdate | Position(s) Held With the Funds | Term of Office and Length of Time Served | Principal Occupation During the Past 5 Years | Number of Portfolios in Fund Complex | Other Directorships Held by Trustee | |||||
R. Lee Youngblood** Birthdate: 01/47 | Trustee | Indefinite, 01/09 — Present | From April 1971 to present, employee of Branch Banking and Trust Company (currently Executive Vice President) | 30 | Director, Sterling Capital Management, LLC; Director, Scott & Stringfellow LLC; Director, BB&T Investment Services, Inc. | |||||
| * | The BB&T Funds Complex consists of two open-end investment management companies: the Trust and the BB&T Funds. |
| ** | Mr. Youngblood is treated by the Funds as an “interested person” (as defined in Section 2(a)(19) of the 1940 Act) of the Funds. Mr. Youngblood is an “interested person” because he owns shares of BB&T Corporation. |
The following table shows information for officers of the Funds:
Name and Birthdate | Position(s) Held | Term of Office | Principal Occupation During the Past 5 Years | |||
E.G. Purcell, III Birthdate: 01/55 | President and Secretary | Indefinite, President and Secretary, 11/08- Present; Vice President, 11/00-11/08 | From 1995 to present, Senior Vice President, BB&T Asset Management, Inc. and its predecessors | |||
| Todd M. Miller Birthdate: 09/71 | Vice President | Indefinite, 8/05 — Present | From May 2009 to present, Vice President BB&T Asset Management; from June 2005 to May 2009, Mutual Funds Administrator; from May 2001 to May 2005, Manager, BISYS Fund Services | |||
| Clinton L. Ward Birthdate: 11/69 | Chief Compliance and Anti-Money Laundering Officer | Indefinite, 4/07 — Present | From July 2004 to present, Chief Compliance Officer and Secretary, BB&T Asset Management, Inc.; from January 2002 to July 2004, Compliance Analyst, Evergreen Investments | |||
40
Table of Contents
BB&T Variable Insurance Funds
Name and Birthdate | Position(s) Held With the Funds | Term of Office and Length of Time Served | Principal Occupation During the Past 5 Years | |||
Andrew J. McNally Birthdate: 12/70 | Treasurer | Indefinite, 4/07 — Present | From January 2007 to present, Vice President and Senior Director, and from July 2000 to December 2006, Director, Fund Accounting and Administration Department, PNC Global Investment Servicing (U.S.) Inc. | |||
Avery Maher Birthdate: 02/45 | Assistant Secretary | Indefinite, 4/07 — Present | From March 2006 to present, Vice President and Counsel, Regulatory Administration Department, PNC Global Investment Servicing (U.S.) Inc.; from October 2004 to August 2005, Vice President and Assistant General Counsel, JPMorgan Asset Management; from 1992 to 2004, Second Vice President and Assistant Secretary, John Hancock Advisers, LLC | |||
The Funds’ Statement of Additional Information includes information about the Funds’ Trustees. To receive your free copy of the Statement of Additional Information, call toll free: 1-800-228-1872.
41
Table of Contents
| Item 2. | Code of Ethics. |
| (a) | The registrant, as of the end of the period covered by this report, has adopted a code of ethics that applies to the registrant’s principal executive officer, principal financial officer, principal accounting officer or controller, or persons performing similar functions, regardless of whether these individuals are employed by the registrant or a third party (the “Code of Ethics”). |
| (c) | There have been no amendments, during the period covered by this report, to a provision of the Code of Ethics that applies to the registrant’s principal executive officer, principal financial officer, principal accounting officer or controller, or persons performing similar functions, regardless of whether these individuals are employed by the registrant or a third party, and that relates to any element of the code of ethics definition enumerated in Item 2(b) of Form N-CSR. |
| (d) | The registrant has not granted any waivers, including an implicit waiver, from a provision of the “code of ethics” that applies to the registrant’s principal executive officer, principal financial officer, principal accounting officer or controller, or persons performing similar functions, regardless of whether these individuals are employed by the registrant or a third party, that relates to one or more of the items set forth in Item 2(b) of Form N-CSR. |
| Item 3. | Audit Committee Financial Expert. |
As of the end of the period covered by the report, the registrant’s board of trustees has determined that Drew Kagan is qualified to serve as an audit committee financial expert serving on its audit committee and that he is “independent,” as defined by Item 3 of Form N-CSR.
| Item 4. | Principal Accountant Fees and Services. |
Audit Fees
| (a) | The aggregate fees billed for each of the last two fiscal years for professional services rendered by the principal accountant for the audit of the registrant’s annual financial statements or services that are normally provided by the accountant in connection with statutory and regulatory filings or engagements for those fiscal years are $90,000 in 2008 and $92,000 in 2009. |
Audit-Related Fees
| (b) | The aggregate fees billed in each of the last two fiscal years for assurance and related services by the principal accountant that are reasonably related to the performance of the audit of the registrant’s financial statements and are not reported under paragraph (a) of this Item are $0 in 2008 and $0 in 2009. |
Table of Contents
Tax Fees
| (c) | The aggregate fees billed in each of the last two fiscal years for professional services rendered by the principal accountant for tax compliance, tax advice, and tax planning are $13,500 in 2008 and $9,000 in 2009. Fees for both 2009 and 2008 relate to the preparation of federal income and excise tax returns and review of capital gains distribution calculations. |
All Other Fees
| (d) | The aggregate fees billed in each of the last two fiscal years for products and services provided by the principal accountant, other than the services reported in paragraphs (a) through (c) of this Item are $0 in 2008 and $0 in 2009. |
(e)(1) | Except as permitted by Rule 2-01(c)(7)(i)(C) of Regulation S-X, the Trust’s Audit Committee must pre-approve all audit and non-audit services provided by the independent accountants relating to the operations or financial reporting of the funds. Prior to the commencement of any audit or non-audit services to a fund, the Audit Committee reviews the services to determine whether they are appropriate and permissible under applicable law. | |
(e)(2) | The percentage of services described in each of paragraphs (b) through (d) of this Item that were approved by the audit committee pursuant to paragraph (c)(7)(i)(C) of Rule 2-01 of Regulation S-X are as follows: | |
(b) N/A
(c) 100%
(d) N/A
| (f) | The percentage of hours expended on the principal accountant’s engagement to audit the registrant’s financial statements for the most recent fiscal year that were attributed to work performed by persons other than the principal accountant’s full-time, permanent employees was 0%. |
| (g) | The aggregate non-audit fees billed by the registrant’s accountant for services rendered to the registrant, and rendered to the registrant’s investment adviser (not including any sub-adviser whose role is primarily portfolio management and is subcontracted with or overseen by another investment adviser), and any entity controlling, controlled by, or under common control with the adviser that provides ongoing services to the registrant for each of the last two fiscal years of the registrant was $332,000 in 2008 and $93,000 in 2009. |
| (h) | The registrant’s audit committee of the board of directors has considered whether the provision of non-audit services that were rendered to the registrant’s investment adviser (not including any sub-adviser whose role is primarily portfolio management and is subcontracted with or overseen by another investment adviser), and any entity controlling, controlled by, or under common control with the investment adviser that provides ongoing services to the registrant that were not pre-approved pursuant to paragraph (c)(7)(ii) of Rule 2-01 of Regulation S-X is compatible with maintaining the principal accountant’s independence. |
Table of Contents
| Item 5. | Audit Committee of Listed Registrants. |
Not applicable.
| Item 6. | Investments. |
| (a) | Schedule of Investments in securities of unaffiliated issuers as of the close of the reporting period is included as part of the report to shareholders filed under Item 1 of this form. |
| (b) | Not applicable. |
| Item 7. | Disclosure of Proxy Voting Policies and Procedures for Closed-End Management Investment Companies. |
Not applicable.
| Item 8. | Portfolio Managers of Closed-End Management Investment Companies. |
Not applicable.
| Item 9. | Purchases of Equity Securities by Closed-End Management Investment Company and Affiliated Purchasers. |
Not applicable.
| Item 10. | Submission of Matters to a Vote of Security Holders. |
There have been no material changes to the procedures by which shareholders may recommend nominees to the registrant’s board of trustees, where those changes were implemented after the registrant last provided disclosure in response to the requirements of Item 407(c)(2)(iv) of Regulation S-K (17 CFR 229.407) (as required by Item 22(b)(15) of Schedule 14A (17 CFR 240.14a-101)), or this Item.
Table of Contents
| Item 11. | Controls and Procedures. |
| (a) | The registrant’s principal executive officer and principal financial officer have concluded, based on their evaluation of the effectiveness of the design and operation of the registrant’s disclosure controls and procedures (as defined in Rule 30a-3(c) under the Investment Company Act of 1940 (17 CFR 270.30a-3(c))) as of a date within 90 days of the filing date of this report, that the design and operation of such procedures are effective to provide reasonable assurance that information required to be disclosed by the registrant on Form N-CSR is recorded, processed, summarized and reported within the time periods specified in the Securities and Exchange Commission’s rules and forms, and that information required to be disclosed by the registrant in the reports that it files or submits on Form N-CSR is accumulated and communicated to the registrant’s management, including its principal executive and principal financial officers, as appropriate to allow timely decisions regarding required disclosure. |
| (b) | There were no changes in the registrant’s internal control over financial reporting (as defined in Rule 30a-3(d) under the 1940 Act (17 CFR 270.30a-3(d))) that occurred during the second fiscal quarter of the period covered by this report that have materially affected, or are reasonably likely to materially affect, the registrant’s internal control over financial reporting. |
Item 12. Exhibits.
| (a)(1) | Code of ethics, that is the subject of disclosure required by Item 2 was included as Exhibit (a)(1) of the registrant’s N-CSR filed on March 5, 2009 (Accession No. 0001193125-09-0 45916. | |
(a)(2) | Certifications pursuant to Rule 30a-2(a) under the 1940 Act and Section 302 of the Sarbanes-Oxley Act of 2002 are attached hereto. | |
(a)(3) | Not applicable. | |
(b) | Certifications pursuant to Rule 30a-2(b) under the 1940 Act and Section 906 of the Sarbanes-Oxley Act of 2002 are attached hereto. | |
Table of Contents
SIGNATURES
Pursuant to the requirements of the Securities Exchange Act of 1934 and the Investment Company Act of 1940, the registrant has duly caused this report to be signed on its behalf by the undersigned, thereunto duly authorized.
(Registrant) | BB&T Variable Insurance Funds | |||
By (Signature and Title) | /s/ E.G. PURCELL, III | |||
| E.G. Purcell, III, President | ||||
| (principal executive officer) | ||||
Date 2/25/10 | ||||
Pursuant to the requirements of the Securities Exchange Act of 1934 and the Investment Company Act of 1940, this report has been signed below by the following persons on behalf of the registrant and in the capacities and on the dates indicated.
By (Signature and Title) | /s/ E.G. PURCELL, III | |||
| E.G. Purcell, III, President | ||||
| (principal executive officer) | ||||
Date 2/25/10 | ||||
By (Signature and Title) | /s/ ANDREW J. MCNALLY | |||
| Andrew J. McNally, Treasurer | ||||
| (principal financial officer) | ||||
Date 2/25/10 | ||||