UNITED STATES
SECURITIES AND EXCHANGE COMMISSION
Washington, D.C. 20549
FORM N-CSR
CERTIFIED SHAREHOLDER REPORT OF REGISTERED MANAGEMENT
INVESTMENT COMPANIES
Investment Company Act file number 811-21682
| BB&T Variable Insurance Funds |
| (Exact name of registrant as specified in charter) |
434 Fayetteville Street Mall, 5th Floor Raleigh, NC 27601-0575 |
| (Address of principal executive offices) (Zip code) |
Keith F. Karlawish, President BB&T Variable Insurance Funds 434 Fayetteville Street Mall, 5th Floor Raleigh, NC 27601-0575 |
| (Name and address of agent for service) |
Registrant’s telephone number, including area code: (800) 228-1872
Date of fiscal year end: December 31
Date of reporting period: December 31, 2007
Form N-CSR is to be used by management investment companies to file reports with the Commission not later than 10 days after the transmission to stockholders of any report that is required to be transmitted to stockholders under Rule 30e-1 under the Investment Company Act of 1940 (17 CFR 270.30e-1). The Commission may use the information provided on Form N-CSR in its regulatory, disclosure review, inspection, and policymaking roles.
A registrant is required to disclose the information specified by Form N-CSR, and the Commission will make this information public. A registrant is not required to respond to the collection of information contained in Form N-CSR unless the Form displays a currently valid Office of Management and Budget (“OMB”) control number. Please direct comments concerning the accuracy of the information collection burden estimate and any suggestions for reducing the burden to Secretary, Securities and Exchange Commission, 100 F Street, NE, Washington, DC 20549. The OMB has reviewed this collection of information under the clearance requirements of 44 U.S.C. § 3507.
| Item 1. | Reports to Stockholders. |
The Report to Shareholders is attached herewith.
BB&T Variable Insurance Funds
Fund Summary | ||
| 2 | ||
| 3 | ||
| 4 | ||
| 5 | ||
| 6 | ||
| 7 | ||
| 8 | ||
Schedule of Portfolio Investments | ||
| 9 | ||
| 10 | ||
| 11 | ||
| 12 | ||
| 13 | ||
| 17 | ||
| 23 | ||
| 30 | ||
| 31 | ||
| 35 | ||
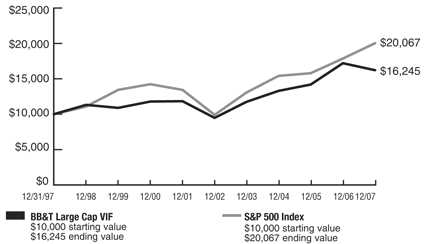
Performance Overview 12/31/1997 - 12/31/2007
Growth of a $10,000 investment
Portfolio Manager
Ronald T. Rimkus, CFA
Director of Core Equity
BB&T Asset Management, Inc.
Average Annual Returns
| 1 Year | 5 Year | 10 Years | |||||||
BB&T Large Cap VIF | -5.87 | % | 11.29 | % | 4.97 | % | |||
S&P 500 Index | 5.49 | % | 12.82 | % | 5.91 | % |
The chart represents a comparison of a hypothetical $10,000 investment in the indicated Fund versus a similar investment in the Fund’s benchmark, and includes the reinvestment of distributions. (The returns include the Fund level expenses, but exclude the insurance charges). Past performance does not guarantee future results. The value of the contract will fluctuate so that when redeemed, it may be worth more or less than the original investment.
Investment Concerns
Equity securities (stocks) are more volatile and carry more risk than other forms of investments, including investments in high-grade fixed income securities. The net asset value per share of the Fund will fluctuate as the value of the securities in the portfolio changes. Value-based investments are subject to the risk that the broad market may not recognize their intrinsic value.
Q. How did the Fund perform during the 12-month period between January 1, 2007 and December 31, 2007?
A. The Fund lost 5.87%. That compared to a 5.49% return for its benchmark, the Standard & Poor’s 500® Index (“S&P 500 Index”).¹
Q. What factors affected the Fund’s performance?
A. The stock market generated volatile returns during 2007, and ended the period with a modest gain. Shares of energy and materials stocks added to the Fund’s absolute return, while financial stocks — particularly shares of firms in the mortgage industry —reduced the Fund’s return.2
This Fund seeks to invest in stocks that exhibit a durable competitive advantage and sell at a discount to their intrinsic value. This approach led us to trim or sell some industrial stocks that appeared expensive —leaving a relatively small stake in that sector compared to the benchmark index. Shares of industrial firms continued to perform well during much of the period, however, as powerful foreign economic growth boosted demand for industrial companies’ products and services. As a result, the Fund’s underweight position decreased performance relative to the benchmark.2
Selection among stocks in the sector also reduced relative returns. That said, we were able to reduce the average price-to-value ratio of the Fund’s holdings from 90% to 68%. While lower valuations do not guarantee strong future performance, we believe that a ratio in the 60s historically has prefaced strong relative performance.
Holdings related to the mortgage and homebuilding industries weighed on the Fund’s performance against its benchmark late in the period, as the housing slump deepened. We initiated several of those positions during 2007, as the stocks traded at low valuations. The housing market’s troubles continued to weigh on the stocks during the period, however. 2
The Fund’s health-care allocation also dragged on performance against the index. Losses from shares of a large biotechnology firm especially pulled down returns in that sector as fears mounted over concerns about the safety of one of its leading products. The stock of a large pharmaceutical firm partially offset the negative selection effect in the health-care sector.2
Security selection in the consumer discretionary sector added to relative returns. Consumer discretionary stocks in general performed poorly, but the Fund’s holdings in that sector posted strong gains. Our investments in shares of a specialty retailer proved particularly beneficial to relative performance. Furthermore, the Fund’s overweight stake in the consumer discretionary sector magnified the effect of successful stock selection.2
We also over-weighted technology stocks. The technology sector rallied during the 12-month period, so the Fund’s larger-than-benchmark position added to relative returns. However, selection in that sector detracted from relative returns, as some of the Fund’s investments in that sector were out of favor late in the year.2
| 1 | The Fund is measured against the S&P 500 Index, a widely recognized, unmanaged index of common stocks. This index is unmanaged and does not reflect the deduction of expenses associated with a mutual fund, such as investment management and fund accounting fees. The Fund’s performance reflects the deduction of fees for these services. Investors cannot invest directly in an index, although they can invest in its underlying securities. |
| 2 | Portfolio composition is as of December 31, 2007, and is subject to change. |
A portion of the Fund’s fees have been reduced. If fees had not been reduced, the Fund’s total return for the periods would have been lower.
2
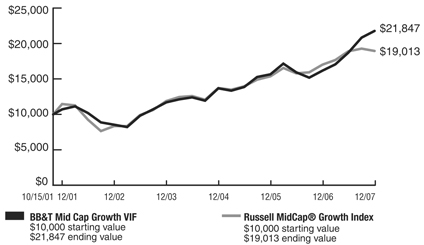
Performance Overview 10/15/2001 - 12/31/2007
Growth of a $10,000 investment
Portfolio Manager
David P. Nolan
Senior Vice President and Portfolio Manager
BB&T Asset Management, Inc.
Average Annual Returns (Inception 10/15/2001)
| 1 Year | 5 Year | Since Inception | ||||||
BB&T Mid Cap Growth VIF | 35.02% | 20.61 | % | 13.41 | % | |||
Russell MidCap® Growth Index | 11.43% | 17.90 | % | 10.98 | % |
The chart represents a comparison of a hypothetical $10,000 investment in the indicated Fund versus a similar investment in the Fund’s benchmark, and includes the reinvestment of distributions. The inception date used for the Russell MidCap® Growth Index was 10/31/01. (The returns include the Fund level expenses, but exclude the insurance charges). Past performance does not guarantee future results. The value of the contract will fluctuate so that when redeemed, it may be worth more or less than the original investment.
Investment Concerns
Mid-capitalization funds typically carry additional risks since smaller companies generally have a higher risk of failure, and historically, their stocks have experienced a greater degree of market volatility than stocks on average.
Equity securities (stocks) are more volatile and carry more risk than other forms of investments, including investments in high-grade fixed income securities. The net asset value per share of the Fund will fluctuate as the value of the securities in the portfolio changes.
Q. How did the Fund perform during the 12-month period between January 1, 2007 and December 31, 2007?
A. The Fund gained 35.02%. That compared to a 11.43% return for its benchmark, the Russell MidCap® Growth Index.¹
Q. What factors affected the Fund’s performance?
A. Mid-cap growth stocks characterized by high growth rates, high price-to-earnings ratios and volatility were among the market’s best performers for the period.2
Stock picking helped the Fund post impressive absolute returns for the period. Positions in four strong-performing stocks particularly added to the Fund’s gains. Shares of a solar-panel maker, a video-game maker, a footwear maker and a firm specializing in liquefied natural gas terminal construction contributed mightily to absolute performance.2
The Fund emphasizes stocks with a higher growth profile than the benchmark index. While the index carried an average projected growth rate of approximately 17%, the average projected growth rate of the Fund’s holdings was about 27%. That emphasis on growth helped the Fund outperform its benchmark during 2007.2
The Fund manager throughout the period emphasized stocks of solar energy and engineering/construction firms, which stood to benefit from the high price of crude oil. Although the Fund was slightly underweight in energy stocks compared to the index, the stocks related to those energy-related themes helped the Fund beat its benchmark by a wide margin.2
Consumer discretionary stocks were the second-worst performing sector among the 10 economic sectors represented in the S&P 500®. As a result, the Fund’s relative return benefited from a smaller-than-benchmark allocation to those stocks. That said, the Fund’s relative performance benefited even more from strong returns by a few select stocks in that sector.2
The same was true of the technology sector, which mildly detracted from the benchmark’s returns. Strong performance from a few stocks in the sector improved both absolute and relative returns, particularly since the Fund held an overweight position in technology stocks.2
1 | The Fund is measured against the Russell MidCap® Growth Index, an unmanaged index which measures the performance of those securities in the Russell 1000 Index with higher price-to-book ratios and lower forecasted growth values. The index does not reflect the deduction of expenses associated with a mutual fund, such as investment management and fund accounting fees. The Fund’s performance reflects the deduction of fees for these services. Investors cannot invest directly in an index, although they can invest in its underlying securities. |
2 | Portfolio composition is as of December 31, 2007, and is subject to change. |
A portion of the Fund’s fees have been reduced. If fees had not been reduced, the Fund’s total return for the periods would have been lower.
3
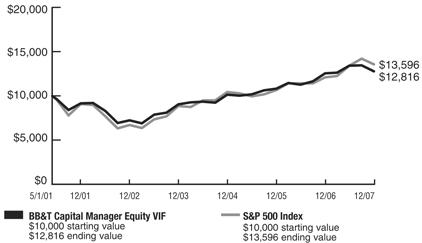
BB&T Capital Manager Equity VIF
Performance Overview 5/1/2001 - 12/31/2007
Growth of a $10,000 investment
Portfolio Management Team
Managed by the BB&T Balanced Portfolio Management Team
Average Annual Returns (Inception 5/1/2001)
| 1 Year | 5 Year | Since Inception | ||||||
BB&T Capital Manager Equity VIF | 1.98% | 12.11 | % | 3.79 | % | |||
S&P 500 Index | 5.49% | 12.82 | % | 4.27 | % |
The chart represents a comparison of a hypothetical $10,000 investment in the indicated Fund versus a similar investment in the Fund’s benchmark, and includes the reinvestment of distributions. The inception date used for the S&P 500 Index was 04/30/01. (The returns include the Fund level expenses, but exclude the insurance charges). Past performance does not guarantee future results. The value of the contract will fluctuate so that when redeemed, it may be worth more or less than the original investment.
Investment Concerns
Equity securities (stocks) are more volatile and carry more risk than other forms of investments, including investments in high-grade fixed income securities. The net asset value per share of the Fund will fluctuate as the value of the securities in the portfolio changes.
Q. How did the Fund perform during the 12-month period between January 1, 2007 and December 31, 2007?
A. The Fund gained 1.98%. That compared to a 5.49% return for the Standard & Poor’s 500® Index (“S&P 500 Index”).¹
Q. What factors affected the Fund’s performance?
A. The Fund invests in a combination of the BB&T Equity Index Fund, BB&T Large Cap Fund, the BB&T Mid Cap Value Fund, the BB&T Mid Cap Growth Fund, the BB&T International Equity Fund, the BB&T Small Cap Fund and the BB&T U.S. Treasury Money Market Fund.2
The stock market performed unevenly during the period, with wide divergence between the market’s best- and worst-performing groups. International stocks outperformed domestic issues, mid-cap stocks outperformed large caps while besting small caps by a wide margin, and growth stocks outperformed value-oriented shares.2
That environment helped the Fund generate a small but positive absolute return. The Fund’s return benefited from its allocations to large-cap and mid-cap funds, which posted modest gains. Its allocation to the BB&T International Equity Fund also boosted absolute performance, as that fund returned 10.5% during the period. Negative returns in the small-cap equity market dragged on the Fund’s absolute return, as the BB&T Small Cap Fund returned -8.5%.2
The same dynamics shaped the Fund’s relative returns. The Fund trailed the benchmark despite the positive effect of its allocation to large-cap, mid-cap, and international stocks. The Fund’s strategic bias in favor of value stocks — which historically have generated stronger risk-adjusted returns than growth stocks — hurt relative returns, as growth stocks outgained value names for the first time since 2002. Weak returns from small-cap stocks also weighed on relative performance.2
1 | The Fund is measured against the S&P 500 Index, a widely recognized, unmanaged index of common stocks. The Index does not reflect the deduction of expenses associated with a mutual fund, such as investment management and fund accounting fees. The Fund’s performance reflects the deduction of fees for these services. Investors cannot invest directly in an index, although they can invest in its underlying securities. |
2 | Portfolio composition is as of December 31, 2007, and is subject to change. |
A portion of the Fund’s fees have been reduced. If fees had not been reduced, the Fund’s total return for the periods would have been lower.
4
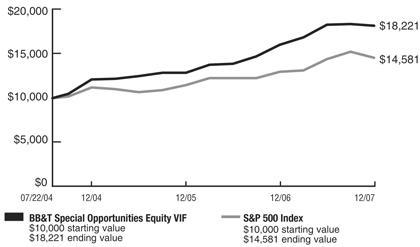
BB&T Special Opportunities Equity VIF
Performance Overview 7/22/2004 - 12/31/2007
Growth of a $10,000 investment
Portfolio Manager
George F. Shipp, CFA
Chief Investment Officer
Scott & Stringfellow, Inc.
Average Annual Returns (Inception 7/22/2004)
| 1 Year | Since Inception | |||||
BB&T Special Opportunities Equity VIF | 13.41 | % | 19.03 | % | ||
S&P 500 Index | 5.49 | % | 10.83 | % |
The chart represents a comparison of a hypothetical $10,000 investment in the indicated Fund versus a similar investment in the Fund’s benchmark, and includes the reinvestment of distributions. The inception date used for the S&P 500 Index was 07/31/04. (The returns include the Fund level expenses, but exclude the insurance charges). Past performance does not guarantee future results. The value of the contract will fluctuate so that when redeemed, it may be worth more or less than the original investment.
Investment Concerns
Equity securities (stocks) are more volatile and carry more risk than other forms of investments, including investments in high-grade fixed income securities. The net asset value per share of this Fund will fluctuate as the value of the securities in the portfolio changes. A concentrated portfolio may add a measure of volatility to performance, as major fluctuations in any one holding will likely affect the Fund more than a fund with greater diversification.
Q. How did the Fund perform during the 12-month period between January 1, 2007 and December 31, 2007?
A. The Fund gained 13.41%. That compared to a 5.49% return for its benchmark, the Standard & Poor’s 500® Index (“S&P 500 Index”).¹
Q. What factors affected the Fund’s performance?
A. The stock market’s solid gains of the first six months of 2007 dwindled during the second half of the year, as investors grew increasingly concerned about economic growth. The period marked the first year since 2002 when more stocks in the S&P 500 declined than advanced, and the first since 1998 in which large-capitalization stocks out-performed small caps.2
Stock selection drove the Fund’s strong returns, both in absolute terms and relative to its benchmarks. The Fund benefited from owning shares of three firms that received takeover offers at sizeable premiums to the companies’ market values, including a video-game maker, an online billing services company and a major student-loan provider.2
The manager’s longstanding emphasis on energy stocks contributed positively to both absolute and relative gains, as oil prices soared to almost $100 a barrel. Two of the strongest-performing stocks, which the manager selected due to the stocks’ strong underlying fundamentals, were shares of an oil services firm and a major coal producer. The Fund held both of those stocks for the entire period.2
The Fund’s over-weighting in the recession-resistant healthcare sector proved helpful as evidence of economic slowdown accumulated. Shares of the world’s largest generic drug maker were a major contributor to the Fund’s strong relative performance. The Fund also benefited from an underweight position in financial stocks. Financial shares were the market’s worst-performing group during the period, as the sub-prime meltdown dominated the second half of 2007.2
A handful of individual investments weighed on the Fund’s absolute and relative returns. One such investment was the stock of an online stock brokerage, which encountered problems related to the quality of its assets. Shares of the nation’s largest cable provider also weighed on the Fund’s relative returns. The manager maintained its stake in that stock, however, due to the attractiveness of the firm’s strategic position and technology platform.2
1 | The Fund is measured against the S&P 500 Index, a widely recognized, unmanaged index of common stocks. The Index does not reflect the deduction of expenses associated with a mutual fund, such as investment management and fund accounting fees. The Fund’s performance reflects the deduction of fees for these services. Investors cannot invest directly in an index, although they can invest in its underlying securities. |
2 | Portfolio composition is as of December 31, 2007, and is subject to change. |
A portion of the Fund’s fees have been reduced. If fees had not been reduced, the Fund’s total return for the periods would have been lower.
5
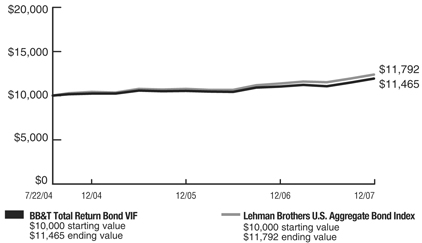
Performance Overview 7/22/2004 - 12/31/2007
Growth of a $10,000 investment
Portfolio Manager
David M. Ralston
Managing Director and Chief Investment Officer
Sterling Capital Management LLC
Average Annual Returns (Inception 7/22/2004)
| 1 Year | Since Inception | |||||
BB&T Total Return Bond VIF | 6.47 | % | 4.05 | % | ||
Lehman Bros. Agg. Bond Index | 6.97 | % | 4.94 | % |
The chart represents a comparison of a hypothetical $10,000 investment in the indicated Fund versus a similar investment in the Fund’s benchmark, and includes the reinvestment of distributions. The inception date used for the Lehman Brothers U.S. Aggregate Bond Index was 07/ 31/04. (The returns include the Fund level expenses, but exclude the insurance charges). Past performance does not guarantee future results. The value of the contract will fluctuate so that when redeemed, it may be worth more or less than the original investment.
Investment Concerns
Bonds offer a relatively stable level of income, although bond prices will fluctuate providing the potential for principal gain or loss. Intermediate-term, higher-quality bonds generally offer less risk than longer-term bonds and a lower rate of return.
The Fund is subject to the risk that principal value reacts in opposition to the movement of interest rates and that a rising interest rate environment increases the risk of loss of principal.
Q. How did the Fund perform during the 12-month period between January 1, 2007 and December 31, 2007?
A. The Fund gained 6.47%. That compared to a 6.97% return for its benchmark, the Lehman Brothers U.S. Aggregate Bond Index¹.
Q. What factors affected the Fund’s performance?
A. Treasury bonds outperformed lower-quality issues during 2007. Securities backed by mortgages especially struggled, as investors became concerned about fallout from rising defaults on sub-prime mortgages. This Fund’s absolute return benefited from declining yields on Treasury notes and bonds, which pushed up prices on existing Treasury securities. The Fund’s bias toward high-quality issues helped it to generate a solid gain for the period.3
The Fund’s managers employed a bulleted yield-curve strategy, which included over-weighting the five-year portion of the curve and underweighting securities with longer than 10 years to maturity. Those strategies boosted the Fund’s return relative to its benchmark index. Likewise, an underweight allocation to long-term bonds in the financial sector added to relative performance during the fourth quarter, as did a high-quality bias among corporate bonds.3
The Fund held a duration that was slightly shorter than that of its benchmark. That duration positioning detracted from relative performance.2 In addition, the Fund maintained exposure to high-quality mortgage-backed securities, because the manager believed investors would differentiate between higher- and lower-quality bonds in that sector. Mortgage-backed securities of all qualities fared poorly, however, and the Fund’s stake in them weighed on relative returns.3
1 | The Fund is measured against Lehman Brothers U.S. Aggregate Bond Index which is a market value-weighted performance benchmark for investment-grade fixed-rate debt issues, including government, corporate, asset-backed and mortgage-backed securities, with maturities of at least one year. The index is unmanaged and does not reflect the deduction of expenses associated with a mutual fund, such as investment management and fund accounting fees. The Fund’s performance reflects the deduction of fees for these services. Investors cannot invest directly in an index, although they can invest in its underlying securities. |
2 | Duration is a measure of a bond’s or a bond fund’s price risk that is adjusted for any optionality. |
3 | Portfolio composition is as of December 31, 2007, and is subject to change. |
A portion of the Fund’s fees have been reduced. If fees had not been reduced, the Fund’s total return for the periods would have been lower.
6
Summary of Portfolio Holdings (Unaudited)
December 31, 2007
The BB&T Variable Insurance Funds portfolio composition was as follows at December 31, 2007:
| Percentage of net assets | |||
BB&T Large Cap VIF | |||
Consumer Discretionary | 18.3 | % | |
Consumer Staples | 8.1 | % | |
Energy | 9.0 | % | |
Financials | 19.5 | % | |
Health Care | 18.0 | % | |
Industrials | 5.6 | % | |
Information Technology | 18.1 | % | |
Investment Company | 1.7 | % | |
Materials | 1.3 | % | |
| 99.6 | % | ||
BB&T Mid Cap Growth VIF | |||
Consumer Discretionary | 11.5 | % | |
Consumer Staples | 1.1 | % | |
Energy | 9.2 | % | |
Exchange Traded Fund | 2.2 | % | |
Financials | 6.3 | % | |
Health Care | 12.0 | % | |
Industrials | 23.1 | % | |
Information Technology | 26.1 | % | |
Investment Company | 2.6 | % | |
Materials | 3.4 | % | |
Telecommunication Services | 1.8 | % | |
Utilities | 1.6 | % | |
| 100.9 | % | ||
BB&T Capital Manager Equity VIF | |||
BB&T Equity Index Fund | 8.3 | % | |
BB&T International Equity Fund | 24.8 | % | |
BB&T Large Cap Fund | 33.3 | % | |
BB&T Mid Cap Growth Fund | 9.3 | % | |
BB&T Mid Cap Value Fund | 13.7 | % | |
BB&T Small Cap Fund | 7.2 | % | |
BB&T US Treasury Money Market Fund | 2.9 | % | |
| 99.5 | % | ||
BB&T Special Opportunities Equity VIF | |||
Consumer Discretionary | 10.4 | % | |
Consumer Staples | 2.6 | % | |
Energy | 17.5 | % | |
Financials | 3.5 | % | |
Health Care | 19.8 | % | |
Industrials | 8.8 | % | |
Information Technology | 25.8 | % | |
Investment Company | 6.9 | % | |
Materials | 10.3 | % | |
| 105.6 | % | ||
BB&T Total Return Bond VIF | |||
Asset Backed Securities | 6.4 | % | |
Commercial Mortgage-Backed Securities | 6.5 | % | |
Corporate Bonds | 23.2 | % | |
Federal Home Loan Mortgage Corp. — Collateralized Mortgage Obligations | 0.7 | % | |
Federal National Mortgage Association — Collateralized Mortgage Obligations | 0.5 | % | |
Federal Home Loan Mortgage Corp. — Mortgage-Backed Securities | 15.5 | % | |
Federal National Mortgage Association — Mortgage-Backed Securities | 21.7 | % | |
Government National Mortgage Association | 1.8 | % | |
Federal Home Loan Bank | 2.6 | % | |
Federal Home Loan Mortgage Corp. — U.S. Government Agencies | 1.7 | % | |
Federal National Mortgage Association — U.S. Government Agencies | 5.1 | % | |
Municipal Bonds | 5.0 | % | |
U.S. Treasury Notes | 12.0 | % | |
Investment Company | 2.2 | % | |
| 104.9 | % | ||
7
Expense Example (Unaudited)
December 31, 2007
As a shareholder of the BB&T Variable Insurance Funds, you incur two types of costs: (1) transaction costs, and (2) ongoing costs, including management fees; and other Fund expenses.
These examples are intended to help you understand your ongoing costs (in dollars) of investing in the BB&T Variable Insurance Funds and to compare these costs with the ongoing costs of investing in other mutual funds.
These examples are based on an investment of $1,000 invested at the beginning of the period and held for the entire period from July 1, 2007 through December 31, 2007.
Actual Example
The table below provides information about actual account values and actual expenses. You may use the information below, together with the amount you invested, to estimate the expenses that you paid over the period. Simply divide your account value by $1,000 (for example, an $8,600 account value divided by $1,000 = 8.6), then multiply the result by the number in the table under the heading entitled “Expenses Paid During Period” to estimate the expenses you paid on your account during this period.
| Beginning Account Value 7/1/07 | Ending Account Value 12/31/07 | Expenses Paid During Period* 7/1/07 – 12/31/07 | Expense Ratio During Period 7/1/07 – 12/31/07 | |||||||||
BB&T Large Cap VIF | $ | 1,000.00 | $ | 892.70 | $ | 3.72 | 0.78 | % | ||||
BB&T Mid Cap Growth VIF | 1,000.00 | 1,163.60 | 4.53 | 0.83 | % | |||||||
BB&T Capital Manager Equity VIF | 1,000.00 | 951.70 | 0.89 | 0.18 | % | |||||||
BB&T Special Opportunities Equity VIF | 1,000.00 | 993.70 | 5.33 | 1.06 | % | |||||||
BB&T Total Return Bond VIF | 1,000.00 | 1,060.70 | 4.00 | 0.77 | % | |||||||
| * | Expenses are equal to the average account value times the Fund’s annualized expense ratio multiplied by the number of days in the most recent fiscal half-year divided by the number of days in the fiscal year. |
Hypothetical Example for Comparison Purposes
The table below provides information about hypothetical account values and hypothetical expenses based on each BB&T Variable Insurance Funds’ actual expense ratio and an assumed rate of return of 5% per year before expenses, which is not the Fund’s actual return. The hypothetical account values and expenses may not be used to estimate the actual ending account balance or expenses you paid for the period. You may use this information to compare this 5% hypothetical example with the 5% hypothetical examples that appear in the shareholder reports of other funds.
Please note that the expenses shown in the table are meant to highlight your ongoing costs only and do not reflect any transactional costs. Therefore, the table is useful in comparing ongoing costs only, and will not help you determine the relative total costs of owning different funds. In addition, if these transactional costs were included, your costs would have been higher.
| Beginning Account Value 7/1/07 | Ending Account Value 12/31/07 | Expenses Paid During Period* 7/1/07 – 12/31/07 | Expense Ratio During Period 7/1/07 – 12/31/07 | |||||||||
BB&T Large Cap VIF | $ | 1,000.00 | $ | 1,021.27 | $ | 3.97 | 0.78 | % | ||||
BB&T Mid Cap Growth VIF | 1,000.00 | 1,021.02 | 4.23 | 0.83 | % | |||||||
BB&T Capital Manager Equity VIF | 1,000.00 | 1,024.30 | 0.92 | 0.18 | % | |||||||
BB&T Special Opportunities Equity VIF | 1,000.00 | 1,019.86 | 5.40 | 1.06 | % | |||||||
BB&T Total Return Bond VIF | 1,000.00 | 1,021.32 | 3.92 | 0.77 | % | |||||||
| * | Expenses are equal to the average account value times the Fund’s annualized expense ratio multiplied by the number of days in the most recent fiscal half-year divided by the number of days in the fiscal year. |
8
Schedule of Portfolio Investments
December 31, 2007
Shares | Fair Value | ||||
| COMMON STOCKS (97.9%) | |||||
Consumer Discretionary (18.3%) | |||||
| 171,808 | Comcast Corp., Class A(a) | $ | 3,137,214 | ||
| 93,690 | Home Depot, Inc. (The) | 2,524,009 | |||
| 178,399 | KB Home | 3,853,418 | |||
| 42,538 | Target Corp. | 2,126,900 | |||
| 41,565 | Tiffany & Co. | 1,913,237 | |||
| 75,471 | Walt Disney Co. (The) | 2,436,204 | |||
| 15,990,982 | |||||
Consumer Staples (8.1%) | |||||
| 95,290 | Kraft Foods, Inc., Class A | 3,109,313 | |||
| 53,282 | Procter & Gamble Co. | 3,911,964 | |||
| 7,021,277 | |||||
Energy (9.0%) | |||||
| 26,924 | Anadarko Petroleum Corp. | 1,768,637 | |||
| 31,462 | ConocoPhillips | 2,778,095 | |||
| 35,656 | Exxon Mobil Corp. | 3,340,612 | |||
| 7,887,344 | |||||
Financials (19.5%) | |||||
| 46,628 | American International Group, Inc. | 2,718,412 | |||
| 27,387 | Bank of New York Mellon Corp. (The) | 1,335,394 | |||
| 52,715 | Citigroup, Inc. | 1,551,930 | |||
| 479,229 | Countrywide Financial Corp. | 4,284,307 | |||
| 40,909 | JPMorgan Chase & Co. | 1,785,678 | |||
| 102,855 | MGIC Investment Corp. | 2,307,038 | |||
| 118,282 | Progressive Corp. (The) | 2,266,283 | |||
| 25,271 | Wells Fargo & Co. | 762,931 | |||
| 17,011,973 | |||||
Health Care (18.0%) | |||||
| 42,966 | Amgen, Inc.(a) | 1,995,341 | |||
| 33,560 | Eli Lilly & Co. | 1,791,768 | |||
| 68,422 | Johnson & Johnson | 4,563,748 | |||
| 52,842 | Medtronic, Inc. | 2,656,367 | |||
| 58,962 | Merck & Co., Inc. | 3,426,282 | |||
| 54,743 | Pfizer, Inc. | 1,244,308 | |||
| 15,677,814 | |||||
Industrials (5.6%) | |||||
| 73,335 | General Electric Co. | 2,718,528 | |||
| 60,488 | USG Corp.(a) | 2,164,866 | |||
| 4,883,394 | |||||
Information Technology (18.1%) | |||||
| 58,023 | Cisco Systems, Inc.(a) | 1,570,683 | |||
| 98,024 | Dell, Inc.(a) | 2,402,568 | |||
| 80,784 | eBay, Inc.(a) | 2,681,221 | |||
| 125,387 | Intel Corp. | 3,342,817 | |||
| 28,215 | Microsoft Corp. | 1,004,454 | |||
| 65,648 | QUALCOMM, Inc. | 2,583,249 | |||
| 95,870 | Yahoo!, Inc.(a) | 2,229,936 | |||
| 15,814,928 | |||||
Materials (1.3%) | |||||
| 29,870 | Alcoa, Inc. | 1,091,749 | |||
| Total Common Stocks (Cost $83,867,108) | 85,379,461 | ||||
| INVESTMENT COMPANY (1.7%) | |||||
| 1,483,912 | Federated Treasury Obligations Fund, Institutional Shares | 1,483,912 | |||
| Total Investment Company (Cost $1,483,912) | 1,483,912 | ||||
| Total Investments — 99.6% (Cost $85,351,020) | 86,863,373 | ||||
| Net Other Assets (Liabilities) — 0.4% | 308,011 | ||||
| NET ASSETS — 100.0% | $ | 87,171,384 | |||
See notes to Schedules of Portfolio Investments.
See accompanying notes to the financial statements.
9
Schedule of Portfolio Investments
December 31, 2007
Shares | Fair Value | |||||
| COMMON STOCKS (96.1%) | ||||||
Consumer Discretionary (11.5%) | ||||||
| 13,925 | DeVry, Inc. | $ | 723,543 | |||
| 16,530 | Dick’s Sporting Goods, Inc.(a) | 458,873 | ||||
| 13,670 | Focus Media Holding, Ltd., ADR(a) | 776,593 | ||||
| 15,035 | GameStop Corp., Class A(a) | 933,824 | ||||
| 12,685 | Guess?, Inc. | 480,634 | ||||
| 10,190 | Under Armour, Inc., Class A(a) | 444,997 | ||||
| 3,818,464 | ||||||
Consumer Staples (1.1%) | ||||||
| 8,555 | Hansen Natural Corp.(a) | 378,901 | ||||
Energy (9.2%) | ||||||
| 13,450 | Cameron International Corp.(a) | 647,348 | ||||
| 5,380 | Core Laboratories N.V.(a) | 670,994 | ||||
| 4,375 | Diamond Offshore Drilling, Inc. | 621,250 | ||||
| 9,610 | National Oilwell Varco, Inc.(a) | 705,951 | ||||
| 2,950 | Transocean, Inc.(a) | 422,292 | ||||
| 3,067,835 | ||||||
Financials (6.3%) | ||||||
| 5,860 | AllianceBernstein Holding L.P. | 440,965 | ||||
| 1,215 | CME Group, Inc. | 833,490 | ||||
| 26,335 | Invesco, Ltd. | 826,392 | ||||
| 2,100,847 | ||||||
Health Care (12.0%) | ||||||
| 8,075 | ArthroCare Corp.(a) | 388,004 | ||||
| 7,875 | Cerner Corp.(a) | 444,150 | ||||
| 7,100 | Healthways, Inc.(a) | 414,924 | ||||
| 12,825 | Hologic, Inc.(a) | 880,308 | ||||
| 12,975 | LifeCell Corp.(a) | 559,352 | ||||
| 5,515 | Medco Health Solutions, Inc.(a) | 559,221 | ||||
| 13,370 | Thermo Fisher Scientific, Inc.(a) | 771,182 | ||||
| 4,017,141 | ||||||
Industrials (23.1%) | ||||||
| 24,795 | ABB, Ltd., ADR | 714,096 | ||||
| 18,675 | BE Aerospace, Inc.(a) | 987,908 | ||||
| 14,350 | Chicago Bridge & Iron Co. N.V. | 867,314 | ||||
| 23,030 | Corrections Corp of America(a) | 679,615 | ||||
| 1,500 | First Solar, Inc.(a) | 400,710 | ||||
| 5,095 | Foster Wheeler, Ltd.(a) | 789,827 | ||||
| 6,700 | JA Solar Holdings Co, Ltd., ADR.(a) | 467,727 | ||||
| 13,840 | Manitowoc Co., Inc. (The) | 675,807 | ||||
| 9,975 | Monster Worldwide, Inc.(a) | 323,190 | ||||
| 3,375 | Precision Castparts Corp. | 468,112 | ||||
| 10,050 | Stericycle, Inc.(a) | 596,970 | ||||
| 5,625 | SunPower Corp., Class A.(a) | 733,444 | ||||
| 7,704,720 | ||||||
Information Technology (26.1%) | ||||||
| 28,580 | Activision, Inc.(a) | 848,826 | ||||
| 13,265 | Akamai Technologies, Inc.(a) | 458,969 | ||||
| 12,675 | Amphenol Corp., Class A | 587,740 | ||||
| 3,495 | Apple, Inc.(a) | 692,289 | ||||
| 1,090 | Baiducom, Inc., ADR(a) | 425,525 | ||||
| 17,875 | Ciena Corp.(a) | 609,716 | ||||
| 7,880 | Equinix, Inc.(a) | 796,432 | ||||
| 925 | Google, Inc., Class A(a) | 639,619 | ||||
| 15,800 | Juniper Networks, Inc(a) | 524,560 | ||||
| 3,875 | Mastercard, Inc., Class A | 833,900 | ||||
| 7,275 | MEMC Electronic Materials, Inc.(a) | 643,765 | ||||
| 9,775 | MICROS Systems, Inc.(a) | 685,814 | ||||
| 13,070 | Sina Corp.(a) | 579,132 | ||||
| 4,658 | VMware, Inc., Class A(a) | 395,883 | ||||
| 8,722,170 | ||||||
Materials (3.4%) | ||||||
| 4,575 | CF Industries Holdings, Inc. | 503,525 | ||||
| 19,555 | Companhia Vale do Rio Doce, ADR | 638,862 | ||||
| 1,142,387 | ||||||
Telecommunication Services (1.8%) | ||||||
| 14,035 | American Tower Corp., Class A(a) | 597,891 | ||||
Utilities (1.6%) | ||||||
| 8,285 | Allegheny Energy, Inc. | 527,009 | ||||
Total Common Stocks | 32,077,365 | |||||
| EXCHANGE TRADED FUNDS (2.2%) | ||||||
| 6,430 | iShares Russell MidCap Growth Index Fund | 732,634 | ||||
Total Exchange Traded Funds | 732,634 | |||||
| INVESTMENT COMPANY (2.6%) | ||||||
| 891,784 | Federated Treasury Obligations Fund, Institutional Shares | 891,784 | ||||
Total Investment Company | 891,784 | |||||
| Total Investments — 100.9% (Cost $25,128,173) | 33,701,783 | |||||
| Net Other Assets (Liabilities) — (0.9)% | (315,435 | ) | ||||
| NET ASSETS — 100.0% | $ | 33,386,348 | ||||
See notes to Schedules of Portfolio Investments.
See accompanying notes to the financial statements.
10
BB&T Capital Manager Equity VIF
Schedule of Portfolio Investments
December 31, 2007
| Shares | Fair Value | ||||
| AFFILIATED INVESTMENT COMPANIES (99.5%) | |||||
| 157,202 | BB&T Equity Index Fund, Institutional Class | $ | 1,542,151 | ||
| 573,444 | BB&T International Equity Fund, Institutional Class | 4,581,819 | |||
| 424,056 | BB&T Large Cap Fund, Institutional Class | 6,165,777 | |||
| 110,904 | BB&T Mid Cap Growth Fund, Institutional Class | 1,710,147 | |||
| 206,078 | BB&T Mid Cap Value Fund, Institutional Class | 2,528,575 | |||
| 103,261 | BB&T Small Cap Fund, Institutional Class | 1,334,131 | |||
| 537,831 | BB&T U.S. Treasury Money Market Fund, Institutional Class | 537,831 | |||
Total Affiliated Investment Companies | 18,400,431 | ||||
| Total Investments — 99.5% (Cost $19,486,259) | 18,400,431 | ||||
| Net Other Assets (Liabilities) — 0.5% | 94,276 | ||||
| NET ASSETS — 100.0% | $ | 18,494,707 | |||
See notes to Schedules of Portfolio Investments.
See accompanying notes to the financial statements.
11
BB&T Special Opportunities Equity VIF
Schedule of Portfolio Investments
December 31, 2007
Shares | Fair Value | |||||
| COMMON STOCKS (98.7%) | ||||||
Consumer Discretionary (10.4%) | ||||||
| 67,000 | Comcast Corp., Class A(a) | $ | 1,223,420 | |||
| 48,000 | News Corp., Class A | 983,520 | ||||
| 56,000 | XM Satellite Radio Holdings, Inc., Class A(a)(d) | 685,440 | ||||
| 21,300 | Yum! Brands, Inc.(d) | 815,151 | ||||
| 3,707,531 | ||||||
Consumer Staples (2.6%) | ||||||
| 32,490 | Smithfield Foods, Inc.(a) | 939,611 | ||||
Energy (17.5%) | ||||||
| 11,100 | Apache Corp. | 1,193,694 | ||||
| 25,000 | CONSOL Energy, Inc.(d) | 1,788,000 | ||||
| 23,000 | Nabors Industries, Ltd.(a) | 629,970 | ||||
| 22,200 | Noble Corp.(d) | 1,254,522 | ||||
| 20,000 | Weatherford International, Ltd.(a)(d) | 1,372,000 | ||||
| 6,238,186 | ||||||
Financials (3.5%) | ||||||
| 1,100 | Markel Corp.(a) | 540,210 | ||||
| 23,800 | Wells Fargo & Co. | 718,522 | ||||
| 1,258,732 | ||||||
Health Care (19.8%) | ||||||
| 24,000 | Amgen, Inc.(a) | 1,114,560 | ||||
| 10,100 | Coventry Health Care, Inc.(a) | 598,425 | ||||
| 20,000 | McKesson Corp. | 1,310,200 | ||||
| 8,638 | MedCath Corp.(a) | 212,149 | ||||
| 27,000 | Teva Pharmaceutical Industries, Ltd., ADR | 1,254,960 | ||||
| 19,000 | UnitedHealth Group, Inc. | 1,105,800 | ||||
| 28,000 | Varian Medical Systems, Inc.(a)(d) | 1,460,480 | ||||
| 7,056,574 | ||||||
Industrials (8.8%) | ||||||
| 25,000 | JB Hunt Transport Services, Inc. | 688,750 | ||||
| 8,500 | L-3 Communications Holdings, Inc.(d) | 900,490 | ||||
| 70,000 | Southwest Airlines Co. | 854,000 | ||||
| 25,000 | Trinity Industries, Inc. | 694,000 | ||||
| 3,137,240 | ||||||
Information Technology (25.8%) | ||||||
| 67,510 | ACI Worldwide, Inc.(a) | 1,285,391 | ||||
| 29,000 | Akamai Technologies, Inc.(a) | 1,003,400 | ||||
| 95,000 | ARM Holdings PLC, ADR | 703,000 | ||||
| 48,000 | Cisco Systems, Inc.(a) | 1,299,355 | ||||
| 57,000 | Corning, Inc.(d) | 1,367,430 | ||||
| 26,169 | Digital River, Inc.(a) | 865,409 | ||||
| 14,000 | Harris Corp. | 877,520 | ||||
| 44,950 | Symantec Corp.(a) | 725,493 | ||||
| 45,000 | Yahoo!, Inc.(a) | 1,046,700 | ||||
| 9,173,698 | ||||||
Materials (10.3%) | ||||||
| 16,000 | Aracruz Celulose SA, ADR | 1,189,600 | ||||
| 19,000 | Dow Chemical Co. (The) | 748,980 | ||||
| 40,200 | Nalco Holding Co. | 972,036 | ||||
| 32,065 | Sealed Air Corp. | 741,984 | ||||
| 3,652,600 | ||||||
Total Common Stocks | 35,164,172 | |||||
| INVESTMENT COMPANY (6.9%) | ||||||
| 2,455,098 | Federated Treasury Obligations Fund, | |||||
| Institutional Shares | 2,455,098 | |||||
Total Investment Company | 2,455,098 | |||||
| Total Investments — 105.6% (Cost $31,775,775) | 37,619,270 | |||||
| Net Other Assets (Liabilities) — (5.6)% | (1,999,623 | ) | ||||
| NET ASSETS — 100.0% | $ | 35,619,647 | ||||
See notes to Schedules of Portfolio Investments.
See accompanying notes to the financial statements.
12
Schedule of Portfolio Investments
December 31, 2007
Principal | Fair Value | |||||
| ASSET BACKED SECURITIES (6.4%) | ||||||
| $ | 80,000 | American Express Credit Account Master Trust, Series 2004-5, Class A, 5.118%, 4/16/12*(b) | $ | 79,804 | ||
| 260,000 | Capital One Master Trust, Series 2001-1, Class A, 5.228%, 12/15/10*(b) | 260,115 | ||||
| 122,000 | Carmax Auto Owner Trust, Series 2007-2, Class A3, 5.230%, 12/15/11 | 123,263 | ||||
| 52,000 | Centex Home Equity, Series 2005-C, Class AF6 STEP, 4.638%, 6/25/35 | 49,024 | ||||
| 98,000 | Chase Funding Mortgage Loan Asset-Backed Certificates, Series 2003-4, Class 1A5 STEP, 5.416%, 5/25/33 | 92,425 | ||||
| 58,000 | MBNA Credit Card Master Note Trust, Series 2001-A5, Class A5, 5.238%, 3/15/11*(b) | 58,033 | ||||
| 115,000 | MBNA Credit Card Master Note Trust, Series 2003-A8, Class A8, 5.218%, 12/17/12*(b) | 114,742 | ||||
| 115,000 | MBNA Credit Card Master Note Trust, Series 2002-A8, Class A8, 5.393%, 12/15/11*(b) | 114,869 | ||||
Total Asset Backed Securities | 892,275 | |||||
| COLLATERALIZED MORTGAGE OBLIGATIONS (1.2%) | ||||||
Federal Home Loan Mortgage Corp. (0.7%) | ||||||
| 46,774 | 5.000%, 8/15/31, Series 3025, Class AB | 46,838 | ||||
| 49,169 | 5.500%, 7/15/16, Series 3061, Class VU | 50,253 | ||||
| 97,091 | ||||||
Federal National Mortgage Association (0.5%) | ||||||
| 37,171 | 4.000%, 1/25/18, Series 2003-35, Class NA | 36,372 | ||||
| 41,652 | 5.500%, 10/25/24, Series 2006-18, Class CA | 42,221 | ||||
| 78,593 | ||||||
Total Collateralized Mortgage Obligations | 175,684 | |||||
| COMMERCIAL MORTGAGE-BACKED SECURITIES (6.5%) | ||||||
| 25,000 | Banc of America Commercial Mortgage, Inc., Series 2004-6, Class A5, 4.811%, 12/10/42 | 24,688 | ||||
| 125,000 | Citigroup/Deutsche Bank Commercial Mortgage Trust, Series 2006-CD3, Class A3, 5.607%, 10/15/48 | 126,251 | ||||
| 78,000 | CS First Boston Mortgage Securities Corp., Series 2005-C5, Class A3, 5100%, 8/15/38* | 77,179 | ||||
| 28,000 | Merrill Lynch/Countrywide Commercial Mortgage Trust, Series 2006-3, Class A3, 5389%, 7/12/46* | 28,004 | ||||
| 300,000 | Morgan Stanley Capital I, Series 2007-IQ13, Class A3, 5330%, 3/15/44 | 297,561 | ||||
| 173,000 | Wachovia Bank Commercial Mortgage Trust, Series 2005-C22, Class A4, 5.266%, 12/15/44* | 173,147 | ||||
| 187,000 | Wachovia Bank Commercial Mortgage Trust, Series 2007-C33, Class A3, 5.903%, 2/15/51* | 192,283 | ||||
Total Commercial Mortgage-Backed Securities | 919,113 | |||||
| CORPORATE BONDS (23.2%) | ||||||
Consumer Discretionary (0.7%) | ||||||
| 48,000 | Historic TW, Inc., 9.125%, 1/15/13 | 54,532 | ||||
| 44,000 | Time Warner, Inc., 5.875%, 11/15/16 | 43,729 | ||||
| 98,261 | ||||||
Consumer Staples (1.5%) | ||||||
| 60,000 | Coca-Cola Co. (The), 5.350%, 11/15/17 | 61,473 | ||||
| 42,000 | CVS Caremark Corp., 5.750%, 8/15/11 | 43,022 | ||||
| 112,000 | CVS Caremark Corp., 4.875%, 9/15/14 | 108,172 | ||||
| 212,667 | ||||||
Energy (0.5%) | ||||||
| 68,000 | Peabody Energy Corp., Series B, 6.875%, 3/15/13 | 68,340 | ||||
Financials (10.4%) | ||||||
| 45,000 | American International Group, Inc., MTN, Series G, 5.850%, 1/16/18 | 45,295 | ||||
| 25,000 | Bank of America Corp., 6.250%, 4/15/12 | 26,252 | ||||
| 250,000 | Bank of America Corp., 5.125%, 11/15/14 | 246,084 | ||||
| 36,000 | Bank of America Corp., 5.750%, 12/1/17 | 36,083 | ||||
| 32,000 | Capital One Financial Corp., 5.500%, 6/1/15 | 29,516 | ||||
| 28,000 | ERP Operating LP, 5.125%, 3/15/16 | 26,051 | ||||
| 55,000 | GATX Financial Corp., 5.125%, 4/15/10 | 54,153 | ||||
| 182,000 | General Electric Capital Corp., MTN, Series A, 6.000%, 6/15/12 | 190,797 | ||||
| 77,000 | Goldman Sachs Group, Inc. (The), 5.450%, 11/1/12 | 78,498 | ||||
| 26,000 | Goldman Sachs Group, Inc. (The), 5.125%, 1/15/15 | 25,541 | ||||
| 120,000 | IBM International Group Capital LLC, 5.050%, 10/22/12 | 122,242 | ||||
| 40,000 | Lehman Brothers Holdings, Inc., MTN, Series G, 4.800%, 3/13/14 | 37,228 | ||||
| 130,000 | Lehman Brothers Holdings, Inc., MTN, Series I, 6.200%, 9/26/14 | 132,401 | ||||
| 178,000 | Prudential Financial, Inc., MTN, Series B, 5.100%, 9/20/14 | 175,704 | ||||
| 45,000 | Prudential Financial, Inc., MTN, Series D, 6.625%, 12/1/37 | 45,378 | ||||
| 188,000 | Wells Fargo & Co., 5.625%, 12/11/17 | 188,115 | ||||
| 1,459,338 | ||||||
Health Care (1.2%) | ||||||
| 78,000 | Cardinal Health, Inc., 4.000%, 6/15/15 | 71,775 | ||||
| 90,000 | Laboratory Corp. of America Holdings, 5.625%, 12/15/15 | 88,576 | ||||
| 160,351 | ||||||
Industrials (2.4%) | ||||||
| 111,000 | Allied Waste North America, Inc., 6.875%, 6/1/17 | 108,225 | ||||
| 115,000 | Corrections Corp. of America, 6.250%, 3/15/13 | 113,275 | ||||
| 60,000 | General Dynamics Corp., 4.250%, 5/15/13 | 58,849 | ||||
| 60,000 | Goodrich (BF) Corp., 6.290%, 7/1/16 | 62,439 | ||||
| 342,788 | ||||||
Information Technology (3.7%) | ||||||
| 71,000 | Cisco Systems, Inc., 5.500%, 2/22/16 | 72,205 | ||||
| 70,000 | Hewlett-Packard Co., 6.500%, 7/1/12 | 75,636 | ||||
| 110,000 | Hewlett-Packard Co., 5.400%, 3/1/17 | 109,756 | ||||
| 65,000 | International Business Machines Corp., 5.700%, 9/14/17 | 67,195 | ||||
| 157,000 | Oracle Corp. and Ozark Holding, Inc., 5.000%, 1/15/11 | 159,076 | ||||
Continued
13
BB&T Total Return Bond VIF
Schedule of Portfolio Investments — (continued)
December 31, 2007
Principal | Fair Value | |||||
| CORPORATE BONDS — (continued) | ||||||
Information Technology — (continued) | ||||||
| $ | 35,000 | Oracle Corp. and Ozark Holding, Inc., 5.250%, 1/15/16 | $ | 34,931 | ||
| 518,799 | ||||||
Telecommunication Services (1.1%) | ||||||
| 144,000 | New Cingular Wireless Services, Inc., 8.125%, 5/1/12 | 160,116 | ||||
Utilities (1.7%) | ||||||
| 208,000 | Duke Energy Carolinas LLC, 6.250%, 1/15/12. | 219,327 | ||||
| 24,000 | Ohio Power Co., Series K, 6.000%, 6/1/16 | 24,260 | ||||
| 243,587 | ||||||
Total Corporate Bonds | 3,264,247 | |||||
| MORTGAGE-BACKED SECURITIES (39.0%) | ||||||
Federal Home Loan Mortgage Corp. (15.5%) | ||||||
| 111,365 | 6.000%, 10/1/19, Pool #G11679 | 114,083 | ||||
| 52,105 | 5.500%, 10/1/21, Pool #G12425 | 52,743 | ||||
| 59,097 | 5.500%, 11/1/21, Pool #G12454 | 59,820 | ||||
| 65,871 | 5.000%, 1/1/22, Pool #J04202 | 65,944 | ||||
| 115,450 | 5.000%, 5/1/22, Pool #J04788 | 115,577 | ||||
| 332,671 | 5.000%, 8/1/22, Pool #J05384 | 333,036 | ||||
| 41,250 | 4.500%, 6/1/35, Pool #G01842 | 39,014 | ||||
| 35,823 | 5.500%, 7/1/35, Pool #A36540 | 35,763 | ||||
| 22,375 | 6.000%, 7/1/35, Pool #A36304 | 22,726 | ||||
| 21,067 | 5.500%, 12/1/35, Pool #A40359 | 21,031 | ||||
| 67,467 | 5.500%, 2/1/36, Pool #G08111 | 67,336 | ||||
| 49,603 | 5.500%, 4/1/36, Pool #A44445 | 49,507 | ||||
| 114,607 | 5.897%, 12/1/36, Pool #1J1390* | 116,188 | ||||
| 77,413 | 5.965%, 1/1/37, Pool #1Q0192* | 78,796 | ||||
| 107,074 | 5.500%, 4/1/37, Pool #G08192 | 106,853 | ||||
| 64,431 | 6.000%, 4/1/37, Pool #A58853 | 65,394 | ||||
| 51,475 | 5.000%, 6/1/37, Pool #G03094 | 50,226 | ||||
| 226,552 | 6.000%, 8/1/37, Pool #A64067 | 229,935 | ||||
| 179,019 | 5.781%, 9/1/37, Pool #1Q0319* | 179,729 | ||||
| 370,000 | 6.000%, 1/15/38(c) | 375,435 | ||||
| 2,179,136 | ||||||
Federal National Mortgage Association (21.7%) | ||||||
| 26,245 | 4.500%, 10/1/18, Pool #752030 | 25,823 | ||||
| 17,567 | 5.500%, 11/1/20, Pool #843972 | 17,801 | ||||
| 19,637 | 5.500%, 12/1/20, Pool #831138 | 19,899 | ||||
| 46,458 | 5.500%, 5/1/21, Pool #895628 | 47,077 | ||||
| 66,791 | 5.500%, 6/1/21, Pool #831526 | 67,665 | ||||
| 320,547 | 5.500%, 4/1/22, Pool #914937 | 324,706 | ||||
| 24,059 | 6.000%, 9/1/22, Pool #907006 | 24,623 | ||||
| 277,840 | 6.000%, 11/1/22, Pool #948159 | 284,354 | ||||
| 56,746 | 5.000%, 10/1/25, Pool #255894 | 55,958 | ||||
| 65,768 | 5.500%, 2/1/27, Pool #256600 | 66,063 | ||||
| 251,242 | 5.500%, 1/1/34, Pool #757571 | 251,428 | ||||
| 57,426 | 6.000%, 9/1/34, Pool #790912 | 58,394 | ||||
| 62,357 | 6.500%, 9/1/34, Pool #796569 | 64,271 | ||||
| 30,724 | 7.000%, 6/1/35, Pool #255820 | 32,076 | ||||
| 112,426 | 5.000%, 11/1/35, Pool #842402 | 109,759 | ||||
| 28,505 | 5.500%, 2/1/36, Pool #256101 | 28,487 | ||||
| 42,960 | 5.621%, 5/1/36, Pool #871259* | 42,888 | ||||
| 44,575 | 5.436%, 6/1/36, Pool #905183* | 44,738 | ||||
| 71,145 | 5.500%, 12/1/36, Pool #922224 | 71,068 | ||||
| 358,558 | 5.500%, 12/1/36, Pool #928043 | 358,171 | ||||
| 67,666 | 6.000%, 12/1/36, Pool #902054 | 68,728 | ||||
| 135,756 | 5.000%, 1/1/37, Pool #920727 | 132,490 | ||||
| 300,570 | 5.500%, 1/1/37, Pool #256552 | 300,245 | ||||
| 62,560 | 6.000%, 1/1/37, Pool #906095 | 63,542 | ||||
| 108,267 | 5.000%, 3/1/37, Pool 911395 | 105,641 | ||||
| 62,484 | 6.000%, 4/1/37, Pool #914725 | 63,456 | ||||
| 95,441 | 6.000%, 7/1/37, Pool #256800 | 96,925 | ||||
| 220,000 | 5.920%, 12/1/37, Pool #966223* | 222,336 | ||||
| 3,048,612 | ||||||
Government National Mortgage Association (1.8%) | ||||||
| 262,000 | 5.000%, 1/15/38(c) | 258,152 | ||||
Total Mortgage-Backed Securities | 5,485,900 | |||||
| MUNICIPAL BONDS (5.0%) | ||||||
California (0.5%) | ||||||
| 65,000 | Fresno, CA, County Pension Obligation Revenue Bonds, Series A (FGIC), 4.198%, 8/15/13 | 62,602 | ||||
Florida (0.5%) | ||||||
| 10,000 | Gainesville, FL, Post Employment Benefits Pension Revenue Bonds, Retiree Health Care Plan (MBIA), 4.680%, 10/1/13 | 9,988 | ||||
| 36,000 | Gainesville, FL, Post Employment Benefits Pension Revenue Bonds, Retiree Health Care Plan (MBIA), 4.710%, 10/1/14 | 35,747 | ||||
| 13,000 | Palm Beach County, FL, Refunding Land Acquisition G.O., 5.735%, 6/1/12 | 13,657 | ||||
| 13,000 | Palm Beach County, FL, Refunding Land Acquisition G.O., 5.784%, 6/1/13 | 13,756 | ||||
| 73,148 | ||||||
Illinois (0.2%) | ||||||
| 30,000 | Chicago, IL, Public Improvements G.O., Series B, OID (XLCA), 5.250%, 1/1/12 | 30,804 | ||||
Maryland (0.9%) | ||||||
| 125,000 | Howard County, MD, Construction Public Improvements Refunding G.O., Series B, 5.000%, 2/15/11 | 131,955 | ||||
Michigan (0.5%) | ||||||
| 75,000 | Michigan Municipal Bond Authority, Refunding School Loan Revenue Bonds (FGIC), 5.222%, 6/1/14 | 75,754 | ||||
Mississippi (0.6%) | ||||||
| 75,000 | Mississippi State, Small Enterprises G.O., Series C, 4.750%, 12/1/11 | 76,552 | ||||
New York (0.6%) | ||||||
| 85,000 | New York City Transitional Finance Authority, NY, Public Improvements Revenue Bonds, Series D-TXBL, OID, 4.800%, 2/1/13 | 86,457 | ||||
South Carolina (0.3%) | ||||||
| 40,000 | South Carolina Transportation Infrastructure Bank, Transit Improvements Revenue Bonds, Series A, Prerefunded 10/1/09 @ 101 (AMBAC), 5.500%, 10/1/15 | 42,063 | ||||
Continued
14
BB&T Total Return Bond VIF
Schedule of Portfolio Investments — (continued)
December 31, 2007
Principal | Fair Value | ||||||
| MUNICIPAL BONDS — (continued) | |||||||
Wisconsin (0.9%) | |||||||
| $ | 120,000 | Wisconsin State General Pension Funding Revenue Bonds, Series A, OID (FSA), 4.800%, 5/1/13 | $ | 120,800 | |||
Total Municipal Bonds | 700,135 | ||||||
| U.S. GOVERNMENT AGENCIES (9.4%) | |||||||
Federal Home Loan Bank (2.6%) | |||||||
| 290,000 | 5.000%, 9/14/12 | 303,073 | |||||
| 65,000 | 5.250%, 9/13/13 | 68,938 | |||||
| 372,011 | |||||||
Federal Home Loan Mortgage Corp. (1.7%) | |||||||
| 223,000 | 4.875%, 11/15/13 | 232,530 | |||||
| 232,530 | |||||||
Federal National Mortgage Association (5.1%) | |||||||
| 279,000 | 6.125%, 3/15/12 | 303,116 | |||||
| 405,000 | 4.875%, 5/18/12 | 420,805 | |||||
| 723,921 | |||||||
Total U.S. Government Agencies | 1,328,462 | ||||||
| U.S. TREASURY NOTES (12.0%) | |||||||
| 568,000 | 4.250%, 8/15/14(b) | 587,303 | |||||
| 1,036,000 | 4.750%, 8/15/17 | 1,094,194 | |||||
Total U.S. Treasury Notes | 1,681,497 | ||||||
Shares | |||||||
| INVESTMENT COMPANY (2.2%) | |||||||
| 306,255 | Federated Treasury Obligations Fund, Institutional Shares | 306,255 | |||||
Total Investment Company | 306,255 | ||||||
| | Total Investments — 104.9% (Cost $14,550,009) | 14,753,568 | |||||
| Net Other Assets (Liabilities) — (4.9)% | (689,928 | ) | |||||
| NET ASSETS — 100.0% | $ | 14,063,640 | |||||
See notes to Schedules of Portfolio Investments.
See accompanying notes to the financial statements.
15
Schedule of Portfolio Investments
Notes to Schedules of Portfolio Investments
December 31, 2007
| (a) | Represents non-income producing security. |
| (b) | Represents that all or a portion of the security was pledged as collateral for securities purchased on a when-issued basis. |
| (c) | Represents a security purchased on a when-issued basis. At December 31, 2007, total cost of investments purchased on a when-issued basis for the BB&T Total Return Bond VIF was $633,586. |
| (d) | Security held as collateral for written call option. |
| * | The interest rate for this variable rate note, which will change periodically, is based either on the prime rate or an index of market rates. The reflected rate is in effect as of December 31, 2007. For bond funds, the maturity date reflected is the final maturity date. |
ADR — American Depository Receipt.
AMBAC — Insured by AMBAC Indemnity Corp.
FGIC — Insured by the Financial Guaranty Insurance Corp.
FSA — Insured by Financial Security Assurance.
G.O. — General Obligation.
LLC — Limited Liability Company.
MBIA — Insured by the Municipal Bond Insurance Association.
MTN — Medium Term Note.
OID — Original Issue Discount.
STEP — Step Coupon Bond.
XLCA — Insured by XL Capital Assurance.
See accompanying notes to the financial statements.
16
Statements of Assets and Liabilities
December 31, 2007
| BB&T Large Cap VIF | BB&T Mid Cap Growth VIF | BB&T Capital Manager Equity VIF | BB&T Special Opportunities Equity VIF | BB&T Total Return Bond VIF | |||||||||||||
Assets: | |||||||||||||||||
Investments: | |||||||||||||||||
Unaffiliated investments, at cost | $ | 85,351,020 | $ | 25,128,173 | $ | — | $ | 31,775,775 | $ | 14,550,009 | |||||||
Investment in affiliates, at cost | — | — | 19,486,259 | — | — | ||||||||||||
Total investments, at cost | 85,351,020 | 25,128,173 | 19,486,259 | 31,775,775 | 14,550,009 | ||||||||||||
Unrealized appreciation (depreciation) | 1,512,353 | 8,573,610 | (1,085,828 | ) | 5,843,495 | 203,559 | |||||||||||
Investments, at value | 86,863,373 | 33,701,783 | 18,400,431 | 37,619,270 | 14,753,568 | ||||||||||||
Cash | — | — | — | — | 2 | ||||||||||||
Interest and dividends receivable | 120,346 | 5,438 | 21,466 | 22,476 | 129,295 | ||||||||||||
Maturities receivable | — | — | — | — | 5,185 | ||||||||||||
Receivable for investments sold | — | — | — | 12,729 | — | ||||||||||||
Receivable for capital shares issued | 236,194 | 55,215 | 77,439 | 35,822 | — | ||||||||||||
Receivable from Advisor | — | — | 1,797 | — | — | ||||||||||||
Prepaid and other expenses | 37,990 | 13,451 | 7,753 | 14,181 | 5,789 | ||||||||||||
Total Assets | 87,257,903 | 33,775,887 | 18,508,886 | 37,704,478 | 14,893,839 | ||||||||||||
Liabilities: | |||||||||||||||||
Call options written (premiums received $ — , | — | — | — | 375,630 | — | ||||||||||||
Payable for investments purchased | — | — | — | 1,609,987 | 706,986 | ||||||||||||
Payable for capital shares redeemed | 622 | 360,517 | 7,619 | 64,325 | 112,229 | ||||||||||||
Accrued expenses and other payables: | |||||||||||||||||
Investment advisory fees | 70,430 | 17,301 | — | 22,577 | 3,522 | ||||||||||||
Administration fees | 7,009 | 2,587 | — | 2,753 | 1,105 | ||||||||||||
Compliance service fees | 79 | — | 5 | 91 | 77 | ||||||||||||
Legal fees | — | 1,183 | 821 | 1,236 | 419 | ||||||||||||
Printing fees | — | 1,246 | 1,242 | 1,741 | 547 | ||||||||||||
Transfer agency fees | 6,302 | 2,217 | 1,673 | 2,419 | 846 | ||||||||||||
Other fees | 2,077 | 4,488 | 2,819 | 4,072 | 4,468 | ||||||||||||
Total Liabilities | 86,519 | 389,539 | 14,179 | 2,084,831 | 830,199 | ||||||||||||
Net Assets: | |||||||||||||||||
Capital | 73,062,911 | 20,271,031 | 16,590,175 | 28,721,105 | 13,826,635 | ||||||||||||
Accumulated undistributed net investment income | — | — | 19,457 | — | 167,126 | ||||||||||||
Accumulated realized gains (losses) from investments and written options | 12,596,120 | 4,541,707 | 2,970,903 | 1,224,581 | (133,680 | ) | |||||||||||
Net unrealized appreciation/(depreciation) on investments and written options | 1,512,353 | 8,573,610 | (1,085,828 | ) | 5,673,961 | 203,559 | |||||||||||
Net Assets | $ | 87,171,384 | $ | 33,386,348 | $ | 18,494,707 | $ | 35,619,647 | $ | 14,063,640 | |||||||
Shares of Beneficial Interest Outstanding (unlimited number of shares authorized, no par value) | 6,365,818 | 1,825,776 | 1,789,604 | 2,221,568 | 1,403,726 | ||||||||||||
Net Asset Value — offering and redemption price per share | $ | 13.69 | $ | 18.29 | $ | 10.33 | $ | 16.03 | $ | 10.02 | |||||||
See accompanying notes to the financial statements.
17
BB&T Variable Insurance Funds
Statements of Operations
For the Year Ended December 31, 2007
| BB&T Large Cap VIF | BB&T Mid Cap Growth VIF | BB&T Capital Manager Equity VIF | BB&T Special Opportunities Equity VIF | BB&T Total Return Bond VIF | ||||||||||||||||
Investment Income: | ||||||||||||||||||||
Interest income | $ | 29,700 | $ | 22,039 | $ | — | $ | 38,165 | $ | 535,999 | ||||||||||
Dividend income | 2,242,083 | 101,039 | — | 230,697 | 8,777 | |||||||||||||||
Dividend income from affiliates | — | — | 471,577 | — | — | |||||||||||||||
Foreign tax withholding | — | (2,284 | ) | — | (6,244 | ) | — | |||||||||||||
Income from securities lending | 13,951 | 47,238 | — | 4,093 | 2,233 | |||||||||||||||
Total investment income | 2,285,734 | 168,032 | 471,577 | 266,711 | 547,009 | |||||||||||||||
Expenses: | ||||||||||||||||||||
Investment advisory fees (See Note 4) | 743,323 | 215,769 | 48,103 | 236,897 | 63,041 | |||||||||||||||
Administration fees (See Note 4) | 99,752 | 28,778 | 6,555 | 29,069 | 10,188 | |||||||||||||||
Compliance service fees (See Note 4) | 7,306 | 1,834 | 1,311 | 1,814 | 617 | |||||||||||||||
Trustee fees | 25,623 | 6,922 | 4,685 | 6,739 | 2,228 | |||||||||||||||
Audit fees | 55,210 | 15,688 | 10,500 | 15,433 | 6,014 | |||||||||||||||
Custodian fees | 5,057 | 1,372 | 938 | 1,403 | 477 | |||||||||||||||
Fund accounting fees (See Note 4) | 9,369 | 2,796 | 1,838 | 2,845 | 1,015 | |||||||||||||||
Insurance fees | 3080 | 855 | 73 | 684 | 707 | |||||||||||||||
Interest expense | — | 5 | — | — | — | |||||||||||||||
Legal fees | 40,824 | 9,583 | 6,794 | 9,250 | 2,926 | |||||||||||||||
Printing fees | 51,945 | 8,952 | 7,649 | 8,913 | 4,347 | |||||||||||||||
Transfer agent fees (See Note 4) | 29,974 | 9,061 | 6,315 | 9,411 | 3,470 | |||||||||||||||
Other fees | 19,018 | 6,393 | 3,518 | 5,790 | 10,814 | |||||||||||||||
Total expenses before waivers | 1,090,481 | 308,008 | 98,279 | 328,248 | 105,844 | |||||||||||||||
Less expenses reimbursed or waived by the Investment Advisor | (317,724 | ) | (75,690 | ) | (57,157 | ) | (14,777 | ) | (24,453 | ) | ||||||||||
Less expenses waived by the Administrator | — | — | (6,555 | ) | — | — | ||||||||||||||
Net expenses | 772,757 | 232,318 | 34,567 | 313,471 | 81,391 | |||||||||||||||
Net investment income (loss) | 1,512,977 | (64,286 | ) | 437,010 | (46,760 | ) | 465,618 | |||||||||||||
Realized/Unrealized Gains (Losses) on | ||||||||||||||||||||
Net realized gains (losses) from: | ||||||||||||||||||||
Investments | 12,657,230 | 4,623,497 | — | 1,062,781 | 75,270 | |||||||||||||||
Distributions from affiliated funds | — | — | 2,999,843 | — | — | |||||||||||||||
Written Options | — | — | — | 215,736 | — | |||||||||||||||
Affiliated investment transactions | — | — | (28,915 | ) | — | — | ||||||||||||||
Change in unrealized appreciation/depreciation on: | ||||||||||||||||||||
Investments | (19,468,983 | ) | 4,163,473 | (3,018,705 | ) | 2,156,916 | 204,918 | |||||||||||||
Written Options | — | — | — | (207,781 | ) | — | ||||||||||||||
Net realized/unrealized gains (losses) on investments and written options | (6,811,753 | ) | 8,786,970 | (47,777 | ) | 3,227,652 | 280,188 | |||||||||||||
Change in net assets from operations | $ | (5,298,776 | ) | $ | 8,722,684 | $ | 389,233 | $ | 3,180,892 | $ | 745,806 | |||||||||
See accompanying notes to the financial statements.
18
BB&T Variable Insurance Funds
Statements of Changes in Net Assets
| BB&T Large Cap VIF | BB&T Mid Cap Growth VIF | |||||||||||||||
| For the Year Ended December 31, 2007 | For the Year Ended December 31, 2006 | For the Year Ended December 31, 2007 | For the Year Ended December 31, 2006 | |||||||||||||
From Investment Activities: | ||||||||||||||||
Operations: | ||||||||||||||||
Net investment income (loss) | $ | 1,512,977 | $ | 1,935,959 | $ | (64,286 | ) | $ | 97,117 | |||||||
Net realized gains (losses) on investments, distributions from underlying funds and written options | 12,657,230 | 18,508,713 | 4,623,497 | 6,928,124 | ||||||||||||
Change in unrealized appreciation/depreciation of investments and written options | (19,468,983 | ) | 1,298,734 | 4,163,473 | (6,370,282 | ) | ||||||||||
Change in net assets from operations | (5,298,776 | ) | 21,743,406 | 8,722,684 | 654,959 | |||||||||||
Distributions to Shareholders: | ||||||||||||||||
Net investment income | (1,937,234 | ) | (1,597,154 | ) | (377 | ) | (169,918 | ) | ||||||||
Net realized gains from investment transactions | (11,116,882 | ) | — | (3,179,274 | ) | (2,384,160 | ) | |||||||||
Change in net assets from shareholder distributions | (13,054,116 | ) | (1,597,154 | ) | (3,179,651 | ) | (2,554,078 | ) | ||||||||
Capital Transactions: | ||||||||||||||||
Proceeds from shares issued | 15,112,419 | 3,613,319 | 3,804,286 | 5,338,345 | ||||||||||||
Proceeds from shares issued in conversion (Note 5) | 13,750,356 | — | — | — | ||||||||||||
Distributions reinvested | 13,054,115 | 1,597,154 | 3,179,651 | 2,554,078 | ||||||||||||
Value of shares redeemed | (29,535,278 | ) | (12,806,788 | ) | (4,600,823 | ) | (3,965,432 | ) | ||||||||
Redemption In-Kind | — | (33,055,269 | ) | — | (15,658,169 | ) | ||||||||||
Change in net assets from capital transactions | 12,381,612 | (40,651,584 | ) | 2,383,114 | (11,731,178 | ) | ||||||||||
Change in net assets | (5,971,280 | ) | (20,505,332 | ) | 7,926,147 | (13,630,297 | ) | |||||||||
Net Assets: | ||||||||||||||||
Beginning of year | 93,142,664 | 113,647,996 | 25,460,201 | 39,090,498 | ||||||||||||
End of year | $ | 87,171,384 | $ | 93,142,664 | $ | 33,386,348 | $ | 25,460,201 | ||||||||
Accumulated undistributed net investment income | $ | — | $ | 363,182 | $ | — | $ | — | ||||||||
Share Transactions: | ||||||||||||||||
Issued | 907,626 | 236,412 | 219,708 | 336,699 | ||||||||||||
Issued in conversion (Note 5) | 810,901 | — | — | — | ||||||||||||
Reinvested | 869,273 | 106,704 | 196,637 | 175,022 | ||||||||||||
Redeemed | (1,781,498 | ) | (850,964 | ) | (270,101 | ) | (259,014 | ) | ||||||||
Redemption In-Kind | — | (2,053,122 | ) | — | (1,067,360 | ) | ||||||||||
Change in Shares | 806,302 | (2,560,970 | ) | 146,244 | (814,653 | ) | ||||||||||
See accompanying notes to the financial statements.
19
BB&T Variable Insurance Funds
Statements of Changes in Net Assets
BB&T | BB&T Special Opportunities Equity VIF | BB&T Total Return Bond VIF | ||||||||||||||||||||
For the | For the Year Ended December 31, 2006 | For the Year Ended December 31, 2007 | For the Year Ended December 31, 2006 | For the Year Ended December 31, 2007 | For the Year Ended December 31, 2006 | |||||||||||||||||
| $ | 437,010 | $ | 303,744 | $ | (46,760 | ) | $ | (16,818 | ) | $ | 465,618 | $ | 838,101 | |||||||||
| 2,970,928 | 2,638,203 | 1,278,517 | 6,508,365 | 75,270 | (30,159 | ) | ||||||||||||||||
| (3,018,705 | ) | 327,925 | 1,949,135 | 767,928 | 204,918 | 124,775 | ||||||||||||||||
| 389,233 | 3,269,872 | 3,180,892 | 7,259,475 | 745,806 | 932,717 | |||||||||||||||||
| (512,781 | ) | (252,133 | ) | — | (20,982 | ) | (456,227 | ) | (831,872 | ) | ||||||||||||
| (2,014,013 | ) | (1,067,700 | ) | (2,016,836 | ) | (1,809,941 | ) | — | — | |||||||||||||
| (2,526,794 | ) | (1,319,833 | ) | (2,016,836 | ) | (1,830,923 | ) | (456,227 | ) | (831,872 | ) | |||||||||||
| 2,591,141 | 4,965,546 | 12,942,110 | 6,523,307 | 8,183,083 | 4,002,998 | |||||||||||||||||
| — | — | — | — | — | — | |||||||||||||||||
| 2,526,794 | 1,319,833 | 2,016,836 | 1,830,923 | 482,039 | 831,872 | |||||||||||||||||
| (2,708,114 | ) | (1,316,172 | ) | (1,797,100 | ) | (1,373,589 | ) | (1,658,187 | ) | (583,849 | ) | |||||||||||
| — | (17,418,807 | ) | — | (22,883,690 | ) | — | (16,361,455 | ) | ||||||||||||||
| 2,409,821 | (12,449,600 | ) | 13,161,846 | (15,903,049 | ) | 7,006,935 | (12,110,434 | ) | ||||||||||||||
| 272,260 | (10,499,561 | ) | 14,325,902 | (10,474,497 | ) | 7,296,514 | (12,009,589 | ) | ||||||||||||||
| 18,222,447 | 28,722,008 | 21,293,745 | 31,768,242 | 6,767,126 | 18,776,715 | |||||||||||||||||
| $ | 18,494,707 | $ | 18,222,447 | $ | 35,619,647 | $ | 21,293,745 | $ | 14,063,640 | $ | 6,767,126 | |||||||||||
| $ | 19,457 | $ | 95,228 | $ | — | $ | — | $ | 167,126 | $ | 164,983 | |||||||||||
| 222,208 | 452,112 | 789,817 | 472,777 | 834,990 | 408,945 | |||||||||||||||||
| — | — | — | — | — | — | |||||||||||||||||
| 236,281 | 124,570 | 127,810 | 137,514 | 48,984 | 84,905 | |||||||||||||||||
| (232,413 | ) | (119,628 | ) | (109,151 | ) | (99,525 | ) | (168,369 | ) | (59,822 | ) | |||||||||||
| — | (1,626,406 | ) | — | (1,599,140 | ) | — | (1,637,783 | ) | ||||||||||||||
| 226,076 | (1,169,352 | ) | 808,476 | (1,088,374 | ) | 715,605 | (1,203,755 | ) | ||||||||||||||
See accompanying notes to the financial statements.
20
BB&T Variable Insurance Funds
Financial Highlights
Selected data for a share of beneficial interest outstanding throughout the periods indicated.
| Investment Activities | ||||||||||||
| Net Asset Value, Beginning of Period | Net investment income (loss) | Net realized/ unrealized gains (losses) on investments | Total from Investment Activities | |||||||||
BB&T Large Cap VIF | ||||||||||||
Year Ended December 31, 2007 | $ | 16.75 | 0.23 | (1.08 | ) | (0.85 | ) | |||||
Year Ended December 31, 2006 | $ | 14.00 | 0.27 | 2.68 | 2.95 | |||||||
Year Ended December 31, 2005 | $ | 13.35 | 0.26 | 0.65 | 0.91 | |||||||
Year Ended December 31, 2004 | $ | 12.00 | 0.22 | 1.35 | 1.57 | |||||||
Year Ended December 31, 2003 | $ | 9.88 | 0.19 | 2.12 | 2.31 | |||||||
BB&T Mid Cap Growth VIF | ||||||||||||
Year Ended December 31, 2007 | $ | 15.16 | (0.03 | ) | 5.09 | 5.06 | ||||||
Year Ended December 31, 2006 | $ | 15.67 | 0.03 | 0.44 | 0.47 | |||||||
Year Ended December 31, 2005 | $ | 13.70 | (0.04 | ) | 2.01 | 1.97 | ||||||
Year Ended December 31, 2004 | $ | 11.69 | (0.05 | ) | 2.06 | 2.01 | ||||||
Year Ended December 31, 2003 | $ | 8.56 | (0.06 | ) | 3.19 | 3.13 | ||||||
BB&T Capital Manager Equity VIF*** | ||||||||||||
Year Ended December 31, 2007 | $ | 11.65 | 0.25 | — | (c) | 0.25 | ||||||
Year Ended December 31, 2006 | $ | 10.51 | 0.16 | 1.45 | 1.61 | |||||||
Year Ended December 31, 2005 | $ | 9.99 | 0.17 | 0.50 | 0.67 | |||||||
Year Ended December 31, 2004 | $ | 8.99 | 0.07 | 1.00 | 1.07 | |||||||
Year Ended December 31, 2003 | $ | 7.19 | 0.03 | 1.80 | 1.83 | |||||||
BB&T Special Opportunities Equity VIF | ||||||||||||
Year Ended December 31, 2007 | $ | 15.07 | (0.02 | ) | 2.02 | 2.00 | ||||||
Year Ended December 31, 2006 | $ | 12.70 | (0.02 | ) | 3.07 | 3.05 | ||||||
Year Ended December 31, 2005 | $ | 12.12 | (0.03 | ) | 0.79 | 0.76 | ||||||
July 22, 2004 to December 31, 2004(d) | $ | 10.00 | (0.04 | ) | 2.16 | 2.12 | ||||||
BB&T Total Return Bond VIF | ||||||||||||
Year Ended December 31, 2007 | $ | 9.83 | 0.31 | 0.31 | 0.62 | |||||||
Year Ended December 31, 2006 | $ | 9.92 | 0.50 | (0.17 | ) | 0.33 | ||||||
Year Ended December 31, 2005 | $ | 10.08 | 0.33 | (0.10 | ) | 0.23 | ||||||
July 22, 2004 to December 31, 2004(d) | $ | 10.00 | 0.10 | 0.08 | 0.18 | |||||||
| * | During the period certain fees were reduced. If such reductions had not occurred, the ratios would have been as indicated. |
| ** | Total return ratios assume reinvestment of distributions at net asset value. |
Total return ratios do not reflect charges pursuant to the terms of the insurance contracts funded by separate accounts that invest in the Fund’s shares.
| *** | The expense ratios exclude the impact of fees/expenses paid by each underlying fund. |
| (a) | Not annualized for periods less than one year. |
| (b) | Annualized for periods less than one year. |
| (c) | Amount is less than $0.005. |
| (d) | Period from commencement of operations. |
See accompanying notes to the financial statements.
21
| Distributions | Ratios/Supplemental Data | ||||||||||||||||||||||||||||||
Net | Return of capital | Net realized gains on investments | Total Distributions | Net Asset Value, End of Period | Total Return**(a) | Net Assets, End of Period (000) | Ratio of net expenses to average net assets(b) | Ratio of net investment income (loss) to average net assets(b) | Ratio of expenses to average net assets*(b) | Portfolio turnover rate(a) | |||||||||||||||||||||
| (0.31 | ) | — | (1.90 | ) | (2.21 | ) | $ | 13.69 | (5.87 | )% | $ | 87,171 | 0.77 | % | 1.50 | % | 1.08 | % | 52.81 | % | |||||||||||
| (0.20 | ) | — | — | (0.20 | ) | $ | 16.75 | 21.28 | % | $ | 93,143 | 0.77 | % | 1.72 | % | 1.01 | % | 45.76 | % | ||||||||||||
| (0.26 | ) | — | — | (0.26 | ) | $ | 14.00 | 6.90 | % | $ | 113,648 | 0.79 | % | 1.95 | % | 1.05 | % | 21.76 | % | ||||||||||||
| (0.22 | ) | — | — | (0.22 | ) | $ | 13.35 | 13.18 | % | $ | 111,612 | 0.81 | % | 1.77 | % | 1.10 | % | 12.91 | % | ||||||||||||
| (0.19 | ) | — | (c) | — | (0.19 | ) | $ | 12.00 | 23.62 | % | $ | 94,683 | 0.88 | % | 1.82 | % | 1.17 | % | 13.96 | % | |||||||||||
| — | (c) | — | (1.93 | ) | (1.93 | ) | $ | 18.29 | 35.02 | % | $ | 33,386 | 0.80 | % | (0.22 | )% | 1.05 | % | 127.76 | % | |||||||||||
| (0.07 | ) | — | (0.91 | ) | (0.98 | ) | $ | 15.16 | 3.26 | % | $ | 25,460 | 0.78 | % | 0.25 | % | 1.02 | % | 160.04 | % | |||||||||||
| — | — | — | — | $ | 15.67 | 14.38 | % | $ | 39,090 | 0.78 | % | (0.28 | )% | 1.10 | % | 113.04 | % | ||||||||||||||
| — | — | — | — | $ | 13.70 | 17.19 | % | $ | 32,407 | 0.83 | % | (0.44 | )% | 1.22 | % | 135.55 | % | ||||||||||||||
| — | — | — | — | $ | 11.69 | 36.57 | % | $ | 23,903 | 0.98 | % | (0.78 | )% | 1.37 | % | 113.75 | % | ||||||||||||||
| (0.30 | ) | — | (1.27 | ) | (1.57 | ) | $ | 10.33 | 1.98 | % | $ | 18,495 | 0.18 | % | 2.27 | % | 0.51 | % | 40.70 | % | |||||||||||
| (0.12 | ) | — | (0.35 | ) | (0.47 | ) | $ | 11.65 | 15.82 | % | $ | 18,222 | 0.17 | % | 1.15 | % | 0.54 | % | 20.55 | % | |||||||||||
| (0.15 | ) | — | — | (0.15 | ) | $ | 10.51 | 6.77 | % | $ | 28,722 | 0.26 | % | 1.68 | % | 0.55 | % | 3.24 | % | ||||||||||||
| (0.07 | ) | — | — | (0.07 | ) | $ | 9.99 | 11.91 | % | $ | 25,611 | 0.34 | % | 0.75 | % | 0.54 | % | 1.09 | % | ||||||||||||
| (0.03 | ) | — | — | (0.03 | ) | $ | 8.99 | 25.47 | % | $ | 20,606 | 0.56 | % | 0.40 | % | 0.66 | % | 10.06 | % | ||||||||||||
| — | — | (1.04 | ) | (1.04 | ) | $ | 16.03 | 13.41 | % | $ | 35,620 | 1.06 | % | (0.16 | )% | 1.11 | % | 23.86 | % | ||||||||||||
| (0.01 | ) | — | (0.67 | ) | (0.68 | ) | $ | 15.07 | 24.71 | % | $ | 21,294 | 1.06 | % | (0.05 | )% | 1.06 | % | 59.93 | % | |||||||||||
| — | — | (0.18 | ) | (0.18 | ) | $ | 12.70 | 6.29 | % | $ | 31,768 | 1.23 | % | (0.28 | )% | 1.23 | % | 42.15 | % | ||||||||||||
| — | — | — | — | $ | 12.12 | 21.20 | % | $ | 21,044 | 1.45 | % | (0.76 | )% | 1.45 | % | 13.81 | % | ||||||||||||||
| (0.43 | ) | — | — | (0.43 | ) | $ | 10.02 | 6.47 | % | $ | 14,064 | 0.77 | % | 4.42 | % | 1.01 | % | 252.64 | % | ||||||||||||
| (0.42 | ) | — | — | (0.42 | ) | $ | 9.83 | 3.47 | % | $ | 6,767 | 0.77 | % | 4.34 | % | 0.88 | % | 188.24 | % | ||||||||||||
| (0.36 | ) | — | (0.03 | ) | (0.39 | ) | $ | 9.92 | 2.29 | % | $ | 18,777 | 1.00 | % | 3.38 | % | 1.12 | % | 196.66 | % | |||||||||||
| (0.10 | ) | — | — | (0.10 | ) | $ | 10.08 | 1.76 | % | $ | 15,653 | 1.29 | % | 2.34 | % | 1.29 | % | 36.74 | % | ||||||||||||
22
Notes to Financial Statements
December 31, 2007
| 1. | Organization: |
The BB&TVariable Insurance Funds (the “Trust”) was organized on November 8, 2004, and is registered under the Investment Company Act of 1940, as amended (the “1940 Act”), as an open-end investment company established as a Massachusetts business trust. The Trust commenced operations on May 1, 2005 and presently offers shares of the BB&T Large Cap VIF, the BB&T Mid Cap Growth VIF, the BB&T Capital Manager Equity VIF, the BB&T Special Opportunities Equity VIF, and the BB&T Total Return Bond VIF (referred to individually as a “Fund” and collectively as the “Funds”). The Trust is authorized to issue an unlimited number of shares of beneficial interest without par value. Shares of the Funds are offered through variable annuity contracts offered through the separate accounts of participating insurance companies. The BB&T Capital Manager Equity VIF (the “Fund of Funds”) invests in underlying mutual funds as opposed to individual securities.
Under the Trust’s organizational documents, its Officers and Trustees are indemnified against certain liabilities arising out of the performance of their duties to the Trust. In addition, in the normal course of business, the Funds may enter into contracts with their vendors and others that provide for general indemnifications. The Funds’ maximum exposure under these arrangements is unknown as this would involve future claims that may be made against the Funds. However, based on experience, the Funds expect that risk of loss to be remote.
| 2. | Significant Accounting Policies: |
The following is a summary of significant accounting policies followed by the Trust in the preparation of their financial statements. The policies are in conformity with United States generally accepted accounting principles (“GAAP”). The preparation of financial statements requires management to make estimates and assumptions that affect the reported amounts of assets and liabilities and disclosure of contingent assets and liabilities at the date of the financial statements and the reported amounts of income and expenses for the reporting period. Actual results could differ from those estimates.
Recent Accounting Standards — In September 2006, the Financial Accounting Standards Board (“FASB”) issued Statement on Financial Accounting Standards No. 157, “Fair Value Measurements” (“SFAS No. 157”). This standard establishes a single authoritative definition of fair value, sets out a framework for measuring fair value and requires additional disclosures about fair value measurements. SFAS No. 157 applies to fair value measurements already required or permitted by existing standards. SFAS No. 157 is effective for financial statements issued for fiscal years beginning after November 15, 2007 and interim periods within those fiscal years. The changes to current GAAP from the application of this SFAS No. 157 relate to the definition of fair value, the methods used to measure fair value, and the expanded disclosures about fair value measurements. As of December 31, 2007, the Funds do not believe the adoption of SFAS No. 157 will impact the financial statement amounts, however, additional disclosures may be required about the inputs used to develop the measurements and the effect of certain of the measurements on changes in net assets for the period.
In July 2006, the FASB released FASB Interpretation No. 48 “Accounting for Uncertainty in Income Taxes” (“FIN 48”). FIN 48 provides guidance for how uncertain tax positions should be recognized, measured, presented and disclosed in the financial statements. FIN 48 requires the evaluation of tax positions taken or expected to be taken in the course of preparing the Funds’ tax returns to determine whether the tax positions are “more-likely-than-not” of being sustained by the applicable tax authority. Tax positions not deemed to meet the more-likely-than-not threshold would be recorded as a tax benefit or expense in the year of determination. Adoption of FIN 48 is required no later than the last business day of the first financial statement reporting period for fiscal years beginning after December 15, 2006 and is to be applied to all open tax years as of the effective date. Management has completed their analysis and has determined that the adoption of FIN 48 will not have an impact on the financial statements. The Funds’ federal and state income and federal excise tax returns for tax years for which the applicable statutes of limitations have not expired are subject to examination by the Internal Revenue Service and state departments of revenue.
Securities Valuation — Investments in common stocks, commercial paper, corporate bonds, municipal securities, U.S. Government securities, and U.S. Government agency securities, the principal market for which is a securities exchange or an over-the-counter market, are valued at their latest available sale price (except for those securities that are traded on NASDAQ, which will be valued at the NASDAQ official closing price) or in the absence of such a price, by reference to the latest available bid price in the principal market in which such securities are normally traded. The Funds may also use an independent pricing service approved by the Board of Trustees (the “Board”) to value certain securities. Such prices reflect fair values which may be established through the use of electronic and matrix techniques. Short-term obligations that mature in 60 days or
23
BB&T Variable Insurance Funds
Notes to Financial Statements — (continued)
December 31, 2007
less are valued at either amortized cost or original cost plus interest, which approximates current fair value. Investments in open-end investment companies, including the underlying Funds invested in by Fund of Funds, are valued at their respective net asset values as reported by such companies. Investments in closed-end investment companies are valued at their fair values based upon the latest available bid prices in the principal market in which such securities are normally traded. The differences between cost and fair values of investments are reflected as either unrealized appreciation or depreciation. Securities for which market quotations are not readily available or deemed unreliable (e.g., an approved pricing service does not provide a price, a furnished price is in error, certain stale prices, or an event that materially effects the furnished price) will be valued at fair value using methods determined in good faith by the Pricing Committee under the supervision of the Board.
Securities Transactions and Related Income — During the period, securities transactions are accounted for no later than one business day after trade date. For financial reporting purposes, however, security transactions are accounted for on trade date of the last business day of the reporting period. Interest income is recognized on the accrual basis and includes, where applicable, the amortization/accretion of premium or discount. Dividend income is recorded on the ex-dividend date. Gains or losses realized from sales of securities are determined by comparing the identified cost of the security lot sold with the net sales proceeds.
When-Issued — The Funds may purchase securities on a “when-issued” basis. The Funds record when-issued securities on the trade date and pledge assets with a value at least equal to the purchase commitment for payment of the securities purchased. The value of the securities underlying when-issued securities and any subsequent fluctuation in their value is taken into account when determining the net asset value of the Funds, commencing with the date the Funds agree to purchase the securities. The Funds do not accrue interest or dividends on “when-issued” securities until the underlying securities are received.
Repurchase Agreements — The Funds may enter into agreements with member banks of the Federal Deposit Insurance Corporation and with registered broker/dealers that BB&T Asset Management, Inc. (“BB&T AM”) or a sub-advisor deemed creditworthy under guidelines approved by the Board, subject to the seller’s agreement to repurchase such securities at a mutually agreed-upon date and price. The repurchase price generally equals the price paid by the Funds plus interest negotiated on the basis of current short-term rates, which may be more or less than the rate on the underlying Fund securities. The seller under a repurchase agreement is required to maintain the value of collateral held pursuant to the agreement at not less than the repurchase price (including accrued interest). Securities subject to repurchase are held by the Funds’ custodian, or another qualified custodian or in the Federal Reserve/Treasury book-entry system. In the event of counterparty default, the Fund has the right to use the collateral to offset losses incurred. There is a potential for loss to the Fund in the event the Fund is delayed or prevented from exercising its rights to dispose of the collateral securities, including the risk of possible decline in fair value of the underlying securities during the period while the Fund seeks to assert its rights.
Option Contracts — The Funds may purchase or write option contracts. These transactions are to hedge against changes in interest rates, security prices, currency fluctuations, and other market developments, or for the purposes of earning additional income (i.e. speculation).
The risk associated with purchasing an option is that the Fund pays a premium whether or not the option is exercised. Additionally, the Funds bear the risk of loss of the premium and change in fair value should the counterparty not perform under the contract. Put and call options purchased are accounted for in the same manner as other securities owned. The cost of securities acquired through the exercise of call options is increased by the premiums paid. The proceeds from securities sold through the exercise of put options are decreased by the premiums paid.
In writing an option, the Funds contract with a specified counterparty to purchase (put option written) or sell (call option written) a specified quantity (notional amount) of an underlying asset at a specified price during a specified period upon demand of the counterparty. The risk associated with writing an option is that the Funds bear the market risk of an unfavorable change in the price of an underlying asset and may be required to buy or sell an underlying asset under the contractual terms of the option at a price different from the current fair value.
24
BB&T Variable Insurance Funds
Notes to Financial Statements — (continued)
December 31, 2007
The BB&T Special Opportunities Equity VIF had the following transactions in written covered call options during the year ended December 31, 2007:
| BB&T Special Opportunities Equity VIF | |||||||
Covered Call Options | Number of Contracts | Premiums Received | |||||
Balance at beginning of period | 155 | $ | 39,022 | ||||
Options written | 2,028 | 175,630 | |||||
Options purchased | 3,321 | 263,627 | |||||
Options closed | (646 | ) | (66,132 | ) | |||
Options expired | (2,158 | ) | (185,764 | ) | |||
Options exercised | (422 | ) | (20,287 | ) | |||
Balance at end of period | 2,278 | $ | 206,096 | ||||
| The following is a summary of options outstanding as of December 31, 2007: | |||||||
| Number of Contracts | Fair Value | ||||||
Security | |||||||
Special Opportunities Equity VIF | |||||||
CONSOL Energy, Inc., $60.00, 1/19/08 | 250 | $ | 300,000 | ||||
Corning, Inc., $30.00, 2/16/08 | 570 | 5,700 | |||||
L-3 Communications Holdings, Inc., $115.00, 1/19/08 | 85 | 1,275 | |||||
Noble, Corp., $67.50, 3/22/08 | 150 | 12,750 | |||||
Varian Medical Systems, Inc., $60.00, 5/17/08 | 280 | 30,800 | |||||
Weatherford International, Ltd., $80.00, 2/16/08 | 200 | 15,000 | |||||
XM Satellite Radio Holdings, Inc., Class A, $20.00, 1/19/08 | 530 | 2,650 | |||||
Yum! Brands, Inc., $45.00, 4/19/08 | 213 | 7,455 | |||||
| 2,278 | $ | 375,630 | |||||
Security Loans — To generate additional income, the Funds may lend up to 33 1/3% of their respective total assets pursuant to agreements requiring that the loan be continuously secured by any combination of cash, U.S. Government or U.S. Government agency securities, equal at all times to at least 100% of the fair value.
The Funds receive payments from borrowers equivalent to the dividends and interest that would have been earned on securities loaned while simultaneously seeking to earn income on the investment of collateral. Collateral is marked to market daily to provide a level of collateral at least equal to the fair value of securities lent. There may be risks of delay in recovery of the securities or even loss of rights in the collateral should the borrower of the securities fail financially. However, loans will be made only to borrowers, such as broker-dealers, banks or institutional borrowers of securities, deemed by the Funds to be of good standing and creditworthy under guidelines established by the Board and when, in the judgment of the Funds, the consideration which can be earned currently from such securities loans justifies the attendant risks. Loans are subject to termination by the Funds or the borrower at any time and are, therefore, not considered to be illiquid investments. There were no securities on loan as of December 31, 2007.
| Average Value on Loan for the year ended December 31, 2007 | |||
BB&T Large Cap VIF | $ | 17,194,538 | |
25
BB&T Variable Insurance Funds
Notes to Financial Statements — (continued)
December 31, 2007
| Average Value on Loan for the year ended December 31, 2007 | ||
BB&T Mid Cap Growth VIF | 11,452,295 | |
BB&T Special Opportunities Equity VIF | 8,424,490 | |
BB&T Total Return Bond VIF | 2,580,673 |
Distributions to Shareholders — Distributions from net investment income are declared and paid quarterly for the Funds, with the exception of the BB&T Total Return Bond VIF, in which case dividends from net investment income are declared daily and paid monthly. Distributable net realized gains, if any, are declared and distributed at least annually. Distributions to shareholders which exceed net investment income and net realized gains for tax purposes are reported as distributions of capital or return of capital.
The character of income and gains distributed are determined in accordance with federal income tax regulations, which may differ from GAAP. These “book/tax” differences are either considered temporary or permanent in nature. To the extent these differences are permanent in nature (e.g., reclass of net operating losses, market discounts, gain/loss, paydowns and distributions), such amounts are reclassified within the composition of net assets based on their federal tax-basis treatment; temporary differences do not require reclassification. These reclassifications have no impact on net assets or net asset values per share.
| Increase/ Decrease Net Investment Income(Loss) | Increase/ Decrease Realized Gain(Loss) | |||||||
Large Cap Fund VIF | $ | 61,075 | $ | (61,075 | ) | |||
Mid Cap Growth Fund VIF | 64,663 | (64,663 | ) | |||||
Special Opportunities Equity VIF | 46,760 | (46,760 | ) | |||||
Total Return Bond VIF | (7,248 | ) | 7,248 | |||||
Federal Income Taxes — It is the policy of the Funds to continue to qualify as regulated investment companies by complying with the provisions available to certain investment companies, as defined in applicable sections of the Internal Revenue Code, and to make distributions of net investment income and net realized capital gains sufficient to relieve it from all, or substantially all, federal income taxes. Accordingly, no provision for federal income tax is required.
Other — Expenses directly attributable to a Fund are charged to that Fund. Expenses not directly attributable to a Fund are allocated proportionately among all Funds daily in relation to the net assets of each Fund or on another reasonable basis. Expenses which are attributable to both the Funds and the BB&T Funds are allocated across Funds and BB&T Funds, based upon relative net assets or on another reasonable basis.
| 3. | Purchases and Sales of Securities: |
Purchases and sales of securities (excluding in-kind transactions, U.S. Government Securities and securities maturing less than one year from acquisition) for the year ended December 31, 2007 are as follows:
| Purchases | Sales | |||||
BB&T Large Cap VIF | $ | 51,362,977 | $ | 63,016,237 | ||
BB&T Mid Cap Growth VIF | 37,107,684 | 36,273,741 | ||||
BB&T Capital Manager Equity VIF | 10,989,249 | 7,519,034 | ||||
BB&T Special Opportunities Equity VIF | 18,706,428 | 6,782,568 | ||||
BB&T Total Return Bond VIF | 5,768,858 | 2,898,295 | ||||
Purchases and sales of U.S. Government Securities (excluding in-kind transactions and securities maturing less than one year from acquisition) for the year ended December 31, 2007 for the BB&T Total Return Bond VIF were $28,568,700 and $23,600,700, respectively.
26
BB&T Variable Insurance Funds
Notes to Financial Statements — (continued)
December 31, 2007
| 4. | Related Party Transactions: |
Investment advisory services are provided to the Funds by BB&T AM. Under the terms of the investment advisory agreement, BB&T AM is entitled to receive fees based on a percentage of the average daily net assets of the Funds. These fees are accrued daily and payable on a monthly basis and are reflected on the Statements of Operations as “Investment advisory fees”. BB&T AM waived investment advisory fees and certain expenses of the Funds referenced below which are not subject to recoupment in subsequent fiscal periods and are included on the Statements of Operations as “Less expenses waived by the Investment Advisor”.
Information regarding these transactions is as follows for the year ended December 31, 2007:
| Contractual Fee Rate | Fee Rate after Voluntary Waiver* | |||||
BB&T Large Cap VIF | 0.74 | % | 0.42 | % | ||
BB&T Mid Cap Growth VIF | 0.74 | % | 0.48 | % | ||
BB&T Capital Manager Equity VIF | 0.25 | % | 0.00 | % | ||
BB&T Special Opportunities Equity VIF | 0.80 | % | 0.75 | % | ||
BB&T Total Return Bond VIF | 0.60 | % | 0.37 | % |
| * | For all or a portion of the year ended December 31, 2007, BB&T AM voluntarily waived additional investment advisory fees for the BB&T Large Cap VIF, BB&T Mid Cap Growth VIF, BB&T Capital Manager VIF and BB&T Total Return Bond VIF. All voluntary investment advisory fee waivers are not subject to recoupment in subsequent fiscal periods and may be discontinued at any time. |
Pursuant to a sub-advisory agreement with BB&T AM, Scott & Stringfellow, Inc., a wholly owned subsidiary of BB&T Corporation, serves as the sub-advisor to the BB&T Special Opportunities Equity VIF, subject to the general supervision of the Board and BB&T AM. Pursuant to a sub-advisory agreement with BB&T AM, Sterling Capital Management LLC, a wholly owned subsidiary of BB&T Corporation, serves as the sub-advisor to the BB&T Total Return Bond VIF, subject to the general supervision of the Board and BB&T AM. For their services, the sub-advisors are entitled to a fee payable by BB&T AM.
BB&T AM serves as the administrator to the Funds pursuant to the administration agreement. The Funds pay their portion of a fee to BB&T AM for providing administration services based on the aggregate assets of the Funds and the BB&T Funds at a rate of 0.11% on the first $3.5 billion of average net assets; 0.075% on the next $1 billion of average net assets; 0.06% on the next $1.5 billion of average net assets; and 0.04% of average net assets over $6 billion. This fee is accrued daily and payable on a monthly basis. Expenses incurred are reflected on the Statements of Operations as “Administration fees.” During the year ended December 31, 2007, BB&T AM voluntarily waived administration fees of $6,555 for the BB&T Capital Manager Equity VIF, and this waiver is not subject to recoupmentin subsequent fiscal periods. Effective April 23, 2007, pursuant to a sub-administration agreement with BB&T AM, PFPC Inc. (“PFPC”) serves as sub-administrator to the Funds subject to the general supervision of the Board and BB&T AM. For these services, PFPC is entitled to a fee, payable by BB&T AM. Prior to April 23, 2007, Citi Fund Services (“Citi”), formerly known as BISYS Fund Services Ohio, Inc. served as sub-administrator to the Funds.
Effective April 23, 2007, PFPC serves as the Funds’ fund accountant and transfer agent and receives compensation by the Funds for these services. Expenses incurred are reflected on the Statements of Operations as “Fund accounting fees” and “Transfer agent fees”. Prior to April 23, 2007, Citi served as the Funds’ fund accountant and transfer agent.
On April 23, 2007, BB&T AM’s Chief Compliance Officer (“CCO”) also began to serve as the Funds’ CCO. Since April 23, 2007, the CCO’s compensation is reviewed and approved by the Funds’ Board and paid by BB&T AM. However, the Funds reimburse BB&T AM for their allocable portion of the CCO’s salary. Prior to April 23, 2007, under a Compliance Services Agreement between the Funds and Citi (the “CCOAgreement”), Citi made an employee available to serve as the Funds’CCO. For the services provided under the CCO Agreement, the Funds paid Citi $11,667 for the year ended December 31, 2007 plus certain out of pocket expenses. Expenses incurred are reflected on the Statements of Operations as “Compliance service fees”.
For the year ended December 31, 2007, the Funds paid $36,337 in brokerage fees to Scott & Stringfellow, Inc., a wholly owned subsidiary of BB&T Corporation, on the execution of purchases and sales of the Funds’ portfolio investments.
The Trust has adopted a Variable Contract Owner Servicing Plan (the “Service Plan”) under which the Funds may pay a fee computed daily and paid monthly, at an annual rate of up to 0.25% of the average daily net assets of the Fund. A servicing agent may periodically waive all or a portion of its servicing fees. For the year ended December 31, 2007 the Funds did not participate in any service plans.
27
BB&T Variable Insurance Funds
Notes to Financial Statements — (continued)
December 31, 2007
Certain Officers and Trustees of the Funds are affiliated with the adviser, the administrator or the sub-administrator. Such Officers and Trustees receive no compensation from the Funds for serving in their respective roles. Each of the five non-interested Trustees who serve on both the Board and the Audit Committee are compensated $1,250 per quarter and $500 for each regularly scheduled meeting, plus reimbursement for certain expenses. During the year ended December 31, 2007, actual Trustee compensation and reimbursement for certain expenses was $48,921 in total.
| 5. | Conversion of the BB&T Large Cap VIF and the BB&T Large Cap Growth VIF: |
On February 12, 2007, the BB&T Large Cap VIF acquired all of the assets and assumed all of the liabilities of the BB&T Large Cap Growth VIF in exchange for shares of the BB&T Large Cap VIF, pursuant to an Agreement and Plan of Reorganization approved by the BB&T Large Cap Growth VIF’s shareholders on February 7, 2007 and the Board on August 29, 2006. All fees and expenses incurred by the BB&T Large Cap Growth VIF, BB&T Large Cap VIF and BB&T AM in connection with the consummation of the transaction were borne by BB&T AM. The following is a summary of shares issued, net assets converted, net asset value per share issued and unrealized appreciation/depreciation of assets acquired as of the conversion date:
| Shares Issued | Net Assets Converted | Net Asset Value Per Share Issued | Unrealized Appreciation | ||||||||
BB&T Large Cap VIF | 810,901 | $ | 13,750,356 | $ | 16.96 | $ | 175,611 | ||||
| 6. | Line of Credit: |
U.S. Bank, N.A. has made available a credit facility to the Funds, pursuant to a Credit Agreement (the ”Agreement”). The primary purpose of the Agreement is to allow the Funds to avoid security liquidation that BB&T AM believes are unfavorable to shareholders. Outstanding principal amounts under the Agreement bear interest at an interest rate equal to the Prime Rate minus 2.00%. There were no open lines of credit at December 31, 2007. During the year ended December 31, 2007 the following Fund utilized a line of credit:
| Average Interest Rate | Average Loan Balance | Number of Days Outstanding | Interest Expense Incurred | Maximum Amount Borrowed During the Period | ||||||||||
BB&T Mid Cap Growth VIF | 5.75 | % | $ | 28,000 | 1 | $ | 5 | $ | 28,000 | |||||
| 7. | Federal Tax Information: |
At December 31, 2007, the following Funds have net capital loss carryforwards available to offset future net capital gains, if any, to the extent provided by the Treasury regulations. To the extent that these carryforwards are used to offset future capital gains, it is probable that the gains that are offset will not be distributed to shareholders.
| Amount | Expires | ||||
BB&T Total Return Bond VIF | $ | 60,272 | 2013 | ||
BB&T Total Return Bond VIF | 62,902 | 2014 | |||
Capital loss carryforwards utilized in the current fiscal year were $36,013 for the BB&T Total Return Bond VIF.
The tax character of distributions paid to shareholders during the fiscal year ended December 31, 2007 were as follows:
| Distributions paid from | |||||||||||||||
| Ordinary Income | Net Long-Term Gains | Total Taxable Distributions | Tax Exempt Distributions | Total Distributions Paid* | |||||||||||
BB&T Large Cap VIF | $ | 1,937,234 | $ | 11,116,882 | $ | 13,054,116 | $ | — | $ | 13,054,116 | |||||
BB&T Mid Cap Growth VIF | 61,600 | 3,118,051 | 3,179,651 | — | 3,179,651 | ||||||||||
BB&T Capital Manager Equity VIF | 760,193 | 1,766,601 | 2,526,794 | — | 2,526,794 | ||||||||||
BB&T Special Opportunities Equity VIF | 843,431 | 1,173,405 | 2,016,836 | — | 2,016,836 | ||||||||||
BB&T Total Return Bond VIF | 456,227 | — | 456,227 | — | 456,227 | ||||||||||
28
BB&T Variable Insurance Funds
Notes to Financial Statements — (continued)
December 31, 2007
The tax character of distributions paid to shareholders during the fiscal year ended December 31, 2006 were as follows:
| Distributions paid from | |||||||||||||||
| Ordinary Income | Net Long-Term Gains | Total Taxable Distributions | Tax Exempt Distributions | Total Distributions Paid* | |||||||||||
BB&T Large Cap VIF | $ | 1,597,154 | $ | — | $ | 1,597,194 | $ | — | $ | 1,597,154 | |||||
BB&T Mid Cap Growth VIF | 169,918 | 2,384,160 | 2,554,078 | — | 2,554,078 | ||||||||||
BB&T Capital Manager Equity VIF | 351,849 | 967,984 | 1,319,833 | — | 1,319,833 | ||||||||||
BB&T Special Opportunities Equity VIF | 304,495 | 1,526,428 | 1,830,923 | — | 1,830,923 | ||||||||||
BB&T Total Return Bond VIF | 806,098 | — | 806,098 | — | 806,098 | ||||||||||
| * | Total Distributions paid may differ from the Statements of Changes in Net Assets because distributions are recognized when actually paid for tax purposes. |
As of December 31, 2007, the components of accumulated earnings (deficit) on a tax basis were as follows:
| Undistributed Ordinary Income | Undistributed Long Term Capital Gains | Accumulated Earnings | Accumulated Capital and Other Losses | Unrealized Appreciation (Depreciation)* | Total Accumulated Earnings | |||||||||||||||
BB&T Large Cap VIF | $ | 239,588 | $ | 12,407,061 | $ | 12,646,650 | $ | — | $ | 1,461,824 | $ | 14,108,473 | ||||||||
BB&T Mid Cap Growth VIF | 1,251,675 | 3,285,103 | 4,536,778 | — | 8,578,539 | 13,115,317 | ||||||||||||||
BB&T Capital Manager Equity VIF | 133,157 | 3,097,913 | 3,231,069 | — | (1,326,538 | ) | 1,904,532 | |||||||||||||
BB&T Special Opportunities Equity VIF | 558,192 | 671,389 | 1,229,582 | — | 5,668,961 | 6,898,542 | ||||||||||||||
BB&T Total Return Bond VIF | 167,126 | — | 167,126 | (126,240 | ) | 196,119 | 237,005 | |||||||||||||
| * | The primary differences between book basis and tax basis unrealized appreciation/(depreciation) were due to the deferral of losses on wash sales and the deferral of market discount and premium until point of sale. |
Under current tax law, capital losses realized after October 31 of a Fund’s fiscal year may be deferred and treated as occurring on the first business day of the following fiscal year for tax purposes. The BB&T Total Return Bond VIF had deferred post-October capital losses of $3,066, which will be treated as arising on the first business day of the fiscal year ending December 31, 2008.
At December 31, 2007, the cost, gross unrealized appreciation and gross unrealized depreciation on securities for federal income tax purposes were as follows:
| Tax Cost | Tax Unrealized Appreciation | Tax Unrealized Depreciation | Net Unrealized Appreciation (Depreciation) | |||||||||||
BB&T Large Cap VIF | $ | 85,401,549 | $ | 13,415,414 | $ | (11,953,590 | ) | $ | 1,461,824 | |||||
BB&T Mid Cap Growth VIF | 25,123,244 | 9,154,538 | (575,999 | ) | 8,578,539 | |||||||||
BB&T Capital Manager Equity VIF | 19,726,969 | 531,805 | (1,858,343 | ) | (1,326,538 | ) | ||||||||
BB&T Special Opportunities Equity VIF | 31,780,775 | 7,368,438 | (1,529,943 | ) | 5,838,495 | |||||||||
BB&T Total Return Bond VIF | 14,557,449 | 234,528 | (38,409 | ) | 196,119 | |||||||||
29
Report of Independent Registered Public Accounting Firm
To the Shareholders and Board of Trustees of
BB&T Variable Insurance Funds:
We have audited the accompanying statements of assets and liabilities of BB&T Variable Insurance Funds – BB&T Large Cap VIF, BB&T Mid Cap Growth VIF, BB&T Capital Manager Equity VIF, BB&T Special Opportunities Equity VIF, and BB&T Total Return Bond VIF (collectively, the Funds), including the schedules of portfolio investments, as of December 31, 2007, and the related statements of operations for the year then ended, the statements of changes in net assets for each of the periods in the two-year period then ended, and the financial highlights for each of the periods in the five-year period then ended. These financial statements and financial highlights are the responsibility of the Funds’ management. Our responsibility is to express an opinion on these financial statements and financial highlights based on our audits.
We conducted our audits in accordance with the standards of the Public Company Accounting Oversight Board (United States). Those standards require that we plan and perform the audit to obtain reasonable assurance about whether the financial statements and financial highlights are free of material misstatement. An audit includes examining, on a test basis, evidence supporting the amounts and disclosures in the financial statements. Our procedures included confirmation of securities owned as of December 31, 2007, by correspondence with the custodian, transfer agent of the underlying funds, or brokers; where replies were not received from brokers we performed other auditing procedures. An audit also includes assessing the accounting principles used and significant estimates made by management, as well as evaluating the overall financial statement presentation. We believe that our audits provide a reasonable basis for our opinion.
In our opinion, the financial statements and financial highlights referred to above present fairly, in all material respects, the financial position of the Funds as of December 31, 2007, the results of their operations for the year then ended, the changes in their net assets for each of the periods in the two-year period then ended, and the financial highlights for each of the periods in the five-year period then ended, in conformity with U.S. generally accepted accounting principles.
KPMG LLP
New York, NY
February 22, 2008
30
BB&T Variable Insurance Funds
December 31, 2007
Other Federal Income Tax Information (Unaudited)
For the fiscal year ended December 31, 2007, each Fund is designating the following items with regard to distributions paid during the year.
For corporate shareholders, the following percentage of the total ordinary income dividends paid during the fiscal year ended December 31, 2007, qualify for the corporate dividends received deduction for the following Funds:
| Dividends Received Deduction | |||
BB&T Large Cap VIF | 100.00 | % | |
BB&T Mid Cap Growth VIF | 33.14 | % | |
BB&T Capital Manager Equity VIF | 58.63 | % | |
BB&T Special Opportunities Equity VIF | 16.65 | % |
During the fiscal year ended December 31, 2007, the following Funds designate long-term capital gain distributions pursuant to Section 852(b)(3) of the Internal Revenue Code:
| Amount | |||
Large Cap VIF | $ | 11,116,882 | |
Mid Cap Growth VIF | 3,118,051 | ||
Capital Manager Equity VIF | 1,766,601 | ||
Special Opportunities Equity VIF | 1,173,405 | ||
31
BB&T Variable Insurance Funds
December 31, 2007
A description of the policies and procedures that the Funds use to determine how to vote proxies relating to portfolio securities is available (i) without charge, upon request, by calling 1-800-228-1872; and (ii) on the Securities and Exchange Commission’s (the “Commission”) website at http://www.sec.gov.
Information regarding how the Funds voted proxies relating to portfolio securities during the most recent 12-month period ended June 30th is available (i) without charge, upon request, by calling 1-800-228-1872 and (ii) on the Commission’s website at http://www.sec.gov.
The Funds file complete Schedules of Portfolio Holdings with the Commission for the first and third quarters of each fiscal year on Form N-Q. The Funds’ Forms N-Q are available without charge on the Commission’s website at http://www.sec.gov, or may be reviewed and copied at the Commission’s Public Reference Room in Washington, D.C. Information on the operation of the Public Reference Room may be obtained by calling 1-800-SEC-0330.
32
The Board of Trustees, at a meeting held on August 28, 2007, formally considered the continuance of the BB&T Variable Insurance Funds’ (the ”Funds”) investment advisory agreement with BB&T Asset Management, Inc. (“BB&T AM” or the ”Adviser”) and sub-advisory agreements of BB&T AM with Scott & Stringfellow, Inc. (“Scott & Stringfellow”), with respect to the Special Opportunities Equity VIF, and Sterling Capital Management LLC (“Sterling Capital”), with respect to the Total Return Bond VIF (collectively, the “Advisory Agreements”). Scott & Stringfellow and Sterling Capital are referred to as “Sub-Advisers” and, collectively with the Adviser, as the “Advisers.”
The Trustees reviewed extensive material in connection with their consideration of the Advisory Agreements, including data from an independent provider of mutual fund data (as assembled by the Funds’ administrator), which included comparisons with industry averages for comparable funds for advisory fees, Rule 12b-1 fees, and total fund expenses. The data reflected BB&T AM fee waivers in place, as well as BB&T AM’s contractual investment advisory fee levels. The Board was assisted in its review by independent legal counsel, who provided a memorandum detailing the legal standards for review of the Advisory Agreements. The Board received a detailed presentation by BB&T AM, which included a fund-by-fund analysis of performance and investment process.
Presentations were also provided by each Sub-Adviser. The Board also received Fund-by-Fund profitability information from the Adviser, Scott & Stringfellow and Sterling Capital. The Board also deliberated outside the presence of management and the Advisers.
In their deliberations, each Trustee attributed different weights to various factors involved in an analysis of the Advisory Agreement, and no factor alone was considered determinative. The Trustees determined that the overall arrangements between the Trust and the Advisers, as provided in the Advisory Agreements, were fair and reasonable and that the continuance of the Advisory Agreements was in the best interests of each Fund and its shareholders.
The matters addressed below were considered and discussed by the Trustees in reaching their conclusions.
Nature, Extent and Quality of Services Provided by the Adviser
The Trustees received and considered information regarding the nature, extent, and quality of the services provided to each Fund under the Advisory Agreements. The Trustees took into account information furnished throughout the year at Trustee meetings, as well as materials furnished specifically in connection with the annual review process. The Trustees considered the background and experience of each Adviser’s senior management and the expertise of investment personnel of each Adviser responsible for the day-to-day management of each Fund. The Trustees considered the overall reputation, and the capabilities and commitment of the Advisers to provide high-quality service to the Trust, and the Trustees’ overall confidence in each Adviser’s integrity.
The Trustees received information concerning the investment philosophy and investment processes applied by the Advisers in managing the Funds as well as each Adviser’s Form ADV. The Trustees also considered information regarding regulatory compliance and compliance with the investment policies of the Funds. The Trustees evaluated the trading practices of Scott & Stringfellow, which engages in affiliated brokerage for a majority of the portfolio trades for the Funds it sub-advises. As part of this evaluation, the Trustees received information regarding safeguards employed, such as prohibitions on principal and cross-agency trades. The Trustees also received information demonstrating a decreased use by Scott & Stringfellow of affiliated broker transactions over the past year. The Trustees evaluated the procedures of the Advisers designed to fulfill the Advisers’ fiduciary duty to the Funds with respect to possible conflicts of interest, including the Advisers’ codes of ethics (regulating the personal trading of its officers and employees).
Based on their review, the Trustees concluded that, with respect to the quality and nature of services to be provided by the Advisers, the scope of responsibilities was consistent with mutual fund industry norms, and that the quality of the services was very satisfactory.
Investment Performance
The Trustees considered performance results of each Fund in absolute terms and relative to each Fund’s benchmark index and peer group. It was noted that performance over the last twelve months was generally satisfactory. During their review, the Trustees particularly considered the strong one-year performance of the Special Opportunities Equity VIF. The Trustees also considered that although the Total Return Bond VIF had lagged both its peers and the benchmark index in the last quarter, the Fund’s long term performance was generally more favorable.
After reviewing the performance of each Fund, and taking into consideration the management style, investment strategies, and prevailing market conditions during the prior year and for longer periods, the Trustees concluded that the performance of each of the Funds was generally strong and that in cases where performance issues were encountered, the Adviser was properly addressing the situation.
Cost of Services, Including the Profits Realized by the Advisers and Affiliates
The Trustees considered peer group comparable information with respect to the advisory fees charged by BB&T AM to each of the Funds, taking into consideration both contractual and actual (i.e., after waiver) fee levels. The Trustees concluded that the investment
33
advisory fees fell within an acceptable range as compared to peer groups, particularly in light of the fee waivers that would be continued in the upcoming year with respect to Capital Manager Equity VIF, Large Cap VIF, Mid Cap Growth VIF, and Total Return Bond VIF.
As part of their review, the Trustees considered benefits to the Adviser aside from investment advisory fees. The Trustees reviewed administration fees received by BB&T AM and considered the fallout benefits to BB&T AM such as the research services available to the Adviser by reason of brokerage commissions generated by the Funds’ turnover. The Trustees also considered benefits to BB&T AM’s affiliates, including brokerage commissions received by Scott & Stringfellow for executing trades on behalf of the Special Opportunities Equity VIF and sub-advisory fees received by its affiliate, Sterling Capital, for its management of the Total Return Bond VIF. With respect to Scott & Stringfellow, the Trustees noted that brokerage commissions were paid at a standard commission rate, which was consistent with that used by the Adviser and that such brokerage arrangements were considered by the Sub-Adviser to be advantageous.
Consideration of the reasonableness of advisory fees also took into account, where relevant, the profitability of the Advisers. In determining whether all other investment advisory and sub-advisory fees were reasonable, the Trustees reviewed profitability information provided by the Advisers with respect to investment advisory services. With respect to such information, the Trustees recognized that such profitability data was generally unaudited and represented an Adviser’s own determination of its and its affiliates’ revenues from the contractual services provided to the Funds, less expenses of providing such services. Expenses include direct and indirect costs and were calculated using an allocation methodology developed by the Adviser. The Trustees also recognized that it is difficult to make comparisons of profitability from fund investment advisory and sub-advisory contracts, because comparative information is not generally publicly available and is affected by numerous factors. Based on their review, the Trustees concluded that the profitability to BB&T AM, Scott & Stringfellow and Sterling Capital as a result of their relationships with the Funds was acceptable. The Board also concluded that the fees under the Advisory Agreements were fair and reasonable, in light of the services and benefits provided to each Fund.
Economies of Scale
The Trustees also considered whether fee levels reflect economies of scale and whether economies of scale would be produced by the growth of the Trust’s assets. The Trustees found that the Adviser had generally reduced total fund expense ratios through contract negotiations and fee waivers. The Trustees found that the asset levels of the Trust were not currently so large as to warrant formal contractual breakpoints, and that the fee waivers were a reasonable way to provide the benefits of economies of scale to shareholders at this time.
34
BB&T Variable Insurance Funds
Information about Trustees and Officers (Unaudited)
Overall responsibility for the management of the Funds rests with its Board, who are elected by the Shareholders of the Funds. The Trustees’ elect the officers of the Funds to supervise actively its day-to-day operations. The names of the Trustees’, their addresses, birthdate, term of office and length of time served, principal occupations during the past five years, number of portfolios overseen and directorships held outside of the Funds are listed in the two tables immediately following. The business address of the persons listed below is 434 Fayetteville, Street 5th Floor, Raleigh, North Carolina 27601.
Name and Birthdate | Position(s) Held With BB&T Funds | Term of Office/ | Principal Occupation | Number of Portfolios in Fund Complex by Trustee | Other Directorships Held by Trustee | |||||
| Thomas W. Lambeth Birthdate: 1/35 | Trustee, Chairman of the Board of Trustees | Indefinite, 8/92 — Present | From January 2001 to present, Senior Fellow, Z. Smith Reynolds Foundation; from 1978 to January 2001, Executive Director, Z. Smith Reynolds Foundation | 30 | None | |||||
| Drew T. Kagan Birthdate: 2/48 | Trustee | Indefinite, 8/00 — Present | From December 2003 to present, President and Director, Montecito Advisors, Inc; from March 1996 to December 2003, President, Investment Affiliate, Inc. | 30 | None | |||||
| Laura C. Bingham Birthdate: 11/56 | Trustee | Indefinite, 2/01 — resent | From July 1998 to present, President of Peace College | 30 | None | |||||
| Douglas R. Van Scoy Birthdate: 11/43 | Trustee | Indefinite, 5/04 — Present | Retired; from November 1974 to July 2001, employee of Smith Barney (investment banking), most recently as Director of Private Client Group and Senior Executive Vice President | 30 | None | |||||
| James L. Roberts Birthdate: 11/42 | Trustee | Indefinite, 11/04 — Present | Retired; from November 2006 to present, Director, Grand Mountain Bancshares, Inc.; from January 1999 to December 2003, President, CEO and Director, Covest Bancshares, Inc. | 30 | None | |||||
35
BB&T Variable Insurance Funds
The following table shows information for the trustee who is an “interested persons” of Funds as defined in the 1940 Act:
Name and Birthdate | Position(s) Held With BB&T | Term of Office/ | Principal Occupation | Overseen Complex | ||||
| *Keith F. Karlawish Birthdate: 8/64 | Trustee | Indefinite, 6/06 — Present | From May 2002 to present, President, BB&T Asset Management, Inc.; from 1996 to 2002, Senior Vice President and Director of Fixed Income, BB&T Asset Management, Inc. | 30 |
| * | Mr. Karlawish is treated by the Funds as an “interested person” (as defined in Section 2(a)(19) of the 1940 Act) of the Funds. |
| Mr. Karlawish is an “interested person” because he owns shares of BB&T Corporation and is the President of BB&T Asset |
| Management, the Adviser. |
The following table shows information for officers of Funds:
Name and Birthdate | Position(s) Held With BB&T Funds | Term of Office/ | Principal Occupation | |||
Keith F. Karlawish Birthdate: 8/64 | President | Indefinite, 2/05 — Present | From May 2002 to present, President, BB&T Asset Management, Inc.; from 1996 to 2002, Senior Vice President and Director of Fixed Income, BB&T Asset Management, Inc. | |||
James T. Gillespie Birthdate: 11/66 | Vice President, Secretary | Indefinite, 5/02 — Present, 8/06 — Present | From February 2005 to present, Vice President and Manager of Mutual Fund Administration, BB&T Asset Management, Inc.; from February 1992 to 2005, employee of BISYS Fund Services | |||
E.G. Purcell, III Birthdate: 1/55 | Vice President | Indefinite, 11/00 — Present | From 1995 to present, Senior Vice President, BB&T Asset Management, Inc. and its predecessors | |||
Todd M. Miller Birthdate: 9/71 | Vice President | Indefinite, 8/05 — Present | From June 2005 to Present, Mutual Fund Administrator, BB&T Asset Management, Inc.; from May 2001 to May 2005, Manager, BISYS Fund Services | |||
36
BB&T Variable Insurance Funds
Name and Birthdate | Position(s) Held With BB&T Funds | Term of Office/ | Principal Occupation | |||
Diana Hanlin Birthdate: 5/67 | Vice President | Indefinite, 8/07 — Present | From April 2007 to present, Compliance Officer, BB&T Asset Management, Inc.; from May 2004 to March 2007, Director of Compliance, BISYS Fund Services; from October 2000 to May 2004, Senior Compliance Analyst, BISYS Fund Services | |||
Clinton L. Ward Birthdate: 11/69 | Chief Compliance and Anti-Money Laundering Officer | Indefinite, 4/07 — Present | From July 2004 to present, Chief Compliance Officer and Secretary, BB&T Asset Management, Inc.; from January 2002 to July 2004, Compliance Analyst, Wachovia Bank, N.A.; from November 1999 to January 2002, Compliance Manager - Mutual Fund Compliance, Banc of America Capital Management, LLC | |||
Andrew J. McNally Birthdate: 12/70 | Treasurer | Indefinite, 4/07 — Present | From December 2000 to present, Vice President and Senior Director, Fund Accounting and Administration Department, PFPC Inc. | |||
Avery Maher Birthdate: 2/45 | Assistant Secretary | Indefinite, 4/07 — Present | From March 2006 to present, Vice President and Counsel, Regulatory Administration Department, PFPC Inc.; from October 2004 to August 2005, Vice President and Assistant General Counsel, JPMorgan Asset Management; from 1992 to 2004, Second Vice President and Assistant Secretary John Hancock Advisers, LLC | |||
The Funds’ Statement of Additional Information includes information about the Funds’ Trustees. To receive your free copy of the Statement of Additional Information, call toll free: 1-800-228-1872.
37
| Item 2. | Code of Ethics. |
| (a) | The registrant, as of the end of the period covered by this report, has adopted a code of ethics that applies to the registrant’s principal executive officer, principal financial officer, principal accounting officer or controller, or persons performing similar functions, regardless of whether these individuals are employed by the registrant or a third party. |
| (c) | There have been no material amendments, during the period covered by this report, to a provision of the code of ethics that applies to the registrant’s principal executive officer, principal financial officer, principal accounting officer or controller, or persons performing similar functions, regardless of whether these individuals are employed by the registrant or a third party, and that relates to any element of the code of ethics description. |
| (d) | The registrant has not granted any waivers, including an implicit waiver, from a provision of the code of ethics that applies to the registrant’s principal executive officer, principal financial officer, principal accounting officer or controller, or persons performing similar functions, regardless of whether these individuals are employed by the registrant or a third party, that relates to one or more of the items set forth in paragraph (b) of this item’s instructions. |
| Item 3. | Audit Committee Financial Expert. |
As of the end of the period covered by the report, the registrant’s board of trustees has determined that Drew Kagan is qualified to serve as an audit committee financial expert serving on its audit committee and that he is “independent,” as defined by Item 3 of Form N-CSR.
| Item 4. | Principal Accountant Fees and Services. |
Audit Fees
| (a) | The aggregate fees billed for each of the last two fiscal years for professional services rendered by the principal accountant for the audit of the registrant’s annual financial statements or services that are normally provided by the accountant in connection with statutory and regulatory filings or engagements for those fiscal years are $56,000.00 in 2006 and $75,000.00 in 2007. |
Audit-Related Fees
| (b) | The aggregate fees billed in each of the last two fiscal years for assurance and related services by the principal accountant that are reasonably related to the performance of the audit of the registrant’s financial statements and are not reported under paragraph (a) of this Item are $4,650.00 in 2006 and $0 in 2007. |
Tax Fees
| (c) | The aggregate fees billed in each of the last two fiscal years for professional services rendered by the principal accountant for tax compliance, tax advice, and tax planning are $13,800.00 in 2006 and $12,500.00 in 2007. |
All Other Fees
| (d) | The aggregate fees billed in each of the last two fiscal years for products and services provided by the principal accountant, other than the services reported in paragraphs (a) through (c) of this Item are $0 in 2006 and $0 in 2007. |
| (e)(1) | Except as permitted by Rule 2-01(c)(7)(i)(C) of Regulation S-X, the registrant’s Audit Committee must pre-approve all audit and non-audit services provided by the independent accountants relating to the operations or financial reporting of the funds. Prior to the commencement of any audit or non-audit services to a fund, the Audit Committee reviews the services to determine whether they are appropriate and permissible under applicable law. |
| (e)(2) | None of services described in each of paragraphs (b) through (d) of this Item that were approved by the audit committee pursuant to paragraph (c)(7)(i)(C) of Rule 2-01 of Regulation S-X. |
| (f) | Not Applicable |
| (g) | The aggregate non-audit fees billed by the registrant’s accountant for services rendered to the registrant, and rendered to the registrant’s investment adviser (not including any sub-adviser whose role is primarily portfolio management and is subcontracted with or overseen by another investment adviser), and any entity controlling, controlled by, or under common control with the adviser that provides ongoing services to the registrant for each of the last two fiscal years of the registrant was $704,848 in 2006 and $12,500.00 in 2007. |
| (h) | The registrant’s audit committee of the board of directors has considered whether the provision of non-audit services that were rendered to the registrant’s investment adviser (not including any sub-adviser whose role is primarily portfolio management and is subcontracted with or overseen by another investment adviser), and any entity controlling, controlled by, or under common control with the investment adviser that provides ongoing services to the registrant that were not pre-approved pursuant to paragraph (c)(7)(ii) of Rule 2-01 of Regulation S-X is compatible with maintaining the principal accountant’s independence. |
| Item 5. | Audit Committee of Listed registrants. |
Not applicable.
| Item 6. | Schedule of Investments. |
Not applicable.
| Item 7. | Disclosure of Proxy Voting Policies and Procedures for Closed-End Management Investment Companies. |
Not applicable.
| Item 8. | Portfolio Managers of Closed-End Management Investment Companies. |
Not applicable.
| Item 9. | Purchases of Equity Securities by Closed-End Management Investment Company and Affiliated Purchasers. |
Not applicable.
| Item 10. | Submission of Matters to a Vote of Security Holders. |
Not applicable.
| Item 11. | Controls and Procedures. |
| (a) | The registrant’s principal executive and principal financial officers have concluded, based on their evaluation of the effectiveness of the design and operation of the registrant’s disclosure controls and procedures as of a date within 90 days of the filing date of this report, that the design and operation of such procedures are effective to provide reasonable assurance that information required to be disclosed by the registrant in this report is recorded, processed, summarized and reported within the time periods specified in the Commission’s rules and forms. |
| (b) | There were no changes in the registrant’s internal control over financial reporting (as defined in Rule 30a-3(d) under the 1940 Act (17 CFR 270.30a-3(d)) that occurred during the registrant’s second fiscal quarter of the period covered by this report that has materially affected, or is reasonably likely to materially affect, the registrant’s internal control over financial reporting. |
| Item 12. | Exhibits. |
| (a)(1) | Code of ethics, or any amendment thereto, that is the subject of disclosure required by Item 2 is attached hereto. |
| (a)(2) | Certifications pursuant to Rule 30a-2(a) under the 1940 Act and Section 302 of the Sarbanes-Oxley Act of 2002 are attached hereto. |
| (a)(3) | Not applicable. |
| (b) | Certifications pursuant to Rule 30a-2(b) under the 1940 Act and Section 906 of the Sarbanes-Oxley Act of 2002 are attached hereto. |
SIGNATURES
Pursuant to the requirements of the Securities Exchange Act of 1934 and the Investment Company Act of 1940, the registrant has duly caused this report to be signed on its behalf by the undersigned, thereunto duly authorized.
(registrant) | BB&T Variable Insurance Funds | |||
By (Signature and Title)* | /s/ Keith F. Karlawish | |||
| Keith F. Karlawish, President | ||||
| (principal executive officer) | ||||
| Date | March 6, 2008 | |||
Pursuant to the requirements of the Securities Exchange Act of 1934 and the Investment Company Act of 1940, this report has been signed below by the following persons on behalf of the registrant and in the capacities and on the dates indicated.
| By (Signature and Title)* | /s/ Keith F. Karlawish | |||
| Keith F. Karlawish, President | ||||
| (principal executive officer) | ||||
| Date | March 6, 2008 | |||
| By (Signature and Title)* | /s/ Andrew J. McNally | |||
| Andrew J. McNally, Treasurer | ||||
| (principal financial officer) | ||||
| Date | February 28, 2008 | |||
* | Print the name and title of each signing officer under his or her signature. |