UNITED STATES
SECURITIES AND EXCHANGE COMMISSION
Washington, D.C. 20549
FORM N-CSR
CERTIFIED SHAREHOLDER REPORT OF REGISTERED
MANAGEMENT INVESTMENT COMPANIES
Investment Company Act file number | 811-21682 | |||||||
| ||||||||
BB&T Variable Insurance Funds | ||||||||
(Exact name of registrant as specified in charter) | ||||||||
| ||||||||
434 Fayetteville Street, 5th Floor, Raleigh, NC |
| 27626-0575 | ||||||
(Address of principal executive offices) |
| (Zip code) | ||||||
| ||||||||
BISYS Fund Services, 3435 Stelzer Road, Columbus, OH 43219 | ||||||||
(Name and address of agent for service) | ||||||||
| ||||||||
Registrant’s telephone number, including area code: | (800) 228-1872 |
| ||||||
| ||||||||
Date of fiscal year end: | December 31 |
| ||||||
| ||||||||
Date of reporting period: | December 31, 2005 |
| ||||||
Item 1. Reports to Stockholders.
BB&T Variable Insurance Funds
Table of Contents
Fund Summary
| Large Cap Value VIF | 1 | ||||||
| Mid Cap Growth VIF | 2 | ||||||
| Large Company Growth VIF | 3 | ||||||
| Capital Manager Equity VIF | 4 | ||||||
| Special Opportunities Equity VIF | 5 | ||||||
| Total Return Bond VIF | 7 | ||||||
| Summary of Portfolio Holdings | 9 | ||||||
| Expense Example | 10 | ||||||
Schedule of Portfolio Investments
| Large Cap Value VIF | 11 | ||||||
| Mid Cap Growth VIF | 12 | ||||||
| Large Company Growth VIF | 13 | ||||||
| Capital Manager Equity VIF | 14 | ||||||
| Special Opportunities Equity VIF | 15 | ||||||
| Total Return Bond VIF | 16 | ||||||
| Financial Statements | 20 | ||||||
| Notes to Financial Statements | 26 | ||||||
| Report of Independent Registered Public Accounting Firm | 31 | ||||||
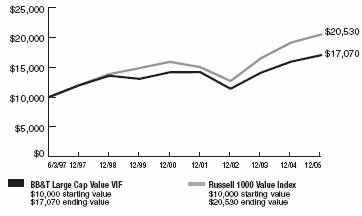
BB&T Large Cap Value VIF
Performance Overview 6/3/1997 - 12/31/2005
Growth of a $10,000 investment
Portfolio Manager
Rick B. Jones, CFA
Senior Vice President – Director, Value Equities
BB&T Asset Management, Inc.
Average Annual Returns (Inception 6/3/1997)
|
| 1 Year |
| 5 Year |
| Since Inception |
|
BB&T Large Cap Value VIF |
| 6.90 | % | 3.78 | % | 6.43 | % |
Russell 1000 Value Index |
| 7.05 | % | 5.28 | % | 8.74 | % |
The chart represents a comparison of a hypothetical $10,000 investment in the indicated Fund versus a similar investment in the Fund’s benchmark, and includes the reinvestment of dividends and capital gains. (The returns include the Fund level expenses, but exclude the insurance charges). Past performance does not guarantee future results. The value of the contract will fluctuate so that when redeemed, it may be worth more or less than the original investment.
Investment Concerns
Equity securities (stocks) are more volatile and carry more risk than other forms of investments, including investments in high-grade fixed income securities. The net asset value per share of the Fund will fluctuate as the value of the securities in the portfolio changes. Common stocks, and funds investing in common stocks, generally provide greater return potential when compared with other types of investments. Value-based investments are subject to the risk that the broad market may not recognize their intrinsic value.
The Fund’s 6.90% total return comfortably outpaced the S&P 500 Index which returned 4.91% for the one-year period, but slightly trailed its primary benchmark, the Russell 1000® Value Index(1), which rose 7.05%.
Overall the Fund’s returns were solid as traditionally value oriented sectors of the stock market, like Energy and Utilities, continued to do well.
The portfolio carried a full weighting in energy throughout the period and not surprisingly our two top contributors to performance were energy stocks: ConocoPhillips and Anadarko Corp. A significant contribution was also made by Hewlett Packard Co., which underwent a management change.
Because we have had difficulty finding reasonably valued utility stocks, the portfolio was underweighted in a sector that did very well in 2005. Our consumer stock sector selection was also challenged. Specifically, the Albertson’s Inc. stock position performed poorly, as the company rejected a buy-out bid late in the period (has since accepted a sweetened offer) and its Sara Lee holding had a bumpy start to a dramatic reshaping program, registering disappointing performance.
As of December 31, 2005, the top five equity holdings in the Fund were Bank of America Corp. (3.1% of the portfolio’s net assets), ConocoPhillips (2.7%), Citigroup, Inc. (2.7%), J.P. Morgan Chase & Co. (2.6%) and ChevronTexaco Corp. (25%)(2).
We continue to be disciplined in applying our diversified value investment approach. We are steadfastly focused on maintaining diversified portfolio of financially strong companies that we believe are currently trading at reasonable valuation levels given our assessment of their prospects. The portfolio enters the new-year being overweighted healthcare and technology stocks while being most underweighted in financial and utility stocks.
(1) The Fund is measured against the Russell 1000 Value Index an unmanaged index which consists of 1,000 of the largest capitalized U.S. domiciled companies. Companies in this index generally have low price-to-book and price-to-earnings ratios, higher dividend yields and lower forecasted growth values. The index does not reflect the deduction of expenses associated with a mutual fund, such as investment management and fund accounting fees. The Fund’s performance reflects the deduction of fees for these services. Investors cannot invest directly in an index, although they can invest in its underlying securities.
(2) Portfolio composition is as of December 31, 2005, and is subject to change.
A portion of the Fund’s fees have been reduced. If fees had not been reduced, the Fund’s total return for the period would have been lower.
1
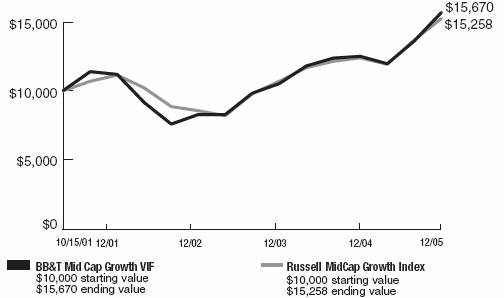
BB&T Mid Cap Growth VIF
Performance Overview 10/15/2001 - 12/31/2005
Growth of a $10,000 investment
Portfolio Manager
David P. Nolan
Senior Vice President and Portfolio Manager
BB&T Asset Management, Inc.
Average Annual Returns (Inception 10/15/2001)
|
| 1 Year |
| Since Inception |
|
BB&T Mid Cap Growth VIF |
| 14.38 | % | 11.26 | % |
Russell MidCap Growth Index |
| 12.10 | % | 10.55 | % |
The chart represents a comparison of a hypothetical $10,000 investment in the indicated Fund versus a similar investment in the Fund’s benchmark, and includes the reinvestment of dividends and capital gains. (The returns include the Fund level expenses, but exclude the insurance charges). Past performance does not guarantee future results. The value of the contract will fluctuate so that when redeemed, it may be worth more or less than the original investment.
Investment Concerns
Mid-capitalization funds typically carry additional risks since smaller companies generally have a higher risk of failure, and historically, their stocks have experienced a greater degree of market volatility than stocks on average
Equity securities (stocks) are more volatile and carry more risk than other forms of investments, including investments in high-grade fixed income securities. The net asset value per share of the Fund will fluctuate as the value of the securities in the portfolio changes. Common stocks, and funds investing in common stocks, generally provide greater return potential when compared with other types of investments. Value-based investments are subject to the risk that the broad market may not recognize their intrinsic value.
The Fund produced robust performance of 14.38% during the last 12 months, nearly tripling the 2005 return of 4.91% for the S&P 500 Index and notably outpacing the Russell MidCap® Growth Index(1) return of 12.10%.
Our investments in the energy sector, such as Peabody Energy Corp. (1.7% of the portfolio’s net assets), were especially productive, as we were overweight in energy for much of the period. At one point, the Fund’s allocation to energy was roughly 50% higher than the allocation of our benchmark, and we reaped the benefits of energy stocks’ steady climb. Another positive factor in our performance was our decision to underweight the consumer discretionary and consumer staples sectors in the second half of the year as concerns grew over the consumer’s allocation of discretionary income in the face of rising fuel prices. Technology holdings such as Apple Computer (sold) and Marvell Technology Group, Ltd. (2.0%) were strong performers for the period. Other standouts were Celgene Corp. (2.0%) and the Chicago Mercantile Exchange Holdings, Inc. (1.8%).
The mid cap arena has been on a roll for quite some time, outperforming large and small cap stocks for much of the last decade. To some extent, our strong gains reflected a continuation of this long-term trend.
The greatest detractors from performance during the period were found in the technology sector. Negative returns were experienced in F5 Networks (sold), and in semiconductor companies Cree, Inc. (sold) and Tessera Technologies (sold).
As of December 31, 2005, the top five individual equity holdings in the Fund were American Tower Corp. – Class A (3.0%), Cognizant Technology Solutions Corp. – Class A (2.3%), Comverse Technology, Inc. (2.2%), UTI Worldwide (2.1%), and Celgene Corp. (2.0%)(2).
We think energy will continue to play a key role in the market going forward, and we hope to see a further upward revision of earnings estimates. Energy stocks will swing, sometimes dramatically, on short-term movements in the prices of crude oil and natural gas. But we believe energy prices are not going to retreat significantly and that positive earning “surprises” will continue. The energy sector is expected by analysts to lead the mid cap area in 2006 earnings per share growth.
For now, as long as higher energy prices and the Fed’s tightening bias do not contribute to a recessionary environment and the economy keeps growing at a three percent-or-better pace, then we believe that mid cap growth stocks in general should continue to provide competitive returns. In that environment, we believe that investment opportunities will be found in numerous sectors in addition to energy. Among these would be technology, health care, industrial and select financial stocks which should all show strong year-over-year earnings gains.
(1) The Fund is measured against the Russell MidCap Growth Index, an unmanaged index which measures the performance of those securities in the Russell 1000 Index with higher price-to-book ratios and lower forecasted growth values. The index does not reflect the deduction of expenses associated with a mutual fund, such as investment management and fund accounting fees. The Fund’s performance reflects the deduction of fees for these services. Investors cannot invest directly in an index, although they can invest in its underlying securities.
(2) Portfolio composition is as of December 31, 2005, and is subject to change.
A portion of the Fund’s fees have been reduced. If fees had not been reduced, the Fund’s total return for the period would have been lower.
2
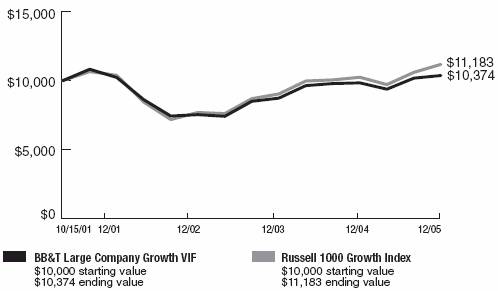
BB&T Large Company Growth VIF
Performance Overview 10/15/2001 - 12/31/2005
Growth of a $10,000 investment
Portfolio Manager
Jeffery J. Schappe, CFA
Senior Vice President and Chief Investment Officer
BB&T Asset Management, Inc.
Average Annual Returns (Inception 10/15/2001)
|
| 1 Year |
| Since Inception |
|
BB&T Large Company Growth VIF |
| 1.88 | % | 0.88 | % |
Russell 1000 Growth Index |
| 5.26 | % | 2.69 | % |
The chart represents a comparison of a hypothetical $10,000 investment in the indicated Fund versus a similar investment in the Fund’s benchmark, and includes the reinvestment of dividends and capital gains. (The returns include the Fund level expenses, but exclude the insurance charges). Past performance does not guarantee future results. The value of the contract will fluctuate so that when redeemed, it may be worth more or less than the original investment.
Investment Concerns
Equity securities (stocks) are more volatile and carry more risk than other forms of investments, including investments in high-grade fixed income securities. The net asset value per share of the Fund will fluctuate as the value of the securities in the portfolio changes. Common stocks, and funds investing in common stocks, generally provide greater return potential when compared with other types of investments. Value-based investments are subject to the risk that the broad market may not recognize their intrinsic value.
We were not completely satisfied with the Fund’s performance during the last 12 months. Although we posted a positive total return of 1.88%, we trailed our primary benchmark, the Russell 1000® Growth Index(1) by 3.38%.
The Fund underperformed its benchmark due to security selection but also because we have focused on higher quality names, which have lagged for much of the year. We believe, however, that a continued bias towards quality companies boosts return potential over the long run. Lagging behind the broader market was a group of historically strong growth stocks, such as General Electric Co. (4.2% of the portfolio’s net assets), Microsoft Corp. (4.2%), Cisco Systems, Inc. (2.2%), Dell, Inc. (1.0%), and Home Depot, Inc. (1.0%); all of these stocks produced returns for the period that were below the benchmark’s performance.
We did, however, enjoy strong returns in a number of traditional growth sectors. In health care, such stalwarts as UnitedHealth Group, Inc. (+41% total return), WellPoint, Inc. (+32%), and Gilead Sciences, Inc. (+50%) delivered results that ranged from robust to outstanding. Technology stocks such as Motorola, Inc. (+32%) and Texas Instruments, Inc. (31%) enhanced fund returns.
As of December 31, 2005, the top five equity holdings in the Fund were General Electric Co. (4.2% of the portfolio’s net assets), Microsoft Corp. (4.2%), Intel Corp. (3.3%), Johnson & Johnson (3.0%), and Wal Mart Stores, Inc. (2.4%)(2).
Looking out over the next six to 12 months, we believe conditions point to a relatively constructive environment for the type of high-quality growth stocks we favor.
Respectable economic growth, low inflation, and the Fed adopting a neutral bias should provide a favorable backdrop for equities, in general. Because growth stocks have trailed value equities the past several years, we hope that a more normal valuation relationship between growth and value will emerge this year.
As is our practice, we continue to invest in the stocks of financially strong companies with reasonable earnings growth prospects. We feel this approach should serve our shareholders well through our next fiscal year.
(1) The Fund is measured against the Russell 1000 Growth Index an unmanaged index which is comprised of 1,000 of the largest capitalized U.S. domiciled companies with higher price-to-book ratios and higher forecasted growth values whose common stock is traded in the United States on the New York Stock Exchange, American Stock Exchange and NASDAQ. The index does not reflect the deduction of expenses associated with a mutual fund, such as investment management and fund accounting fees. The Fund’s performance reflects the deduction of fees for these services. Investors cannot invest directly in an index, although they can invest in its underlying securities.
(2) Portfolio composition is as of December 31, 2005, and is subject to change.
A portion of the Fund’s fees have been reduced. If fees had not been reduced, the Fund’s total return for the period would have been lower.
3
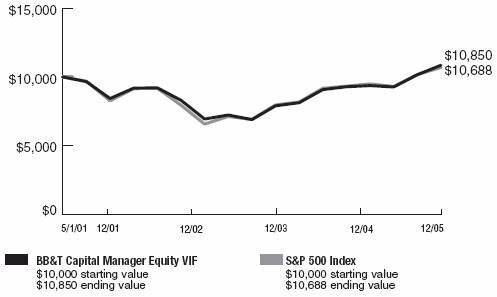
BB&T Capital Manager Equity VIF
Performance Overview 5/1/2001 - 12/31/2005
Growth of a $10,000 investment
Portfolio Management Team
Managed by the BB&T Balanced Portfolio Management Team
Average Annual Returns (Inception 5/1/2001)
|
| 1 Year |
| Since Inception |
|
BB&T Capital Manager Equity VIF |
| 6.77 | % | 1.76 | % |
S&P 500 Index |
| 4.91 | % | 1.44 | % |
The chart represents a comparison of a hypothetical $10,000 investment in the indicated Fund versus a similar investment in the Fund’s benchmark, and includes the reinvestment of dividends and capital gains. (The returns include the Fund level expenses, but exclude the insurance charges). Past performance does not guarantee future results. The value of the contract will fluctuate so that when redeemed, it may be worth more or less than the original investment.
Investment Concerns
Equity securities (stocks) are more volatile and carry more risk than other forms of investments, including investments in high-grade fixed income securities. The net asset value per share of the Fund will fluctuate as the value of the securities in the portfolio changes. Common stocks, and funds investing in common stocks, generally provide greater return potential when compared with other types of investments. Value-based investments are subject to the risk that the broad market may not recognize their intrinsic value.
For the twelve-month period ended December 31, 2005, the BB&T Capital Manager Equity VIF provided a total return of 6.77%. In comparison, the S&P 500 Index returned 4.91% for the same period.
The Fund invests in a diversified selection of underlying portfolios from the BB&T family of mutual funds. As such, our allocation decisions play a big role in the Fund’s performance.
In 2005, we benefited from strong, absolute returns from the shares we owned in the BB&T Large Company Value Fund and BB&T International Equity Fund. We have a long-term strategic overweight in the value arena, which did well versus growth. Also, our strategic overweights in mid-cap and small-cap significantly contributed to our outperformance in 2005.
Our substantial weighting in the BB&T International Equity Fund demonstrated the potential value of diversifying outside the U.S., as the MSCI EAFE Index(1), which tracks international stocks, gained over twice as much as the S&P 500 Index(2), our domestic equity benchmark.
As of December 31, 2005, the portfolio’s five largest allocations in underlying BB&T portfolios were the Large Company Value Fund (30.3% of portfolio’s net assets), the Large Company Growth Fund (20.3%), the International Equity Fund (14.6%), the Equity Index Fund (12.6%), and the Mid Cap Value Fund (7.0%)(3).
These five funds are the same, and in the same order, as the allocations we had one year earlier. This similarity reflects our practice of rebalancing the Fund’s assets back to our strategic weightings on a regular basis.
While still providing positive returns, our investment in the BB&T Large Company Growth Fund underperformed the other asset classes for the year.
Looking ahead to the next twelve months, we have positive expectations for stocks, and we expect stocks to outperform bonds.
Steady economic growth, relatively contained inflation, low long-term interest rates, and reasonable valuation levels all contribute to a favorable backdrop for stocks.
One of the risks to this view is that corporate profit margins, currently near record levels, are being pressured by higher short-term interest rates and higher commodity prices. Although decelerating, earnings growth continues and remains healthy in a number of sectors. Other risks to our view include lower housing affordability and a peaking housing market. However, we believe capital management activity will increase. Cash on corporate balance sheets is high, which should support continued solid merger and acquisition activity, as well as potential dividend increases and share repurchases.
(1) The MSCI EAFE Index is an unmanaged index which is generally representative of the performance of stock markets in that region. The index does not reflect the deduction of expenses associated with a mutual fund, such as investment management and fund accounting fees. The Fund’s performance reflects the deduction of fees for these services. Investors cannot invest directly in an index, although they can invest in its underlying securities.
(2) The Fund is measured against the S&P 500 Index, an unmanaged index generally representative of the U.S. stock market as a whole. The Index does not reflect the deduction of expenses associated with a mutual fund, such as investment management and fund accounting fees. The Fund’s performance reflects the deduction of fees for these services. Investors cannot invest directly in an index, although they can invest in its underlying securities.
(3) Portfolio composition is as of December 31, 2005, and is subject to change.
A portion of the Fund’s fees have been reduced. If fees had not been reduced, the Fund’s total return for the period would have been lower.
4
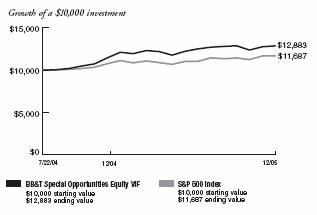
BB&T Special Opportunities Equity VIF
Performance Overview 7/22/04 - 12/31/05
Portfolio Manager
George F. Shipp, CFA
Chief Investment Officer
Scott & Stringfellow, Inc.
Average Annual Returns (Inception 7/22/04)
|
| 1 Year |
| Since Inception |
|
BB&T Special Opportunities Equity VIF |
| 6.29 | % | 19.18 | % |
S&P 500 Index |
| 4.91 | % | 11.40 | % |
The chart represents a comparison of a hypothetical $10,000 investment in the indicated Fund versus a similar investment in the Fund’s benchmark, and includes the reinvestment of dividends and capital gains. (The returns include the Fund level expenses, but exclude the insurance charges). Past performance doe not guarantee future results. The value of the contract will fluctuate so that when redeemed, it may be worth more or less than the original investment.
Investment Concerns
Equity securities (stocks) are more volatile and carry more risk than other forms of investments, including investments in high-grade fixed income securities. The net asset value per share of this Fund will fluctuate as the value of the securities in the portfolio changes. A concentrated portfolio may add a measure of volatility to performance, as major fluctuations in any one holding will likely affect the Fund more than a fund with greater diversification.
For the full year 2005, the BB&T Special Opportunities Equity VIF produced a 6.29% gain, outpacing both the 4.91% total return of the S&P 500 Index(1) and the 6.1% result of the Russell 3000 Index. This was also only slightly ahead of the Lipper Multi-Cap Value group, which posted a 6.2% gain for the year.
We manage a concentrated portfolio and were fortunate to have a few more big winners than losers. We entered October with a decent performance advantage against the market, but Hurricanes Katrina and Rita knocked a few of our companies off track. We became mesmerized by the associated spike in energy quotes and determined to hold our Apache Corp. and Pioneer Natural Resources Co. positions, even though we were well aware their Gulf of Mexico operations had been hard hit. Oil and gas quotes soon topped out due to the “demand destruction” caused by refinery and chemical outages in tandem with $3/gallon gasoline, causing the energy group to under-perform the S&P 500 by 9% in the 4th quarter. In the short term both of these stocks lagged land-focused exploration and production companies (such as Burlington, EOG, or XTO). Another fund holding, MedCath Corp. had a cardiovascular-focused hospital in Hurricane Katrina’s path. Although it managed to keep its doors open throughout the disaster, that facility in a New Orleans suburb contributed to a reduced outlook. MedCath Corp. shares fell 22% during the quarter and the year. At the end of the year, though, our admiration of energy had served our clients well, as Apache Corp., Pioneer Natural Resources Co. and Weatherford International, Ltd. (a driller for energy) all posted gains exceeding 35% over the period.
Late in 2005 we waved good-bye to our biggest gainer of the year, managed healthcare leader Coventry Health Care, Inc. Coventry shares were up over 50% from our original purchase price towards the end of 2005, on top of 23% gains in 2004 and a 122% rebound in 2003. That adds up to a cumulative +357%, whereas earnings have advanced 170% over those three years. The resultant doubling in P/E valuation raises risks, while at the same time logic would say that margin gains will become increasingly difficult. Healthcare risk underwriting used to be a cyclical business, so despite our strong admiration for the company’s management, we decided to move on.
Digital Insight, Inc. was another of our original purchases for the Fund, after shares fell on some negative short-term news just before our inception date, giving us a chance to enter around $14. Since then, we have trimmed the position on a few occasions to manage risk (wish we hadn’t but hindsight is always 20/20). As much as we like the company and its prospects, today we find ourselves uncomfortable initiating positions at current levels around $33 (up 30% in 2005 alone), so we sold out of our position and took our profits. Digital Insight, Inc. sees non-GAAPEPS in a $1.04-1.06 range in 2006 (+21%), which puts the stock’s P/E valuation at a “full” 35x forecasts.
5
There was bad with the good, as there will likely always be. Mistakes will be made, learned from, and actions taken. We can forgive ourselves for riding out the energy storm, but not for the red ink we spilled in printer maker Lexmark International, Inc., which reported two major reductions in its earnings outlook in 2005 on the way to seeing its value nearly cut in half. We should have taken the hint the first time, i.e. “fool me twice, shame on us.” That second miss (October 3) cost us about 30% on our Lexmark position in the quarter as investors (including us) lost faith in the “razor and blade” thesis that had carried the company for about nine years. A 23% quarterly decline in security and storage software leader Symantec Corp. and 12% drop in cable operator Comcast Corp. – Class A were a little more frustrating, only because we did not see material news (“increasing competition” often is cited for both) to fully explain the serious depreciation.
Ours is not a dividend-oriented portfolio, but 15 of our 28 year-end equity holdings raised their payouts in 2005, by an average 35% (median +17%). If fourth quarter earnings estimates generally are accurate, our companies’ profits grew by an average 17% in 2005, superior to the still-impressive +13% expectation for the S&P 500.We believe that should be encouraging for our portfolio’s 2006 prospects.
As of December 31, 2005, the top five equity holdings in the Fund were Smithfield Foods, Inc. (4.2% of the portfolio’s net assets), CONSOL Energy, Inc. (4.1%), Weatherford International, Ltd. (3.9%), PACCAR, Inc. (3.8%), and Comcast Corp.- Class A (3.8%)(2).
(1) The Fund is measured against the S&P 500 Index, an unmanaged index generally representative of the U.S. stock market as a whole. The Index does not reflect the deduction of expenses associated with a mutual fund, such as investment management and fund accounting fees. The Fund’s performance reflects the deduction of fees for these services. Investors cannot invest directly in an index, although they can invest in its underlying securities.
(2) Portfolio composition is as of December 31, 2005, and is subject to change.
A portion of the Fund’s fees have been reduced. If fees had not been reduced, the Fund’s total return for the period would have been lower.
6
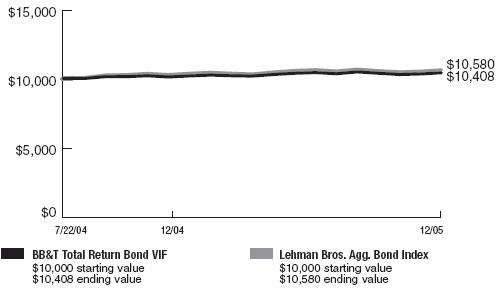
BB&T Total Return Bond VIF
Performance Overview 7/22/04 - 12/31/05
Growth of a $10,000 investment
Portfolio Manager
David M Ralston, CFA
Managing Director and Chief Investment Officer
Sterling Capital Management, LLC
Average Annual Returns (Inception 7/22/04)
|
| 1 Year |
| Since Inception |
|
|
|
|
|
|
|
BB&T Total Return Bond VIF |
| 2.29 | % | 2.81 | % |
Lehman Bros. Agg. Bond Index |
| 2.43 | % | 3.98 | % |
The chart represents a comparison of a hypothetical $10,000 investment in the indicated Fund versus a similar investment in the Fund’s benchmark, and includes the reinvestment of dividends and capital gains. (The returns include the Fund level expenses, but exclude the insurance charges). Past performance does not guarantee future results. The value of the contract will fluctuate so that when redeemed, it may be worth more or less than the original investment.
Investment Concerns
Bonds offer a relatively stable level of income, although bond prices will fluctuate providing the potential for principal gain or loss. Intermediate-term, higher-quality bonds generally offer less risk than longer-term bonds and a lower rate of return.
The Fund is subject to the risk that principal value reacts in opposition to the movement of interest rates and that a rising interest rate environment increases the risk of loss of principal.
For the twelve-month period ended December 31, 2005, the BB&I Total Return Bond VIF produced a total return of 2.29%, compared to 2.43% for the Lehman Brothers Aggregate Bond Index(1).
Effective July 18, 2005, Sterling Capital Management LLC began serving as subadviser to the Fund*.
2005 will be remembered as the year of an active Federal Reserve, a flatter yield curve and a benevolent foreign investor. Throughout the year the Fed continued on its “measured” path of removing prior years of monetary accommodation. The Fed raised the overnight borrowing rate a total of eight times in 2005 to 4.25%.
As the Fed removed monetary accommodation from an economy exhibiting amazing resilience, yields on Treasury securities from 3 months to approximately 15 years rose. The rather benign increase in core inflation along with a continued inflow of foreign capital provided a consistent bid for the long end of the Treasury curve. In fact, when looking at total returns for the year (coupon and price appreciation), long Treasury securities had the best relative returns, up approximately 9% for the year. Due to the flattening of the curve, the distant second place segment of the yield curve was the return on 6 month Treasury bills which returned 3.1% for the same time period.
In 2005 the U.S. became increasingly more dependent upon the foreign investor. Spending to finance the Iraq war and the rebuilding cost associated with hurricanes in the gulf coast led to a further deterioration of the budget deficit. Increased reliance on foreign oil and Americans’ preferences for imported goods led to a ballooning of the trade deficit. The inflow of foreign funds has had an increasing degree of importance in helping fund our internal shortfall. It is estimated that in 2005 70% of all new Treasuries issued were bought by foreign investors. This support has been critically important in maintaining low long-term interest rates, but the magnitude of these flows is worrisome and is a significant risk looking forward.
Another important influence on rates during 2005 was the energy price spike due to the dislocation of oil and refinery capacity. The Iraq war and the unprecedented back to back hurricanes hitting the refinery rich gulf coast had a severe impact on prices and consumer confidence. However, the economy weathered these storms and appears to be once again expanding at a healthy pace.
As we look forward to the year ahead the economy continues to expand at a pace that is expected to be above trend. While consensus expectations are for a slight slowing of domestic growth, the global economy is solidly gaining momentum. In 2006 corporate spending and manufacturing are expected to have a more prominent leadership role in the economy. The improved health of Corporate America that is flush with liquidity is expected to facilitate the generation of new jobs in the coming year. It is our belief that the strength of the production side of the economy will continue to create new jobs in 2006. During the last few years many of these new jobs have been created by the housing sector. While we acknowledge that there are pockets of excessive residential price appreciation, we do not believe we have a bubble in home values that is getting ready to burst. Yet we do expect the economic contribution of housing to be weaker in 2006 than in 2005. However, nearly every measure of the sector is stronger that where it was a year ago.
7
Continued new job creation is critical to our positive outlook on the economy moving forward. With lower rates and increased refinancing, consumers extracted a great deal of equity from their homes over the last several years. As rates rise, this stimulus of personal consumption will decline. Another source of optimism for us toward economic expansion is the continued growth of federal spending. Support for reconstruction of the Gulf states region is expected to go on for years. Spending for defense is expected to remain at elevated levels.
On top of robust growth, we are anticipating a higher level of core inflation over the next twelve months. We feel several factors will contribute to an increase in prices. First, we believe the Chinese will eventually capitulate to political pressure from Congress and allow a second more realistic revaluation of their currency. This will reduce the downward pressure we have seen on import prices over the last several years. Second, we believe that the economy is approaching full employment and the pressure on wages will continue to rise.
In addition, the “output gap”, or the slack in the economy, is narrowing as the production side of the economy accelerates. History has shown that with capacity utilization above 80%, producers will be able to raise prices.
Our belief that the economy is healthy and advancing combined with our expectations of higher inflation leads us to a cynical view of the current level of interest rates. Simply stated, we do not believe an investor is being sufficiently paid to have exposure to current yield levels. We view the interest rate market as range-bound with current prices at the high end and yields at the low end of the range for the next several months. Therefore, we are currently short duration in our core portfolios.
From a yield curve perspective, we have shifted our positioning over the last two months. After being barbelled for most of 2005 we have moved to more of a bullet approach.
Since we expect the Fed to continue to raise short rates we remain overweight in floating rate securities to participate in the anticipated upward adjustment that accompanies Fed rate increases. Security selection in the treasury, agency and taxable muni sectors detracted about 5 basis points relative to the benchmark, and sector allocations to the taxable muni sector cost us another 2 basis points of excess return. Convexity choice across all sectors was also a small detractor from performance.
From a sector perspective, we remain convinced that having a portfolio that is of higher quality and higher yield is the proper strategy. We still believe that the restructuring risk in the market due to the emerging importance of private equity funds favors equity investors over bondholders. As such we are underweight credit and expect to remain so over the next few months.
Due to our range-bound view towards interest rates and our concern about credit, we are overweight mortgages and structure product. We believe the high quality and superior yields offered by direct issue mortgages, commercial mortgage-backed securities and AAA rated home equity Asset Backed Securities will provide superior return opportunities over time.
As of December 31, 2005, the Fund’s effective duration was 4.30 years2. Approximately 40.1% of the portfolio was invested in corporate obligations, 32.7% in U.S. Treasury and agency securities, 24.8% in collateralized mortgage-backed securities, 7.5% in cash and cash equivalents and 2.2% in municipal bonds. The Fund’s average credit quality was Aa1 (as rated by Moody’s)(3)(4).
We expect a challenging market environment for bonds in the first half of 2006. We feel our conservative posturing of the portfolio will provide us extension opportunities in the months ahead. We believe the Fed will raise rates a few more times and pause when the Fed funds rate reaches 4.75% to 5%. At this point we believe the yield curve will once again steepen and we expect to more heavily invest in Treasury securities in the intermediate part of the curve.
*Sterling Capital Management LLC is a majority owned, non-bank subsidiary of BB&T Corporation, and is an affiliate of BB&T Asset Management, Inc.
(1) The Fund is measured against Lehman Brothers Aggregate Bond Index which is a market value-weighted performance benchmark for investment-grade fixed-rate debt issues, including government, corporate, asset-backed and mortgage-backed securities, with maturities of at least one year. The index is unmanaged and does not reflect the deduction of expenses associated with a mutual fund, such as investment management and fund accounting fees. The Fund’s performance reflects the deduction of fees for these services. Investors cannot invest directly in an index, although they can invest in its underlying securities.
(2) Duration is a measure of a bond’s or a bond fund’s price risk that is adjusted for any optionality.
(3) Portfolio composition is as of December 31, 2005 and is subject to change.
(4) Moody’s Fund Ratings represent an opinion only, not a recommendation to buy or sell.
A portion of the Fund’s fees have been reduced. If fees had not been reduced, the Fund’s total return for the period would have been lower.
8
BB&T Variable Insurance Funds
Summary of Portfolio Holdings (Unaudited)
December 31, 2005
The BB&T Variable Insurance Funds portfolio composition was as follows at December 31, 2005:
| BB&T Large Cap Value VIF | Percentage of net assets | ||||||
| Consumer Discretionary | 7.8 | % | |||||
| Consumer Staples | 6.1 | ||||||
| Energy | 13.0 | ||||||
| Financials | 30.5 | ||||||
| Health Care | 9.0 | ||||||
| Industrials | 7.4 | ||||||
| Information Technology | 8.3 | ||||||
| Materials | 4.9 | ||||||
| Repurchase Agreement | 2.7 | ||||||
| Telecommunication Services | 5.0 | ||||||
| Utilities | 5.3 | ||||||
| 100.0 | % | ||||||
BB&T Mid Cap Growth VIF
| Consumer Discretionary | 12.6 | % | |||||
| Energy | 13.1 | ||||||
| Exchange Traded Funds | 4.3 | ||||||
| Financials | 8.3 | ||||||
| Health Care | 16.1 | ||||||
| Industrials | 13.2 | ||||||
| Information Technology | 21.9 | ||||||
| Materials | 2.5 | ||||||
| Repurchase Agreement | 3.6 | ||||||
| Telecommunication Services | 4.8 | ||||||
| 100.4 | % | ||||||
BB&T Large Company Growth VIF
| Consumer Discretionary | 9.2 | % | |||||
| Consumer Staples | 8.8 | ||||||
| Energy | 5.6 | ||||||
| Financials | 4.8 | ||||||
| Health Care | 20.2 | ||||||
| Industrials | 17.3 | ||||||
| Information Technology | 28.8 | ||||||
| Repurchase Agreement | 4.4 | ||||||
| Telecommunication Services | 0.9 | ||||||
| 100.0 | % | ||||||
BB&T Capital Manager Equity VIF
| Equity Index | 12.6 | % | |||||
| International Equity | 14.7 | ||||||
| Large Company Equity | 50.6 | ||||||
| Mid Cap Equity | 11.6 | ||||||
| Money Market | 3.0 | ||||||
| Small Cap | 7.4 | ||||||
| 99.9 | % | ||||||
BB&T Special Opportunities Equity VIF
| Commercial Services | 6.8 | % | |||||
| Consumer Discretionary | 20.4 | ||||||
| Energy | 15.0 | ||||||
| Financials | 8.2 | ||||||
| Health Care | 13.2 | ||||||
| Industrials | 7.6 | ||||||
| Information Technology | 18.5 | ||||||
| Repurchase Agreement | 10.7 | ||||||
| 100.4 | % | ||||||
BB&T Total Return Bond VIF
| Corporate Bonds | 40.1 | % | |||||
| Federal Home Loan Bank | 4.4 | ||||||
| Federal Home Loan Mortgage Corporation—Mortgage Backed Securities | 7.6 | ||||||
| Federal Home Loan Mortgage Corporation—U.S. Government Agencies | 3.2 | ||||||
| Federal National Mortgage Association—Mortgage Backed Securities | 17.2 | ||||||
| Federal National Mortgage Association—U.S. Government Agencies | 4.7 | ||||||
| Government National Mortgage Association | 8.4 | ||||||
| Municipal Bonds | 2.2 | ||||||
| Repurchase Agreement | 7.5 | ||||||
| Student Loan Marketing Association | 1.6 | ||||||
| U.S. Treasury Bonds | 9.5 | ||||||
| U.S. Treasury Notes | 0.9 | ||||||
| 107.3 | % | ||||||
9
BB&T Variable Insurance Funds
Expense Example (Unaudited)
December 31, 2005
As a shareholder of the BB&T Variable Insurance Funds, you incur two types of costs: (1) transaction costs, and (2) ongoing costs, including management fees; and other Fund expenses.
These examples are intended to help you understand your ongoing costs (in dollars) of investing in the BB&T Variable Insurance Funds and to compare these costs with the ongoing costs of investing in other mutual funds.
These examples are based on an investment of $1,000 invested at the beginning of the period and held for the entire period from July 1, 2005 through December 31, 2005.
Actual Example
The table below provides information about actual account values and actual expenses. You may use the information below, together with the amount you invested, to estimate the expenses that you paid over the period. Simply divide your account value by $1,000 (for example, an $8,600 account value divided by $1,000 = 8.6), then multiply the result by the number in the table under the heading entitled "Expenses Paid During Period" to estimate the expenses you paid on your account during this period.
| Beginning Account Value 7/1/05 | Ending Account Value 12/31/05 | Expenses Paid During Period* 7/1/05 – 12/31/05 | Expense Ratio During Period 7/1/05 – 12/31/05 | ||||||||||||||||
| BB&T Large Cap Value VIF | $ | 1,000.00 | $ | 1,054.40 | $ | 4.09 | 0.79 | % | |||||||||||
| BB&T Mid Cap Growth VIF | 1,000.00 | 1,129.00 | 4.19 | 0.78 | % | ||||||||||||||
| BB&T Large Company Growth VIF | 1,000.00 | 1,031.30 | 3.94 | 0.77 | % | ||||||||||||||
| BB&T Capital Manager Equity VIF | 1,000.00 | 1,062.50 | 0.99 | 0.19 | % | ||||||||||||||
| BB&T Special Opportunities Equity VIF | 1,000.00 | 1,029.00 | 6.03 | 1.18 | % | ||||||||||||||
| BB&T Total Return Bond VIF | 1,000.00 | 998.80 | 4.43 | 0.88 | % | ||||||||||||||
* Expenses are equal to the average account value times the Fund's annualized expense ratio multiplied by the number of days in the most recent fiscal half-year divided by the number of days in the fiscal year.
Hypothetical Example for Comparison Purposes
The table below provides information about hypothetical account values and hypothetical expenses based on each BB&T Variable Insurance Funds' actual expense ratio and an assumed rate of return of 5% per year before expenses, which is not the Fund's actual return. The hypothetical account values and expenses may not be used to estimate the actual ending account balance or expenses you paid for the period. You may use this information to compare this 5% hypothetical example with the 5% hypothetical examples that appear in the shareholder reports of other funds.
Please note that the expenses shown in the table are meant to highlight your ongoing costs only and do not reflect any transactional costs. Therefore, the table is useful in comparing ongoing costs only, and will not help you determine the relative total costs of owning different funds. In addition, if these transactional costs were included, your costs would have been higher.
| Beginning Account Value 7/1/05 | Ending Account Value 12/31/05 | Expenses Paid During Period* 7/1/05 – 12/31/05 | Expense Ratio During Period 7/1/05 – 12/31/05 | ||||||||||||||||
| BB&T Large Cap Value VIF | $ | 1,000.00 | $ | 1,021.22 | $ | 4.02 | 0.79 | % | |||||||||||
| BB&T Mid Cap Growth VIF | 1,000.00 | 1,021.27 | 3.97 | 0.78 | % | ||||||||||||||
| BB&T Large Company Growth VIF | 1,000.00 | 1,021.32 | 3.92 | 0.77 | % | ||||||||||||||
| BB&T Capital Manager Equity VIF | 1,000.00 | 1,024.25 | 0.97 | 0.19 | % | ||||||||||||||
| BB&T Special Opportunities Equity VIF | 1,000.00 | 1,019.26 | 6.01 | 1.18 | % | ||||||||||||||
| BB&T Total Return Bond VIF | 1,000.00 | 1,020.77 | 4.48 | 0.88 | % | ||||||||||||||
* Expenses are equal to the average account value times the Fund's annualized expense ratio multiplied by the number of days in the most recent fiscal half-year divided by the number of days in the fiscal year.
10
BB&T Large Cap Value VIF
Schedule of Portfolio Investments
December 31, 2005
| Shares | Fair Value | ||||||||||
| COMMON STOCKS (97.3%) | |||||||||||
| Consumer Discretionary (7.8%) | |||||||||||
| 8,223 | Federated Department Stores, Inc. | $ | 545,432 | ||||||||
| 45,000 | Gannett Co., Inc. | 2,725,649 | |||||||||
| 70,000 | Mattel, Inc. | 1,107,400 | |||||||||
| 17,475 | V.F. Corp. | 967,067 | |||||||||
| 99,000 | Walt Disney Co. (The) | 2,373,030 | |||||||||
| 13,100 | Whirlpool Corp. | 1,097,256 | |||||||||
| 8,815,834 | |||||||||||
| Consumer Staples (6.1%) | |||||||||||
| 55,400 | Albertson's, Inc. | 1,182,790 | |||||||||
| 24,000 | Altria Group, Inc. | 1,793,280 | |||||||||
| 38,000 | Kimberly-Clark Corp. | 2,266,700 | |||||||||
| 90,452 | Sara Lee Corp. | 1,709,543 | |||||||||
| 6,952,313 | |||||||||||
| Energy (13.0%) | |||||||||||
| 19,000 | Anadarko Petroleum Corp. | 1,800,250 | |||||||||
| 9,000 | Burlington Resources, Inc. | 775,800 | |||||||||
| 50,800 | ChevronTexaco Corp. | 2,883,916 | |||||||||
| 53,400 | ConocoPhillips | 3,106,812 | |||||||||
| 47,632 | Exxon Mobil Corp. | 2,675,489 | |||||||||
| 38,500 | Royal Dutch Shell PLC, A Shares, ADR | 2,367,365 | |||||||||
| 12,000 | Schlumberger, Ltd. | 1,165,800 | |||||||||
| 14,775,432 | |||||||||||
| Financials (30.5%) | |||||||||||
| 6,000 | Ambac Financial Group, Inc. | 462,360 | |||||||||
| 17,000 | American International Group, Inc. | 1,159,910 | |||||||||
| 76,000 | Bank of America Corp. | 3,507,400 | |||||||||
| 37,000 | Bank of New York Co., Inc. (The) | 1,178,450 | |||||||||
| 62,333 | Citigroup, Inc. | 3,025,020 | |||||||||
| 15,000 | Equity Residential, REIT | 586,800 | |||||||||
| 34,000 | Fannie Mae | 1,659,540 | |||||||||
| 11,500 | Franklin Resources, Inc. | 1,081,115 | |||||||||
| 44,677 | ING Groep NV, ADR | 1,555,653 | |||||||||
| 74,490 | J.P. Morgan Chase & Co. | 2,956,508 | |||||||||
| 23,200 | Lincoln National Corp. | 1,230,296 | |||||||||
| 30,000 | Merrill Lynch & Company, Inc. | 2,031,900 | |||||||||
| 37,000 | Northern Trust Corp. | 1,917,340 | |||||||||
| 45,000 | Old Republic International Corp. | 1,181,700 | |||||||||
| 38,000 | PNC Financial Services Group, Inc. | 2,349,540 | |||||||||
| 56,600 | St. Paul Travelers Cos, Inc. (The) | 2,528,322 | |||||||||
| 26,000 | SunTrust Banks, Inc. | 1,891,760 | |||||||||
| 52,000 | Washington Mutual, Inc. | 2,262,000 | |||||||||
| 22,900 | Wells Fargo & Co. | 1,438,807 | |||||||||
| 16,400 | Willis Group Holdings, Ltd. | 605,816 | |||||||||
| 34,610,237 | |||||||||||
| Health Care (9.0%) | |||||||||||
| 29,200 | Abbott Laboratories | 1,151,356 | |||||||||
| 43,600 | Bristol-Myers Squibb Co. | 1,001,928 | |||||||||
| 17,000 | Cigna Corp. | 1,898,900 | |||||||||
| 25,000 | HCA, Inc. | 1,262,500 | |||||||||
| 17,400 | Johnson & Johnson | 1,045,740 | |||||||||
| 61,000 | Merck & Co., Inc. | 1,940,410 | |||||||||
| 51,000 | Pfizer, Inc. | 1,189,320 | |||||||||
| 15,000 | Wyeth | 691,050 | |||||||||
| 10,181,204 | |||||||||||
| Shares or Principal Amount | Fair Value | ||||||||||
| COMMON STOCKS — (continued) | |||||||||||
| Industrials (7.4%) | |||||||||||
| 15,000 | CSX Corp. | $ | 761,550 | ||||||||
| 9,500 | Emerson Electric Co. | 709,650 | |||||||||
| 31,000 | General Electric Co. | 1,086,550 | |||||||||
| 18,900 | Parker-Hannifin Corp. | 1,246,644 | |||||||||
| 3,500 | Phelps Dodge Corp. | 503,545 | |||||||||
| 27,600 | Pitney Bowes, Inc. | 1,166,100 | |||||||||
| 47,000 | Raytheon Co. | 1,887,050 | |||||||||
| 14,000 | Textron, Inc. | 1,077,720 | |||||||||
| 8,438,809 | |||||||||||
| Information Technology (8.3%) | |||||||||||
| 25,400 | Automatic Data Processing, Inc. | 1,165,606 | |||||||||
| 29,000 | First Data Corp. | 1,247,290 | |||||||||
| 82,200 | Hewlett-Packard Co. | 2,353,386 | |||||||||
| 4,800 | IBM Corp. | 394,560 | |||||||||
| 40,000 | Microsoft Corp. | 1,046,000 | |||||||||
| 87,000 | Nokia Corp., ADR | 1,592,100 | |||||||||
| 96,000 | Time Warner, Inc. | 1,674,240 | |||||||||
| 9,473,182 | |||||||||||
| Materials (4.9%) | |||||||||||
| 17,000 | Air Products & Chemicals, Inc. | 1,006,230 | |||||||||
| 41,000 | Alcoa, Inc. | 1,212,370 | |||||||||
| 5,000 | E.I. DuPont de Nemours & Co. | 212,500 | |||||||||
| 39,800 | Sonoco Products Co. | 1,170,120 | |||||||||
| 30,000 | Weyerhaeuser Co. | 1,990,200 | |||||||||
| 5,591,420 | |||||||||||
| Telecommunication Services (5.0%) | |||||||||||
| 72,399 | AT&T, Inc. | 1,773,052 | |||||||||
| 36,800 | BellSouth Corp. | 997,280 | |||||||||
| 60,000 | Sprint Nextel Corp. | 1,401,600 | |||||||||
| 52,000 | Verizon Communications, Inc. | 1,566,240 | |||||||||
| 5,738,172 | |||||||||||
| Utilities (5.3%) | |||||||||||
| 16,000 | Dominion Resources, Inc. | 1,235,200 | |||||||||
| 30,000 | Duke Energy Corp. | 823,500 | |||||||||
| 38,200 | National Fuel Gas Co. | 1,191,458 | |||||||||
| 70,000 | NiSource, Inc. | 1,460,200 | |||||||||
| 6,450 | SCANA Corp. | 254,001 | |||||||||
| 59,910 | Xcel Energy, Inc. | 1,105,939 | |||||||||
| 6,070,298 | |||||||||||
| Total Common Stocks (Cost $90,964,299) | 110,646,901 | ||||||||||
| REPURCHASE AGREEMENT (2.7%) | |||||||||||
| $ | 3,042,954 | U.S. Bank N.A., 4.05%, dated 12/30/05, maturing 1/3/06, with a maturity value of $3,044,323 (Collateralized fully by U.S. Government Agencies) | 3,042,954 | ||||||||
| Total Repurchase Agreement (Cost $3,042,954) | 3,042,954 | ||||||||||
| Total Investments (Cost $94,007,253) — 100.0% | 113,689,855 | ||||||||||
| Net other assets (liabilities) — 0.0% | (41,859 | ) | |||||||||
| NET ASSETS — 100.0% | $ | 113,647,996 | |||||||||
See accompanying notes to schedules of portfolio investments and notes to the financial statements.
11
BB&T Mid Cap Growth VIF
Schedule of Portfolio Investments
December 31, 2005
| Shares | Fair Value | ||||||||||
| COMMON STOCKS (92.5%) | |||||||||||
| Consumer Discretionary (12.6%) | |||||||||||
| 9,850 | Abercrombie & Fitch Co., Class A | $ | 642,023 | ||||||||
| 11,550 | Advance Auto Parts, Inc. (a) | 501,963 | |||||||||
| 10,000 | Carter's, Inc. (a) | 588,500 | |||||||||
| 14,400 | Chico's FAS, Inc. (a) | 632,592 | |||||||||
| 17,100 | Coach, Inc. (a) | 570,114 | |||||||||
| 5,700 | Getty Images, Inc. (a) | 508,839 | |||||||||
| 3,625 | Harman International Industries, Inc. | 354,706 | |||||||||
| 6,500 | Starwood Hotels & Resorts Worldwide, Inc. | 415,090 | |||||||||
| 28,000 | Urban Outfitters, Inc. (a) | 708,680 | |||||||||
| 4,922,507 | |||||||||||
| Energy (13.1%) | |||||||||||
| 7,300 | Arch Coal, Inc. | 580,350 | |||||||||
| 15,000 | Cal Dive International, Inc. (a) | 538,350 | |||||||||
| 9,700 | Cameco Corp. | 614,883 | |||||||||
| 19,700 | Chesapeake Energy Corp. | 625,081 | |||||||||
| 15,600 | Cooper Cameron Corp. (a) | 645,840 | |||||||||
| 16,000 | Grant Prideco, Inc. (a) | 705,920 | |||||||||
| 5,950 | National-Oilwell Varco, Inc. (a) | 373,065 | |||||||||
| 8,100 | Peabody Energy Corp. | 667,602 | |||||||||
| 10,300 | Rowan Cos., Inc. | 367,092 | |||||||||
| 1 | XTO Energy, Inc. | 44 | |||||||||
| 5,118,227 | |||||||||||
| Financials (8.3%) | |||||||||||
| 9,700 | Affiliated Managers Group, Inc. (a) | 778,425 | |||||||||
| 27,000 | Ameritrade Holding Corp. (a) | 648,000 | |||||||||
| 1,950 | Chicago Mercantile Exchange Holdings, Inc. | 716,606 | |||||||||
| 6,000 | Legg Mason, Inc. | 718,140 | |||||||||
| 5,500 | T. Rowe Price Group, Inc. | 396,165 | |||||||||
| 3,257,336 | |||||||||||
| Health Care (16.1%) | |||||||||||
| 6,100 | Aetna, Inc. | 575,291 | |||||||||
| 13,500 | Caremark Rx, Inc. (a) | 699,165 | |||||||||
| 12,250 | Celgene Corp. (a) | 793,800 | |||||||||
| 4,600 | Cerner Corp. (a) | 418,186 | |||||||||
| 11,700 | Covance, Inc. (a) | 568,035 | |||||||||
| 9,500 | Coventry Health Care, Inc. (a) | 541,120 | |||||||||
| 16,000 | Dade Behring Holdings, Inc. | 654,240 | |||||||||
| 8,000 | Genzyme Corp. (a) | 566,240 | |||||||||
| 8,400 | Humana, Inc. (a) | 456,372 | |||||||||
| 9,100 | Omnicare, Inc. | 520,702 | |||||||||
| 13,400 | ResMed, Inc. (a) | 513,354 | |||||||||
| 6,306,505 | |||||||||||
| Industrials (13.2%) | |||||||||||
| 9,500 | Canadian Pacific Railway, Ltd. | 398,525 | |||||||||
| 24,500 | Gol-Linhas Aereas Inteligentes, ADR | 691,145 | |||||||||
| 9,300 | Goodrich Corp. | 382,230 | |||||||||
| 10,300 | JLG Industries, Inc. | 470,298 | |||||||||
| 18,300 | Joy Global, Inc. | 732,000 | |||||||||
| 16,700 | Monster Worldwide, Inc. (a) | 681,694 | |||||||||
| 11,400 | Precision Castparts Corp. | 590,634 | |||||||||
| 6,800 | Rockwell Automation, Inc. | 402,288 | |||||||||
| Shares or Principal Amount | Fair Value | ||||||||||
| COMMON STOCKS — (continued) | |||||||||||
| Industrials — (continued) | |||||||||||
| 8,750 | UTI Worldwide, Inc. | $ | 812,350 | ||||||||
| 5,161,164 | |||||||||||
| Information Technology (21.9%) | |||||||||||
| 16,950 | Advanced Micro Devices, Inc. (a) | 518,670 | |||||||||
| 11,300 | Amphenol Corp., Class A | 500,138 | |||||||||
| 11,400 | ATI Technologies, Inc. (a) | 193,686 | |||||||||
| 13,300 | AutoDesk, Inc. | 571,235 | |||||||||
| 10,500 | Broadcom Corp., Class A (a) | 495,075 | |||||||||
| 26,500 | CNET Networks, Inc. (a) | 389,285 | |||||||||
| 17,500 | Cognizant Technology Solutions Corp., Class A (a) | 881,125 | |||||||||
| 32,000 | Comverse Technology, Inc. (a) | 850,880 | |||||||||
| 14,800 | Harris Corp. | 636,548 | |||||||||
| 31,700 | Intersil Corp., Class A | 788,696 | |||||||||
| 19,700 | Jabil Circuit, Inc. (a) | 730,673 | |||||||||
| 14,000 | Marvell Technology Group, Ltd. (a) | 785,260 | |||||||||
| 27,500 | MEMC Electronic Materials, Inc. (a) | 609,675 | |||||||||
| 13,400 | Varian Semiconductor Equipment Associates, Inc. (a) | 588,662 | |||||||||
| 8,539,608 | |||||||||||
| Materials (2.5%) | |||||||||||
| 18,700 | Airgas, Inc. | 615,230 | |||||||||
| 7,750 | Florida Rock Industries, Inc. | 380,215 | |||||||||
| 995,445 | |||||||||||
| Telecommunication Services (4.8%) | |||||||||||
| 43,000 | American Tower Corp., Class A (a) | 1,165,300 | |||||||||
| 16,600 | NII Holdings, Inc. (a) | 725,088 | |||||||||
| 1,890,388 | |||||||||||
| Total Common Stocks (Cost $25,441,356) | 36,191,180 | ||||||||||
| EXCHANGE TRADED FUNDS (4.3%) | |||||||||||
| 17,700 | iShares Russell Midcap Growth Index Fund | 1,664,508 | |||||||||
| Total Exchange Traded Funds (Cost $1,633,913) | 1,664,508 | ||||||||||
| REPURCHASE AGREEMENT (3.6%) | |||||||||||
| $ | 1,408,006 | U.S. Bank N.A., 4.05%, dated 12/30/05, maturing 1/3/06, with a maturity value of $1,408,640 (Collateralized fully by U.S. Government Agencies) | 1,408,006 | ||||||||
| Total Repurchase Agreement (Cost $1,408,006) | 1,408,006 | ||||||||||
| Total Investments (Cost $28,483,275) — 100.4% | 39,263,694 | ||||||||||
| Net other assets (liabilities) — (0.4)% | (173,196 | ) | |||||||||
| NET ASSETS — 100.0% | $ | 39,090,498 | |||||||||
See accompanying notes to schedules of portfolio investments and notes to the financial statements.
12
BB&T Large Company Growth VIF
Schedule of Portfolio Investments
December 31, 2005
| Shares | Fair Value | ||||||||||
| COMMON STOCKS (95.6%) | |||||||||||
| Consumer Discretionary (9.2%) | |||||||||||
| 3,397 | Chico's FAS, Inc. (a) | $ | 149,230 | ||||||||
| 3,671 | Coach, Inc. (a) | 122,391 | |||||||||
| 2,300 | eBay, Inc. (a) | 99,475 | |||||||||
| 3,933 | Hershey Co., (The) | 217,298 | |||||||||
| 5,814 | Home Depot, Inc. | 235,351 | |||||||||
| 6,410 | Kohl's Corp. (a) | 311,526 | |||||||||
| 1,855 | Lowe's Companies, Inc. | 123,654 | |||||||||
| 1,594 | Nike, Inc., Class B | 138,343 | |||||||||
| 17,297 | Starbucks Corp. (a) | 519,084 | |||||||||
| 2,174 | Target Corp. | 119,505 | |||||||||
| 3,049 | Williams Sonoma, Inc. (a) | 131,564 | |||||||||
| 2,167,421 | |||||||||||
| Consumer Staples (8.8%) | |||||||||||
| 3,182 | Altria Group, Inc. | 237,759 | |||||||||
| 5,749 | Coca-Cola Co. | 231,742 | |||||||||
| 8,753 | PepsiCo, Inc. | 517,127 | |||||||||
| 9,033 | Procter & Gamble Co. | 522,830 | |||||||||
| 11,936 | Wal-Mart Stores, Inc. | 558,605 | |||||||||
| 2,068,063 | |||||||||||
| Energy (5.6%) | |||||||||||
| 3,737 | Anadarko Petroleum Corp. | 354,081 | |||||||||
| 5,136 | Apache Corp. | 351,919 | |||||||||
| 6,270 | Baker Hughes, Inc. | 381,090 | |||||||||
| 3,842 | ConocoPhillips | 223,528 | |||||||||
| 1,310,618 | |||||||||||
| Financials (4.8%) | |||||||||||
| 4,399 | American International Group, Inc. | 300,143 | |||||||||
| 2,355 | CIT Group, Inc. | 121,942 | |||||||||
| 2,553 | Franklin Resources, Inc. | 240,008 | |||||||||
| 1,890 | Goldman Sachs Group, Inc. (The) | 241,372 | |||||||||
| 3,699 | PNC Financial Services Group, Inc. | 228,709 | |||||||||
| 1,132,174 | |||||||||||
| Health Care (20.2%) | |||||||||||
| 6,940 | Abbott Laboratories | 273,644 | |||||||||
| 6,253 | Amgen, Inc. (a) | 493,112 | |||||||||
| 5,865 | Caremark Rx, Inc. (a) | 303,748 | |||||||||
| 2,385 | Genentech, Inc. (a) | 220,613 | |||||||||
| 2,870 | Genzyme Corp. (a) | 203,139 | |||||||||
| 5,502 | Gilead Sciences, Inc. (a) | 289,570 | |||||||||
| 11,846 | Johnson & Johnson | 711,944 | |||||||||
| 4,449 | Medco Health Solutions, Inc. (a) | 248,254 | |||||||||
| 8,608 | Medtronic, Inc. | 495,562 | |||||||||
| 5,400 | Novartis AG, ADR | 283,392 | |||||||||
| 9,865 | Pfizer, Inc. | 230,052 | |||||||||
| 6,811 | UnitedHealth Group, Inc. | 423,236 | |||||||||
| 3,056 | Wellpoint, Inc. (a) | 243,838 | |||||||||
| 7,140 | Wyeth | 328,940 | |||||||||
| 4,749,044 | |||||||||||
| Industrials (17.3%) | |||||||||||
| 4,514 | Boeing Co. | 317,063 | |||||||||
| 6,201 | Caterpillar, Inc. | 358,232 | |||||||||
| Shares or Principal Amount | Fair Value | ||||||||||
| COMMON STOCKS — (continued) | |||||||||||
| Industrials — (continued) | |||||||||||
| 2,245 | Danaher Corp. | $ | 125,226 | ||||||||
| 6,296 | Dow Chemical Co. (The) | 275,891 | |||||||||
| 1,406 | FedEx Corp. | 145,366 | |||||||||
| 28,213 | General Electric Co. | 988,866 | |||||||||
| 3,300 | Honeywell International, Inc. | 122,925 | |||||||||
| 2,892 | Illinois Tool Works, Inc. | 254,467 | |||||||||
| 11,774 | National Semiconductor Corp. | 305,889 | |||||||||
| 2,415 | Phelps Dodge Corp. | 347,446 | |||||||||
| 4,661 | Precision Castparts Corp. | 241,486 | |||||||||
| 3,158 | United Parcel Service, Inc., Class B | 237,324 | |||||||||
| 6,096 | United Technologies Corp. | 340,827 | |||||||||
| 4,061,008 | |||||||||||
| Information Technology (28.8%) | |||||||||||
| 4,941 | 3M Co. | 382,928 | |||||||||
| 1,887 | Apple Computer, Inc. (a) | 135,656 | |||||||||
| 30,747 | Cisco Systems, Inc. (a) | 526,389 | |||||||||
| 12,768 | Corning, Inc. (a) | 251,019 | |||||||||
| 7,767 | Dell, Inc. (a) | 232,932 | |||||||||
| 8,530 | EMC Corp. (a) | 116,179 | |||||||||
| 605 | Google, Inc . (a) | 250,990 | |||||||||
| 6,442 | IBM Corp. | 529,532 | |||||||||
| 31,504 | Intel Corp. | 786,340 | |||||||||
| 37,536 | Microsoft Corp. | 981,567 | |||||||||
| 9,956 | Monster Worldwide, Inc. (a) | 406,404 | |||||||||
| 19,939 | Motorola, Inc. | 450,422 | |||||||||
| 10,094 | Nokia Corp., ADR | 184,720 | |||||||||
| 30,800 | Oracle Corp. (a) | 376,068 | |||||||||
| 6,100 | QUALCOMM, Inc. | 262,788 | |||||||||
| 11,579 | Texas Instruments, Inc. | 371,339 | |||||||||
| 23,776 | Time Warner, Inc. | 414,653 | |||||||||
| 3,116 | Yahoo!, Inc. (a) | 122,085 | |||||||||
| 6,782,011 | |||||||||||
| Telecommunication Services (0.9%) | |||||||||||
| 9,423 | Sprint Nextel Corp. | 220,121 | |||||||||
| Total Common Stocks (Cost $20,175,360) | 22,490,460 | ||||||||||
| REPURCHASE AGREEMENT (4.4%) | |||||||||||
| $ | 1,026,296 | U.S. Bank N.A., 4.05% dated 12/30/05, maturing 1/3/06, with a maturity value of $1,026,758 (Collateralized fully by U.S. Government Agencies) | 1,026,296 | ||||||||
| Total Repurchase Agreement (Cost $1,026,296) | 1,026,296 | ||||||||||
| Total Investments (Cost $21,201,656) — 100.0% | 23,516,756 | ||||||||||
| Net other assets (liabilities) — 0.0% | 6,415 | ||||||||||
| NET ASSETS — 100.0% | $ | 23,523,171 | |||||||||
See accompanying notes to schedules of portfolio investments and notes to the financial statements.
13
BB&T Capital Manager Equity VIF
Schedule of Portfolio Investments
December 31, 2005
| Shares | Fair Value | ||||||||||
| INVESTMENT COMPANIES (99.9%) | |||||||||||
| 432,590 | BB&T Equity Index Fund, Class A | $ | 3,629,430 | ||||||||
| 416,286 | BB&T International Equity Fund, Institutional Class | 4,204,486 | |||||||||
| 632,624 | BB&T Large Company Growth Fund, Institutional Class | 5,820,140 | |||||||||
| 475,413 | BB&T Large Company Value Fund, Institutional Class | 8,695,304 | |||||||||
| 99,177 | BB&T Mid Cap Growth Fund, Institutional Class (a) | 1,334,918 | |||||||||
| 163,034 | BB&T Mid Cap Value Fund, Institutional Class | 2,002,055 | |||||||||
| 56,293 | BB&T Small Company Growth Fund, Institutional Class (a) | 853,958 | |||||||||
| Shares | Fair Value | ||||||||||
| INVESTMENT COMPANIES — (continued) | |||||||||||
| 89,284 | BB&T Small Cap Fund, Institutional Class | $ | 1,279,442 | ||||||||
| 865,285 | BB&T U.S. Treasury Money Market Fund, Institutional Class | 865,285 | |||||||||
| Total Investment Companies (Cost $27,080,066) | 28,685,018 | ||||||||||
| Total Investments (Cost $27,080,066) — 99.9% | 28,685,018 | ||||||||||
| Net other assets (liabilities) — 0.1% | 36,990 | ||||||||||
| NET ASSETS — 100.0% | $ | 28,722,008 | |||||||||
See accompanying notes to schedules of portfolio investments and notes to the financial statements.
14
BB&T Special Opportunities Equity VIF
Schedule of Portfolio Investments
December 31, 2005
| Shares | Fair Value | ||||||||||
| COMMON STOCKS (89.7%) | |||||||||||
| Commercial Services (6.8%) | |||||||||||
| 54,500 | Cendant Corp. | $ | 940,125 | ||||||||
| 44,900 | WCI Communities, Inc. (a) | 1,205,565 | |||||||||
| 2,145,690 | |||||||||||
| Consumer Discretionary (20.4%) | |||||||||||
| 20,500 | Anheuser-Busch Companies, Inc. | 880,680 | |||||||||
| 46,450 | Comcast Corp., Class A (a) | 1,205,842 | |||||||||
| 16,500 | Costco Wholesale Corp. | 816,255 | |||||||||
| 10,000 | Hain Celestial Group, Inc. (a) | 211,600 | |||||||||
| 65,340 | News Corp., Class A | 1,016,037 | |||||||||
| 43,100 | Smithfield Foods, Inc. (a) | 1,318,860 | |||||||||
| 22,200 | YUM! Brands, Inc. | 1,040,736 | |||||||||
| 6,490,010 | |||||||||||
| Energy (15.0%) | |||||||||||
| 16,800 | Apache Corp. | 1,151,136 | |||||||||
| 19,900 | CONSOL Energy, Inc. | 1,297,082 | |||||||||
| 20,600 | Pioneer Natural Resources Co. | 1,056,162 | |||||||||
| 34,600 | Weatherford International, Ltd. (a) | 1,252,520 | |||||||||
| 4,756,900 | |||||||||||
| Financials (8.2%) | |||||||||||
| 2,600 | Markel Corp. (a) | 824,330 | |||||||||
| 11,000 | MBIA, Inc. | 661,760 | |||||||||
| 18,000 | Wells Fargo & Co. | 1,130,940 | |||||||||
| 2,617,030 | |||||||||||
| Health Care (13.2%) | |||||||||||
| 111,448 | Emdeon Corp. (a) | 942,850 | |||||||||
| 18,900 | Laboratory Corporation of America Holdings (a) | 1,017,765 | |||||||||
| 28,000 | Manor Care, Inc. | 1,113,560 | |||||||||
| 60,503 | MedCath Corp. (a) | 1,122,331 | |||||||||
| 4,196,506 | |||||||||||
| Shares or Principal Amount | Fair Value | ||||||||||
| COMMON STOCKS — (continued) | |||||||||||
| Industrials (7.6%) | |||||||||||
| 16,000 | L-3 Communications Holdings, Inc. | $ | 1,189,600 | ||||||||
| 17,500 | PACCAR, Inc. | 1,211,525 | |||||||||
| 2,401,125 | |||||||||||
| Information Technology (18.5%) | |||||||||||
| 42,400 | Activision, Inc. (a) | 582,576 | |||||||||
| 175,880 | ARM Holdings PLC, ADR | 1,092,215 | |||||||||
| 49,200 | ATI Technologies, Inc. (a) | 835,908 | |||||||||
| 17,000 | Fair Issac Corp. | 750,890 | |||||||||
| 27,840 | First Data Corp. | 1,197,398 | |||||||||
| 33,000 | Packeteer, Inc. (a) | 256,410 | |||||||||
| 66,400 | Symantec Corp. (a) | 1,162,000 | |||||||||
| 5,877,397 | |||||||||||
| Total Common Stocks (Cost $25,531,936) | 28,484,658 | ||||||||||
| REPURCHASE AGREEMENT (10.7%) | |||||||||||
| $ | 3,403,712 | U.S. Bank N.A., 4.05%, dated 12/30/05, maturing 1/3/06, with a maturity value of $3,405,244 (Collateralized fully by U.S. Government Agencies) | 3,403,712 | ||||||||
| Total Repurchase Agreement (Cost $3,403,712) | 3,403,712 | ||||||||||
| Total Investments (Cost $28,935,648) — 100.4% | 31,888,370 | ||||||||||
| Net other assets (liabilities) — (0.4)% | (120,128 | ) | |||||||||
| NET ASSETS — 100.0% | $ | 31,768,242 | |||||||||
See accompanying notes to schedules of portfolio investments and notes to the financial statements.
15
BB&T Total Return Bond VIF
Schedule of Portfolio Investments
December 31, 2005
| Principal Amount | Fair Value | ||||||||||
| CORPORATE BONDS (40.1%) | |||||||||||
| Aerospace & Defense (0.5%) | |||||||||||
| $ | 85,000 | Raytheon Co., 6.15%, 11/1/08 | $ | 88,215 | |||||||
| Airlines (0.6%) | |||||||||||
| 125,000 | Southwest Airlines Co., 5.25%, 10/1/14 | 121,219 | |||||||||
| Auto — Cars/Light Trucks (0.7%) | |||||||||||
| 125,000 | DaimlerChrysler NA Holdings, 4.875%, 6/15/10 | 122,048 | |||||||||
| Banking & Financial Services (32.5%) | |||||||||||
| 87,000 | Associates Corp. NA, 6.25%, 11/1/08 | 90,121 | |||||||||
| 355,000 | Bank of America Commercial Mortgage, Inc., Series 2004-6, Class A5, 4.81%, 12/10/42 | 346,119 | |||||||||
| 155,000 | Bank of America Corp., 4.25%, 10/1/10 | 150,723 | |||||||||
| 184,000 | Centex Home Equity, Series 2005-C, Class AF6, 4.64%, 6/25/35 | 178,782 | |||||||||
| 345,000 | Chase Funding Mortgage Loan Asset-Backed, Series 2003-4, Class 1A5, 5.42%, 5/25/33 | 345,104 | |||||||||
| 500,000 | Chase Issuance Trust, Series 2005-A1, Class A1, 4.38%, 12/15/10 (c)* | 500,050 | |||||||||
| 82,000 | CIT Group, Inc., 5.00%, 2/13/14 | 80,209 | |||||||||
| 200,000 | CIT Group, Inc., Series MTN, 4.73%, 9/20/07* | 200,661 | |||||||||
| 490,000 | Countrywide Asset-Backed Certificates, Series 2004-3, Class 3A3, 4.76%, 8/25/34 (c)* | 491,375 | |||||||||
| 284,000 | Countrywide Asset-Backed Certificates, Series 2005-4, Class 3AV2, 4.59%, 10/25/35 (c)* | 284,050 | |||||||||
| 250,000 | CS First Boston Mortgage Securities Corp., Series 2004-C1, Class A2, 3.52%, 1/15/37 | 241,005 | |||||||||
| 182,000 | Gatx Financial Corp., 5.125%, 4/15/10 | 180,201 | |||||||||
| 166,000 | GE Capital Commercial Mortgage Corp., Series 2005-C4, Class A4, 5.33%, 11/10/45 | 168,962 | |||||||||
| 173,912 | GE Capital Commercial Mortgage Corp., Series 2001-3, Class A1, 5.56%, 6/10/38 | 175,602 | |||||||||
| 310,000 | GE Capital Commercial Mortgage Corp., Series 2004-C1, Class A2, 3.915%, 11/10/38 | 297,767 | |||||||||
| 184,000 | General Motors Acceptance Corp., 6.75%, 12/1/14 | 165,530 | |||||||||
| 130,000 | Goldman Sachs Group, Inc., 4.125%, 1/15/08 | 128,004 | |||||||||
| 175,000 | Household Automotive Trust, Series 2005-1, Class A4, 4.35%, 6/18/12 | 172,122 | |||||||||
| 150,000 | HSBC Finance Corp., 4.75%, 7/15/13 | 144,927 | |||||||||
| 265,000 | Lehman Brothers Holdings, Series MTNG, 4.80%, 3/13/14 | 258,744 | |||||||||
| 190,000 | Merrill Lynch & Co., 6.00%, 2/17/09 | 195,935 | |||||||||
| 170,000 | Morgan Stanley, 4.25%, 5/15/10 | 164,326 | |||||||||
| 251,602 | Residential Asset Mortgage Products, Inc., Series 2003-RZ5, Class A3, 3.80%, 7/25/30 | 250,607 | |||||||||
| 408,000 | Residential Asset Securities Corp., Series 2005-KS6, Class A2, 4.53%, 7/25/35 (c)* | 407,814 | |||||||||
| 147,000 | Synovus Financial, 4.875%, 2/15/13 | 144,383 | |||||||||
| 200,000 | Wachovia Corp., 4.28%, 10/28/08* | 199,979 | |||||||||
| 140,000 | Wachovia Corp., 4.375%, 6/1/10 | 136,951 | |||||||||
| 6,100,053 | |||||||||||
| Telecommunications (4.1%) | |||||||||||
| 175,000 | America Movil SA de CV, 5.75%, 1/15/15 | 175,595 | |||||||||
| 320,000 | Motorola, Inc., 7.50%, 5/15/25 | 385,028 | |||||||||
| 200,000 | Sprint Capital Corp., 6.875%, 11/15/28 | 218,538 | |||||||||
| 779,161 | |||||||||||
| Principal Amount | Fair Value | ||||||||||
| CORPORATE BONDS — (continued) | |||||||||||
| Utilities (1.7%) | |||||||||||
| $ | 215,000 | American Electric Power, Series C, 5.375%, 3/15/10 | $ | 216,731 | |||||||
| 105,000 | General Electric Co., 5.00%, 2/1/13 | 104,945 | |||||||||
| 321,676 | |||||||||||
| Total Corporate Bonds (Cost $7,590,167) | 7,532,372 | ||||||||||
| MORTGAGE-BACKED SECURITIES (33.2%) | |||||||||||
| Federal Home Loan Mortgage Corp. (7.6%) | |||||||||||
| 795,375 | 6.00%, 10/1/19, Pool # G11679 | 811,633 | |||||||||
| 94,665 | 5.50%, 11/1/20, Pool # J02711 | 95,239 | |||||||||
| 166,833 | 4.50%, 6/1/35, Pool # G01842 | 156,962 | |||||||||
| 152,766 | 5.50%, 7/1/35, Pool # A36540 | 151,397 | |||||||||
| 121,706 | 6.00%, 7/1/35, Pool # A36304 | 122,936 | |||||||||
| 91,001 | 5.50%, 12/1/35, Pool # A40359 | 90,186 | |||||||||
| 1,428,353 | |||||||||||
| Federal National Mortgage Assoc. (17.2%) | |||||||||||
| 134,396 | 4.50%, 10/1/18, Pool # 752030 | 130,782 | |||||||||
| 90,659 | 5.50%, 11/1/20, Pool # 843972 | 91,250 | |||||||||
| 1,451,321 | 5.50%, 1/1/34, Pool # 757571 | 1,437,367 | |||||||||
| 351,628 | 6.50%, 9/1/34, Pool # 796569 | 360,765 | |||||||||
| 505,313 | 6.00%, 2/1/35, Pool # 735269 | 510,114 | |||||||||
| 125,019 | 6.00%, 5/1/35, Pool # 821037 | 126,207 | |||||||||
| 256,470 | 7.00%, 6/1/35, Pool # 255820 | 267,597 | |||||||||
| 132,227 | 5.00%, 9/1/35, Pool # 757857 | 128,122 | |||||||||
| 89,399 | 6.00%, 11/1/35, Pool # 843803 | 90,249 | |||||||||
| 93,186 | 6.00%, 11/1/35, Pool # 817636 | 94,072 | |||||||||
| 3,236,525 | |||||||||||
| Government National Mortgage Assoc. (8.4%) | |||||||||||
| 1,590,000 | 5.00%, 1/1/36 (b) | 1,568,634 | |||||||||
| Total Mortgage-Backed Securities (Cost $6,281,141) | 6,233,512 | ||||||||||
| MUNICIPAL BONDS (2.2%) | |||||||||||
| Illinois (0.4%) | |||||||||||
| 85,000 | Illinois State, 3.75%, 6/1/12 | 79,865 | |||||||||
| New York (0.5%) | |||||||||||
| 100,000 | Sales Tax Asset Receivables Corp., Series B, 4.06%, 10/15/10, FGIC | 96,694 | |||||||||
| Oregon (0.5%) | |||||||||||
| 95,000 | Oregon School Boards Association, 4.76%, 6/30/28, AMBAC | 89,122 | |||||||||
| Texas (0.8%) | |||||||||||
| 155,000 | Brownsville Texas Utility System, Series B, 4.92%, 9/1/14, AMBAC | 154,525 | |||||||||
| Total Municipal Bonds (Cost $424,345) | 420,206 | ||||||||||
| U.S. GOVERNMENT AGENCIES (13.9%) | |||||||||||
| Federal Home Loan Bank (4.4%) | |||||||||||
| 200,000 | 4.25%, 9/28/06, Callable 3/28/06 @ 100* | 199,767 | |||||||||
| 150,000 | 4.25%, 3/24/08, Callable 3/24/06 @ 100 | 148,260 | |||||||||
| 220,000 | 3.75%, 8/15/08 | 214,770 | |||||||||
| 245,000 | Series FB11, 5.875%, 2/15/11 | 255,989 | |||||||||
| 818,786 | |||||||||||
Continued
16
BB&T Total Return Bond VIF
Schedule of Portfolio Investments — (continued)
December 31, 2005
| Principal Amount | Fair Value | ||||||||||
| U.S. GOVERNMENT AGENCIES — (continued) | |||||||||||
| Federal Home Loan Mortgage Corp. (3.2%) | |||||||||||
| $ | 100,000 | 3.75%, 2/25/08, Callable 2/25/06 @ 100* | $ | 99,371 | |||||||
| 196,000 | 4.625%, 8/15/08, Callable 8/15/06 @ 100 | 194,994 | |||||||||
| 210,000 | 4.125%, 7/12/10 | 204,782 | |||||||||
| 109,000 | 5.50%, 8/20/19, Callable 8/20/07 @ 100 | 108,142 | |||||||||
| 607,289 | |||||||||||
| Federal National Mortgage Assoc. (4.7%) | |||||||||||
| 385,000 | 6.625%, 11/15/10 | 416,054 | |||||||||
| 439,000 | 6.00%, 5/15/11 | 464,302 | |||||||||
| 880,356 | |||||||||||
| Student Loan Marketing Assoc. (1.6%) | |||||||||||
| 150,000 | Series MTNA, 4.28%, 1/25/08* | 150,096 | |||||||||
| 150,000 | Series MTNA, 4.00%, 1/15/09 | 145,970 | |||||||||
| 296,066 | |||||||||||
| Total U.S. Government Agencies (Cost $2,614,263) | 2,602,497 | ||||||||||
| U.S. TREASURY BONDS (9.5%) | |||||||||||
| 455,000 | 8.875%, 8/15/17 | 632,272 | |||||||||
| 314,000 | 7.875%, 2/15/21 | 424,955 | |||||||||
| 283,000 | 7.25%, 8/15/22 | 368,541 | |||||||||
| 300,000 | 6.25%, 8/15/23 | 358,242 | |||||||||
| Total U.S. Treasury Bonds (Cost $1,790,054) | 1,784,010 | ||||||||||
| U.S. TREASURY NOTES (0.9%) | |||||||||||
| 167,000 | 4.50%, 11/15/10 | 167,900 | |||||||||
| Total U.S. Treasury Notes (Cost $166,661) | 167,900 | ||||||||||
| Principal Amount | Fair Value | ||||||||||
| REPURCHASE AGREEMENT (7.5%) | |||||||||||
| $ | 1,409,886 | U.S. Bank N.A., 4.05%, dated 12/30/05, maturing 1/3/06, with a maturity value of $1,410,520 (Collateralized fully by U.S. Government Agencies) | $ | 1,409,886 | |||||||
| Total Repurchase Agreement (Cost $1,409,886) | 1,409,886 | ||||||||||
| Total Investments (Cost $20,276,517) — 107.3% | 20,150,383 | ||||||||||
| Net other assets (liabilities) — (7.3)% | (1,373,668 | ) | |||||||||
| NET ASSETS — 100.0% | $ | 18,776,715 | |||||||||
See accompanying notes to schedules of portfolio investments and notes to the financial statements.
17
Schedule of Portfolio Investments
Notes to Schedules of Portfolio Investments
December 31, 2005
(a) Represents non-income producing security.
(b) Represents a security purchased on a when-issued basis. At December 31, 2005, total cost of investments purchased on a when-issued basis for the BB&T Total Return Bond VIF was $1,552,304.
(c) Represents that all or a portion of the security was pledged as collateral for securities purchased on a when-issued basis.
* The interest rate for this variable rate note, which will change periodically, is based either on the prime rate or an index of market rates. The reflected rate is the rate in effect as of December 31, 2005. The maturity date reflected is the final maturity date.
ADR — American Depository Receipt.
AMBAC — Insured by AMBAC Indemnity Corp.
FGIC — Insured by Financial Guaranty Insurance Corp.
REIT — Real Estate Investment Trust.
See accompanying notes to financial statements.
18
(This page has been left blank intentionally.)
19
BB&T Variable Insurance Funds
Statements of Assets and Liabilities
December 31, 2005
| BB&T Large Cap Value VIF | BB&T Mid Cap Growth VIF | BB&T Large Company Growth VIF | BB&T Capital Manager Equity VIF | BB&T Special Opportunities Equity VIF | BB&T Total Return Bond VIF | ||||||||||||||||||||||
| Assets: | |||||||||||||||||||||||||||
| Investments: | |||||||||||||||||||||||||||
| Unaffiliated investments, at cost | $ | 90,964,299 | $ | 27,075,269 | $ | 20,175,360 | $ | — | $ | 25,531,936 | $ | 18,866,631 | |||||||||||||||
| Investment in affiliates, at cost | — | — | — | 27,080,066 | — | — | |||||||||||||||||||||
| Total investments, at cost | 90,964,299 | 27,075,269 | 20,175,360 | 27,080,066 | 25,531,936 | 18,866,631 | |||||||||||||||||||||
| Unrealized appreciation (depreciation) | 19,682,602 | 10,780,419 | 2,315,100 | 1,604,952 | 2,952,722 | (126,134 | ) | ||||||||||||||||||||
| Investments, at value | 110,646,901 | 37,855,688 | 22,490,460 | 28,685,018 | 28,484,658 | 18,740,497 | |||||||||||||||||||||
| Repurchase agreements, at cost | 3,042,954 | 1,408,006 | 1,026,296 | — | 3,403,712 | 1,409,886 | |||||||||||||||||||||
| Cash | 4,402 | 1,865 | — | — | 4,478 | 1,180 | |||||||||||||||||||||
| Interest and dividends receivable | 209,507 | 15,779 | 22,682 | 41,244 | 40,516 | 158,991 | |||||||||||||||||||||
| Receivable for investments sold | — | — | — | — | 320,851 | — | |||||||||||||||||||||
| Receivable from Investment Advisor | — | — | — | 1,357 | — | — | |||||||||||||||||||||
| Receivable for capital shares issued | 14,717 | 30,512 | 67 | — | 2,834 | 41,119 | |||||||||||||||||||||
| Prepaid expenses | 5,069 | 1,675 | 1,054 | 1,267 | 1,358 | 805 | |||||||||||||||||||||
| Total Assets | 113,923,550 | 39,313,525 | 23,540,559 | 28,728,886 | 32,258,407 | 20,352,478 | |||||||||||||||||||||
| Liabilities: | |||||||||||||||||||||||||||
| Covered options written (premiums received $0; $0; $0; $0; $4,501; $0) | — | — | — | — | 325 | — | |||||||||||||||||||||
| Payable for investments purchased | 182,906 | 194,297 | — | — | 391,801 | 1,557,162 | |||||||||||||||||||||
| Payable for capital shares redeemed | 9,085 | 143 | 1,258 | 907 | 58,792 | 217 | |||||||||||||||||||||
| Accrued expenses and other payables: | |||||||||||||||||||||||||||
| Investment advisory fees | 47,412 | 14,978 | 8,109 | — | 21,544 | 6,273 | |||||||||||||||||||||
| Administration fees | 11,004 | 3,724 | 2,280 | — | 3,003 | 1,759 | |||||||||||||||||||||
| Fund accounting fees | 1,133 | 488 | 358 | 247 | 424 | 432 | |||||||||||||||||||||
| Transfer agency fees | 2,094 | 1,449 | 1,319 | 1,517 | 1,385 | 1,273 | |||||||||||||||||||||
| Compliance service fees | 1,317 | 435 | 274 | 329 | 352 | 209 | |||||||||||||||||||||
| Other | 20,603 | 7,513 | 3,790 | 3,878 | 12,539 | 8,438 | |||||||||||||||||||||
| Total Liabilities | 275,554 | 223,027 | 17,388 | 6,878 | 490,165 | 1,575,763 | |||||||||||||||||||||
| Net Assets: | |||||||||||||||||||||||||||
| Capital | 94,851,983 | 25,934,212 | 21,265,528 | 26,027,366 | 27,002,115 | 18,930,134 | |||||||||||||||||||||
| Accumulated undistributed (distributions in excess of) net investment income | 24,377 | — | — | 43,617 | — | 77,712 | |||||||||||||||||||||
| Accumulated realized gains/(losses) from investment transactions | (910,966 | ) | 2,375,867 | (57,457 | ) | 1,046,073 | 1,809,229 | (104,997 | ) | ||||||||||||||||||
| Net unrealized appreciation/ depreciation on investments | 19,682,602 | 10,780,419 | 2,315,100 | 1,604,952 | 2,956,898 | (126,134 | ) | ||||||||||||||||||||
| Net Assets | $ | 113,647,996 | $ | 39,090,498 | $ | 23,523,171 | $ | 28,722,008 | $ | 31,768,242 | $ | 18,776,715 | |||||||||||||||
| Outstanding units of beneficial interest (shares) | 8,120,486 | 2,494,185 | 2,285,271 | 2,732,880 | 2,501,466 | 1,891,876 | |||||||||||||||||||||
| Net asset value — offering and redemption price per share | $ | 14.00 | $ | 15.67 | $ | 10.29 | $ | 10.51 | $ | 12.70 | $ | 9.92 | |||||||||||||||
See accompanying notes to the financial statements.
20
BB&T Variable Insurance Funds
Statements of Operations
For the Year Ended December 31, 2005
| BB&T Large Cap Value VIF | BB&T Mid Cap GrowthVIF | BB&T Large Company Growth VIF | BB&T Capital Manager Equity VIF | BB&T Special Opportunities Equity VIF | BB&T Total Return Bond VIF | ||||||||||||||||||||||
| Investment Income: | |||||||||||||||||||||||||||
| Interest income | $ | 117,232 | $ | 55,396 | $ | 30,269 | $ | — | $ | 61,557 | $ | 747,023 | |||||||||||||||
| Dividend income | 2,957,911 | 117,711 | 241,567 | — | 192,618 | 1,377 | |||||||||||||||||||||
| Dividend income from affiliates | — | — | — | 522,657 | — | — | |||||||||||||||||||||
| Total investment income: | 3,075,143 | 173,107 | 271,836 | 522,657 | 254,175 | 748,400 | |||||||||||||||||||||
| Expenses: | |||||||||||||||||||||||||||
| Investment advisory fees (See Note 4) | 831,024 | 253,849 | 169,101 | 67,370 | 216,096 | 102,477 | |||||||||||||||||||||
| Administration, transfer agency, and fund accounting fees (See Note 4) | 93,267 | 38,338 | 31,486 | 14,888 | 32,320 | 27,649 | |||||||||||||||||||||
| Administration fees (See Note 4) | 85,967 | 27,014 | 17,717 | 21,023 | 21,960 | 13,412 | |||||||||||||||||||||
| Fund accounting fees (See Note 4) | 11,917 | 6,965 | 5,751 | 4,009 | 6,886 | 7,432 | |||||||||||||||||||||
| Transfer agency fees (See Note 4) | 13,051 | 7,878 | 6,879 | 7,649 | 7,335 | 6,318 | |||||||||||||||||||||
| Compliance service fees (See Note 4) | 9,936 | 3,074 | 2,001 | 2,329 | 2,374 | 1,461 | |||||||||||||||||||||
| Custodian fees | 14,306 | 4,345 | 2,862 | 3,305 | 3,293 | 2,019 | |||||||||||||||||||||
| Professional fees | 68,366 | 20,437 | 13,420 | 15,803 | 20,255 | 13,924 | |||||||||||||||||||||
| Trustee fees | 15,148 | 4,606 | 3,005 | 3,497 | 3,865 | 2,409 | |||||||||||||||||||||
| Other | 34,906 | 11,266 | 7,782 | 9,087 | 16,707 | 13,943 | |||||||||||||||||||||
| Total expenses before waivers | 1,177,888 | 377,772 | 260,004 | 148,960 | 331,091 | 191,044 | |||||||||||||||||||||
| Less expenses reimbursed or waived by the Investment Advisor | (235,503 | ) | (109,799 | ) | (78,732 | ) | (58,964 | ) | — | (20,342 | ) | ||||||||||||||||
| Less expenses waived by the Administrator and its affiliates | (54,844 | ) | — | — | (21,023 | ) | — | — | |||||||||||||||||||
| Net expenses | 887,541 | 267,973 | 181,272 | 68,973 | 331,091 | 170,702 | |||||||||||||||||||||
| Net investment income (loss) | 2,187,602 | (94,866 | ) | 90,564 | 453,684 | (76,916 | ) | 577,698 | |||||||||||||||||||
| Realized/Unrealized Gains (Losses) on Investments: | |||||||||||||||||||||||||||
| Net realized gains (losses) on option contract transactions | — | — | — | — | 34,400 | — | |||||||||||||||||||||
| Net realized gains (losses) from investment security transactions | 5,648,845 | 2,740,583 | 761,512 | — | 1,851,743 | (4,837 | ) | ||||||||||||||||||||
| Net realized gains (losses) on investments with affiliates | — | — | — | 12,893 | — | — | |||||||||||||||||||||
| Net realized gain distributions from underlying funds | — | — | — | 1,484,532 | — | — | |||||||||||||||||||||
| Change in unrealized appreciation/ depreciation of investments | (351,242 | ) | 2,171,358 | (393,355 | ) | (123,802 | ) | (87,895 | ) | (180,295 | ) | ||||||||||||||||
| Net realized/unrealized gains (losses) on investments | 5,297,603 | 4,911,941 | 368,157 | 1,373,623 | 1,798,248 | (185,132 | ) | ||||||||||||||||||||
| Change in net assets from operations | $ | 7,485,205 | $ | 4,817,075 | $ | 458,721 | $ | 1,827,307 | $ | 1,721,332 | $ | 392,566 | |||||||||||||||
See accompanying notes to the financial statements.
21
BB&T Variable Insurance Funds
Statements of Changes in Net Assets
| BB&T Large Cap Value VIF | BB&T Mid Cap Growth VIF | BB&T Large Company Growth VIF | |||||||||||||||||||||||||
| For the Year Ended December 31, 2005 | For the Year Ended December 31, 2004 | For the Year Ended December 31, 2005 | For the Year Ended December 31, 2004 | For the Year Ended December 31, 2005 | For the Year Ended December 31, 2004 | ||||||||||||||||||||||
| From Investment Activities: | |||||||||||||||||||||||||||
| Operations: | |||||||||||||||||||||||||||
| Net investment income (loss) | $ | 2,187,602 | $ | 1,778,050 | $ | (94,866 | ) | $ | (117,831 | ) | $ | 90,564 | $ | 93,252 | |||||||||||||
| Net realized gains (losses) from investment transactions | 5,648,845 | 890,277 | 2,740,583 | 1,562,831 | 761,512 | 1,043,147 | |||||||||||||||||||||
| Net realized gains (losses) on investments with affiliates | — | — | — | — | — | — | |||||||||||||||||||||
| Net realized gain distributions from underlying funds | — | — | — | — | — | — | |||||||||||||||||||||
| Change in unrealized appreciation/depreciation of investments | (351,242 | ) | 10,154,949 | 2,171,358 | 3,098,166 | (393,355 | ) | 62,677 | |||||||||||||||||||
| Change in net assets from operations | 7,485,205 | 12,823,276 | 4,817,075 | 4,543,166 | 458,721 | 1,199,076 | |||||||||||||||||||||
| Dividends to Shareholders: | |||||||||||||||||||||||||||
| Net investment income | (2,163,186 | ) | (1,778,089 | ) | — | — | (91,612 | ) | (93,247 | ) | |||||||||||||||||
| Net realized gains from investment transactions | — | — | — | — | — | — | |||||||||||||||||||||
| Change in net assets from shareholder dividends | (2,163,186 | ) | (1,778,089 | ) | — | — | (91,612 | ) | (93,247 | ) | |||||||||||||||||
| Capital Transactions: | |||||||||||||||||||||||||||
| Proceeds from shares issued | 2,804,935 | 8,206,444 | 3,785,288 | 5,075,670 | 1,803,928 | 3,514,255 | |||||||||||||||||||||
| Dividends reinvested | 2,712,897 | 1,648,020 | — | — | 183,178 | 1,683 | |||||||||||||||||||||
| Value of shares redeemed | (8,803,839 | ) | (3,970,967 | ) | (1,919,195 | ) | (1,114,583 | ) | (1,130,736 | ) | (786,493 | ) | |||||||||||||||
| Change in net assets from capital transactions | (3,286,007 | ) | 5,883,497 | 1,866,093 | 3,961,087 | 856,370 | 2,729,445 | ||||||||||||||||||||
| Change in net assets | 2,036,012 | 16,928,684 | 6,683,168 | 8,504,253 | 1,223,479 | 3,835,274 | |||||||||||||||||||||
| Net Assets: | |||||||||||||||||||||||||||
| Beginning of Period | 111,611,984 | 94,683,300 | 32,407,330 | 23,903,077 | 22,299,692 | 18,464,418 | |||||||||||||||||||||
| End of Period | $ | 113,647,996 | $ | 111,611,984 | $ | 39,090,498 | $ | 32,407,330 | $ | 23,523,171 | $ | 22,299,692 | |||||||||||||||
| Share Transactions: | |||||||||||||||||||||||||||
| Issued | 208,216 | 657,552 | 266,255 | 415,359 | 180,801 | 363,360 | |||||||||||||||||||||
| Reinvested | 199,567 | 134,624 | — | — | 18,107 | 179 | |||||||||||||||||||||
| Redeemed | (646,756 | ) | (322,025 | ) | (138,285 | ) | (93,117 | ) | (111,804 | ) | (81,015 | ) | |||||||||||||||
| Change in shares | (238,973 | ) | 470,151 | 127,970 | 322,242 | 87,104 | 282,524 | ||||||||||||||||||||
| Accumulated undistributed (distributions in excess of) net investment income | $ | 24,377 | $ | (39 | ) | $ | — | $ | — | $ | — | $ | 5 | ||||||||||||||
(a) Period from commencement of operations.
See accompanying notes to the financial statements.
22
| BB&T Capital Manager Equity VIF | BB&T Special Opportunities Equity VIF | BB&T Total Return Bond VIF | |||||||||||||||||||||||||
| For the Year Ended December 31, 2005 | For the Year Ended December 31, 2004 | For the Year Ended December 31, 2005 | For the Period July 22, 2004 through December 31, 2004 (a) | For the Year Ended December 31, 2005 | For the Period July 22, 2004 through December 31, 2004 (a) | ||||||||||||||||||||||
| From Investment Activities: | |||||||||||||||||||||||||||
| Operations: | |||||||||||||||||||||||||||
| Net investment income (loss) | $ | 453,684 | $ | 169,566 | $ | (76,916 | ) | $ | (57,905 | ) | $ | 577,698 | $ | 157,989 | |||||||||||||
| Net realized gains (losses) from investment transactions | — | — | 1,886,143 | 480,367 | (4,837 | ) | 51,592 | ||||||||||||||||||||
| Net realized gains (losses) on investments with affiliates | 12,893 | (18,558 | ) | — | — | — | — | ||||||||||||||||||||
| Net realized gain distributions from underlying funds | 1,484,532 | 35,810 | — | — | — | — | |||||||||||||||||||||
| Change in unrealized appreciation/depreciation of investments | (123,802 | ) | 2,482,753 | (87,895 | ) | 3,044,793 | (180,295 | ) | 54,161 | ||||||||||||||||||
| Change in net assets from operations | 1,827,307 | 2,669,571 | 1,721,332 | 3,467,255 | 392,566 | 263,742 | |||||||||||||||||||||
| Dividends to Shareholders: | |||||||||||||||||||||||||||
| Net investment income | (410,067 | ) | (169,566 | ) | — | — | (617,780 | ) | (144,938 | ) | |||||||||||||||||
| Net realized gains from investment transactions | — | — | (425,936 | ) | — | (50,547 | ) | — | |||||||||||||||||||
| Change in net assets from shareholder dividends | (410,067 | ) | (169,566 | ) | (425,936 | ) | — | (668,327 | ) | (144,938 | ) | ||||||||||||||||
| Capital Transactions: | |||||||||||||||||||||||||||
| Proceeds from shares issued | 2,201,817 | 3,400,142 | 9,603,027 | 17,578,780 | 2,753,417 | 15,425,182 | |||||||||||||||||||||
| Dividends reinvested | 481,528 | 134,465 | 425,882 | — | 704,135 | 109,130 | |||||||||||||||||||||
| Value of shares redeemed | (989,412 | ) | (1,029,876 | ) | (599,801 | ) | (2,297 | ) | (57,671 | ) | (521 | ) | |||||||||||||||
| Change in net assets from capital transactions | 1,693,933 | 2,504,731 | 9,429,108 | 17,576,483 | 3,399,881 | 15,533,791 | |||||||||||||||||||||
| Change in net assets | 3,111,173 | 5,004,736 | 10,724,504 | 21,043,738 | 3,124,120 | 15,652,595 | |||||||||||||||||||||
| Net Assets: | |||||||||||||||||||||||||||
| Beginning of Period | 25,610,835 | 20,606,099 | 21,043,738 | — | 15,652,595 | — | |||||||||||||||||||||
| End of Period | $ | 28,722,008 | $ | 25,610,835 | $ | 31,768,242 | $ | 21,043,738 | $ | 18,776,715 | $ | 15,652,595 | |||||||||||||||
| Share Transactions: | |||||||||||||||||||||||||||
| Issued | 218,620 | 369,676 | 779,800 | 1,736,446 | 274,427 | 1,542,200 | |||||||||||||||||||||
| Reinvested | 46,889 | 14,730 | 33,720 | — | 70,239 | 10,818 | |||||||||||||||||||||
| Redeemed | (96,369 | ) | (112,905 | ) | (48,297 | ) | (203 | ) | (5,756 | ) | (52 | ) | |||||||||||||||
| Change in shares | 169,140 | 271,501 | 765,223 | 1,736,243 | 338,910 | 1,552,966 | |||||||||||||||||||||
| Accumulated undistributed (distributions in excess of) net investment income | $ | 43,617 | $ | — | $ | — | $ | — | $ | 77,712 | $ | 45,634 | |||||||||||||||
23
BB&T Variable Insurance Funds
Financial Highlights
Selected data for a share of beneficial interest outstanding throughout the periods indicated.
| Investment Activities | Dividends | ||||||||||||||||||||||||||||||||||
| Net Asset Value, Beginning of Period | Net investment income (loss) | Net realized/ unrealized gains (losses) on investments | Total from Investment Activities | Net investment income | Return of capital | Net realized gains on investments | Total Dividends | ||||||||||||||||||||||||||||
| BB&T Large Cap Value VIF | |||||||||||||||||||||||||||||||||||
| Year Ended December 31, 2005 | $ | 13.35 | 0.26 | 0.65 | 0.91 | (0.26 | ) | — | — | (0.26 | ) | ||||||||||||||||||||||||
| Year Ended December 31, 2004 | $ | 12.00 | 0.22 | 1.35 | 1.57 | (0.22 | ) | — | — | (0.22 | ) | ||||||||||||||||||||||||
| Year Ended December 31, 2003 | $ | 9.88 | 0.19 | 2.12 | 2.31 | (0.19 | ) | (0.00 | )(b) | — | (0.19 | ) | |||||||||||||||||||||||
| Year Ended December 31, 2002 | $ | 12.50 | 0.17 | (2.62 | ) | (2.45 | ) | (0.17 | ) | — | — | (0.17 | ) | ||||||||||||||||||||||
| Year Ended December 31, 2001 | $ | 12.66 | 0.17 | (0.16 | ) | 0.01 | (0.17 | ) | — | — | (0.17 | ) | |||||||||||||||||||||||
| BB&T Mid Cap Growth VIF | |||||||||||||||||||||||||||||||||||
| Year Ended December 31, 2005 | $ | 13.70 | (0.04 | ) | 2.01 | 1.97 | — | — | — | — | |||||||||||||||||||||||||
| Year Ended December 31, 2004 | $ | 11.69 | (0.05 | ) | 2.06 | 2.01 | — | — | — | — | |||||||||||||||||||||||||
| Year Ended December 31, 2003 | $ | 8.56 | (0.06 | ) | 3.19 | 3.13 | — | — | — | — | |||||||||||||||||||||||||
| Year Ended December 31, 2002 | $ | 10.70 | (0.09 | ) | (2.05 | ) | (2.14 | ) | — | — | — | — | |||||||||||||||||||||||
| October 15, 2001 to December 31, 2001 (a) | $ | 10.00 | (0.01 | ) | (0.71 | ) | 0.70 | — | — | — | — | ||||||||||||||||||||||||
| BB&T Large Company Growth VIF | |||||||||||||||||||||||||||||||||||
| Year Ended December 31, 2005 | $ | 10.14 | 0.04 | 0.15 | 0.19 | (0.04 | ) | — | — | (0.04 | ) | ||||||||||||||||||||||||
| Year Ended December 31, 2004 | $ | 9.64 | 0.04 | 0.50 | 0.54 | (0.04 | ) | — | — | (0.04 | ) | ||||||||||||||||||||||||
| Year Ended December 31, 2003 | $ | 7.53 | (0.02 | ) | 2.13 | 2.11 | — | — | — | — | |||||||||||||||||||||||||
| Year Ended December 31, 2002 | $ | 10.83 | (0.06 | ) | (3.24 | ) | (3.30 | ) | — | — | — | — | |||||||||||||||||||||||
| October 15, 2001 to December 31, 2001 (a) | $ | 10.00 | (0.01 | ) | 0.84 | 0.83 | — | — | — | — | |||||||||||||||||||||||||
| BB&T Capital Manager Equity VIF*** | |||||||||||||||||||||||||||||||||||
| Year Ended December 31, 2005 | $ | 9.99 | 0.17 | 0.50 | 0.67 | (0.15 | ) | — | — | (0.15 | ) | ||||||||||||||||||||||||
| Year Ended December 31, 2004 | $ | 8.99 | 0.07 | 1.00 | 1.07 | (0.07 | ) | — | — | (0.07 | ) | ||||||||||||||||||||||||
| Year Ended December 31, 2003 | $ | 7.19 | 0.03 | 1.80 | 1.83 | (0.03 | ) | — | — | (0.03 | ) | ||||||||||||||||||||||||
| Year Ended December 31, 2002 | $ | 9.28 | 0.01 | (1.98 | ) | (1.97 | ) | (0.01 | ) | — | (0.11 | ) | (0.12 | ) | |||||||||||||||||||||
| May 1, 2001 to December 31, 2001 (a) | $ | 10.00 | 0.01 | (0.72 | ) | (0.71 | ) | (0.01 | ) | — | — | (0.01 | ) | ||||||||||||||||||||||
| BB&T Special Opportunities Equity VIF | |||||||||||||||||||||||||||||||||||
| Year Ended December 31, 2005 | $ | 12.12 | (0.03 | ) | 0.79 | 0.76 | — | — | (0.18 | ) | (0.18 | ) | |||||||||||||||||||||||
| July 22, 2004 to December 31, 2004 (a) | $ | 10.00 | (0.04 | ) | 2.16 | 2.12 | — | — | — | — | |||||||||||||||||||||||||
| BB&T Total Return Bond VIF | |||||||||||||||||||||||||||||||||||
| Year Ended December 31, 2005 | $ | 10.08 | 0.33 | (0.10 | ) | 0.23 | (0.36 | ) | — | (0.03 | ) | (0.39 | ) | ||||||||||||||||||||||
| July 22, 2004 to December 31, 2004 (a) | $ | 10.00 | 0.10 | 0.08 | 0.18 | (0.10 | ) | — | — | (0.10 | ) | ||||||||||||||||||||||||
* During the period certain fees were reduced. If such reductions had not occurred, the ratios would have been as indicated.
** Total return ratios are based on a share outstanding throughout the period and assume reinvestment of distributions at a net asset value. Total return ratios do not reflect charges pursuant to the terms of the insurance contracts funded by separate accounts that invest in the Fund's shares.
*** The expense ratios exclude the impact of fees/expenses paid at the underlying fund level.
(a) Period from commencement of operations.
(b) Amount is less than $0.005.
(c) Not annualized for periods less than one year.
(d) Annualized for periods less than one year.
See accompanying notes to the financial statements.
24
| Ratios/Supplemental Data | |||||||||||||||||||||||||||||||
| Net Asset Value, End of Period | Total Return** (c) | Net Assets, End of Period (000) | Ratio of net expenses to average net assets (d) | Ratio of net investment income (loss) to average net assets (d) | Ratio of expenses to average net assets* (d) | Portfolio turnover rate | |||||||||||||||||||||||||
| BB&T Large Cap Value VIF | |||||||||||||||||||||||||||||||
| Year Ended December 31, 2005 | $ | 14.00 | 6.90 | % | $ | 113,648 | 0.79 | % | 1.95 | % | 1.05 | % | 21.76 | % | |||||||||||||||||
| Year Ended December 31, 2004 | $ | 13.35 | 13.18 | % | $ | 111,612 | 0.81 | % | 1.77 | % | 1.10 | % | 12.91 | % | |||||||||||||||||
| Year Ended December 31, 2003 | $ | 12.00 | 23.62 | % | $ | 94,683 | 0.88 | % | 1.82 | % | 1.17 | % | 13.96 | % | |||||||||||||||||
| Year Ended December 31, 2002 | $ | 9.88 | (19.64 | )% | $ | 63,667 | 0.84 | % | 1.57 | % | 1.13 | % | 15.24 | % | |||||||||||||||||
| Year Ended December 31, 2001 | $ | 12.50 | 0.16 | % | $ | 77,796 | 0.86 | % | 1.17 | % | 1.15 | % | 14.47 | % | |||||||||||||||||
| BB&T Mid Cap Growth VIF | |||||||||||||||||||||||||||||||
| Year Ended December 31, 2005 | $ | 15.67 | 14.38 | % | $ | 39,090 | 0.78 | % | (0.28 | )% | 1.10 | % | 113.04 | % | |||||||||||||||||
| Year Ended December 31, 2004 | $ | 13.70 | 17.19 | % | $ | 32,407 | 0.83 | % | (0.44 | )% | 1.22 | % | 135.55 | % | |||||||||||||||||
| Year Ended December 31, 2003 | $ | 11.69 | 36.57 | % | $ | 23,903 | 0.98 | % | (0.78 | )% | 1.37 | % | 113.75 | % | |||||||||||||||||
| Year Ended December 31, 2002 | $ | 8.56 | (20.00 | )% | $ | 10,864 | 1.23 | % | (1.05 | )% | 1.62 | % | 96.89 | % | |||||||||||||||||
| October 15, 2001 to December 31, 2001 (a) | $ | 10.70 | 7.00 | % | $ | 10,713 | 1.19 | % | (0.55 | )% | 1.58 | % | 3.82 | % | |||||||||||||||||
| BB&T Large Company Growth VIF | |||||||||||||||||||||||||||||||
| Year Ended December 31, 2005 | $ | 10.29 | 1.88 | % | $ | 23,523 | 0.79 | % | 0.40 | % | 1.14 | % | 91.61 | % | |||||||||||||||||
| Year Ended December 31, 2004 | $ | 10.14 | 5.63 | % | $ | 22,300 | 0.86 | % | 0.46 | % | 1.26 | % | 119.90 | % | |||||||||||||||||
| Year Ended December 31, 2003 | $ | 9.64 | 28.02 | % | $ | 18,464 | 1.04 | % | (0.32 | )% | 1.44 | % | 90.57 | % | |||||||||||||||||
| Year Ended December 31, 2002 | $ | 7.53 | (30.47 | )% | $ | 9,328 | 1.31 | % | (0.73 | )% | 1.71 | % | 93.65 | % | |||||||||||||||||
| October 15, 2001 to December 31, 2001 (a) | $ | 10.83 | 8.30 | % | $ | 10,876 | 1.19 | % | (0.32 | )% | 1.59 | % | 16.20 | % | |||||||||||||||||
| BB&T Capital Manager Equity VIF*** | |||||||||||||||||||||||||||||||
| Year Ended December 31, 2005 | $ | 10.51 | 6.77 | % | $ | 28,722 | 0.26 | % | 1.68 | % | 0.55 | % | 3.24 | % | |||||||||||||||||
| Year Ended December 31, 2004 | $ | 9.99 | 11.91 | % | $ | 25,611 | 0.34 | % | 0.75 | % | 0.54 | % | 1.09 | % | |||||||||||||||||
| Year Ended December 31, 2003 | $ | 8.99 | 25.47 | % | $ | 20,606 | 0.56 | % | 0.40 | % | 0.66 | % | 10.06 | % | |||||||||||||||||
| Year Ended December 31, 2002 | $ | 7.19 | (21.25 | )% | $ | 14,804 | 0.64 | % | 0.15 | % | 0.74 | % | 3.47 | % | |||||||||||||||||
| May 1, 2001 to December 31, 2001 (a) | $ | 9.28 | (7.08 | )% | $ | 16,295 | 0.54 | % | 0.18 | % | 0.63 | % | 9.18 | % | |||||||||||||||||
| BB&T Special Opportunities Equity VIF | |||||||||||||||||||||||||||||||
| Year Ended December 31, 2005 | $ | 12.70 | 6.29 | % | $ | 31,768 | 1.23 | % | (0.28 | )% | 1.23 | % | 42.15 | % | |||||||||||||||||
| July 22, 2004 to December 31, 2004 (a) | $ | 12.12 | 21.20 | % | $ | 21,044 | 1.45 | % | (0.76 | )% | 1.45 | % | 13.81 | % | |||||||||||||||||
| BB&T Total Return Bond VIF | |||||||||||||||||||||||||||||||
| Year Ended December 31, 2005 | $ | 9.92 | 2.29 | % | $ | 18,777 | 1.00 | % | 3.38 | % | 1.12 | % | 196.66 | % | |||||||||||||||||
| July 22, 2004 to December 31, 2004 (a) | $ | 10.08 | 1.76 | % | $ | 15,653 | 1.29 | % | 2.34 | % | 1.29 | % | 36.74 | % | |||||||||||||||||
25
BB&T Variable Insurance Funds
Notes to Financial Statements
December 31, 2005
1. Organization:
The BB&T Variable Insurance Funds (the "Trust") was organized on November 8, 2004, and is registered under the Investment Company Act of 1940, as amended (the "1940 Act"), as an open-end investment company established as a Massachusetts business trust. The Trust commenced operations on May 1, 2005 and presently offers shares of the BB&T Large Cap Value VIF, the BB&T Mid Cap Growth VIF, the BB&T Large Company Growth VIF, the BB&T Capital Manager Equity VIF, the BB&T Special Opportunities Equity VIF, and the BB&T Total Return Bond VIF (referred to individually as a "Fund" and collectively as the "Funds"). The Trust is authorized to issue an unlimited number of shares of beneficial interest without par value. Shares of the Funds are offered through variable annuity contracts offered through the separate accounts of participating insurance companies. The BB&T Capital Manager Equity VIF (the "Fund of Funds") invest s in other Fund Portfolios as opposed to individual securities. Prior to May 1, 2005 the Funds operated as a separate series of the Variable Insurance Funds, an investment company organized as a Massachusetts business trust, and registered under the 1940 Act as a diversified, open-end management investment company.
Under the Funds' organizational documents, its Officers and Trustees are indemnified against certain liabilities arising out of the performance of their duties to the Funds. In addition, in the normal course of business, the Funds may enter into contracts with their vendors and others that provide for general indemnifications. The Funds' maximum exposure under these arrangements is unknown as this would involve future claims that may be made against the Funds. However, based on experience, the Funds expect that risk of loss to be remote.
2. Significant Accounting Policies:
The following is a summary of significant accounting policies followed by the Trust in the preparation of its financial statements. The policies are in conformity with accounting principles generally accepted in the United States of America ("GAAP"). The preparation of financial statements requires management to make estimates and assumptions that affect the reported amounts of assets and liabilities and disclosure of contingent assets and liabilities at the date of the financial statements and the reported amounts of income and expenses for the period. Actual results could differ from those estimates. The Fund of Funds seeks its investment objective of capital appreciation by investing solely in a diversified portfolio of mutual funds (the "Underlying Funds"). The Fund of Funds purchases shares of the Underlying Funds at net asset value and without sales charge.
Securities Valuation—Investments in common stocks, commercial paper, corporate bonds, municipal securities, U.S. Government securities, and U.S. Government agency securities, the principal market for which is a securities exchange or an over-the-counter market, are valued at their latest available sale price (except for those securities that are traded on NASDAQ, which will be valued at the NASDAQ official closing price) or in the absence of such a price, by reference to the latest available bid quotations in the principal market in which such securities are normally traded. The Funds may also use an independent pricing service approved by the Board of Trustees to value certain securities. Such prices reflect fair values which may be established through the use of electronic and matrix techniques. Short-term obligations that mature in 60 days or less are valu ed at either amortized cost or original cost plus interest, which approximates fair value. Investments in open-end investment companies, including the Fund of Funds, are valued at their respective net asset values as reported by such companies. Investments in closed-end investment companies are valued at their fair values based upon the latest available bid prices in the principal market in which such securities are normally traded. The differences between cost and fair values of investments are reflected as either unrealized appreciation or depreciation. Securities for which market quotations are not readily available will be valued at fair value using methods determined in good faith by the Pricing Committee under the supervision of the Board of Trustees. Fair value pricing may be used for significant events such as securities whose trading has been suspended, whose price has become stale or for which there is no currently available price.
Securities Transactions and Related Income—Securities transactions are accounted for no later than one business day after trade date. However, for financial reporting purposes security transactions are accounted for on trade date. Interest income is recognized on the accrual basis and includes, where applicable, the pro rata amortization/accretion of premium or discount. Dividend income is recorded on the ex-dividend date. Gains or losses realized from sales of securities are determined by comparing the identified cost of the security lot sold with the net sales proceeds.
When-Issued—The Funds, may purchase securities on a "when-issued" basis. The Funds record when-issued securities on the trade date and pledge assets with a value equal to the purchase commitment for payment of the securities purchased. The value of the securities underlying when-issued securities and any subsequent fluctuation in their fair value is taken into account when determining the net asset value of the Funds, commencing with the date the Funds agree to purchase the securities.
Repurchase Agreements—The Funds may acquire repurchase agreements from member banks of the Federal Deposit Insurance Corporation and from registered broker/dealers that BB&T Asset Management, Inc. ("BB&T") deems creditworthy under guidelines
26
BB&T Variable Insurance Funds
Notes to Financial Statements — (continued)
December 31, 2005
approved by the Board of Trustees, subject to the seller's agreement to repurchase such securities at a mutually agreed-upon date and price. The repurchase price generally equals the price paid by the Funds plus interest negotiated on the basis of current short-term rates, which may be more or less than the rate on the underlying collateral. The seller under a repurchase agreement is required to maintain the value of collateral held pursuant to the agreement at not less than the repurchase price, including accrued interest. Securities subject to repurchase agreements are held by the Funds' custodian or another qualified custodian or in the Federal Reserve/Treasury book-entry system.
Option Contracts—The Funds may write or purchase option contracts. These transactions are to hedge against changes in interest rates, security prices, currency fluctuations, and other market developments, or for the purposes of earning additional income (i.e. speculation).
The risk associated with purchasing an option is that the Fund pays a premium whether or not the option is exercised. Additionally, the Funds bear the risk of loss of the premium and change in fair value should the counterparty not perform under the contract. Put and call options purchased are accounted for in the same manner as other securities owned. The cost of securities acquired through the exercise of call options is increased by the premiums paid. The proceeds from securities sold through the exercise of put
options are decreased by the premiums paid.
In writing an option, the Funds contract with a specified counterparty to purchase (written put option) or sell (written call option) a specified quantity (notional amount) of an underlying asset at a specified price during a specified period upon demand of the counterparty. The risk associated with writing an option is that the Funds bear the market risk of an unfavorable change in the price of an underlying asset, and may be required to buy or sell an underlying asset under the contractual terms of the option at a price different from the current fair value. The BB&T Special Opportunities Equity VIF had the following transactions in written covered call options during the year ended December 31, 2005.
| BB&T Special Opportunities Equity VIF | |||||||||||
| Covered Call Options | Shares Subject to Contract | Premiums | |||||||||
| Balance at beginning of period | 291 | $ | 43,616 | ||||||||
| Options written | 939 | 47,965 | |||||||||
| Options closed | (90 | ) | (6,030 | ) | |||||||
| Options expired | (574 | ) | (29,091 | ) | |||||||
| Options exercised | (501 | ) | (51,959 | ) | |||||||
| Balance at end of period | 65 | $ | 4,501 | ||||||||
The following is a summary of options outstanding as of December 31, 2005:
| Security | |||||||||||
| Security | |||||||||||
| BB&T Special Opportunities Equity VIF | Shares Subject to Contract | Fair Value | |||||||||
| Fair Isaac Corp., $50.00, 1/21/06 | 65 | $ | 325 | ||||||||
| $ | 325 | ||||||||||
Dividends and Distributions—Dividends from net investment income are declared and paid quarterly for the Funds, with the exception of the BB&T Total Return Bond VIF, in which case dividends from net investment income are declared daily and paid monthly. Distributable net realized gains, if any, are declared and distributed at least annually.
The character of income and gains distributed are determined in accordance with federal income tax regulations, which may differ from GAAP. These "book/tax" differences are either considered temporary or permanent in nature. To the extent these differences are permanent in nature (i.e. reclass of market discounts, gain/loss, paydowns and distributions), such amounts are reclassified within the composition of net assets based on their federal tax-basis treatment; temporary differences do not require reclassification. Dividends to shareholders which exceed net investment income and net realized gains for tax purposes are reported as distributions of capital or return of capital.
Federal Income Taxes —It is the policy of each Fund to continue to qualify as a regulated investment company by complying with the provisions available to certain investment companies, as defined in applicable sections of the Internal Revenue Code, and to
27
BB&T Variable Insurance Funds
Notes to Financial Statements — (continued)
December 31, 2005
make distributions of net investment income and net realized capital gains sufficient to relieve it from all, or substantially all, federal income taxes. Accordingly, no provision for federal income tax is required. Under the applicable foreign tax law, a withholding tax may be imposed on interest, dividends and capital gains earned on foreign investments at various rates. Where available, the Funds will file for claims on foreign taxes withheld.
Other—Expenses directly attributable to a Fund are charged to that Fund. Expenses not directly attributable to a Fund are allocated proportionately among all Funds daily in relation to the net assets of each Fund or on another reasonable basis. Expenses which are attributable to more than one Trust are allocated across the BB&T Variable Insurance Funds and BB&T Funds Trusts, based upon relative net assets or on another reasonable basis. BB&T Asset Management, Inc. ("BB&T") serves as the Investment Advisor for each the BB&T Variable Insurance Fund, and BB&T Funds Trusts.
3. Purchases and Sales of Securities:
Purchases and sales of securities (excluding short-term and U.S. Government securities) for the year ended December 31, 2005 are as follows:
| Purchases | Sales | ||||||||||
| BB&T Large Cap Value VIF | $ | 23,585,332 | $ | 26,774,467 | |||||||
| BB&T Mid Cap Growth VIF | 38,174,380 | 36,499,528 | |||||||||
| BB&T Large Company Growth VIF | 20,590,270 | 19,523,582 | |||||||||
| BB&T Capital Manager Equity VIF | 3,964,111 | 845,000 | |||||||||
| BB&T Special Opportunities Equity VIF | 16,505,874 | 10,580,567 | |||||||||
| BB&T Total Return Bond VIF | 37,247,547 | 33,207,843 | |||||||||
Purchases and sales of long-term U.S. Government Securities for the year ended December 31, 2005 for the BB&T Total Return Bond VIF were $3,315,463 and $4,207,126, respectively.
4. Related Party Transactions:
Investment advisory services are provided to the Funds by BB&T. Under the terms of the Investment Advisory Agreement, BB&T is entitled to receive fees based on a percentage of the average daily net assets of the Funds. These fees are accrued daily and payable on a monthly basis.
Information regarding these transactions is as follows for the year ended December 31, 2005:
| Contractual Fee Rate | Fee Rate after Contractual Waiver(1) | Fee Rate after Contractual Waiver(2)* | |||||||||||||
| BB&T Large Company Value VIF | 0.74 | % | 0.60 | % | 0.50 | % | |||||||||
| BB&T Mid Cap Growth VIF | 0.74 | % | 0.35 | % | 0.50 | % | |||||||||
| BB&T Large Company Growth VIF | 0.74 | % | 0.34 | % | 0.50 | % | |||||||||
| BB&T Capital Manager Equity VIF | 0.25 | % | 0.15 | % | 0.00 | % | |||||||||
| BB&T Special Opportunities Equity VIF | 0.80 | % | 0.80 | % | 0.80 | % | |||||||||
| BB&T Total Return Bond VIF | 0.60 | % | 0.60 | % | 0.50 | % | |||||||||
* Effective May 1, 2005, BB&T has contractually agreed to waive a portion of the investment advisory fee as disclosed in the table above. For the period ended December 31, 2005, BB&T voluntarily agreed to waive an additional portion of the investment advisory fees. All contractual and voluntary investment advisory fee waivers are not subject to recoupment in subsequent fiscal periods.
(1) For the period January 1, 2005 through April 30, 2005.
(2) For the period May 1, 2005 through December 31, 2005.
Pursuant to a Sub-Advisory agreement with BB&T, Scott & Stringfellow, Inc., a wholly owned subsidiary of BB&T Corporation, serves as the Sub-Advisor to the BB&T Special Opportunities Equity VIF, subject to the general supervision of the Trusts' Board of Trustees and BB&T. Pursuant to a Sub-Advisory agreement with BB&T effective July 18, 2005, Sterling Capital Management LLC, a wholly owned subsidiary of BB&T Corporation, serves as the Sub-Advisor to the BB&T Total Return Bond VIF, subject to the general supervision of the Trusts' Board of Trustees and BB&T. For their services, the Sub-Advisors are entitled to a fee, payable by BB&T.
Effective May 1, 2005, BB&T began serving the Funds as administrator. BB&T receives compensation for providing administration services at a rate of 0.12% of the BB&T Variable Insurance Funds and BB&T Funds aggregate average daily net assets up to
28
BB&T Variable Insurance Funds
Notes to Financial Statements — (continued)
December 31, 2005
$5 billion, and a rate of 0.08% of the average daily net assets in excess of $5 billion. This fee is accrued daily and payable on a monthly basis. Expenses incurred are reflected on the Statements of Operations as "Administration fees." During the period ended December 31, 2005, BB&T voluntarily waived administration fees of $21,023 for the BB&T Capital Manager Equity VIF, and this waiver is not subject to recoupment in subsequent fiscal periods. Pursuant to a sub-administration agreement with BB&T, BISYS serves as Sub-Administrator to the Trust subject to the general supervision of the Trusts' Board of Trustees and BB&T. For these services, BISYS is entitled to a fee, payable by BB&T.
BISYS Fund Services Limited Partnership d/b/a BISYS Fund Services ("BISYS"), an Ohio Limited Partnership, and BISYS Fund Services Ohio, Inc. ("BISYS Ohio") are subsidiaries of the BISYS Group, Inc. BISYS, with whom certain officers of the Funds are affiliated, serves the Funds as distributor. BISYS Ohio serves the Funds as fund accountant and transfer agent. Prior to May 1, 2005, BISYS and BISYS Ohio received compensation for providing administration, fund accounting and transfer agency services at a percentage of the average net assets of each Fund. In addition, for each Fund an additional flat fee was charged. The fee was accrued daily and payable on a monthly basis. Expenses incurred are reflected on the Statements of Operations as "Administration, transfer agency and fund accounting fees". BISYS voluntarily waived fees totaling $54,844 of administration fees for the period January 1, 2005 through April 30, 2005, for the BB&T Large Ca p Value VIF, and this waiver is not subject to recoupment in subsequent fiscal periods.
Effective May 1, 2005, BISYS Ohio serves the Funds as fund accountant and transfer agent and receives compensation for providing fund accounting and transfer agency services at a rate of 0.02% (0.01% for each service) of the average daily net assets of each Fund, the fee is accrued daily and payable on a monthy basis. Expenses incurred are reflected on the Statements of Operations as "Fund accounting fees" and "Transfer agency fees", respectively.
Under a Compliance Services Agreement between the Funds' and BISYS Ohio (the "CCO Agreement"), BISYS Ohio makes an employee available to serve as the Funds' Chief Compliance Officer (the "CCO"). Under the CCO Agreement, BISYS Ohio also provides infrastructure and support in implementing the written policies and procedures comprising the Funds' compliance program, including support services to the CCO. For the services provided under the CCO Agreement, the Funds paid BISYS Ohio $19,750 for the reporting period ended December 31, 2005, plus certain out of pocket expenses. Effective September 24, 2005, the CCO Agreement was increased to $35,000, plus certain out of pocket expenses. Expenses incurred are reflected on the Statements of Operations as "Compliance service fees". BISYS Ohio pays the salary and other compensation earned by any such individuals as employees of BISYS Ohio.
For the year ended December 31, 2005, the Funds' paid $34,335 in brokerage fees to Scott & Stringfellow, Inc., a wholly owned subsidiary of BB&T Corporation, on the execution of purchases and sales of the Funds' portfolio investments.
The Trust has adopted a Variable Contract Owner Servicing Plan (the "Service Plan") under which the Funds may pay a fee computed daily and paid monthly, at an annual rate of up to 0.25% of the average daily net assets of the Fund. A servicing agent may periodically waive all or a portion of its servicing fees. For the year ended December 31, 2005 the Funds did not participate in any service plans.
Certain Officers and Trustees of the Trust are affiliated with the Adviser or the Administrator. Such Officers and Trustees receive no compensation from the Funds for serving in their respective roles. Each of the non-interested Trustees who served both on the Board and the audit committee are compensated $1,750 ($33,250 in total) for meeting or retainer fees, plus reimbursement for certain expenses.
5. Federal Income Tax Information:
At December 31, 2005, the following Funds have net capital loss carryforwards to offset future net capital gains, if any, to the extent provided by the Treasury regulations. To the extent that these carryforwards are used to offset future capital gains, it is probable that the gains that are offset will not be distributed to shareholders.
| Amount | Expires | ||||||||||
| BB&T Large Cap Value VIF | $ | 891,424 | 2011 | ||||||||
| BB&T Total Return Bond VIF | 96,285 | 2013 | |||||||||
29
BB&T Variable Insurance Funds
Notes to Financial Statements — (continued)
December 31, 2005
The tax character of dividends paid to shareholders during the fiscal year ended December 31, 2005 were as follows:
| Distributions paid from | |||||||||||||||||||||||
| Ordinary Income | Net Long-Term Gains | Total Taxable Distributions | Tax Exempt Distributions | Total Distributions Paid* | |||||||||||||||||||
| BB&T Large Cap Value VIF | $ | 2,712,891 | $ | — | $ | 2,712,891 | $ | — | $ | 2,712,891 | |||||||||||||
| BB&T Large Company Growth VIF | 183,178 | — | 183,178 | — | 183,178 | ||||||||||||||||||
| BB&T Capital Manager Equity VIF | 481,528 | — | 481,528 | — | 481,528 | ||||||||||||||||||
| BB&T Special Opportunities Equity VIF | 425,882 | — | 425,882 | — | 425,882 | ||||||||||||||||||
| BB&T Total Return Bond VIF | 704,135 | — | 704,135 | — | 704,135 | ||||||||||||||||||
The tax character of dividends paid to shareholders during the fiscal year ended December 31, 2004, were as follows:
| Distributions paid from | |||||||||||||||||||||||
| Ordinary Income | Net Long-Term Gains | Total Taxable Distributions | Tax Exempt Distributions | Total Distributions Paid* | |||||||||||||||||||
| BB&T Large Cap Value VIF | $ | 1,648,020 | $ | — | $ | 1,648,020 | $ | — | $ | 1,648,020 | |||||||||||||
| BB&T Large Company Growth VIF | 1,683 | — | 1,683 | — | 1,683 | ||||||||||||||||||
| BB&T Capital Manager Equity VIF | 134,465 | — | 134,465 | — | 134,465 | ||||||||||||||||||
| BB&T Total Return Bond VIF | 109,130 | — | 109,130 | — | 109,130 | ||||||||||||||||||
* Total Distributions paid may differ from the Statement of Changes in Net Assets because distributions are recognized when actually paid for tax purposes.
As of December 31, 2005, the components of accumulated earnings (deficit) on a tax basis were as follows:
| Undistributed Ordinary Income | Undistributed Long Term Capital Gains (Lossses) | Accumulated Earnings | Dividends Payable | Accumulated Capital and Other Losses | Unrealized Appreciation (Depreciation) | Total Accumulated Earnings (Deficit) | |||||||||||||||||||||||||
| BB&T Large Cap Value VIF | $ | 24,377 | $ | — | $ | 24,377 | $ | — | $ | (891,424 | ) | $ | 19,663,060 | $ | 18,796,013 | ||||||||||||||||
| BB&T Mid Cap Growth VIF | — | 2,384,160 | 2,384,160 | — | — | 10,772,126 | 13,156,286 | ||||||||||||||||||||||||
| BB&T Large Company Growth VIF | — | 62,259 | 62,259 | — | — | 2,195,384 | 2,257,643 | ||||||||||||||||||||||||
| BB&T Capital Manager Equity VIF | 143,333 | 967,984 | 1,111,317 | — | — | 1,583,325 | 2,694,642 | ||||||||||||||||||||||||
| BB&T Special Opportunities Equity VIF | 283,514 | 1,526,429 | 1,809,943 | — | — | 2,956,184 | 4,766,127 | ||||||||||||||||||||||||
| BB&T Total Return Bond VIF | 77,712 | — | 77,712 | — | (96,285 | ) | (134,846 | ) | (153,419 | ) | |||||||||||||||||||||
At December 31, 2005, the cost, gross unrealized appreciation and gross unrealized depreciation on securities for federal income tax purposes were as follows:
| Tax Cost | Tax Unrealized Appreciation | Tax Unrealized Depreciation | Net Unrealized Appreciation (Depreciation) | ||||||||||||||||
| BB&T Large Cap Value VIF | $ | 94,026,795 | $ | 22,625,981 | $ | (2,962,921 | ) | $ | 19,663,060 | ||||||||||
| BB&T Mid Cap Growth VIF | 28,491,568 | 10,907,628 | (135,502 | ) | 10,772,126 | ||||||||||||||
| BB&T Large Company Growth VIF | 21,321,372 | 2,588,396 | (393,012 | ) | 2,195,384 | ||||||||||||||
| BB&T Capital Manager Equity VIF | 27,101,693 | 1,908,444 | (325,119 | ) | 1,583,325 | ||||||||||||||
| BB&T Special Opportunities Equity VIF | 28,936,362 | 3,435,042 | (483,034 | ) | 2,952,008 | ||||||||||||||
| BB&T Total Return Bond VIF | 20,285,229 | 29,231 | (164,077 | ) | (134,846 | ) | |||||||||||||
30
Report of Independent Registered Public Accounting Firm
To the Shareholders and Board of Trustees of
BB&T Variable Insurance Funds:
We have audited the accompanying statements of assets and liabilities of BB&T Variable Insurance Funds (previously the Variable Insurance Funds) – BB&T Large Cap Value Variable Insurance Fund, BB&T Mid Cap Growth Variable Insurance Fund, BB&T Large Company Growth Variable Insurance Fund, BB&T Capital Manager Equity Variable Insurance Fund, BB&T Special Opportunities Equity Variable Insurance Fund and BB&T Total Return Bond Variable Insurance Fund (referred to individually as a Fund and collectively as the Funds) including the schedules of portfolio investments, as of December 31, 2005, and the related statements of operations for the year then ended, the statements of changes in net assets for each period in the two-year period then ended, and the financial highlights for each period in the four-year period then ended. These financial statements and financial highlights are the responsibility of the Funds' ma nagement. Our responsibility is to express an opinion on these financial statements and financial highlights based on our audits. The accompanying financial highlights for the periods ended December 31, 2001 were audited by other auditors whose report thereon dated February 15, 2002, expressed an unqualified opinion on those financial highlights.
We conducted our audits in accordance with the standards of the Public Company Accounting Oversight Board (United States). Those standards require that we plan and perform the audit to obtain reasonable assurance about whether the financial statements and financial highlights are free of material misstatement. An audit includes examining, on a test basis, evidence supporting the amounts and disclosures in the financial statements. Our procedures included confirmation of securities owned as of December 31, 2005, by correspondence with custodians and brokers; where replies were not received from brokers, we performed other auditing procedures. An audit also includes assessing the accounting principles used and significant estimates made by management, as well as evaluating the overall financial statement presentation. We believe that our audits provide a reasonable basis for our opinion.
In our opinion, the financial statements and financial highlights referred to above present fairly, in all material respects, the financial position of the Funds as of December 31, 2005, the results of its operations for the year then ended, the changes in their net assets for each period in the two-year period then ended, and the financial highlights for each period in the four-year period then ended, in conformity with U.S. generally accepted accounting principles.
KPMG LLP
Columbus, Ohio
February 17, 2006
31
BB&T Variable Insurance Funds
Other Information (Unaudited)
December 31, 2005
Other Federal Income Tax Information (Unaudited):
For corporate shareholders, the following percentage of the total ordinary income dividends paid during the fiscal year ended December 31, 2005 qualify for the corporate dividends received deduction for the following Funds:
| Dividends Received Deduction | |||||||
| BB&T Large Cap Value VIF | 100.00 | % | |||||
| BB&T Large Company Growth VIF | 100.00 | % | |||||
| BB&T Capital Manager Equity VIF | 100.00 | % | |||||
Special Meeting of Shareholders (Unaudited):
On July 8, 2005, there was a special meeting of the shareholders of the BB&T Variable Insurance Funds. The purpose of the meeting was: (1) to approve Investment Sub-Advisory Agreements between the Advisor and Sterling Capital Management LLC with repect to the BB&T Total Return Bond VIF. A description of the proposal and the number of shares voted is as follows:
1. Approve Investment Sub-Advisory Agreements between the Advisor and Sterling Capital Management with respect to the BB&T Total Return Bond VIF.
| Affirmative | Against | Abstain | |||||||||||||
| BB&T Total Return Bond Fund | 1,655,759 | — | — | ||||||||||||
Other Information (Unaudited):
A description of the policies and procedures that the Funds use to determine how to vote proxies relating to portfolio securities is available (i) without charge, upon request, by calling 1-800-228-1872; and (ii) on the Securities and Exchange Commission's ("the Commission") website at http://www.sec.gov.
Information regarding how the Funds voted proxies relating to portfolio securities during the most recent 12-month period ended June 30th is available (i) without charge, upon request, by calling 1-800-228-1872 and (ii) on the Commission's website at http://www.sec.gov.
The BB&T Variable Insurance Funds file complete Schedules of Portfolio Holdings with the Commission for the first and third quarters of each fiscal year on Form N-Q. The Funds' Forms N-Q are available without charge on the Commission's website at http://www.sec.gov, or may be reviewed and copied at the Commission's Public Reference Room in Washington, D.C. Information on the operation of the Public Reference Room, may be obtained by calling 1-800-SEC-0330.
32
BOARD CONSIDERATION OF ADVISORY AND SUB-ADVISORY AGREEMENTS (UNAUDITED)
The Board of Trustees, at a meeting held on August 30, 2005, formally considered the Trust's investment advisory agreement with BB&T Asset Management, Inc. ("BB&TAM" or the "Adviser") with respect to all funds of the Trust and sub-advisory agreement of BB&TAM with Scott & Stringfellow, Inc. (the "Sub-Adviser" or, collectively with the Adviser, the "Advisers") with respect to the Special Opportunities Equity VIF (collectively, the "Advisory Agreements"). The Trustees reviewed extensive material in connection with their review of the Advisory Agreements, including data from an independent provider of mutual fund data which included comparisons with industry averages for comparable funds for advisory fees and total fund expenses. The data reflected BB&TAM fee waivers in place, as well as BB&TAM's contractual investment advisory fee levels. The Board was assisted in its review by independent legal counsel, who provided a memorandum detailing the legal standards for review of the Advisory Agreements. The Board received a detailed presentation by BB&TAM, which included a fund-by-fund analysis of performance. A presentation was also provided by the Sub-Adviser. The Board also deliberated outside the presence of management and the Advisers.
In their deliberations, each Trustee attributed different weights to various factors involved in an analysis of whether each Advisory Agreement should be continued, and no factor alone was considered determinative. The Trustees determined that the overall arrangements between the Trust and the Advisers, as provided in the Advisory Agreements, were fair and reasonable and that continuance of the Advisory Agreements was in the best interests of each Fund and its shareholders.
The matters addressed below were considered and discussed by the Trustees in reaching their conclusions.
Nature, Extent and Quality of Services Provided by the Adviser
The Trustees received and considered information regarding the nature, extent, and quality of the services provided to each Fund under the Advisory Agreements. The Trustees took into account information furnished throughout the year at Trustee meetings, as well as materials furnished specifically in connection with the annual review process. The Trustees considered the background and experience of each Adviser's senior management and the expertise of investment personnel of each Adviser responsible for the day-to-day management of each Fund. The Trustees considered the overall reputation, and the capabilities and commitment of the Advisers to provide high quality service to the Trust, and the Trustees' overall confidence in each Adviser's integrity.
The Trustees received information concerning the investment philosophy and investment processes applied by the Advisers in managing the Funds. The Trustees also considered information regarding regulatory compliance and compliance with the investment policies of the Funds. The Trustees evaluated the trading practices of Scott & Stringfellow, which engages in affiliated brokerage for a majority of the portfolio trades for the Fund it sub-advises. As part of this evaluation, the Trustees received information regarding safeguards employed, such as prohibitions on principal and cross-agency trades. The Trustees also evaluated the procedures of the Advisers designed to fulfill the Advisers' fiduciary duty to the Funds with respect to possible conflicts of interest, including the Advisers' codes of ethics (regulating the personal trading of its officers and employees).
With respect to BB&TAM, the Trustees particularly noted recent increased staffing and enhancements to the investment processes and systems and administration, including the retention of, and improvements initiated by, a chief investment officer. Based on their review, the Trustees concluded that, with respect to the quality and nature of services to be provided by the Advisers, the scope of responsibilities was typical of those of investment advisers and sub-advisers to open-end mutual funds generally, and that the quality of the services was very satisfactory.
Investment Performance
The Trustees considered performance results of each Fund in absolute terms and relative to each Fund's benchmark index. It was noted that performance of the Funds over the last twelve months was generally strong. During their review, the Trustees particularly considered the strong one-year performance of the Special Opportunities Equity VIF relative to its benchmark index.
After reviewing the performance of each Fund, and taking into consideration the management style, investment strategies, and prevailing market conditions during the prior year and for longer periods, the Trustees concluded that the performance of each of the Funds was satisfactory or better.
Cost of Services, Including the Profits Realized by the Advisers and Affiliates
The Trustees considered peer group comparable information with respect to the advisory fees charged by BB&TAM to each of the Funds, taking into consideration both contractual and actual (i.e., after waiver) fee levels. The Trustees concluded that the investment advisory fees fell within an acceptable range as compared to peer groups. The Trustees particularly noted, however, that investment advisory fees for the Special Opportunities Equity VIF exceeded the industry average. The Trustees considered that the total expense ratio for the Special Opportunities Equity VIF exceeded the industry average by only 10 basis points. The Trustees also considered the strong performance of this fund over the past twelve months, as compared to its benchmark index, and concluded that the strong performance supported the somewhat higher investment advisory fee.
33
As part of their review, the Trustees considered benefits to the Adviser aside from investment advisory fees. The Trustees reviewed administration fees received by BB&TAM and considered the fallout benefits to BB&TAM such as the research services available to the Adviser by reason of brokerage commissions generated by the Funds' turnover. The Trustees also considered benefits to BB&TAM's affiliates, including brokerage commissions received by Scott & Stringfellow for executing trades on behalf of the Special Opportunities Equity VIF. With respect to Scott & Stringfellow, the Trustees noted that brokerage commissions were paid on the same commission schedule as employed by BB&TAM and that such brokerage arrangements were considered by the Sub-Adviser to be advantageous in terms of superior access to the market.
Consideration of the reasonableness of advisory fees also took into account, where relevant, the profitability of the Advisers. In determining whether the investment advisory and sub-advisory fees (collectively, the "investment advisory fees") were reasonable, the Trustees reviewed profitability information provided by the Advisers with respect to investment advisory services. With respect to such information, the Trustees recognized that such profitability data was generally unaudited and represented an Adviser's own determination of its and its affiliates' revenues from the contractual services provided to the Funds, less expenses of providing such services. Expenses include direct and indirect costs and were calculated using an allocation methodology developed by the Adviser. The Trustees also recognized that it is difficult to make comparisons of profitability from fund investment advisory and sub-advisory contracts, because comparative information is not generally publicly available and is affected by numerous factors. Based on their review, the Trustees concluded that the profitability to BB&TAM and its affiliates as a result of their relationships with the Funds was acceptable. With respect to Sub-Adviser profitability, the Trustees noted that sub-advisory fees are paid by BB&TAM, rather than directly from the Trust's assets. The Board also concluded that the fees under the Advisory Agreements were fair and reasonable, in light of the services and benefits provided to each Fund.
Economies of Scale
The Trustees also considered whether fee levels reflect economies of scale and whether economies of scale would be produced by the growth of the Trust's assets. The Trustees noted that the Funds were not of a comparable size and had yet to attract assets sufficient to generate economies of scale.
34
Information about Trustees and Officers (Unaudited)
Overall responsibility for the management of the Funds rests with its Board of Trustees', who are elected by the Shareholders of the Funds. The Trustees' elect the officers of the Funds to supervise its day-to-day operations. The names of the Trustees', their addresses, birthdate, length of tenure, principal occupations during the past five years, number of portfolios overseen and directorships held outside of the Funds are set below:
| Name, Address, and Birthdate | Position(s) Held with BB&T | Term of Office/ Length of Time Served | Principal Occupation During the Past 5 Years | Number of Portfolios Overseen in Complex by Trustee | |||||||||||||||
| Thomas W. Lambeth 700 Yorkshire Road Winston-Salem, NC 27106 Birthdate: 1/35 | Trustee, Chairman of the Board of Trustees | Indefinite, 8/92—present | From January 2001 to present, Senior Fellow, Z. Smith Reynolds Foundation; From 1978 to January 2001, Executive Director, Z. Smith Reynolds Foundation. | 31 | |||||||||||||||
| Drew T. Kagan Montecito Advisors, Inc. 810 N. Jefferson St., Ste 101. Lewisburg, WV 24901 Birthdate: 2/48 | Trustee | Indefinite, 8/00—present | From December 2003 to present, President and Director, Montecito Advisors, Inc..; from March 1996 to December 2003, President, Investment Affiliate, Inc. | 31 | |||||||||||||||
| Laura C. Bingham Peace College Office of the President 15 East Peace Street Raleigh, NC 27604-1194 Birthdate: 11/56 | Trustee | Indefinite, 2/01—present | From July 1998 to present, President of Peace College. | 31 | |||||||||||||||
| Douglas R. Van Scoy 841 Middle St. Sullivans Island, SC 26481 Birthday: 11/43 | Trustee | Indefinite, 5/04—present | Retired; From November 1974 to July 2001, Deputy Director of Private Client Group and Senior Executive Vice President of Smith Barney (investment banking). | 31 | |||||||||||||||
| James L. Roberts 207 Highland Terrace Breckenridge, CO 80424 Birthday: 11/42 | Trustee | Indefinite, 11/04—present | Retired; From January 1999 to December 2003 President, CEO and Director, Covest Bancshares, Inc. | 31 | |||||||||||||||
| The Funds Statement of Additional Information includes information about the Fund's Trustees. To receive your free copy of the Statement of Additional Information, call toll free: 1-800-453-7348. | |||||||||||||||||||
35
The following table shows information for trustees who are "interested persons" of BB&T Variable Insurance Funds as defined in the 1940 act:
| Name, Address and Birthdate | Position(s) Held with BB&T | Term of Office/ Length of Time Served | Principal Occupation During the Past 5 Years | Overseen Complex | |||||||||||||||
| *Kenneth L. Miller 200 W. Second Street, 16th Floor Winston-Salem, NC 2710 Birthdate: 9/46 | Trustee | Indefinite, 11/03—present | From August 1997 to present, Executive Vice President, Branch Banking and Trust Company; Employee of Branch Banking and Trust Company since 1989. | 31 | |||||||||||||||
* Mr. Miller is treated by the Funds as an "interested person" (as defined in Section 2(e)(19) of the 1940 Act) of the Funds. Mr. Miller is an "interested person" because he owns shares of BB&T Corporation and is an Executive Vice President of Branch Banking and Trust Company, the parent of the adviser.
The following table shows information for officers of BB&T Variable Insurance Funds:
| Name and Birthdate | Position(s) Held with BB&T Fund | Term of Office/ Length of Time Served | Principal Occupation During the Past 5 Years | ||||||||||||
| Keith F. Karlawish Birthdate: 8/64 | President | Indefinite, 2/05—Present | From May 2002 to present, President, BB&T Asset Management, Inc.; from 1996 to 2002, Senior Vice President and Director of Fixed Income, BB&T Asset Management, Inc. | ||||||||||||
| E.G. Purcell, III Birthdate: 1/55 | Vice President | Indefinite, 11/00—Present | From 1995 to present, Senior Vice President, BB&T Asset Management, Inc. and its predecessors | ||||||||||||
| James T. Gillespie Birthdate: 11/66 | Vice President | Indefinite, 5/02—Present | From February 2005 to present, Vice President of BB&T Asset Management; from 1992 to 2005, Director, BISYS Fund Services | ||||||||||||
| Todd M. Miller Birthdate: 9/71 | Vice President | Indefinite, 8/05—Present | From June 2005 to present, Mutual Fund Administrator, BB&T Asset Management; from May 1993 to May 2005, Manager, BISYS Fund Services | ||||||||||||
| Rodney Ruehle Birthdate: 4/68 | Anti-Money Laundering Officer and Chief Compliance Officer | Indefinite, 2/06—Present | From August 1995 to present, Fund Compliance Officer, BISYS Fund Services. | ||||||||||||
36
| Name and Birthdate | Position(s) Held with BB&T Fund | Term of Office/ Length of Time Served | Principal Occupation During the Past 5 Years | ||||||||||||
| C. David Bunstine Birthdate: 7/65 | Secretary | Indefinite, 5/05—Present | From December 1987 to present, Vice President, BISYS Fund Services | ||||||||||||
| Troy A. Sheets Birthdate: 5/71 | Treasurer | Indefinite, 5/02—Present | From April 2002 to present, Vice President, BISYS Fund Services; from September 1993 to April 2002, Senior Manager, KPMG LLP | ||||||||||||
| Christopher E. Sabato Birthdate: 12/68 | Assistant Treasurer | Indefinite 11/02—Present | From February 1993 to present, Director, BISYS Fund Services | ||||||||||||
| Alaina V. Metz Birthdate: 4/67 | Assistant Secretary | Indefinite 9/95—Present | From June 1995 to present, Vice President of BISYS Fund Services. | ||||||||||||
37
Item 2. Code of Ethics.
(a) The registrant has adopted a code of ethics that applies to the registrant’s principal executive officer, principal financial officer, principal accounting officer or controller, or persons performing similar functions. This code of ethics is included as Exhibit 12(a)(1).
(b) During the period covered by the report, with respect to the registrant’s code of ethics that applies to its principal executive officer, principal financial officer, principal accounting officer or controller, or persons performing similar functions; there have been no amendments to, nor any waivers granted from, a provision that relates to any element of the code of ethics definition enumerated in paragraph (b) of this Item 2. The BB&T Variable Insurance Funds (“Funds”) commenced operations on May 1, 2005. Prior to May 1, 2005 the Funds operated as a separate series of the Variable Insurance Funds, an investment company organized as a Massachusetts business trust, and registered under the 1940 Act as a diversified, open-end management investment company.
Item 3. Audit Committee Financial Expert.
3(a)(1) The registrant’s board of directors has determined that the registrant has at least one audit committee financial expert serving on its audit committee.
3(a)(2) The audit committee financial expert is Drew Kagan, who is “independent” for purposes of this Item 3 of Form N-CSR.
Item 4. Principal Accountant Fees and Services.
(a) Audit Fees |
| 2004 |
| $ | 54,150 | * |
|
| 2005 |
| $ | 57,300 |
|
|
|
|
|
|
| |
(b) Audit - Related Fees |
| 2004 |
| $ | 4,400 | * |
|
| 2005 |
| $ | 4,600 |
|
2004- Fees of $4,400 relate to the review and consent of the N-1A filing.
2005- Fees of $4,600 relate to the review and consent of the N-1A filing.
(c) Tax Fees |
| 2004 |
| $ | 12,600 | * |
|
| 2005 |
| $ | 13,200 |
|
Fees for both 2004 & 2005 relate to the preparation of federal income & excise tax returns and review of the excise tax calculations
(d) All Other Fees |
| 2004 |
| $ | 0 | * |
|
| 2005 |
| $ | 0 |
|
e(1) Except as permitted by Rule 2-01(c)(7)(i)(C) of Regulation S-X, the Trust’s Audit Committee must pre-approve all audit and non-audit services provided by the independent accountants relating to the operations or financial reporting of the funds. Prior to the commencement of any audit or non-audit services to a fund, the Audit Committee reviews the services to determine whether they are appropriate and permissible under applicable law.
e(2) None of the services summarized in (b)-(d), above, were approved by the Audit Committee pursuant to Rule 2-01(c)(7)(i)(C) of Regulation S-X.
(f) Not applicable.
(g) |
| 2004 |
| $ | 165,000 | * |
|
| 2005 |
| $ | 512,000 |
|
(h) In regards to Item 4 (g), the audit committee considered the nonaudit services rendered to the registrant’s investment adviser and any entity controlling, controlled by, or under common control with the investment adviser, and believes the principal accountants independence has not been compromised.
*The Funds commenced operations on May 1, 2005. Prior to May 1, 2005 the Funds operated as a separate series of the Variable Insurance Funds, an investment company organized as a Massachusetts business trust, and registered under the 1940 Act as a diversified, open-end management investment company. Fees disclosed for fiscal year 2004 were related to the Funds operating as a series of the Variable Insurance Funds.
Item 5. Audit Committee of Listed Registrants.
Not applicable.
Item 6. Schedule of Investments.
Not applicable.
Item 7. Disclosure of Proxy Voting Policies and Procedures for Closed-End Management Investment Companies.
Not applicable.
Item 8. Portfolio Managers of Closed-End Management Investment Companies.
Not applicable.
Item 9. Purchases of Equity Securities by Closed-End Management Investment Company and Affiliated Purchasers.
Not applicable.
Item 10. Submission of Matters to a Vote of Security Holders.
Not applicable.
Item 11. Controls and Procedures.
(a) The registrant’s principal executive officer and principal financial officer have concluded, based on their evaluation of the registrant’s disclosure controls and procedures as conducted within 90 days of the filing date of this report, that these disclosure controls and procedures are adequately designed and are operating effectively to ensure that information required to be disclosed by the registrant on Form N-CSR is recorded, processed, summarized and reported within the time periods specified in the Securities and Exchange Commission’s rules and forms.
(b)There were no changes in the registrant’s internal control over financial reporting (as defined in Rule 30a-3(d) under the Act
(17 CFR 270.30a-3(d)) that occurred during the second fiscal quarter of the period covered by this report that have materially affected or are reasonably likely to materially affect, the registrant’s internal control over financial reporting.
Item 12. Exhibits.
(a)(1) The code of ethics that is the subject of the disclosure required by Item 2 is attached hereto.
(a)(2) Certifications pursuant to Rule 30a-2(a) are attached hereto.
(a)(3) Not applicable.
(b) Certifications pursuant to Rule 30a-2(b) are furnished herewith.
SIGNATURES
Pursuant to the requirements of the Securities Exchange Act of 1934 and the Investment Company Act of 1940, the registrant has duly caused this report to be signed on its behalf by the undersigned, thereunto duly authorized.
(Registrant) | BB&T Variable Insurance Funds |
| ||||||
|
| |||||||
|
| |||||||
By (Signature and Title)* | /s/ Troy A. Sheets, Treasurer |
| ||||||
| Troy A. Sheets, Treasurer | |||||||
|
| |||||||
Date | March 8, 2006 |
| ||||||
Pursuant to the requirements of the Securities Exchange Act of 1934 and the Investment Company Act of 1940, this report has been signed below by the following persons on behalf of the registrant and in the capacities and on the dates indicated.
By (Signature and Title)* | /s/ Keith F. Karlawish, President | ||
| Keith F. Karlawish, President | ||
|
| ||
|
| ||
Date | March 8, 2006 |
| |
By (Signature and Title)* | s/ Troy A. Sheets, Treasurer |
| ||
| Troy A. Sheets, Treasurer | |||
|
| |||
|
| |||
Date | March 8, 2006 |
| ||
* Print the name and title of each signing officer under his or her signature.