UNITED STATES
SECURITIES AND EXCHANGE COMMISSION
Washington, D.C. 20549
FORM N-CSR
CERTIFIED SHAREHOLDER REPORT OF REGISTERED
MANAGEMENT INVESTMENT COMPANIES
Investment Company Act file number | 811-21682 | |||
|
|
| ||
BB&T Variable Insurance Funds | ||||
(Exact name of registrant as specified in charter) | ||||
|
|
| ||
434 Fayetteville Street, 5th Floor, Raleigh, NC |
| 27626-0575 | ||
(Address of principal executive offices) |
| (Zip code) | ||
|
|
| ||
BISYS Fund Services Ohio, Inc., 3435 Stelzer Road, Columbus, OH 43219 | ||||
(Name and address of agent for service) | ||||
|
|
| ||
Registrant’s telephone number, including area code: |
| (800) 228-1872 |
| |
Date of fiscal year end: | December 31 |
|
|
| |
Date of reporting period: | December 31, 2006 |
|
BB&T Variable Insurance Funds
Table of Contents
| Fund Summary | |||||||
| Large Cap VIF | 1 | ||||||
| Mid Cap Growth VIF | 2 | ||||||
| Large Cap Growth VIF | 3 | ||||||
| Capital Manager Equity VIF | 4 | ||||||
| Special Opportunities Equity VIF | 5 | ||||||
| Total Return Bond VIF | 6 | ||||||
| Summary of Portfolio Holdings | 7 | ||||||
| Expense Examples | 8 | ||||||
| Schedule of Portfolio Investments | |||||||
| Large Cap VIF | 9 | ||||||
| Mid Cap Growth VIF | 10 | ||||||
| Large Cap Growth VIF | 11 | ||||||
| Capital Manager Equity VIF | 12 | ||||||
| Special Opportunities Equity VIF | 13 | ||||||
| Total Return Bond VIF | 14 | ||||||
| Financial Statements | 17 | ||||||
| Notes to Financial Statements | 24 | ||||||
| Report of Independent Registered Public Accounting Firm | 31 | ||||||
| Other Information | 32 | ||||||
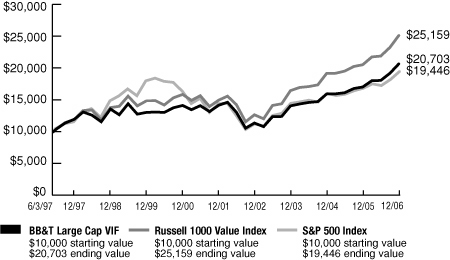
BB&T Large Cap VIF
Performance Overview 6/3/1997 - 12/31/2006
Growth of a $10,000 investment
Portfolio Manager
Ronald T. Rimkus
Director of Core Equity
BB&T Asset Management, Inc.
Average Annual Returns (Inception 6/3/1997)
| 1 Year | 5 Year | Since Inception | |||||||||||||
| BB&T Large Cap VIF | 21.28 | % | 7.83 | % | 7.89 | % | |||||||||
| Russell 1000 Value Index | 22.25 | % | 10.86 | % | 10.11 | % | |||||||||
| S&P 500 Index | 15.79 | % | 6.19 | % | 7.19 | % | |||||||||
The chart represents a comparison of a hypothetical $10,000 investment in the indicated Fund versus a similar investment in the Fund's benchmark, and includes the reinvestment of dividends and capital gains. (The returns include the Fund level expenses, but exclude the insurance charges). Past performance does not guarantee future results. The value of the contract will fluctuate so that when redeemed, it may be worth more or less than the original investment.
Investment Concerns
Equity securities (stocks) are more volatile and carry more risk than other forms of investments, including investments in high-grade fixed income securities. The net asset value per share of the Fund will fluctuate as the value of the securities in the portfolio changes. Common stocks, and funds investing in common stocks, generally provide greater return potential when compared with other types of investments. Value-based investments are subject to the risk that the broad market may not recognize their intrinsic value.
Q. How did the Portfolio perform during the 12-month period between January 1, 2006 and December 31, 2006?
A. The Portfolio gained 21.28%. That compared to a 15.79% return for its benchmark, the S&P 500 Index.1
Q. What factors affected the Portfolio's performance?
A. Stocks posted strong gains during 2006, helping the BB&T Large Cap VIF Portfolio generate a very good absolute return. Stocks in the consumer discretionary, energy and telecommunications sectors especially contributed to the Portfolio's gains.
The Portfolio substantially outperformed its benchmark index, largely on the strength of effective stock selection. Security selection boosted relative returns in eight of the ten economic sectors, and was particularly beneficial in the consumer discretionary, health care and financials sectors.
The Portfolio's sector weights also helped it to outperform its benchmark. In particular, overweight positions in the strong-performing energy and financials sectors and underweight stakes in lagging information technology and industrial stocks boosted relative returns.
Very few factors detracted from the Portfolio's return versus its benchmark index. Security selection in the materials and utilities sectors had very minor negative effects on relative returns. Likewise, particular stocks in the Internet auctions and insurance industries decreased the Portfolio's relative gain.
1 The Fund is measured against the S&P 500® Index, a widely recognized, unmanaged index of common stocks. This index is unmanaged and does not reflect the deduction of expenses associated with a mutual fund, such as investment management and fund accounting fees. The Fund's performance reflects the deduction of fees for these services. Investors cannot invest directly in an index, although they can invest in its underlying securities. The benchmark index for the Fund change from the Russell 1000® Value Index to the S&P 500® Index in order to provide a better comparison for the Fund's investment policies, as the market capitalization of companies within the S&P 500® Index are more closely aligned with the market capitalization of the companies in which the Fund invests.
Portfolio composition is as of December 31, 2006, and is subject to change.
A portion of the Fund's fees have been reduced. If fees had not been reduced, the Fund's total return for the period would have been lower.
1
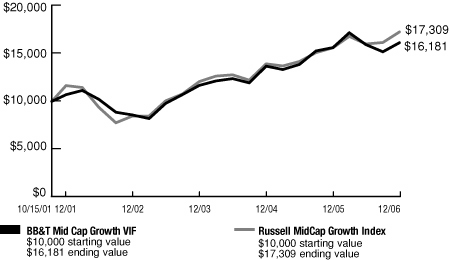
BB&T Mid Cap Growth VIF
Performance Overview 10/15/2001 - 12/31/2006
Growth of a $10,000 investment
Portfolio Manager
David P. Nolan
Senior Vice President and Portfolio Manager
BB&T Asset Management, Inc.
Average Annual Returns (Inception 10/15/2001)
| 1 Year | 5 Year | Since Inception | |||||||||||||
| BB&T Mid Cap Growth VIF | 3.26 | % | 8.62 | % | 9.68 | % | |||||||||
| Russell MidCap Growth Index | 10.66 | % | 8.22 | % | 11.12 | % | |||||||||
The chart represents a comparison of a hypothetical $10,000 investment in the indicated Fund versus a similar investment in the Fund's benchmark, and includes the reinvestment of dividends and capital gains. (The returns include the Fund level expenses, but exclude the insurance charges). Past performance does not guarantee future results. The value of the contract will fluctuate so that when redeemed, it may be worth more or less than the original investment.
Investment Concerns
Mid-capitalization funds typically carry additional risks since smaller companies generally have a higher risk of failure, and historically, their stocks have experienced a greater degree of market volatility than stocks on average.
Equity securities (stocks) are more volatile and carry more risk than other forms of investments, including investments in high-grade fixed income securities. The net asset value per share of the Fund will fluctuate as the value of the securities in the portfolio changes.
Q. How did the Portfolio perform during the 12-month period between January 1, 2006 and December 31, 2006?
A. The Portfolio gained 3.26%. That compared to a 10.66% return for its benchmark, the Russell Midcap Growth Index.1
Q. What factors affected the Portfolio's performance?
A. Mid-cap growth stocks generally produced solid gains for the year as a whole, helping this Portfolio generate a positive return. The types of fast-growing stocks in which this Portfolio invests surged at the beginning of the year, fell precipitously during spring and then posted modest gains during the remainder of the year.
This Portfolio attempts to invest in shares of firms that appear poised to generate stronger earnings growth than the average company represented in the benchmark. The Portfolio's returns relative to its index benefited from that strategy early in the period, as stocks characterized by high growth rates, price-to-earnings ratios and volatility led the market.
Such stocks subsequently declined sharply, however, causing the Portfolio to lag its benchmark during the period as a whole. For example, during the third quarter stocks with the slowest projected earnings-growth rates performed significantly better than stocks with projected growth rates of more than 20%. This Portfolio's holdings offered average annual earnings growth greater than 20%, so the market's shift toward slower-growth stocks weighed on relative returns.
That dynamic particularly hurt the Portfolio's relative performance in the information technology and consumer discretionary sectors. Security selection in those sectors was the primary reason that the Portfolio trailed its benchmark. Conversely, the manager's security selection in the energy sector boosted relative returns.
Positions in several strong-performing stocks also helped improve the Fund's performance. They included shares of a biotechnology company, a crane manufacturer, a semiconductor materials maker and an international telecommunications firm.
1 The Fund is measured against the Russell MidCap Growth Index, an unmanaged index which measures the performance of those securities in the Russell 1000 Index with higher price-to-book ratios and lower forecasted growth values. The index does not reflect the deduction of expenses associated with a mutual fund, such as investment management and fund accounting fees. The Fund's performance reflects the deduction of fees for these services. Investors cannot invest directly in an index, although they can invest in its underlying securities.
Portfolio composition is as of December 31, 2006, and is subject to change.
A portion of the Fund's fees have been reduced. If fees had not been reduced, the Fund's total return for the period would have been lower.
2
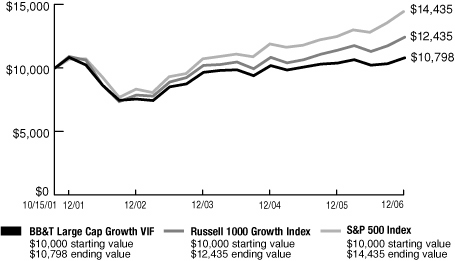
BB&T Large Cap Growth VIF
Performance Overview 10/15/2001 - 12/31/2006
Growth of a $10,000 investment
Portfolio Manager
David P. Nolan
Senior Vice President and Portfolio Manager
BB&T Asset Management, Inc.
Average Annual Returns (Inception 10/15/2001)
| 1 Year | 5 Year | Since Inception | |||||||||||||
| BB&T Large Cap Growth VIF | 4.09 | % | (0.06 | )% | 1.49 | % | |||||||||
| Russell 1000 Growth Index | 9.07 | % | 2.69 | % | 4.28 | % | |||||||||
| S&P 500 Index | 15.79 | % | 6.19 | % | 7.31 | % | |||||||||
The chart represents a comparison of a hypothetical $10,000 investment in the indicated Fund versus a similar investment in the Fund's benchmark, and includes the reinvestment of dividends and capital gains. (The returns include the Fund level expenses, but exclude the insurance charges). Past performance does not guarantee future results. The value of the contract will fluctuate so that when redeemed, it may be worth more or less than the original investment.
Investment Concerns
Equity securities (stocks) are more volatile and carry more risk than other forms of investments, including investments in high-grade fixed income securities. The net asset value per share of the Fund will fluctuate as the value of the securities in the portfolio changes.
Q. How did the Portfolio perform during the 12-month period between January 1, 2006 and December 31, 2006?
A. The Portfolio gained 4.09%. That compared to a 9.07% and 15.79%, respectively, return for its benchmarks, the Russell 1000 Growth Index and S&P 500 Index.1
Q. What factors affected the Portfolio's performance?
A. Large-cap growth stocks produced healthy gains for the year as a whole, helping this Portfolio generate a positive return. The types of fast-growing stocks in which this Portfolio seeks to invest rallied early in the year, but subsequently generated weak returns.
This Portfolio attempts to invest in shares of firms that appear poised to generate stronger earnings growth than the benchmark average. Such stocks typically carry relatively high price-to-earnings ratios, and tend to be more volatile than slower-growing stocks. Those types of stocks surged during the first four months of the year, boosting the Portfolio's returns relative to its index.
High-growth, high-volatility stocks declined sharply during spring, however, and then posted only modest returns during the remainder of the year. For example, shares of firms with projected earnings growth of 20% or more dramatically lagged slower-growth stocks during the third quarter. The Portfolio's investment approach focuses on those fast-growing stocks, so the shift in investor preference caused the Portfolio to lag its benchmark for the calendar year.
That dynamic especially weighed on the Portfolio's relative performance in the information technology sector. Security selection among technology stocks accounted for most of the discrepancy between the return of the Portfolio and that of its benchmark.
A number of strong-performing holdings did boost the Fund's performance. They included shares of a clothing retailer, a networking equipment firm, a large software company and a Mexican telecommunications provider.
1 The Fund is measured against the S&P 500® Index, a widely recognized, unmanaged index of common stocks. The index does not reflect the deduction of expenses associated with a mutual fund, such as investment management and fund accounting fees. The Fund's performance reflects the deduction of fees for these services. Investors cannot invest directly in an index, although they can invest in its underlying securities. The benchmark index for the Fund change from the Russell 1000® Value Index to the S&P 500® Index in order to provide a better comparison for the Fund's investment policies, as the market capitalization of companies within the S&P 500® Index are more closely aligned with the market capitalization of the companies in which the Fund invests.
Portfolio composition is as of December 31, 2006, and is subject to change.
A portion of the Fund's fees have been reduced. If fees had not been reduced, the Fund's total return for the period would have been lower.
3
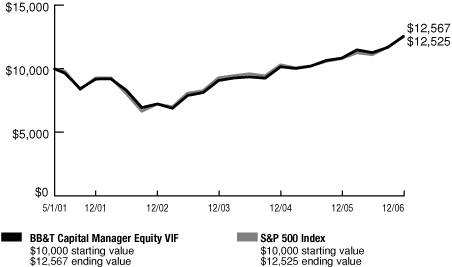
BB&T Capital Manager Equity VIF
Performance Overview 5/1/2001 - 12/31/2006
Growth of a $10,000 investment
Portfolio Management Team
Managed by the BB&T Balanced Portfolio Management Team
Average Annual Returns (Inception 5/1/2001)
| 1 Year | 5 Year | Since Inception | |||||||||||||
| BB&T Capital Manager Equity VIF | 15.82 | % | 6.46 | % | 4.11 | % | |||||||||
| S&P 500 Index | 15.79 | % | 6.19 | % | 4.05 | % | |||||||||
The chart represents a comparison of a hypothetical $10,000 investment in the indicated Fund versus a similar investment in the Fund's benchmark, and includes the reinvestment of dividends and capital gains. (The returns include the Fund level expenses, but exclude the insurance charges). Past performance does not guarantee future results. The value of the contract will fluctuate so that when redeemed, it may be worth more or less than the original investment.
Investment Concerns
Equity securities (stocks) are more volatile and carry more risk than other forms of investments, including investments in high-grade fixed income securities. The net asset value per share of the Fund will fluctuate as the value of the securities in the portfolio changes.
Q. How did the Portfolio perform during the 12-month period between January 1, 2006 and December 31, 2006?
A. The Portfolio gained 15.82%. That compared to a 15.79% return for its benchmark, the S&P 500 Index.1
Q. What factors affected the Portfolio's performance?
A. The stock market had a strong year as reasonable valuations, healthy earnings growth and relatively low interest rates attracted investors to equities. That environment helped the Portfolio generate a good absolute return.
The Portfolio produced a return that was in line with that of its benchmark. Small-cap stocks led the market, so the Portfolio's 8% allocation to small caps boosted performance against the large-cap index. Likewise, foreign shares generally outperformed the U.S. market by a healthy margin, so the Portfolio's 15% international allocation added to gains against the domestic benchmark.
An overweight allocation to value stocks also improved the Portfolio's relative return. Value stocks dramatically out-gained growth shares: The Russell 3000 Value Index, which tracks the return of value-oriented large-, mid- and small-cap stocks, gained 22.34% during 2006, while its growth-oriented counterpart, the Russell 3000 Growth Index, gained 9.46%. Finally, strong performance by the Portfolio's Large Cap sub-portfolio, which accounted for roughly half of assets, boosted relative returns as well.
The Portfolio's 12% allocation to mid-cap stocks weighed modestly on performance versus the benchmark, as medium-sized shares slightly trailed large caps. Its stake in the Large Cap Growth sub-portfolio also reduced relative gains, as that portfolio lagged its benchmark.
1 The Fund is measured against the S&P 500® Index, a widely recognized, unmanaged index of common stocks. The Index does not reflect the deduction of expenses associated with a mutual fund, such as investment management and fund accounting fees. The Fund's performance reflects the deduction of fees for these services. Investors cannot invest directly in an index, although they can invest in its underlying securities.
Portfolio composition is as of December 31, 2006, and is subject to change.
A portion of the Fund's fees have been reduced. If fees had not been reduced, the Fund's total return for the period would have been lower.
4
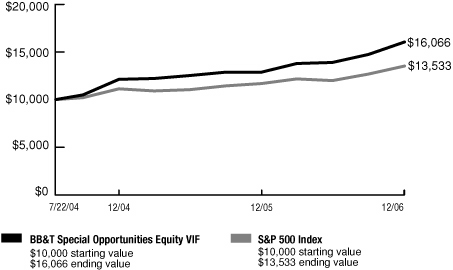
BB&T Special Opportunities Equity VIF
Performance Overview 7/22/04 - 12/31/06
Growth of a $10,000 investment
Portfolio Manager
George F. Shipp, CFA
Chief Investment Officer
Scott & Stringfellow, Inc.
Average Annual Returns (Inception 7/22/04)
| 1 Year | Since Inception | ||||||||||
| BB&T Special Opportunities Equity VIF | 24.71 | % | 21.41 | % | |||||||
| S&P 500 Index | 15.79 | % | 13.20 | % | |||||||
The chart represents a comparison of a hypothetical $10,000 investment in the indicated Fund versus a similar investment in the Fund's benchmark, and includes the reinvestment of dividends and capital gains. (The returns include the Fund level expenses, but exclude the insurance charges). Past performance does not guarantee future results. The value of the contract will fluctuate so that when redeemed, it may be worth more or less than the original investment.
Investment Concerns
Equity securities (stocks) are more volatile and carry more risk than other forms of investments, including investments in high-grade fixed income securities. The net asset value per share of this Fund will fluctuate as the value of the securities in the portfolio changes. A concentrated portfolio may add a measure of volatility to performance, as major fluctuations in any one holding will likely affect the Fund more than a fund with greater diversification.
Q. How did the Portfolio perform during the 12-month period between January 1, 2006 and December 31, 2006?
A. The Portfolio gained 24.71%. That compared to a 15.79% return for the S&P 500 Index.1
Q. What factors affected the Portfolio's performance?
A. Stock selection drove the Portfolio's strong returns. Gains were broad-based, rather than concentrated in a single industry sector. The Portfolio benefited from purchasing shares of two electronic banking companies during the summer, when uncertainty was high but valuations were attractive. One of the firms subsequently received a takeover offer at a sizable premium to its market value.
The sub-advisor's security selections in the health care sector also contributed to both absolute and relative gains, despite the fact that health care was the worst-performing of the ten major sectors in the S&P 500 Index. The sub-advisor's investments in stocks, in the hospital, medical laboratory, nursing care, medical products and health care technology industries generally posted solid returns.
Shares of the nation's largest cable company rallied throughout 2006, boosting the Portfolio's returns, as the firm benefited from strong demand for its television, voice and data offerings. Meanwhile, stock in a specialty insurer also surged.
A small handful of investments weighed on the Portfolio's returns against the benchmark. In particular, shares in a luxury homebuilder fell sharply as the negative effect of the deteriorating housing market out-weighed what the manager had viewed as a favorable valuation. A decline in a certain food stock also weighed on the Portfolio's returns.
1 The Fund is measured against the S&P 500® Index, a widely recognized, unmanaged index of common stocks. The Index does not reflect the deduction of expenses associated with a mutual fund, such as investment management and fund accounting fees. The Fund's performance reflects the deduction of fees for these services. Investors cannot invest directly in an index, although they can invest in its underlying securities.
Portfolio composition is as of December 31, 2006, and is subject to change.
5
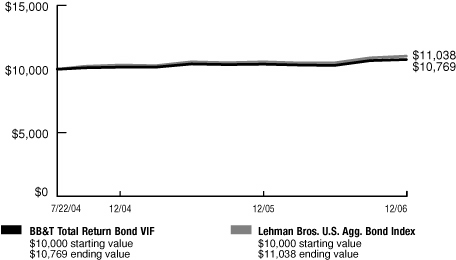
BB&T Total Return Bond VIF
Performance Overview 7/22/04 - 12/31/06
Growth of a $10,000 investment
Portfolio Manager
David M Ralston, CFA
Managing Director and Chief Investment Officer
Sterling Capital Management, LLC
Average Annual Returns (Inception 7/22/04)
| 1 Year | Since Inception | ||||||||||
| BB&T Total Return Bond VIF | 3.47 | % | 3.08 | % | |||||||
| Lehman Bros. U.S. Agg. Bond Index | 4.33 | % | 4.13 | % | |||||||
The chart represents a comparison of a hypothetical $10,000 investment in the indicated Fund versus a similar investment in the Fund's benchmark, and includes the reinvestment of dividends and capital gains. (The returns include the Fund level expenses, but exclude the insurance charges). Past performance does not guarantee future results. The value of the contract will fluctuate so that when redeemed, it may be worth more or less than the original investment.
Investment Concerns
Bonds offer a relatively stable level of income, although bond prices will fluctuate providing the potential for principal gain or loss. Intermediate-term, higher quality bonds generally offer less risk than longer-term bonds and a lower rate of return.
The Fund is subject to the risk that principal value reacts in opposition to the movement of interest rates and that a rising interest rate environment increases the risk of loss of principal.
Q. How did the Portfolio perform during the 12-month period between January 1, 2006 and December 31, 2006?
A. The Portfolio gained 3.47%. That compared to a 4.33% return for its benchmark, the Lehman Brothers U.S. Aggregate Bond Index.1
Q. What factors affected the Portfolio's performance?
A. In 2006 interest rates rose by approximately 0.35 to 0.40 percentage points on bonds across the yield curve. That trend reduced absolute returns, because most types of fixed-rate securities perform poorly while interest rates are rising. The Portfolio's positive return therefore came as a result of its high yield and the manager's proactive management of the fund.
The sub-advisor maintained a healthy exposure to floating rate securities, which reset their coupons based on the general level of interest rates. That position boosted performance relative to the benchmark, as those types of bonds generated solid returns as interest rates rose. The sub-advisor also held overweight stakes in relatively high-yielding mortgage and asset-backed securities, and those positions contributed to relative gains.
The Portfolio manager's duration2 strategy increased relative returns as well. The sub-advisor maintained a duration shorter than that of the benchmark during the first six months of the year. That strategy protected shareholders' principal as interest rates rose. Around mid-year, the manager lengthened the Portfolio's duration to slightly longer than that of the benchmark. Interest rates declined during the second half of 2006, so that approach also boosted relative returns.
A few factors did detract from performance relative to the benchmark index. The sub-advisor under-weighted corporate bonds during the first half of the year, but corporate securities generally outperformed government issues. Moreover, an overweight position in GNMA mortgages during the second quarter weighed on relative returns as well, as those securities trailed other mortgage sectors. Finally, the manager's individual security selection in the industrial credit and pass-through mortgage sectors detracted from relative performance.
1 The Fund is measured against Lehman Brothers U.S. Aggregate Bond Index which is a market value-weighted performance benchmark for investment-grade fixed-rate debt issues, including government, corporate, asset-backed and mortgage-backed securities, with maturities of at least one year. The index is unmanaged and does not reflect the deduction of expenses associated with a mutual fund, such as investment management and fund accounting fees. The Fund's performance reflects the deduction of fees for these services. Investors cannot invest directly in an index, although they can invest in its underlying securities.
2 Duration is a measure of a bond's or a bond fund's price risk that is adjusted for any optionality.
Portfolio composition is as of December 31, 2006 and is subject to change.
A portion of the Fund's fees have been reduced. If fees had not been reduced, the Fund's total return for the period would have been lower.
6
BB&T Variable Insurance Funds
Summary of Portfolio Holdings
December 31, 2006 (Unaudited)
The BB&T Variable Insurance Funds invested, as a percentage of net assets, in the following industry sectors, countries, states, funds or security types, as of December 31, 2006:
| BB&T Large Cap VIF | Percentage of net assets | ||||||
| Consumer Discretionary | 14.9 | % | |||||
| Consumer Staples | 5.5 | ||||||
| Energy | 11.3 | ||||||
| Financials | 21.9 | ||||||
| Health Care | 17.9 | ||||||
| Industrials | 2.1 | ||||||
| Information Technology | 15.8 | ||||||
| Materials | 4.0 | ||||||
| Repurchase Agreements | 2.6 | ||||||
| Telecommunication Services | 2.2 | ||||||
| Utilities | 1.8 | ||||||
| 100.0 | % | ||||||
| BB&T Mid Cap Growth VIF | |||||||
| Consumer Discretionary | 17.7 | % | |||||
| Consumer Staples | 3.1 | ||||||
| Energy | 6.5 | ||||||
| Exchange Traded Funds | 4.0 | ||||||
| Financials | 12.6 | ||||||
| Health Care | 7.7 | ||||||
| Industrials | 11.8 | ||||||
| Information Technology | 24.1 | ||||||
| Materials | 2.7 | ||||||
| Repurchase Agreements | 4.9 | ||||||
| Telecommunication Services | 3.1 | ||||||
| Utilities | 1.7 | ||||||
| 99.9 | % | ||||||
| BB&T Large Cap Growth VIF | |||||||
| Consumer Discretionary | 17.5 | % | |||||
| Consumer Staples | 3.3 | ||||||
| Energy | 7.5 | ||||||
| Exchange Traded Funds | 10.1 | ||||||
| Financials | 12.0 | ||||||
| Health Care | 6.5 | ||||||
| Industrials | 9.3 | ||||||
| Information Technology | 23.2 | ||||||
| Repurchase Agreements | 6.4 | ||||||
| Telecommunication Services | 6.6 | ||||||
| 102.4 | % | ||||||
| BB&T Capital Manager Equity VIF | |||||||
| Equity Index | 12.5 | % | |||||
| International Equity | 14.5 | ||||||
| Large Cap | 50.1 | ||||||
| Mid Cap Growth | 4.5 | ||||||
| Mid Cap Value | 6.9 | ||||||
| Small Cap | 7.3 | ||||||
| U.S. Treasury Money Market | 4.1 | ||||||
| 99.9 | % | ||||||
| BB&T Special Opportunities Equity VIF | |||||||
| Consumer Discretionary | 13.6 | % | |||||
| Consumer Staples | 3.7 | ||||||
| Energy | 13.2 | ||||||
| Financials | 4.9 | ||||||
| Health Care | 18.5 | ||||||
| Industrials | 12.2 | ||||||
| Information Technology | 21.0 | ||||||
| Option Contracts | 0.0 | ||||||
| Paper and Related Products | 3.2 | ||||||
| Repurchase Agreements | 9.1 | ||||||
| Telecommunication Services | 3.8 | ||||||
| 103.2 | % | ||||||
| BB&T Total Return Bond VIF | |||||||
| Corporate Bonds | 38.5 | % | |||||
| Federal Home Loan Bank | 1.8 | ||||||
| Federal Home Loan Mortgage Corp.—Mortgage-Backed Securities | 10.6 | ||||||
| Federal Home Loan Mortgage Corp.—U.S. Government Agencies | 4.5 | ||||||
| Federal National Mortgage Assoc.—Mortgage-Backed Securities | 15.1 | ||||||
| Federal National Mortgage Assoc.—U.S. Government Agencies | 4.4 | ||||||
| Government National Mortgage Assoc. | 4.3 | ||||||
| Municipal | 3.8 | ||||||
| Repurchase Agreements | 5.6 | ||||||
| U.S. Treasury Bonds | 15.1 | ||||||
| U.S. Treasury Notes | 2.2 | ||||||
| 105.9 | % | ||||||
7
BB&T Variable Insurance Funds
Expense Examples
December 31, 2006 (Unaudited)
As a shareholder of the BB&T Variable Insurance Funds (the "Funds"), you incur two types of costs: (1) transaction costs, and (2) ongoing costs, including management fees and other Fund expenses.
These examples are intended to help you understand your ongoing costs (in dollars) of investing in the Funds and to compare these costs with the ongoing costs of investing in other mutual funds.
These examples are based on an investment of $1,000 invested at the beginning of the period and held for the entire period from July 1, 2006 through December 31, 2006.
Actual Example
The table below provides information about actual account values and actual expenses. You may use the information below, together with the amount you invested, to estimate the expenses that you paid over the period. Simply divide your account value by $1,000 (for example, an $8,600 account value divided by $1,000 = 8.6), then multiply the result by the number in the table under the heading entitled "Expenses Paid During Period" to estimate the expenses you paid on your account during this period.
| Beginning Account Value 7/1/06 | Ending Account Value 12/31/06 | Expenses Paid During Period* 7/1/06 – 12/31/06 | Annualized Expense Ratio During Period 7/1/06 – 12/31/06 | ||||||||||||||||
| BB&T Large Cap VIF | $ | 1,000.00 | $ | 1,144.00 | $ | 4.32 | 0.80 | % | |||||||||||
| BB&T Mid Cap Growth VIF | 1,000.00 | 1,013.10 | 4.01 | 0.79 | % | ||||||||||||||
| BB&T Large Cap Growth VIF | 1,000.00 | 1,058.20 | 4.15 | 0.80 | % | ||||||||||||||
| BB&T Capital Manager Equity VIF | 1,000.00 | 1,113.40 | 0.96 | 0.18 | % | ||||||||||||||
| BB&T Special Opportunities Equity VIF | 1,000.00 | 1,154.60 | 5.81 | 1.07 | % | ||||||||||||||
| BB&T Total Return Bond VIF | 1,000.00 | 1,044.80 | 3.92 | 0.76 | % | ||||||||||||||
* Expenses are equal to the average account value times the Fund's annualized ratio multiplied by the number of days in the most recent fiscal half-year divided by the number of days in the fiscal year (to reflect the one-half year period).
Hypothetical Example for Comparison Purposes
The table below provides information about hypothetical account values and hypothetical expenses based on each Funds' actual expense ratio and an assumed rate of return of 5% per year before expenses, which is not the Fund's actual return. The hypothetical account values and expenses may not be used to estimate the actual ending account balance or expenses you paid for the period. You may use this information to compare this 5% hypothetical example with the 5% hypothetical examples that appear in the shareholder reports of other funds.
Please note that the expenses shown in the table are meant to highlight your ongoing costs only and do not reflect any transactional costs. Therefore, the table is useful in comparing ongoing costs only, and will not help you determine the relative total costs of owning different funds. In addition, if these transactional costs were included, your costs would have been higher.
| Beginning Account Value 7/1/06 | Ending Account Value 12/31/06 | Expenses Paid During Period* 7/1/06 – 12/31/06 | Annualized Expense Ratio During Period 7/1/06 – 12/31/06 | ||||||||||||||||
| BB&T Large Cap VIF | $ | 1,000.00 | $ | 1,021.17 | $ | 4.08 | 0.80 | % | |||||||||||
| BB&T Mid Cap Growth VIF | 1,000.00 | 1,021.22 | 4.02 | 0.79 | % | ||||||||||||||
| BB&T Large Cap Growth VIF | 1,000.00 | 1,021.17 | 4.08 | 0.80 | % | ||||||||||||||
| BB&T Capital Manager Equity VIF | 1,000.00 | 1,024.30 | 0.92 | 0.18 | % | ||||||||||||||
| BB&T Special Opportunities Equity VIF | 1,000.00 | 1,019.81 | 5.45 | 1.07 | % | ||||||||||||||
| BB&T Total Return Bond VIF | 1,000.00 | 1,021.37 | 3.87 | 0.76 | % | ||||||||||||||
* Expenses are equal to the average account value times the Fund's annualized ratio multiplied by the number of days in the most recent fiscal half-year divided by the number of days in the fiscal year (to reflect the one-half year period).
8
BB&T Large Cap VIF
Schedule of Portfolio Investments
December 31, 2006
| Shares | Fair Value | ||||||||||
| COMMON STOCKS (97.4%) | |||||||||||
| Consumer Discretionary (14.9%) | |||||||||||
| 69,859 | eBay, Inc. (a) | $ | 2,100,660 | ||||||||
| 71,753 | Home Depot, Inc. (The) | 2,881,601 | |||||||||
| 2,702 | Idearc, Inc. (a) | 77,412 | |||||||||
| 54,982 | Mattel, Inc. | 1,245,892 | |||||||||
| 21,207 | Target Corp. | 1,209,859 | |||||||||
| 89,568 | Tiffany & Co. | 3,514,649 | |||||||||
| 82,305 | Walt Disney Co. (The) | 2,820,592 | |||||||||
| 13,850,665 | |||||||||||
| Consumer Staples (5.5%) | |||||||||||
| 17,510 | Altria Group, Inc. | 1,502,708 | |||||||||
| 34,996 | Kimberly-Clark Corp. | 2,377,978 | |||||||||
| 71,854 | Sara Lee Corp. | 1,223,674 | |||||||||
| 5,104,360 | |||||||||||
| Energy (11.3%) | |||||||||||
| 27,668 | Anadarko Petroleum Corp. | 1,204,111 | |||||||||
| 41,355 | Chevron Corp. | 3,040,833 | |||||||||
| 33,487 | ConocoPhillips | 2,409,390 | |||||||||
| 30,604 | Duke Energy Corp. | 1,016,359 | |||||||||
| 36,660 | Exxon Mobil Corp. | 2,809,256 | |||||||||
| 10,479,949 | |||||||||||
| Financials (21.9%) | |||||||||||
| 11,793 | Ambac Financial Group, Inc. | 1,050,403 | |||||||||
| 22,963 | American International Group, Inc. | 1,645,529 | |||||||||
| 31,588 | Bank of New York Co., Inc. (The) | 1,243,620 | |||||||||
| 51,260 | CitiGroup, Inc. | 2,855,182 | |||||||||
| 26,044 | Fannie Mae | 1,546,753 | |||||||||
| 64,204 | JPMorgan Chase & Co. | 3,101,053 | |||||||||
| 24,002 | Merrill Lynch & Co., Inc. | 2,234,586 | |||||||||
| 32,523 | Northern Trust Corp. | 1,973,821 | |||||||||
| 37,771 | St. Paul Travelers Cos., Inc. (The) | 2,027,925 | |||||||||
| 40,206 | Washington Mutual, Inc. | 1,828,971 | |||||||||
| 27,529 | Wells Fargo & Co. | 978,931 | |||||||||
| 20,486,774 | |||||||||||
| Health Care (17.9%) | |||||||||||
| 39,888 | Amgen, Inc. (a) | 2,724,749 | |||||||||
| 44,703 | Eli Lilly & Co. | 2,329,026 | |||||||||
| 36,682 | Johnson & Johnson | 2,421,746 | |||||||||
| 56,696 | Medtronic, Inc. | 3,033,803 | |||||||||
| 64,071 | Merck & Co., Inc. | 2,793,496 | |||||||||
| 92,970 | Pfizer, Inc. | 2,407,923 | |||||||||
| 18,184 | Wyeth | 925,929 | |||||||||
| 16,636,672 | |||||||||||
| Shares or Principal Amount | Fair Value | ||||||||||
| COMMON STOCKS — (continued) | |||||||||||
| Industrials (2.1%) | |||||||||||
| 10,560 | Emerson Electric Co. | $ | 465,379 | ||||||||
| 13,264 | General Electric Co. | 493,553 | |||||||||
| 22,132 | Pitney Bowes, Inc. | 1,022,278 | |||||||||
| 1,981,210 | |||||||||||
| Information Technology (15.8%) | |||||||||||
| 18,065 | Automatic Data Processing, Inc. | 889,701 | |||||||||
| 133,082 | Cisco Systems, Inc. (a) | 3,637,131 | |||||||||
| 107,389 | Dell, Inc. (a) | 2,694,390 | |||||||||
| 178,276 | Intel Corp. | 3,610,089 | |||||||||
| 69,601 | Nokia Corp. ADR | 1,414,292 | |||||||||
| 30,653 | Microsoft Corp. | 915,299 | |||||||||
| 71,396 | Time Warner, Inc. | 1,555,005 | |||||||||
| 14,715,907 | |||||||||||
| Materials (4.0%) | |||||||||||
| 15,794 | Air Products & Chemicals, Inc. | 1,110,002 | |||||||||
| 31,916 | Alcoa, Inc. | 957,799 | |||||||||
| 23,609 | Weyerhaeuser Co. | 1,667,976 | |||||||||
| 3,735,777 | |||||||||||
| Telecommunication Services (2.2%) | |||||||||||
| 54,058 | Verizon Communications, Inc. | 2,013,120 | |||||||||
| Utilities (1.8%) | |||||||||||
| 68,063 | NiSource, Inc. | 1,640,318 | |||||||||
| Total Common Stocks (Cost $69,663,416) | 90,644,752 | ||||||||||
| REPURCHASE AGREEMENT (2.6%) | |||||||||||
| $ | 2,453,196 | U.S. Bank N.A., 5.05%, dated 12/29/06, maturing 1/3/07, with a maturity value of $2,454,917 (Collateralized fully by U.S. Government Agencies) | 2,453,196 | ||||||||
| Total Repurchase Agreement (Cost $2,453,196) | 2,453,196 | ||||||||||
| Total Investments (Cost $72,116,612) — 100.0% | 93,097,948 | ||||||||||
| Net Other Assets (Liabilities) — 0.0% | 44,716 | ||||||||||
| NET ASSETS — 100.0% | $ | 93,142,664 | |||||||||
See notes to the Schedules of Portfolio Investments.
See accompanying notes to the financial statements.
9
BB&T Mid Cap Growth VIF
Schedule of Portfolio Investments
December 31, 2006
| Shares | Fair Value | ||||||||||
| COMMON STOCKS (91.0%) | |||||||||||
| Consumer Discretionary (17.7%) | |||||||||||
| 5,625 | Children's Place Retail Stores, Inc. (The) (a) | $ | 357,300 | ||||||||
| 9,100 | Coach, Inc. (a) | 390,936 | |||||||||
| 9,375 | Crocs, Inc. (a) | 405,000 | |||||||||
| 5,625 | Focus Media Holding, Ltd. ADR (a) | 373,444 | |||||||||
| 10,425 | GameStop Corp., Class A (a) | 574,521 | |||||||||
| 8,525 | Guess?, Inc. (a) | 540,741 | |||||||||
| 2,525 | Harman International Industries, Inc. | 252,273 | |||||||||
| 16,375 | Hilton Hotels Corp. | 571,487 | |||||||||
| 4,025 | Nutri/System, Inc. (a) | 255,145 | |||||||||
| 13,125 | NVIDIA Corp. (a) | 485,756 | |||||||||
| 8,275 | Tween Brands, Inc. (a) | 330,421 | |||||||||
| 4,537,024 | |||||||||||
| Consumer Staples (3.1%) | |||||||||||
| 6,575 | Chipotle Mexican Grill, Inc., Class A (a) | 374,775 | |||||||||
| 12,200 | Corn Products International, Inc. | 421,388 | |||||||||
| 796,163 | |||||||||||
| Energy (6.5%) | |||||||||||
| 9,990 | Cameron International Corp. (a) | 529,969 | |||||||||
| 5,825 | Core Laboratories N.V. (a) | 471,825 | |||||||||
| 7,500 | SunPower Corp., Class A (a) | 278,775 | |||||||||
| 7,875 | XTO Energy, Inc. | 370,519 | |||||||||
| 1,651,088 | |||||||||||
| Financials (12.6%) | |||||||||||
| 3,950 | Affiliated Managers Group, Inc. (a) | 415,264 | |||||||||
| 10,425 | AllianceBernstein Holding L.P. | 838,169 | |||||||||
| 12,300 | Amvescap PLC ADR | 303,195 | |||||||||
| 2,300 | Bear Stearns Cos., Inc. (The) | 374,394 | |||||||||
| 9,200 | Cash America International, Inc. | 431,480 | |||||||||
| 790 | Chicago Mercantile Exchange Holdings, Inc. | 402,703 | |||||||||
| 4,125 | IntercontinentalExchange Inc. (a) | 445,088 | |||||||||
| 3,210,293 | |||||||||||
| Health Care (7.7%) | |||||||||||
| 10,025 | Celgene Corp. (a) | 576,738 | |||||||||
| 10,000 | Psychiatric Solutions, Inc. (a) | 375,200 | |||||||||
| 6,825 | ResMed, Inc. (a) | 335,927 | |||||||||
| 7,500 | Respironics, Inc. (a) | 283,125 | |||||||||
| 5,550 | WellCare Health Plans, Inc. (a) | 382,395 | |||||||||
| 1,953,385 | |||||||||||
| Industrials (11.8%) | |||||||||||
| 20,275 | Acergy SA, ADR (a) | 390,497 | |||||||||
| 8,625 | Corrections Corporation of America (a) | 390,109 | |||||||||
| 8,775 | Manitowoc Co., Inc. (The) | 521,498 | |||||||||
| 7,700 | McDermott International, Inc. (a) | 391,622 | |||||||||
| 6,100 | Precision Castparts Corp. | 477,508 | |||||||||
| 17,825 | QLogic Corp. (a) | 390,724 | |||||||||
| 6,950 | Terex Corp. (a) | 448,831 | |||||||||
| 3,010,789 | |||||||||||
| Shares or Principal Amount | Fair Value | ||||||||||
| COMMON STOCKS — (continued) | |||||||||||
| Information Technology (24.1%) | |||||||||||
| 26,575 | Activision, Inc. (a) | $ | 458,152 | ||||||||
| 4,875 | Akamai Technologies, Inc. (a) | 258,960 | |||||||||
| 7,125 | Amdocs, Ltd. (a) | 276,094 | |||||||||
| 6,000 | Amphenol Corp., Class A | 372,480 | |||||||||
| 8,450 | Cerner Corp. (a) | 384,475 | |||||||||
| 4,975 | Cognizant Technology Solutions Corp., Class A (a) | 383,871 | |||||||||
| 6,850 | Digital River, Inc. (a) | 382,162 | |||||||||
| 8,675 | MEMC Electronic Materials, Inc. (a) | 339,540 | |||||||||
| 8,000 | MICROS Systems, Inc. (a) | 421,600 | |||||||||
| 10,000 | Network Appliance, Inc. (a) | 392,800 | |||||||||
| 14,250 | Polycom, Inc. (a) | 440,467 | |||||||||
| 12,950 | Riverbed Technology, Inc. (a) | 397,565 | |||||||||
| 9,200 | THQ Inc. (a) | 299,184 | |||||||||
| 21,300 | Time Warner Telecom, Inc. (a) | 424,509 | |||||||||
| 10,925 | Varian Semiconductor Equipment Associates, Inc. (a) | 497,305 | |||||||||
| 11,250 | Verifone Holdings, Inc. (a) | 398,250 | |||||||||
| 6,127,414 | |||||||||||
| Materials (2.7%) | |||||||||||
| 8,000 | Airgas, Inc. | 324,160 | |||||||||
| 12,200 | Titanium Metals Corp. (a) | 360,022 | |||||||||
| 684,182 | |||||||||||
| Telecommunication Services (3.1%) | |||||||||||
| 10,700 | American Tower Corp., Class A (a) | 398,896 | |||||||||
| 6,025 | NII Holdings, Inc. (a) | 388,251 | |||||||||
| 787,147 | |||||||||||
| Utilities (1.7%) | |||||||||||
| 9,200 | Allegheny Energy, Inc. (a) | 422,372 | |||||||||
| Total Common Stocks (Cost $18,759,217) | 23,179,857 | ||||||||||
| EXCHANGE TRADED FUNDS (4.0%) | |||||||||||
| 9,800 | iShares Russell Midcap Growth Index Fund | 1,010,086 | |||||||||
| Total Exchange Traded Funds (Cost $1,020,589) | 1,010,086 | ||||||||||
| REPURCHASE AGREEMENT (4.9%) | |||||||||||
| $ | 1,249,850 | U.S. Bank N.A., 5.05%, dated 12/29/06, maturing 1/3/07, with a maturity value of $1,250,727 (Collateralized fully by U.S. Government Agencies) | 1,249,850 | ||||||||
| Total Repurchase Agreement (Cost $1,249,850) | 1,249,850 | ||||||||||
| Total Investments (Cost $21,029,656) — 99.9% | 25,439,793 | ||||||||||
| Net Other Assets (Liabilities) — 0.1% | 20,408 | ||||||||||
| NET ASSETS — 100.0% | $ | 25,460,201 | |||||||||
See notes to the Schedules of Portfolio Investments.
See accompanying notes to the financial statements.
10
BB&T Large Cap Growth VIF
Schedule of Portfolio Investments
December 31, 2006
| Shares | Fair Value | ||||||||||
| COMMON STOCKS (85.9%) | |||||||||||
| Consumer Discretionary (17.5%) | |||||||||||
| 4,275 | American Eagle Outfitters, Inc. | $ | 133,423 | ||||||||
| 3,975 | Coach, Inc. (a) | 170,766 | |||||||||
| 5,550 | Comcast Corp., Class A (a) | 234,932 | |||||||||
| 3,550 | Federated Department Stores, Inc. | 135,362 | |||||||||
| 1,550 | Fomento Economico Mexicano SP, ADR | 179,428 | |||||||||
| 3,675 | GameStop Corp., Class A (a) | 202,529 | |||||||||
| 6,300 | Hilton Hotels Corp. | 219,870 | |||||||||
| 2,125 | J. C. Penney Co., Inc. | 164,390 | |||||||||
| 4,100 | McDonald's Corp. | 181,753 | |||||||||
| 6,100 | News Corp., Class B | 135,786 | |||||||||
| 6,675 | NVIDIA Corp. (a) | 247,041 | |||||||||
| 2,150 | Polo Ralph Lauren Corp. | 166,969 | |||||||||
| 4,750 | Starbucks Corp. (a) | 168,245 | |||||||||
| 2,340,494 | |||||||||||
| Consumer Staples (3.3%) | |||||||||||
| 4,850 | Hansen Natural Corp. (a) | 163,348 | |||||||||
| 2,150 | PepsiCo, Inc. | 134,483 | |||||||||
| 2,200 | Procter & Gamble Co. (The) | 141,394 | |||||||||
| 439,225 | |||||||||||
| Energy (7.5%) | |||||||||||
| 2,825 | Anadarko Petroleum Corp. | 122,944 | |||||||||
| 1,850 | Devon Energy Corp. | 124,098 | |||||||||
| 2,050 | FPL Group, Inc. | 111,561 | |||||||||
| 1,850 | Marathon Oil Corp. | 171,125 | |||||||||
| 3,350 | Oceaneering International, Inc. (a) | 132,995 | |||||||||
| 3,150 | Schlumberger, Ltd. | 198,954 | |||||||||
| 1,775 | Transocean, Inc. (a) | 143,580 | |||||||||
| 1,005,257 | |||||||||||
| Financials (12.0%) | |||||||||||
| 1,975 | Affiliated Managers Group, Inc. (a) | 207,632 | |||||||||
| 2,175 | American International Group, Inc. | 155,861 | |||||||||
| 1,275 | Bear Stearns Cos., Inc. (The) | 207,545 | |||||||||
| 11,000 | Charles Schwab Corp. (The) | 212,740 | |||||||||
| 325 | Chicago Mercantile Exchange Holdings, Inc. | 165,669 | |||||||||
| 1,150 | Goldman Sachs Group, Inc. (The) | 229,252 | |||||||||
| 4,100 | JPMorgan Chase & Co. | 198,030 | |||||||||
| 2,500 | Merrill Lynch & Co., Inc. | 232,749 | |||||||||
| 1,609,478 | |||||||||||
| Health Care (6.5%) | |||||||||||
| 3,725 | Celgene Corp. (a) | 214,299 | |||||||||
| 2,100 | Gilead Sciences, Inc. (a) | 136,353 | |||||||||
| 3,475 | Novartis AG, ADR | 199,604 | |||||||||
| 6,000 | Schering-Plough Corp. | 141,840 | |||||||||
| 2,400 | Stericycle, Inc. (a) | 181,200 | |||||||||
| 873,296 | |||||||||||
| Shares or Principal Amount | Fair Value | ||||||||||
| COMMON STOCKS — (continued) | |||||||||||
| Industrials (9.3%) | |||||||||||
| 3,004 | Danaher Corp. | $ | 217,610 | ||||||||
| 1,368 | FedEx Corp. | 148,592 | |||||||||
| 3,825 | General Electric Co. | 142,328 | |||||||||
| 3,850 | McDermott International, Inc. (a) | 195,811 | |||||||||
| 4,300 | Monster Worldwide, Inc. (a) | 200,552 | |||||||||
| 2,150 | Precision Castparts Corp. | 168,302 | |||||||||
| 3,600 | Thermo Fisher Scientific, Inc. (a) | 163,044 | |||||||||
| 1,236,239 | |||||||||||
| Information Technology (23.2%) | |||||||||||
| 3,825 | Agilent Technologies, Inc. (a) | 133,301 | |||||||||
| 5,000 | Akamai Technologies, Inc. (a) | 265,600 | |||||||||
| 3,200 | Amphenol Corp., Class A | 198,656 | |||||||||
| 4,000 | Cerner Corp. (a) | 182,000 | |||||||||
| 10,900 | Cisco Systems, Inc. (a) | 297,896 | |||||||||
| 2,600 | Cognizant Technology Solutions Corp., Class A (a) | 200,616 | |||||||||
| 470 | Google, Inc. (a) | 216,426 | |||||||||
| 7,125 | Hewlett-Packard Co. | 293,479 | |||||||||
| 2,150 | IBM Corp. | 208,873 | |||||||||
| 9,250 | Intel Corp. | 187,313 | |||||||||
| 3,900 | MEMC Electronic Materials, Inc. (a) | 152,646 | |||||||||
| 11,500 | Microsoft Corp. | 343,389 | |||||||||
| 5,150 | Network Appliance, Inc. (a) | 202,292 | |||||||||
| 11,900 | Oracle Corp. (a) | 203,966 | |||||||||
| 3,086,453 | |||||||||||
| Telecommunication Services (6.6%) | |||||||||||
| 6,100 | America Movil SA de CV, Series L, ADR | 275,842 | |||||||||
| 5,650 | American Tower Corp., Class A (a) | 210,632 | |||||||||
| 5,200 | AT&T, Inc. | 185,900 | |||||||||
| 3,175 | NII Holdings, Inc. (a) | 204,597 | |||||||||
| 876,971 | |||||||||||
| Total Common Stocks (Cost $9,687,002) | 11,467,413 | ||||||||||
| EXCHANGE TRADED FUNDS (10.1%) | |||||||||||
| 15,000 | iShares Russell 1000 Growth Index Fund | 825,000 | |||||||||
| 6,900 | iShares Russell 1000 Index Fund | 529,851 | |||||||||
| Total Exchange Traded Funds (Cost $1,364,049) | 1,354,851 | ||||||||||
| REPURCHASE AGREEMENT (6.4%) | |||||||||||
| $ | 858,351 | U.S. Bank N.A., 5.05%, dated 12/29/06, maturing 1/3/07, with a maturity value of $858,953 (Collateralized fully by U.S. Government Agencies) | 858,351 | ||||||||
| Total Repurchase Agreement (Cost $858,351) | 858,351 | ||||||||||
| Total Investments (Cost $11,909,402) — 102.4% | 13,680,615 | ||||||||||
| Net Other Assets (Liabilities) — (2.4)% | (322,497 | ) | |||||||||
| NET ASSETS — 100.0% | $ | 13,358,118 | |||||||||
See notes to the Schedules of Portfolio Investments.
See accompanying notes to the financial statements.
11
BB&T Capital Manager Equity VIF
Schedule of Portfolio Investments
December 31, 2006
| Shares | Fair Value | ||||||||||
| Affiliated Investment Companies (99.9%) | |||||||||||
| 239,957 | BB&T Equity Index Fund, Class A | $ | 2,284,387 | ||||||||
| 215,223 | BB&T International Equity Fund, Institutional Class | 2,636,477 | |||||||||
| 494,377 | BB&T Large Cap Fund, Institutional Class | 9,145,970 | |||||||||
| 66,265 | BB&T Mid Cap Growth Fund, Institutional Class | 813,070 | |||||||||
| 89,466 | BB&T Mid Cap Value Fund, Institutional Class | 1,248,942 | |||||||||
| 86,617 | BB&T Small Cap Fund, Institutional Class | 1,334,765 | |||||||||
| 746,553 | BB&T U.S. Treasury Money Market Fund, Institutional Class | 746,553 | |||||||||
| Total Affiliated Investment Companies (Cost $16,277,287) | 18,210,164 | ||||||||||
| Total Investments (Cost $16,277,287) — 99.9% | 18,210,164 | ||||||||||
| Net Other Assets (Liabilities) — 0.1% | 12,283 | ||||||||||
| NET ASSETS — 100.0% | $ | 18,222,447 | |||||||||
See notes to the Schedules of Portfolio Investments.
See accompanying notes to the financial statements.
12
BB&T Special Opportunities Equity VIF
Schedule of Portfolio Investments
December 31, 2006
| Shares | Fair Value | ||||||||||
| COMMON STOCKS (94.1%) | |||||||||||
| Consumer Discretionary (13.6%) | |||||||||||
| 18,600 | Comcast Corp., Class A (a) | $ | 787,338 | ||||||||
| 7,000 | Costco Wholesale Corp. | 370,090 | |||||||||
| 11,615 | Laureate Education, Inc. (a) | 564,837 | |||||||||
| 28,800 | News Corp., Class A | 618,624 | |||||||||
| 9,600 | YUM! Brands, Inc. | 564,480 | |||||||||
| 2,905,369 | |||||||||||
| Consumer Staples (3.7%) | |||||||||||
| 30,490 | Smithfield Foods, Inc. (a) | 782,373 | |||||||||
| Energy (13.2%) | |||||||||||
| 10,100 | Apache Corp. | 671,751 | |||||||||
| 20,000 | CONSOL Energy, Inc. | 642,600 | |||||||||
| 10,600 | Noble Corp. | 807,190 | |||||||||
| 16,600 | Weatherford International, Ltd. (a) | 693,714 | |||||||||
| 2,815,255 | |||||||||||
| Financials (4.9%) | |||||||||||
| 1,100 | Markel Corp. (a) | 528,110 | |||||||||
| 14,300 | Wells Fargo & Co. | 508,508 | |||||||||
| 1,036,618 | |||||||||||
| Health Care (18.5%) | |||||||||||
| 6,300 | Amgen, Inc. (a) | 430,353 | |||||||||
| 6,050 | Bard (C.R.), Inc. | 501,969 | |||||||||
| 7,600 | Coventry Health Care, Inc. (a) | 380,380 | |||||||||
| 16,500 | McKesson Corp. | 836,550 | |||||||||
| 10,200 | MedCath Corp. (a) | 279,072 | |||||||||
| 27,000 | Teva Pharmaceutical Industries, Ltd. SP, ADR | 839,160 | |||||||||
| 12,500 | UnitedHealth Group, Inc. | 671,625 | |||||||||
| 3,939,109 | |||||||||||
| Shares or Principal Amount | Fair Value | ||||||||||
| COMMON STOCKS — (continued) | |||||||||||
| Industrials (12.2%) | |||||||||||
| 17,400 | Dow Chemical Co. (The) | $ | 694,956 | ||||||||
| 25,000 | J.B. Hunt Transport Services, Inc. | 519,250 | |||||||||
| 8,000 | L-3 Communications Holdings, Inc. | 654,240 | |||||||||
| 35,930 | Nalco Holdings Co. (a) | 735,128 | |||||||||
| 2,603,574 | |||||||||||
| Information Technology (21.0%) | |||||||||||
| 21,600 | Activision, Inc. (a) | 372,384 | |||||||||
| 98,868 | ARM Holdings PLC, ADR | 721,736 | |||||||||
| 15,600 | Checkfree Corp. (a) | 626,496 | |||||||||
| 41,000 | Corning, Inc. (a) | 767,110 | |||||||||
| 13,200 | Fair Issac Corp. | 536,580 | |||||||||
| 33,450 | Symantec Corp. (a) | 697,433 | |||||||||
| 29,200 | Yahoo!, Inc. (a) | 745,768 | |||||||||
| 4,467,507 | |||||||||||
| Paper and Related Products (3.2%) | |||||||||||
| 11,300 | Aracruz Celulose SA, ADR | 692,012 | |||||||||
| Telecommunication Services (3.8%) | |||||||||||
| 55,300 | XM Satellite Radio Holdings, Inc., Class A (a) | 799,085 | |||||||||
| Total Common Stocks (Cost $16,354,323) | 20,040,902 | ||||||||||
| REPURCHASE AGREEMENT (9.1%) | |||||||||||
| $ | 1,933,066 | U.S. Bank N.A., 5.05%, dated 12/29/06, maturing 1/3/07, with a maturity value of $1,934,422 (Collateralized fully by U.S. Government Agencies) | 1,933,066 | ||||||||
| Total Repurchase Agreement (Cost $1,933,066) | 1,933,066 | ||||||||||
| Total Investments (Cost $18,287,389) — 103.2% | 21,973,968 | ||||||||||
| Net Other Assets (Liabilities) — (3.2)% | (680,223 | ) | |||||||||
| NET ASSETS — 100.0% | $ | 21,293,745 | |||||||||
See notes to the Schedules of Portfolio Investments.
See accompanying notes to the financial statements.
13
BB&T Total Return Bond VIF
Schedule of Portfolio Investments
December 31, 2006
| Principal Amount | Fair Value | ||||||||||
| CORPORATE BONDS (38.5%) | |||||||||||
| Airlines (0.6%) | |||||||||||
| $ | 44,000 | Southwest Airlines Co., 5.25%, 10/1/14 | $ | 42,502 | |||||||
| Auto — Cars/Light Trucks (0.5%) | |||||||||||
| 36,000 | DaimlerChrysler, 4.875%, 6/15/10 | 35,093 | |||||||||
| Banking & Financial Services (28.7%) | |||||||||||
| 28,000 | American Express Credit Account Master Trust, 5.35%, 3/15/11 (c) * | 27,947 | |||||||||
| 25,000 | Bank of America Commercial Mortgage, Inc., 4.81%, 12/10/42, Series 2004-6, Class A5 | 24,172 | |||||||||
| 37,000 | Bank of America Corp., 5.39%, Series 2006-5 Class A3, 2/10/14 | 37,130 | |||||||||
| 34,000 | Bank of America Corp., 5.625%, 10/14/16 | 34,616 | |||||||||
| 44,000 | Boeing Capital Corp., 7.375%, 9/27/10 | 47,172 | |||||||||
| 32,000 | Capital One Financial, 5.50%, 6/1/15 | 31,978 | |||||||||
| 52,000 | Centex Home Equity, 4.64%, Series 2005-C, 6/25/35 | 50,641 | |||||||||
| 34,000 | Chase Credit Card Master Trust, 5.46%, Series 2003-3, Class A, 10/15/10 (c) * | 34,065 | |||||||||
| 98,000 | Chase Funding Mortgage Loan | 97,180 | |||||||||
| 23,000 | Asset-Backed, 5.42%, Series 2003-4, Class 1A5, 5/25/33 CIT Group, Inc., 5.00%, 2/13/14 | 22,228 | |||||||||
| 6,000 | CitiBank Credit Card Issuance Trust, 5.46%, Series 2003-A1, Class A, 1/15/10 (c) * | 6,008 | |||||||||
| 125,000 | CitiGroup/Deutsche Bank Commercial Mortgage Trust, 5.61%, Series 2006-CD3, Class A3, 10/15/48 | 126,825 | |||||||||
| 139,000 | Countrywide Asset-Backed Certificates, 5.73%, Series 2004-3, Class 3A3, 8/25/34 (c) * | 139,577 | |||||||||
| 80,991 | Countrywide Asset-Backed Certificates, 5.56%, Series 2005-4, Class 3AV2, 10/25/35 (c) * | 81,060 | |||||||||
| 63,000 | Countrywide Asset-Backed Certificates, 6.05%, Series 2006-11, Class 1AF3, 9/25/46 | 63,630 | |||||||||
| 28,000 | ERP Operating LP, 5.125%, 3/15/16 | 27,193 | |||||||||
| 55,000 | Gatx Financial Corp., 5.125%, 4/15/10 | 54,277 | |||||||||
| 88,000 | General Electric Capital Commercial Mortgage Corp., 3.915%, Series 2004-C1, Class A2, 11/10/38 | 84,945 | |||||||||
| 52,000 | Goldman Sachs Group, Inc., 5.125%, 1/15/15 | 50,808 | |||||||||
| 54,183 | JP Morgan Mortgage Trust, 5.225%, Series 2005-A3, 6/25/35 | 52,986 | |||||||||
| 98,097 | JPMorgan Chase Commercial Mortgage Securities, 5.41%, Series 2005-A816, Class 1A1, 11/25/35 | 96,810 | |||||||||
| 48,000 | JPMorgan Chase Commercial Mortgage Securities, 5.58%, Series 2006-CB16, Class A3B, 5/12/45 | 48,499 | |||||||||
| 85,000 | Lehman Brothers Holdings, Inc., 4.80%, Series MTNG, 3/13/14 | 81,823 | |||||||||
| 62,000 | Merrill Lynch & Co., 5.45%, 7/15/14 | 62,331 | |||||||||
| 28,000 | Merrill Lynch/Countrywide Commercial Mortgage, 5.39%, 7/12/46 | 28,088 | |||||||||
| 55,000 | Morgan Stanley, 4.25%, 5/15/10 | 53,152 | |||||||||
| 147,000 | Residential Asset Mortgage Products, Inc., 5.50%, Series 2005-RZ4, Class A2, 11/25/35 (c) * | 147,263 | |||||||||
| Principal Amount | Fair Value | ||||||||||
| CORPORATE BONDS — (continued) | |||||||||||
| Banking & Financial Services — (continued) | |||||||||||
| $ | 116,000 | Residential Asset Securities Corp., 5.47%, Series 2005-KS6, Class A2, 7/25/35 (c) * | $ | 116,037 | |||||||
| 48,000 | Structured Asset Investment Loan Trust, 5.54%, Series 2005-11, Class A6, 1/25/36 (c) * | 48,092 | |||||||||
| 42,000 | Synovus Financial Corp., 4.875%, 2/15/13 | 40,936 | |||||||||
| 57,000 | Wachovia Bank Commercial Mortgage Trust, 5.57%, Series 2006-C28, Class A4, 10/15/48 (c) | 57,832 | |||||||||
| 60,000 | Wells Fargo Co., 5.30%, 8/26/11 | 60,239 | |||||||||
| 1,935,540 | |||||||||||
| Broadcasting/Cable (0.5%) | |||||||||||
| 32,000 | Comcast Corp., 5.90%, 3/15/16 | 32,091 | |||||||||
| Correctional Institutions (0.4%) | |||||||||||
| 29,000 | Corrections Corp. of America, 6.25%, 3/15/13, Callable 3/15/2009 @ 103.125 | 28,746 | |||||||||
| Health Care (0.2%) | |||||||||||
| 18,000 | Cardinal Health, Inc., 4.00%, 6/15/15 | 15,959 | |||||||||
| Information Technology (2.0%) | |||||||||||
| 28,000 | Cisco Systems, Inc., 5.50%, 2/22/16 | 28,018 | |||||||||
| 55,000 | Electric Data Systems, Series B, 6.50%, 8/1/13 | 55,371 | |||||||||
| 54,000 | Oracle Corp., 5.00%, 1/15/11 | 53,456 | |||||||||
| 136,845 | |||||||||||
| Oil — Field Services (0.2%) | |||||||||||
| 9,000 | Halliburton Co., 8.75%, 2/15/21 | 11,274 | |||||||||
| Telecommunications (2.5%) | |||||||||||
| 21,000 | America Movil SA de CV, 5.75%, 1/15/15 | 20,777 | |||||||||
| 34,000 | New Cingular Wireless Services, 8.125%, 5/1/12 | 38,259 | |||||||||
| 41,000 | Motorola, Inc., 8.00%, 11/1/11, | 45,369 | |||||||||
| 57,000 | Motorola, Inc., 7.50%, 5/15/25 | 66,117 | |||||||||
| 170,522 | |||||||||||
| Utilities (2.9%) | |||||||||||
| 28,000 | FirstEnergy Corp., 6.45%, 11/15/11 | 29,199 | |||||||||
| 31,000 | General Electric Capital Corp., 5.00%, 1/8/16 | 30,296 | |||||||||
| 30,000 | General Electric Co., 5.00%, 2/1/13 | 29,667 | |||||||||
| 104,000 | Ohio Power Co. - IBC, 6.00%, 6/1/16 | 106,788 | |||||||||
| 195,950 | |||||||||||
| Total Corporate Bonds (Cost $2,604,858) | 2,604,522 | ||||||||||
| MORTGAGE-BACKED SECURITIES (30.0%) | |||||||||||
| Federal Home Loan Mortgage Corp. (10.6%) | |||||||||||
| 146,223 | 6.00%, 10/1/19, Pool # G11679 | 148,190 | |||||||||
| 23,255 | 5.50%, 11/1/20, Pool # J02711 | 23,238 | |||||||||
| 94,000 | 5.00%, 9/1/21, Pool # 10195 (b) | 90,680 | |||||||||
| 60,278 | 5.50%, 10/1/21, Pool # G12425 | 60,232 | |||||||||
| 43,970 | 4.50%, 6/1/35, Pool # G01842 | 41,204 | |||||||||
| 40,288 | 5.50%, 7/1/35, Pool # A36540 | 39,851 | |||||||||
| 26,437 | 6.00%, 7/1/35, Pool # A36304 | 26,633 | |||||||||
| 23,748 | 5.50%, 12/1/35, Pool # A40359 | 23,491 | |||||||||
| 72,689 | 5.50%, 2/1/36, Pool # G08111 | 71,879 | |||||||||
| 54,581 | 5.50%, 4/1/36, Pool # A44445 | 53,973 | |||||||||
Continued
14
BB&T Total Return Bond VIF
Schedule of Portfolio Investments — (continued)
December 31, 2006
| Principal Amount | Fair Value | ||||||||||
| MORTGAGE-BACKED SECURITIES — (continued) | |||||||||||
| Federal Home Loan Mortgage Corp. — (continued) | |||||||||||
| $ | 38,115 | 5.92%, 7/1/36, Pool # 1G2448* | $ | 38,209 | |||||||
| 47,023 | 5.85%, 8/1/36, Pool # 1G1094* | 47,101 | |||||||||
| 53,563 | 5.87%, 8/1/36, Pool # 1B7116* | 53,686 | |||||||||
| 718,367 | |||||||||||
| Federal National Mortgage Assoc. (15.1%) | |||||||||||
| 30,590 | 4.50%, 10/1/18, Pool # 752030 | 29,505 | |||||||||
| 18,178 | 5.50%, 11/1/20, Pool # 843972 | 18,176 | |||||||||
| 25,505 | 5.50%, 12/1/20, Pool # 831138 | 25,503 | |||||||||
| 56,099 | 5.50%, 5/1/21, Pool # 895628 | 56,095 | |||||||||
| 63,103 | 5.00%, 10/1/25, Pool # 255894 | 61,406 | |||||||||
| 296,146 | 5.50%, 1/1/34, Pool # 757571 | 292,654 | |||||||||
| 66,415 | 6.00%, 9/1/34, Pool # 790912 | 66,913 | |||||||||
| 72,451 | 6.50%, 9/1/34, Pool # 796569 | 73,819 | |||||||||
| 51,375 | 7.00%, 6/1/35, Pool # 255820 | 52,734 | |||||||||
| 32,943 | 5.00%, 9/1/35, Pool # 757857 | 31,801 | |||||||||
| 31,331 | 5.50%, 2/1/36, Pool #256101 | 30,974 | |||||||||
| 40,770 | 5.614%, 5/1/36, Pool # 871259* | 40,783 | |||||||||
| 52,677 | 5.93%, 8/1/36, Pool # 900502* | 52,899 | |||||||||
| 73,000 | 5.00%, 10/25/36, Pool # 16548 (b) | 70,468 | |||||||||
| 115,000 | 6.00%, 10/25/36, Pool # 43693 (b) | 115,755 | |||||||||
| 1,019,485 | |||||||||||
| Government National Mortgage Assoc. (4.3%) | |||||||||||
| 300,000 | 5.00%, 11/1/35, Pool # 5461 (b) | 291,656 | |||||||||
| �� | Total Mortgage-Backed Securities (Cost $2,047,452) | 2,029,508 | |||||||||
| MUNICIPAL BONDS (3.8%) | |||||||||||
| California (0.9%) | |||||||||||
| 65,000 | Fresno County, CA, Pension Obligation, 4.20%, Series A, 8/15/13, FGIC | 61,591 | |||||||||
| Florida (1.1%) | |||||||||||
| 10,000 | Gainesville, FL, Post Employment Benefits Obligation, 4.68%, 10/1/13 | 9,710 | |||||||||
| 36,000 | Gainesville, FL, Post Employment Benefits Obligation, 4.71%, 10/1/14 | 34,883 | |||||||||
| 13,000 | Palm Beach County, FL, 5.735%, 6/1/12 | 13,340 | |||||||||
| 13,000 | Palm Beach County, FL, 5.78%, 6/1/13 | 13,404 | |||||||||
| 71,337 | |||||||||||
| Illinois (0.8%) | |||||||||||
| 30,000 | Chicago, IL, Series B, 5.25%, 1/1/12, XLCA | 30,105 | |||||||||
| 24,000 | Illinois State, 3.75%, 6/1/12 | 22,401 | |||||||||
| 52,506 | |||||||||||
| New York (0.4%) | |||||||||||
| 28,000 | Sales Tax Asset Receivables Corp., 4.06% Series B, 10/15/10, FGIC | 26,990 | |||||||||
| Texas (0.6%) | |||||||||||
| 44,000 | Brownsville, TX, Utility System, 4.92%, Series B, 9/1/14, AMBAC | 43,237 | |||||||||
| Total Municipal Bonds (Cost $254,664) | 255,661 | ||||||||||
| Principal Amount | Fair Value | ||||||||||
| U.S. GOVERNMENT AGENCIES (10.7%) | |||||||||||
| Federal Home Loan Bank (1.8%) | |||||||||||
| $ | 30,000 | 4.85%, 8/10/10, Callable 2/10/07 @ 100 | $ | 29,627 | |||||||
| 65,000 | 5.25%, 9/13/13 | 65,991 | |||||||||
| 25,000 | 5.375%, 5/18/16 | 25,679 | |||||||||
| 121,297 | |||||||||||
| Federal Home Loan Mortgage Corp. (4.5%) | |||||||||||
| 36,000 | Series MTN, 4.50%, 6/15/10, Callable 3/15/07 @ 100 | 35,202 | |||||||||
| 100,000 | 4.875%, 11/15/13 | 99,390 | |||||||||
| 52,639 | Series 3061, Class VU, 5.50%, 7/15/16, | 52,917 | |||||||||
| 69,000 | 5.125%, 10/18/16 | 69,591 | |||||||||
| 53,112 | Series 3025, Class AB, 5.00%, 8/15/31 | 52,293 | |||||||||
| 309,393 | |||||||||||
| Federal National Mortgage Assoc. (4.4%) | |||||||||||
| 115,000 | 6.125%, 3/15/12 | 121,088 | |||||||||
| 83,299 | Series 2005-120, Class VA, 5.50%, 11/25/16, | 83,288 | |||||||||
| 43,750 | Series 2003-35, Class NA, 4.00%, 1/25/18, | 41,836 | |||||||||
| 48,305 | Series 2006-18, Class CA, 5.50%, 10/25/24, | 48,233 | |||||||||
| 294,445 | |||||||||||
| Total U.S. Government Agencies (Cost $719,098) | 725,135 | ||||||||||
| U.S. TREASURY BONDS (15.1%) | |||||||||||
| 349,000 | 8.875%, 8/15/17 | 466,869 | |||||||||
| 421,000 | 8.75%, 5/15/17 | 556,970 | |||||||||
| Total U.S. Treasury Bonds (Cost $1,014,085) | 1,023,839 | ||||||||||
| U.S. TREASURY NOTES (2.2%) | |||||||||||
| 79,000 | 2.00%, 1/15/14 | 83,812 | |||||||||
| 65,000 | 2.00%, 1/15/16 | 63,811 | |||||||||
| Total U.S. Treasury Notes (Cost $147,490) | 147,623 | ||||||||||
| REPURCHASE AGREEMENT(5.6%) | |||||||||||
| 381,306 | U.S. Bank N.A., 5.05%, dated 12/29/06, maturing 1/3/07, with a maturity value of $381,573 (Collateralized fully by U.S. Government Agencies) | 381,306 | |||||||||
| Total Repurchase Agreement (Cost $381,306) | 381,306 | ||||||||||
| Total Investments (Cost $7,168,953) — 105.9% | 7,167,594 | ||||||||||
| Net Other Assets (Liabilities) — (5.9)% | (400,468 | ) | |||||||||
| NET ASSETS — 100.0% | $ | 6,767,126 | |||||||||
See notes to the Schedules of Portfolio Investments.
See accompanying notes to the financial statements.
15
Notes to Schedules of Portfolio Investments
December 31, 2006
(a) Represents non-income producing security.
(b) Represents a security purchased on a when-issued basis. At December 31, 2006, total cost of investments purchased on a when-issued basis for the BB&T Total Return Bond VIF was $573,439.
(c) Represents that all or a portion of the security was pledged as collateral for securities purchased on a when-issued basis.
* The interest rate for this variable rate note, which will change periodically, is based either on the prime rate or an index of market rates. The reflected rate is the rate in effect as of December 31, 2006. The maturity date reflected is the final maturity date.
ADR — American Depository Receipt.
AMBAC — Insured by AMBAC Indemnity Corp.
FGIC — Insured by Financial Guaranty Insurance Corp.
XLCA — Insured by XL Capital Assurance.
16
BB&T Variable Insurance Funds
Statements of Assets and Liabilities
December 31, 2006
| BB&T Large Cap VIF | BB&T Mid Cap Growth VIF | BB&T Large Cap Growth VIF | BB&T Capital Manager Equity VIF | BB&T Special Opportunities Equity VIF | BB&T Total Return Bond VIF | ||||||||||||||||||||||
| Assets: | |||||||||||||||||||||||||||
| Investments: | |||||||||||||||||||||||||||
| Unaffiliated investments, at cost | $ | 69,663,416 | $ | 19,779,806 | $ | 11,051,051 | $ | — | $ | 16,354,323 | $ | 6,787,647 | |||||||||||||||
| Investment in affiliates, at cost | — | — | — | 16,277,287 | — | — | |||||||||||||||||||||
| Total investments, at cost | 69,663,416 | 19,779,806 | 11,051,051 | 16,277,287 | 16,354,323 | 6,787,647 | |||||||||||||||||||||
| Unrealized appreciation (depreciation) | 20,981,336 | 4,410,137 | 1,771,213 | 1,932,877 | 3,686,579 | (1,359 | ) | ||||||||||||||||||||
| Investments, at value | 90,644,752 | 24,189,943 | 12,822,264 | 18,210,164 | 20,040,902 | 6,786,288 | |||||||||||||||||||||
| Repurchase agreements, at cost | 2,453,196 | 1,249,850 | 858,351 | — | 1,933,066 | 381,306 | |||||||||||||||||||||
| Cash | 34,786 | — | — | — | 23,163 | 1,142 | |||||||||||||||||||||
| Interest and dividends receivable | 131,663 | 1,670 | 4,338 | 42,574 | 11,703 | 61,891 | |||||||||||||||||||||
| Receivable from Advisor | — | — | — | 3,340 | — | — | |||||||||||||||||||||
| Receivable from fund accounting | — | — | — | 240 | — | — | |||||||||||||||||||||
| Receivable for investments sold | — | — | 222,191 | — | 21,526 | 4,894 | |||||||||||||||||||||
| Receivable for capital shares issued | 1,849 | 58,063 | — | 224 | 53,247 | 138,812 | |||||||||||||||||||||
| Prepaid and other expenses | 2,719 | 763 | 403 | 517 | 596 | 665 | |||||||||||||||||||||
| Total Assets | 93,268,965 | 25,500,289 | 13,907,547 | 18,257,059 | 22,084,203 | 7,374,998 | |||||||||||||||||||||
| Liabilities: | |||||||||||||||||||||||||||
| Call options written (premiums received $—; $—; $—;$—; $39,022; $—, respectively) | — | — | — | — | 775 | — | |||||||||||||||||||||
| Dividends payable | — | — | — | — | — | 25,774 | |||||||||||||||||||||
| Cash overdraft | — | 13,628 | 3,107 | 694 | — | — | |||||||||||||||||||||
| Payable for investments purchased | — | — | 532,960 | — | 647,389 | 574,738 | |||||||||||||||||||||
| Payable for capital shares redeemed | 59,197 | 8,532 | 4,333 | 29,830 | 120,737 | — | |||||||||||||||||||||
| Accrued expenses and other payables: | |||||||||||||||||||||||||||
| Investment advisory fees | 39,571 | 9,876 | 4,618 | — | 14,439 | 2,842 | |||||||||||||||||||||
| Administration fees | 9,286 | 2,560 | 1,364 | — | 2,102 | 973 | |||||||||||||||||||||
| Fund accounting fees | 949 | 383 | 272 | 153 | 339 | 575 | |||||||||||||||||||||
| Transfer agency fees | 867 | 295 | 191 | 228 | 230 | 158 | |||||||||||||||||||||
| Compliance service fees | 1,501 | 416 | 219 | 290 | 343 | 148 | |||||||||||||||||||||
| Other fees | 14,930 | 4,398 | 2,365 | 3,417 | 4,104 | 2,664 | |||||||||||||||||||||
| Total Liabilities | 126,301 | 40,088 | 549,429 | 34,612 | 790,458 | 607,872 | |||||||||||||||||||||
| Net Assets: | |||||||||||||||||||||||||||
| Capital | 60,681,299 | 17,887,917 | 10,783,188 | 14,180,354 | 15,559,259 | 6,819,700 | |||||||||||||||||||||
| Accumulated net investment income | 363,182 | — | — | 95,228 | — | 164,983 | |||||||||||||||||||||
| Accumulated realized gains/(losses) from investment transactions | 11,116,847 | 3,162,147 | 803,717 | 2,013,988 | 2,009,660 | (216,198 | ) | ||||||||||||||||||||
| Net unrealized appreciation/ depreciation on investments | 20,981,336 | 4,410,137 | 1,771,213 | 1,932,877 | 3,724,826 | (1,359 | ) | ||||||||||||||||||||
| Net Assets | $ | 93,142,664 | $ | 25,460,201 | $ | 13,358,118 | $ | 18,222,447 | $ | 21,293,745 | $ | 6,767,126 | |||||||||||||||
| Shares of Beneficial Interest Outstanding (unlimited number of shares authorized, no par value) | 5,559,516 | 1,679,532 | 1,256,874 | 1,563,528 | 1,413,092 | 688,121 | |||||||||||||||||||||
| Net Asset Value - offering and redemption price per share | $ | 16.75 | $ | 15.16 | $ | 10.63 | $ | 11.65 | $ | 15.07 | $ | 9.83 | |||||||||||||||
See accompanying notes to the financial statements.
17
BB&T Variable Insurance Funds
Statements of Operations
For the Year Ended December 31, 2006
| BB&T Large Cap VIF | BB&T Mid Cap GrowthVIF | BB&T Large Cap Growth VIF | BB&T Capital Manager Equity VIF | BB&T Special Opportunities Equity VIF | BB&T Total Return Bond VIF | ||||||||||||||||||||||
| Investment Income: | |||||||||||||||||||||||||||
| Interest income | $ | 222,571 | $ | 69,318 | $ | 44,141 | $ | — | $ | 105,611 | $ | 986,039 | |||||||||||||||
| Dividend income | 2,584,811 | 325,964 | 201,955 | — | 232,366 | — | |||||||||||||||||||||
| Dividend income from affiliates | — | — | — | 347,875 | — | — | |||||||||||||||||||||
| Total Investment Income: | 2,807,382 | 395,282 | 246,096 | 347,875 | 337,977 | 986,039 | |||||||||||||||||||||
| Expenses: | |||||||||||||||||||||||||||
| Investment advisory fees | 834,595 | 283,918 | 154,488 | 66,257 | 266,954 | 115,898 | |||||||||||||||||||||
| Administration fees | 127,988 | 43,505 | 23,669 | 30,036 | 37,844 | 21,924 | |||||||||||||||||||||
| Fund accounting fees | 28,123 | 10,410 | 5,912 | 5,632 | 8,977 | 9,382 | |||||||||||||||||||||
| Transfer agency fees | 12,289 | 4,817 | 3,295 | 4,319 | 3,337 | 1,932 | |||||||||||||||||||||
| Compliance service fees | 13,951 | 4,616 | 2,631 | 3,409 | 3,021 | 1,867 | |||||||||||||||||||||
| Custodian fees | 7,982 | 2,961 | 1,610 | 2,385 | 1,575 | 992 | |||||||||||||||||||||
| Professional fees | 81,836 | 27,431 | 15,021 | 20,270 | 21,806 | 11,579 | |||||||||||||||||||||
| Trustee fees | 18,536 | 6,451 | 3,662 | 4,088 | 5,719 | 3,172 | |||||||||||||||||||||
| Interest fees(1) | — | 23 | — | — | — | — | |||||||||||||||||||||
| Other fees | 19,221 | 7,218 | 5,294 | 7,368 | 5,562 | 3,496 | |||||||||||||||||||||
| Total expenses before waivers | 1,144,521 | 391,350 | 215,582 | 143,764 | 354,795 | 170,242 | |||||||||||||||||||||
| Less expenses waived by the Investment Advisor | (273,098 | ) | (93,185 | ) | (51,445 | ) | (69,597 | ) | — | (22,304 | ) | ||||||||||||||||
| Less expenses waived by the Administrator | — | — | — | (30,036 | ) | — | — | ||||||||||||||||||||
| Net Expenses | 871,423 | 298,165 | 164,137 | 44,131 | 354,795 | 147,938 | |||||||||||||||||||||
| Net Investment Income (Loss) | 1,935,959 | 97,117 | 81,959 | 303,744 | (16,818 | ) | 838,101 | ||||||||||||||||||||
| Realized/Unrealized Gains (Losses) on Investments: | |||||||||||||||||||||||||||
| Net realized gains (losses) on option contracts | — | — | — | — | 18,654 | — | |||||||||||||||||||||
| Net realized gains (losses) from affiliated investment transactions | — | — | — | 1,003,199 | — | — | |||||||||||||||||||||
| Net realized gain distributions from underlying funds | — | — | — | 1,635,004 | — | — | |||||||||||||||||||||
| Net realized gains (losses) from investment transactions | 18,508,713 | 6,928,124 | 927,105 | — | 6,489,711 | (30,159 | ) | ||||||||||||||||||||
| Change in unrealized appreciation/ depreciation on investments | 1,298,734 | (6,370,282 | ) | (543,887 | ) | 327,925 | 767,928 | 124,775 | |||||||||||||||||||
| Net realized/unrealized gains (losses) on investments | 19,807,447 | 557,842 | 383,218 | 2,966,128 | 7,276,293 | 94,616 | |||||||||||||||||||||
| Change in net assets from operations | $ | 21,743,406 | $ | 654,959 | $ | 465,177 | $ | 3,269,872 | $ | 7,259,475 | $ | 932,717 | |||||||||||||||
(1) Expense consists of interest expense on the line of credit utilized during the fiscal year.
See accompanying notes to the financial statements.
18
(This page has been left blank intentionally.)
19
BB&T Variable Insurance Funds
Statements of Changes in Net Assets
| BB&T Large Cap VIF | BB&T Mid Cap Growth VIF | BB&T Large Cap Growth VIF | |||||||||||||||||||||||||
| For the Year Ended December 31, 2006 | For the Year Ended December 31, 2005 | For the Year Ended December 31, 2006 | For the Year Ended December 31, 2005 | For the Year Ended December 31, 2006 | For the Year Ended December 31, 2005 | ||||||||||||||||||||||
| From Investment Activities | |||||||||||||||||||||||||||
| Operations: | |||||||||||||||||||||||||||
| Net investment income (loss) | $ | 1,935,959 | $ | 2,187,602 | $ | 97,117 | $ | (94,866 | ) | $ | 81,959 | $ | 90,564 | ||||||||||||||
| Net realized gains (losses) from investment transactions and distributions from underlying funds | 18,508,713 | 5,648,845 | 6,928,124 | 2,740,583 | 927,105 | 761,512 | |||||||||||||||||||||
| Change in unrealized appreciation/depreciation on investments | 1,298,734 | (351,242 | ) | (6,370,282 | ) | 2,171,358 | (543,887 | ) | (393,355 | ) | |||||||||||||||||
| Change in net assets from operations | 21,743,406 | 7,485,205 | 654,959 | 4,817,075 | 465,177 | 458,721 | |||||||||||||||||||||
| Dividends to Shareholders: | |||||||||||||||||||||||||||
| Net investment income | (1,597,154 | ) | (2,163,186 | ) | (169,918 | ) | — | (85,631 | ) | (91,612 | ) | ||||||||||||||||
| Net realized gains from investment transactions | — | — | (2,384,160 | ) | — | (62,259 | ) | — | |||||||||||||||||||
| Change in net assets from shareholder dividends | (1,597,154 | ) | (2,163,186 | ) | (2,554,078 | ) | — | (147,890 | ) | (91,612 | ) | ||||||||||||||||
| Capital Transactions: | |||||||||||||||||||||||||||
| Proceeds from shares issued | 3,613,319 | 2,804,935 | 5,338,345 | 3,785,288 | 1,522,860 | 1,803,928 | |||||||||||||||||||||
| Dividends reinvested | 1,597,154 | 2,712,897 | 2,554,078 | — | 147,890 | 183,178 | |||||||||||||||||||||
| Value of shares redeemed | (12,806,788 | ) | (8,803,839 | ) | (3,965,432 | ) | (1,919,195 | ) | (12,153,090 | ) | (1,130,736 | ) | |||||||||||||||
| Redemption In-Kind | (33,055,269 | ) | — | (15,658,169 | ) | — | — | — | |||||||||||||||||||
| Change in net assets from capital transactions | (40,651,584 | ) | (3,286,007 | ) | (11,731,178 | ) | 1,866,093 | (10,482,340 | ) | 856,370 | |||||||||||||||||
| Change in net assets | (20,505,332 | ) | 2,036,012 | (13,630,297 | ) | 6,683,168 | (10,165,053 | ) | 1,223,479 | ||||||||||||||||||
| Net Assets: | |||||||||||||||||||||||||||
| Beginning of period | 113,647,996 | 111,611,984 | 39,090,498 | 32,407,330 | 23,523,171 | 22,299,692 | |||||||||||||||||||||
| End of period | $ | 93,142,664 | $ | 113,647,996 | $ | 25,460,201 | $ | 39,090,498 | $ | 13,358,118 | $ | 23,523,171 | |||||||||||||||
| Share Transactions: | |||||||||||||||||||||||||||
| Issued | 236,412 | 208,216 | 336,699 | 266,255 | 148,486 | 180,801 | |||||||||||||||||||||
| Reinvested | 106,704 | 199,567 | 175,022 | — | 14,608 | 18,107 | |||||||||||||||||||||
| Redeemed | (850,964 | ) | (646,756 | ) | (259,014 | ) | (138,285 | ) | (1,191,491 | ) | (111,804 | ) | |||||||||||||||
| Redemption In-Kind | (2,053,122 | ) | — | (1,067,360 | ) | — | — | — | |||||||||||||||||||
| Change in Shares | (2,560,970 | ) | (238,973 | ) | (814,653 | ) | 127,970 | (1,028,397 | ) | 87,104 | |||||||||||||||||
| Accumulated undistributed net investment income | $ | 363,182 | $ | 24,377 | $ | — | $ | — | $ | — | $ | — | |||||||||||||||
See accompanying notes to the financial statements.
20
| BB&T Capital Manager Equity VIF | BB&T Special Opportunities Equity VIF | BB&T Total Return Bond VIF | |||||||||||||||||||||||||
| For the Year Ended December 31, 2006 | For the Year Ended December 31, 2005 | For the Year Ended December 31, 2006 | For the Year Ended December 31, 2005 | For the Year Ended December 31, 2006 | For the Year Ended December 31, 2005 | ||||||||||||||||||||||
| From Investment Activities | |||||||||||||||||||||||||||
| Operations: | |||||||||||||||||||||||||||
| Net investment income (loss) | $ | 303,744 | $ | 453,684 | $ | (16,818 | ) | $ | (76,916 | ) | $ | 838,101 | $ | 577,698 | |||||||||||||
| Net realized gains (losses) from investment transactions and distributions from underlying funds | 2,638,203 | 1,497,425 | 6,508,365 | 1,886,143 | (30,159 | ) | (4,837 | ) | |||||||||||||||||||
| Change in unrealized appreciation/depreciation on investments | 327,925 | (123,802 | ) | 767,928 | (87,895 | ) | 124,775 | (180,295 | ) | ||||||||||||||||||
| Change in net assets from operations | 3,269,872 | 1,827,307 | 7,259,475 | 1,721,332 | 932,717 | 392,566 | |||||||||||||||||||||
| Dividends to Shareholders: | |||||||||||||||||||||||||||
| Net investment income | (252,133 | ) | (410,067 | ) | (20,982 | ) | — | (831,872 | ) | (617,780 | ) | ||||||||||||||||
| Net realized gains from investment transactions | (1,067,700 | ) | — | (1,809,941 | ) | (425,936 | ) | — | (50,547 | ) | |||||||||||||||||
| Change in net assets from shareholder dividends | (1,319,833 | ) | (410,067 | ) | (1,830,923 | ) | (425,936 | ) | (831,872 | ) | (668,327 | ) | |||||||||||||||
| Capital Transactions: | |||||||||||||||||||||||||||
| Proceeds from shares issued | 4,965,546 | 2,201,817 | 6,523,307 | 9,603,027 | 4,002,998 | 2,753,417 | |||||||||||||||||||||
| Dividends reinvested | 1,319,833 | 481,528 | 1,830,923 | 425,882 | 831,872 | 704,135 | |||||||||||||||||||||
| Value of shares redeemed | (1,316,172 | ) | (989,412 | ) | (1,373,589 | ) | (599,801 | ) | (583,849 | ) | (57,671 | ) | |||||||||||||||
| Redemption In-Kind | (17,418,807 | ) | — | (22,883,690 | ) | — | (16,361,455 | ) | — | ||||||||||||||||||
| Change in net assets from capital transactions | (12,449,600 | ) | 1,693,933 | (15,903,049 | ) | 9,429,108 | (12,110,434 | ) | 3,399,881 | ||||||||||||||||||
| Change in net assets | (10,499,561 | ) | 3,111,173 | (10,474,497 | ) | 10,724,504 | (12,009,589 | ) | 3,124,120 | ||||||||||||||||||
| Net Assets: | |||||||||||||||||||||||||||
| Beginning of period | 28,722,008 | 25,610,835 | 31,768,242 | 21,043,738 | 18,776,715 | 15,652,595 | |||||||||||||||||||||
| End of period | $ | 18,222,447 | $ | 28,722,008 | $ | 21,293,745 | $ | 31,768,242 | $ | 6,767,126 | $ | 18,776,715 | |||||||||||||||
| Share Transactions: | |||||||||||||||||||||||||||
| Issued | 452,112 | 218,620 | 472,777 | 779,800 | 408,945 | 274,427 | |||||||||||||||||||||
| Reinvested | 124,570 | 46,889 | 137,514 | 33,720 | 84,905 | 70,239 | |||||||||||||||||||||
| Redeemed | (119,628 | ) | (96,369 | ) | (99,525 | ) | (48,297 | ) | (59,822 | ) | (5,756 | ) | |||||||||||||||
| Redemption In-Kind | (1,626,406 | ) | — | (1,599,140 | ) | — | (1,637,783 | ) | — | ||||||||||||||||||
| Change in Shares | (1,169,352 | ) | 169,140 | (1,088,374 | ) | 765,223 | (1,203,755 | ) | 338,910 | ||||||||||||||||||
| Accumulated undistributed net investment income | $ | 95,228 | $ | 43,617 | $ | — | $ | — | $ | 164,983 | $ | 77,712 | |||||||||||||||
21
BB&T Variable Insurance Funds
Financial Highlights
Selected data for a share of beneficial interest outstanding throughout the periods indicated.
| Investment Activities | Dividends | ||||||||||||||||||||||||||||||||||
Net Asset Value, Beginning of Period | Net investment income (loss) | Net realized/ unrealized gains (losses) on investments | Total from Investment Activities | Net investment income | Return of Capital | Net realized gains on investments | Total Distributions | ||||||||||||||||||||||||||||
| BB&T Large Cap VIF | |||||||||||||||||||||||||||||||||||
| Year Ended December 31, 2006 | $ | 14.00 | 0.27 | 2.68 | 2.95 | (0.20 | ) | — | — | (0.20 | ) | ||||||||||||||||||||||||
| Year Ended December 31, 2005 | $ | 13.35 | 0.26 | 0.65 | 0.91 | (0.26 | ) | — | — | (0.26 | ) | ||||||||||||||||||||||||
| Year Ended December 31, 2004 | $ | 12.00 | 0.22 | 1.35 | 1.57 | (0.22 | ) | — | — | (0.22 | ) | ||||||||||||||||||||||||
| Year Ended December 31, 2003 | $ | 9.88 | 0.19 | 2.12 | 2.31 | (0.19 | ) | (0.00 | )(b) | — | (0.19 | ) | |||||||||||||||||||||||
| Year Ended December 31, 2002 | $ | 12.50 | 0.17 | (2.62 | ) | (2.45 | ) | (0.17 | ) | — | — | (0.17 | ) | ||||||||||||||||||||||
| BB&T Mid Cap Growth VIF | |||||||||||||||||||||||||||||||||||
| Year Ended December 31, 2006 | $ | 15.67 | 0.03 | 0.44 | 0.47 | (0.07 | ) | — | (0.91 | ) | (0.98 | ) | |||||||||||||||||||||||
| Year Ended December 31, 2005 | $ | 13.70 | (0.04 | ) | 2.01 | 1.97 | — | — | — | — | |||||||||||||||||||||||||
| Year Ended December 31, 2004 | $ | 11.69 | (0.05 | ) | 2.06 | 2.01 | — | — | — | — | |||||||||||||||||||||||||
| Year Ended December 31, 2003 | $ | 8.56 | (0.06 | ) | 3.19 | 3.13 | — | — | — | — | |||||||||||||||||||||||||
| Year Ended December 31, 2002 | $ | 10.70 | (0.09 | ) | (2.05 | ) | (2.14 | ) | — | — | — | — | |||||||||||||||||||||||
| BB&T Large Cap Growth VIF | |||||||||||||||||||||||||||||||||||
| Year Ended December 31, 2006 | $ | 10.29 | 0.05 | 0.37 | 0.42 | (0.05 | ) | — | (0.03 | ) | (0.08 | ) | |||||||||||||||||||||||
| Year Ended December 31, 2005 | $ | 10.14 | 0.04 | 0.15 | 0.19 | (0.04 | ) | — | — | (0.04 | ) | ||||||||||||||||||||||||
| Year Ended December 31, 2004 | $ | 9.64 | 0.04 | 0.50 | 0.54 | (0.04 | ) | — | — | (0.04 | ) | ||||||||||||||||||||||||
| Year Ended December 31, 2003 | $ | 7.53 | (0.02 | ) | 2.13 | 2.11 | — | — | — | — | |||||||||||||||||||||||||
| Year Ended December 31, 2002 | $ | 10.83 | (0.06 | ) | (3.24 | ) | (3.30 | ) | — | — | — | — | |||||||||||||||||||||||
| BB&T Capital Manager Equity VIF*** | |||||||||||||||||||||||||||||||||||
| Year Ended December 31, 2006 | $ | 10.51 | 0.16 | 1.45 | 1.61 | (0.12 | ) | — | (0.35 | ) | (0.47 | ) | |||||||||||||||||||||||
| Year Ended December 31, 2005 | $ | 9.99 | 0.17 | 0.50 | 0.67 | (0.15 | ) | — | — | (0.15 | ) | ||||||||||||||||||||||||
| Year Ended December 31, 2004 | $ | 8.99 | 0.07 | 1.00 | 1.07 | (0.07 | ) | — | — | (0.07 | ) | ||||||||||||||||||||||||
| Year Ended December 31, 2003 | $ | 7.19 | 0.03 | 1.80 | 1.83 | (0.03 | ) | — | — | (0.03 | ) | ||||||||||||||||||||||||
| Year Ended December 31, 2002 | $ | 9.28 | 0.01 | (1.98 | ) | (1.97 | ) | (0.01 | ) | — | (0.11 | ) | (0.12 | ) | |||||||||||||||||||||
| BB&T Special Opportunities Equity VIF | |||||||||||||||||||||||||||||||||||
| Year Ended December 31, 2006 | $ | 12.70 | (0.02 | ) | 3.07 | 3.05 | (0.01 | ) | — | (0.67 | ) | (0.68 | ) | ||||||||||||||||||||||
| Year Ended December 31, 2005 | $ | 12.12 | (0.03 | ) | 0.79 | 0.76 | — | — | (0.18 | ) | (0.18 | ) | |||||||||||||||||||||||
| July 22, 2004 to December 31, 2004 (a) | $ | 10.00 | (0.04 | ) | 2.16 | 2.12 | — | — | — | — | |||||||||||||||||||||||||
| BB&T Total Return Bond VIF | |||||||||||||||||||||||||||||||||||
| Year Ended December 31, 2006 | $ | 9.92 | 0.50 | (0.17 | ) | 0.33 | (0.42 | ) | — | — | (0.42 | ) | |||||||||||||||||||||||
| Year Ended December 31, 2005 | $ | 10.08 | 0.33 | (0.10 | ) | 0.23 | (0.36 | ) | — | (0.03 | ) | (0.39 | ) | ||||||||||||||||||||||
| July 22, 2004 to December 31, 2004 (a) | $ | 10.00 | 0.10 | 0.08 | 0.18 | (0.10 | ) | — | — | (0.10 | ) | ||||||||||||||||||||||||
* During the period certain fees were reduced. If such reductions had not occurred, the ratios would have been as indicated.
** Total return ratios assume reinvestment of distributions at net asset value.
Total return ratios do not reflect charges pursuant to the terms of the insurance contracts funded by separate accounts that invest
in the Fund's shares.
*** The expense ratios exclude the indirect impact of fees/expenses paid by each underlying fund.
(a) Period from commencement of operations.
(b) Amount is less than $0.005.
(c) Not annualized for periods less than one year.
(d) Annualized for periods less than one year.
See accompanying notes to the financial statements.
22
| Ratios/Supplementary Data | |||||||||||||||||||||||||||||||
Net Asset Value, End of Period | Total Return** (c) | Net Assets, End of Period (000) | Ratio of net expenses to average net assets (d) | Ratio of net investment income (loss) to average net assets (d) | Ratio of expenses to average net assets* (d) | Portfolio turnover rate (c) | |||||||||||||||||||||||||
| BB&T Large Cap VIF | |||||||||||||||||||||||||||||||
| Year Ended December 31, 2006 | $ | 16.75 | 21.28 | % | $ | 93,143 | 0.77 | % | 1.72 | % | 1.01 | % | 45.76 | % | |||||||||||||||||
| Year Ended December 31, 2005 | $ | 14.00 | 6.90 | % | $ | 113,648 | 0.79 | % | 1.95 | % | 1.05 | % | 21.76 | % | |||||||||||||||||
| Year Ended December 31, 2004 | $ | 13.35 | 13.18 | % | $ | 111,612 | 0.81 | % | 1.77 | % | 1.10 | % | 12.91 | % | |||||||||||||||||
| Year Ended December 31, 2003 | $ | 12.00 | 23.62 | % | $ | 94,683 | 0.88 | % | 1.82 | % | 1.17 | % | 13.96 | % | |||||||||||||||||
| Year Ended December 31, 2002 | $ | 9.88 | (19.64 | )% | $ | 63,667 | 0.84 | % | 1.57 | % | 1.13 | % | 15.24 | % | |||||||||||||||||
| BB&T Mid Cap Growth VIF | |||||||||||||||||||||||||||||||
| Year Ended December 31, 2006 | $ | 15.16 | 3.26 | % | $ | 25,460 | 0.78 | % | 0.25 | % | 1.02 | % | 160.04 | % | |||||||||||||||||
| Year Ended December 31, 2005 | $ | 15.67 | 14.38 | % | $ | 39,090 | 0.78 | % | (0.28 | )% | 1.10 | % | 113.04 | % | |||||||||||||||||
| Year Ended December 31, 2004 | $ | 13.70 | 17.19 | % | $ | 32,407 | 0.83 | % | (0.44 | )% | 1.22 | % | 135.55 | % | |||||||||||||||||
| Year Ended December 31, 2003 | $ | 11.69 | 36.57 | % | $ | 23,903 | 0.98 | % | (0.78 | )% | 1.37 | % | 113.75 | % | |||||||||||||||||
| Year Ended December 31, 2002 | $ | 8.56 | (20.00 | )% | $ | 10,864 | 1.23 | % | (1.05 | )% | 1.62 | % | 96.89 | % | |||||||||||||||||
| BB&T Large Cap Growth VIF | |||||||||||||||||||||||||||||||
| Year Ended December 31, 2006 | $ | 10.63 | 4.09 | % | $ | 13,358 | 0.79 | % | 0.39 | % | 1.03 | % | 200.35 | % | |||||||||||||||||
| Year Ended December 31, 2005 | $ | 10.29 | 1.88 | % | $ | 23,523 | 0.79 | % | 0.40 | % | 1.14 | % | 91.61 | % | |||||||||||||||||
| Year Ended December 31, 2004 | $ | 10.14 | 5.63 | % | $ | 22,300 | 0.86 | % | 0.46 | % | 1.26 | % | 119.90 | % | |||||||||||||||||
| Year Ended December 31, 2003 | $ | 9.64 | 28.02 | % | $ | 18,464 | 1.04 | % | (0.32 | )% | 1.44 | % | 90.57 | % | |||||||||||||||||
| Year Ended December 31, 2002 | $ | 7.53 | (30.47 | )% | $ | 9,328 | 1.31 | % | (0.73 | )% | 1.71 | % | 93.65 | % | |||||||||||||||||
| BB&T Capital Manager Equity VIF*** | |||||||||||||||||||||||||||||||
| Year Ended December 31, 2006 | $ | 11.65 | 15.82 | % | $ | 18,222 | 0.17 | % | 1.15 | % | 0.54 | % | 20.55 | % | |||||||||||||||||
| Year Ended December 31, 2005 | $ | 10.51 | 6.77 | % | $ | 28,722 | 0.26 | % | 1.68 | % | 0.55 | % | 3.24 | % | |||||||||||||||||
| Year Ended December 31, 2004 | $ | 9.99 | 11.91 | % | $ | 25,611 | 0.34 | % | 0.75 | % | 0.54 | % | 1.09 | % | |||||||||||||||||
| Year Ended December 31, 2003 | $ | 8.99 | 25.47 | % | $ | 20,606 | 0.56 | % | 0.40 | % | 0.66 | % | 10.06 | % | |||||||||||||||||
| Year Ended December 31, 2002 | $ | 7.19 | (21.25 | )% | $ | 14,804 | 0.64 | % | 0.15 | % | 0.74 | % | 3.47 | % | |||||||||||||||||
| BB&T Special Opportunities Equity VIF | |||||||||||||||||||||||||||||||
| Year Ended December 31, 2006 | $ | 15.07 | 24.71 | % | $ | 21,294 | 1.06 | % | (0.05 | )% | 1.06 | % | 59.93 | % | |||||||||||||||||
| Year Ended December 31, 2005 | $ | 12.70 | 6.29 | % | $ | 31,768 | 1.23 | % | (0.28 | )% | 1.23 | % | 42.15 | % | |||||||||||||||||
| July 22, 2004 to December 31, 2004 (a) | $ | 12.12 | 21.20 | % | $ | 21,044 | 1.45 | % | (0.76 | )% | 1.45 | % | 13.81 | % | |||||||||||||||||
| BB&T Total Return Bond VIF | |||||||||||||||||||||||||||||||
| Year Ended December 31, 2006 | $ | 9.83 | 3.47 | % | $ | 6,767 | 0.77 | % | 4.34 | % | 0.88 | % | 188.24 | % | |||||||||||||||||
| Year Ended December 31, 2005 | $ | 9.92 | 2.29 | % | $ | 18,777 | 1.00 | % | 3.38 | % | 1.12 | % | 196.66 | % | |||||||||||||||||
| July 22, 2004 to December 31, 2004 (a) | $ | 10.08 | 1.76 | % | $ | 15,653 | 1.29 | % | 2.34 | % | 1.29 | % | 36.74 | % | |||||||||||||||||
23
BB&T Variable Insurance Funds
Notes to Financial Statements
December 31, 2006
1. Organization:
The BB&T Variable Insurance Funds (the "Trust") was organized on November 8, 2004, and is registered under the Investment Company Act of 1940, as amended (the "1940 Act"), as an open-end investment company established as a Massachusetts business trust. The Trust commenced operations on May 1, 2005 and presently offers shares of the BB&T Large Cap VIF (formerly known as the BB&T Large Cap Value VIF), the BB&T Mid Cap Growth VIF, the BB&T Large Cap Growth VIF, the BB&T Capital Manager Equity VIF, the BB&T Special Opportunities Equity VIF, and the BB&T Total Return Bond VIF (referred to individually as a "Fund" and collectively as the "Funds"). The Trust is authorized to issue an unlimited number of shares of beneficial interest without par value. Shares of the Funds are offered through variable annuity contracts offered through the separate accounts of participating insurance companies. The BB&T Capital Mana ger Equity VIF (the "Fund of Funds") invests in underlying mutual funds as opposed to individual securities.
Under the Funds' organizational documents, its Officers and Trustees are indemnified against certain liabilities arising out of the performance of their duties to the Funds. In addition, in the normal course of business, the Funds may enter into contracts with their vendors and others that provide for general indemnifications. The Funds' maximum exposure under these arrangements is unknown, as this would involve future claims that may be made against the Funds. However, based on experience, the Funds expect that risk of loss to be remote.
During the fiscal year ended December 31, 2006, the BB&T Large Cap VIF, BB&T Capital Manager Equity VIF, BB&T Mid Cap Growth VIF, BB&T Special Opportunities Equity VIF and the BB&T Total Return Bond VIF delivered securities of the Funds in exchange for the redemption of Institutional Shares (redemption-in-kind). Cash and securities were transferred for redemptions at a fair value of $33,055,269; $15,658,169; $17,418,807; $22,883,690 and $16,361,455 for the BB&T Large Cap VIF, BB&T Mid Cap Growth VIF, BB&T Capital Manager Equity VIF, BB&T Special Opportunities Equity VIF and the BB&T Total Return Bond VIF, respectively. For financial reporting purposes, the Large Cap VIF, Mid Cap Growth VIF, Capital Manager Equity VIF, Special Opportunities Equity VIF and the Total Return Bond VIF recorded net realized gains of $3,558,906; $1,923,171; $624,215; $3,399,685 and $159,266, respectively, in connection with t he transactions. However, for tax purposes, the transactions received tax-free treatment. These permanent book to tax differences were reclassified within the components of net assets in accordance with the Funds' accounting policies more fully disclosed in note 2.
2. Significant Accounting Policies:
The following is a summary of significant accounting policies followed by the Trust in the preparation of its financial statements. The policies are in conformity with U.S. generally accepted accounting principles ("GAAP"). The preparation of financial statements requires management to make estimates and assumptions that affect the reported amounts of assets and liabilities and disclosure of contingent assets and liabilities at the date of the financial statements and the reported amounts of income and expenses for the year. Actual results could differ from those estimates. The Fund of Funds seeks its investment objective of capital appreciation by investing solely in a diversified portfolio of mutual funds (the "Underlying Mutual Funds"). The Fund of Funds purchases shares of the Underlying Mutual Funds at net asset value and without sales charge.
New Accounting Standards—In September 2006, the Financial Accounting Standards Board (FASB) issued Statement on Financial Accounting Standards (SFAS) No. 157, "Fair Value Measurements." This standard establishes a single authoritative definition of fair value, sets out a framework for measuring fair value and requires additional disclosures about fair value measurements. SFAS No. 157 applies to fair value measurements already required or permitted by existing standards. SFAS No. 157 is effective for financial statements issued for fiscal years beginning after November 15, 2007 and interim periods within those fiscal years. The changes to current generally accepted accounting principles from the application of this Statement relate to the definition of fair value, the methods used to measure fair value, and the expanded disclosures about fair value measurement s. As of December 31, 2006, the Funds do not believe the adoption of SFAS No. 157 will impact the financial statement amounts, however, additional disclosures will be required about the inputs used to develop the measurements and the effect of certain of the measurements on changes in net assets for the period.
In July 2006, the Financial Accounting Standards Board (FASB) released FASB Interpretation No. 48 "Accounting for Uncertainty in Income Taxes" (FIN 48). FIN 48 provides guidance for how uncertain tax positions should be recognized, measured, presented and disclosed in the financial statements. FIN 48 requires the evaluation of tax positions taken or expected to be taken in the course of preparing the Fund's tax return to determine whether the tax positions are "more-likely-than-not" of being sustained by the applicable tax authority. Tax positions not deemed to meet the more-likely-than-not threshold would be recorded as a tax benefit or expense in the current year. Adoption of FIN 48 is required no later than the last business day of the first financial statement
24
BB&T Variable Insurance Funds
Notes to Financial Statements — (continued)
December 31, 2006
reporting period for fiscal years beginning after December 15, 2006 and is to be applied to all open tax years as of the effective date. Management has not completed their analysis on whether the adoption of FIN 48 will have an impact to the financial statements once adopted.
Securities Valuation—Investments in common stocks, commercial paper, corporate bonds, municipal securities, U.S. Government securities, and U.S. Government agency securities, the principal market for which is a securities exchange or an over-the-counter market, are valued at their latest available sale price (except for those securities that are traded on NASDAQ, which will be valued at the NASDAQ official closing price) or in the absence of such a price, by reference to the latest available bid quotations in the principal market in which such securities are normally traded. The Funds may also use an independent pricing service approved by the Board of Trustees to value certain securities. Such prices reflect fair values which may be established through the use of electronic and matrix techniques. Short-term obligations that mature in 60 days or less are valu ed at either amortized cost or original cost plus interest, which approximates fair value. Investments in open-end investment companies, including the Fund of Funds, are valued at their respective net asset values as reported by such companies. Investments in closed-end investment companies are valued at their fair values based upon the latest available bid prices in the principal market in which such securities are normally traded. The differences between cost and fair values of investments are reflected as either unrealized appreciation or depreciation. Securities for which market quotations are not readily available will be valued at fair value using methods determined in good faith by the Pricing Committee under the supervision of the Board of Trustees. Fair value pricing may be used for significant events such as securities whose trading has been suspended, whose price has become stale or for which there is no currently available price. At December 31, 2006 there were no fair valued prices in the Funds.
Securities Transactions and Related Income—During the period, security transactions are accounted for no later than one business day after trade date. For financial reporting purposes, security transactions are accounted for on trade date of the last business day of the reporting period. Interest income is recognized on the accrual basis and includes, where applicable, the pro-rata amortization/accretion of premium or discount done by using the effective interest method. Dividend income is recorded on the ex-dividend date. Gains or losses realized from sales of securities are determined by comparing the identified cost of the security lot sold with the net sales proceeds. Under the applicable foreign tax law, a withholding tax may be imposed on interest, dividends and capital gains earned on foreign investments at various rates. Where available, the Funds wil l file for claims on foreign taxes withheld.
When-Issued Securities—The Funds, may purchase securities on a "when-issued" basis. The Funds record when-issued securities on the trade date and pledge assets with a value at least equal to the purchase commitment for payment of the securities purchased. The value of the securities underlying when-issued securities and any subsequent fluctuation in their value is taken into account when determining the net asset value of the funds commencing with the date the funds agree to purchase the securities. The Funds do not accrue interest or dividends on "when-issued" securities until the underlying securities are received.
Repurchase Agreements—The Funds may acquire repurchase agreements from member banks of the Federal Deposit Insurance Corporation and from registered broker/dealers that BB&T Asset Management, Inc. ("BB&T") or a sub-advisor deems creditworthy under guidelines approved by the Board of Trustees, subject to the seller's agreement to repurchase such securities at a mutually agreed-upon date and price. The repurchase price generally equals the price paid by the Funds plus interest negotiated on the
basis of current short-term rates, which may be more or less than the rate on the underlying collateral. The seller under a repurchase agreement is required to maintain the value of collateral held pursuant to the agreement at not less than the repurchase price, including accrued interest. Securities subject to repurchase agreements are held by the Funds' cus todian or another qualified custodian or in the Federal Reserve/Treasury book-entry system. In the event of counterparty default, the Fund has the right to use the collateral to offset losses incurred. There is potential for loss to the Fund in the event the Fund is delayed or prevented from exercising its rights to dispose of the collateral securities, including the risk of a possible decline in the fair value of the underlying securities during the period while the Fund seeks to assert its rights.
Option Contracts—The Funds may purchase or write option contracts. These transactions are to hedge against changes in interest rates, security prices, currency fluctuations, and other market developments, or for the purposes of earning additional income (i.e., speculation).
The risk associated with purchasing an option is that the Fund pays a premium whether or not the option is exercised. Additionally, the Funds bear the risk of loss of the premium and change in fair value should the counterparty not perform under the contract. Put and call options purchased are accounted for in the same manner as other securities owned. The cost of securities acquired through the exercise of call options is increased by the premiums paid. The proceeds from securities sold through the exercise of put options are decreased by premiums paid.
25
BB&T Variable Insurance Funds
Notes to Financial Statements — (continued)
December 31, 2006
In writing an option, the Funds contract with a specified counterparty to purchase (put option written) or sell (call option written) a specified quantity (notional amount) of an underlying asset at a specified price during a specified period upon demand of the counterparty. The risk associated with writing an option is that the Funds bear the market risk of an unfavorable change in the price of an underlying asset, and may be required to buy or sell an underlying asset under the contractual terms of the option at a price different from the current fair value.
The BB&T Special Opportunities Equity VIF had the following transactions in call options during the year ended December 31, 2006:
| BB&T Special Opportunities Equity VIF | |||||||||||
| Covered Call Options | Shares Subject to Contract | Premiums | |||||||||
| Balance at beginning of period | 65 | $ | 4,501 | ||||||||
| Options written | 1,431 | 235,036 | |||||||||
| Options closed | (950 | ) | (180,771 | ) | |||||||
| Options expired | (391 | ) | (19,744 | ) | |||||||
| Options exercised | — | — | |||||||||
| Balance at end of period | 155 | $ | 39,022 | ||||||||
The following is a summary of options outstanding as of December 31, 2006:
| Security | |||||||||||
| BB&T Special Opportunities Equity VIF | Shares Subject to Contract | Fair Value | |||||||||
| Consol Energy, Inc. $47.50, 1/20/07 | 90 | $ | 450 | ||||||||
| Consol Energy, Inc. $50.00, 1/20/07 | 65 | 325 | |||||||||
| 155 | $ | 775 | |||||||||
Dividends and Distributions—Dividends from net investment income are declared and paid quarterly for the Funds, with the exception of the BB&T Total Return Bond VIF, in which case dividends from net investment income are declared daily and paid monthly. Distributable net realized gains, if any, are declared and distributed at least annually.
The character of income and gains distributed are determined in accordance with federal income tax regulations, which may differ from GAAP. These "book/tax" differences are either considered temporary or permanent in nature. To the extent these differences are permanent in nature (e.g., reclass of market discounts, net operating loss, gain/loss, paydowns and distributions), such amounts are reclassified within the composition of net assets based on their federal tax-basis treatment; temporary differences (e.g., wash sales) do not require reclassification. Dividends to shareholders which exceed net investment income and net realized gains for tax purposes are reported as distributions of capital or return of capital.
Federal Income Taxes—It is the policy of the Funds to continue to qualify as regulated investment companies by complying with the provisions available to certain investment companies, as defined in applicable sections of the Internal Revenue Code, and to make distributions of net investment income and net realized capital gains sufficient to relieve it from all, or substantially all,
federal income taxes. Accordingly, no provision for federal income tax is required.
Other—Expenses directly attributable to a Fund are charged to that Fund. Expenses not directly attributable to a Fund are allocated proportionately among all Funds daily in relation to the net assets of each Fund or on another reasonable basis. Expenses which are attributable to more than one Trust are allocated across the BB&T Variable Insurance Funds and BB&T Funds Trusts, based upon relative net assets or on another reasonable basis. BB&T serves as the Investment Advisor for the BB&T Variable Insurance Funds and BB&T Funds Trusts.
26
BB&T Variable Insurance Funds
Notes to Financial Statements — (continued)
December 31, 2006
3. Purchases and Sales of Securities:
Purchases and sales of securities (excluding securities maturing less than one year from acquisition) for the year ended December 31, 2006 are as follows:
| Purchases | Sales | ||||||||||
| BB&T Large Cap VIF | $ | 48,936,912 | $ | 57,205,210 | |||||||
| BB&T Mid Cap Growth VIF | 59,016,629 | 56,598,727 | |||||||||
| BB&T Large Cap Growth VIF | 38,618,478 | 49,281,727 | |||||||||
| BB&T Capital Manager Equity VIF | 9,055,375 | 5,074,383 | |||||||||
| BB&T Special Opportunities Equity VIF | 24,508,421 | 18,152,385 | |||||||||
| BB&T Total Return Bond VIF | 32,835,101 | 24,951,106 | |||||||||
Purchases and sales of U.S. Government Securities (excluding securities maturing less than one year from acquisition) for the year ended December 31, 2006 for the BB&T Total Return Bond VIF were $11,143,372 and $11,925,796, respectively.
4. Related Party Transactions:
Investment advisory services are provided to the Funds by BB&T. Under the terms of the Investment Advisory Agreement, BB&T is entitled to receive fees based on a percentage of the average daily net assets of the Funds. These fees are accrued daily and payable on a monthly basis and are reflected on the Statements of Operations as "Investment advisory fees". BB&T voluntarily waived investment advisory fees which are included on the Statements of Operations as "Less expenses waived by the Investment Advisor".
Information regarding these transactions is as follows for the year ended December 31, 2006:
| Contractual Fee Rate | Fee Rate after Voluntary Waiver | ||||||||||
| BB&T Large Cap VIF* | 0.74 | % | 0.50 | % | |||||||
| BB&T Mid Cap Growth VIF* | 0.74 | % | 0.50 | % | |||||||
| BB&T Large Cap Growth VIF* | 0.74 | % | 0.50 | % | |||||||
| BB&T Capital Manager Equity VIF* | 0.25 | % | 0.00 | % | |||||||
| BB&T Special Opportunities Equity VIF | 0.80 | % | 0.80 | % | |||||||
| BB&T Total Return Bond VIF* | 0.60 | % | 0.50 | % | |||||||
* For all or a portion of the fiscal year ended December 31, 2006 BB&T voluntarily waived additional investment advisory fees for the BB&T Large Cap VIF, BB&T Mid Cap Growth VIF, BB&T Large Cap Growth VIF, BB&T Capital Manager Equity VIF and the BB&T Total Return Bond VIF. All voluntary investment advisory fee waivers are not subject to recoupment in subsequent fiscal periods, and may be discontinued at any time.
Pursuant to a Sub-Advisory agreement with BB&T, Scott & Stringfellow, Inc., a wholly owned subsidiary of BB&T Corporation, serves as the Sub-Advisor to the BB&T Special Opportunities Equity VIF, subject to the general supervision of the Trust's Board of Trustees and BB&T. Pursuant to a Sub-Advisory agreement with BB&T, Sterling Capital Management LLC, a wholly owned subsidiary of BB&T Corporation, serves as the Sub-Advisor to the BB&T Total Return Bond VIF, subject to the general supervision of the Trust's Board of Trustees and BB&T. For their services, the Sub-Advisors are entitled to a fee payable by BB&T.
BB&T serves the Funds as administrator. BB&T receives compensation for providing administration services at a rate of 0.12% of the BB&T Funds and BB&T Variable Insurance Funds aggregate average daily net assets up to $5 billion and a rate of 0.08% of the aggregate average daily net assets in excess of $5 billion. This fee is accrued daily and payable on a monthly basis. Expenses incurred are reflected on the Statements of Operations as "Administration fees". BB&T voluntarily waived administration fees of $30,036, of the BB&T Capital Manager Equity VIF. Administration fee waivers are included on the Statements of Operations as "Less expenses waived by the Administrator" and these waivers are not subject to recoupment in subsequent fiscal periods. Pursuant to a Sub-Administration Agreement with BB&T, BISYS Fund Services Ohio, Inc. ("BISYS Ohio") serves as sub-administrator to the Funds subject to the general supervi sion of the Funds' Board of Trustees and BB&T. For these services, BISYS Ohio is entitled to a fee, payable by BB&T. BISYS Ohio is a subsidiary of The BISYS Group, Inc.
BISYS Ohio serves the Funds as fund accountant and transfer agent and receives compensation for providing fund accounting and transfer agency services at a rate of 0.02% (0.01% for each service) of the average daily net assets of each Fund, plus certain out
27
BB&T Variable Insurance Funds
Notes to Financial Statements — (continued)
December 31, 2006
of pocket expenses. Expenses incurred are reflected on the Statements of Operations as "Fund accounting fees" and "Transfer agency fees", respectively.
Under a Compliance Services Agreement between the Trust and BISYS Ohio (the "CCO Agreement"), BISYS Ohio makes an employee available to serve as the Trust's Chief Compliance Officer (the "CCO"). Under the CCO Agreement, BISYS Ohio also provides infrastructure and support in implementing the written policies and procedures comprising the Funds' compliance program, including support services to the CCO. For services provided under the CCO Agreement, the Funds paid BISYS Ohio $35,000 for the reporting period ended December 31, 2006, plus certain out of pocket expenses. Expenses incurred for the Funds are reflected on the Statements of Operations as "Compliance service fees". BISYS Ohio pays the salary and other compensation earned by any such individuals as employees of BISYS Ohio.
For the year ended December 31, 2006, the Funds' paid $46,799 in brokerage fees to Scott & Stringfellow, Inc., on the execution of purchases and sales of the Funds' portfolio investments.
The Trust has adopted a Variable Contract Owner Servicing Plan (the "Service Plan") under which the Funds may pay a fee computed daily and paid monthly, at an annual rate of up to 0.25% of the average daily net assets of the Fund. A servicing agent may periodically waive all or a portion of its servicing fees. For the year ended December 31, 2006, the Funds did not participate in any service plans.
Certain Officers and Trustees of the Funds are affiliated with the adviser, the administrator, or the sub-administrator. Such Officers and Trustees receive no compensation from the Funds for serving in their respective roles. Each of the five non-interested Trustees who serve on both the Board and the Audit Committee are compensated $1,250 per quarter and $500 for each regularly scheduled meeting, plus reimbursement for certain expenses. During the year ended December 31, 2006, actual Trustee compensation was $41,628 in total.
5. Line of Credit:
U.S. Bank, N.A. has made available a credit facility to the Funds, pursuant to a Credit Agreement (the "Agreement"). The primary purpose of the Agreement is to allow the Funds to avoid security liquidation that BB&T believes are unfavorable to shareholders. Outstanding principal amounts under the Agreement bear interest at an interest rate equal to the Prime Rate minus 2.00%. At December 31, 2006, the following Fund utilized lines of credit:
| Average Interest Rate | Average Loan Balance | Number of Days Outstanding | Interest Expense Incurred | Maximum Amount Borrowed During The Period | |||||||||||||||||||
| BB&T Mid Cap Growth VIF | 6.25 | % | $ | 45,000 | 3 | $ | 23 | $ | 45,000 | ||||||||||||||
6. Federal Income Tax Information:
At December 31, 2006, the following Funds have net capital loss carryforwards available to offset future net capital gains, if any, to the extent provided by the Treasury regulations. To the extent that these carryforwards are used to offset future capital gains, it is probable that the gains that are offset will not be distributed to shareholders.
| Amount | Expires | ||||||||||
| BB&T Total Return Bond VIF | $ | 96,285 | 2013 | ||||||||
| BB&T Total Return Bond VIF | 62,902 | 2014 | |||||||||
The tax character of dividends paid to shareholders during the fiscal year ended December 31, 2006 were as follows:
| Distributions paid from | |||||||||||||||||||||||
| Ordinary Income | Net Long-Term Gains | Total Taxable Distributions | Tax Exempt Distributions | Total Distributions Paid* | |||||||||||||||||||
| BB&T Large Cap VIF | $ | 1,597,154 | $ | — | $ | 1,597,154 | $ | — | $ | 1,597,154 | |||||||||||||
| BB&T Mid Cap Growth VIF | 169,918 | 2,384,160 | 2,554,078 | — | 2,554,078 | ||||||||||||||||||
| BB&T Large Cap Growth VIF | 85,631 | 62,259 | 147,890 | — | 147,890 | ||||||||||||||||||
| BB&T Capital Manager Equity VIF | 351,849 | 967,984 | 1,319,833 | — | 1,319,833 | ||||||||||||||||||
| BB&T Special Opportunities Equity VIF | 304,495 | 1,526,428 | 1,830,923 | — | 1,830,923 | ||||||||||||||||||
| BB&T Total Return Bond VIF | 806,098 | — | 806,098 | — | 806,098 | ||||||||||||||||||
* Total Distributions paid may differ from the Statements of Changes in Net Assets because distributions are recognized when actually paid for tax purposes.
28
BB&T Variable Insurance Funds
Notes to Financial Statements — (continued)
December 31, 2006
The tax character of dividends paid to shareholders during the fiscal year ended December 31, 2005 were as follows:
| Distributions paid from | |||||||||||||||||||||||
| Ordinary Income | Net Long-Term Gains | Total Taxable Distributions | Tax Exempt Distributions | Total Distributions Paid* | |||||||||||||||||||
| BB&T Large Cap VIF | $ | 2,712,891 | $ | — | $ | 2,712,891 | $ | — | $ | 2,712,891 | |||||||||||||
| BB&T Large Cap Growth VIF | 183,178 | — | 183,178 | — | 183,178 | ||||||||||||||||||
| BB&T Capital Manager Equity VIF | 481,528 | — | 481,528 | — | 481,528 | ||||||||||||||||||
| BB&T Special Opportunities Equity VIF | 425,882 | — | 425,882 | — | 425,882 | ||||||||||||||||||
| BB&T Total Return Bond VIF | 704,135 | — | 704,135 | — | 704,135 | ||||||||||||||||||
* Total Distributions paid may differ from the Statements of Changes in Net Assets because distributions are recognized when actually paid for tax purposes.
At December 31, 2006, the components of accumulated earnings (deficit) on a tax basis were as follows:
| Undistributed Ordinary Income | Undistributed Long Term Capital Gains (Lossses) | Accumulated Earnings | Dividends Payable | Accumulated Capital and Other Losses | Unrealized Appreciation (Depreciation) | Total Accumulated Earnings (Deficit) | |||||||||||||||||||||||||
| BB&T Large Cap VIF | $ | 363,182 | $ | 11,116,847 | $ | 11,480,029 | $ | — | $ | — | $ | 20,981,336 | $ | 32,461,365 | |||||||||||||||||
| BB&T Mid Cap Growth VIF | 61,222 | 3,118,042 | 3,179,264 | — | — | 4,393,020 | 7,572,284 | ||||||||||||||||||||||||
| BB&T Large Cap Growth VIF | 54,847 | 778,965 | 833,812 | — | — | 1,741,118 | 2,574,930 | ||||||||||||||||||||||||
| BB&T Capital Manager Equity VIF | 342,625 | 1,766,591 | 2,109,216 | — | — | 1,932,877 | 4,042,093 | ||||||||||||||||||||||||
| BB&T Special Opportunities Equity VIF | 843,425 | 1,173,395 | 2,016,820 | — | — | 3,717,666 | 5,734,486 | ||||||||||||||||||||||||
| BB&T Total Return Bond VIF | 190,757 | — | 190,757 | (25,774 | ) | (197,377 | ) | (20,180 | ) | (52,574 | ) | ||||||||||||||||||||
Under current tax law, capital losses realized after October 31 of a Fund's fiscal year may be deferred and treated as occurring on the first business day of the following fiscal year for tax purposes. The BB&T Total Return Bond VIF had deferred post October capital of $38,190, which will be treated as arising on the first business day of the fiscal year ending December 31, 2007.
At December 31, 2006, the cost, gross unrealized appreciation and gross unrealized depreciation on securities for federal income tax purposes were as follows:
| Tax Cost | Tax Unrealized Appreciation | Tax Unrealized Depreciation | Net Unrealized Appreciation (Depreciation) | ||||||||||||||||
| BB&T Large Cap VIF | $ | 72,116,612 | $ | 21,178,835 | $ | (197,499 | ) | $ | 20,981,336 | ||||||||||
| BB&T Mid Cap Growth VIF | 21,046,773 | 4,625,925 | (232,905 | ) | 4,393,020 | ||||||||||||||
| BB&T Large Cap Growth VIF | 11,939,497 | 1,827,763 | (86,645 | ) | 1,741,118 | ||||||||||||||
| BB&T Capital Manager Equity VIF | 16,277,287 | 1,939,945 | (7,068 | ) | 1,932,877 | ||||||||||||||
| BB&T Special Opportunities Equity VIF | 18,294,549 | 3,753,244 | (73,825 | ) | 3,679,419 | ||||||||||||||
| BB&T Total Return Bond VIF | 7,187,774 | 34,514 | (54,694 | ) | (20,180 | ) | |||||||||||||
29
BB&T Variable Insurance Funds
Notes to Financial Statements — (continued)
December 31, 2006
7. Subsequent Event:
At the August 29, 2006 board meeting, the Board of Trustees approved, subject to shareholders' approval, a fund merger between the BB&T Large Cap VIF and the BB&T Large Cap Growth VIF. The merger was completed on February 12, 2007.
30
Report of Independent Registered Public Accounting Firm
The Shareholders and Board of Trustees of
BB&T Variable Insurance Funds:
We have audited the accompanying statements of assets and liabilities of BB&T Variable Insurance Funds – BB&T Large Cap VIF, BB&T Mid Cap Growth VIF, BB&T Large Cap Growth VIF, BB&T Capital Manager Equity VIF, BB&T Special Opportunities Equity VIF and BB&T Total Return Bond VIF (referred to individually as a Fund and collectively as the Funds) including the schedules of portfolio investments, as of December 31, 2006, and the related statements of operations for the year then ended, the statements of changes in net assets for each year in the two-year period then ended, and the financial highlights for each period in the five-year period then ended. These financial statements and financial highlights are the responsibility of the Funds' management. Our responsibility is to express an opinion on these financial statements and financial highlights based on our audits.
We conducted our audits in accordance with the standards of the Public Company Accounting Oversight Board (United States). Those standards require that we plan and perform the audit to obtain reasonable assurance about whether the financial statements and financial highlights are free of material misstatement. An audit includes examining, on a test basis, evidence supporting the amounts and disclosures in the financial statements. Our procedures included confirmation of securities owned as of December 31, 2006, by correspondence with custodians and brokers; where replies were not received from brokers, we performed other auditing procedures. An audit also includes assessing the accounting principles used and significant estimates made by management, as well as evaluating the overall financial statement presentation. We believe that our audits provide a reasonable basis for our opinion.
In our opinion, the financial statements and financial highlights referred to above present fairly, in all material respects, the financial position of the Funds as of December 31, 2006, the results of their operations for the year then ended, the changes in their net assets for each year in the two-year period then ended, and the financial highlights for each period in the five-year period then ended, in conformity with U.S. generally accepted accounting principles.
KPMG LLP
Columbus, Ohio
February 26, 2007
31
BB&T Variable Insurance Funds
Other Federal Income Tax Information
(Unaudited):
For corporate shareholders, the following percentage of the total ordinary income dividends paid the fiscal year ended December 31, 2006 qualify for the corporate dividends received deductions for the following Funds:
| Dividends Received Deduction | |||||||
| BB&T Large Cap VIF | 100.00 | % | |||||
| BB&T Mid Cap Growth VIF | 33.31 | % | |||||
| BB&T Large Cap Growth VIF | 100.00 | % | |||||
| BB&T Capital Manager Equity VIF | 100.00 | % | |||||
| BB&T Special Opportunities Equity VIF | 64.96 | % | |||||
In the calender year 2006 the following Funds distributed long-term capital gains (which includes amounts
designated as distributions to shareholders on the redemption of shares):
| BB&T Large Cap VIF | $ | 3,589,757 | |||||
| BB&T Mid Cap Growth VIF | 4,073,269 | ||||||
| BB&T Large Cap Growth VIF | 62,259 | ||||||
| BB&T Capital Manager Equity VIF | 967,984 | ||||||
| BB&T Special Opportunities Equity VIF | 2,159,609 | ||||||
32
BB&T Variable Insurance Funds
Other Information
December 31, 2006 (Unaudited)
A description of the policies and procedures that the Funds use to determine how to vote proxies relating to portfolio securities is available (i) without charge, upon request, by calling 1-800-228-1872; and (ii) on the Securities and Exchange Commission's ("the Commission") website at http://www.sec.gov.
Information regarding how the Funds voted proxies relating to portfolio securities during the most recent 12-month period ended June 30th is available (i) without charge, upon request, by calling 1-800-228-1872 and (ii) on the Commission's website at http://www.sec.gov.
The Funds file complete Schedules of Portfolio Holdings with the Commission for the first and third quarters of each fiscal year on Form N-Q. The Funds' Forms N-Q are available without charge on the Commission's website at http://www.sec.gov, or may be reviewed and copied at the Commission's Reference Room in Washington, D.C. Information on the operation of the Public Reference Room, may be obtained by calling 1-800-SEC-0330.
33
Special Meeting of the Shareholders (Unaudited):
On February 7, 2007, there was a special meeting of the shareholders of the BB&T Large Cap Growth VIF and the BB&T Large Cap VIF. The purpose of the meeting was: (1) to consider and act upon a Plan of Reorganization ("Reorganization Plan") adopted by the BB&T Variable Insurance Funds providing for the transfer of all the assets of the BB&T Large Cap Growth VIF in exchange for the BB&T Large Cap VIF and the assumption by the BB&T Large Cap VIF of all the liabilities of the BB&T Large Cap Growth VIF, followed by the dissolution and liquidation of the BB&T Large Cap Growth VIF and the distribution of Shares of the BB&T Large Cap VIF to the shareholders of the BB&T Large Cap Growth VIF, and (2) transact such other business as may properly come before the Special Meeting or any adjournment therof. A description of the proposal and the number of shares voted is as follows:
1. To consider and act upon an Agreement and Plan of Reorganization providing for the transfer of all of the assets of the BB&T Large Cap Growth VIF to the BB&T Large Cap VIF in exchange for Shares of the BB&T Large Cap VIF and the assumption by the BB&T Large Cap VIF of all the liabilities of the BB&T Large Cap Growth VIF, followed by the dissolution and liquidation of the BB&T Large Cap Growth VIF and the distribution of the BB&T Large Cap VIF to the shareholders of the BB&T Large Cap Growth VIF.
| AFFIRMATIVE | AGAINST | ABSTAIN | |||||||||
| 1,100,442 | 49,835 | 134,558 | |||||||||
2. To transact such other business as may properly come before the Special Meeting or any adjournment therof.
| AFFIRMATIVE | AGAINST | ABSTAIN | |||||||||
| 1,066,467 | 60,760 | 157,609 | |||||||||
34
BOARD CONSIDERATION OF ADVISORY AND SUB-ADVISORY AGREEMENTS (UNAUDITED)
The Board of Trustees, at a meeting held on August 29, 2006, formally considered BB&T Variable Insurance Funds' (the "Funds") investment advisory agreement with BB&T Asset Management, Inc. ("BB&TAM" or the "Adviser") and sub-advisory agreements of BB&TAM with Scott & Stringfellow, Inc. ("Scott & Stringfellow"), with respect to the Special Opportunities Equity VIF, and Sterling Capital Management LLC ("Sterling Capital"), with respect to the Total Return Bond VIF (collectively, the "Advisory Agreements"). Scott & Stringfellow and Sterling Capital are referred to as "Sub-Advisers" and, collectively with the Adviser, as the "Advisers."
The Trustees reviewed extensive material in connection with their review of the Advisory Agreements, including data from an independent provider of mutual fund data (as assembled by the Funds' sub-administrator) which included comparisons with industry averages for comparable funds for advisory fees and total fund expenses. The data reflected BB&TAM fee waivers in place, as well as BB&TAM's contractual investment advisory fee levels. The Board was assisted in its review by independent legal counsel, who provided a memorandum detailing the legal standards for review of the Advisory Agreements. The Board received a detailed presentation by BB&TAM, which included a Fund-by-Fund analysis of performance.
Presentations were also provided by each Sub-Adviser. The Board also received Fund-by-Fund profitability information from the Adviser, Scott & Stringfellow and Sterling Capital. The Board also deliberated outside the presence of management and the Advisers.
In their deliberations, each Trustee attributed different weights to various factors involved in an analysis of whether each Advisory Agreement should be continued, and no factor alone was considered determinative. The Trustees determined that the overall arrangements between the Trust and the Advisers, as provided in the Advisory Agreements, were fair and reasonable and that the continuance of the Advisory Agreements was in the best interests of each Fund and its shareholders.
The matters addressed below were considered and discussed by the Trustees in reaching their conclusions.
Nature, Extent and Quality of Services Provided by the Adviser
The Trustees received and considered information regarding the nature, extent, and quality of the services provided to each Fund under the Advisory Agreements. The Trustees took into account information furnished throughout the year at Trustee meetings, as well as materials furnished specifically in connection with the annual review process. The Trustees considered the background and experience of each Adviser's senior management and the expertise of investment personnel of each Adviser responsible for the day-to-day management of each Fund. The Trustees considered the overall reputation, and the capabilities and commitment of the Advisers to provide high-quality service to the Trust, and the Trustees' overall confidence in each Adviser's integrity.
The Trustees received information concerning the investment philosophy and investment processes applied by the Advisers in managing the Funds. The Trustees also considered information regarding regulatory compliance and compliance with the investment policies of the Funds. The Trustees evaluated the trading practices of Scott & Stringfellow, which engages in affiliated brokerage for a majority of the portfolio trades for the Funds it sub-advises. As part of this evaluation, the Trustees received information regarding safeguards employed, such as prohibitions on principal and cross-agency trades. The Trustees also evaluated the procedures of the Advisers designed to fulfill the Advisers' fiduciary duty to the Funds with respect to possible conflicts of interest, including the Advisers' codes of ethics (regulating the personal trading of its officers and employees).
Based on their review, the Trustees concluded that, with respect to the quality and nature of services to be provided by the Advisers, the scope of responsibilities was consistent with mutual fund industry norms, and that the quality of the services was wholly acceptable.
Investment Performance
The Trustees considered performance results of each Fund in absolute terms and relative to each Fund's benchmark index. It was noted that performance over the last twelve months was generally strong. During their review, the Trustees particularly considered the strong one-year performance of the Mid Cap Growth VIF.
After reviewing the performance of each Fund, and taking into consideration the management style, investment strategies, and prevailing market conditions during the prior year and for longer periods, the Trustees concluded that the performance of each of the Funds was generally strong and that in cases where performance issues were encountered, the Adviser was properly addressing the situation.
Cost of Services, Including the Profits Realized by the Advisers and Affiliates
The Trustees considered peer group comparable information with respect to the advisory fees charged by BB&TAM to each of the Funds, taking into consideration both contractual and actual (i.e., after waiver) fee levels. The Trustees concluded that the investment advisory fees fell within an acceptable range as compared to peer groups, particularly in light of the fee waivers that would be continued in the upcoming year.
As part of their review, the Trustees considered benefits to the Adviser aside from investment advisory fees. The Trustees reviewed administration fees received by BB&TAM and considered the fallout benefits to BB&TAM such as the research services available to the
35
Adviser by reason of brokerage commissions generated by the Funds' turnover. The Trustees also considered benefits to BB&TAM's affiliates, including brokerage commissions received by Scott & Stringfellow for executing trades on behalf of the Special Opportunities Equity VIF and sub-advisory fees received by its affiliate, Sterling Capital, for its management of the Total Return Bond VIF. With respect to Scott & Stringfellow, the Trustees noted that brokerage commissions were paid at a standard commission rate, which was consistent with that used by the Adviser and that such brokerage arrangements were considered by the Sub-Adviser to be advantageous in terms of superior access to the market.
Consideration of the reasonableness of advisory fees also took into account, where relevant, the profitability of the Advisers. In determining whether all other investment advisory and sub-advisory fees were reasonable, the Trustees reviewed profitability information provided by the Advisers with respect to investment advisory services. With respect to such information, the Trustees recognized that such profitability data was generally unaudited and represented an Adviser's own determination of its and its affiliates' revenues from the contractual services provided to the Funds, less expenses of providing such services. Expenses include direct and indirect costs and were calculated using an allocation methodology developed by the Adviser. The Trustees also recognized that it is difficult to make comparisons of profitability from fund investment advisory and sub-advisory contracts, because comparative information is not generally publicly ava ilable and is affected by numerous factors. Based on their review, the Trustees concluded that the profitability to BB&TAM and its affiliates as a result of their relationships with the Funds was acceptable. With respect to non-affiliated sub-adviser profitability, the Trustees noted that while information regarding the profitability of non-affiliated sub-advisers was not available, it also was not helpful in assessing the continuance of the Advisory Agreements. The Board also concluded that the fees under the Advisory Agreements were fair and reasonable, in light of the services and benefits provided to each Fund.
Economies of Scale
The Trustees also considered whether fee levels reflect economies of scale and whether economies of scale would be produced by the growth of the Trust's assets. The Trustees found that the Adviser over the last two years had generally reduced total fund expense ratios through contract negotiations and fee waivers. The Trustees found that fee waivers entered into by the Adviser allowed investors to enjoy economies of scale appropriately and concluded that contractual breakpoints would not necessarily be required at this time to assure that future economies of scale, when and if achieved, would be shared with shareholders based on the Adviser's current record of responsible action in this regard.
36
Information about Trustees and Officers
(Unaudited)
Overall responsibility for the management of the Funds rests with its Board of Trustees ("Trustees"), who are elected by the Shareholders of the BB&T Variable Insurance Funds ("Funds"). The Trustees elect the officers of the Funds to supervise actively its day-to-day operations. The names of the Trustees, their addresses, birthdate, term of office and length of time served, principal occupations during the past five years, number of portfolios overseen and directorships held outside of the Funds are set below:
| Name, Address and Birthdate | Position(s) Held with BB&T | Term of Office/ Length of Time Served | Principal Occupation During the Past 5 Years | Number of Portfolios in Fund Complex Overseen by Trustee | Other Directorships Held | ||||||||||||||||||
| Thomas W. Lambeth 700 Yorkshire Road Winston-Salem, NC 27106 Birthdate: 1/35 | Trustee, Chairman of the Board of Trustees | Indefinite, 2/05—Present | From January 2001 to present, Senior Fellow, Z. Smith Reynolds Foundation; From 1978 to January 2001, Executive Director, Z. Smith Reynolds Foundation. | 32 | None | ||||||||||||||||||
| Drew T. Kagan Montecito Advisors, Inc. 810 N. Jefferson St., Ste 101. Lewisburg, WV 24901 Birthdate: 2/48 | Trustee | Indefinite, 2/05—Present | From December 2003 to present, President and Director, Montecito Advisors, Inc; from March 1996 to December 2003, President, Investment Affiliate, Inc. | 32 | None | ||||||||||||||||||
| Laura C. Bingham Peace College Office of the President 15 East Peace Street Raleigh, NC 27604-1194 Birthdate: 11/56 | Trustee | Indefinite, 2/05—Present | From July 1998 to present, President of Peace College. | 32 | None | ||||||||||||||||||
| Douglas R. Van Scoy 841 Middle St. Sullivans Island, SC 26481 Birthday: 11/43 | Trustee | Indefinite, 2/05—Present | Retired; From November 1974 to July 2001, Deputy Director of Private Client Group and Senior Executive Vice President of Smith Barney (investment banking). | 32 | None | ||||||||||||||||||
| James L. Roberts 207 Highland Terrace Breckenridge, CO 80424 Birthday: 11/42 | Trustee | Indefinite, 2/05—Present | Retired; From January 1999 to December 2003 President, CEO and Director, Covest Bancshares, Inc. | 32 | None | ||||||||||||||||||
The following table shows information for trustees who are "interested Persons" of BB&T Variable Insurance Funds as defined in the 1940 Act:
| Number of Portfolios in Fund Complex Overseen by Trustee | Other Directorships Held | ||||||||||||||||||||||
| *Keith F. Karlawish 434 Fayetteville Street, 5th Floor Raleigh, NC 27601 Birthdate: 8/64 | Trustee and President | Indefinite, 6/06—Present, 2/05—Present | From May 2002 to present, President, BB&T Asset Management, Inc.; from 1996 to 2002, Senior Vice President and Director of Fixed Income, BB&T Asset Management, Inc. | 32 | None | ||||||||||||||||||
Mr. Karlawish is treated by the Funds as an "interested person" (as defined in Section 2(a)(19) of the 1940 Act) of the Funds.
Mr. Karlawish is an "interested person" because he owns shares of BB&T Corporation and is the President of BB&T Asset Management, Inc., the Adviser.
37
Information about Trustees and Officers — (continued)
(Unaudited)
The following table shows information for officers of BB&T Variable Insurance Funds:
| Name and Birthdate | Position(s) Held with BB&T VIF | Term of Office/ Length of Time Served | Principal Occupation During the Past 5 Years | ||||||||||||
| E.G. Purcell, III Birthdate: 1/55 | Vice President | Indefinite, 2/05—Present | From 1995 to present, Senior Vice President, BB&T Asset Management, Inc. and its predecessors | ||||||||||||
| James T. Gillespie Birthdate: 11/66 | Vice President and Secretary | Indefinite, 2/05—Present, 8/06—Present | From February 2005 to present, Vice President of BB&T Asset Management; from 1992 to 2005, Director, BISYS Fund Services | ||||||||||||
| Todd M. Miller Birthdate: 9/71 | Vice President | Indefinite, 8/05—Present | From June 2005 to Present, Investment Officer and Mutual Fund Administrator, BB&T Asset Management; from May 1993 to May 2005, Manager, BISYS Fund Services | ||||||||||||
| Rodney Ruehle Birthdate: 4/68 | Vice President, Chief Compliance Officer and AML Compliance Officer | Indefinite, 2/06—Present | From August 1995 to present, Fund Compliance Officer, BISYS Fund Services. | ||||||||||||
| Troy A. Sheets Birthdate: 5/71 | Treasurer | Indefinite, 2/05—Present | From April 2002 to present, Vice President, BISYS Fund Services; from September 1993 to April 2002, Senior Manager, KPMG LLP | ||||||||||||
| Christopher E. Sabato Birthdate: 12/68 | Assistant Treasurer | Indefinite, 2/05—Present | From February 1993 to present, Vice President, BISYS Fund Services | ||||||||||||
The Funds Statement of Additional Information includes information about the Funds' Trustees. To receive your free copy of the Statement of Additional Information, call toll free: 1-800-453-7348.
38
(a) The registrant has adopted a code of ethics that applies to the registrant’s principal executive officer, principal financial officer, principal accounting officer or controller, or persons performing similar functions. This code of ethics is included as an Exhibit.
(b) During the period covered by the report, with respect to the registrant’s code of ethics that applies to its principal executive officer, principal financial officer, principal accounting officer or controller, or persons performing similar functions; there have been no amendments to, nor any waivers granted from, a provision that relates to any element of the code of ethics definition enumerated in paragraph (b) of this Item 2.
Item 3. Audit Committee Financial Expert.
3(a)(1) The registrant’s board of directors has determined that the registrant has at least one audit committee financial expert serving on its audit committee.
3(a)(2) The audit committee financial expert is Drew Kagan, who is “independent” for purposes of this Item 3 of Form N-CSR.
Item 4. Principal Accountant Fees and Services.
(a) |
| Audit Fees |
| 2005 |
| $ | 57,300 |
|
|
|
|
| 2006 |
| $ | 56,000 |
|
|
|
|
|
|
|
|
| |
(b) |
| Audit — Related Fees |
| 2005 |
| $ | 4,600 |
|
|
|
|
| 2006 |
| $ | 4,650 |
|
|
| 2005- Fees of $4,600 relate to the review and consent of the N-1A filing. |
|
|
|
|
| |
|
| 2006- Fees of $4,650 relate to the review and consent of the N-1A filing. |
|
|
|
|
| |
|
|
|
|
|
|
|
| |
(c) |
| Tax Fees |
| 2005 |
| $ | 13,200 |
|
|
|
|
| 2006 |
| $ | 13,800 |
|
|
|
|
|
|
|
|
| |
|
| Fees for both 2005 & 2006 relate to the preparation of federal income & excise tax returns. |
|
|
| |||
|
|
|
|
|
|
|
| |
(d) |
| All Other Fees |
| 2005 |
| $ | 0 |
|
|
|
|
| 2006 |
| $ | 0 |
|
2
(e)(1) Except as permitted by Rule 2-01(c)(7)(i)(C) of Regulation S-X, the Trust’s Audit Committee must pre-approve all audit and non-audit services provided by the independent accountants relating to the operations or financial reporting of the funds. Prior to the commencement of any audit or non-audit services to a fund, the Audit Committee reviews the services to determine whether they are appropriate and permissible under applicable law.
(e)(2) None of the services summarized in (b)-(d), above, were approved by the Audit Committee pursuant to Rule 2-01(c)(7)(i)(C) of Regulation S-X.
(f) Not applicable.
(g) |
| 2005 |
| $512,000 |
|
| 2006 |
| $704,484 |
(h) In regards to Item (g), the audit committee considered the nonaudit services rendered to the registrant’s investment adviser and any entity controlling, controlled by, or under common control with the investment adviser, and believes the principal accountants independence has not been compromised.
Item 5. Audit Committee of Listed Registrants.
Not applicable.
Item 6. Schedule of Investments.
Not applicable.
Item 7. Disclosure of Proxy Voting Policies and Procedures for Closed-End Management Investment Companies.
Not applicable.
Item 8. Portfolio Managers of Closed-End Management Investment Companies.
Not applicable.
Item 9. Purchases of Equity Securities by Closed-End Management Investment Company and Affiliated Purchasers.
Not applicable.
Item 10. Submission of Matters to a Vote of Security Holders.
Not applicable.
Item 11. Controls and Procedures.
(a)The registrant’s principal executive officer and principal financial officer have concluded, based on their evaluation of the registrant’s disclosure controls and procedures as conducted within 90 days of the filing date of this report, that these disclosure controls and procedures are adequately designed and are operating effectively to ensure that information required to be disclosed by the registrant on Form N-CSR is recorded, processed, summarized and reported within the time periods specified in the Securities and Exchange Commission’s rules and forms.
(b)There were no changes in the registrant’s internal control over financial reporting (as defined in Rule 30a-3(d) under the Act (17 CFR 270.30a-3(d)) that occurred during the second fiscal quarter of the period covered by this report that have materially affected or are reasonably likely to materially affect, the registrant’s internal control over financial reporting.
(a)(1) The code of ethics that is the subject of the disclosure required by Item 2 is attached hereto.
(a)(2) Certifications pursuant to Rule 30a-2(a) are attached hereto.
3
(a)(3) Not applicable.
(b) Certifications pursuant to Rule 30a-2(b) are furnished herewith.
4
SIGNATURES
Pursuant to the requirements of the Securities Exchange Act of 1934 and the Investment Company Act of 1940, the registrant has duly caused this report to be signed on its behalf by the undersigned, thereunto duly authorized.
(Registrant) | BB&T Variable Insurance Funds |
| ||||
|
|
| ||||
By (Signature and Title) | /s/Troy A. Sheets |
| ||||
| Troy A. Sheets, Treasurer |
| ||||
|
|
| ||||
|
|
| ||||
Date: | March 1, 2007 |
| ||||
Pursuant to the requirements of the Securities Exchange Act of 1934 and the Investment Company Act of 1940, this report has been signed below by the following persons on behalf of the registrant and in the capacities and on the dates indicated.
By (Signature and Title) | /s/Keith F. Karlawish |
| |||
| Keith F. Karlawish, President |
| |||
|
|
| |||
|
|
| |||
Date: | March 1, 2007 |
| |||
By (Signature and Title) | /s/Troy A. Sheets |
| |||
| Troy A. Sheets, Treasurer |
| |||
|
|
| |||
|
|
| |||
Date: | March 1, 2007 |
| |||