GeothermEx, Inc.
______________________________________________________________________________
Several other events in the history of the Mammoth Pacific project have significantly affected reservoir performance and have bearing on the question of improving the injection strategy, or have helped in the assessment of project capacity expansion. These include:
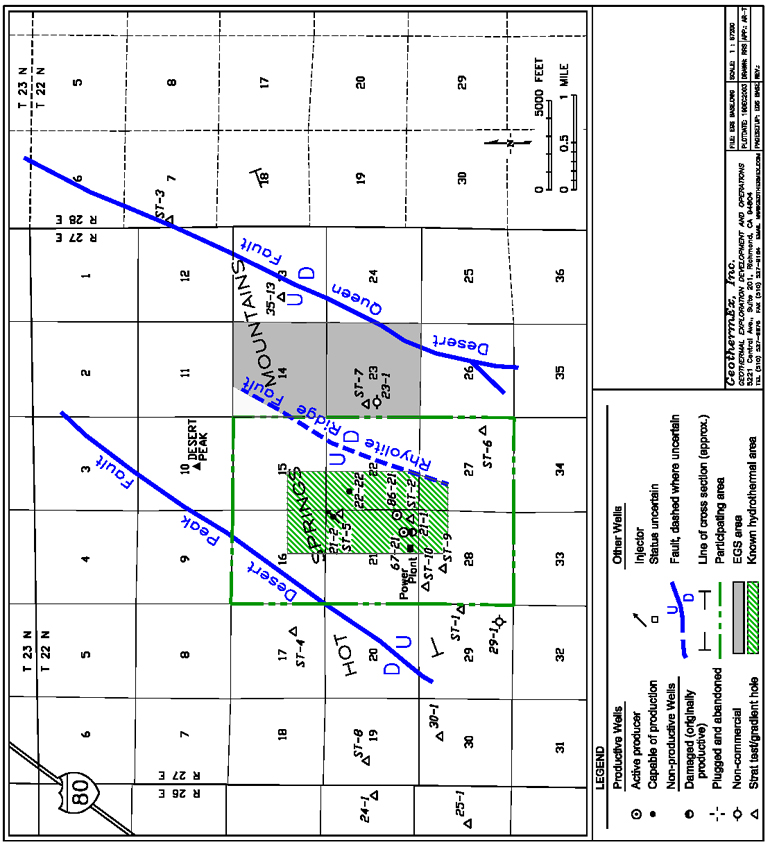
A geologic model of the reservoir, based on surface geology and subsurface information from the exploration and development wells, was used to assist in estimating the average thickness, area and temperature of the reservoir. These parameters are required for the estimation of recoverable geothermal energy reserves, as discussed below. The geologic model postulates that a gently-dipping slab of high temperature rock underlies the lease area. This slab is heated by the flow of thermal fluid through aquifers contained within the slab. The wells that penetrate the entire thickness of the slab show temperatures decreasing beneath it. Consequently, the location where upwelling hot water enters the slab is not known. It is highly probable, however, that the heat source, and overlying fluid up-flow zone, is located either beneath one or more of the young volcanic domes located within and north of the lease area, or beneath Mammoth Mountain, a young volcano, located to the southwest of the lease area (Figure 2.1).
The direction of migration of the fluid through the aquifers is controlled by structures that developed as a consequence of uplift and doming of the stratified volcanic formations in the Long Valley Caldera. The center of uplift is located in the center of the caldera. Uplift caused extensional faulting in the center of the caldera, directly above the uplift, as well as tilting of strata away from the center toward the caldera margin. The NNW-trending fault paralleling Highway 395 on the west (see Figure 2.1), herein referred to as the 395 Fault, is a result of extension and fracturing over the uplift.
Based on this model, it is postulated that thermal fluid enters the aquifers down-dip, near either the volcanic domes or Mammoth Mountain, and migrates up-dip to the east due to buoyancy. Up-dip migration is halted at the 395 Fault because fault movement has juxtaposed impermeable strata on the east side of the fault against the aquifers on the west side. Further upward migration, however, is possible within the aquifers along the west side of the fault. Due to the orientation of the aquifers with respect to the orientation of the fault, the new direction of migration is upward and to the southeast. Thermal fluid reaches the surface near the present production area at Casa Diablo Hot Springs.
Chemically, the thermal fluid is a low-salinity (about 940 to 1,000 mg/l) water with approximately equal amounts of chloride and alkalinity measured as bicarbonate, and lesser sulfate. Chloride ranges from about 230 to 250 mg/l.
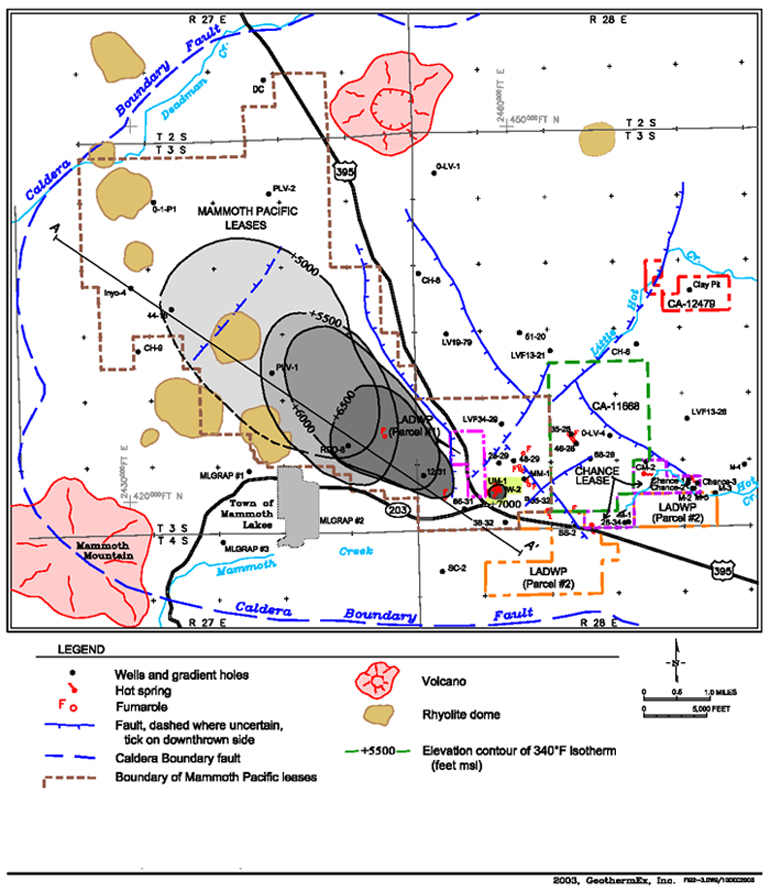
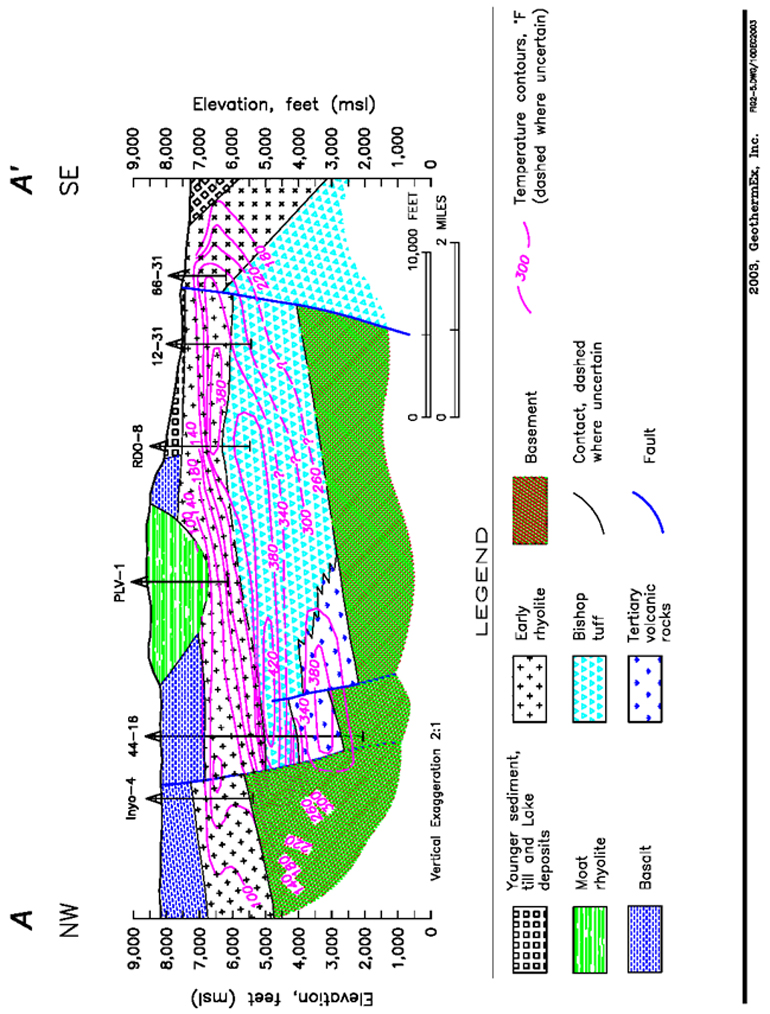
The distribution of subsurface temperature in the reservoir has been estimated based on temperatures measured in the exploration wells and on the reservoir model described above. Figure 2.3 shows the 340°F isothermal surface at
5221 CENTRAL AVENUE, SUITE 201
RICHMOND, CALIFORNIA 94804-5829
GeothermEx, Inc.
______________________________________________________________________________
TELEPHONE: (510) 527-9876
FAX: (510) 527-8164
E-MAIL: mw@geothermex.com
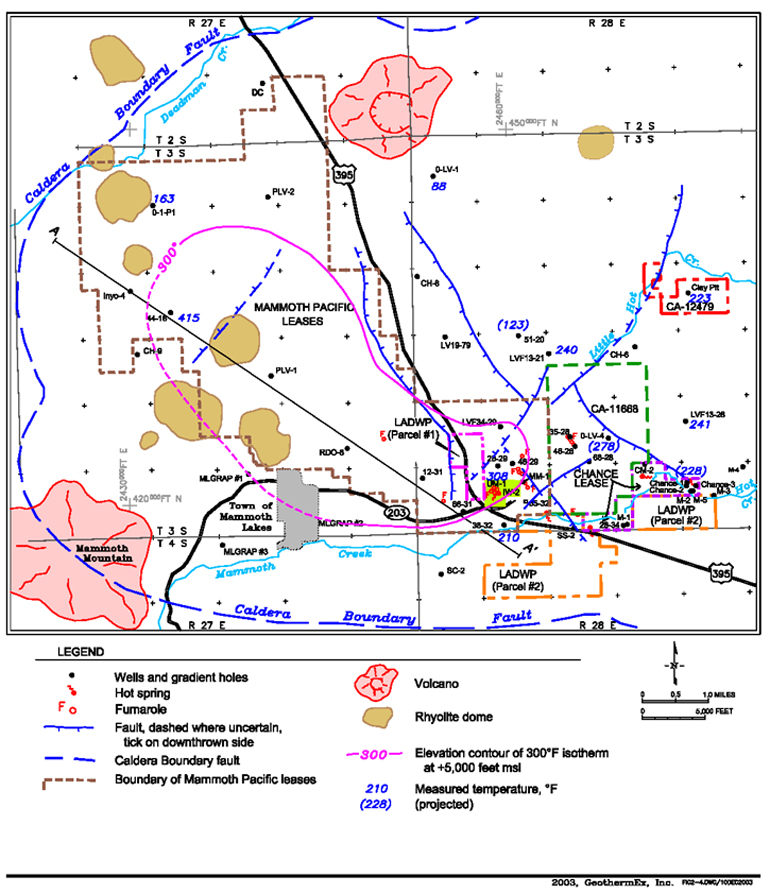
500-foot intervals between the elevations of +5,000 and +7,000 feet msl. This three-dimensional distribution of the isothermal surface shows it decreasing in size and migrating southeastward along the southwest side of the 395 Fault at each successive higher elevation, reflecting the fluid migration path proposed above. Figure 2.4 shows the 300°F temperature contour line at the elevation of +5,000 feet msl, which corresponds to an average depth of approximately 4,000 feet. The area of the reservoir is taken as the area outlined by this isotherm, considered the minimum useful resource temperature for electrical generation. The area enclosed by the 300°F isotherm, and within the lease area, is approximately 14.6 square miles. For the purpose of reserve estimation, this is considered the most likely reservoir area. However, because of the uncertainty associated with the fact that the estimate is based on a limited number of exploration holes, minimum and maximum areas are estimated at 7.3 and 21.9 square miles, respectively.
Reservoir thickness is equated to the thickness of the tilted slab heated by the thermal aquifers. Utilizing the cut-off temperature of 300°F, the heated slab has a estimated maximum thickness of 2,800 feet at the northwestern end of the lease area (as indicated in well 44-16) and an estimated minimum thickness of 1,400 feet at the southeastern end of the lease area (as indicated in well 12-31). The basis for these measurements is shown in Figure 2.5, which is a northwest-trending combined geologic and temperature cross-section through the field. For reserve estimation the minimum and maximum reservoir thicknesses are estimated at 1,400 and 2,800 feet, respectively.
As stated, the minimum reservoir temperature considered to be commercially useful is 300°F. The maximum measured reservoir temperature (well 44-16) is 425°F. The average of these temperatures is 362°F. Assuming that this average is also the most likely reservoir temperature, and that there is an uncertainty in the estimates of about plus or minus 20°F, then for the purpose of reserve estimation, minimum, maximum and most likely average reservoir temperatures are taken as 342°F, 382°F and 362°F, respectively.
The recoverable heat energy beneath the Mammoth-Pacific lease area can be evaluated by estimating the average thickness, area, temperature and other properties of the rock that contains the geothermal reservoir. We have used a volumetric reserve estimation methodology, which is described in detail in Appendix D. The minimum and maximum values for porosity and recovery factor are considered to have equal probability. The range of porosity is estimated to be 3 to 7%, and recovery factor is estimated to range from 5 to 20%. The rejection temperature was taken as 55°F.
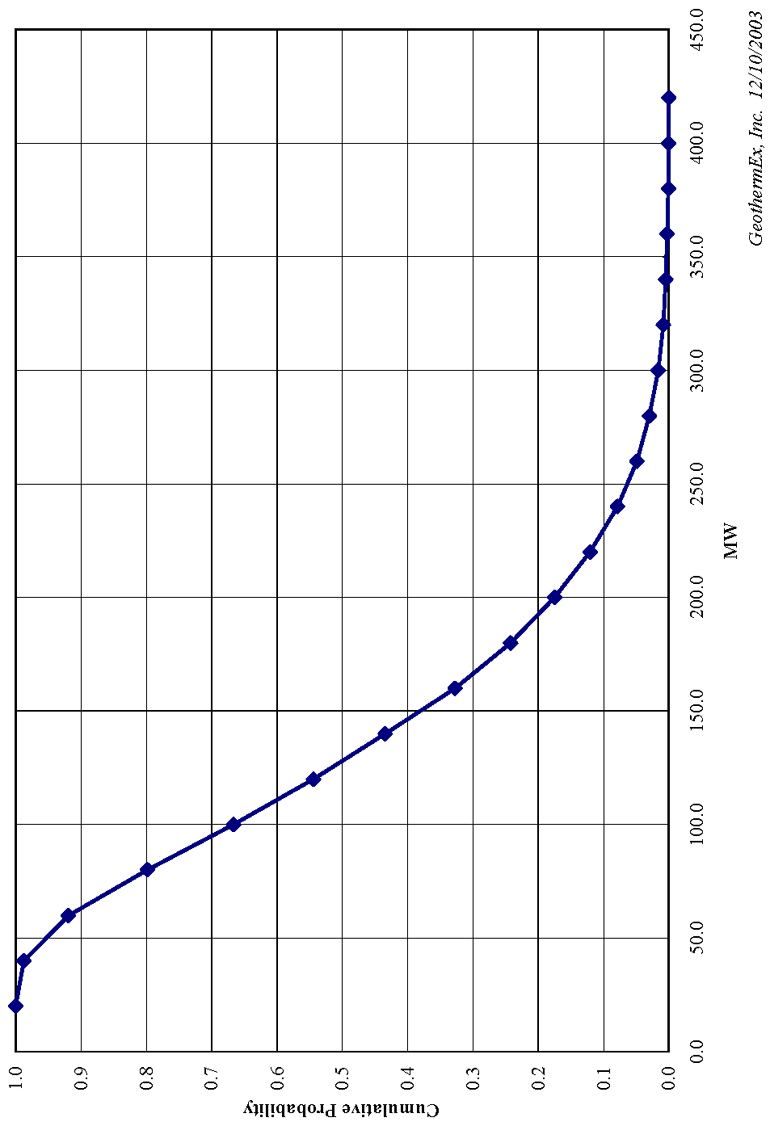
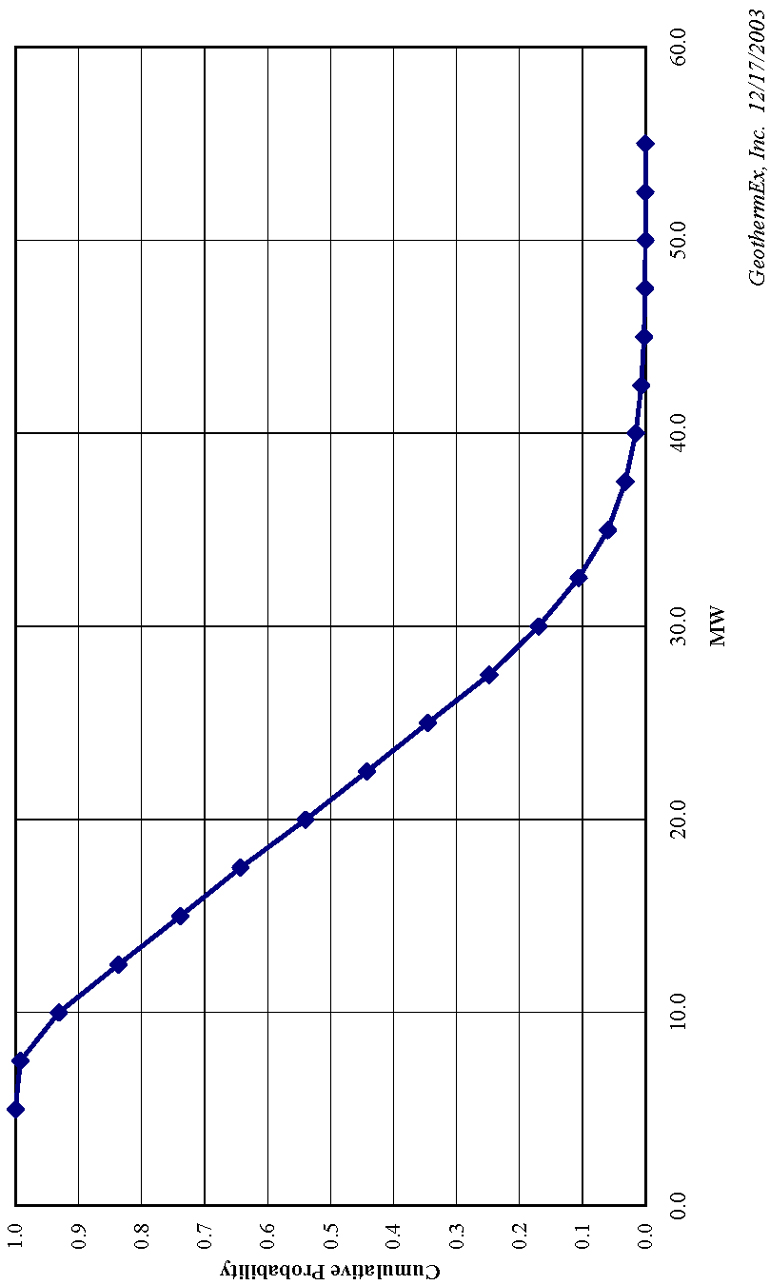
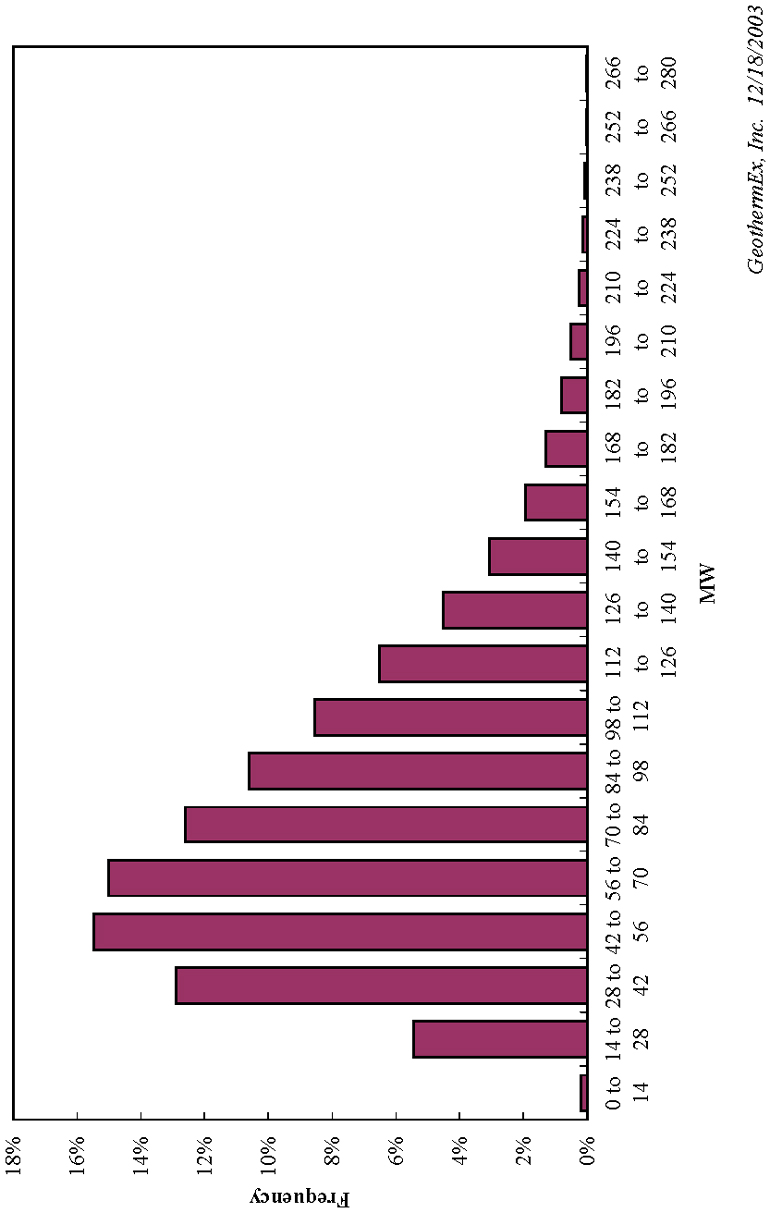
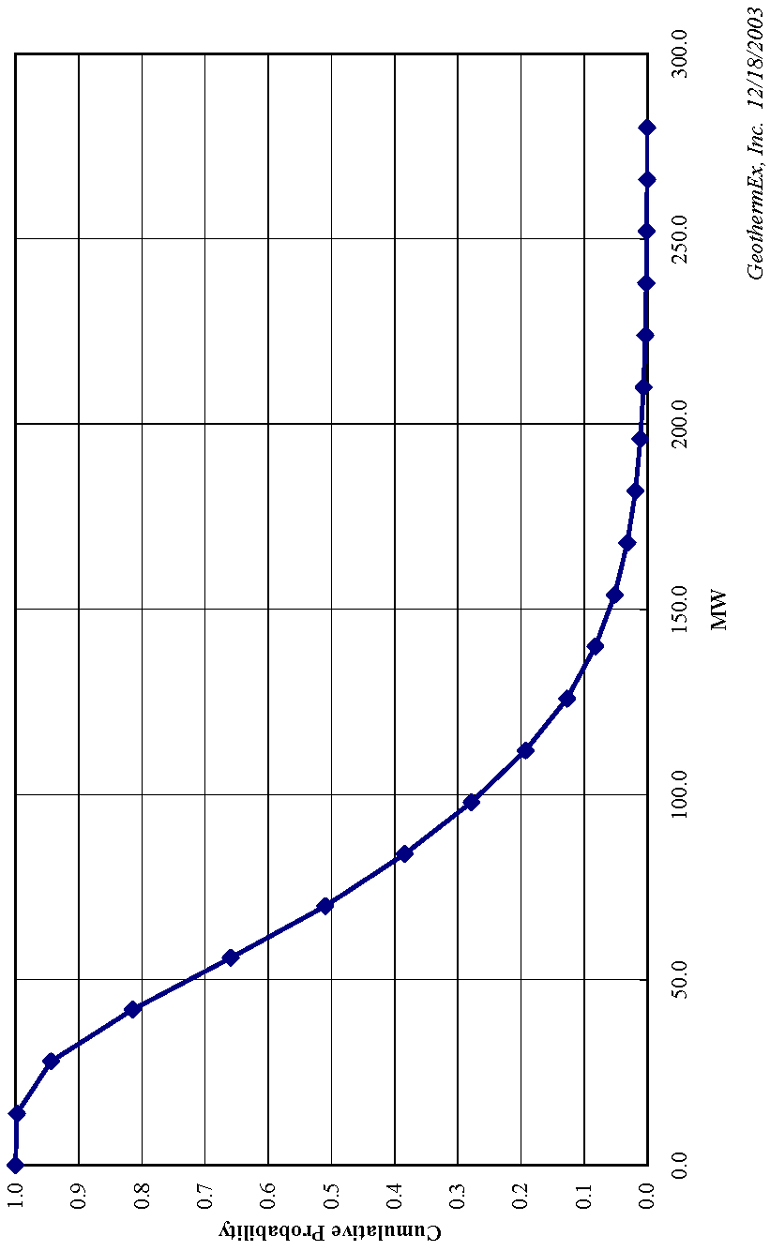
Figure 2.6 shows the histogram of the estimated reserves in gross megawatts for the Mammoth-Pacific lease area. The results indicate that the geothermal energy reserve has a most-likely value of about 90 MW (gross) for 30 years. Figure 2.7 presents the results of reserve estimation in the form of a cumulative probability distribution; this figure shows that the reserves exceed 63 MW (gross) for 30 years with a cumulative probability of 90%.
2.3 Resource Utilization Plan
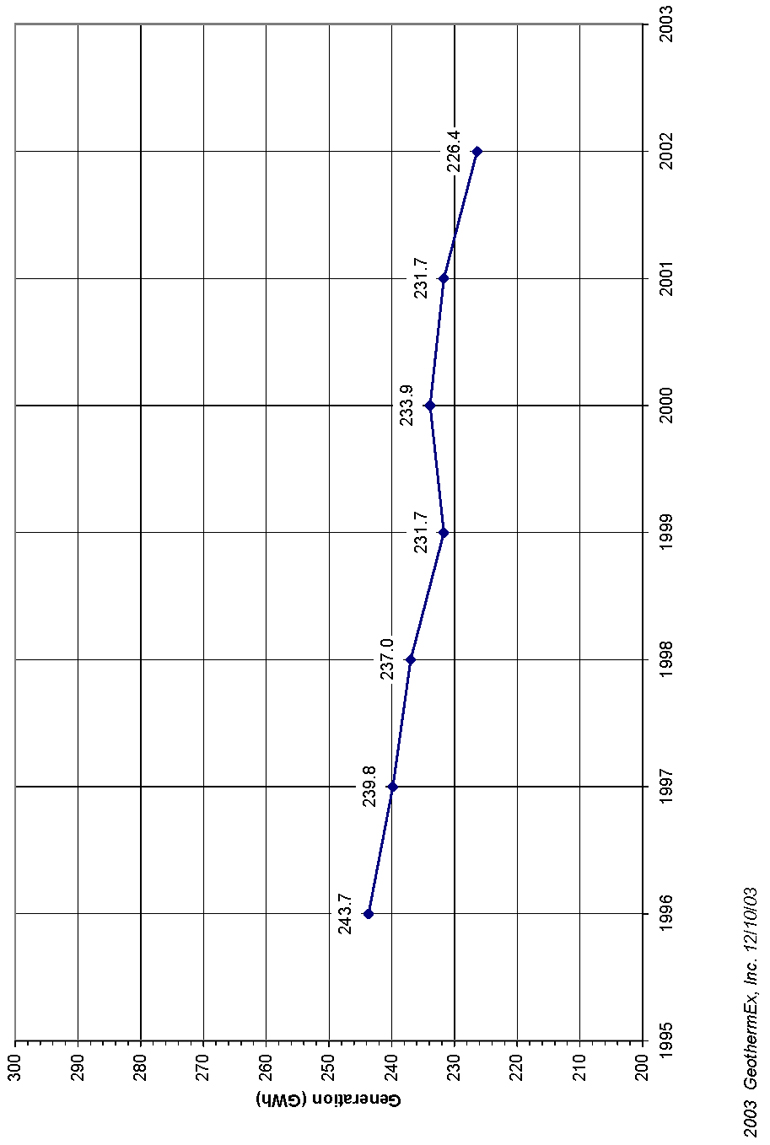
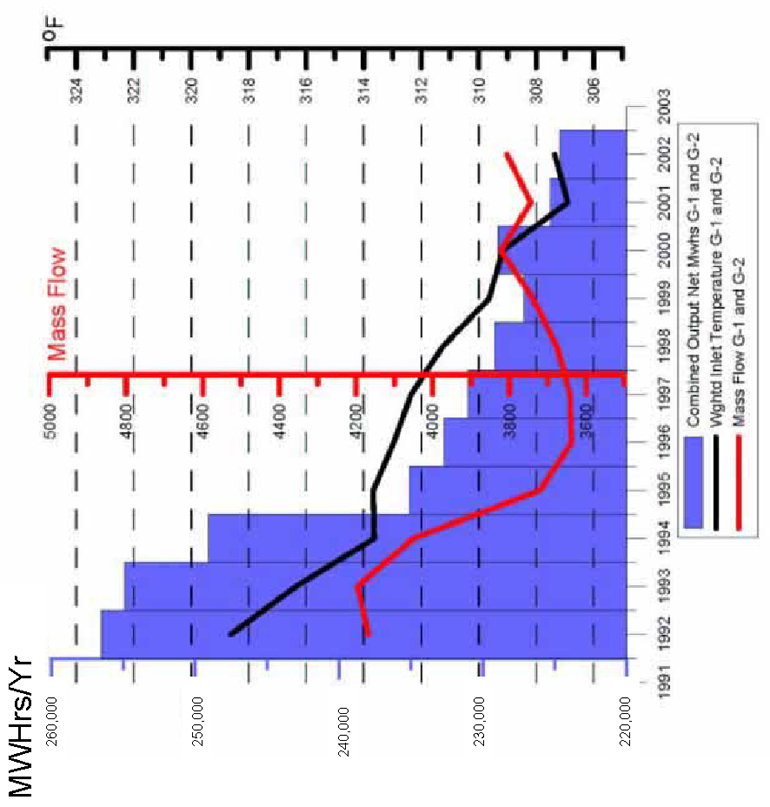
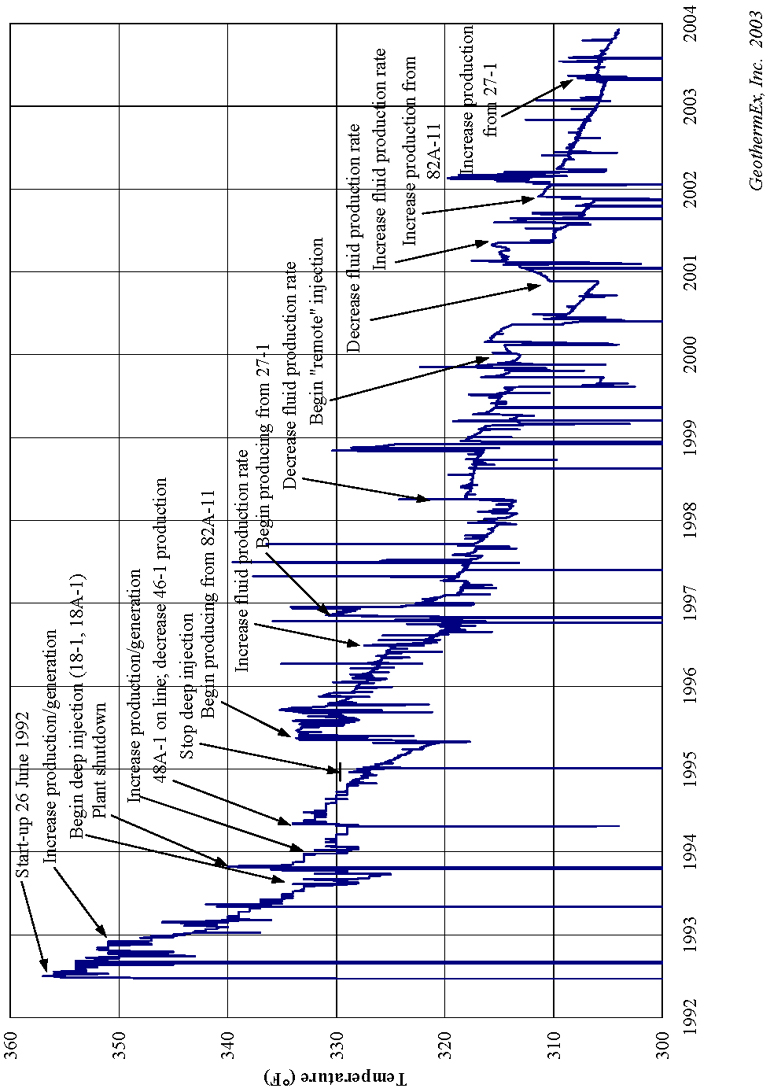
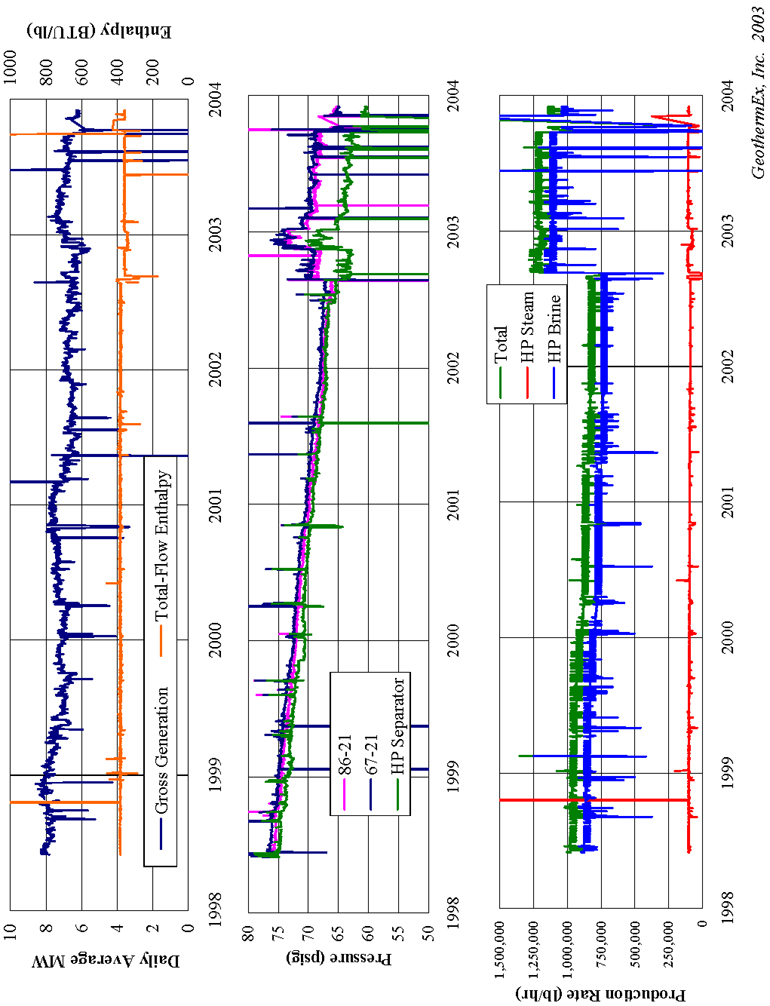
The most critical site-specific issues in the management of the geothermal resource at Mammoth are temperature decline and pressure decline. For several years, the temperature decline has constrained the project's ability to operate at full power, as evidenced by a steady decline in annual gigawatt-hours (GWh) generated (from 243.7 GWh in 1996 to 226.4 GWh in 2002) (Figure 2.8). The pressure decline has affected the feasibility and cost of operating downhole production pumps. Both these issues appear to be manageable with the appropriate configuration of production and injection wells, and to some extent may be mitigated by improvements in surface facilities. The following discussion illustrates how these issues have affected the operating history of the project. The focus is on the operating history since 1991, essentially the period since the start-up of the G 2 and G 3 plants.
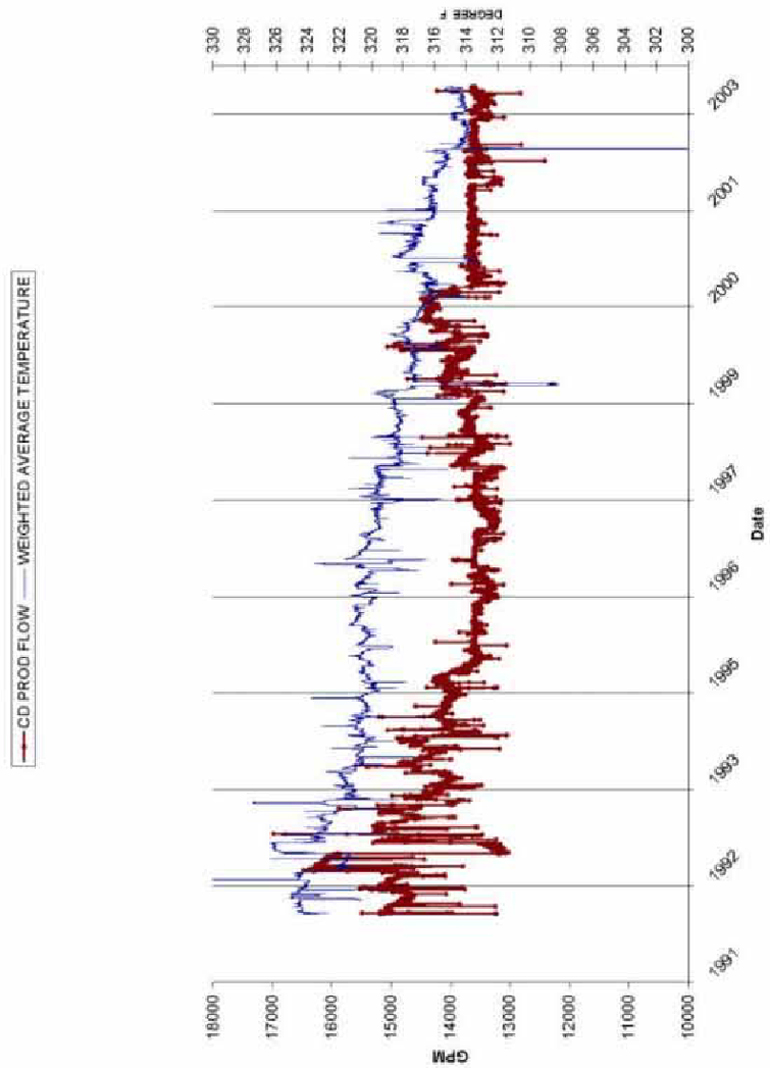
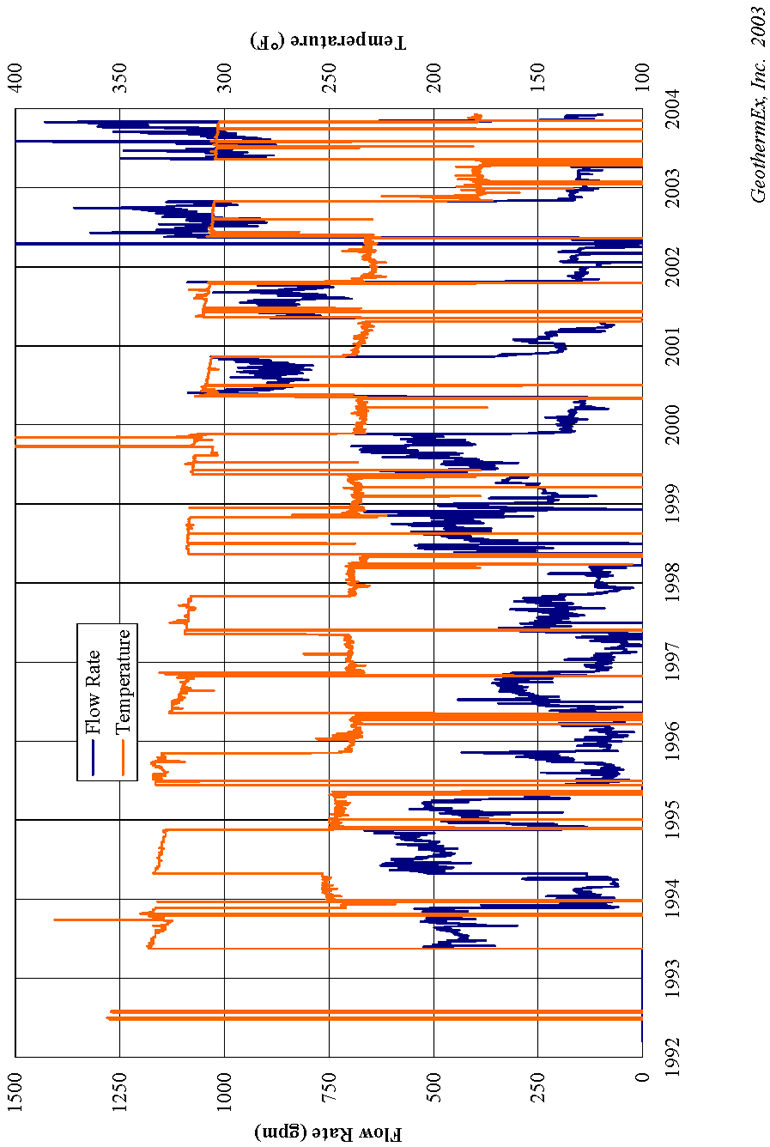
Figure 2.9 shows the trend in average production temperatures. For comparison, the figure includes the total production rate in gallons per minute (gpm). The field-wide step-rate test from August 1992 to January 1993 (most clearly seen in a dip in flow rate to 13,000 gpm and a corresponding peak in temperature at 326°F) illustrated that there was an inverse relationship between flow rate and temperature: the harder the production wells were pumped, the lower the average temperature. To some extent, this effect was reversible; the operator could raise the average temperature again by cutting back on the flow rate. There was, however, an underlying trend toward lower
2-3
5221 CENTRAL AVENUE, SUITE 201
RICHMOND, CALIFORNIA 94804-5829
GeothermEx, Inc.
______________________________________________________________________________
TELEPHONE: (510) 527-9876
FAX: (510) 527-8164
E-MAIL: mw@geothermex.com
temperatures, as illustrated in the decline from about 324°F in 1991 to about 320.5°in 1995, even though production rates were generally trending downward. This was primarily because of continued seepage of some injection water into the Early Rhyolite production interval, despite the workovers of injection wells that attempted to confine injection to the underlying Bishop Tuff. Still, as discussed above, the rates of temperature decline from 1991 to 1995 were much less than the steep declines before the injection well workovers were performed. From 1995 to about 1997, flow rates were held essentially steady, and temperatures remained nearly constant.
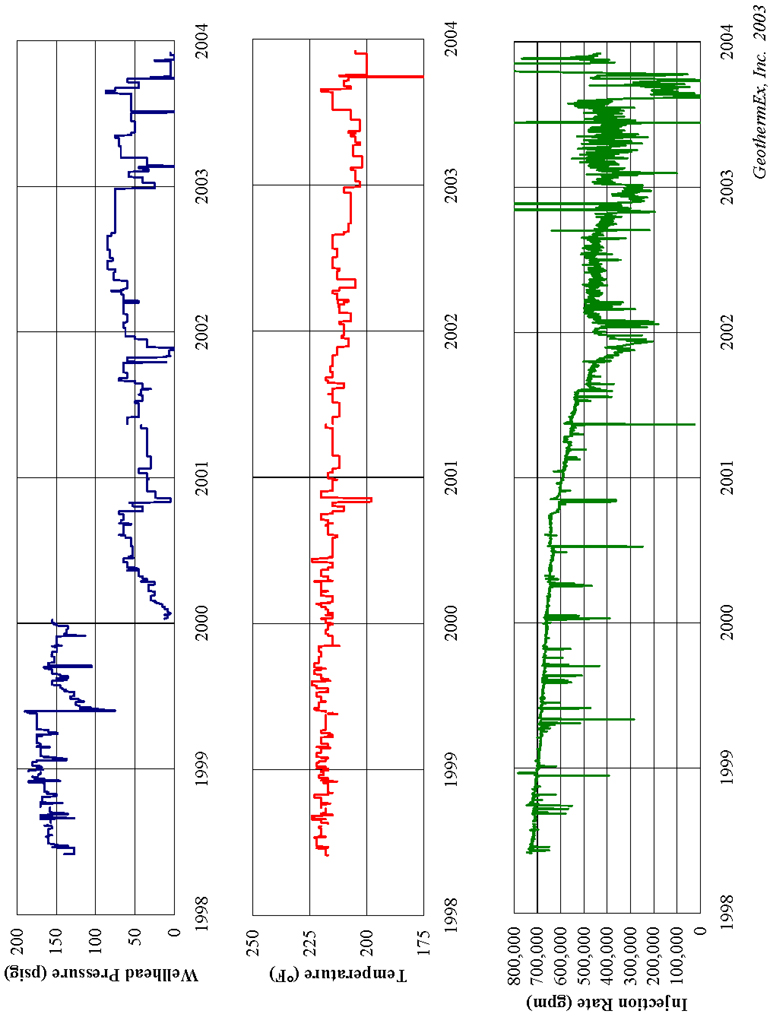
Starting with the "Bank Test" in May 1998, and again in May 1999 and May 2000, flow rates were increased incrementally in an effort to demonstrate that the plants could generate more power at higher flow rates, even at lower average temperatures. The results of this strategy were inconclusive: annual generation declined in 1998 and 1999, then increased slightly in 2000. The 2000 results were affected in part by the injection test into IW-2, which allowed a reduction in the parasitic load for injection pumps and thus increased net output. However, the use of the IW-2 injection well (which communicated directly with the Early Rhyolite production zone) also caused a drop of about 3°F in average temperatures. In September 2000, the IW-2 injection test was stopped, and temperatures recovered to the pre-test level (about 317.5°) within about six months.
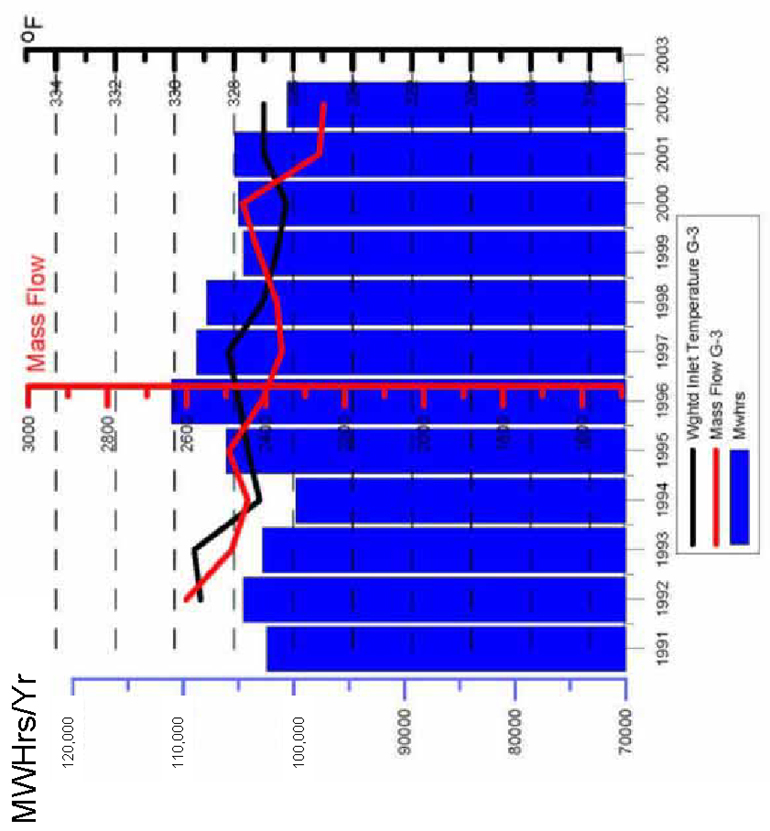
Since the end of the IW-2 injection test, flow rates have been maintained essentially constant at 13,500 gpm (about 6,250 kph), equivalent to the rate established during the "Bank Test" in 1998. However, since about 2001, temperatures have been declining overall (Figure 2.9). By 2003, the weighted average temperature had reached 314°F, the same temperature as at the end of the IW-2 injection test in 2000. The continuing temperature decline appears to be caused primarily by injection breakthrough. Temperature declines at the G 1 and G 2 plants (Figure 2.10) have been much steeper than at the G 3 plant (Figure 2.11), and among the wells supplying the G 1 and G 2 plants, the majority of the decline is accounted for by two wells (24C-32 and 24D-32) that have been shown by tracer testing to have the most direct connection to injection wells. The G 1 and G 2 plants are supplied by wells on private land (the Magma lease) in the northern part of the developed wellfield, while the G 3 plant is supplied by wells on federal land further south. The G 3 wells have generally higher temperatures and lower rates of temperature decline.
Based on this operating history, it is likely that slowing or eliminating the temperature decline will require drilling new wells. Cutting back on the flow rate of wells most affected by cooling could raise the average temperature, but there is not enough spare capacity in the hotter wells to make up for the loss of flow rate, and the net result would be a further loss of generation.
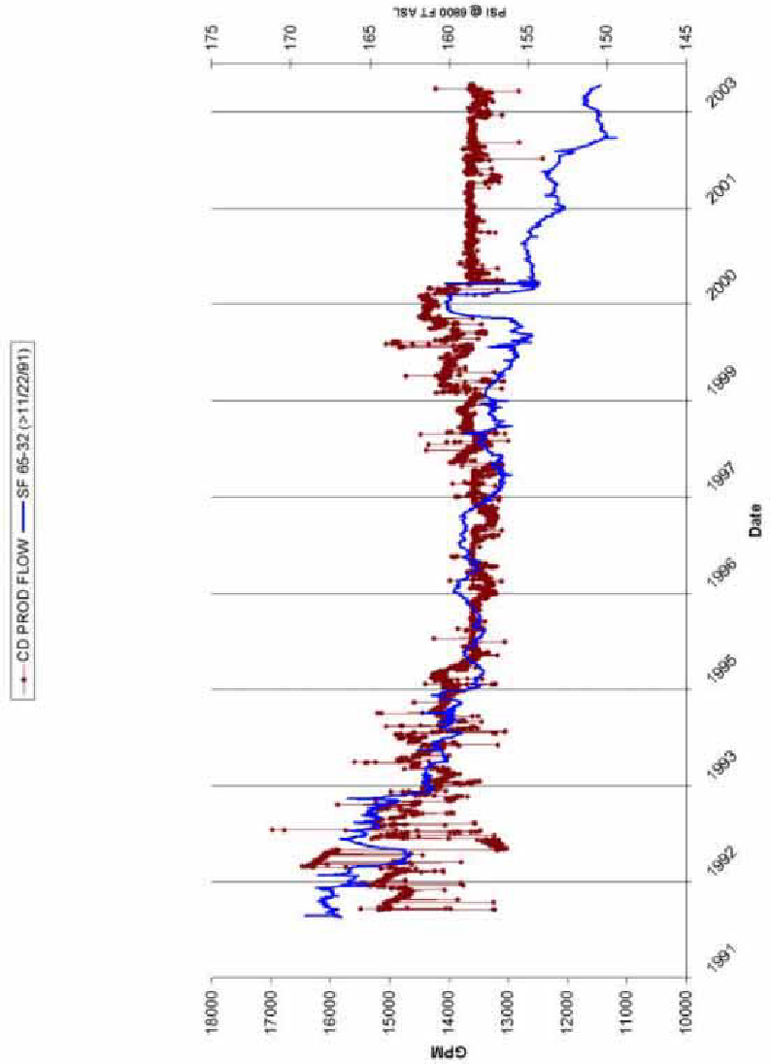
The second critical issue is declining reservoir pressures. Figure 2.12 shows the history of reservoir pressures as measured in observation well SF 65-32, with the total production rate again shown for comparison. Well 65-32 responds to pressures in the Early Rhyolite production zone. Its pressure trend is mimicked by other observation wells, so the changes in pressure do not appear to result from any mechanical problem with the pressure sensing equipment in this well. The pressure in the Early Rhyolite responds to changes in both production and injection. Pressures showed an overall declining trend from 1991 to 1995, with excursions above and below the trend at the time of the step-rate test from August 1992 to January 1993. This reflected a response to production rates generally above 14,000 gpm in this period. From 1995 to 1997, with production steady at about 13,500 gpm, Early Rhyolite pressures were generally stable. Pressure declines resumed in late 1997 and continued with the incremental increases in production starting in 1998. A temporary gain of about 5 pounds per square inch (psi) occurred in mid-2000 during the IW-2 injection test, which directed a greater proportion of the injection water to the Early Rhyolite zone. When the IW-2 test ended, the pressure decline resumed. Pressures in the Early Rhyolite zone are now about 7 psi lower than in the stable 1995-1997 period, and the overall downward trend appears to be continuing.
One notable characteristic of the pressure decline is that it often appears to occur in steps (as in late 1997, late 2001, and mid-2002), followed by periods of relative stability or even slight increases. These stair-steps down do not clearly correlate with any increase in production or any shift in the allocation of injection. The former operator of the project (Covanta) apparently hypothesized that these sudden decreases on the order of 2 to 3 psi might be related to the presence of an active magma body at Mammoth; specifically, "deformation events on a resurgent rhyolite dome" within the caldera. According to this hypothesis (which some researchers at the USGS have proposed in connection
2-4
5221 CENTRAL AVENUE, SUITE 201
RICHMOND, CALIFORNIA 94804-5829
GeothermEx, Inc.
______________________________________________________________________________
TELEPHONE: (510) 527-9876
FAX: (510) 527-8164
E-MAIL: mw@geothermex.com
with the pressure trends at the Mammoth field), the deformation opens cracks within the dome that fill with water, thus drawing down water levels in surrounding aquifers. When the cracks are filled, the water levels stabilize or rebound slightly until the next deformation event. GeothermEx finds no firm scientific basis upon which to support or refute such a hypothesis. Usually earthquakes and tectonic activity have only transient effects on geothermal reservoir pressures, and such effects are often outweighed by the pressure disturbances of production and injection. In this case, however, the possibility that deformation events are having a significant impact on reservoir pressures cannot be ruled out, especially since there is no clear correlation to changes in production or injection operations.
The practical effect of declining reservoir pressures in the Mammoth field is that it lowers the height of the water column above downhole pumps in the production wells. At the top of the water column, the hot water is at boiling conditions. If the boiling water level reaches the intake of the pump, scaling and cavitation of the pump typically occur. The treatment for scaling involves performing periodic acetic acid washes of the pump. The operator reports that such acid washes are already being performed on two of the hotter wells (25-32 and 25A-32). The impact of cavitation is effectively to shorten run-time of downhole pumps, requiring more frequent workovers. The shallow depths of production wells at Mammoth do not allow for setting the pumps much deeper. The pump in 25A-32 was recently deepened by 10 feet; at a pressure decline rate of more than 1 psi per year, this effectively deferred the date at which the boiling level would reach the pump in this well by four to five years. Other wells are at their limit for pump-setting depth. One production well (24F-32) has been shut in since the late 1990s and is used only as a spare, because the cost of acid washes, pump maintenance, and electricity to run the pump make it uneconomic to operate on a regular basis.
The history of pressure decline also suggests that additional drilling will be needed at Mammoth. In order to minimize pressure interference, this drilling would need to be located further away than the 200 to 300 feet that typically separate adjacent producers in the existing wellfield. The operator's proposal to drill two wells in the Basalt Canyon area west of the existing field is motivated in part by the desire to lessen the load on the developed wellfield and distribute production over a broader area. Besides helping to minimize the costs of operating and maintaining production pumps, lessening pressure declines would help minimize the impacts on adjacent hydrothermal features and springs (such as the fish hatchery east of the field). It is also the best defense against the possibility that future deformation events at the Rhyolite Dome could cause additional drops in pressure. Further, the proposed drilling locations in Basalt Canyon (if successful) would satisfy the requirement to drill a productive well in that area in order to extend the lease. Even aside from the possibility of future expansions of plant capacity, extending the Basalt Canyon lease is likely to be important in the longer term to supplement production to sustain the existing plant.
As illustrated in Figure 2.8, generation levels under current operating conditions are declining at about 1% per year. The operator has proposed to drill two production wells in Basalt Canyon and to build a pipeline to connect them to the existing plant; the capital costs of this work are not a part of this note offering. Slim hole 12-31 in Basalt Canyon has documented temperatures of in the range of 310°F to 360°F in potentially productive zones and suggests an initial average production temperature of about 335°F for full-sized well at this location. Moreover, the Basalt Canyon area appears to be on the path of hot fluid migration toward the developed wellfield, according to the geologic model described earlier. Therefore, in GeothermEx's opinion, the two production wells proposed for the Basalt Canyon area have a reasonable probability of success. The forecast of power generation in the projection shows an increase of approximately 3.6 MW in 2006. The 3.6-MW increase is reasonable, given the expected success of the two Basalt Canyon wells.
In the base case, the projection assumes a generation decline rate corresponding to cooling of 1°F per year; this is reasonable based on the observed history. The accelerated cooling case corresponds to a more conservative decline rate of 1.5°F per year.
2-5
5221 CENTRAL AVENUE, SUITE 201
RICHMOND, CALIFORNIA 94804-5829
GeothermEx, Inc.
______________________________________________________________________________
TELEPHONE: (510) 527-9876
FAX: (510) 527-8164
E-MAIL: mw@geothermex.com
3. ORMESA PROJECT
3.1 Project History
The first two wells drilled at East Mesa were petroleum exploration wells drilled in the 1960s. Between 1972 and 1974, five deep wells were drilled at East Mesa by the US Bureau of Reclamation. These wells, whose locations were suggested by surface geophysical studies, confirmed the existence of the East Mesa thermal anomaly and had bottomhole temperatures ranging from 300° to 400°F. In 1975 - - 1976, Republic Geothermal drilled three wells in the northern part of the field, confirming the extension of commercial temperatures, and proceeded in 1977 to drill seven additional confirmation wells. Meanwhile, Magma Power Company began drilling on its East Mesa leases in 1976, drilling approximately 15 wells to supply its 10.2 MW (gross) Magmamax binary power plant (this was later called the B.C. McCabe power plant), which began operating in 1983 and was retired from service in the early 1990s.
Ormat Energy Systems Inc. (OESI) took over Republic's leases in 1986, and developed the OG I, OG IE, OG II, and OG IH projects, which began generating power in 1987, 1988, 1988 and 1989, respectively. Geothermal Resources International bought out Magma and formed Geo East Mesa Limited Partnership (GEMLP). Additional wells were drilled on the former Magma leases for its GEM 2/3 power plant (the McCabe binary plant was renamed GEM 1), which began operating in 1989 and has a generating capacity of 34 MW (gross). In 1992, FPL Energy (a subsidiary of Florida Power and Light) acquired an ownership position and became operator of the OG II project. In 1998, FPL Energy and Caithness Energy together purchased the remaining East Mesa power projects, with FPL Energy serving as the operating partner. In addition to routine wellfield maintenance, FPL instituted a program to enable flexibility in field operation by interconnecting certain production and injection areas, since as sole operator it was free of the constraints imposed by dedicated production and injection areas for a given plant. After these assets were sold to Ormat in 2002, a process was initiated to further rationalize the field by modifying surface facilities and field operations, as will be discussed in subsequent sections.
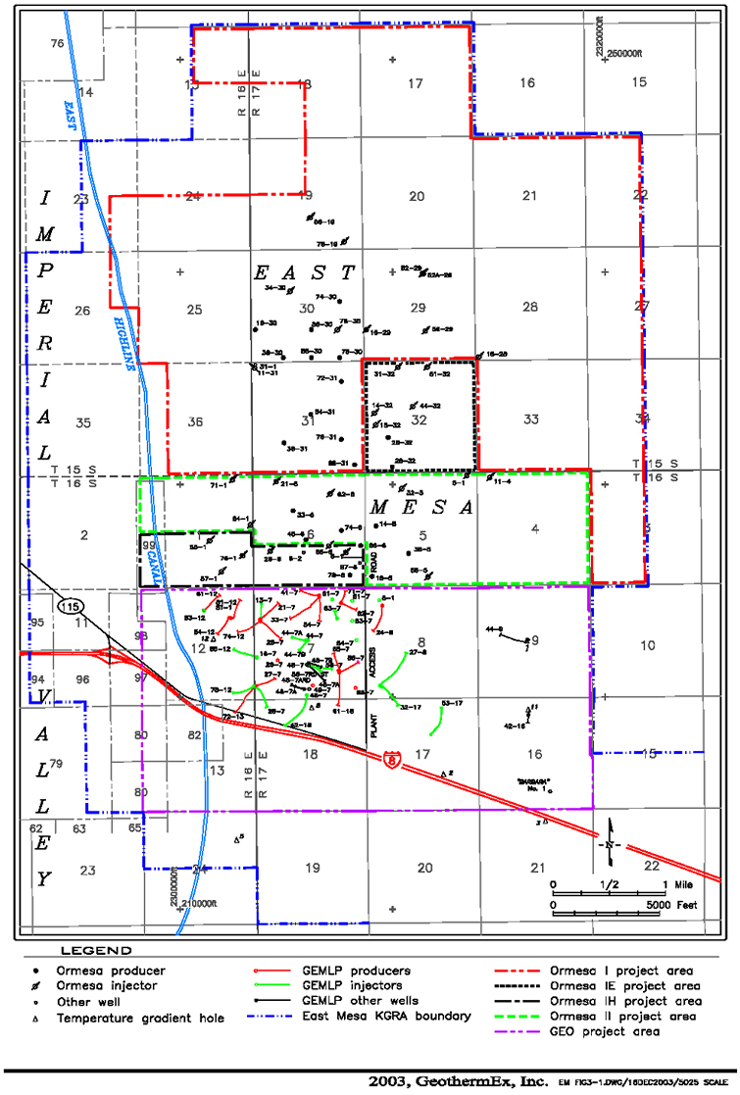
Well locations and the nominal or former boundaries of the various power plant areas are shown in Figure 3.1, and historical production and injection data for all wells in the field through November 2002 are included in Appendix A.
3.2 Resource Characteristics
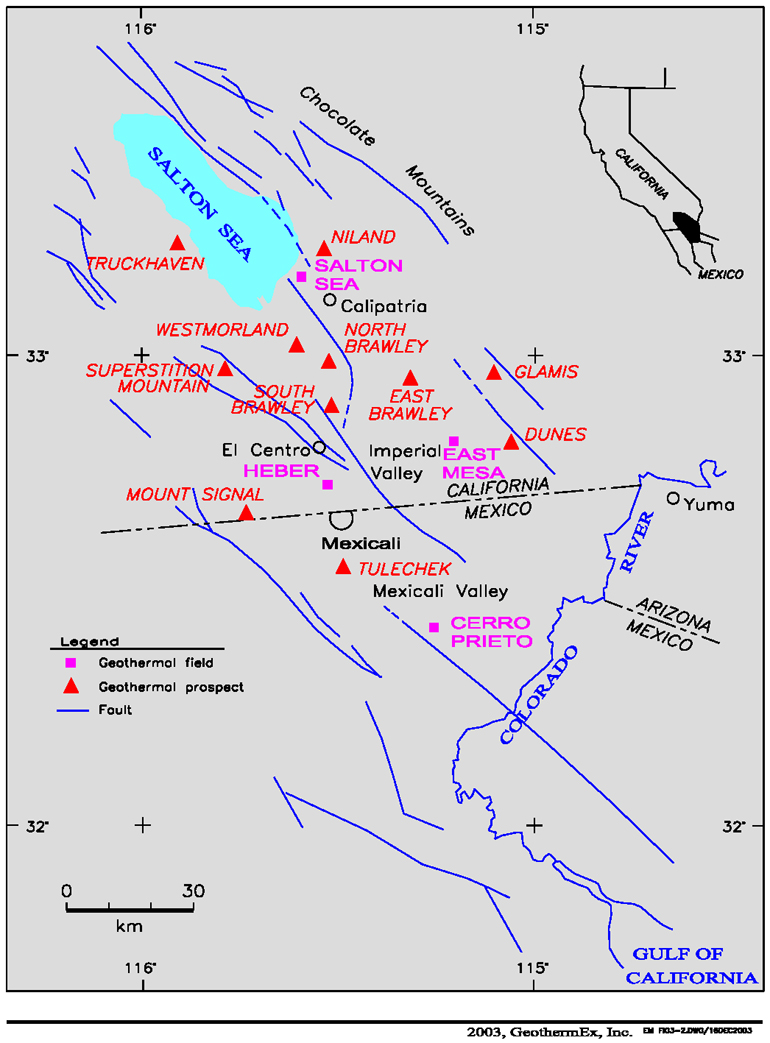
East Mesa is located within the Salton Trough geologic province, an area characterized by tectonic extension and very high heat flow. Both are due to its location astride the on-shore extension of the East Pacific Rise, a zone of upwelling in the mantle and subsequent rifting of the overlying crust of the earth. As shown in Figure 3.2, there are several producing and non-producing geothermal areas located within the Salton Trough.
Like the other geothermal reservoirs in the Salton Trough geologic province, the East Mesa geothermal reservoir is contained within an alternating sequence of sandstones and shales deposited in a deltaic environment (the ancient delta of the Colorado River). Production in the field is generally obtained from the sandstones, although some fracture permeability may be present in shale units. Above the reservoir there is a thick section of fine-grained rocks that forms a low-permeability cap on the geothermal system. Unlike other Salton Trough geothermal reservoirs, however, the East Mesa reservoir has relatively low salinity and is therefore considered to be relatively benign from a chemical perspective. However, some scaling has occurred in the hotter GEM production wells, primarily because of mixing of fluids from different zones.
As shown in Figure 3.1, there has been a significant amount of drilling in the field, and this has allowed the thermal anomaly and the permeability structure of the field to be quite well-defined. Static temperature profiles from the East Mesa wells reflect the structure described above, with high temperature gradients through the relatively impermeable cap rock representing conductive heat transfer, and significantly lower gradients within the permeable reservoir, where convective fluid flow dominates.
3-1
5221 CENTRAL AVENUE, SUITE 201
RICHMOND, CALIFORNIA 94804-5829
GeothermEx, Inc.
______________________________________________________________________________
TELEPHONE: (510) 527-9876
FAX: (510) 527-8164
E-MAIL: mw@geothermex.com
There have been few unproductive wells drilled in the field, with the notable exception of the four deep wells drilled by Geothermal Resources International in its attempt to prove deep production from fault zones. While these wells were poor producers, one or more were eventually used for injection. Active production and injection wells at East Mesa typically range in depth from 3,000 to 8,000 feet.
Analysis of subsurface temperature data reveals a broad, N-S trending temperature anomaly that covers an area of more than 12 square miles. Maximum pre-exploitation temperatures of about 375°F have been observed at a depth of about 6,000 feet. It is possible to calculate the heat in place in the reservoir using the subsurface temperature distribution within the field. Using reasonable assumptions regarding how much of this heat can be recovered at the surface and how efficiently the heat can be converted to electricity, it is possible to estimate the recoverable energy reserves of the East Mesa field.
We have estimated the recoverable geothermal energy reserves using the methodology described in Appendix D. The following values have been used for the parameters required to estimate the recoverable energy reserves of the East Mesa field:

| | | | | | | | | | | | | | |
| Input Parameter | | Minimum Value | | Most-Likely Value | | Maximum Value |
| Variable Parameters | |
| Reservoir Area (mi2) | | 6.9 | | 8.2 | | 9.5 |
| Reservoir Thickness (ft) | | 4,000 | | 5,500 | | 6,000 |
| Rock Porosity (%) | | 10 | | - - | | 20 |
| Reservoir Temp. (°F) | | 300 | | 310 | | 320 |
| Recovery Factor (%) | | 10 | | - - | | 20 |
| Fixed Parameters | |
| Rock Heat Capacity | | | | 39.0 BTU/ft3°F | | |
| Rejection Temperature | | | | 75°F | | |
| Utilization Factor | | | | 45% | | |
| Capacity Factor | | | | 90% | | |
| Power Plant Life | | | | 30 years | | |
|
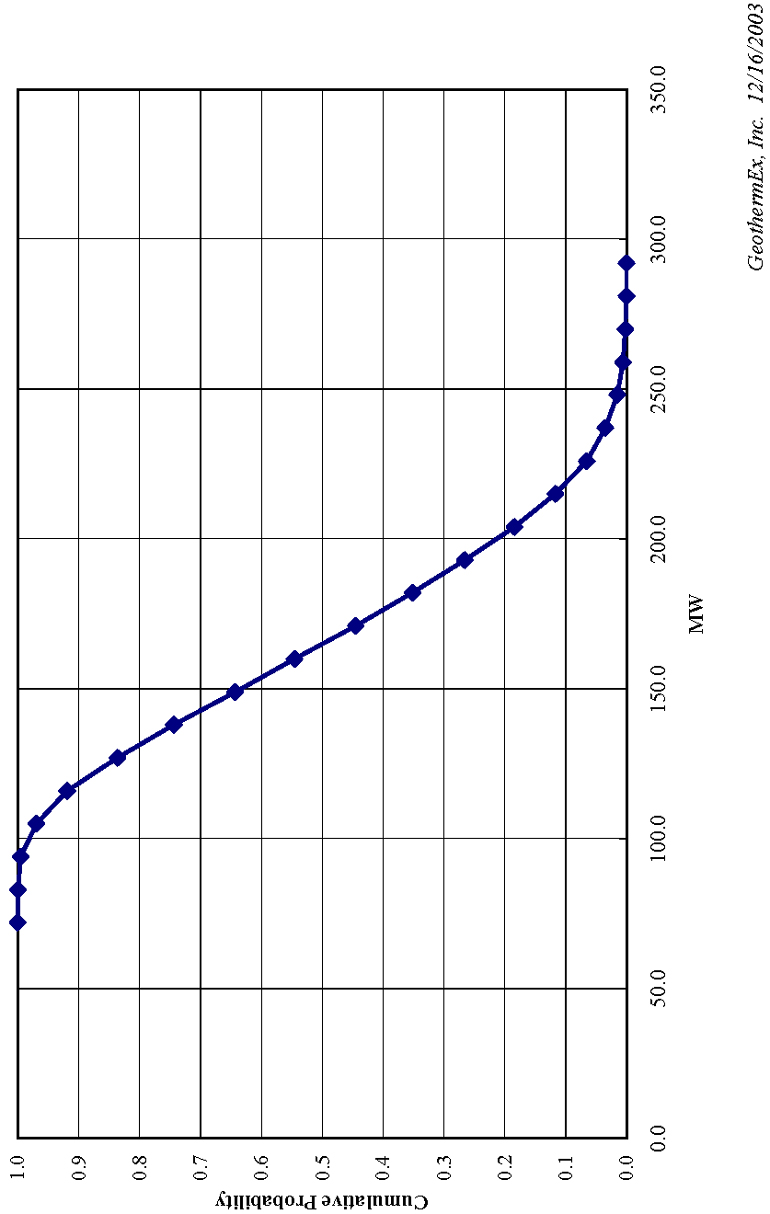
The results, which are shown in Figure 3.3 and 3.4, indicate that there is a 90% probability that the recoverable geothermal energy reserves of the East Mesa field exceed 118 MW (gross). The most-likely value is 148 MW (gross), and the mean value is 167 MW (gross), with a standard deviation of 38 MW.
3.3. Resource Utilization Plan
As discussed in the preceding sections, the East Mesa geothermal resource is one which is relatively large and has a consistent and predictable structure, which has resulted in a favorable drilling success rate. However, the production and injection wells are located reasonably close together and are often completed at similar depths. This has resulted in cooling of the production wells as injected fluids have migrated back to production zones. Appendix A presents detailed production/injection records from each of the Ormesa wells. Table 3.1 shows that the rate of cooling in individual production wells as of December 2002 varied from 0 to 3.5°F per year; the flow-weighted average temperature decline at that time was approximately 1°F per year.
3-2
5221 CENTRAL AVENUE, SUITE 201
RICHMOND, CALIFORNIA 94804-5829
GeothermEx, Inc.
______________________________________________________________________________
TELEPHONE: (510) 527-9876
FAX: (510) 527-8164
E-MAIL: mw@geothermex.com
The stratified nature of the East Mesa reservoir and the operational flexibility in the field (which allows fluid to be moved from one area to another) enables cooling to be mitigated using one ore more of the following techniques:
| | |
| • | well workover operations (selective cementing of cooler inflow zones); |
| | |
| • | conversion of production to injection wells; and/or |
| | |
| • | directing the geothermal fluid to the facility that can use it with the highest possible conversion efficiency. |
In the projection, Ormat has reasonably assumed a 1% decline in generation to account for cooling. A sensitivity study associated with a higher generation decline rate has not been made because the above-mentioned mitigating measures are relatively simple to accomplish.
All of the production wells at East Mesa are pumped, and pump replacements have been required every 24 months on average. Pump replacements are somewhat more frequent in the GEM area owing to the hotter reservoir temperatures and a greater tendency to form scale in the wellbore. In recent years, this tendency has been reduced by re-completing certain wells to prevent the mixing of fluids from different zones in the reservoir and sometimes from injection water breakthrough. The scaling that has occurred has been managed primarily using a combination of mechanical and chemical clean-outs, which are typically undertaken when a pump is replaced. The average pump setting depth is about 1,400 feet, and ranges from 800 to about 1,750 feet. Liner tops (that limit how deep the pumps can be set) are typically at a depth of about 2,000 feet; therefore, there is some room to lower most production pumps if some unanticipated reservoir drawdown were to occur. Considering the pressure support provided by injection, this is unlikely; however, as discussed above, the downside of injection pressure support is cooling of the production zones by the injected fluid. In this field, cooling is a more important issue than drawdown.
Table 3.1 Status of East Mesa Production Wells (as of 3 November 2002)
Og I Wells
| | | | | | | | | | | | | | |
| Well | | Brine Temperature (°F) | | Production Rate (gpm) | | Cooling Rate (°F/Year) |
| 74-30 | | 290 | | 1,383 | | 0 |
| 78-30 | | 305 | | 1,353 | | 0.12 |
| 38-30 | | 300 | | 924 | | 0.59 |
| 16-30 | | 292 | | 966 | | 0.12 |
| 56-30 | | 310 | | 767 | | 1.53 |
| 54-31 | | 286 | | 1,615 | | 1.29 |
| 72-31 | | 302 | | 1,528 | | 0 |
| 36-31 | | 295 | | 989 | | 0.41 |
| 76-31 | | 280 | | 1,553 | | 1.76 |
| 88-31 | | 296 | | 1,622 | | 1.18 |
|
3-3
5221 CENTRAL AVENUE, SUITE 201
RICHMOND, CALIFORNIA 94804-5829
GeothermEx, Inc.
______________________________________________________________________________
TELEPHONE: (510) 527-9876
FAX: (510) 527-8164
E-MAIL: mw@geothermex.com
Og Ie Wells
| | | | | | | | | | | | | | |
| Well | | Brine Temperature (°F) | | Production Rate (gpm) | | Cooling Rate (°F/Year) |
| 28-32 | | 280 | | 1,175 | | 0.65 |
|
Og Ih Wells
| | | | | | | | | | | | | | |
| Well | | Brine Temperature (°F) | | Production Rate (gpm) | | Cooling Rate (°F/Year) |
| 78-6 | | 295 | | 1,299 | | 0.82 |
| 86-6* | | 257 | | 865 | | 3.52 |
|
Og Ii Wells
| | | | | | | | | | | | | | |
| Well | | Brine Temperature (°F) | | Production Rate (gpm) | | Cooling Rate (°F/Year) |
| 14-5 | | 310 | | 1,472 | | 1.76 |
| 18-5 | | 313 | | 1,705 | | 1.47 |
| 36-5* | | 284 | | 1,777 | | 2.00 |
| 33-6 | | 281 | | 1,330 | | 2.11 |
| 45-6 | | 325 | | 1,803 | | 0.76 |
| 74-6 | | 316 | | 1,319 | | 0.82 |
|
GEM Wells
| | | | | | | | | | | | | | |
| Well | | Brine Temperature (°F) | | Production Rate (gpm) | | Cooling Rate (°F/year) |
| 21-7 | | 334 | | 736 | | 0.58 |
| 25-7 | | 347 | | 805 | | 0 |
| 27-7 | | 317 | | 1058 | | 2.0 |
| 33-7 | | 351 | | 836 | | 1.41 |
| 41-7 | | 336 | | 1,311 | | 0 |
| 54-7 | | 308 | | 1,122 | | 0.59 |
| 71-7 | | 338 | | 805 | | 0 |
| 82-7 | | 353 | | 701 | | 0.59 |
| 88-7 | | 347 | | 968 | | 0.17 |
| 24-8 | | 324 | | 1,564 | | 0.12 |
|
3-4
5221 CENTRAL AVENUE, SUITE 201
RICHMOND, CALIFORNIA 94804-5829
GeothermEx, Inc.
______________________________________________________________________________
TELEPHONE: (510) 527-9876
FAX: (510) 527-8164
E-MAIL: mw@geothermex.com
| | | | | | | | | | | | | | |
| Well | | Brine Temperature (°F) | | Production Rate (gpm) | | Cooling Rate (°F/year) |
| 54-12 | | 314 | | 1,137 | | 0.17 |
| 61-12 | | 333 | | 687 | | 0 |
| 74-12 | | 320 | | 1,271 | | 0.59 |
| 81-12 | | 330 | | 1,241 | | 0.71 |
| 72-13 | | 334 | | 893 | | 0 |
| 61-18 | | 317 | | 1,260 | | 1.65 |
|
* Later converted from production well to injection well
Injection wells show a gradual decline in injectivity because of one or more of the three following causes:
| | |
| • | scale, which forms on casing walls, in liner slots, and on the wall of the wellbore (the "sand face") behind liners; |
| | |
| • | fines (particles of clay and silt), which come from production wells and accumulate in the injection wells at the sand face; and |
| | |
| • | fill, which accumulates in the bottom of some injection wells as a result of sloughing of the wellbore walls. |
Scale in injection well is observed primarily in the GEM area. The scale consists mostly of magnesium silicate, and it forms as the result of mixing of waters of different chemical composition. Plugging by fines can occur anywhere in the field, but its impact varies from well to well. Accumulation of fill has affected wells primarily in the northern part of the field. Mitigation techniques included mechanical clean-out with a drilling rig or coiled tubing unit, back-flowing the well by nitrogen lift using a coiled tubing unit, acidization with a combination of hydrofluoric and hydrochloric acid, and re-perforation of plugged intervals. In general, these techniques provide enough options to allow the injectivity of most injectors to be maintained.
Upon taking ownership of the East Mesa projects, Ormat embarked on a series of changes designed to simplify field operations and increase generation. OG I continues to use its seven dedicated production wells, but no longer relies upon part of the flow from two GEM wells, one OG IE well and one OG II well (this stream was shared with the OG IE plant; see below). Instead, 3,200 gallons per minute (gpm) of 217°F waste fluid from the GEM plant supplies the Level 3 OECs at OG I. At OG IE, two OG I wells and one OG IE well continue to be used, but the remaining part of the flow from two GEM wells, one OG IE well and one OG II well is replaced by a single additional OG I well. At OG IH, one well was shut in because of low temperature. Another OG IH well is dedicated to the plant, as is the fluid from three GEM producers; however, 270 gpm of fluid at the weighted average temperature of 317°F is diverted to OG II. The OG II project is now supplied by its own five production wells (a sixth was to be converted to injection) plus the 270 gpm of 317° fluid diverted from OG IH. The number of production wells supplying the GEM plant was increased by five, resulting in a significantly higher mass flow and overall generation.
On the injection side, most of the total injection requirements of the OG I and IE projects (which includes 3,200 gpm transferred from the GEM plant) are met using 10 injection wells in the OG I area and four in the OG IE area, with the remainder (about 3,000 gpm) sent to OG II injectors. The OG IH and OG II plants dispose of their waste fluid in four OG IH wells and six OG II wells, which also accommodate the 3,000 gpm of waste fluid from OG I/IE and 1,800 gpm of waste fluid from the GEM plant. The injection requirement for the GEM plant, reduced by the 3,200 gpm transfer to the Level 3 OEC at OG I and the 1,800 gpm transferred for injection in the OG IH/II injection wells, is disposed of in 19 injection wells within the GEM area. A review of the historical injection capacities of the East Mesa wells supports the feasibility of this injection plan.
3-5
5221 CENTRAL AVENUE, SUITE 201
RICHMOND, CALIFORNIA 94804-5829
GeothermEx, Inc.
______________________________________________________________________________
TELEPHONE: (510) 527-9876
FAX: (510) 527-8164
E-MAIL: mw@geothermex.com
The net result is a simplification of operations in the field by reducing fluid transfer across the field. The minor increases in production rate (less than 3%) and injection rate (less than 2%) are easily accommodated by the existing wells.
In October 2003, an acceptance test was undertaken to determine the success of the wellfield modifications described above and repairs/modifications to the above-ground facilities. The latter included:
| | |
| • | repair of the cooling towers; |
| | |
| • | replacing the original 24 Level 1 and Level 2 OECs at OG I with two new, larger OECs; |
| | |
| • | converting the Level 3 OECs at OG I to accept the 217°F waste fluid from the GEM plant; |
| | |
| • | upgrading/modifying the injection pumps (including an injection pump conversion in the GEM plant to make more steam available to the one of the two GEM turbine-generators); and |
| | |
| • | overhauling the other of the two GEM turbine-generators. |
The test showed that the output of the power plant met expectations; in fact, after correction for differences in assumed and actual ambient temperature (which affects the conversion efficiency of the OG units), about 4% excess capacity was demonstrated during the one-week test.
Field-related O&M costs are included in the East Mesa projection at $4.9 million for 2004, escalating at a constant rate of 2% per year thereafter. The costs are to cover production pump replacements and repairs, well clean-outs and acid stimulations, well workovers, well surveys, chemicals used for scale inhibition, miscellaneous labor and equipment required for field O&M work, and an annual amount to be set aside as a drilling contingency fund. Details of the breakdown between these various items have not been provided, but the overall amount appears to be reasonable.
3-6
5221 CENTRAL AVENUE, SUITE 201
RICHMOND, CALIFORNIA 94804-5829
GeothermEx, Inc.
______________________________________________________________________________
TELEPHONE: (510) 527-9876
FAX: (510) 527-8164
E-MAIL: mw@geothermex.com
4. STEAMBOAT PROJECT
4.1 Project History
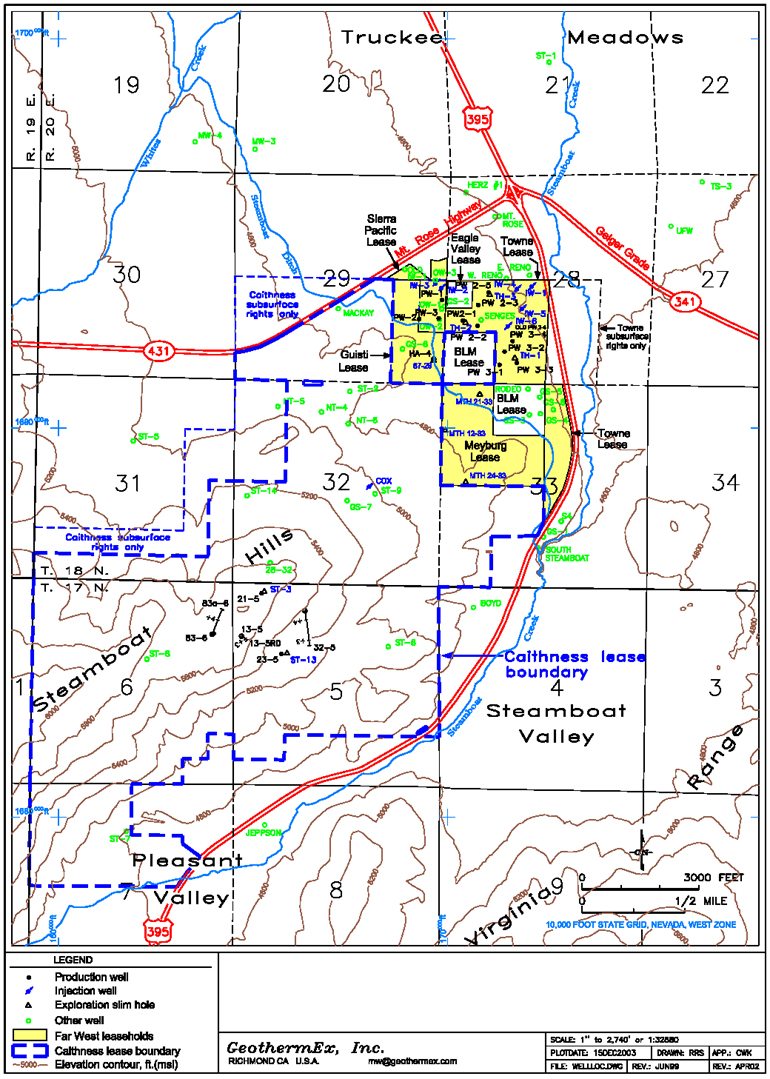
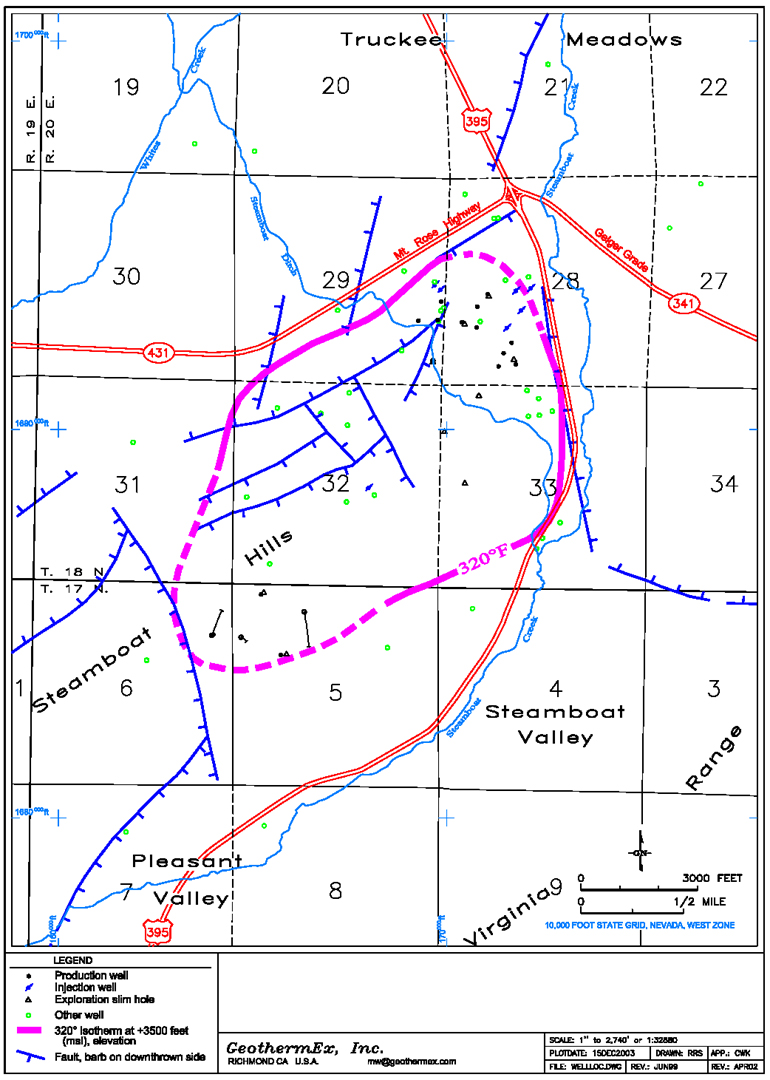
The Steamboat 1/1A, and Steamboat 2 and 3 projects are located within and at the northern end of the Steamboat Hills, at the southern end of Truckee Meadows in Washoe County 10 miles south of downtown Reno, NV (Figure 4.1). The historic Steamboat Hot Springs (now mostly dry but emitting steam) are located along the northeastern edge of the hills, just west and east of highway 395 (Figure 4.2).
The exploration and commercialization history of the resource can be divided into activities in the Lower Steamboat development area at the northeast end of the Steamboat Hills (leases in yellow on Figure 4.1), and the Upper Steamboat development area in the central part of the Steamboat Hills (Caithness Lease on Figure 4.1). This report is concerned with resource supply in the Lower Steamboat area, but the development and operation of Upper Steamboat is potentially relevant.
The Lower Steamboat area was first exploited during the 1920s - 1940s, when shallow wells were drilled for thermal spa and landowner use, mostly at low-lying locations east and north of the areas now used for electricity production. In the 1950s the U.S. Geological Survey (USGS) drilled a number of scientific test wells (GS-1 to GS-8) in sections 28, 29, 32 and 33, and published a series of Professional Papers on the geology, geochemistry (fluids and rock alteration chemistry) and thermal regime of the resource (hole locations are on Figure 4.1).
The current electrification development of Lower Steamboat started in the Sierra Pacific Lease (eastern edge of section 29) during 1985-1986, with drilling, construction and operation of the Steamboat 1 power plant (a table of plant data follows below). This project was expanded in 1988, with addition of plant Steamboat 1A.
Commercial development of the Towne and Guisti leases started with drilling in 1990 (holes TH-1 to -3, now used for temperature observation, and HA-4, now used for production), and resumed in 1992 with development drilling, construction and operation of the Steamboat 2 and Steamboat power plants.
Activities in the Lower Steamboat area since 1992 have included some additional scientific and exploration drilling (hole 87-29 in the Giusti lease, three holes in the Meyburg area), technological improvements in pumping (some line-shaft pumps replaced with down-hole pumps), modifications of some injection wells to redirect injection to lower elevations, modifications of some production wells to block off zones near the bottom that were affected by injection, and the replacement of a failed turbine in one unit of Steamboat 1/1A.
In the Upper Steamboat area, a few commercial holes were drilled during 1954-1961 (NT- series holes), but present developments did not start until numerous temperature gradient holes and stratigraphic test wells (holes ST-1 to - -14) were drilled in the 1970s, followed by the first successful large-diameter production hole 1979 (well 21-5).
The remaining development drilling of Upper Steamboat was done during 1981-1987 and a 13.2 MW (gross) power plant came on-line in 1989. This facility, owned and operated by another party (Caithness), is separate from the Ormat facilities that are the subject of this note offering. However, it taps the same geothermal reservoir.
Since 1989, in the Upper Steamboat area, one additional deep well has been drilled (well 13 5/13-5 RD), a tracer test has been conducted at the injection well (Cox well, center of section 32, with monitoring at Lower Steamboat wells), and some government-funded geophysical studies of the resource area (Upper and Lower) have been started.
The Steamboat power plants and related currently active production (P) and injection (I) wells (all within the corresponding leases) are now as follows:
4-1
5221 CENTRAL AVENUE, SUITE 201
RICHMOND, CALIFORNIA 94804-5829
GeothermEx, Inc.
______________________________________________________________________________
TELEPHONE: (510) 527-9876
FAX: (510) 527-8164
E-MAIL: mw@geothermex.com
| | | | | | |
| | | Plant(s)
Lease | | Type | | Start-up | | P | | I |
Lower
Steamboat | | SB 1/1A
Sierra Pacific | | Air-cooled
binary | | 1986 &
1988 | | PW-1 to -3 | | IW-2 and -3 |
| | | | | | | | | PW2-1 |
| | | | | | | | | PW2-3 |
| | | | | | | | | PW2-5 | | IW-1 |
Lower
Steamboat | | SB 2/3
Towne & Giusti | | Air-cooled
binary | | 1992 | | HA-4
PW3-1 | | IW-4
IW-5 |
| | | | | | | | | PW3-2 | | IW-6 |
| | | | | | | | | PW3-3 |
| | | | | | | | | PW3-4 | | |
Upper
Steamboat | | Caithness
Caithness | | Dual flash | | 1988 | | 24-5, 83A-7
and 23-5 | | Cox-1 |
|
There are, in addition, a number of standby production wells and temperature and pressure observation wells, which are included on Figure 4.1.
4.2 Resource Characteristics
The geothermal resource at Lower Steamboat consists of a shallow zone of hot water that flows northward in a reservoir of fractured granodiorite (an intrusive rock similar to granite). At most locations this shallow zone is effectively a tongue of hot water, with higher temperatures above and slightly lower temperatures below. The resource beneath Steamboat Hills (to the south of Lower Steamboat) also lies within the fractured granodiorite, but at greater depth.
In most of the drilled area at Lower Steamboat, the granodiorite is covered by a layer of younger volcanic rock (Tertiary in age and comprising several distinct rock types and formations). This, in turn, is overlain by recently deposited alluvium (sedimentary sand, gravel and clay) of varying thickness, that has come from erosion of the adjacent Sierra Nevada mountains to the west. The volcanic and sedimentary cover thickens to the north beneath Truckee Meadows, but the older granodiorite is locally exposed along the northern edge of the Steamboat Hills (see Figure 4.2).
Fracture permeability is pervasive in the granodiorite although permeability appears to be enhanced in the vicinities of two major fracture zones:
| | |
| • | a western zone that trends north (N) to northeast (NE) beneath the Sierra Pacific and Giusti Leases; and |
| | |
| • | an eastern zone that trends N beneath the eastern edge of the Towne Lease. |
These fracture zones control spring discharges onto the High and Middle Terrace areas. Figure 4.2 shows the fault locations that are the surface expressions of these fracture zones. The western zone (High Terrace Fracture zone) includes two faults, one that trends more directly N and one that trends more NE, intersecting in the vicinity of well PW-3. The existence of both faults and associated fracture zones in the western area is supported by rock data collected during drilling into the granodiorite beneath the Guisti and Sierra Pacific Leases.
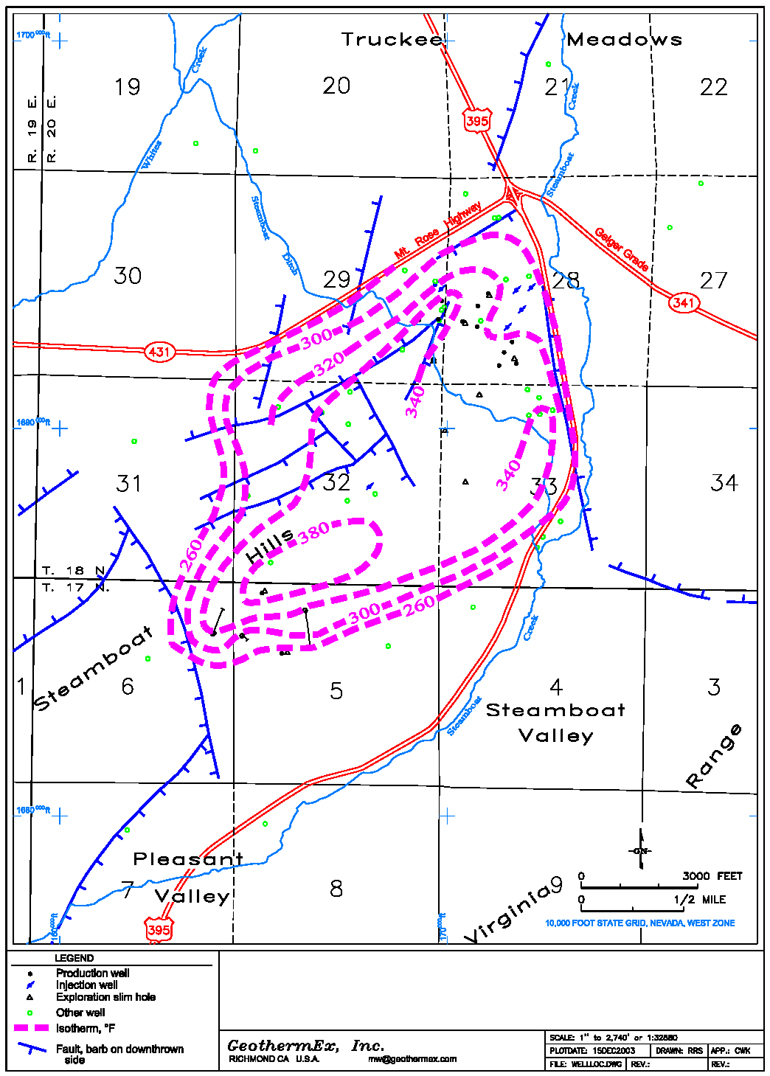
The western and eastern fracture zones, and associated parallel faults, have a strong degree of control on fluid flow in the geothermal system, as indicated by temperature distribution at depth. Figure 4.3 shows the subsurface temperature distribution (before geothermal development) in the northeastern part of the Steamboat area at an elevation of 4,000 ft above sea level (msl), drawn with respect to the faults. It shows that the highest temperatures occur along the western and eastern fracture zones. There is indirect evidence that this lobate distribution of temperature is caused also by a zone of relatively low permeability that trends NW-SE across the central to northern part of the Meyburg area, between the western and eastern fracture zones.
4-2
5221 CENTRAL AVENUE, SUITE 201
RICHMOND, CALIFORNIA 94804-5829
GeothermEx, Inc.
______________________________________________________________________________
TELEPHONE: (510) 527-9876
FAX: (510) 527-8164
E-MAIL: mw@geothermex.com
The southeast edge of the entire temperature anomaly, at the north end of Steamboat Valley, is sharply bounded along another fault (not shown on Figure 4.2 or 4.3) that is roughly coincident with the E-NE-trending contact between volcanic rocks of the Lousetown Formation, to the N-NW, and older metamorphosed sedimentary rocks, to the S-SE.
The +4,000 ft msl datum illustrated on Figure 4.3 is 600 to 700 ft below the Lower Steamboat ground surface. The uppermost level of production in this area is at about +4,100 ft msl, as higher elevations (shallower levels) are behind casing in most of the production wells. Deeper production occurs in the Upper Steamboat area (Steamboat Hills).
Figure 4.3 represents temperature conditions prior to large-scale commercial exploitation, based on records of downhole conditions in wells throughout the Steamboat area, including exploration wells that are not in production.
The contours in the Lower Steamboat portion of Figure 4.3 (sections 28 and 29 and northern half of 32 and 33) are based principally on initial flowing wellhead temperatures at several production wells, and on downhole survey data from:
| | |
| • | slim holes TH-1, -2 and -3, which were completed in the Towne lease before the Steamboat 2/3 production and injection wells were drilled |
| | |
| • | well PW2-2 in the Towne Lease |
| | |
| • | wells PW-1, PW-3 and IW-2 in the Sierra Pacific Lease |
| | |
| • | well HA-4 in the Giusti Lease |
| | |
| • | newer exploration holes (MTH 21-33 and MTH 24-33), and |
| | |
| • | the GS-series holes in the hot spring areas, drilled and studied by the U.S. Geological Survey. |
There is some uncertainty about the three-dimensional temperature distribution beneath the section 28 Towne Lease, because stabilized downhole temperature information after completion of drilling was not collected from many of the wells in that area: PW2-2 is the only production well survey reported, and the downhole surveys from injection wells (except perhaps IW-1) have appeared to reflect unstable conditions.
As mentioned above, there is a slight temperature inversion in the Lower Steamboat area. For example, before production the three TH- holes (drilled down to +3,800 ft (msl)) were stable at 331°F to 338°F between +4,200 and +4,300 ft (msl), declining downwards to a fairly constant 325°F between +4,000 ft and +3,800 ft (msl). Similar conditions are seen in stabilized temperature profiles from other wells in the western part of the Lower Steamboat area.
There is some uncertainty about original temperature conditions beneath the Meyburg area, because cooled geothermal fluid (power plant effluent) has been injected into the Caithness project's Cox well, which is located about ½ mile to the southwest, since 1988, and the Meyburg wells were drilled in 1994 and 2001. The injection zone of the Cox well lies at about +2,300 ft to +2,500 ft msl. A tracer test conducted during (about) 2002 is said to have established connection between the Cox well and production wells in the Giusti and Sierra Pacific leases, but the quantitative significance of this is unknown.
Temperature distribution maps for several significantly different levels within, above and below the reservoir have not been compiled, because the amount and density of temperature data necessary for this are not available. The map of horizontal temperature distribution at +4,000 ft (msl) shown as Figure 4.3 is slightly below the very highest temperatures in the Lower Steamboat area, which occur at about +4,200 to +4,300 ft (msl), but a map at the higher level would appear nearly identical, with temperatures averaging only a few degrees higher. Since the Steamboat production wells are all cased down to an elevation of +4,100 ft (msl) or below (HA-4 is an exception, at +4,200 ft (msl)), they do not produce from the very hottest horizon.
Figure 4.3 indicates that geothermal fluid at a temperature of about 340°F (detailed data indicate 342°F) enters the southern part of the Lower Steamboat area and flows horizontally in the fractured granodiorite. The hottest fluid
4-3
5221 CENTRAL AVENUE, SUITE 201
RICHMOND, CALIFORNIA 94804-5829
GeothermEx, Inc.
______________________________________________________________________________
TELEPHONE: (510) 527-9876
FAX: (510) 527-8164
E-MAIL: mw@geothermex.com
migrates northward along the upper part of the western and eastern fracture zones beneath a cover of lower-permeability volcanic rock. As the fluid moves to the N, it cools to a temperature below 320°F.
The amount and distribution of deep permeability outside of the temperature anomaly of Figure 4.3 is unknown, but the sharp temperature decrease at the margins of the anomaly suggests that high permeability is largely confined to the anomaly itself. This means that rocks below perhaps +4,300 ft (msl) and outside of the 260°F contour (about) may have relatively low permeability, and might not be suitable for deep injection should attempts be made to relocate injection outside of the temperature anomaly. Wells to the north of the anomaly such as Herz and Mt. Rose at the intersection of Highways 395 and 431 (Figure 4.1) are less than a few hundred feet deep and have a geothermal component that is related to natural outflow from the reservoir. The extent and depth of deeper outflow is unknown.
Measured downhole pressure profiles from the wells in the Steamboat area indicate that the lateral pressure gradient through the reservoir is insignificant. This implies that the overall permeability in the reservoir is very high, which has been confirmed by well tests.
The water at Lower Steamboat production wells has been sampled regularly since the first well tests in 1985. The reservoir has a typical geothermal sodium-chloride (Na-Cl) composition, with 800 to 850 mg/l of chloride and about 2,100 mg/l total dissolved solids. Chemical modeling has indicated that the deep, highest-temperature parent fluid that rises beneath the Upper Steamboat area probably carries about 720 mg/L Cl at about 440°F. A slight increase of Cl from there to Lower Steamboat (where Cl has been constant at 840 +/- 10 mg/L for over a decade and is now largely homogenized by injection) may be attributed to some uncertain combination of sub-surface boiling, leaching of Cl from reservoir rocks, and injection of concentrated (boiled) water into the Cox well.
The constant Cl concentration and constant alkalinity/Cl suggest that production and injection in the Lower Steamboat reservoir has not triggered any dilute recharge or a change of deeper water supply. These waters do show effects of cooling, however, as illustrated by shifts of:
| | |
| • | the ratio Na/K (sodium/potassium): about 9.0 in 1985 and increasing steadily to 14.0 in 2001 |
| | |
| • | the Na-K-Ca (sodium-potassium-calcium) chemical thermometer: about 440°F in 1985 and decreasing steadily to 375°F during 1999-2001, and |
| | |
| • | the silica (chalcedony) solubility thermometer: about 360°F in 1985 and decreasing steadily to 315°F during 1999-2001. |
Whereas the Na-K-Ca thermometer over-estimates conditions in the Lower Steamboat reservoir (the result of incomplete re-equilibration during cooling), the current average chalcedony temperature is about 315° - 320°F, which should not be far from the average production temperature.
Lower Steamboat water carries about 800 ppm-wt of total dissolved gases. This is a relatively low level that has not interfered with well pumping, and is not likely to, given the high reservoir permeability.
The generation capacity of the entire Steamboat resource has been estimated using a volumetric reserve estimation methodology. Our best-estimates of the principal parameters needed for this calculation are:
| | |
| • | Average pre-exploitation temperature: 350°F to 390°F, with 370°F most likely |
| | |
| • | Average thickness: 4,000 ft to 4,500 feet |
| | |
| • | Average area: 2.5 to 3.4 square miles, with 2.9 square miles most likely |
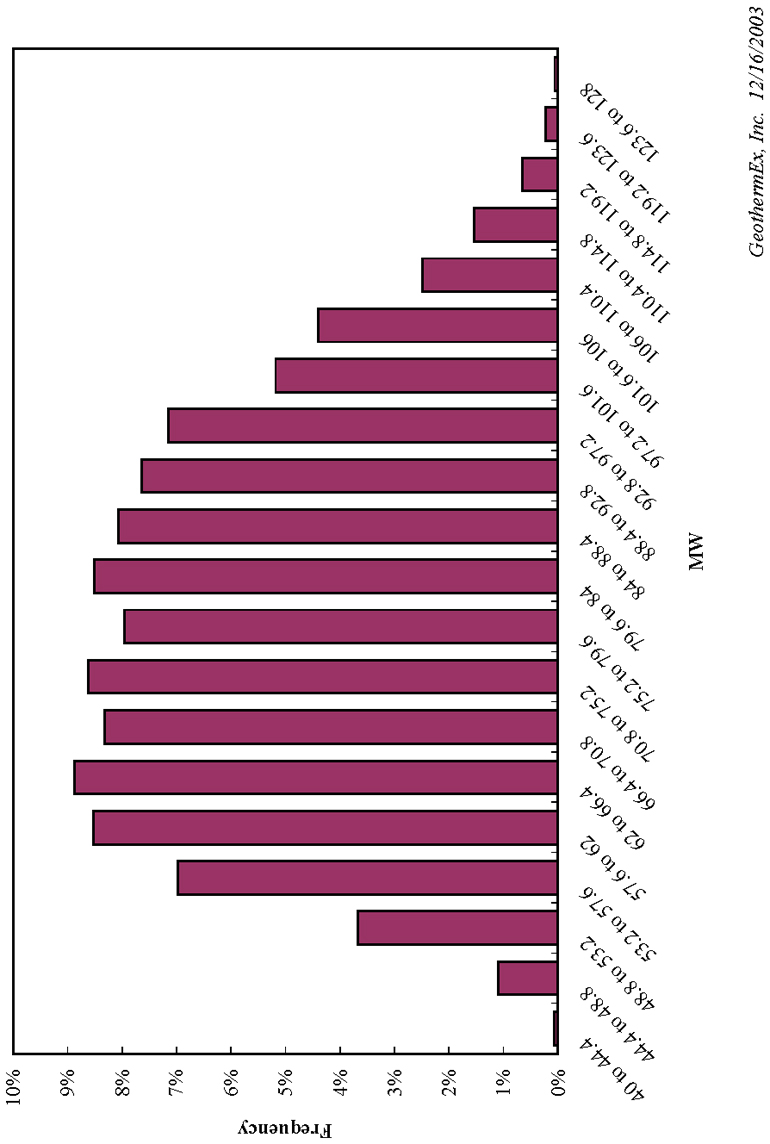
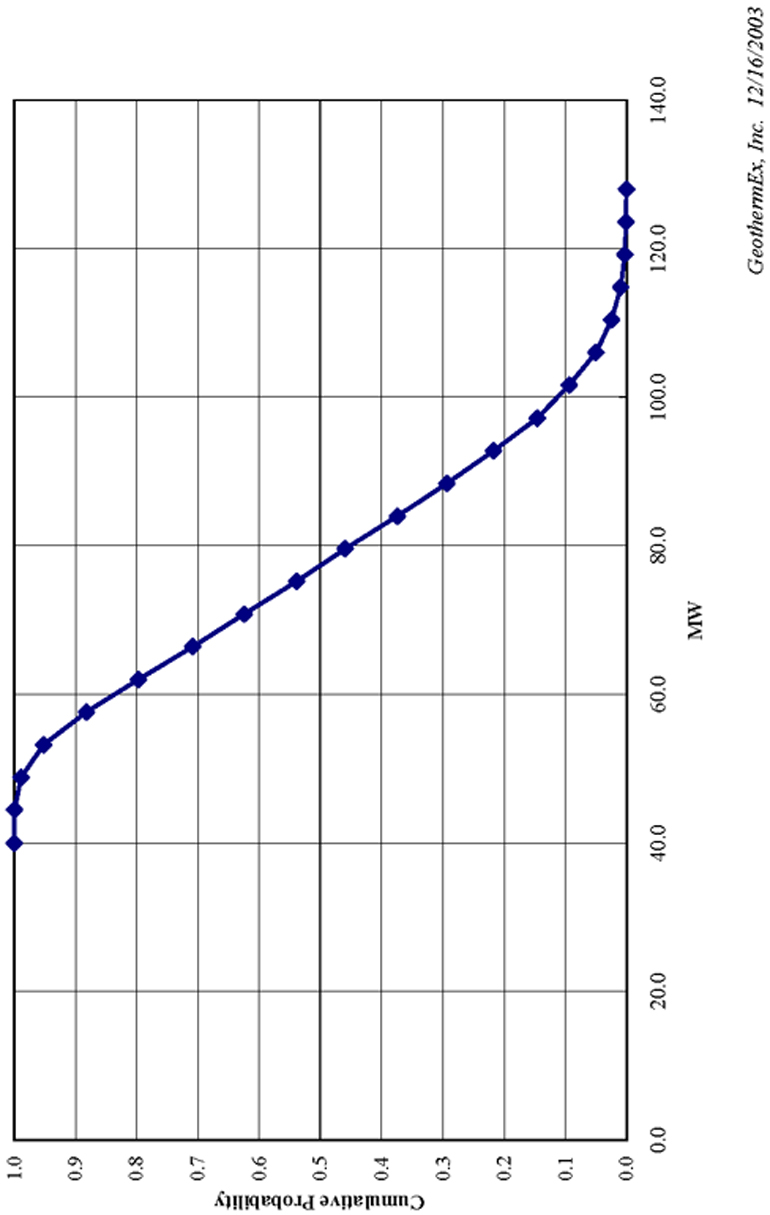
The results of this reserve estimation calculation are illustrated on Figures 4.5 and 4.6. The minimum generation capacity (90% cumulative probability) for 30 years is 56 MW (gross). The most-likely value calculated is 62 MW (gross) for 30 years, but the histogram of results (Figure 4.5) shows a very broad maximum, so there is little significant difference between this and estimates as high as about 90 MW for 30 years.
4-4
5221 CENTRAL AVENUE, SUITE 201
RICHMOND, CALIFORNIA 94804-5829
GeothermEx, Inc.
______________________________________________________________________________
TELEPHONE: (510) 527-9876
FAX: (510) 527-8164
E-MAIL: mw@geothermex.com
This reserves calculation estimates only the heat-in-place in the reservoir at any one time prior to exploitation, and does not consider natural recharge and flow-through of the geothermal fluid, from the deep source beneath Upper Steamboat in the south, to surface and subsurface discharge at the northern end. Numerical simulations of the Steamboat reservoir have suggested that the contribution of hot, natural recharge is considerable.
4.3 Resource Utilization Plan
The wellhead temperatures and flow histories of the individual Steamboat production and injection wells are illustrated in an Appendix B to this report. Injection temperatures are the same at all injection wells, because the injectate is combined flow.
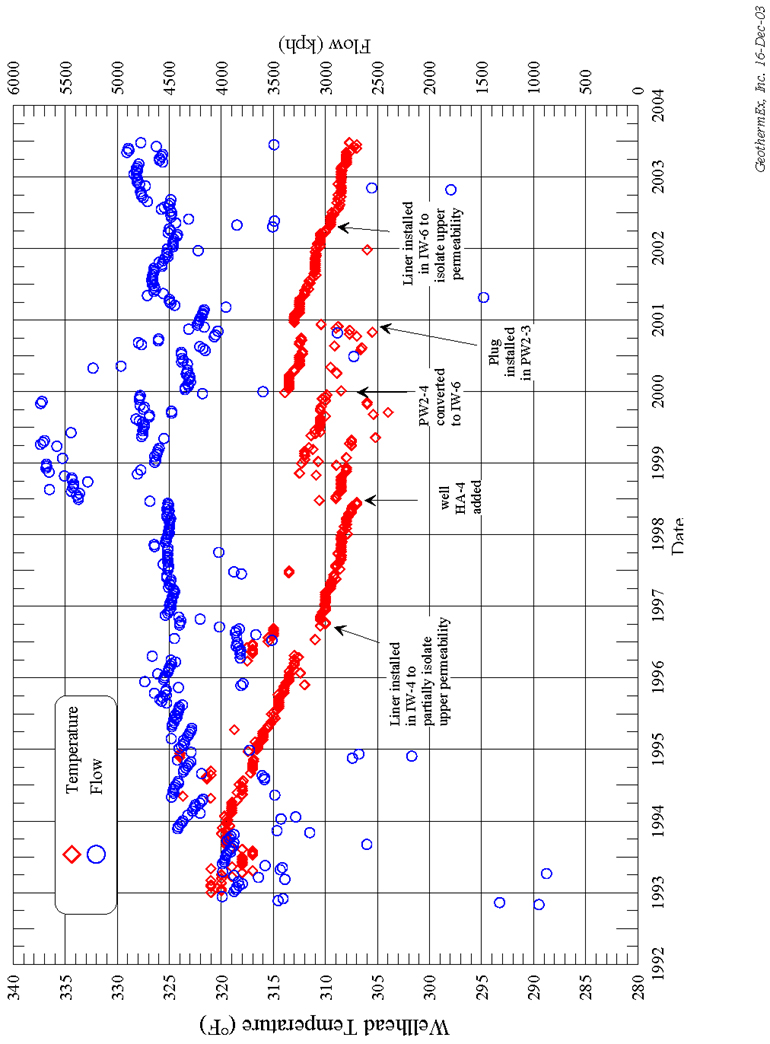
The combined total flow and temperature histories at the Steamboat 2 and 3 plant inlets are shown on Figures 4.7 and 4.8. There is a cross-over of Steamboat 2 and Steamboat 3 production wells at the power plant inlets, so it has been possible for the operator to optimize plant performance by blending the Steamboat 2 and Steamboat 3 well flows. Therefore, the Steamboat 2 and 3 plant inlet temperatures are not weighted averages of the separate sets of wells.
The temperature at Steamboat 2 was 320°F in 1993, and about 307.5°F in mid-2003 (most recent data provided). From January 1994 until mid-1998 the decline rate was a linear 2.8°F per year. Since mid-1998, there have been various adjustments to the production and injection systems, and a linear best fit to the decline since January 2001 is 2.2°F per year. This may have decreased slightly after the installation of a liner in IW-6 in early 2002, but data from 2003 suggest a resumption of the 2.2°F per year rate.
At Steamboat 3, the inlet temperature was about 323°F in 1993 and 309°F in mid-2003 (most recent data provided). From January 1993 until early 2000 the decline rate was a linear 1.8°F per year. Temperatures increased slightly in response to various adjustments to the production and injection systems during 2000 - 2002, and the current decline rate is a bit uncertain due to small but rapid increases and decreases. The overall average since January 2000 has been about 1°F per year, but this is comprised of rapid increases in response to operations changes, separated by declines as large as about 4.8°F per year (last 5 months of 2002), while the temperature during January-June 2003 was all but constant and may even have increased by less than 1°. It is likely that the stability during the first half of 2003 will not continue, but whether the average thereafter will be as low as 1°F per year is unknown.
The available information suggests that the temperature declines at the individual wells and the plant inlets are principally caused by returns of injectate from the injection wells to production wells.
GeothermEx has reviewed the flow rate and temperature histories of the Steamboat 1/1A production wells from start-up through mid-1997. Ormat has provided GeothermEx with the flow rate and temperature data for two recent dates (25 November 2003 and 12 January 2004). The data gap between mid-1997 and the present notwithstanding, it is apparent that the three wells have experienced cooling rates ranging from 1.8 to 2.4°F per year.
Ormat's assets at the Steamboat geothermal field consist of the Steamboat 1/1A and Steamboat 2 and 3 projects, which include two power plant complexes that bear these names. The current combined capacity of these projects is 42 MW (gross). Ormat Nevada Inc. presently operates the plants in essentially the same manner as was done under the previous owners, and the net power produced is sold to Sierra Pacific (SPPC) under existing PPAs. However, Ormat plans to make several important changes to the project during the next few years, which will result in the following operating scenario:
| | |
| • | A new power plant (the "Galena" plant) will be built, near the site of the existing 1/1A power plant. It is expected that the Galena plant will be eligible to sell power to Nevada Power Company (NPC) under an 18 MW PPA that may be awarded through the current offering related to Nevada's Renewable Portfolio Standard (RPS). |
| | |
| • | Once the Galena plant is on line, the 1/1A plant will be shut down, and the geothermal fluid that presently supplies 1/1A will be used to supply the Galena plant (2,423,000 lbs/hour at 306.7°F); the assumed flow rate and temperature are verified from the well histories shown in Appendix B. |
4-5
5221 CENTRAL AVENUE, SUITE 201
RICHMOND, CALIFORNIA 94804-5829
GeothermEx, Inc.
______________________________________________________________________________
TELEPHONE: (510) 527-9876
FAX: (510) 527-8164
E-MAIL: mw@geothermex.com
| | |
| • | The Steamboat 2/3 plant will be operated at a lower output. It will be supplied by approximately two thirds of the geothermal fluid that it presently receives; the remainder of the fluid will be re-directed to the Galena plant. A portion of the power generated by the Galena plant will be used to make up any shortfall in generation of the 2/3 plant below the level required to meet its contractual capacity requirements. |
| | |
| • | The overall scheme of production will remain the same, with the exception that well 2-2 will be reactivated to produce approximately 250,000 lbs/hr of 280°F fluid; the assumed flow rate and temperature are verified from the history of this well. |
| | |
| • | The injection scheme may or may not be changed; an optimum plan of injection will be developed and implemented. |
| | |
| • | The base case projection assumes a generation decline rate of 1.8°F per year; this is close to what has been the case in recent years. The accelerated cooling case in the projection assumes a more conservative temperature decline rate of 2.7°F per year. |
4-6
5221 CENTRAL AVENUE, SUITE 201
RICHMOND, CALIFORNIA 94804-5829
GeothermEx, Inc.
______________________________________________________________________________
TELEPHONE: (510) 527-9876
FAX: (510) 527-8164
E-MAIL: mw@geothermex.com
5. BRADY PROJECT
5.1 Project History
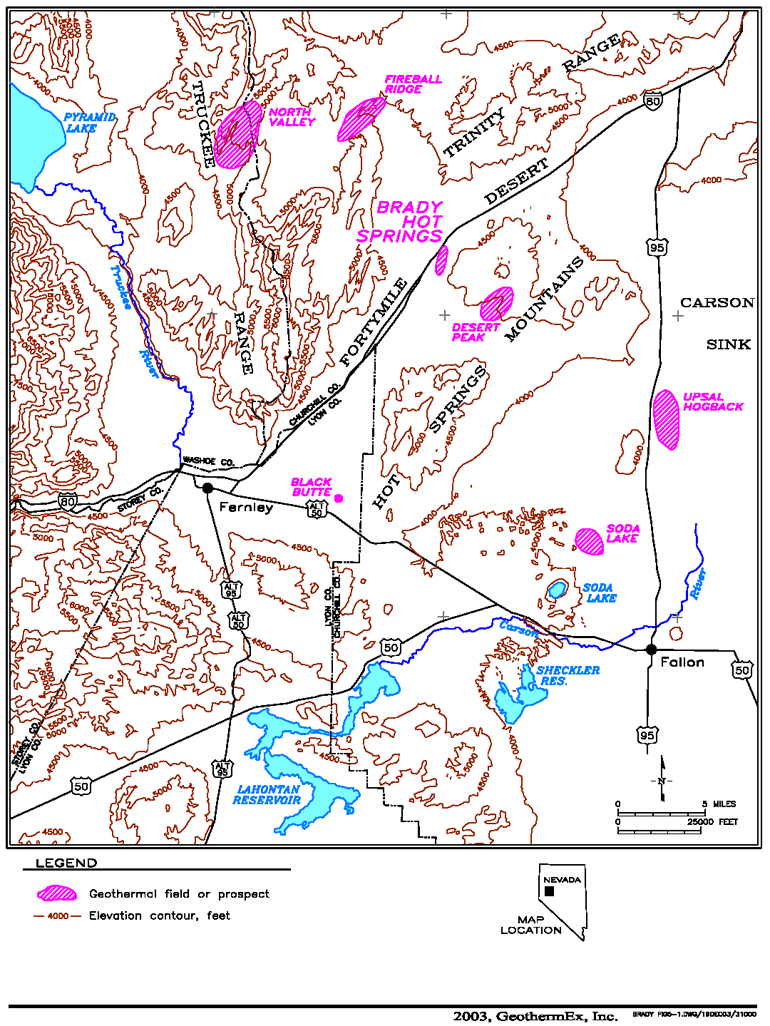
The Brady project is located in Churchill County, Nevada, approximately 60 miles northeast of Reno and near the northwestern margin of the Carson Sink (Figure 5.1). Surface manifestations of geothermal activity, including the historic hot springs, occur near Interstate Highway 80 along the trace of the Brady Fault.
Exploration for the purpose of geothermal resource exploitation began in the late 1950s. Between 1959 and 1986, sixteen wells were drilled in the field to depths ranging from less than 250 feet to more than 7,000 feet. A number of the wells produced thermal water from a shallow aquifer fed by the Brady Fault, and several of these wells were ultimately used to supply the onion drying facility originally built and operated by Geothermal Food Processors (the drying plant continues to operate annually, supplied by fluid from the power generation project). The deeper wells extended into the footwall of the Brady Fault, and did not encounter sufficient permeability beneath the zone around the fault to yield commercial production.
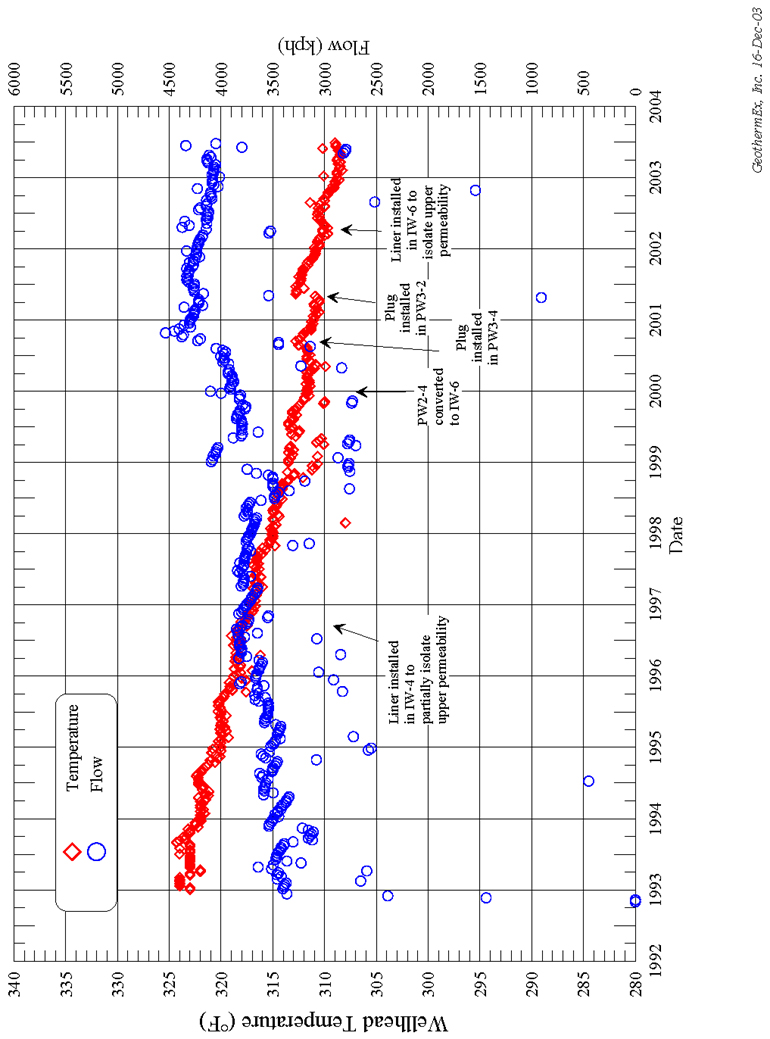
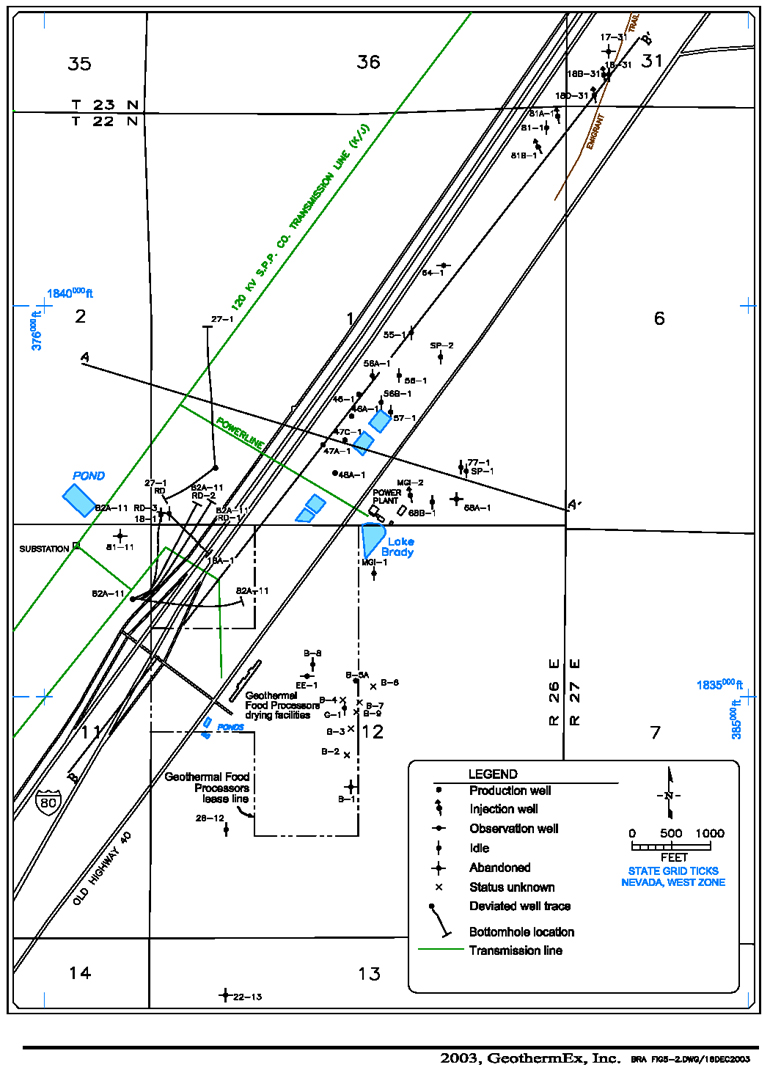
Beginning in 1990, commercial development of the Brady field was undertaken by Hot Springs Power and Brady Power Partners, with the objective of installing and operating a 25.85 MW (gross) geothermal power plant. In late 1990, a slim-diameter well, 57-1, was sited and drilled with the objective of intersecting the Brady Fault at a deeper level than previous wells. This objective was achieved, and commercial production of 350°F fluid was obtained. A number of full-diameter production wells were then drilled, targeting production zones at similar depths along the length of the Brady Fault within the lease area controlled by Brady Power Partners (Figure 5.2).
Investigation of possible injection well sites was also conducted while production drilling was underway, but the only permeability encountered outside the Brady Fault was associated with the shallow lava aquifer. Therefore, given the limited time available before power generation started, the only realistic option at the time was to drill injection wells into this shallow aquifer, as far away from the production wells as possible; the wells were therefore located on the basis of the northern-most surface thermal manifestations. These wells were successful in finding permeability, but a tracer test showed that there was significant interaction between this injection area and the production wells and it was therefore recognized that additional injection sites would probably need to be found in the future.
The Brady power plant began operation in June 1992. The plant design incorporated three water-cooled condensing turbines, supplied by steam separated from thermal water produced by up to 9 pumped production wells. Significant cooling of the produced fluid was observed almost immediately, as expected from the tracer testing results. In light of this problem, a decision was made to drill new injection wells to the southwest of the production field (and located on the west side of Interstate 80), with the aim of injecting deeper into the fault and thereby reducing the possibility of thermal breakthrough. Wells 18-1 and 18A-1 were therefore drilled to targets based on extrapolating the apparent dip and strike of the Brady Fault, as interpreted from the production wells. Both wells were successful, although the permeable zone in 18-1 was encountered approximately 1,000 feet deeper than anticipated.
A tracer test conducted in well 18-1 showed positive returns in the production wells, indicating a connection, probably through the Brady Fault, between the shallow production wells and the deep injectors. Diversion of a portion of the injection fluid from the northern injectors to the two southern injectors began in June and July of 1993, and an immediate impact was noted in the production wells; the northern production wells (56-1 and 56B-1) increased in temperature but the temperatures in the southern production wells (46-1, 46A-1, 47A-1 and 47C-1) began to decline at a higher rate than previously noted. The temperature decline in the southern wells had not been expected, and the fast response indicated that it was not due to thermal breakthrough of the southern injection water. Temperature data from wells 46A-1 and 47A-1 confirmed that a second source of cool water was present in the field; possibly associated with a highly permeable aquifer or aquifers; this source was inferred to be principally responsible for the temperature declines observed in the southern production wells.
5-1
5221 CENTRAL AVENUE, SUITE 201
RICHMOND, CALIFORNIA 94804-5829
GeothermEx, Inc.
______________________________________________________________________________
TELEPHONE: (510) 527-9876
FAX: (510) 527-8164
E-MAIL: mw@geothermex.com
The continuing temperature decline led to the decision to drill an additional injection well (82A-11) to the south. The well did not find permeability at its original target, and was eventually redrilled towards well 18-1, where a suitable permeable zone was found. The diversion of additional injected water to the south initially resulted in a rise in temperature in the northern production wells (56-1 and 56B-1), but the overall trend of temperature decline continued.
In 1995, injection to the southern wells was stopped, and well 82A-11 was converted to a production well. The higher-temperature production from the deeper part of the Brady Fault intercepted by 82A-11 immediately increased the average temperature of the produced fluid by more than 10°F. After several months the temperature decline resumed, though at a somewhat lower rate than previously. In 1996, well 27-1 was drilled as a "twin" of 82A-11. The average fluid temperature increased temporarily when 27-1 was brought on line, but the longer-term decline trend was not changed significantly.
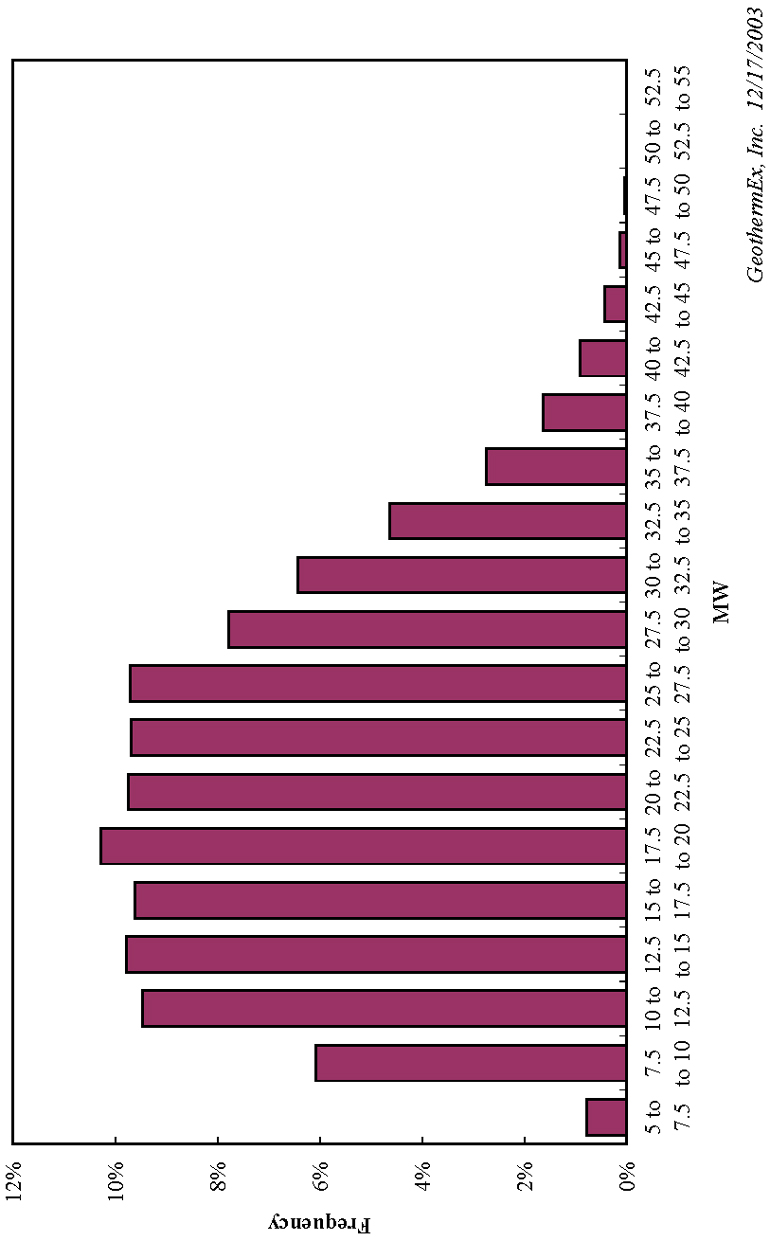
During 1997-1999 no major changes to the production/injection scheme were made. The rate of temperature decline during this period varied mainly in response to changes in the total rate of fluid production. Total generation declined from about 20 MW (gross) in mid-1996 to 15-16 MW (gross) at the end of 1999.
In an effort to mitigate this decline, Brady Power Partners conducted a study aimed at identifying an injection zone that would minimize cooling. As a result of this study, 4 new injection wells (61-25, 73-25, 74-25 and 81-25) were drilled in an area several miles to the southeast of the producing well field, and all of the injection was shifted to this "remote" injection area at the beginning of 2000. Production temperatures increased somewhat, but reservoir pressures dropped more than predicted, resulting in a significant decrease in fluid production and no net gain in generation. Subsequently, the proportion of water diverted to the "remote" injection area has been varied periodically in an effort to obtain the best balance between reservoir pressure support and minimal cooling. At present, about 25% of the total fluid produced is injected in the "remote" area.
Beginning in mid-2001, the pumps in the production wells were set at deeper levels in order to produce more fluid under the conditions of lower pressure. The balance of injection and increased production from the deeper wells resulted in a temporary increase in average production temperature and a reduction of the overall temperature decline trend.
In mid-2002, an Ormat Energy Converter (OEC) unit was put into operation as a bottoming cycle, using the separated brine to generate additional power up to 6-7 MW (gross). This immediately increased the total power generation level from the Brady plant, while decreasing the injection temperature from about 225°F to about 180°F. This and other modifications to the plant equipment, along with the enhancements to the well field operating scheme, raised the total generation of the Brady project by more than 10 MW between mid-2001 and December 2003. Ormat has determined that the current capacity of the plant is 24 MW (gross).
5.2 Resource Characteristics
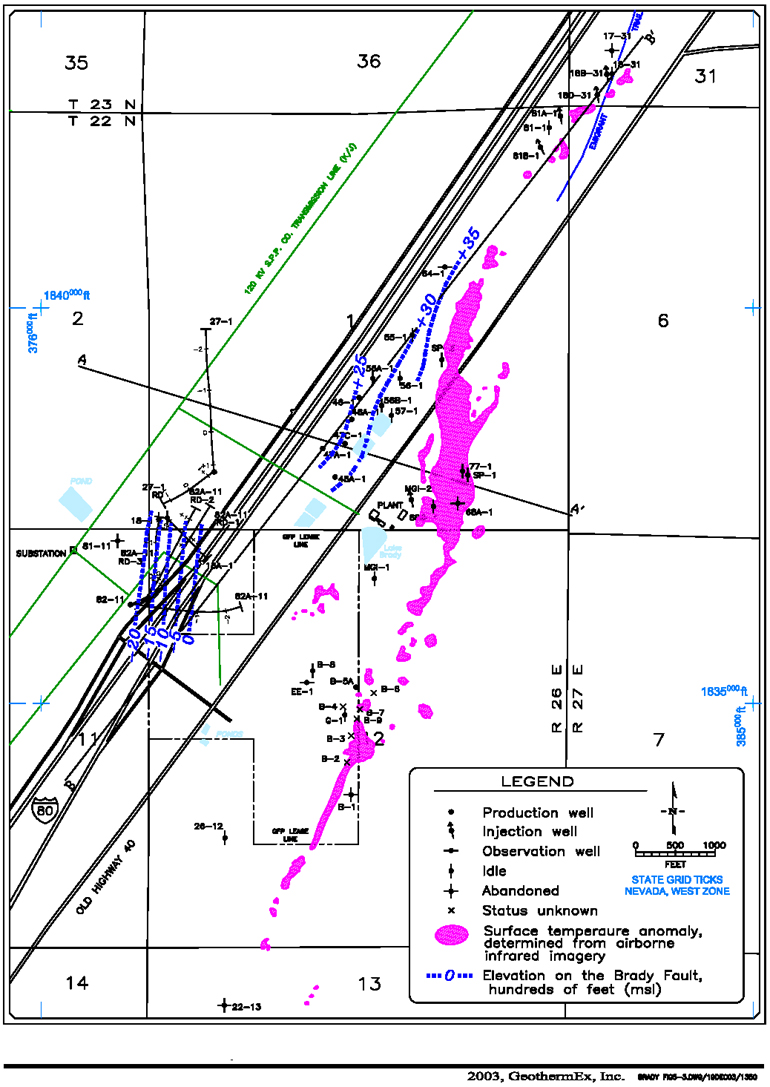
The dominant geologic feature of the Brady area is a linear, NNE-trending band of hot ground that extends for a distance of two miles. The location of this feature, as mapped by aerial infrared imagery, is shown on Figure 5.3. Although there is no topographic scarp, its linearity and obvious association with thermal activity indicate that this feature is the surface trace of a permeable fault that conducts thermal fluid to the surface. In view of the essential role of the Brady Fault in providing the conduit for thermal fluid to reach the surface, the essential elements of the geothermal reservoir in the Brady field are:
| |
| • | the position of the Brady Fault at depth; |
| |
| • | the geometry of the permeable channels within the fault zone that are conducting thermal fluid; and |
| |
| • | the aquifers intersected by the fault and which are in hydraulic communication with the thermal fluid in the fault. |
5-2
5221 CENTRAL AVENUE, SUITE 201
RICHMOND, CALIFORNIA 94804-5829
GeothermEx, Inc.
______________________________________________________________________________
TELEPHONE: (510) 527-9876
FAX: (510) 527-8164
E-MAIL: mw@geothermex.com
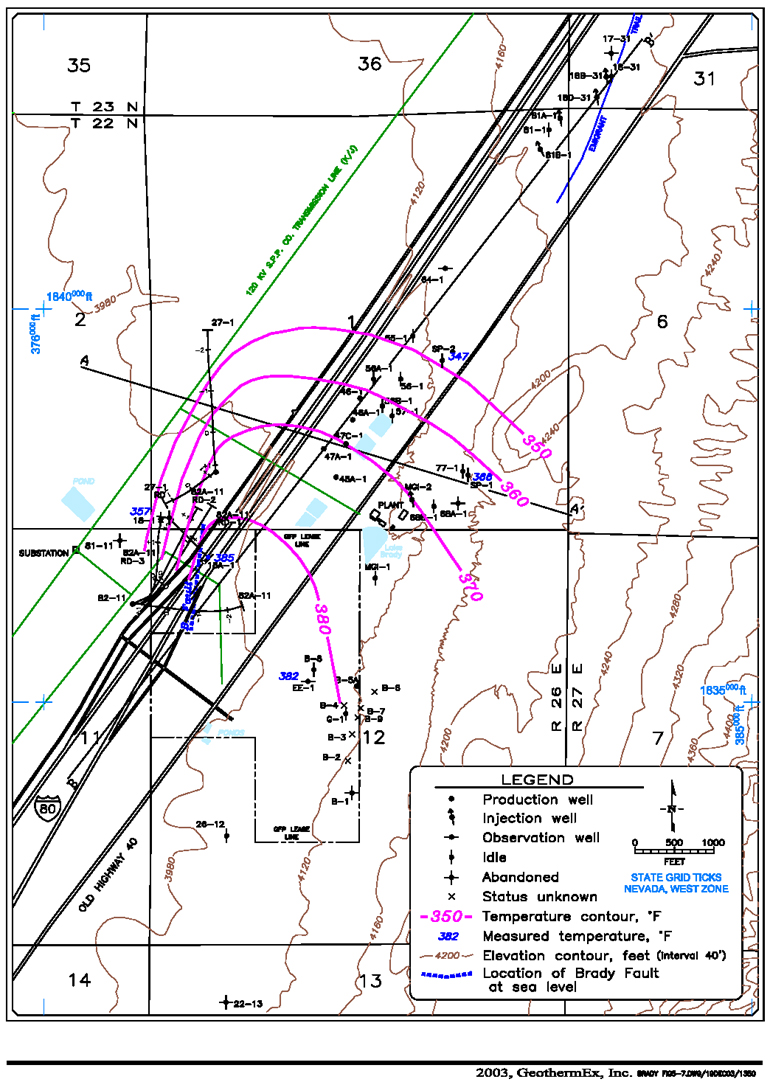
Elevation contours have been drawn on the Brady Fault where it was penetrated by wells (Figure 5.3). The depths in the wells at which the fault was penetrated have been identified by two methods: a) recognition of faulted out portions of the stratigraphic section; and b) location of major zones of permeability. The contours on the fault zone show that the Brady fault dips generally northwestward, but the exact direction and amount of dip vary from place to place. Furthermore, the difference in orientation of the fault between the northern group of wells and the southern, deeper group (18-1, 18A-1, 82A-11 and 27-1) indicates the presence of a structure that offsets the Brady fault somewhere between these two areas. The exact nature of the offsetting structure is unknown; however, it appears to have an important role in controlling the main upflow of fluid into the geothermal reservoir.
The Brady Fault offsets a number of stratigraphic units that are identified consistently in wells drilled in the field. From youngest to oldest, these units are:
| | |
| • | The TRUCKEE FORMATION, which is a lake bed deposit, 900 feet thick, composed of interbedded clay, silt and limestone. |
| | |
| • | The DESERT PEAK FORMATION, which is composed of interlayered volcanic tuffs and lava flows and ranges from 2,000 to 2,300 feet in thickness. |
| | |
| • | The CHLOROPAGUS FORMATION, consisting of interlayered basalt and tuff, and ranges in thickness from 700 to 1,100 feet. |
| | |
| • | RHYOLITE (unnamed), consisting of an 1,800-foot sequence of mainly tuffs and breccias. |
| | |
| • | METAVOLCANIC ROCK, which is the basement rock of the area. Its thickness is unknown. |
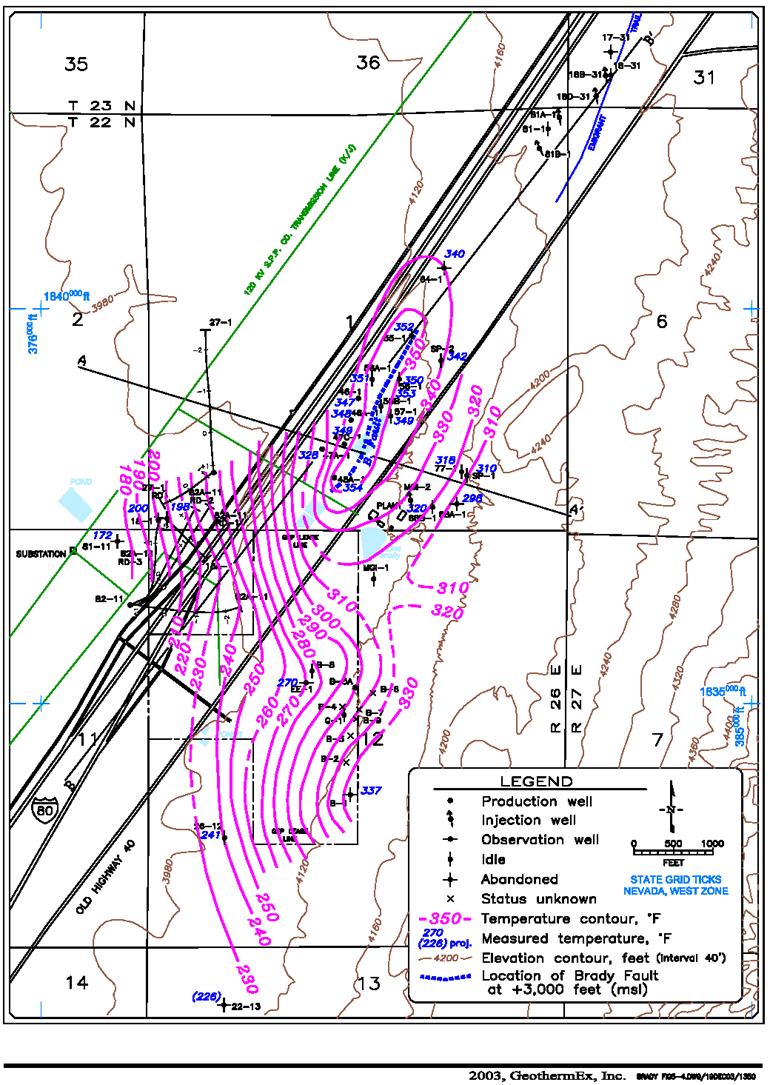
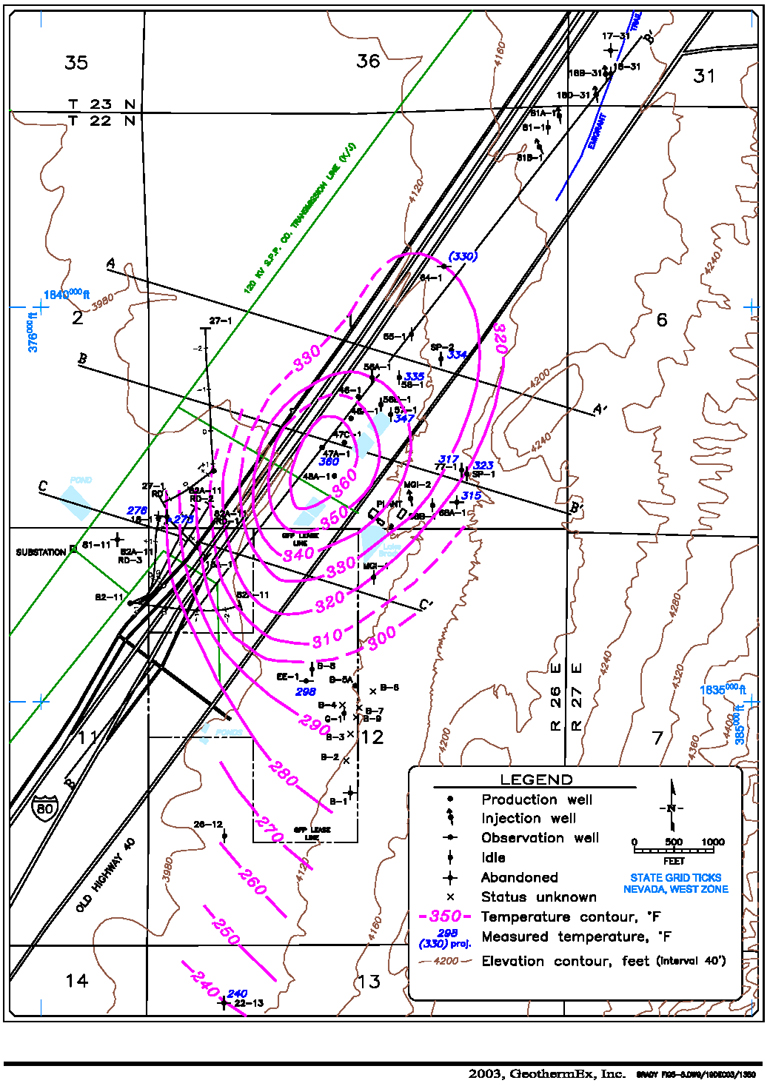
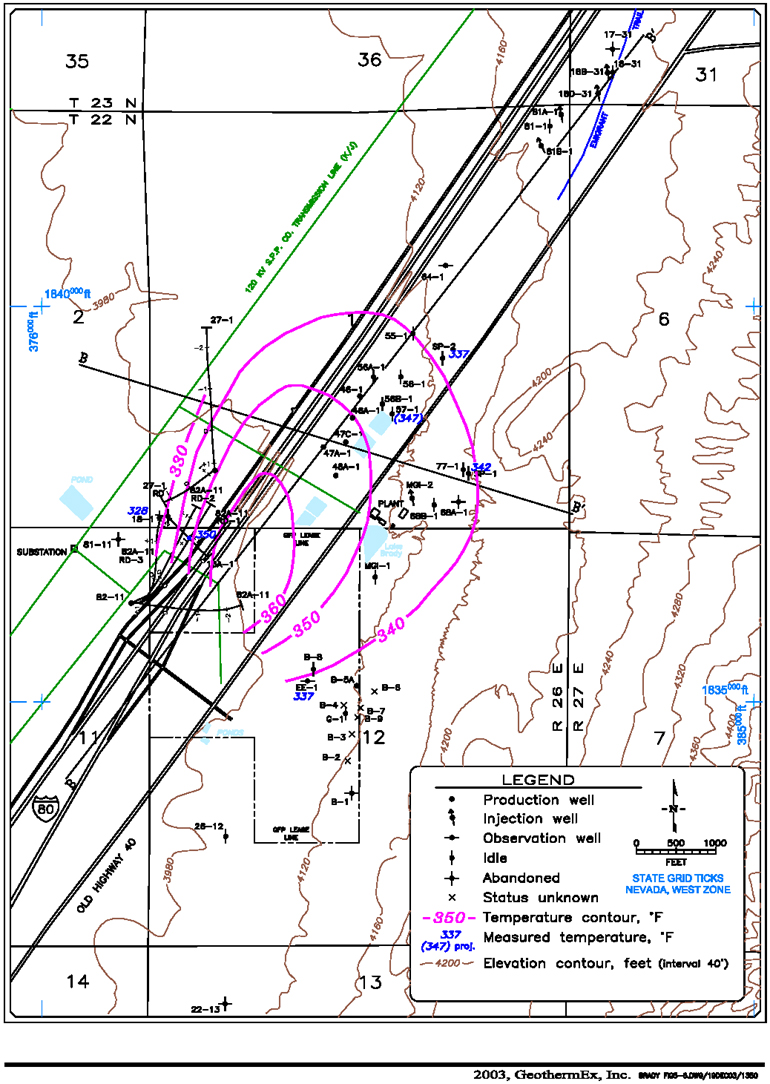
The geometry of the Brady reservoir is illustrated by the three-dimensional distribution of temperature as defined by downhole measurements. Figures 5.4 - 5.7 show the deduced original distribution of subsurface temperatures at 1,000 foot intervals, from an elevation of +3,000 feet down to mean sea level. The three shallowest map shows that there are two separate temperature highs, one in Section 1 and the other in Section 12. Both highs trend NE, parallel to the Brady Fault, but are offset from one another, perpendicular to the fault, by a distance of 2,000 feet. This offset is apparent, but not as large, in the pattern of the surface temperature anomaly shown in Figure 5.3. It is highly probable that this lateral offset in the shallow temperature distribution is related to the structural feature channeling thermal fluid to the surface, as discussed above.
Below +2,000 feet msl, contouring is based more on geologic interpretation than actual measurements. The high temperature "eye" of the anomaly migrates downward along the Brady Fault, and to the SW, based on weak indications of this direction of plunge in the shallower temperature data. At the deepest levels for which temperature data are available, original reservoir temperatures exceed 380°F. It should be noted that, due to the exploitation history of the field, production temperatures at this level have not been achieved, and current production temperatures are significantly lower as a result of reservoir cooling.
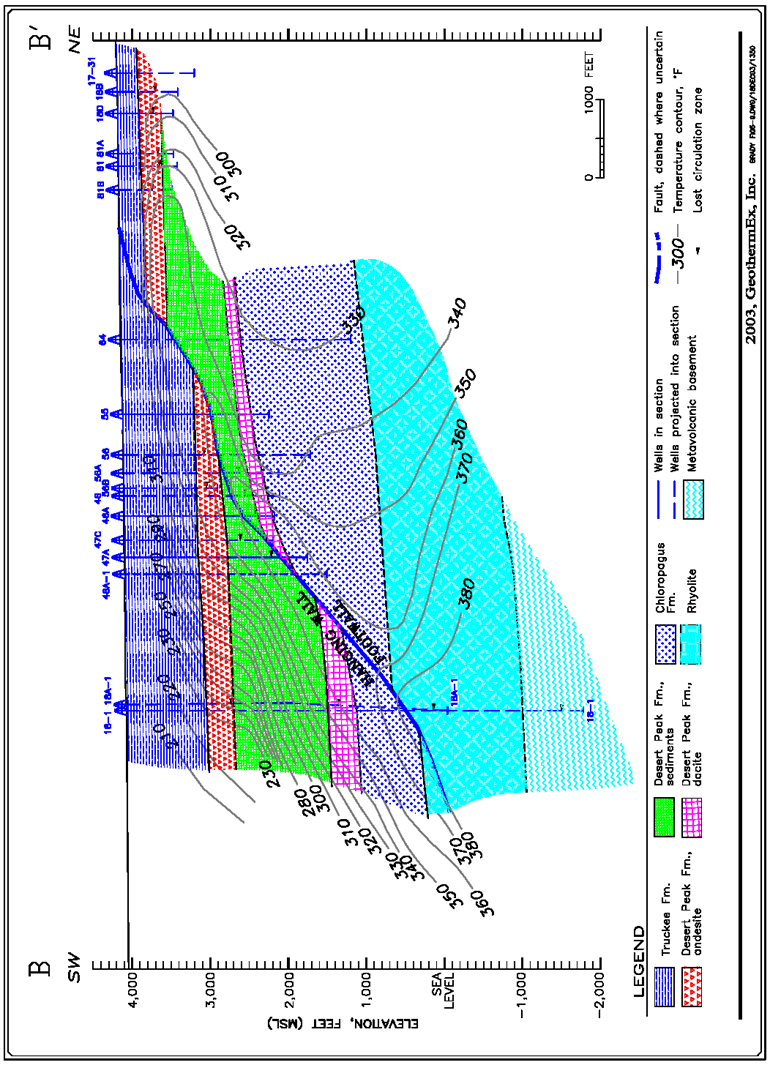
To illustrate the conceptual model developed from lithologic, geophysical and temperature logs, geologic/temperature cross sections have been constructed through the Brady Field. Section A-A' (Figure 5.8) shows the distribution of geologic features and temperature in a plane transverse to the Brady Fault. The top of the Desert Peak Formation is displaced by 700 feet across the fault. Well 47A-1 has two permeable zones, one in the fault and the other in a dacite member of the Desert Peak Formation. As will be discussed below, the presence of aquifer permeability and fault permeability in the same well, as illustrated by 47A-1, contributes significantly to the cooling problem in the Brady Field. The temperature pattern in section A-A' shows that thermal fluid is not moving up the fault, but rather, is migrating laterally to the NE along the fault.
Section B-B' (Figure 5.9) is drawn sub-parallel to the Brady Fault, starting in the footwall on the NE and passing into the hanging wall on the SW. The apparent low angle of dip on the fault is an artifact of the low angle at which the section crosses the fault. Because most of the wells drilled close to the Brady Fault have been projected into the section, it illustrates how closely permeability is associated with the fault. The section also shows the geologic relationship between the northern injection wells and the rest of the field. Northern injection does not pass directly
5-3
5221 CENTRAL AVENUE, SUITE 201
RICHMOND, CALIFORNIA 94804-5829
GeothermEx, Inc.
______________________________________________________________________________
TELEPHONE: (510) 527-9876
FAX: (510) 527-8164
E-MAIL: mw@geothermex.com
into the fault, but rather into an andesite aquifer located in the foot wall block at the top of the Desert Peak Formation. This aquifer extends the length of the field and helps account for the high communication between the northern injection wells, some of the producing wells and the central injection wells MGI-1 and MGI-2.
Some of the major aspects of the conceptual model, particularly where it affects production, can be summarized as follows:
| | |
| • | The noted deepening of permeable zones to the SW within the production field indicates that production is associated with a NW-dipping fault (the Brady Fault). The individual well production zones, although they occur at different depths, have been shown by both pressure interference and tracer test results to be interconnected. |
| | |
| • | The northern injection wells, wells MGI-1 and MGI-2 and the production wells drilled on the ConAgra lease area are completed in a shallow lava aquifer on the SE side of the Brady Fault. This aquifer is believed to be fed by the Brady Fault and is associated with the surface thermal manifestations. The interconnections between these wells and with the deeper production wells have been shown to exist by pressure interference and tracer test results. |
| | |
| • | Wells 55-1, 56-1, 56B-1 and 57-1 appear to produce only from a zone associated with the Brady Fault at a depth of approximately 1,100 feet. These wells are located in a line along the strike of the fault as defined by the surface thermal manifestations. Well 48A-1 also produces from a zone at a similar depth, although it is located to the west of the line of strike. This change in permeable zone characteristics may indicate that the Brady Fault is offset in the area of 48A-1 by a cross-fault. |
| | |
| • | Wells 46-1, 46A-1, 47A-1 and 47C-1 appear to have encountered permeability in both the zone associated with the fault and in a deeper aquifer, or aquifers. Temperature logging has shown that the deep aquifer(s) are providing cool water to the production wells and are therefore responsible, in part, for the noted cooling in these production wells. Such aquifers have also been identified from geophysical logs. |
| | |
| • | In the southern injection area, wells 82A-11 (OH), RD-1 and RD-2 intersected the Brady Fault in the elevation range of -500 to -700 feet msl. At this depth, the fault is in a rhyolite unit and is not permeable. Well 18A-1, however, intercepted the fault in the same rhyolite, at +138 feet msl, and did find permeability. Wells 18-1 and 82A-11 RD-3 both found permeability near the fault, down-dip from the permeable zone found in 18A-1. Well 18A-11 RD-3 is injecting into a zone near the bottom of the rhyolite unit and well 18-1 is injecting into basement just below rhyolite. |
| | |
| • | The difference between the structural attitude of the Brady Fault in the southern injection area, as compared to the production area, as well as the subsurface temperature patterns developed above 2,000 feet msl, support the possibly that the production and injection areas may lie on opposite sides of either a cross-fault offsetting the main Brady Fault or a SW-plunging roll within the fault itself. This feature appears to be the structure controlling thermal fluid upflow in the Brady system. |
The recoverable heat energy within the Brady system can be evaluated by estimating the average thickness, area, temperature and other properties of the rock that contains the geothermal reservoir. We have used the same volumetric reserve estimation methodology used to evaluate reserves for the other project areas.
Minimum, most-likely and maximum values of area, thickness and average temperature of the reservoir were estimated from the temperature distribution deduced from well data. The reservoir area is estimated to range from 0.6 to 1.2 square miles, with a most likely value of 0.8 square miles. The corresponding values for reservoir thickness are 4,500, 5,500 and 5,000 feet, and for reservoir temperature they are 340°F, 380°F and 360°F. The minimum and maximum values for porosity and recovery factor are considered to have equal probability. The range of porosity is estimated to be 3% to 7%, and recovery factor is estimated to range from 5% to 20%. The rejection temperature was assumed to be 59°F.
5-4
5221 CENTRAL AVENUE, SUITE 201
RICHMOND, CALIFORNIA 94804-5829
GeothermEx, Inc.
______________________________________________________________________________
TELEPHONE: (510) 527-9876
FAX: (510) 527-8164
E-MAIL: mw@geothermex.com
Figure 5.10 shows the histogram of the estimated reserves in gross megawatts (for a 30-year project lifetime) for the Brady system. The results indicate that the geothermal energy reserves have a most-likely value close to 20 MW (gross). Figure 5.11 presents the results of the reserve estimation in the form of a cumulative probability distribution; this figure shows that the reserves exceed about 11 MW (gross) with a cumulative probability of 90%. The reserves estimate reflects the heat-in-place within the reservoir zone itself, and does not take into account any recharge that may occur; as pointed out for Steamboat, a considerable amount of additional reserves should be available from natural hot recharge.
5.3 Resource Utilization Plan
The most critical site-specific issues related to the exploitation and management of the Brady geothermal resource are temperature decline and optimization of the utilization of the geothermal fluid. Both of these issues have been addressed during the lifetime of the project. An additional issue affecting the Brady project is its obligation under a Settlement Agreement to supply the ConAgra drying plant with thermal water during part of each year.
Figure 5.12 shows the combined output (in gross and net MW) of the power plant units over their period of operation, along with the average temperature of the produced and injected fluid, and the total rate of production and injection in the field. Figure 5.13 shows a detailed plot of the history of average production temperature in the field, with major changes to the scheme of field operation noted.
Detailed production/injection records from the principal production wells that have been used to supply the Brady plant are presented in Appendix C. These consist of 5 northern producers (46-1, 46A-1, 47A-1, 47C-1 and 48A-1) and the two deep southern producers (27-1 and 82A-11). Some production was also obtained from several other northern wells during the early years of the project. Appendix C also includes plots of the well-by-well history of injection. These include the northern injection wells (81A-1, 81B-1, 18B-31 and 18D-31), well MGI-2 (which was used for injection to various degrees until late 2000), and the "remote" injection wells (61-25, 73-25, 74-25 and 81-25). Not shown are the injection histories of the deep wells (18-1, 18A-1 and 82A-11), where injection took place only during 1993-1995.
As shown in Figure 5.12, through mid-2001 there was a fairly steady decline in the output of the Brady plant, from a peak of about 25 MW (gross) to about 12 MW (gross). This decline coincided with an overall decline in the combined production temperature, from an initial value of more than 350°F to less than 310°F. In recent years, Ormat has implemented a series of modifications to the plant and well field that has increased generation to a present level of more than 22 MW (gross). These modifications include:
| | |
| • | adding three OEC units to generate power from the separated brine; |
| | |
| • | adding an additional separator to supply steam directly to the flash-plant gas ejectors; |
| | |
| • | re-setting the pumps in the production wells to deeper levels, allowing production rates to be increased; |
| | |
| • | shutting in the two coldest production wells; and |
| | |
| • | decreasing the amount of injection to the "remote" injection area. |
As shown in figures 5.12 and 5.13, these modifications have helped allow the total production rate from the field to be stabilized near 10,000 gpm without the addition of new production wells. However, the overall trend of cooling has continued, though at a somewhat reduced rate. It should be anticipated that some amount of additional cooling will be experienced in the future as the field continues to be exploited in its current configuration.
Ormat contracted a study and forecast of the performance of the Brady field in 2002. This study included an updated numerical model of the geothermal system, based on which it was concluded that cooling would proceed at a rate near 2.5°F/year for about the next 2½ years, assuming the current field and plant configuration. The model further suggests that, under the current operating scheme, the long-term temperature decline rate would be between 2°F and 2.5°F. GeothermEx has not reviewed the numerical model on which these forecasts are based, nor developed its own
5-5
5221 CENTRAL AVENUE, SUITE 201
RICHMOND, CALIFORNIA 94804-5829
GeothermEx, Inc.
______________________________________________________________________________
TELEPHONE: (510) 527-9876
FAX: (510) 527-8164
E-MAIL: mw@geothermex.com
independent model of the system; however, the model results provided by Ormat appear to reflect a reasonable match to the observed operating results.
Ormat's operating plan within the context of this note offering does not include any significant operational changes. The project pro-forma includes two generation scenarios: a "base case", in which generation is calculated assuming that produced fluids will continue to cool at a rate of 2.5°F per year, and an "accelerated cooling" case based on a cooling rate of 3.5°F per year. These assumed cooling rates are reasonable, based on the history and forecast discussed above.
The Brady section of the project pro-forma also includes the generation from the Desert Peak plant that is dedicated to the Brady project. This generation is discussed separately under the chapter related to Desert Peak.
The Brady project is obligated to supply the ConAgra drying plant with the thermal water it requires to operate. Most of the fluid requirement occurs during the months of May through October (coinciding with the period when onions are available for processing). During these months, the fluid delivered to the plant ranges up to about 1,300 gpm, but in recent years has averaged closer to 1,000-1,100 gpm (Figure 5.14). The temperature of this fluid is essentially equivalent to the temperature of the fluid delivered to the Brady power plant. During the off-season months (approximately November through early May), a smaller volume (less than 250 gpm) of discharged water from the plant is delivered to the ConAgra plant to maintain the facilities at a minimum temperature (Figure 5.14).
5-6
5221 CENTRAL AVENUE, SUITE 201
RICHMOND, CALIFORNIA 94804-5829
GeothermEx, Inc.
______________________________________________________________________________
TELEPHONE: (510) 527-9876
FAX: (510) 527-8164
E-MAIL: mw@geothermex.com
6. DESERT PEAK PROJECT
6.1 Project History
The Desert Peak geothermal field is located approximately 65 miles NE of Reno, Nevada, in the northern portion of the Hot Springs Mountains, about 5 miles E of the Brady Hot Springs geothermal field. As discussed in the previous chapter, the Brady area was the focus of early exploration efforts by various parties. In 1973, Phillips Petroleum Company (Phillips) began a temperature gradient drilling program that was originally planned to futher define the eastern part of the Brady geothermal system. However, the eighth temperature gradient hole showed unexpectedly high temperatures about 4 miles E of Brady, and three additional gradient holes confirmed the existence of a separate thermal anomaly at Desert Peak.
During a 1974 lease offering, Union and Phillips filed for some of the same lease parcels in this newly discovered area, resulting in the creation of the Brady-Hazen Known Geothermal Resource Area (KGRA), which encompassed both the Brady and Desert Peak areas. Phillips drilled the first production test (29-1) in 1974 near the center of the thermal anomaly defined by shallow temperature gradient drilling. This well did not encounter deep production but penetrated a thin, shallow thermal aquifer. Phillips then drilled a series of 2,000-foot wells (stratigraphic test or "ST" wells) in 1976 to measure temperatures beneath this shallow outflow zone. Two of these wells (ST-2 and ST-5) encountered the shallow outflow but also found very high temperature gradients beneath it.
In late 1976, well 21-1 was drilled to a depth of 4,150 feet; it encountered temperatures in excess of 400°F and was a commercial producer (Figure 6.1). Well 21-2 was drilled shortly thereafter and also encountered commercial permeability. To further delineate the field, Phillips drilled three more stratigraphic test holes (ST-7, -8 and -9) in 1977; one of these (ST-7) encountered a high thermal gradient about a mile to the east of the existing producers. With partial funding from the US Department of Energy, well 23-1 was drilled to a depth of 9,641 feet near ST-7. While the well found temperatures comparable to those in 21-1 and 21-2, it had very low permeability and did not flow at commercial rates. This well is now the focus of another DOE-supported program to investigate the feasibility of developing Enhanced Geothermal Systems, which has the goal of developing methods to stimulate reservoirs that are hot but lack sufficient natural permeability to sustain commercial flow.
In 1982, two additional wells were completed (Figure 6.1): well 86-21 (to a depth of 3,269 feet); and well 22-22 (6,730 feet). The first was a successful producer, while the second flowed at modest rates. In 1984, two additional stratigraphic test wells (ST-9 and -10) were drilled to delineate temperatures in the southern part of the field. In 1984, well 67-21 was drilled to a depth of 4,097 feet from a surface location next to well 21-1, and was completed with a larger-diameter production casing (13 3/8-inch versus 9 5/8-inch) to maximize its flow rate. Consistent with its location, it encountered conditions very similar to well 21-1.
Both binary and flash technology were considered for the Desert Peak power plant, based on utilizing 1,000,000 pounds per hour of fluid (supplied by two wells) at a wellhead pressure of 97 psia. Eventually, a dual-flash design incorporating a rotary separator turbine and a dual-pressure steam turbine was constructed, and generation began in December 1985. The rotary separator turbine, which was expected to provide about 650 kW, did not perform as was expected and was removed from the plant, which has a capacity of 8 MW (gross).
In late 1985, Phillips sold its geothermal properties, including the Desert Peak wellfield and power plant, to Chevron Resources Company. California Energy Company acquired the project in 1991 and was field and power plant operator until 2001, when Ormat acquired the project. Ormat recently began a program of temperature gradient drilling and full-diameter well drilling to the NE of the area of current production area to support a proposed capacity expansion.
Until a few years ago, most of the power from the Desert Peak plant was sold to Sierra Pacific Power Company. At present, the power produced at Desert Peak is transferred to the Brady Hot Springs project.
6-1
5221 CENTRAL AVENUE, SUITE 201
RICHMOND, CALIFORNIA 94804-5829
GeothermEx, Inc.
______________________________________________________________________________
TELEPHONE: (510) 527-9876
FAX: (510) 527-8164
E-MAIL: mw@geothermex.com
6.2 Resource Characteristics
The Desert Peak geothermal field is located within the Hot Springs Mountains, which form part of the western boundary of the Carson Sink. There are several other producing geothermal fields in the area (Brady Hot Springs, Stillwater, Soda Lake and Dixie Valley). The Hot Springs Mountains are comprised of Tertiary volcanic rocks; however, drilling at Desert Peak reveals that these younger volcanics are underlain by Mesozoic marine sediments and intrusive rocks, with a younger intrusion of Cretaceous granodiorite beneath. The structure is characterized by east-tilted fault blocks and NNE-trending folds, and the strata are cut by numerous en echelon, overlapping NNE-striking faults, most of which dip WNW. The bedding typically dips from 20 to 45° toward the ESE, and strikes NNE parallel to the faults. Production is typically obtained from the base of the Tertiary section and/or the top of the Mesozoic basement rock.
Downhole data from the project wells can be used to define the subsurface temperature distribution in the field. As shown in Figure 6.2, the overall shape of the temperature contours is elongated to the NNE, parallel to the main faults in the region. In cross section (Figure 6.3), the high-temperature core of the field is located beneath the current area of hydrothermal production. As mentioned above, additional exploration is underway to define additional productive areas for a possible capacity expansion.
It is possible to calculate the heat in place in the reservoir using the subsurface temperature distribution within the field using the methodology described in Appendix D.
The following values have been used for the parameters required to estimate the recoverable energy reserves of the Desert Peak field:
| | | | | | | | | | | | | | |
| Input Parameter | | Minimum value | | Most-Likely Value | | Maximum Value |
| Variable Parameters | | | | | | | | | | | | |
| Reservoir Area (mi2) | | 1.7 | | 4.0 | | 8 |
| Reservoir Thickness (ft) | | 1,500 | | 3,000 | | 4,500 |
| Rock Porosity (%) | | 3 | | - - | | 7 |
| Reservoir Temp. (°F) | | 370 | | 385 | | 400 |
| Recovery Factor (%) | | 5 | | - - | | 20 |
| Fixed Parameters | | | | | | |
| Rock Heat Capacity | | | | 39.0 BTU/ft3°F | | |
| Rejection Temperature | | | | 59°F | | |
| Utilization Factor | | | | 45% | | |
| Capacity Factor | | | | 90% | | |
| Power Plant Life | | | | 30 years | | |
|
The results, which are shown in Figures 6.4 and 6.5, indicate that there is a 90% probability that the recoverable geothermal energy reserves of the Desert Peak field exceed 33 MW (gross). The most-likely value is 45 MW (gross), and the mean value is 78 MW (gross), with a standard deviation of 40 MW. This estimate is likely to increase if significant step-outs are drilled during the course of the ongoing exploration drilling program.
6-2
5221 CENTRAL AVENUE, SUITE 201
RICHMOND, CALIFORNIA 94804-5829
GeothermEx, Inc.
______________________________________________________________________________
TELEPHONE: (510) 527-9876
FAX: (510) 527-8164
E-MAIL: mw@geothermex.com
6.3 Resource Utilization Plan
Production and injection data were available in digital format for the period from mid-1998 to early December 2003. These data, which represent a time period adequate for the evaluation of recent trends, were evaluated for this work. Production data are presented in Figure 6.6, while injection data are presented in Figure 6.7.
During most of the project history, two wells (67-21 and 86-21) have been used for production, and one (21-2) for injection. The production wells are not metered separately; therefore, the total flow rate from both wells is shown in the lower plot on Figure 6.6. Also shown are the gross generation and enthalpy (upper plot) and pressure data (middle plot), including the wellhead pressures of the two production wells and the inlet pressure of the high-pressure separator. Discussions with Ormat regarding the sharp increase in the flow rate data in September 2002 indicate that: 1) this is due to re-calibration of flow metering equipment; and 2) the pre-calibration data are correct, while the post-calibration data are incorrect in terms of numerical value. However, general trends in the post-calibration data should still be valid.
Similarly, pressure gauges were re-calibrated or replaced in September 2002, resulting in a discontinuity in the pressure data shown in the middle plot of Figure 6.6 (wellhead pressures increased at this time, while the HP separator pressure decreased slightly). Plant personnel believe that the more recent pressure data are correct; again, the trends in the data are considered to be valid. HP separator pressure is currently at about 61 psig; Ormat reports that this is near the minimum pressure required to operate the gas ejectors in the power plant, and that the power plant governor valve is throttled to maintain this minimum pressure. Throttling of the governor valve is likely to impose a back-pressure on all upstream system elements, including the HP separator and the two production wells themselves.
Although the two wells are not metered separately, Ormat believes that well 86-21 currently supplies a total flow rate of approximately 500,000 pounds per hour, while well 67-21 currently supplies about 330,000 pounds per hour.
The generation during the period shown declined gradually from an initial value of 8 MW (gross) to 6 MW (gross) near the end of 2003. Thereafter, an increase in generation occurred, followed by another period of gradual decline to the end of the period, when generation stood at just greater than 6 MW (gross). The available data do not allow a determination of the root cause of this decline in generation. Although there have been declines in flowing wellhead pressure and a very gradual decline in total flow enthalpy, there may also be operational reasons for the decline in generation.
In October 2003, Ormat worked over well 21-1 to eliminate a cool downflow that was believed to be affecting the temperature of the nearby production well 67-21. This well has recently been connected to supply the power plant. The present output of the plant is consistent with the transfer of power to the Brady project assumed in the project pro-forma. (52,000 MW-hours per year).
6-3
5221 CENTRAL AVENUE, SUITE 201
RICHMOND, CALIFORNIA 94804-5829
GeothermEx, Inc.
______________________________________________________________________________
TELEPHONE: (510) 527-9876
FAX: (510) 527-8164
E-MAIL: mw@geothermex.com
FIGURES
| |
| Figure 2.1: | Map of Mammoth Pacific lease area, including plant and exploration well locations and major geologic features |
Figure 2.2:
Well location map, Mammoth-Pacific project
| |
| Figure 2.3: | Subsurface location of the 340 °F isothermal surface between +5,000 and +7,000 feet msl, Mammoth Pacific leasehold |
| |
| Figure 2.4: | Subsurface location of the 300 °F temperature contour at +5,000 feet msl, Mammoth Pacific leasehold |
| |
| Figure 2.5: | Combined geologic and temperature cross section, Mammoth Pacific leasehold |
Figure 2.6: Histogram of Recoverable Geothermal Energy Reserves, Mammoth field, California
Figure 2.7: Cumulative Probability of Recoverable Energy Reserves, Mammoth field, California
Figure 2.8: Electrical Generation of Mammoth-Pacific Geothermal Project
Figure 2.9: Total Production Rate and Temperature History, Mammoth Project
Figure 2.10: G2/G1 Generation, Flow, Temperature
Figure 2.11: G3 Generation, Flow, Temperature
Figure 2.12: History of Total Production Rate at Mammoth and Pressure in Observation Well SF 65-32
Figure 3.1: Well location map, East Mesa geothermal field
Figure 3.2: Location of geothermal fields in the Salton Trough geologic province
Figure 3.3: Histogram of Recoverable Geothermal Energy Reserves, East Mesa geothermal filed, California
Figure 3.4: Cumulative Probability of Recoverable Energy Reserves, East Mesa geothermal filed, California
Figure 4.1: Well and lease location map, Steamboat geothermal field, Nevada
Figure 4.2: Geologic map, Steamboat Hills geothermal area (modified after White, ct.al., 1964)
Figure 4.3: Approximate initial temperature distribution at +4,000 feet (msl), Steamboat geothermal field, Nevada
Figure 4.4: Approximate extent of 320 °F isotherm at +3,500 feet (msl), Steamboat geothermal field, Nevada
Figure 4.5: Histogram of Recoverable Geothermal Energy Reserves, Steamboat geothermal field, Nevada
Figure 4.6: Cumulative Probability of Recoverable Energy Reserves, Steamboat geothermal field, Nevada
Figure 4.7: Total flow and temperature history at SB-II plant inlet
Figure 4.8: Total flow and temperature history at SB-III plant inlet
Figure 5.1: Location of the Brady Hot Springs project
Figure 5.2: Well location map, Brady Hot Springs project
| |
| Figure 5.3: | Location of surface temperature anomaly and elevation contours on the Brady Fault |
Figure 5.4: Temperature distribution at +3,000 feet (msl), Brady Hot Springs
Figure 5.5: Temperature distribution at +2,000 feet (msl), Brady Hot Springs
Figure 5.6: Temperature distribution at +1,000 feet (msl), Brady Hot Springs
| |
| Figure 5.7: | Temperature distribution at sea level, Brady Hot Springs |
Figure 5.8: Geologic and temperature cross section A-A', Brady Hot Springs
Figure 5.9: Geologic and temperature cross section B-B', Brady Hot Springs
Figure 5.10: Histogram of Recoverable Geothermal Energy Reserves, Brandy Hot Springs, Nevada
Figure 5.11: Cumulative Probability of Recoverable Energy Reserves, Brandy Hot Springs, Nevada
Figure 5.12: Production Summary - Brandy Power Plants
Figure 5.13: Brady Power Plants-Inlet Temperature History
Figure 5.14: Brady Project-fluid delivered to GFP plant
Figure 6.1: Well location map, Desert Peak geothermal field
Figure 6.2: Elevation of the 360 °F isotherm, Desert Peak geothermal field
Figure 6.3: Geologic and temperature cross section, Desert Peak geothermal field
Figure 6.4: Histogram of Recoverable Geothermal Energy Reserves, Desert Peak geothermal field, Nevada
Figure 6.5: Cumulative Probability of Recoverable Energy Reserves, Desert Peak geothermal filed, Navada
Figure 6.6: Production Summary - Desert Peak Power Plant
Figure 6.7: Injection Summary - Desert Peak Well 21-2
APPENDICES A THROUGH C
OF
THE GEOTHERMAL
CONSULTANT'S REPORT
APPENDICES A THROUGH C OF THE GEOTHERMAL CONSULTANT'S REPORT HAVE BEEN OMITTED FROM THIS OFFERING MEMORANDUM. YOU CAN OBTAIN COPIES OF THESE APPENDICES FROM US UPON REQUEST.
[THIS PAGE INTENTIONALLY LEFT BLANK.]
5221 CENTRAL AVENUE, SUITE 201
RICHMOND, CALIFORNIA 94804-5829
GeothermEx, Inc.
______________________________________________________________________________
TELEPHONE: (510) 527-9876
FAX: (510) 527-8164
E-MAIL: mw@geothermex.com
APPENDIX D: RESERVE ESTIMATION METHODOLOGY
In our method, the maximum sustainable generation (power plant) capacity (E) is given by:
| |
| E = | V Cv(T-T0)•R/F/L (D.1) |
| |
| Where V = | volume of the reservoir, |
| |
| Cv = | volumetric specific heat of the reservoir, |
| |
| T = | average temperature of the reservoir, |
| |
| T0 = | rejection temperature (equivalent to the average annual ambient
temperature), |
| |
| R = | overall recovery efficiency (the fraction of thermal energy in-place
in the reservoir that is converted to electrical energy at the power
plant), |
| |
| F = | power plant capacity factor (the fraction of time the plant produces
power on an annual basis), and |
| |
| L = | power plant life. |
The parameter R can be determined as follows:
|
| | | | | | | | | | |
| R = | | W • r • e | | (D.2) |
| Cf • (T − T0) | |
|
| |
| where r = | recovery factor (the fraction of thermal energy in-place that is
recoverable as thermal energy at the surface), |
| |
| Cf = | specific heat of reservoir fluid, |
| |
| W = | maximum available thermodynamic work from the produced fluid, and |
| |
| e = | utilization factor to account for mechanical and other losses that
occur in a real power cycle. |
The parameter Cv in (A.1) is given by:
D-1
5221 CENTRAL AVENUE, SUITE 201
RICHMOND, CALIFORNIA 94804-5829
GeothermEx, Inc.
______________________________________________________________________________
TELEPHONE: (510) 527-9876
FAX: (510) 527-8164
E-MAIL: mw@geothermex.com
| Cv= Pr Cr (1-(Theta)) + Pf Cf (Theta) | (D.3) |
where Pr = density or rock matrix,
Cr = specific heat of rock matrix,
Pf = density of reservoir fluid, and
(Theta) = reservoir porosity.
The parameter W in (A.2) is derived from the First and Second Laws of Thermodynamics as follows:
and
where q represents thermal energy and T represents absolute temperature.
The parameters required for reserve estimation are considered to have significant uncertainty. Therefore, it is prudent to estimate reserves in a probabilistic way using the Monte Carlo sampling technique, with the estimates of uncertain parameters based on a reservoir model developed from surface and subsurface geologic data and from temperature distributions measured in the exploration and development wells.
D-2