UNITED STATES
SECURITIES AND EXCHANGE COMMISSION
Washington, D.C. 20549
FORM N-CSR
CERTIFIED SHAREHOLDER REPORT OF REGISTERED
MANAGEMENT INVESTMENT COMPANIES
Investment Company Act file number 811-21700
Tortoise North American Energy Corporation
(Exact name of registrant as specified in charter)
11550 Ash Street, Suite 300, Leawood, KS 66211
(Address of principal executive offices) (Zip code)
David J. Schulte
11550 Ash Street, Suite 300, Leawood, KS 66211
(Name and address of agent for service)
913-981-1020
Registrant's telephone number, including area code
Date of fiscal year end: November 30
Date of reporting period: May 31, 2009
Item 1. Report to Stockholders.
Company at a Glance
Tortoise North American Energy Corp. is a non-diversified closed-end investment company focused primarily on investing in publicly-traded Master Limited Partnerships. During October and November of 2008, weak MLP performance required TYN to sell some investments and pay off leverage in order to comply with the coverage ratios as mandated by the Investment Company Act of 1940 and by loan documents. The weak relative performance of MLPs compared to Canadian Royalty and Income Trusts presented an opportunity for TYN to sell Canadian holdings and use the proceeds to reduce leverage. On Dec. 01, 2008, TYN’s investment strategy was expanded to require the company, under normal conditions, to invest at least 80 percent of its total assets (including assets obtained through leverage) in equity securities of companies in the energy sector, including oil and gas exploitation, energy infrastructure and energy shipping companies.
Investment Goals: Yield, Growth and Quality
We seek a high level of total return with an emphasis on dividend income paid to stockholders.
In seeking to achieve yield, we target distributions to our stockholders that are roughly equal to the underlying yield on a direct investment in MLPs. In order to accomplish this, we maintain our strategy of investing primarily in energy infrastructure companies with attractive current yields and growth potential.
We seek to achieve distribution growth as revenues of our underlying companies grow with the economy, with the population and through rate increases. This revenue growth generally leads to increased operating profits, and when combined with internal expansion projects and acquisitions, is expected to provide attractive growth in distributions to us.
We seek to achieve quality by investing in companies operating energy infrastructure assets that are critical to the North American economy. Often these assets would be difficult to replicate. We also back experienced management teams with successful track records. By investing in Tortoise North America, our stockholders have access to a portfolio that is diversified through geographic regions and across product lines, including natural gas, natural gas liquids, crude oil and refined products.
About U.S. Energy Infrastructure Master Limited Partnerships (MLPs)
MLPs are limited partnerships whose units trade on public exchanges such as the New York Stock Exchange (NYSE), the NYSE Alternext US and the NASDAQ. Buying MLP units makes an investor a limited partner in the MLP. There are currently more than 70 MLPs in the market, mostly in industries related to energy and natural resources. Tortoise North America invests primarily in MLPs in the energy infrastructure sector. Energy infrastructure MLPs are engaged in the transportation, storage and processing of crude oil, natural gas and refined products from production points to the end users.
Tortoise North America Investment Features
Tortoise North America provides stockholders an alternative to investing directly in MLPs and their affiliates. Tortoise North America offers investors the opportunity to receive an attractive distribution return with a historically low return correlation to returns on stocks and bonds.
Additional features of Tortoise North America include:
- One Form 1099 per stockholder at the end of the year, multiple K-1s and multiple state filings for individual partnership investments;
- A professional management team, with nearly 100 years combined investment experience;
- The ability to access investment grade credit markets to enhance stockholder return; and
- Access to direct placements and other investments not available through the public market.
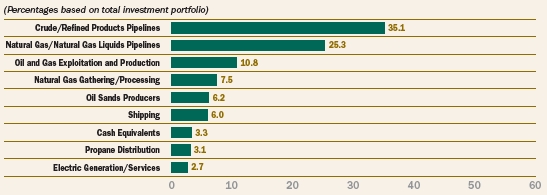
Allocation of Portfolio Assets
May 31, 2009 (Unaudited)
June 30, 2009
DEAR STOCKHOLDERS,
Tortoise North American Energy Corp.’s shift into MLPs during 2008 continued to reward stockholders in the second quarter of 2009 as MLPs performed well during the quarter. TYN’s exposure to commodity-sensitive MLPs provided a boost as crude oil rebounded. Over the past 10 years MLPs have achieved annual total returns of 14.2 percent.(1) However, during the 2008 stock market volatility, MLPs experienced exceptionally weak stock market returns, despite positive cash flows. While the MLP market has rebounded in 2009, we believe MLPs remain undervalued compared to long-term spreads and cash flow multiples and MLPs remain an ideal investment for investors looking for high current income plus modest growth.
During the second quarter, we pursued our plan to merge TYN with an affiliated private fund, Tortoise Gas and Oil Corp. (TGO), as announced on Apr. 1, 2009. The funds share similar investment objectives which seek to provide stockholders a high level of total return with an emphasis on current income. We expect to mail definitive materials to TYN and TGO stockholders that will contain information about the proposed transaction once the joint proxy statement/ prospectus on Form N-14 has been declared effective by the SEC.
Master Limited Partnership Investment Overview and Outlook
For the quarter ended May 31, 2009, the MLP market, represented by the Wachovia MLP Index, reflected a total return of 21.2 percent compared to 6.1 percent for the prior quarter ended Feb. 28, 2009. The improved performance was driven primarily by resilient MLP business fundamentals, improved capital market access and a rebound from the 2008 sell-off.
Our portfolio is predominately invested in crude oil, refined product, and natural gas pipelines which represent approximately 60 percent of the portfolio as of May 31, 2009. An additional 18 percent of the portfolio is invested in gathering and processing (G&P) and exploitation and production (E&P) MLPs whose contract structures expose them to commodity prices. These MLPs attempt to limit volatility of their revenues by entering into multi-year hedging strategies and by maintaining higher distribution coverage ratios. The spot price of crude oil has rebounded from a low of $33 in February to around $60 today. The futures markets expect the crude oil price to be between $60 and $65 for the remainder of the year. On the other hand, natural gas prices remain around $3.50 per mmcf down from approximately $6 since the start of 2009. Drilling for natural gas has declined substantially in certain regions of the United States; however, drilling remains active in the areas where our MLPs operate. A prolonged decline in the price of natural gas could reduce the volume and revenue of MLPs within our portfolio. E&P and G&P MLPs could benefit from access to the capital markets and declining costs of capital by expanding their asset footprints either through acquisition or internal growth projects.
In summary, we believe that MLPs operate essential assets that produce attractive yields to investors. With visible growth drivers, we expect MLPs to grow distributions by 4 to 6 percent over the long-term though growth will likely fall below these levels until the capital markets fully recover. Despite the potential for continued risk in the economy, we expect MLPs to be defensive investments offering steady distributions and attractive total return potential compared to other yield-oriented investments.
Performance Review
Our total return based on market value, including the reinvestment of distributions, was 35.8 percent for the quarter ended May 31, 2009, and 73.8 percent for the six months ended May 31, 2009.
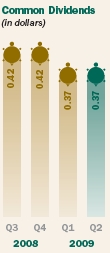
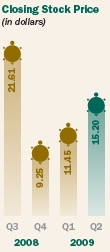
We paid a distribution of $0.37 per common share ($1.48 annualized) to our stockholders on June 1, 2009, unchanged from the prior quarter. This represented an annualized yield of 9.7 percent based on the closing price of $15.20 on May 31, 2009. Based upon our current expectations, we believe our portfolio companies will continue to pay us distributions which will allow quarterly distributions to our stockholders of not less than $0.36 during fiscal year 2009.
On June 19, 2009, we entered into an amendment to our bank credit facility agreement that extends the facility through June 20, 2010. Terms of the amendment provide for an unsecured facility of $10 million. We currently have no outstanding balance on our credit facility.
Additional information about our financial performance and use of leverage is available in the Management’s Discussion of this report.
Organizational Updates
On June 3, 2009, Tortoise Capital Advisors, L.L.C. (Tortoise) the adviser of Tortoise North American Energy Corp., announced that senior management of Tortoise entered into an agreement with Mariner Holdings, LLC (Mariner) to purchase all of the ownership interests in Tortoise owned by Kansas City Equity Partners (KCEP) and affiliates of KCEP and Fountain Capital Management. As part of the transaction, Mariner will purchase a majority stake in Tortoise, with the intention to provide growth capital and resources. With the provision of such growth capital and resources, Mariner will provide Tortoise with a complementary strategic partner in the asset management business.
The transaction is expected to close in the third calendar quarter of 2009 and is subject to the receipt of certain approvals, including the approval by TYN stockholders of a new investment advisory agreement with Tortoise and the fulfillment of certain other conditions. A special meeting to vote on the matter has been scheduled for Sept. 11, 2009. Our board has recommended that our stockholders approve the agreement and we encourage you to vote on this proposed agreement.
Conclusion
We maintain that our long-term thesis of yield, growth and quality remains fully intact. As of June 30, 2009, the Wachovia MLP Index yielded 9.3 percent. Combining that yield with a long-term growth rate of 4 to 6 percent implies long-term returns in the 10 to 15 percent range, and this comes from assets that are essential to providing basic energy products that the U.S. economy requires to successfully function.
We pride ourselves on having transparent and user-friendly investor information through our financial reports, our Web site and our Investor Relations services. As always, we welcome investor questions and comments, and we thank you for your support of TYN.
Sincerely,
The Managing Directors
Tortoise Capital Advisors, L.L.C.
The adviser to Tortoise North American Energy Corp.
|
|
|
| H. Kevin Birzer | Zachary A. Hamel | Kenneth P. Malvey |
|
| |
| Terry Matlack | David J. Schulte |


(1) The Wachovia MLP Index.
2009 2nd Quarter Report 1
Key Financial Data (Supplemental Unaudited Information) (dollar amounts in thousands unless otherwise indicated) |
The information presented below regarding Distributable Cash Flow and Selected Operating Ratios is supplemental non-GAAP financial information, which we believe is meaningful to understanding our operating performance. The Selected Operating Ratios are the functional equivalent of EBITDA for non-investment companies, and we believe they are an important supplemental measure of performance and promote comparisons from period-to-period. Supplemental non-GAAP measures should be read in conjunction with our full financial statements.
| 2008 | 2009 | ||||||||||||||
| Q2(1) | Q3(1) | Q4(1) | Q1(1) | Q2(1) | |||||||||||
| Total Distributions Received from Investments | |||||||||||||||
| Distributions received from master limited partnerships | $ | 941 | $ | 1,009 | $ | 1,004 | $ | 1,276 | $ | 1,315 | |||||
| Dividends paid in stock | 661 | 695 | 658 | 434 | 425 | ||||||||||
| Dividends from common stock | 235 | 397 | 322 | 171 | 172 | ||||||||||
| Distributions received from Canadian trusts | 1,584 | 1,350 | 1,049 | 107 | — | ||||||||||
| Interest and dividend income | 423 | 398 | 475 | 385 | 369 | ||||||||||
| Foreign tax withheld | (182 | ) | (89 | ) | (140 | ) | (2 | ) | — | ||||||
| Total from investments | 3,662 | 3,760 | 3,368 | 2,371 | 2,281 | ||||||||||
| Operating Expenses Before Leverage Costs and Current Taxes | |||||||||||||||
| Advisory fees, net of expense reimbursement | 401 | 392 | 265 | 151 | 168 | ||||||||||
| Other operating expenses | 131 | 130 | 154 | 152 | 152 | ||||||||||
| 532 | 522 | 419 | 303 | 320 | |||||||||||
| Distributable cash flow before leverage costs and current taxes | 3,130 | 3,238 | 2,949 | 2,068 | 1,961 | ||||||||||
| Leverage costs(2) | 1,181 | 1,119 | 751 | 230 | 221 | ||||||||||
| Current foreign tax expense | 10 | 10 | 10 | 8 | (2 | ) | |||||||||
| Distributable Cash Flow(3) | $ | 1,939 | $ | 2,109 | $ | 2,188 | $ | 1,830 | $ | 1,742 | |||||
| Distributions paid on common stock | $ | 1,753 | $ | 1,937 | $ | 1,937 | $ | 1,707 | $ | 1,707 | |||||
| Distributions paid on common stock per share | 0.3800 | 0.4200 | 0.4200 | 0.3700 | 0.3700 | ||||||||||
| Payout percentage for period(2) | 90.4 | % | 91.8 | % | 88.5 | % | 93.3 | % | 98.0 | % | |||||
| Net realized gain (loss) on investments | 10,580 | (1,391 | ) | (24,936 | ) | (2,265 | ) | (2,200 | ) | ||||||
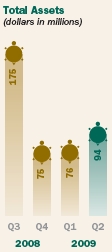
| Total assets, end of period | 204,091 | 175,462 | 75,330 | 76,020 | 94,290 | ||||||||||
| Average total assets during period(5) | 194,948 | 198,422 | 130,502 | 75,569 | 83,049 | ||||||||||
| Leverage (long-term debt obligations, preferred stock and short-term borrowings)(6) | 58,950 | 55,000 | 25,000 | 15,000 | 15,000 | ||||||||||
| Leverage as a percent of total assets | 28.9 | % | 31.3 | % | 33.2 | % | 19.7 | % | 15.9 | % | |||||
| Net unrealized appreciation (depreciation) net of income taxes, end of period | 22,122 | 5,551 | (33,436 | ) | (23,262 | ) | (946 | ) | |||||||
| Net assets, end of period | 138,973 | 116,783 | 49,715 | 58,675 | 77,008 | ||||||||||
| Average net assets during period(7) | 126,644 | 123,923 | 74,690 | 58,474 | 65,468 | ||||||||||
| Net asset value per common share | 30.13 | 25.32 | 10.78 | 12.72 | 16.70 | ||||||||||
| Market value per common share | 25.37 | 21.61 | 9.25 | 11.45 | 15.20 | ||||||||||
| Shares outstanding | 4,612,640 | 4,612,640 | 4,612,640 | 4,612,640 | 4,612,640 | ||||||||||
| Selected Operating Ratios(8) | |||||||||||||||
| As a Percent of Average Total Assets | |||||||||||||||
| Total distributions received from investments (net of foreign taxes withheld) | 7.56 | % | 7.54 | % | 10.38 | % | 12.72 | % | 10.90 | % | |||||
| Operating expenses before leverage costs and current taxes | 1.10 | % | 1.05 | % | 1.29 | % | 1.63 | % | 1.53 | % | |||||
| Distributable cash flow before leverage costs and current taxes | 6.46 | % | 6.49 | % | 9.09 | % | 11.09 | % | 9.37 | % | |||||
| As a Percent of Average Net Assets | |||||||||||||||
| Distributable cash flow(3) | 6.16 | % | 6.77 | % | 11.78 | % | 12.69 | % | 10.56 | % | |||||
| (1) | Q1 is the period from December through February. Q2 is the period from March through May. Q3 is the period from June through August. Q4 is the period from September through November. | |
| (2) | Leverage costs include interest expense, agent fees, interest rate swap expenses and distributions to preferred stockholders. | |
| (3) | “Net investment income (loss), before income taxes” on the Statement of Operations is adjusted as follows to reconcile to Distributable Cash Flow (DCF): increased by the return of capital on MLP distributions, the value of paid-in-kind distributions, amortization of market premiums, premium on redemption of long-term debt obligations and amortization of debt issuance costs; decreased by distributions to preferred stockholders, current foreign taxes paid, and realized and unrealized gains (losses) on interest rate swap settlements; and adjusted to reflect distributions received from Canadian trusts on a cash basis. | |
| (4) | Distributions paid as a percentage of Distributable Cash Flow. | |
| (5) | Computed by averaging month-end values within each period. | |
| (6) | There were no outstanding borrowings on the short-term credit facility as of May 31, 2009. | |
| (7) | Computed by averaging daily values within each period. | |
| (8) | Annualized for periods less than one full year. Operating ratios contained in our Financial Highlights are based on net assets and include current foreign tax expense and leverage costs. |
2 Tortoise North American Energy Corp.
Management’s Discussion (Unaudited) |
Management’s Discussion
The information contained in this section should be read in conjunction with our Financial Statements and the Notes thereto. In addition, this report contains certain forward-looking statements. These statements include the plans and objectives of management for future operations and financial objectives and can be identified by the use of forward-looking terminology such as “may,” “will,” “expect,” “intend,” “anticipate,” “estimate,” or “continue” or the negative thereof or other variations thereon or comparable terminology. These forward-looking statements are subject to the inherent uncertainties in predicting future results and conditions. Certain factors that could cause actual results and conditions to differ materially from those projected in these forward-looking statements are set forth in the “Risk Factors” section of our public filings with the SEC.
Overview
Tortoise North American Energy Corp’s (“TYN”) investment objective is to provide a high level of total return, with an emphasis on distribution income paid to stockholders. Our investment strategy requires us to invest at least 80 percent of our total assets in equity securities of companies in the energy sector, including oil and gas exploitation, energy infrastructure and energy shipping companies. The equity securities of the energy companies purchased by TYN consist primarily of interests in MLPs. MLPs are publicly traded partnerships whose equity interests are traded in the form of units on public exchanges, such as the NYSE or NASDAQ. We invest primarily in MLPs through public market and private purchases. While we are a registered investment company under the Investment Company Act of 1940, as amended (the “1940 Act”), we no longer expect to be treated as a “regulated investment company” for federal tax purposes. Our distributions do not typically generate unrelated business taxable income (UBTI) and our stock may therefore be suitable for holding by pension funds, IRAs and mutual funds, as well as taxable accounts. Tortoise Capital Advisors, L.L.C. serves as our investment adviser.
Proposed Reorganization
At a meeting held on April 1, 2009, our Board of Directors and the Board of Directors of Tortoise Gas and Oil Corp. (“TGO”) each approved a reorganization in which TGO will be reorganized into TYN. As part of the reorganization, TGO common stockholders will be issued TYN common stock and TYN will acquire substantially all of the assets and liabilities of TGO. It is currently expected that the reorganization will take place during the Company’s third quarter of 2009, subject to obtaining TYN and TGO stockholder votes and compliance with all regulatory requirements and satisfaction of customary closing conditions.
Company Update
Market values of our MLP investments increased during 2nd quarter 2009 from their levels at February 28, 2009, having a positive impact on our capital structure and increasing the existing cushion on our leverage coverage ratios. We have entered into an amendment to our bank credit facility that extends through June 20, 2010. Additional information on our leverage is disclosed below and in our Notes to Financial Statements.
While we expect the current year to be challenging for almost every industry, including the energy infrastructure sector, we continue to believe the flow of energy commodities remains critical to our economy and that the long-term prospect for MLPs is attractive.
Critical Accounting Policies
The financial statements are based on the selection and application of critical accounting policies, which require management to make significant estimates and assumptions. Critical accounting policies are those that are both important to the presentation of our financial condition and results of operations and require management’s most difficult, complex, or subjective judgments. Our critical accounting policies are those applicable to the valuation of investments, tax matters and certain revenue recognition matters as discussed in Note 2 in the Notes to Financial Statements.
Determining Distributions to Stockholders
Our portfolio generates cash flow from which we pay distributions to stockholders. Our Board of Directors considers our distributable cash flow (“DCF”) in determining distributions to stockholders. Our Board of Directors reviews the distribution rate quarterly, and may adjust the quarterly distribution throughout the year. Our goal is to declare what we believe to be sustainable increases in our regular quarterly distributions. We have targeted to pay at least 95 percent of DCF on an annualized basis.
Determining DCF
DCF is simply distributions received from investments less expenses. The total distributions received from our investments include the amount received by us as cash distributions from MLPs, paid-in-kind distributions, and dividend and interest payments. The total expenses include current or anticipated operating expenses, leverage costs and current income taxes. Each are summarized for you in the table on page 2 and are discussed in more detail below.
The Key Financial Data table discloses the calculation of DCF and should be read in conjunction with this discussion. The difference between distributions received from investments in the DCF calculation and total investment income as reported in the Statement of Operations, is reconciled as follows: GAAP recognizes that a significant portion of the cash distributions received from MLPs are treated as a return of capital and therefore excluded from investment income, whereas the DCF calculation includes the return of capital; and distributions received from investments in the DCF calculation include the value of dividends paid-in-kind (additional stock or MLP units), whereas such amounts are not included as income for GAAP purposes. The treatment of expenses in the DCF calculation also differs from what is reported in the Statement of Operations. In addition to the total operating expenses as disclosed in the Statement of Operations, the DCF calculation reflects interest expense, recurring agent fees, distributions to preferred stockholders and realized and unrealized gains (losses) on interest rate swap settlements (if any) as leverage costs, as well as current taxes paid.
Distributions Received from Investments
Our ability to generate cash is dependent on the ability of our portfolio of investments to generate cash flow from their operations. In order to maintain and grow distributions to our stockholders, we evaluate each holding based upon its contribution to our investment income, our anticipation of its growth rate, and its risk relative to other potential investments.
We concentrate on investments we believe can expect an increasing demand for services from economic and population growth. We seek well-managed businesses with hard assets and stable recurring revenue streams. However, during the last year the economy has been retrenching, which may lead some MLPs to slow distribution growth or possibly reduce distributions.
Total distributions received from our investments relating to DCF for the 2nd quarter 2009 was approximately $2.3 million, representing a 38 percent decrease as compared to 2nd quarter 2008 and a 4 percent decrease as compared to 1st quarter 2009. These changes primarily reflect the result of net portfolio sales during fiscal year 2008 to fund leverage redemptions.
As disclosed in Note 13 of our Notes to Financial Statements, we have in the past used forward foreign currency contracts to protect the value of income received from investments denominated in foreign currency against changes in foreign exchange rates. We no longer hold any Canadian dollar denominated investments and have terminated our remaining forward foreign currency contracts.
Expenses
We incur two types of expenses: (1) operating expenses, consisting primarily of the advisory fee; and (2) leverage costs. On a percentage basis, operating expenses before leverage costs and current taxes were an annualized 1.53 percent of average total assets for the 2nd quarter 2009 as compared to 1.10 percent for the 2nd quarter 2008 and 1.63 percent for the 1st quarter 2009. The decrease in our operating expense ratio was the result of unchanged other operating expenses, which are primarily fixed costs, as a percent of increased average total assets. Advisory fees for the 2nd quarter 2009 increased 11 percent from 1st quarter 2009 as a result of increased average managed assets from increasing MLP asset values.
While the contractual advisory fee of 1.00 percent of average monthly managed assets remains unchanged, the Adviser waived an amount equal to 0.15 percent of average monthly managed assets effective January 1, 2008 through December 31, 2008. Effective January 1, 2009 through December 31, 2009, the Adviser has agreed to waive an amount equal to 0.10 percent of average monthly managed assets.
Leverage costs consist of four major components: (1) the direct interest expense on our Tortoise Notes and short-term credit facility; (2) the agent fees, which are the marketing and rating agency costs for the leverage; (3) the realized and unrealized gain or loss on our interest rate swap settlements (if any); and (4) distributions to preferred stockholders (if any).
| 2009 2nd Quarter Report | 3 |
Management’s Discussion (Unaudited) (Continued) |
Total leverage costs were approximately $221,000 in 2nd quarter 2009 as compared to $1.2 million for the 2nd quarter 2008 and $230,000 for the 1st quarter 2009, as detailed below.
| 2Q 08 | 1Q 09 | 2Q 09 | |||||||
| Interest expense | $ | 620,223 | $ | 215,699 | $ | 216,567 | |||
| Agent fees | 20,583 | 7,751 | 4,864 | ||||||
| Net realized and unrealized loss | |||||||||
| on interest rate swap settlements | 327,556 | — | — | ||||||
| Distributions to preferred stockholders | 213,024 | 6,761 | — | ||||||
| Total leverage costs | $ | 1,181,386 | $ | 230,211 | $ | 221,431 | |||
| Average outstanding leverage (in millions) | $ | 58.1 | $ | 15.0 | $ | 15.0 | |||
The decrease in total leverage costs from 2nd quarter 2008 to 2nd quarter 2009 reflects the reduction in average outstanding leverage of approximately $43 million during the period. The average annualized total cost of leverage (total leverage costs divided by average outstanding leverage) was 5.86 percent for the 2nd quarter 2009 as compared to 6.22 percent for the 1st quarter 2009, and 8.08 percent for 2nd quarter 2008. The decrease of 36 basis points from 1st quarter 2009 to 2nd quarter 2009 reflects the redemption of our auction rate Money Market Preferred Stock during the 1st quarter and reduced agent fees.
Distributable Cash Flow
For 2nd quarter 2009, our DCF was approximately $1.7 million, a decrease of 10 percent as compared to 2nd quarter 2008 and 5 percent as compared to 1st quarter 2009. These decreases are the net result of lower total distributions received from investments and changes in expenses, as outlined above. We paid a distribution of $1.7 million, or 98.0 percent of DCF during the quarter. On a per share basis, we declared a $0.37 distribution on May 12, 2009. This is a decrease of 2.6 percent as compared to 2nd quarter 2008 and unchanged from 1st quarter 2009.
Factoring in portfolio sales completed in fiscal year 2008 to fund leverage reductions and assuming moderate to no increases in projected distribution income from MLPs, change in fee waiver and our cost of leverage, we currently expect to pay quarterly distributions to our stockholders of not less than $0.36 during fiscal year 2009. This represents a current estimate and is subject to change based upon actual results and Board approval.
Liquidity and Capital Resources
We had total assets of $94 million at quarter-end. Our total assets reflect the value of our investments, which are itemized in the Schedule of Investments. It also reflects cash, interest and receivables, net deferred tax asset and any expenses that may have been prepaid. During 2nd quarter 2009, total assets increased from approximately $76 million to $94 million, an increase of $18 million. This change was primarily the result of unrealized appreciation of investments during the quarter.
Total leverage outstanding at May 31, 2009 is comprised of $15 million in senior notes and represented 15.9 percent of total assets.
Subsequent to quarter-end, we entered into an amendment to our bank credit facility that extends the facility through June 20, 2010. Terms of the amendment provide for an unsecured facility of $10 million. During the extension, outstanding balances generally will accrue interest at a variable rate equal to one-month LIBOR plus 2.00 percent with a fee of 0.25 percent on any unused balance.
We have used leverage to acquire securities consistent with our investment philosophy. The terms of our leverage are governed by regulatory and contractual asset coverage requirements that arise from the use of leverage. Under the 1940 Act, we may not pay distributions to our common stockholders if we do not meet a 300 percent asset coverage ratio for debt and 200 percent asset coverage ratio for debt and preferred shares (if any) after payment of the distribution, and we may not pay distributions on preferred shares (if any) if we fail to meet a 200 percent asset coverage ratio on our debt. Under the agreement with our bank lenders, if portfolio values decline such that we no longer meet the asset coverage ratios under the 1940 Act, we must repay a portion of our bank line until we meet the coverage requirement. Further, under the terms of our institutional senior notes, if we fail to meet basic maintenance ratios as of any valuation date (generally Fridays) or fail to satisfy the 1940 Act asset coverage as of the last business day of any month, we could be subject to mandatory redemption of the senior notes if such failure is not waived or cured. In some cases we may be delayed in paying common stock distributions until such coverage ratios can be met.
As disclosed in Section 18 of the 1940 Act, the 300 percent asset coverage ratio for debt is equal to total assets less all liabilities and indebtedness not represented by debt divided by debt. The 200 percent asset coverage ratio for preferred shares (if any) is equal to the same numerator as the 300 percent test divided by the sum of debt and preferred shares.
Taxation of our Distributions and Deferred Taxes
We invest in partnerships which generally have larger distributions of cash than the accounting income which they generate. Accordingly, the distributions include a return of capital component for accounting and tax purposes. Distributions declared and paid by us in a year generally differ from taxable income for that year, as such distributions may include the distribution of current year taxable income or return of capital.
The taxability of the distribution you receive depends on whether we have annual earnings and profits. If so, those earnings and profits are first allocated to preferred shares (if any) and then to the common shares.
In the event we have earnings and profits allocated to our common shares, all or a portion of our distribution will be taxable at the 15 percent Qualified Dividend Income (“QDI”) rate, assuming various holding requirements are met by the stockholder. The portion of our distribution that is taxable may vary for either of two reasons: first, the characterization of the distributions we receive from MLPs could change annually based upon the K-1s we receive and become less return of capital and more in the form of income. Second, we could sell an MLP investment and realize a gain or loss at any time. It is for these reasons that we inform you of the tax treatment after the close of each year as the ultimate result is undeterminable until the year is over.
For tax purposes, distributions to stockholders for the fiscal year ended 2008, when we were treated as a regulated investment company, were comprised of approximately 6 percent long-term capital gains and 94 percent return of capital. We currently expect that a portion of our 2009 distributions will consist of return of capital, although the ultimate determination will not be made until January 2010, after determining our earnings and profits.
The unrealized gain or loss we have in the portfolio is reflected in the Statement of Assets and Liabilities. At May 31, 2009, our investments at value are $88 million, with an adjusted cost of $94 million. The $6 million difference reflects unrealized depreciation that would be realized for financial statement purposes if those investments were sold at those values. The Statement of Assets and Liabilities reflects either a deferred tax liability or deferred tax asset depending primarily upon unrealized gains (losses) on investments, realized gains (losses) on investments and net operating losses. At May 31, 2009, the balance sheet reflects a net deferred tax asset of approximately $5.8 million or $1.25 per share.
The net deferred tax asset of approximately $5.8 million reflects the net benefit we have determined will be realized in future periods under generally accepted accounting principles. Realization of a deferred tax asset is dependent on whether there will be sufficient future taxable income within the carryforward periods to realize a portion or all of the deferred tax benefit. The carryforward period for ordinary losses to offset ordinary income is 20 years while capital losses can be carried forward 5 years to offset capital gains. A valuation allowance against the deferred tax asset is needed when, based on the weight of the available evidence, it is more likely than not that some portion or all of the deferred tax asset will not be realized. Our valuation allowance policy is in conformity with generally accepted accounting principles and is based upon our estimation of potential future taxable income. If we do not believe we can use a deferred tax asset in a relatively short period, in our case three years or less, we create a valuation allowance against the existing gross deferred tax asset. At May 31, 2009, we had a gross deferred tax asset of approximately $11 million, against which we provided a valuation allowance of approximately $5.2 million resulting in a net deferred tax asset of approximately $5.8 million. Our Adviser does not charge an advisory fee based upon net deferred tax assets. Details of our deferred taxes are disclosed in Note 5 in our Notes to Financial Statements.
4 | Tortoise North American Energy Corp. |
Schedule of Investments May 31, 2009 |
| (Unaudited) | |||||||
| Shares | Fair Value | ||||||
| Common Stock — 6.3%(1) | |||||||
| Republic of the Marshall Islands — 6.3%(1) | |||||||
| Shipping — 6.3%(1) | |||||||
| Navios Maritime Partners L.P. | 197,000 | $ | 2,011,370 | ||||
| Teekay Offshore Partners L.P. | 205,500 | 2,858,505 | |||||
| Total Common Stock (Cost $7,201,621) | 4,869,875 | ||||||
| Master Limited Partnerships and | |||||||
| Related Companies — 90.0%(1) | |||||||
| United States — 90.0%(1) | |||||||
| Crude/Refined Products Pipelines — 39.5%(1) | |||||||
| Buckeye Partners, L.P. | 13,150 | 565,319 | |||||
| Enbridge Energy Management, L.L.C.(2) | 226,614 | 8,679,305 | |||||
| Holly Energy Partners, L.P. | 3,650 | 109,865 | |||||
| Kinder Morgan Management, LLC(2) | 154,930 | 6,954,814 | |||||
| Magellan Midstream Partners, L.P. | 104,000 | 3,634,800 | |||||
| NuStar Energy L.P. | 60,000 | 3,241,800 | |||||
| Plains All American Pipeline, L.P. | 76,800 | 3,400,704 | |||||
| SemGroup Energy Partners, L.P. | 37,000 | 231,139 | |||||
| TEPPCO Partners, L.P. | 119,900 | 3,576,617 | |||||
| 30,394,363 | |||||||
| Natural Gas/Natural Gas Liquids Pipelines — 28.9%(1) | |||||||
| Boardwalk Pipeline Partners, LP | 76,627 | 1,581,581 | |||||
| El Paso Pipeline Partners, L.P. | 95,300 | 1,829,760 | |||||
| Energy Transfer Equity, L.P. | 134,500 | 3,534,660 | |||||
| Energy Transfer Partners, L.P. | 114,400 | 4,840,264 | |||||
| Enterprise Products Partners L.P. | 187,000 | 4,862,000 | |||||
| ONEOK Partners, L.P. | 30,800 | 1,490,412 | |||||
| TC PipeLines, LP | 118,800 | 4,121,172 | |||||
| 22,259,849 | |||||||
| Natural Gas Gathering/Processing — 8.6%(1) | |||||||
| Copano Energy, L.L.C. | 24,600 | 388,926 | |||||
| Copano Energy, L.L.C.(3)(4) | 95,260 | 1,348,882 | |||||
| DCP Midstream Partners, LP | 8,700 | 167,388 | |||||
| MarkWest Energy Partners, L.P. | 139,151 | 2,503,327 | |||||
| Targa Resources Partners LP | 155,028 | 2,038,618 | |||||
| Williams Partners L.P. | 8,249 | 152,771 | |||||
| 6,599,912 | |||||||
| Oil and Gas Exploitation and Production — 9.0%(1) | |||||||
| Encore Energy Partners LP | 25,100 | 395,576 | |||||
| EV Energy Partners, L.P. | 65,600 | 1,392,688 | |||||
| Linn Energy, LLC | 232,000 | 4,582,000 | |||||
| Pioneer Southwest Energy Partners L.P. | 29,300 | 537,362 | |||||
| 6,907,626 | |||||||
| Propane Distribution — 3.5%(1) | |||||||
| Inergy, L.P. | 107,486 | 2,730,144 | |||||
| Shipping — 0.5%(1) | |||||||
| OSG America L.P. | 62,135 | 431,838 | |||||
| Total Master Limited Partnerships and | |||||||
| Related Companies (Cost $61,313,278) | 69,323,732 | ||||||
| Principal | |||||||
| Amount | |||||||
| Corporate Bonds — 14.0%(1) | |||||||
| Canada — 10.4%(1) | |||||||
| Oil and Gas Exploitation and Production — 3.3%(1) | |||||||
| Connacher Oil & Gas Ltd, | |||||||
| 10.25%, 12/15/2015(4) | $ | 4,000,000 | 2,540,000 | ||||
| Oil Sands Producers — 7.1%(1) | |||||||
| OPTI Canada Inc., 7.875%, 12/15/2014 | 5,500,000 | 3,712,500 | |||||
| OPTI Canada Inc., 8.25%, 12/15/2014(4) | 2,500,000 | 1,725,000 | |||||
| 5,437,500 | |||||||
| United States — 3.6%(1) | |||||||
| Crude/Refined Products Pipelines — 0.5%(1) | |||||||
| SemGroup, L.P., 8.75%, 11/15/2015(3)(4) | 6,300,000 | 409,500 | |||||
| Electric Generation/Services — 3.1%(1) | |||||||
| Texas Competitive Electric Holdings Co LLC, | |||||||
| 10.25%, 11/01/2015 | 4,000,000 | 2,370,000 | |||||
| Total Corporate Bonds (Cost $22,670,797) | 10,757,000 | ||||||
| Shares | |||||||
| Short-Term Investment — 3.7%(1) | |||||||
| United States Investment Company — 3.7%(1) | |||||||
| Evergreen Institutional Class Money Market Fund, | |||||||
| 0.35%(5) (Cost $2,870,691) | 2,870,691 | 2,870,691 | |||||
| Total Investments — 114.0%(1) | |||||||
| (Cost $94,056,387) | 87,821,298 | ||||||
| Other Assets and Liabilities — 5.4%(1) | 4,187,017 | ||||||
| Long-Term Debt Obligations — (19.4%)(1) | (15,000,000 | ) | |||||
| Total Net Assets Applicable to | |||||||
| Common Stockholders — 100.0%(1) | $ | 77,008,315 | |||||
| (1) | Calculated as a percentage of net assets applicable to common stockholders. |
| (2) | Security distributions are paid-in-kind. |
| (3) | Non-income producing. |
| (4) | Restricted securities have been fair valued in accordance with procedures approved by the Board of Directors and have a total fair value of $6,023,382, which represents 7.8% of net assets. See Note 9 to the financial statements for further disclosure. |
| (5) | Rate reported is the current yield as of May 31, 2009. |
See accompanying Notes to Financial Statements.
| 2009 2nd Quarter Report | 5 |
Statement of Assets & Liabilities May 31, 2009 |
| (Unaudited) | ||||
| Assets | ||||
| Investments at fair value (cost $94,056,387) | $ | 87,821,298 | ||
| Receivable for Adviser expense reimbursement | 13,035 | |||
| Receivable for investments sold | 53,896 | |||
| Interest and dividend receivable, net of $151,448 allowance | ||||
| for doubtful accounts | 518,665 | |||
| Deferred tax asset | 5,776,324 | |||
| Prepaid expenses and other assets | 106,945 | |||
| Total assets | 94,290,163 | |||
| Liabilities | ||||
| Payable to Adviser | 130,347 | |||
| Distributions payable to common stockholders | 1,706,677 | |||
| Payable for investments purchased | 64,689 | |||
| Accrued expenses and other liabilities | 380,135 | |||
| Long-term debt obligations | 15,000,000 | |||
| Total liabilities | 17,281,848 | |||
| Net assets applicable to common stockholders | $ | 77,008,315 | ||
| Net Assets Applicable to Common Stockholders Consist of: | ||||
| Capital stock, $0.001 par value; 4,612,640 shares issued | ||||
| and outstanding (100,000,000 shares authorized) | $ | 4,613 | ||
| Additional paid-in capital | 95,591,500 | |||
| Undistributed net investment income, net of income taxes | 443,275 | |||
| Accumulated net realized loss, net of income taxes | (18,628,648 | ) | ||
| Net unrealized depreciation of investments, net of income taxes | (402,425 | ) | ||
| Net assets applicable to common stockholders | $ | 77,008,315 | ||
| Net Asset Value per common share outstanding | ||||
| (net assets applicable to common stock, | ||||
| divided by common shares outstanding) | $ | 16.70 |
| STATEMENT OF OPERATIONS | ||||
| Period from December 1, 2008 through May 31, 2009 | ||||
| (Unaudited) | ||||
| Investment Income | ||||
| Distributions received from master limited partnerships | $ | 2,591,250 | ||
| Less return of capital on distributions | (2,379,204 | ) | ||
| Net distributions from master limited partnerships | 212,046 | |||
| Dividend income from Canadian trusts | 2,970 | |||
| Dividends from common stock | 342,550 | |||
| Dividends from money market mutual funds | 22,565 | |||
| Interest income | 693,319 | |||
| Gain on redemption of preferred stock | 1,300,500 | |||
| Less foreign tax withheld | (5,009 | ) | ||
| Total Investment Income | 2,568,941 | |||
| Operating Expenses | ||||
| Advisory fees | 357,358 | |||
| Professional fees | 213,169 | |||
| Administration fees | 50,900 | |||
| Directors’ fees | 34,704 | |||
| Reports to stockholders | 28,416 | |||
| Registration fees | 22,577 | |||
| Stock transfer agent fees | 5,137 | |||
| Custodian fees and expenses | 3,345 | |||
| Other expenses | 27,423 | |||
| Total Operating Expenses | 743,029 | |||
| Interest expense | 432,266 | |||
| Agent fees | 12,615 | |||
| Amortization of debt issuance costs | 9,664 | |||
| Total Interest, Agent, Debt Issuance and Redemption Fees | 454,545 | |||
| Total Expenses | 1,197,574 | |||
| Less expense reimbursement by Adviser | (38,515 | ) | ||
| Net Expenses | 1,159,059 | |||
| Net Investment Income, before Income Taxes | 1,409,882 | |||
| Current foreign tax benefit | 29,358 | |||
| Deferred tax expense | (9,484 | ) | ||
| Income tax benefit, net | 19,874 | |||
| Net Investment Income | 1,429,756 | |||
| Realized and Unrealized Gain (Loss) on Investments | ||||
| and Foreign Currency Transactions | ||||
| Net realized loss on investments | (4,465,337 | ) | ||
| Net realized gain on forward foreign currency contracts | 657,537 | |||
| Net realized gain on foreign currency and translation of | ||||
| other assets and liabilities denominated in foreign currency | 104,471 | |||
| Net realized loss, before income taxes | (3,703,329 | ) | ||
| Deferred tax expense | (46,856 | ) | ||
| Net realized loss on investments and foreign | ||||
| currency transactions | (3,750,185 | ) | ||
| Net unrealized appreciation of investments | 27,877,997 | |||
| Net unrealized depreciation of foreign currency, forward | ||||
| foreign currency contracts and translation of other assets | ||||
| and liabilities denominated in foreign currency | (677,448 | ) | ||
| Net unrealized appreciation, before income taxes | 27,200,549 | |||
| Deferred tax benefit | 344,155 | |||
| Deferred tax benefit — conversion to a taxable corporation | 5,488,509 | |||
| Net unrealized appreciation of investments and | ||||
| foreign currency transactions | 33,033,213 | |||
| Net Realized and Unrealized Gain (Loss) on Investments | ||||
| and Foreign Currency Transactions | 29,283,028 | |||
| Distributions to Preferred Stockholders | (6,761 | ) | ||
| Net Increase in Net Assets Applicable to Common | ||||
| Stockholders Resulting from Operations | $ | 30,706,023 | ||
See accompanying Notes to Financial Statements.
6 | Tortoise North American Energy Corp. |
Statement of Changes in Net Assets |
| Period from | ||||||||
| December 1, 2008 | ||||||||
| through | Year Ended | |||||||
| May 31, 2009 | November 30, 2008 | |||||||
| (Unaudited) | ||||||||
| Operations | ||||||||
| Net investment income | $ | 1,429,756 | $ | 1,968,518 | ||||
| Net realized loss on investments and foreign currency transactions | (3,750,185 | ) | (19,204,881 | ) | ||||
| Net unrealized appreciation (depreciation) of investments, foreign currency, forward foreign currency contracts and translation of other assets and liabilities denominated in foreign currency | 33,033,213 | (50,623,486 | ) | |||||
| Distributions to preferred stockholders | (6,761 | ) | (781,097 | ) | ||||
| Net increase (decrease) in net assets applicable to common stockholders resulting from operations | 30,706,023 | (68,640,946 | ) | |||||
| Distributions to Common Stockholders | ||||||||
| Net investment income | (138,740 | ) | — | |||||
| Net realized gain | — | (474,711 | ) | |||||
| Return of capital | (3,274,614 | ) | (6,870,918 | ) | ||||
| Total distributions to common stockholders | (3,413,354 | ) | (7,345,629 | ) | ||||
| Total increase (decrease) in net assets applicable to common stockholders | 27,292,669 | (75,986,575 | ) | |||||
| Net Assets | ||||||||
| Beginning of period | 49,715,646 | 125,702,221 | ||||||
| End of period | $ | 77,008,315 | $ | 49,715,646 | ||||
| Accumulated net investment income (loss), net of income taxes, at the end of period | $ | 443,275 | $ | (847,741 | ) | |||
See accompanying Notes to Financial Statements.
| 2009 2nd Quarter Report | 7 |
Statement of Cash Flows Period from December 1, 2008 through May 31, 2009 |
(Unaudited) | |||
| Cash Flows from Operating Activities | |||
| Purchases of long-term investments | $ | (22,302,309 | ) |
| Proceeds from sales of long-term investments | 21,127,013 | ||
| Proceeds from sales of short-term investments, net | 7,110,210 | ||
| Distributions received from master limited partnerships | 2,591,250 | ||
| Dividend income from Canadian trusts | 6,596 | ||
| Interest and dividend income received | 1,104,426 | ||
| Proceeds from sale of foreign currency, net | 1,263,890 | ||
| Interest expense paid | (453,553 | ) | |
| Proceeds from termination of forward foreign currency contracts | 563,418 | ||
| Income taxes paid | (8,082 | ) | |
| Operating expenses paid | (786,091 | ) | |
| Net cash provided by operating activities | 10,216,768 | ||
| Cash Flows from Financing Activities | |||
| Distributions paid to common stockholders | (1,706,677 | ) | |
| Distributions paid to preferred stockholders | (9,181 | ) | |
| Redemption of preferred stock | (8,699,500 | ) | |
| Net cash used in financing activities | (10,415,358 | ) | |
| Net decrease in cash | (198,590 | ) | |
| Effect of exchange rate gains on foreign currency | 198,590 | ||
| Cash — beginning of period | — | ||
| Cash — end of period | $ | — | |
| Reconciliation of net increase in net assets applicable to common stockholders resulting from operations to net cash provided by operating activities | |||
| Net increase in net assets applicable to common stockholders resulting from operations | $ | 30,706,023 | |
| Adjustments to reconcile net increase in net assets applicable to common stockholders resulting from operations to net cash provided by operating activities: | |||
| Purchases of long-term investments | (22,366,998 | ) | |
| Return of capital on distributions received | 2,379,204 | ||
| Proceeds from sales of short-term investments, net | 7,110,210 | ||
| Proceeds from sales of long-term investments | 21,180,909 | ||
| Deferred tax benefit | (287,815 | ) | |
| Deferred tax benefit - conversion to a taxable corporation | (5,488,509 | ) | |
| Net unrealized appreciation of investments | (27,877,997 | ) | |
| Net unrealized depreciation of foreign currency, forward foreign exchange contracts and translation of assets and liabilities denominated in foreign currency | 677,448 | ||
| Net realized loss on investments and | |||
| foreign currency transactions | 4,360,866 | ||
| Amortization of market premium, net | 39,035 | ||
| Gain on redemption of preferred stock | 1,300,500 | ||
| Amortization of debt issuance costs | 9,664 | ||
| Distributions to preferred stockholders | 6,761 | ||
| Changes in operating assets and liabilities: | |||
| Decrease in foreign currency | 1,263,890 | ||
| Increase in interest and dividend receivable | (135,005 | ) | |
| Decrease in receivable for investments sold | 3,347 | ||
| Increase in prepaid expenses and other assets | (41,221 | ) | |
| Increase in payable for investments purchased | 64,689 | ||
| Decrease in current tax liability | (31,595 | ) | |
| Decrease in payable to Adviser, net of expense reimbursement | (37,817 | ) | |
| Decrease in accrued expenses and other liabilities | (17,821 | ) | |
| Total adjustments | (17,888,255 | ) | |
| Net cash provided by operating activities | $ | 12,817,768 | |
See accompanying Notes to Financial Statements.
8 | Tortoise North American Energy Corp. |
FINANCIAL HIGHLIGHTS |
| Period from | Period from | |||||||||||||||||||
| December 1, 2008 | Year Ended | Year Ended | Year Ended | October 31, 2005(1) | ||||||||||||||||
| through | November 30, | November 30, | November 30, | through | ||||||||||||||||
| May 31, 2009 | 2008 | 2007 | 2006 | November 30, 2005 | ||||||||||||||||
| (Unaudited) | ||||||||||||||||||||
| Per Common Share Data(2) | ||||||||||||||||||||
| Net Asset Value, beginning of period | $ | 10.78 | $ | 27.25 | $ | 23.70 | $ | 23.95 | $ | — | ||||||||||
| Public Offering Price | — | — | — | — | 25.00 | |||||||||||||||
| Underwriting discounts and offering costs on issuance of common and preferred stock(3) | — | — | — | (0.07 | ) | (1.31 | ) | |||||||||||||
| Income from Investment Operations: | ||||||||||||||||||||
| Net investment income(4) | 0.31 | 0.43 | 0.72 | 0.61 | 0.02 | |||||||||||||||
| Net realized and unrealized gain (loss) on investments(4) | 6.35 | (15.14 | ) | 4.47 | 0.55 | 0.24 | ||||||||||||||
| Total increase (decrease) from investment operations | 6.66 | (14.71 | ) | 5.19 | 1.16 | 0.26 | ||||||||||||||
| Less Distributions to Preferred Stockholders: | ||||||||||||||||||||
| Net investment income | — | (0.17 | ) | (0.12 | ) | (0.06 | ) | — | ||||||||||||
| Net realized gain | — | — | (0.07 | ) | (0.01 | ) | — | |||||||||||||
| Total distributions to preferred stockholders | — | (0.17 | ) | (0.19 | ) | (0.07 | ) | — | ||||||||||||
| Less Distributions to Common Stockholders: | ||||||||||||||||||||
| Net investment income | (0.03 | ) | — | (0.90 | ) | (0.69 | ) | — | ||||||||||||
| Net realized gain | — | (0.10 | ) | (0.55 | ) | (0.12 | ) | — | ||||||||||||
| Return of capital | (0.71 | ) | (1.49 | ) | — | (0.46 | ) | — | ||||||||||||
| Total distributions to common stockholders | (0.74 | ) | (1.59 | ) | (1.45 | ) | (1.27 | ) | — | |||||||||||
| Net Asset Value, end of period | $ | 16.70 | $ | 10.78 | $ | 27.25 | $ | 23.70 | $ | 23.95 | ||||||||||
| Per common share market value, end of period | $ | 15.20 | $ | 9.25 | $ | 23.10 | $ | 22.38 | $ | 25.00 | ||||||||||
| Total Investment Return Based on Market Value(5) | 73.83 | % | (55.98 | )% | 9.28 | % | (5.39 | )% | 0.00 | % | ||||||||||
See accompanying Notes to Financial Statements.
| 2009 2nd Quarter Report | 9 |
FINANCIAL HIGHLIGHTS (Continued) |
| Period from | Period from | |||||||||||||||||||
| December 1, 2008 | Year Ended | Year Ended | Year Ended | October 31, 2005(1) | ||||||||||||||||
| through | November 30, | November 30, | November 30, | through | ||||||||||||||||
| May 31, 2009 | 2008 | 2007 | 2006 | November 30, 2005 | ||||||||||||||||
| (Unaudited) | ||||||||||||||||||||
| Supplemental Data and Ratios | ||||||||||||||||||||
| Net assets applicable to common stockholders, end of period (000’s) | $ | 77,008 | $ | 49,716 | $ | 125,702 | $ | 109,326 | $ | 110,451 | ||||||||||
| Ratio of expenses (including net current and deferred income tax (benefit) expense) to average net assets before waiver(6)(7)(8)(9) | (14.90 | )% | 5.75 | % | 3.88 | % | 3.41 | % | 2.02 | % | ||||||||||
| Ratio of expenses (including net current and deferred income tax (benefit) expense) to average net assets after waiver(6)(7)(8)(9) | (14.78 | )% | 5.52 | % | 3.59 | % | 3.09 | % | 1.77 | % | ||||||||||
| Ratio of expenses (excluding net current and deferred income tax (benefit) expense) to average net assets before waiver(6)(8)(9)(10) | 3.88 | % | 5.69 | % | 3.86 | % | 3.40 | % | 2.02 | % | ||||||||||
| Ratio of expenses (excluding net current and deferred income tax (benefit) expense) to average net assets after waiver(6)(8)(9)(10) | 4.00 | % | 5.46 | % | 3.57 | % | 3.08 | % | 1.77 | % | ||||||||||
| Ratio of net investment income (including net current and deferred income tax (benefit) expense) to average net assets before waiver(6)(7)(8)(9) | 23.21 | % | 1.51 | % | 2.36 | % | 2.14 | % | 0.75 | % | ||||||||||
| Ratio of net investment income (including net current and deferred income tax (benefit) expense) to average net assets after waiver(6)(7)(8)(9) | 23.09 | % | 1.74 | % | 2.65 | % | 2.46 | % | 1.00 | % | ||||||||||
| Ratio of net investment income (excluding net current and deferred income tax (benefit) expense) to average net assets before waiver(6)(8)(9)(10) | 4.43 | % | 1.57 | % | 2.38 | % | 2.15 | % | 0.75 | % | ||||||||||
| Ratio of net investment income (excluding net current and deferred income tax (benefit) expense) to average net assets after waiver(6)(8)(9)(10) | 4.31 | % | 1.80 | % | 2.67 | % | 2.47 | % | 1.00 | % | ||||||||||
| Portfolio turnover rate(6) | 61.54 | % | 36.69 | % | 16.06 | % | 12.01 | % | 0.00 | % | ||||||||||
| Short-term borrowings, end of period (000’s) | — | — | $ | 9,600 | $ | 7,000 | — | |||||||||||||
| Long-term debt obligations, end of period (000’s) | $ | 15,000 | $ | 15,000 | $ | 40,000 | $ | 40,000 | — | |||||||||||
| Preferred stock, end of period (000’s) | — | $ | 10,000 | $ | 15,000 | $ | 15,000 | — | ||||||||||||
| Per common share amount of long-term debt obligations outstanding, at end of period | $ | 3.25 | $ | 3.25 | $ | 8.67 | $ | 8.67 | — | |||||||||||
| Per common share amount of net assets, excluding long-term debt obligations, at end of period | $ | 19.95 | $ | 14.03 | $ | 35.92 | $ | 32.37 | — | |||||||||||
| Asset coverage, per $1,000 of principal amount of long-term debt obligations and short-term borrowings(11) | $ | 6,134 | $ | 4,981 | $ | 3,837 | $ | 3,645 | — | |||||||||||
| Asset coverage ratio of long-term debt obligations and short-term borrowings(11) | 613 | % | 498 | % | 384 | % | 365 | % | — | |||||||||||
| Asset coverage, per $25,000 liquidation value per share of preferred stock(12) | — | $ | 149,289 | $ | 234,504 | $ | 207,210 | — | ||||||||||||
| Asset coverage, per $25,000 liquidation value per share of preferred stock(13) | — | $ | 74,716 | $ | 73,646 | $ | 69,083 | — | ||||||||||||
| Asset coverage ratio of preferred stock(13) | — | 299 | % | 295 | % | 276 | % | — | ||||||||||||
| (1) | Commencement of Operations. | |
| (2) | Information presented relates to a share of common stock outstanding for the entire period. | |
| (3) | Represents the issuance of preferred stock for the year ended November 30, 2006. Represents the issuance of common stock for the period from October 31, 2005 through November 30, 2005. | |
| (4) | The per common share data for the years ended November 30, 2008, 2007 and 2006 and the period from October 31, 2005 through November 30, 2005, do not reflect the change in estimate of investment income and return of capital, for the respective period. See Note 2F to the financial statements for further disclosure. | |
| (5) | Not annualized. Total investment return is calculated assuming a purchase of common stock at the beginning of period (or initial public offering price) and a sale at the closing price on the last day of the period reported (excluding broker commissions). The calculation also assumes reinvestment of distributions at actual prices pursuant to the Company’s dividend reinvestment plan. | |
| (6) | Annualized for periods less than one full year. | |
| (7) | The Company accrued $(29,358), $68,509, $22,447, $13,225 and $0 for the period from December 1, 2008 through May 31, 2009, the years ended November 30, 2008, 2007 and 2006, and the period from October 31, 2005 through November 30, 2005, respectively, for current foreign and excise tax (benefit) expense. For the period ended May 31, 2009, the Company accrued $5,776,324 in net deferred income tax benefit. This includes $5,488,509 of net deferred income tax benefit for the timing differences at December 1, 2008 when the Company converted to a taxable corporation. | |
| 8) | The expense ratios and net investment income ratios do not reflect the effect of distributions to preferred stockholders. | |
| (9) | In addition to the fees and expenses which the Company bears directly, the Company bears a pro rata share of the fees and expenses of the acquired companies in which it invests. Such indirect expenses are not included in the above expense and income ratios. | |
| (10) | The ratio excludes the impact of current and deferred income taxes. | |
| (11) | Represents value of total assets less all liabilities and indebtedness not represented by long-term debt obligations, short-term borrowings and preferred stock at the end of the period divided by long-term debt obligations and short-term borrowings outstanding at the end of the period. | |
| (12) | Represents value of total assets less all liabilities and indebtedness not represented by preferred stock at the end of the period divided by preferred stock outstanding at the end of the period, assuming the retirement of all long-term debt obligations and short-term borrowings. | |
| (13) | Represents value of total assets less all liabilities and indebtedness not represented by long-term debt obligations, short-term borrowings and preferred stock at the end of the period divided by long-term debt obligations, short-term borrowings and preferred stock outstanding at the end of the period. | |
See accompanying Notes to Financial Statements.
10 | Tortoise North American Energy Corp. |
Notes to Financial Statements (Unaudited) May 31, 2009 |
1. Organization
Tortoise North American Energy Corporation (the “Company”) was organized as a Maryland corporation on January 13, 2005, and is a non-diversified, closed-end management investment company under the Investment Company Act of 1940, as amended (the “1940 Act”). The Company’s investment objective is to seek a high level of total return with an emphasis on distribution income paid to stockholders. The Company seeks to provide its stockholders with a vehicle to invest in a portfolio consisting primarily of publicly traded U.S. master limited partnerships (“MLPs”), including oil and gas exploitation, energy infrastructure and energy shipping companies. The Company commenced operations on October 31, 2005. The Company’s stock is listed on the New York Stock Exchange under the symbol “TYN.”
On April 1, 2009, the Boards of Directors of the Company and Tortoise Gas and Oil Corp. (“TGO”) each approved a reorganization in which the Company plans to acquire TGO. As part of the reorganization, TGO common stockholders will be issued common stock of the Company and the Company would acquire substantially all of the assets and liabilities of TGO. It is currently expected that the reorganization will take place during the Company’s third fiscal quarter of 2009, subject to obtaining the Company and TGO stockholder votes and compliance with all regulatory requirements and satisfaction of customary closing conditions.
2. Significant Accounting Policies
A. Use of Estimates
The preparation of financial statements in conformity with U.S. generally accepted accounting principles requires management to make estimates and assumptions that affect the reported amount of assets and liabilities, recognition of distribution income and disclosure of contingent assets and liabilities at the date of the financial statements. Actual results could differ from those estimates.
B. Investment Valuation
The Company primarily owns securities that are listed on a securities exchange or over-the-counter market. The Company values those securities at their last sale price on that exchange or over-the-counter market on the valuation date. If the security is listed on more than one exchange, the Company will use the price of the exchange that it considers to be the principal exchange on which the security is traded. Securities listed on the NASDAQ will be valued at the NASDAQ Official Closing Price, which may not necessarily represent the last sale price. If there has been no sale on such exchange or over-the-counter market on such day, the security will be valued at the mean between the bid and ask price on such day.
The Company may invest up to 50 percent of its total assets in restricted securities. Restricted securities may be subject to statutory and contractual restrictions on their public resale, which may make it more difficult to obtain a valuation and may limit the Company’s ability to dispose of them. Investments in restricted securities and other securities for which market quotations are not readily available will be valued in good faith by using fair value procedures approved by the Board of Directors. Such fair value procedures consider factors such as discounts to publicly traded issues, time until conversion date, securities with similar yields, quality, type of issue, coupon, duration and rating. If events occur that will affect the value of the Company’s portfolio securities before the net asset value has been calculated (a “significant event”), the portfolio securities so affected will generally be priced using fair value procedures.
An equity security of a publicly traded company acquired in a direct placement transaction may be subject to restrictions on resale that can affect the security’s liquidity and fair value. Such securities that are convertible into or otherwise will become freely tradable will be valued based on the market value of the freely tradable security less an applicable discount. Generally, the discount will initially be equal to the discount at which the Company purchased the securities. To the extent that such securities are convertible or otherwise become freely tradable within a time frame that may be reasonably determined, an amortization schedule may be used to determine the discount.
Effective December 1, 2007, the Company adopted Statement of Financial Accounting Standards No. 157, Fair Value Measurements (“SFAS 157”). SFAS 157 defines fair value, establishes a framework for measuring fair value in accordance with U.S. generally accepted accounting principles and expands disclosures about fair value measurements. SFAS 157 is applicable in conjunction with other accounting pronouncements that require or permit fair value measurements, but does not expand the use of fair value to any new circumstances. More specifically, SFAS 157 emphasizes that fair value is a market based measurement, not an entity-specific measurement, and sets out a fair value hierarchy with the highest priority given to quoted prices in active markets and the lowest priority to unobservable inputs. The Company’s adoption of SFAS 157 did not have an impact on its financial condition or results of operations. See Note 8 — Fair Value of Financial Instruments for further disclosure.
The Company generally values short-term debt securities at prices based on market quotations for such securities, except those securities purchased with 60 days or less to maturity are valued on the basis of amortized cost, which approximates market value.
The Company generally values its interest rate swap contracts based on dealer quotations, if available, or using industry-accepted models which discount the estimated future cash flows derived from the stated terms of the interest rate swap agreement and use a discount rate based on interest rates currently available in the market.
C. Foreign Currency Translation
For foreign currency, investments in foreign securities, and other assets and liabilities denominated in a foreign currency, the Company translates these amounts into U.S. dollars on the following basis:
| (1) | market value of investment securities, assets and liabilities at the current rate of exchange on the valuation date and | ||
| (2) | purchases and sales of investment securities, income and expenses at the relevant rates of exchange on the respective dates of such transactions. | ||
The Company does not isolate that portion of gains and losses on investments that is due to changes in the foreign exchange rates from that which is due to changes in market prices of equity securities.
D. Forward Foreign Currency Contracts
The Company may enter into forward foreign currency contracts as economic hedges related to specific transactions. All commitments are “marked-to-market” daily at the applicable foreign exchange rate, and any resulting unrealized gains or losses are recorded in the Statement of Operations. The Company recognizes realized gains or losses at the time forward contracts are extinguished.
E. Foreign Withholding Taxes
The Company may be subject to taxes imposed by countries in which it invests with respect to its investment in issuers existing or operating in such countries. Such taxes are generally based on income earned. The Company accrues such taxes when the related income is earned.
F. Security Transactions and Investment Income
Security transactions are accounted for on the date the securities are purchased or sold (trade date). Realized gains and losses are reported on an identified cost basis. Interest income is recognized on the accrual basis, including amortization of premiums and accretion of discounts. Dividends and distribution income are recorded on the ex-dividend date. Distributions received from the Company’s investments in Canadian Royalty and Income Trusts are generally comprised of ordinary income. Distributions
2009 2nd Quarter Report 11
Notes to Financial Statements (Unaudited) (Continued) |
from MLPs are generally comprised of income and return of capital from the MLPs. The Company allocates distributions between investment income and return of capital based on estimates made at the time such distributions are received. Such estimates are based on historical information available from each MLP and other industry sources. These estimates may subsequently be revised based on actual allocations received from MLPs after their tax reporting periods are concluded, as the actual character of these distributions is not known until after the fiscal year end of the Company.
For the period from December 1, 2007 through November 30, 2008, the Company estimated the allocation of investment income and return of capital for the distributions received from MLPs within the Statement of Operations. For this period, the Company had estimated approximately 16 percent of total distributions as investment income and approximately 84 percent as return of capital.
Subsequent to November 30, 2008, the Company reallocated the amount of investment income and return of capital it recognized based on the 2008 tax reporting information received from the individual MLPs. This reallocation amounted to a decrease in pre-tax net investment income of approximately $213,000 or $0.046 per share ($134,000 or $0.029 per share, net of deferred tax benefit); an increase in unrealized appreciation of investments of approximately $202,000 or $0.044 per share ($127,000 or $0.028 per share, net of deferred tax expense) and an increase in realized gains of approximately $11,000 or $0.002 per share ($7,000 or $0.001 per share, net of deferred tax expense) for the period from December 1, 2008 through May 31, 2009.
Subsequent to the period ended February 28, 2009, the Company reallocated the amount of investment income and return of capital reported in the current fiscal year based on its revised 2009 estimates. This reallocation amounted to a decrease in pre-tax net investment income of approximately $8,000 or $0.002 per share ($5,000 or $0.001 per share, net of deferred tax benefit); a decrease in unrealized appreciation of investments of approximately $186,000 or $0.040 per share ($117,000 or $0.025 per share, net of deferred tax benefit) and an increase in realized gains of approximately $194,000 or $0.042 per share ($122,000 or $0.026 per share, net of deferred tax expense).
G. Distributions to Stockholders
Distributions to common stockholders are recorded on the ex-dividend date. The Company may not declare or pay distributions to its common stockholders if it does not meet asset coverage ratios required under the 1940 Act or the rating agency guidelines for its debt and preferred stock (if any) following such distribution. The character of distributions to stockholders made during the year may differ from their ultimate characterization for federal income tax purposes. Distributions paid to stockholders in excess of investment company taxable income and net realized capital gains will be treated as a return of capital to the stockholders. For the year ended November 30, 2008, the Company’s distributions for book purposes were comprised of 100 percent return of capital and for the period ended May 31, 2009, the Company’s distributions for book purposes were comprised of approximately 4 percent ordinary income with the remainder consisting of return of capital. For the year ended November 30, 2008, the Company’s distributions to common stockholders for tax purposes were comprised of 6 percent capital gain and 94 percent return of capital. The tax character of distributions paid for the current year will be determined subsequent to November 30, 2009.
Distributions to preferred stockholders are based on variable rates set at auctions, normally held every 28 days unless a special rate period is designated. The Company may not declare or pay distributions to its preferred stockholders if it does not meet a 200 percent asset coverage ratio for its debt or the rating agency basic maintenance amount for the debt following such distribution. Distributions to preferred stockholders are accrued on a daily basis for the subsequent rate period at a rate determined on the auction date. Distributions to preferred stockholders are payable on the first day following the end of the rate period or the first day of the month if the rate period is longer than one month. The character of distributions to preferred stockholders made during the year may differ from their ultimate characterization for federal income tax purposes. For the year ended November 30, 2008, the Company’s distributions for book purposes were comprised of 100 percent return of capital and for the period ended May 31, 2009, the Company’s distributions for book purposes were comprised of 100 percent ordinary income. For the year ended November 30, 2008, the Company’s distributions to preferred stockholders for tax purposes were comprised 100 percent return of capital. The tax character of distributions paid for the current year will be determined subsequent to November 30, 2009.
H. Federal Income Taxation
Through November 30, 2008, the Company qualified as a regulated investment company (“RIC”) under the U.S. Internal Revenue Code of 1986, as amended (the “Code”). As a result, the Company generally was not subject to U.S. federal income tax on income and gains that it distributed each taxable year to stockholders if it met certain minimum distribution requirements. The Company was required to distribute substantially all of its income, in addition to other asset diversification requirements. The Company was subject to a 4 percent non-deductible U.S. federal excise tax on certain undistributed income unless the Company made sufficient distributions to satisfy the excise tax avoidance requirement.
Effective December 1, 2008, the Company is treated as a taxable corporation for federal and state income tax purposes. The Company is obligated to pay federal and state income taxes on its taxable income. Currently, the highest regular marginal federal income tax rate for a corporation is 35 percent; however, the Company anticipates a marginal effective rate of 34 percent due to expectations of the level of taxable income relative to the federal graduated tax rates, including the tax rate anticipated when temporary differences reverse. The Company may be subject to a 20 percent federal alternative minimum tax on its federal alternative minimum taxable income to the extent that its alternative minimum tax exceeds its regular federal income tax.
The Company invests in MLPs, which generally are treated as partnerships for federal income tax purposes. As a limited partner in the MLPs, the Company reports its allocable share of the MLP’s taxable income in computing its own taxable income. The Company’s tax expense or benefit is included in the Statement of Operations based on the component of income or gains (losses) to which such expense or benefit relates. Deferred income taxes reflect the net effects of temporary differences between the carrying amounts of assets and liabilities for financial reporting purposes and the amounts used for income tax purposes. A valuation allowance is recognized if, based on the weight of available evidence, it is more likely than not that some portion or all of the deferred income tax asset will not be realized.
I. Organization Expenses, Offering and Debt Issuance Costs
The Company is responsible for paying all organizational expenses and offering costs. Offering costs related to the issuance of common and preferred stock are charged to additional paid-in capital when the stock is issued. Debt issuance costs related to long-term debt obligations are capitalized and amortized over the period the debt is outstanding.
J. Derivative Financial Instruments
The Company may use derivative financial instruments (principally interest rate swap and forward foreign currency contracts) to manage interest rate and currency risk. The Company has established policies and procedures for risk assessment and the approval, reporting and monitoring of derivative financial instrument activities. The Company does not hold or issue derivative financial instruments for speculative purposes. All derivative financial instruments are recorded at fair value with changes in fair value during the reporting period, and amounts accrued under the agreements, included as unrealized gains or losses in the accompanying Statement of Operations. Cash settlements under the terms of the interest rate swap and forward foreign currency contracts are recorded as realized gains or losses in the accompanying Statement of Operations.
12 Tortoise North American Energy Corp.
Notes to Financial Statements (Unaudited) (Continued) |
On December 1, 2008, the Company adopted the Financial Accounting Standards Board (“FASB”) Statement of Financial Accounting Standards No. 161 (“SFAS 161”), Disclosures about Derivative Instruments and Hedging Activities — an amendment to FASB Statement No. 133. SFAS 161 requires enhanced disclosures about an entity’s derivative and hedging activities. Entities are required to provide enhanced disclosures about (a) how and why an entity uses derivative instruments; (b) how derivative instruments and related hedged items are accounted for under Statement 133 and its related interpretations and (c) how derivative instruments and related hedged items affect an entity’s financial position, financial performance and cash flows. The Company does not have any outstanding derivative instruments at May 31, 2009 and the adoption of SFAS 161 did not have an impact on the Company’s financial statements and related disclosures.
K. Indemnifications
Under the Company’s organizational documents, its officers and directors are indemnified against certain liabilities arising out of the performance of their duties to the Company. In addition, in the normal course of business, the Company may enter into contracts that provide general indemnification to other parties. The Company’s maximum exposure under these arrangements is unknown, as this would involve future claims that may be made against the Company that have not yet occurred, and may not occur. However, the Company has not had prior claims or losses pursuant to these contracts and expects the risk of loss to be remote.
L. Recent Accounting Pronouncements
On April 9, 2009, the FASB issued Staff Position No. 157-4, Determining Fair Value When the Volume and Level of Activity for the Asset or Liability Have Significantly Decreased and Identifying Transactions That Are Not Orderly (“FSP 157-4”). FSP 157-4 provides additional guidance for estimating fair value in accordance with SFAS 157 when the volume and level of activity for the asset or liability have significantly decreased. FSP 157-4 also provides guidance on identifying circumstances that indicate a transaction is not orderly. FSP 157-4 is effective for interim and annual reporting periods ending after June 15, 2009. The adoption of FSP 157-4 is not expected to have a significant impact on the Company’s financial statements.
On April 9, 2009, the FASB issued FASB Staff Position (FSP) No. FAS 107-1 and APB 28-1, Interim Disclosures about Fair Value of Financial Instruments, which amends FASB Statement No. 107, Disclosures about Fair Value of Financial Instruments (“FSP 107-1”), to require disclosures about fair value of financial instruments for interim financial statements of publicly traded companies as well as in annual financial statements. FSP 107-1 also amends APB Opinion No. 28, Interim Financial Reporting, to require those disclosures in summarized financial information at interim reporting periods. FSP 107-1 is effective for interim reporting periods ending after June 15, 2009. The adoption of FSP 107-1 is not expected to have a significant impact on the Company’s financial statements.
3. Concentration of Risk
The Company’s investment objective is to seek a high level of total return with an emphasis on distribution income paid to stockholders. Under normal conditions, the Company will have at least 80 percent of its total assets (including assets obtained through leverage) in equity securities of companies in the energy sector with their primary operations in North America (“Energy Companies”). Energy Companies include companies that derive more than 50 percent of their revenues from transporting, processing, storing, distributing or marketing natural gas, natural gas liquids, electricity, coal, crude oil or refined petroleum products, or exploring, developing, managing or producing such commodities. The Company may invest up to 50 percent of its total assets in restricted securities.
4. Agreements
The Company has entered into an Investment Advisory Agreement with Tortoise Capital Advisors, L.L.C. (the “Adviser”). Under the terms of the agreement, the Company pays the Adviser a fee equal to an annual rate of 1.00 percent of the Company’s average monthly total assets (including any assets attributable to leverage) minus accrued liabilities (other than debt entered into for purposes of leverage and the aggregate liquidation preference of outstanding preferred stock, if any) (“Managed Assets”), in exchange for the investment advisory services provided. For the period from January 1, 2008 through December 31, 2008, the Adviser waived fees in an amount equal to an annual rate of 0.15 percent of the Company’s average monthly Managed Assets. The Adviser has contractually agreed to waive fees in the amount of 0.10 percent of average monthly Managed Assets for the period from January 1, 2009 through December 31, 2009.
The Company has engaged SEI Investments Global Funds Services to serve as the Company’s administrator. The Company pays the administrator a monthly fee computed at an annual rate of 0.05 percent of the first $500,000,000 of the Company’s Managed Assets and 0.04 percent on the balance of the Company’s Managed Assets, subject to a minimum annual fee of $100,000.
U.S. Bank, N.A. serves as custodian of the Company’s cash and investment securities. The Company pays the custodian an annual fee of 0.004 percent of the average daily market value of the Company’s domestic assets, and 0.015 percent of the average daily market value of the Company’s Canadian Dollar-denominated assets.
Computershare Trust Company, N.A. serves as the Company’s transfer agent, dividend paying agent, and agent for the automatic dividend reinvestment plan.
5. Income Taxes
Deferred income taxes reflect the net tax effect of temporary differences between the carrying amount of assets and liabilities for financial reporting and tax purposes. Components of the Company’s deferred tax assets and liabilities as of May 31, 2009, are as follows:
| Deferred tax assets: | |||
| Net operating loss | $ | 558,316 | |
| Net unrealized losses on investment securities | 2,308,230 | ||
| Capital loss | 7,849,546 | ||
| Deferred expense associated with interest rate swap terminations | 221,085 | ||
| Organization costs | 59,926 | ||
| Passive activity loss associated with MLPs | 673,164 | ||
| Subtotal | 11,670,267 | ||
| Valuation allowance | (5,145,279 | ) | |
| 6,524,988 | |||
| Deferred tax liabilities: | |||
| Basis reduction of investment in MLPs | 748,664 | ||
| Total net deferred tax asset | $ | 5,776,324 |
At May 31, 2009, the Company has recorded a valuation allowance in the amount of $5,145,279 for a portion of its deferred tax asset which it does not believe will, more likely than not, be realized. The Company estimates, based on existence of sufficient evidence, primarily regarding the amount and timing of distributions to be received from portfolio companies, the ability to realize the remainder of its deferred tax assets. Any adjustments to such estimates will be made in the period such determination is made.
Management determined that no reserve for unrecognized tax benefits is necessary when temporary differences represent net future deductible amounts rather than net future taxable amounts. The Company does not expect any change in such amount of unrecognized tax benefits over the next twelve months subsequent to November 30, 2008. The Company’s policy is to record interest and penalties on uncertain tax
2009 2nd Quarter Report 13
Notes to Financial Statements (Unaudited) (Continued) |
positions as part of tax expense. No interest or penalties were accrued at May 31, 2009. All tax years since inception remain open to examination by federal and state tax authorities.
Total income tax benefit differs from the amount computed by applying the federal statutory income tax rate of 34 percent to net investment loss and realized and unrealized losses on investments before taxes for the period ended May 31, 2009, as follows:
| Application of statutory income tax rate | $ | 8,468,415 | |
| State income taxes, net of federal tax benefit | 752,194 | ||
| Foreign tax benefit, net of federal tax effect | (18,490 | ) | |
| Gain on redemption of preferred stock | (481,445 | ) | |
| Change in valuation allowance | (9,037,847 | ) | |
| Tax benefit on conversion to taxable corporation | (5,488,509 | ) | |
| Total income tax benefit | $ | (5,805,682 | ) |
Total income taxes are computed by applying the federal statutory rate plus a blended state income tax rate. For the period ended May 31, 2009, the components of income tax benefit include current foreign tax benefit (for which the federal tax effect in included in deferred tax expense) of $29,358 and deferred federal and state income tax benefit (net of federal tax effect) of $256,911 and $30,904, respectively. The deferred income tax benefit is net of the reduction in valuation allowance of $9,037,847 and deferred income tax benefit (net of valuation allowance) of $5,488,509, including both federal and state tax effect, resulting from the Company’s conversion from a RIC to a taxable corporation.
At November 30, 2008, the components of distributable earnings on a tax basis were as follows:
| Accumulated capital losses | $ | (14,878,462 | ) |
| Unrealized depreciation | (34,111,972 | ) | |
| Other temporary differences | (171,408 | ) | |
| Distributable earnings | $ | (49,161,842 | ) |
As of November 30, 2008, the Company had a capital loss carryforward of approximately $18,200,000 which may be carried forward for 5 years and if not utilized expires in the year ending November 30, 2013. The amount of deferred tax asset for net operating loss and capital loss at May 31, 2009, include amounts for the period from December 1, 2008 through May 31, 2009. For corporations, capital losses can only be used to offset capital gains and cannot be used to offset ordinary income.
As of May 31, 2009, the aggregate cost of securities for federal income tax purposes was $92,034,069. The aggregate gross unrealized appreciation for all securities in which there was an excess of fair value over tax cost was $11,953,733, the aggregate gross unrealized depreciation for all securities in which there was an excess of tax cost over fair value was $16,166,504 and the net unrealized depreciation was $4,212,771.
6. Investment Transactions
For the period ended May 31, 2009, the Company purchased (at cost) and sold securities (proceeds received) in the amount of $22,366,998 and $21,180,909 (excluding short-term and government securities), respectively.
7. Common Stock
The Company has 100,000,000 shares of capital stock authorized and 4,612,640 shares outstanding at May 31, 2009 and November 30, 2008.
8. Fair Value of Financial Instruments
Various inputs are used in determining the value of the Company’s investments. These inputs are summarized in the three broad levels listed below:
| Level 1 | — | quoted prices in active markets for identical investments | |
| Level 2 | — | other significant observable inputs (including quoted prices for similar investments, market corroborated inputs, etc.) | |
| Level 3 | — | significant unobservable inputs (including the Company’s own assumptions in determining the fair value of investments) |
The inputs or methodology used for valuing securities are not necessarily an indication of the risk associated with investing in those securities.
The following table provides the fair value measurements of applicable Company assets and liabilities by level within the fair value hierarchy as of May 31, 2009. These assets and liabilities are measured on a recurring basis.
| Fair Value Measurements at Reporting Date Using | ||||||||
| Quoted Prices in | Significant | |||||||
| Active Markets for | Significant Other | Unobservable | ||||||
| Fair Value at | Identical Assets | Observable Inputs | Inputs | |||||
| Description | May 31, 2009 | (Level 1) | (Level 2) | (Level 3) | ||||
| Investments | $87,821,298 | $75,715,416 | $10,757,000 | $1,348,882 | ||||
| Fair Value Measurements Using Significant Unobservable Inputs | ||||
| (Level 3) for Investments | ||||
| For the period ended | ||||
| May 31, 2009 | ||||
| Fair value beginning balance | $ | 940,216 | ||
| Total unrealized gains included in net increase in net assets applicable | ||||
| to common stockholders | 408,666 | |||
| Net purchases, issuances and settlements | — | |||
| Return of capital adjustments impacting cost basis of security | — | |||
| Transfers into Level 3 | — | |||
| Fair value ending balance | $ | 1,348,882 | ||
The Company utilizes the beginning of reporting period method for determining transfers into or out of Level 3. Accordingly, this method is the basis for presenting the rollforward in the preceding table. Under this method, the fair value of the asset at the beginning of the period will be disclosed as a transfer into or out of Level 3, gains or losses for an asset that transfers into Level 3 during the period will be included in the reconciliation, and gains or losses for an asset that transfers out of Level 3 will be excluded from the reconciliation.
14 Tortoise North American Energy Corp.
Notes to Financial Statements (Unaudited)
(Continued)
9. Restricted Securities
Certain of the Company’s investments are restricted and are valued as determined in accordance with procedures established by the Board of Directors, as more fully described in Note 2. The table below shows the shares/principal amount, acquisition date(s), acquisition cost, fair value per share and percent of net assets which the securities comprise at May 31, 2009.
| Fair | Fair | ||||||||||||||
| Shares/ | Value | Value as | |||||||||||||
| Principal | Acquisition | Acquisition | Per | Percent of | |||||||||||
| Company | Amount | Date(s) | Cost | Share | Net Assets | ||||||||||
| Connacher Oil & Gas Ltd, 10.25%, 12/15/2015 | $ | 4,000,000 | 04/25/08- | $ | 4,257,500 | N/A | 3.3 | % | |||||||
| 07/31/08 | |||||||||||||||
| Copano Energy, L.L.C. — Class D Common Units | 95,260 | 03/14/08 | 2,500,575 | $ | 14.16 | 1.8 | |||||||||
| OPTI Canada Inc., 8.25%, 12/15/2014 | $ | 2,500,000 | 12/08/06- | 2,533,250 | N/A | 2.2 | |||||||||
| 12/14/06 | |||||||||||||||
| SemGroup, L.P., 8.75%, 11/15/2015 | $ | 6,300,000 | 11/04/05- | 6,267,010 | N/A | 0.5 | |||||||||
| 04/16/08 | |||||||||||||||
| $ | 15,558,335 | 7.8 | % | ||||||||||||
10. Credit Facility
The Company had a revolving loan commitment amount of $10,000,000 ($15,000,000 from November 1, 2008, through and including December 31, 2008) that matured on March 20, 2009 with U.S. Bank, N.A. The credit facility had a variable annual rate equal to one-month LIBOR plus 0.75 percent and unused portions of the credit facility accrued a non-usage fee equal to an annual rate of 0.15 percent.
On March 20, 2009, the Company entered into an extension of its credit facility through June 20, 2009. The amended credit agreement provides for an unsecured revolving credit facility of up to $10,000,000. During the extension, outstanding balances accrue interest at a variable annual rate equal to one-month LIBOR plus 2.00 percent and unused portions of the credit facility accrue a non-usage fee equal to an annual rate of 0.25 percent. The Company did not utilize the credit facility during the period ended May 31, 2009.
Under the terms of the credit facility, the Company must maintain asset coverage required under the 1940 Act. If the Company fails to maintain the required coverage, it may be required to repay a portion of an outstanding balance until the coverage requirement has been met.
11. Long-Term Debt Obligations
The Company has $15,000,000 aggregate principal amount of Series B private senior notes (the “Notes”) outstanding. The Notes are unsecured obligations of the Company and, upon liquidation, dissolution or winding up of the Company, will rank: (1) senior to all of the Company’s outstanding preferred stock; (2) senior to all of the Company’s outstanding common stock; (3) on parity with any unsecured creditors of the Company and any unsecured senior securities representing indebtedness of the Company and (4) junior to any secured creditors of the Company. Holders of the Notes are entitled to receive cash interest payments each quarter at a fixed annual rate until maturity.
The Notes are redeemable in certain circumstances at the option of the Company. The Notes are also subject to a mandatory redemption if the Company fails to meet asset coverage ratios required under the 1940 Act or the rating agency guidelines if such failure is not waived or cured. At May 31, 2009, the Company was in compliance with asset coverage covenants and basic maintenance covenants for its senior notes.
Estimated fair value of the Series B Notes was calculated using the spread between the AAA corporate finance debt rate and the U.S. Treasury rate with an equivalent maturity date plus the average spread between the fixed rate of the Notes and the AAA corporate finance debt rate. At May 31, 2009, the total spread was applied to the equivalent U.S. Treasury rate for the series and future cash flows were discounted to determine the estimated fair value. The table below shows the issue date, maturity date, notional/carrying amount, estimated fair value and fixed rate as of May 31, 2009.
| Notional/ | ||||||||||
| Issue | Maturity | Carrying | Estimated | Fixed | ||||||
| Series | Date | Date | Amount | Fair Value | Rate | |||||
| Series B | June 17, 2008 | June 17, 2011 | $15,000,000 | $15,776,883 | 5.56% |
12. Preferred Stock
At November 30, 2008, the Company had 800 authorized shares of Money Market Preferred (“MMP”) Stock and 400 shares outstanding with a total liquidation value of $10,000,000. On December 3, 2008 and December 26, 2008, the Company redeemed the MMP Stock with a liquidation value of $7,225,000 and $2,775,000, respectively. The Company realized a gain of $1,300,500 upon redemption. Following these redemptions, the Company had no MMP Stock outstanding. The weighted average distribution rate for the period the MMP Stock was outstanding during the period ended May 31, 2009, was 2.90 percent. This rate does not include commissions paid to the auction agent, which are included in agent fees in the accompanying Statement of Operations.
13. Forward Foreign Currency Contracts
The Company entered into forward foreign currency contracts with U.S. Bank, N.A. to protect the value of income received from investments denominated in foreign currency against changes in foreign exchange rates. At May 31, 2009, there were no forward foreign currency contracts outstanding.
The table below shows the original maturity date, forward currency amounts to be purchased or sold and the realized gains on the termination of the forward foreign currency contracts for the period ended May 31, 2009.
| Realized | |||||||||||
| Maturity | Currency To | Currency To | Gain On | ||||||||
| Date | Receive | Deliver | Termination | ||||||||
| 05/21/09 | USD | 994,695 | CAD | 1,125,000 | $ | 80,694 | |||||
| 08/21/09 | USD | 994,695 | CAD | 1,125,000 | 77,872 | ||||||
| 11/20/09 | USD | 994,695 | CAD | 1,125,000 | 74,002 | ||||||
| 02/19/10 | USD | 994,695 | CAD | 1,125,000 | 70,531 | ||||||
| 05/21/10 | USD | 994,695 | CAD | 1,125,000 | 67,819 | ||||||
| 08/20/10 | USD | 994,695 | CAD | 1,125,000 | 65,859 | ||||||
| 11/19/10 | USD | 994,695 | CAD | 1,125,000 | 64,284 | ||||||
| 02/21/11 | USD | 994,695 | CAD | 1,125,000 | 62,357 | ||||||
| $ | 563,418 | ||||||||||
CAD — Canadian Dollar
USD — U.S. Dollar
14. Subsequent Events
On June 1, 2009, the Company paid a distribution in the amount of $0.37 per common share, for a total of $1,706,677. Of this total, the dividend reinvestment amounted to $180,132.
On June 19, 2009, the Company entered into an amendment to its credit facility that extends the facility through June 20, 2010. The terms of the extension provide for an unsecured revolving credit facility of $10,000,000. During the extension, outstanding balances will accrue interest at a variable rate equal to one-month LIBOR plus 2.00 percent and unused portions of the credit facility will accrue a non-usage fee equal to an annual rate of 0.25 percent.
2009 2nd Quarter Report 15
Additional Information (Unaudited)
Stockholder Proxy Voting Results
The annual meeting of stockholders was held on May 22, 2009. The matters considered at the meeting, together with the actual vote tabulations relating to such matters are as follows:
1. To elect two directors of the Company, to hold office for a term of three years and until their successors are duly elected and qualified.
| No. of Shares | |
| Charles E. Heath | |
| Affirmative | 4,014,350 |
| Withheld | 222,369 |
| TOTAL | 4,236,719 |
| No. of Shares | |
| Terry C. Matlack | |
| Affirmative | 4,013,572 |
| Withheld | 223,147 |
| TOTAL | 4,236,719 |
H. Kevin Birzer and John R. Graham continued as directors and their terms expire on the date of the 2010 annual meeting of stockholders, and Conrad S. Ciccotello continued as a director and his term expires on the date of the 2011 annual meeting of stockholders.
2. To approve a proposal to authorize flexibility to the Company to sell its common shares for less than net asset value, subject to certain conditions.
| Vote of Common Stockholders | No. of |
| of Record (24 Stockholders of | Recordholders |
| Record as of Record Date) | Voting |
| Affirmative | 15 |
| Against | 2 |
| Abstain | 2 |
| Broker Non-votes | 0 |
| TOTAL | 19 |
| Vote of Stockholders | No. of Shares |
| Affirmative | 1,076,528 |
| Against | 307,200 |
| Abstain | 38,663 |
| Broker Non-votes | 2,814,328 |
| TOTAL | 4,236,719 |
3. To ratify the selection of Ernst & Young LLP as the independent registered public accounting firm of the Company for its fiscal year ending November 30, 2009.
| No. of Shares | |
| Affirmative | 4,169,995 |
| Against | 47,769 |
| Abstain | 18,955 |
| TOTAL | 4,236,719 |
Based upon votes required for approval, each of these matters passed.
Director and Officer Compensation
The Company does not compensate any of its directors who are “interested persons,” as defined in Section 2(a)(19) of the 1940 Act, nor any of its officers. For the period ended May 31, 2009, the aggregate compensation paid by the Company to the independent directors was $37,000. The Company did not pay any special compensation to any of its directors or officers.
Forward-Looking Statements
This report contains “forward-looking statements” within the meaning of the Securities Act of 1933 and the Securities Exchange Act of 1934. By their nature, all forward-looking statements involve risks and uncertainties, and actual results could differ materially from those contemplated by the forward-looking statements. Several factors that could materially affect the Company’s actual results are the performance of the portfolio of stocks held by it, the conditions in the U.S. and international financial, petroleum and other markets, the price at which shares of the Company will trade in the public markets and other factors discussed in filings with the SEC.
Proxy Voting Policies
A description of the policies and procedures that the Company uses to determine how to vote proxies relating to portfolio securities owned by the Company and information regarding how the Company voted proxies relating to the portfolio of securities during the 12-month period ended June 30, 2008 is available to stockholders (i) without charge, upon request by calling the Company at (913) 981-1020 or toll-free at (866) 362-9331 and on the Company’s Web site at www.tortoiseadvisors.com; and (ii) on the SEC’s Web site at www.sec.gov.
Form N-Q
The Company files its complete schedule of portfolio holdings for the first and third quarters of each fiscal year with the SEC on Form N-Q. The Company’s Form N-Q is available without charge upon request by calling the Company at (866) 362-9331 or by visiting the SEC’s Web site at www.sec.gov. In addition, you may review and copy the Company’s Form N-Q at the SEC’s Public Reference Room in Washington, D.C. You may obtain information on the operation of the Public Reference Room by calling (800) SEC-0330.
The Company’s Form N-Qs are also available on the Company’s Web site at www.tortoiseadvisors.com.
Statement of Additional Information
The Statement of Additional Information (“SAI”) includes additional information about the Company’s directors and is available upon request without charge by calling the Company at (866) 362-9331 or by visiting the SEC’s Web site at www.sec.gov.
Certifications
The Company’s Chief Executive Officer submitted to the New York Stock Exchange in 2009 the annual CEO certification as required by Section 303A.12(a) of the NYSE Listed Company Manual.
The Company has filed with the SEC, as an exhibit to its most recently filed Form N-CSR, the certification of its Chief Executive Officer and Chief Financial Officer required by Section 302 of the Sarbanes-Oxley Act.
Privacy Policy
In order to conduct its business, the Company collects and maintains certain nonpublic personal information about its stockholders of record with respect to their transactions in shares of the Company’s securities. This information includes the stockholder’s address, tax identification or Social Security number, share balances, and dividend elections. We do not collect or maintain personal information about stockholders whose share balances of our securities are held in “street name” by a financial institution such as a bank or broker.
We do not disclose any nonpublic personal information about you, the Company’s other stockholders or the Company’s former stockholders to third parties unless necessary to process a transaction, service an account, or as otherwise permitted by law.
To protect your personal information internally, we restrict access to nonpublic personal information about the Company’s stockholders to those employees who need to know that information to provide services to our stockholders. We also maintain certain other safeguards to protect your nonpublic personal information.
16 Tortoise North American Energy Corp.
Office of the Company and Managing Directors of Board of Directors of H. Kevin Birzer, Chairman Terry Matlack Conrad S. Ciccotello John R. Graham Charles E. Heath | ADMINISTRATOR CUSTODIAN TRANSFER, DIVIDEND DISBURSING LEGAL COUNSEL INVESTOR RELATIONS STOCK SYMBOL This report is for stockholder information. This is not a prospectus intended for use in the purchase or sale of fund shares. Past performance is no guarantee of future results and your investment may be worth more or less at the time you sell. |
| Tortoise Capital Advisors’ Public Investment Companies | ||||
| Total Assets | ||||
| Ticker/ | Primary Target | Investor | as of 6/30/09 | |
| Name | Inception Date | Investments | Suitability | ($ in millions) |
| Tortoise North American Energy Corp. | TYN | U.S. Energy Infrastructure | Retirement Accounts | $91 |
| Oct. 2005 | Pension Plans | |||
| Taxable Accounts | ||||
| Tortoise Energy Infrastructure Corp. | TYG | U.S. Energy Infrastructure | Retirement Accounts | $834 |
| Feb. 2004 | Pension Plans | |||
| Taxable Accounts | ||||
| Tortoise Energy Capital Corp. | TYY | U.S. Energy Infrastructure | Retirement Accounts | $485 |
| May 2005 | Pension Plans | |||
| Taxable Accounts | ||||
| Tortoise Capital Resources Corp. | TTO | U.S. Energy Infrastructure | Retirement Accounts | $101 |
| Dec. 2005 | Private and Micro Cap | Pension Plans | (as of 5/31/09) | |
| (Feb. 2007 – IPO) | Public Companies | Taxable Accounts | ||

Item 2. Code of Ethics.
Not applicable for semi-annual reports.
Item 3. Audit Committee Financial Expert.
Not applicable for semi-annual reports.
Item 4. Principal Accountant Fees and Services.
Not applicable for semi-annual reports.
Item 5. Audit Committee of Listed Registrants.
Not applicable for semi-annual reports.
Item 6. Schedule of Investments.
Schedule of Investments is included as part of the report to shareholders filed under Item 1.
Item 7. Disclosure of Proxy Voting Policies and Procedures for Closed-End Management Investment Companies.
Not applicable for semi-annual reports.
Item 8. Portfolio Managers of Closed-End Management Investment Companies.
There have been no changes in the portfolio managers identified in response to this Item in the Registrant’s most recent annual report on Form N-CSR.
Item 9. Purchases of Equity Securities by Closed-End Management Investment Company and Affiliated Purchasers.
| Period | (a) Total Number of Shares (or Units) Purchased | (b) Average Price Paid per Share (or Unit) | (c) Total Number of Shares (or Units) Purchased as Part of Publicly Announced Plans or Programs | (d) Maximum Number (or Approximate Dollar Value) of Shares (or Units) that May Yet Be Purchased Under the Plans or Programs |
| Month #1 | 0 | 0 | 0 | 0 |
| 12/1/08-12/31/08 | ||||
| Month #2 | 0 | 0 | 0 | 0 |
| 1/1/09-1/31/09 | ||||
| Month #3 | 0 | 0 | 0 | 0 |
| 2/1/09-2/28/09 | ||||
| Month #4 | 0 | 0 | 0 | 0 |
| 3/1/09-3/31/09 | ||||
| Month #5 | 0 | 0 | 0 | 0 |
| 4/1/09-4/30/09 | ||||
| Month #6 | 0 | 0 | 0 | 0 |
| 5/1/09-5/31/09 | ||||
| Total | 0 | 0 | 0 | 0 |
Item 10. Submission of Matters to a Vote of Security Holders.
None.
Item 11. Controls and Procedures.
(a) The Registrant’s Chief Executive Officer and its Chief Financial Officer have concluded that the Registrant's disclosure controls and procedures (as defined in Rule 30a-3(c) under the Investment Company Act of 1940 (the “1940 Act”)) are effective as of a date within 90 days of the filing date of this report, based on the evaluation of these controls and procedures required by Rule 30a-3(b) under the 1940 Act and Rules 13a-15(b) or 15d-15(b) under the Securities Exchange Act of 1934, as amended.
(b) There were no changes in the Registrant’s internal controls over financial reporting (as defined in Rule 30a-3(d) under 1940 Act) that occurred during the Registrant’s second fiscal quarter of the period covered by this report that have materially affected, or are reasonably likely to materially affect, the Registrant’s internal control over financial reporting.
Item 12. Exhibits.
(a)(1) Any code of ethics or amendment thereto, that is the subject of the disclosure required by Item 2, to the extent that the Registrant intends to satisfy Item 2 requirements through filing of an exhibit. Not applicable.
(2) Certifications pursuant to Section 302 of the Sarbanes-Oxley Act of 2002. Filed herewith.
(3) Any written solicitation to purchase securities under Rule 23c-1 under the Act sent or given during the period covered by the report by or on behalf of the Registrant to 10 or more persons. None.
(b) Certification pursuant to Section 906 of the Sarbanes-Oxley Act of 2002. Furnished herewith.
SIGNATURES
Pursuant to the requirements of the Securities Exchange Act of 1934 and the Investment Company Act of 1940, the Registrant has duly caused this report to be signed on its behalf by the undersigned, thereunto duly authorized.
| (Registrant) | Tortoise North American Energy Corporation | |
| By (Signature and Title) | /s/ David J. Schulte | |
| David J. Schulte, Chief Executive Officer | ||
Date: July 16, 2009
Pursuant to the requirements of the Securities Exchange Act of 1934 and the Investment Company Act of 1940, this report has been signed below by the following persons on behalf of the Registrant and in the capacities and on the dates indicated.
| By (Signature and Title) | /s/ David J. Schulte | |
| David J. Schulte, Chief Executive Officer | ||
| Date: July 16, 2009 | ||
| By (Signature and Title) | /s/ Terry Matlack | |
| Terry Matlack, Chief Financial Officer | ||
| Date: July 16, 2009 |