UNITED STATES
SECURITIES AND EXCHANGE COMMISSION
Washington, D.C. 20549
FORM N-CSR
CERTIFIED SHAREHOLDER REPORT OF REGISTERED
MANAGEMENT INVESTMENT COMPANIES
Investment Company Act file number 811-21700
Tortoise North American Energy Corporation
(Exact name of registrant as specified in charter)
11550 Ash Street, Suite 300, Leawood, KS 66211
(Address of principal executive offices) (Zip code)
Terry Matlack
Diane Bono
11550 Ash Street, Suite 300, Leawood, KS 66211
(Name and address of agent for service)
913-981-1020
Registrant's telephone number, including area code
Date of fiscal year end: November 30
Date of reporting period: May 31, 2014
Item 1. Reports to Stockholders.
Tortoise North American Energy Corp. (NYSE: TYN) is a non-diversified closed-end investment company focused primarily on investing in equity securities of companies in the energy sector with their primary operations in North America, including oil and gas exploitation, energy infrastructure and energy shipping companies. Our investments are primarily in Master Limited Partnerships (MLPs) and their affiliates, but may also include Canadian royalty and income trusts, common stock, debt and other securities issued by energy companies that are not MLPs.
Investment Goals: Yield, Growth and Quality
TYN seeks a high level of total return with an emphasis on current distributions paid to stockholders.
In seeking to achieve yield, we target distributions to our stockholders that are roughly equal to the underlying yield on a direct investment in MLPs. In order to accomplish this, we maintain our strategy of investing primarily in companies in the energy sector with attractive current yields and growth potential.
We seek to achieve distribution growth as revenues of our underlying companies grow with the economy, with the population and through rate increases. This revenue growth generally leads to increased operating profits, and when combined with internal expansion projects and acquisitions, is expected to provide attractive growth in distributions to us.
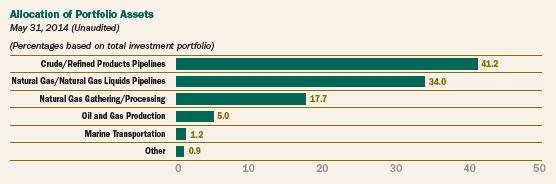
TYN seeks to achieve quality by investing in companies operating energy infrastructure assets that are critical to the North American economy. Often these assets would be difficult to replicate. We also back experienced management teams with successful track records. By investing in TYN, our stockholders have access to a portfolio that is diversified through geographic regions and across product lines, including natural gas, natural gas liquids, crude oil and refined products.
About U.S. Energy Infrastructure Master Limited Partnerships (MLPs)
MLPs are limited partnerships whose units trade on public exchanges such as the New York Stock Exchange (NYSE), the NYSE Alternext US and the NASDAQ. Buying MLP units makes an investor a limited partner in the MLP. There are currently more than 100 MLPs in the market in industries related to energy and natural resources. We invest primarily in MLPs in the energy infrastructure sector. Energy infrastructure MLPs are engaged in the transportation, storage and processing of crude oil, natural gas and refined products from production points to the end users.
TYN Investment Features
We provide stockholders an alternative to investing directly in MLPs and their affiliates. We offer investors the opportunity to receive an attractive distribution return with a historically low return correlation to returns on stocks and bonds.
Additional features include:
- One Form 1099 per stockholder at the end of the year, multiple K-1s and multiple state filings for individual partnership investments;
- A professional management team, with more than 130 years combined investment experience;
- The ability to access investment grade credit markets to enhance stockholder return; and
- Access to direct placements and other investments not available through the public market.
June 23, 2014
Dear Fellow Stockholders,
The second fiscal quarter ending May 31, 2014 was positive for MLPs, whose success continued to be driven by the robust oil and natural gas production that is creating the critical need for energy infrastructure build-out. Their performance was further enhanced by an upbeat earnings season and an uptick in pipeline reversal projects, particularly in the pipeline-constrained Marcellus shale in Pennsylvania where takeaway needs are acute.
With respect to the broad market, equities demonstrated some volatility as the second fiscal quarter unfolded, although strength among blue chips and stronger-than-expected first-quarter earnings reports from nearly three-quarters of the companies in the S&P 500 Index® helped maintain a generally upward trajectory. For the three and six months ending May 31, 2014, the S&P 500 Index® returned 4.0 and 7.6 percent respectively, with energy, utilities, consumer staples and materials emerging as the best-performing sectors.
Master Limited Partnership Sector Review and Outlook
MLPs handily outperformed the broader market, with the Tortoise MLP Index® posting 10.2 and 13.5 percent total returns for the three- and six-month periods through May 31, 2014. Midstream MLPs outperformed upstream MLPs by a wide margin, as upstream MLPs dealt with a weaker earnings season. The Tortoise Midstream MLP Index returned 10.8 and 14.0 percent for the three and six months, respectively, compared to the Tortoise Upstream MLP Index’s 1.5 and 6.8 percent returns for the same periods, respectively.
Strong oil and natural gas production growth out of premier North American shales is driving the need for new infrastructure, and midstream MLPs are responding. While infrastructure build-out continues for both crude oil and natural gas liquids pipelines, there has been an increase in natural gas pipelines activity, especially around the gas-rich Marcellus. We also are seeing investments to enable gas pipelines to reverse the direction they transport gas. As the sources of oil and gas have shifted, some pipelines are adding bi-directional capability and reversing flow, reflecting how domestic production growth is reducing our reliance on imported energy and changing the way it moves around our country.
Capital markets continued to underpin sector growth, with MLPs raising approximately $14.6 billion in equity and $14.1 billion in debt offerings during the second fiscal quarter, bringing the totals for debt and equity raised during the first half of the fiscal year to approximately $19.6 billion and $20.7 billion respectively, including three new initial public offerings in the second quarter. Merger and acquisition activity has remained healthy, with approximately $14.7 billion in MLP transactions announced thus far in 2014. The largest of these was Kinder Morgan’s dropdown of natural gas assets to El Paso Pipeline Partners, LP in a deal valued at approximately $2 billion. As part of the deal, El Paso will acquire a 50 percent interest in Ruby Pipeline and Gulf LNG and a 47.5 percent interest in Young Gas Storage.
Fund Performance Review
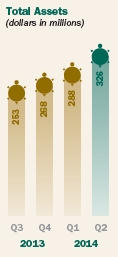
The fund’s total assets increased from approximately $287.9 million on Feb. 28, 2014 to $325.9 on May 31, 2014, primarily from net realized and unrealized gains on investments, as well as approximately $8.4 million in new leverage proceeds. Leverage (bank debt) as a percent of total assets increased slightly to close the quarter at 18.3 percent.
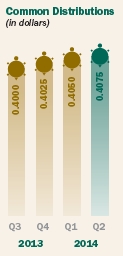
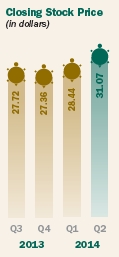
At fiscal quarter end, the fund paid a distribution of $0.4075 per common share ($1.63 annualized) to stockholders, an increase of 0.6 percent quarter over quarter and 2.5 percent year over year. This distribution represented an annualized distribution rate of 5.2 percent based on the fund’s fiscal quarter closing price of $31.07. In managing the fund, Tortoise places particular emphasis on distribution coverage: distributable cash flow (DCF) earned by the fund divided by distributions paid to stockholders. Our goal is to declare what we believe to be sustainable quarterly distributions with increases safely covered by earned distributable cash flow. The distribution payout coverage was 106.2 percent for the fiscal quarter and 107.9 percent for the last four quarters.
(Unaudited)
2014 2nd Quarter Report 1
For the fiscal quarter, the fund’s market-based total return was 10.7 percent and its NAV-based total return was 11.1 percent (16.6 and 14.9 percent for the six months, respectively) including the reinvestment of distributions. The difference between the market value total return and the NAV total return reflected a slight widening of the discount of the fund’s stock price relative to its NAV during the quarter. This was the case for many closed-end funds as they came under pressure due to concerns over rising interest rates.
Key Quarterly Performance Drivers
- The pace of pipeline infrastructure expansion projects to support the robust oil and natural gas production out of North American shales continued to accelerate, driving the fund’s strong asset performance during the fiscal quarter.
- The fund benefited on both an absolute and relative basis from its investments in crude oil pipeline MLPs whose success was driven by increasing volumes, particularly those linking to refineries along the Gulf Coast, and refined product MLPs as they continued to benefit from strong fundamentals and expected dropdown acquisitions.
- An underweight exposure to and better selection among oil and gas production MLPs also helped in both absolute and relative terms.
- Certain non-midstream MLPs the fund did not hold, given its midstream investment strategy, had strong performance during the quarter. This restrained performance slightly during the period.
Additional information about the fund’s financial performance, distributions and leverage is available in the Key Financial Data and Management’s Discussion sections of this report.
Concluding Thoughts
We believe the prolific volumes of oil and natural gas being produced in the premier basins will continue to drive the need for new pipelines to remove bottlenecks and transport these valuable resources from areas of new and growing production to end users.
In closing, we invite you to visit Tortoise’s new educational microsite, www.uncoverenergy.com, which provides articles covering 10 themes that trace North America’s energy past, present and future. We created this site as part of our commitment to promote education and knowledge about the energy sector. It is designed to be a resource for the investment community, educators and the general public. As always, we welcome your feedback and suggestions. Also, if you haven’t had a chance to view our May webcast of the annual stockholders meeting, we encourage you to do so.
Sincerely,
The Managing Directors
Tortoise Capital Advisors, L.L.C.
The adviser to Tortoise North American Energy Corp.
The Tortoise MLP Index® is a float-adjusted, capitalization-weighted index of energy master limited partnerships (MLPs). The Tortoise Midstream MLP Index, a sub-index of the Tortoise MLP Index®, is comprised of all constituents included in the following sub sectors: Crude Oil Pipelines, Gathering & Processing, Natural Gas Pipelines and Refined Products Pipelines. The Tortoise Upstream MLP Index is comprised of all constituents included in the Tortoise MLP Index’s Coal and Oil & Gas Production sub sector indices. The S&P 500 Index® is a unmanaged market-value-weighted index of stocks, which is widely regarded as the standard for measuring large-cap U.S. stock market performance.
(Unaudited)
2 Tortoise North American Energy Corp.
Key Financial Data (Supplemental Unaudited Information) (dollar amounts in thousands unless otherwise indicated) |
The information presented below regarding Distributable Cash Flow and Selected Financial Information is supplemental non-GAAP financial information, which we believe is meaningful to understanding our operating performance. The Distributable Cash Flow Ratios include the functional equivalent of EBITDA for non-investment companies, and we believe they are an important supplemental measure of performance and promote comparisons from period-to-period. This information is supplemental, is not inclusive of required financial disclosures (e.g. Total Expense Ratio), and should be read in conjunction with our full financial statements.
| 2013 | 2014 | |||||||||||||||||||
| Q2(1) | Q3(1) | Q4(1) | Q1(1) | Q2(1) | ||||||||||||||||
| Total Income from Investments | ||||||||||||||||||||
| Distributions from master limited partnerships | $ | 3,423 | $ | 3,352 | $ | 3,530 | $ | 3,501 | $ | 3,650 | ||||||||||
| Dividends paid in stock | 205 | 211 | 219 | 225 | 178 | |||||||||||||||
| Dividends from common stock | 63 | 65 | 61 | 63 | 68 | |||||||||||||||
| Other income | — | — | 13 | — | — | |||||||||||||||
| Total from investments | 3,691 | 3,628 | 3,823 | 3,789 | 3,896 | |||||||||||||||
| Operating Expenses Before Leverage Costs and Current Taxes | ||||||||||||||||||||
| Advisory fees, net of fees waived | 640 | 649 | 645 | 681 | 763 | |||||||||||||||
| Other operating expenses | 123 | 121 | 119 | 136 | 145 | |||||||||||||||
| 763 | 770 | 764 | 817 | 908 | ||||||||||||||||
| Distributable cash flow before leverage costs and current taxes | 2,928 | 2,858 | 3,059 | 2,972 | 2,988 | |||||||||||||||
| Leverage costs(2) | 193 | 192 | 192 | 232 | 253 | |||||||||||||||
| Current income tax expense(3) | — | — | — | — | — | |||||||||||||||
| Distributable Cash Flow(4) | $ | 2,735 | $ | 2,666 | $ | 2,867 | $ | 2,740 | $ | 2,735 | ||||||||||
| As a percent of average total assets(5) | ||||||||||||||||||||
| Total from investments | 5.77 | % | 5.59 | % | 5.87 | % | 5.46 | % | 5.08 | % | ||||||||||
| Operating expenses before leverage costs and current taxes | 1.19 | % | 1.19 | % | 1.17 | % | 1.18 | % | 1.18 | % | ||||||||||
| Distributable cash flow before leverage costs and current taxes | 4.58 | % | 4.40 | % | 4.70 | % | 4.28 | % | 3.90 | % | ||||||||||
| As a percent of average net assets(5) | ||||||||||||||||||||
| Total from investments | 8.19 | % | 8.01 | % | 8.50 | % | 8.37 | % | 7.88 | % | ||||||||||
| Operating expenses before leverage costs and current taxes | 1.69 | % | 1.70 | % | 1.70 | % | 1.80 | % | 1.84 | % | ||||||||||
| Leverage costs and current taxes | 0.43 | % | 0.42 | % | 0.43 | % | 0.51 | % | 0.51 | % | ||||||||||
| Distributable cash flow | 6.07 | % | 5.89 | % | 6.37 | % | 6.06 | % | 5.53 | % | ||||||||||
| Selected Financial Information | ||||||||||||||||||||
| Distributions paid on common stock | $ | 2,507 | $ | 2,524 | $ | 2,542 | $ | 2,558 | $ | 2,574 | ||||||||||
| Distributions paid on common stock per share | 0.3975 | 0.4000 | 0.4025 | 0.4050 | 0.4075 | |||||||||||||||
| Distribution coverage percentage for period(6) | 109.1 | % | 105.6 | % | 112.8 | % | 107.1 | % | 106.2 | % | ||||||||||
| Net realized gain, net of income taxes, for the period | 6,156 | 2,661 | 2,402 | 1,925 | 2,138 | |||||||||||||||
| Total assets, end of period | 252,597 | 253,294 | 267,518 | 287,918 | 325,917 | |||||||||||||||
| Average total assets during period(7) | 253,747 | 257,322 | 261,286 | 281,315 | 304,100 | |||||||||||||||
| Leverage(8) | 32,900 | 32,900 | 38,600 | 51,400 | 59,800 | |||||||||||||||
| Leverage as a percent of total assets | 13.0 | % | 13.0 | % | 14.4 | % | 17.9 | % | 18.3 | % | ||||||||||
| Net unrealized appreciation, end of period | 71,249 | 72,694 | 78,978 | 83,742 | 103,144 | |||||||||||||||
| Net assets, end of period | 175,468 | 176,768 | 182,746 | 186,476 | 204,525 | |||||||||||||||
| Average net assets during period(9) | 178,907 | 179,673 | 180,367 | 183,687 | 196,127 | |||||||||||||||
| Net asset value per common share | 27.82 | 28.01 | 28.93 | 29.52 | 32.38 | |||||||||||||||
| Market value per common share | 31.18 | 27.72 | 27.36 | 28.44 | 31.07 | |||||||||||||||
| Shares outstanding (000’s) | 6,306 | 6,311 | 6,316 | 6,316 | 6,316 | |||||||||||||||
| (1) | Q1 is the period from December through February. Q2 is the period from March through May. Q3 is the period from June through August. Q4 is the period from September through November. |
| (2) | Leverage costs include interest expense, interest rate swap expenses and other recurring leverage expenses. |
| (3) | Includes taxes paid on net investment income and foreign taxes, if any. Taxes related to realized gains are excluded from the calculation of Distributable Cash Flow (“DCF”). |
| (4) | “Net investment income (loss), before income taxes” on the Statement of Operations is adjusted as follows to reconcile to DCF: increased by the return of capital on distributions, the value of paid-in-kind distributions and non-recurring merger expenses; and decreased by realized and unrealized gains (losses) on interest rate swap settlements. |
| (5) | Annualized for periods less than one full year. |
| (6) | Distributable Cash Flow divided by distributions paid. |
| (7) | Computed by averaging month-end values within each period. |
| (8) | Leverage consists of short-term borrowings. |
| (9) | Computed by averaging daily net assets within each period. |
2014 2nd Quarter Report 3
Management’s Discussion (Unaudited) |
The information contained in this section should be read in conjunction with our Financial Statements and the Notes thereto. In addition, this report contains certain forward-looking statements. These statements include the plans and objectives of management for future operations and financial objectives and can be identified by the use of forward-looking terminology such as “may,” “will,” “expect,” “intend,” “anticipate,” “estimate,” or “continue” or the negative thereof or other variations thereon or comparable terminology. These forward-looking statements are subject to the inherent uncertainties in predicting future results and conditions. Certain factors that could cause actual results and conditions to differ materially from those projected in these forward-looking statements are set forth in the “Risk Factors” section of our public filings with the SEC.
Overview
Tortoise North American Energy Corp.’s (“TYN” or the “Company”) primary investment objective is to seek a high level of total return for our stockholders, with an emphasis on distribution income paid to stockholders. Our investment strategy requires us to invest at least 80 percent of our total assets in equity securities of companies in the energy sector with their primary operations in North America, including energy infrastructure, oil and gas production and energy shipping companies. The equity securities of the energy companies purchased by TYN consist primarily of interests in master limited partnerships (“MLPs”). MLPs are publicly traded partnerships whose equity interests are traded in the form of units on public exchanges, such as the NYSE or NASDAQ. We invest primarily in MLPs through public market and private purchases. While we are a registered investment company under the Investment Company Act of 1940, as amended (the “1940 Act”), we are not a “regulated investment company” for federal tax purposes. Our distributions do not typically generate unrelated business taxable income (“UBTI”) and our stock may therefore be suitable for holding by pension funds, IRAs and mutual funds, as well as taxable accounts. Tortoise Capital Advisors, L.L.C. serves as our investment adviser.
Company Update
On May 28, 2014, the stockholders of the Company and Tortoise Energy Infrastructure Corporation (“TYG”) each approved the proposed merger of the Company with and into TYG. As part of the merger, TYG acquired the net assets of the Company in the amount of $210,449,285 on June 23, 2014 and a total of 6,316,079 shares of common stock of the Company were exchanged for 4,130,451 shares of common stock of TYG.
Total assets increased approximately $38 million during the 2nd quarter, primarily as a result of increased market values of our investments as well as increased leverage utilization. Distribution increases from our investments were in-line with our expectations. Asset-based expenses increased from the previous quarter as a result of increased average managed assets. Total leverage as a percent of total assets increased during the quarter and we increased our quarterly distribution to $0.4075 per share. Additional information on these events and results of our operations are discussed in more detail below.
Critical Accounting Policies
The financial statements are based on the selection and application of critical accounting policies, which require management to make significant estimates and assumptions. Critical accounting policies are those that are both important to the presentation of our financial condition and results of operations and require management’s most difficult, complex, or subjective judgments. Our critical accounting policies are those applicable to the valuation of investments, tax matters and certain revenue recognition matters as discussed in Note 2 in the Notes to Financial Statements.
Determining Distributions to Stockholders
Our portfolio generates cash flow from which we pay distributions to stockholders. Our Board of Directors has adopted a policy of declaring what it believes to be sustainable distributions. In determining distributions, our Board of Directors considers a number of current and anticipated factors, including, among others, distributable cash flow (“DCF”), realized and unrealized gains, leverage amounts and rates, current and deferred taxes payable, and potential volatility in returns from our investments and the overall market. While the Board considers many factors in determining distributions to stockholders, particular emphasis is given to DCF and distribution coverage. Distribution coverage is DCF divided by distributions paid to stockholders and is discussed in more detail below. Over the long term, we expect to distribute substantially all of our DCF to holders of common stock. Our Board of Directors reviews the distribution rate quarterly and may adjust the quarterly distribution throughout the year.
Determining DCF
DCF is distributions received from investments, less expenses. The total distributions received from our investments include the amount received by us as cash distributions from MLPs and common stock, paid-in-kind distributions, and dividend and interest payments. The total expenses include current or anticipated operating expenses, leverage costs and current income taxes. Current income taxes include taxes paid on our net investment income in addition to foreign taxes, if any. Taxes incurred from realized gains on the sale of investments, expected tax benefits and deferred taxes are not included in DCF.
The Key Financial Data table discloses the calculation of DCF and should be read in conjunction with this discussion. The difference between distributions received from investments in the DCF calculation and total investment income as reported in the Statement of Operations, is reconciled as follows: the Statement of Operations, in conformity with U.S. generally accepted accounting principles (“GAAP”), recognizes distribution income from MLPs and common stock on their ex-dates, whereas the DCF calculation may reflect distribution income on their pay dates; GAAP recognizes that a significant portion of the cash distributions received from MLPs are characterized as a return of capital and therefore excluded from investment income, whereas the DCF calculation includes
4 Tortoise North American Energy Corp.
Management’s Discussion (Unaudited) (Continued) |
the return of capital; and distributions received from investments in the DCF calculation include the value of dividends paid-in-kind (additional stock or MLP units), whereas such amounts are not included as income for GAAP purposes, and includes distributions related to direct investments when the purchase price is reduced in lieu of receiving cash distributions. The treatment of expenses in the DCF calculation also differs from what is reported in the Statement of Operations. In addition to the total operating expenses, including fee waiver, as disclosed in the Statement of Operations, the DCF calculation reflects interest expense, realized and unrealized gains (losses) on interest rate swap settlements, other leverage expenses, and taxes paid on net investment income. Non-recurring expenses related to the merger are excluded from DCF. A reconciliation of Net Investment Loss, before Income Taxes to DCF is included below.
Distributions Received from Investments
Our ability to generate cash is dependent on the ability of our portfolio of investments to generate cash flow from their operations. In order to maintain and grow distributions to our stockholders, we evaluate each holding based upon its contribution to our investment income, our anticipation of its growth rate, and its risk relative to other potential investments.
We concentrate on investments we believe can expect an increasing demand for services from economic and population growth. We seek well-managed businesses with hard assets and stable recurring revenue streams.
Total distributions received from our investments for the 2nd quarter 2014 were approximately $3.9 million, an increase of 2.8 percent as compared to 1st quarter 2014 and an increase of 5.6 percent as compared to 2nd quarter 2013. These changes reflect increases in per share distribution rates on our investments, the distributions received from additional investments funded from leverage proceeds and the impact of various portfolio trading activity. In addition, one portfolio company changed the timing of its distribution payment which shifted approximately $41,700 of distributions to TYN from the 1st quarter 2014 to the 2nd quarter 2014.
Expenses
We incur two types of expenses: (1) operating expenses, consisting primarily of the advisory fee, and (2) leverage costs. On a percentage basis, operating expenses before leverage costs and current taxes were an annualized 1.18 percent of average total assets for the 2nd quarter 2014 as compared to 1.19 percent for the 2nd quarter 2013 and 1.18 percent for the 1st quarter 2014.
Advisory fees for the 2nd quarter 2014 increased approximately 12.0 percent as compared to 1st quarter 2014 as a result of increased average managed assets. Other operating expenses increased approximately $9,000 as compared to 1st quarter 2014, mainly due to increased professional fees and asset-based fees during the quarter.
Leverage costs consist of two major components: (1) the direct interest expense, which will vary from period to period as our margin borrowing facility has a variable interest rate, and (2) the realized and unrealized gain or loss on our interest rate swap settlements. Detailed information on our margin borrowing facility is included in the Liquidity and Capital Resources section below.
Total leverage costs for DCF purposes were approximately $253,000 for the 2nd quarter 2014, an increase of 9.1 percent as compared to the 1st quarter 2014 due to increased leverage utilization. Our average annualized total cost of leverage, including interest rate swaps, was 1.74 percent as of May 31, 2014.
As indicated in Note 9 of our Notes to Financial Statements, we have entered into $25 million notional amount of interest rate swap contracts with The Bank of Nova Scotia in an attempt to reduce a portion of the interest rate risk arising from our leveraged capital structure. TYN has agreed to pay The Bank of Nova Scotia a fixed rate while receiving a floating rate based upon the 1-month U.S. Dollar London Interbank Offered Rate (“LIBOR”). The spread between the fixed swap rate and LIBOR is reflected in our Statement of Operations as a realized or unrealized gain when LIBOR exceeds the fixed rate (The Bank of Nova Scotia pays TYN the net difference) or a realized or unrealized loss when the fixed rate exceeds LIBOR (TYN pays The Bank of Nova Scotia the net difference). The interest rate swap contracts have a weighted average fixed rate of 1.70 percent and weighted average remaining maturity of approximately 4.3 years at May 31, 2014. This swap arrangement effectively fixes the cost of approximately 42 percent of our outstanding leverage as of May 31, 2014 over the remaining swap period.
Interest accrues on the margin facility at a rate equal to 1-month LIBOR plus 0.925 percent and unused balances are subject to a fee of 0.25 percent. Additional information on our leverage is disclosed below in Liquidity and Capital Resources and in our Notes to Financial Statements.
Distributable Cash Flow
For 2nd quarter 2014, our DCF was approximately $2.7 million, unchanged as compared to 2nd quarter 2013 and a decrease of 0.2 percent as compared to 1st quarter 2014. The changes are the net result of changes to distributions and expenses as outlined above. We paid a distribution of $2.6 million, or $0.4075 per share, during the quarter. This represents an increase of $0.01 per share as compared to 2nd quarter 2013 and an increase of $0.0025 per share as compared to 1st quarter 2014.
Our distribution coverage ratio was 106.2 percent for 2nd quarter 2014, a decrease in the coverage ratio of 2.9 percent as compared to 2nd quarter 2013 and a decrease of 0.9 percent as compared to 1st quarter 2014.
2014 2nd Quarter Report 5
Management’s Discussion (Unaudited) (Continued) |
Net investment loss before income taxes on the Statement of Operations is adjusted as follows to reconcile to DCF for 2014 YTD and 2nd quarter 2014 (in thousands):
| 2014 YTD | 2nd Qtr 2014 | |||||||
| Net Investment Loss, before Income Taxes | $ | (2,050 | ) | $ | (1,426 | ) | ||
| Adjustments to reconcile to DCF: | ||||||||
| Dividends paid in stock | 403 | 178 | ||||||
| Distributions characterized as return of capital | 7,290 | 4,067 | ||||||
| Expenses related to fund merger | 26 | 14 | ||||||
| Interest rate swap expenses | (194 | ) | (98 | ) | ||||
| DCF | $ | 5,475 | $ | 2,735 | ||||
Liquidity and Capital Resources
We had total assets of approximately $326 million at quarter-end. Our total assets reflect the value of our investments, which are itemized in the Schedule of Investments. It also reflects cash, interest and receivables and any expenses that may have been prepaid. During 2nd quarter 2014, total assets increased by approximately $38 million. This change was primarily the result of a $30 million increase in the value of our investments as reflected by the change in realized and unrealized gains on investments (excluding return of capital on distributions) and net purchases of approximately $9 million during the quarter mainly funded with additional leverage utilization.
Total leverage outstanding at May 31, 2014 was $59.8 million, an increase of $8.4 million as compared to February 28, 2014. Total leverage represented 18.3 percent of total assets at May 31, 2014, an increase from 17.9 percent at February 28, 2014 and an increase from 13.0 percent at May 31, 2013.
We have used leverage to acquire securities consistent with our investment philosophy. The terms of our leverage are governed by regulatory and contractual asset coverage requirements that arise from the use of leverage. Additional information on our leverage and asset coverage requirements is discussed in Note 8 in the Notes to Financial Statements.
Taxation of our Distributions and Income Taxes
We invest in partnerships that generally have cash distributions in excess of their income for accounting and tax purposes. Accordingly, the distributions include a return of capital component for accounting and tax purposes. Distributions declared and paid by us in a year generally differ from taxable income for that year, as such distributions may include the distribution of current year taxable income or return of capital.
The taxability of the distribution you receive depends on whether we have annual earnings and profits (“E&P”). E&P is primarily comprised of the taxable income from MLPs with certain specified adjustments as reported on annual K-1s, fund operating expenses and net realized gains. If we have E&P, it is first allocated to preferred shares (if any) and then to the common shares.
In the event we have E&P allocated to our common shares, all or a portion of our distribution will be taxable at the Qualified Dividend Income (“QDI”) rate, assuming various holding requirements are met by the stockholder. The QDI rate is variable based on the taxpayer’s taxable income. The portion of our distribution that is taxable may vary for either of two reasons. First, the characterization of the distributions we receive from MLPs could change annually based upon the K-1 allocations and result in less return of capital and more in the form of income. Second, we could sell an MLP investment and realize a gain or loss at any time. It is for these reasons that we inform you of the tax treatment after the close of each year as the ultimate characterization of our distributions is undeterminable until the year is over.
E&P for 2013 exceeded total distributions to stockholders. As a result, for tax purposes, distributions to common stockholders for the year ended 2013 were 100 percent qualified dividend income. This information is reported to stockholders on Form 1099-DIV and is available on our Web site at www.tortoiseadvisors.com. For book purposes, the source of distributions to common stockholders for the year ended 2013 was 100 percent return of capital.
For the calendar year 2014, common stockholders will receive their final 1099 from TYN for the distributions received through the date of the merger; common stockholders will also receive a 1099 from TYG for distributions received after the merger. The tax character of distributions will be determined in January 2015.
The unrealized gain or loss we have in the portfolio is reflected in the Statement of Assets and Liabilities. At May 31, 2014, our investments are valued at $325.8 million, with an adjusted cost of $182.5 million. The $143.3 million difference reflects unrealized gain that would be realized for financial statement purposes if those investments were sold at those values. The Statement of Assets and Liabilities also reflects a net deferred tax liability primarily due to unrealized gains (losses) on investments. At May 31, 2014, the balance sheet reflects a net deferred tax liability of approximately $60.4 million or $9.57 per share. Accordingly, our net asset value per share represents the amount which would be available for distribution to stockholders after payment of taxes. Details of our taxes are disclosed in Note 5 in our Notes to Financial Statements.
6 Tortoise North American Energy Corp.
Schedule of Investments May 31, 2014 |
| (Unaudited) |
| Shares | Fair Value | |||||
| Master Limited Partnerships and | ||||||
| Related Companies — 157.0%(1) | ||||||
| Crude/Refined Products Pipelines — 65.6%(1) | ||||||
| United States — 65.6%(1) | ||||||
| Arc Logistics Partners LP | 135,700 | $ | 3,201,163 | |||
| Buckeye Partners, L.P.(2) | 226,168 | 17,745,141 | ||||
| Enbridge Energy Partners, L.P.(2) | 290,604 | 9,008,724 | ||||
| Genesis Energy L.P. | 21,706 | 1,237,242 | ||||
| Holly Energy Partners, L.P.(2) | 95,360 | 3,370,022 | ||||
| Magellan Midstream Partners, L.P.(2) | 301,400 | 24,678,632 | ||||
| MPLX LP | 86,500 | 4,944,340 | ||||
| NuStar Energy L.P.(2) | 86,900 | 5,041,938 | ||||
| Oiltanking Partners, L.P. | 35,123 | 3,129,459 | ||||
| PBF Logistics, L.P. | 225,000 | 6,018,750 | ||||
| Phillips 66 Partners LP | 40,200 | 2,434,110 | ||||
| Plains All American Pipeline, L.P.(2)(3) | 506,951 | 28,627,523 | ||||
| Rose Rock Midstream, L.P. | 19,042 | 826,994 | ||||
| Sunoco Logistics Partners L.P.(2) | 184,900 | 17,010,800 | ||||
| Tesoro Logistics L.P.(2) | 80,900 | 5,638,730 | ||||
| Valero Energy Partners LP | 30,653 | 1,361,913 | ||||
| 134,275,481 | ||||||
| Natural Gas/Natural Gas Liquids Pipelines — 54.2%(1) | ||||||
| United States — 54.2%(1) | ||||||
| Crestwood Midstream Partners, L.P. | 188,589 | 4,111,240 | ||||
| El Paso Pipeline Partners, L.P.(2) | 117,950 | 4,038,608 | ||||
| Energy Transfer Equity, L.P.(2) | 220,800 | 11,251,968 | ||||
| Energy Transfer Partners, L.P.(2) | 192,000 | 10,813,440 | ||||
| Enterprise Products Partners L.P.(2) | 293,700 | 21,974,634 | ||||
| EQT Midstream Partners, L.P. | 93,940 | 7,716,232 | ||||
| Kinder Morgan Energy Partners, L.P.(2) | 31,700 | 2,410,785 | ||||
| Kinder Morgan Management, L.L.C.(2)(4) | 131,209 | 9,456,218 | ||||
| ONEOK Partners, L.P.(2) | 221,140 | 12,184,814 | ||||
| Regency Energy Partners L.P.(2) | 338,298 | 9,404,684 | ||||
| Spectra Energy Partners, L.P.(2) | 161,500 | 8,470,675 | ||||
| Williams Partners L.P.(2) | 168,300 | 8,938,413 | ||||
| 110,771,711 | ||||||
| Natural Gas Gathering/Processing — 28.1%(1) | ||||||
| United States — 28.1%(1) | ||||||
| Access Midstream Partners, L.P.(2) | 203,808 | 12,837,866 | ||||
| DCP Midstream Partners, L.P.(2) | 136,600 | 7,336,786 | ||||
| EnLink Midstream Partners, L.P.(2) | 171,398 | 5,222,497 | ||||
| MarkWest Energy Partners, L.P.(2) | 139,890 | 8,666,186 | ||||
| Summit Midstream Partners, LP | 45,300 | 2,038,953 | ||||
| Targa Resources Partners L.P.(2) | 142,749 | 9,701,222 | ||||
| Western Gas Partners L.P.(2) | 162,518 | 11,699,671 | ||||
| 57,503,181 | ||||||
| Oil and Gas Production — 7.9%(1) | ||||||
| United States — 7.9%(1) | ||||||
| BreitBurn Energy Partners L.P.(2) | 253,800 | 5,441,472 | ||||
| Legacy Reserves, L.P.(2) | 191,300 | 5,624,220 | ||||
| Vanguard Natural Resources, LLC(2) | 168,800 | 5,185,536 | ||||
| 16,251,228 | ||||||
| Marine Transportation — 1.2%(1) | ||||||
| Republic of the Marshall Islands — 1.2%(1) | ||||||
| Teekay LNG Partners L.P.(2) | 53,500 | 2,370,050 | ||||
| Total Master Limited Partnerships and | ||||||
| Related Companies (Cost $179,320,186) | 321,171,651 | |||||
| Common Stock — 2.2%(1) | ||||||
| Marine Transportation — 0.7%(1) | ||||||
| Republic of the Marshall Islands — 0.7%(1) | ||||||
| Teekay Offshore Partners L.P.(2) | 42,400 | 1,512,408 | ||||
| Other — 1.5%(1) | ||||||
| Republic of the Marshall Islands — 1.5%(1) | ||||||
| Seadrill Partners LLC | 90,000 | 2,955,600 | ||||
| Total Common Stock (Cost $2,993,360) | 4,468,008 | |||||
| Short-Term Investment — 0.1%(1) | ||||||
| United States Investment Company — 0.1%(1) | ||||||
| Fidelity Institutional Money Market Portfolio — | ||||||
| Class I, 0.05%(5) (Cost $147,688) | 147,688 | 147,688 | ||||
| Total Investments — 159.3%(1) | ||||||
| (Cost $182,461,234) | 325,787,347 | |||||
| Interest Rate Swap Contracts — (0.2%)(1) | ||||||
| $25,000,000 notional — Unrealized Depreciation(6) | (493,991 | ) | ||||
| Other Assets and Liabilities — (59.1%)(1) | (120,767,954 | ) | ||||
| Total Net Assets Applicable to | ||||||
| Common Stockholders — 100.0%(1) | $ | 204,525,402 | ||||
| (1) | Calculated as a percentage of net assets applicable to common stockholders. |
| (2) | All or a portion of the security is segregated as collateral for the margin borrowing facility. See Note 8 to the financial statements for further disclosure. |
| (3) | All or a portion of the security is segregated as collateral for the unrealized depreciation of interest rate swap contracts of $493,991. |
| (4) | Security distributions are paid-in-kind. |
| (5) | Rate reported is the current yield as of May 31, 2014. |
| (6) | See Note 9 to the financial statements for further disclosure. |
See accompanying Notes to Financial Statements.
2014 2nd Quarter Report 7
Statement of Assets & Liabilities May 31, 2014 |
| (Unaudited) |
| Assets | ||||
| Investments at fair value (cost $182,461,234) | $ | 325,787,347 | ||
| Distributions receivable from master limited partnerships | 35,448 | |||
| Prepaid expenses and other assets | 94,493 | |||
| Total assets | 325,917,288 | |||
| Liabilities | ||||
| Payable to Adviser | 517,932 | |||
| Accrued expenses and other liabilities | 138,727 | |||
| Unrealized depreciation of interest rate swap contracts | 493,991 | |||
| Deferred tax liability | 60,441,236 | |||
| Short-term borrowings | 59,800,000 | |||
| �� Total liabilities | 121,391,886 | |||
| Net assets applicable to common stockholders | $ | 204,525,402 | ||
| Net Assets Applicable to Common Stockholders Consist of: | ||||
| Capital stock, $0.001 par value; 6,316,079 shares issued and | ||||
| outstanding (100,000,000 shares authorized) | $ | 6,316 | ||
| Additional paid-in capital | 82,332,609 | |||
| Accumulated net investment loss, net of income taxes | (5,168,527 | ) | ||
| Undistributed net realized gain, net of income taxes | 24,211,063 | |||
| Net unrealized appreciation of investments and | ||||
| interest rate swap contracts, net of income taxes | 103,143,941 | |||
| Net assets applicable to common stockholders | $ | 204,525,402 | ||
| Net Asset Value per common share outstanding | ||||
| (net assets applicable to common stock, | ||||
| divided by common shares outstanding) | $ | 32.38 | ||
| Statement of Operations Period from December 1, 2013 through May 31, 2014 |
| (Unaudited) |
| Investment Income | ||||
| Distributions from master limited partnerships | $ | 7,151,547 | ||
| Dividends from common stock | 131,381 | |||
| Less return of capital on distributions | (7,290,417 | ) | ||
| Net distributions and dividends from investments | (7,489 | ) | ||
| Dividends from money market mutual funds | 39 | |||
| Total Investment Loss | (7,450 | ) | ||
| Operating Expenses | ||||
| Advisory fees | 1,444,519 | |||
| Professional fees | 88,072 | |||
| Administrator fees | 57,819 | |||
| Directors’ fees | 37,516 | |||
| Stockholder communication expenses | 29,017 | |||
| Merger expenses | 26,397 | |||
| Fund accounting fees | 20,692 | |||
| Registration fees | 12,298 | |||
| Custodian fees and expenses | 7,573 | |||
| Stock transfer agent fees | 6,115 | |||
| Other operating expenses | 21,753 | |||
| Total Operating Expenses | 1,751,771 | |||
| Leverage Expenses | ||||
| Interest expense | 291,120 | |||
| Total Expenses | 2,042,891 | |||
| Net Investment Loss, before Income Taxes | (2,050,341 | ) | ||
| Deferred tax benefit | 732,886 | |||
| Net Investment Loss | (1,317,455 | ) | ||
| Realized and Unrealized Gain on Investments | ||||
| and Interest Rate Swaps | ||||
| Net realized gain on investments | 6,560,249 | |||
| Net realized loss on interest rate swap settlements | (190,897 | ) | ||
| Net realized gain, before income taxes | 6,369,352 | |||
| Current tax expense | (60,000 | ) | ||
| Deferred tax expense | (2,246,392 | ) | ||
| Net realized gain on investments and | ||||
| interest rate swaps | 4,062,960 | |||
| Net unrealized appreciation of investments | 38,004,059 | |||
| Net unrealized depreciation of interest rate swap contracts | (119,915 | ) | ||
| Net unrealized appreciation, before income taxes | 37,884,144 | |||
| Deferred tax expense | (13,718,144 | ) | ||
| Net unrealized appreciation of investments | ||||
| and interest rate swap contracts | 24,166,000 | |||
| Net Realized and Unrealized Gain on Investments | ||||
| and Interest Rate Swaps | 28,228,960 | |||
| Net Increase in Net Assets Applicable to | ||||
| Common Stockholders Resulting from Operations | $ | 26,911,505 |
See accompanying Notes to Financial Statements.
8 Tortoise North American Energy Corp.
Statement of Changes in Net Assets |
| Period from | |||||||||||
| December 1, 2013 | |||||||||||
| through | Year Ended | ||||||||||
| May 31, 2014 | November 30, 2013 | ||||||||||
| (Unaudited) | |||||||||||
| Operations | |||||||||||
| Net investment loss | $ | (1,317,455 | ) | $ | (1,832,103 | ) | |||||
| Net realized gain on investments and interest rate swaps | 4,062,960 | 12,731,754 | |||||||||
| Net unrealized appreciation of investments and interest rate swap contracts | 24,166,000 | 20,773,948 | |||||||||
| Net increase in net assets applicable to common stockholders resulting from operations | 26,911,505 | 31,673,599 | |||||||||
| Distributions to Common Stockholders | |||||||||||
| Return of capital | (5,131,814 | ) | (10,062,211 | ) | |||||||
| Capital Stock Transactions | |||||||||||
| Issuance of 14,888 common shares from reinvestment of distributions to stockholders | — | 417,784 | |||||||||
| Total increase in net assets applicable to common stockholders | 21,779,691 | 22,029,172 | |||||||||
| Net Assets | |||||||||||
| Beginning of period | 182,745,711 | 160,716,539 | |||||||||
| End of period | $ | 204,525,402 | $ | 182,745,711 | |||||||
| Accumulated net investment loss, net of income taxes, end of period | $ | (5,168,527 | ) | $ | (3,851,072 | ) | |||||
See accompanying Notes to Financial Statements.
2014 2nd Quarter Report 9
Statement of Cash Flows Period from December 1, 2013 through May 31, 2014 |
| (Unaudited) |
| Cash Flows from Operating Activities | ||||
| Distributions received from master limited partnerships | $ | 7,149,319 | ||
| Dividends received from common stock | ||||
| and money market mutual funds | 131,419 | |||
| Purchases of long-term investments | (47,885,135 | ) | ||
| Proceeds from sales of long-term investments | 26,807,413 | |||
| Purchases of short-term investments, net | (43,037 | ) | ||
| Payments on interest rate swap contracts, net | (190,897 | ) | ||
| Interest expense paid | (289,676 | ) | ||
| Income taxes paid | (60,000 | ) | ||
| Operating expenses paid | (1,687,592 | ) | ||
| Net cash used in operating activities | (16,068,186 | ) | ||
| Cash Flows from Financing Activities | ||||
| Advances from margin loan facility | 36,600,000 | |||
| Repayments on margin loan facility | (15,400,000 | ) | ||
| Distributions paid to common stockholders | (5,131,814 | ) | ||
| Net cash provided by financing activities | 16,068,186 | |||
| Net change in cash | — | |||
| Cash — beginning of period | — | |||
| Cash — end of period | $ | — | ||
| Reconciliation of net increase in net assets applicable | ||||
| to common stockholders resulting from operations | ||||
| to net cash used in operating activities | ||||
| Net increase in net assets applicable to common stockholders | ||||
| resulting from operations | $ | 26,911,505 | ||
| Adjustments to reconcile net increase in net assets | ||||
| applicable to common stockholders resulting from | ||||
| operations to net cash used in operating activities: | ||||
| Purchases of long-term investments | (47,885,135 | ) | ||
| Proceeds from sales of long-term investments | 26,807,413 | |||
| Purchases of short-term investments, net | (43,037 | ) | ||
| Return of capital on distributions received | 7,290,417 | |||
| Deferred tax expense | 15,231,650 | |||
| Net unrealized appreciation of investments and | ||||
| interest rate swap contracts | (37,884,144 | ) | ||
| Net realized gain on investments | (6,560,249 | ) | ||
| Changes in operating assets and liabilities: | ||||
| Increase in distributions receivable from | ||||
| master limited partnerships | (2,228 | ) | ||
| Increase in prepaid expenses and other assets | (1,958 | ) | ||
| Increase in payable to Adviser | 80,789 | |||
| Decrease in accrued expenses and other liabilities | (13,209 | ) | ||
| Total adjustments | (42,979,691 | ) | ||
| Net cash used in operating activities | $ | (16,068,186 | ) | |
See accompanying Notes to Financial Statements.
10 Tortoise North American Energy Corp.
Financial Highlights |
| Period from | ||||||||||||||||||||||||||
| December 1, 2013 | Year Ended | Year Ended | Year Ended | Year Ended | Year Ended | |||||||||||||||||||||
| through | November 30, | November 30, | November 30, | November 30, | November 30, | |||||||||||||||||||||
| May 31, 2014 | 2013 | 2012 | 2011 | 2010 | 2009 | |||||||||||||||||||||
| (Unaudited) | ||||||||||||||||||||||||||
| Per Common Share Data(1) | ||||||||||||||||||||||||||
| Net Asset Value, beginning of period | $ | 28.93 | $ | 25.51 | $ | 24.77 | $ | 24.51 | $ | 20.22 | $ | 10.78 | ||||||||||||||
| Income from Investment Operations | ||||||||||||||||||||||||||
| Net investment income (loss)(2) | (0.21 | ) | (0.29 | ) | (0.23 | ) | (0.12 | ) | (0.09 | ) | 0.25 | |||||||||||||||
| Net realized and unrealized gain on investments and | ||||||||||||||||||||||||||
| interest rate swaps contracts(2) | 4.47 | 5.31 | 2.53 | 1.89 | 5.86 | 10.67 | ||||||||||||||||||||
| Total income from investment operations | 4.26 | 5.02 | 2.30 | 1.77 | 5.77 | 10.92 | ||||||||||||||||||||
| Distributions to Common Stockholders | ||||||||||||||||||||||||||
| Return of capital | (0.81 | ) | (1.60 | ) | (1.56 | ) | (1.51 | ) | (1.48 | ) | (1.48 | ) | ||||||||||||||
| Net Asset Value, end of period | $ | 32.38 | $ | 28.93 | $ | 25.51 | $ | 24.77 | $ | 24.51 | $ | 20.22 | ||||||||||||||
| Per common share market value, end of period | $ | 31.07 | $ | 27.36 | $ | 25.06 | $ | 24.05 | $ | 24.44 | $ | 19.49 | ||||||||||||||
| Total Investment Return Based on Market Value(3)(4) | 16.62 | % | 15.62 | % | 10.87 | % | 4.77 | % | 33.62 | % | 131.66 | % | ||||||||||||||
| Supplemental Data and Ratios | ||||||||||||||||||||||||||
| Net assets applicable to common stockholders, | ||||||||||||||||||||||||||
| end of period (000’s) | $ | 204,525 | $ | 182,746 | $ | 160,717 | $ | 155,942 | $ | 154,289 | $ | 126,609 | ||||||||||||||
| Average net assets (000’s) | $ | 189,975 | $ | 176,118 | $ | 160,825 | $ | 157,410 | $ | 141,986 | $ | 80,041 | ||||||||||||||
| Ratio of Expenses to Average Net Assets(5) | ||||||||||||||||||||||||||
| Advisory fees | 1.53 | % | 1.42 | % | 1.36 | % | 1.28 | % | 1.19 | % | 1.13 | % | ||||||||||||||
| Other expenses | 0.32 | 0.28 | 0.31 | 0.32 | 0.38 | 1.01 | ||||||||||||||||||||
| Total operating expenses, before fee waiver | 1.85 | 1.70 | 1.67 | 1.60 | 1.57 | 2.14 | ||||||||||||||||||||
| Fee waiver | — | — | (0.01 | ) | (0.07 | ) | (0.12 | ) | (0.12 | ) | ||||||||||||||||
| Total operating expenses | 1.85 | 1.70 | 1.66 | 1.53 | 1.45 | 2.02 | ||||||||||||||||||||
| Leverage expenses | 0.31 | 0.22 | 0.24 | 0.47 | 0.75 | 1.17 | ||||||||||||||||||||
| Income tax expense (benefit)(6) | 16.14 | 9.52 | 5.31 | 4.30 | 13.10 | (4.70 | ) | |||||||||||||||||||
| Total expenses | 18.30 | % | 11.44 | % | 7.21 | % | 6.30 | % | 15.30 | % | (1.51 | )% | ||||||||||||||
See accompanying Notes to Financial Statements.
2014 2nd Quarter Report 11
Financial Highlights (Continued) |
| Period from | ||||||||||||||||||||||||||
| December 1, 2013 | Year Ended | Year Ended | Year Ended | Year Ended | Year Ended | |||||||||||||||||||||
| through | November 30, | November 30, | November 30, | November 30, | November 30, | |||||||||||||||||||||
| May 31, 2014 | 2013 | 2012 | 2011 | 2010 | 2009 | |||||||||||||||||||||
| (Unaudited) | ||||||||||||||||||||||||||
| Ratio of net investment income (loss) to average net assets | ||||||||||||||||||||||||||
| before fee waiver(5) | (1.39 | )% | (1.04 | )% | (0.90 | )% | (0.54 | )% | (0.50 | )% | 1.82 | % | ||||||||||||||
| Ratio of net investment income (loss) to average net assets | ||||||||||||||||||||||||||
| after fee waiver(5) | (1.39 | )% | (1.04 | )% | (0.89 | )% | (0.47 | )% | (0.38 | )% | 1.94 | % | ||||||||||||||
| Portfolio turnover rate(3) | 9.15 | % | 15.65 | % | 22.37 | % | 27.34 | % | 27.89 | % | 41.90 | % | ||||||||||||||
| Short-term borrowings, end of period (000’s) | $ | 59,800 | $ | 38,600 | $ | 34,800 | $ | 31,300 | $ | 10,400 | $ | 5,900 | ||||||||||||||
| Long-term debt obligations, end of period (000’s) | — | — | — | — | $ | 15,000 | $ | 15,000 | ||||||||||||||||||
| Per common share amount of long-term debt obligations | ||||||||||||||||||||||||||
| outstanding, end of period | — | — | — | — | $ | 2.38 | $ | 2.40 | ||||||||||||||||||
| Per common share amount of net assets, excluding | ||||||||||||||||||||||||||
| long-term debt obligations, end of period | $ | 32.38 | $ | 28.93 | $ | 25.51 | $ | 24.77 | $ | 26.89 | $ | 22.61 | ||||||||||||||
| Asset coverage, per $1,000 of principal amount of | ||||||||||||||||||||||||||
| long-term debt obligations and short-term borrowings(7) | $ | 4,420 | $ | 5,734 | $ | 5,618 | $ | 5,982 | $ | 7,074 | $ | 7,058 | ||||||||||||||
| Asset coverage ratio of long-term debt obligations | ||||||||||||||||||||||||||
| and short-term borrowings(7) | 442 | % | 573 | % | 562 | % | 598 | % | 707 | % | 706 | % | ||||||||||||||
| (1) | Information presented relates to a share of common stock outstanding for the entire period. |
| (2) | The per common share data for the years ended November 30, 2013, 2012, 2011, 2010, and 2009 do not reflect the change in estimate of investment income and return of capital, for the respective year. See Note 2E to the financial statements for further disclosure. |
| (3) | Not annualized for periods less than one year. |
| (4) | Total investment return is calculated assuming a purchase of common stock at the beginning of the period and a sale at the closing price on the last day of the period reported (excluding broker commissions). The calculation also assumes reinvestment of distributions at actual prices pursuant to the Company’s dividend reinvestment plan. |
| (5) | Annualized for periods less than one full year. |
| (6) | For the period from December 1, 2013 through May 31, 2014, the Company accrued $60,000 for current income tax expense and $15,231,650 for net deferred income tax expense. For the year ended November 30, 2013, the Company accrued $16,769,675 for net deferred income tax expense. For the year ended November 30, 2012, the Company accrued $13,102 for current income tax expense and $8,530,007 for net deferred income tax expense. For the year ended November 30, 2011, the Company accrued $44,786 for current and foreign tax expense and $6,732,194 for net deferred income tax expense. For the year ended November 30, 2010, the Company accrued $39,097 for current and foreign tax expense and $18,559,864 for net deferred income tax expense. For the year ended November 30, 2009, the Company accrued $28,837 for current and foreign tax benefit and $3,732,366 for net deferred income tax benefit, which included $5,488,509 of deferred income tax benefit for the timing differences at December 1, 2008 when the Company converted to a taxable corporation. |
| (7) | Represents value of total assets less all liabilities and indebtedness not represented by long-term debt obligations, short-term borrowings and preferred stock at the end of the period divided by long-term debt obligations and short-term borrowings outstanding at the end of the period. |
See accompanying Notes to Financial Statements.
12 Tortoise North American Energy Corp.
Notes to Financial Statements (Unaudited) May 31, 2014 |
1. Organization
Tortoise North American Energy Corporation (the “Company”) was organized as a Maryland corporation on January 13, 2005, and is a non-diversified, closed-end management investment company under the Investment Company Act of 1940, as amended (the “1940 Act”). The Company’s investment objective is to seek a high level of total return with an emphasis on distribution income paid to stockholders. The Company seeks to provide its stockholders with a vehicle to invest in a portfolio consisting primarily of publicly traded U.S. master limited partnerships (“MLPs”), including oil and gas exploitation, energy infrastructure and energy shipping companies. The Company commenced operations on October 31, 2005. The Company’s stock is listed on the New York Stock Exchange under the symbol “TYN.”
On January 28, 2014, the Boards of Directors of the Company and of Tortoise Energy Infrastructure Corporation (“TYG”) approved a proposal in which the Company plans to merge with TYG. Stockholders of the Company and of TYG approved the merger on May 28, 2014. As part of the merger, the Company’s stockholders will be issued common stock of TYG and TYG would acquire substantially all of the assets and liabilities of the Company. See Note 11 — Subsequent Events for further information.
2. Significant Accounting Policies
A. Use of Estimates
The preparation of financial statements in conformity with U.S. generally accepted accounting principles requires management to make estimates and assumptions that affect the reported amount of assets and liabilities, recognition of distribution income and disclosure of contingent assets and liabilities at the date of the financial statements. Actual results could differ from those estimates.
B. Investment Valuation
The Company primarily owns securities that are listed on a securities exchange or over-the-counter market. The Company values those securities at their last sale price on that exchange or over-the-counter market on the valuation date. If the security is listed on more than one exchange, the Company uses the price from the exchange that it considers to be the principal exchange on which the security is traded. Securities listed on the NASDAQ will be valued at the NASDAQ Official Closing Price, which may not necessarily represent the last sale price. If there has been no sale on such exchange or over-the-counter market on such day, the security will be valued at the mean between the last bid price and last ask price on such day.
The Company may invest up to 50 percent of its total assets in restricted securities. Restricted securities are subject to statutory and contractual restrictions on their public resale, which may make it more difficult to obtain a valuation and may limit the Company’s ability to dispose of them. Investments in restricted securities and other securities for which market quotations are not readily available will be valued in good faith by using fair value procedures approved by the Board of Directors. Such fair value procedures consider factors such as discounts to publicly traded issues, time until conversion date, securities with similar yields, quality, type of issue, coupon, duration and rating. If events occur that affect the value of the Company’s portfolio securities before the net asset value has been calculated (a “significant event”), the portfolio securities so affected will generally be priced using fair value procedures. The Company did not hold any restricted securities at May 31, 2014.
An equity security of a publicly traded company acquired in a direct placement transaction may be subject to restrictions on resale that can affect the security’s liquidity and fair value. Such securities that are convertible or otherwise will become freely tradable will be valued based on the market value of the freely tradable security less an applicable discount. Generally, the discount will initially be equal to the discount at which the Company purchased the securities. To the extent that such securities are convertible or otherwise become freely tradable within a time frame that may be reasonably determined, an amortization schedule may be used to determine the discount.
The Company generally values debt securities at prices based on market quotations for such securities, except those securities purchased with 60 days or less to maturity are valued on the basis of amortized cost, which approximates market value.
The Company generally values its interest rate swap contracts using industry-accepted models which discount the estimated future cash flows based on the stated terms of the interest rate swap agreement by using interest rates currently available in the market, or based on dealer quotations, if available.
C. Foreign Currency Translation
For foreign currency, investments in foreign securities, and other assets and liabilities denominated in a foreign currency, the Company translates these amounts into U.S. dollars on the following basis: (1) market value of investment securities, assets and liabilities at the current rate of exchange on the valuation date and (2) purchases and sales of investment securities, income and expenses at the relevant rates of exchange on the respective dates of such transactions. The Company does not isolate that portion of gains and losses on investments that is due to changes in the foreign exchange rates from that which is due to changes in market prices of equity securities.
D. Foreign Withholding Taxes
The Company may be subject to taxes imposed by countries in which it invests with respect to its investment in issuers existing or operating in such countries. Such taxes are generally based on income earned. The Company accrues such taxes when the related income is earned.
E. Security Transactions and Investment Income
Security transactions are accounted for on the date the securities are purchased or sold (trade date). Realized gains and losses are reported on an identified cost basis. Interest income is recognized on the accrual basis, including amortization of premiums and accretion of discounts. Dividend income and distributions are recorded on the ex-dividend date. Distributions received from investments generally are comprised of ordinary income and return of capital. The Company allocates distributions between investment income and return of capital based on estimates made at the time such distributions are received. Such estimates are based on information provided by each portfolio company and other industry sources. These estimates may subsequently be revised based on actual allocations received from the portfolio companies after their tax reporting periods are concluded, as the actual character of these distributions is not known until after the fiscal year end of the Company.
For the period from December 1, 2012 through November 30, 2013, the Company estimated the allocation of investment income and return of capital for distributions received from investments within the Statement of Operations. For this period, the Company had estimated approximately 8 percent of total distributions as investment income and approximately 92 percent as return of capital.
2014 2nd Quarter Report 13
Notes to Financial Statements (Unaudited) (Continued) |
Subsequent to November 30, 2013, the Company reallocated the amount of investment income and return of capital it recognized for the period from December 1, 2012 through November 30, 2013 based on the 2013 tax reporting information received from the individual MLPs. This reclassification amounted to a decrease in pre-tax net investment income of approximately $622,000 or $0.098 per share ($395,000 or $0.063 per share, net of deferred tax benefit), an increase in unrealized appreciation of investments of approximately $464,000 or $0.073 per share ($295,000 or $0.047 per share, net of deferred tax expense), and an increase in realized gains of approximately $158,000 or $0.025 per share ($100,000 or $0.016 per share, net of deferred tax expense) for the period from December 1, 2013 through May 31, 2014.
Subsequent to the period ended February 28, 2014, the Company reallocated the amount of investment income and return of capital it recognized in the current fiscal year based on its revised 2014 estimates, after considering the final allocations for 2013. This reclassification amounted to a decrease in pre-tax net investment income of approximately $42,000 or $0.007 per share ($27,000 or $0.004 per share, net of deferred tax benefit), a decrease in unrealized appreciation of investments of approximately $166,000 or $0.026 per share ($105,000 or $0.017 per share, net of deferred tax benefit), and an increase in realized gains of approximately $208,000 or $0.033 per share ($132,000 or $0.021 per share, net of deferred tax expense).
F. Distributions to Stockholders
Distributions to common stockholders are recorded on the ex-dividend date. The Company may not declare or pay distributions to its common stockholders if it does not meet asset coverage ratios required under the 1940 Act or the rating agency guidelines for its debt and preferred stock (if any) following such distribution. The character of distributions to stockholders made during the year may differ from their ultimate characterization for federal income tax purposes. For book purposes, the source of the Company’s distributions to common stockholders for the year ended November 30, 2013 and the period ended May 31, 2014 was 100 percent return of capital. For tax purposes, the Company’s distributions to common stockholders for the year ended November 30, 2013 were 100 percent qualified dividend income. The tax character of distributions paid to common stockholders in the current year will be determined subsequent to November 30, 2014.
G. Federal Income Taxation
From the Company’s inception through November 30, 2008, the Company qualified as a regulated investment company (“RIC”) under the U.S. Internal Revenue Code of 1986, as amended (the “Code”). Effective December 1, 2008, the Company is treated as a taxable corporation for federal and state income tax purposes. The Company, as a corporation, is obligated to pay federal and state income tax on its taxable income. Currently, the highest regular marginal federal income tax rate for a corporation is 35 percent. The Company may be subject to a 20 percent federal alternative minimum tax (“AMT”) on its federal alternative minimum taxable income to the extent that its AMT exceeds its regular federal income tax.
The Company invests in MLPs, which generally are treated as partnerships for federal income tax purposes. As a limited partner in the MLPs, the Company reports its allocable share of the MLP’s taxable income in computing its own taxable income. The Company’s tax expense or benefit is included in the Statement of Operations based on the component of income or gains (losses) to which such expense or benefit relates. Deferred income taxes reflect the net tax effects of temporary differences between the carrying amounts of assets and liabilities for financial reporting purposes and the amounts used for income tax purposes. A valuation allowance is recognized if, based on the weight of available evidence, it is more likely than not that some portion or all of the deferred income tax asset will not be realized.
H. Offering and Debt Issuance Costs
Offering costs related to the issuance of common and preferred stock are charged to additional paid-in capital when the stock is issued. Debt issuance costs related to long-term debt obligations are capitalized and amortized over the period the debt is outstanding.
I. Derivative Financial Instruments
The Company uses derivative financial instruments (principally interest rate swap contracts) to manage interest rate risk. The Company has established policies and procedures for risk assessment and the approval, reporting and monitoring of derivative financial instrument activities. The Company does not hold or issue derivative financial instruments for speculative purposes. All derivative financial instruments are recorded at fair value with changes in fair value during the reporting period, and amounts accrued under the agreements, included as unrealized gains or losses in the accompanying Statement of Operations. The fair value of derivative financial instruments in a loss position are offset against the fair value of derivative financial instruments in a gain position, with the net fair value appropriately reflected as an asset or liability within the accompanying Statement of Assets & Liabilities. Cash settlements under the terms of the interest rate swap contracts and termination of such contracts are recorded as realized gains or losses in the accompanying Statement of Operations.
J. Indemnifications
Under the Company’s organizational documents, its officers and directors are indemnified against certain liabilities arising out of the performance of their duties to the Company. In addition, in the normal course of business, the Company may enter into contracts that provide general indemnification to other parties. The Company’s maximum exposure under these arrangements is unknown, as this would involve future claims that may be made against the Company that have not yet occurred, and may not occur. However, the Company has not had prior claims or losses pursuant to these contracts and expects the risk of loss to be remote.
3. Concentration Risk
Under normal conditions, the Company will have at least 80 percent of its total assets in equity securities of companies in the energy sector with their primary operations in North America (“Energy Companies”). Energy Companies include companies that derive more than 50 percent of their revenues from transporting, processing, storing, distributing or marketing natural gas, natural gas liquids, electricity, coal, crude oil or refined petroleum products, or exploring, developing, managing or producing such commodities. The Company may invest up to 50 percent of its total assets in restricted securities. In determining application of these policies, the term “total assets” includes assets obtained through leverage. Companies that primarily invest in a particular sector may experience greater volatility than companies investing in a broad range of industry sectors. The Company may, for defensive purposes, temporarily invest all or a significant portion of its assets in investment grade securities, short-term debt securities and cash or cash equivalents. To the extent the Company uses this strategy, it may not achieve its investment objective.
14 Tortoise North American Energy Corp.
Notes to Financial Statements (Unaudited) (Continued) |
4. Agreements
The Company has entered into an Investment Advisory Agreement with Tortoise Capital Advisors, L.L.C. (the “Adviser”). Under the terms of the agreement, the Company pays the Adviser a fee equal to an annual rate of 1.00 percent of the Company’s average monthly total assets (including any assets attributable to leverage and excluding any net deferred tax asset) minus accrued liabilities (other than net deferred tax liability, debt entered into for purposes of leverage and the aggregate liquidation preference of outstanding preferred stock, if any) (“Managed Assets”), in exchange for the investment advisory services provided.
U.S. Bancorp Fund Services, LLC serves as the Company’s administrator. The Company pays the administrator a monthly fee computed at an annual rate of 0.04 percent of the first $1,000,000,000 of the Company’s Managed Assets, 0.01 percent on the next $500,000,000 of Managed Assets and 0.005 percent on the balance of the Company’s Managed Assets.
Computershare Trust Company, N.A. serves as the Company’s transfer agent and registrar and Computershare Inc. serves as the Company’s dividend paying agent and agent for the automatic dividend reinvestment plan.
U.S. Bank, N.A. serves as custodian of the Company’s cash and investment securities. The Company pays the custodian a monthly fee computed at an annual rate of 0.004 percent of the Company’s portfolio assets, plus portfolio transaction fees.
5. Income Taxes
Deferred income taxes reflect the net tax effect of temporary differences between the carrying amount of assets and liabilities for financial reporting and tax purposes. Components of the Company’s deferred tax assets and liabilities as of May 31, 2014, are as follows:
| Deferred tax assets: | |||
| Net operating loss carryforwards | $ | 4,827,453 | |
| AMT credit | 93,959 | ||
| Organization costs | 33,053 | ||
| State of Kansas credit | 4,055 | ||
| 4,958,520 | |||
| Deferred tax liabilities: | |||
| Basis reduction of investment in MLPs | 13,354,270 | ||
| Net unrealized gains on investment securities | 52,045,486 | ||
| 65,399,756 | |||
| Total net deferred tax liability | $ | 60,441,236 |
At May 31, 2014, a valuation allowance on deferred tax assets was not deemed necessary because the Company believes it is more likely than not that there is an ability to realize its deferred tax assets through future taxable income. Any adjustments to the Company’s estimates of future taxable income will be made in the period such determination is made. The Company recognizes the tax benefits of uncertain tax positions only when the position is “more likely than not” to be sustained upon examination by the tax authorities based on the technical merits of the tax position. The Company’s policy is to record interest and penalties on uncertain tax positions as part of tax expense. As of May 31, 2014, the Company had no uncertain tax positions and no penalties and interest were accrued. Tax years subsequent to the year ending November 30, 2008 remain open to examination by federal and state tax authorities.
Total income tax expense differs from the amount computed by applying the federal statutory income tax rate of 35 percent to net investment loss and net realized and unrealized gains on investments for the period ended May 31, 2014, as follows:
| Application of statutory income tax rate | $ | 14,771,105 | ||
| State income taxes, net of federal tax benefit | 603,505 | |||
| Permanent differences | (82,960 | ) | ||
| Total income tax expense | $ | 15,291,650 |
Total income taxes are computed by applying the federal statutory rate plus a blended state income tax rate.
For the period from December 1, 2013 through May 31, 2014, the components of income tax expense include alternative minimum tax expense of $60,000 and deferred federal and state income tax expense (net of federal tax benefit) of $14,633,757 and $597,893, respectively.
The Company acquired all of the net assets of Tortoise Gas and Oil Corporation (“TGO”) on September 14, 2009 in a tax-free reorganization under Section 368(a)(1)(C) of the Internal Revenue Code. As of November 30, 2013, the Company had net operating losses for federal income tax purposes of approximately $10,320,000. This amount includes net operating losses of approximately $7,935,000 from TGO. The net operating losses may be carried forward for 20 years. If not utilized, these net operating losses will expire in the years ending November 30, 2027 through November 30, 2032. Utilization of the net operating losses from TGO is further subject to Section 382 limitations of the Internal Revenue Code, which limit tax attributes subsequent to ownership changes. The amount of deferred tax asset for net operating losses at May 31, 2014 includes amounts for the period from December 1, 2013 through May 31, 2014.
As of November 30, 2013, the Company estimated that it utilized its capital loss carryforward of approximately $6,500,000. This amount includes a capital loss of approximately $1,400,000 from TGO. For corporations, capital losses can only be used to offset capital gains and cannot be used to offset ordinary income. As of November 30, 2013, an AMT credit of $33,959 was available, which may be credited in the future against regular income tax. This credit may be carried forward indefinitely.
As of May 31, 2014, the aggregate cost of securities for federal income tax purposes was $145,803,890. The aggregate gross unrealized appreciation for all securities in which there was an excess of fair value over tax cost was $179,983,457, the aggregate gross unrealized depreciation for all securities in which there was an excess of tax cost over fair value was $0 and the net unrealized appreciation was $179,983,457.
6. Fair Value of Financial Instruments
Various inputs are used in determining the fair value of the Company’s financial instruments. These inputs are summarized in the three broad levels listed below:
| Level 1 – | quoted prices in active markets for identical investments | |
| Level 2 – | other significant observable inputs (including quoted prices for similar investments, market corroborated inputs, etc.) | |
| Level 3 – | significant unobservable inputs (including the Company’s own assumptions in determining the fair value of investments) |
The inputs or methodology used for valuing securities are not necessarily an indication of the risk associated with investing in those securities.
2014 2nd Quarter Report 15
Notes to Financial Statements (Unaudited) (Continued) |
The following table provides the fair value measurements of applicable Company assets and liabilities by level within the fair value hierarchy as of May 31, 2014. These assets and liabilities are measured on a recurring basis.
| Fair Value at | ||||||||||||
| Description | May 31, 2014 | Level 1 | Level 2 | Level 3 | ||||||||
| Assets | ||||||||||||
| Equity Securities: | ||||||||||||
| Common Stock(a) | $ | 4,468,008 | $ | 4,468,008 | $ | — | $ | — | ||||
| Master Limited Partnerships | ||||||||||||
| and Related Companies(a) | 321,171,651 | 321,171,651 | — | — | ||||||||
| Total Equity Securities | 325,639,659 | 325,639,659 | — | — | ||||||||
| Other Securities: | ||||||||||||
| Short-Term Investment(b) | 147,688 | 147,688 | — | — | ||||||||
| Total Assets | $ | 325,787,347 | $ | 325,787,347 | $ | — | $ | — | ||||
| Liabilities | ||||||||||||
| Interest Rate Swap Contracts | $ | 493,991 | $ | — | $ | 493,991 | $ | — | ||||
| (a) | All other industry classifications are identified in the Schedule of Investments. |
| (b) | Short-term investment is a sweep investment for cash balances in the Company at May 31, 2014. |
The Company did not hold any Level 3 securities during the period from December 1, 2013 through May 31, 2014. The Company utilizes the beginning of reporting period method for determining transfers between levels. There were no transfers between levels during the period from December 1, 2013 through May 31, 2014.
Valuation Techniques
In general, and where applicable, the Company uses readily available market quotations based upon the last updated sales price from the principal market to determine fair value. This pricing methodology applies to the Company’s Level 1 investments.
An equity security of a publicly traded company acquired in a private placement transaction without registration under the Securities Act of 1933, as amended (the “1933 Act”), is subject to restrictions on resale that can affect the security’s fair value. If such a security is convertible into publicly-traded common shares, the security generally will be valued at the common share market price adjusted by a percentage discount due to the restrictions and categorized as Level 2 in the fair value hierarchy. If the security has characteristics that are dissimilar to the class of security that trades on the open market, the security will generally be valued and categorized as Level 3 in the fair value hierarchy.
Interest rate swap contracts are valued by using industry-accepted models which discount the estimated future cash flows based on a forward rate curve and the stated terms of the interest rate swap agreement by using interest rates currently available in the market, or based on dealer quotations, if available, which applies to the Company’s Level 2 liabilities.
7. Investment Transactions
For the period from December 1, 2013 through May 31, 2014, the Company purchased (at cost) and sold securities (proceeds received) in the amount of $47,885,135 and $26,807,413 (excluding short-term debt securities), respectively.
8. Credit Facility
As of May 31, 2014, the Company has a 270-day rolling evergreen margin loan facility with Bank of America, N.A. The terms of the agreement provide for a $65,000,000 facility that is secured by certain of the Company’s assets. Outstanding balances generally accrue interest at a variable rate equal to one-month LIBOR plus 0.925 percent and unused portions of the facility accrue a fee equal to an annual rate of 0.25 percent. On December 11, 2013, the Company entered into an amendment to its margin facility that increased the capacity of the facility from $40,000,000 to $65,000,000 and increased the interest rate on the facility from one-month LIBOR plus 0.85 percent to one-month LIBOR plus 0.925 percent.
The average principal balance and interest rate for the period during which the margin loan facility was utilized during the period ended May 31, 2014, was approximately $50,300,000 and 1.08 percent, respectively. At May 31, 2014, the principal balance outstanding was $59,800,000 at an interest rate of 1.08 percent.
Under the terms of the margin loan facility, the Company must maintain asset coverage required under the 1940 Act. If the Company fails to maintain the required coverage, it may be required to repay a portion of an outstanding balance until the coverage requirement has been met. At May 31, 2014, the Company was in compliance with the terms of the margin loan facility.
9. Interest Rate Swap Contracts
The Company has entered into interest rate swap contracts in an attempt to protect itself from increasing interest expense on its leverage resulting from increasing short-term interest rates. A decline in interest rates may result in a decline in the value of the swap contracts, which may result in a decline in the net assets of the Company. At the time the interest rate swap contracts reach their scheduled termination, there is a risk that the Company would not be able to obtain a replacement transaction, or that the terms of the replacement would not be as favorable as on the expiring transaction. In addition, if the Company is required to terminate any swap contract early due to the net assets of the Company falling below $48,000,000 or the Company failing to maintain a required 300 percent asset coverage of the liquidation value of the outstanding debt, then the Company could be required to make a payment to the extent of any net unrealized depreciation of the terminated swaps, in addition to redeeming all or some of the debt. The Company segregates a portion of its assets as collateral for the amount of any net liability of its interest rate swap contracts. Details of the interest rate swap contracts outstanding as of May 31, 2014, are as follows:
| Fixed Rate | Floating Rate | ||||||||||||||
| Maturity | Notional | Paid by the | Received by | Unrealized | |||||||||||
| Counterparty | Date | Amount | Company | the Company | Depreciation | ||||||||||
| The Bank of Nova Scotia | 09/02/2014 | $ | 5,000,000 | 0.654% | 1-month U.S. Dollar LIBOR | $ | (8,618 | ) | |||||||
| The Bank of Nova Scotia | 09/02/2016 | 5,000,000 | 1.258% | 1-month U.S. Dollar LIBOR | (89,947 | ) | |||||||||
| The Bank of Nova Scotia | 09/02/2018 | 5,000,000 | 1.815% | 1-month U.S. Dollar LIBOR | (125,525 | ) | |||||||||
| The Bank of Nova Scotia | 09/02/2021 | 10,000,000 | 2.381% | 1-month U.S. Dollar LIBOR | (269,901 | ) | |||||||||
| $ | 25,000,000 | $ | (493,991 | ) | |||||||||||
16 Tortoise North American Energy Corp.
Notes to Financial Statements (Unaudited) (Continued) |
The Company is exposed to credit risk on the interest rate swap contracts if the counterparty should fail to perform under the terms of the interest rate swap contracts. The amount of credit risk is limited to the net appreciation of the interest rate swap contracts, if any, as no collateral is pledged by the counterparty. In addition, if the counterparty to the interest rate swap contracts defaults, the Company would incur a loss in the amount of the receivable and would not receive amounts due from the counterparty to offset the interest payments on the Company’s leverage.
The unrealized depreciation of interest rate swap contracts in the amount of $119,915 for the period ended May 31, 2014 is included in the Statement of Operations. Cash settlement payments under the terms of the interest rate swap contracts in the amount of $190,897 are recorded as realized losses for the period ended May 31, 2014. The total notional amount of all open swap agreements at May 31, 2014 is indicative of the volume of this derivative type for the period ended May 31, 2014.
| Net Amounts | |||||||||||||||
| Gross Amounts | of Liabilities | Gross Amounts Not Offset | |||||||||||||
| Gross | Offset in the | Presented in | in the Statement of Assets | ||||||||||||
| Amounts of | Statement | the Statement | & Liabilities | ||||||||||||
| Recognized | of Assets & | of Assets & | Financial | Cash Collateral | Net | ||||||||||
| Description | Liabilities | Liabilities | Liabilities | Instruments | Received | Amount | |||||||||
| Interest Rate Swap | |||||||||||||||
| Contracts | $493,991 | $ | — | $493,991 | $ | — | $ | — | $493,991 | ||||||
10. Common Stock
The Company has 100,000,000 shares of capital stock authorized and 6,316,079 shares outstanding at May 31, 2014 and November 30, 2013.
11. Subsequent Events
Pursuant to a plan of merger approved by the stockholders of each of the Company and Tortoise Energy Infrastructure Corporation (“TYG”), TYG acquired all of the net assets of the Company on June 23, 2014 in the amount of $210,449,285. A total of 6,316,079 shares of common stock of the Company were exchanged for 4,130,451 shares of common stock of TYG immediately after the closing date. The merger qualified as a tax-free reorganization under Section 368(a)(1)(C) of the Internal Revenue Code.
The Company has performed an evaluation of subsequent events through the date the financial statements were issued and has determined that no additional items require recognition or disclosure.
2014 2nd Quarter Report 17
Additional Information (Unaudited) |
Stockholder Proxy Voting Results
The annual meeting of stockholders was held on May 28, 2014. The matters considered at the meeting, together with the actual vote tabulations relating to such matters are as follows:
| 1. | To consider and vote upon a proposal to approve the merger of the Company with and into Tortoise Energy Infrastructure Corporation. |
| Vote of Stockholders | No. of Shares | |
| Affirmative | 3,191,719 | |
| Against | 149,044 | |
| Abstain | 81,099 | |
| Broker Non-votes | 1,717,261 | |
| TOTAL | 5,139,123 |
| 2. | To elect two directors of the Company, to hold office for a term of three years and until their successors are duly elected and qualified. |
| No. of Shares | ||
| Conrad S. Ciccotello | ||
| Affirmative | 5,117,631 | |
| Withheld | 240,169 | |
| TOTAL | 5,357,800 | |
| No. of Shares | ||
| Terry C. Matlack | ||
| Affirmative | 5,122,370 | |
| Withheld | 235,430 | |
| TOTAL | 5,357,800 |
Each of Charles E. Heath and Rand C. Berney continued as a director with a term expiring on the date of the 2015 annual meeting of stockholders. H. Kevin Birzer continued as a director with a term expiring on the date of the 2016 annual meeting of stockholders.
| 3. | To approve a proposal to authorize flexibility to the Company to sell its common shares for less than net asset value, subject to certain conditions. |
| Vote of Common Stockholders | No. of | |
| of Record (25 Stockholders of | Recordholders | |
| Record as of Record Date) | Voting | |
| Affirmative | 21 | |
| Against | 1 | |
| Abstain | 2 | |
| TOTAL | 24 |
| Vote of Stockholders | No. of Shares | |
| Affirmative | 2,798,325 | |
| Against | 474,291 | |
| Abstain | 113,102 | |
| Broker Non-votes | 1,717,262 | |
| TOTAL | 5,102,980 |
| 4. | To ratify the selection of Ernst & Young LLP as the independent registered public accounting firm of the Company for its fiscal year ending November 30, 2014. |
| No. of Shares | ||
| Affirmative | 5,214,997 | |
| Against | 77,618 | |
| Abstain | 65,180 | |
| TOTAL | 5,357,795 |
Based upon votes required for approval, each of these matters passed.
18 Tortoise North American Energy Corp.
Additional Information (Unaudited) (Continued) |
Director and Officer Compensation
The Company does not compensate any of its directors who are “interested persons,” as defined in Section 2(a)(19) of the 1940 Act, nor any of its officers. For the period ended May 31, 2014, the aggregate compensation paid by the Company to the independent directors was $40,500. The Company did not pay any special compensation to any of its directors or officers.
Forward-Looking Statements
This report contains “forward-looking statements” within the meaning of the Securities Act of 1933 and the Securities Exchange Act of 1934. By their nature, all forward-looking statements involve risks and uncertainties, and actual results could differ materially from those contemplated by the forward-looking statements. Several factors that could materially affect the Company’s actual results are the performance of the portfolio of stocks held by it, the conditions in the U.S. and international financial, petroleum and other markets, the price at which shares of the Company will trade in the public markets and other factors discussed in filings with the SEC.
Proxy Voting Policies
A description of the policies and procedures that the Company uses to determine how to vote proxies relating to portfolio securities owned by the Company and information regarding how the Company voted proxies relating to the portfolio of securities during the 12-month period ended June 30, 2013 is available to stockholders (i) without charge, upon request by calling the Company at (913) 981-1020 or toll-free at (866) 362-9331 and on the Company’s Web site at www.tortoiseadvisors.com; and (ii) on the SEC’s Web site at www.sec.gov.
Form N-Q
The Company files its complete schedule of portfolio holdings for the first and third quarters of each fiscal year with the SEC on Form N-Q. The Company’s Form N-Q is available without charge upon request by calling the Company at (866) 362-9331 or by visiting the SEC’s Web site at www.sec.gov. In addition, you may review and copy the Company’s Form N-Q at the SEC’s Public Reference Room in Washington, D.C. You may obtain information on the operation of the Public Reference Room by calling (800) SEC-0330.
The Company’s Form N-Qs are also available on the Company’s Web site at www. tortoiseadvisors.com.
Statement of Additional Information
The Statement of Additional Information (“SAI”) includes additional information about the Company’s directors and is available upon request without charge by calling the Company at (866) 362-9331 or by visiting the SEC’s Web site at www.sec.gov.
Certifications
The Company’s Chief Executive Officer submitted to the New York Stock Exchange the annual CEO certification as required by Section 303A.12(a) of the NYSE Listed Company Manual.
The Company has filed with the SEC, as an exhibit to its most recently filed Form N-CSR, the certification of its Chief Executive Officer and Chief Financial Officer required by Section 302 of the Sarbanes-Oxley Act.
Privacy Policy
In order to conduct its business, the Company collects and maintains certain nonpublic personal information about its stockholders of record with respect to their transactions in shares of the Company’s securities. This information includes the stockholder’s address, tax identification or Social Security number, share balances, and dividend elections. We do not collect or maintain personal information about stockholders whose share balances of our securities are held in “street name” by a financial institution such as a bank or broker.
We do not disclose any nonpublic personal information about you, the Company’s other stockholders or the Company’s former stockholders to third parties unless necessary to process a transaction, service an account, or as otherwise permitted by law.
To protect your personal information internally, we restrict access to nonpublic personal information about the Company’s stockholders to those employees who need to know that information to provide services to our stockholders. We also maintain certain other safeguards to protect your nonpublic personal information.
2014 2nd Quarter Report 19

Office of the Company Board of Directors of H. Kevin Birzer, Chairman Terry Matlack Rand C. Berney Conrad S. Ciccotello Charles E. Heath | ADMINISTRATOR CUSTODIAN TRANSFER, DIVIDEND DISBURSING LEGAL COUNSEL INVESTOR RELATIONS STOCK SYMBOL This report is for stockholder information. This is not a prospectus intended for use in the purchase or sale of fund shares. Past performance is no guarantee of future results and your investment may be worth more or less at the time you sell. |
Tortoise Capital Advisors’ Closed-end Funds
| Pureplay MLP Funds | Broader Funds | |||||||||||
| Name | Ticker | Focus | Total Assets(1) ($ in millions) | Name | Ticker | Focus | Total Assets(1) ($ in millions) | |||||
Tortoise Energy | Midstream Equity | $4,513 | Tortoise Pipeline & |  | Pipeline Equity | $492 | ||||||
Tortoise MLP |  | Natural Gas Infrastructure Equity | $2,396 | Tortoise Energy |  | North American Upstream Equity | $528 | |||||
Tortoise Power and |  | Power & Energy Infrastructure | $260 | |||||||||
(1) As of 6/30/14

Item 2. Code of Ethics.
Not applicable for semi-annual reports.
Item 3. Audit Committee Financial Expert.
Not applicable for semi-annual reports.
Item 4. Principal Accountant Fees and Services.
Not applicable for semi-annual reports.
Item 5. Audit Committee of Listed Registrants.
Not applicable for semi-annual reports.
Item 6. Investments.
Schedule of Investments is included as part of the report to shareholders filed under Item 1.
Item 7. Disclosure of Proxy Voting Policies and Procedures for Closed-End Management Investment Companies.
Not applicable for semi-annual reports.
Item 8. Portfolio Managers of Closed-End Management Investment Companies.
There have been no changes in the portfolio managers identified in response to this Item in the Registrant’s most recent annual report on Form N-CSR.
Item 9. Purchases of Equity Securities by Closed-End Management Investment Company and Affiliated Purchasers.
| Period | (a) Total Number of Shares (or Units) Purchased | (b) Average Price Paid per Share (or Unit) | (c) Total Number of Shares (or Units) Purchased as Part of Publicly Announced Plans or Programs | (d) Maximum Number (or Approximate Dollar Value) of Shares (or Units) that May Yet Be Purchased Under the Plans or Programs |
| Month #1 12/1/13-12/31/13 | 0 | 0 | 0 | 0 |
| Month #2 1/1/14-1/31/14 | 0 | 0 | 0 | 0 |
| Month #3 2/1/14-2/28/14 | 0 | 0 | 0 | 0 |
| Month #4 3/1/14-3/31/14 | 0 | 0 | 0 | 0 |
| Month #5 4/1/14-4/30/14 | 0 | 0 | 0 | 0 |
| Month #6 5/1/14-5/31/14 | 0 | 0 | 0 | 0 |
| Total | 0 | 0 | 0 | 0 |
Item 10. Submission of Matters to a Vote of Security Holders.
None.
Item 11. Controls and Procedures.
(a) The Registrant’s Chief Executive Officer and its Chief Financial Officer have concluded that the Registrant's disclosure controls and procedures (as defined in Rule 30a-3(c) under the Investment Company Act of 1940 (the “1940 Act”)) are effective as of a date within 90 days of the filing date of this report, based on the evaluation of these controls and procedures required by Rule 30a-3(b) under the 1940 Act and Rules 13a-15(b) or 15d-15(b) under the Securities Exchange Act of 1934, as amended.
(b) There were no changes in the Registrant’s internal controls over financial reporting (as defined in Rule 30a-3(d) under the 1940 Act) that occurred during the Registrant’s second fiscal quarter of the period covered by this report that have materially affected, or are reasonably likely to materially affect, the Registrant’s internal control over financial reporting.
Item 12. Exhibits.
(a)(1) Any code of ethics, or amendment thereto, that is the subject of the disclosure required by Item 2, to the extent that the Registrant intends to satisfy the Item 2 requirements through filing of an exhibit. Not applicable.
(2) Certifications pursuant to Section 302 of the Sarbanes-Oxley Act of 2002. Filed herewith.
(3) Any written solicitation to purchase securities under Rule 23c-1 under the Act sent or given during the period covered by the report by or on behalf of the Registrant to 10 or more persons. None.
(b) Certification pursuant to Section 906 of the Sarbanes-Oxley Act of 2002. Furnished herewith.
SIGNATURES
Pursuant to the requirements of the Securities Exchange Act of 1934 and the Investment Company Act of 1940, the Registrant has duly caused this report to be signed on its behalf by the undersigned, thereunto duly authorized.
| (Registrant) | Tortoise North American Energy Corporation | |
| By (Signature and Title) | /s/ Terry Matlack | |
| Terry Matlack, Chief Executive Officer | ||
| Date July 22, 2014 | ||
Pursuant to the requirements of the Securities Exchange Act of 1934 and the Investment Company Act of 1940, this report has been signed below by the following persons on behalf of the Registrant and in the capacities and on the dates indicated.
| By (Signature and Title) | /s/ Terry Matlack | |
| Terry Matlack, Chief Executive Officer | ||
| Date July 22, 2014 | ||
| By (Signature and Title) | /s/ P. Bradley Adams | |
| P. Bradley Adams, Chief Financial Officer | ||
| Date July 22, 2014 | ||