united states
securities and exchange commission
washington, d.c. 20549
form n-csr
certified shareholder report of registered management
investment companies
Investment Company Act file number 811-21720
Northern Lights Fund Trust
(Exact name of registrant as specified in charter)
225 Pictoria Drive, Suite 450, Cincinnati, Ohio 45246
(Address of principal executive offices) (Zip code)
The Corporation Trust Company
1209 Orange Street Wilmington, DE 19801
(Name and address of agent for service)
Registrant's telephone number, including area code: 631-490-4300
Date of fiscal year end: 4/30
Date of reporting period: 4/30/23
Item 1. Reports to Stockholders.

Class A Shares: EGLAX
Class C Shares: EGLCX
Class I Shares: EGLIX
Class N Shares: EGLNX
Annual Report
April 30, 2023
Distributed by Northern Lights Distributors, LLC
Member FINRA/SIPC

April 30, 2023
Dear Investor:
The Eagle MLP Strategy Fund (“Fund”) is an open-end mutual fund that invests in a portfolio of Master Limited Partnerships (“MLPs”) and MLP-related securities that provide exposure to the underlying price and income characteristics of predominately midstream energy infrastructure assets in an attempt to generate attractive, long-term, risk-adjusted returns. The Fund’s Co-Adviser, Eagle Global Advisors, LLC, draws upon years of experience in selecting and investing in MLPs and MLP-related securities. The Fund’s investments attempt to capture the income and market characteristics of MLPs and MLP-related securities while not participating in the tax complexities that can reduce the attractiveness of investing in this asset class, including K-1s, state and local tax filings and Unrelated Business Taxable Income (“UBTI”). As of April 30, 2023, the Fund had approximately $91 million of assets under management.
Fund Performance
During the Fund’s fiscal year, May 1, 2022 through April 30, 2023 (the “Investment Period”), the Fund’s Class I Shares returned 12.30%, Class N Shares returned 12.52%, Class A Shares returned 12.01% and Class C returned 11.23%. The Co-Advisers believe this performance was competitive with similar funds and appropriate benchmarks.
Figure 1
The Fund’s Investment Results*
| As of April 30, 2023 | May-June 2022 | Q3 2022 | Q4 2022 | Q1 2023 | April 2023 | One Year | Three Year | Since Inception* |
| Class I (NAV) | -8.28% | 4.31% | 14.14% | 0.42% | 2.41% | 12.30% | 33.91% | 2.93% |
| Class A (NAV) | -8.28% | 4.08% | 14.27% | 0.21% | 2.47% | 12.01% | 33.57% | 2.68% |
| Class A (Max Load) | -13.62% | -1.88% | 7.72% | -5.55% | -3.49% | 5.50% | 30.91% | 2.11% |
| Class C (NAV) | -8.31% | 3.91% | 13.93% | 0.16% | 2.31% | 11.23% | 32.61% | 1.07% |
| Class N (NAV) | -8.23% | 4.28% | 14.36% | 0.42% | 2.39% | 12.52% | 34.11% | 6.58% |
| Alerian MLP Index | -7.30% | 8.05% | 10.11% | 4.09% | 1.72% | 16.78% | 29.33% | 2.08% |
| * | The inception date of Class A and Class I is 9/14/12 and Class C is 2/21/13. The Alerian MLP Index is a composite of the 27 most prominent energy Master Limited Partnerships (MLPs) and its performance is reported for the period 9/14/12 through 4/30/23. Returns for periods longer than one year are annualized. PAST PERFORMANCE IS NOT NECESSARILY INDICATIVE OF FUTURE RESULTS. The performance data quoted here represents past performance. Current performance may be lower or higher than the performance data quoted above. Investment return and principal value will fluctuate, so that shares, when redeemed, may be worth more or less than their original cost. Past performance is no guarantee of future results. The total annual fund operating expenses are Class A 1.97%, Class C 2.72%, Class I 1.72% and Class N 1.72% per the August 29, 2022 prospectus. The Fund’s investment Co-Advisers have contractually agreed to reduce its fees and/or absorb expenses of the Fund, at least until August 31, 2023. Total annual operating expenses after fee waiver are Class A 1.65%, Class C 2.40%, Class I 1.40% and Class N 1.26% per the August 29, 2022 prospectus. The maximum sales charge (load) for Class A is 5.75%. Class A investors may be eligible for a reduction in sales charges. See the Fund’s prospectus for more information. Please review the Fund’s Prospectus for more detail on the expense waiver. Results shown reflect the waiver, without which the results could have been lower. Performance over short periods of time should not be the sole factor in making your investment decisions. For performance information current to the most recent month end, please call toll-free 1-888-868-9501. |
7477-NLD 06/09/2023
1
The Investment Period saw significant macroeconomic and geopolitical events. With respect to midstream energy infrastructure, the most obvious driver the Fund’s 2022 performance during the Investment Period was the impact of Russia’s invasion of Ukraine. Two things happened, the first was the world was suddenly aware of how important traditional energy is to the global economy and the second was the invasion accelerated what was already rising inflation. Major beneficiaries were stocks that had idiosyncratic exposure to the Russian-instigated energy crisis, as well as those with sensitivity to energy price volatility. Another major positive theme was Midstream companies being bought out by their sponsors at material premiums.
Another key macroeconomic theme during the Investment Period was inflation and Central Banks around the world trying to get it under control. In the United States (“US”), this fight meant raising interest rates from an Upper Bound of 0.25% at the beginning of 2022 to 5.00% as of April 30, 2023. While inflation (as measured year-over-year by the Consumer Price Index) has put in a peak (for now) at just over 9% in June 2022, the path back down to the US Federal Reserve target of 2.00% may prove long and winding. Interest rates are less of a problem for a midstream energy asset class which now has increasing cash flows and minimal capital needs. Capital expenditures are far less than they were during the height of the fracking revolution, with free cash flow after dividends and capital expenditures meaningfully positive for most Midstream companies. The question is more about refinancing existing debt and/or managing floating rate debt and less about financing growth. We see refinancing risk as modest and manageable for most midstream companies. While floating rate risk is a headwind for a few companies, it’s not necessarily a sector-wide issue since dividend coverage ratios are nearly 2.0x across the Midstream sector.
The market is continuing to gain confidence in Midstream energy companies’ ability to generate large amounts of free cash flow. This free cash flow provides visibility on de-leveraging and share buybacks, and that is attracting generalist interest. It goes beyond this though. We believe management teams are more disciplined, and there is less fear that a company will make an ill-advised acquisition or pursue an unnecessary growth project.
Performance Attribution
The table on the next page shows the contribution to Fund performance of various categories within the midstream energy sector. We are pleased to report that each sector contributed positively overall to performance during the Investment Period.
7477-NLD 06/09/2023
2
Figure 2
Estimated Monthly Performance Attribution by Sector
Fiscal Year Ended April 30, 2023
| May-June 2022 | Q3 2022 | Q4 2022 | Q1 2023 | April 2023 | One Year | |
| Pipeline - Diversified | -0.78% | 1.09% | 0.98% | 0.74% | 0.39% | 2.45% |
| Pipeline - NGL Infrastructure | -2.77% | -0.64% | 3.16% | 0.03% | 0.66% | 0.13% |
| LNG Infrastructure | -0.15% | 2.19% | -1.08% | 0.61% | -0.30% | 1.37% |
| Pipeline - Natural Gas | -1.30% | -0.70% | 2.47% | -0.42% | 0.27% | 0.13% |
| Pipeline - Petroleum | -0.77% | 0.67% | 1.77% | 0.74% | 0.44% | 2.86% |
| Pipelines & Transportation | -0.41% | 0.00% | 0.77% | 0.21% | 0.28% | 0.84% |
| Renewable Electric Generation | -1.21% | 0.60% | 2.30% | -0.01% | -0.01% | 1.55% |
| Other Energy Infrastructure | -0.67% | 1.49% | 4.19% | -1.14% | 0.65% | 4.47% |
| Class I Performance** | -8.28% | 4.31% | 14.14% | 0.42% | 2.41% | 12.30% |
** The attribution data will not match the performance results of the Fund as it is an estimate and does not include Fund expenses and the results of residual cash balances.
Outlook
We believe there simply aren’t many sectors that own the critical infrastructure the US needs to keep the economy rolling, while at the same time delivering so many shareholder friendly catalysts and at a compelling valuation. Midstream seems to fit that bill today and into the future, and we believe the more people underestimate the sector’s importance the more likely Midstream will continue to outperform. If the last several years have taught us anything it’s to not take anything for granted. We remain optimistic about the long-term investment opportunity for MLPs. We believe there is significant long-term value in the asset class in terms of distribution yield, distribution growth and total return. The asset class has evolved and we believe Midstream companies have continued taking the necessary steps to strengthen their companies by making business model improvements, such as reducing debt, increasing distribution coverage, and internally funding growth, among others.
| Very Truly Yours, | |
| Princeton Fund Advisors, LLC | Eagle Global Advisors, LLC |
| Co-Adviser to the Fund | Co-Adviser to the Fund |
7477-NLD 06/09/2023
3
Eagle MLP Strategy Fund
PORTFOLIO REVIEW (Unaudited)
April 30, 2023
The Fund’s performance figures* for the year ended April 30, 2023, compared to its benchmark:
| Annualized | Annualized | Annualized | |||||
| Annualized | Annualized | Annualized | Inception**- | Inception*** - | Inception**** - | ||
| One Year | Three Year | Five Year | Ten Year | April 30, 2023 | April 30, 2023 | April 30, 2023 | |
| Eagle MLP Strategy Fund – Class A | 12.01% | 33.57% | 7.95% | 1.05% | 2.68% | N/A | N/A |
| Eagle MLP Strategy Fund – Class A with load | 5.50% | 30.91% | 6.68% | 0.46% | 2.11% | N/A | N/A |
| Eagle MLP Strategy Fund – Class C | 11.23% | 32.61% | 7.15% | 0.29% | N/A | 1.07% | N/A |
| Eagle MLP Strategy Fund – Class I | 12.30% | 33.91% | 8.23% | 1.30% | 2.93% | N/A | N/A |
| Eagle MLP Strategy Fund – Class N | 12.52% | 34.11% | N/A | N/A | N/A | N/A | 6.58% |
| Alerian MLP Index | 16.78% | 29.33% | 6.12% | 0.65% | 2.08% | 1.35% | 3.63% |
| * | The performance data quoted here represents past performance. The performance comparison includes reinvestment of all dividends and capital gains and has been adjusted for the Class A maximum sales charge of 5.75%, where applicable. The Class A maximum sales charge may be reduced or waived by the co-advisers. Current performance may be lower or higher than the performance data quoted above. Past performance is no guarantee of future results. The investment return and principal value of an investment will fluctuate so that an investor’s shares, when redeemed, may be worth more or less than their original cost. The returns shown do not reflect the deduction of taxes that a shareholder would pay on Fund distributions or on the redemption of Fund shares. Performance figures for periods greater than one year are annualized. The Fund’s total annual operating expenses, before fee waivers and/or expense reimbursements, are 1.97%, 2.72%, 1.72% and 1.72%, respectively, for Class A, Class C, Class I and Class N shares per the August 29, 2022 prospectus. After fee waivers and/or expense reimbursements, the Fund’s total annual operating expenses are 1.65%, 2.40%, 1.40% and 1.26%, respectively, for Class A, Class C, Class I and Class N shares per the August 29, 2022 prospectus. The Fund’s performance would have been lower had the co-advisers not waived fees and/or reimbursed expenses. The Class A maximum sales may be reduced or waived by the co-advisers. For performance information current to the most recent month-end, please call toll-free 1-888-868-9501. |
| ** | Inception date for Class A and Class I is September 14, 2012. |
| *** | Inception date for Class C is February 21, 2013. |
| **** | Inception date for Class N is August 16, 2018. |
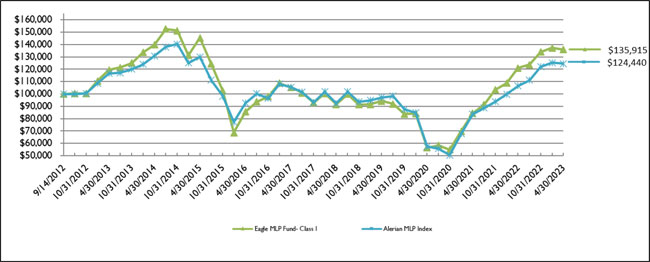
The Alerian MLP Index is a composite of the 27 most prominent energy MLPs that provides investors with an unbiased, comprehensive benchmark for this emerging asset class. There are no fees or expenses associated with the index and investors cannot invest directly in an index or benchmark.
Comparison of the Change in Value of a $100,000 Investment
4
Eagle MLP Strategy Fund
PORTFOLIO REVIEW (Unaudited)(Continued)
April 30, 2023
The Fund’s Holdings by Asset Class and Industry as of April 30, 2023 are as follows:
| Asset Class | % of Net Assets | |||
| MLP & MLP Related Securities | ||||
| Pipeline-NGL Infrastructure | 19.3 | % | ||
| Gathering & Processing | 15.8 | % | ||
| Pipeline-Petroleum | 13.6 | % | ||
| Pipeline-Natural Gas | 12.8 | % | ||
| LNG Infrastructure | 9.9 | % | ||
| Pipeline-Diversified | 9.9 | % | ||
| Pipelines and Transportation | 9.4 | % | ||
| Mineral Companies | 3.8 | % | ||
| Utility | 2.6 | % | ||
| Renewable Electric Generation | 0.9 | % | ||
| Short-Term Investment | 0.0 | % * | ||
| Other Assets in Excess of Liabilities | 2.0 | % | ||
| 100.0 | % | |||
| * | Percentage rounds to less than 0.1%. |
Please refer to the Schedule of Investments in this Annual Report for a detailed listing of the Fund’s holdings.
5
| EAGLE MLP STRATEGY FUND |
| SCHEDULE OF INVESTMENTS |
| April 30, 2023 |
| Shares | Fair Value | |||||||
| MLP & MLP RELATED SECURITIES — 98.0% | ||||||||
| GATHERING & PROCESSING - 15.8% | ||||||||
| 300,810 | Antero Midstream Corporation | $ | 3,236,715 | |||||
| 146,500 | EnLink Midstream, LLC | 1,437,165 | ||||||
| 92,120 | Hess Midstream, L.P., Class A | 2,702,801 | ||||||
| 265,630 | Western Midstream Partners, L.P. | 7,031,226 | ||||||
| 14,407,907 | ||||||||
| LNG INFRASTRUCTURE - 9.9% | ||||||||
| 59,130 | Cheniere Energy, Inc. | 9,046,890 | ||||||
| MINERAL COMPANIES - 3.8% | ||||||||
| 65,600 | Sitio Royalties Corporation, Class A | 1,665,584 | ||||||
| 60,000 | Viper Energy Partners, L.P. | 1,766,400 | ||||||
| 3,431,984 | ||||||||
| PIPELINE-DIVERSIFIED - 9.9% | ||||||||
| 701,950 | Energy Transfer, L.P. | 9,041,116 | ||||||
| PIPELINE-NATURAL GAS - 12.8% | ||||||||
| 180,000 | Kinder Morgan, Inc. | 3,087,000 | ||||||
| 65,790 | ONEOK, Inc. | 4,303,324 | ||||||
| 142,220 | Williams Companies, Inc. (The) | 4,303,577 | ||||||
| 11,693,901 | ||||||||
| PIPELINE-NGL INFRASTRUCTURE - 19.3% | ||||||||
| 174,000 | Keyera Corporation | 4,094,903 | ||||||
| 126,100 | Pembina Pipeline Corporation | 4,152,474 | ||||||
| 126,280 | Targa Resources Corporation | 9,537,929 | ||||||
| 17,785,306 | ||||||||
| PIPELINE-PETROLEUM - 13.6% | ||||||||
| 98,000 | Holly Energy Partners, L.P. | 1,632,680 | ||||||
| 8,200 | Magellan Midstream Partners, L.P. | 457,560 | ||||||
| 773,500 | Plains GP Holdings, L.P., Class A | 10,364,900 | ||||||
| 12,455,140 | ||||||||
| PIPELINES AND TRANSPORTATION - 9.4% | ||||||||
| 108,470 | Enbridge, Inc. | 4,312,767 | ||||||
| 123,080 | MPLX, L.P. | 4,306,569 | ||||||
| 8,619,336 | ||||||||
See accompanying notes to financial statements.
6
| EAGLE MLP STRATEGY FUND |
| SCHEDULE OF INVESTMENTS (Continued) |
| April 30, 2023 |
| Shares | Fair Value | |||||||
| MLP & MLP RELATED SECURITIES — 98.0% (Continued) | ||||||||
| RENEWABLE ELECTRIC GENERATION - 0.9% | ||||||||
| 14,000 | Clearway Energy, Inc. | $ | 425,180 | |||||
| 4,700 | Ormat Technologies, Inc. | 403,307 | ||||||
| 828,487 | ||||||||
| UTILITY - 2.6% | ||||||||
| 30,600 | NextEra Energy, Inc. | 2,344,878 | ||||||
| TOTAL COMMON STOCKS (Cost $49,215,074) | 89,654,945 | |||||||
| SHORT-TERM INVESTMENT — 0.0%(a) | ||||||||
| MONEY MARKET FUND - 0.0% (a) | ||||||||
| 658 | First American Government Obligations Fund Class X, 2.30% (Cost $658)(b) | 658 | ||||||
| TOTAL INVESTMENTS - 98.0% (Cost $49,215,732) | $ | 89,655,603 | ||||||
| OTHER ASSETS IN EXCESS OF LIABILITIES - 2.0% | 1,790,563 | |||||||
| NET ASSETS - 100.0% | $ | 91,446,166 | ||||||
| LLC | - Limited Liability Company |
| LNG | - Liquefied natural gas |
| LP | - Limited Partnership |
| MLP | - Master Limited Partnership |
| NGL | - Natural gas liquids |
| (a) | Percentage rounds to less than 0.1%. |
| (b) | Rate disclosed is the seven day effective yield as of April 30, 2023. |
See accompanying notes to financial statements.
7
| Eagle MLP Strategy Fund |
| STATEMENT OF ASSETS AND LIABILITIES |
| April 30, 2023 |
| ASSETS | ||||
| Investments (cost $49,215,732) | $ | 89,655,603 | ||
| Receivable for securities sold | 4,002,176 | |||
| Dividends and interest receivable | 828,651 | |||
| Receivable for Fund shares sold | 17,015 | |||
| Prepaid expenses and other assets | 53,804 | |||
| TOTAL ASSETS | 94,557,249 | |||
| LIABILITIES | ||||
| Payable for investments purchased | 2,616,730 | |||
| Line of credit payable | 358,000 | |||
| Investment advisory fees payable, net | 56,984 | |||
| Payable to related parties | 20,653 | |||
| Payable for Fund shares redeemed | 17,911 | |||
| Distribution (12b-1) fees payable | 4,445 | |||
| Accrued expenses and other liabilities | 36,360 | |||
| TOTAL LIABILITIES | 3,111,083 | |||
| NET ASSETS | $ | 91,446,166 | ||
| Net Assets Consist Of: | ||||
| Paid in capital | $ | 502,566,443 | ||
| Accumulated deficit | (411,120,277 | ) | ||
| NET ASSETS | $ | 91,446,166 | ||
See accompanying notes to financial statements.
8
| Eagle MLP Strategy Fund |
| STATEMENT OF ASSETS AND LIABILITIES (Continued) |
| April 30, 2023 |
| Net Asset Value Per Share: | ||||
| Class A Shares: | ||||
| Net Assets | $ | 5,224,658 | ||
| Shares of beneficial interest outstanding ($0 par value, unlimited shares authorized) | 742,563 | |||
| Net asset value (Net Assets ÷ Shares Outstanding) and redemption price per share | $ | 7.04 | ||
| Maximum offering price per share (maximum sales charge of 5.75%) | $ | 7.47 | ||
| Class C Shares: | ||||
| Net Assets | $ | 6,797,034 | ||
| Shares of beneficial interest outstanding ($0 par value, unlimited shares authorized) | 968,507 | |||
| Net asset value (Net Assets ÷ Shares Outstanding), offering price and redemption price per share | $ | 7.02 | ||
| Class I Shares: | ||||
| Net Assets | $ | 45,738,071 | ||
| Shares of beneficial interest outstanding ($0 par value, unlimited shares authorized) | 6,498,808 | |||
| Net asset value (Net Assets ÷ Shares Outstanding), offering price and redemption price per share | $ | 7.04 | ||
| Class N Shares: | ||||
| Net Assets | $ | 33,686,403 | ||
| Shares of beneficial interest outstanding ($0 par value, unlimited shares authorized) | 4,746,323 | |||
| Net asset value (Net Assets ÷ Shares Outstanding), offering price and redemption price per share | $ | 7.10 |
See accompanying notes to financial statements.
9
| Eagle MLP Strategy Fund |
| STATEMENT OF OPERATIONS |
| For the Year Ended April 30, 2023 |
| INVESTMENT INCOME | ||||
| Dividend income (net, tax withholdings $82,343) | $ | 3,500,698 | ||
| Interest income | 13,084 | |||
| TOTAL INVESTMENT INCOME | 3,513,782 | |||
| EXPENSES | ||||
| Investment advisory fees | 1,120,351 | |||
| Distribution (12b-1) Fees: | ||||
| Class A | 17,141 | |||
| Class C | 70,347 | |||
| Administrative services fees | 72,570 | |||
| Third Party Administrative Servicing Fees | 65,704 | |||
| Registration fees | 64,998 | |||
| Accounting services fees | 60,585 | |||
| Audit and tax fees | 38,562 | |||
| Transfer agent fees | 29,197 | |||
| Printing and postage expenses | 22,674 | |||
| Legal fees | 20,974 | |||
| Trustees fees and expenses | 15,579 | |||
| Compliance officer fees | 14,667 | |||
| Custodian fees | 11,147 | |||
| Interest expense | 2,724 | |||
| Insurance expense | 2,000 | |||
| Other expenses | 10,778 | |||
| TOTAL EXPENSES | 1,639,998 | |||
| Less: Fees waived by the co-advisers | (342,018 | ) | ||
| NET EXPENSES | 1,297,980 | |||
| NET INVESTMENT INCOME | 2,215,802 | |||
| REALIZED AND UNREALIZED GAIN (LOSS) ON INVESTMENTS | ||||
| Net realized gain (loss): | ||||
| Investments | 9,919,805 | |||
| Foreign currency transactions | (1,490 | ) | ||
| Net realized gain | 9,918,315 | |||
| Net change in unrealized depreciation on: | ||||
| Investments | (1,714,466 | ) | ||
| Foreign currency transactions | (5,153 | ) | ||
| Net change in unrealized depreciation | (1,719,619 | ) | ||
| NET REALIZED AND UNREALIZED GAIN ON INVESTMENTS | 8,198,696 | |||
| NET INCREASE IN NET ASSETS RESULTING FROM OPERATIONS | $ | 10,414,498 |
See accompanying notes to financial statements.
10
| Eagle MLP Strategy Fund |
| STATEMENTS OF CHANGES IN NET ASSETS |
| Year Ended | Year Ended | |||||||
| April 30, 2023 | April 30, 2022 | |||||||
| FROM OPERATIONS | ||||||||
| Net investment income | $ | 2,215,802 | $ | 1,902,522 | ||||
| Net realized gain on investments and foreign currency transactions | 9,918,315 | 10,515,748 | ||||||
| Net change in unrealized appreciation (depreciation) on investments and foreign currency transactions | (1,719,619 | ) | 18,168,764 | |||||
| Net increase in net assets resulting from operations | 10,414,498 | 30,587,034 | ||||||
| DISTRIBUTIONS TO SHAREHOLDERS | ||||||||
| From return of capital: | ||||||||
| Class A | (194,302 | ) | (139,014 | ) | ||||
| Class C | (165,042 | ) | (145,890 | ) | ||||
| Class I | (1,161,751 | ) | (1,010,278 | ) | ||||
| Class N | (926,549 | ) | (903,932 | ) | ||||
| Total distributions paid: | ||||||||
| Class A | (190,364 | ) | (141,689 | ) | ||||
| Class C | (170,066 | ) | (160,015 | ) | ||||
| Class I | (1,302,669 | ) | (1,107,738 | ) | ||||
| Class N | (988,410 | ) | (996,779 | ) | ||||
| Net decrease in net assets resulting from distributions to shareholders | (5,099,153 | ) | (4,605,335 | ) | ||||
| FROM SHARES OF BENEFICIAL INTEREST | ||||||||
| Proceeds from shares sold: | �� | |||||||
| Class A | 4,576,613 | 442,499 | ||||||
| Class C | 121,760 | 127,418 | ||||||
| Class I | 8,930,995 | 5,977,146 | ||||||
| Class N | 90,599 | 45,498 | ||||||
| Net asset value of shares issued in reinvestment of distributions: | ||||||||
| Class A | 360,580 | 261,857 | ||||||
| Class C | 302,067 | 279,703 | ||||||
| Class I | 2,053,933 | 1,698,164 | ||||||
| Class N | 346,073 | 277,501 | ||||||
| Payments for shares redeemed: | ||||||||
| Class A | (5,514,778 | ) | (1,864,243 | ) | ||||
| Class C | (1,229,690 | ) | (1,740,522 | ) | ||||
| Class I | (8,726,104 | ) | (15,925,701 | ) | ||||
| Class N | (5,794,766 | ) | (5,222,871 | ) | ||||
| Net decrease in net assets resulting from shares of beneficial interest | (4,482,718 | ) | (15,643,551 | ) | ||||
| TOTAL INCREASE IN NET ASSETS | 832,627 | 10,338,148 | ||||||
| NET ASSETS | ||||||||
| Beginning of Year | 90,613,539 | 80,275,391 | ||||||
| End of Year | $ | 91,446,166 | $ | 90,613,539 | ||||
See accompanying notes to financial statements.
11
| Eagle MLP Strategy Fund |
| STATEMENTS OF CHANGES IN NET ASSETS (Continued) |
| Year Ended | Year Ended | |||||||
| April 30, 2023 | April 30, 2022 | |||||||
| Class A: | ||||||||
| Shares Sold | 671,669 | 70,431 | ||||||
| Shares Reinvested | 51,743 | 43,910 | ||||||
| Shares Redeemed | (806,327 | ) | (318,455 | ) | ||||
| Net decrease in shares of beneficial interest outstanding | (82,915 | ) | (204,114 | ) | ||||
| Class C: | ||||||||
| Shares Sold | 18,088 | 22,690 | ||||||
| Shares Reinvested | 43,667 | 46,885 | ||||||
| Shares Redeemed | (180,174 | ) | (312,379 | ) | ||||
| Net decrease in shares of beneficial interest outstanding | (118,419 | ) | (242,804 | ) | ||||
| Class I: | ||||||||
| Shares Sold | 1,291,627 | 993,208 | ||||||
| Shares Reinvested | 296,204 | 283,248 | ||||||
| Shares Redeemed | (1,277,699 | ) | (2,773,724 | ) | ||||
| Net increase (decrease) in shares of beneficial interest outstanding | 310,132 | (1,497,268 | ) | |||||
| Class N : | ||||||||
| Shares Sold | 12,586 | 7,569 | ||||||
| Shares Reinvested | 49,495 | 46,057 | ||||||
| Shares Redeemed | (830,513 | ) | (892,189 | ) | ||||
| Net decrease in shares of beneficial interest outstanding | (768,432 | ) | (838,563 | ) | ||||
See accompanying notes to financial statements.
12
| Eagle MLP Strategy Fund |
| FINANCIAL HIGHLIGHTS |
Per Share Data and Ratios for a Share of Beneficial Interest Outstanding Throughout Each Year
| Year Ended | Year Ended | Year Ended | Year Ended | Year Ended | ||||||||||||||||
| April 30, | April 30, | April 30, | April 30, | April 30, | ||||||||||||||||
| Class A | 2023 | 2022 | 2021 | 2020 | 2019 | |||||||||||||||
| Net asset value, beginning of year | $ | 6.64 | $ | 4.89 | $ | 3.54 | $ | 6.48 | $ | 6.77 | ||||||||||
| Activity from investment operations: | ||||||||||||||||||||
| Net investment income (1) | 0.17 | 0.12 | 0.10 | 0.16 | 0.15 | |||||||||||||||
| Net realized and unrealized gain (loss) on investments | 0.61 | 1.94 | 1.54 | (2.62 | ) | 0.03 | ||||||||||||||
| Total from investment operations | 0.78 | 2.06 | 1.64 | (2.46 | ) | 0.18 | ||||||||||||||
| Less distributions from: | ||||||||||||||||||||
| Net investment income | (0.19 | ) | (0.17 | ) | (0.24 | ) | (0.15 | ) | (0.24 | ) | ||||||||||
| Return of capital | (0.19 | ) | (0.14 | ) | (0.05 | ) | (0.33 | ) | (0.23 | ) | ||||||||||
| Total distributions | (0.38 | ) | (0.31 | ) | (0.29 | ) | (0.48 | ) | (0.47 | ) | ||||||||||
| Net asset value, end of year | $ | 7.04 | $ | 6.64 | $ | 4.89 | $ | 3.54 | $ | 6.48 | ||||||||||
| Total return (2) | 12.01 | % | 42.99 | % | 48.78 | % | (40.06 | )% | 2.62 | % | ||||||||||
| Net assets, at end of year (000s) | $ | 5,225 | $ | 5,480 | $ | 5,031 | $ | 5,698 | $ | 20,793 | ||||||||||
| Ratio of gross expenses to average net assets (3)(4) | 1.98 | % (5) | 1.97 | % | 2.10 | % | 1.81 | % | 1.73 | % | ||||||||||
| Ratio of net expenses to average net assets (4) | 1.65 | % (5) | 1.65 | % | 1.68 | % | 1.67 | % | 1.67 | % | ||||||||||
| Ratio of net investment income to average net assets (4) | 2.43 | % (5) | 2.01 | % | 2.67 | % | 2.80 | % | 2.15 | % | ||||||||||
| Portfolio Turnover Rate | 46 | % | 26 | % | 82 | % | 69 | % | 36 | % | ||||||||||
| (1) | Per share amounts calculated using the average shares method, which more appropriately presents the per share data for the period. |
| (2) | Total returns shown are historical in nature and assume changes in share price, reinvestment of dividends and distributions, if any, and exclude the effect of applicable sales charges and redemption fees. Had the co-advisers not waived a portion of their fees, total returns would have been lower. |
| (3) | Represents the ratio of expenses to average net assets absent fee waivers and/or expense reimbursements by the co-advisers. |
| (4) | Does not include the Fund’s share of the expenses of the underlying investment companies in which the Fund invests. Recognition of investment income by the Fund is affected by the timing and declaration of dividends by underlying investment companies in which the Fund invests. |
| (5) | Includes 0.00% for the year ended April 30, 2023 attributed to borrowing costs (line of credit fees) which are not subject to waiver by the advisor. |
See accompanying notes to financial statements.
13
| Eagle MLP Strategy Fund |
| FINANCIAL HIGHLIGHTS |
Per Share Data and Ratios for a Share of Beneficial Interest Outstanding Throughout Each Year
| Year Ended | Year Ended | Year Ended | Year Ended | Year Ended | ||||||||||||||||
| April 30, | April 30, | April 30, | April 30, | April 30, | ||||||||||||||||
| Class C | 2023 | 2022 | 2021 | 2020 | 2019 | |||||||||||||||
| Net asset value, beginning of year | $ | 6.62 | $ | 4.88 | $ | 3.53 | $ | 6.47 | $ | 6.75 | ||||||||||
| Activity from investment operations: | ||||||||||||||||||||
| Net investment income (1) | 0.10 | 0.07 | 0.07 | 0.05 | 0.07 | |||||||||||||||
| Net realized and unrealized gain (loss) on investments | 0.63 | 1.94 | 1.54 | (2.55 | ) | 0.06 | ||||||||||||||
| Total from investment operations | 0.73 | 2.01 | 1.61 | (2.50 | ) | 0.13 | ||||||||||||||
| Less distributions from: | ||||||||||||||||||||
| Net investment income | (0.17 | ) | (0.15 | ) | (0.21 | ) | (0.14 | ) | (0.21 | ) | ||||||||||
| Return of capital | (0.16 | ) | (0.12 | ) | (0.05 | ) | (0.30 | ) | (0.20 | ) | ||||||||||
| Total distributions | (0.33 | ) | (0.27 | ) | (0.26 | ) | (0.44 | ) | (0.41 | ) | ||||||||||
| Net asset value, end of year | $ | 7.02 | $ | 6.62 | $ | 4.88 | $ | 3.53 | $ | 6.47 | ||||||||||
| Total return (2) | 11.23 | % | 41.84 | % | 47.80 | % | (40.60 | )% | 1.99 | % | ||||||||||
| Net assets, at end of year (000s) | $ | 6,797 | $ | 7,197 | $ | 6,484 | $ | 5,566 | $ | 12,584 | ||||||||||
| Ratio of gross expenses to average net assets (3)(4) | 2.73 | % (5) | 2.72 | % | 2.84 | % | 2.56 | % | 2.48 | % | ||||||||||
| Ratio of net expenses to average net assets (4) | 2.40 | % (5) | 2.40 | % | 2.43 | % | 2.42 | % | 2.42 | % | ||||||||||
| Ratio of net investment income to average net assets (4) | 1.48 | % (5) | 1.27 | % | 1.65 | % | 0.97 | % | 0.98 | % | ||||||||||
| Portfolio Turnover Rate | 46 | % | 26 | % | 82 | % | 69 | % | 36 | % | ||||||||||
| (1) | Per share amounts calculated using the average shares method, which more appropriately presents the per share data for the period. |
| (2) | Total returns shown are historical in nature and assume changes in share price, reinvestment of dividends and distributions, if any, and exclude the effect of applicable sales charges and redemption fees. Had the co-advisers not waived a portion of their fees, total returns would have been lower. |
| (3) | Represents the ratio of expenses to average net assets absent fee waivers and/or expense reimbursements by the co-advisers. |
| (4) | Does not include the Fund’s share of the expenses of the underlying investment companies in which the Fund invests. Recognition of investment income by the Fund is affected by the timing and declaration of dividends by underlying investment companies in which the Fund invests. |
| (5) | Includes 0.00% for the year ended April 30, 2023 attributed to borrowing costs (line of credit fees) which are not subject to waiver by the advisor. |
See accompanying notes to financial statements.
14
| Eagle MLP Strategy Fund |
| FINANCIAL HIGHLIGHTS |
Per Share Data and Ratios for a Share of Beneficial Interest Outstanding Throughout Each Year
| Year Ended | Year Ended | Year Ended | Year Ended | Year Ended | ||||||||||||||||
| April 30, | April 30, | April 30, | April 30, | April 30, | ||||||||||||||||
| Class I | 2023 | 2022 | 2021 | 2020 | 2019 | |||||||||||||||
| Net asset value, beginning of year | $ | 6.64 | $ | 4.89 | $ | 3.54 | $ | 6.49 | $ | 6.77 | ||||||||||
| Activity from investment operations: | ||||||||||||||||||||
| Net investment income (1) | 0.17 | 0.13 | 0.12 | 0.20 | 0.24 | |||||||||||||||
| Net realized and unrealized gain (loss) on investments | 0.63 | 1.95 | 1.53 | (2.65 | ) | (0.03 | ) | |||||||||||||
| Total from investment operations | 0.80 | 2.08 | 1.65 | (2.45 | ) | 0.21 | ||||||||||||||
| Less distributions from: | ||||||||||||||||||||
| Net investment income | (0.21 | ) | (0.18 | ) | (0.25 | ) | (0.16 | ) | (0.25 | ) | ||||||||||
| Return of capital | (0.19 | ) | (0.15 | ) | (0.05 | ) | (0.34 | ) | (0.24 | ) | ||||||||||
| Total distributions | (0.40 | ) | (0.33 | ) | (0.30 | ) | (0.50 | ) | (0.49 | ) | ||||||||||
| Net asset value, end of year | $ | 7.04 | $ | 6.64 | $ | 4.89 | $ | 3.54 | $ | 6.49 | ||||||||||
| Total return (2) | 12.30 | % | 43.35 | % | 49.18 | % | (39.98 | )% | 3.02 | % | ||||||||||
| Net assets, at end of year (000s) | $ | 45,738 | $ | 41,084 | $ | 37,561 | $ | 46,545 | $ | 201,708 | ||||||||||
| Ratio of gross expenses to average net assets (3)(4) | 1.73 | % (5) | 1.72 | % | 1.86 | % | 1.56 | % | 1.48 | % | ||||||||||
| Ratio of net expenses to average net assets (4) | 1.40 | % (5) | 1.40 | % | 1.43 | % | 1.42 | % | 1.42 | % | ||||||||||
| Ratio of net investment income to average net assets (4) | 2.52 | % (5) | 2.30 | % | 3.04 | % | 3.52 | % | 3.40 | % | ||||||||||
| Portfolio Turnover Rate | 46 | % | 26 | % | 82 | % | 69 | % | 36 | % | ||||||||||
| (1) | Per share amounts calculated using the average shares method, which more appropriately presents the per share data for the period. |
| (2) | Total returns shown are historical in nature and assume changes in share price, reinvestment of dividends and distributions, if any, and exclude the effect of applicable sales charges and redemption fees. Had the co-advisers not waived a portion of their fees, total returns would have been lower. |
| (3) | Represents the ratio of expenses to average net assets absent fee waivers and/or expense reimbursements by the co-advisers. |
| (4) | Does not include the Fund’s share of the expenses of the underlying investment companies in which the Fund invests. Recognition of investment income by the Fund is affected by the timing and declaration of dividends by underlying investment companies in which the Fund invests. |
| (5) | Includes 0.00% for the year ended April 30, 2023 attributed to borrowing costs (line of credit fees) which are not subject to waiver by the advisor. |
See accompanying notes to financial statements.
15
| Eagle MLP Strategy Fund |
| FINANCIAL HIGHLIGHTS |
Per Share Data and Ratios for a Share of Beneficial Interest Outstanding Throughout Each Year
| Year Ended | Year Ended | Year Ended | Year Ended | Period Ended | ||||||||||||||||
| April 30, | April 30, | April 30, | April 30, | April 30, | ||||||||||||||||
| Class N | 2023 | 2022 | 2021 | 2020 | 2019 (1) | |||||||||||||||
| Net asset value, beginning of period | $ | 6.68 | $ | 4.91 | $ | 3.55 | $ | 6.50 | $ | 7.39 | ||||||||||
| Activity from investment operations: | ||||||||||||||||||||
| Net investment income (loss) (2) | 0.18 | 0.14 | 0.13 | 0.19 | (0.11 | ) | ||||||||||||||
| Net realized and unrealized gain (loss) on investments | 0.64 | 1.96 | 1.53 | (2.64 | ) | (0.41 | ) | |||||||||||||
| Total from investment operations | 0.82 | 2.10 | 1.66 | (2.45 | ) | (0.52 | ) | |||||||||||||
| Less distributions from: | ||||||||||||||||||||
| Net investment income | (0.21 | ) | (0.18 | ) | (0.25 | ) | (0.16 | ) | (0.25 | ) | ||||||||||
| Return of capital | (0.19 | ) | (0.15 | ) | (0.05 | ) | (0.34 | ) | (0.12 | ) | ||||||||||
| Total distributions | (0.40 | ) | (0.33 | ) | (0.30 | ) | (0.50 | ) | (0.37 | ) | ||||||||||
| Net asset value, end of period | $ | 7.10 | $ | 6.68 | $ | 4.91 | $ | 3.55 | $ | 6.50 | ||||||||||
| Total return (3) | 12.52 | % | 43.58 | % | 49.31 | % | (39.91 | )% | (6.90 | )% (8) | ||||||||||
| Net assets, at end of period (000s) | $ | 33,686 | $ | 36,853 | $ | 31,199 | $ | 66,397 | $ | 258,197 | ||||||||||
| Ratio of gross expenses to average net assets (4)(5)(7) | 1.73 | % (6) | 1.72 | % | 1.84 | % | 1.55 | % | 1.50 | % | ||||||||||
| Ratio of net expenses to average net assets (5)(7) | 1.26 | % (6) | 1.26 | % | 1.29 | % | 1.27 | % | 1.27 | % | ||||||||||
| Ratio of net investment income (loss) to average net assets (5)(7) | 2.63 | % (6) | 2.39 | % | 3.33 | % | 3.36 | % | (2.30 | )% | ||||||||||
| Portfolio Turnover Rate | 46 | % | 26 | % | 82 | % | 69 | % | 36 | % (8) | ||||||||||
| (1) | The Eagle MLP Strategy Fund’s Class N shares commenced operations on August 16, 2018. |
| (2) | Per share amounts calculated using the average shares method, which more appropriately presents the per share data for the period. |
| (3) | Total returns shown are historical in nature and assume changes in share price, reinvestment of dividends and distributions, if any, and exclude the effect of applicable sales charges and redemption fees. Had the co-advisers not waived a portion of their fees, total returns would have been lower. |
| (4) | Represents the ratio of expenses to average net assets absent fee waivers and/or expense reimbursements by the co-advisers. |
| (5) | Does not include the Fund’s share of the expenses of the underlying investment companies in which the Fund invests. Recognition of investment income (loss) by the Fund is affected by the timing and declaration of dividends by underlying investment companies in which the Fund invests. |
| (6) | Includes 0.00% for the year ended April 30, 2023 attributed to borrowing costs (line of credit fees) which are not subject to waiver by the advisor. |
| (7) | Annualized for periods less than one year. |
| (8) | Not annualized. |
See accompanying notes to financial statements.
16
| Eagle MLP Strategy Fund |
| NOTES TO FINANCIAL STATEMENTS |
| April 30, 2023 |
| 1. | ORGANIZATION |
The Eagle MLP Strategy Fund (the “Fund”) is a non-diversified series of shares of beneficial interest of Northern Lights Fund Trust (the “Trust”), a statutory trust organized under the laws of the State of Delaware on January 19, 2005, and registered under the Investment Company Act of 1940, as amended (the “1940 Act”), as an open-end management investment company. The Fund’s investment objective is to seek total return from income and capital appreciation.
The Fund currently offers Class A, Class C, Class I and Class N shares. Class C, Class I and Class N shares are offered at (“NAV”). Class A shares are offered at NAV plus a maximum sales charge of 5.75%, depending on how much you invest, which may be waived by the co-advisers under certain circumstances. Each class represents an interest in the same assets of the Fund and classes are identical except for differences in their sales charge structures and ongoing service and distribution charges. All classes of shares have equal voting privileges except that each class has exclusive voting rights with respect to its service and/or distribution plans. The Fund’s income, expenses (other than class specific distribution fees) and realized and unrealized gains and losses are allocated proportionately each day based upon the relative net assets of each class.
| 2. | SIGNIFICANT ACCOUNTING POLICIES |
The following is a summary of significant accounting policies set by the Trust and followed by the Fund in preparation of its financial statements. These policies are in conformity with accounting principles generally accepted in the United States of America (“GAAP”). The preparation of financial statements requires management to make estimates and assumptions that affect the reported amounts of assets and liabilities and disclosure of contingent assets and liabilities at the date of the financial statements and the reported amounts of income and expenses for the period. Actual results could differ from those estimates. The Fund is an investment company and accordingly follows the investment company accounting and reporting guidance of the Financial Accounting Standards Board (“FASB”) Accounting Standards Codification Topic 946 “Financial Services – Investment Companies” including FASB Accounting Standards Update (“ASU”) 2013-08.
Securities Valuation – Securities listed on an exchange are valued at the last reported sale price at the close of the regular trading session of the primary exchange on the business day the value is being determined, or in the case of securities listed on NASDAQ at the NASDAQ Official Closing Price (“NOCP”). In the absence of a sale, such securities shall be valued at the mean between the current bid and ask prices on the primary exchange on the day of valuation. Debt securities (other than short-term obligations) are valued each day by an independent pricing service approved by the Trust’s Board of Trustees (the “Board”) based on methods which include consideration of: yields or prices of securities of comparable quality, coupon, maturity and type, indications as to values from dealers, and general market conditions or market quotations from a major market maker in the securities. Investments valued in currencies other than the U.S. dollar are converted to U.S. dollars using exchange rates obtained from pricing services. The independent pricing service does not distinguish between smaller-sized bond positions known as “odd lots” and larger institutional -sized bond positions known as “round lots”. The Fund may fair value a particular bond if a co-adviser does not believe that
17
| Eagle MLP Strategy Fund |
| NOTES TO FINANCIAL STATEMENTS (Continued) |
| April 30, 2023 |
the round lot value provided by the independent pricing service reflects fair value of the Fund’s holding. Short-term debt obligations having 60 days or less remaining until maturity, at time of purchase, may be valued at amortized cost, which approximates fair value. Investments in open-end investment companies are valued at NAV.
The Fund may hold securities, such as private investments, interests in commodity pools, other non-traded securities or temporarily illiquid securities, for which market quotations are not readily available or are determined to be unreliable. These securities will be valued using the “fair value” procedures approved by the Board. The Board has delegated execution of these procedures to the Adviser as its valuation designee (the “Valuation Designee”). The Board may also enlist third party consultants such as a valuation specialist at a public accounting firm, valuation consultant or financial officer of a security issuer on an as-needed basis to assist the Valuation Designee in determining a security-specific fair value. The Board is responsible for reviewing and approving fair value methodologies utilized by the Valuation Designee, which approval shall be based upon whether the Valuation Designee followed the valuation procedures established by the Board.
Exchange Traded Notes – The Fund may invest in exchange traded notes (“ETNs”). ETNs are a type of debt security that is linked to the performance of underlying securities. The risks of owning ETNs generally reflect the risks of owning the underlying securities they are designed to track. In addition, ETNs are subject to credit risk generally to the same extent as debt securities.
Fair Valuation Process – The applicable investments are valued by the Valuation Designee pursuant to valuation procedures established by the Board. For example, fair value determinations are required for the following securities: (i) securities for which market quotations are insufficient or not readily available on a particular business day (including securities for which there is a short and temporary lapse in the provision of a price by the regular pricing source); (ii) securities for which, in the judgment of the Valuation Designee, the prices or values available do not represent the fair value of the instrument; factors which may cause the Valuation Designee to make such a judgment include, but are not limited to, the following: only a bid price or an ask price is available; the spread between bid and ask prices is substantial; the frequency of sales; the thinness of the market; the size of reported trades; and actions of the securities markets, such as the suspension or limitation of trading; (iii) securities determined to be illiquid; and (iv) securities with respect to which an event that affects the value thereof has occurred (a “significant event”) since the closing prices were established on the principal exchange on which they are traded, but prior to a Fund’s calculation of its NAV. Specifically, interests in commodity pools or managed futures pools are valued on a daily basis by reference to the closing market prices of each futures contract or other asset held by a pool, as adjusted for pool expenses. Restricted or illiquid securities, such as private investments or non-traded securities are valued based upon the current bid for the security from two or more independent dealers or other parties reasonably familiar with the facts and circumstances of the security (who should take into consideration all relevant factors as may be appropriate under the circumstances). If a current bid from such independent dealers or other independent parties is unavailable, the Valuation Designee shall determine the fair value of such security using the following factors: (i) the type of security; (ii) the cost at date of purchase; (iii) the size and nature of the Fund’s holdings; (iv) the discount from market
18
| Eagle MLP Strategy Fund |
| NOTES TO FINANCIAL STATEMENTS (Continued) |
| April 30, 2023 |
value of unrestricted securities of the same class at the time of purchase and subsequent thereto; (v) information as to any transactions or offers with respect to the security; (vi) the nature and duration of restrictions on disposition of the security and the existence of any registration rights; (vii) how the yield of the security compares to similar securities of companies of similar or equal creditworthiness; (viii) the level of recent trades of similar or comparable securities; (ix) the liquidity characteristics of the security; (x) current market conditions; and (xi) the market value of any securities into which the security is convertible or exchangeable.
The Fund utilizes various methods to measure the fair value of all of its investments on a recurring basis. GAAP establishes a hierarchy that prioritizes inputs to valuation methods. The three levels of input are:
Level 1 – Unadjusted quoted prices in active markets for identical assets and liabilities that the Fund has the ability to access.
Level 2 – Observable inputs other than quoted prices included in Level 1 that are observable for the asset or liability, either directly or indirectly. These inputs may include quoted prices for the identical instrument in an inactive market, prices for similar instruments, interest rates, prepayment speeds, credit risk, yield curves, default rates and similar data.
Level 3 – Unobservable inputs for the asset or liability, to the extent relevant observable inputs are not available, representing the Fund’s own assumptions about the assumptions a market participant would use in valuing the asset or liability, and would be based on the best information available.
The availability of observable inputs can vary from security to security and is affected by a wide variety of factors, including, for example, the type of security, whether the security is new and not yet established in the marketplace, the liquidity of markets, and other characteristics particular to the security. To the extent that valuation is based on models or inputs that are less observable or unobservable in the market, the determination of fair value requires more judgment. Accordingly, the degree of judgment exercised in determining fair value is greatest for instruments categorized in Level 3.
The inputs used to measure fair value may fall into different levels of the fair value hierarchy. In such cases, for disclosure purposes, the level in the fair value hierarchy within which the fair value measurement falls in its entirety, is determined based on the lowest level input that is significant to the fair value measurement in its entirety.
The inputs or methodology used for valuing securities are not necessarily an indication of the risk associated with investing in those securities. Please refer to the Fund’s prospectus for a full listing of risks associated with these investments. The following tables summarize the inputs used as of April 30, 2023 for the Fund’s assets measured at fair value:
19
| Eagle MLP Strategy Fund |
| NOTES TO FINANCIAL STATEMENTS (Continued) |
| April 30, 2023 |
| Assets * | Level 1 | Level 2 | Level 3 | Total | ||||||||||||
| MLP & MLP Related Securities | $ | 89,654,945 | $ | — | $ | — | $ | 89,654,945 | ||||||||
| Short Term Investment | 658 | — | — | 658 | ||||||||||||
| Total | $ | 89,655,603 | $ | — | $ | — | $ | 89,655,603 | ||||||||
The Fund did not hold any Level 2 or Level 3 securities during the period.
| * | See Schedule of Investments for industry classification. |
Security Transactions and Related Income – Security transactions are accounted for on a trade date basis. Interest income is recognized on an accrual basis. Discounts are accreted and premiums are amortized on securities purchased over the lives of the respective securities. Dividend income is recorded on the ex-dividend date. Realized gains or losses from sales of securities are determined by comparing the identified cost of the security lot sold with the net sales proceeds.
Master Limited Partnerships – The Fund invests in Master Limited Partnerships (“MLPs”) which are publicly traded partnerships engaged in, among other things, the transportation, storage and processing of minerals and natural resources, and are treated as partnerships for U.S. federal income tax purposes. By confining their operations to these specific activities, their interests, or units, are able to trade on public securities exchanges exactly like the shares of a corporation, without entity level taxation. Of the roughly ninety MLPs in existence, fifty are eligible for inclusion in the Alerian MLP Index, approximately two-thirds trade on the NYSE and the rest trade on the NASDAQ. To qualify as a MLP and to not be taxed as a corporation, a partnership must receive at least 90% of its income from qualifying sources as set forth in Section 7704(d) of the Internal Revenue Code of 1986, as amended (the “Code”). These qualifying sources include natural resource based activities such as the processing, transportation and storage of mineral or natural resources. MLPs generally have two classes of owners, the general partner and limited partners. The general partner of an MLP is typically owned by a major energy company, an investment fund, the direct management of the MLP, or is an entity owned by one or more of such parties. The general partner may be structured as a private or publicly traded corporation or other entity. The general partner typically controls the operations and management of the MLP through an up to 2% equity interest in the MLP plus, in many cases, ownership of common units and subordinated units. Limited partners typically own the remainder of the partnership, through ownership of common units, and have a limited role in the partnership’s operations and management.
MLPs are typically structured such that common units and general partner interests have first priority to receive quarterly cash distributions up to an established minimum amount (“minimum quarterly distribution” or “MQD”). Common and general partner interests also accrue arrearages in distributions to the extent MQD is not paid. Once common and general partner interests have been paid, subordinated units receive distributions of up to MQD; however, subordinated units do not accrue arrearages. Distributable cash in excess of MQD is paid to both common and subordinated units and is distributed to both common and subordinated units generally on a pro rata basis. The general partner is also eligible to receive incentive distributions if the general partner operates the business in a manner which results in distributions paid per common unit surpassing specified target levels. As the general partner increases cash distributions to the limited partners, the general partner receives an increasingly higher percentage of the incremental cash distributions.
20
| Eagle MLP Strategy Fund |
| NOTES TO FINANCIAL STATEMENTS (Continued) |
| April 30, 2023 |
Allocation of Income, Expenses, Gains and Losses – Income, expenses (other than those attributable to a specific class), gains and losses are allocated on a daily basis to each class of shares based upon the relative proportion of net assets represented by such class. Operating expenses directly attributable to a specific class are charged against the operations of that class.
Dividends and Distributions to Shareholders – Dividends from net investment income, if any, are declared and paid quarterly. Distributable net realized capital gains, if any, are declared and distributed annually. Dividends from net investment income and distributions from net realized gains are determined in accordance with federal income tax regulations, which may differ from GAAP. These “book/tax” differences are considered either temporary (e.g., deferred losses) or permanent in nature. To the extent these differences are permanent in nature, such amounts are reclassified within the composition of net assets based on their federal tax-basis treatment; temporary differences do not require reclassification. Dividends and distributions to shareholders are recorded on the ex-dividend date.
Expenses – Expenses of the Trust that are directly identifiable to a specific fund are charged to that fund. Expenses, which are not readily identifiable to a specific fund, are allocated in such a manner as deemed equitable (as determined by the Board), taking into consideration the nature and type of expense and the relative sizes of the funds in the Trust.
Credit Facility – Effective August 2, 2021, the Fund entered into a revolving, uncommitted $120,000,000 line of credit with U.S. Bank National Association (the “Revolving Credit Agreement”) which expired on July 31, 2022. Effective August 1, 2022, the Fund entered into an amended and restated agreement, dated August 1, 2022, with a $170,000,000 line credit with U.S. Bank National Association (the “Amended and Restated Revolving Credit Agreement”). Borrowings under the Amended and Restated Revolving Credit Agreement bear interest at Prime Rate minus 1% per month. There are no fees charged on the unused portion of the line of credit. For the year ended April 30, 2022 through April 30, 2023, amounts outstanding to the Fund under the credit facility at no time were permitted to exceed $170,000,000.
For the year ended April 30, 2023, the interest expense was $2,724 for the Fund. There was an outstanding balance of $358,000, with an effective rate of 7.00%, as of April 30, 2023. The average borrowings for the Fund for the period the line was drawn, May 1, 2022 through April 30, 2023, was $372,400 at an average borrowing rate of 4.64%. For the year ended April 30, 2023, the maximum borrowing was $2,164,000 at a maximum interest rate of 7.00%.
Federal Income Taxes – The Fund intends to comply with the requirements of the Code applicable to regulated investment companies and to distribute all of its taxable income to its shareholders. Therefore, no provision for federal income tax is required. The Fund recognizes the tax benefits of uncertain tax positions only where the position is “more likely than not” to be sustained assuming examination by tax authorities. Management has analyzed the Fund’s tax positions, and has concluded that no liability for unrecognized tax benefits should be recorded related to uncertain tax positions taken on tax returns filed for the open tax years 2020 – 2022, or expected to be taken in the Fund’s
21
| Eagle MLP Strategy Fund |
| NOTES TO FINANCIAL STATEMENTS (Continued) |
| April 30, 2023 |
2023 tax returns. The Fund identifies its major tax jurisdictions as U.S. federal, Ohio and foreign jurisdictions where the Fund makes significant investments; however, the Fund is not aware of any tax positions for which it is reasonably possible that the total amounts of unrecognized tax benefits will change materially in the next twelve months.
Indemnification – The Trust indemnifies its officers and Trustees for certain liabilities that may arise from the performance of their duties to the Trust. Additionally, in the normal course of business, the Fund enters into contracts that contain a variety of representations and warranties and which provide general indemnities. The Fund’s maximum exposure under these arrangements is unknown, as this would involve future claims that may be made against the Fund that have not yet occurred. However, based on experience, the risk of loss due to these warranties and indemnities appears to be remote.
| 3. | INVESTMENT TRANSACTIONS |
For the year ended April 30, 2023, cost of purchases and proceeds from sales of portfolio securities, other than short-term investments and U.S. government securities, amounted to $40,816,664 and $47,309,098 respectively.
| 4. | INVESTMENT ADVISORY AGREEMENT AND TRANSACTIONS WITH RELATED PARTIES |
Princeton Fund Advisors, LLC and Eagle Global Advisors, LLC, serve as the Fund’s investment co-advisers (the “Co-Advisers”). Pursuant to an investment advisory agreement with the Trust, on behalf of the Fund, the Co-Advisers, under the oversight of the Board, direct the daily operations of the Fund and supervise the performance of administrative and professional services provided by others. As compensation for their services and the related expenses borne by the Co-Advisers, the Fund pays the Co-Advisers a management fee, computed and accrued daily and paid monthly, at an annual rate of 1.25% of the Fund’s average daily net assets. For the year ended April 30 2023, the Fund incurred advisory fees of $1,120,351.
Pursuant to a written contract (the “Waiver Agreement”), the Co-Advisers have agreed, at least until August 31, 2023, to waive a portion of their advisory fee and have agreed to reimburse the Fund for other expenses to the extent necessary so that the total expenses incurred by the Fund (excluding expenses such as any front-end or contingent deferred loads, brokerage fees and commissions, acquired fund fees and expenses, fees and expenses associated with investments in other collective investment vehicles or derivative instruments (including for example option and swap fees and expenses), borrowing costs (such as interest and dividend expense on securities sold short), taxes, and extraordinary expenses such as litigation expenses (which may include indemnification of Fund officers and Trustees, contractual indemnification of Fund service providers (other than a Co-Adviser)) do not exceed 1.65% per annum of Class A average daily net assets, 2.40% per annum of Class C average daily net assets, 1.40% per annum of Class I average daily net assets and 1.26% per annum of Class N average daily net assets (the “Expense Limitation”). For the year ended April 30, 2023, the Co-Advisers waived expenses of $342,018 pursuant to the Waiver Agreement.
22
| Eagle MLP Strategy Fund |
| NOTES TO FINANCIAL STATEMENTS (Continued) |
| April 30, 2023 |
If the Co-Advisers waive any fees or reimburse any expenses pursuant to the Waiver Agreement, and the Fund’s operating expenses attributable to Class A, Class C, Class I and Class N shares, respectively, are subsequently less than the Expense Limitation, the Co-Advisers shall be entitled to reimbursement by the Fund for such waived fees or reimbursed expenses provided that such reimbursement does not cause the Fund’s expenses to exceed the Expense Limitation and any expense limitation in effect at the time of recoupment. If the operating expenses attributable to the Class A, Class C, Class I and Class N shares subsequently exceed the Expense Limitation, the reimbursements shall be suspended. The Co-Advisers may seek reimbursement only for expenses waived or paid by it during the three years prior to such reimbursement; provided, however, that such expenses may only be reimbursed to the extent they were waived or paid after the effective date of the Waiver Agreement (or any similar agreement). The Board may terminate the Waiver Agreement at any time.
The following amounts are subject to recapture by the Co-Advisers by the following dates:
| April 30, 2024 | April 30, 2025 | April 30, 2026 | |||||||||
| $ | 380,807 | $ | 315,411 | $ | 342,018 | ||||||
Distributor – The Trust, with respect to the Fund, has adopted the Trust’s Master Distribution and Shareholder Servicing Plans pursuant to Rule 12b-1 under the 1940 Act for each of its Class A and Class C shares (the “Plans”). The Plans provide that a monthly service and/or distribution fee is calculated by the Fund at annual rates of 0.25% and 1.00% of the average daily net assets attributable to Class A shares and Class C shares, respectively, and is paid to Northern Lights Distributors, LLC (“NLD” or the “Distributor”), to provide compensation for ongoing distribution-related activities or services and/or maintenance of the Fund’s shareholder accounts, not otherwise required to be provided by the Co -Advisers. Class I and Class N shares do not incur a 12b-1 fee. The Plans are compensation plans, which mean that compensation is provided regardless of 12b-1 expenses incurred. For the year ended April 30, 2023, the Fund paid $17,141 and $70,347 to the Distributor for Class A and Class C shares, respectively.
The Distributor acts as the Fund’s principal underwriter in a continuous public offering of the Fund’s shares. On sales of Class A shares, for the year ended April 30, 2023, the Distributor received $19,328 from front-end sales charge of which $2,788 was retained by the Distributor or other affiliated broker-dealers.
In addition, certain affiliates of the Distributor provide services to the Fund as follows:
Ultimus Fund Solutions, LLC (“UFS”) – UFS, an affiliate of the Distributor, provides administration, fund accounting, and transfer agent services to the Trust. Pursuant to separate servicing agreements with UFS, the Fund pays UFS customary fees for providing administration, fund accounting and transfer agency services to the Fund. Certain officers of the Trust are also officers of UFS, and are not paid any fees directly by the Trust for serving in such capacities.
23
| Eagle MLP Strategy Fund |
| NOTES TO FINANCIAL STATEMENTS (Continued) |
| April 30, 2023 |
Northern Lights Compliance Services, LLC (“NLCS”) – NLCS, an affiliate of UFS and the Distributor, provides a Chief Compliance Officer to the Trust, as well as related compliance services, pursuant to a consulting agreement between NLCS and the Trust. Under the terms of such agreement, NLCS receives customary fees from the Fund.
Blu Giant LLC (“Blu Giant”) – Blu Giant, an affiliate of UFS and the Distributor, provides EDGAR conversion and filing services as well as print management services for the Fund on an ad-hoc basis. For the provision of these services, Blu Giant receives customary fees from the Fund.
| 5. | DISTRIBUTIONS TO SHAREHOLDERS AND TAX COMPONENTS OF CAPITAL |
The tax character of distributions paid during the tax years ended October 31, 2022, and October 31, 2021 was as follows:
| Tax Year Ended | Fiscal Year Ended | |||||||
| October 31, 2022 | October 31, 2021 | |||||||
| Ordinary Income | $ | 2,022,344 | $ | 4,605,335 | ||||
| Long-Term Capital Gain | — | — | ||||||
| Return of Capital | 3,076,809 | — | ||||||
| $ | 5,099,153 | $ | 4,605,335 | |||||
The components of accumulated earnings/(deficit) on a tax basis as of October 31, 2022, adjusted for activity through fiscal year end April 30, 2023, were as follows:
| Undistributed | Undistributed | Post October Loss | Capital Loss | Other | Unrealized | Total | ||||||||||||||||||||
| Ordinary | Long-Term | and | Carry | Book/Tax | Appreciation/ | Distributable Earnings/ | ||||||||||||||||||||
| Income | Gains | Late Year Loss | Forwards | Differences | (Depreciation) | (Accumulated Deficit) | ||||||||||||||||||||
| $ | 12,847,486 | $ | — | $ | — | $ | (437,965,960 | ) | $ | — | $ | 13,998,197 | $ | (411,120,277 | ) | |||||||||||
The difference between book basis and tax basis unrealized appreciation, accumulated net realized losses from security transactions and undistributed net investment income is primarily attributable to tax adjustments for partnerships and the tax deferral of losses on wash sales. The unrealized appreciation in the table above includes unrealized foreign currency losses of $(3,240).
At the Fund’s tax year end of October 31, 2022, the Fund had capital loss carry forwards for federal income tax purposes available to offset future capital gains, along with capital loss carry forwards utilized as follows:
| Short-Term | Long-Term | Total | CLCF Utilized | |||||||||||
| $ | 69,751,988 | $ | 371,912,230 | $ | 441,664,218 | $ | 11,454,744 | |||||||
Permanent book and tax differences, primarily attributable to tax adjustments for distributions in excess, resulted in reclassifications for the Fund for the fiscal year ended April 30, 2023, as follows:
| Paid | ||||||
| In | Accumulated | |||||
| Capital | Deficit | |||||
| $ | (3,076,809 | ) | $ | 3,076,809 | ||
24
| Eagle MLP Strategy Fund |
| NOTES TO FINANCIAL STATEMENTS (Continued) |
| April 30, 2023 |
| 6. | AGGREGATE UNREALIZED APPRECIATION AND DEPRECIATION – TAX BASIS |
| Gross | Gross | |||||||||||||
| Unrealized | Unrealized | Net Unrealized | ||||||||||||
| Tax Cost | Appreciation | (Depreciation) | Appreciation | |||||||||||
| $ | 75,654,166 | $ | 40,621,812 | $ | (26,620,375 | ) | $ | 14,001,437 | ||||||
| 7. | SUBSEQUENT EVENTS |
Subsequent events after the date of the Statement of Assets and Liabilities have been evaluated through the date the financial statements were issued.
Management has determined that no events or transactions occurred requiring adjustment or disclosure in the financial statements.
25
Report of Independent Registered Public Accounting Firm
To the Board of Trustees of Northern Lights Fund Trust
and the Shareholders of Eagle MLP Strategy Fund
Opinion on the Financial Statements
We have audited the accompanying statement of assets and liabilities of Eagle MLP Strategy Fund (the Fund), including the schedule of investments, as of April 30, 2023, the related statements of operations for the year then ended, the statements of changes in net assets for each of the two years in the period then ended, and the related notes to the financial statements (collectively, the financial statements), and the financial highlights for each of the five years in the period then ended. In our opinion, the financial statements and financial highlights present fairly, in all material respects, the financial position of the Fund as of April 30, 2023, the results of its operations for the year then ended, the changes in net assets for each of the two years in the period then ended, and the financial highlights for each of the five years in the period then ended, in conformity with accounting principles generally accepted in the United States of America.
Basis for Opinion
These financial statements are the responsibility of the Fund’s management. Our responsibility is to express an opinion on the Fund’s financial statements and financial highlights based on our audits. We are a public accounting firm registered with the Public Company Accounting Oversight Board (United States) (PCAOB) and are required to be independent with respect to the Fund in accordance with U.S. federal securities laws and the applicable rules and regulations of the Securities and Exchange Commission and the PCAOB.
We conducted our audits in accordance with the standards of the PCAOB. Those standards require that we plan and perform the audit to obtain reasonable assurance about whether the financial statements are free of material misstatement, whether due to error or fraud. The Fund is not required to have, nor were we engaged to perform, an audit of its internal control over financial reporting. As part of our audits, we are required to obtain an understanding of internal control over financial reporting but not for the purpose of expressing an opinion on the effectiveness of the Fund’s internal control over financial reporting. Accordingly, we express no such opinion.
Our audits included performing procedures to assess the risks of material misstatement of the financial statements, whether due to error or fraud, and performing procedures that respond to those risks. Such procedures included examining, on a test basis, evidence regarding the amounts and disclosures in the financial statements. Our procedures included confirmation of securities owned as of April 30, 2023, by correspondence with the custodian and brokers or by other appropriate auditing procedures where replies from brokers were not received. Our audits also included evaluating the accounting principles used and significant estimates made by management, as well as evaluating the overall presentation of the financial statements. We believe that our audits provide a reasonable basis for our opinion.
/s/ RSM US LLP
We have served as the auditor of one or more Princeton Fund Advisors, LLC advised investment companies since 2010.
Denver, Colorado
June 29, 2023
26
| Eagle MLP Strategy Fund |
| EXPENSE EXAMPLES (Unaudited) |
| April 30, 2023 |
As a shareholder of the Eagle MLP Strategy Fund, you incur two types of costs: (1) transaction costs, including sales charges (loads) on purchases of Class A shares; and (2) ongoing costs, including management fees, distribution and/or service (12b-1) fees, and other Fund expenses. This example is intended to help you understand your ongoing costs (in dollars) of investing in the Fund and to compare these costs with the ongoing costs of investing in other mutual funds.
The example is based on an investment of $1,000 invested at the beginning of the period and held for the entire period from November 1, 2022 through April 30, 2023.
Actual Expenses
The “Actual” lines in the table below provide information about actual account values and actual expenses. You may use the information below, together with the amount you invested, to estimate the expenses that you paid over the period. Simply divide your account value by $1,000 (for example, an $8,600 account value divided by $1,000 = 8.6), then multiply the result by the number in the table under the heading entitled “Expenses Paid During Period” to estimate the expenses you paid on your account during this period.
Hypothetical Example for Comparison Purposes
The “Hypothetical” lines in the table below provide information about hypothetical account values and hypothetical expenses based on the Fund’s actual expense ratio and an assumed rate of return of 5% per year before expenses, which is not the Fund’s actual return. The hypothetical account values and expenses may not be used to estimate the actual ending account balances or expenses you paid for the period. You may use this information to compare this 5% hypothetical example with the 5% hypothetical examples that appear in the shareholder reports of other funds.
Please note that the expenses shown in the table are meant to highlight your ongoing costs only and do not reflect any transactional costs, such as sales charges (loads), or redemption fees. Therefore, the table is useful in comparing ongoing costs only, and will not help you determine the relative total costs of owning different funds. In addition, if these transactional costs were included, your costs would have been higher.
| Beginning | Ending Account | Expenses Paid | Expense Ratio | |||||
| Account Value | Value | During Period | During Period** | |||||
| Actual | 11/1/2022 | 4/30/2023 | 11/1/2022 – 4/30/2023 | 11/1/2022 – 4/30/2023 | ||||
| Class A | $1,000.00 | $1,012.50 | $16.60 | 1.65% | ||||
| Class C | $1,000.00 | $1,008.90 | $24.11 | 2.40% | ||||
| Class I | $1,000.00 | $1,014.00 | $14.10 | 1.40% | ||||
| Class N | $1,000.00 | $1,015.30 | $14.11 | 1.26% | ||||
| Beginning | Ending Account | Expenses Paid | Expense Ratio | |||||
| Hypothetical | Account Value | Value | During Period | During Period** | ||||
| (5% return before expenses) | 11/1/2022 | 4/30/2023 | 11/1/2022 – 4/30/2023 | 11/1/2022 – 4/30/2023 | ||||
| Class A | $1,000.00 | $1,016.61 | $8.25 | 1.65% | ||||
| Class C | $1,000.00 | $1,012.89 | $11.98 | 2.40% | ||||
| Class I | $1,000.00 | $1,017.85 | $7.00 | 1.40% | ||||
| Class N | $1,000.00 | $1,018.55 | $6.31 | 1.26% |
| * | Actual expenses are equal to the average account value over the period, multiplied by the Fund’s annualized expense ratio, multiplied by the number of days in the period (181) divided by the number of days in the fiscal year (365). “Hypothetical” expense information is presented on the basis of the full one-half year period to enable a comparison to other funds. It is based on assuming the same net expense ratio and average account value over the period but is multiplied by 181/365 (to reflect the full half-year period). |
| ** | Annualized. |
27
| Eagle MLP Strategy Fund |
| SUPPLEMENTAL INFORMATION (Unaudited) |
| April 30, 2023 |
The Trustees and the executive officers of the Trust are listed below with their present positions with the Trust and principal occupations over at least the last five years. The business address of each Trustee and Officer is 225 Pictoria Drive, Suite 450, Cincinnati, OH 45246. All correspondence to the Trustees and Officers should be directed to c/o Ultimus Fund Solutions, LLC, P.O. Box 541150, Omaha, Nebraska 68154.
Independent Trustees
| Name, Address and Year of Birth | Position/Term of Office* | Principal Occupation During the Past Five Years | Number of Portfolios in Fund Complex** Overseen by Trustee | Other Directorships held by Trustee During the Past Five Years |
| Mark Garbin Born in 1951 | Trustee Since 2013 | Managing Principal, Coherent Capital Management LLC (since 2007). | 5 | Northern Lights Fund Trust (for series not affiliated with the Funds since 2013); Two Roads Shared Trust (since 2012); Forethought Variable Insurance Trust (since 2013); Northern Lights Variable Trust (since 2013); OHA Mortgage Strategies Fund (offshore), Ltd. (2014 - 2017); and Altegris KKR Commitments Master Fund (since 2014); Carlyle Tactical Private Credit Fund (since March 2018) and Independent Director OHA CLO Enhanced Equity II Genpar LLP (since June 2021). |
| Mark D. Gersten Born in 1950 | Trustee Since 2013 | Independent Consultant (since 2012). | 5 | Northern Lights Fund Trust (for series not affiliated with the Funds since 2013); Northern Lights Variable Trust (since 2013); Two Roads Shared Trust (since 2012); Altegris KKR Commitments Master Fund (since 2014); previously, Ramius Archview Credit and Distressed Fund (2015-2017); and Schroder Global Series Trust (2012 to 2017). |
| Anthony J. Hertl Born in 1950 | Trustee Since 2005; Chairman of the Board since 2013 | Retired, previously held several positions in a major Wall Street firm including Capital Markets Controller, Director of Global Taxation, and CFO of the Specialty Finance Group. | 5 | Northern Lights Fund Trust (for series not affiliated with the Funds since 2005); Northern Lights Variable Trust (since 2006); Alternative Strategies Fund (since 2010); Satuit Capital Management Trust (2007-2019). |
| Gary W. Lanzen Born in 1954 | Trustee Since 2005 | Retired (since 2012). Formerly, Founder, President, and Chief Investment Officer, Orizon Investment Counsel, Inc. (2000-2012). | 5 | Northern Lights Fund Trust (for series not affiliated with the Funds since 2005) Northern Lights Variable Trust (since 2006); AdvisorOne Funds (since 2003); Alternative Strategies Fund (since 2010); and previously, CLA Strategic Allocation Fund (2014-2015). |
| John V. Palancia Born in 1954 | Trustee Since 2011 | Retired (since 2011). Formerly, Director of Futures Operations, Merrill Lynch, Pierce, Fenner & Smith Inc. (1975-2011). | 5 | Northern Lights Fund Trust (for series not affiliated with the Funds since 2011); Northern Lights Fund Trust III (since February 2012); Alternative Strategies Fund (since 2012) and Northern Lights Variable Trust (since 2011). |
| Mark H. Taylor Born in 1964 | Trustee Since 2007; Chairman of the Audit Committee since 2013 | PhD (Accounting), CPA; Professor and Director, Lynn Pippenger School of Accountancy, Muma College of Business, University of South Florida (2019 – present); Professor and Department of Accountancy Chair, Case Western Reserve University (2009-2019); President, American Accounting Association (AAA) commencing August 2022 (President-Elect 2022-2023, President 2023-2024; Past President 2024- 2025). AAA Vice President-Finance (2017-2020); President, Auditing Section of the AAA; Member, AICPA Auditing Standards Board (2009-2012); Academic Fellow, Office of the Chief Accountant, United States Securities Exchange Commission (2005-2006); Center for Audit Quality research grants (2014, 2012). | 5 | Northern Lights Fund Trust (for series not affiliated with the Funds since 2007); Alternative Strategies Fund (since 2010); Northern Lights Fund Trust III (since 2012); and Northern Lights Variable Trust (since 2007). |
28
| Eagle MLP Strategy Fund |
| SUPPLEMENTAL INFORMATION (Unaudited)(Continued) |
| April 30, 2023 |
Officers
| Name, Address and Year of Birth | Position/Term of Office* | Principal Occupation During the Past Five Years | Number of Portfolios in Fund Complex** Overseen by Trustee | Other Directorships held by Trustee During the Past Five Years |
| Kevin E. Wolf Born in 1969 | President, Principal Executive Officer Since June 2017 | Executive Vice President, Head of Fund Administration, and Product; Ultimus Fund Solutions, LLC (since 2020); Vice President of The Ultimus Group, LLC (since 2019); Executive Vice President, Gemini Fund Services, LLC (2019-2020); President, Gemini Fund Services, LLC (2012-2019); Treasurer of the Trust (2006-June 2017). | N/A | N/A |
| James Colantino Born in 1969 | Treasurer, Principal Accounting Officer Since June 2017 | Senior Vice President Fund Administration, Ultimus Fund Solutions (since 2020); Senior Vice President Fund Administration, Gemini Fund Services, LLC (2012-2020); Assistant Treasurer of the Trust (2006-June 2017). | N/A | N/A |
| Stephanie Shearer Born in 1979 | Secretary Since February 2017 | Assistant Secretary of the Trust (2012- February 2017); Associate Director, Ultimus Fund Solutions (since 2022); Manager of Legal Administration, Ultimus Fund Solutions (2020-2022); Manager of Legal Administration, Gemini Fund Services, LLC (2018-2020); Senior Paralegal, Gemini Fund Services, LLC (2013 - 2018). | N/A | N/A |
| Michael J. Nanosky Born in 1966 | Chief Compliance Officer Since January 2021 | Chief Compliance Officer, of the Trust (since January 2021); Vice President-Senior Compliance Officer, Ultimus Fund Solutions (since 2020); Vice President, Chief Compliance Officer for Williamsburg Investment Trust (2020-current); Senior Vice President- Chief Compliance Officer, PNC Funds (2014-2019). | N/A | N/A |
| * | The term of office for each Trustee and officer listed above will continue indefinitely until the individual resigns or is removed. |
| ** | As of April 30, 2023, the Trust was comprised of 66 active portfolios managed by unaffiliated investment advisers. The term “Fund Complex” applies only to the Funds in the Trust advised by the Fund’s Adviser. The Funds do not hold themselves out as related to any other series within the Trust that is not advised by the Fund’s Adviser. |
The Funds’ SAI includes additional information about the Trustees and is available free of charge, upon request, by calling toll-free at 1-888-868-9501.
29
PRIVACY NOTICE
Northern Lights Fund Trust
Rev. February 2014
| FACTS | WHAT DOES NORTHERN LIGHTS FUND TRUST DO WITH YOUR PERSONAL INFORMATION? |
| Why? | Financial companies choose how they share your personal information. Federal law gives consumers the right to limit some, but not all sharing. Federal law also requires us to tell you how we collect, share, and protect your personal information. Please read this notice carefully to understand what we do. |
| What? | The types of personal information we collect and share depends on the product or service that you have with us. This information can include:
● Social Security number and wire transfer instructions
● account transactions and transaction history
● investment experience and purchase history
When you are no longer our customer, we continue to share your information as described in this notice. |
| How? | All financial companies need to share customers’ personal information to run their everyday business. In the section below, we list the reasons financial companies can share their customers’ personal information; the reasons Northern Lights Fund Trust chooses to share; and whether you can limit this sharing. |
| Reasons we can share your personal information: | Does Northern Lights Fund Trust share information? | Can you limit this sharing? |
| For our everyday business purposes - such as to process your transactions, maintain your account(s), respond to court orders and legal investigations, or report to credit bureaus. | YES | NO |
| For our marketing purposes - to offer our products and services to you. | NO | We don’t share |
| For joint marketing with other financial companies. | NO | We don’t share |
| For our affiliates’ everyday business purposes - information about your transactions and records. | NO | We don’t share |
| For our affiliates’ everyday business purposes - information about your credit worthiness. | NO | We don’t share |
| For nonaffiliates to market to you | NO | We don’t share |
| QUESTIONS? | Call 1-402-493-4603 |
30
PRIVACY NOTICE
Northern Lights Fund Trust
| Page 2 |
| What we do: | |
How does Northern Lights Fund Trust protect my personal information? | To protect your personal information from unauthorized access and use, we use security measures that comply with federal law. These measures include computer safeguards and secured files and buildings.
Our service providers are held accountable for adhering to strict policies and procedures to prevent any misuse of your nonpublic personal information. |
How does Northern Lights Fund Trust collect my personal information? | We collect your personal information, for example, when you ● open an account or deposit money
● direct us to buy securities or direct us to sell your securities
● seek advice about your investments
We also collect your personal information from others, such as credit bureaus, affiliates, or other companies. |
Why can’t I limit all sharing? | Federal law gives you the right to limit only: ● sharing for affiliates’ everyday business purposes – information about your creditworthiness.
● affiliates from using your information to market to you.
● sharing for nonaffiliates to market to you.
State laws and individual companies may give you additional rights to limit sharing. |
| Definitions | |
| Affiliates | Companies related by common ownership or control. They can be financial and nonfinancial companies.
● Northern Lights Fund Trust does not share with our affiliates. |
| Nonaffiliates | Companies not related by common ownership or control. They can be financial and nonfinancial companies.
● Northern Lights Fund Trust does not share with nonaffiliates so they can market to you. |
| Joint marketing | A formal agreement between nonaffiliated financial companies that together market financial products or services to you.
● Northern Lights Fund Trust doesn’t jointly market. |
31
PROXY VOTING POLICY
Information regarding how the Fund voted proxies relating to portfolio securities for the most recent twelve month period ended June 30 as well as a description of the policies and procedures that the Fund uses to determine how to vote proxies is available without charge, upon request, by calling 1-888 -868-9501 or by referring to the Securities and Exchange Commission’s (“SEC”) website at http://www.sec.gov.
PORTFOLIO HOLDINGS
The Fund files its complete schedule of portfolio holdings with the SEC for the first and third quarters of each fiscal year on Form N-PORT. Form N-PORT is available on the SEC’s website at http://www.sec.gov. The information on Form N-PORT is available without charge, upon request, by calling 1-888-868-9501.
| INVESTMENT CO-ADVISERS |
| Princeton Fund Advisors, LLC |
| 1580 Lincoln Street, Suite 680 |
| Denver, CO 80203 |
| Eagle Global Advisors, LLC |
| 1330 Post Oak Blvd, Suite 3000 |
| Houston, TX 77056 |
| ADMINISTRATOR |
| Ultimus Fund Solutions, LLC |
| 225 Pictoria Drive, Suite 450 |
| Cincinnati, OH 45246 |
| EAGLE-AR23 |
Item 2. Code of Ethics.
(a) As of the end of the period covered by this report, the registrant has adopted a code of ethics that applies to the registrant's principal executive officer, principal financial officer, principal accounting officer or controller, or persons performing similar functions, regardless of whether these individuals are employed by the registrant or a third party.
(b) For purposes of this item, “code of ethics” means written standards that are reasonably designed to deter wrongdoing and to promote:
| (1) | Honest and ethical conduct, including the ethical handling of actual or apparent conflicts of interest between personal and professional relationships; |
| (2) | Full, fair, accurate, timely, and understandable disclosure in reports and documents that a registrant files with, or submits to, the Commission and in other public communications made by the registrant; |
(3) Compliance with applicable governmental laws, rules, and regulations;
| (4) | The prompt internal reporting of violations of the code to an appropriate person or persons identified in the code; and |
(5) Accountability for adherence to the code.
(c) Amendments: During the period covered by the report, there have not been any amendments to the provisions of the code of ethics.
(d) Waivers: During the period covered by the report, the registrant has not granted any express or implicit waivers from the provisions of the code of ethics.
(e) The Code of Ethics is not posted on Registrant’ website.
(f) A copy of the Code of Ethics is attached as an exhibit.
Item 3. Audit Committee Financial Expert.
(a) The Registrant’s board of trustees has determined that Mark Gersten, Anthony J. Hertl, and Mark H. Taylor are audit committee financial experts, as defined in Item 3 of Form N-CSR. Mr. Gersten, Mr. Hertl and Mr. Taylor are independent for purposes of this Item 3.
Item 4. Principal Accountant Fees and Services.
| (a) | Audit Fees |
2023 - $29,000
2022 - $28,000
| (b) | Audit-Related Fees |
2023 - None
2022 - None
| (c) | Tax Fees |
2023 - $11,000
2022 - $10,500
Preparation of Federal & State income tax returns, assistance with calculation of required income, capital gain and excise distributions and preparation of Federal excise tax returns.
| (d) | All Other Fees |
2023 - None
2022 - None
| (e) | (1) Audit Committee’s Pre-Approval Policies |
The registrant’s Audit Committee is required to pre-approve all audit services and, when appropriate, any non-audit services (including audit-related, tax and all other services) to the registrant. The registrant’s Audit Committee also is required to pre-approve, when appropriate, any non-audit services (including audit-related, tax and all other services) to its adviser, or any entity controlling, controlled by or under common control with the adviser that provides ongoing services to the registrant, to the extent that the services may be determined to have an impact on the operations or financial reporting of the registrant. Services are reviewed on an engagement by engagement basis by the Audit Committee.
| (2) | Percentages of Services Approved by the Audit Committee |
2023 2022
Audit-Related Fees: 0.00% 0.00%
Tax Fees: 0.00% 0.00%
All Other Fees: 0.00% 0.00%
| (f) | During the audit of registrant's financial statements for the most recent fiscal year, less than 50 percent of the hours expended on the principal accountant's engagement were attributed to work performed by persons other than the principal accountant's full-time, permanent employees. |
| (g) | The aggregate non-audit fees billed by the registrant's accountant for services rendered to the registrant, and rendered to the registrant's investment adviser (not including any sub-adviser whose role is primarily portfolio management and is subcontracted with or overseen by another investment adviser), and any entity controlling, controlled by, or under common control with the adviser that provides ongoing services to the registrant: |
2023 - $11,000
2022 - $10,500
(h) The registrant's audit committee has considered whether the provision of non-audit services to the registrant's investment adviser (not including any sub-adviser whose role is primarily portfolio management and is subcontracted with or overseen by another investment adviser), and any entity controlling, controlled by, or under common control with the investment adviser that provides ongoing services to the registrant, that were not pre-approved pursuant to paragraph (c)(7)(ii) of Rule 2-01 of Regulation S-X, is compatible with maintaining the principal accountant's independence.
(i) Not applicable.
(j) Not applicable.
Item 5. Audit Committee of Listed Companies. Not applicable to open-end investment companies.
Item 6. Schedule of Investments. Schedule of investments in securities of unaffiliated issuers is included under Item 1.
Item 7. Disclosure of Proxy Voting Policies and Procedures for Closed-End Funds. Not applicable to open-end investment companies.
Item 8. Portfolio Managers of Closed-End Management Investment Companies. Not applicable to open-end investment companies.
Item 9. Purchases of Equity Securities by Closed-End Funds. Not applicable to open-end investment companies.
Item 10. Submission of Matters to a Vote of Security Holders. None
Item 11. Controls and Procedures.
(a) Based on an evaluation of the Registrant’s disclosure controls and procedures as of a date within 90 days of filing date of this Form N-CSR, the principal executive officer and principal financial officer of the Registrant have concluded that the disclosure controls and procedures of the Registrant are reasonably designed to ensure that the information required in filings on Form N-CSR is recorded, processed, summarized, and reported by the filing date, including that information required to be disclosed is accumulated and communicated to the Registrant’s management, including the Registrant’s principal executive officer and principal financial officer, as appropriate to allow timely decisions regarding required disclosure.
(b) There were no significant changes in the Registrant’s internal control over financial reporting that occurred during the Registrant’s last fiscal half-year that have materially affected, or are reasonably likely to materially affect, the Registrant’s internal control over financial reporting.
Item 12. Disclosure of Securities Lending Activities for Closed-End Management Investment Companies. Not applicable to open-end investment companies.
Item 13. Exhibits.
(a)(1) Code of Ethics filed herewith.
(a)(3) Not applicable for open-end investment companies.
SIGNATURES
Pursuant to the requirements of the Securities Exchange Act of 1934 and the Investment Company Act of 1940, the registrant has duly caused this report to be signed on its behalf by the undersigned, thereunto duly authorized.
(Registrant) Northern Lights Fund Trust
By (Signature and Title)
/s/ Kevin E. Wolf
Kevin E. Wolf, Principal Executive Officer/ President
Date 7/07/23
Pursuant to the requirements of the Securities Exchange Act of 1934 and the Investment Company Act of 1940, this report has been signed below by the following persons on behalf of the registrant and in the capacities and on the dates indicated.
By (Signature and Title)
/s/ Kevin E. Wolf
Kevin E. Wolf, Principal Executive Officer/ President
Date 7/07/23
By (Signature and Title)
/s/ Jim Colantino
Jim Colantino, Principal Financial Officer/ Treasurer
Date 7/07/23