united states
securities and exchange commission
washington, d.c. 20549
form n-csr
certified shareholder report of registered management
investment companies
Investment Company Act file number 811-21720
Northern Lights Fund Trust
(Exact name of registrant as specified in charter)
225 Pictoria Drive, Suite 450 Cincinnati, OH 45246
(Address of principal executive offices) (Zip code)
Stephanie Shearer, Ultimus Fund Solutions, LLC.
80 Arkay Drive, Hauppauge, NY 11788
(Name and address of agent for service)
Registrant's telephone number, including area code: 631-470-2633
Date of fiscal year end: 4/30
Date of reporting period: 4/30/23
Item 1. Reports to Stockholders.
 | ||
| TOEWS TACTICAL INCOME FUND | ||
| TOEWS HEDGED OCEANA FUND | ||
| TOEWS HEDGED U.S. FUND | ||
| TOEWS HEDGED U.S. OPPORTUNITY FUND | ||
| TOEWS UNCONSTRAINED INCOME FUND | ||
| TOEWS TACTICAL DEFENSIVE ALPHA FUND | ||
| Annual Report | ||
| April 30, 2023 | ||
| Investor Information: 1-877-558-6397 | ||
| This report and the financial statements contained herein are submitted for the general information of shareholders and are not authorized for distribution to prospective investors unless preceded or accompanied by an effective prospectus. Nothing herein contained is to be considered an offer of sale or solicitation of an offer to buy shares of the Funds. Such offering is made only by prospectus, which includes details as to offering price and other material information. | ||
| Distributed by Northern Lights Distributors, LLC | ||
| Member FINRA | ||
Dear Shareholders,
Investing in equities and bonds has the potential to generate above-inflation returns for investors. Yet despite the many reasons for investing in these markets, financial assets remain vulnerable to infrequent, severe losses during bear market cycles. As a consequence, risk abatement strategies are desirable for investors who have a limited ability to tolerate losses. The objectives of our strategies are to provide investors with access to financial markets while seeking to reduce the risk of significant loss.
Our Strategy and Fund Performance
Our investment strategies enter and exit markets based on asset class price movements. When our system indicates that prices are rising, asset classes remain fully invested, and we attempt to participate in the movement of the target asset class of each Fund (defined in Notes) . At every point during a rising market, our system maintains an exit point at some percentage below the market. As prices rise, the exit level “rolls up” at a rate that correlates roughly to the rate of the increase of the target asset price level.
Once our system exits a market for a certain asset class, the respective Fund remains out of that asset class as long as it is declining. Just as our hedging point slowly increases during rising markets, our point of re -entry adjusts lower as markets move lower. The greater the decline, the more likely it is that we will re-enter the market at a lower point than we exited. During severe declines, the re-entry point can be significantly lower than the exit price, creating a lower basis for gains.
To take positions in stocks, we frequently employ the use of equity index futures contracts. Futures contracts tend to track their respective market indices efficiently. Due to arbitrage and other factors, there is no material impact on a Fund’s performance, either positive or negative, from the use of futures contracts versus holding individual equities and/or ETFs. Additionally, some Funds may use options contracts to hedge against swift and deep drops in the equity markets. In rising markets, the options contracts are expected to lose some value and lower a Fund’s performance.
Each exit out of the market creates a possible market underperformance event. If the system becomes completely defensive and the market reverses over the short term, the market re-entry point can be higher than the exit level. This can happen several days or several weeks after a defensive posture is implemented. The greater the number of incidents of moving in/out of a market during a period of time, the more vulnerable the system is to under-performance. In other words, while our system attempts to reduce the risk of significant loss, there may be a cost to implementing this system that can be realized if the Funds underperform their respective benchmarks. Ideal investors for the Funds are those for whom risk management is paramount.
The underperformance in Toews Hedged U.S. Fund (THLGX), Toews Hedged U.S. Opportunity Fund (THSMX) and Toews Tactical Oceana Fund (THIDX) mainly occurred during the period from 12/23/2022-4/28/2023 when the funds were primarily in a defensive posture and underperformed the benchmarks by 2.5% (THLGX), about 7.0% (THSMX) and 3.6% (THIDX). During the same period (12/23/2022-4/28/2023) Toews Tactical Defensive Alpha Fund (TTDAX) returned -0.31% compared to the benchmark’s 9.04%.
1
The Toews Tactical Income Fund (THHYX) trailed its benchmark for the year with underperformance occurring during the period from 3/20/2023 -4/3/2023 when the fund was primarily in a defensive posture and returned 0.09% compared to the benchmark’s 2.60%.
One Year Performance as of 04-30-2023
| Fund | Net Assets | Fund Return* | Benchmark Return | Benchmark |
| Toews Tactical Income Fund | $589,961,700 | -2.61% | 1.21% | ICE BofA Merrill Lynch High Yield Cash Pay Index |
| Toews Tactical Oceana Fund | $48,555,992 | 2.68% | 8.42% | MSCI EAFE Index |
| Toews Hedged U.S. Fund (fka Toews Tactical Monument Fund | $83,361,210 | -0.16% | 2.66% | S&P 500 Total Return Index |
| Toews Hedged U.S. Opportunity Fund (fka Toews Tactical Opportunity Fund) | $62,490,781 | -9.80% | -1.38% 1.28% | Morningstar US Small Cap Total Return Index S&P 400 Total Return Index |
| Toews Unconstrained Income Fund | $54,443,543 | -0.68% | -0.43% | Bloomberg Barclays U.S. Aggregate Bond Index |
| Toews Tactical Defensive Alpha Fund | $108,318,302 | -10.21% | 2.66% | S&P 500 Total Return Index |
| * | Past performance is not indicative of future results |
Our policy is to distribute substantially all of the Funds’ net investment income at least annually except for Toews Tactical Income Fund and Toews Unconstrained Income Fund, which intend to make distributions monthly. The remaining Funds intend to distribute net capital gains annually, usually in December. The effect of such a policy has been to provide significant distributions of capital back to shareholders in December for those Funds that had net capital gains and more frequently than annually for net investment income in Toews Tactical Income Fund and Toews Unconstrained Income Fund. Since the distributions are reinvested in shares of the Funds unless a cash distribution is selected, the Funds have not seen significant change in Fund assets except briefly in December prior to reinvestment and for brief periods of time throughout the year for Toews Tactical Income Fund and Toews Unconstrained Income Fund.
Our Outlook
We believe that stocks and high yield bonds are overvalued from a historical perspective, and their valuations may be challenged over the coming months. The potential advantage of our methodology is its ability to attempt to avoid the bulk of market declines. When markets decline, depending on strategy, the Funds can exchange their market exposure for defensive assets like money market securities, bond funds, and/or low volatility stocks. If the objective of the Fund is achieved, it creates an opportunity to buy near market lows and participate in potential rebounds. As a result, it may be possible to produce positive returns even after the market lost money or moved sideways.
For investors who wish to participate in long term, above inflation growth investments, the path to navigate these markets is straightforward but requires constant vigilance: 1) stay committed
2
to equity markets, an asset class that may help protect investors against inflation; and 2) hedge your equity portfolios against losses. Both are pillars on which the Toews system has been built.
As always, we feel strongly that adding risk management strategies to portfolios in this environment is prudent and desirable.
We thank you for the confidence you have placed in us.
Warmest Regards,

Phillip R. Toews
Portfolio Manager
Prior performance is no guarantee of future results. There can be no assurance, and individuals should not assume, that future performance of any of the portfolios referenced will be comparable to past performance. There can be no assurance that Toews will achieve its performance objectives.
This letter may include forward-looking statements. All statements other than statements of historical fact are forward-looking statements (including words such as “believe,” “estimate,” “anticipate,” “may,” “will,” “should,” and “expect”). Although we believe that the expectations reflected in such forward-looking statements are reasonable, we can give no assurance that such expectations will prove to be correct. Various factors could cause actual results or performance to differ materially from those discussed in such forward-looking statements.
This letter is intended to provide general information only and should not be construed as an offer of specifically-tailored individualized advice. Please contact your investment adviser, accountant, and/or attorney for advice appropriate to your specific situation.
Investors cannot invest directly in an index.
Definitions:
Options and futures contracts are types of derivatives. A derivative is a security with a price that is dependent upon or derived from one or more underlying assets.
The MSCI EAFE Index is a stock market index that is designed to measure the equity market performance of developed markets outside of the U.S. & Canada.
The ICE BofA Merrill Lynch High Yield Cash Pay Index is a commonly used benchmark for U.S. issued high yield corporate bonds.
Morningstar US Small Cap Total Return Index tracks the performance of U.S. small-cap stocks that fall between 90th and 97th percentile in market capitalization of the investable universe. The S&P 400 Total Return Index is a stock market index that serves as a barometer for the U.S. mid-cap equities sector.
3
The S&P 500 Total Return Index is an unmanaged composite of 500 large capitalization companies. This index is widely used by professional investors as a performance benchmark for large-cap stocks.
The Bloomberg Barclays U.S. Aggregate Bond Index is an index used to represent U.S. traded investment grade bonds.
For additional information about Toews, including fees and services, send for our disclosure statement as set forth on Form ADV by contacting Toews at Toews Corporation, 1750 Zion Road, Suite 201, Northfield, NJ 08225-1844 or (877) 863-9726. 2087-NLD-05302023
5708209-093023 MFMK
4
| Toews Tactical Income Fund |
| PORTFOLIO REVIEW (Unaudited) |
| April 30, 2023 |
Comparison of Change in Value of $10,000 Investment
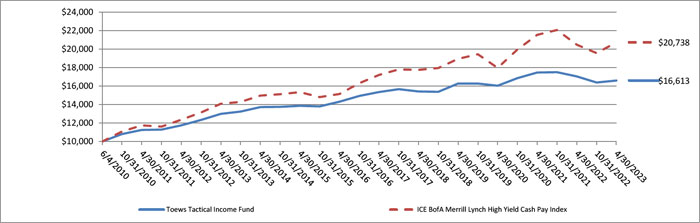
Total Returns as of April 30, 2023(a)
| Annualized | |||||
| Since | |||||
| 1 Year | 5 Year | 10 Year | Inception(b) | ||
| Toews Tactical Income Fund | (2.61)% | 1.49% | 2.48% | 4.01% | |
| ICE BofA Merrill Lynch High Yield Cash Pay Index | 1.21% | 3.14% | 3.94% | 5.82% |
| (a) | Total Returns are calculated using the traded net asset value (“NAV”) on April 30, 2023. |
| (b) | Commencement of operations is June 4, 2010. |
The ICE BofA Merrill Lynch High Yield Cash Pay Index is an unmanaged index used as a general measure of market performance consisting of fixed-rate, coupon-bearing bonds with an outstanding par which is greater than or equal to $50 million, a maturity range greater than or equal to one year and must be less than BBB/Baa3 rated but not in default. Investors cannot invest directly in an index or benchmark.
Past performance is not predictive of future results. The investment return and principal value of an investment will fluctuate. An investor’s shares, when redeemed, may be worth more or less than the original cost. Total return is calculated assuming reinvestment of all dividends and distributions. The Fund’s adviser has waived fees and/or reimbursed expenses over the periods shown above. The Fund’s total returns would have been lower had the adviser not waived its fees and reimbursed a portion of the Fund’s expenses. The Fund’s total gross annual operating expenses, including underlying funds, are 1.46% of average net assets, per the Fund’s prospectus dated August 29, 2022. The graph does not reflect the deduction of taxes that a shareholder would have to pay on Fund distributions or the redemption of Fund shares. For performance information current to the most recent month-end, please call (877) 558-6397.
| PORTFOLIO ANALYSIS (Unaudited) | ||||
| April 30, 2023 | ||||
| Percent of | ||||
| Net Assets | ||||
| Exchange Traded Funds | 57.7 | % | ||
| Open End Funds | 32.2 | % | ||
| Corporate Bonds | 9.7 | % | ||
| Collateral For Securities Loaned | 9.9 | % | ||
| Liabilities In Excess of Other Assets | (9.5 | )% | ||
| 100.0 | % | |||
Please refer to the Schedule of Investments in this annual report for a detailed listing of the Fund’s holdings.
5
| Toews Hedged Oceana Fund |
| PORTFOLIO REVIEW (Unaudited) |
| April 30, 2023 |
Comparison of Change in Value of $10,000 Investment
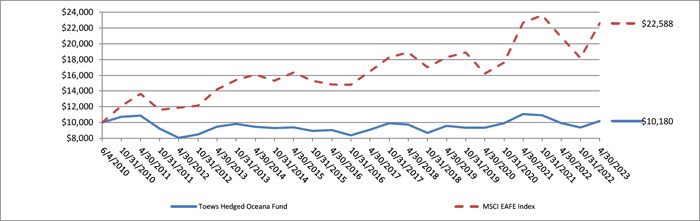
Total Returns as of April 30, 2023(a)
| Annualized | |||||
| Since | |||||
| 1 Year | 5 Year | 10 Year | Inception(b) | ||
| Toews Hedged Oceana Fund | 2.68% | 0.91% | 0.72% | 0.14% | |
| MSCI EAFE Index | 8.42% | 3.63% | 4.76% | 6.52% |
| (a) | Total Returns are calculated using the traded net asset value (“NAV”) on April 30, 2023. |
| (b) | Commencement of operations is June 4, 2010. |
The MSCI EAFE Index (Europe, Australasia, Far East) is a free float-adjusted market capitalization index that is designed to measure the equity market performance of developed markets, excluding the US & Canada. The MSCI EAFE Index consists of the following 21 developed market country indices: Australia, Austria, Belgium, Denmark, Finland, France, Germany, Hong Kong, Ireland, Israel, Italy, Japan, the Netherlands, New Zealand, Norway, Portugal, Singapore, Spain, Sweden, Switzerland, and the United Kingdom. Investors cannot invest directly in an index or benchmark.
Past performance is not predictive of future results. The investment return and principal value of an investment will fluctuate. An investor’s shares, when redeemed, may be worth more or less than the original cost. Total return is calculated assuming reinvestment of all dividends and distributions. The Fund’s adviser has waived fees and/or reimbursed expenses over the periods shown above. The Fund’s total returns would have been lower had the adviser not waived its fees and reimbursed a portion of the Fund’s expenses. The Fund’s total gross annual operating expenses, including underlying funds, are 1.38% of average net assets, per the Fund’s prospectus dated August 29, 2022. The graph does not reflect the deduction of taxes that a shareholder would have to pay on Fund distributions or the redemption of Fund shares. For performance information current to the most recent month-end, please call (877) 558-6397.
| PORTFOLIO ANALYSIS (Unaudited) | ||||
| April 30, 2023 | ||||
| Percent of | ||||
| Net Assets | ||||
| Exchange Traded Funds | 98.8 | % | ||
| Future Options Purchased | 0.2 | % | ||
| Other Assets in Excess of Liabilities | 1.0 | % | ||
| 100.0 | % | |||
Please refer to the Schedule of Investments in this annual report for a detailed listing of the Fund’s holdings.
6
| Toews Hedged U.S. Fund |
| PORTFOLIO REVIEW (Unaudited) |
| April 30, 2023 |
Comparison of Change in Value of $10,000 Investment
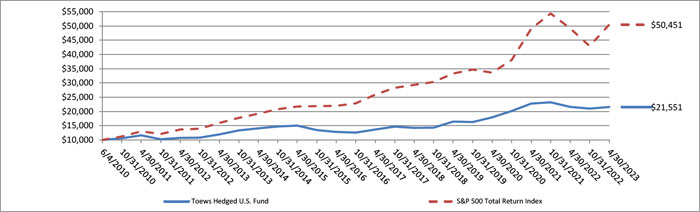
Total Returns as of April 30, 2023(a)
| Annualized | |||||
| Since | |||||
| 1 Year | 5 Year | 10 Year | Inception(b) | ||
| Toews Hedged U.S. Fund | (0.16)% | 8.64% | 6.08% | 6.13% | |
| S&P 500 Total Return Index | 2.66% | 11.45% | 12.20% | 13.36% |
| (a) | Total Returns are calculated using the traded net asset value (“NAV”) on April 30, 2023. |
| (b) | Commencement of operations is June 4, 2010. |
The S&P 500 Total Return Index is an unmanaged market capitalization-weighted index which is comprised of 500 of the largest U.S. domiciled companies and includes the reinvestment of all dividends. Investors cannot invest directly in an index or benchmark.
Past performance is not predictive of future results. The investment return and principal value of an investment will fluctuate. An investor’s shares, when redeemed, may be worth more or less than the original cost. Total return is calculated assuming reinvestment of all dividends and distributions. The Fund’s adviser has waived fees and/or reimbursed expenses over the periods shown above. The Fund’s total returns would have been lower had the adviser not waived its fees and reimbursed a portion of the Fund’s expenses. The Fund’s total gross annual operating expenses, including underlying funds, are 1.28% of average net assets, per the Fund’s prospectus dated August 29, 2022. The graph does not reflect the deduction of taxes that a shareholder would have to pay on Fund distributions or the redemption of Fund shares. For performance information current to the most recent month-end, please call (877) 558-6397.
| PORTFOLIO ANALYSIS (Unaudited) | ||||
| April 30, 2023 | ||||
| Percent of | ||||
| Net Assets | ||||
| U.S. Government & Agencies | 79.1 | % | ||
| Future Options Purchased | 0.2 | % | ||
| Other Assets in Excess of Liabilities * | 20.7 | % | ||
| 100.0 | % | |||
| * | Includes unrealized appreciation on open futures contracts. |
Please refer to the Schedule of Investments in this annual report for a detailed listing of the Fund’s holdings.
7
| Toews Hedged U.S. Opportunity Fund |
| PORTFOLIO REVIEW (Unaudited) |
| April 30, 2023 |
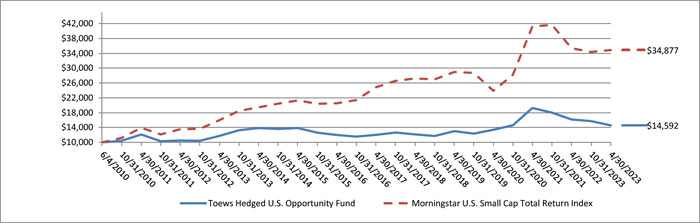
Comparison of Change in Value of $10,000 Investment
Total Returns as of April 30, 2023(a)
| Annualized | |||||
| Since | |||||
| 1 Year | 5 Year | 10 Year | Inception(b) | ||
| Toews Hedged U.S. Opportunity Fund | (9.80)% | 3.72% | 2.18% | 2.97% | |
| Morningstar U.S. Small Cap Total Return Index | (1.38)% | 5.07% | 8.12% | 10.17% |
| (a) | Total Returns are calculated using the traded net asset value (“NAV”) on April 30, 2023. |
| (b) | Commencement of operations is June 4, 2010. |
The Morningstar U.S. Small Cap Total Return Index measures the performance of stocks issued by small-capitalization companies that are domiciled or principally traded in the United States. Investors cannot invest directly in an index or benchmark.
Past performance is not predictive of future results. The investment return and principal value of an investment will fluctuate. An investor’s shares, when redeemed, may be worth more or less than the original cost. Total return is calculated assuming reinvestment of all dividends and distributions. The Fund’s adviser has waived fees and/or reimbursed expenses over the periods shown above. The Fund’s total returns would have been lower had the adviser not waived its fees and reimbursed a portion of the Fund’s expenses. The Fund’s total gross annual operating expenses, including underlying funds, are 1.33% of average net assets, per the Fund’s prospectus dated August 29, 2022. The graph does not reflect the deduction of taxes that a shareholder would have to pay on Fund distributions or the redemption of Fund shares. For performance information current to the most recent month-end, please call (877) 558-6397.
The Toews Hedged U.S. Opportunity Fund is not sponsored, endorsed, sold or promoted by Morningstar, Inc. or any of its affiliates (all such entities, collectively, “Morningstar Entities”). The Morningstar Entities make no representation or warranty, express or implied, to the owners of the Toews Hedged U.S. Opportunity Fund or any member of the public regarding the advisability of investing in equities generally or in the Toews Hedged U.S. Opportunity Fund in particular or the ability of The MorningStar U.S. Small Cap Total Return Index to track general equity market performance.
THE MORNINGSTAR ENTITIES DO NOT GUARANTEE THE ACCURACY AND/OR THE COMPLETENESS OF THE MORNINGSTAR U.S. SMALL CAP TOTAL RETURN INDEX OR ANY DATA INCLUDED THEREIN AND MORNINGSTAR ENTITIES SHALL HAVE NO LIABILITY FOR ANY ERRORS, OMISSIONS, OR INTERRUPTIONS THEREIN.
| PORTFOLIO ANALYSIS (Unaudited) | ||||
| April 30, 2023 | ||||
| Percent of | ||||
| Net Assets | ||||
| U.S. Government & Agencies | 80.9 | % | ||
| Future Options Purchased | 0.3 | % | ||
| Other Assets in Excess of Liabilities* | 18.8 | % | ||
| 100.0 | % | |||
| * | Includes unrealized appreciation on open futures contracts. |
Please refer to the Schedule of Investments in this annual report for a detailed listing of the Fund’s holdings.
8
| Toews Unconstrained Income Fund |
| PORTFOLIO REVIEW (Unaudited) |
| April 30, 2023 |
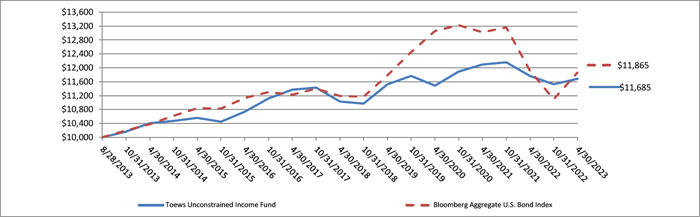
Comparison of Change in Value of $10,000 Investment
Total Returns as of April 30, 2023(a)
| Annualized | ||||
| Since | ||||
| 1 Year | 5 Year | Inception(b) | ||
| Toews Unconstrained Income Fund | -0.68% | 1.16% | 1.62% | |
| Bloomberg U.S. Aggregate Bond Index | -0.43% | 1.18% | 1.78% | |
| (a) | Total Returns are calculated using the traded net asset value (“NAV”) on April 30, 2023. |
| (b) | Commencement of operations is August 28, 2013. |
The Bloomberg U.S. Aggregate Bond Index is an unmanaged index which represents the U.S. investment-grade fixed-rate bond market (including government and corporate securities, mortgage pass-through securities and asset-backed securities). Investors cannot invest directly in an index or benchmark.
Past performance is not predictive of future results. The investment return and principal value of an investment will fluctuate. An investor’s shares, when redeemed, may be worth more or less than the original cost. Total return is calculated assuming reinvestment of all dividends and distributions. The Fund’s adviser has waived fees and/or reimbursed expenses over the periods shown above. The Fund’s total returns would have been lower had the adviser not waived its fees and reimbursed a portion of the Fund’s expenses. The Fund’s total gross annual operating expenses, including underlying funds, are 1.49% of average net assets, per the Fund’s prospectus dated August 29, 2022. The graph does not reflect the deduction of taxes that a shareholder would have to pay on Fund distributions or the redemption of Fund shares. For performance information current to the most recent month-end, please call (877) 558-6397.
| PORTFOLIO ANALYSIS (Unaudited) | ||||
| April 30, 2023 | ||||
| Percent of | ||||
| Net Assets | ||||
| Exchange Traded Funds | 39.2 | % | ||
| U.S. Government & Agencies | 31.4 | % | ||
| Open End Funds | 11.0 | % | ||
| Other Assets in Excess of Liabilities | 18.4 | % | ||
| 100.0 | % | |||
Please refer to the Schedule of Investments in this annual report for a detailed listing of the Fund’s holdings.
9
| Toews Tactical Defensive Alpha Fund |
| PORTFOLIO REVIEW (Unaudited) |
| April 30, 2023 |
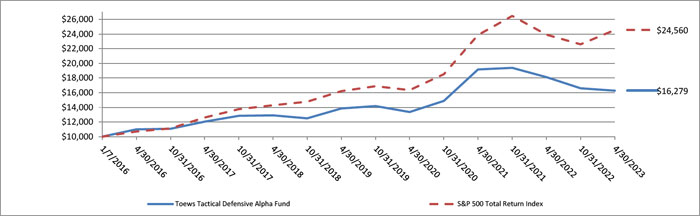
Comparison of Change in Value of $10,000 Investment
Total Returns as of April 30, 2023(a)
| Annualized | ||||
| Since | ||||
| 1 Year | 5 Year | Inception(b) | ||
| Toews Tactical Defensive Alpha Fund | (10.21)% | 4.75% | 6.89% | |
| S&P 500 Total Return Index | 2.66% | 11.45% | 13.07% | |
| (a) | Total Returns are calculated using the traded net asset value (“NAV”) on April 30, 2023. |
| (b) | Commencement of operations is January 7, 2016. |
The S&P 500 Total Return Index is an unmanaged market capitalization-weighted index which is comprised of 500 of the largest U.S. domiciled companies and includes the reinvestment of all dividends. Investors cannot invest directly in an index or benchmark.
Past performance is not predictive of future results. The investment return and principal value of an investment will fluctuate. An investor’s shares, when redeemed, may be worth more or less than the original cost. Total return is calculated assuming reinvestment of all dividends and distributions. The Fund’s adviser has waived fees and/or reimbursed expenses over the period shown above. The Fund’s total returns would have been lower had the adviser not waived its fees and reimbursed a portion of the Fund’s expenses. The Fund’s total gross annual operating expenses, including underlying funds, are 1.26% of average net assets of average net assets, per the Fund’s prospectus dated August 29, 2022. The graph does not reflect the deduction of taxes that a shareholder would have to pay on Fund distributions or the redemption of Fund shares. For performance information current to the most recent month-end, please call (877) 558-6397.
| PORTFOLIO ANALYSIS (Unaudited) April 30, 2023 | ||||
| Percent of | ||||
| Net Assets | ||||
| Exchange Traded Funds | 29.9 | % | ||
| Future Options Purchased | 0.2 | % | ||
| Other Assets in Excess of Liabilities* | 69.9 | % | ||
| 100.0 | % | |||
| * | Includes unrealized appreciation on open futures contracts. |
Please refer to the Schedule of Investments in this annual report for a detailed listing of the Fund’s holdings.
10
| TOEWS TACTICAL INCOME FUND |
| SCHEDULE OF INVESTMENTS |
| April 30, 2023 |
| Shares | Fair Value | |||||||
| EXCHANGE-TRADED FUNDS — 57.7% | ||||||||
| FIXED INCOME - 57.7% | ||||||||
| 150,000 | iShares 0-5 Year High Yield Corporate Bond ETF | $ | 6,232,500 | |||||
| 3,585,000 | iShares Broad USD High Yield Corporate Bond ETF | 127,052,400 | ||||||
| 1,930,000 | iShares iBoxx $ High Yield Corporate Bond ETF(a) | 145,444,800 | ||||||
| 615,000 | SPDR Bloomberg High Yield Bond ETF(a) | 56,881,350 | ||||||
| 75,000 | VanEck Fallen Angel High Yield Bond ETF | 2,081,250 | ||||||
| 75,000 | Xtrackers USD High Yield Corporate Bond ETF | 2,595,750 | ||||||
| 340,288,050 | ||||||||
| TOTAL EXCHANGE-TRADED FUNDS (Cost $339,980,624) | 340,288,050 | |||||||
| OPEN END FUNDS — 32.2% | ||||||||
| FIXED INCOME - 32.2% | ||||||||
| 11,013,263 | BlackRock High Yield Bond Portfolio, Institutional Class | 75,110,455 | ||||||
| 6,061,991 | Fidelity High Income Fund, Class I | 44,979,975 | ||||||
| 10,813,161 | PGIM High Yield Fund, Class Q | 50,064,935 | ||||||
| 2,642,008 | T Rowe Price Institutional High Yield Fund, Institutional Class | 19,920,740 | ||||||
| 190,076,105 | ||||||||
| TOTAL OPEN END FUNDS (Cost $190,000,000) | 190,076,105 | |||||||
| Principal | Coupon Rate | |||||||||||
| Amount ($) | (%) | Maturity | ||||||||||
| CORPORATE BONDS — 9.7% | ||||||||||||
| AEROSPACE & DEFENSE — 0.6% | ||||||||||||
| 750,000 | Bombardier, Inc.(b) | 7.8750 | 04/15/27 | 749,204 | ||||||||
| 600,000 | Rolls-Royce PLC(b) | 5.7500 | 10/15/27 | 599,467 | ||||||||
| 1,000,000 | TransDigm, Inc.(b) | 6.2500 | 03/15/26 | 1,007,162 | ||||||||
| 750,000 | TransDigm, Inc.(b) | 6.7500 | 08/15/28 | 762,923 | ||||||||
| 3,118,756 | ||||||||||||
| AUTOMOTIVE — 0.4% | ||||||||||||
| 500,000 | Ford Motor Company | 3.2500 | 02/12/32 | 386,941 | ||||||||
| 1,000,000 | Ford Motor Credit Company, LLC | 3.3750 | 11/13/25 | 930,161 | ||||||||
| 750,000 | Ford Motor Credit Company, LLC | 7.3500 | 11/04/27 | 773,298 | ||||||||
| 2,090,400 | ||||||||||||
11
| TOEWS TACTICAL INCOME FUND |
| SCHEDULE OF INVESTMENTS (Continued) |
| April 30, 2023 |
| Principal | Coupon Rate | |||||||||||
| Amount ($) | (%) | Maturity | Fair Value | |||||||||
| CORPORATE BONDS — 9.7% (Continued) | ||||||||||||
| BIOTECH & PHARMA — 0.3% | ||||||||||||
| 500,000 | Bausch Health Companies, Inc.(b) | 5.5000 | 11/01/25 | $ | 436,655 | |||||||
| 1,250,000 | Jazz Securities DAC(b) | 4.3750 | 01/15/29 | 1,150,215 | ||||||||
| 500,000 | Organon Finance 1, LLC(b) | 5.1250 | 04/30/31 | 445,941 | ||||||||
| 2,032,811 | ||||||||||||
| CABLE & SATELLITE — 0.8% | ||||||||||||
| 1,000,000 | CCO Holdings, LLC / CCO Holdings Capital Corporation(b) | 5.1250 | 05/01/27 | 946,060 | ||||||||
| 1,750,000 | CCO Holdings, LLC / CCO Holdings Capital Corporation(b) | 4.7500 | 03/01/30 | 1,511,594 | ||||||||
| 750,000 | DIRECTV Holdings, LLC / DIRECTV Financing Company, Inc.(b) | 5.8750 | 08/15/27 | 658,627 | ||||||||
| 1,250,000 | DISH Network Corporation(b) | 11.7500 | 11/15/27 | 1,183,007 | ||||||||
| 750,000 | Sirius XM Radio, Inc.(b) | 4.0000 | 07/15/28 | 634,015 | ||||||||
| 4,933,303 | ||||||||||||
| CHEMICALS — 0.2% | ||||||||||||
| 550,000 | Tronox, Inc.(b) | 4.6250 | 03/15/29 | 457,851 | ||||||||
| 500,000 | WR Grace Holdings, LLC(b) | 5.6250 | 08/15/29 | 431,783 | ||||||||
| 889,634 | ||||||||||||
| COMMERCIAL SUPPORT SERVICES — 0.1% | ||||||||||||
| 800,000 | Allied Universal Holdco, LLC / Allied Universal Finance Corporation(b) | 6.6250 | 07/15/26 | 772,228 | ||||||||
| CONTAINERS & PACKAGING — 0.1% | ||||||||||||
| 500,000 | Mauser Packaging Solutions Holding Company(b) | 7.8750 | 08/15/26 | 505,913 | ||||||||
| ELECTRIC UTILITIES — 0.2% | ||||||||||||
| 600,000 | Calpine Corporation(b) | 5.1250 | 03/15/28 | 554,994 | ||||||||
| 700,000 | FirstEnergy Corporation | 4.1500 | 07/15/27 | 683,295 | ||||||||
| 1,238,289 | ||||||||||||
| ELECTRICAL EQUIPMENT — 0.2% | ||||||||||||
| 1,000,000 | WESCO Distribution, Inc.(b) | 7.1250 | 06/15/25 | 1,019,460 | ||||||||
| ENGINEERING & CONSTRUCTION — 0.1% | ||||||||||||
| 400,000 | Fluor Corporation | 4.2500 | 09/15/28 | 370,868 | ||||||||
| HEALTH CARE FACILITIES & SERVICES — 0.6% | ||||||||||||
| 400,000 | CHS/Community Health Systems, Inc.(b) | 8.0000 | 03/15/26 | 396,978 | ||||||||
| 1,000,000 | DaVita, Inc.(b) | 4.6250 | 06/01/30 | 872,305 | ||||||||
12
| TOEWS TACTICAL INCOME FUND |
| SCHEDULE OF INVESTMENTS (Continued) |
| April 30, 2023 |
| Principal | Coupon Rate | |||||||||||
| Amount ($) | (%) | Maturity | Fair Value | |||||||||
| CORPORATE BONDS — 9.7% (Continued) | ||||||||||||
| HEALTH CARE FACILITIES & SERVICES — 0.6% (Continued) | ||||||||||||
| 500,000 | Providence Service Corporation (The)(b) | 5.8750 | 11/15/25 | $ | 478,255 | |||||||
| 1,000,000 | Tenet Healthcare Corporation | 6.1250 | 10/01/28 | 971,439 | ||||||||
| 2,718,977 | ||||||||||||
| HOME & OFFICE PRODUCTS — 0.1% | ||||||||||||
| 750,000 | Newell Brands, Inc. | 4.4500 | 04/01/26 | 717,030 | ||||||||
| INDUSTRIAL SUPPORT SERVICES — 0.2% | ||||||||||||
| 650,000 | United Rentals North America, Inc. | 3.8750 | 11/15/27 | 610,616 | ||||||||
| 750,000 | United Rentals North America, Inc. | 5.2500 | 01/15/30 | 726,423 | ||||||||
| 1,337,039 | ||||||||||||
| INSTITUTIONAL FINANCIAL SERVICES — 0.6% | ||||||||||||
| 125,000 | Coinbase Global, Inc.(b) | 3.3750 | 10/01/28 | 75,625 | ||||||||
| 3,000,000 | Goldman Sachs Group, Inc. (The) | 6.7500 | 10/01/37 | 3,282,678 | ||||||||
| 3,358,303 | ||||||||||||
| INSURANCE — 0.1% | ||||||||||||
| 300,000 | Alliant Holdings Intermediate, LLC / Alliant Holdings Co-Issuer(b) | 6.7500 | 10/15/27 | 280,425 | ||||||||
| 450,000 | Genworth Holdings, Inc. | 6.5000 | 06/15/34 | 401,604 | ||||||||
| 682,029 | ||||||||||||
| INTERNET MEDIA & SERVICES — 0.2% | ||||||||||||
| 500,000 | Netflix, Inc. | 5.8750 | 11/15/28 | 526,520 | ||||||||
| 550,000 | Uber Technologies, Inc.(b) | 4.5000 | 08/15/29 | 506,703 | ||||||||
| 1,033,223 | ||||||||||||
| LEISURE FACILITIES & SERVICES — 1.2% | ||||||||||||
| 500,000 | 1011778 BC ULC / New Red Finance, Inc.(b) | 3.8750 | 01/15/28 | 467,786 | ||||||||
| 1,000,000 | Caesars Entertainment, Inc.(b) | 6.2500 | 07/01/25 | 1,002,515 | ||||||||
| 1,000,000 | Caesars Entertainment, Inc.(b) | 8.1250 | 07/01/27 | 1,021,164 | ||||||||
| 500,000 | Carnival Corporation(b) | 6.0000 | 05/01/29 | 392,949 | ||||||||
| 1,000,000 | Carnival Holdings Bermuda Ltd.(b) | 10.3750 | 05/01/28 | 1,076,053 | ||||||||
| 800,000 | KFC Holding Co/Pizza Hut Holdings, LLC/Taco Bell of America, LLC(b) | 4.7500 | 06/01/27 | 788,200 | ||||||||
| 500,000 | Las Vegas Sands Corporation | 3.9000 | 08/08/29 | 455,647 | ||||||||
| 700,000 | Live Nation Entertainment, Inc.(b) | 6.5000 | 05/15/27 | 709,967 | ||||||||
| 300,000 | NCL Corporation Ltd.(b) | 5.8750 | 03/15/26 | 258,193 | ||||||||
| 550,000 | Royal Caribbean Cruises Ltd.(b) | 11.5000 | 06/01/25 | 584,431 | ||||||||
| 500,000 | Sands China Ltd. | 5.1250 | 08/08/25 | 490,059 | ||||||||
13
| TOEWS TACTICAL INCOME FUND |
| SCHEDULE OF INVESTMENTS (Continued) |
| April 30, 2023 |
| Principal | Coupon Rate | |||||||||||
| Amount ($) | (%) | Maturity | Fair Value | |||||||||
| CORPORATE BONDS — 9.7% (Continued) | ||||||||||||
| LEISURE FACILITIES & SERVICES — 1.2% (Continued) | ||||||||||||
| 500,000 | Wynn Macau Ltd.(b) | 5.6250 | 08/26/28 | $ | 437,020 | |||||||
| 7,683,984 | ||||||||||||
| MACHINERY — 0.1% | ||||||||||||
| 600,000 | Hillenbrand, Inc. | 3.7500 | 03/01/31 | 513,184 | ||||||||
| MEDICAL EQUIPMENT & DEVICES — 0.1% | ||||||||||||
| 1,000,000 | Mozart Debt Merger Sub, Inc.(b) | 3.8750 | 04/01/29 | 875,536 | ||||||||
| METALS & MINING — 0.2% | ||||||||||||
| 400,000 | Arconic Corporation(b) | 6.1250 | 02/15/28 | 395,225 | ||||||||
| 500,000 | Cleveland-Cliffs, Inc.(b) | 6.7500 | 03/15/26 | 508,332 | ||||||||
| 500,000 | Novelis Corporation(b) | 4.7500 | 01/30/30 | 453,272 | ||||||||
| 1,356,829 | ||||||||||||
| OIL & GAS PRODUCERS — 1.1% | ||||||||||||
| 500,000 | Apache Corporation | 5.1000 | 09/01/40 | 429,205 | ||||||||
| 1,000,000 | Cheniere Energy, Inc. | 4.6250 | 10/15/28 | 954,698 | ||||||||
| 900,000 | Chesapeake Energy Corporation(b) | 6.7500 | 04/15/29 | 891,832 | ||||||||
| 500,000 | CQP Holdco, L.P. / BIP-V Chinook Holdco, LLC(b) | 5.5000 | 06/15/31 | 466,904 | ||||||||
| 1,250,000 | NGL Energy Operating, LLC / NGL Energy Finance Corporation(b) | 7.5000 | 02/01/26 | 1,199,745 | ||||||||
| 750,000 | Occidental Petroleum Corporation | 6.1250 | 01/01/31 | 784,939 | ||||||||
| 1,000,000 | Occidental Petroleum Corporation | 6.4500 | 09/15/36 | 1,062,150 | ||||||||
| 400,000 | PBF Holding Company, LLC / PBF Finance Corporation | 6.0000 | 02/15/28 | 368,470 | ||||||||
| 600,000 | Southwestern Energy Company | 4.7500 | 02/01/32 | 530,352 | ||||||||
| 6,688,295 | ||||||||||||
| OIL & GAS SERVICES & EQUIPMENT — 0.1% | ||||||||||||
| 500,000 | Weatherford International Ltd.(b) | 8.6250 | 04/30/30 | 510,368 | ||||||||
| PUBLISHING & BROADCASTING — 0.1% | ||||||||||||
| 700,000 | News Corporation(b) | 3.8750 | 05/15/29 | 622,125 | ||||||||
| REAL ESTATE INVESTMENT TRUSTS — 0.2% | ||||||||||||
| 500,000 | Iron Mountain, Inc.(b) | 5.2500 | 07/15/30 | 459,919 | ||||||||
| 400,000 | MPT Operating Partnership, L.P. / MPT Finance Corporation. | 3.5000 | 03/15/31 | 274,458 | ||||||||
14
| TOEWS TACTICAL INCOME FUND |
| SCHEDULE OF INVESTMENTS (Continued) |
| April 30, 2023 |
| Principal | Coupon Rate | |||||||||||
| Amount ($) | (%) | Maturity | Fair Value | |||||||||
| CORPORATE BONDS — 9.7% (Continued) | ||||||||||||
| REAL ESTATE INVESTMENT TRUSTS — 0.2% (Continued) | ||||||||||||
| 500,000 | Uniti Group, L.P. / Uniti Group Finance, Inc. /CSL Capital, LLC(b) | 10.5000 | 02/15/28 | $ | 479,145 | |||||||
| 1,213,522 | ||||||||||||
| RETAIL - DISCRETIONARY — 0.3% | ||||||||||||
| 650,000 | Macy’s Retail Holdings, LLC(b) | 5.8750 | 03/15/30 | 577,515 | ||||||||
| 300,000 | Nordstrom, Inc. | 6.9500 | 03/15/28 | 289,874 | ||||||||
| 1,000,000 | Staples, Inc.(b) | 7.5000 | 04/15/26 | 845,175 | ||||||||
| 1,712,564 | ||||||||||||
| SOFTWARE — 0.1% | ||||||||||||
| 500,000 | Minerva Merger Sub, Inc.(b) | 6.5000 | 02/15/30 | 410,966 | ||||||||
| 500,000 | Picard Midco, Inc.(b) | 6.5000 | 03/31/29 | 451,148 | ||||||||
| 862,114 | ||||||||||||
| SPECIALTY FINANCE — 0.4% | ||||||||||||
| 550,000 | Ally Financial, Inc. | 5.7500 | 11/20/25 | 534,435 | ||||||||
| 350,000 | Global Aircraft Leasing Company Ltd.(b) | 6.5000 | 09/15/24 | 312,869 | ||||||||
| 400,000 | Nationstar Mortgage Holdings, Inc.(b) | 5.5000 | 08/15/28 | 356,152 | ||||||||
| 500,000 | OneMain Finance Corporation | 6.1250 | 03/15/24 | 492,582 | ||||||||
| 350,000 | Quicken Loans, LLC / Quicken Loans Co-Issuer, Inc.(b) | 3.8750 | 03/01/31 | 283,242 | ||||||||
| 700,000 | Starwood Property Trust, Inc.(b) | 4.3750 | 01/15/27 | 603,858 | ||||||||
| 2,583,138 | ||||||||||||
| TECHNOLOGY HARDWARE — 0.3% | ||||||||||||
| 750,000 | CommScope, Inc. Series(b) | 6.0000 | 03/01/26 | 717,319 | ||||||||
| 500,000 | Seagate HDD Cayman(b) | 9.6250 | 12/01/32 | 548,835 | ||||||||
| 500,000 | Xerox Holdings Corporation(b) | 5.5000 | 08/15/28 | 438,220 | ||||||||
| 1,704,374 | ||||||||||||
| TECHNOLOGY SERVICES — 0.1% | ||||||||||||
| 600,000 | MSCI, Inc.(b) | 3.8750 | 02/15/31 | 526,377 | ||||||||
| TELECOMMUNICATIONS — 0.4% | ||||||||||||
| 950,000 | Sprint Capital Corporation | 6.8750 | 11/15/28 | 1,024,515 | ||||||||
| 1,000,000 | Sprint Capital Corporation | 8.7500 | 03/15/32 | 1,222,941 | ||||||||
| 2,247,456 | ||||||||||||
| TRANSPORTATION & LOGISTICS — 0.2% | ||||||||||||
| 1,000,000 | American Airlines, Inc./AAdvantage Loyalty IP Ltd.(b) | 5.5000 | 04/20/26 | 983,340 | ||||||||
| 200,000 | Delta Air Lines, Inc. | 3.7500 | 10/28/29 | 179,159 | ||||||||
15
| TOEWS TACTICAL INCOME FUND |
| SCHEDULE OF INVESTMENTS (Continued) |
| April 30, 2023 |
| Principal | Coupon Rate | |||||||||||
| Amount ($) | (%) | Maturity | Fair Value | |||||||||
| CORPORATE BONDS — 9.7% (Continued) | ||||||||||||
| TRANSPORTATION & LOGISTICS — 0.2% (Continued) | ||||||||||||
| 300,000 | Hawaiian Brand Intellectual Property Ltd. / HawaiianMiles Loyalty Ltd.(b) | 5.7500 | 01/20/26 | $ | 279,791 | |||||||
| 1,442,290 | ||||||||||||
| TOTAL CORPORATE BONDS (Cost $57,409,472) | 57,360,419 | |||||||||||
| SHORT-TERM INVESTMENTS — 9.9% | ||||||||||||
| COLLATERAL FOR SECURITIES LOANED - 9.9% | ||||||||||||
| 58,264,250 | State Street Institutional US Government Money Market Fund, Institutional Class , 4.81% (Cost $58,264,250)(c),(d) | 58,264,250 | ||||||||||
| TOTAL INVESTMENTS - 109.5% (Cost $645,654,346) | $ | 645,988,824 | ||||||||||
| LIABILITIES IN EXCESS OF OTHER ASSETS - (9.5)% | (56,027,124 | ) | ||||||||||
| NET ASSETS - 100.0% | $ | 589,961,700 | ||||||||||
ETF - Exchange-Traded Fund
LLC - Limited Liability Company
Ltd. - Limited Company
MSCI - Morgan Stanley Capital International
PLC - Public Limited Company
SPDR - Standard & Poor’s Depositary Receipt
| (a) | All or a portion of the security is on loan. The total fair value of the securities on loan as of April 30, 2023 was $57,343,491. |
| (b) | Security exempt from registration under Rule 144A or Section 4(2) of the Securities Act of 1933. The security may be resold in transactions exempt from registration, normally to qualified institutional buyers. As of April 30, 2023 the total market value of 144A securities is $37,372,878 or 6.3% of net assets. |
| (c) | Security was purchased with cash received as collateral for securities on loan at April 30, 2023. Total collateral had a value of $58,264,250 at April 30, 2023. |
| (d) | Rate disclosed is the seven day effective yield as of April 30, 2023. |
16
| TOEWS HEDGED OCEANA FUND |
| SCHEDULE OF INVESTMENTS |
| April 30, 2023 |
| Shares | Fair Value | |||||||
| EXCHANGE-TRADED FUNDS — 98.8% | ||||||||
| EQUITY - 98.8% | ||||||||
| 1,034,800 | Vanguard FTSE Developed Markets ETF | $ | 47,973,328 | |||||
| TOTAL EXCHANGE-TRADED FUNDS (Cost $43,684,540) | 47,973,328 | |||||||
| Contracts(a) | Counterparty | Expiration Date | Exercise Price | Notional Value | ||||||||||||||||
| FUTURE OPTIONS PURCHASED - 0.2% | ||||||||||||||||||||
| PUT OPTIONS PURCHASED - 0.2% | ||||||||||||||||||||
| 237 | CME E-Mini Standard & Poor’s 500 Index Future | EDF | 06/16/2023 | $ | 3,610 | $ | 49,633,725 | $ | 103,688 | |||||||||||
| TOTAL FUTURE OPTIONS PURCHASED (Cost - $151,088) | 103,688 | |||||||||||||||||||
| TOTAL INVESTMENTS - 99.0% (Cost $43,835,628) | $ | 48,077,016 | ||||||||||||||||||
| OTHER ASSETS IN EXCESS OF LIABILITIES - 1.0% | 478,976 | |||||||||||||||||||
| NET ASSETS - 100.0% | $ | 48,555,992 | ||||||||||||||||||
CME - Chicago Mercantile Exchange
ETF - Exchange-Traded Fund
EDF - ED&F Man Capital Markets, Inc.
| (a) | Each contract is equivalent to one futures contract. |
See accompanying notes to financial statements.
17
| TOEWS HEDGED U.S. FUND |
| SCHEDULE OF INVESTMENTS |
| April 30, 2023 |
| Principal | Coupon Rate | |||||||||||
| Amount ($) | (%) | Maturity | Fair Value | |||||||||
| U.S. GOVERNMENT & AGENCIES — 79.1% | ||||||||||||
| U.S. TREASURY BILLS — 79.1% | ||||||||||||
| 33,500,000 | United States Treasury Bill(a) | 4.750 | 06/15/23 | $ | 33,301,303 | |||||||
| 33,000,000 | United States Treasury Bill(a) | 5.080 | 07/20/23 | 32,639,017 | ||||||||
| 65,940,320 | ||||||||||||
| TOTAL U.S. GOVERNMENT & AGENCIES (Cost $66,036,233) | 65,940,320 | |||||||||||
| Contracts(b) | Counterparty | Expiration Date | Exercise Price | Notional Value | ||||||||||||||||
| FUTURE OPTIONS PURCHASED - 0.2% | ||||||||||||||||||||
| PUT OPTIONS PURCHASED - 0.2% | ||||||||||||||||||||
| 402 | CME E-Mini Standard & Poor’s 500 Index Future | EDF | 06/16/2023 | $ | 3,610 | $ | 84,188,850 | $ | 175,875 | |||||||||||
| TOTAL FUTURE OPTIONS PURCHASED (Cost - $256,275) | 175,875 | |||||||||||||||||||
| TOTAL INVESTMENTS - 79.3% (Cost $66,292,508) | $ | 66,116,195 | ||||||||||||||||||
| OTHER ASSETS IN EXCESS OF LIABILITIES - 20.7% | 17,245,015 | |||||||||||||||||||
| NET ASSETS - 100.0% | $ | 83,361,210 | ||||||||||||||||||
| OPEN FUTURES CONTRACTS | ||||||||||||||||
| Number of Contracts | Open Long Futures Contracts | Counterparty | Expiration | Notional Amount(c) | Fair Value and Unrealized Appreciation | |||||||||||
| 95 | CME E-Mini NASDAQ 100 Index Future | EDF | 06/16/2023 | $ | 25,308,570 | $ | 1,455,533 | |||||||||
| 279 | CME E-Mini Standard & Poor’s 500 Index Future | EDF | 06/16/2023 | 58,429,575 | 3,308,835 | |||||||||||
| TOTAL FUTURES CONTRACTS | $ | 4,764,368 | ||||||||||||||
CME- Chicago Mercantile Exchange
EDF - ED&F Man Capital Markets, Inc.
| (a) | Zero coupon bond. Rate shown is discount rate at time of purchase. |
| (b) | Each contract is equivalent to one futures contract. |
| (c) | The amounts shown are the underlying reference notional amounts to stock exchange indices and equities upon which the fair value of the futures contracts held by the Fund are based. Notional values do not represent the current fair value of, and are not necessarily indicative of the future cash flows of the Fund’s futures contracts. Further, the underlying price changes in relation to the variables specified by the notional values affects the fair value of these derivative financial instruments. The notional values as set forth within this schedule do not purport to represent economic value at risk to the Fund. |
18
| TOEWS HEDGED U.S. OPPORTUNITY FUND |
| SCHEDULE OF INVESTMENTS |
| April 30, 2023 |
| Principal | Coupon Rate | |||||||||||
| Amount ($) | (%) | Maturity | Fair Value | |||||||||
| U.S. GOVERNMENT & AGENCIES — 80.9% | ||||||||||||
| U.S. TREASURY BILLS — 80.9% | ||||||||||||
| 26,000,000 | United States Treasury Bill(a) | 4.750 | 06/15/23 | $ | 25,845,787 | |||||||
| 25,000,000 | United States Treasury Bill(a) | 5.080 | 07/20/23 | 24,726,528 | ||||||||
| 50,572,315 | ||||||||||||
| TOTAL U.S. GOVERNMENT & AGENCIES (Cost $50,646,656) | 50,572,315 | |||||||||||
| Contracts(b) | Counterparty | Expiration Date | Exercise Price | Notional Value | ||||||||||||||||
| FUTURE OPTIONS PURCHASED - 0.3% | ||||||||||||||||||||
| PUT OPTIONS PURCHASED - 0.3% | ||||||||||||||||||||
| 710 | CME E-Mini Russell 2000 Index Future | EDF | 06/16/2023 | $ | 1,475 | $ | 63,005,400 | $ | 157,975 | |||||||||||
| TOTAL FUTURE OPTIONS PURCHASED (Cost - $191,255) | 157,975 | |||||||||||||||||||
| TOTAL INVESTMENTS - 81.2% (Cost $50,837,911) | $ | 50,730,290 | ||||||||||||||||||
| OTHER ASSETS IN EXCESS OF LIABILITIES - 18.8% | 11,760,491 | |||||||||||||||||||
| NET ASSETS - 100.0% | $ | 62,490,781 | ||||||||||||||||||
| OPEN FUTURES CONTRACTS | ||||||||||||||||
| Number of Contracts | Open Long Futures Contracts | Counterparty | Expiration | Notional Amount(c) | Fair Value and Unrealized Appreciation | |||||||||||
| 354 | CME E-Mini Russell 2000 Index Future | EDF | 06/16/2023 | $ | 31,413,960 | $ | 392,285 | |||||||||
| 126 | CME E-Mini Standard & Poor’s MidCap 400 Index | EDF | 06/16/2023 | 31,507,560 | 1,059,519 | |||||||||||
| TOTAL FUTURES CONTRACTS | $ | 1,451,804 | ||||||||||||||
CME- Chicago Mercantile Exchange
EDF - ED&F Man Capital Markets, Inc.
| (a) | Zero coupon bond. Rate shown is discount rate at time of purchase. |
| (b) | Each contract is equivalent to one futures contract. |
| (c) | The amounts shown are the underlying reference notional amounts to stock exchange indices and equities upon which the fair value of the futures contracts held by the Fund are based. Notional values do not represent the current fair value of, and are not necessarily indicative of the future cash flows of the Fund’s futures contracts. Further, the underlying price changes in relation to the variables specified by the notional values affects the fair value of these derivative financial instruments. The notional values as set forth within this schedule do not purport to represent economic value at risk to the Fund. |
19
| TOEWS UNCONSTRAINED INCOME FUND |
| SCHEDULE OF INVESTMENTS |
| April 30, 2023 |
| Shares | Fair Value | |||||||
| EXCHANGE-TRADED FUNDS — 39.2% | ||||||||
| FIXED INCOME - 39.2% | ||||||||
| 139,000 | iShares iBoxx $ High Yield Corporate Bond ETF | $ | 10,475,040 | |||||
| 117,000 | SPDR Bloomberg High Yield Bond ETF | 10,821,330 | ||||||
| 21,296,370 | ||||||||
| TOTAL EXCHANGE-TRADED FUNDS (Cost $21,214,386) | 21,296,370 | |||||||
| �� | ||||||||
| OPEN END FUNDS — 11.0% | ||||||||
| FIXED INCOME - 11.0% | ||||||||
| 404,858 | Fidelity High Income Fund, Class I | 3,004,049 | ||||||
| 649,351 | PGIM High Yield Fund , Class Q | 3,006,493 | ||||||
| 6,010,542 | ||||||||
| TOTAL OPEN END FUNDS (Cost $6,000,000) | 6,010,542 | |||||||
| Principal | Coupon Rate | |||||||||||
| Amount ($) | (%) | Maturity | ||||||||||
| U.S. GOVERNMENT & AGENCIES — 31.4% | ||||||||||||
| U.S. TREASURY BILLS — 31.4% | ||||||||||||
| 8,000,000 | United States Treasury Bill(a) | 4.490 | 05/25/23 | 7,977,460 | ||||||||
| 9,200,000 | United States Treasury Bill(a) | 4.675 | 06/22/23 | 9,135,798 | ||||||||
| 17,113,258 | ||||||||||||
| TOTAL U.S. GOVERNMENT & AGENCIES (Cost $17,115,135) | 17,113,258 | |||||||||||
| TOTAL INVESTMENTS - 81.6% (Cost $44,329,521) | $ | 44,420,170 | ||||||||||
| OTHER ASSETS IN EXCESS OF LIABILITIES - 18.4% | 10,023,373 | |||||||||||
| NET ASSETS - 100.0% | $ | 54,443,543 | ||||||||||
ETF - Exchange-Traded Fund
SPDR - Standard & Poor’s Depositary Receipt
| (a) | Zero coupon bond. Rate shown is discount rate at time of purchase. |
See accompanying notes to financial statements.
20
| TOEWS TACTICAL DEFENSIVE ALPHA FUND |
| SCHEDULE OF INVESTMENTS |
| April 30, 2023 |
| Shares | Fair Value | |||||||
| EXCHANGE-TRADED FUNDS — 29.9% | ||||||||
| EQUITY - 29.9% | ||||||||
| 698,700 | Vanguard FTSE Developed Markets ETF | $ | 32,391,732 | |||||
| TOTAL EXCHANGE-TRADED FUNDS (Cost $29,501,215) | 32,391,732 | |||||||
| Contracts(a) | Counterparty | Expiration Date | Exercise Price | Notional Value | ||||||||||||||||
| FUTURE OPTIONS PURCHASED - 0.2% | ||||||||||||||||||||
| PUT OPTIONS PURCHASED - 0.2% | ||||||||||||||||||||
| 613 | CME E-Mini Russell 2000 Index Future | EDF | 06/16/2023 | $ | 1,475 | $ | 54,397,620 | $ | 136,392 | |||||||||||
| 265 | CME E-Mini Standard & Poor’s 500 Index Future | EDF | 06/16/2023 | 3,610 | 55,497,625 | 115,938 | ||||||||||||||
| TOTAL PUT OPTIONS PURCHASED (Cost - $334,063) | 252,330 | |||||||||||||||||||
| TOTAL FUTURE OPTIONS PURCHASED (Cost - $334,063) | 252,330 | |||||||||||||||||||
| TOTAL INVESTMENTS - 30.1% (Cost $29,835,278) | $ | 32,644,062 | ||||||||||||||||||
| OTHER ASSETS IN EXCESS OF LIABILITIES - 69.9% | 75,674,240 | |||||||||||||||||||
| NET ASSETS - 100.0% | $ | 108,318,302 | ||||||||||||||||||
| OPEN FUTURES CONTRACTS | ||||||||||||||||
| Number of Contracts | Open Long Futures Contracts | Counterparty | Expiration | Notional Amount(b) | Fair Value and Unrealized Appreciation | |||||||||||
| 25 | CME E-Mini NASDAQ 100 Index Future | EDF | 06/16/2023 | $ | 6,660,150 | $ | 388,772 | |||||||||
| 307 | CME E-Mini Russell 2000 Index Futures | EDF | 06/16/2023 | 27,243,180 | 337,148 | |||||||||||
| 73 | CME E-Mini Standard & Poor’s 500 Index Future | EDF | 06/16/2023 | 15,288,025 | 871,585 | |||||||||||
| 109 | CME E-Mini Standard & Poor’s MidCap 400 Index | EDF | 06/16/2023 | 27,256,540 | 912,903 | |||||||||||
| TOTAL FUTURES CONTRACTS | $ | 2,510,408 | ||||||||||||||
CME - Chicago Mercantile Exchange
ETF - Exchange-Traded Fund
EDF - ED&F Man Capital Markets, Inc.
| (a) | Each contract is equivalent to one futures contract. |
| (b) | The amounts shown are the underlying reference notional amounts to stock exchange indices and equities upon which the fair value of the futures contracts held by the Fund are based. Notional values do not represent the current fair value of, and are not necessarily indicative of the future cash flows of the Fund’s futures contracts. Further, the underlying price changes in relation to the variables specified by the notional values affects the fair value of these derivative financial instruments. The notional values as set forth within this schedule do not purport to represent economic value at risk to the Fund. |
21
| Toews Funds |
| Statements of Assets and Liabilities |
| April 30, 2023 |
| Toews Tactical | Toews Hedged | Toews Hedged | ||||||||||
| Income | Oceana | U.S. | ||||||||||
| Fund | Fund | Fund | ||||||||||
| ASSETS: | ||||||||||||
| Investments, at cost | $ | 645,654,346 | $ | 43,835,628 | $ | 66,292,508 | ||||||
| Investments, at fair value | $ | 645,988,824 | (a) | $ | 48,077,016 | $ | 66,116,195 | |||||
| Cash and cash equivalents | 5,053,102 | — | 8,339,699 | |||||||||
| Cash deposit with broker - futures margin balance | 580,055 | 285,335 | 4,268,193 | |||||||||
| Receivable for securities sold | — | 395,633 | — | |||||||||
| Unrealized appreciation from futures contracts | — | — | 4,764,368 | |||||||||
| Receivable for Fund shares sold | 195,130 | 5,029 | 16,283 | |||||||||
| Dividends and interest receivable | 1,688,719 | 481 | 26,683 | |||||||||
| Prepaid expenses and other assets | 21,023 | 18,014 | 18,287 | |||||||||
| Total Assets | 653,526,853 | 48,781,508 | 83,549,708 | |||||||||
| LIABILITIES: | ||||||||||||
| Due to Custodian | — | 121,793 | — | |||||||||
| Collateral for securities loaned | 58,264,250 | — | — | |||||||||
| Payable for securities purchased | 3,890,375 | — | — | |||||||||
| Accrued advisory fees | 483,290 | 21,633 | 63,811 | |||||||||
| Payable for Fund shares redeemed | 746,240 | 49,994 | 87,733 | |||||||||
| Payable to related parties | 72,875 | 5,353 | 11,579 | |||||||||
| Audit and tax fees | 19,198 | 17,958 | 17,919 | |||||||||
| Accrued expenses and other liabilities | 88,925 | 8,785 | 7,456 | |||||||||
| Total Liabilities | 63,565,153 | 225,516 | 188,498 | |||||||||
| Net Assets | $ | 589,961,700 | $ | 48,555,992 | $ | 83,361,210 | ||||||
| NET ASSETS CONSIST OF: | ||||||||||||
| Paid in capital | $ | 647,737,059 | $ | 53,517,350 | $ | 95,603,041 | ||||||
| Accumulated losses | (57,775,359 | ) | (4,961,358 | ) | (12,241,831 | ) | ||||||
| Net Assets | $ | 589,961,700 | $ | 48,555,992 | $ | 83,361,210 | ||||||
| Shares of beneficial interest outstanding ($0 par value, unlimited shares authorized) | 58,842,632 | 5,291,752 | 6,645,926 | |||||||||
| Net Asset Value (Net Assets / Shares Outstanding), offering price and redemption price per share | $ | 10.03 | $ | 9.18 | $ | 12.54 | ||||||
| (a) | includes loaned securities with a value of $57,343,491. |
See accompanying notes to financial statements.
22
| Toews Funds |
| Statements of Assets and Liabilities (Continued) |
| April 30, 2023 |
| Toews Hedged | Toews | Toews Tactical | ||||||||||
| U.S. Opportunity | Unconstrained Income | Defensive Alpha | ||||||||||
| Fund | Fund | Fund | ||||||||||
| ASSETS: | ||||||||||||
| Investments, at cost | $ | 50,837,911 | $ | 44,329,521 | $ | 29,835,278 | ||||||
| Investments, at fair value | $ | 50,730,290 | $ | 44,420,170 | $ | 32,644,062 | ||||||
| Cash and cash equivalents | 6,205,218 | 10,163,033 | 66,400,213 | |||||||||
| Cash deposit with broker - futures margin balance | 4,170,178 | — | 6,112,787 | |||||||||
| Receivable for Fund shares sold | 25,153 | 107,879 | 17,813 | |||||||||
| Dividends and interest receivable | 19,147 | 46,283 | 208,223 | |||||||||
| Receivable for securities sold | — | — | 943,068 | |||||||||
| Unrealized appreciation from futures contracts | 1,451,804 | — | 2,510,408 | |||||||||
| Prepaid expenses and other assets | 18,041 | 10,757 | 21,363 | |||||||||
| Total Assets | 62,619,831 | 54,748,122 | 108,857,937 | |||||||||
| LIABILITIES: | ||||||||||||
| Payable for Fund shares redeemed | 65,034 | 228,604 | 405,336 | |||||||||
| Accrued advisory fees | 32,963 | 42,134 | 91,742 | |||||||||
| Audit and tax fees | 17,440 | 19,198 | 17,425 | |||||||||
| Payable to related parties | 7,182 | 9,026 | 10,550 | |||||||||
| Accrued expenses and other liabilities | 6,431 | 5,617 | 14,582 | |||||||||
| Total Liabilities | 129,050 | 304,579 | 539,635 | |||||||||
| Net Assets | $ | 62,490,781 | $ | 54,443,543 | $ | 108,318,302 | ||||||
| NET ASSETS CONSIST OF: | ||||||||||||
| Paid in capital | $ | 87,117,931 | $ | 61,670,989 | $ | 131,287,330 | ||||||
| Accumulated losses | (24,627,150 | ) | (7,227,446 | ) | (22,969,028 | ) | ||||||
| Net Assets | $ | 62,490,781 | $ | 54,443,543 | $ | 108,318,302 | ||||||
| Shares of beneficial interest outstanding ($0 par value, unlimited shares authorized) | 6,668,201 | 5,843,833 | 11,384,619 | |||||||||
| Net Asset Value (Net Assets / Shares Outstanding), offering price and redemption price per share | $ | 9.37 | $ | 9.32 | $ | 9.51 | ||||||
See accompanying notes to financial statements.
23
| Toews Funds |
| Statements of Operations |
| For the Year Ended April 30, 2023 |
| Toews Tactical | Toews Hedged | Toews Hedged | ||||||||||
| Income | Oceana | U.S. | ||||||||||
| Fund | Fund | Fund | ||||||||||
| Investment Income: | ||||||||||||
| Interest income | $ | 6,244,486 | $ | 333,351 | $ | 2,336,016 | ||||||
| Dividend income | 19,798,428 | 926,993 | — | |||||||||
| Securities lending income, net | 248,067 | — | — | |||||||||
| Total Investment Income | 26,290,981 | 1,260,344 | 2,336,016 | |||||||||
| Operating Expenses: | �� | |||||||||||
| Investment advisory fees | 6,156,085 | 590,382 | 1,031,058 | |||||||||
| Third party administrative servicing fees | 586,256 | 64,835 | 110,399 | |||||||||
| Administration fees | 370,977 | 51,447 | 77,097 | |||||||||
| Fund accounting fees | 120,941 | 11,395 | 20,184 | |||||||||
| Registration fees | 50,103 | 31,954 | 28,042 | |||||||||
| Transfer agent fees | 47,260 | 6,514 | 12,679 | |||||||||
| Printing expenses | 28,249 | 10,356 | 25,998 | |||||||||
| Compliance officer fees | 24,125 | 7,286 | 9,044 | |||||||||
| Legal fees | 16,914 | 8,760 | 9,893 | |||||||||
| Audit and tax fees | 19,242 | 17,966 | 21,392 | |||||||||
| Trustees’ fees | 15,457 | 15,506 | 15,462 | |||||||||
| Insurance expenses | 8,091 | 3,075 | 3,722 | |||||||||
| Interest expenses | 100 | 1,337 | 2,699 | |||||||||
| Miscellaneous expenses | 3,061 | 4,066 | 2,561 | |||||||||
| Total Operating Expenses | 7,446,861 | 824,879 | 1,370,230 | |||||||||
| Less: Expenses waived by Adviser | — | (86,133 | ) | (80,122 | ) | |||||||
| Net Operating Expenses | 7,446,861 | 738,746 | 1,290,108 | |||||||||
| Net Investment Income | 18,844,120 | 521,598 | 1,045,908 | |||||||||
| Realized and Unrealized Gain (Loss) on Investments, Options Purchased, Options Written, and Futures Contracts | ||||||||||||
| Net realized gain (loss) on: | ||||||||||||
| Investments | (35,696,735 | ) | (2,900,915 | ) | (49,347 | ) | ||||||
| Options Purchased | — | (747,743 | ) | (655,546 | ) | |||||||
| Options Written | — | 370,541 | 719,321 | |||||||||
| Futures contracts | (408,895 | ) | — | (7,145,780 | ) | |||||||
| Distributions of capital gains from underlying investment companies | 637,179 | — | — | |||||||||
| Net change in unrealized appreciation (depreciation) on: | ||||||||||||
| Investments | 334,478 | 4,288,788 | (95,913 | ) | ||||||||
| Options Purchased | — | (47,400 | ) | (80,400 | ) | |||||||
| Futures contracts | — | — | 4,764,368 | |||||||||
| Net Realized and Unrealized Gain (Loss) on Investments Options Purchased, Options Written and Futures Contracts | (35,133,973 | ) | 963,271 | (2,543,297 | ) | |||||||
| Net Increase (Decrease) in Net Assets Resulting From Operations | $ | (16,289,853 | ) | $ | 1,484,869 | $ | (1,497,389 | ) | ||||
See accompanying notes to financial statements.
24
| Toews Funds |
| Statements of Operations (Continued) |
| For the Year Ended April 30, 2023 |
| Toews Hedged | Toews | Toews Tactical | ||||||||||
| U.S. Opportunity | Unconstrained Income | Defensive Alpha | ||||||||||
| Fund | Fund | Fund | ||||||||||
| Investment Income: | ||||||||||||
| Interest income | $ | 1,915,900 | $ | 1,098,930 | $ | 953,001 | ||||||
| Dividend income | — | 975,513 | 2,007,231 | |||||||||
| Securities lending income, net | — | 12,910 | — | |||||||||
| Total Investment Income | 1,915,900 | 2,087,353 | 2,960,232 | |||||||||
| Operating Expenses: | ||||||||||||
| Investment advisory fees | 859,657 | 603,125 | 1,170,481 | |||||||||
| Third party administrative servicing fees | 93,005 | 58,133 | 113,281 | |||||||||
| Administration fees | 67,949 | 47,558 | 85,596 | |||||||||
| Registration fees | 36,007 | 25,972 | 23,230 | |||||||||
| Audit and tax fees | 17,485 | 19,241 | 17,471 | |||||||||
| Fund accounting fees | 16,691 | 11,721 | 23,127 | |||||||||
| Trustees’ fees | 15,352 | 15,347 | 15,360 | |||||||||
| Printing expenses | 11,390 | 20,243 | 5,986 | |||||||||
| Legal fees | 9,661 | 9,927 | 10,097 | |||||||||
| Transfer agent fees | 8,471 | 6,736 | 11,246 | |||||||||
| Compliance officer fees | 8,314 | 7,297 | 9,052 | |||||||||
| Insurance expenses | 3,412 | 3,079 | 3,931 | |||||||||
| Interest expenses | 3,196 | — | 11,946 | |||||||||
| Miscellaneous expenses | 5,101 | 2,493 | 4,606 | |||||||||
| Total Operating Expenses | 1,155,691 | 830,872 | 1,505,410 | |||||||||
| Less: Expenses waived by Adviser | (79,131 | ) | (77,308 | ) | (30,942 | ) | ||||||
| Net Operating Expenses | 1,076,560 | 753,564 | 1,474,468 | |||||||||
| Net Investment Income | 839,340 | 1,333,789 | 1,485,764 | |||||||||
| Realized and Unrealized Gain (Loss) on Investments Options Purchased, Options Written and Futures Contracts: | ||||||||||||
| Net realized gain (loss) on: | ||||||||||||
| Investments | (71,810 | ) | (1,953,302 | ) | (12,714,112 | ) | ||||||
| Options Purchased | (441,445 | ) | — | (487,400 | ) | |||||||
| Options Written | 590,026 | — | (381,716 | ) | ||||||||
| Futures contracts | (10,174,166 | ) | — | (9,002,059 | ) | |||||||
| Distributions of capital gains from underlying investment companies | — | 35,399 | — | |||||||||
| Net change in unrealized appreciation (depreciation) on: | ||||||||||||
| Investments | (74,341 | ) | 90,649 | 5,755,351 | ||||||||
| Options Purchased | (33,280 | ) | — | (81,733 | ) | |||||||
| Futures contracts | 1,451,804 | — | 2,510,408 | |||||||||
| Net Realized and Unrealized Loss on Investments Options Purchased, Options Written and Futures Contracts | (8,753,212 | ) | (1,827,254 | ) | (14,401,261 | ) | ||||||
| Net Decrease in Net Assets Resulting From Operations | $ | (7,913,872 | ) | $ | (493,465 | ) | $ | (12,915,497 | ) | |||
See accompanying notes to financial statements.
25
| Toews Funds |
| Statements of Changes in Net Assets |
| Toews Tactical Income | Toews Hedged Oceana | |||||||||||||||
| Fund | Fund | |||||||||||||||
| Year Ended | Year Ended | Year Ended | Year Ended | |||||||||||||
| April 30, 2023 | April 30, 2022 | April 30, 2023 | April 30, 2022 | |||||||||||||
| Operations: | ||||||||||||||||
| Net investment income (loss) | $ | 18,844,120 | $ | 11,882,107 | $ | 521,598 | $ | (243,943 | ) | |||||||
| Net realized loss on investments, options purchased, options written and futures contracts | (36,105,630 | ) | (25,518,843 | ) | (3,278,117 | ) | (5,407,639 | ) | ||||||||
| Distributions of capital gains from underlying investment companies | 637,179 | — | — | 33,280 | ||||||||||||
| Net change in unrealized appreciation (depreciation) on investments, options purchased and futures contracts | 334,478 | (2,124,460 | ) | 4,241,388 | (1,047,625 | ) | ||||||||||
| Net increase (decrease) in net assets resulting from operations | (16,289,853 | ) | (15,761,196 | ) | 1,484,869 | (6,665,927 | ) | |||||||||
| Dividends and Distributions to Shareholders: | ||||||||||||||||
| Total distributions paid | (18,741,659 | ) | (14,200,580 | ) | — | (1,478,847 | ) | |||||||||
| Total Dividends and Distributions to Shareholders | (18,741,659 | ) | (14,200,580 | ) | — | (1,478,847 | ) | |||||||||
| Share Transactions of Beneficial Interest: | ||||||||||||||||
| Net proceeds from shares sold | 183,007,549 | 275,982,599 | 12,957,678 | 41,510,839 | ||||||||||||
| Reinvestment of dividends and distributions | 18,101,461 | 13,690,130 | — | 1,467,941 | ||||||||||||
| Cost of shares redeemed | (237,385,185 | ) | (284,904,180 | ) | (31,125,185 | ) | (26,483,955 | ) | ||||||||
| Net increase (decrease) in net assets from share transactions of beneficial interest | (36,276,175 | ) | 4,768,549 | (18,167,507 | ) | 16,494,825 | ||||||||||
| Total Increase (Decrease) in Net Assets | (71,307,687 | ) | (25,193,227 | ) | (16,682,638 | ) | 8,350,051 | |||||||||
| Net Assets: | ||||||||||||||||
| Beginning of year | 661,269,387 | 686,462,614 | 65,238,630 | 56,888,579 | ||||||||||||
| End of year | $ | 589,961,700 | $ | 661,269,387 | $ | 48,555,992 | $ | 65,238,630 | ||||||||
| Share Activity: | ||||||||||||||||
| Shares Sold | 17,768,390 | 25,233,477 | 1,486,110 | 4,384,715 | ||||||||||||
| Shares Reinvested | 1,776,858 | 1,243,123 | — | 156,664 | ||||||||||||
| Shares Redeemed | (23,008,499 | ) | (26,036,878 | ) | (3,495,436 | ) | (2,784,097 | ) | ||||||||
| Net increase (decrease) in shares of beneficial interest outstanding | (3,463,251 | ) | 439,722 | (2,009,326 | ) | 1,757,282 | ||||||||||
See accompanying notes to financial statements.
26
| Toews Funds |
| Statements of Changes in Net Assets (Continued) |
| Toews Hedged U.S. | Toews Hedged U.S. Opportunity | |||||||||||||||
| Fund | Fund | |||||||||||||||
| Year Ended | Year Ended | Year Ended | Year Ended | |||||||||||||
| April 30, 2023 | April 30, 2022 | April 30, 2023 | April 30, 2022 | |||||||||||||
| Operations: | ||||||||||||||||
| Net investment income (loss) | $ | 1,045,908 | $ | (521,664 | ) | $ | 839,340 | $ | (379,664 | ) | ||||||
| Net realized loss on investments, options purchased, options written and futures contracts | (7,131,352 | ) | (4,364,880 | ) | (10,097,395 | ) | (14,767,756 | ) | ||||||||
| Distributions of capital gains from underlying investment companies | — | 94,250 | — | 53,690 | ||||||||||||
| Net change in unrealized appreciation (depreciation) on investments, options purchased and futures contracts | 4,588,055 | (2,108,204 | ) | 1,344,183 | (1,563,436 | ) | ||||||||||
| Net decrease in net assets resulting from operations | (1,497,389 | ) | (6,900,498 | ) | (7,913,872 | ) | (16,657,166 | ) | ||||||||
| Distributions to Shareholders: | ||||||||||||||||
| From return of capital | — | (485,426 | ) | — | — | |||||||||||
| Distributions paid | — | (17,765,312 | ) | (14,200 | ) | (13,202,180 | ) | |||||||||
| Total Dividends and Distributions to Shareholders | — | (18,250,738 | ) | (14,200 | ) | (13,202,180 | ) | |||||||||
| Share Transactions of Beneficial Interest: | ||||||||||||||||
| Net proceeds from shares sold | 47,404,942 | 56,070,176 | 19,035,950 | 64,248,596 | ||||||||||||
| Reinvestment of dividends and distributions | — | 17,862,721 | 14,025 | 12,961,314 | ||||||||||||
| Cost of shares redeemed | (87,333,956 | ) | (73,034,186 | ) | (46,486,587 | ) | (47,467,021 | ) | ||||||||
| Net increase (decrease) in net assets from share transactions of beneficial interest | (39,929,014 | ) | 898,711 | (27,436,612 | ) | 29,742,889 | ||||||||||
| Total Decrease in Net Assets | (41,426,403 | ) | (24,252,525 | ) | (35,364,684 | ) | (116,457 | ) | ||||||||
| Net Assets: | ||||||||||||||||
| Beginning of year | 124,787,613 | 149,040,138 | 97,855,465 | 97,971,922 | ||||||||||||
| End of year | $ | 83,361,210 | $ | 124,787,613 | $ | 62,490,781 | $ | 97,855,465 | ||||||||
| Share Activity: | ||||||||||||||||
| Shares Sold | 3,830,733 | 4,000,692 | 1,898,885 | 5,553,494 | ||||||||||||
| Shares Reinvested | — | 1,326,111 | 1,436 | 1,168,739 | ||||||||||||
| Shares Redeemed | (7,118,545 | ) | (5,331,664 | ) | (4,654,146 | ) | (4,028,857 | ) | ||||||||
| Net increase (decrease) in shares of beneficial interest outstanding | (3,287,812 | ) | (4,861 | ) | (2,753,825 | ) | 2,693,376 | |||||||||
See accompanying notes to financial statements.
27
| Toews Funds |
| Statements of Changes in Net Assets (Continued) |
| Toews Unconstrained | Toews Tactical Defensive | |||||||||||||||
| Income Fund | Alpha Fund | |||||||||||||||
| Year Ended | Year Ended | Year Ended | Year Ended | |||||||||||||
| April 30, 2023 | April 30, 2022 | April 30, 2023 | April 30, 2022 | |||||||||||||
| Operations: | ||||||||||||||||
| Net investment income | $ | 1,333,789 | $ | 1,015,780 | $ | 1,485,764 | $ | 216,797 | ||||||||
| Net realized loss on investments, options purchased, options written and futures contracts | (1,953,302 | ) | (2,693,211 | ) | (22,585,287 | ) | (2,539,506 | ) | ||||||||
| Distributions of capital gains from underlying investment companies | 35,399 | 24,765 | — | — | ||||||||||||
| Net change in unrealized appreciation (depreciation) on investments, options purchased and futures contracts | 90,649 | (179,825 | ) | 8,184,026 | (5,155,056 | ) | ||||||||||
| Net decrease in net assets resulting from operations | (493,465 | ) | (1,832,491 | ) | (12,915,497 | ) | (7,477,765 | ) | ||||||||
| Dividends and Distributions to Shareholders: | ||||||||||||||||
| From return of capital | (108,585 | ) | — | — | — | |||||||||||
| Distributions paid | (1,215,827 | ) | (1,151,027 | ) | (1,152,050 | ) | (29,549,667 | ) | ||||||||
| Total Dividends and Distributions to Shareholders | (1,324,412 | ) | (1,151,027 | ) | (1,152,050 | ) | (29,549,667 | ) | ||||||||
| Share Transactions of Beneficial Interest: | ||||||||||||||||
| Net proceeds from shares sold | 12,895,269 | 29,825,454 | 27,155,445 | 31,712,291 | ||||||||||||
| Reinvestment of dividends and distributions | 1,300,365 | 1,057,236 | 1,136,372 | 29,159,256 | ||||||||||||
| Cost of shares redeemed | (22,528,758 | ) | (29,004,244 | ) | (31,856,725 | ) | (35,682,617 | ) | ||||||||
| Net increase (decrease) in net assets from share transactions of beneficial interest | (8,333,124 | ) | 1,878,446 | (3,564,908 | ) | 25,188,930 | ||||||||||
| Total Decrease in Net Assets | (10,151,001 | ) | (1,105,072 | ) | (17,632,455 | ) | (11,838,502 | ) | ||||||||
| Net Assets: | ||||||||||||||||
| Beginning of year | 64,594,544 | 65,699,616 | 125,950,757 | 137,789,259 | ||||||||||||
| End of year | $ | 54,443,543 | $ | 64,594,544 | $ | 108,318,302 | $ | 125,950,757 | ||||||||
| Share Activity: | ||||||||||||||||
| Shares Sold | 1,365,856 | 3,015,407 | 2,755,136 | 2,455,175 | ||||||||||||
| Shares Reinvested | 138,526 | 105,256 | 118,619 | 2,582,751 | ||||||||||||
| Shares Redeemed | (2,386,288 | ) | (2,936,774 | ) | (3,261,485 | ) | (2,841,573 | ) | ||||||||
| Net increase (decrease) in shares of beneficial interest outstanding | (881,906 | ) | 183,889 | (387,730 | ) | 2,196,353 | ||||||||||
See accompanying notes to financial statements.
28
| Toews Tactical Income Fund |
| Financial Highlights |
| Selected data based on a share outstanding throughout each year. |
| For the Year | For the Year | For the Year | For the Year | For the Year | ||||||||||||||||
| Ended | Ended | Ended | Ended | Ended | ||||||||||||||||
| April 30, 2023 | April 30, 2022 | April 30, 2021 | April, 30, 2020 | April, 30, 2019 | ||||||||||||||||
| Net asset value, beginning of year | $ | 10.61 | $ | 11.10 | $ | 10.47 | $ | 10.96 | $ | 10.68 | ||||||||||
| ACTIVITY FROM INVESTMENT OPERATIONS: | ||||||||||||||||||||
| Net investment income (a) | 0.31 | 0.19 | 0.29 | 0.33 | 0.30 | |||||||||||||||
| Net realized and unrealized gain (loss) on investments | (0.58 | ) | (0.45 | ) | 0.63 | (0.48 | ) | 0.28 | ||||||||||||
| Total from investment operations | (0.27 | ) | (0.26 | ) | 0.92 | (0.15 | ) | 0.58 | ||||||||||||
| LESS DISTRIBUTIONS: | ||||||||||||||||||||
| From net investment income | (0.31 | ) | (0.23 | ) | (0.29 | ) | (0.34 | ) | (0.30 | ) | ||||||||||
| From net realized gains on investments | — | — | — | — | (0.00 | ) (e) | ||||||||||||||
| Total distributions | (0.31 | ) | (0.23 | ) | (0.29 | ) | (0.34 | ) | (0.30 | ) | ||||||||||
| Net asset value, end of year | $ | 10.03 | $ | 10.61 | $ | 11.10 | $ | 10.47 | $ | 10.96 | ||||||||||
| Total return (b) | (2.51 | )% (c) | (2.41 | )% | 8.90 | % | (1.41 | )% | 5.54 | % | ||||||||||
| RATIOS/SUPPLEMENTAL DATA: | ||||||||||||||||||||
| Net assets, end of year (in 000’s) | $ | 589,962 | $ | 661,269 | $ | 686,463 | $ | 611,707 | $ | 529,375 | ||||||||||
| Ratios to average net assets | ||||||||||||||||||||
| Expenses, net of reimbursement/recapture (d) | 1.21 | % (f) | 1.21 | % | 1.18 | % | 1.19 | % | 1.20 | % | ||||||||||
| Expenses, before reimbursement/recapture (d) | 1.21 | % (f) | 1.21 | % | 1.18 | % | 1.19 | % | 1.20 | % | ||||||||||
| Net investment income, net of reimbursement/recapture (d,e) | 3.06 | % | 1.74 | % | 2.65 | % | 3.03 | % | 2.86 | % | ||||||||||
| Portfolio turnover rate | 1026 | % | 790 | % | 797 | % | 1323 | % | 623 | % | ||||||||||
| (a) | Per share amounts have been calculated using the average share method, which more appropriately presents the per share data for the period. |
| (b) | Total returns are historical and assume changes in share price and reinvestment of dividends and capital gain distributions if any. Had the adviser not absorbed or recaptured a portion of the expenses, total returns would have been lower or higher, respectively. |
| (c) | Includes adjustments in accordance with accounting principles generally accepted in the United States and, consequently, the net asset value for financial reporting purposes and the returns based upon those net asset values may differ from the net asset values and returns for shareholder transactions. |
| (d) | Does not include expenses of the investment companies in which the Fund invests. |
| (e) | Recognition of net investment income by the Fund is affected by the timing of the declaration of dividends by the underlying investment companies in which the Fund invests. |
| (f) | Includes interest expense. Excluding interest expense, the following ratios would have been: |
| Expenses, net of reimbursement (d) | 1.21 | % | ||
| Expenses, before reimbursement (d) | 1.21 | % | ||
See accompanying notes to financial statements.
29
| Toews Hedged Oceana Fund |
| Financial Highlights |
| Selected data based on a share outstanding throughout each year. |
| For the Year | For the Year | For the Year | For the Year | For the Year | ||||||||||||||||
| Ended | Ended | Ended | Ended | Ended | ||||||||||||||||
| April 30, 2023 | April 30, 2022 | April 30, 2021 | April, 30, 2020 | April, 30, 2019 | ||||||||||||||||
| Net asset value, beginning of year | $ | 8.94 | $ | 10.26 | $ | 8.67 | $ | 9.00 | $ | 9.25 | ||||||||||
| ACTIVITY FROM INVESTMENT OPERATIONS: | ||||||||||||||||||||
| Net investment income (loss) (a) | 0.08 | (0.04 | ) | 0.01 | 0.09 | 0.09 | ||||||||||||||
| Net realized and unrealized gain (loss) on investments | 0.16 | (1.02 | ) | 1.61 | (0.31 | ) | (0.25 | ) | ||||||||||||
| Total from investment operations | 0.24 | (1.06 | ) | 1.62 | (0.22 | ) | (0.16 | ) | ||||||||||||
| LESS DISTRIBUTIONS: | ||||||||||||||||||||
| From net investment income | — | — | (0.03 | ) | (0.11 | ) | (0.09 | ) | ||||||||||||
| From net realized gains on investments | — | (0.26 | ) | — | — | — | ||||||||||||||
| Total distributions | — | (0.26 | ) | (0.03 | ) | (0.11 | ) | (0.09 | ) | |||||||||||
| Net asset value, end of year | $ | 9.18 | $ | 8.94 | $ | 10.26 | $ | 8.67 | $ | 9.00 | ||||||||||
| Total return (b) | 2.68 | % | (10.43 | )% | 18.66 | % | (2.51 | )% | (1.68 | )% | ||||||||||
| RATIOS/SUPPLEMENTAL DATA: | ||||||||||||||||||||
| Net assets, end of year (in 000’s) | $ | 48,556 | $ | 65,239 | $ | 56,889 | $ | 28,688 | $ | 32,238 | ||||||||||
| Ratios to average net assets | ||||||||||||||||||||
| Expenses, net of reimbursement (c) | 1.25 | % (e) | 1.26 | % (e) | 1.26 | % (e) | 1.25 | % | 1.25 | % | ||||||||||
| Expenses, before reimbursement (c) | 1.40 | % (e) | 1.36 | % (e) | 1.36 | % (e) | 1.46 | % | 1.41 | % | ||||||||||
| Net investment Income (loss), net of reimbursement (c,d) | 0.88 | % | (0.40 | )% | 0.06 | % | 1.00 | % | 1.00 | % | ||||||||||
| Portfolio turnover rate | 259 | % | 433 | % | 421 | % | 514 | % | 570 | % | ||||||||||
| (a) | Per share amounts have been calculated using the average share method, which more appropriately presents the per share data for the period. |
| (b) | Total returns are historical and assume changes in share price and reinvestment of dividends and capital gain distributions if any. Had the adviser not absorbed a portion of the expenses, total returns would have been lower. |
| (c) | Does not include expenses of the investment companies in which the Fund invests. |
| (d) | Recognition of net investment income (loss) by the Fund is affected by the timing of the declaration of dividends by the underlying investment companies in which the Fund invests. |
| (e) | Includes interest expense. Excluding interest expense, the following ratios would have been: |
| Expenses, net of reimbursement (c) | 1.25 | % | 1.25 | % | 1.25 | % | ||||||
| Expenses, before reimbursement (c) | 1.40 | % | 1.35 | % | 1.35 | % | ||||||
See accompanying notes to financial statements.
30
| Toews Hedged U.S. Fund |
| Financial Highlights |
| Selected data based on a share outstanding throughout each year. |
| For the Year | For the Year | For the Year | For the Year | For the Year | ||||||||||||||||
| Ended | Ended | Ended | Ended | Ended | ||||||||||||||||
| April 30, 2023 | April 30, 2022 | April 30, 2021 | April, 30, 2020 | April, 30, 2019 | ||||||||||||||||
| Net asset value, beginning of year | $ | 12.56 | $ | 15.00 | $ | 12.87 | $ | 11.96 | $ | 10.38 | ||||||||||
| ACTIVITY FROM INVESTMENT OPERATIONS: | ||||||||||||||||||||
| Net investment income (loss) (a) | 0.12 | (0.05 | ) | 0.02 | 0.07 | 0.11 | ||||||||||||||
| Net realized and unrealized gain (loss) on investments | (0.14 | ) | (0.59 | ) | 3.41 | 0.99 | 1.50 | |||||||||||||
| Total from investment operations | (0.02 | ) | (0.64 | ) | 3.43 | 1.06 | 1.61 | |||||||||||||
| LESS DISTRIBUTIONS: | ||||||||||||||||||||
| From net investment income | — | — | (0.13 | ) | (0.15 | ) | (0.03 | ) | ||||||||||||
| From net realized gains on investments | — | (1.75 | ) | (1.17 | ) | — | — | |||||||||||||
| From return of capital | — | (0.05 | ) | — | — | — | ||||||||||||||
| Total distributions | — | (1.80 | ) | (1.30 | ) | (0.15 | ) | (0.03 | ) | |||||||||||
| Net asset value, end of year | $ | 12.54 | $ | 12.56 | $ | 15.00 | $ | 12.87 | $ | 11.96 | ||||||||||
| Total return (b) | (0.16 | )% | (5.10 | )% | 26.96 | % | 8.90 | % | 15.53 | % | ||||||||||
| RATIOS/SUPPLEMENTAL DATA: | ||||||||||||||||||||
| Net assets, end of year (in 000’s) | $ | 83,361 | $ | 124,788 | $ | 149,040 | $ | 96,709 | $ | 28,078 | ||||||||||
| Ratios to average net assets | ||||||||||||||||||||
| Expenses, net of reimbursement (c) | 1.25 | % (e) | 1.25 | % | 1.25 | % | 1.25 | % | 1.25 | % | ||||||||||
| Expenses, before reimbursement (c) | 1.33 | % (e) | 1.26 | % | 1.32 | % | 1.42 | % | 1.47 | % | ||||||||||
| Net investment income (loss), net of reimbursement (c,d) | 1.02 | % | (0.35 | )% | 0.12 | % | 0.59 | % | 0.98 | % | ||||||||||
| Portfolio turnover rate | 0 | % | 443 | % | 438 | % | 446 | % | 548 | % | ||||||||||
| (a) | Per share amounts have been calculated using the average share method, which more appropriately presents the per share data for the period. |
| (b) | Total returns are historical and assume changes in share price and reinvestment of dividends and capital gain distributions if any. Had the adviser not absorbed a portion of the expenses, total returns would have been lower. |
| (c) | Does not include expenses of the investment companies in which the Fund invests. |
| (d) | Recognition of net investment income (loss) by the Fund is affected by the timing of the declaration of dividends by the underlying investment companies in which the Fund invests. |
| (e) | Includes interest expense. Excluding interest expense, the following ratios would have been: |
| Expenses, net of reimbursement (c) | 1.25 | % | ||
| Expenses, before reimbursement (c) | 1.33 | % | ||
See accompanying notes to financial statements.
31
| Toews Hedged U.S. Opportunity Fund |
| Financial Highlights |
| Selected data based on a share outstanding throughout each year. |
| For the Year | For the Year | For the Year | For the Year | For the Year | ||||||||||||||||
| Ended | Ended | Ended | Ended | Ended | ||||||||||||||||
| April 30, 2023 | April 30, 2022 | April 30, 2021 | April, 30, 2020 | April 30, 2019 | ||||||||||||||||
| Net asset value, beginning of year | $ | 10.39 | $ | 14.56 | $ | 10.18 | $ | 10.03 | $ | 9.37 | ||||||||||
| ACTIVITY FROM INVESTMENT OPERATIONS: | ||||||||||||||||||||
| Net investment income (loss) (a) | 0.10 | (0.05 | ) | 0.01 | 0.10 | 0.09 | ||||||||||||||
| Net realized and unrealized gain (loss) on investments | (1.12 | ) | (2.17 | ) | 4.44 | 0.18 | 0.59 | |||||||||||||
| Total from investment operations | (1.02 | ) | (2.22 | ) | 4.45 | 0.28 | 0.68 | |||||||||||||
| LESS DISTRIBUTIONS: | ||||||||||||||||||||
| From net investment income | (0.00 | ) | (0.00 | ) (b) | (0.07 | ) | (0.13 | ) | (0.02 | ) | ||||||||||
| From net realized gains on investments | — | (1.95 | ) | — | — | — | ||||||||||||||
| Total distributions | (0.00 | ) | (1.95 | ) | (0.07 | ) | (0.13 | ) | (0.02 | ) | ||||||||||
| Net asset value, end of year | $ | 9.37 | $ | 10.39 | $ | 14.56 | $ | 10.18 | $ | 10.03 | ||||||||||
| Total return (c) | (9.80 | )% | (16.08 | )% | 43.82 | % | 2.78 | % | 7.29 | % | ||||||||||
| RATIOS/SUPPLEMENTAL DATA: | ||||||||||||||||||||
| Net assets, end of year (in 000’s) | $ | 62,491 | $ | 97,855 | $ | 97,972 | $ | 41,095 | $ | 43,971 | ||||||||||
| Ratios to average net assets | ||||||||||||||||||||
| Expenses, net of reimbursement (d) | 1.25 | % (f) | 1.26 | % (f) | 1.25 | % | 1.25 | % | 1.25 | % | ||||||||||
| Expenses, before reimbursement (d) | 1.34 | % (f) | 1.31 | % (f) | 1.28 | % | 1.40 | % | 1.39 | % | ||||||||||
| Net investment income (loss), net of reimbursement (d,e) | 0.98 | % | (0.39 | )% | 0.05 | % | 1.00 | % | 0.99 | % | ||||||||||
| Portfolio turnover rate | 0 | % | 433 | % | 429 | % | 515 | % | 565 | % | ||||||||||
| (a) | Per share amounts have been calculated using the average share method, which more appropriately presents the per share data for the period. |
| (b) | Represents less than $0.01 per share. |
| (c) | Total returns are historical and assume changes in share price and reinvestment of dividends and capital gain distributions if any. Had the adviser not absorbed or recaptured a portion of the expenses, total returns would have been lower or higher, respectively. |
| (d) | Does not include expenses of the investment companies in which the Fund invests. |
| (e) | Recognition of net investment income (loss) by the Fund is affected by the timing of the declaration of dividends by the underlying investment companies in which the Fund invests |
| (f) | Includes interest expense. Excluding interest expense, the following ratios would have been: |
| Expenses, net of reimbursement (d) | 1.25 | % | 1.25 | % | ||||
| Expenses, before reimbursement (d) | 1.34 | % | 1.30 | % | ||||
See accompanying notes to financial statements.
32
| Toews Unconstrained Income Fund |
| Financial Highlights |
| Selected data based on a share outstanding throughout each year. |
| For the Year | For the Year | For the Year | For the Year | For the Year | ||||||||||||||||
| Ended | Ended | Ended | Ended | Ended | ||||||||||||||||
| April 30, 2023 | April 30, 2022 | April 30, 2021 | April, 30, 2020 | April, 30, 2019 | ||||||||||||||||
| Net asset value, beginning of year | $ | 9.60 | $ | 10.04 | $ | 9.69 | $ | 9.93 | $ | 9.70 | ||||||||||
| ACTIVITY FROM INVESTMENT OPERATIONS: | ||||||||||||||||||||
| Net investment income (a) | 0.21 | 0.15 | 0.16 | 0.20 | 0.19 | |||||||||||||||
| Net realized and unrealized gain (loss) on investments | (0.28 | ) | (0.42 | ) | 0.35 | (0.23 | ) | 0.24 | ||||||||||||
| Total from investment operations | (0.07 | ) | (0.27 | ) | 0.51 | (0.03 | ) | 0.43 | ||||||||||||
| LESS DISTRIBUTIONS: | ||||||||||||||||||||
| From net investment income | (0.19 | ) | (0.17 | ) | (0.16 | ) | (0.21 | ) | (0.20 | ) | ||||||||||
| From net realized gains on investments | — | — | (0.00 | ) (e) | — | — | ||||||||||||||
| From return of capital | (0.02 | ) | — | — | — | — | ||||||||||||||
| Total distributions | (0.21 | ) | (0.17 | ) | (0.16 | ) | (0.21 | ) | (0.20 | ) | ||||||||||
| Net asset value, end of year | $ | 9.32 | $ | 9.60 | $ | 10.04 | $ | 9.69 | $ | 9.93 | ||||||||||
| Total return (b) | (0.68 | )% | (2.73 | )% | 5.27 | % | (0.30 | )% | 4.48 | % | ||||||||||
| RATIOS/SUPPLEMENTAL DATA: | ||||||||||||||||||||
| Net assets, end of year (in 000’s) | $ | 54,444 | $ | 64,595 | $ | 65,700 | $ | 61,798 | $ | 61,349 | ||||||||||
| Ratios to average net assets | ||||||||||||||||||||
| Expenses, net of reimbursement (c) | 1.25 | % | 1.25 | % | 1.25 | % | 1.25 | % | 1.25 | % | ||||||||||
| Expenses, before reimbursement (c) | 1.38 | % | 1.33 | % | 1.33 | % | 1.33 | % | 1.30 | % | ||||||||||
| Net investment income, net of reimbursement (c,d) | 2.21 | % | 1.51 | % | 1.56 | % | 2.00 | % | 2.02 | % | ||||||||||
| Portfolio turnover rate | 691 | % | 651 | % | 566 | % | 920 | % | 666 | % | ||||||||||
| (a) | Per share amounts have been calculated using the average share method, which more appropriately presents the per share data for the period. |
| (b) | Total returns are historical and assume changes in share price and reinvestment of dividends and capital gain distributions if any. Had the adviser not absorbed a portion of the expenses, total returns would have been lower. |
| (c) | Does not include expenses of the investment companies in which the Fund invests. |
| (d) | Recognition of net investment income by the Fund is affected by the timing of the declaration of dividends by the underlying investment companies in which the Fund invests. |
| (e) | Per share amount represents less than $0.01 per share. |
See accompanying notes to financial statements.
33
| Toews Tactical Defensive Alpha Fund |
| Financial Highlights |
| Selected data based on a share outstanding throughout each year. |
| For the Year | For the Year | For the Year | For the Year | For the Year | ||||||||||||||||
| Ended | Ended | Ended | Ended | Ended | ||||||||||||||||
| April 30, 2023 | April 30, 2022 | April 30, 2021 | April, 30, 2020 | April, 30, 2019 | ||||||||||||||||
| Net asset value, beginning of year | $ | 10.70 | $ | 14.39 | $ | 10.44 | $ | 11.63 | $ | 10.99 | ||||||||||
| ACTIVITY FROM INVESTMENT OPERATIONS: | ||||||||||||||||||||
| Net investment income (a) | 0.13 | 0.02 | 0.03 | 0.16 | 0.10 | |||||||||||||||
| Net realized and unrealized gain (loss) on investments | (1.22 | ) | (0.65 | ) | 4.45 | (0.48 | ) | 0.67 | ||||||||||||
| Total from investment operations | (1.09 | ) | (0.63 | ) | 4.48 | (0.32 | ) | 0.77 | ||||||||||||
| LESS DISTRIBUTIONS: | ||||||||||||||||||||
| From net investment income | (0.10 | ) | — | (0.07 | ) | (0.24 | ) | (0.04 | ) | |||||||||||
| From net realized gains on investments | — | (3.06 | ) | (0.46 | ) | (0.63 | ) | (0.09 | ) | |||||||||||
| Total distributions | (0.10 | ) | (3.06 | ) | (0.53 | ) | (0.87 | ) | (0.13 | ) | ||||||||||
| �� | ||||||||||||||||||||
| Net asset value, end of year | $ | 9.51 | $ | 10.70 | $ | 14.39 | $ | 10.44 | $ | 11.63 | ||||||||||
| Total return (b) | (10.21 | )% | (5.46 | )% | 43.48 | % | (3.51 | )% | 7.32 | % | ||||||||||
| RATIOS/SUPPLEMENTAL DATA: | ||||||||||||||||||||
| Net assets, end of year (in 000’s) | $ | 108,318 | $ | 125,951 | $ | 137,789 | $ | 109,761 | $ | 115,836 | ||||||||||
| Ratios to average net assets | ||||||||||||||||||||
| Expenses, net of reimbursement/recapture (c) | 1.26 | % (e) | 1.25 | % | 1.25 | % | 1.25 | % | 1.25 | % | ||||||||||
| Expenses, before reimbursement/recapture (c) | 1.29 | % (e) | 1.24 | % | 1.23 | % | 1.26 | % | 1.26 | % | ||||||||||
| Net investment Income, net of reimbursement/recapture (c,d) | 1.27 | % | 0.16 | % | 0.15 | % | 1.42 | % | 0.93 | % | ||||||||||
| Portfolio turnover rate | 610 | % | 1003 | % | 943 | % | 1080 | % | 854 | % | ||||||||||
| (a) | Per share amounts have been calculated using the average share method, which more appropriately presents the per share data for the period. |
| (b) | Total returns are historical and assume changes in share price and reinvestment of dividends and capital gain distributions if any. Had the adviser not absorbed a portion of the expenses, total returns would have been lower. |
| (c) | Does not include expenses of the investment companies in which the Fund invests. |
| (d) | Recognition of net investment income by the Fund is affected by the timing of the declaration of dividends by the underlying investment companies in which the Fund invests. |
| (e) | Includes interest expense. Excluding interest expense, the following ratios would have been: |
| Expenses, net of reimbursement (c) | 1.25 | % | ||
| Expenses, before reimbursement (c) | 1.28 | % | ||
See accompanying notes to financial statements.
34
| Toews Funds |
| Notes to Financial Statements |
| April 30, 2023 |
NOTE 1. ORGANIZATION
The Toews Tactical Income Fund (the “Tactical Income Fund”), Toews Hedged Oceana Fund (the “Oceana Fund”), Toews Hedged U.S. Fund (the “U.S. Fund”), Toews Hedged U.S. Opportunity Fund (the “Opportunity Fund”), Toews Unconstrained Income Fund (the “Unconstrained Income Fund”) and Toews Tactical Defensive Alpha Fund (the “Defensive Alpha Fund”) (each a “Fund,” collectively the “Funds”), are each a series of shares of beneficial interest of Northern Lights Fund Trust (the “Trust”), a statutory trust organized under the laws of the State of Delaware on January 19, 2005 and registered under the Investment Company Act of 1940, as amended (the “1940 Act”), as an open-end management investment company. The Defensive Alpha Fund is a non -diversified fund. The Income Fund, Oceana Fund, U.S. Fund, Opportunity Fund and Unconstrained Income Fund are each a diversified fund.
The primary investment objective of each Fund is as follows:
| Fund | Primary Objective |
| Tactical Income Fund | High Level of Current Income |
| Oceana Fund | Long Term Growth of Capital |
| U.S. Fund | Long Term Growth of Capital |
| Opportunity Fund | Long Term Growth of Capital |
| Unconstrained Income Fund | Income and Long-Term Growth of Capital |
| Defensive Alpha Fund | Long Term Growth of Capital |
NOTE 2. SUMMARY OF SIGNIFICANT ACCOUNTING POLICIES
The following is a summary of significant accounting policies followed by the Funds in preparation of their financial statements. These policies are in conformity with accounting principles generally accepted in the United States of America (“GAAP”). The preparation of financial statements requires management to make estimates and assumptions that affect the reported amounts of assets and liabilities and disclosure of contingent assets and liabilities at the date of the financial statements and the reported amounts of income and expenses for the period. Actual results could differ from those estimates. The Funds are investment companies and accordingly follow the Investment Company accounting and reporting guidance of the Financial Accounting Standards Board (“FASB”) Accounting Standard Codification Topic 946 “Financial Services – Investment Companies” including FASB Accounting Standards Update (“ASU”) 2013-08.
Security Valuation – Securities listed on an exchange are valued at the last reported sale price at the close of the regular trading session of the primary exchange on the business day the value is being determined, or in the case of securities listed on NASDAQ at the NASDAQ Official Closing Price. In the absence of a sale, such securities shall be valued at the mean between the current bid and ask prices on the primary exchange on the day of valuation. Exchange traded options, futures and options on futures are valued at the final settle price or, in the absence of a sale price, at the mean between the current bid and ask prices on the day of valuation. Index options shall be valued at the mean between the current bid and ask prices on the day of valuation. Debt securities (other than short-term obligations) are valued each day by an independent pricing service approved by the Trust’s Board of Trustees (the “Board”) based on methods that include consideration of: yields or prices of securities of comparable quality, coupon, maturity and type, indications as to values from dealers, and general market conditions or market quotations from a major market maker in the securities. The independent pricing service does not distinguish between smaller-sized bond positions known as “odd lots” and larger institutional- sized bond positions known as “round lots”. The Funds may fair value a particular bond if the adviser does not believe that the round lot value provided by the independent pricing service reflects fair value of the Funds’ holding. Short-term debt obligations that mature in 60 days or less, at the time of purchase, may be valued at amortized cost.
The Funds may hold securities, such as private investments, interests in commodity pools, other non-traded securities or temporarily illiquid securities, for which market quotations are not readily available or are determined to be unreliable. These securities are valued using the “fair value” procedures approved by the Board. The Board has designated the adviser as its valuation designee (the “Valuation Designee”) to execute these procedures. The Board may also enlist third party consultants such a valuation specialist at a public accounting firm, valuation consultant or financial officer of a security issuer on an as-needed basis to assist the Valuation Designee in determining a security-specific fair value. The Board is responsible for reviewing and approving fair value methodologies utilized by the Valuation Designee, approval of which shall be based upon whether the Valuation Designee followed the valuation procedures established by the Board.
35
| Toews Funds |
| Notes to Financial Statements (Continued) |
| April 30, 2023 |
Valuation of Fund of Funds – The Funds may invest in portfolios of open-end or closed-end investment companies. Open-end investment companies are valued at their respective net asset values as reported by such investment companies. Open-end investment companies value securities in their portfolios for which market quotations are readily available at their market values (generally the last reported sale price) and all other securities and assets at their fair value to the methods established by the board of directors of the open-end investment companies.
The shares of many closed-end investment companies, after their initial public offering, frequently trade at a price per share, which is different than the net asset value per share. The difference represents a market premium or market discount of such shares. There can be no assurances that the market discount or market premium on shares of any closed-end investment company purchased by the Funds will not change.
Fair Valuation Process – The applicable investments are valued by the Valuation Designee pursuant to valuation procedures established by the Board. For example, fair value determinations are required for the following securities: (i) securities for which market quotations are insufficient or not readily available on a particular business day (including securities for which there is a short and temporary lapse in the provision of a price by the regular pricing source); (ii) securities for which, in the judgment of the Valuation Designee, the prices or values available do not represent the fair value of the instrument; factors which may cause the Valuation Designee to make such a judgment include, but are not limited to, the following: only a bid price or an ask price is available; the spread between bid and ask prices is substantial; the frequency of sales; the thinness of the market; the size of reported trades; and actions of the securities markets, such as the suspension or limitation of trading; (iii) securities determined to be illiquid; and (iv) securities with respect to which an event that affects the value thereof has occurred (a “significant event”) since the closing prices were established on the principal exchange on which they are traded, but prior to a Fund’s calculation of its net asset value. Specifically, interests in commodity pools or managed futures pools are valued on a daily basis by reference to the closing market prices of each futures contract or other asset held by a pool, as adjusted for pool expenses. Restricted or illiquid securities, such as private investments or non-traded securities are valued based upon the current bid for the security from two or more independent dealers or other parties reasonably familiar with the facts and circumstances of the security (who should take into consideration all relevant factors as may be appropriate under the circumstances). If a current bid from such independent dealers or other independent parties is unavailable, the Valuation Designee shall determine the fair value of such security using the following factors: (i) the type of security; (ii) the cost at date of purchase; (iii) the size and nature of the Fund’s holdings; (iv) the discount from market value of unrestricted securities of the same class at the time of purchase and subsequent thereto; (v) information as to any transactions or offers with respect to the security; (vi) the nature and duration of restrictions on disposition of the security and the existence of any registration rights; (vii) how the yield of the security compares to similar securities of companies of similar or equal creditworthiness; (viii) the level of recent trades of similar or comparable securities; (ix) the liquidity characteristics of the security; (x) current market conditions; and (xi) the market value of any securities into which the security is convertible or exchangeable.
The Funds utilize various methods to measure the fair value of all of its investments on a recurring basis. GAAP establishes a hierarchy that prioritizes inputs to valuation methods. The three levels of input are:
Level 1 – Unadjusted quoted prices in active markets for identical assets and liabilities that Funds have the ability to access.
Level 2 – Observable inputs other than quoted prices included in Level 1 that are observable for the asset or liability, either directly or indirectly. These inputs may include quoted prices for the identical instrument in an active market, prices for similar instruments, interest rates, prepayment speeds, credit risk, yield curves, default rates and similar data.
Level 3 – Unobservable inputs for the asset or liability, to the extent relevant observable inputs are not available, representing the Funds’ own assumptions about the assumptions a market participant would use in valuing the asset or liability, and would be based on the best information available.
The availability of observable inputs can vary from security to security and is affected by a wide variety of factors, including, for example, the type of security, whether the security is new and not yet established in the marketplace, the liquidity of markets, and other characteristics particular to the security. To the extent that valuation is based on models or inputs that are less observable or unobservable in the market, the determination of fair value requires more judgment. Accordingly, the degree of judgment exercised in determining fair value is greatest for instruments categorized in Level 3.
36
| Toews Funds |
| Notes to Financial Statements (Continued) |
| April 30, 2023 |
The inputs used to measure fair value may fall into different levels of the fair value hierarchy. In such cases, for disclosure purposes, the level in the fair value hierarchy within which the fair value measurement falls in its entirety, is determined based on the lowest level input that is significant to the fair value measurement in its entirety.
The inputs or methodology used for valuing securities are not necessarily an indication of the risk associated with investing in those securities. Please refer to the Funds’ prospectuses for a full listing of risks associated with these investments. The following tables summarize the inputs used as of April 30, 2023 for the Funds’ assets and liabilities measured at fair value:
| Tactical Income Fund | ||||||||||||||||
| Assets | Level 1 | Level 2 | Level 3 | Total | ||||||||||||
| Exchange-Traded Funds | $ | 340,288,050 | $ | — | $ | — | $ | 340,288,050 | ||||||||
| Open End Funds | 190,076,105 | — | — | 190,076,105 | ||||||||||||
| Corporate Bonds | — | 57,360,419 | — | 57,360,419 | ||||||||||||
| Collateral For Securities Loaned | 58,264,250 | — | — | 58,264,250 | ||||||||||||
| Total | $ | 588,628,405 | $ | 57,360,419 | $ | — | $ | 645,988,824 | ||||||||
| Oceana Fund | ||||||||||||||||
| Assets | Level 1 | Level 2 | Level 3 | Total | ||||||||||||
| Exchange-Traded Funds | $ | 47,973,328 | $ | — | $ | — | $ | 47,973,328 | ||||||||
| Future Options Purchased | 103,688 | — | — | 103,688 | ||||||||||||
| Total | $ | 48,077,016 | $ | — | $ | — | $ | 48,077,016 | ||||||||
| U.S. Fund | ||||||||||||||||
| Assets | Level 1 | Level 2 | Level 3 | Total | ||||||||||||
| U.S. Government & Agencies | $ | — | $ | 65,940,320 | $ | — | $ | 65,940,320 | ||||||||
| Future Options Purchased | 175,875 | — | — | 175,875 | ||||||||||||
| Futures Contracts | 4,764,368 | — | — | 4,764,368 | ||||||||||||
| Total | $ | 4,940,243 | $ | 65,940,320 | $ | — | $ | 70,880,563 | ||||||||
| Opportunity Fund | ||||||||||||||||
| Assets | Level 1 | Level 2 | Level 3 | Total | ||||||||||||
| U.S. Government & Agencies | $ | — | $ | 50,572,315 | $ | — | $ | 50,572,315 | ||||||||
| Future Options Purchased | 157,975 | — | — | 157,975 | ||||||||||||
| Futures Contracts | 1,451,804 | — | — | 1,451,804 | ||||||||||||
| Total | $ | 1,609,779 | $ | 50,572,315 | $ | — | $ | 52,182,094 | ||||||||
| Unconstrained Income Fund | ||||||||||||||||
| Assets | Level 1 | Level 2 | Level 3 | Total | ||||||||||||
| Exchange-Traded Funds | $ | 21,296,370 | $ | — | $ | — | $ | 21,296,370 | ||||||||
| Open End Funds | 6,010,542 | — | — | 6,010,542 | ||||||||||||
| U.S. Government & Agencies | — | 17,113,258 | — | 17,113,258 | ||||||||||||
| Total | $ | 27,306,912 | $ | 17,113,258 | $ | — | $ | 44,420,170 | ||||||||
| Defensive Alpha Fund | ||||||||||||||||
| Assets | Level 1 | Level 2 | Level 3 | Total | ||||||||||||
| Exchange-Traded Funds | $ | 32,391,732 | $ | — | $ | — | $ | 32,391,732 | ||||||||
| Future Options Purchased | 252,330 | — | — | 252,330 | ||||||||||||
| Futures Contracts | 2,510,408 | — | — | 2,510,408 | ||||||||||||
| Total | $ | 35,154,470 | $ | — | $ | — | $ | 35,154,470 | ||||||||
The Funds did not hold any Level 3 securities during the period.
Exchange Traded Funds (“ETFs”) – The Funds may invest in ETFs. ETFs are a type of fund bought and sold on a securities exchange. An ETF trades like common stock and represents a fixed portfolio of securities. The Funds may purchase an ETF to temporarily gain
37
| Toews Funds |
| Notes to Financial Statements (Continued) |
| April 30, 2023 |
exposure to a portion of the U.S. or a foreign market while awaiting purchase of underlying securities. There are risks of owning the underlying securities the ETFs are designed to track, and the lack of liquidity of an ETF may result in it being more volatile. Additionally, ETFs have fees and expenses that reduce their value.
ETF, Mutual Fund and Exchange Traded Note (“ETN”) Risk – ETFs, mutual funds and ETNs are subject to investment advisory fees or management fees and other expenses, which are indirectly paid by each Fund. Each are subject to specific risks, depending on investment strategy. Also, each may be subject to leverage risk, which may magnify losses. ETNs are also subject to default risks.
Securities Lending Risk – The Funds may lend portfolio securities to institutions, such as banks and certain broker-dealers. A Fund may experience a loss or delay in the recovery of its securities if the borrowing institution breaches its agreement with the Fund (see additional information at Note 8).
Market Risk – Overall market risks may also affect the value of the Fund. The market values of securities or other investments owned by the Fund will go up or down, sometimes rapidly or unpredictably. Factors such as economic growth and market conditions, interest rate levels, exchange rates and political events affect the securities markets. Changes in market conditions and interest rates generally do not have the same impact on all types of securities and instruments. Unexpected local, regional or global events and their aftermath, such as war; acts of terrorism; financial, political or social disruptions; natural, environmental or man-made disasters; the spread of infectious illnesses or other public health issues; recessions and depressions; or other tragedies, catastrophes and events could have a significant impact on the Fund and its investments and could result in increased premiums or discounts to the Fund’s net asset value, and may impair market liquidity, thereby increasing liquidity risk. Such events can cause investor fear and panic, which can adversely affect the economies of many companies, sectors, nations, regions and the market in general, in ways that cannot necessarily be foreseen. The Fund could lose money over short periods due to short-term market movements and over longer periods during more prolonged market downturns. During a general market downturn, multiple asset classes may be negatively affected. In times of severe market disruptions you could lose your entire investment.
An outbreak of infectious respiratory illness caused by a novel coronavirus known as COVID-19 was first detected in China in December 2019 and subsequently spread globally. This coronavirus has resulted in, among other things, travel restrictions, closed international borders, enhanced health screenings at ports of entry and elsewhere, disruption of and delays in healthcare service preparation and delivery, prolonged quarantines, significant disruptions to business operations, market closures, cancellations and restrictions, supply chain disruptions, lower consumer demand, and significant volatility and declines in global financial markets, as well as general concern and uncertainty. The impact of COVID -19 has adversely affected, and other infectious illness outbreaks that may arise in the future could adversely affect, the economies of many nations and the entire global economy, individual issuers and capital markets in ways that cannot necessarily be foreseen. In addition, the impact of infectious illnesses in emerging market countries may be greater due to generally less established healthcare systems. Public health crises caused by the COVID-19 outbreak may exacerbate other pre-existing political, social and economic risks in certain countries or globally. The duration of the COVID-19 outbreak and its effects cannot be determined with certainty.
Futures – The Funds are subject to equity price risk in the normal course of pursuing their investment objectives. To manage equity price risk, the Funds may enter into futures contracts. Upon entering into a futures contract with a broker, the Funds are required to deposit, in a segregated account, a specified amount of cash or U.S. government securities which are classified as “cash deposit” with broker in the accompanying Statements of Assets and Liabilities. Futures contracts are valued daily and unrealized gains or losses are recorded in the “net unrealized appreciation from future contracts” account. Periodically, the Funds receive from, or pay to the brokers, a specified amount of cash based upon changes in the “net unrealized appreciation from open future contracts” account. When a contract is closed, the Funds recognize a realized gain or loss. Futures contracts have market risks, including the risk that the change in the value of the contract may not correlate with changes in the value of the underlying securities. With futures contracts, there is minimal counterparty credit risk to the Funds since futures are exchange traded and the exchange’s clearinghouse, as counterparty to all exchange traded futures, guarantees the futures against default. Futures contracts outstanding at period end are listed after the Funds’ schedules of investments.
The notional value represents amounts related to each Fund’s futures contracts upon which the fair value of the futures contracts held by the Fund are based. Notional values do not represent the current fair value of the Funds’ futures contracts. Further, the underlying price changes in relation to variables specified by the notional values, affects the fair value of these derivative financial
38
| Toews Funds |
| Notes to Financial Statements (Continued) |
| April 30, 2023 |
instruments. Theoretically, each Fund’s exposure is equal to the notional value of contracts held. Each Fund’s obligations will generally equal only the amount to be paid or received through a futures contract.
Options Transactions – The Funds are subject to equity price risk in the normal course of pursuing its investment objective and may purchase or sell options to help hedge against risk. When a Fund writes put and call options, an amount equal to the premium received is included in the Statement of Assets and Liabilities as a liability. The amount of the liability is subsequently marked -to-market to reflect the current market value of the option. If an option expires on its stipulated expiration date or if a Fund enters into a closing purchase transaction, a gain or loss is realized. If a written call option is exercised, a gain or loss is realized for the sale of the underlying security and the proceeds from the sale are increased by the premium originally received. As writer of an option, a Fund has no control over whether the option will be exercised and, as a result, retains the market risk of an unfavorable change in the price of the security underlying the written option.
The Funds may purchase put and call options. Put options are purchased to hedge against a decline in the value of securities held in a Fund’s portfolio. If such a decline occurs, a put option will permit a Fund to sell the securities underlying such options at the exercise price, or to close out the options at a profit. The premium paid for a put or call option plus any transaction costs will reduce the benefit, if any, realized by a Fund upon exercise of the option, and, unless the price of the underlying security or index rises or declines sufficiently, the option may expire worthless to a Fund. In addition, in the event that the price of the security or index in connection with which an option was purchased moves in a direction favorable to a Fund, the benefits realized by a Fund as a result of such favorable movement will be reduced by the amount of the premium paid for the option and related transaction costs. Written and purchased options are non-income producing securities. With purchased options, there is minimal counterparty risk to a Fund since these options are exchange traded and the exchange’s clearinghouse, as counterparty to all exchange traded options, guarantees against a possible default.
The notional value of the derivative instruments outstanding as of April 30, 2023, as disclosed in the Schedules of Investments and the amounts realized and changes in unrealized gains and losses on derivative instruments during the period as disclosed above and within the Statements of Operations serve as indicators of the volume of derivative activity.
For the year ended April 30, 2023, the amount of unrealized appreciation (depreciation) and realized gain (loss) on futures, options purchased, and options written subject to equity price risk (interest rate risk for Tactical Income Fund) amounted to the following:
| Statements of | ||||||||||||
| Statements of Assets | Operations | Statements of | ||||||||||
| and Liabilities | Change in Unrealized | Operations Realized | ||||||||||
| Unrealized Appreciation | Appreciation on | Gain (Loss) on | ||||||||||
| Fund | from Futures Contracts | Futures Contracts | Futures Contracts | |||||||||
| Tactical Income Fund | $ | — | $ | — | $ | (408,895 | ) | |||||
| U.S. Fund | 4,764,368 | 4,764,368 | (7,145,780 | ) | ||||||||
| Opportunity Fund | 1,451,804 | 1,451,804 | (10,174,166 | ) | ||||||||
| Defensive Alpha Fund | 2,510,408 | 2,510,408 | (9,002,059 | ) | ||||||||
39
| Toews Funds |
| Notes to Financial Statements (Continued) |
| April 30, 2023 |
| Statements of | ||||||||||||
| Statements of Assets | Operations | Statements of | ||||||||||
| and Liabilities | Change in Unrealized | Operations Realized | ||||||||||
| Options Purchased at | Depreciation on | Loss on Options | ||||||||||
| Fund | Fair Value | Options Purchased | Purchased | |||||||||
| Oceana Fund | $ | 103,688 | $ | (47,400 | ) | $ | (747,743 | ) | ||||
| U.S. Fund | 175,875 | (80,400 | ) | (655,546 | ) | |||||||
| Opportunity Fund | 157,975 | (33,280 | ) | (441,445 | ) | |||||||
| Defensive Alpha Fund | 252,330 | (81,733 | ) | (487,400 | ) | |||||||
| Statements of | ||||||||||||
| Operations | ||||||||||||
| Change in Unrealized | Statements of | |||||||||||
| Statements of Assets | Appreciation | Operations Realized | ||||||||||
| and Liabilities | (Depreciation) on | Gain (Loss) on | ||||||||||
| Option Contracts | Written Options | Written Options | ||||||||||
| Fund | Written at Fair Value | Contracts | Contracts | |||||||||
| Oceana Fund | $ | — | $ | — | $ | 370,541 | ||||||
| U.S. Fund | — | — | 719,321 | |||||||||
| Opportunity Fund | — | — | 590,026 | |||||||||
| Defensive Alpha Fund | — | — | (381,716 | ) | ||||||||
Offsetting of Financial Assets and Derivative Assets and Liabilities – The Funds’ policy is to recognize a net asset or liability equal to the net appreciation (depreciation) of the derivative. The following tables show additional information regarding derivatives and the offsetting of assets and liabilities at April 30, 2021.
Tactical Income Fund
| Net Amounts | Financial | Cash | Net | |||||||||||||||||||||||
| Gross Amounts of | Gross Amounts of | Presented in the | Instruments | Collateral | Amount | |||||||||||||||||||||
| Description | Counterparty | Recognized Assets | Recognized Liabilities | Statement of Assets & Liabilities | Pledged | Pledged | of Assets & Liabilities | |||||||||||||||||||
| Collateral For Securities Loaned | Securities Finance Trust Co. | $ | — | $ | 58,264,250 | (1) | $ | 58,264,250 | $ | — | $ | 58,264,250 | (2) | $ | — | |||||||||||
| $ | — | $ | 58,264,250 | $ | 58,264,250 | $ | — | $ | 58,264,250 | $ | — | |||||||||||||||
Oceana Fund
| Net Amounts | Financial | Cash | Net | |||||||||||||||||||||||
| Gross Amounts of | Gross Amounts of | Presented in the | Instruments | Collateral | Amount | |||||||||||||||||||||
| Description | Counterparty | Recognized Assets | Recognized Liabilities | Statement of Assets & Liabilities | Pledged | Pledged | of Assets & Liabilities | |||||||||||||||||||
| Option Purchased at Value | EDF & MAN Capital Markets | $ | 103,688 | (1) | $ | — | $ | 103,688 | $ | — | $ | — | $ | 103,688 | ||||||||||||
| $ | 103,688 | $ | — | $ | 103,688 | $ | — | $ | — | $ | 103,688 | |||||||||||||||
U.S Fund
| Net Amounts | Financial | Cash | Net | |||||||||||||||||||||||
| Gross Amounts of | Gross Amounts of | Presented in the | Instruments | Collateral | Amount | |||||||||||||||||||||
| Description | Counterparty | Recognized Assets | Recognized Liabilities | Statement of Assets & Liabilities | Pledged | Pledged (3) | of Assets & Liabilities | |||||||||||||||||||
| Option Purchased at Value | EDF & MAN Capital Markets | $ | 175,875 | (1) | $ | — | $ | 175,875 | $ | — | $ | — | $ | 175,875 | ||||||||||||
| Future Contracts | EDF & MAN Capital Markets | 4,764,368 | (1) | — | 4,764,368 | — | — | 4,764,368 | ||||||||||||||||||
| $ | 4,940,243 | $ | — | $ | 4,940,243 | $ | — | $ | — | $ | 4,940,243 | |||||||||||||||
40
| Toews Funds |
| Notes to Financial Statements (Continued) |
| April 30, 2023 |
Opportunity Fund
| Net Amounts | Financial | Cash | Net | |||||||||||||||||||||||
| Gross Amounts of | Gross Amounts of | Presented in the | Instruments | Collateral | Amount | |||||||||||||||||||||
| Description | Counterparty | Recognized Assets | Recognized Liabilities | Statement of Assets & Liabilities | Pledged | Pledged (3) | of Assets & Liabilities | |||||||||||||||||||
| Option Purchased at Value | EDF & MAN Capital Markets | $ | 157,975 | (1) | $ | — | $ | 157,975 | $ | — | $ | — | $ | 157,975 | ||||||||||||
| Future Contracts | EDF & MAN Capital Markets | 1,451,804 | (1) | — | 1,451,804 | — | — | 1,451,804 | ||||||||||||||||||
| $ | 1,609,779 | $ | — | $ | 1,609,779 | $ | — | $ | — | $ | 1,609,779 | |||||||||||||||
| Defensive Alpha Fund | ||||||||||||||||||||||||||
| Net Amounts | Financial | Cash | Net | |||||||||||||||||||||||
| Gross Amounts of | Gross Amounts of | Presented in the | Instruments | Collateral | Amount | |||||||||||||||||||||
| Description | Counterparty | Recognized Assets | Recognized Liabilities | Statement of Assets & Liabilities | Pledged | Pledged (3) | of Assets & Liabilities | |||||||||||||||||||
| Option Purchased at Value | EDF & MAN Capital Markets | $ | 252,330 | (1) | $ | — | $ | 252,330 | $ | — | $ | — | $ | 252,330 | ||||||||||||
| Future Contracts | EDF & MAN Capital Markets | 2,510,408 | (1) | — | 2,510,408 | — | — | 2,510,408 | ||||||||||||||||||
| $ | 2,762,738 | $ | — | $ | 2,762,738 | $ | — | $ | — | $ | 2,762,738 | |||||||||||||||
| (1) | Value as presented in the Schedule of Investments. |
| (2) | The amount is limited to the derivative liability balance and does not include excess collateral pledged to the counterparty. Total collateral amounts are presented in the Statements of Assets and Liabilities. |
| (3) | Excess collateral is not shown in this table. Collateral amounts for open futures contracts are presented in the Statements of Assets and Liabilities as Cash Deposit with broker-futures margin balance. |
Cash and Cash Equivalents – Cash and cash equivalents include cash and overnight investments in interest-bearing demand deposits with a financial institution with original maturities of three months or less. The assets of each Fund may be placed in deposit accounts at U.S. banks and such deposits generally exceed Federal Deposit Insurance Corporation (“FDIC”) insurance limits. The FDIC insures deposit accounts up to $250,000 for each accountholder. The counterparty is generally a single bank or other financial institution, rather than a group of financial institutions; thus, there may be a greater counterparty credit risk. The Funds place deposits only with those counterparties which are believed to be creditworthy.
Security Transactions and Investment Income – Investment security transactions are accounted for no later than the first business day after the trade date, except for reporting purposes when transactions are recorded on the trade date. Cost is determined and gains and losses are calculated based upon the specific identification method for both financial statement and federal income tax purposes. Dividend income is recorded on the ex-dividend date and interest income is recorded on an accrual basis. Purchase discounts and premiums on securities are accreted and amortized over the life of the respective securities.
Expenses – Expenses of the Trust that are directly identifiable to a specific fund are charged to that fund. Expenses which are not readily identifiable to a specific fund are allocated in such a manner as deemed equitable, taking into consideration the nature and type of expense and the relative sizes of the funds in the Trust.
Federal Income Taxes – The Funds intend to comply with the requirements of Subchapter M of the Internal Revenue Code applicable to regulated investment companies and will distribute all of their taxable income, if any, to shareholders. Accordingly, no provision for Federal income taxes is required in the financial statements. The Funds recognize the tax benefits of uncertain tax positions only when the position is “more likely than not” to be sustained assuming examination by tax authorities. Management has analyzed the Funds’ tax positions and has concluded that no liability for unrecognized tax benefits should be recorded related to uncertain tax positions taken on returns filed for open tax years ended April 30, 2020, to April 30, 2022, or expected to be taken in the Funds’ April 30, 2023 year-end tax returns. The Funds identify their major tax jurisdictions as United States Federal and Ohio. The Funds recognize interest and penalties, if any, related to unrecognized tax benefits as income tax expense in the Statements of Operations. During the year, the Funds did not incur any interest or penalties. Generally, tax authorities can examine tax returns filed for the last three years.
Dividends and Distributions – Each of the Funds, except the Income Fund, will pay dividends from net investment income, if any, at least annually and will declare and pay distributions from net realized capital gains, if any, annually. The Income Fund pays dividends from net investment income, if any, monthly, and pays distributions from net realized capital gains, if any, annually. The amounts of distributions from net investment income and capital gains are determined in accordance with federal income tax regulations, which may differ from those amounts determined under GAAP. To the extent these book/tax differences are permanent, they are charged or credited to paid-in-capital in the period that the differences arises. All short-term capital gains are included in ordinary income for tax purposes.
41
| Toews Funds |
| Notes to Financial Statements (Continued) |
| April 30, 2023 |
Indemnification – The Trust indemnifies its officers and Trustees for certain liabilities that may arise from the performance of their duties to the Trust. Additionally, in the normal course of business, the Funds enter into contracts that contain a variety of representations and warranties and which provide general indemnities. Each Fund’s maximum exposure under these arrangements is unknown, as this would involve future claims that may be made against the Funds that have not yet occurred. However, based on experience, the risk of loss due to these warranties and indemnities appears to be remote.
NOTE 3. INVESTMENT ADVISORY AGREEMENT AND TRANSACTIONS WITH RELATED PARTIES
The Trust has entered into an investment advisory agreement with Toews Corporation (the “Adviser”) with respect to the Funds. The Adviser has overall supervisory responsibility for the general management and investment of the Funds and their securities portfolios. The Adviser receives a monthly fee payable by the Funds calculated at an annual rate of 1.00% of the average daily net assets of each Fund.
The Adviser has contractually agreed to waive its management fees and/or make payments to limit each Funds’ expenses (exclusive of any front-end or contingent deferred loads, brokerage fees and commissions, acquired fund fees and expenses), fees and expenses associated with investments in other collective investment vehicles or derivative instruments (including for example option and swap fees and expenses), borrowing costs (such as interest and dividend expense on securities sold short), taxes, and extraordinary expenses such as litigation expenses (which may include indemnification of Fund officers and Trustees, contractual indemnification of Fund service providers (other than the Adviser) at least until August 31, 2023, so that the total annual operating expenses of the Funds do not exceed 1.25% of the Funds’ average net assets. For the year ended April 30, 2023 the Adviser earned and waived and/or reimbursed the following fees pursuant to its contractual agreement:
| Fund | Fees Earned | Fees (Waived) | ||||||
| Tactical Income Fund | $ | 6,156,085 | $ | — | ||||
| Oceana Fund | 590,382 | (86,133 | ) | |||||
| U.S. Fund | 1,031,058 | (80,122 | ) | |||||
| Opportunity Fund | 859,657 | (79,131 | ) | |||||
| Unconstrained Income Fund | 603,125 | (77,308 | ) | |||||
| Defensive Alpha Fund | 1,170,481 | (30,942 | ) | |||||
Fees waived or expenses reimbursed may be recouped by the Adviser from the Funds for a period up to three years from the date the fee or expense was waived or reimbursed. However, no recoupment payment will be made if it would result in the Funds exceeding the contractual expense limitation described above. The following table shows the remaining waived expenses subject to potential recovery which expire in:
| Fund | April 30, 2024 | April 30, 2025 | April 30, 2026 | Total | ||||||||||||
| Oceana Fund | $ | 43,918 | $ | 60,545 | $ | 86,133 | $ | 190,596 | ||||||||
| U.S. Fund | 93,903 | 13,643 | 80,122 | 187,668 | ||||||||||||
| Opportunity Fund | 14,963 | 53,258 | 79,131 | 147,352 | ||||||||||||
| Unconstrained Income Fund | 48,742 | 54,921 | 77,308 | 180,971 | ||||||||||||
| Defensive Alpha Fund | — | — | 30,942 | 30,942 | ||||||||||||
Distributor – The distributor of the Funds is Northern Lights Distributors, LLC (“NLD” or the “Distributor”). For the year ended April 30, 2023, the Funds did not pay distribution-related charges to the Distributor.
In addition, certain affiliates of the Distributor provide services to the Funds as follows:
Ultimus Fund Solutions, LLC (“UFS”), an affiliate of the Distributor, provides administration, fund accounting, and transfer agent services to the Trust. Pursuant to separate servicing agreements with UFS, the Funds pay UFS customary fees for providing administration, fund accounting and transfer agency services to the Funds. Certain officers of the Trust are also officers of UFS, and are not paid any fees directly by the Funds for serving in such capacities.
42
| Toews Funds |
| Notes to Financial Statements (Continued) |
| April 30, 2023 |
Northern Lights Compliance Services, LLC (“NLCS”), an affiliate of UFS and the Distributor, provides a Chief Compliance Officer to the Trust, as well as related compliance services, pursuant to a consulting agreement between NLCS and the Trust. Under the terms of such agreement, NLCS receives customary fees from the Funds.
Blu Giant, LLC (“Blu Giant”), an affiliate of UFS and the Distributor, provides EDGAR conversion and filing services as well as print management services for the Funds on an ad-hoc basis. For the provision of these services, Blu Giant receives customary fees from the Funds.
NOTE 4. INVESTMENT TRANSACTIONS
The cost of security purchases and the proceeds from the sales of securities, other than short-term securities, for the year ended April 30, 2023 amounted to the following:
| Fund | Purchases | Sales | ||||||
| Tactical Income Fund | $ | 4,589,723,335 | $ | 3,966,653,644 | ||||
| Oceana Fund | 176,405,132 | 129,819,677 | ||||||
| U.S. Fund | — | — | ||||||
| Opportunity Fund | — | — | ||||||
| Unconstrained Income Fund | 203,996,722 | 174,818,234 | ||||||
| Defensive Alpha Fund | 444,562,924 | 530,396,683 | ||||||
NOTE 5. AGGREGATE UNREALIZED APPRECIATION AND DEPRECIATION – TAX BASIS
The identified cost of investments in securities owned by each Fund for federal income tax purposes and its respective gross unrealized appreciation and depreciation at April 30, 2023, were as follows:
| Gross Unrealized | Gross Unrealized | Net Unrealized | ||||||||||||||
| Tax Cost | Appreciation | (Depreciation) | (Depreciation) | |||||||||||||
| Tactical Income Fund | $ | 652,956,651 | $ | 906,874 | $ | (7,874,701 | ) | $ | (6,967,827 | ) | ||||||
| Oceana Fund | 43,799,010 | 4,288,788 | (10,782 | ) | 4,278,006 | |||||||||||
| U.S. Fund | 70,976,476 | — | (95,913 | ) | (95,913 | ) | ||||||||||
| Opportunity Fund | 52,256,435 | — | (74,341 | ) | (74,341 | ) | ||||||||||
| Unconstrained Income Fund | 44,881,690 | 94,600 | (556,120 | ) | (461,520 | ) | ||||||||||
| Defensive Alpha Fund | 32,263,953 | 2,890,611 | (94 | ) | 2,890,517 | |||||||||||
43
| Toews Funds |
| Notes to Financial Statements (Continued) |
| April 30, 2023 |
NOTE 6. DISTRIBUTIONS TO SHAREHOLDERS AND TAX COMPONENTS OF CAPITAL
The tax character of Funds’ distributions for the periods ended April 30, 2023, and April 30, 2022, was as follows:
| For the period ended April 30, 2023: | ||||||||||||||||||||
| Ordinary | Long-Term | Return | Tax-Exempt | |||||||||||||||||
| Portfolio | Income | Capital Gains | of Capital | Income | Total | |||||||||||||||
| Tactical Income Fund | $ | 18,741,659 | $ | — | $ | — | $ | — | $ | 18,741,659 | ||||||||||
| Oceana Fund | — | — | — | — | — | |||||||||||||||
| U.S. Fund | — | — | — | — | — | |||||||||||||||
| Opportunity Fund | 14,200 | — | — | — | 14,200 | |||||||||||||||
| Unconstrained Income Fund | 1,215,827 | — | 108,585 | — | 1,324,412 | |||||||||||||||
| Defensive Alpha Fund | 1,152,050 | — | — | — | 1,152,050 | |||||||||||||||
| For the period ended April 30, 2022: | ||||||||||||||||||||
| Ordinary | Long-Term | Return | Tax-Exempt | |||||||||||||||||
| Portfolio | Income | Capital Gains | of Capital | Income | Total | |||||||||||||||
| Tactical Income Fund | $ | 14,200,580 | $ | — | $ | — | $ | — | $ | 14,200,580 | ||||||||||
| Oceana Fund | 740,187 | 737,720 | 940 | — | 1,478,847 | |||||||||||||||
| U.S. Fund | 6,325,735 | 11,439,577 | 485,426 | — | 18,250,738 | |||||||||||||||
| Opportunity Fund | 5,483,005 | 7,719,175 | — | — | 13,202,180 | |||||||||||||||
| Unconstrained Income Fund | 1,133,742 | — | 17,285 | — | 1,151,027 | |||||||||||||||
| Defensive Alpha Fund | 13,563,832 | 15,985,835 | — | — | 29,549,667 | |||||||||||||||
As of April 30, 2023, the components of accumulated earnings on a tax basis were as follows:
| Undistributed | Undistributed | Post October Loss | Capital Loss | Other | Unrealized | Total | ||||||||||||||||||||||
| Ordinary | Long-Term | and | Carry | Book/Tax | Appreciation/ | Accumulated | ||||||||||||||||||||||
| Portfolio | Income | Capital Gains | Late Year Loss | Forwards | Differences | (Depreciation) | Earnings/(Deficits) | |||||||||||||||||||||
| Tactical Income Fund | $ | 3,815,039 | $ | — | $ | (3,554,711 | ) | $ | (51,067,860 | ) | $ | — | $ | (6,967,827 | ) | $ | (57,775,359 | ) | ||||||||||
| Oceana Fund | 521,598 | — | — | (9,760,962 | ) | — | 4,278,006 | (4,961,358 | ) | |||||||||||||||||||
| U.S. Fund | 513,252 | — | — | (12,659,170 | ) | — | (95,913 | ) | (12,241,831 | ) | ||||||||||||||||||
| Opportunity Fund | 443,394 | — | (6,432,132 | ) | (18,564,071 | ) | — | (74,341 | ) | (24,627,150 | ) | |||||||||||||||||
| Unconstrained Income Fund | — | — | — | (6,765,926 | ) | — | (461,520 | ) | (7,227,446 | ) | ||||||||||||||||||
| Defensive Alpha Fund | 410,026 | — | (9,434,073 | ) | (16,835,498 | ) | — | 2,890,517 | (22,969,028 | ) | ||||||||||||||||||
The difference between book basis and tax basis undistributed net investment income, accumulated net realized losses, and unrealized (depreciation) from investments is primarily attributable to the tax deferral of losses on wash sales, mark-to-market on open 1256 futures and options.
Capital losses incurred after October 31 within the fiscal year are deemed to arise on the first business day of the following fiscal year for tax purposes. The following Funds incurred and elected to defer such capital losses as follows:
| Post October | ||||
| Portfolio | Losses | |||
| Tactical Income Fund | $ | 3,554,711 | ||
| Oceana Fund | — | |||
| U.S. Fund | — | |||
| Opportunity Fund | 6,432,132 | |||
| Unconstrained Income Fund | — | |||
| Defensive Alpha Fund | 9,434,073 | |||
44
| Toews Funds |
| Notes to Financial Statements (Continued) |
| April 30, 2023 |
At April 30, 2023, the Funds had capital loss carry forwards for federal income tax purposes available to offset future capital gains, as follows:
| Non-Expiring | ||||||||||||||||
| Portfolio | Short-Term | Long-Term | Total | CLCF Utilized | ||||||||||||
| Tactical Income Fund | $ | 51,067,860 | $ | — | $ | 51,067,860 | $ | — | ||||||||
| Oceana Fund | 6,280,271 | 3,480,691 | 9,760,962 | — | ||||||||||||
| U.S. Fund | 6,637,712 | 6,021,458 | 12,659,170 | — | ||||||||||||
| Opportunity Fund | 8,444,880 | 10,119,191 | 18,564,071 | — | ||||||||||||
| Unconstrained Income Fund | 6,765,926 | — | 6,765,926 | — | ||||||||||||
| Defensive Alpha Fund | 9,328,844 | 7,506,654 | 16,835,498 | — | ||||||||||||
Permanent book and tax differences, primarily attributable to the tax treatment of reclassification of Funds’ distributions for the Funds for the year ended April 30, 2023, as follows:
| Paid | ||||||||
| In | Accumulated | |||||||
| Portfolio | Capital | Earnings (Losses) | ||||||
| Tactical Income Fund | $ | — | $ | — | ||||
| Oceana Fund | — | — | ||||||
| U.S. Fund | — | — | ||||||
| Opportunity Fund | — | — | ||||||
| Unconstrained Income Fund | (108,585 | ) | 108,585 | |||||
| Defensive Alpha Fund | — | — | ||||||
NOTE 7. SECURITIES LENDING
The Tactical Income Fund and Unconstrained Income Fund have entered into a securities lending arrangement (the “Agreement”) with the Securities Finance Trust Company (“SFTC”, or the “Lending Agent”). Under an agreement (the “Securities Lending Agreement”) with the SFTC, the Funds can lend their portfolio securities to brokers, dealers and other financial institutions approved by the Board to earn additional income. For each securities loan, the borrower shall transfer collateral in an amount determined by applying the margin to the market value of the loaned available securities (102% for same currency and 105% for cross currency). Collateral is invested in highly liquid, short -term instruments such as money market funds in accordance with the Funds’ security lending procedures. The Funds continue to receive interest or dividends on the securities loaned. The Funds have the right under the Securities Lending Agreement to recover the securities from the borrower on demand; if the borrower fails to deliver the securities on a timely basis, the Funds could experience delays or losses on recovery. Additionally, the Funds are subject to the risk of loss from investments made with the cash received as collateral. The Funds manage credit exposure arising from these lending transactions by, in appropriate circumstances, entering into master netting agreements and collateral agreements with third party borrowers that provide in the event of default (such as bankruptcy or a borrower’s failure to pay or perform), the right to net a third-party borrower’s rights and obligations under such agreement and liquidate and set off collateral against the net amount owed by the counterparty.
The Unconstrained Income Fund had no securities on loan as of April 30, 2023. The following table breaks out Tactical Income Fund’s securities lending transactions accounted for as secured borrowings with cash collateral of overnight and continuous maturities as of April 30, 2023:
| Overnight and | ||||||
| Continuous | ||||||
| Tactical Income Fund | State Street Institutional US Government Money Market Fund, Institutional Class | $ | 58,264,250 | |||
As of April 30, 2023, the Tactical Income Fund loaned securities and received cash collateral for the loan. This cash was invested in the State Street Institutional US Government Money Market Fund Institutional Class as shown in the Schedule of Investments. For the
45
| Toews Funds |
| Notes to Financial Statements (Continued) |
| April 30, 2023 |
year ended April 30, 2023, the Tactical Income Fund and Unconstrained Income Fund earned $248,067 and $12,910, respectively, from their securities lending activities during the year as disclosed on the Statement of Operations.
The securities loaned are noted in the Schedule of Investments. The fair value of the securities loaned for the Funds at April 30, 2023 were as follows.
| Fair Value of | ||||
| Securities Loaned | ||||
| Tactical Income Fund | $ | 57,343,491 | ||
The fair value of the “Collateral for Securities Loaned” on the Schedule of Investments includes only cash collateral received and reinvested. As of April 30, 2023, the total collateral for securities loaned was as follows:
| Collateral for | ||||
| Securities Loaned | ||||
| Tactical Income Fund | $ | 58,264,250 | ||
These amounts are offset by a liability recorded as “Collateral on securities loaned” as shown on the Statement of Assets and Liabilities.
NOTE 8. BENEFICIAL OWNERSHIP
The Funds have no knowledge as to whether all or any portion of the shares owned, by the parties noted below, are also owned beneficially by any party who would be presumed to control the respective Funds. The beneficial ownership, either directly or indirectly, of more than 25% of the voting securities of a fund creates presumption of control of the fund under section 2(a)(9) of the 1940 Act. As of April 30, 2023, the below entities held more than 25% of the voting securities for each of the Funds listed.
| Fund | TD Ameritrade, Inc. | |
| Tactical Income Fund | 65.38% | |
| Oceana Fund | 56.77% | |
| U.S. Fund | 50.11% | |
| Opportunity Fund | 57.55% | |
| Unconstrained Income Fund | 64.78% | |
| Defensive Alpha Fund | 58.88% |
NOTE 9. UNDERLYING INVESTMENT IN OTHER INVESTMENT COMPANIES
The following Funds currently invest a portion of their assets in the corresponding investments. The Funds may redeem their investment from the investments at any time if the Adviser determines that it is in the best interest of the Funds and their shareholders to do so. The performance of the Funds will be directly affected by the performance of the investments. The financial statements of the investments, including their portfolio of investments, can be found at the Securities and Exchange Commission’s website www.sec.gov and should be read in conjunction with the Funds’ financial statements.
| Fund | Investment | Percentage of Net Assets | ||
| Oceana Fund | Vanguard FTSE Developed Markets ETF | 98.8% | ||
| Defensive Alpha Fund | Vanguard FTSE Developed Markets ETF | 29.9% |
NOTE 10. SUBSEQUENT EVENTS
Subsequent events after the date of the Statements of Assets and Liabilities have been evaluated through the date the financial statements were issued. Management has determined that no events or transactions occurred requiring adjustment or disclosure in the financial statements.
46
Report of Independent Registered Public Accounting Firm
To the Board of Trustees of Northern Lights Fund Trust
and the Shareholders of Toews Tactical Income Fund, Toews Hedged Oceana Fund, Toews Hedged U.S. Fund, Toews Hedged U.S. Opportunity Fund, Toews Unconstrained Income Fund and Toews Tactical Defensive Alpha Fund
Opinion on the Financial Statements
We have audited the accompanying statements of assets and liabilities of Toews Tactical Income Fund, Toews Hedged Oceana Fund, Toews Hedged U.S. Fund, Toews Hedged U.S. Opportunity Fund, Toews Unconstrained Income Fund and Toews Tactical Defensive Alpha Fund (collectively, the Funds), each a separate series of the Northern Lights Fund Trust, including the schedules of investments, as of April 30, 2023, the related statements of operations for the year then ended, the statements of changes in net assets for each of the two years in the period then ended and the related notes to the financial statements (collectively, the financial statements), and the financial highlights for each of the five years in the period then ended. In our opinion, the financial statements and financial highlights present fairly, in all material respects, the financial position of the Funds as of April 30, 2023, the results of their operations for the year then ended, the changes in net assets for each of the two years in the period then ended, and the financial highlights for each of the five years in the period then ended, in conformity with accounting principles generally accepted in the United States of America.
Basis for Opinion
These financial statements are the responsibility of the Funds’ management. Our responsibility is to express an opinion on the Funds’ financial statements and financial highlights based on our audits. We are a public accounting firm registered with the Public Company Accounting Oversight Board (United States) (PCAOB) and are required to be independent with respect to the Funds in accordance with U.S. federal securities laws and the applicable rules and regulations of the Securities and Exchange Commission and the PCAOB.
We conducted our audits in accordance with the standards of the PCAOB. Those standards require that we plan and perform the audits to obtain reasonable assurance about whether the financial statements are free of material misstatement, whether due to error or fraud. The Funds are not required to have, nor were we engaged to perform, audits of their internal control over financial reporting. As part of our audits, we are required to obtain an understanding of internal control over financial reporting but not for the purpose of expressing an opinion on the effectiveness of the Funds’ internal control over financial reporting. Accordingly, we express no such opinion.
Our audits included performing procedures to assess the risks of material misstatement of the financial statements, whether due to error or fraud, and performing procedures that respond to those risks. Such procedures included examining, on a test basis, evidence regarding the amounts and disclosures in the financial statements. Our procedures included confirmation of investments owned as of April 30, 2023, by correspondence with the custodians and brokers or by other appropriate auditing procedures where replies from brokers were not received. Our audits also included evaluating the accounting principles used and significant estimates made by management, as well as evaluating the overall presentation of the financial statements. We believe that our audits provide a reasonable basis for our opinion.
/s/ RSM US LLP
We have served as the auditor to one or more of the Toews Funds since 2013.
Denver, Colorado
June 29, 2023
47
| Toews Funds |
| Shareholder Expense Example (Unaudited) |
As a shareholder of the Funds you incur ongoing costs, including management fees and other Fund expenses. Additionally, you may incur transactional costs in the form of redemption fees. This Example is intended to help you understand your ongoing costs (in dollars) of investing in the Funds and to compare these costs with the ongoing costs of investing in other mutual funds. The Example is based on $1,000 invested on November 1, 2022 and held April 30, 2023.
Actual Expenses: The columns on the left of the table provides information about actual account values and actual expenses. You may use the information in this line, together with the amount you invested, to estimate the expenses that you paid over the period. Simply divide your account value by $1,000 (for example, an $8,600 account value divided by $1,000 = 8.6), then multiply the result by the number in the first line under the heading entitled “Expenses Paid During the Period” to estimate the expenses you paid on your account during the period.
Hypothetical Examples for Comparison Purposes: The columns on the right of the table below provides information about hypothetical account values and hypothetical expenses based on the Funds’ actual expense ratio and an assumed rate of return of 5% per year before expenses, which is not the Funds’ actual return. The hypothetical account values and expenses may not be used to estimate the actual ending account balance or expenses you paid for the period. You may use this information to compare the ongoing costs of investing in the Funds and other funds. To do so, compare this 5% hypothetical example with the 5% hypothetical examples that appear in the shareholder reports of the other funds.
Please note that the expenses shown in the table are meant to highlight your ongoing costs only and do not reflect any transactional costs which may be applicable to your account. Therefore, the second line of the table is useful in comparing ongoing costs only and will not help you determine the relative total costs of owning different funds. In addition, if these transactional costs were included, your costs would have been higher.
| Hypothetical | ||||||||||||||||
| Actual | (5% return before expenses) | |||||||||||||||
| Fund’s | ||||||||||||||||
| Beginning | Ending | Expenses | Beginning | Ending | Expenses | Annualized | ||||||||||
| Account Value | Account Value | Paid During | Account Value | Account Value | Paid During | Expense | ||||||||||
| 11/1/22 | 4/30/23 | Period* | 11/1/22 | 4/30/23 | Period* | Ratio | ||||||||||
| Tactical Income Fund | $1,000.00 | $1,013.10 | $6.04 | $1,000.00 | $1,018.79 | $6.06 | 1.21% | |||||||||
| Oceana Fund | $1,000.00 | $1,087.70 | $6.47 | $1,000.00 | $1,018.60 | $6.26 | 1.25% | |||||||||
| U.S. Fund | $1,000.00 | $1,027.00 | $6.28 | $1,000.00 | $1,018.60 | $6.26 | 1.25% | |||||||||
| Opportunity Fund | $1,000.00 | $927.00 | $5.97 | $1,000.00 | $1,018.60 | $6.26 | 1.25% | |||||||||
| Unconstrained Income Fund | $1,000.00 | $1,013.60 | $6.24 | $1,000.00 | $1,018.60 | $6.26 | 1.25% | |||||||||
| Defensive Alpha Fund | $1,000.00 | $980.30 | $6.14 | $1,000.00 | $1,018.60 | $6.26 | 1.25% | |||||||||
| * | Expenses Paid During Period are equal to the Funds’ annualized expense ratio multiplied by the average account value over the period, multiplied by 181/365 (to reflect the number of days in the period ended April 30, 2023). |
48
| Toews Funds |
| SUPPLEMENTAL INFORMATION (Unaudited) |
| April 30, 2022 |
Toews Corporation Adviser to Toews Hedged Oceana Fund (“Toews Oceana”), Toews Hedged U.S. Opportunity Fund (“Toews Opportunity”), Toews Hedged U.S. Fund (“Toews Hedged U.S”), Toews Tactical Income Fund (“Toews Tactical Income”), Toews Unconstrained Income Fund (“Toews Unconstrained”), and Toews Tactical Defensive Alpha Fund (“Toews Defensive”) *
In connection with the regular meeting held on June 22-23, 2022 of the Board of Trustees (the “Trustees” or the “Board”) of the Northern Lights Fund Trust (the “Trust”), including a majority of the Trustees who are not “interested persons,” as that term is defined in the Investment Company Act of 1940, as amended, discussed the renewal of an investment advisory agreement (the “Advisory Agreement”) between Toews Corporation (“Toews” or the “Adviser”) and the Trust, with respect to the Toews Oceana, Toews Opportunity, Toews Hedged U.S., Toews Tactical Income, Toews Unconstrained, and Toews Defensive. (each a “Fund” and collectively referred to as the “Funds”). In considering the renewal of the Advisory Agreement, the Board received materials specifically relating to the Advisory Agreement.
The Trustees were assisted by independent legal counsel throughout the Advisory Agreement review process. The Trustees relied upon the advice of independent legal counsel and their own business judgment in determining the material factors to be considered in evaluating the Advisory Agreement and the weight to be given to each such factor. The conclusions reached by the Trustees were based on a comprehensive evaluation of all of the information provided and were not the result of any one factor. Moreover, each Trustee may have afforded different weight to the various factors in reaching his conclusions with respect to the Advisory Agreement.
Nature, Extent & Quality of Services.
The Board noted that Toews was founded in 1995 and managed approximately $1.3 billion in assets, a decrease from the previous year. The Board further noted that Toews specialized in designing and managing portfolios, specifically SMAs, mutual funds and ETFs, based on behavioral science and tactical research. The Board discussed the background information on the Adviser’s key personnel, taking into consideration their education and significant financial industry experience. They noted that the new CCO had been fully integrated into his role at the Adviser as of February 2022 and they discussed his previous compliance experience. The Board considered that Toews investment process relied on technical analysis of target allocations to identify the proper weighting of a portfolio. The Board recognized that the Adviser’s experience in the tactical space and commitment to its systematic signals had added value. The Board acknowledged the Adviser’s risk mitigation strategies for each Fund. The Trustees noted that the Adviser hired a third-party IT service provider who conducted a complete assessment of the Adviser’s IT infrastructure which included cybersecurity, which will result in an enhanced cybersecurity policy. After further discussion, the Board agreed Toews has the necessary resources to continue to provide quality service to the Funds for the benefit of shareholders.
Performance.
Toews Oceana. The Board discussed the Fund’s investment objective and strategy. The Board observed that the Fund underperformed its peer median and Morningstar category median over the one-year, three-year and five-year period, and had a 2-star Morningstar rating. The Board noted that the Fund’s strategy was designed to avoid material market drawdowns, which resulted in a solid standard deviation. Although the Fund continued to underperform, the Board noted that Toews was managing the Fund in accordance with its intended design. The Board discussed the Adviser’s recent enhancements to the Fund’s investment algorithm and acknowledged the Fund’s performance challenges. After further discussion, it was the consensus of the Board that performance was acceptable.
49
| Toews Funds |
| SUPPLEMENTAL INFORMATION (Unaudited) (Continued) |
| April 30, 2022 |
Toews Opportunity. The Board discussed the Fund’s investment objective and strategy. They noted that the Fund had unperformed by a large margin over the past 12 months, compared to the peer group and category averages. The Board observed that the Fund outperformed the category median over the three-year, five-year and since inception periods. The Board concluded that the Fund continued to show strong performance and good risk adjusted returns.
Toews Hedged U.S. The Board discussed the Fund’s investment objectives and strategy. The Board noted that the Fund outperformed the peer group and Morningstar category median over the three-year, five-year and since inception periods. The Board acknowledged the Fund’s solid long-term risk adjusted returns, noting recent underperformance. The Board agreed that the Adviser’s process had driven satisfactory returns over time and the Fund’s performance was satisfactory.
Toews Tactical Income. The Board discussed the Fund’s investment objectives and strategy. The Board noted that the Fund underperformed its Morningstar category, peer group median and benchmark over the three-year, five-year and since inception periods. The Board noted that despite the Fund’s underperformance, the Adviser had delivered positive returns for shareholders during those periods while adhering to the Fund’s strategy. The Board considered the Adviser’s assertion that the Fund’s standard deviation ranking was important given the Fund’s commitment to reduce downside risk. They noted that the Fund had reduced downside risk during sustained downturns in high yield bonds. It was the consensus of the Board that the Fund’s performance was acceptable.
Toews Unconstrained Income. The Board discussed the Fund’s investment objectives and strategy. The Board noted that the Fund outperformed its and benchmark and had the same performance as its category median over the one-year period but underperformed the peer group median and category median over the three-year and five-year periods and underperformed the category median since inception. The Board noted that the Fund had delivered positive returns during the longer periods presented, despite its defensive nature. After further discussion, it was the consensus of the Board that the Fund’s performance was acceptable given the Fund’s objectives.
Toews Defensive. The Board discussed the Fund’s investment objectives and strategy. They noted that the Fund had received a 4-star rating from Morningstar and was in the long-short equity category. The Board noted that the Fund outperformed its peer group and Morningstar category medians over all periods presented. The Board noted that the Adviser was implementing the Fund’s strategy as designed, delivering reasonable risk adjusted returns.
Fees and Expenses.
Toews Oceana. The Board noted that the Fund’s advisory fee of 1.00% was lower than its peer group median and average and equal to the category median. The Board reviewed the Fund’s net expense ratio and commented that the expense ratio was lower than its category and peer group medians and averages. After further discussion, the Board concluded that the Fund’s advisory fee was not unreasonable.
Toews Tactical Income. The Board noted the Fund’s advisory fee of 1.00% was higher than the peer group median and category median but, within the range charged by the funds in the peer group. The Board discussed the Fund’s net expense ratio, noting that it was higher than both the peer and category medians. The Board considered the Adviser’s assertion that the fee was reasonable given the active management of the Fund. After further discussion, the Board concluded that the Fund’s advisory fee was not unreasonable.
Toews Opportunity. The Board noted the Fund’s advisory fee of 1.00% was lower than its peer group median and average but equal to the category median. The Board discussed the Fund’s net expense ratio relative to
50
| Toews Funds |
| SUPPLEMENTAL INFORMATION (Unaudited) (Continued) |
| April 30, 2022 |
peers and the category. After further discussion, the Board concluded that the Fund’s advisory fee was not unreasonable.
Toews Hedged U.S. The Board noted that the Fund’s advisory fee of 1.00% was lower than its Morningstar category and peer group averages, lower than the peer group median and equal to the category median. The Board observed that the advisory fee was well within the range charged by the funds in the peer group. The Board discussed the Fund’s net expense ratio relative to peers and the category. After further discussion, the Board concluded that the Fund’s advisory fee was not unreasonable.
Toews Unconstrained Income. The Board noted that the Fund’s advisory fee of 1.00% was higher than its Morningstar category and peer group medians and averages. The Board reviewed the Fund’s net expense ratio relative to peers and the category. After further discussion, the Board concluded the Fund’s advisory fee was not unreasonable.
Toews Defensive. The Board noted that the Fund’s advisory fee of 1.00% was lower than its peer group median and equal to the category median. The Board reviewed the Fund’s net expense ratio and commented that it was lower than both its category and peer group medians. After further discussion, the Board concluded the Fund’s advisory fee was not unreasonable.
Economies of Scale.
The Board considered whether economies of scale had been realized in connection with Toews’ advisory services. They discussed the Adviser’s acknowledgement that breakpoints could be appropriate in the future as the Funds’ assets increase to more meaningful levels. The Board noted that based on each Fund’s current asset sizes and profit levels, the absence of breakpoints was acceptable at this time.
Profitability.
The Board reviewed the profitability analysis provided by Toews and discussed Toews’ analysis of risks assumed in managing the Funds. The Board noted that the Adviser realized a profit with respect to each Fund, and the explanation provided by the Adviser pertaining to the reasonableness of such profit. The Board agreed that the profits realized by Toews in each applicable case were not excessive.
Conclusion.
Having requested and received such information from Toews as the Board believed to be reasonably necessary to evaluate the terms of the Advisory Agreement, and as assisted by the advice of counsel, the Board concluded that renewal of the Advisory Agreement was in the best interests of the Funds and each Fund’s respective shareholders.
| * | Due to the timing of the contract renewal schedule, these deliberations may or may not relate to the current performance results of the Funds. |
51
| Toews Funds |
| SUPPLEMENTAL INFORMATION (Unaudited) |
| April 30, 2023 |
The Trustees and the executive officers of the Trust are listed below with their present positions with the Trust and principal occupations over at least the last five years. The business address of each Trustee and Officer is 225 Pictoria Drive, Suite 450, Cincinnati, OH 45246. All correspondence to the Trustees and Officers should be directed to c/o Ultimus Fund Solutions, LLC, P.O. Box 541150, Omaha, Nebraska 68154.
Independent Trustees
| Name, Address and Year of Birth | Position/Term of Office* | Principal Occupation During the Past Five Years | Number of Portfolios in Fund Complex** Overseen by Trustee | Other Directorships held by Trustee During the Past Five Years |
| Mark Garbin Born in 1951 | Trustee Since 2013 | Managing Principal, Coherent Capital Management LLC (since 2007). | 8 | Northern Lights Fund Trust (for series not affiliated with the Funds since 2013); Two Roads Shared Trust (since 2012); Forethought Variable Insurance Trust (since 2013); Northern Lights Variable Trust (since 2013); OHA Mortgage Strategies Fund (offshore), Ltd. (2014 - 2017); and Altegris KKR Commitments Master Fund (since 2014); Carlyle Tactical Private Credit Fund (since March 2018) and Independent Director OHA CLO Enhanced Equity II Genpar LLP (since June 2021). |
| Mark D. Gersten Born in 1950 | Trustee Since 2013 | Independent Consultant (since 2012). | 8 | Northern Lights Fund Trust (for series not affiliated with the Funds since 2013); Northern Lights Variable Trust (since 2013); Two Roads Shared Trust (since 2012); Altegris KKR Commitments Master Fund (since 2014); previously, Ramius Archview Credit and Distressed Fund (2015-2017); and Schroder Global Series Trust (2012 to 2017). |
| Anthony J. Hertl Born in 1950 | Trustee Since 2005; Chairman of the Board since 2013 | Retired, previously held several positions in a major Wall Street firm including Capital Markets Controller, Director of Global Taxation, and CFO of the Specialty Finance Group. | 8 | Northern Lights Fund Trust (for series not affiliated with the Funds since 2005); Northern Lights Variable Trust (since 2006); Alternative Strategies Fund (since 2010); Satuit Capital Management Trust (2007-2019). |
| Gary W. Lanzen Born in 1954 | Trustee Since 2005 | Retired (since 2012). Formerly, Founder, President and Chief Investment Officer, Orizon Investment Counsel, Inc. (2000-2012). | 8 | Northern Lights Fund Trust (for series not affiliated with the Funds since 2005) Northern Lights Variable Trust (since 2006); AdvisorOne Funds (since 2003); Alternative Strategies Fund (since 2010); and previously, CLA Strategic Allocation Fund (2014-2015). |
| John V. Palancia Born in 1954 | Trustee Since 2011 | Retired (since 2011). Formerly, Director of Futures Operations, Merrill Lynch, Pierce, Fenner & Smith Inc. (1975- 2011). | 8 | Northern Lights Fund Trust (for series not affiliated with the Funds since 2011); Northern Lights Fund Trust III (since February 2012); Alternative Strategies Fund (since 2012) and Northern Lights Variable Trust (since 2011). |
| Mark H. Taylor Born in 1964 | Trustee Since 2007; Chairman of the Audit Committee since 2013 | PhD (Accounting), CPA; Professor and Director, Lynn Pippenger School of Accountancy, Muma College of Business, University of South Florida (2019 – present); Professor and Department of Accountancy Chair, Case Western Reserve University (2009-2019); President, American Accounting Association (AAA) commencing August 2022 (President-Elect 2022-2023, President 2023- 2024; Past President 2024- 2025). AAA Vice President-Finance (2017- 2020); President, Auditing Section of the AAA; Member, AICPA Auditing Standards Board (2009- 2012); Academic Fellow, Office of the Chief Accountant, United States Securities Exchange Commission (2005-2006); Center for Audit Quality research grants (2014, 2012). | 8 | Northern Lights Fund Trust (for series not affiliated with the Funds since 2007); Alternative Strategies Fund (since 2010); Northern Lights Fund Trust III (since 2012); and Northern Lights Variable Trust (since 2007). |
4/30/23 – NLFT_v2
52
| Toews Funds |
| SUPPLEMENTAL INFORMATION (Unaudited) (Continued) |
| April 30, 2023 |
Officers
| Name, Address and Year of Birth | Position/Term of Office* | Principal Occupation During the Past Five Years | Number of Portfolios in Fund Complex** Overseen by Trustee | Other Directorships held by Trustee During the Past Five Years |
| Kevin E. Wolf Born in 1969 | President, Principal Executive Officer Since June 2017 | Executive Vice President, Head of Fund Administration, and Product; Ultimus Fund Solutions, LLC (since 2020); Vice President of The Ultimus Group, LLC (since 2019); Executive Vice President, Gemini Fund Services, LLC (2019-2020); President, Gemini Fund Services, LLC (2012-2019); Treasurer of the Trust (2006-June 2017). | N/A | N/A |
| James Colantino Born in 1969 | Treasurer, Principal Accounting Officer Since June 2017 | Senior Vice President Fund Administration, Ultimus Fund Solutions (since 2020); Senior Vice President Fund Administration, Gemini Fund Services, LLC (2012-2020); Assistant Treasurer of the Trust (2006-June 2017). | N/A | N/A |
| Stephanie Shearer Born in 1979 | Secretary Since February 2017 | Assistant Secretary of the Trust (2012-February 2017); Associate Director, Ultimus Fund Solutions (since 2022); Manager of Legal Administration, Ultimus Fund Solutions (2020-2022); Manager of Legal Administration, Gemini Fund Services, LLC (2018-2020); Senior Paralegal, Gemini Fund Services, LLC (2013 -2018). | N/A | N/A |
| Michael J. Nanosky Born in 1966 | Chief Compliance Officer Since January 2021 | Chief Compliance Officer, of the Trust (since January 2021); Vice President-Senior Compliance Officer, Ultimus Fund Solutions (since 2020); Vice President, Chief Compliance Officer for Williamsburg Investment Trust (2020-current); Senior Vice President-Chief Compliance Officer, PNC Funds (2014-2019). | N/A | N/A |
| * | The term of office for each Trustee and officer listed above will continue indefinitely until the individual resigns or is removed. |
| ** | As of April 30, 2023, the Trust was comprised of 66 active portfolios managed by unaffiliated investment advisers. The term “Fund Complex” applies only to the Funds in the Trust advised by the Fund’s Adviser. The Funds do not hold themselves out as related to any other series within the Trust that is not advised by the Fund’s Adviser. |
The Funds’ SAI includes additional information about the Trustees and is available free of charge, upon request, by calling toll-free at 1-877-558-6397.
4/30/23 – NLFT_v2
53
PRIVACY NOTICE
Northern Lights Fund Trust
Rev. February 2014
| FACTS | WHAT DOES NORTHERN LIGHTS FUND TRUST DO WITH YOUR PERSONAL INFORMATION? |
| Why? | Financial companies choose how they share your personal information. Federal law gives consumers the right to limit some, but not all sharing. Federal law also requires us to tell you how we collect, share, and protect your personal information. Please read this notice carefully to understand what we do. |
| What? | The types of personal information we collect and share depends on the product or service that you have with us. This information can include:
● Social Security number and wire transfer instructions
● account transactions and transaction history
● investment experience and purchase history
When you are no longer our customer, we continue to share your information as described in this notice. |
| How? | All financial companies need to share customers’ personal information to run their everyday business. In the section below, we list the reasons financial companies can share their customers’ personal information; the reasons Northern Lights Fund Trust chooses to share; and whether you can limit this sharing. |
| Reasons we can share your personal information: | Does Northern Lights Fund Trust share information? | Can you limit this sharing? |
| For our everyday business purposes - such as to process your transactions, maintain your account(s), respond to court orders and legal investigations, or report to credit bureaus. | YES | NO |
| For our marketing purposes - to offer our products and services to you. | NO | We don’t share |
| For joint marketing with other financial companies. | NO | We don’t share |
| For our affiliates’ everyday business purposes - information about your transactions and records. | NO | We don’t share |
| For our affiliates’ everyday business purposes - information about your credit worthiness. | NO | We don’t share |
| For nonaffiliates to market to you | NO | We don’t share |
| QUESTIONS? | Call 1-402-493-4603 |
54
PRIVACY NOTICE
Northern Lights Fund Trust
| Page 2 |
| What we do: | |
How does Northern Lights Fund Trust protect my personal information? | To protect your personal information from unauthorized access and use, we use security measures that comply with federal law. These measures include computer safeguards and secured files and buildings.
Our service providers are held accountable for adhering to strict policies and procedures to prevent any misuse of your nonpublic personal information. |
How does Northern Lights Fund Trust collect my personal information? | We collect your personal information, for example, when you ● open an account or deposit money
● direct us to buy securities or direct us to sell your securities
● seek advice about your investments
We also collect your personal information from others, such as credit bureaus, affiliates, or other companies. |
Why can’t I limit all sharing? | Federal law gives you the right to limit only: ● sharing for affiliates’ everyday business purposes – information about your creditworthiness.
● affiliates from using your information to market to you.
● sharing for nonaffiliates to market to you.
State laws and individual companies may give you additional rights to limit sharing. |
| Definitions | |
| Affiliates | Companies related by common ownership or control. They can be financial and nonfinancial companies.
● Northern Lights Fund Trust does not share with our affiliates. |
| Nonaffiliates | Companies not related by common ownership or control. They can be financial and nonfinancial companies.
● Northern Lights Fund Trust does not share with nonaffiliates so they can market to you. |
| Joint marketing | A formal agreement between nonaffiliated financial companies that together market financial products or services to you.
● Northern Lights Fund Trust doesn’t jointly market. |
55
How to Obtain Proxy Voting Information
Information regarding how the Funds voted proxies relating to portfolio securities for the 12 month period ended June 30th as well as a description of the policies and procedures that the Funds used to determine how to vote proxies is available without charge, upon request, by calling 1-877-558-6397 or by referring to the Securities and Exchange Commission’s (“SEC”) website at http://www.sec.gov.
How to Obtain 1st and 3rd Fiscal Quarter Portfolio Holdings
The Funds file their complete schedule of portfolio holdings with the SEC for the first and third quarters of each fiscal year as an exhibit to its reports on Form N-PORT, within sixty days after the end of the period. Form N-PORT reports are available on the SEC’s website at http://www.sec.gov. The information on Form N-PORT is available without charge, upon request, by calling 1-877-558-6397.
| INVESTMENT ADVISER |
| Toews Corporation |
| 1750 Zion Road |
| Suite 201 |
| Northfield, NJ 08225 |
| ADMINISTRATOR |
| Ultimus Fund Solutions, LLC |
| 225 Pictoria Drive, Suite 450 |
| Cincinnati, OH 45246 |
| TOEWS-A23 |
Item 2. Code of Ethics.
(a) As of the end of the period covered by this report, the registrant has adopted a code of ethics that applies to the registrant's principal executive officer, principal financial officer, principal accounting officer or controller, or persons performing similar functions, regardless of whether these individuals are employed by the registrant or a third party.
(b) For purposes of this item, “code of ethics” means written standards that are reasonably designed to deter wrongdoing and to promote:
| (1) | Honest and ethical conduct, including the ethical handling of actual or apparent conflicts of interest between personal and professional relationships; |
| (2) | Full, fair, accurate, timely, and understandable disclosure in reports and documents that a registrant files with, or submits to, the Commission and in other public communications made by the registrant; |
(3) Compliance with applicable governmental laws, rules, and regulations;
| (4) | The prompt internal reporting of violations of the code to an appropriate person or persons identified in the code; and |
(5) Accountability for adherence to the code.
(c) Amendments: During the period covered by the report, there have not been any amendments to the provisions of the code of ethics.
(d) Waivers: During the period covered by the report, the registrant has not granted any express or implicit waivers from the provisions of the code of ethics.
(e) The Code of Ethics is not posted on Registrant’ website.
(f) A copy of the Code of Ethics is attached as an exhibit.
Item 3. Audit Committee Financial Expert.
(a) The Registrant’s board of trustees has determined that Anthony J. Hertl, Mark Gersten and Mark H. Taylor are audit committee financial experts, as defined in Item 3 of Form N-CSR. Mr. Hertl, Mr. Gersten and Mr. Taylor are independent for purposes of this Item 3.
Item 4. Principal Accountant Fees and Services.
| (a) | Audit Fees |
2023 - $92,000
2022 - $89,000
| (b) | Audit-Related Fees |
2023 – None
2022 – None
| (c) | Tax Fees |
2023 – $22,500
2022 – $20,700
Preparation of Federal & State income tax returns, assistance with calculation of required income, capital gain and excise distributions and preparation of Federal excise tax returns.
| (d) | All Other Fees |
2023 - None
2022 - None
| (e) | (1) Audit Committee’s Pre-Approval Policies |
The registrant’s Audit Committee is required to pre-approve all audit services and, when appropriate, any non-audit services (including audit-related, tax and all other services) to the registrant. The registrant’s Audit Committee also is required to pre-approve, when appropriate, any non-audit services (including audit-related, tax and all other services) to its adviser, or any entity controlling, controlled by or under common control with the adviser that provides ongoing services to the registrant, to the extent that the services may be determined to have an impact on the operations or financial reporting of the registrant. Services are reviewed on an engagement by engagement basis by the Audit Committee.
| (2) | Percentages of Services Approved by the Audit Committee |
2023 2022
Audit-Related Fees: 0.00% 0.00%
Tax Fees: 0.00% 0.00%
All Other Fees: 0.00% 0.00%
| (f) | During the audit of registrant's financial statements for the most recent fiscal year, less than 50 percent of the hours expended on the principal accountant's engagement were attributed to work performed by persons other than the principal accountant's full-time, permanent employees. |
| (g) | The aggregate non-audit fees billed by the registrant's accountant for services rendered to the registrant, and rendered to the registrant's investment adviser (not including any sub-adviser whose role is primarily portfolio management and is subcontracted with or overseen by another investment adviser), and any entity controlling, controlled by, or under common control with the adviser that provides ongoing services to the registrant: |
2023 - $22,500
2022 - $20,700
(h) The registrant's audit committee has considered whether the provision of non-audit services to the registrant's investment adviser (not including any sub-adviser whose role is primarily portfolio management and is subcontracted with or overseen by another investment adviser), and any entity controlling, controlled by, or under common control with the investment adviser that provides ongoing services to the registrant, that were not pre-approved pursuant to paragraph (c)(7)(ii) of Rule 2-01 of Regulation S-X, is compatible with maintaining the principal accountant's independence.
(i) Not applicable.
(j) Not applicable.
Item 5. Audit Committee of Listed Companies. Not applicable to open-end investment companies.
Item 6. Schedule of Investments. Schedule of investments in securities of unaffiliated issuers is included under Item 1.
Item 7. Disclosure of Proxy Voting Policies and Procedures for Closed-End Funds. Not applicable to open-end investment companies.
Item 8. Portfolio Managers of Closed-End Management Investment Companies. Not applicable to open-end investment companies.
Item 9. Purchases of Equity Securities by Closed-End Funds. Not applicable to open-end investment companies.
Item 10. Submission of Matters to a Vote of Security Holders. None
Item 11. Controls and Procedures.
(a) Based on an evaluation of the Registrant’s disclosure controls and procedures as of a date within 90 days of filing date of this Form N-CSR, the principal executive officer and principal financial officer of the Registrant have concluded that the disclosure controls and procedures of the Registrant are reasonably designed to ensure that the information required in filings on Form N-CSR is recorded, processed, summarized, and reported by the filing date, including that information required to be disclosed is accumulated and communicated to the Registrant’s management, including the Registrant’s principal executive officer and principal financial officer, as appropriate to allow timely decisions regarding required disclosure.
(b) There were no significant changes in the Registrant’s internal control over financial reporting that occurred during the period covered by this report that have materially affected, or are reasonably likely to materially affect, the Registrant’s internal control over financial reporting.
Item 12. Disclosure of Securities Lending Activities for Closed-End Management Investment Companies. Not applicable.
Item 13. Exhibits.
(a)(1) Code of Ethics filed herewith.
(a)(3) Not applicable for open-end investment companies.
SIGNATURES
Pursuant to the requirements of the Securities Exchange Act of 1934 and the Investment Company Act of 1940, the registrant has duly caused this report to be signed on its behalf by the undersigned, thereunto duly authorized.
(Registrant) Northern Lights Fund Trust
By (Signature and Title)
/s/ Kevin Wolf
Kevin Wolf, Principal Executive Officer/President
Date 7/6/23
Pursuant to the requirements of the Securities Exchange Act of 1934 and the Investment Company Act of 1940, this report has been signed below by the following persons on behalf of the registrant and in the capacities and on the dates indicated.
By (Signature and Title)
/s/ Kevin Wolf
Kevin Wolf, Principal Executive Officer/President
Date 7/6/23
By (Signature and Title)
/s/ Jim Colantino
Jim Colantino, Principal Financial Officer/Treasurer
Date 7/6/23