united states
securities and exchange commission
washington, d.c. 20549
form n-csr
certified shareholder report of registered management
investment companies
| Investment Company Act file number | 811-21720 |
| Northern Lights Fund Trust |
| (Exact name of registrant as specified in charter) |
| 225 Pictoria Drive, Suite 450, Cincinnati, OH | 45246 |
| (Address of principal executive offices) | (Zip code) |
| The Corporation Trust Co, Corporate Trust Center, 251 Little Falls Dr. Wilmington, DE 19808 |
| (Name and address of agent for service) |
| Registrant’s telephone number, including area code: | 631-490-4300 |
| Date of fiscal year end: | 12/31 |
| Date of reporting period: | 6/30/2024 |
Item 1. Reports to Stockholders.
(a)
Altegris/AACA Opportunistic Real Estate Fund
Semi-Annual Shareholder Report - June 30, 2024
This semi-annual shareholder report contains important information about Altegris/AACA Opportunistic Real Estate Fund for the period of January 1, 2024 to June 30, 2024. You can find additional information about the Fund at https://funds.altegris.com/altegris-aaca-opportunistic-real-estate-fund-documents. You can also request this information by contacting us at 1-877-772-5838.
What were the Fund’s costs for the last six months?
(based on a hypothetical $10,000 investment)
| Class Name | Costs of a $10,000 investment | Costs paid as a percentage of a $10,000 investment |
|---|
| Class A | $149 | 2.98% |
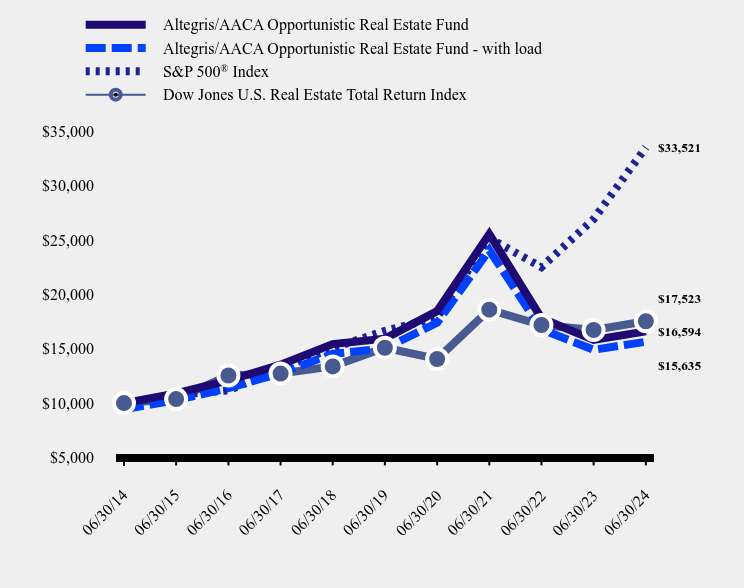
How has the Fund performed over the last ten years?
Total Return Based on $10,000 Investment
| Altegris/AACA Opportunistic Real Estate Fund | Altegris/AACA Opportunistic Real Estate Fund - with load | S&P 500® Index | Dow Jones U.S. Real Estate Total Return Index |
|---|
| 06/30/14 | $10,000 | $9,422 | $10,000 | $10,000 |
| 06/30/15 | $10,893 | $10,263 | $10,742 | $10,362 |
| 06/30/16 | $12,078 | $11,380 | $11,171 | $12,535 |
| 06/30/17 | $13,531 | $12,749 | $13,170 | $12,714 |
| 06/30/18 | $15,425 | $14,533 | $15,064 | $13,374 |
| 06/30/19 | $15,929 | $15,008 | $16,633 | $15,087 |
| 06/30/20 | $18,458 | $17,391 | $17,881 | $14,054 |
| 06/30/21 | $25,540 | $24,063 | $25,175 | $18,588 |
| 06/30/22 | $17,804 | $16,774 | $22,503 | $17,178 |
| 06/30/23 | $15,815 | $14,901 | $26,912 | $16,723 |
| 06/30/24 | $16,594 | $15,635 | $33,521 | $17,523 |
Average Annual Total Returns
| 6 months | 1 Year | 5 Years | 10 Years |
|---|
| Altegris/AACA Opportunistic Real Estate Fund | | | | |
| Without Load | | 4.92% | 0.82% | 5.20% |
| With Load | | | | 4.57% |
S&P 500® Index | 15.29% | 24.56% | 15.05% | 12.86% |
| Dow Jones U.S. Real Estate Total Return Index | | 4.79% | 3.04% | 5.77% |
The Fund's past performance is not a good predictor of how the Fund will perform in the future. The graph and table do not reflect the deduction of taxes that a shareholder would pay on fund distributions or redemption of fund shares.
- Net Assets$135,571,479
- Number of Portfolio Holdings51
- Advisory Fee (net of waivers)$941,769
- Portfolio Turnover28%
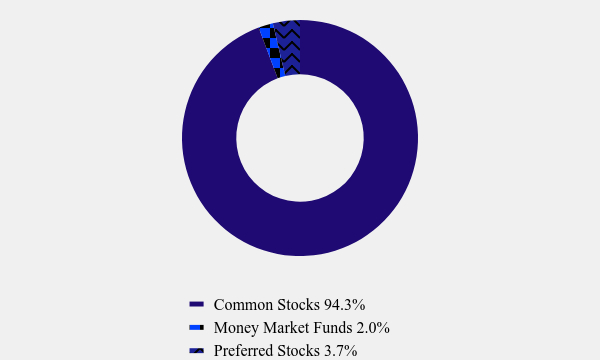
Asset Weighting (% of total investments)
| Value | Value |
|---|
| Common Stocks | 94.3% |
| Money Market Funds | 2.0% |
| Preferred Stocks | 3.7% |
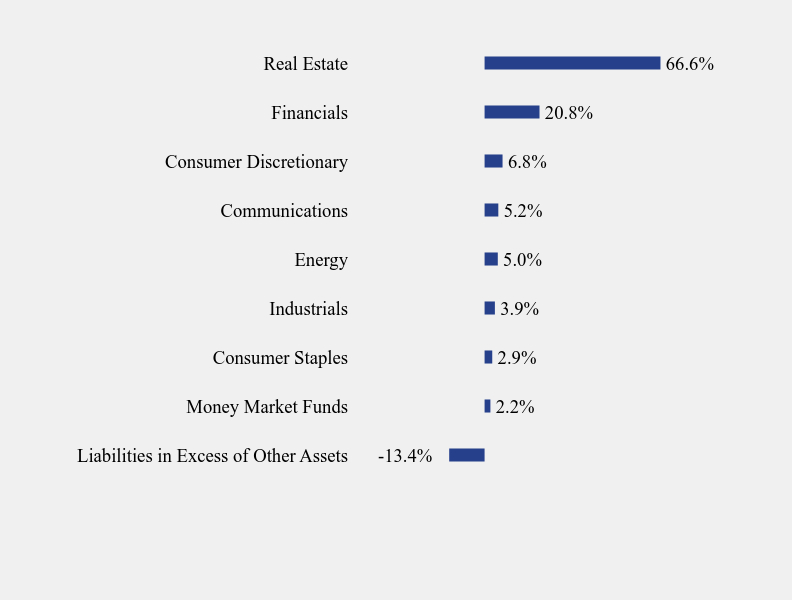
What did the Fund invest in?
Sector Weighting (% of net assets)
| Value | Value |
|---|
| Liabilities in Excess of Other Assets | -13.4% |
| Money Market Funds | 2.2% |
| Consumer Staples | 2.9% |
| Industrials | 3.9% |
| Energy | 5.0% |
| Communications | 5.2% |
| Consumer Discretionary | 6.8% |
| Financials | 20.8% |
| Real Estate | 66.6% |
Top 10 Holdings (% of net assets)
| Holding Name | % of Net Assets |
| FTAI Infrastructure, Inc. | 14.6% |
| American Tower Corporation | 7.4% |
| Equinix, Inc. | 6.9% |
| Simon Property Group, Inc. | 6.1% |
| Innovative Industrial Properties, Inc. | 5.9% |
| IQHQ Private Investment, Inc. | 5.7% |
| New Fortress Energy, Inc. | 5.0% |
| NewLake Capital Partners, Inc. | 5.0% |
| Digital Realty Trust, Inc. | 4.6% |
| DigitalBridge Group, Inc. | 3.8% |
No material changes occurred during the period ended June 30, 2024.
Altegris/AACA Opportunistic Real Estate Fund - Class A (RAAAX)
Semi-Annual Shareholder Report - June 30, 2024
Where can I find additional information about the Fund?
Additional information is available on the Fund's website ( https://funds.altegris.com/altegris-aaca-opportunistic-real-estate-fund-documents ), including its:
Prospectus
Financial information
Holdings
Proxy voting information
Altegris/AACA Opportunistic Real Estate Fund
Semi-Annual Shareholder Report - June 30, 2024
This semi-annual shareholder report contains important information about Altegris/AACA Opportunistic Real Estate Fund for the period of January 1, 2024 to June 30, 2024. You can find additional information about the Fund at https://funds.altegris.com/altegris-aaca-opportunistic-real-estate-fund-documents. You can also request this information by contacting us at 1-877-772-5838.
What were the Fund’s costs for the last six months?
(based on a hypothetical $10,000 investment)
| Class Name | Costs of a $10,000 investment | Costs paid as a percentage of a $10,000 investment |
|---|
| Class C | $187 | 3.73% |
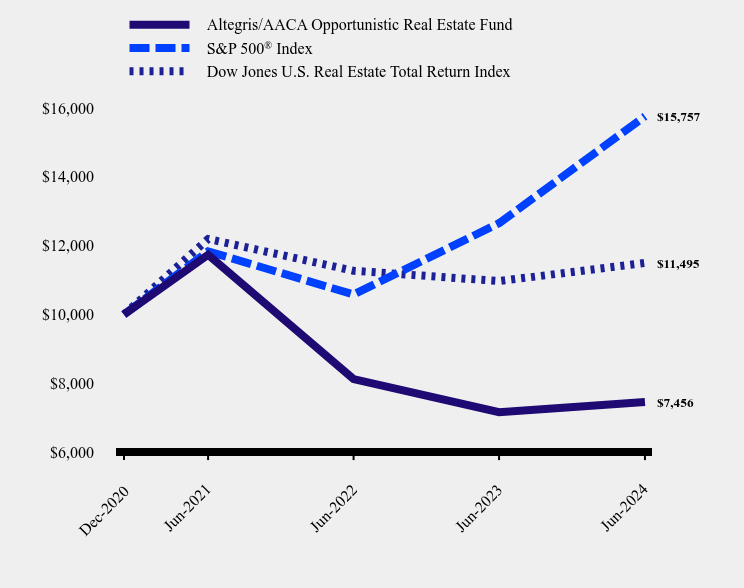
How has the Fund performed since inception?
Total Return Based on $10,000 Investment
| Altegris/AACA Opportunistic Real Estate Fund | S&P 500® Index | Dow Jones U.S. Real Estate Total Return Index |
|---|
| Dec-2020 | $10,000 | $10,000 | $10,000 |
| Jun-2021 | $11,735 | $11,835 | $12,193 |
| Jun-2022 | $8,122 | $10,578 | $11,269 |
| Jun-2023 | $7,158 | $12,651 | $10,970 |
| Jun-2024 | $7,456 | $15,757 | $11,495 |
Average Annual Total Returns
| 6 Months | 1 Year | Since Inception (December 1, 2020) |
|---|
| Altegris/AACA Opportunistic Real Estate Fund | | 4.17% | |
S&P 500® Index | 15.29% | 24.56% | 13.55% |
| Dow Jones U.S. Real Estate Total Return Index | | 4.79% | 3.97% |
The Fund's past performance is not a good predictor of how the Fund will perform in the future. The graph and table do not reflect the deduction of taxes that a shareholder would pay on fund distributions or redemption of fund shares.
- Net Assets$135,571,479
- Number of Portfolio Holdings51
- Advisory Fee (net of waivers)$941,769
- Portfolio Turnover28%
Asset Weighting (% of total investments)
| Value | Value |
|---|
| Common Stocks | 94.3% |
| Money Market Funds | 2.0% |
| Preferred Stocks | 3.7% |
What did the Fund invest in?
Sector Weighting (% of net assets)
| Value | Value |
|---|
| Liabilities in Excess of Other Assets | -13.4% |
| Money Market Funds | 2.2% |
| Consumer Staples | 2.9% |
| Industrials | 3.9% |
| Energy | 5.0% |
| Communications | 5.2% |
| Consumer Discretionary | 6.8% |
| Financials | 20.8% |
| Real Estate | 66.6% |
Top 10 Holdings (% of net assets)
| Holding Name | % of Net Assets |
| FTAI Infrastructure, Inc. | 14.6% |
| American Tower Corporation | 7.4% |
| Equinix, Inc. | 6.9% |
| Simon Property Group, Inc. | 6.1% |
| Innovative Industrial Properties, Inc. | 5.9% |
| IQHQ Private Investment, Inc. | 5.7% |
| New Fortress Energy, Inc. | 5.0% |
| NewLake Capital Partners, Inc. | 5.0% |
| Digital Realty Trust, Inc. | 4.6% |
| DigitalBridge Group, Inc. | 3.8% |
No material changes occurred during the period ended June 30, 2024.
Altegris/AACA Opportunistic Real Estate Fund - Class C (RAACX)
Semi-Annual Shareholder Report - June 30, 2024
Where can I find additional information about the Fund?
Additional information is available on the Fund's website ( https://funds.altegris.com/altegris-aaca-opportunistic-real-estate-fund-documents ), including its:
Prospectus
Financial information
Holdings
Proxy voting information
Altegris/AACA Opportunistic Real Estate Fund
Semi-Annual Shareholder Report - June 30, 2024
This semi-annual shareholder report contains important information about Altegris/AACA Opportunistic Real Estate Fund for the period of January 1, 2024 to June 30, 2024. You can find additional information about the Fund at https://funds.altegris.com/altegris-aaca-opportunistic-real-estate-fund-documents. You can also request this information by contacting us at 1-877-772-5838.
What were the Fund’s costs for the last six months?
(based on a hypothetical $10,000 investment)
| Class Name | Costs of a $10,000 investment | Costs paid as a percentage of a $10,000 investment |
|---|
| Class I | $137 | 2.73% |
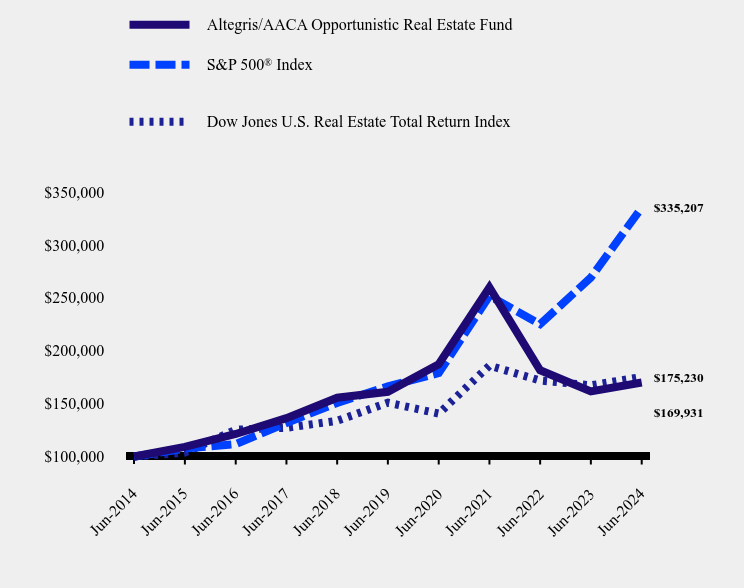
How has the Fund performed over the last ten years?
Total Return Based on $100,000 Investment
| Altegris/AACA Opportunistic Real Estate Fund | S&P 500® Index | Dow Jones U.S. Real Estate Total Return Index |
|---|
| Jun-2014 | $100,000 | $100,000 | $100,000 |
| Jun-2015 | $109,160 | $107,423 | $103,621 |
| Jun-2016 | $121,277 | $111,712 | $125,353 |
| Jun-2017 | $136,222 | $131,704 | $127,138 |
| Jun-2018 | $155,569 | $150,635 | $133,741 |
| Jun-2019 | $161,123 | $166,327 | $150,873 |
| Jun-2020 | $187,188 | $178,810 | $140,541 |
| Jun-2021 | $259,787 | $251,754 | $185,875 |
| Jun-2022 | $181,472 | $225,029 | $171,784 |
| Jun-2023 | $161,548 | $269,121 | $167,225 |
| Jun-2024 | $169,931 | $335,207 | $175,230 |
Average Annual Total Returns
| 6 Months | 1 Year | 5 Years | 10 Years |
|---|
| Altegris/AACA Opportunistic Real Estate Fund | | 5.19% | 1.07% | 5.45% |
S&P 500® Index | 15.29% | 24.56% | 15.05% | 12.86% |
| Dow Jones U.S. Real Estate Total Return Index | | 4.79% | 3.04% | 5.77% |
The Fund's past performance is not a good predictor of how the Fund will perform in the future. The graph and table do not reflect the deduction of taxes that a shareholder would pay on fund distributions or redemption of fund shares.
- Net Assets$135,571,479
- Number of Portfolio Holdings51
- Advisory Fee (net of waivers)$941,769
- Portfolio Turnover28%
Asset Weighting (% of total investments)
| Value | Value |
|---|
| Common Stocks | 94.3% |
| Money Market Funds | 2.0% |
| Preferred Stocks | 3.7% |
What did the Fund invest in?
Sector Weighting (% of net assets)
| Value | Value |
|---|
| Liabilities in Excess of Other Assets | -13.4% |
| Money Market Funds | 2.2% |
| Consumer Staples | 2.9% |
| Industrials | 3.9% |
| Energy | 5.0% |
| Communications | 5.2% |
| Consumer Discretionary | 6.8% |
| Financials | 20.8% |
| Real Estate | 66.6% |
Top 10 Holdings (% of net assets)
| Holding Name | % of Net Assets |
| FTAI Infrastructure, Inc. | 14.6% |
| American Tower Corporation | 7.4% |
| Equinix, Inc. | 6.9% |
| Simon Property Group, Inc. | 6.1% |
| Innovative Industrial Properties, Inc. | 5.9% |
| IQHQ Private Investment, Inc. | 5.7% |
| New Fortress Energy, Inc. | 5.0% |
| NewLake Capital Partners, Inc. | 5.0% |
| Digital Realty Trust, Inc. | 4.6% |
| DigitalBridge Group, Inc. | 3.8% |
No material changes occurred during the period ended June 30, 2024.
Altegris/AACA Opportunistic Real Estate Fund - Class I (RAAIX)
Semi-Annual Shareholder Report - June 30, 2024
Where can I find additional information about the Fund?
Additional information is available on the Fund's website ( https://funds.altegris.com/altegris-aaca-opportunistic-real-estate-fund-documents ), including its:
Prospectus
Financial information
Holdings
Proxy voting information
(b) Not applicable
Item 2. Code of Ethics. Not applicable for semi-annual reports
Item 3. Audit Committee Financial Expert. Not applicable for semi-annual reports
Item 4. Principal Accountant Fees and Services. Not applicable for semi-annual reports
Item 5. Audit Committee of Listed Registrants. Not applicable to open-end investment companies.
Item 6. Investments.
The Registrant’s schedule of investments in unaffiliated issuers is included in the Financial Statements under Item 7 of this form.
Item 7. Financial Statements and Financial Highlights for Open-End Management Investment Companies.
(a)
 |
| | |
| | |
| | |
| | |
| | |
| | June 30, 2024 |
| | |
| | |
| | |
| | The Altegris Mutual Funds |
| | |
| | |
| | A SERIES OF NORTHERN LIGHTS FUND TRUST |
| | |
| | |
| | |
| | |
| | Semi-Annual Financial Statements |
| | |
| | Altegris/AACA Opportunistic Real Estate Fund |
| | |
| | |
| | |
| | |
| | |
| | Advised by: |
| | Altegris Advisors, LLC |
| | 1200 Prospect, Suite 400 |
| | La Jolla, CA 92037 |
| | |
| | |
| | |
| | |
| | |
| | |
| | |
| | |
| | |
| | |
| | |
| | |
| | |
| | |
| | |
800.828.5225 | WWW.ALTEGRIS.COM
| ALTEGRIS/AACA OPPORTUNISTIC REAL ESTATE FUND |
| SCHEDULE OF INVESTMENTS (Unaudited) |
| June 30, 2024 |
| Shares | | | | | Fair Value | |
| | | | | COMMON STOCKS — 107.0% | | | | |
| | | | | ASSET MANAGEMENT - 16.8% | | | | |
| | 24,030 | | | Blackstone, Inc.(a) | | $ | 2,974,914 | |
| | 2,290,781 | | | FTAI Infrastructure, Inc. (a) | | | 19,769,440 | |
| | | | | | | | 22,744,354 | |
| | | | | DATA CENTER REIT - 11.5% | | | | |
| | 41,048 | | | Digital Realty Trust, Inc. | | | 6,241,348 | |
| | 12,292 | | | Equinix, Inc. (a) | | | 9,300,127 | |
| | | | | | | | 15,541,475 | |
| | | | | ELECTRICAL EQUIPMENT - 2.5% | | | | |
| | 19,481 | | | GE Vernova, LLC(b) | | | 3,341,187 | |
| | | | | | | | | |
| | | | | FOOD - 2.9% | | | | |
| | 1,282,789 | | | Cadiz, Inc. (a) ,(b) | | | 3,963,818 | |
| | | | | | | | | |
| | | | | HEALTH CARE REIT - 7.7% | | | | |
| | 890,864 | | | IQHQ Private Investment, Inc.(b),(c),(d) | | | 7,778,312 | |
| | 50,999 | | | Ventas, Inc. | | | 2,614,209 | |
| | | | | | | | 10,392,521 | |
| | | | | INDUSTRIAL REIT - 11.0% | | | | |
| | 110,042 | | | Americold Realty Trust, Inc. (a) | | | 2,810,473 | |
| | 73,578 | | | Innovative Industrial Properties, Inc. (a) | | | 8,036,189 | |
| | 90,583 | | | Rexford Industrial Realty, Inc. | | | 4,039,096 | |
| | | | | | | | 14,885,758 | |
| | | | | INFRASTRUCTURE REIT - 7.4% | | | | |
| | 51,332 | | | American Tower Corporation, A(a) | | | 9,977,915 | |
| | | | | | | | | |
| | | | | LEISURE FACILITIES & SERVICES - 6.8% | | | | |
| | 80,708 | | | Caesars Entertainment, Inc.(b) | | | 3,207,336 | |
| | 72,747 | | | MGM Resorts International(b) | | | 3,232,876 | |
| | 30,803 | | | Wynn Resorts Ltd. | | | 2,756,869 | |
| | | | | | | | 9,197,081 | |
| | | | | OFFICE REIT - 2.1% | | | | |
| | 24,518 | | | Alexandria Real Estate Equities, Inc. | | | 2,867,870 | |
| | | | | | | | | |
See accompanying notes to financial statements.
| ALTEGRIS/AACA OPPORTUNISTIC REAL ESTATE FUND |
| SCHEDULE OF INVESTMENTS (Unaudited) (Continued) |
| June 30, 2024 |
| Shares | | | | | Fair Value | |
| | | | | COMMON STOCKS — 107.0% (Continued) | | | | |
| | | | | OIL & GAS PRODUCERS — 5.0% | | | | |
| | 307,460 | | | New Fortress Energy, Inc. (a) | | $ | 6,757,971 | |
| | | | | | | | | |
| | | | | RESIDENTIAL REIT - 5.5% | | | | |
| | 45,819 | | | American Homes 4 Rent, Class A(a) | | | 1,702,634 | |
| | 23,210 | | | Equity LifeStyle Properties, Inc. (a) | | | 1,511,667 | |
| | 66,060 | | | Invitation Homes, Inc. (a) | | | 2,370,893 | |
| | 15,694 | | | Sun Communities, Inc. (a) | | | 1,888,616 | |
| | | | | | | | 7,473,810 | |
| | | | | RETAIL REIT - 9.8% | | | | |
| | 330,237 | | | Macerich Company (The) (a) | | | 5,098,859 | |
| | 54,165 | | | Simon Property Group, Inc. (a) | | | 8,222,247 | |
| | | | | | | | 13,321,106 | |
| | | | | SELF-STORAGE REIT - 3.3% | | | | |
| | 28,640 | | | CubeSmart | | | 1,293,669 | |
| | 20,668 | | | Extra Space Storage, Inc. (a) | | | 3,212,014 | |
| | | | | | | | 4,505,683 | |
| | | | | SPECIALTY FINANCE - 2.5% | | | | |
| | 33,543 | | | FTAI Aviation Ltd. | | | 3,462,644 | |
| | | | | | | | | |
| | | | | SPECIALTY REIT — 7.0% | | | | |
| | 31,213 | | | Iron Mountain, Inc. | | | 2,797,309 | |
| | 337,105 | | | NewLake Capital Partners, Inc. | | | 6,742,100 | |
| | | | | | | | 9,539,409 | |
| | | | | TELECOMMUNICATIONS - 3.8% | | | | |
| | 374,222 | | | DigitalBridge Group, Inc. (a) | | | 5,126,841 | |
| | | | | | | | | |
| | | | | TRANSPORTATION & LOGISTICS - 1.4% | | | | |
| | 15,903 | | | Kirby Corporation(b) | | | 1,904,066 | |
| | | | | | | | | |
| | | | | TOTAL COMMON STOCKS (Cost $140,253,380) | | | 145,003,509 | |
| | | | | | | | | |
See accompanying notes to financial statements.
| ALTEGRIS/AACA OPPORTUNISTIC REAL ESTATE FUND |
| SCHEDULE OF INVESTMENTS (Unaudited) (Continued) |
| June 30, 2024 |
| | | | | | Coupon Rate | | | | | |
| Shares | | | | | (%) | | Maturity | | Fair Value | |
| | | | | PREFERRED STOCKS — 4.2% | | | | | | | | |
| | | | | FOOD — 0.0%(e) | | | | | | | | |
| | 2,000 | | | Cadiz, Inc. | | 8.8750 | | Perpetual | | $ | 32,000 | |
| | | | | | | | | | | | | |
| | | | | REAL ESTATE INVESTMENT TRUSTS — 1.2% | | | | | | | | |
| | 24,022 | | | Digital Realty Trust, Inc. - Series L | | 5.2000 | | Perpetual | | | 516,472 | |
| | 7,159 | | | EPR Properties - Series C | | 5.7500 | | Perpetual | | | 138,240 | |
| | 7,078 | | | EPR Properties - Series G | | 5.7500 | | Perpetual | | | 138,446 | |
| | 12,285 | | | Global Net Lease, Inc. - Series A | | 7.2500 | | Perpetual | | | 255,528 | |
| | 1,041 | | | Innovative Industrial Properties, Inc. - Series A | | 9.0000 | | Perpetual | | | 28,836 | |
| | 1,083 | | | Mid-America Apartment Communities, Inc. - Series I | | 8.5000 | | Perpetual | | | 58,671 | |
| | 15,983 | | | Pebblebrook Hotel Trust - Series G | | 6.3750 | | Perpetual | | | 313,107 | |
| | 7,307 | | | Pebblebrook Hotel Trust - Series E | | 6.3750 | | Perpetual | | | 148,040 | |
| | 592 | | | Simon Property Group, Inc. - Series J | | 8.3750 | | Perpetual | | | 36,651 | |
| | | | | | | | | | | | 1,633,991 | |
| | | | | SPECIALTY FINANCE — 1.5% | | | | | | | | |
| | 27,280 | | | Annaly Capital Management, Inc. - Series G(a) | | 9.7638 | | Perpetual | | | 695,913 | |
| | 20,000 | | | FTAI Aviation Ltd. | | 8.0000 | | Perpetual | | | 500,200 | |
| | 3,000 | | | FTAI Aviation Ltd. - Series D | | 9.5000 | | Perpetual | | | 78,360 | |
| | 10,000 | | | FTAI Aviation Ltd. Investors, LLC Series A | | 8.2500 | | Perpetual | | | 250,300 | |
| | 6,084 | | | FTAI Aviation Ltd. Investors, LLC Series C | | 8.2500 | | Perpetual | | | 153,925 | |
| | 17,941 | | | MFA Financial, Inc. - Series B | | 7.5000 | | Perpetual | | | 381,964 | |
| | | | | | | | | | | | 2,060,662 | |
| | | | | TELECOMMUNICATIONS — 1.5% | | | | | | | | |
| | 26,505 | | | DigitalBridge Group, Inc. - Series J | | 7.1250 | | Perpetual | | | 635,590 | |
| | 30,000 | | | DigitalBridge Group, Inc. - Series I(a) | | 7.1500 | | Perpetual | | | 738,000 | |
| | 23,735 | | | DigitalBridge Group, Inc. - Series H | | 7.1250 | | Perpetual | | | 563,706 | |
| | | | | | | | | | | | 1,937,296 | |
| | | | | | | | | | | | | |
| | | | | TOTAL PREFERRED STOCKS (Cost $5,030,604) | | | | | | | 5,663,949 | |
| | | | | | | | | | | | | |
See accompanying notes to financial statements.
| ALTEGRIS/AACA OPPORTUNISTIC REAL ESTATE FUND |
| SCHEDULE OF INVESTMENTS (Unaudited) (Continued) |
| June 30, 2024 |
| Shares | | | | | Fair Value | |
| | | | | SHORT-TERM INVESTMENTS — 2.2% | | | | |
| | | | | MONEY MARKET FUNDS - 2.2% | | | | |
| | 3,043,485 | | | First American Government Obligations Fund, Class X, 5.23% (Cost $3,043,485)(f) | | $ | 3,043,485 | |
| | | | | | | | | |
| | | | | TOTAL INVESTMENTS - 113.4% (Cost $148,327,469) | | $ | 153,710,943 | |
| | | | | LIABILITIES IN EXCESS OF OTHER ASSETS - (13.4)% | | | (18,139,464 | ) |
| | | | | NET ASSETS - 100.0% | | $ | 135,571,479 | |
| | | | | | | | | |
| LLC | - Limited Liability Company |
| | |
| LTD | - Limited Company |
| | |
| REIT | - Real Estate Investment Trust |
| (a) | All or a portion of this security is held as collateral for the margin loan. |
| (b) | Non-income producing security. |
| (c) | Security exempt from registration under Rule 144A or Section 4(2) of the Securities Act of 1933. The security may be resold in transactions exempt from registration, normally to qualified institutional buyers. As of June 30, 2024 the total market value of 144A securities is $7,778,312 or 5.7% of net assets. |
| (d) | Level 3 securities, fair value under procedures established by the Board of Trustees. The total fair value of these securities as of June 30, 2024 was $7,778,312, representing 5.7% of net assets and is illiquid. |
| (e) | Percentage rounds to less than 0.1%. |
| (f) | Rate disclosed is the seven day effective yield as of June 30, 2024. |
| ALTEGRIS/AACA OPPORTUNISTIC REAL ESTATE FUND |
| SCHEDULE OF SECURITIES SOLD SHORT (Unaudited) |
| June 30, 2024 |
| Shares | | | | | Fair Value | |
| | | | | COMMON STOCKS — (1.3)% | | | | |
| | | | | OFFICE REIT - (1.3)% | | | | |
| | (377,668 | ) | | Paramount Group, Inc. | | $ | (1,748,603 | ) |
| | | | | | | | | |
| | | | | TOTAL SECURITIES SOLD SHORT - (Proceeds - $1,584,986) | | $ | (1,748,603 | ) |
| | | | | | | | | |
See accompanying notes to financial statements.
| Altegris/AACA Opportunistic Real Estate Fund |
| Statement of Assets and Liabilities (Unaudited) |
| June 30, 2024 |
| ASSETS | | | | |
| Investment in securities, at cost | | $ | 148,327,469 | |
| Investment in securities, at value | | $ | 153,710,943 | |
| Cash and cash equivalents | | | 244,396 | |
| Receivable for Fund shares sold | | | 12,041 | |
| Dividends and interest receivable | | | 873,415 | |
| Prepaid expenses and other assets | | | 35,474 | |
| TOTAL ASSETS | | | 154,876,269 | |
| | | | | |
| LIABILITIES | | | | |
| Securities sold short, at value (proceeds $1,584,986) | | | 1,748,603 | |
| Borrowing from Bank | | | 17,320,796 | |
| Payable for Fund shares redeemed | | | 90,961 | |
| Investment advisory fees payable | | | 69,349 | |
| Dividends payable on securities sold short | | | 13,218 | |
| Payable to Related Parties | | | 18,821 | |
| Distribution fees (12b-1) payable | | | 2,112 | |
| Accrued expenses and other liabilities | | | 40,930 | |
| TOTAL LIABILITIES | | | 19,304,790 | |
| NET ASSETS | | $ | 135,571,479 | |
| | | | | |
| Net Assets Consist Of: | | | | |
| Paid-in capital | | $ | 242,204,199 | |
| Accumulated Loss | | | (106,632,720 | ) |
| NET ASSETS | | $ | 135,571,479 | |
| | | | | |
| NET ASSET VALUE PER SHARE: | | | | |
| Class A Shares: | | | | |
| Net Assets | | $ | 8,412,722 | |
| Shares of beneficial interest outstanding [$0 par value, unlimited shares authorized] | | | 680,132 | |
| Net asset value (Net Assets ÷ Shares Outstanding) and redemption price per share (a) | | $ | 12.37 | |
| Maximum offering price per share (net asset value plus maximum sales charge of 5.75%) (b) | | $ | 13.12 | |
| | | | | |
| Class C Shares: | | | | |
| Net Assets | | $ | 157,380 | |
| Shares of beneficial interest outstanding [$0 par value, unlimited shares authorized] | | | 13,082 | |
| Net asset value (Net Assets ÷ Shares Outstanding), offering price and redemption price per share (c) | | $ | 12.03 | |
| | | | | |
| Class I Shares: | | | | |
| Net Assets | | $ | 127,001,377 | |
| Shares of beneficial interest outstanding [$0 par value, unlimited shares authorized] | | | 10,103,596 | |
| Net asset value (Net Assets ÷ Shares Outstanding), offering price and redemption price per share | | $ | 12.57 | |
| (a) | Investments in Class A shares made at or above the $1 million breakpoint are not subject to an initial sales charge and may be subject to a 1.00% contingent deferred sales charge (“CDSC”) on shares redeemed less than 18 months after the date of purchase (excluding shares purchases with reinvested dividends and/or distributions). |
| (b) | On investments of $25,000 or more, the sales load is reduced. |
| (c) | Shares redeemed within 12 months after purchase will be charged a contingent deferred sales charge (“CDSC”) of up to 1.00%. |
See accompanying notes to financial statements.
| Altegris/AACA Opportunistic Real Estate Fund |
| Statement of Operations (Unaudited) |
| For the Six Months Ended June 30, 2024 |
| INVESTMENT INCOME | | | | |
| Dividends (Tax Withholding $4,773) | | $ | 2,591,900 | |
| Interest | | | 83,860 | |
| TOTAL INVESTMENT INCOME | | | 2,675,760 | |
| | | | | |
| EXPENSES | | | | |
| Investment advisory fees | | | 1,045,936 | |
| Interest expense | | | 921,454 | |
| Short sale dividend expense | | | 26,437 | |
| Distribution (12b-1) fees: | | | | |
| Class A | | | 12,314 | |
| Class C | | | 916 | |
| Administrative services fees | | | 76,707 | |
| Third party administrative services fees | | | 60,929 | |
| Registration fees | | | 32,820 | |
| Transfer agent fees | | | 26,516 | |
| Custodian fees | | | 21,429 | |
| Compliance officer fees | | | 18,489 | |
| Audit fees | | | 16,174 | |
| Legal fees | | | 13,801 | |
| Accounting services fees | | | 12,571 | |
| Printing | | | 11,283 | |
| Trustees fees and expenses | | | 8,377 | |
| Insurance expense | | | 2,659 | |
| Other expenses | | | 1,902 | |
| TOTAL EXPENSES | | | 2,310,714 | |
| | | | | |
| Less: Fees waived by the Advisor | | | (104,167 | ) |
| NET EXPENSES | | | 2,206,547 | |
| | | | | |
| NET INVESTMENT INCOME | | | 469,213 | |
| | | | | |
| REALIZED AND UNREALIZED GAIN/(LOSS) ON INVESTMENTS AND SECURITIES SOLD SHORT | | | | |
| Net realized gain from: | | | | |
| Investments | | | 11,696,691 | |
| Securities sold short | | | 105,554 | |
| | | | 11,802,245 | |
| Net change in unrealized appreciation/(depreciation) from: | | | | |
| Investments | | | (15,841,310 | ) |
| Securities sold short | | | 246,685 | |
| | | | (15,594,625 | ) |
| REALIZED AND UNREALIZED GAIN/(LOSS) ON INVESTMENTS AND SECURITIES SOLD SHORT | | | (3,792,380 | ) |
| NET DECREASE IN NET ASSETS RESULTING FROM OPERATIONS | | $ | (3,323,167 | ) |
See accompanying notes to financial statements.
| Altegris/AACA Opportunistic Real Estate Fund |
| STATEMENTS OF CHANGES IN NET ASSETS |
| | | For the Six Months Ended | | | For the Year Ended | |
| | | June 30, 2024 | | | December 31, 2023 | |
| | | (Unaudited) | | | | |
| FROM OPERATIONS | | | | | | | | |
| Net investment gain/(loss) | | $ | 469,213 | | | $ | (100,336 | ) |
| Net realized gain/(loss) from investments and securities sold short | | | 11,802,245 | | | | (64,920,576 | ) |
| Net change in unrealized appreciation/(depreciation) on investments and securities sold short | | | (15,594,625 | ) | | | 82,478,952 | |
| Net increase/(decrease) in net assets resulting from operations | | | (3,323,167 | ) | | | 17,458,040 | |
| | | | | | | | | |
| FROM CAPITAL SHARE TRANSACTIONS | | | | | | | | |
| Proceeds from shares sold: | | | | | | | | |
| Class A | | | 142,909 | | | | 2,209,206 | |
| Class C | | | 4,994 | | | | 37,097 | |
| Class I | | | 6,619,328 | | | | 47,343,624 | |
| Class N | | | — | | | | 917,539 | |
| Trasnsfer of net assets: | | | | | | | | |
| From Class N to Class A | | | — | | | | (10,592,180 | ) |
| To Class A from Class N | | | — | | | | 10,592,180 | |
| Payments for shares redeemed: | | | | | | | | |
| Class A | | | (2,770,892 | ) | | | (6,640,346 | ) |
| Class C | | | (34,350 | ) | | | (70,760 | ) |
| Class I | | | (41,032,029 | ) | | | (102,260,967 | ) |
| Class N | | | — | | | | (6,972,654 | ) |
| Net decrease in net assets from capital share transactions | | | (37,070,040 | ) | | | (65,437,261 | ) |
| | | | | | | | | |
| TOTAL DECREASE IN NET ASSETS | | | (40,393,207 | ) | | | (47,979,221 | ) |
| | | | | | | | | |
| NET ASSETS | | | | | | | | |
| Beginning of Year | | | 175,964,686 | | | | 223,943,907 | |
| End of Year/Period | | $ | 135,571,479 | | | $ | 175,964,686 | |
See accompanying notes to financial statements.
| Altegris/AACA Opportunistic Real Estate Fund |
| STATEMENTS OF CHANGES IN NET ASSETS (Continued) |
| | | For the Six Months Ended | | | For the Year Ended | |
| | | June 30, 2024 | | | December 31, 2023 | |
| | | (Unaudited) | | | | |
| CAPITAL SHARE ACTIVITY | | | | | | | | |
| Class A | | | | | | | | |
| Shares Sold | | | 11,299 | | | | 179,335 | |
| Shares Transferred in from Class N | | | — | | | | 862,106 | |
| Shares Redeemed | | | (217,567 | ) | | | (566,480 | ) |
| Net increase/(decrease) in shares outstanding | | | (206,268 | ) | | | 474,961 | |
| | | | | | | | | |
| Class C | | | | | | | | |
| Shares Sold | | | 409 | | | | 3,255 | |
| Shares Redeemed | | | (2,848 | ) | | | (6,136 | ) |
| Net decrease in shares outstanding | | | (2,439 | ) | | | (2,881 | ) |
| | | | | | | | | |
| Class I | | | | | | | | |
| Shares Sold | | | 519,483 | | | | 3,840,204 | |
| Shares Redeemed | | | (3,235,034 | ) | | | (8,680,076 | ) |
| Net decrease in shares outstanding | | | (2,715,551 | ) | | | (4,839,872 | ) |
| | | | | | | | | |
| Class N (a) | | | | | | | | |
| Shares Sold | | | — | | | | 77,095 | |
| Shares Transferred to Class A | | | — | | | | (861,223 | ) |
| Shares Redeemed | | | — | | | | (580,924 | ) |
| Net decrease in shares outstanding | | | — | | | | (1,365,052 | ) |
| (a) | Effective July 21, 2023, the Class N shares were discontinued. |
See accompanying notes to financial statements.
| Altegris/AACA Opportunistic Real Estate Fund |
| STATEMENT OF CASH FLOWS (Unaudited) |
| For the Six Months Ended June 30, 2024 |
| CASH FLOWS FROM OPERATING ACTIVITIES | | | | |
| Net decrease in net assets resulting from operations | | $ | (3,323,167 | ) |
| Adjustments to reconcile net decrease in net assets resulting from operations to net cash used in operating activities: | | | | |
| Purchase of investments | | | (52,339,036 | ) |
| Proceeds from sale of investments | | | 92,214,083 | |
| Net sales of short-term investments | | | 1,085,888 | |
| Net change in unrealized appreciation (depreciation) | | | 15,594,625 | |
| Net realized gains from investments | | | (11,802,245 | ) |
| Increase in receivable for Fund shares sold | | | (4,937 | ) |
| Decrease in dividends and interest Recievable | | | 123,928 | |
| Decrease in prepaid expenses and other assets | | | 9,817 | |
| Decrease in payable to related parties | | | (6,256 | ) |
| Decrease in investment advisory fee payable | | | (58,743 | ) |
| Decrease in payable for Fund shares redeemed | | | (305,451 | ) |
| Decrease in dividends in payable on securities sold short | | | (7,000 | ) |
| Decrease in distributions (12b-1) fees | | | (690 | ) |
| Decrease in accrued expenses and other liabilities | | | (15,018 | ) |
| Net Cash Used in Operating Activities | | | 41,165,798 | |
| | | | | |
| CASH FLOWS FROM FINANCING ACTIVITIES | | | | |
| Proceeds from Shares issued, net | | | 6,767,231 | |
| Payment of Shares repurchased, | | | (43,837,271 | ) |
| Borrowing proceeds | | | 41,023,695 | |
| Borrowing payments | | | (45,894,118 | ) |
| Net Cash Provided in Financing Activities | | | (41,940,463 | ) |
| | | | | |
| NET INCREASE IN CASH | | | (774,665 | ) |
| CASH - BEGINNING OF PERIOD | | | 1,019,061 | |
| CASH - END OF PERIOD | | $ | 244,396 | |
Supplemental disclosure of cash flow information:
| Interest expense paid | | $ | 921,454 | |
See accompanying notes to financial statements.
| Altegris/AACA Opportunistic Real Estate Fund |
| FINANCIAL HIGHLIGHTS |
| |
| Per Share Data and Ratios for a Share of Beneficial Interest Outstanding Throughout Each Year/Period |
| | | Class A | |
| | | Six Months Ended | | | Year Ended | | | Year Ended | | | Year Ended | | | Year Ended | | | Year Ended | |
| | | June 30, | | | December 31, | | | December 31, | | | December 31, | | | December 31, | | | December 31, | |
| | | 2024 | | | 2023 | | | 2022 | | | 2021 | | | 2020 | | | 2019 | |
| | | (Unaudited) | | | | | | | | | | | | | | | | |
| Net asset value, beginning of year/period | | $ | 12.65 | | | $ | 11.38 | | | $ | 20.40 | | | $ | 21.43 | | | $ | 17.97 | | | $ | 12.57 | |
| Income/(loss) from investment operations: | | | | | | | | | | | | | | | | | | | | | | | | |
| Net investment income/(loss) (1) | | | 0.02 | | | | (0.03 | ) | | | (0.08 | ) | | | (0.16 | ) | | | 0.00 | | | | 0.09 | |
| Net realized and unrealized gain/(loss) on investments | | | (0.30 | ) | | | 1.30 | | | | (8.05 | ) | | | 1.79 | | | | 5.04 | | | | 5.68 | |
| Total income/(loss) from investment operations | | | (0.28 | ) | | | 1.27 | | | | (8.13 | ) | | | 1.63 | | | | 5.04 | | | | 5.77 | |
| Less distributions from: | | | | | | | | | | | | | | | | | | | | | | | | |
| Net investment income | | | — | | | | — | | | | — | | | | — | | | | (0.09 | ) | | | (0.06 | ) |
| Net realized gains | | | — | | | | — | | | | (0.89 | ) | | | (2.66 | ) | | | (1.49 | ) | | | (0.31 | ) |
| Total distributions | | | — | | | | — | | | | (0.89 | ) | | | (2.66 | ) | | | (1.58 | ) | | | (0.37 | ) |
| Redemption fees collected | | | — | | | | — | | | | 0.00 | (2) | | | 0.00 | (2) | | | 0.00 | (2) | | | 0.00 | (2) |
| Net asset value, end of year/period | | $ | 12.37 | | | $ | 12.65 | | | $ | 11.38 | | | $ | 20.40 | | | $ | 21.43 | | | $ | 17.97 | |
| Total return (3,4) | | | (2.21 | )% (9) | | | 11.16 | % | | | (40.19 | )% | | | 8.58 | % | | | 28.16 | % | | | 46.00 | % |
| Net assets, at end of year/period (000s) | | $ | 8,413 | | | $ | 11,210 | | | $ | 4,683 | | | $ | 25,215 | | | $ | 24,905 | | | $ | 15,191 | |
| Ratios/Supplemental Data: | | | | | | | | | | | | | | | | | | | | | | | | |
| Ratios to average net assets (including securities sold short and interest expense): | | | | | | | | | | | | | | | | | | | | | | | | |
| Expenses, before waiver and reimbursement (6,8) | | | 3.11 | % (5,10) | | | 3.05 | % (5) | | | 2.44 | % (5) | | | 2.17 | % (5) | | | 2.23 | % | | | 2.30 | % |
| Expenses, after waiver and reimbursement (6,8) | | | 2.98 | % (10) | | | 2.96 | % | | | 2.43 | % | | | 2.17 | % | | | 2.22 | % | | | 2.30 | % |
| Ratio of net investment income to average net assets (7) | | | 0.32 | % (10) | | | (0.22 | )% | | | (0.48 | )% | | | (0.72 | )% | | | 0.01 | % | | | 0.55 | % |
| Portfolio Turnover Rate | | | 28 | % (9) | | | 54 | % | | | 42 | % | | | 63 | % | | | 61 | % | | | 36 | % |
| (1) | Per share amounts calculated using the average shares method, which more appropriately presents the per share data for the year/period. |
| (2) | Represents less than $0.01 per share. |
| (3) | Total returns shown exclude the effect of applicable sales charges and redemption fees and assumes reinvestment of all distributions. |
| (4) | Includes adjustments in accordance with accounting principles generally accepted in the United States and consequently the net asset value for financial reporting purposes and the returns based upon those net asset values may differ from the net asset values and returns for shareholder transactions. |
| (5) | Represents the ratio of expenses to average net assets absent fee waivers and/or expense reimbursements by the advisor. |
| (6) | The ratios of expenses and net investment income/(loss) to average net assets do not reflect the Fund’s proportionate share of income and expenses of underlying investment companies or REITs in which the Fund invests. |
| (7) | Recognition of net investment income by the Fund is affected by the timing of the declaration of dividends by the underlying investment companies in which the Fund invests. |
| (8) | Ratios to average net assets (excluding dividends from securities sold short and interest expense): |
| Expenses, before waiver and reimbursement | | | 1.93 | % (10) | | | 1.89 | % | | | 1.81 | % | | | 1.80 | % | | | 1.81 | % | | | 1.78 | % |
| Expenses, after waiver and reimbursement | | | 1.80 | % (10) | | | 1.80 | % | | | 1.80 | % | | | 1.80 | % | | | 1.80 | % | | | 1.78 | % |
See accompanying notes to financial statements.
| Altegris/AACA Opportunistic Real Estate Fund |
| FINANCIAL HIGHLIGHTS |
| |
| Per Share Data and Ratios for a Share of Beneficial Interest Outstanding Throughout Each Year/Period |
| | | Class C | |
| | | Six Months Ended | | | Year Ended | | | Year Ended | | | Year Ended | | | Period Ended | |
| | | June 30, | | | December 31, | | | December 31, | | | December 31, | | | December 31, | |
| | | 2024 | | | 2023 | | | 2022 | | | 2021 | | | 2020* | |
| | | (Unaudited) | | | | | | | | | | | | | |
| Net asset value, beginning of year/period | | $ | 12.35 | | | $ | 11.19 | | | $ | 20.24 | | | $ | 21.43 | | | $ | 21.56 | |
| Income/(loss) from investment operations: | | | | | | | | | | | | | | | | | | | | |
| Net investment income/(loss) (1) | | | (0.02 | ) | | | (0.12 | ) | | | (0.11 | ) | | | (0.25 | ) | | | 0.00 | (2) |
| Net realized and unrealized gain/(loss) on investments | | | (0.30 | ) | | | 1.28 | | | | (8.05 | ) | | | 1.72 | | | | 1.40 | |
| Total income/(loss) from investment operations | | | (0.32 | ) | | | 1.16 | | | | (8.16 | ) | | | 1.47 | | | | 1.40 | |
| Less distributions from: | | | | | | | | | | | | | | | | | | | | |
| Net investment income | | | — | | | | — | | | | — | | | | — | | | | (0.04 | ) |
| Net realized gains | | | — | | | | — | | | | (0.89 | ) | | | (2.66 | ) | | | (1.49 | ) |
| Total distributions | | | — | | | | — | | | | (0.89 | ) | | | (2.66 | ) | | | (1.53 | ) |
| Redemption fees collected | | | — | | | | — | | | | 0.00 | (2) | | | 0.00 | (2) | | | 0.00 | (2) |
| Net asset value, end of year/period | | $ | 12.03 | | | $ | 12.35 | | | $ | 11.19 | | | $ | 20.24 | | | $ | 21.43 | |
| Total return (3,5) | | | (2.59 | )% (4,5) | | | 10.37 | % | | | (40.66 | )% | | | 7.83 | % | | | 6.61 | % (4) |
| Net assets, at end of year/period (000s) | | $ | 157 | | | $ | 192 | | | $ | 206 | | | $ | 84 | | | $ | 0 | (6) |
| Ratios/Supplemental Data: | | | | | | | | | | | | | | | | | | | | |
| Ratios to average net assets (including securities sold short and interest expense): | | | | | | | | | | | | | | | | | | | | |
| Expenses, before waiver and reimbursement (8,11) | | | 3.86 | % (7,10) | | | 3.63 | % (7) | | | 3.19 | % (7) | | | 2.92 | % (7) | | | 2.98 | % (10) |
| Expenses, after waiver and reimbursement (8,11) | | | 3.73 | % (10) | | | 3.54 | % | | | 3.18 | % | | | 2.92 | % | | | 2.97 | % (10) |
| Ratio of net investment income to average net assets (9) | | | (0.36 | )% (10) | | | (1.02 | )% | | | (0.77 | )% | | | (1.14 | )% | | | 0.19 | % (10) |
| Portfolio Turnover Rate | | | 28 | % (4) | | | 54 | % | | | 42 | % | | | 63 | % | | | 61 | % (4) |
| * | Class C commenced operations on December 1, 2020 |
| (1) | Per share amounts calculated using the average shares method, which more appropriately presents the per share data for the year/period. |
| (2) | Represents less than $0.01 per share. |
| (3) | Total returns shown exclude the effect of applicable sales charges and redemption fees and assumes reinvestment of all distributions. |
| (5) | Includes adjustments in accordance with accounting principles generally accepted in the United States and consequently the net asset value for financial reporting purposes and the returns based upon those net asset values may differ from the net asset values and returns for shareholder transactions. |
| (6) | Amount less than 1,000. |
| (7) | Represents the ratio of expenses to average net assets absent fee waivers and/or expense reimbursements by the advisor. |
| (8) | The ratios of expenses and net investment income (loss) to average net assets do not reflect the Fund’s proportionate share of income and expenses of underlying investment companies or REITs in which the Fund invests. |
| (9) | Recognition of net investment income by the Fund is affected by the timing of the declaration of dividends by the underlying investment companies in which the Fund invests. |
| (11) | Ratios to average net assets (excluding dividends from securities sold short and interest expense): |
| Expenses, before waiver and reimbursement | | | 2.68 | % (10) | | | 2.64 | % | | | 2.56 | % | | | 2.55 | % | | | 2.56 | % |
| Expenses, after waiver and reimbursement | | | 2.55 | % (10) | | | 2.55 | % | | | 2.55 | % | | | 2.55 | % | | | 2.55 | % |
See accompanying notes to financial statements.
| Altegris/AACA Opportunistic Real Estate Fund |
| FINANCIAL HIGHLIGHTS |
| |
| Per Share Data and Ratios for a Share of Beneficial Interest Outstanding Throughout Each Year/Period |
| | | Class I | |
| | | Six Months Ended | | | Year Ended | | | Year Ended | | | Year Ended | | | Year Ended | | | Year Ended | |
| | | June 30, | | | December 31, | | | December 31, | | | December 31, | | | December 31, | | | December 31, | |
| | | 2024 | | | 2023 | | | 2022 | | | 2021 | | | 2020 | | | 2019 | |
| | | (Unaudited) | | | | | | | | | | | | | | | | |
| Net asset value, beginning of year/period | | $ | 12.84 | | | $ | 11.52 | | | $ | 20.59 | | | $ | 21.55 | | | $ | 18.08 | | | $ | 12.64 | |
| Income/(loss) from investment operations: | | | | | | | | | | | | | | | | | | | | | | | | |
| Net investment income/(loss) (1) | | | 0.04 | | | | (0.01 | ) | | | (0.03 | ) | | | (0.10 | ) | | | 0.05 | | | | 0.14 | |
| Net realized and unrealized gain/(loss) on investments | | | (0.31 | ) | | | 1.33 | | | | (8.15 | ) | | | 1.80 | | | | 5.06 | | | | 5.70 | |
| Total income/(loss) from investment operations | | | (0.27 | ) | | | 1.32 | | | | (8.18 | ) | | | 1.70 | | | | 5.11 | | | | 5.84 | |
| Less distributions from: | | | | | | | | | | | | | | | | | | | | | | | | |
| Net investment income | | | — | | | | — | | | | — | | | | — | | | | (0.15 | ) | | | (0.09 | ) |
| Net realized gains | | | — | | | | — | | | | (0.89 | ) | | | (2.66 | ) | | | (1.49 | ) | | | (0.31 | ) |
| Total distributions | | | — | | | | — | | | | (0.89 | ) | | | (2.66 | ) | | | (1.64 | ) | | | (0.40 | ) |
| Redemption fees collected | | | — | | | | — | | | | 0.00 | (2) | | | 0.00 | (2) | | | 0.00 | (2) | | | 0.00 | (2) |
| Net asset value, end of year/period | | $ | 12.57 | | | $ | 12.84 | | | $ | 11.52 | | | $ | 20.59 | | | $ | 21.55 | | | $ | 18.08 | |
| Total return (3,4) | | | (2.10 | )% (9) | | | 11.46 | % | | | (40.06 | )% | | | 8.86 | % | | | 28.45 | % | | | 46.34 | % |
| Net assets, at end of year/period (000s) | | $ | 127,001 | | | $ | 164,563 | | | $ | 203,502 | | | $ | 621,281 | | | $ | 519,163 | | | $ | 329,530 | |
| Ratios/Supplemental Data: | | | | | | | | | | | | | | | | | | | | | | | | |
| Ratios to average net assets (including securities sold short and interest expense): | | | | | | | | | | | | | | | | | | | | | | | | |
| Expenses, before waiver and reimbursement (6,8) | | | 2.86 | % (5,10) | | | 2.61 | % (5) | | | 2.19 | % (5) | | | 1.92 | % (5) | | | 1.99 | % | | | 2.02 | % |
| Expenses, after waiver and reimbursement (6,8) | | | 2.73 | % (10) | | | 2.52 | % | | | 2.18 | % | | | 1.92 | % | | | 1.97 | % | | | 2.02 | % |
| Ratio of net investment income to average net assets (7) | | | 0.60 | % (10) | | | (0.04 | )% | | | (0.19 | )% | | | (0.45 | )% | | | 0.24 | % | | | 0.83 | % |
| Portfolio Turnover Rate | | | 28 | % (9) | | | 54 | % | | | 42 | % | | | 63 | % | | | 61 | % | | | 36 | % |
| (1) | Per share amounts calculated using the average shares method, which more appropriately presents the per share data for the year/period. |
| (2) | Represents less than $0.01 per share. |
| (3) | Total returns shown exclude the effect of applicable sales charges and redemption fees and assumes reinvestment of all distributions. |
| (4) | Includes adjustments in accordance with accounting principles generally accepted in the United States and consequently the net asset value for financial reporting purposes and the returns based upon those net asset values may differ from the net asset values and returns for shareholder transactions. |
| (5) | Represents the ratio of expenses to average net assets absent fee waivers and/or expense reimbursements by the advisor. |
| (6) | The ratios of expenses and net investment income (loss) to average net assets do not reflect the Fund’s proportionate share of income and expenses of underlying investment companies or REITs in which the Fund invests. |
| (7) | Recognition of net investment income by the Fund is affected by the timing of the declaration of dividends by the underlying investment companies in which the Fund invests. |
| (8) | Ratios to average net assets (excluding dividends from securities sold short and interest expense): |
| Expenses, before waiver and reimbursement | | | 1.68 | % (10) | | | 1.64 | % | | | 1.56 | % | | | 1.56 | % | | | 1.56 | % | | | 1.54 | % |
| Expenses, after waiver and reimbursement | | | 1.55 | % (10) | | | 1.55 | % | | | 1.55 | % | | | 1.55 | % | | | 1.55 | % | | | 1.54 | % |
See accompanying notes to financial statements.
Altegris/AACA Opportunistic Real Estate Fund
NOTES TO FINANCIAL STATEMENTS (Unaudited)
June 30, 2024
Altegris/AACA Opportunistic Real Estate Fund (the “Fund”) is a non-diversified series of shares of beneficial interest of Northern Lights Fund Trust (the “Trust”), a statutory trust organized under the laws of the State of Delaware on January 19, 2005, and registered under the Investment Company Act of 1940, as amended (the “1940 Act”), as an open-end management investment company. The Fund commenced operations on January 9, 2014, and seeks to provide total return through long term capital appreciation and current income by investing in both long and short, in equity securities of real estate and real estate related companies.
The Fund offers Class A, Class C, and Class I shares. Class A shares are offered at net asset value (“NAV”) plus a maximum sales charge of 5.75% and are subject to 12b-1. Investors that purchase $1,000,000 or more of the Fund’s Class A shares will not pay any initial sales charge on the purchase; however, may be subject to a contingent deferred sales charge (“CDSC”) on shares redeemed during the first 18 months after their purchase in the amount of the commissions paid on the shares redeemed. Class C shares commenced operations on December 1, 2020, and are offered at their NAV without an initial sales charge and are subject to 12b-1. If you redeem Class C shares within one year after purchase, you will be charged a CDSC of up to 1.00%. Class I shares of the Fund are sold at NAV without an initial sales charge and are not subject to distribution fees, but have a higher minimum initial investment than Class A and Class C shares. Each share class represents an interest in the same assets of the Fund and classes are identical except for differences in their sales charge structures and ongoing service and distribution charges. All classes of shares have equal voting privileges except that each class has exclusive voting rights with respect to its service and/or distribution plans. As of July 21, 2023, the Class N shares were discontinued, the existing Class N shareholders as of that date were redesignated as Class A shareholders with any sales loads associated with Class A shares waived. The Fund’s income, expenses (other than class specific distribution fees) and realized and unrealized gains and losses are allocated proportionately each day based upon the relative net assets of each class of the Fund.
| 2. | SIGNIFICANT ACCOUNTING POLICIES |
The following is a summary of significant accounting policies followed by the Fund in preparation of its financial statements. The policies are in conformity with accounting principles generally accepted in the United States of America (“GAAP”). The preparation of the financial statements requires management to make estimates and assumptions that affect the reported amounts of assets and liabilities and disclosure of contingent assets and liabilities at the date of the financial statements and the reported amounts of income and expenses for the period. Actual results could differ from those estimates. Due to custodian liabilities shown on the Statement of Assets and Liabilities are carried at cost and approximate fair value as of June 30, 2024, using level 2 inputs. The Fund is an investment company and accordingly follows the investment company accounting and reporting guidance of the Financial Accounting Standards Board (“FASB”) Accounting Standard Codification Topic 946.
Security Valuation – Securities listed on an exchange are valued at the last reported sale price at the close of the regular trading session of the exchange on the business day the value is being determined, or in the case of securities listed on NASDAQ at the NASDAQ Official Closing Price. In the absence of a sale such securities shall be valued at the mean between the current bid and ask prices on the day of valuation. Options are valued at their closing price on the exchange they are traded on. When no closing price is available, options are valued at their mean price. Short-term debt obligations having 60 days or less remaining until maturity, at time of purchase may be valued at amortized cost (which approximates fair value). Investments in open-end investment companies are valued at net asset value.
The Fund may hold securities, such as private investments, interests in commodity pools, other non-traded securities or temporarily illiquid securities, for which market quotations are not readily available or are determined to be unreliable. These securities will be valued using the “fair value” procedures approved by the Board. The Board has delegated execution of these procedures to the Adviser as its valuation designee (the “Valuation Designee”). The Valuation Designee may also enlist third party consultants such a valuation specialist at a public accounting firm, valuation consultant or financial officer of a security issuer on an as-needed basis to assist in determining a security-specific fair value. The Board is responsible for reviewing and approving fair value methodologies utilized by the Valuation Designee, which approval shall be based upon whether the Valuation Designee followed the valuation procedures established by the Board.
Altegris/AACA Opportunistic Real Estate Fund
NOTES TO FINANCIAL STATEMENTS (Unaudited) (Continued)
June 30, 2024
Fair Valuation Process – The applicable investments are valued by the Valuation Designee pursuant to valuation procedures established by the Board. For example, fair value determinations are required for the following securities: (i) securities for which market quotations are insufficient or not readily available on a particular business day (including securities for which there is a short and temporary lapse in the provision of a price by the regular pricing source); (ii) securities for which, in the judgment of the Valuation Designee, the prices or values available do not represent the fair value of the instrument; factors which may cause the Valuation Designee to make such a judgment include, but are not limited to, the following: only a bid price or an ask price is available; the spread between bid and ask prices is substantial; the frequency of sales; the thinness of the market; the size of reported trades; and actions of the securities markets, such as the suspension or limitation of trading; (iii) securities determined to be illiquid; and (iv) securities with respect to which an event that will affect the value thereof has occurred (a “significant event”) since the closing prices were established on the principal exchange on which they are traded, but prior to a Fund’s calculation of its net asset value. Specifically, interests in commodity pools or managed futures pools are valued on a daily basis by reference to the closing market prices of each futures contract or other asset held by a pool, as adjusted for pool expenses. Restricted or illiquid securities, such as private investments or non-traded securities are valued based upon the current bid for the security from two or more independent dealers or other parties reasonably familiar with the facts and circumstances of the security (who should take into consideration all relevant factors as may be appropriate under the circumstances). If a current bid from such independent dealers or other independent parties is unavailable, the Valuation Designee shall determine, the fair value of such security using the following factors: (i) the type of security; (ii) the cost at date of purchase; (iii) the size and nature of the Fund’s holdings; (iv) the discount from market value of unrestricted securities of the same class at the time of purchase and subsequent thereto; (v) information as to any transactions or offers with respect to the security; (vi) the nature and duration of restrictions on disposition of the security and the existence of any registration rights; (vii) how the yield of the security compares to similar securities of companies of similar or equal creditworthiness; (viii) the level of recent trades of similar or comparable securities; (ix) the liquidity characteristics of the security; (x) current market conditions; and (xi) the market value of any securities into which the security is convertible or exchangeable.
The Fund utilizes various methods to measure the fair value of all of its investments on a recurring basis. GAAP establishes a hierarchy that prioritizes inputs to valuation methods. The three levels of input are:
Level 1 – Unadjusted quoted prices in active markets for identical assets and liabilities.
Level 2 – Observable inputs other than quoted prices included in Level 1 that are observable for the asset or liability, either directly or indirectly. These inputs may include quoted prices for the identical instrument in an inactive market, prices for similar instruments, interest rates, prepayment speeds, credit risk, yield curves, default rates and similar data.
Level 3 – Unobservable inputs for the asset or liability, to the extent relevant observable inputs are not available; representing the Fund’s own assumptions about the assumptions a market participant would use in valuing the asset or liability, and would be based on the best information available.
The availability of observable inputs can vary from security to security and is affected by a wide variety of factors, including, for example, the type of security, whether the security is new and not yet established in the marketplace, the liquidity of markets, and other characteristics particular to the security. To the extent that valuation is based on models or inputs that are less observable or unobservable in the market, the determination of fair value requires more judgment. Accordingly, the degree of judgment exercised in determining fair value is greatest for instruments categorized in Level 3.
The inputs used to measure fair value may fall into different levels of the fair value hierarchy. In such cases, for disclosure purposes, the level in the fair value hierarchy within which the fair value measurement falls in its entirety, is determined based on the lowest level input that is significant to the fair value measurement in its entirety.
Altegris/AACA Opportunistic Real Estate Fund
NOTES TO FINANCIAL STATEMENTS (Unaudited) (Continued)
June 30, 2024
The inputs or methodology used for valuing securities are not necessarily an indication of the risk associated with investing in those securities. The following table summarizes the level of inputs used as of June 30, 2024, for the Fund’s assets and liabilities measured at fair value:
| Assets* | | Level 1 | | | Level 2 | | | Level 3 | | | Total | |
| Investments | | | | | | | | | | | | | | | | |
| Common Stock | | $ | 137,225,197 | | | $ | — | | | $ | 7,778,312 | | | | 145,003,509 | |
| Preferred Stock | | | 5,663,949 | | | | — | | | | — | | | | 5,663,949 | |
| Short-Term Investments | | | 3,043,485 | | | | — | | | | — | | | | 3,043,485 | |
| Total Assets | | $ | 145,932,631 | | | $ | — | | | $ | 7,778,312 | | | $ | 153,710,943 | |
| | | | | | | | | | | | | | | | | |
| Liabilities* | | Level 1 | | | Level 2 | | | Level 3 | | | Total | |
| Securities Sold Short | | | | | | | | | | | | | | | | |
| Common Stock | | $ | 1,748,603 | | | $ | — | | | $ | — | | | $ | 1,748,603 | |
| Total Liabilities | | $ | 1,748,603 | | | $ | — | | | $ | — | | | $ | 1,748,603 | |
| * | Refer to the Schedule of Investments for classifications. |
The following table is a reconciliation of assets in which Level 3 inputs were used in determining value:
| | | IQHQ | |
| Beginning Balance | | $ | 21,334,501 | |
| Total realized gain/(loss) | | | — | |
| Change in Unrealized Appreciation/(Depreciation) | | | (13,556,189 | ) |
| Cost of Purchases | | | — | |
| Proceeds from Sales | | | — | |
| Proceeds from Principal | | | — | |
| Accrued Interest | | | — | |
| Net transfers in/out of level 3 | | | — | |
| Ending Balance | | $ | 7,778,312 | |
The following table summarizes the valuation techniques and significant unobservable inputs used for the Fund’s investment that is categorized within Level 3 of the fair value hierarchy as of June 30, 2024:
| | | | | | | | | | | Impact to |
| | | | | | | | | | | valuation from |
| Assets | | Fair Value at | | | | | | Unobservable | | an increase in |
| (at fair value) | | June 30, 2024 | | Valuation Technique | | Unobservable Inputs | | Input Value | | input* |
| IQHQ | | $7,778,312 | | Real Estate Appraisal Values | | Exit Capitalization Rate
Discount Rate
Share Dilution* | | 5.25% to 7.00%
6.75% to 10.50%
N/A* | | Decrease
Decrease
N/A* |
| * | An increase in share dilution would result in a decrease in valuation. |
During the six-month period ended June 30, 2024, management determined that the Fund’s IQHQ fair value methodology should be changed after the review of Company issued materials and adverse market conditions. The June 30, 2024 NAV per share was determined by using a third-party valuation, which incorporated fair value estimates of properties owned by the Company and adjustments to the ownership structure of the Company. The fair value estimates of the properties were determined by some or all of a direct capitalization approach, an income approach, and a comparable sales approach. These approaches utilized various inputs and analyses which included, but were not limited to, discounted cash flow analyses and references to market comparable data. The discounted cash flow analyses considered previous appraisals for qualitative considerations and current market rates. The most significant unobservable inputs utilized in determining the fair value of these properties are capitalization rates and discount rates, which ranged from 5.25% to 7.00% and 6.75% to 10.50%, respectively. The fund valuation designee and Sub-adviser continue to monitor the Company through the review of Company issued materials such as financial statements, appraisals, and other investor materials and through discussions with its management. The Sub-adviser and Adviser may recommend to adjust the NAV per share based on this information.
Altegris/AACA Opportunistic Real Estate Fund
NOTES TO FINANCIAL STATEMENTS (Unaudited) (Continued)
June 30, 2024
Security Transactions and Related Income – Security transactions are accounted for on a trade date basis. Interest income is recognized on an accrual basis. Discounts are accreted and premiums are amortized on securities purchased over the lives of the respective securities. Dividend income is recorded on the ex-dividend date. Realized gains or losses from sales of securities are determined by comparing the identified cost of the security lot sold with the net sales proceeds.
Foreign Currency Translations – All assets and liabilities denominated in foreign currencies are translated into U.S. dollars based on the rate of exchange of such currencies against U.S. dollars on the date of valuation. Purchases and sales of securities and income and expenses are translated at the rate of exchange quoted on the respective date that such transactions are recorded. The Fund does not isolate the portion of the results of operations resulting from changes in foreign exchange rates on investments from the fluctuations arising from changes in market prices of securities held.
The Fund’s investments in foreign securities are subject to foreign currency fluctuations, higher volatility than U.S. securities, varying degrees of regulation and limited liquidity. Greater political, economic, credit and information risks are also associated with foreign securities.
Dividends and Distributions to Shareholders – Dividends from net investment income are declared and distributed quarterly for the Fund. Distributable net realized capital gains are declared and distributed annually. Dividends from net investment income and distributions from net realized gains are recorded on ex dividend date and determined in accordance with federal income tax regulations, which may differ from GAAP. These “book/tax” differences are considered either temporary (i.e., deferred losses, capital loss carry forwards) or permanent in nature. To the extent these differences are permanent in nature, such amounts are reclassified within the composition of net assets based on their federal tax-basis treatment; temporary differences do not require reclassification.
Federal Income Taxes – It is the Fund’s policy to continue to qualify as a regulated investment company by complying with the provisions of the Internal Revenue Code that are applicable to regulated investment companies and to distribute substantially all of its taxable income and net realized gains to shareholders. Therefore, no federal income tax provision has been recorded.
The Fund recognizes the tax benefits of uncertain tax positions only where the position is “more likely than not” to be sustained assuming examination by tax authorities. Management has analyzed the Fund’s tax positions and has concluded that no liability for unrecognized tax benefits should be recorded related to uncertain tax positions taken on returns filed for open tax years ended December 31, 2021 through December 31, 2023 or expected to be taken in the Fund’s December 31, 2024 year-end tax returns. The Fund identifies its major tax jurisdictions as U.S. federal, Ohio, and any foreign jurisdiction where the Fund makes significant investments; however, the Fund is not aware of any tax positions for which it is reasonably possible that the total amounts of unrecognized tax benefits will change materially in the next twelve months.
Expenses – Expenses of the Trust that are directly identifiable to a specific fund are charged to that fund. Expenses, which are not readily identifiable to a specific fund, are allocated in such a manner as deemed equitable, taking into consideration the nature and type of expense and the relative sizes of the funds in the Trust.
Indemnification – The Trust indemnifies its officers and Trustees for certain liabilities that may arise from the performance of their duties to the Trust. Additionally, in the normal course of business, if the Fund enters into contracts that contain a variety of representations and warranties and which provide general indemnities, the Fund’s maximum exposure under these arrangements is unknown, as this would involve future claims that may be made against the Fund that have not yet occurred. However, based on experience, the risk of loss due to these warranties and indemnities appears to be remote.
Market and Geopolitical Risk – The increasing interconnectivity between global economies and financial markets increases the likelihood that events or conditions in one region or financial market may adversely impact issuers in a different country, region or financial market. Securities in a Fund’s portfolio may underperform due to inflation (or expectations for inflation), interest rates, global demand for particular products or resources, natural disasters, pandemics, epidemics, terrorism, regulatory events and governmental or quasi-governmental actions. The occurrence of global events similar to those in recent years may result in market volatility and may have long term effects on both the U.S. and global financial markets.
Altegris/AACA Opportunistic Real Estate Fund
NOTES TO FINANCIAL STATEMENTS (Unaudited) (Continued)
June 30, 2024
| 3. | INVESTMENT TRANSACTIONS AND ASSOCIATED RISKS |
The cost of purchases and the proceeds for the Fund from sales of investments, other than short-term investments, for the six months ended June 30, 2024, were as follows:
| | | | | | | Cover Short | | | Securities Sold | |
| Purchases | | | Sales | | | Sale | | | Short | |
| $ | 51,347,780 | | | $ | 92,047,779 | | | $ | 991,257 | | | $ | — | |
During the normal course of business, the Fund purchases and sells various financial instruments, which may result in market, liquidity, currency, and counterparty risks, the amount of which is not apparent from the financial statements.
Market Risk: Market risk is the risk that changes in interest rates, foreign exchange rates or equity prices will affect the positions held by the Fund. The Fund is exposed to market risk on financial instruments that are valued at market prices as disclosed in the portfolio of investments. The prices of derivative instruments, including options, forwards and futures prices, can be highly volatile. Price movements of derivative contracts in which the Fund’s assets may be invested are influenced by, among other things, interest rates, changing supply and demand relationships, trade, fiscal, monetary and exchange control programs and policies of governments, and national and international political and economic events and policies. The Fund may be exposed to market risk on derivative contracts if the Fund is not able to readily dispose of its holdings when they choose and also that the price obtained on disposal is below that at which the investment is included in its financial statements. All financial instruments are recognized at fair value, and all changes in market conditions directly affect net income. Derivative instruments and exposure to market risk will be disclosed in the Fund’s Portfolio of Investments.
Liquidity Risk: Liquidity risk is the risk that the Fund will encounter difficulty in raising funds to meet commitments. Liquidity risk may result in an inability to sell investments quickly at close to fair value. The Fund’s financial instruments include investments in securities which are not traded on organized public exchanges and which generally may be illiquid. As a result, the Fund may not be able to quickly liquidate its investments in these instruments at an amount close to its fair value in order to meet its liquidity requirements. The Fund does not anticipate any material losses as a result of liquidity risk.
Currency Risk: The Fund may invest in financial instruments and enter into transactions that are denominated in currencies other than its functional currency. Consequently, the Fund is exposed to the risk that the exchange rate of the Fund’s currency relative to other foreign currencies may change in a manner that has an adverse effect on the fair value or future cash flows of that portion of the Fund’s assets or liabilities denominated in currencies other than the USD.
Counterparty Risk: Counterparty risk is the risk that the Fund’s counterparties might default on their obligation to pay or perform generally on their obligations.
Short Sales – A short sale is a transaction in which the Fund sells a security it does not own but has borrowed in anticipation that the market price of that security will decline. The Fund is obligated to replace the security borrowed by purchasing it on the open market at a later date. If the price of the security sold short increases between the time of the short sale and the time the Fund replaces the borrowed security, the Fund will incur a loss. Conversely, if the price declines, the Fund will realize a gain.
Option Transactions – Options are derivative financial instruments that give the buyer, in exchange for a premium payment, the right, but not the obligation, to either purchase from (call option) or sell to (put option) the writer a specified underlying instrument at a specified price on or before a specified date. The Fund may enter into option contracts to meet the requirements of its trading activities.
The risk in writing a call option is that the Fund may incur a loss if the market price of the security increases and the option is exercised. The risk in writing a put option is that the Fund may incur a loss if the market price of the security decreases and the option is exercised. The risk in buying an option is that the Fund pays a premium whether or not the option is exercised. The Fund also has the additional risk of not being able to enter into a closing transaction if a liquid secondary market does not exist.
Altegris/AACA Opportunistic Real Estate Fund
NOTES TO FINANCIAL STATEMENTS (Unaudited) (Continued)
June 30, 2024
Put options are purchased to hedge against a decline in the value of securities held in the Fund’s portfolio. If such a decline occurs, the put options will permit the Fund to sell the securities underlying such options at the exercise price, or to close out the options at a profit. The Fund may purchase call options as a temporary substitute for the purchase of individual securities, which then could be purchased in orderly fashion. The premium paid for a put or call option plus any transaction costs will reduce the benefit, if any, realized by the Fund upon exercise of the option, and, unless the price of the underlying security rises or declines sufficiently, the option may expire worthless. In addition, in the event that the price of the security, in connection with which an option was purchased, moves in a direction favorable, the benefits realized as a result of such movement will be reduced by the amount of the premium paid for the option and related transaction costs. Written and purchased options are non-income producing securities. With purchased options, there is minimal counterparty credit risk since these options are exchange traded and the exchange’s clearinghouse, as counterparty to all exchange traded options, guarantees against a possible default.
| 4. | INVESTMENT ADVISORY AGREEMENT AND TRANSACTIONS WITH RELATED PARTIES |
Altegris Advisors, LLC, serves as the Fund’s investment advisor (“the Advisor”). Pursuant to an investment advisory agreement (the “Advisory Agreement”) with the Trust, on behalf of the Fund, the Advisor, subject to the oversight of the Board, and in conformity with the stated policies of the Fund, manages the portfolio investment operations of the Fund. The Advisor has overall supervisory responsibilities for the general management and investment of the Fund’s securities portfolio, which is subject to review and approval by the Board. In general, the Advisor’s duties include setting the Fund’s overall investment strategies and asset allocation as well as hiring and supervising sub-advisors. The Advisor allocates portions of the Fund’s portfolio to be managed by American Assets Capital Advisers, LLC (“AACA”) as sub-advisor.
As compensation for its services and the related expenses borne by the Advisor, the Fund pays the Advisor a fee computed and accrued daily and paid monthly, based on its average daily net assets at an annual rate of 1.30%. Pursuant to the investment advisory agreement, the Advisor earned $1,045,936 for the six months ended June 30, 2024.
The Advisor has contractually agreed to waive its fees and/or absorb expenses of the Fund, to ensure that total annual Fund operating expenses after fee waiver and/or reimbursement (exclusive of any front-end or contingent deferred loads, brokerage fees and commissions, acquired fund fees and expenses; fees and expenses associated with investments with other collective investment vehicles or derivative instruments (including for example options and swap fees and expenses), borrowing costs (such as interest and dividend expenses on securities sold short), taxes, expenses incurred in connection with any merger or reorganization and extraordinary expenses such as litigation expenses (which may include indemnification of officers and Trustees, and contractual indemnification of fund service providers (other than the Advisor)) will not exceed certain percentages with respect to the Fund (the “Expense Limitations”). Pursuant to the Expense Limitations, the Fund’s Operating Expenses will not exceed 1.80%, 2.55%, and 1.55% through October 31, 2025, of the daily average net assets attributable to each of the Class A, Class C, and Class I shares, respectively. For the six months ended June 30, 2024, the Advisor waived $104,167 of advisory fees.
The Advisor may seek reimbursement only for expenses waived or paid by it during the three fiscal years prior to such reimbursement; provided, however, that such expenses may only be reimbursed to the extent they were waived or paid after the date of the waiver agreement (or any similar agreement). The Board may terminate this expense reimbursement arrangement at any time. Cumulative expenses previously waived or reimbursed subject to the aforementioned conditions will expire as presented in the table below:
| December 2024 | | $ | 3,774 | |
| December 2025 | | | 44,986 | |
| December 2026 | | | 183,322 | |
| | | $ | 232,082 | |
The Trust has adopted, on behalf of the Fund, the Trust’s Master Distribution and Shareholder Servicing Plan (the “Plan”) for Class A and Class C shares, pursuant to Rule 12b-1 under the 1940 Act. The Plan provides that a monthly service and/or distribution fee is calculated by the Fund at an annual rate of 0.25% for Class A and 1.00% for Class C of the average daily net assets attributable to each Class, respectively. The fee is paid to Northern Lights Distributors, LLC (the “Distributor”) to provide compensation for ongoing distribution-related activities or services and/or maintenance of the Fund’s shareholder
Altegris/AACA Opportunistic Real Estate Fund
NOTES TO FINANCIAL STATEMENTS (Unaudited) (Continued)
June 30, 2024
accounts, not otherwise required to be provided by the Advisor. During the six months ended June 30, 2024, pursuant to the Plan, Class A and Class C shares paid the amounts of $12,314 and $916, respectively.
The Distributor acts as the Fund’s principal underwriter in a continuous public offering of the Fund’s Class A, Class C, and Class I shares. During the six months ended June 30, 2024, for Class A and Class C shares, the Distributor received $273 and $79 in underwriting commissions for sales of the Fund, of which $36 and $29 were retained by the principal underwriter for the Fund.
In addition, certain affiliates of the Distributor provide services to the Fund as follows:
Ultimus Fund Solutions, LLC (“UFS”)
UFS, an affiliate of the Distributor, provides administration, fund accounting, and transfer agent services to the Trust. Pursuant to separate servicing agreements with UFS, the Fund pays UFS customary fees for providing administration, fund accounting and transfer agency services to the Fund. Certain officers of the Trust are also officers of UFS and are not paid any fees directly by the Fund for serving in such capacities. UFS provides a Principal Executive Officer and a Principal Financial Officer to the Trust.
Northern Lights Compliance Services, LLC (“NLCS”)
NLCS, an affiliate of UFS and the Distributor, provides a Chief Compliance Officer to the Trust, as well as related compliance services, pursuant to a consulting agreement between NLCS and the Trust. Under the terms of such agreement, NLCS receives customary fees from the Fund.
Blu Giant, LLC (“Blu Giant”)
Blu Giant, an affiliate of UFS and the Distributor, provides EDGAR conversion and filing services as well as print management services for the Fund on an ad-hoc basis. For the provision of these services, Blu Giant receives customary fees from the Fund.
| 5. | AGGREGATE UNREALIZED APPRECIATION AND DEPRECIATION – TAX BASIS |
| | | | | | | | | | Net Unrealized | |
| Cost for Federal | | | Unrealized | | | Unrealized | | | Appreciation/ | |
| Tax Purposes | | | Appreciation | | | Depreciation | | | (Depreciation) | |
| $ | 155,815,719 | | | $ | 23,649,718 | | | $ | (27,503,097 | ) | | $ | (3,853,379 | ) |
| 6. | DISTRIBUTIONS TO SHAREHOLDERS AND TAX COMPONENTS OF CAPITAL |
The tax character of distributions paid during the fiscal years ended December 31, 2023 and December 31, 2022 was as follows:
| | | Fiscal Year Ended | | | Fiscal Year Ended | |
| | | December 31, 2023 | | | December 31, 2022 | |
| Ordinary Income | | $ | — | | | $ | — | |
| Long-Term Capital Gain | | | — | | | | 17,223,666 | |
| Return of Capital | | | — | | | | — | |
| | | $ | — | | | $ | 17,223,666 | |
As of December 31, 2023, the components of accumulated earnings/ (deficit) on a tax basis were as follows:
| Undistributed | | | Undistributed | | | Post October Loss | | | Capital Loss | | | Other | | | Unrealized | | | Total | |
| Ordinary | | | Long-Term | | | and | | | Carry | | | Book/Tax | | | Appreciation/ | | | Accumulated | |
| Income | | | Gains | | | Late Year Loss | | | Forwards | | | Differences | | | (Depreciation) | | | Earnings/(Deficits) | |
| $ | 1,333,441 | | | $ | — | | | $ | (8,258,972 | ) | | $ | (104,747,373 | ) | | $ | (3,377,895 | ) | | $ | 11,741,246 | | | $ | (103,309,553 | ) |
Altegris/AACA Opportunistic Real Estate Fund
NOTES TO FINANCIAL STATEMENTS (Unaudited) (Continued)
June 30, 2024
The difference between book basis and tax basis undistributed net investment income, accumulated net realized gains, and unrealized appreciation from investments is primarily attributable to adjustments for passive foreign investment companies and C-Corporation return of capital distributions. In addition, the amount listed under other book/tax differences for the Fund are primarily attributable to disallowed business interest expense carryforward and the tax deferral of losses on straddles.
Capital losses incurred after October 31 within the fiscal year are deemed to arise on the first business day of the following fiscal year for tax purposes. The Fund incurred and elected to defer such capital losses of $8,258,972.
At December 31, 2023, the Fund had capital loss carry forwards for federal income tax purposes available to offset future capital gains, as follows:
| Short-Term | | | Long-Term | | | Total | | | CLCF Utilized | |
| $ | 45,095,610 | | | $ | 59,651,763 | | | $ | 104,747,373 | | | $ | — | |
Permanent book and tax differences, primarily attributable to the book/tax basis treatment of adjustments for prior year tax returns, resulted in reclassifications for the Fund for the fiscal year ended December 31, 2023 as follows:
| Paid In | | | Accumulated | |
| Capital | | | Deficit | |
| $ | 1,829,362 | | | $ | (1,829,362 | ) |
The Fund may employ leverage by borrowing. To employ this leverage the Fund has an asset-based financing agreement with JP Morgan Cash Bank NA. The amounts that can be borrowed will fluctuate based on the assets held by the Fund. As of June 30, 2024, the balance outstanding was $17,320,796. The Interest rate as of June 30, 2024 was 6.92%. The Fund’s average borrowings during the six months was $25,945,950 with an average rate of 6.92%. The total interest paid on borrowings for the six months was $907,483. The loan is recorded at cost on the Statement of Assets and Liabilities. As of June 30, 2024, the fair value of the loan outstanding approximates cost; fair value of the loan outstanding is estimated using level 2 inputs in the fair value hierarchy.
The beneficial ownership, either directly or indirectly, of 25% or more of the outstanding shares of a fund creates a presumption of control of the fund under Section 2(a)(9) of the 1940 Act. As of June 30, 20244, Charles Schwab and Co. Inc. and National Financial Services, LLC were the record owners of 25.48% and 39.88% respectively of the Fund’s outstanding shares. Charles Schwab and Co. Inc. and National Financial Services, LLC may be the beneficial owner of some or all the shares or may hold the shares for the benefit of others. As a result, Charles Schwab and Co. Inc. and National Financial Services, LLC may be deemed to control the Fund.
Subsequent events after the date of the Statement of Assets and Liabilities have been evaluated through the date the financial statements were issued. Management has determined that no events or transactions occurred requiring adjustment or disclosure in the financial statements.
PROXY VOTING POLICY
Information regarding how the Fund voted proxies relating to portfolio securities for the most recent twelve month period ended June 30 as well as a description of the policies and procedures that the Fund’s use to determine how to vote proxies is available without charge, upon request, by calling 1-877-772-5838 or by referring to the Securities and Exchange Commission’s (“SEC”) website at http://www.sec.gov.
PORTFOLIO HOLDINGS
Funds file a complete schedule of portfolio holdings with the Securities and Exchange Commission (the “SEC”) for the first and third quarters of each fiscal year as an exhibit to its reports on Form N-PORT, within sixty days after the end of the period. Form N-PORT reports are available at the SEC’s website at www.sec.gov.
| INVESTMENT ADVISOR | ADMINISTRATOR |
| | |
| Altegris Advisors, L.L.C | Ultimus Fund Solutions, LLC |
| 1200 Prospect Street, Suite 400 | 225 Pictoria Dr. |
| La Jolla, CA 92037 | Cincinnati, OH 45246 |
Altegris/AACA Opportunistic Real Estate Fund
SUB-ADVISOR
American Assets Capital Advisers, LLC
11455 El Camino Realm Suite 140
San Diego, CA 92130
| | |
| | |
| | |
| | |
| | |
| | |
| | |
| | |
| | |
| | |
| | |
| | |
| | |
| | |
| | |
| | |
| | |
| | |
| | |
| | |
| | |
| | |
| | |
| | |
| | |
| | |
| | |
| | |
| | |
| | |
| | |
| | |
| | |
| | |
| | |
| | |
| | |
| | |
| | |
| | ABOUT ALTEGRIS |
| | |
| | Altegris is a pioneer in providing access to alternative sources of income and growth. |
| | |
| | With one of the leading research and investment teams focused solely on alternatives, Altegris follows a disciplined process for identifying, evaluating, selecting and monitoring investment talent across a spectrum of alternative strategies. |
| | |
| | For additional information, visit altegris.com |
800.828.5225 | WWW.ALTEGRIS.COM
Item 8. Changes in and Disagreements with Accountants for Open-End Management Investment Companies.
Not applicable
Item 9. Proxy Disclosures for Open-End Management Investment Companies.
Not applicable
Item 10. Remuneration Paid to Directors, Officers, and Others of Open-End Management Investment Companies.
Included under Item 7
Item 11. Statement Regarding Basis for Approval of Investment Advisory Contract.
Included under Item 7
Item 12. Disclosure of Proxy Voting Policies and Procedures for Closed-End Management Investment Companies.
Not applicable
Item 13. Portfolio Managers of Closed-End Management Investment Companies.
Not applicable
Item 14. Purchases of Equity Securities by Closed-End Management Investment Company and Affiliated Purchasers.
Not applicable
Item 15. Submission of Matters to a Vote of Security Holders.
None
Item 16. Controls and Procedures
(a) The registrant’s Principal Executive Officer and Principal Financial Officer have concluded that the registrant’s disclosure controls and procedures (as defined in Rule 30a-3(c) under the Act) are effective in design and operation and are sufficient to form the basis of the certifications required by Rule 30a-(2) under the Act, based on their evaluation of these disclosure controls and procedures as of a date within 90 days of this report on Form N-CSR.
(b) There were no changes in the registrant’s internal control over financial reporting (as defined in Rule 30a-3(d) under the Act) during the period covered by this report that have materially affected, or are reasonably likely to materially affect, the registrant’s internal control over financial reporting.
Item 17. Disclosure of Securities Lending Activities for Closed-End Management Investment Companies.
Not applicable
Item 18. Recovery of Erroneously Awarded Compensation.
(a) Not applicable
(b) Not applicable
Item 19. Exhibits.
(a)(1) Not applicable
(a)(2) Not applicable
(a)(3) A separate certification for each principal executive officer and principal financial officer of the registrant as required by Rule 30a-2(a) under the Act (17 CFR 270.30a-2(a)): Attached hereto.
(a)(4) Not applicable
(b) Certifications required by Rule 30a-2(b) under the Act (17 CFR 270.30a-2(b)): Attached hereto
SIGNATURES
Pursuant to the requirements of the Securities Exchange Act of 1934 and the Investment Company Act of 1940, the registrant has duly caused this report to be signed on its behalf by the undersigned, thereunto duly authorized.
Northern Lights Fund Trust
Kevin Wolf
| By | /s/ Kevin Wolf |
| Principal Executive Officer |
| Date: 9/5/2024 |
Pursuant to the requirements of the Securities Exchange Act of 1934 and the Investment Company Act of 1940, this report has been signed below by the following persons on behalf of the registrant and in the capacities and on the dates indicated.
| By | /s/ Kevin Wolf |
| Kevin Wolf |
| Principal Executive Officer |
| Date: 9/5/2024 |
| By | /s/ Jim Colantino |
| Jim Colantino |
| Principal Financial Officer |
| Date: 9/5/2024 |