united states
securities and exchange commission
washington, d.c. 20549
form n-csr
certified shareholder report of registered
management investment companies
| Investment Company Act file number | 811-21720 | |
Northern Lights Fund Trust
(Exact name of registrant as specified in charter)
| 225 Pictoria Drive, Suite 450, Cincinnati, OH | | 45246 |
| (Address of principal executive offices) | | (Zip code) |
The Corporation Trust Company
1209 Orange Street, Wilmington, DE 19801
(Name and address of agent for service)
| Registrant’s telephone number, including area code: | 631-470-2600 | |
| Date of fiscal year end: | 12/31 | |
| | | |
| Date of reporting period: | 06/30/2024 | |
Item 1. Reports to Stockholders.
(a)
TransWestern Institutional Short Duration Government Bond Fund
Semi-Annual Shareholder Report - June 30, 2024
This semi-annual shareholder report contains important information about TransWestern Institutional Short Duration Government Bond Fund for the period of January 1, 2024 to June 30, 2024. You can find additional information about the Fund at www.TranswesternFunds.com. You can also request this information by contacting us at (800) 997-0718.
What were the Fund’s costs for the last six months?
(based on a hypothetical $10,000 investment)
| Class Name | Costs of a $10,000 investment | Costs paid as a percentage of a $10,000 investment |
|---|
| Fund | $32 | 0.65% |
How did the Fund perform during the reporting period?
The fund outperformed the benchmark during the quarter. Security selection and yield curve effects were the main drivers of excess return. Securitized exposures contributed the most to performance due to an overweight position and positive issue selection. Within our allocation to Securitized Agency, issue selection contributed to outperformance. Issue selection within CMOs, Agency MBS Passthroughs, and Agency CMBS were all positive. Duration continues to be managed in line with the benchmark but duration differences along the yield curve resulted in a positive performance effect during the quarter. We are concerned about the lagged effects of the significant monetary tightening, globally. We also remain concerned about potential exogenous shocks to growth, possibly emanating out of the ongoing conflict in the Middle East, as well as the potential disruption and volatility around US and global elections.
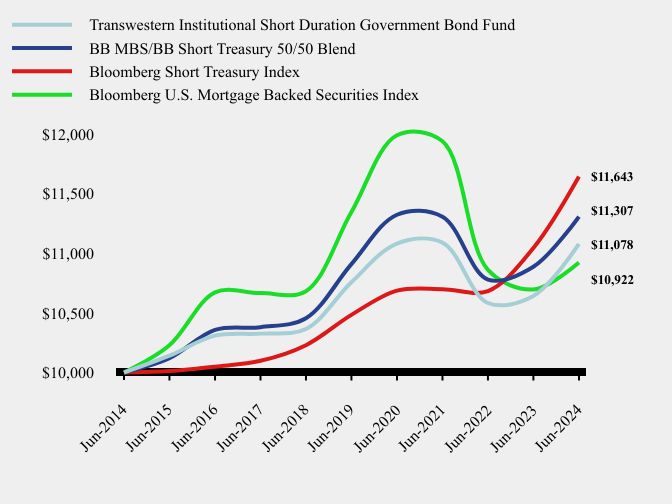
How has the Fund performed over the last ten years?
Total Return Based on $10,000 Investment
| Transwestern Institutional Short Duration Government Bond Fund | BB MBS/BB Short Treasury 50/50 Blend | Bloomberg Short Treasury Index | Bloomberg U.S. Mortgage Backed Securities Index |
|---|
| Jun-2014 | $10,000 | $10,000 | $10,000 | $10,000 |
| Jun-2015 | $10,141 | $10,120 | $10,012 | $10,228 |
| Jun-2016 | $10,309 | $10,357 | $10,049 | $10,672 |
| Jun-2017 | $10,326 | $10,380 | $10,098 | $10,666 |
| Jun-2018 | $10,365 | $10,455 | $10,229 | $10,682 |
| Jun-2019 | $10,757 | $10,909 | $10,483 | $11,346 |
| Jun-2020 | $11,081 | $11,323 | $10,687 | $11,989 |
| Jun-2021 | $11,089 | $11,306 | $10,699 | $11,939 |
| Jun-2022 | $10,583 | $10,779 | $10,683 | $10,861 |
| Jun-2023 | $10,642 | $10,887 | $11,044 | $10,696 |
| Jun-2024 | $11,078 | $11,307 | $11,643 | $10,922 |
Average Annual Total Returns
| 6 Months | 1 Year | 5 Years | 10 Years |
|---|
| Transwestern Institutional Short Duration Government Bond Fund | 1.00% | 4.10% | 0.59% | 1.03% |
| BB MBS/BB Short Treasury 50/50 Blend | 0.79% | 3.86% | 0.72% | 1.24% |
| Bloomberg Short Treasury Index | 2.54% | 5.42% | 2.12% | 1.53% |
| Bloomberg U.S. Mortgage Backed Securities Index | | 2.12% | | 0.89% |
The Fund's past performance is not a good predictor of how the Fund will perform in the future. The graph and table do not reflect the deduction of taxes that a shareholder would pay on fund distributions or redemption of fund shares.
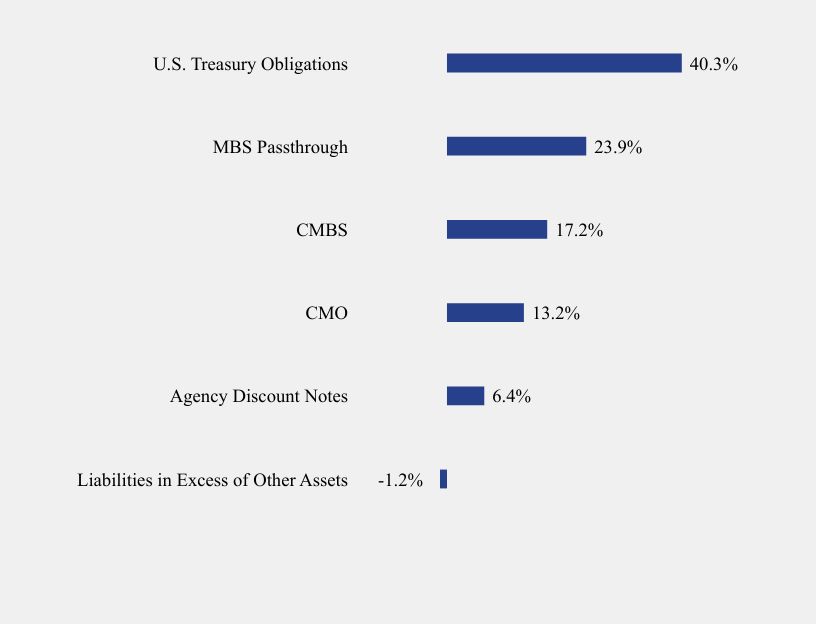
What did the Fund invest in?
Sector Weighting (% of net assets)
| Value | Value |
|---|
| Liabilities in Excess of Other Assets | -1.2% |
| Agency Discount Notes | 6.4% |
| CMO | 13.2% |
| CMBS | 17.2% |
| MBS Passthrough | 23.9% |
| U.S. Treasury Obligations | 40.3% |
| Net Assets | $84,400,717 |
| Number of Portfolio Holdings | 164 |
| Advisory Fee (net of waivers) | $103,942 |
| Portfolio Turnover | 92% |
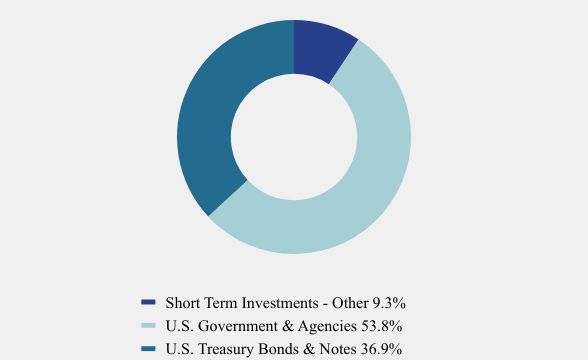
Asset Weighting (% of total investments)
| Value | Value |
|---|
| Short Term Investments - Other | 9.3% |
| U.S. Government & Agencies | 53.8% |
| U.S. Treasury Bonds & Notes | 36.9% |
No material changes occurred during the period ended June 30, 2024.
Additional information is available on the Fund's website ( www.TranswesternFunds.com ), including its:
Prospectus
Financial information
Holdings
Proxy voting information
TSR-Transwestern-TWSGX-SAR 063024
TransWestern Institutional Short Duration Government Bond Fund - Fund (TWSGX)
Semi-Annual Shareholder Report - June 30, 2024
Item 2. Code of Ethics.
Not applicable.
Item 3. Audit Committee Financial Expert.
Not applicable.
Item 4. Principal Accountant Fees and Services.
Not applicable.
Item 5. Audit Committee of Listed Registrants.
Not applicable to open-end investment companies.
Item 6. Investments.
Schedule of investments in securities of unaffiliated issuers is included under Item 7.
Item 7. Financial Statements and Financial Highlights for Open-End Management Investment Companies.

Institutional Short Duration
Government Bond Fund
TWSGX
Semi-Annual Financial Statements
June 30, 2024
| | Advised by:
TransWestern Capital Advisors, LLC
37 Bellevue Avenue
Newport, RI 02840
(303) 864-1213 |
| | |
| | Subadvised by:
Loomis, Sayles & Company, L.P. One Financial Center
Boston, MA 02111 |
Tel. (800) 997-0718
www.TransWesternFunds.com
TRANSWESTERN INSTITUTIONAL SHORT DURATION GOVERNMENT BOND FUND
SCHEDULE OF INVESTMENTS (Unaudited)
June 30, 2024
Principal
Amount ($) | | | | | Spread | | Coupon Rate
(%) | | Maturity | | Fair Value | |
| | | | | U.S. GOVERNMENT & AGENCIES — 54.5% | | | | | | | | | | |
| | | | | FEDERAL HOME LOAN MORTGAGE CORP. — 17.9%(a) | | | | | | | | | | |
| | 372,458 | | | Freddie Mac Gold Pool Series SB8031 | | | | 2.5000 | | 02/01/35 | | $ | 340,160 | |
| | 56,010 | | | Freddie Mac Gold Pool Series G08448 | | | | 5.0000 | | 05/01/41 | | | 55,504 | |
| | 500,750 | | | Freddie Mac Gold Pool Series Q18571 | | | | 3.5000 | | 05/01/43 | | | 456,722 | |
| | 297,185 | | | Freddie Mac Gold Pool Series Q20545 | | | | 3.5000 | | 07/01/43 | | | 271,427 | |
| | 97,496 | | | Freddie Mac Gold Pool Series U92432 | | | | 4.0000 | | 02/01/44 | | | 91,856 | |
| | 1,147,662 | | | Freddie Mac Multifamily Structured Pass Through Series KJ20 A2 | | | | 3.7990 | | 12/25/25 | | | 1,130,107 | |
| | 768,143 | | | Freddie Mac Multifamily Structured Pass Through Series KF60 A(b) | | SOFR30A + 0.604% | | 5.9290 | | 02/25/26 | | | 769,268 | |
| | 1,420,810 | | | Freddie Mac Multifamily Structured Pass Through Series KJ21 A2 | | | | 3.7000 | | 09/25/26 | | | 1,385,745 | |
| | 973,696 | | | Freddie Mac Multifamily Structured Pass Through Series KF72 A(b) | | SOFR30A + 0.614% | | 5.9390 | | 11/25/26 | | | 973,129 | |
| | 954,327 | | | Freddie Mac Multifamily Structured Pass Through Series KF77 AL(b) | | SOFR30A + 0.814% | | 6.1390 | | 02/25/27 | | | 957,895 | |
| | 559,222 | | | Freddie Mac Multifamily Structured Pass Through Series KF82 AS(b) | | SOFR30A + 0.420% | | 5.7440 | | 06/25/30 | | | 557,671 | |
| | 838,834 | | | Freddie Mac Multifamily Structured Pass Through Series KF82 AL(b) | | SOFR30A + 0.484% | | 5.8090 | | 06/25/30 | | | 839,626 | |
| | 779,828 | | | Freddie Mac Multifamily Structured Pass Through Series KF80 AS(b) | | SOFR30A + 0.510% | | 5.8340 | | 06/25/30 | | | 780,020 | |
| | 2,580,000 | | | Freddie Mac Multifamily Structured Pass Through Series KJ42 A2 | | | | 4.1180 | | 11/25/32 | | | 2,449,333 | |
| | 135,483 | | | Freddie Mac Multifamily Structured Pass Through Series Q008 A(b) | | SOFR30A + 0.504% | | 5.8290 | | 10/25/45 | | | 135,201 | |
| | 1,288,850 | | | Freddie Mac Multifamily Structured Pass Through Series Q016 APT1(c) | | | | 1.2420 | | 05/25/51 | | | 1,207,151 | |
| | 225,619 | | | Freddie Mac Non Gold Pool Series 780722(b) | | H15T1Y + 2.220% | | 6.2200 | | 08/01/33 | | | 229,049 | |
| | 52,663 | | | Freddie Mac Non Gold Pool Series 972132(b) | | H15T1Y + 2.225% | | 6.3500 | | 11/01/33 | | | 53,953 | |
| | 73,387 | | | Freddie Mac Non Gold Pool Series 1B2025(b) | | RFUCCT1Y + 1.862% | | 6.5560 | | 06/01/34 | | | 75,356 | |
| | 62,171 | | | Freddie Mac Non Gold Pool Series 1Q0160(b) | | RFUCCT1Y + 1.765% | | 6.0150 | | 09/01/35 | | | 62,853 | |
| | 109,057 | | | Freddie Mac Non Gold Pool Series 1L1358(b) | | H15T1Y + 2.500% | | 6.7870 | | 05/01/36 | | | 112,586 | |
| | 279,999 | | | Freddie Mac Non Gold Pool Series 848690(b) | | H15T1Y + 2.250% | | 6.3770 | | 03/01/37 | | | 287,859 | |
| | 20,050 | | | Freddie Mac Non Gold Pool Series 848565(b) | | RFUCCT1Y + 1.750% | | 6.0610 | | 12/01/37 | | | 20,207 | |
| | 702,031 | | | Freddie Mac Non Gold Pool Series 848949(b) | | H15T1Y + 2.248% | | 6.2710 | | 09/01/38 | | | 718,575 | |
| | 36,409 | | | Freddie Mac Non Gold Pool Series 848568(b) | | H15T1Y + 2.207% | | 6.3520 | | 09/01/38 | | | 36,941 | |
| | 53,023 | | | Freddie Mac Non Gold Pool Series 1Q1302(b) | | RFUCCT1Y + 1.703% | | 5.9920 | | 11/01/38 | | | 53,193 | |
| | 18,659 | | | Freddie Mac Non Gold Pool Series 1Q0647(b) | | RFUCCT1Y + 1.776% | | 6.8170 | | 11/01/38 | | | 18,708 | |
| | 187,669 | | | Freddie Mac Non Gold Pool Series 849046(b) | | RFUCCT1Y + 1.896% | | 7.2570 | | 09/01/41 | | | 188,801 | |
| | 1,747 | | | Freddie Mac REMICS Series 2903 Z(d) | | | | 5.0000 | | 12/15/24 | | | 1,689 | |
| | 5,591 | | | Freddie Mac REMICS Series 3104 DH(d) | | | | 5.0000 | | 01/15/26 | | | 5,382 | |
| | 26,680 | | | Freddie Mac REMICS Series 2102 PE(d) | | | | 6.5000 | | 12/15/28 | | | 26,135 | |
See accompanying notes to financial statements.
TRANSWESTERN INSTITUTIONAL SHORT DURATION GOVERNMENT BOND FUND
SCHEDULE OF INVESTMENTS (Unaudited) (Continued)
June 30, 2024
Principal
Amount ($) | | | | | Spread | | Coupon Rate
(%) | | Maturity | | Fair Value | |
| | | | | U.S. GOVERNMENT & AGENCIES — 54.5% (Continued) | | | | | | | | | | |
| | | | | FEDERAL HOME LOAN MORTGAGE CORP. — 17.9%(a) (Continued) | | | | | | | | | | |
| | 18,415 | | | Freddie Mac REMICS Series 2131 ZB(d) | | | | 6.0000 | | 03/15/29 | | $ | 17,595 | |
| | 9,804 | | | Freddie Mac REMICS Series 2412 OF(b),(d) | | SOFR30A + 1.064% | | 6.3980 | | 12/15/31 | | | 9,615 | |
| | 4,844 | | | Freddie Mac REMICS Series 2450 FW(b),(d) | | SOFR30A + 0.614% | | 5.9480 | | 03/15/32 | | | 4,685 | |
| | 18,881 | | | Freddie Mac REMICS Series 2448 FV(b),(d) | | SOFR30A + 1.114% | | 6.4480 | | 03/15/32 | | | 18,479 | |
| | 28,099 | | | Freddie Mac REMICS Series 2581 FD(b),(d) | | SOFR30A + 0.864% | | 6.1980 | | 12/15/32 | | | 27,314 | |
| | 9,911 | | | Freddie Mac REMICS Series 2557 WF(b),(d) | | SOFR30A + 0.514% | | 5.8480 | | 01/15/33 | | | 9,560 | |
| | 26,510 | | | Freddie Mac REMICS Series 2768 PW(d) | | | | 4.2500 | | 03/15/34 | | | 24,897 | |
| | 137,046 | | | Freddie Mac REMICS Series 2978 JG(d) | | | | 5.5000 | | 05/15/35 | | | 138,087 | |
| | 211,559 | | | Freddie Mac REMICS Series 3036 NE(d) | | | | 5.0000 | | 09/15/35 | | | 209,792 | |
| | 107,592 | | | Freddie Mac REMICS Series 3620 AT(b),(d) | | | | 4.0350 | | 12/15/36 | | | 105,191 | |
| | 112,845 | | | Freddie Mac REMICS Series 3412 AY(d) | | | | 5.5000 | | 02/15/38 | | | 114,622 | |
| | 101,965 | | | Freddie Mac REMICS Series 3561 W(c),(d) | | | | 2.5650 | | 06/15/48 | | | 93,159 | |
| | | | | | | | | | | | | | 15,065,098 | |
| | | | | FEDERAL NATIONAL MORTGAGE ASSOCIATION — 24.3%(a) | | | | | | | | | | |
| | 201 | | | Fannie Mae Pool Series 303212(b) | | RFUCCT6M + 2.170% | | 6.4200 | | 02/01/25 | | | 201 | |
| | 2,040,000 | | | Fannie Mae Pool Series BL0481 | | | | 3.5800 | | 01/01/26 | | | 1,988,102 | |
| | 13,298 | | | Fannie Mae Pool Series 684842(b) | | H15T1Y + 2.438% | | 5.2720 | | 01/01/30 | | | 13,081 | |
| | 17,163 | | | Fannie Mae Pool Series 642012(b) | | H15T1Y + 2.265% | | 7.1400 | | 05/01/32 | | | 17,327 | |
| | 95,584 | | | Fannie Mae Pool Series 555375 | | | | 6.0000 | | 04/01/33 | | | 96,979 | |
| | 47,445 | | | Fannie Mae Pool Series 699985(b) | | H15T1Y + 2.212% | | 7.0860 | | 04/01/33 | | | 48,160 | |
| | 34,955 | | | Fannie Mae Pool Series 721424(b) | | H15T1Y + 2.287% | | 6.0370 | | 06/01/33 | | | 35,635 | |
| | 19,296 | | | Fannie Mae Pool Series 725052(b) | | H15T1Y + 2.166% | | 5.2910 | | 07/01/33 | | | 19,191 | |
| | 14,593 | | | Fannie Mae Pool Series 732087(b) | | H15T1Y + 2.440% | | 6.2660 | | 08/01/33 | | | 14,937 | |
| | 293,419 | | | Fannie Mae Pool Series AD0541(b) | | H15T1Y + 2.185% | | 6.2190 | | 11/01/33 | | | 298,758 | |
| | 7,042 | | | Fannie Mae Pool Series 783245(b) | | 12MTA + 1.200% | | 6.3140 | | 04/01/34 | | | 6,911 | |
| | 18,816 | | | Fannie Mae Pool Series 725392(b) | | H15T1Y + 2.195% | | 6.5230 | | 04/01/34 | | | 19,063 | |
| | 262,416 | | | Fannie Mae Pool Series AL1270(b) | | H15T1Y + 2.216% | | 6.5160 | | 10/01/34 | | | 270,011 | |
| | 38,892 | | | Fannie Mae Pool Series 813844(b) | | RFUCCT6M + 1.552% | | 7.3440 | | 01/01/35 | | | 39,444 | |
| | 12,836 | | | Fannie Mae Pool Series 995552(b) | | H15T1Y + 2.189% | | 6.5350 | | 05/01/35 | | | 13,038 | |
| | 42,599 | | | Fannie Mae Pool Series 735667 | | | | 5.0000 | | 07/01/35 | | | 42,109 | |
| | 101,988 | | | Fannie Mae Pool Series 889822(b) | | RFUCCT1Y + 1.555% | | 6.0480 | | 07/01/35 | | | 103,802 | |
| | 51,607 | | | Fannie Mae Pool Series AL0361(b) | | H15T1Y + 2.223% | | 6.1440 | | 07/01/35 | | | 52,598 | |
See accompanying notes to financial statements.
TRANSWESTERN INSTITUTIONAL SHORT DURATION GOVERNMENT BOND FUND
SCHEDULE OF INVESTMENTS (Unaudited) (Continued)
June 30, 2024
Principal
Amount ($) | | | | | Spread | | Coupon Rate
(%) | | Maturity | | Fair Value | |
| | | | | U.S. GOVERNMENT & AGENCIES — 54.5% (Continued) | | | | | | | | | | |
| | | | | FEDERAL NATIONAL MORTGAGE ASSOCIATION — 24.3%(a) (Continued) | | | | | | | | | | |
| | 18,362 | | | Fannie Mae Pool Series 995269(b) | | RFUCCT6M + 1.544% | | 7.2310 | | 07/01/35 | | $ | 18,626 | |
| | 71,189 | | | Fannie Mae Pool Series 838948(b) | | RFUCCT6M + 1.510% | | 7.3160 | | 08/01/35 | | | 71,883 | |
| | 7,444 | | | Fannie Mae Pool Series 844532(b) | | 12MTA + 1.717% | | 6.8380 | | 11/01/35 | | | 7,363 | |
| | 170,977 | | | Fannie Mae Pool Series 813637(b) | | H15T1Y + 2.185% | | 6.3100 | | 01/01/36 | | | 173,383 | |
| | 30,632 | | | Fannie Mae Pool Series 863729(b) | | H15T1Y + 2.268% | | 6.3930 | | 01/01/36 | | | 31,158 | |
| | 107,855 | | | Fannie Mae Pool Series 846749(b) | | RFUCCT6M + 2.428% | | 6.6780 | | 01/01/36 | | | 108,369 | |
| | 77,245 | | | Fannie Mae Pool Series 880373(b) | | RFUCCT1Y + 1.537% | | 5.7900 | | 02/01/36 | | | 79,210 | |
| | 9,603 | | | Fannie Mae Pool Series 880366(b) | | RFUCCT6M + 1.430% | | 7.0830 | | 02/01/36 | | | 9,640 | |
| | 112,714 | | | Fannie Mae Pool Series 920847(b) | | H15T1Y + 2.500% | | 6.7930 | | 08/01/36 | | | 117,021 | |
| | 17,973 | | | Fannie Mae Pool Series 886376(b) | | 12MTA + 2.354% | | 7.5250 | | 08/01/36 | | | 18,577 | |
| | 978 | | | Fannie Mae Pool Series 879683(b) | | H15T1Y + 2.145% | | 5.9340 | | 09/01/36 | | | 985 | |
| | 10,710 | | | Fannie Mae Pool Series 995949(b) | | 12MTA + 2.366% | | 7.5110 | | 09/01/36 | | | 10,888 | |
| | 134,489 | | | Fannie Mae Pool Series 900197(b) | | RFUCCT1Y + 2.075% | | 6.3250 | | 10/01/36 | | | 137,237 | |
| | 35,912 | | | Fannie Mae Pool Series 995008(b) | | 12MTA + 2.178% | | 7.3150 | | 10/01/36 | | | 36,708 | |
| | 41,118 | | | Fannie Mae Pool Series AE0870(b) | | RFUCCT1Y + 1.671% | | 6.2560 | | 11/01/36 | | | 41,651 | |
| | 147,584 | | | Fannie Mae Pool Series 889819(b) | | RFUCCT1Y + 1.550% | | 6.1610 | | 04/01/37 | | | 151,078 | |
| | 17,925 | | | Fannie Mae Pool Series 748848(b) | | H15T1Y + 2.270% | | 6.0200 | | 06/01/37 | | | 18,291 | |
| | 59,367 | | | Fannie Mae Pool Series AB5688 | | | | 3.5000 | | 07/01/37 | | | 54,507 | |
| | 34,792 | | | Fannie Mae Pool Series AL0920 | | | | 5.0000 | | 07/01/37 | | | 34,392 | |
| | 1,310 | | | Fannie Mae Pool Series 899633 | | | | 5.5000 | | 07/01/37 | | | 1,309 | |
| | 31,132 | | | Fannie Mae Pool Series 888628(b) | | RFUCCT1Y + 1.828% | | 6.1940 | | 07/01/37 | | | 31,163 | |
| | 73,342 | | | Fannie Mae Pool Series AD0959(b) | | RFUCCT6M + 2.062% | | 6.8310 | | 07/01/37 | | | 74,687 | |
| | 121,599 | | | Fannie Mae Pool Series AL1288(b) | | RFUCCT1Y + 1.584% | | 5.8380 | | 09/01/37 | | | 122,333 | |
| | 8,284 | | | Fannie Mae Pool Series AL0883(b) | | RFUCCT1Y + 1.357% | | 5.6280 | | 01/01/38 | | | 8,293 | |
| | 69,347 | | | Fannie Mae Pool Series 964760(b) | | RFUCCT1Y + 1.616% | | 5.8660 | | 08/01/38 | | | 69,524 | |
| | 3,774 | | | Fannie Mae Pool Series 725320(b) | | H15T1Y + 2.249% | | 6.6740 | | 08/01/39 | | | 3,839 | |
| | 41,253 | | | Fannie Mae Pool Series AC2472 | | | | 5.0000 | | 06/01/40 | | | 40,510 | |
| | 1,683,642 | | | Fannie Mae Pool Series BM1078(b) | | H15T1Y + 2.175% | | 6.3750 | | 12/01/40 | | | 1,730,320 | |
See accompanying notes to financial statements.
TRANSWESTERN INSTITUTIONAL SHORT DURATION GOVERNMENT BOND FUND
SCHEDULE OF INVESTMENTS (Unaudited) (Continued)
June 30, 2024
Principal
Amount ($) | | | | | Spread | | Coupon Rate
(%) | | Maturity | | Fair Value | |
| | | | | U.S. GOVERNMENT & AGENCIES — 54.5% (Continued) | | | | | | | | | | |
| | | | | FEDERAL NATIONAL MORTGAGE ASSOCIATION — 24.3%(a) (Continued) | | | | | | | | | | |
| | 5,399 | | | Fannie Mae Pool Series AL2559(b) | | RFUCCT1Y + 1.809% | | 6.9370 | | 07/01/41 | | $ | 5,456 | |
| | 268,562 | | | Fannie Mae Pool Series AJ0875(b) | | RFUCCT1Y + 1.800% | | 6.0500 | | 10/01/41 | | | 276,341 | |
| | 357,678 | | | Fannie Mae Pool Series AO4163 | | | | 3.5000 | | 06/01/42 | | | 328,340 | |
| | 210,926 | | | Fannie Mae Pool Series AB5519 | | | | 3.5000 | | 07/01/42 | | | 193,627 | |
| | 1,907,050 | | | Fannie Mae Pool Series AO8169 | | | | 3.5000 | | 09/01/42 | | | 1,750,602 | |
| | 285,885 | | | Fannie Mae Pool Series AB7016 | | | | 4.0000 | | 11/01/42 | | | 268,926 | |
| | 513,584 | | | Fannie Mae Pool Series AQ6238 | | | | 3.5000 | | 12/01/42 | | | 471,456 | |
| | 357,749 | | | Fannie Mae Pool Series AQ9715 | | | | 3.0000 | | 01/01/43 | | | 318,126 | |
| | 377,944 | | | Fannie Mae Pool Series MA1404 | | | | 3.5000 | | 04/01/43 | | | 346,931 | |
| | 112,601 | | | Fannie Mae Pool Series AB9096 | | | | 4.0000 | | 04/01/43 | | | 105,951 | |
| | 21,375 | | | Fannie Mae Pool Series 803338(b) | | 12MTA + 1.200% | | 6.3140 | | 09/01/44 | | | 21,347 | |
| | 211,031 | | | Fannie Mae Pool Series MA3536 | | | | 4.0000 | | 12/01/48 | | | 196,157 | |
| | 2,995,668 | | | Fannie Mae Pool Series CB2846 | | | | 2.0000 | | 02/01/52 | | | 2,360,340 | |
| | 2,844,785 | | | Fannie Mae Pool Series MA4562 | | | | 2.0000 | | 03/01/52 | | | 2,239,715 | |
| | 1 | | | Fannie Mae REMICS Series 1999-57 FC(b),(d) | | SOFR30A + 0.364% | | 5.6980 | | 11/17/29 | | | 1 | |
| | 49,402 | | | Fannie Mae REMICS Series 2000-45 FD(b),(d) | | SOFR30A + 0.664% | | 5.9980 | | 12/18/30 | | | 47,920 | |
| | 33,885 | | | Fannie Mae REMICS Series 2000-45 FG(b),(d) | | SOFR30A + 0.664% | | 5.9980 | | 12/18/30 | | | 32,869 | |
| | 29,890 | | | Fannie Mae REMICS Series 2002-30 FB(b),(d) | | SOFR30A + 1.114% | | 6.4500 | | 08/25/31 | | | 29,222 | |
| | 15,569 | | | Fannie Mae REMICS Series 2002-16 VF(b),(d) | | SOFR30A + 0.664% | | 6.0000 | | 04/25/32 | | | 14,789 | |
| | 6,369 | | | Fannie Mae REMICS Series 2002-71 AP(d) | | | | 5.0000 | | 11/25/32 | | | 6,030 | |
| | 1,658 | | | Fannie Mae REMICS Series 2003-35 FG(b),(d) | | SOFR30A + 0.414% | | 5.7500 | | 05/25/33 | | | 1,597 | |
| | 22,523 | | | Fannie Mae REMICS Series 2005-29 WQ(d) | | | | 5.5000 | | 04/25/35 | | | 22,695 | |
| | 72,468 | | | Fannie Mae REMICS Series 2009-50 PT(c),(d) | | | | 5.6310 | | 05/25/37 | | | 70,816 | |
| | 62,826 | | | Fannie Mae REMICS Series 2008-86 LA(c),(d) | | | | 3.5050 | | 08/25/38 | | | 60,199 | |
| | 278,370 | | | Fannie Mae REMICS Series 2010-60 HB(d) | | | | 5.0000 | | 06/25/40 | | | 275,486 | |
| | 81,312 | | | Fannie Mae REMICS Series 2013-63 YF(b),(d) | | SOFR30A + 1.114% | | 5.0000 | | 06/25/43 | | | 72,129 | |
| | 1,297,529 | | | Fannie Mae REMICS Series 2020-35 FA(b),(d) | | SOFR30A + 0.614% | | 5.9430 | | 06/25/50 | | | 1,278,093 | |
| | 1,464,997 | | | Fannie Mae-Aces Series 2017-M3 A2(c) | | | | 2.5470 | | 12/25/26 | | | 1,381,889 | |
| | 2,180,087 | | | Fannie Mae-Aces Series 2017-M14 A2(c) | | | | 2.9060 | | 11/25/27 | | | 2,045,265 | |
| | | | | | | | | | | | | | 20,504,607 | |
| | | | | GOVERNMENT NATIONAL MORTGAGE ASSOCIATION — 12.3% | | | | | | | | | | |
| | 18,951 | | | Ginnie Mae II Pool Series 891616(b) | | H15T1Y + 1.400% | | 6.4100 | | 06/20/58 | | | 19,065 | |
| | 1,141 | | | Ginnie Mae II Pool Series 751387(c) | | | | 4.7420 | | 01/20/61 | | | 1,123 | |
See accompanying notes to financial statements.
TRANSWESTERN INSTITUTIONAL SHORT DURATION GOVERNMENT BOND FUND
SCHEDULE OF INVESTMENTS (Unaudited) (Continued)
June 30, 2024
Principal
Amount ($) | | | | | Spread | | Coupon Rate
(%) | | Maturity | | Fair Value | |
| | | | | U.S. GOVERNMENT & AGENCIES — 54.5% (Continued) | | | | | | | | | | |
| | | | | GOVERNMENT NATIONAL MORTGAGE ASSOCIATION — 12.3% (Continued) | | | | | | | | | | |
| | 13,965 | | | Ginnie Mae II Pool Series 710065(c) | | | | 4.8100 | | 02/20/61 | | $ | 13,650 | |
| | 15,395 | | | Ginnie Mae II Pool Series 894704(b) | | H15T1Y + 0.870% | | 5.7860 | | 10/20/61 | | | 15,375 | |
| | 1,338 | | | Ginnie Mae II Pool Series 773437(c) | | | | 4.4850 | | 02/20/62 | | | 1,280 | |
| | 3,470 | | | Ginnie Mae II Pool Series 759745(c) | | | | 4.8150 | | 05/20/62 | | | 3,392 | |
| | 140,340 | | | Ginnie Mae II Pool Series 897906(b) | | H15T1Y + 0.886% | | 5.8690 | | 06/20/62 | | | 140,295 | |
| | 197,161 | | | Ginnie Mae II Pool Series 896363(b) | | H15T1Y + 0.682% | | 5.6870 | | 07/20/62 | | | 196,710 | |
| | 1,274 | | | Ginnie Mae II Pool Series 766556(c) | | | | 4.7550 | | 08/20/62 | | | 1,239 | |
| | 6,612 | | | Ginnie Mae II Pool Series 777432(c) | | | | 4.5990 | | 10/20/62 | | | 6,494 | |
| | 84,384 | | | Ginnie Mae II Pool Series 899072(b) | | RFUCCT1M + 2.084% | | 7.5180 | | 10/20/62 | | | 86,948 | |
| | 4,032 | | | Ginnie Mae II Pool Series 765229(c) | | | | 4.5530 | | 11/20/62 | | | 3,865 | |
| | 424,472 | | | Ginnie Mae II Pool Series 899633(b) | | RFUCCT1M + 1.860% | | 7.2700 | | 01/20/63 | | | 434,366 | |
| | 90,822 | | | Ginnie Mae II Pool Series 898433(b) | | RFUCCT1M + 2.131% | | 7.5640 | | 01/20/63 | | | 92,217 | |
| | 280,009 | | | Ginnie Mae II Pool Series 899650(b) | | RFUCCT1M + 1.890% | | 7.3240 | | 02/20/63 | | | 285,658 | |
| | 281,280 | | | Ginnie Mae II Pool Series 899765(b) | | RFUCCT1M + 1.944% | | 7.3720 | | 02/20/63 | | | 286,355 | |
| | 71,355 | | | Ginnie Mae II Pool Series 898436(b) | | RFUCCT1M + 2.259% | | 7.5700 | | 02/20/63 | | | 72,840 | |
| | 133,498 | | | Ginnie Mae II Pool Series 899651(b) | | RFUCCT1M + 2.309% | | 7.7450 | | 02/20/63 | | | 136,349 | |
| | 13,282 | | | Ginnie Mae II Pool Series AE9606(b) | | H15T1Y + 1.140% | | 6.1500 | | 08/20/64 | | | 13,328 | |
| | 3,420 | | | Ginnie Mae II Pool Series AG8190(b) | | H15T1Y + 1.140% | | 6.1450 | | 09/20/64 | | | 3,423 | |
| | 11,421 | | | Ginnie Mae II Pool Series AG8209(b) | | H15T1Y + 0.910% | | 5.8820 | | 10/20/64 | | | 11,404 | |
| | 7,112 | | | Ginnie Mae II Pool Series AG8275(b) | | H15T1Y + 1.140% | | 6.1470 | | 03/20/65 | | | 7,117 | |
| | 34,348 | | | Government National Mortgage Association Series 2003-72 Z(c) | | | | 5.4200 | | 11/16/45 | | | 33,975 | |
| | 591,241 | | | Government National Mortgage Association Series 2014-H12 HZ(c),(d) | | | | 4.5070 | | 06/20/64 | | | 574,720 | |
| | 694 | | | Government National Mortgage Association Series 2015-H09 HA(d) | | | | 1.7500 | | 03/20/65 | | | 622 | |
| | 2,008,783 | | | Government National Mortgage Association Series 2018-H16 FA(b),(d) | | TSFR1M + .534% | | 5.8570 | | 09/20/68 | | | 1,988,957 | |
| | 2,515,931 | | | Government National Mortgage Association Series 2020-H04 FP(b),(d) | | TSFR1M + 0.614% | | 5.9370 | | 06/20/69 | | | 2,512,697 | |
| | 3,441,681 | | | Government National Mortgage Association Series 2020-H02 FG(b),(d) | | TSFR1M + 0.714% | | 6.0370 | | 01/20/70 | | | 3,443,296 | |
| | | | | | | | | | | | | | 10,386,760 | |
| | | | | TOTAL U.S. GOVERNMENT & AGENCIES (Cost $47,848,954) | | | | | | | | | 45,956,465 | |
See accompanying notes to financial statements.
TRANSWESTERN INSTITUTIONAL SHORT DURATION GOVERNMENT BOND FUND
SCHEDULE OF INVESTMENTS (Unaudited) (Continued)
June 30, 2024
Principal
Amount ($) | | | | | Spread | | Coupon Rate
(%) | | Maturity | | Fair Value | |
| | | | | U.S. TREASURY NOTES — 37.3% | | | | | | | | | | |
| | 4,410,000 | | | United States Treasury Note | | | | 5.0000 | | 08/31/25 | | $ | 4,407,158 | |
| | 525,000 | | | United States Treasury Note | | | | 4.2500 | | 01/31/26 | | | 520,037 | |
| | 495,000 | | | United States Treasury Note | | | | 4.5000 | | 03/31/26 | | | 492,467 | |
| | 4,585,000 | | | United States Treasury Note | | | | 4.8750 | | 05/31/26 | | | 4,594,493 | |
| | 1,000,000 | | | United States Treasury Note | | | | 4.1250 | | 06/15/26 | | | 988,672 | |
| | 815,000 | | | United States Treasury Note | | | | 4.6250 | | 11/15/26 | | | 814,841 | |
| | 2,250,000 | | | United States Treasury Note | | | | 3.6250 | | 03/31/28 | | | 2,188,257 | |
| | 4,090,000 | | | United States Treasury Note | | | | 4.1250 | | 07/31/28 | | | 4,049,180 | |
| | 2,520,000 | | | United States Treasury Note | | | | 4.0000 | | 01/31/29 | | | 2,483,184 | |
| | 210,000 | | | United States Treasury Note | | | | 4.1250 | | 03/31/29 | | | 208,019 | |
| | 620,000 | | | United States Treasury Note | | | | 4.2500 | | 06/30/29 | | | 617,796 | |
| | 5,200,000 | | | United States Treasury Note | | | | 4.1250 | | 11/15/32 | | | 5,122,000 | |
| | 235,000 | | | United States Treasury Note | | | | 3.5000 | | 02/15/33 | | | 220,689 | |
| | 2,940,000 | | | United States Treasury Note | | | | 3.8750 | | 08/15/33 | | | 2,834,975 | |
| | 2,025,000 | | | United States Treasury Note | | | | 4.0000 | | 02/15/34 | | | 1,970,420 | |
| | | | | TOTAL U.S. TREASURY NOTES (Cost $31,805,051) | | | | | | | | | 31,512,188 | |
| | | | | | | | | | | | | | | |
| | | | | SHORT-TERM INVESTMENTS — 9.4% | | | | | | | | | | |
| | | | | AGENCY DISCOUNT NOTES — 6.4% | | | | | | | | | | |
| | 1,950,000 | | | Federal Home Loan Bank Discount Notes | | | | - | | 07/01/24 | | | 1,950,000 | |
| | 3,430,000 | | | Federal Home Loan Bank Discount Notes | | | | 4.7600 | | 07/10/24 | | | 3,425,531 | |
| | | | | | | | | | | | | | 5,375,531 | |
| | | | | U.S. TREASURY BILLS — 3.0% | | | | | | | | | | |
| | 2,555,000 | | | United States Treasury Bill Series(e) | | | | 5.2300 | | 08/22/24 | | | 2,535,736 | |
| | | | | | | | | | | | | | | |
| | | | | TOTAL SHORT-TERM INVESTMENTS (Cost $7,911,199) | | | | | | | | | 7,911,267 | |
See accompanying notes to financial statements.
TRANSWESTERN INSTITUTIONAL SHORT DURATION GOVERNMENT BOND FUND
SCHEDULE OF INVESTMENTS (Unaudited) (Continued)
June 30, 2024
Principal
Amount ($) | | | | | | | | | | | Fair Value | |
| | | | | TOTAL INVESTMENTS - 101.2% (Cost $87,565,204) | | | | | | | | $ | 85,379,920 | |
| | | | | LIABILITIES IN EXCESS OF OTHER ASSETS - (1.2)% | | | | | | | | | (979,203 | ) |
| | | | | NET ASSETS - 100.0% | | | | | | | | $ | 84,400,717 | |
| REMIC | - Real Estate Mortgage Investment Conduit |
| | |
| 12MTA | Federal Reserve US 12 Month Cumulative Avg 1 Year CMT |
| H15T1Y | US Treasury Yield Curve Rate T Note Constant Maturity 1 Year |
| RFUCCT1M | RFUCCT1M |
| RFUCCT1Y | RFUCCT1Y |
| RFUCCT6M | RFUCCT6M |
| SOFR30A | United States 30 Day Average SOFR Secured Overnight Financing Rate |
| TSFR1M | TSFR1M |
| (a) | Issuer operates under a Congressional charter; its securities are neither issued nor guaranteed by the U.S. government. The Federal National Mortgage Association and the Federal Home Loan Mortgage Corporation currently operate under a federal conservatorship. |
| (b) | Variable rate security; the rate shown represents the rate on June 30, 2024. |
| (c) | Variable or floating rate security, the interest rate of which adjusts periodically based on changes in current interest rates and prepayments on the underlying pool of assets. |
| (d) | Collateralized mortgage obligation (CMO). |
See accompanying notes which are an integral part of these financial statements.
See accompanying notes to financial statements.
TransWestern Institutional Short Duration Government Bond Fund
STATEMENT OF ASSETS AND LIABILITIES (Unaudited)
June 30, 2024
| ASSETS | | | | |
| Investment securities: | | | | |
| At cost | | $ | 87,565,204 | |
| At value | | $ | 85,379,920 | |
| Cash | | | 483,935 | |
| Receivable for securities sold | | | 1,956,199 | |
| Principal paydown receivable | | | 39,092 | |
| Interest receivable | | | 503,698 | |
| Prepaid expenses and other assets | | | 15,328 | |
| TOTAL ASSETS | | | 88,378,172 | |
| | | | | |
| LIABILITIES | | | | |
| Payable for investments purchased | | | 3,915,354 | |
| Distributions payable | | | 30,619 | |
| Investment advisory fees payable | | | 17,440 | |
| Distribution (12b-1) fees payable | | | 6,895 | |
| Accrued expenses and other liabilities | | | 7,147 | |
| TOTAL LIABILITIES | | | 3,977,455 | |
| | | | | |
| NET ASSETS | | $ | 84,400,717 | |
| | | | | |
| Net Assets Consist Of: | | | | |
| Paid in capital | | | 118,155,865 | |
| Accumulated deficit | | | (33,755,148 | ) |
| NET ASSETS | | $ | 84,400,717 | |
| | | | | |
| Net Asset Value Per Share: | | | | |
| Shares of beneficial interest outstanding [$0 par value, unlimited shares authorized] | | | 9,299,018 | |
| Net asset value (Net Assets divided by Shares Outstanding), offering price and redemption price per share (a) | | $ | 9.08 | |
| (a) | Redemptions made within 30 days of purchase may be assessed a redemption fee of 0.25%. |
See accompanying notes to financial statements.
TransWestern Institutional Short Duration Government Bond Fund
STATEMENT OF OPERATIONS (Unaudited)
Six Months Ended June 30, 2024
| INVESTMENT INCOME | | | | |
| Interest | | $ | 1,781,671 | |
| | | | | |
| EXPENSES | | | | |
| Investment advisory fees | | | 186,733 | |
| Distribution (12b-1) fees | | | 41,496 | |
| Administrative services fees | | | 49,073 | |
| Compliance officer fees | | | 14,383 | |
| Transfer agent fees | | | 12,627 | |
| Custodian fees | | | 9,395 | |
| Trustees’ fees and expenses | | | 9,158 | |
| Accounting services fees | | | 9,053 | |
| Audit fees | | | 9,011 | |
| Legal fees | | | 5,429 | |
| Printing and postage expenses | | | 3,072 | |
| Insurance expense | | | 2,552 | |
| Registration fees | | | 741 | |
| Other expenses | | | 284 | |
| TOTAL EXPENSES | | | 353,007 | |
| Less: Fees waived by the Advisor | | | (82,791 | ) |
| NET EXPENSES | | | 270,216 | |
| | | | | |
| NET INVESTMENT INCOME | | | 1,511,455 | |
| | | | | |
| REALIZED AND UNREALIZED LOSS ON INVESTMENTS | | | | |
| Net realized loss from investments | | | (53,604 | ) |
| | | | | |
| Net change in unrealized appreciation/(depreciation) on investments | | | (546,254 | ) |
| | | | | |
| NET REALIZED AND UNREALIZED LOSS ON INVESTMENTS | | | (599,858 | ) |
| | | | | |
| NET INCREASE IN NET ASSETS FROM OPERATIONS | | $ | 911,597 | |
See accompanying notes to financial statements.
TransWestern Institutional Short Duration Government Bond Fund
STATEMENTS OF CHANGES IN NET ASSETS
| | | Six Months Ended
June 30,
2024
(Unaudited) | | | Year Ended
December 31,
2023 | |
| FROM OPERATIONS | | | | | | | | |
| Net investment income | | $ | 1,511,455 | | | $ | 2,839,321 | |
| Net realized loss from investments | | | (53,604 | ) | | | (767,915 | ) |
| Net change in unrealized appreciation/(depreciation) on investments | | | (546,254 | ) | | | 1,533,397 | |
| Net increase in net assets resulting from operations | | | 911,597 | | | | 3,604,803 | |
| | | | | | | | | |
| DISTRIBUTIONS TO SHAREHOLDERS FROM EARNINGS | | | | | | | | |
| Total distributions paid | | | (1,657,459 | ) | | | (3,189,379 | ) |
| Net decrease in net assets from distributions to shareholders | | | (1,657,459 | ) | | | (3,189,379 | ) |
| | | | | | | | | |
| FROM BENEFICIAL INTEREST TRANSACTIONS: | | | | | | | | |
| Proceeds from shares sold | | | - | | | | 10,000,000 | |
| Net asset value of shares issued in reinvestment of distributions to shareholders | | | 1,460,991 | | | | 2,795,384 | |
| Payments for shares redeemed | | | (94,000 | ) | | | (18,425,151 | ) |
| | | | | | | | | |
| Net increase/(decrease) in net assets from shares of beneficial interest | | | 1,366,991 | | | | (5,629,767 | ) |
| | | | | | | | | |
| TOTAL INCREASE/(DECREASE) IN NET ASSETS | | | 621,129 | | | | (5,214,343 | ) |
| | | | | | | | | |
| NET ASSETS | | | | | | | | |
| Beginning of year/period | | | 83,779,588 | | | | 88,993,931 | |
| End of year/period | | $ | 84,400,717 | | | $ | 83,779,588 | |
| | | | | | | | | |
| SHARE ACTIVITY | | | | | | | | |
| Shares sold | | | - | | | | 1,114,827 | |
| Shares reinvested | | | 161,301 | | | | 308,328 | |
| Shares redeemed | | | (10,299 | ) | | | (2,053,740 | ) |
| Net increase/(decrease) in shares of beneficial interest outstanding | | | 151,002 | | | | (630,585 | ) |
See accompanying notes to financial statements.
TransWestern Institutional Short Duration Government Bond Fund
FINANCIAL HIGHLIGHTS
Per Share Data and Ratios for a Share of Beneficial Interest Outstanding Throughout Each Year/Period
| | | Six Months Ended
June 30,
2024
(Unaudited) | | | Year Ended
December 31,
2023 | | | Year Ended
December 31,
2022 | | | Year Ended
December 31,
2021 | | | Year Ended
December 31,
2020 | | | Year Ended
December 31,
2019 | |
| Net Asset Value, Beginning of Year/Period | | $ | 9.16 | | | $ | 9.10 | | | $ | 9.72 | | | $ | 9.82 | | | $ | 9.68 | | | $ | 9.57 | |
| Income (loss) from investment operations: | | | | | | | | | | | | | | | | | | | | | | | | |
| Net investment income (1) | | | 0.16 | | | | 0.29 | | | | 0.10 | | | | 0.01 | | | | 0.03 | | | | 0.13 | |
| Net realized and unrealized gain (loss) on investments | | | (0.06 | ) | | | 0.10 | | | | (0.57 | ) | | | (0.08 | ) | | | 0.19 | | | | 0.23 | |
| Total from investment operations | | | 0.10 | | | | 0.39 | | | | (0.47 | ) | | | (0.07 | ) | | | 0.22 | | | | 0.36 | |
| | | | | | | | | | | | | | | | | | | | | | | | | |
| Less distributions from: | | | | | | | | | | | | | | | | | | | | | | | | |
| Net investment income | | | (0.18 | ) | | | (0.33 | ) | | | (0.15 | ) | | | (0.03 | ) | | | (0.08 | ) | | | (0.25 | ) |
| Total from distributions | | | (0.18 | ) | | | (0.33 | ) | | | (0.15 | ) | | | (0.03 | ) | | | (0.08 | ) | | | (0.25 | ) |
| | | | | | | | | | | | | | | | | | | | | | | | | |
| Net Asset Value, End of Year/Period | | $ | 9.08 | | | $ | 9.16 | | | $ | 9.10 | | | $ | 9.72 | | | $ | 9.82 | | | $ | 9.68 | |
| | | | | | | | | | | | | | | | | | | | | | | | | |
| Total return (2) | | | 1.11 | %(5)(7) | | | 4.40 | % | | | (4.82 | )% | | | (0.72 | )% | | | 2.24 | % | | | 3.78 | % |
| | | | | | | | | | | | | | | | | | | | | | | | | |
| Net assets, end of year/period (000s) | | $ | 84,401 | | | $ | 83,780 | | | $ | 88,994 | | | $ | 325,544 | | | $ | 397,181 | | | $ | 161,140 | |
| Ratio of gross expenses to average net assets | | | 0.85 | %(6) | | | 0.85 | % | | | 0.74 | % | | | 0.70 | % | | | 0.69 | % | | | 0.72 | % |
| Ratio of net expenses to average net assets | | | 0.65 | %(6) | | | 0.65 | % | | | 0.65 | % | | | 0.64 | %(4) | | | 0.64 | %(4) | | | 0.65 | % |
| Ratio of net investment income to average net assets | | | 3.64 | %(6) | | | 3.24 | % | | | 1.05 | % | | | 0.11 | % | | | 0.26 | % | | | 1.32 | % |
| Portfolio Turnover Rate | | | 92 | %(5) | | | 222 | % | | | 218 | %(3) | | | 317 | %(3) | | | 433 | % | | | 431 | % |
| | | | | | | | | | | | | | | | | | | | | | | | | |
| (1) | Per share amounts calculated using the average share method, which appropriately presents the per share data for the year/period. |
| (2) | Total returns shown are historical in nature and assume changes in share price, reinvestment of dividends, and capital gain distributions, if any, and exclude the effect of applicable sales loads. Had the Advisor not waived a portion of its fees, total returns would have been lower. |
| (3) | The portfolio turnover rate excludes dollar roll transactions for the years ended December 31, 2022 and December 31, 2021. If these were included in the calculation the turnover percentage would be 237%, and 320%, respectively. The fund had no dollar rolls for the years ended December 31, 2019, December 31, 2020 and December 31, 2023 or the six months ended June 30, 2024. |
| (4) | During the years ended December 31, 2021 and December 31, 2020, the Advisor voluntarily waived a portion of the advisory fee. Without this waiver, the net expense ratio would have been 0.65%. |
| (5) | Not annualized. |
| (6) | Annualized. |
| (7) | Includes adjustments made in accordance with generally accepted accounting principles. |
See accompanying notes to financial statements.
TransWestern Institutional Short Duration Government Bond Fund
NOTES TO FINANCIAL STATEMENTS (Unaudited)
June 30, 2024
1. ORGANIZATION
The TransWestern Institutional Short Duration Government Bond Fund (the “Fund”) is a separate diversified series of shares of beneficial interest of Northern Lights Fund Trust (the “Trust”). The Trust is organized under the laws of the State of Delaware, and is registered under the Investment Company Act of 1940, as amended (the "1940 Act"), as an open-end management investment company. The Fund’s investment objective is to seek to provide income consistent with liquidity, and limited credit and interest rate risk. The Fund commenced operations on January 3, 2011 and is offered at net asset value (“NAV”) without a sales charge.
2. SIGNIFICANT ACCOUNTING POLICIES
The following is a summary of significant accounting policies followed by the Fund in the preparation of its financial statements. These policies are in conformity with accounting principles generally accepted in the United States of America (“GAAP”). The preparation of financial statements in conformity with GAAP requires management to make estimates and assumptions that affect the reported amounts of assets and liabilities and disclosure of contingent assets and liabilities at the date of the financial statements and the reported amounts of increases and decreases in net assets from operations during the reporting period. Actual results could differ from those estimates. The Fund is an investment company and accordingly follows the investment company accounting and reporting guidance of the Financial Accounting Standards Board (“FASB”) Accounting Standard Codification Topic 946 “Financial Services – Investment Companies” including Accounting Standards update 2013-08.
Securities Valuation – Securities listed on an exchange are valued at the last reported sale price at the close of the regular trading session of the primary exchange on the business day the value is being determined, or in the case of securities listed on NASDAQ at the NASDAQ Official Closing Price (“NOCP”). In the absence of a sale, such securities -shall be valued at the mean between the current bid and ask prices on the day of valuation. Debt securities (other than short term obligations) are valued each day by an independent pricing service approved by the Board of Trustees of the Trust (the “Board”) based on methods which include consideration of: yields or prices of securities of comparable quality, coupon, maturity and type, indications as to values from dealers, and general market conditions or market quotations from a major market maker in the securities. The independent pricing service does not distinguish between smaller-sized bond positions known as “odd lots” and larger institutional-sized bond positions known as “round lots”. The Fund may fair value a particular bond if the advisor does not believe that the round lot value provided by the independent pricing service reflects fair value of the Fund’s holding. Short-term debt obligations, having 60 days or less remaining until maturity, at time of purchase, may be valued at amortized cost.
The Fund may hold securities, such as private investments, interests in commodity pools, other non-traded securities or temporarily illiquid securities, for which market quotations are not readily available or are determined to be unreliable. These securities are valued using the “fair value” procedures approved by the Board. The Board has designated the adviser as its valuation designee (the “Valuation Designee”) to execute these procedures. The Board may also enlist third party consultants such a valuation specialist at a public accounting firm, valuation consultant or financial officer of a security issuer on an as-needed basis to assist the Valuation Designee in determining a security-specific fair value. The Board is responsible for reviewing and approving fair value methodologies utilized by the Valuation Designee, approval of which shall be based upon whether the Valuation Designee followed the valuation procedures established by the Board.
Fair Valuation Process – The applicable investments are valued by the Valuation Designee pursuant to valuation procedures established by the Board. For example, fair value determinations are required for the following securities: (i) securities for which market quotations are insufficient or not readily available on a particular business day (including securities for which there is a short and temporary lapse in the provision of a price by the regular pricing source); (ii) securities for which, in the judgment of the Valuation Designee, the prices or values available do not represent the fair value of the instrument; factors which may cause the Valuation Designee to make such a judgment include, but are not limited to, the following: only a bid price or an asked price is available; the spread between bid and asked prices is substantial; the frequency of sales; the thinness of the market; the size of reported trades; and actions of the securities markets, such as the suspension or limitation of trading; (iii) securities determined to be illiquid; and (iv) securities with respect to which an event that affects the value thereof has occurred (a “significant event”) since the closing prices were established on the principal exchange on which they are traded, but prior to a Fund’s calculation of its net asset value. Specifically, interests in commodity pools or managed
TransWestern Institutional Short Duration Government Bond Fund
NOTES TO FINANCIAL STATEMENTS (Unaudited) (Continued)
June 30, 2024
futures pools are valued on a daily basis by reference to the closing market prices of each futures contract or other asset held by a pool, as adjusted for pool expenses. Restricted or illiquid securities, such as private investments or non-traded securities are valued based upon the current bid for the security from two or more independent dealers or other parties reasonably familiar with the facts and circumstances of the security (who should take into consideration all relevant factors as may be appropriate under the circumstances). If a current bid from such independent dealers or other independent parties is unavailable, the Valuation Designee shall determine the fair value of such security using the following factors: (i) the type of security; (ii) the cost at date of purchase; (iii) the size and nature of the Fund’s holdings; (iv) the discount from market value of unrestricted securities of the same class at the time of purchase and subsequent thereto; (v) information as to any transactions or offers with respect to the security; (vi) the nature and duration of restrictions on disposition of the security and the existence of any registration rights; (vii) how the yield of the security compares to similar securities of companies of similar or equal creditworthiness; (viii) the level of recent trades of similar or comparable securities; (ix) the liquidity characteristics of the security; (x) current market conditions; and (xi) the market value of any securities into which the security is convertible or exchangeable.
The Fund utilizes various methods to measure the fair value of its investments on a recurring basis. GAAP establishes a hierarchy that prioritizes inputs to valuation methods. The three levels of input are:
Level 1 – Unadjusted quoted prices in active markets for identical assets and liabilities that the Fund has the ability to access.
Level 2 – Observable inputs other than quoted prices included in Level 1 that are observable for the asset or liability, either directly or indirectly. These inputs may include quoted prices for the identical instrument on an inactive market, prices for similar instruments, interest rates, prepayment speeds, credit risk, yield curves, default rates and similar data.
Level 3 – Unobservable inputs for the asset or liability, to the extent relevant observable inputs are not available, representing the Fund’s own assumptions about the assumptions a market participant would use in valuing the asset or liability, and would be based on the best information available.
The availability of observable inputs can vary from security to security and is affected by a wide variety of factors, including, for example, the type of security, whether the security is new and not yet established in the marketplace, the liquidity of markets, and other characteristics particular to the security. To the extent that valuation is based on models or inputs that are less observable or unobservable in the market, the determination of fair value requires more judgment. Accordingly, the degree of judgment exercised in determining fair value is greatest for instruments categorized in Level 3.
The inputs used to measure fair value may fall into different levels of the fair value hierarchy. In such cases, for disclosure purposes, the level in the fair value hierarchy within which the fair value measurement falls in its entirety, is determined based on the lowest level input that is significant to the fair value measurement in its entirety.
The inputs or methodology used for valuing securities are not necessarily an indication of the risk associated with investing in those securities. The following tables summarize the inputs used as of June 30, 2024 for the Fund’s investments measured at fair value:
| Assets * | | Level 1 | | | Level 2 | | | Level 3 | | | Total | |
| U.S. Government & Agencies | | $ | - | | | $ | 45,956,465 | | | $ | - | | | $ | 45,956,465 | |
| U.S. Treasury Notes | | | - | | | | 31,512,188 | | | | - | | | | 31,512,188 | |
| Short-Term Investments | | | - | | | | 7,911,267 | | | | - | | | | 7,911,267 | |
| Total | | $ | - | | | $ | 85,379,920 | | | $ | - | | | $ | 85,379,920 | |
The Fund did not hold any Level 3 securities during the period.
| * | Refer to the Schedule of Investments for industry classification. |
TransWestern Institutional Short Duration Government Bond Fund
NOTES TO FINANCIAL STATEMENTS (Unaudited) (Continued)
June 30, 2024
Security Transactions and Related Income – Security transactions are accounted for on trade date. Interest income is recognized on an accrual basis. Discounts are accreted and premiums are amortized on securities purchased over the lives of the respective securities using the effective interest method. Dividend income is recorded on the ex-dividend date. Realized gains or losses from sales of securities are determined by comparing the identified cost of the security lot sold with the net sales proceeds.
Dividends and Distributions to Shareholders – Dividends from net investment income are declared daily and paid monthly. Distributable net realized capital gains, if any, are declared and distributed annually. Dividends from net investment income and distributions from net realized gains are recorded on the ex-dividend date and are determined in accordance with federal income tax regulations, which may differ from GAAP. These “book/tax” differences are considered either temporary (e.g., deferred losses, capital loss carry forwards) or permanent in nature. To the extent these differences are permanent in nature, such amounts are reclassified within the composition of net assets based on their federal tax-basis treatment; temporary differences do not require reclassification. Any such reclassifications will have no effect on net assets, results of operations, or net asset value per share of the Fund.
Federal Income Tax – It is the Fund’s policy to continue to qualify as a regulated investment company by complying with the provisions available to certain investment companies, as defined in applicable sections of the Internal Revenue Code of 1986 as amended, and to make distributions of net investment income and net realized capital gains sufficient to relieve it from all, or substantially all, federal income taxes.
The Fund recognizes the tax benefits of uncertain tax positions only where the position is “more likely than not” to be sustained assuming examination by tax authorities. Management has analyzed the Fund’s tax positions and has concluded that no liability for unrecognized tax benefits should be recorded related to uncertain tax positions taken on returns filed for open tax years ended December 31, 2020 to December 31, 2022 or expected to be taken in the Fund’s December 31, 2023 year-end tax returns. The Fund identifies its major tax jurisdictions as U.S. federal and Ohio (Nebraska in prior years), and foreign jurisdictions where the Fund makes significant investments. The Fund is not aware of any tax positions for which it is reasonably possible that the total amounts of unrecognized tax benefits will change materially in the next twelve months.
When-Issued and Delayed-Delivery Transactions – The Fund may engage in when-issued or delayed-delivery transactions. The Fund records when-issued securities on the trade date and maintains security positions such that sufficient liquid assets will be available to make payment for the securities purchased. Securities purchased on a when-issued or delayed-delivery basis are marked to market daily and begin earning interest on the settlement date. Losses may occur on these transactions due to changes in market conditions or the failure of counterparties to perform under the contract.
Dollar Roll Transactions – A mortgage dollar roll transaction involves a sale by the Fund of mortgage related securities that it holds with an agreement by the Fund to repurchase similar securities at an agreed upon price and date. The securities purchased will bear the same interest rate as those sold, but generally will be collateralized by pools of mortgages with different prepayment histories than those securities sold. The Fund accounts for mortgage dollar rolls as purchases and sales transactions. There were no dollar roll transactions during the six months ended June 30, 2024.
Short Sales – A short sale is a transaction in which the Fund sells a security it does not own but has borrowed in anticipation that the market price of that security will decline. The Fund is obligated to replace the security borrowed by purchasing it on the open market at a later date. If the price of the security sold short increases between the time of the short sale and the time the Fund replaces the borrowed security, the Fund will incur a loss. Conversely, if the price declines, the Fund will realize a gain. There were no short sales transactions during the six months ended June 30, 2024.
Indemnification – The Trust indemnifies its officers and Trustees for certain liabilities that may arise from the performance of their duties to the Trust. Additionally, in the normal course of business, the Fund enters into contracts that contain a variety of representations and warranties and which provide general indemnities. The Fund’s maximum exposure under these arrangements is unknown, as this would involve future claims that may be made against the Fund that have not yet occurred. However, based on experience, the risk of loss due to these warranties and indemnities appears to be remote.
Expenses – Expenses of the Trust that are directly identifiable to a specific fund are charged to that fund. Expenses, which are not readily identifiable to a specific fund, are allocated in such a manner as deemed equitable, taking into consideration the nature and type of expense and the relative sizes of the funds in the Trust.
TransWestern Institutional Short Duration Government Bond Fund
NOTES TO FINANCIAL STATEMENTS (Unaudited) (Continued)
June 30, 2024
Cash – The Fund considers its investment in an FDIC insured interest bearing savings account to be cash. The Fund maintains cash balances, which, at times, may exceed federally insured limits. The Fund maintains these balances with a high-quality financial institution.
3. INVESTMENT TRANSACTIONS
For the six months ended June 30, 2024, the cost of purchases and proceeds from sales of U.S. government securities, other than short-term investments, amounted to $73,158,895 and $71,819,403, respectively.
4. INVESTMENT ADVISORY AGREEMENT AND TRANSACTIONS WITH RELATED PARTIES
TransWestern Capital Advisors, LLC serves as the Fund’s investment advisor (the “Advisor”) and Loomis, Sayles & Company, L.P. serves as the Fund’s sub-advisor (the “Sub-Advisor”). Pursuant to an advisory agreement between the Advisor and the Trust, on behalf of the Fund, the Advisor, under the oversight of the Board, directs the daily operations of the Fund and supervises the performance of administrative and professional services provided by others. As compensation for its services and the related expenses borne by the Advisor, the Fund pays the Advisor a management fee, computed and accrued daily and paid monthly, at an annual rate of 0.45% of the Fund’s average daily net assets. Subject to the authority of the Board and oversight by the Advisor, the Sub-Advisor is responsible for day-to-day execution of the Fund’s strategy and management of the Fund’s investment portfolio according to the Fund’s investment objective, policies and restrictions. The Sub-Advisor is paid by the Advisor, not the Fund. During the six months ended June 30, 2024, the Fund incurred $186,733 in advisory fees.
Pursuant to an expense limitation agreement between the Advisor and the Trust, on behalf of the Fund, (the “Expense Limitation Agreement”), the Advisor has contractually agreed, at least until April 30, 2025, to waive a portion of its advisory fee and has agreed to reimburse the Fund for other expenses to the extent necessary so that the total expenses incurred by the Fund (exclusive of any front end or contingent deferred loads, brokerage fees and commissions, acquired fund fees and expenses, fees and expenses associated with instruments in other collective investment vehicles or derivative instruments (including for example options and swap fees and expenses) borrowing costs (such as interest and dividend expense on securities sold short), taxes, and extraordinary expenses, such as litigation expenses (which may include indemnification of Fund officers and Trustees, contractual indemnification of Fund service providers other than the Advisor will not exceed 0.65% per annum of the Fund’s average daily net assets. During the six months ended June 30, 2024, the Advisor waived fees of $82,791.
If the Advisor waives any fee or reimburses any expense pursuant to the expense limitation agreement, and the Fund’s operating expenses are subsequently less than 0.65% of average daily net assets, the Advisor shall be entitled to reimbursement by the Fund for such waived fees or reimbursed expenses provided that such reimbursement does not cause the Fund’s expenses to exceed 0.65% of average daily net assets. If the Fund’s operating expenses subsequently exceed 0.65% per annum of the Fund’s average daily net assets, the reimbursements shall be suspended. The Advisor may seek reimbursement only for expenses waived or paid by it during the three fiscal years prior to such reimbursement; provided, however, that such expenses may only be reimbursed to the extent they were waived or paid after the date of the Expense Limitation Agreement (or any similar agreement). As of December 31, 2023, fee waivers subject to recapture by the Advisor were as follows:
| Year of Expiration | | | |
| December 31, 2024 | | $ | 164,660 | |
| December 31, 2025 | | $ | 173,594 | |
| December 31, 2026 | | $ | 175,104 | |
As of December 31, 2023, $133,788 in previously waived fees expired unrecouped.
Effective September 30, 2020, the Advisor agreed to voluntarily waive a portion of the advisory fee to support an annualized yield. The Advisor can amend or terminate this voluntary waiver at any time. For the six months ended June 30, 2024, the Advisor voluntarily waived $0 of advisory fees. The voluntary waiver is not subject to recapture by the Advisor.
TransWestern Institutional Short Duration Government Bond Fund
NOTES TO FINANCIAL STATEMENTS (Unaudited) (Continued)
June 30, 2024
The Trust, with respect to the Fund, has adopted the Trust’s Master Distribution and Shareholder Servicing Plan (the “12b-1 Plan” or “Plan”). Pursuant to the Plan, the Fund pays the Advisor an annual fee for distribution and shareholder servicing expenses of up to 0.10% of the Fund’s average daily net assets. During the six months ended June 30, 2024, pursuant to the Plan, the Advisor received $41,496 of fees.
Pursuant to a separate servicing agreement with Ultimus Fund Solutions, LLC (“UFS”), the Fund pays UFS fees for providing administration, fund accounting and transfer agency services to the Fund. Certain officers of the Trust are also officers of UFS, and are not paid any fees directly by the Fund for serving in such capacities.
In addition, certain affiliates of UFS provide ancillary services to the Fund as follows:
Northern Lights Compliance Services, LLC (“NLCS”), an affiliate of UFS, provides a Chief Compliance Officer to the Trust, as well as related compliance services, pursuant to a consulting agreement between NLCS and the Trust. Under the terms of such agreement, NLCS receives fees from the Fund.
Blu Giant, LLC (“Blu Giant”), an affiliate of UFS, provides EDGAR conversion and filing services as well as print management services for the Fund on an ad-hoc basis. For the provision of these services, Blu Giant receives fees from the Fund.
5. REDEMPTION FEE
The Fund may assess a short-term redemption fee of 0.25% of the total redemption amount if shareholders sell their shares after holding them for less than 30 days. The redemption fee is paid directly to the Fund. For the six months ended June 30, 2024, the Fund did not assess any redemption fees.
6. AGGREGATE UNREALIZED APPRECIATION AND DEPRECIATON – TAX BASIS
The identified cost of investments in securities owned by the Fund for federal income tax purposes (including securities sold short), and its respective gross unrealized appreciation and depreciation at June 30, 2024, were as follows:
| Cost | | | Appreciation | | | Depreciation | | | Net Unrealized
Depreciation | |
| $ | 87,597,090 | | | $ | 78,428 | | | $ | (2,295,598 | ) | | $ | (2,217,170 | ) |
7. DISTRIBUTIONS TO SHAREHOLDERS AND TAX COMPONENTS OF CAPITAL
The tax character of Fund distributions paid during the years ended December 31, 2023 and December 31, 2022 was as follows:
| | | Fiscal Year Ended
December 31,
2023 |
|
| Fiscal Year Ended
December 31,
2022 |
|
| Ordinary Income | | $ | 3,189,379 | | | $ | 2,491,353 | |
| | | $ | 3,189,379 | | | $ | 2,491,353 | |
As of December 31, 2023, the components of accumulated earnings/(deficit) on a tax basis were as follows:
Undistributed
Ordinary
Income | | | Undistributed
Long-Term
Gains | | | Post October Loss and Late
Year Loss | | | Capital Loss
Carry Forwards | | | Other
Book/Tax
Differences | | | Unrealized
Depreciation | | | Total
Accumulated
Deficit | |
| $ | 29,026 | | | $ | - | | | $ | - | | | $ | (31,337,042 | ) | | $ | (30,354 | ) | | $ | (1,670,916 | ) | | $ | (33,009,286 | ) |
TransWestern Institutional Short Duration Government Bond Fund
NOTES TO FINANCIAL STATEMENTS (Unaudited) (Continued)
June 30, 2024
The difference between book basis and tax basis undistributed net investment income/(loss and other book/tax adjustments is primarily attributable to the tax deferral of losses on wash sales and adjustments for accrued dividends payable.
At December 31, 2023, the Fund had capital loss carry forwards for federal income tax purposes available to offset future capital gains as follows:
Non-Expiring
Short-Term | | | Non-Expiring
Long-Term | | | Total |
|
| $ | 10,344,151 | | | $ | 20,992,891 | | | $ | 31,337,042 | |
8. BENEFICIAL OWNERSHIP
The beneficial ownership, either directly or indirectly, of more than 25% of the voting securities of a fund creates a presumption of control of the fund, under Section 2(a)(9) of the 1940 Act. As of June 30, 2024, Crest Forest Realty Corporation held 63.45% of the voting securities of the Fund.
9. SUBSEQUENT EVENTS
Subsequent events after the date of the Statement of Assets and Liabilities have been evaluated through the date the financial statements were issued. Management has determined that no events or transactions occurred requiring adjustment or disclosure in the financial statements.
PROXY VOTING POLICY
Information regarding how the Fund voted proxies relating to portfolio securities for the most recent twelve month period ended June 30 as well as a description of the policies and procedures that the Fund uses to determine how to vote proxies is available without charge, upon request, by calling 1-855-881-2380 or by referring to the Securities and Exchange Commission’s (“SEC”) website at http://www.sec.gov.
PORTFOLIO HOLDINGS
The Fund files a complete schedule of portfolio holdings with the SEC for the first and third quarters of each fiscal year as an exhibit to its reports on Form N-PORT, within sixty days after the end of the period. Form N-PORT reports are available at the SEC’s website at www.sec.gov.
INVESTMENT ADVISOR
TransWestern Capital Advisors, LLC
37 Bellevue Avenue
Newport, RI 02840
SUB-ADVISOR
Loomis, Sayles & Company, L.P.
One Financial Center
Boston, MA 02111
ADMINISTRATOR
Ultimus Fund Solutions, LLC
225 Pictoria Drive, Suite 450
Cincinnati, OH 45246
Item 8. Changes in and Disagreements with Accountants for Open-End Management Investment Companies.
Not applicable.
Item 9. Proxy Disclosures for Open-End Management Investment Companies.
Not applicable
Item 10. Remuneration Paid to Directors, Officers, and Others of Open-End Management Investment Companies.
Included under Item 7
Item 11. Statement Regarding Basis for Approval of Investment Advisory Contract.
Not applicable
Item 12. Disclosure of Proxy Voting Policies and Procedures for Closed-End Management Investment Companies.
Not applicable
Item 13. Portfolio Managers of Closed-End Management Investment Companies.
Not applicable
Item 14. Purchases of Equity Securities by Closed-End Management Investment Company and Affiliated Purchasers.
Not applicable
Item 15. Submission of Matters to a Vote of Security Holders.
None
Item 16. Controls and Procedures
| (a) | The registrant’s Principal Executive Officer and Principal Financial Officer have concluded that the registrant’s disclosure controls and procedures (as defined in Rule 30a-3(c) under the Act) are effective in design and operation and are sufficient to form the basis of the certifications required by Rule 30a-(2) under the Act, based on their evaluation of these disclosure controls and procedures as of a date within 90 days of this report on Form N-CSR. |
| (b) | There were no changes in the registrant’s internal control over financial reporting (as defined in Rule 30a-3(d) under the Act) during the period covered by this report that have materially affected, or are reasonably likely to materially affect, the registrant’s internal control over financial reporting. |
Item 17. Disclosure of Securities Lending Activities for Closed-End Management Investment Companies.
Not applicable
Item 18. Recovery of Erroneously Awarded Compensation.
Item 19. Exhibits.
| (a)(3) | A separate certification for each principal executive officer and principal financial officer of the registrant as required by Rule 30a-2(a) under the Act (17 CFR 270.30a-2(a)): Attached hereto. |
| (b) | Certifications required by Rule 30a-2(b) under the Act (17 CFR 270.30a-2(b)): Attached hereto |
SIGNATURES
Pursuant to the requirements of the Securities Exchange Act of 1934 and the Investment Company Act of 1940, the registrant has duly caused this report to be signed on its behalf by the undersigned, thereunto duly authorized.
| (Registrant) | Northern Lights Fund Trust | |
| By (Signature and Title) | |
| | |
| /s/ Kevin E. Wolf | |
| Kevin E. Wolf, | |
| Principal Executive Officer | |
Pursuant to the requirements of the Securities Exchange Act of 1934 and the Investment Company Act of 1940, this report has been signed below by the following persons on behalf of the registrant and in the capacities and on the dates indicated.
| By (Signature and Title) | |
| | |
| /s/ Kevin E. Wolf | |
| Kevin E. Wolf, | |
| Principal Executive Officer | |
| By (Signature and Title) | |
| | |
| /s/ Jim Colantino | |
| Jim Colantino, | |
| Principal Financial Officer | |