UNITED STATES
SECURITIES AND EXCHANGE COMMISSION
WASHINGTON, D.C. 20549
FORM N-CSR
CERTIFIED SHAREHOLDER REPORT OF REGISTERED MANAGEMENT
INVESTMENT COMPANIES
| Investment Company Act file number | 811-21720 |
| Northern Lights Fund Trust |
| (Exact name of registrant as specified in charter) |
| 225 Pictoria Drive, Suite 450, Cincinnati, Ohio | 45246 |
| (Address of principal executive offices) | (Zip code) |
| The Corporation Trust Company |
| 1209 Orange Street Wilmington, DE 19801 |
| (Name and address of agent for service) |
| Registrant’s telephone number, including area code: | 631-490-4300 |
| Date of fiscal year end: | 12/31 |
| | |
| Date of reporting period: | 6/30/24 |
Explanatory Note: The registrant is filing this amendment to its filing on Form N-CSRS for the six months ended June 30, 2024, which was originally filed with the Securities and Exchange Commission on August 9, 2024 (Accession Number 0001580642-24-005459), amended to change the column header under the Average Annual Total Returns section from 10 Years to Since Inception.
Item 1. Reports to Stockholders.
(a)
Semi-Annual Shareholder Report - June 30, 2024
This semi-annual shareholder report contains important information about BTS Managed Income Fund for the period of January 1, 2024 to June 30, 2024. You can find additional information about the Fund at www.btsfunds.com. You can also request this information by contacting us at 1-877-287-9820.
What were the Fund’s costs for the last six months?
(based on a hypothetical $10,000 investment)
| Class Name | Costs of a $10,000 investment | Costs paid as a percentage of a $10,000 investment |
|---|
| Class A | $87 | 1.75%Footnote Reference* |
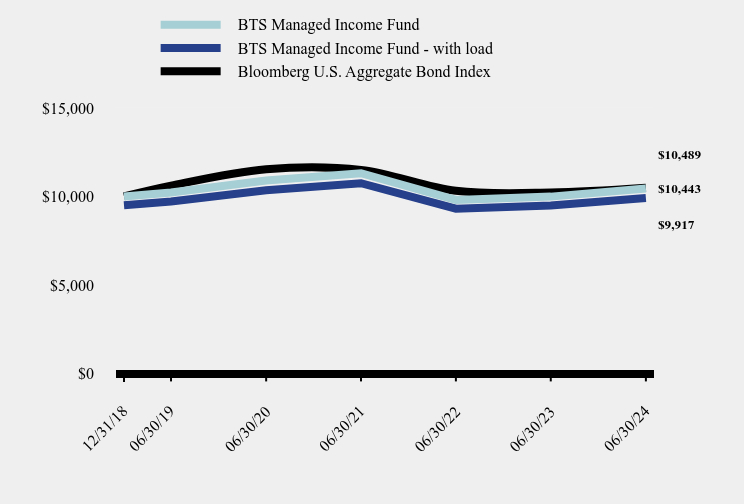
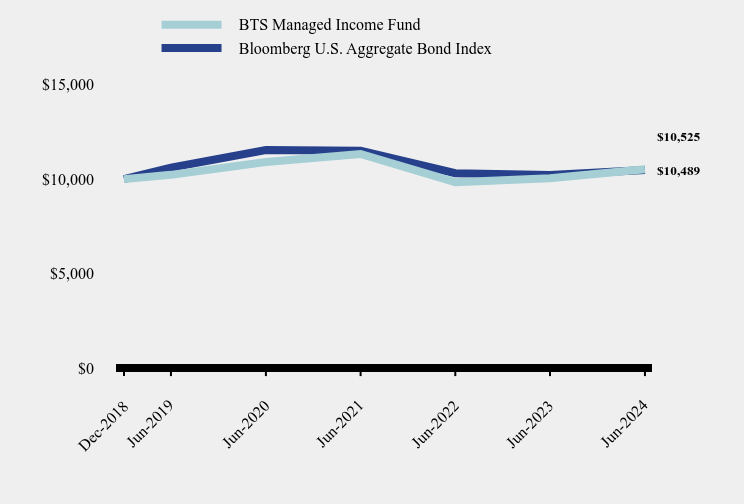
How has the Fund performed since inception?
Total Return Based on $10,000 Investment
| BTS Managed Income Fund | BTS Managed Income Fund - with load | Bloomberg U.S. Aggregate Bond Index |
|---|
| 12/31/18 | $10,000 | $9,497 | $10,000 |
| 06/30/19 | $10,226 | $9,711 | $10,611 |
| 06/30/20 | $10,901 | $10,353 | $11,539 |
| 06/30/21 | $11,315 | $10,745 | $11,500 |
| 06/30/22 | $9,803 | $9,310 | $10,317 |
| 06/30/23 | $9,990 | $9,487 | $10,220 |
| 06/30/24 | $10,443 | $9,917 | $10,489 |
Average Annual Total Returns
| 6 months | 1 Year | 5 Years | Since Inception (December 31, 2018) |
|---|
| BTS Managed Income Fund | | | | |
| Without Load | 1.54% | 4.53% | 0.42% | 0.79% |
| With Load | -2.31% | 0.61% | -0.61% | -0.15% |
| Bloomberg U.S. Aggregate Bond Index | -0.71% | 2.63% | -0.23% | 0.87% |
The Fund's past performance is not a good predictor of how the Fund will perform in the future. The graph and table do not reflect the deduction of taxes that a shareholder would pay on fund distributions or redemption of fund shares.
| Net Assets | $8,097,633 |
| Number of Portfolio Holdings | 28 |
| Advisory Fee (net of waivers) | $0 |
| Portfolio Turnover | 45% |
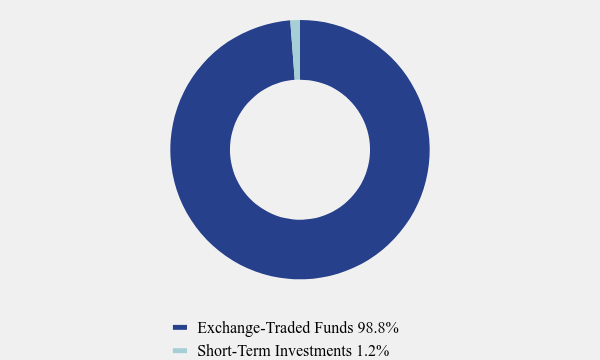
Asset Weighting (% of total investments)
| Value | Value |
|---|
| Exchange-Traded Funds | 98.8% |
| Short-Term Investments | 1.2% |
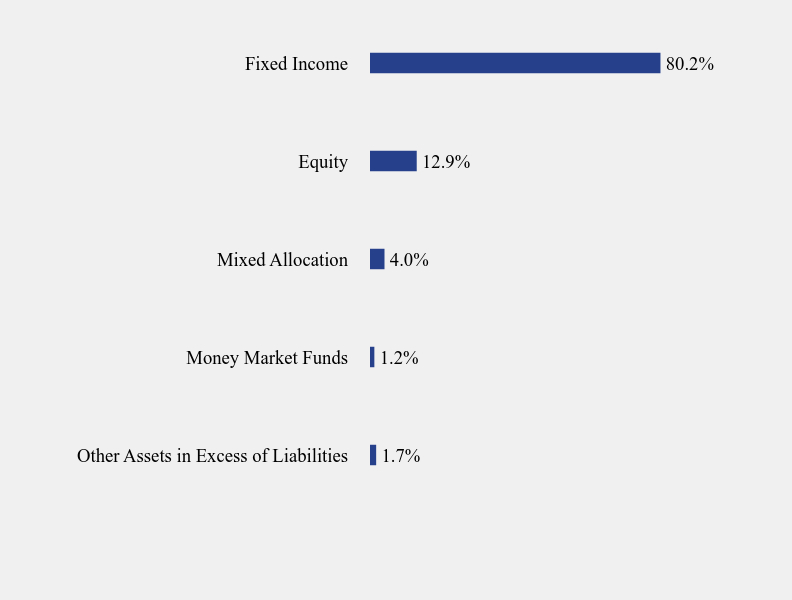
What did the Fund invest in?
Sector Weighting (% of net assets)
| Value | Value |
|---|
| Other Assets in Excess of Liabilities | 1.7% |
| Money Market Funds | 1.2% |
| Mixed Allocation | 4.0% |
| Equity | 12.9% |
| Fixed Income | 80.2% |
Top 10 Holdings (% of net assets)
| Holding Name | % of Net Assets |
| Xtrackers USD High Yield Corporate Bond ETF | 18.8% |
| iShares Treasury Floating Rate Bond ETF | 8.9% |
| SPDR Bloomberg High Yield Bond ETF | 5.9% |
| Janus Henderson AAA CLO ETF | 5.0% |
| iShares Floating Rate Bond ETF | 5.0% |
| Janus Henderson B-BBB CLO ETF | 5.0% |
| Alerian MLP ETF | 4.0% |
| Invesco Variable Rate Preferred ETF | 4.0% |
| Invesco CEF Income Composite ETF | 4.0% |
| SPDR Bloomberg International Treasury Bond ETF | 3.9% |
No material changes occurred during the period ended June 30, 2024.
BTS Managed Income Fund - Class A (BTSAX)
Semi-Annual Shareholder Report - June 30, 2024
Where can I find additional information about the Fund?
Additional information is available on the Fund's website ( www.btsfunds.com ), including its:
Prospectus
Financial information
Holdings
Proxy voting information
Semi-Annual Shareholder Report - June 30, 2024
This semi-annual shareholder report contains important information about BTS Managed Income Fund for the period of January 1, 2024 to June 30, 2024. You can find additional information about the Fund at www.btsfunds.com. You can also request this information by contacting us at 1-877-287-9820.
What were the Fund’s costs for the last six months?
(based on a hypothetical $10,000 investment)
| Class Name | Costs of a $10,000 investment | Costs paid as a percentage of a $10,000 investment |
|---|
| Class C | $124 | 2.50%Footnote Reference* |
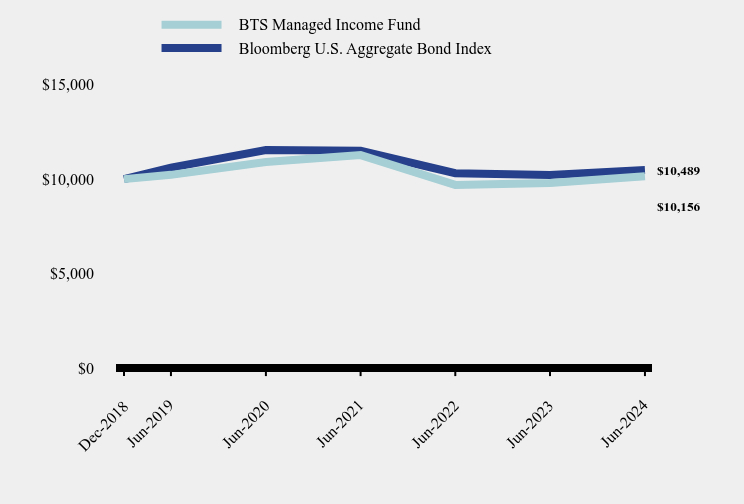
How has the Fund performed since inception?
Total Return Based on $10,000 Investment
| BTS Managed Income Fund | Bloomberg U.S. Aggregate Bond Index |
|---|
| Dec-2018 | $10,000 | $10,000 |
| Jun-2019 | $10,226 | $10,611 |
| Jun-2020 | $10,901 | $11,539 |
| Jun-2021 | $11,270 | $11,500 |
| Jun-2022 | $9,694 | $10,317 |
| Jun-2023 | $9,792 | $10,220 |
| Jun-2024 | $10,156 | $10,489 |
Average Annual Total Returns
| 6 Months | 1 Year | 5 Years | Since Inception (December 31, 2018) |
|---|
| BTS Managed Income Fund | 1.06% | 3.72% | -0.14% | 0.28% |
| Bloomberg U.S. Aggregate Bond Index | -0.71% | 2.63% | -0.23% | 0.87% |
The Fund's past performance is not a good predictor of how the Fund will perform in the future. The graph and table do not reflect the deduction of taxes that a shareholder would pay on fund distributions or redemption of fund shares.
| Net Assets | $8,097,633 |
| Number of Portfolio Holdings | 28 |
| Advisory Fee (net of waivers) | $0 |
| Portfolio Turnover | 45% |
Asset Weighting (% of total investments)
| Value | Value |
|---|
| Exchange-Traded Funds | 98.8% |
| Short-Term Investments | 1.2% |
What did the Fund invest in?
Sector Weighting (% of net assets)
| Value | Value |
|---|
| Other Assets in Excess of Liabilities | 1.7% |
| Money Market Funds | 1.2% |
| Mixed Allocation | 4.0% |
| Equity | 12.9% |
| Fixed Income | 80.2% |
Top 10 Holdings (% of net assets)
| Holding Name | % of Net Assets |
| Xtrackers USD High Yield Corporate Bond ETF | 18.8% |
| iShares Treasury Floating Rate Bond ETF | 8.9% |
| SPDR Bloomberg High Yield Bond ETF | 5.9% |
| Janus Henderson AAA CLO ETF | 5.0% |
| iShares Floating Rate Bond ETF | 5.0% |
| Janus Henderson B-BBB CLO ETF | 5.0% |
| Alerian MLP ETF | 4.0% |
| Invesco Variable Rate Preferred ETF | 4.0% |
| Invesco CEF Income Composite ETF | 4.0% |
| SPDR Bloomberg International Treasury Bond ETF | 3.9% |
No material changes occurred during the period ended June 30, 2024.
BTS Managed Income Fund - Class C (BTSCX)
Semi-Annual Shareholder Report - June 30, 2024
Where can I find additional information about the Fund?
Additional information is available on the Fund's website ( www.btsfunds.com ), including its:
Prospectus
Financial information
Holdings
Proxy voting information
Semi-Annual Shareholder Report - June 30, 2024
This semi-annual shareholder report contains important information about BTS Managed Income Fund for the period of January 1, 2024 to June 30, 2024. You can find additional information about the Fund at www.btsfunds.com. You can also request this information by contacting us at 1-877-287-9820.
What were the Fund’s costs for the last six months?
(based on a hypothetical $10,000 investment)
| Class Name | Costs of a $10,000 investment | Costs paid as a percentage of a $10,000 investment |
|---|
| Class I | $75 | 1.50%Footnote Reference* |
How has the Fund performed since inception?
Total Return Based on $10,000 Investment
| BTS Managed Income Fund | Bloomberg U.S. Aggregate Bond Index |
|---|
| Dec-2018 | $10,000 | $10,000 |
| Jun-2019 | $10,226 | $10,611 |
| Jun-2020 | $10,901 | $11,539 |
| Jun-2021 | $11,328 | $11,500 |
| Jun-2022 | $9,840 | $10,317 |
| Jun-2023 | $10,042 | $10,220 |
| Jun-2024 | $10,525 | $10,489 |
Average Annual Total Returns
| 6 Months | 1 Year | 5 Years | Since Inception (December 31, 2018) |
|---|
| BTS Managed Income Fund | 1.67% | 4.81% | 0.58% | 0.93% |
| Bloomberg U.S. Aggregate Bond Index | -0.71% | 2.63% | -0.23% | 0.87% |
The Fund's past performance is not a good predictor of how the Fund will perform in the future. The graph and table do not reflect the deduction of taxes that a shareholder would pay on fund distributions or redemption of fund shares.
| Net Assets | $8,097,633 |
| Number of Portfolio Holdings | 28 |
| Advisory Fee (net of waivers) | $0 |
| Portfolio Turnover | 45% |
Asset Weighting (% of total investments)
| Value | Value |
|---|
| Exchange-Traded Funds | 98.8% |
| Short-Term Investments | 1.2% |
What did the Fund invest in?
Sector Weighting (% of net assets)
| Value | Value |
|---|
| Other Assets in Excess of Liabilities | 1.7% |
| Money Market Funds | 1.2% |
| Mixed Allocation | 4.0% |
| Equity | 12.9% |
| Fixed Income | 80.2% |
Top 10 Holdings (% of net assets)
| Holding Name | % of Net Assets |
| Xtrackers USD High Yield Corporate Bond ETF | 18.8% |
| iShares Treasury Floating Rate Bond ETF | 8.9% |
| SPDR Bloomberg High Yield Bond ETF | 5.9% |
| Janus Henderson AAA CLO ETF | 5.0% |
| iShares Floating Rate Bond ETF | 5.0% |
| Janus Henderson B-BBB CLO ETF | 5.0% |
| Alerian MLP ETF | 4.0% |
| Invesco Variable Rate Preferred ETF | 4.0% |
| Invesco CEF Income Composite ETF | 4.0% |
| SPDR Bloomberg International Treasury Bond ETF | 3.9% |
No material changes occurred during the period ended June 30, 2024.
BTS Managed Income Fund - Class I (BTSIX)
Semi-Annual Shareholder Report - June 30, 2024
Where can I find additional information about the Fund?
Additional information is available on the Fund's website ( www.btsfunds.com ), including its:
Prospectus
Financial information
Holdings
Proxy voting information
Semi-Annual Shareholder Report - June 30, 2024
This semi-annual shareholder report contains important information about BTS Managed Income Fund for the period of January 1, 2024 to June 30, 2024. You can find additional information about the Fund at www.btsfunds.com. You can also request this information by contacting us at 1-877-287-9820.
What were the Fund’s costs for the last six months?
(based on a hypothetical $10,000 investment)
| Class Name | Costs of a $10,000 investment | Costs paid as a percentage of a $10,000 investment |
|---|
| Class R | $99 | 2.00%Footnote Reference* |
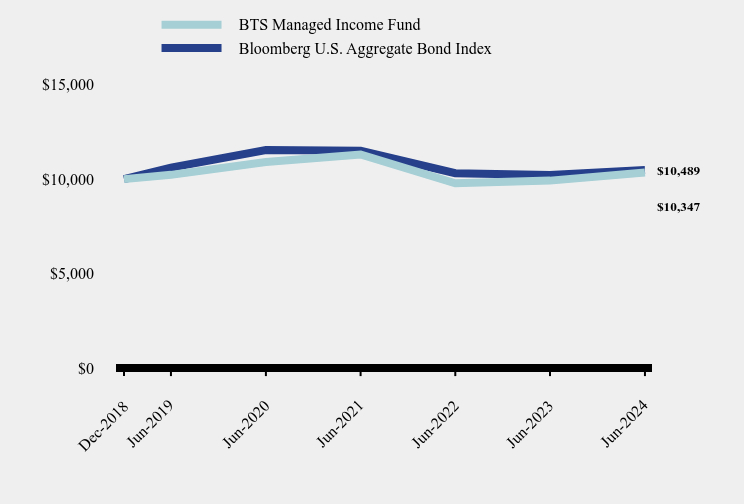
How has the Fund performed since inception?
Total Return Based on $10,000 Investment
| BTS Managed Income Fund | Bloomberg U.S. Aggregate Bond Index |
|---|
| Dec-2018 | $10,000 | $10,000 |
| Jun-2019 | $10,226 | $10,611 |
| Jun-2020 | $10,901 | $11,539 |
| Jun-2021 | $11,303 | $11,500 |
| Jun-2022 | $9,777 | $10,317 |
| Jun-2023 | $9,921 | $10,220 |
| Jun-2024 | $10,347 | $10,489 |
Average Annual Total Returns
| 6 Months | 1 Year | 5 Years | Since Inception (December 31, 2018) |
|---|
| BTS Managed Income Fund | 1.43% | 4.29% | 0.24% | 0.62% |
| Bloomberg U.S. Aggregate Bond Index | -0.71% | 2.63% | -0.23% | 0.87% |
The Fund's past performance is not a good predictor of how the Fund will perform in the future. The graph and table do not reflect the deduction of taxes that a shareholder would pay on fund distributions or redemption of fund shares.
| Net Assets | $8,097,633 |
| Number of Portfolio Holdings | 28 |
| Advisory Fee (net of waivers) | $0 |
| Portfolio Turnover | 45% |
Asset Weighting (% of total investments)
| Value | Value |
|---|
| Exchange-Traded Funds | 98.8% |
| Short-Term Investments | 1.2% |
What did the Fund invest in?
Sector Weighting (% of net assets)
| Value | Value |
|---|
| Other Assets in Excess of Liabilities | 1.7% |
| Money Market Funds | 1.2% |
| Mixed Allocation | 4.0% |
| Equity | 12.9% |
| Fixed Income | 80.2% |
Top 10 Holdings (% of net assets)
| Holding Name | % of Net Assets |
| Xtrackers USD High Yield Corporate Bond ETF | 18.8% |
| iShares Treasury Floating Rate Bond ETF | 8.9% |
| SPDR Bloomberg High Yield Bond ETF | 5.9% |
| Janus Henderson AAA CLO ETF | 5.0% |
| iShares Floating Rate Bond ETF | 5.0% |
| Janus Henderson B-BBB CLO ETF | 5.0% |
| Alerian MLP ETF | 4.0% |
| Invesco Variable Rate Preferred ETF | 4.0% |
| Invesco CEF Income Composite ETF | 4.0% |
| SPDR Bloomberg International Treasury Bond ETF | 3.9% |
No material changes occurred during the period ended June 30, 2024.
BTS Managed Income Fund - Class R (BTSRX)
Semi-Annual Shareholder Report - June 30, 2024
Where can I find additional information about the Fund?
Additional information is available on the Fund's website ( www.btsfunds.com ), including its:
Prospectus
Financial information
Holdings
Proxy voting information
BTS Tactical Fixed Income Fund
Semi-Annual Shareholder Report - June 30, 2024
This semi-annual shareholder report contains important information about BTS Tactical Fixed Income Fund for the period of January 1, 2024 to June 30, 2024. You can find additional information about the Fund at www.btsfunds.com. You can also request this information by contacting us at 1-877-287-9820.
What were the Fund’s costs for the last six months?
(based on a hypothetical $10,000 investment)
| Class Name | Costs of a $10,000 investment | Costs paid as a percentage of a $10,000 investment |
|---|
| Class A | $93 | 1.87%Footnote Reference* |
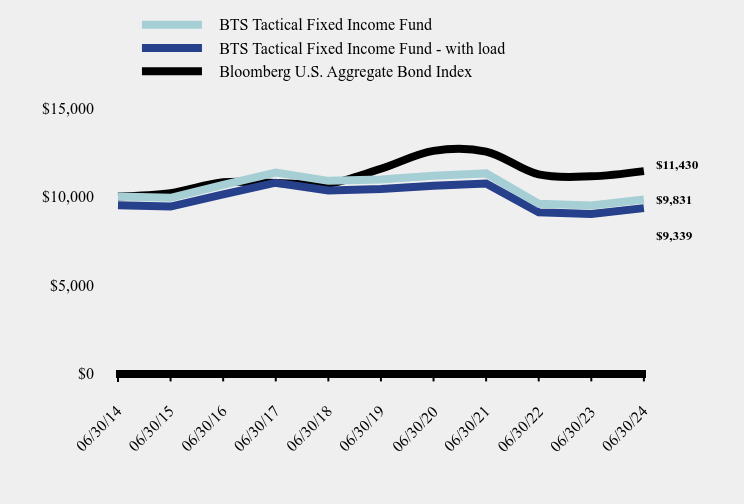
How has the Fund performed over the last ten years?
Total Return Based on $10,000 Investment
| BTS Tactical Fixed Income Fund | BTS Tactical Fixed Income Fund - with load | Bloomberg U.S. Aggregate Bond Index |
|---|
| 06/30/14 | $10,000 | $9,500 | $10,000 |
| 06/30/15 | $9,922 | $9,426 | $10,186 |
| 06/30/16 | $10,653 | $10,121 | $10,797 |
| 06/30/17 | $11,344 | $10,777 | $10,763 |
| 06/30/18 | $10,881 | $10,337 | $10,720 |
| 06/30/19 | $10,963 | $10,415 | $11,564 |
| 06/30/20 | $11,168 | $10,609 | $12,575 |
| 06/30/21 | $11,301 | $10,736 | $12,533 |
| 06/30/22 | $9,585 | $9,106 | $11,243 |
| 06/30/23 | $9,484 | $9,010 | $11,137 |
| 06/30/24 | $9,831 | $9,339 | $11,430 |
Average Annual Total Returns
| 6 months | 1 Year | 5 Years | 10 Years |
|---|
| BTS Tactical Fixed Income Fund | | | | |
| Without Load | 0.98% | 3.65% | -2.16% | -0.17% |
| With Load | -2.81% | -0.24% | -3.16% | -0.68% |
| Bloomberg U.S. Aggregate Bond Index | -0.71% | 2.63% | -0.23% | 1.35% |
The Fund's past performance is not a good predictor of how the Fund will perform in the future. The graph and table do not reflect the deduction of taxes that a shareholder would pay on fund distributions or redemption of fund shares.
| Net Assets | $64,813,182 |
| Number of Portfolio Holdings | 5 |
| Advisory Fee | $347,906 |
| Portfolio Turnover | 21% |
Asset Weighting (% of total investments)
| Value | Value |
|---|
| Exchange-Traded Funds | 99.1% |
| Short-Term Investments | 0.9% |
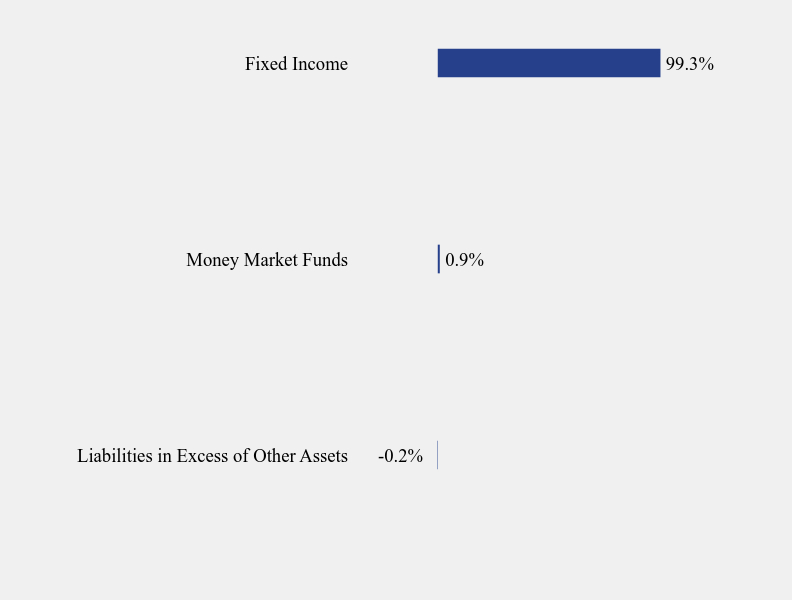
What did the Fund invest in?
Sector Weighting (% of net assets)
| Value | Value |
|---|
| Liabilities in Excess of Other Assets | -0.2% |
| Money Market Funds | 0.9% |
| Fixed Income | 99.3% |
Top 10 Holdings (% of net assets)
| Holding Name | % of Net Assets |
| Xtrackers USD High Yield Corporate Bond ETF | 68.9% |
| SPDR Bloomberg High Yield Bond ETF | 20.3% |
| SPDR Bloomberg Convertible Securities ETF | 5.1% |
| VanEck High Yield Muni ETF | 5.0% |
| Fidelity Government Portfolio, Institutional Class | 0.9% |
No material changes occurred during the period ended June 30, 2024.
BTS Tactical Fixed Income Fund - Class A (BTFAX)
Semi-Annual Shareholder Report - June 30, 2024
Where can I find additional information about the Fund?
Additional information is available on the Fund's website ( www.btsfunds.com ), including its:
Prospectus
Financial information
Holdings
Proxy voting information
BTS Tactical Fixed Income Fund
Semi-Annual Shareholder Report - June 30, 2024
This semi-annual shareholder report contains important information about BTS Tactical Fixed Income Fund for the period of January 1, 2024 to June 30, 2024. You can find additional information about the Fund at www.btsfunds.com. You can also request this information by contacting us at 1-877-287-9820.
What were the Fund’s costs for the last six months?
(based on a hypothetical $10,000 investment)
| Class Name | Costs of a $10,000 investment | Costs paid as a percentage of a $10,000 investment |
|---|
| Class C | $130 | 2.62%Footnote Reference* |
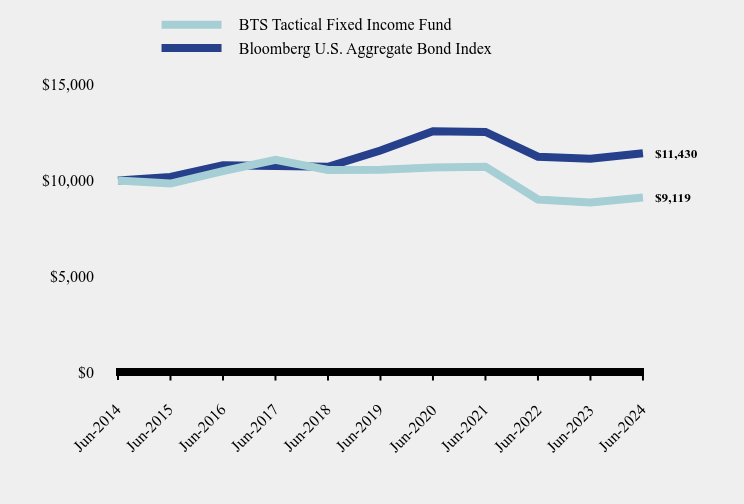
How has the Fund performed over the last ten years?
Total Return Based on $10,000 Investment
| BTS Tactical Fixed Income Fund | Bloomberg U.S. Aggregate Bond Index |
|---|
| Jun-2014 | $10,000 | $10,000 |
| Jun-2015 | $9,844 | $10,186 |
| Jun-2016 | $10,495 | $10,797 |
| Jun-2017 | $11,085 | $10,763 |
| Jun-2018 | $10,551 | $10,720 |
| Jun-2019 | $10,562 | $11,564 |
| Jun-2020 | $10,677 | $12,575 |
| Jun-2021 | $10,725 | $12,533 |
| Jun-2022 | $9,017 | $11,243 |
| Jun-2023 | $8,862 | $11,137 |
| Jun-2024 | $9,119 | $11,430 |
Average Annual Total Returns
| 6 Months | 1 Year | 5 Years | 10 Years |
|---|
| BTS Tactical Fixed Income Fund | 0.62% | 2.90% | -2.90% | -0.92% |
| Bloomberg U.S. Aggregate Bond Index | -0.71% | 2.63% | -0.23% | 1.35% |
The Fund's past performance is not a good predictor of how the Fund will perform in the future. The graph and table do not reflect the deduction of taxes that a shareholder would pay on fund distributions or redemption of fund shares.
| Net Assets | $64,813,182 |
| Number of Portfolio Holdings | 5 |
| Advisory Fee | $347,906 |
| Portfolio Turnover | 21% |
Asset Weighting (% of total investments)
| Value | Value |
|---|
| Exchange-Traded Funds | 99.1% |
| Short-Term Investments | 0.9% |
What did the Fund invest in?
Sector Weighting (% of net assets)
| Value | Value |
|---|
| Liabilities in Excess of Other Assets | -0.2% |
| Money Market Funds | 0.9% |
| Fixed Income | 99.3% |
Top 10 Holdings (% of net assets)
| Holding Name | % of Net Assets |
| Xtrackers USD High Yield Corporate Bond ETF | 68.9% |
| SPDR Bloomberg High Yield Bond ETF | 20.3% |
| SPDR Bloomberg Convertible Securities ETF | 5.1% |
| VanEck High Yield Muni ETF | 5.0% |
| Fidelity Government Portfolio, Institutional Class | 0.9% |
No material changes occurred during the period ended June 30, 2024.
BTS Tactical Fixed Income Fund - Class C (BTFCX)
Semi-Annual Shareholder Report - June 30, 2024
Where can I find additional information about the Fund?
Additional information is available on the Fund's website ( www.btsfunds.com ), including its:
Prospectus
Financial information
Holdings
Proxy voting information
BTS Tactical Fixed Income Fund
Semi-Annual Shareholder Report - June 30, 2024
This semi-annual shareholder report contains important information about BTS Tactical Fixed Income Fund for the period of January 1, 2024 to June 30, 2024. You can find additional information about the Fund at www.btsfunds.com. You can also request this information by contacting us at 1-877-287-9820.
What were the Fund’s costs for the last six months?
(based on a hypothetical $10,000 investment)
| Class Name | Costs of a $10,000 investment | Costs paid as a percentage of a $10,000 investment |
|---|
| Class I | $81 | 1.62%Footnote Reference* |
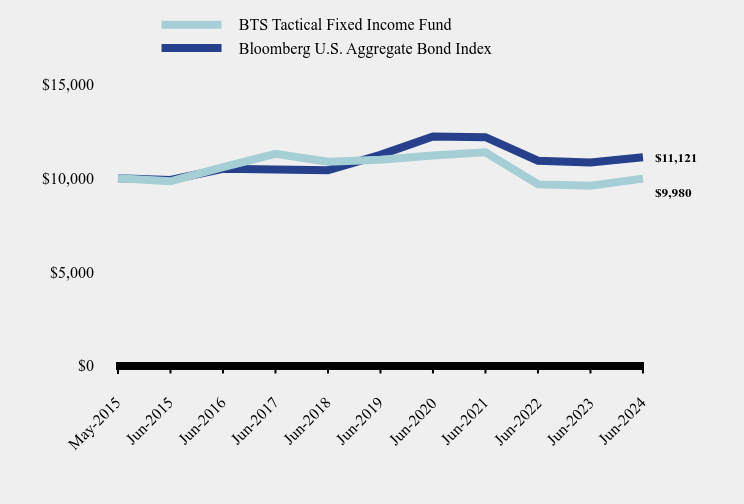
How has the Fund performed since inception?
Total Return Based on $10,000 Investment
| BTS Tactical Fixed Income Fund | Bloomberg U.S. Aggregate Bond Index |
|---|
| May-2015 | $10,000 | $10,000 |
| Jun-2015 | $9,840 | $9,910 |
| Jun-2016 | $10,592 | $10,505 |
| Jun-2017 | $11,307 | $10,472 |
| Jun-2018 | $10,878 | $10,430 |
| Jun-2019 | $10,989 | $11,251 |
| Jun-2020 | $11,216 | $12,234 |
| Jun-2021 | $11,387 | $12,194 |
| Jun-2022 | $9,679 | $10,939 |
| Jun-2023 | $9,602 | $10,836 |
| Jun-2024 | $9,980 | $11,121 |
Average Annual Total Returns
| 6 Months | 1 Year | 5 Years | Since Inception (May 27, 2015) |
|---|
| BTS Tactical Fixed Income Fund | 1.11% | 3.94% | -1.91% | -0.02% |
| Bloomberg U.S. Aggregate Bond Index | -0.71% | 2.63% | -0.23% | 1.18% |
The Fund's past performance is not a good predictor of how the Fund will perform in the future. The graph and table do not reflect the deduction of taxes that a shareholder would pay on fund distributions or redemption of fund shares.
| Net Assets | $64,813,182 |
| Number of Portfolio Holdings | 5 |
| Advisory Fee | $347,906 |
| Portfolio Turnover | 21% |
Asset Weighting (% of total investments)
| Value | Value |
|---|
| Exchange-Traded Funds | 99.1% |
| Short-Term Investments | 0.9% |
What did the Fund invest in?
Sector Weighting (% of net assets)
| Value | Value |
|---|
| Liabilities in Excess of Other Assets | -0.2% |
| Money Market Funds | 0.9% |
| Fixed Income | 99.3% |
Top 10 Holdings (% of net assets)
| Holding Name | % of Net Assets |
| Xtrackers USD High Yield Corporate Bond ETF | 68.9% |
| SPDR Bloomberg High Yield Bond ETF | 20.3% |
| SPDR Bloomberg Convertible Securities ETF | 5.1% |
| VanEck High Yield Muni ETF | 5.0% |
| Fidelity Government Portfolio, Institutional Class | 0.9% |
No material changes occurred during the period ended June 30, 2024.
BTS Tactical Fixed Income Fund - Class I (BTFIX)
Semi-Annual Shareholder Report - June 30, 2024
Where can I find additional information about the Fund?
Additional information is available on the Fund's website ( www.btsfunds.com ), including its:
Prospectus
Financial information
Holdings
Proxy voting information
BTS Tactical Fixed Income Fund
Semi-Annual Shareholder Report - June 30, 2024
This semi-annual shareholder report contains important information about BTS Tactical Fixed Income Fund for the period of January 1, 2024 to June 30, 2024. You can find additional information about the Fund at www.btsfunds.com. You can also request this information by contacting us at 1-877-287-9820.
What were the Fund’s costs for the last six months?
(based on a hypothetical $10,000 investment)
| Class Name | Costs of a $10,000 investment | Costs paid as a percentage of a $10,000 investment |
|---|
| Class R | $105 | 2.12%Footnote Reference* |
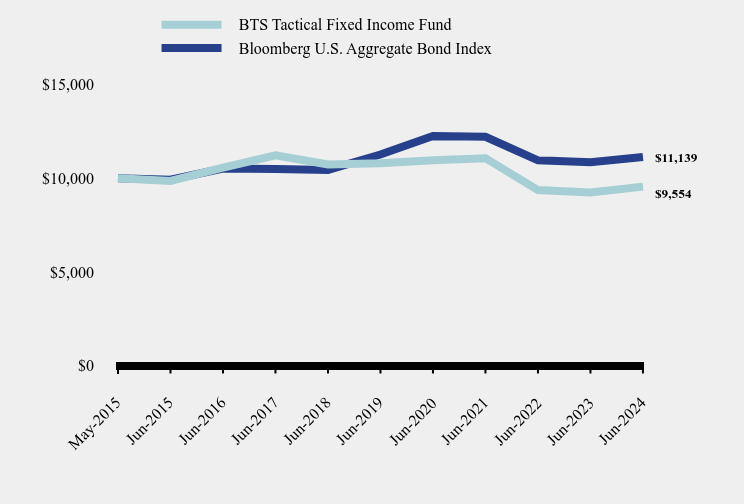
How has the Fund performed since inception?
Total Return Based on $10,000 Investment
| BTS Tactical Fixed Income Fund | Bloomberg U.S. Aggregate Bond Index |
|---|
| May-2015 | $10,000 | $10,000 |
| Jun-2015 | $9,860 | $9,926 |
| Jun-2016 | $10,565 | $10,522 |
| Jun-2017 | $11,221 | $10,489 |
| Jun-2018 | $10,736 | $10,447 |
| Jun-2019 | $10,803 | $11,269 |
| Jun-2020 | $10,962 | $12,254 |
| Jun-2021 | $11,072 | $12,213 |
| Jun-2022 | $9,367 | $10,956 |
| Jun-2023 | $9,242 | $10,854 |
| Jun-2024 | $9,554 | $11,139 |
Average Annual Total Returns
| 6 Months | 1 Year | 5 Years | Since Inception (May 5, 2015) |
|---|
| BTS Tactical Fixed Income Fund | 0.71% | 3.38% | -2.43% | -0.50% |
| Bloomberg U.S. Aggregate Bond Index | -0.71% | 2.63% | -0.23% | 1.19% |
The Fund's past performance is not a good predictor of how the Fund will perform in the future. The graph and table do not reflect the deduction of taxes that a shareholder would pay on fund distributions or redemption of fund shares.
| Net Assets | $64,813,182 |
| Number of Portfolio Holdings | 5 |
| Advisory Fee | $347,906 |
| Portfolio Turnover | 21% |
Asset Weighting (% of total investments)
| Value | Value |
|---|
| Exchange-Traded Funds | 99.1% |
| Short-Term Investments | 0.9% |
What did the Fund invest in?
Sector Weighting (% of net assets)
| Value | Value |
|---|
| Liabilities in Excess of Other Assets | -0.2% |
| Money Market Funds | 0.9% |
| Fixed Income | 99.3% |
Top 10 Holdings (% of net assets)
| Holding Name | % of Net Assets |
| Xtrackers USD High Yield Corporate Bond ETF | 68.9% |
| SPDR Bloomberg High Yield Bond ETF | 20.3% |
| SPDR Bloomberg Convertible Securities ETF | 5.1% |
| VanEck High Yield Muni ETF | 5.0% |
| Fidelity Government Portfolio, Institutional Class | 0.9% |
No material changes occurred during the period ended June 30, 2024.
BTS Tactical Fixed Income Fund - Class R (BTFRX)
Semi-Annual Shareholder Report - June 30, 2024
Where can I find additional information about the Fund?
Additional information is available on the Fund's website ( www.btsfunds.com ), including its:
Prospectus
Financial information
Holdings
Proxy voting information
(b) Not applicable
Item 2. Code of Ethics. Not applicable.
Item 3. Audit Committee Financial Expert. Not applicable.
Item 4. Principal Accountant Fees and Services. Not applicable.
Item 5. Audit Committee of Listed Companies. Not applicable to open-end investment companies.
Item 6. Schedule of Investments. The Registrant’s schedule of investments in unaffiliated issuers is included in the Financial Statements under Item 7 of this form.
Item 7. Financial Statements and Financial Highlights for Open-End Management Investment Companies.

BTS Managed Income Fund
Class A
BTSAX
Class C
BTSCX
Class I
BTSIX
Class R
BTSRX
BTS Tactical Fixed Income Fund
Class A
BTFAX
Class C
BTFCX
Class I
BTFIX
Class R
BTFRX
Semi-Annual Financial Statements
June 30, 2024
1-877-BTS-9820
(1-877-287-9820)
www.btsfunds.com
This report and the financial statements contained herein are submitted for the general information of shareholders and are not authorized for distribution to prospective investors unless preceded or accompanied by an effective prospectus. Nothing herein contained is to be considered an offer of sale or solicitation of an offer to buy shares of the BTS Funds. Such offering is made only by prospectus, which includes details as to offering price and other material information.
| BTS MANAGED INCOME FUND |
| SCHEDULE OF INVESTMENTS (Unaudited) |
| June 30, 2024 |
| |
| Shares | | | | | Fair Value | |
| | | | | EXCHANGE-TRADED FUNDS — 97.1% | | | | |
| | | | | EQUITY - 12.9% | | | | |
| | 6,755 | | | Alerian MLP ETF | | $ | 324,105 | |
| | 928 | | | Communication Services Select Sector SPDR Fund | | | 79,492 | |
| | 1,760 | | | Energy Select Sector SPDR Fund | | | 160,424 | |
| | 1,311 | | | Invesco Global Listed Private Equity ETF | | | 80,089 | |
| | 438 | | | Vanguard Dividend Appreciation ETF | | | 79,957 | |
| | 806 | | | Vanguard Financials ETF | | | 80,503 | |
| | 341 | | | Vanguard Industrials ETF | | | 80,210 | |
| | 1,079 | | | Vanguard Utilities ETF | | | 159,606 | |
| | | | | | | | 1,044,386 | |
| | | | | FIXED INCOME - 80.2% | | | | |
| | 7,649 | | | Invesco Senior Loan ETF | | | 160,935 | |
| | 13,451 | | | Invesco Variable Rate Preferred ETF | | | 322,286 | |
| | 2,580 | | | iShares 20+ Year Treasury Bond ETF | | | 236,792 | |
| | 7,872 | | | iShares Floating Rate Bond ETF | | | 402,180 | |
| | 901 | | | iShares J.P. Morgan USD Emerging Markets Bond ETF | | | 79,720 | |
| | 1,509 | | | iShares National Muni Bond ETF | | | 160,784 | |
| | 2,999 | | | iShares TIPS Bond ETF | | | 320,233 | |
| | 14,296 | | | iShares Treasury Floating Rate Bond ETF | | | 724,236 | |
| | 7,909 | | | Janus Henderson AAA CLO ETF | | | 402,411 | |
| | 8,176 | | | Janus Henderson B-BBB CLO ETF | | | 402,096 | |
| | 3,848 | | | SPDR Blackstone Senior Loan ETF | | | 160,846 | |
| | 3,335 | | | SPDR Bloomberg Convertible Securities ETF | | | 240,320 | |
| | 5,099 | | | SPDR Bloomberg High Yield Bond ETF | | | 480,684 | |
| | 8,399 | | | SPDR Bloomberg International Corporate Bond ETF | | | 241,177 | |
| | 14,968 | | | SPDR Bloomberg International Treasury Bond ETF | | | 320,764 | |
| | 6,289 | | | SPDR Nuveen Bloomberg High Yield Municipal Bond | | | 159,992 | |
| | 3,099 | | | VanEck High Yield Muni ETF | | | 160,063 | |
| | 42,954 | | | Xtrackers USD High Yield Corporate Bond ETF | | | 1,523,150 | |
| | | | | | | | 6,498,669 | |
| | | | | | | | | |
See accompanying notes to financial statements.
| BTS MANAGED INCOME FUND |
| SCHEDULE OF INVESTMENTS (Unaudited) (Continued) |
| June 30, 2024 |
| |
| Shares | | | | | Fair Value | |
| | | | | EXCHANGE-TRADED FUNDS — 97.1% (Continued) | | | | |
| | | | | MIXED ALLOCATION - 4.0% | | | | |
| | 17,098 | | | Invesco CEF Income Composite ETF | | $ | 321,784 | |
| | | | | | | | | |
| | | | | TOTAL EXCHANGE-TRADED FUNDS (Cost $7,690,345) | | | 7,864,839 | |
| | | | | | | | | |
| | | | | SHORT-TERM INVESTMENT - 1.2% | | | | |
| | | | | MONEY MARKET FUND - 1.2% | | | | |
| | 93,003 | | | Fidelity Government Portfolio, Class I, 5.20% (Cost $93,003)(a) | | | 93,003 | |
| | | | | | | | | |
| | | | | TOTAL INVESTMENTS - 98.3% (Cost $7,783,348) | | $ | 7,957,842 | |
| | | | | OTHER ASSETS IN EXCESS OF LIABILITIES - 1.7% | | | 139,791 | |
| | | | | NET ASSETS - 100.0% | | $ | 8,097,633 | |
| | | | | | | | | |
| CEF | - Closed-End Fund |
| | |
| CLO | - Collateralized Loan Obligation |
| | |
| ETF | - Exchange-Traded Fund |
| | |
| MLP | - Master Limited Partnership |
| | |
| SPDR | - Standard & Poor’s Depositary Receipt |
| | |
| (a) | Rate disclosed is the seven day effective yield as of June 30, 2024. |
See accompanying notes to financial statements.
| BTS TACTICAL FIXED INCOME FUND |
| SCHEDULE OF INVESTMENTS (Unaudited) |
| June 30, 2024 |
| |
| Shares | | | | | Fair Value | |
| | | | | EXCHANGE-TRADED FUNDS — 99.3% | | | | |
| | | | | FIXED INCOME - 99.3% | | | | |
| | 46,038 | | | SPDR Bloomberg Convertible Securities ETF | | $ | 3,317,498 | |
| | 139,236 | | | SPDR Bloomberg High Yield Bond ETF | | | 13,125,778 | |
| | 63,182 | | | VanEck High Yield Muni ETF | | | 3,263,350 | |
| | 1,259,617 | | | Xtrackers USD High Yield Corporate Bond ETF | | | 44,666,019 | |
| | | | | TOTAL EXCHANGE-TRADED FUNDS (Cost $62,490,695) | | | 64,372,645 | |
| | | | | | | | | |
| | | | | SHORT-TERM INVESTMENT - 0.9% | | | | |
| | | | | MONEY MARKET FUND - 0.9% | | | | |
| | 570,337 | | | Fidelity Government Portfolio, Class I, 5.20% (Cost $570,337)(a) | | | 570,337 | |
| | | | | | | | | |
| | | | | TOTAL INVESTMENTS - 100.2% (Cost $63,061,032) | | $ | 64,942,982 | |
| | | | | LIABILITIES IN EXCESS OF OTHER ASSETS - (0.2)% | | | (129,800 | ) |
| | | | | NET ASSETS - 100.0% | | $ | 64,813,182 | |
| | | | | | | | | |
| ETF | - Exchange-Traded Fund |
| | |
| SPDR | - Standard & Poor’s Depositary Receipt |
| | |
| (a) | Rate disclosed is the seven day effective yield as of June 30, 2024. |
See accompanying notes to financial statements.
| BTS Funds |
| STATEMENTS OF ASSETS AND LIABILITIES (Unaudited) |
| June 30, 2024 |
| |
| | | BTS | | | BTS | |
| | | Managed Income | | | Tactical Fixed Income | |
| ASSETS | | Fund | | | Fund | |
| Investment securities: | | | | | | | | |
| At cost | | $ | 7,783,348 | | | $ | 63,061,032 | |
| At fair value | | $ | 7,957,842 | | | $ | 64,942,982 | |
| Receivable for fund shares sold | | | — | | | | 210 | |
| Receivable for investments sold | | | 1,210,488 | | | | — | |
| Interest and dividends receivable | | | 2,207 | | | | 2,164 | |
| Receivable due from advisor | | | 30,818 | | | | — | |
| Prepaid expenses and other assets | | | 53,803 | | | | 29,953 | |
| TOTAL ASSETS | | | 9,255,158 | | | | 64,975,309 | |
| | | | | | | | | |
| LIABILITIES | | | | | | | | |
| Payable for investments purchased | | | 1,143,704 | | | | — | |
| Payable to related parties | | | 8,333 | | | | 19,569 | |
| Distribution (12b-1) fees payable | | | 415 | | | | 15,776 | |
| Investment advisory fees payable | | | — | | | | 54,330 | |
| Payable for fund shares redeemed | | | — | | | | 58,322 | |
| Accrued expenses and other liabilities | | | 5,073 | | | | 14,130 | |
| TOTAL LIABILITIES | | | 1,157,525 | | | | 162,127 | |
| NET ASSETS | | $ | 8,097,633 | | | $ | 64,813,182 | |
| | | | | | | | | |
| Net Assets Consist Of: | | | | | | | | |
| Paid in capital ($0 par value, unlimited shares authorized) | | $ | 11,867,977 | | | $ | 174,973,671 | |
| Accumulated losses | | | (3,770,344 | ) | | | (110,160,489 | ) |
| NET ASSETS | | $ | 8,097,633 | | | $ | 64,813,182 | |
| | | | | | | | | |
| Net Asset Value Per Share: | | | | | | | | |
| Class A Shares: | | | | | | | | |
| Net Assets | | $ | 222,433 | | | $ | 15,607,241 | |
| Shares of beneficial interest outstanding ($0 par value, unlimited shares authorized) | | | 23,702 | | | | 2,035,382 | |
| Net asset value and redemption price per share (Net assets/Shares of Beneficial Interest) | | $ | 9.38 | (2) | | $ | 7.67 | |
| Maximum offering price per share (Maximum sales charge of 3.75%) (1) | | $ | 9.75 | | | $ | 7.97 | |
| | | | | | | | | |
| Class C Shares: | | | | | | | | |
| Net Assets | | $ | 458,742 | | | $ | 14,359,098 | |
| Shares of beneficial interest outstanding ($0 par value, unlimited shares authorized) | | | 48,998 | | | | 1,890,074 | |
| Net asset value, offering price and redemption price per share (Net assets/Shares of Beneficial Interest) | | $ | 9.36 | | | $ | 7.60 | |
| | | | | | | | | |
| Class I Shares: | | | | | | | | |
| Net Assets | | $ | 7,381,203 | | | $ | 34,136,771 | |
| Shares of beneficial interest outstanding ($0 par value, unlimited shares authorized) | | | 787,160 | | | | 4,471,281 | |
| Net asset value, offering price and redemption price per share (Net assets/Shares of Beneficial Interest) | | $ | 9.38 | | | $ | 7.63 | (2) |
| | | | | | | | | |
| Class R Shares: | | | | | | | | |
| Net Assets | | $ | 35,255 | | | $ | 710,072 | |
| Shares of beneficial interest outstanding ($0 par value, unlimited shares authorized) | | | 3,752 | | | | 92,947 | |
| Net asset value, offering price and redemption price per share (Net assets/Shares of Beneficial Interest) | | $ | 9.40 | | | $ | 7.64 | |
| | | | | | | | | |
| (1) | On investments of $5 million or more, the maximum sales charge will not apply. However, the investment may be subject to a 1.00% contingent deferred sales charge if redeemed during the first 18 months. |
| (2) | The NAV shown above differs from the last traded NAV on June 28, 2024 due to financial statement rounding and/or financial statement adjustments. |
See accompanying notes to financial statements.
| BTS Funds |
| STATEMENTS OF OPERATIONS (Unaudited) |
| For the Six Months Ended June 30, 2024 |
| |
| | | BTS | | | BTS | |
| | | Managed Income | | | Tactical Fixed Income | |
| | | Fund | | | Fund | |
| INVESTMENT INCOME | | | | | | | | |
| Dividends | | $ | 193,174 | | | $ | 1,692,372 | |
| Interest | | | 5,507 | | | | 16,634 | |
| Securities lending income | | | — | | | | 17,187 | |
| TOTAL INVESTMENT INCOME | | | 198,681 | | | | 1,726,193 | |
| | | | | | | | | |
| EXPENSES | | | | | | | | |
| Investment advisory fees | | | 26,965 | | | | 347,906 | |
| Distribution (12b-1) fees, Class A shares | | | 274 | | | | 20,998 | |
| Distribution (12b-1) fees, Class C shares | | | 1,592 | | | | 75,126 | |
| Distribution (12b-1) fees, Class R shares | | | 128 | | | | 2,443 | |
| Registration fees | | | 26,453 | | | | 32,352 | |
| Accounting services fees | | | 22,721 | | | | 22,455 | |
| Administrative services fees | | | 14,619 | | | | 39,795 | |
| Transfer agent fees | | | 12,417 | | | | 57,802 | |
| Audit and tax fees | | | 11,426 | | | | 11,424 | |
| Trustees fees and expenses | | | 8,672 | | | | 8,706 | |
| Legal fees | | | 7,156 | | | | 7,088 | |
| Compliance officer fees | | | 4,158 | | | | 10,161 | |
| Printing and postage expenses | | | 3,914 | | | | 6,520 | |
| Custodian fees | | | 2,538 | | | | 4,012 | |
| Third party administrative servicing fees | | | 2,330 | | | | 14,704 | |
| Insurance expense | | | 1,540 | | | | 1,967 | |
| Other expenses | | | 2,612 | | | | 2,239 | |
| TOTAL EXPENSES | | | 149,515 | | | | 665,698 | |
| | | | | | | | | |
| Less: Fees waived/reimbursed by the Advisor | | | (84,884 | ) | | | — | |
| | | | | | | | | |
| NET EXPENSES | | | 64,631 | | | | 665,698 | |
| | | | | | | | | |
| NET INVESTMENT INCOME | | | 134,050 | | | | 1,060,495 | |
| | | | | | | | | |
| REALIZED AND UNREALIZED GAIN (LOSS) FROM INVESTMENTS | | | | | | | | |
| Net realized gain (loss) from investments | | | (5,342 | ) | | | 79,943 | |
| Net change in unrealized appreciation (depreciation) of investments | | | 8,144 | | | | (564,218 | ) |
| NET REALIZED AND UNREALIZED GAIN (LOSS) ON INVESTMENTS | | | 2,802 | | | | (484,275 | ) |
| | | | | | | | | |
| NET INCREASE IN NET ASSETS RESULTING FROM OPERATIONS | | $ | 136,852 | | | $ | 576,220 | |
| | | | | | | | | |
See accompanying notes to financial statements.
| BTS Managed Income Fund |
| STATEMENTS OF CHANGES IN NET ASSETS |
| |
| | | For the | | | | |
| | | Six Months Ended | | | For the | |
| | | June 30, 2024 | | | Year Ended | |
| | | (Unaudited) | | | December 31, 2023 | |
| | | | | | | | | |
| FROM OPERATIONS | | | | | | | | |
| Net investment income | | $ | 134,050 | | | $ | 575,018 | |
| Net realized loss from investments | | | (5,342 | ) | | | (1,146,069 | ) |
| Net change in unrealized appreciation of investments | | | 8,144 | | | | 1,025,375 | |
| Net increase in net assets resulting from operations | | | 136,852 | | | | 454,324 | |
| | | | | | | | | |
| DISTRIBUTIONS TO SHAREHOLDERS | | | | | | | | |
| Distributions paid | | | | | | | | |
| Class A | | | (3,396 | ) | | | (5,866 | ) |
| Class C | | | (5,258 | ) | | | (3,579 | ) |
| Class I | | | (125,977 | ) | | | (441,036 | ) |
| Class R | | | (499 | ) | | | (2,507 | ) |
| Net decrease in net assets from distributions to shareholders | | | (135,130 | ) | | | (452,988 | ) |
| | | | | | | | | |
| FROM SHARES OF BENEFICIAL INTEREST | | | | | | | | |
| Proceeds from shares sold: | | | | | | | | |
| Class A | | | — | | | | 19,278 | |
| Class C | | | 244,999 | | | | — | |
| Class I | | | 2,042,892 | | | | 2,084,643 | |
| Net asset value of shares issued in reinvestment of dividends and distributions to shareholders: | | | | | | | | |
| Class A | | | 3,396 | | | | 5,866 | |
| Class C | | | 5,258 | | | | 3,535 | |
| Class I | | | 101,548 | | | | 436,583 | |
| Class R | | | 499 | | | | 2,507 | |
| Payments for shares redeemed: | | | | | | | | |
| Class A | | | (642 | ) | | | (93,124 | ) |
| Class C | | | (12,941 | ) | | | (21,042 | ) |
| Class I | | | (1,791,135 | ) | | | (13,115,572 | ) |
| Class R | | | (86,289 | ) | | | (20,000 | ) |
| Net increase (decrease) in net assets from shares of beneficial interest | | | 507,585 | | | | (10,697,326 | ) |
| | | | | | | | | |
| TOTAL INCREASE (DECREASE) IN NET ASSETS | | | 509,307 | | | | (10,695,990 | ) |
| | | | | | | | | |
| NET ASSETS | | | | | | | | |
| Beginning of Period | | | 7,588,326 | | | | 18,284,316 | |
| End of Period | | $ | 8,097,633 | | | $ | 7,588,326 | |
| | | | | | | | | |
| SHARE ACTIVITY | | | | | | | | |
| Class A: | | | | | | | | |
| Shares sold | | | — | | | | 2,091 | |
| Shares reinvested | | | 360 | | | | 642 | |
| Shares redeemed | | | (68 | ) | | | (10,048 | ) |
| Net increase (decrease) in shares of beneficial interest outstanding | | | 292 | | | | (7,315 | ) |
| | | | | | | | | |
| Class C: | | | | | | | | |
| Shares sold | | | 26,081 | | | | — | |
| Shares reinvested | | | 560 | | | | 388 | |
| Shares redeemed | | | (1,376 | ) | | | (2,296 | ) |
| Net increase (decrease) in shares of beneficial interest outstanding | | | 25,265 | | | | (1,908 | ) |
| | | | | | | | | |
| Class I: | | | | | | | | |
| Shares sold | | | 218,122 | | | | 226,766 | |
| Shares reinvested | | | 10,779 | | | | 47,902 | |
| Shares redeemed | | | (190,809 | ) | | | (1,460,502 | ) |
| Net increase (decrease) in shares of beneficial interest outstanding | | | 38,092 | | | | (1,185,834 | ) |
| | | | | | | | | |
| Class R: | | | | | | | | |
| Shares reinvested | | | 53 | | | | 274 | |
| Shares redeemed | | | (9,266 | ) | | | (2,166 | ) |
| Net decrease in shares of beneficial interest outstanding | | | (9,213 | ) | | | (1,892 | ) |
| | | | | | | | | |
See accompanying notes to financial statements.
| BTS Tactical Fixed Income Fund |
| STATEMENTS OF CHANGES IN NET ASSETS |
| |
| | | For the | | | | |
| | | Six Months Ended | | | For the | |
| | | June 30, 2024 | | | Year Ended | |
| | | (Unaudited) | | | December 31, 2023 | |
| | | | | | | |
| FROM OPERATIONS | | | | | | | | |
| Net investment income | | $ | 1,060,495 | | | $ | 2,996,795 | |
| Net realized gain (loss) from investments | | | 79,943 | | | | (4,453,218 | ) |
| Net change in unrealized appreciation (depreciation) of investments | | | (564,218 | ) | | | 2,845,139 | |
| Net increase in net assets resulting from operations | | | 576,220 | | | | 1,388,716 | |
| | | | | | | | | |
| DISTRIBUTIONS TO SHAREHOLDERS | | | | | | | | |
| Distributions paid | | | | | | | | |
| Class A | | | (257,914 | ) | | | (753,650 | ) |
| Class C | | | (185,166 | ) | | | (465,583 | ) |
| Class I | | | (619,823 | ) | | | (1,685,828 | ) |
| Class R | | | (11,081 | ) | | | (34,258 | ) |
| Net decrease in net assets from distributions to shareholders | | | (1,073,984 | ) | | | (2,939,319 | ) |
| | | | | | | | | |
| FROM SHARES OF BENEFICIAL INTEREST | | | | | | | | |
| Proceeds from shares sold: | | | | | | | | |
| Class A | | | 57,182 | | | | 671,016 | |
| Class C | | | 357,609 | | | | 155,893 | |
| Class I | | | 4,500,126 | | | | 4,568,438 | |
| Class R | | | 5,591 | | | | 6,775 | |
| Net asset value of shares issued in reinvestment of dividends and distributions to shareholders: | | | | | | | | |
| Class A | | | 224,325 | | | | 634,910 | |
| Class C | | | 159,243 | | | | 403,194 | |
| Class I | | | 513,751 | | | | 1,527,781 | |
| Class R | | | 9,581 | | | | 30,358 | |
| Payments for shares redeemed: | | | | | | | | |
| Class A | | | (3,784,101 | ) | | | (10,780,232 | ) |
| Class C | | | (2,117,238 | ) | | | (6,495,206 | ) |
| Class I | | | (8,684,126 | ) | | | (33,731,810 | ) |
| Class R | | | (245,121 | ) | | | (844,665 | ) |
| Net decrease in net assets from shares of beneficial interest | | | (9,003,178 | ) | | | (43,853,548 | ) |
| | | | | | | | | |
| TOTAL DECREASE IN NET ASSETS | | | (9,500,942 | ) | | | (45,404,151 | ) |
| | | | | | | | | |
| NET ASSETS | | | | | | | | |
| Beginning of Period | | | 74,314,124 | | | | 119,718,275 | |
| End of Period | | $ | 64,813,182 | | | $ | 74,314,124 | |
| | | | | | | | | |
| SHARE ACTIVITY | | | | | | | | |
| Class A: | | | | | | | | |
| Shares sold | | | 3,111 | | | | 85,882 | |
| Shares reinvested | | | 33,444 | | | | 82,375 | |
| Shares redeemed | | | (491,632 | ) | | | (1,391,690 | ) |
| Net decrease in shares of beneficial interest outstanding | | | (455,077 | ) | | | (1,223,433 | ) |
| | | | | | | | | |
| Class C: | | | | | | | | |
| Shares sold | | | 46,526 | | | | 20,170 | |
| Shares reinvested | | | 20,871 | | | | 52,794 | |
| Shares redeemed | | | (277,494 | ) | | | (844,332 | ) |
| Net decrease in shares of beneficial interest outstanding | | | (210,097 | ) | | | (771,368 | ) |
| | | | | | | | | |
| Class I: | | | | | | | | |
| Shares sold | | | 587,701 | | | | 587,022 | |
| Shares reinvested | | | 66,970 | | | | 199,037 | |
| Shares redeemed | | | (1,132,134 | ) | | | (4,366,775 | ) |
| Net decrease in shares of beneficial interest outstanding | | | (477,463 | ) | | | (3,580,716 | ) |
| | | | | | | | | |
| Class R: | | | | | | | | |
| Shares sold | | | 729 | | | | 868 | |
| Shares reinvested | | | 1,249 | | | | 3,953 | |
| Shares redeemed | | | (31,826 | ) | | | (108,993 | ) |
| Net decrease in shares of beneficial interest outstanding | | | (29,848 | ) | | | (104,172 | ) |
| | | | | | | | | |
See accompanying notes to financial statements.
| BTS Managed Income Fund |
| FINANCIAL HIGHLIGHTS |
| |
Per Share Data and Ratios for a Share of Beneficial Interest Outstanding Throughout Each Period
| | | Class A | |
| | | For the | | | | | | | | | | | | | | | | |
| | | Six Months Ended | | | For the | | | For the | | | For the | | | For the | | | For the | |
| | | June 30, 2024 | | | Year Ended | | | Year Ended | | | Year Ended | | | Year Ended | | | Period* Ended | |
| | | (Unaudited) | | | December 31, 2023 | | | December 31, 2022 | | | December 31, 2021 | | | December 31, 2020 | | | December 31, 2019 | |
| Net asset value, beginning of period | | $ | 9.39 | | | $ | 9.12 | | | $ | 10.66 | | | $ | 10.92 | | | $ | 10.20 | | | $ | 10.00 | |
| | | | | | | | | | | | | | | | | | | | | | | | | |
| Activity from investment operations: | | | | | | | | | | | | | | | | | | | | | | | | |
| Net investment income (1) | | | 0.14 | | | | 0.30 | | | | 0.18 | | | | 0.12 | | | | 0.96 | | | | 0.21 | |
| Net realized and unrealized gain (loss) on investments | | | 0.00 | (11) | | | 0.18 | (6) | | | (1.51 | ) | | | (0.26 | ) | | | (0.09 | ) | | | 0.20 | |
| Total from investment operations | | | 0.14 | | | | 0.48 | | | | (1.33 | ) | | | (0.14 | ) | | | 0.87 | | | | 0.41 | |
| | | | | | | | | | | | | | | | | | | | | | | | | |
| Less distributions from: | | | | | | | | | | | | | | | | | | | | | | | | |
| Net investment income | | | (0.15 | ) | | | (0.21 | ) | | | (0.21 | ) | | | (0.12 | ) | | | (0.14 | ) | | | (0.20 | ) |
| Return of capital | | | — | | | | — | | | | — | | | | — | | | | (0.01 | ) | | | (0.01 | ) |
| Total distributions | | | (0.15 | ) | | | (0.21 | ) | | | (0.21 | ) | | | (0.12 | ) | | | (0.15 | ) | | | (0.21 | ) |
| | | | | | | �� | | | | | | | | | | | | | | | | | | |
| Net asset value, end of period | | $ | 9.38 | | | $ | 9.39 | | | $ | 9.12 | | | $ | 10.66 | | | $ | 10.92 | | | $ | 10.20 | |
| | | | | | | | | | | | | | | | | | | | | | | | | |
| Total return (2) | | | 1.43 | % (7)(9) | | | 5.37 | % | | | (12.45 | )% | | | (1.28 | )% | | | 8.53 | % | | | 4.06 | % (9) |
| | | | | | | | | | | | | | | | | | | | | | | | | |
| Net assets, at end of period (000)’s | | $ | 222 | (5) | | $ | 220 | | | $ | 280 | | | $ | 321 | | | $ | 34 | | | $ | 0 | (5) |
| | | | | | | | | | | | | | | | | | | | | | | | | |
| Ratio of gross expenses before waiver/reimbursement to average net assets (3) | | | 3.81 | % (10) | | | 2.38 | % (8) | | | 2.07 | % | | | 1.84 | % | | | 2.60 | % | | | 13.86 | % (10) |
| Ratio of net expenses to average net assets (3) | | | 1.75 | % (10) | | | 1.77 | % (8) | | | 1.75 | % | | | 1.75 | % | | | 1.75 | % | | | 1.75 | % (10) |
| Ratio of net investment income (loss) before waiver/reimbursement to average net assets (3,4) | | | 0.95 | % (10) | | | 2.55 | % | | | 1.60 | % | | | 1.04 | % | | | 7.17 | % | | | (10.32 | )% (10) |
| Ratio of net investment income to average net assets (3,4) | | | 3.00 | % (10) | | | 3.24 | % | | | 1.93 | % | | | 1.13 | % | | | 8.02 | % | | | 1.79 | % (10) |
| | | | | | | | | | | | | | | | | | | | | | | | | |
| Portfolio Turnover Rate | | | 45 | % (9) | | | 165 | % | | | 277 | % | | | 243 | % | | | 281 | % | | | 163 | % (9) |
| | | | | | | | | | | | | | | | | | | | | | | | | |
| * | The inception date of the Fund is December 31, 2018 and the Fund commenced operations on January 25, 2019. |
| (1) | Per share amounts calculated using the average shares method, which more appropriately presents the per share data for the period. |
| (2) | Total returns shown exclude the effect of applicable sales loads/redemption fees and assumes reinvestment of dividends and capital gain distributions, if any. Had the Adviser not waived a portion of its fees, total returns would have been lower. |
| (3) | The ratios of expenses and net investment income (loss) to average net assets do not reflect the Fund’s proportionate share of expenses of underlying investment companies in which the Fund invests. |
| (4) | The recognition of investment income (loss) by the Fund is affected by the timing of the declaration of dividends by the underlying funds in which the Fund invests. |
| (6) | Net realized and unrealized gain (loss) on investments per share are balancing amounts necessary to reconcile the change in net asset value per share for the year, and may not accord with the aggregate gains and losses in the Statement of Operations due to share transactions for the year. |
| (7) | Includes adjustments in accordance with accounting principles generally accepted in the United States of America and, consequently, the net asset value for financial reporting purposes and the returns based upon those net asset values may differ from the net asset values and returns for shareholder transactions. |
| (8) | Includes 0.02% for the year ended December 31, 2023 attributed to custody overdraft fees which are not subject to waiver by the Adviser. |
| (11) | Amount represents less than $0.01 per share. |
See accompanying notes to financial statements.
| BTS Managed Income Fund |
| FINANCIAL HIGHLIGHTS |
| |
Per Share Data and Ratios for a Share of Beneficial Interest Outstanding Throughout Each Period
| | | Class C | |
| | | For the | | | | | | | | | | | | | | | | |
| | | Six Months Ended | | | For the | | | For the | | | For the | | | For the | | | For the | |
| | | June 30, 2024 | | | Year Ended | | | Year Ended | | | Year Ended | | | Year Ended | | | Period* Ended | |
| | | (Unaudited) | | | December 31, 2023 | | | December 31, 2022 | | | December 31, 2021 | | | December 31, 2020 | | | December 31, 2019 | |
| Net asset value, beginning of period | | $ | 9.37 | | | $ | 9.12 | | | $ | 10.67 | | | $ | 10.93 | | | $ | 10.20 | | | $ | 10.00 | |
| | | | | | | | | | | | | | | | | | | | | | | | | |
| Activity from investment operations: | | | | | | | | | | | | | | | | | | | | | | | | |
| Net investment income (1) | | | 0.11 | | | | 0.24 | | | | 0.11 | | | | 0.04 | | | | 0.62 | | | | 0.21 | |
| Net realized and unrealized gain (loss) on investments | | | 0.00 | (11) | | | 0.16 | (6) | | | (1.51 | ) | | | (0.26 | ) | | | 0.25 | | | | 0.20 | |
| Total from investment operations | | | 0.11 | | | | 0.40 | | | | (1.40 | ) | | | (0.22 | ) | | | 0.87 | | | | 0.41 | |
| | | | | | | | | | | | | | | | | | | | | | | | | |
| Less distributions from: | | | | | | | | | | | | | | | | | | | | | | | | |
| Net investment income | | | (0.12 | ) | | | (0.15 | ) | | | (0.15 | ) | | | (0.04 | ) | | | (0.13 | ) | | | (0.20 | ) |
| Return of capital | | | — | | | | — | | | | — | | | | — | | | | (0.01 | ) | | | (0.01 | ) |
| Total distributions | | | (0.12 | ) | | | (0.15 | ) | | | (0.15 | ) | | | (0.04 | ) | | | (0.14 | ) | | | (0.21 | ) |
| | | | | | | | | | | | | | | | | | | | | | | | | |
| Net asset value, end of period | | $ | 9.36 | | | $ | 9.37 | | | $ | 9.12 | | | $ | 10.67 | | | $ | 10.93 | | | $ | 10.20 | |
| | | | | | | | | | | | | | | | | | | | | | | | | |
| Total return (2) | | | 1.17 | % (7)(9) | | | 4.43 | % | | | (13.15 | )% | | | (2.00 | )% | | | 8.53 | % | | | 4.06 | % (9) |
| | | | | | | | | | | | | | | | | | | | | | | | | |
| Net assets, at end of period (000’s) | | $ | 459 | (5) | | $ | 222 | | | $ | 234 | | | $ | 320 | | | $ | 196 | | | $ | 0 | (5) |
| | | | | | | | | | | | | | | | | | | | | | | | | |
| Ratio of gross expenses before waiver/reimbursement to average net assets (3) | | | 4.56 | % (10) | | | 3.13 | % (8) | | | 2.82 | % | | | 2.59 | % | | | 3.35 | % | | | 14.61 | % (10) |
| Ratio of net expenses to average net assets (3) | | | 2.50 | % (10) | | | 2.52 | % (8) | | | 2.50 | % | | | 2.50 | % | | | 2.50 | % | | | 2.50 | % (10) |
| Ratio of net investment income (loss) before waiver/reimbursement to average net assets (3,4) | | | 0.26 | % (10) | | | 1.83 | % | | | 0.78 | % | | | 0.25 | % | | | 4.69 | % | | | (11.07 | )% (10) |
| Ratio of net investment income to average net assets (3,4) | | | 2.33 | % (10) | | | 2.56 | % | | | 1.10 | % | | | 0.34 | % | | | 5.54 | % | | | 1.04 | % (10) |
| | | | | | | | | | | | | | | | | | | | | | | | | |
| Portfolio Turnover Rate | | | 45 | % (9) | | | 165 | % | | | 277 | % | | | 243 | % | | | 281 | % | | | 163 | % (9) |
| | | | | | | | | | | | | | | | | | | | | | | | | |
| * | The inception date of the Fund is December 31, 2018 and the Fund commenced operations on January 25, 2019. |
| (1) | Per share amounts calculated using the average shares method, which more appropriately presents the per share data for the period. |
| (2) | Total returns shown exclude the effect of applicable sales loads/redemption fees and assumes reinvestment of dividends and capital gain distributions, if any. Had the Adviser not waived a portion of its fees, total returns would have been lower. |
| (3) | The ratios of expenses and net investment income (loss) to average net assets do not reflect the Fund’s proportionate share of expenses of underlying investment companies in which the Fund invests. |
| (4) | The recognition of investment income (loss) by the Fund is affected by the timing of the declaration of dividends by the underlying funds in which the Fund invests. |
| (6) | Net realized and unrealized gain (loss) on investments per share are balancing amounts necessary to reconcile the change in net asset value per share for the year, and may not accord with the aggregate gains and losses in the Statement of Operations due to share transactions for the year. |
| (7) | Includes adjustments in accordance with accounting principles generally accepted in the United States of America and, consequently, the net asset value for financial reporting purposes and the returns based upon those net asset values may differ from the net asset values and returns for shareholder transactions. |
| (8) | Includes 0.02% for the year ended December 31, 2023 attributed to custody overdraft fees which are not subject to waiver by the Adviser. |
| (11) | Amount represents less than $0.01 per share. |
See accompanying notes to financial statements.
| BTS Managed Income Fund |
| FINANCIAL HIGHLIGHTS |
| |
Per Share Data and Ratios for a Share of Beneficial Interest Outstanding Throughout Each Period
| | | Class I | |
| | | For the | | | | | | | | | | | | | | | | |
| | | Six Months Ended | | | For the | | | For the | | | For the | | | For the | | | For the | |
| | | June 30, 2024 | | | Year Ended | | | Year Ended | | | Year Ended | | | Year Ended | | | Period* Ended | |
| | | (Unaudited) | | | December 31, 2023 | | | December 31, 2022 | | | December 31, 2021 | | | December 31, 2020 | | | December 31, 2019 | |
| Net asset value, beginning of period | | $ | 9.38 | | | $ | 9.11 | | | $ | 10.66 | | | $ | 10.93 | | | $ | 10.20 | | | $ | 10.00 | |
| | | | | | | | | | | | | | | | | | | | | | | | | |
| Activity from investment operations: | | | | | | | | | | | | | | | | | | | | | | | | |
| Net investment income (1) | | | 0.15 | | | | 0.33 | | | | 0.21 | | | | 0.15 | | | | 0.22 | | | | 0.21 | |
| Net realized and unrealized gain (loss) on investments | | | 0.01 | | | | 0.18 | (5) | | | (1.52 | ) | | | (0.27 | ) | | | 0.66 | | | | 0.20 | |
| Total from investment operations | | | 0.16 | | | | 0.51 | | | | (1.31 | ) | | | (0.12 | ) | | | 0.88 | | | | 0.41 | |
| | | | | | | | | | | | | | | | | | | | | | | | | |
| Less distributions from: | | | | | | | | | | | | | | | | | | | | | | | | |
| Net investment income | | | (0.16 | ) | | | (0.24 | ) | | | (0.24 | ) | | | (0.15 | ) | | | (0.14 | ) | | | (0.20 | ) |
| Return of capital | | | — | | | | — | | | | — | | | | — | | | | (0.01 | ) | | | (0.01 | ) |
| Total distributions | | | (0.16 | ) | | | (0.24 | ) | | | (0.24 | ) | | | (0.15 | ) | | | (0.15 | ) | | | (0.21 | ) |
| | | | | | | | | | | | | | | | | | | | | | | | | |
| Net asset value, end of period | | $ | 9.38 | | | $ | 9.38 | | | $ | 9.11 | | | $ | 10.66 | | | $ | 10.93 | | | $ | 10.20 | |
| | | | | | | | | | | | | | | | | | | | | | | | | |
| Total return (2) | | | 1.67 | % (7) | | | 5.65 | % | | | (12.32 | )% | | | (1.14 | )% | | | 8.63 | % | | | 4.06 | % (7) |
| | | | | | | | | | | | | | | | | | | | | | | | | |
| Net assets, at end of period (000’s) | | $ | 7,381 | | | $ | 7,024 | | | $ | 17,634 | | | $ | 24,261 | | | $ | 19,969 | | | $ | 1,156 | |
| | | | | | | | | | | | | | | | | | | | | | | | | |
| Ratio of gross expenses before waiver/reimbursement to average net assets (3) | | | 3.56 | % (8) | | | 2.13 | % (6) | | | 1.82 | % | | | 1.59 | % | | | 2.35 | % | | | 13.61 | % (8) |
| Ratio of net expenses to average net assets (3) | | | 1.50 | % (8) | | | 1.52 | % (6) | | | 1.50 | % | | | 1.50 | % | | | 1.50 | % | | | 1.50 | % (8) |
| Ratio of net investment income (loss) before waiver/reimbursement to average net assets (3,4) | | | 1.24 | % (8) | | | 2.96 | % | | | 1.84 | % | | | 1.24 | % | | | 1.16 | % | | | (10.07 | )% (8) |
| Ratio of net investment income to average net assets (3,4) | | | 3.28 | % (8) | | | 3.56 | % | | | 2.16 | % | | | 1.33 | % | | | 2.01 | % | | | 2.04 | % (8) |
| | | | | | | | | | | | | | | | | | | | | | | | | |
| Portfolio Turnover Rate | | | 45 | % (7) | | | 165 | % | | | 277 | % | | | 243 | % | | | 281 | % | | | 163 | % (7) |
| | | | | | | | | | | | | | | | | | | | | | | | | |
| * | The inception date of the Fund is December 31, 2018 and the Fund commenced operations on January 25, 2019. |
| (1) | Per share amounts calculated using the average shares method, which more appropriately presents the per share data for the period. |
| (2) | Total returns shown exclude the effect of applicable sales loads/redemption fees and assumes reinvestment of dividends and capital gain distributions, if any. Had the Adviser not waived a portion of its fees, total returns would have been lower. |
| (3) | The ratios of expenses and net investment income (loss) to average net assets do not reflect the Fund’s proportionate share of expenses of underlying investment companies in which the Fund invests. |
| (4) | The recognition of investment income (loss) by the Fund is affected by the timing of the declaration of dividends by the underlying funds in which the Fund invests. |
| (5) | Net realized and unrealized gain (loss) on investments per share are balancing amounts necessary to reconcile the change in net asset value per share for the year, and may not accord with the aggregate gains and losses in the Statement of Operations due to share transactions for the year. |
| (6) | Includes 0.02% for the year ended December 31, 2023 attributed to custody overdraft fees which are not subject to waiver by the Adviser. |
See accompanying notes to financial statements.
| BTS Managed Income Fund |
| FINANCIAL HIGHLIGHTS |
| |
Per Share Data and Ratios for a Share of Beneficial Interest Outstanding Throughout Each Period
| | | Class R | |
| | | For the | | | | | | | | | | | | | | | | |
| | | Six Months Ended | | | For the | | | For the | | | For the | | | For the | | | For the | |
| | | June 30, 2024 | | | Year Ended | | | Year Ended | | | Year Ended | | | Year Ended | | | Period* Ended | |
| | | (Unaudited) | | | December 31, 2023 | | | December 31, 2022 | | | December 31, 2021 | | | December 31, 2020 | | | December 31, 2019 | |
| Net asset value, beginning of period | | $ | 9.40 | | | $ | 9.14 | | | $ | 10.68 | | | $ | 10.93 | | | $ | 10.20 | | | $ | 10.00 | |
| | | | | | | | | | | | | | | | | | | | | | | | | |
| Activity from investment operations: | | | | | | | | | | | | | | | | | | | | | | | | |
| Net investment income (1) | | | 0.08 | | | | 0.28 | | | | 0.12 | | | | 0.09 | | | | 0.41 | | | | 0.21 | |
| Net realized and unrealized gain (loss) on investments | | | 0.05 | | | | 0.17 | (6) | | | (1.48 | ) | | | (0.25 | ) | | | 0.46 | | | | 0.20 | |
| Total from investment operations | | | 0.13 | | | | 0.45 | | | | (1.36 | ) | | | (0.16 | ) | | | 0.87 | | | | 0.41 | |
| | | | | | | | | | | | | | | | | | | | | | | | | |
| Less distributions from: | | | | | | | | | | | | | | | | | | | | | | | | |
| Net investment income | | | (0.13 | ) | | | (0.19 | ) | | | (0.18 | ) | | | (0.09 | ) | | | (0.13 | ) | | | (0.20 | ) |
| Return of capital | | | — | | | | — | | | | — | | | | — | | | | (0.01 | ) | | | (0.01 | ) |
| Total distributions | | | (0.13 | ) | | | (0.19 | ) | | | (0.18 | ) | | | (0.09 | ) | | | (0.14 | ) | | | (0.21 | ) |
| | | | | | | | | | | | | | | | | | | | | | | | | |
| | | | | | | | | | | | | | | | | | | | | | | | | |
| Net asset value, end of period | | $ | 9.40 | | | $ | 9.40 | | | $ | 9.14 | | | $ | 10.68 | | | $ | 10.93 | | | $ | 10.20 | |
| | | | | | | | | | | | | | | | | | | | | | | | | |
| Total return (2) | | | 1.43 | % (8) | | | 4.99 | % | | | (12.72 | )% | | | (1.45 | )% | | | 8.56 | % | | | 4.06 | % (8) |
| | | | | | | | | | | | | | | | | | | | | | | | | |
| Net assets, at end of period (000’s) | | $ | 35 | | | $ | 122 | | | $ | 136 | | | $ | 541 | | | $ | 343 | | | $ | 0 | (5) |
| | | | | | | | | | | | | | | | | | | | | | | | | |
| Ratio of gross expenses before waiver/reimbursement to average net assets (3) | | | 4.06 | % (9) | | | 2.63 | % (7) | | | 2.32 | % | | | 2.09 | % | | | 2.85 | % | | | 14.11 | % (9) |
| Ratio of net expenses to average net assets (3) | | | 2.00 | % (9) | | | 2.02 | % (7) | | | 2.00 | % | | | 2.00 | % | | | 2.00 | % | | | 2.00 | % (9) |
| Ratio of net investment income (loss) before waiver/reimbursement to average net assets (3,4) | | | (0.29 | )% (9) | | | 2.29 | % | | | 0.92 | % | | | 0.75 | % | | | 2.89 | % | | | (10.57 | )% (9) |
| Ratio of net investment income to average net assets (3,4) | | | 1.77 | % (9) | | | 3.01 | % | | | 1.19 | % | | | 0.84 | % | | | 3.74 | % | | | 1.54 | % (9) |
| | | | | | | | | | | | | | | | | | | | | | | | | |
| Portfolio Turnover Rate | | | 45 | % (8) | | | 165 | % | | | 277 | % | | | 243 | % | | | 281 | % | | | 163 | % (8) |
| | | | | | | | | | | | | | | | | | | | | | | | | |
| * | The inception date of the Fund is December 31, 2018 and the Fund commenced operations on January 25, 2019. |
| (1) | Per share amounts calculated using the average shares method, which more appropriately presents the per share data for the period. |
| (2) | Total returns shown exclude the effect of applicable sales loads/redemption fees and assumes reinvestment of dividends and capital gain distributions, if any. Had the Adviser not waived a portion of its fees, total returns would have been lower. |
| (3) | The ratios of expenses and net investment income (loss) to average net assets do not reflect the Fund’s proportionate share of expenses of underlying investment companies in which the Fund invests. |
| (4) | The recognition of investment income (loss) by the Fund is affected by the timing of the declaration of dividends by the underlying funds in which the Fund invests. |
| (6) | Net realized and unrealized gain (loss) on investments per share are balancing amounts necessary to reconcile the change in net asset value per share for the year, and may not accord with the aggregate gains and losses in the Statement of Operations due to share transactions for the year. |
| (7) | Includes 0.02% for the year ended December 31, 2023 attributed to custody overdraft fees which are not subject to waiver by the Adviser. |
See accompanying notes to financial statements.
| BTS Tactical Fixed Income Fund |
| FINANCIAL HIGHLIGHTS |
| |
Per Share Data and Ratios for a Share of Beneficial Interest Outstanding Throughout Each Period
| | | Class A | |
| | | For the | | | | | | | | | | | | | | | | |
| | | Six Months Ended | | | For the | | | For the | | | For the | | | For the | | | For the | |
| | | June 30, 2024 | | | Year Ended | | | Year Ended | | | Year Ended | | | Year Ended | | | Year Ended | |
| | | (Unaudited) | | | December 31, 2023 | | | December 31, 2022 | | | December 31, 2021 | | | December 31, 2020 | | | December 31, 2019 | |
| Net asset value, beginning of period | | $ | 7.72 | | | $ | 7.83 | | | $ | 9.17 | | | $ | 9.53 | | | $ | 9.46 | | | $ | 9.36 | |
| | | | | | | | | | | | | | | | | | | | | | | | | |
| Activity from investment operations: | | | | | | | | | | | | | | | | | | | | | | | | |
| Net investment income (1) | | | 0.12 | | | | 0.24 | | | | 0.15 | | | | 0.14 | | | | 0.07 | | | | 0.27 | |
| Net realized and unrealized gain (loss) on investments | | | (0.04 | ) | | | (0.08 | ) | | | (1.32 | ) | | | (0.34 | ) | | | 0.07 | | | | 0.13 | |
| Total from investment operations | | | 0.08 | | | | 0.16 | | | | (1.17 | ) | | | (0.20 | ) | | | 0.14 | | | | 0.40 | |
| | | | | | | | | | | | | | | | | | | | | | | | | |
| Less distributions from: | | | | | | | | | | | | | | | | | | | | | | | | |
| Net investment income | | | (0.13 | ) | | | (0.27 | ) | | | (0.17 | ) | | | (0.16 | ) | | | (0.07 | ) | | | (0.28 | ) |
| Return of capital | | | — | | | | — | | | | — | | | | — | | | | — | | | | (0.02 | ) |
| Total distributions | | | (0.13 | ) | | | (0.27 | ) | | | (0.17 | ) | | | (0.16 | ) | | | (0.07 | ) | | | (0.30 | ) |
| | | | | | | | | | | | | | | | | | | | | | | | | |
| | | | | | | | | | | | | | | | | | | | | | | | | |
| Net asset value, end of period | | $ | 7.67 | | | $ | 7.72 | | | $ | 7.83 | | | $ | 9.17 | | | $ | 9.53 | | | $ | 9.46 | |
| | | | | | | | | | | | | | | | | | | | | | | | | |
| Total return (2) | | | 0.98 | % (5) | | | 2.10 | % | | | (12.80 | )% | | | (2.18 | )% | | | 1.43 | % | | | 4.30 | % |
| | | | | | | | | | | | | | | | | | | | | | | | | |
| Net assets, at end of period (000’s) | | $ | 15,607 | | | $ | 19,236 | | | $ | 29,097 | | | $ | 46,556 | | | $ | 81,714 | | | $ | 85,500 | |
| | | | | | | | | | | | | | | | | | | | | | | | | |
| Ratio of expenses to average net assets (3) | | | 1.87 | % (6) | | | 1.73 | % | | | 1.65 | % | | | 1.54 | % | | | 1.47 | % | | | 1.49 | % |
| Ratio of net investment income to average net assets (3,4) | | | 3.03 | % (6) | | | 3.10 | % | | | 1.78 | % | | | 1.46 | % | | | 0.75 | % | | | 2.85 | % |
| | | | | | | | | | | | | | | | | | | | | | | | | |
| Portfolio Turnover Rate | | | 21 | % (5) | | | 463 | % | | | 899 | % | | | 513 | % | | | 1655 | % | | | 493 | % |
| | | | | | | | | | | | | | | | | | | | | | | | | |
| (1) | Per share amounts calculated using the average shares method, which more appropriately presents the per share data for the period. |
| (2) | Total returns shown exclude the effect of applicable sales loads/redemption fees and assumes reinvestment of dividends and capital gain distributions, if any. |
| (3) | The ratios of expenses and net investment income to average net assets do not reflect the Fund’s proportionate share of expenses of underlying investment companies in which the Fund invests. |
| (4) | The recognition of investment income by the Fund is affected by the timing of the declaration of dividends by the underlying funds in which the Fund invests. |
See accompanying notes to financial statements.
| BTS Tactical Fixed Income Fund |
| FINANCIAL HIGHLIGHTS |
| |
Per Share Data and Ratios for a Share of Beneficial Interest Outstanding Throughout Each Period
| | | Class C | |
| | | For the | | | | | | | | | | | | | | | | |
| | | Six Months Ended | | | For the | | | For the | | | For the | | | For the | | | For the | |
| | | June 30, 2024 | | | Year Ended | | | Year Ended | | | Year Ended | | | Year Ended | | | Year Ended | |
| | | (Unaudited) | | | December 31, 2023 | | | December 31, 2022 | | | December 31, 2021 | | | December 31, 2020 | | | December 31, 2019 | |
| Net asset value, beginning of period | | $ | 7.65 | | | $ | 7.76 | | | $ | 9.10 | | | $ | 9.47 | | | $ | 9.42 | | | $ | 9.32 | |
| | | | | | | | | | | | | | | | | | | | | | | | | |
| Activity from investment operations: | | | | | | | | | | | | | | | | | | | | | | | | |
| Net investment income (1) | | | 0.09 | | | | 0.18 | | | | 0.09 | | | | 0.07 | | | | 0.00 | (5) | | | 0.20 | |
| Net realized and unrealized gain (loss) on investments | | | (0.04 | ) | | | (0.08 | ) | | | (1.31 | ) | | | (0.35 | ) | | | 0.06 | | | | 0.13 | |
| Total from investment operations | | | 0.05 | | | | 0.10 | | | | (1.22 | ) | | | (0.28 | ) | | | 0.06 | | | | 0.33 | |
| | | | | | | | | | | | | | | | | | | | | | | | | |
| Less distributions from: | | | | | | | | | | | | | | | | | | | | | | | | |
| Net investment income | | | (0.10 | ) | | | (0.21 | ) | | | (0.12 | ) | | | (0.09 | ) | | | (0.01 | ) | | | (0.21 | ) |
| Return of capital | | | — | | | | — | | | | — | | | | — | | | | — | | | | (0.02 | ) |
| Total distributions | | | (0.10 | ) | | | (0.21 | ) | | | (0.12 | ) | | | (0.09 | ) | | | (0.01 | ) | | | (0.23 | ) |
| | | | | | | | | | | | | | | | | | | | | | | | | |
| Net asset value, end of period | | $ | 7.60 | | | $ | 7.65 | | | $ | 7.76 | | | $ | 9.10 | | | $ | 9.47 | | | $ | 9.42 | |
| | | | | | | | | | | | | | | | | | | | | | | | | |
| Total return (2) | | | 0.62 | % (7) | | | 1.33 | % | | | (13.43 | )% | | | (2.96 | )% | | | 0.67 | % | | | 3.53 | % |
| | | | | | | | | | | | | | | | | | | | | | | | | |
| Net assets, at end of period (000’s) | | $ | 14,359 | | | $ | 16,074 | | | $ | 22,295 | | | $ | 38,380 | | | $ | 63,806 | | | $ | 77,732 | |
| | | | | | | | | | | | | | | | | | | | | | | | | |
| Ratio of expenses to average net assets (3) | | | 2.62 | % (6) | | | 2.48 | % | | | 2.40 | % | | | 2.29 | % | | | 2.22 | % | | | 2.24 | % |
| | | | | | | | | | | | | | | | | | | | | | | | | |
| Ratio of net investment income to average net assets (3,4) | | | 2.32 | % (6) | | | 2.40 | % | | | 0.99 | % | | | 0.79 | % | | | 0.00 | % | | | 2.10 | % |
| | | | | | | | | | | | | | | | | | | | | | | | | |
| Portfolio Turnover Rate | | | 21 | % (7) | | | 463 | % | | | 899 | % | | | 513 | % | | | 1655 | % | | | 493 | % |
| | | | | | | | | | | | | | | | | | | | | | | | | |
| (1) | Per share amounts calculated using the average shares method, which more appropriately presents the per share data for the period. |
| (2) | Total returns shown exclude the effect of applicable sales loads/redemption fees and assumes reinvestment of dividends and capital gain distributions, if any. |
| (3) | The ratios of expenses and net investment income to average net assets do not reflect the Fund’s proportionate share of expenses of underlying investment companies in which the Fund invests. |
| (4) | The recognition of investment income by the Fund is affected by the timing of the declaration of dividends by the underlying funds in which the Fund invests. |
| (5) | Represents less than $0.005 per share. |
See accompanying notes to financial statements.
| BTS Tactical Fixed Income Fund |
| FINANCIAL HIGHLIGHTS |
| |
Per Share Data and Ratios for a Share of Beneficial Interest Outstanding Throughout Each Period
| | | Class I | |
| | | For the | | | | | | | | | | | | | | | | |
| | | Six Months Ended | | | For the | | | For the | | | For the | | | For the | | | For the | |
| | | June 30, 2024 | | | Year Ended | | | Year Ended | | | Year Ended | | | Year Ended | | | Year Ended | |
| | | (Unaudited) | | | December 31, 2023 | | | December 31, 2022 | | | December 31, 2021 | | | December 31, 2020 | | | December 31, 2019 | |
| Net asset value, beginning of period | | $ | 7.69 | | | $ | 7.80 | | | $ | 9.13 | | | $ | 9.50 | | | $ | 9.43 | | | $ | 9.33 | |
| | | | | | | | | | | | | | | | | | | | | | | | | |
| Activity from investment operations: | | | | | | | | | | | | | | | | | | | | | | | | |
| Net investment income (1) | | | 0.13 | | | | 0.26 | | | | 0.16 | | | | 0.17 | | | | 0.10 | | | | 0.29 | |
| Net realized and unrealized gain (loss) on investments | | | (0.05 | ) | | | (0.08 | ) | | | (1.30 | ) | | | (0.36 | ) | | | 0.06 | | | | 0.13 | |
| Total from investment operations | | | 0.08 | | | | 0.18 | | | | (1.14 | ) | | | (0.19 | ) | | | 0.16 | | | | 0.42 | |
| | | | | | | | | | | | | | | | | | | | | | | | | |
| Less distributions from: | | | | | | | | | | | | | | | | | | | | | | | | |
| Net investment income | | | (0.14 | ) | | | (0.29 | ) | | | (0.19 | ) | | | (0.18 | ) | | | (0.09 | ) | | | (0.30 | ) |
| Return of capital | | | — | | | | — | | | | — | | | | — | | | | — | | | | (0.02 | ) |
| Total distributions | | | (0.14 | ) | | | (0.29 | ) | | | (0.19 | ) | | | (0.18 | ) | | | (0.09 | ) | | | (0.32 | ) |
| | | | | | | | | | | | | | | | | | | | | | | | | |
| Net asset value, end of period | | $ | 7.63 | | | $ | 7.69 | | | $ | 7.80 | | | $ | 9.13 | | | $ | 9.50 | | | $ | 9.43 | |
| | | | | | | | | | | | | | | | | | | | | | | | | |
| Total return (2) | | | 0.98 | % (5)(6) | | | 2.38 | % | | | (12.51 | )% | | | (2.03 | )% | | | 1.69 | % | | | 4.59 | % |
| | | | | | | | | | | | | | | | | | | | | | | | | |
| Net assets, at end of period (000’s) | | $ | 34,137 | | | $ | 38,059 | | | $ | 66,555 | | | $ | 153,501 | | | $ | 321,023 | | | $ | 270,389 | |
| | | | | | | | | | | | | | | | | | | | | | | | | |
| Ratio of expenses to average net assets (3) | | | 1.62 | % (7) | | | 1.48 | % | | | 1.40 | % | | | 1.29 | % | | | 1.22 | % | | | 1.24 | % |
| | | | | | | | | | | | | | | | | | | | | | | | | |
| Ratio of net investment income to average net assets (3,4) | | | 3.33 | % (7) | | | 3.28 | % | | | 1.85 | % | | | 1.77 | % | | | 1.09 | % | | | 3.10 | % |
| | | | | | | | | | | | | | | | | | | | | | | | | |
| Portfolio Turnover Rate | | | 21 | % (6) | | | 463 | % | | | 899 | % | | | 513 | % | | | 1655 | % | | | 493 | % |
| | | | | | | | | | | | | | | | | | | | | | | | | |
| (1) | Per share amounts calculated using the average shares method, which more appropriately presents the per share data for the period. |
| (2) | Total returns shown exclude the effect of applicable sales loads/redemption fees and assumes reinvestment of dividends and capital gain distributions, if any. |
| (3) | The ratios of expenses and net investment income to average net assets do not reflect the Fund’s proportionate share of expenses of underlying investment companies in which the Fund invests. |
| (4) | The recognition of investment income by the Fund is affected by the timing of the declaration of dividends by the underlying funds in which the Fund invests. |
| (5) | Includes adjustments in accordance with accounting principles generally accepted in the United States of America and, consequently, the net asset value for financial reporting purposes and the returns based upon those net asset values may differ from the net asset values and returns for shareholder transactions. |
See accompanying notes to financial statements.
| BTS Tactical Fixed Income Fund |
| FINANCIAL HIGHLIGHTS |
| |
Per Share Data and Ratios for a Share of Beneficial Interest Outstanding Throughout Each Period
| | | Class R | |
| | | For the | | | | | | | | | | | | | | | | |
| | | Six Months Ended | | | For the | | | For the | | | For the | | | For the | | | For the | |
| | | June 30, 2024 | | | Year Ended | | | Year Ended | | | Year Ended | | | Year Ended | | | Year Ended | |
| | | (Unaudited) | | | December 31, 2023 | | | December 31, 2022 | | | December 31, 2021 | | | December 31, 2020 | | | December 31, 2019 | |
| Net asset value, beginning of period | | $ | 7.69 | | | $ | 7.80 | | | $ | 9.13 | | | $ | 9.50 | | | $ | 9.44 | | | $ | 9.34 | |
| | | | | | | | | | | | | | | | | | | | | | | | | |
| Activity from investment operations: | | | | | | | | | | | | | | | | | | | | | | | | |
| Net investment income (1) | | | 0.11 | | | | 0.21 | | | | 0.12 | | | | 0.12 | | | | 0.05 | | | | 0.25 | |
| Net realized and unrealized gain (loss) on investments | | | (0.05 | ) | | | (0.07 | ) | | | (1.30 | ) | | | (0.36 | ) | | | 0.06 | | | | 0.13 | |
| Total from investment operations | | | 0.06 | | | | 0.14 | | | | (1.18 | ) | | | (0.24 | ) | | | 0.11 | | | | 0.38 | |
| | | | | | | | | | | | | | | | | | | | | | | | | |
| Less distributions from: | | | | | | | | | | | | | | | | | | | | | | | | |
| Net investment income | | | (0.11 | ) | | | (0.25 | ) | | | (0.15 | ) | | | (0.13 | ) | | | (0.05 | ) | | | (0.26 | ) |
| Return of capital | | | — | | | | — | | | | — | | | | — | | | | — | | | | (0.02 | ) |
| Total distributions | | | (0.11 | ) | | | (0.25 | ) | | | (0.15 | ) | | | (0.13 | ) | | | (0.05 | ) | | | (0.28 | ) |
| | | | | | | | | | | | | | | | | | | | | | | | | |
| Net asset value, end of period | | $ | 7.64 | | | $ | 7.69 | | | $ | 7.80 | | | $ | 9.13 | | | $ | 9.50 | | | $ | 9.44 | |
| | | | | | | | | | | | | | | | | | | | | | | | | |
| Total return (2) | | | 0.84 | % (5)(6) | | | 1.83 | % | | | (12.93 | )% | | | (2.55 | )% | | | 1.22 | % | | | 4.05 | % |
| | | | | | | | | | | | | | | | | | | | | | | | | |
| Net assets, at end of period (000’s) | | $ | 710 | | | $ | 945 | | | $ | 1,771 | | | $ | 3,302 | | | $ | 5,674 | | | $ | 6,526 | |
| | | | | | | | | | | | | | | | | | | | | | | | | |
| Ratio of expenses to average net assets (3) | | | 2.12 | % (7) | | | 1.98 | % | | | 1.90 | % | | | 1.79 | % | | | 1.72 | % | | | 1.74 | % |
| Ratio of net investment income to average net assets (3,4) | | | 2.86 | % (7) | | | 2.78 | % | | | 1.49 | % | | | 1.25 | % | | | 0.55 | % | | | 2.60 | % |
| | | | | | | | | | | | | | | | | | | | | | | | | |
| Portfolio Turnover Rate | | | 21 | % (6) | | | 463 | % | | | 899 | % | | | 513 | % | | | 1655 | % | | | 493 | % |
| | | | | | | | | | | | | | | | | | | | | | | | | |
| (1) | Per share amounts calculated using the average shares method, which more appropriately presents the per share data for the period. |
| (2) | Total returns shown exclude the effect of applicable sales loads/redemption fees and assumes reinvestment of dividends and capital gain distributions, if any. |
| (3) | The ratios of expenses and net investment income to average net assets do not reflect the Fund’s proportionate share of expenses of underlying investment companies in which the Fund invests. |
| (4) | The recognition of investment income by the Fund is affected by the timing of the declaration of dividends by the underlying funds in which the Fund invests. |
| (5) | Includes adjustments in accordance with accounting principles generally accepted in the United States of America and, consequently, the net asset value for financial reporting purposes and the returns based upon those net asset values may differ from the net asset values and returns for shareholder transactions. |
See accompanying notes to financial statements.
| BTS Funds |
| NOTES TO FINANCIAL STATEMENTS (Unaudited) |
| June 30, 2024 |
| |
BTS Managed Income Fund (“Managed Income Fund”) and BTS Tactical Fixed Income Fund (“Fixed Income Fund”), each a “Fund” and together, the “Funds”, are a diversified series of shares of beneficial interest of Northern Lights Fund Trust (the “Trust”), a trust organized under the laws of the State of Delaware on January 19, 2005 and registered under the Investment Company Act of 1940, as amended (the “1940 Act”), as an open-end management investment company. The Fixed Income Fund commenced operations on May 31, 2013 and the Managed Income Fund commenced operations on January 25, 2019. The investment objectives of each Fund are to seek to provide total return.
Each Fund currently offers four classes of shares: Class A shares, Class C shares, Class I shares and Class R shares. For the Fixed Income Fund the Class A shares and Class C shares commenced operations on May 31, 2013, Class I shares commenced operations on May 27, 2015 and Class R shares commenced operations on May 5, 2015. The Managed Income Fund’s Class A shares, Class C shares, Class I shares and Class R shares commenced operations on January 25, 2019. Class A shares of each Fund are offered at net asset value plus a maximum sales charge of 3.75% for each Fund. Class C shares, Class I shares and Class R shares are offered at net asset value. Each class of shares of the Funds have identical rights and privileges, except with respect to arrangements pertaining to shareholder servicing or distribution, class-related expenses, voting rights on matters affecting a single class of shares, and the exchange privilege of each class of shares. The Funds share classes differ in the fees and expenses charged to shareholders. The Funds’ income, expenses (other than class specific distribution fees) and realized and unrealized gains and losses are allocated proportionately each day based upon the relative net assets of each class. The Funds are “fund of funds”, in that they will generally invest in other investment companies.
| 2. | SIGNIFICANT ACCOUNTING POLICIES |
The following is a summary of significant accounting policies followed by the Funds in the preparation of their financial statements. These policies are in conformity with accounting principles generally accepted in the United States of America (“GAAP”). The preparation of financial statements in conformity with GAAP requires management to make estimates and assumptions that affect the reported amounts of assets and liabilities and disclosure of contingent assets and liabilities at the date of the financial statements and the reported amounts of increases and decreases in net assets from operations during the reporting period. Actual results could differ from those estimates. The Funds are investment companies and accordingly follows the investment company accounting and reporting guidance of the Financial Accounting Standards Board (“FASB”) Accounting Standards Codification Topic 946 “Financial Services – Investment Companies” including FASB Accounting Standards Update (“ASU”) 2013-08.
Securities Valuation – Securities listed on an exchange are valued at the last reported sale price at the close of the regular trading session of the primary exchange on the business day the value is being determined, or in the case of securities listed on NASDAQ at the NASDAQ Official Closing Price (“NOCP”). In the absence of a sale, such securities shall be valued at the mean between the current bid and ask prices on the day of valuation. Debt securities (other than short-term obligations) are valued each day by an independent pricing service approved by the Trust’s Board of Trustees (the “Board”) based on methods which include consideration of: yields or prices of securities of comparable quality, coupon, maturity and type, indications as to values from dealers, and general market conditions or market quotations from a major market maker in the securities. Investments valued in currencies other than the U.S. dollar are converted to U.S. dollars using exchange rates obtained from pricing services. Short-term debt obligations having 60 days or less remaining until maturity, at time of purchase, may be valued at amortized cost. Investments in open-end investment companies are valued at net asset value.
Valuation of Underlying Funds – The Funds may invest in portfolios of open-end or closed-end investment companies (the “Underlying Funds”). The Underlying Funds value securities in their portfolios for which market quotations are readily available at their market values (generally the last reported sale price) and all other securities and assets at their fair value to the methods established by the board of directors of the Underlying Funds.
Open-end investment companies are valued at their respective net asset values as reported by such investment companies. The shares of many closed-end investment companies, after their initial public offering, frequently trade at a price per share, which is different than the net asset value per share. The difference represents a market premium or market discount of such shares. There can be no assurances that the market discount or market premium on shares of any closed-end investment company purchased by the Funds will not change.
| BTS Funds |
| NOTES TO FINANCIAL STATEMENTS (Unaudited)(Continued) |
| June 30, 2024 |
| |
Exchange Traded Funds – The Funds may invest in exchange traded funds (“ETFs”). ETFs are a type of fund bought and sold on a securities exchange. An ETF trades like common stock and represents a fixed portfolio of securities designed to track the performance and dividend yield of a particular domestic or foreign market index. The Funds may purchase an ETF to gain exposure to a portion of the U.S. or a foreign market. The risks of owning an ETF generally reflect the risks of owning the underlying securities they are designed to track, although the lack of liquidity on an ETF could result in it being more volatile. Additionally, ETFs have fees and expenses that reduce their value.
The Funds may hold securities, such as private investments, interests in commodity pools, other non-traded securities or temporarily illiquid securities, for which market quotations are not readily available or are determined to be unreliable. These securities will be valued using the “fair value” procedures approved by the Board. The Board has delegated execution of these procedures to the Adviser as its valuation designee (the “Valuation Designee”). The Board may also enlist third party consultants such a valuation specialist at a public accounting firm, valuation consultant or financial officer of a security issuer on an as-needed basis to assist the Valuation Designee in determining a security-specific fair value. The Board is responsible for reviewing and approving fair value methodologies utilized by the Valuation Designee, which approval shall be based upon whether the Valuation Designee followed the valuation procedures established by the Board.
Fair Valuation Process – The applicable investments are valued by the Valuation Designee pursuant to valuation procedures established by the Board. For example, fair value determinations are required for the following securities: (i) securities for which market quotations are insufficient or not readily available on a particular business day (including securities for which there is a short and temporary lapse in the provision of a price by the regular pricing source); (ii) securities for which, in the judgment of the Valuation Designee, the prices or values available do not represent the fair value of the instrument; factors which may cause the Valuation Designee to make such a judgment include, but are not limited to, the following: only a bid price or an asked price is available; the spread between bid and asked prices is substantial; the frequency of sales; the thinness of the market; the size of reported trades; and actions of the securities markets, such as the suspension or limitation of trading; (iii) securities determined to be illiquid; and (iv) securities with respect to which an event that will affect the value thereof has occurred (a “significant event”) since the closing prices were established on the principal exchange on which they are traded, but prior to a Fund’s calculation of its net asset value. Specifically, interests in commodity pools or managed futures pools are valued on a daily basis by reference to the closing market prices of each futures contract or other asset held by a pool, as adjusted for pool expenses. Restricted or illiquid securities, such as private investments or non-traded securities are valued based upon the current bid for the security from two or more independent dealers or other parties reasonably familiar with the facts and circumstances of the security (who should take into consideration all relevant factors as may be appropriate under the circumstances). If a current bid from such independent dealers or other independent parties is unavailable, the Valuation Designee shall determine, the fair value of such security using the following factors: (i) the type of security; (ii) the cost at date of purchase; (iii) the size and nature of the Fund’s holdings; (iv) the discount from market value of unrestricted securities of the same class at the time of purchase and subsequent thereto; (v) information as to any transactions or offers with respect to the security; (vi) the nature and duration of restrictions on disposition of the security and the existence of any registration rights; (vii) how the yield of the security compares to similar securities of companies of similar or equal creditworthiness; (viii) the level of recent trades of similar or comparable securities; (ix) the liquidity characteristics of the security; (x) current market conditions; and (xi) the market value of any securities into which the security is convertible or exchangeable.
The Funds utilize various methods to measure the fair value of all of its investments on a recurring basis. GAAP establishes a hierarchy that prioritizes inputs to valuation methods. The three levels of input are:
Level 1 – Unadjusted quoted prices in active markets for identical assets and liabilities that a Fund has the ability to access.
Level 2 – Observable inputs other than quoted prices included in Level 1 that are observable for the asset or liability, either directly or indirectly. These inputs may include quoted prices for the identical instrument in an inactive market, prices for similar instruments, interest rates, prepayment speeds, credit risk, yield curves, default rates and similar data.
Level 3 – Unobservable inputs for the asset or liability, to the extent relevant observable inputs are not available, representing a Fund’s own assumptions about the assumptions a market participant would use in valuing the asset or liability, and would be based on the best information available.
| BTS Funds |
| NOTES TO FINANCIAL STATEMENTS (Unaudited)(Continued) |
| June 30, 2024 |
| |
The availability of observable inputs can vary from security to security and is affected by a wide variety of factors, including, for example, the type of security, whether the security is new and not yet established in the marketplace, the liquidity of markets, and other characteristics particular to the security. To the extent that valuation is based on models or inputs that are less observable or unobservable in the market, the determination of fair value requires more judgment. Accordingly, the degree of judgment exercised in determining fair value is greatest for instruments categorized in Level 3.
The inputs used to measure fair value may fall into different levels of the fair value hierarchy. In such cases, for disclosure purposes, the level in the fair value hierarchy within which the fair value measurement falls in its entirety, is determined based on the lowest level input that is significant to the fair value measurement in its entirety.
The inputs or methodology used for valuing securities are not necessarily an indication of the risk associated with investing in those securities. The following tables, summarizes the inputs used as of June 30, 2024 for the Funds’ investments measured at fair value:
Managed Income Fund
| Assets * | | Level 1 | | | Level 2 | | | Level 3 | | | Total | |
| Exchange-Traded Funds | | $ | 7,864,839 | | | $ | — | | | $ | — | | | $ | 7,864,839 | |
| Short Term Investment | | | 93,003 | | | | — | | | | — | | | | 93,003 | |
| Total Investments | | $ | 7,957,842 | | | $ | — | | | $ | — | | | $ | 7,957,842 | |
Fixed Income Fund
| Assets * | | Level 1 | | | Level 2 | | | Level 3 | | | Total | |
| Exchange-Traded Funds | | $ | 64,372,645 | | | $ | — | | | $ | — | | | $ | 64,372,645 | |
| Short Term Investment | | | 570,337 | | | | — | | | | — | | | | 570,337 | |
| Total Investments | | $ | 64,942,982 | | | $ | — | | | $ | — | | | $ | 64,942,982 | |
The Funds did not hold any Level 2 or Level 3 securities during the period.
| * | Please refer to the Schedule of Investments for Classification. |
Security Transactions and Related Income – Security transactions are accounted for on trade date. Interest income is recognized on an accrual basis. Discounts are accreted and premiums are amortized on securities purchased over the lives of the respective securities. Dividend income is recorded on the ex-dividend date. Realized gains or losses from sales of securities are determined by comparing the identified cost of the security lot sold with the net sales proceeds.
Dividends and Distributions to Shareholders – Dividends from net investment income, if any, are declared and paid quarterly. Distributable net realized capital gains, if any, are declared and distributed annually. Dividends from net investment income and distributions from net realized gains are recorded on the ex-dividend date and are determined in accordance with federal income tax regulations, which may differ from GAAP. These “book/tax” differences are considered either temporary (i.e., deferred losses, capital loss carry forwards) or permanent in nature. To the extent these differences are permanent in nature, such amounts are reclassified within the composition of net assets based on the Federal tax-basis treatment; temporary differences do not require reclassification. These reclassifications have no effect on net assets, results from operations or net asset value per share of the Funds.
Federal Income Tax – Each Fund intends to comply with the requirements of the Internal Revenue Code applicable to regulated investment companies and to distribute all of its taxable income to its shareholders. Therefore, no federal income tax provision is required. The Funds recognize the tax benefits of uncertain tax positions only where the position is “more likely than not” to be sustained assuming examination by tax authorities. Management has analyzed the Funds’ tax positions and has concluded that no liability for unrecognized tax benefits should be recorded related to uncertain tax positions taken on returns filed for open tax years ended December 31, 2021 to December 31, 2023 or expected to be taken in the Funds’ December 31, 2024 year-end tax return. The Funds identify their major tax jurisdictions as U.S. federal, Ohio and foreign jurisdictions where the Funds may make significant investments. The Funds are not aware of any tax positions for which it is reasonably possible that the total amounts of unrecognized tax benefits will change materially in the next twelve months.
Expenses – Expenses of the Trust that are directly identifiable to a specific fund are charged to that fund. Expenses which are not readily identifiable to a specific fund are allocated in such a manner as deemed equitable, taking into consideration the nature and type of expense and the relative sizes of the funds in the Trust.
| BTS Funds |
| NOTES TO FINANCIAL STATEMENTS (Unaudited)(Continued) |
| June 30, 2024 |
| |
Indemnification – The Trust indemnifies its officers and Trustees for certain liabilities that may arise from the performance of their duties to the Trust. Additionally, in the normal course of business, the Funds enter into contracts that contain a variety of representations and warranties and which provide general indemnities. The Funds’ maximum exposure under these arrangements is unknown, as this would involve future claims that may be made against the Funds that have not yet occurred. However, based on experience, the risk of loss due to these warranties and indemnities appears to be remote.
Cash and Cash Equivalents – Cash and cash equivalents are held with a financial institution. The assets of the Funds may be placed in deposit accounts at U.S. banks and such deposits generally exceed Federal Deposit Insurance Corporation (“FDIC”) insurance limits. The FDIC insures deposit accounts up to $250,000 for each accountholder. The counterparty is generally a single bank rather than a group of financial institutions; thus, there may be a greater counterparty credit risk. The Funds place deposits only with those counterparties which are believed to be creditworthy and there has been no history of loss.
Securities Lending Risk – The Funds may lend portfolio securities to institutions, such as banks and certain broker-dealers. A Fund may experience a loss or delay in the recovery of its securities if the borrowing institution breaches its agreement with the Fund (see additional information at Note 7).
Market and Geopolitical Risk – The increasing interconnectivity between global economies and financial markets increases the likelihood that events or conditions in one region or financial market may adversely impact issuers in a different country, region or financial market. Securities in the Funds’ portfolio may underperform due to inflation (or expectations for inflation), interest rates, global demand for particular products or resources, natural disasters, climate-change and climate-related events, pandemics, epidemics, terrorism, regulatory events and governmental or quasi-governmental actions. The occurrence of global events similar to those in recent years may result in market volatility and may have long term effects on both the U.S. and global financial markets. It is not known how long such impacts, or any future impacts of other significant events described above, will or would last, but there could be a prolonged period of global economic slowdown, which may impact your investment in the Funds.
| 3. | INVESTMENT TRANSACTIONS |
For the six months ended June 30, 2024, cost of purchases and proceeds from sales of portfolio securities, other than short-term investments were as follows:
| | | Purchases | | | Sales | |
| Managed Income Fund | | $ | 3,991,519 | | | $ | 3,609,209 | |
| Fixed Income Fund | | | 14,660,834 | | | | 24,130,232 | |
| | | | | | | | | |
| 4. | INVESTMENT ADVISORY AGREEMENT AND TRANSACTIONS WITH RELATED PARTIES |
BTS Asset Management, Inc. serves as the Funds’ investment advisor (the “Advisor”). Pursuant to an investment advisory agreement with the Trust, on behalf of the Funds, the Advisor, under the supervision of the Board, oversees the daily operations of the Funds and supervises the performance of administrative and professional services provided by others. As compensation for its services and the related expenses borne by the Advisor, the Fixed Income Fund pays the Advisor an investment advisory fee, computed and accrued daily and paid monthly, at an annual rate of 1.00% of the Fixed Income Fund’s average daily net assets. As compensation for its services and the related expenses borne by the Advisor, the Managed Income Fund pays the Advisor an investment advisory fee, computed and accrued daily and paid monthly, at an annual rate of 0.65% of the Managed Income Fund’s average daily net assets. For the six months ended June 30, 2024, the Funds incurred fees as follows:
| | | Advisory Fees | |
| Managed Income Fund | | $ | 26,965 | |
| Fixed Income Fund | | | 347,906 | |
| | | | | |
Pursuant to a written contract (the “Waiver Agreement”), the Advisor has agreed to waive all or part of its advisory fees and/or make payments to limit the Funds’ expenses (exclusive of any front-end or contingent deferred loads, brokerage fees and commissions, acquired fund fees and expenses, fees and expenses associated with investments in other collective investment vehicles or derivative instruments (including for example option and swap fees and expenses), borrowing costs
| BTS Funds |
| NOTES TO FINANCIAL STATEMENTS (Unaudited)(Continued) |
| June 30, 2024 |
| |
(such as interest and dividend expense on securities sold short), taxes, and extraordinary expenses, such as litigation expenses (which may include indemnification of Fund officers and Trustees, contractual indemnification of the Funds’ service providers (other than the Advisor))) at least until April 30, 2025, so that the total annual operating expenses of the Fixed Income Fund do not exceed 2.00%, 2.75%, 1.75%, and 2.25% of the average daily net assets of the Fixed Income Fund’s Class A, Class C, Class I, and Class R shares, respectively, and that the annual operating expenses of Managed Income Fund do not exceed 1.75%, 2.50%, 1.50% and 2.00% of the average daily net assets of the Managed Income Fund’s Class A, Class C, Class I and Class R shares respectively. Contractual waivers and expense payments may be recouped by the Advisor from the Funds, to the extent that overall expenses fall below the expense limitation, within three years of when the amounts were waived.
For the six months ended June 30, 2024, the Advisor waived fees and reimbursed expenses pursuant to the Waiver Agreement as follows:
| | | Advisory Fees Waived | |
| Managed Income Fund | | $ | 84,884 | |
| Fixed Income Fund | | | — | |
| | | | | |
As of June 30, 2024, the Advisor may recapture all or a portion of the waived fees no later than the date stated below:
| | | December 31, 2024 | | | December 31, 2025 | | | December 31, 2026 | | | Total | |
| Managed Income Fund | | $ | 21,506 | | | $ | 73,687 | | | $ | 99,003 | | | $ | 194,196 | |
| Fixed Income Fund | | | — | | | | — | | | | — | | | | — | |
| | | | | | | | | | | | | | | | | |
Distributor – The distributor of the Funds is Northern Lights Distributors, LLC (“NLD” or the “Distributor”). The Trust has adopted, on behalf of the Funds, the Trust’s Master Distribution and Shareholder Servicing Plans (the “Plans”), as amended, for Class A, Class C and Class R shares pursuant to Rule 12b-1 under the 1940 Act, to pay for certain distribution activities and shareholder services. Under the Plan, the Funds may pay an annual rate of 0.25% of the average daily net assets of the Funds’ Class A shares, 1.00% of the average daily net assets for the Funds’ Class C shares, and 0.50% of the average daily net assets for the Funds’ Class R shares for distribution and shareholder service activities. For the six months ended June 30, 2024, the Funds incurred distribution fees as follows:
| | | Class A | | | Class C | | | Class R | |
| Managed Income Fund | | $ | 274 | | | $ | 1,592 | | | $ | 128 | |
| Fixed Income Fund | | | 20,998 | | | | 75,126 | | | | 2,443 | |
| | | | | | | | | | | | | |
The Distributor acts as the Funds’ principal underwriter in a continuous public offering of the Funds’ shares. For the six months ended June 30, 2024, the Distributor received underwriter commissions for sales of the Funds’ Class A shares as follows:
| | | | | | Amount | |
| | | Underwriter | | | Retained By | |
| | | Commissions | | | Principal Underwriter | |
| Managed Income Fund | | $ | — | | | $ | — | |
| Fixed Income Fund | | | 33 | | | | 5 | |
| | | | | | | | | |
In addition, certain affiliates of the Distributor provide services to the Funds as follows:
Ultimus Fund Solutions, LLC (“UFS”), an affiliate of the Distributor, provides administration, fund accounting, and transfer agent services to the Trust. Pursuant to a separate servicing agreement with UFS, the Funds pay UFS customary fees for providing administration, fund accounting and transfer agency services to the Funds. Certain officers of the Trust are also officers of UFS and are not paid any fees directly by the Funds for serving in such capacities.
Northern Lights Compliance Services, LLC (“NLCS”), an affiliate of UFS and the Distributor, provides a Chief Compliance Officer to the Trust, as well as related compliance services, pursuant to a consulting agreement between NLCS and the Trust. Under the terms of such agreement, NLCS receives customary fees from the Fund.
| BTS Funds |
| NOTES TO FINANCIAL STATEMENTS (Unaudited)(Continued) |
| June 30, 2024 |
| |
Blu Giant, LLC (“Blu Giant”), an affiliate of UFS and the Distributor, provides EDGAR conversion and filing services as well as print management services for the Fund on an ad-hoc basis. For the provision of these services, Blu Giant receives customary fees from the Funds.
| 5. | AGGREGATE UNREALIZED APPRECIATION AND DEPRECIATION – TAX BASIS |
| | | | | | Gross | | | Gross | | | Net Unrealized | |
| | | Tax | | | Unrealized | | | Unrealized | | | Appreciation | |
| | | Cost | | | Appreciation | | | Depreciation | | | (Depreciation) | |
| Managed Income Fund | | $ | 7,828,711 | | | $ | 200,120 | | | $ | (70,989 | ) | | $ | 129,131 | |
| Fixed Income Fund | | $ | 63,061,032 | | | $ | 1,882,857 | | | $ | (907 | ) | | $ | 1,881,950 | |
| | | | | | | | | | | | | | | | | |
| 6. | DISTRIBUTIONS TO SHAREHOLDERS AND TAX COMPONENTS OF CAPITAL |
The tax character of fund distributions paid for the year ended December 31, 2023, and December 31, 2022, was as follows:
| For fiscal year ended | | Ordinary | | | Long-Term | | | Return of | | | | |
| 12/31/2023 | | Income | | | Capital Gains | | | Capital | | | Total | |
| Managed Income Fund | | $ | 452,988 | | | $ | — | | | $ | — | | | $ | 452,988 | |
| Tactical Fixed Income Fund | | | 2,939,319 | | | | — | | | | — | | | | 2,939,319 | |
| | | | | | | | | | | | | | | | | |
| For fiscal year ended | | Ordinary | | | Long-Term | | | Return of | | | | |
| 12/31/2022 | | Income | | | Capital Gains | | | Capital | | | Total | |
| Managed Income Fund | | $ | 302,355 | | | $ | 209,499 | | | $ | — | | | $ | 511,854 | |
| Tactical Fixed Income Fund | | | 2,823,490 | | | | — | | | | — | | | | 2,823,490 | |
| | | | | | | | | | | | | | | | | |
As of December 31, 2023, the components of accumulated earnings/(deficit) on a tax basis were as follows:
| | | Undistributed | | | Undistributed | | | Post October Loss | | | Capital Loss | | | Other | | | Unrealized | | | Total | |
| | | Ordinary | | | Long-Term | | | and | | | Carry | | | Book/Tax | | | Appreciation/ | | | Accumulated | |
| | | Income | | | Capital Gains | | | Late Year Loss | | | Forwards | | | Differences | | | (Depreciation) | | | Earnings/(Deficits) | |
| Managed Income Fund | | $ | 263,727 | | | $ | — | | | $ | — | | | $ | (4,156,780 | ) | | $ | — | | | $ | 120,987 | | | $ | (3,772,066 | ) |
| Tactical Fixed Income Fund | | | 465,374 | | | | — | | | | — | | | | (112,574,267 | ) | | | — | | | | 2,446,168 | | | | (109,662,725 | ) |
| | | | | | | | | | | | | | | | | | | | | | | | | | | | | |
The difference between book basis and tax basis undistributed net investment income, accumulated net realized gain/(loss), and unrealized depreciation from investments is primarily attributable to the tax deferral of losses on wash sales.
At December 31, 2023, the Fund had capital loss carry forwards for federal income tax purposes available to offset future capital gains as follows:
| | | Capital Loss Carry Forward | |
| Fund | | Short-Term | | | Long-Term | | | Total | | | Utilized | |
| Managed Income Fund | | | 2,117,806 | | | | 2,038,974 | | | | 4,156,780 | | | | — | |
| Tactical Fixed Income Fund | | | 112,574,267 | | | | — | | | | 112,574,267 | | | | — | |
| | | | | | | | | | | | | | | | | |
Under an agreement (the “Securities Lending Agreement”) with the Securities Finance Trust Company (“SFTC”), the Funds can lend their portfolio securities to brokers, dealers and other financial institutions approved by the Board to earn additional income. For each securities loan, the borrower shall transfer collateral in an amount determined by applying the margin to the market value of the loaned available securities (102% for same currency and 105% for cross currency). Collateral is invested in highly liquid, short-term instruments such as money market funds in accordance with the Funds’ security lending procedures. The Funds continue to receive interest or dividends on the securities loaned. The Funds have the right under the Securities Lending Agreement to recover the securities from the borrower on demand; if the borrower fails to deliver the securities on a timely basis, the Funds could experience delays or losses on recovery. Additionally, the Funds are subject to the risk of loss from investments made with the cash received as collateral. The Funds manage credit exposure arising from these lending transactions by, in appropriate circumstances, entering into master netting agreements and collateral agreements
| BTS Funds |
| NOTES TO FINANCIAL STATEMENTS (Unaudited)(Continued) |
| June 30, 2024 |
| |
with third party borrowers that provide in the event of default (such as bankruptcy or a borrower’s failure to pay or perform), the right to net a third-party borrower’s rights and obligations under such agreement and liquidate and set off collateral against the net amount owed by the counterparty. The Funds did not have any securities lending transactions accounted for as secured borrowings outstanding as of June 30, 2024.
The Fixed Income Fund and the Managed Income Fund have each entered into a line of credit agreement with U.S. Bank N.A. for investment purposes subject to the limitations of the 1940 Act for borrowings. The maximum amount the Fixed Income Fund is allowed to borrow under its agreement is the lesser of $18,000,000, or 20% of the gross market value of the Fixed Income Fund or 33 1/3% of the gross market value (as determined solely by the Bank using consistently applied valuation methods disclosed to the Borrower) of the unencumbered assets of the Fixed Income Fund. The maximum amount the Managed Income Fund is allowed to borrow under its agreement is the lesser of $2,000,000 or 20% of the gross market value of the Managed Income Fund or 33 1/3% of the gross market value (as determined solely by the Bank using consistently applied valuation methods disclosed to the Borrower) of the unencumbered assets of the Managed Income Fund. Borrowings under each agreement bear interest at the Prime Rate of 8.5% as of June 30, 2024, per annum, on the principal balance outstanding. The maturity date of each line of credit is July 29, 2024. During the six months ended June 30, 2024, the Fixed Income Fund and the Managed Income Fund did not draw upon or access the line of credit. As a result, average borrowings and the average interest rate on the line during the six months ended June 30, 2024, were $0 and 0%, respectively, for both the Fixed Income Fund and the Managed Income Fund.
| 9. | UNDERLYING INVESTMENTS IN OTHER INVESTMENT COMPANIES |
The Fixed Income Fund currently invests a portion of its assets in the Xtrackers USD High Yield Corporate Bond ETF (the “HYLB ETF”). The HYLB ETF seeks investment results that correspond generally to the performance, before fees and expenses, of the Solactive USD High Yield Corporates Total Market Index; a rules-based, market value weighted index engineered to mirror the performance of high-yield-rated corporate bonds issued in U.S. dollars. The Fixed Income Fund may redeem its investment from the HYLB ETF at any time if the Advisor determines that it is in the best interest of the Fixed Income Fund and its shareholders to do so. The performance of the Fixed Income Fund will be directly affected by the performance of the HYLB ETF. The financial statements of the HYLB ETF, including the portfolio of investments, can be found at the Securities and Exchange Commission’s (“SEC”) website www.sec.gov and should be read in conjunction with the Fixed Income Fund’s financial statements. As of June 30, 2024, the percentage of the Fixed Income Fund’s net assets invested in the HYLB ETF was 68.9%.
The beneficial ownership, either directly or indirectly, of more than 25% of the voting securities of a fund creates presumption of control of the fund, under Section 2(a)(9) of the 1940 Act. As of June 30, 2024, the shareholders listed below held, for the benefit of others, more than 25% of an individual Fund and may be deemed to control that Fund. The Funds have no knowledge as to whether all or any portion of the shares owned, by the parties noted below, are also owned beneficially by any party who would be presumed to control the respective Funds.
| Shareholder | | Fund | | Percent |
| Pershing LLC | | Managed Income Fund | | 41.7% |
| Pershing LLC | | Tactical Fixed Income Fund | | 39.7% |
| | | | | |
Subsequent events after the date of the Statements of Assets and Liabilities have been evaluated through the date the financial statements were issued. Management has determined that no events or transactions occurred requiring adjustment or disclosure in the financial statements.
PROXY VOTING POLICY
Information regarding how the Funds voted proxies relating to portfolio securities for the most recent twelve month period ended June 30 as well as a description of the policies and procedures that the Funds use to determine how to vote proxies is available without charge, upon request, by calling 1-877-287-9820 or by referring to the Securities and Exchange Commission’s (“SEC”) website at http://www.sec.gov.
PORTFOLIO HOLDINGS
The Funds file their complete schedule of portfolio holdings with the SEC for the first and third quarters of each fiscal year on Form N-PORT. Form N-PORT is available on the SEC’s website at http://www.sec.gov and may be reviewed and copied at the SEC’s Public Reference Room in Washington, DC (1-800-SEC-0330). The information on Form N-PORT is available without charge, upon request, by calling 1-877-287-9820.
| |
| |
| |
| |
| |
| |
| |
| |
| |
| |
| |
| |
| |
| |
| |
| |
| |
| |
| |
| |
| |
| |
| |
| |
| |
| INVESTMENT ADVISOR |
| BTS Asset Management, Inc. |
| 55 Old Bedford Road, Suite 203 |
| Lincoln, MA 01773 |
| |
| ADMINISTRATOR |
| Ultimus Fund Solutions, LLC |
| 225 Pictoria Drive, Suite 450 |
| Cincinnati, Ohio 45246 |
Item 8. Changes in and Disagreements with Accountants for Open-End Management Investment Companies. Not applicable
Item 9. Proxy Disclosures for Open-End Management Investment Companies. Not applicable
Item 10. Remuneration Paid to Directors, Officers, and Others of Open-End Management Investment Companies. Included under Item 7 of this Form.
Item 11. Statement Regarding Basis for Approval of Investment Advisory Contract.
Not applicable.
Item 12. Disclosure of Proxy Voting Policies and Procedures for Closed-End Management Investment Companies.
Not applicable.
Item 13. Portfolio Managers of Closed-End Management Investment Companies.
Not applicable.
Item 14. Purchases of Equity Securities by Closed-End Management Investment Company and Affiliated Purchasers.
Not applicable.
Item 15. Submission of Matters to a Vote of Security Holders.
None
Item 16. Controls and Procedures.
(a) The registrant’s Principal Executive Officer and Principal Financial Officer have concluded that the registrant’s disclosure controls and procedures (as defined in Rule 30a-3(c) under the Act) are effective in design and operation and are sufficient to form the basis of the certifications required by Rule 30a-(2) under the Act, based on their evaluation of these disclosure controls and procedures as of a date within 90 days of this report on Form N-CSR.
(b) There were no changes in the registrant’s internal control over financial reporting (as defined in Rule 30a-3(d) under the Act) during the period covered by this report that have materially affected, or are reasonably likely to materially affect, the registrant’s internal control over financial reporting.
Item 17. Disclosure of Securities Lending Activities for Closed-End Management Investment Companies.
Not applicable.
Item 18. Recovery of Erroneously Awarded Compensation.
(a) Not applicable.
(b) Not applicable.
Item 19. Exhibits.
(a)(1) Not applicable.
(a)(2) Not applicable.
(a)(3) A separate certification for each principal executive officer and principal financial officer of the registrant as required by Rule 30a-2(a) under the Act (17 CFR 270.30a-2(a)): Attached hereto. Exhibit 99. CERT
(a)(4) Not applicable.
(b) Certifications required by Rule 30a-2(b) under the Act (17 CFR 270.30a-2(b)): Attached hereto Exhibit 99.906CERT
SIGNATURES
Pursuant to the requirements of the Securities Exchange Act of 1934 and the Investment Company Act of 1940, the registrant has duly caused this report to be signed on its behalf by the undersigned, thereunto duly authorized.
| (Registrant) | Northern Lights Fund Trust |
By (Signature and Title)
| /s/ Kevin E. Wolf |
| Kevin E. Wolf, Principal Executive Officer/President |
Pursuant to the requirements of the Securities Exchange Act of 1934 and the Investment Company Act of 1940, this report has been signed below by the following persons on behalf of the registrant and in the capacities and on the dates indicated.
By (Signature and Title)
| /s/ Kevin E. Wolf |
| Kevin E. Wolf, Principal Executive Officer/President |
By (Signature and Title)
| /s/ James Colantino |
| James Colantino, Principal Financial Officer/Treasurer |