united states
securities and exchange commission
washington, d.c. 20549
form n-csr
certified shareholder report of registered management
investment companies
| Investment Company Act file number | 811-21720 |
| | |
| Northern Lights Fund Trust |
| (Exact name of registrant as specified in charter) |
| |
| 225 Pictoria Drive, Suite 450, Cincinnati, Ohio | 45246 |
| (Address of principal executive offices) | (Zip code) |
| | |
| The Corporation Trust Company |
| 1209 Orange Street Wilmington, DE 19801 |
| (Name and address of agent for service) |
| |
| Registrant’s telephone number, including area code: | 631-490-4300 | |
| | | |
| Date of fiscal year end: | 9/30 | |
| | | |
| Date of reporting period: | 9/30/24 | |
Item 1. Reports to Stockholders.
Annual Shareholder Report - September 30, 2024
This annual shareholder report contains important information about Princeton Premium Fund for the period of October 1, 2023 to September 30, 2024. You can find additional information about the Fund at www.PrincetonPremiumFund.com. You can also request this information by contacting us at 1-888-868-9501.
What were the Fund’s costs for the last year?
(based on a hypothetical $10,000 investment)
| Class Name | Costs of a $10,000 investment | Costs paid as a percentage of a $10,000 investment |
|---|
| Class A Shares | $280 | 2.75% |
How did the Fund perform during the reporting period?
The Fund's Class A Shares returned +3.67% during the fiscal year ended September 30, 2024 (the “Investment Period”). The Fund seeks capital appreciation and income by attempting to collect premium each week through the sale of put options on the S&P 500 (SPX) that have approximately a six-to-eight day or less time frame to expiration. The Fund employs a rules-based system that is replicated weekly. Trades are typically placed at multiple times throughout the week. The options-based strategy seeks to generate a weekly profit. Tactical portfolio management overlays are used to help potentially mitigate volatility. The Fund also invests in fixed income securities.
The Fund’s option trading strategy was profitable in 11 out of the 12 months during the Investment Period. During these 11 months, option premiums were generally lighter than usual, with the VIX Index averaging 15.03 during the entire Investment Period.
The one negative month for the Fund came in August 2024, which saw extreme moves in volatility. The early August selloff in US equities saw the VIX spike from 16.36 at the close on 7/31/2024 to an intraday high of 65.73 on the morning of 8/5/2024. This was the largest three-day VIX spike on an intraday basis since the inception of the VIX in 1990. August 5th alone saw the largest intraday spike in VIX, going from 23.39 to the aforementioned 65.73. This was the highest VIX had been since Covid-19 hit markets in March 2020. In that environment, the Fund’s risk management protocols meant that some trades were closed down for what we believe are “educated losses”. The Fund’s investments in fixed income, which consisted primarily of 90-Day Treasury Bills, contributed positively to performance throughout the Investment Period.
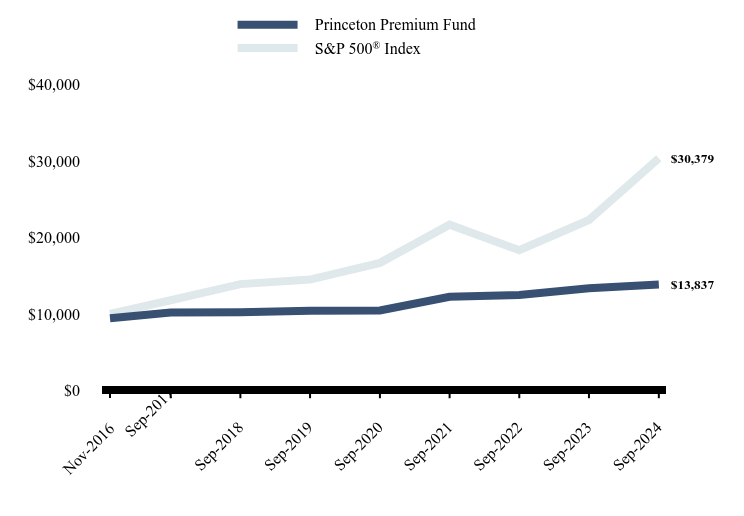
How has the Fund performed since inception?
Total Return Based on $10,000 Investment
| Princeton Premium Fund | S&P 500® Index |
|---|
| Nov-2016 | $9,425 | $10,000 |
| Sep-2017 | $10,160 | $11,778 |
| Sep-2018 | $10,193 | $13,887 |
| Sep-2019 | $10,417 | $14,478 |
| Sep-2020 | $10,432 | $16,671 |
| Sep-2021 | $12,241 | $21,673 |
| Sep-2022 | $12,475 | $18,320 |
| Sep-2023 | $13,347 | $22,280 |
| Sep-2024 | $13,837 | $30,379 |
Average Annual Total Returns
| 1 Year | 5 Years | Since Inception (November 16, 2016) |
|---|
| Princeton Premium Fund | | | |
| Without Load | 3.67% | 5.84% | 5.00% |
| With Load | -2.32% | 4.60% | 4.21% |
S&P 500® Index | 36.35% | 15.98% | 15.16% |
The Fund's past performance is not a good predictor of how the Fund will perform in the future. The graph and table do not reflect the deduction of taxes that a shareholder would pay on fund distributions or redemption of fund shares.
| Net Assets | $375,843,108 |
| Number of Portfolio Holdings | 25 |
| Advisory Fee (net of waivers) | $5,723,906 |
| Portfolio Turnover | 0% |
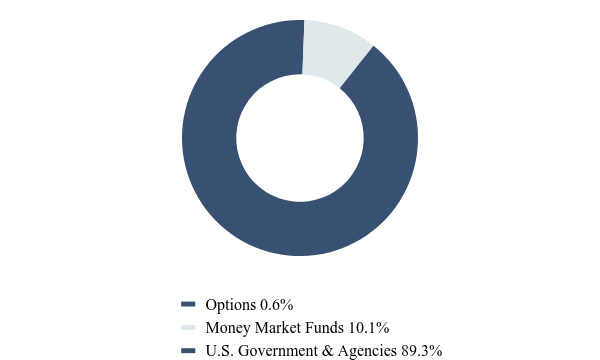
Asset Weighting (% of total investments)
| Value | Value |
|---|
| Options | 0.6% |
| Money Market Funds | 10.1% |
| U.S. Government & Agencies | 89.3% |
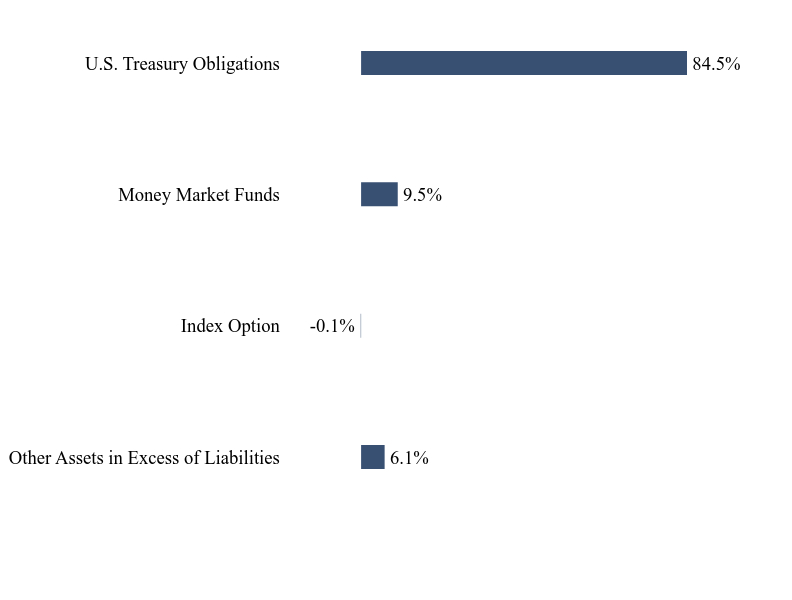
What did the Fund invest in?
Sector Weighting (% of net assets)
| Value | Value |
|---|
| Other Assets in Excess of Liabilities | 6.1% |
| Index Option | -0.1% |
| Money Market Funds | 9.5% |
| U.S. Treasury Obligations | 84.5% |
Top 10 Holdings (% of net assets)
| Holding Name | % of Net Assets |
| United States Treasury Bill, , 4.8849%, 12/12/24 | 7.9% |
| United States Treasury Bill, , 5.1413%, 10/03/24 | 7.5% |
| United States Treasury Bill, , 5.0406%, 11/07/24 | 7.4% |
| United States Treasury Bill, , 5.1225%, 10/31/24 | 7.2% |
| United States Treasury Bill, , 5.0236%, 11/14/24 | 7.1% |
| United States Treasury Bill, , 5.0267%, 11/21/24 | 7.1% |
| United States Treasury Bill, , 4.9328%, 12/05/24 | 7.1% |
| United States Treasury Bill, , 5.1107%, 10/17/24 | 6.9% |
| United States Treasury Bill, , 5.1385%, 10/10/24 | 6.6% |
| United States Treasury Bill, , 5.0110%, 11/29/24 | 6.6% |
No material changes occurred during the year ended September 30, 2024.
Annual Shareholder Report - September 30, 2024
Where can I find additional information about the Fund?
Additional information is available on the Fund's website ( www.PrincetonPremiumFund.com ), including its:
Prospectus
Financial information
Holdings
Proxy voting information
Annual Shareholder Report - September 30, 2024
This annual shareholder report contains important information about Princeton Premium Fund for the period of October 1, 2023 to September 30, 2024. You can find additional information about the Fund at www.PrincetonPremiumFund.com. You can also request this information by contacting us at 1-888-868-9501.
What were the Fund’s costs for the last year?
(based on a hypothetical $10,000 investment)
| Class Name | Costs of a $10,000 investment | Costs paid as a percentage of a $10,000 investment |
|---|
| Class I Shares | $253 | 2.48% |
How did the Fund perform during the reporting period?
The Fund's Class I Shares returned +4.03% during the fiscal year ended September 30, 2024 (the “Investment Period”). The Fund seeks capital appreciation and income by attempting to collect premium each week through the sale of put options on the S&P 500 (SPX) that have approximately a six-to-eight day or less time frame to expiration. The Fund employs a rules-based system that is replicated weekly. Trades are typically placed at multiple times throughout the week. The options-based strategy seeks to generate a weekly profit. Tactical portfolio management overlays are used to help potentially mitigate volatility. The Fund also invests in fixed income securities.
The Fund’s option trading strategy was profitable in 11 out of the 12 months during the Investment Period. During these 11 months, option premiums were generally lighter than usual, with the VIX Index averaging 15.03 during the entire Investment Period.
The one negative month for the Fund came in August 2024, which saw extreme moves in volatility. The early August selloff in US equities saw the VIX spike from 16.36 at the close on 7/31/2024 to an intraday high of 65.73 on the morning of 8/5/2024. This was the largest three-day VIX spike on an intraday basis since the inception of the VIX in 1990. August 5th alone saw the largest intraday spike in VIX, going from 23.39 to the aforementioned 65.73. This was the highest VIX had been since Covid-19 hit markets in March 2020. In that environment, the Fund’s risk management protocols meant that some trades were closed down for what we believe are “educated losses”. The Fund’s investments in fixed income, which consisted primarily of 90-Day Treasury Bills, contributed positively to performance throughout the Investment Period.
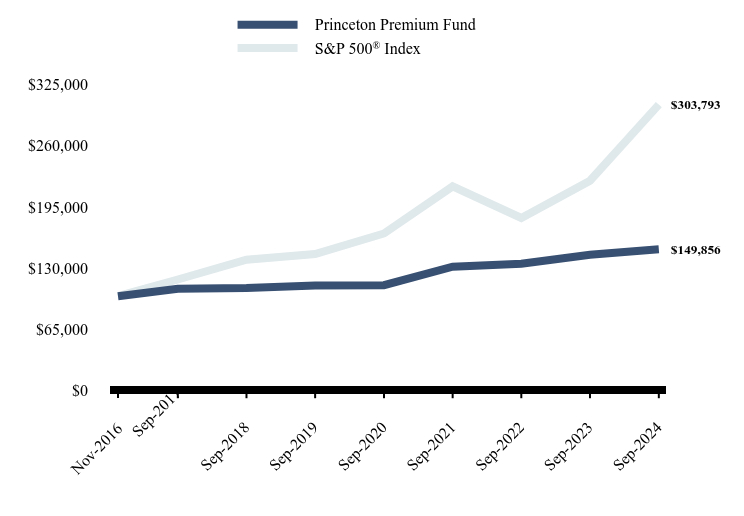
How has the Fund performed since inception?
Total Return Based on $100,000 Investment
| Princeton Premium Fund | S&P 500® Index |
|---|
| Nov-2016 | $100,000 | $100,000 |
| Sep-2017 | $108,000 | $117,776 |
| Sep-2018 | $108,649 | $138,871 |
| Sep-2019 | $111,342 | $144,778 |
| Sep-2020 | $111,709 | $166,710 |
| Sep-2021 | $131,416 | $216,732 |
| Sep-2022 | $134,447 | $183,199 |
| Sep-2023 | $144,054 | $222,802 |
| Sep-2024 | $149,856 | $303,793 |
Average Annual Total Returns
| 1 Year | 5 Years | Since Inception (November 16, 2016) |
|---|
| Princeton Premium Fund | 4.03% | 6.12% | 5.27% |
S&P 500® Index | 36.35% | 15.98% | 15.16% |
The Fund's past performance is not a good predictor of how the Fund will perform in the future. The graph and table do not reflect the deduction of taxes that a shareholder would pay on fund distributions or redemption of fund shares.
| Net Assets | $375,843,108 |
| Number of Portfolio Holdings | 25 |
| Advisory Fee (net of waivers) | $5,723,906 |
| Portfolio Turnover | 0% |
Asset Weighting (% of total investments)
| Value | Value |
|---|
| Options | 0.6% |
| Money Market Funds | 10.1% |
| U.S. Government & Agencies | 89.3% |
What did the Fund invest in?
Sector Weighting (% of net assets)
| Value | Value |
|---|
| Other Assets in Excess of Liabilities | 6.1% |
| Index Option | -0.1% |
| Money Market Funds | 9.5% |
| U.S. Treasury Obligations | 84.5% |
Top 10 Holdings (% of net assets)
| Holding Name | % of Net Assets |
| United States Treasury Bill, , 4.8849%, 12/12/24 | 7.9% |
| United States Treasury Bill, , 5.1413%, 10/03/24 | 7.5% |
| United States Treasury Bill, , 5.0406%, 11/07/24 | 7.4% |
| United States Treasury Bill, , 5.1225%, 10/31/24 | 7.2% |
| United States Treasury Bill, , 5.0236%, 11/14/24 | 7.1% |
| United States Treasury Bill, , 5.0267%, 11/21/24 | 7.1% |
| United States Treasury Bill, , 4.9328%, 12/05/24 | 7.1% |
| United States Treasury Bill, , 5.1107%, 10/17/24 | 6.9% |
| United States Treasury Bill, , 5.1385%, 10/10/24 | 6.6% |
| United States Treasury Bill, , 5.0110%, 11/29/24 | 6.6% |
No material changes occurred during the year ended September 30, 2024.
Annual Shareholder Report - September 30, 2024
Where can I find additional information about the Fund?
Additional information is available on the Fund's website ( www.PrincetonPremiumFund.com ), including its:
Prospectus
Financial information
Holdings
Proxy voting information
Item 2. Code of Ethics.
| (a) | The registrant has, as of the end of the period covered by this report, adopted a code of ethics that applies to the registrant’s principal executive officer, principal financial officer, and principal accounting officer or controller, or persons performing similar functions, regardless of whether these individuals are employed by the registrant or a third party. |
| | |
| (b) | N/A |
| | |
| (c) | During the period covered by this report, there were no amendments to any provision of the code of ethics. |
| | |
| (d) | During the period covered by this report, there were no waivers or implicit waivers of a provision of the code of ethics. |
| | |
| (e) | N/A |
| | |
| (f) | See Item 19(a)(1) |
Item 3. Audit Committee Financial Expert.
(a)(1) The Registrant’s board of trustees has determined that Mark Gersten, Anthony J. Hertl, and Mark H. Taylor are audit committee financial experts, as defined in Item 3 of Form N-CSR. Mr. Gersten, Mr. Hertl and Mr. Taylor are independent for purposes of this Item.
(a)(2) Not applicable.
(a)(3) Not applicable.
Item 4. Principal Accountant Fees and Services.
| (a) | Audit Fees. The aggregate fees billed for each of the last two fiscal years for professional services rendered by the registrant’s principal accountant for the audit of the registrant’s annual financial statements or services that are normally provided by the accountant in connection with statutory and regulatory filings or engagements for those fiscal years are as follows: |
| | |
| | 2024 – $21,250 |
| | 2023 – $20,250 |
| | |
| (b) | Audit-Related Fees. There were no fees billed in each of the last two fiscal years for assurances and related services by the principal accountant that are reasonably related to the performance of the audit of the registrant’s financial statements and are not reported under paragraph (a) of this item. |
| | |
| (c) | Tax Fees. The aggregate fees billed in each of the last two fiscal years for professional services rendered by the principal accountant for tax compliance are as follows: |
| | |
| | 2024 – $3,900 |
| | 2023 – $3,900 |
| | |
| | Preparation of Federal & State income tax returns, assistance with calculation of required income, capital gain and excise distributions and preparation of Federal excise tax returns. |
| | |
| (d) | All Other Fees. The aggregate fees billed in each of the last two fiscal years for products and services provided by the registrant’s principal accountant, other than the services reported in paragraphs (a) through (c) of this item were $0 and $0 for the fiscal years ended September 30, 2023, and 2024 respectively. |
| | |
| (e)(1) | The audit committee does not have pre-approval policies and procedures. Instead, the audit committee or audit committee chairman approves on a case-by-case basis each audit or non-audit service before the principal accountant is engaged by the registrant. |
| | |
| (e)(2) | There were no services described in each of paragraphs (b) through (d) of this Item that were approved by the audit committee pursuant to paragraph (c)(7)(i)(C) of Rule 2-01 of Regulation S-X. |
| | |
| (f) | Not applicable. The percentage of hours expended on the principal accountant’s engagement to audit the registrant’s financial statements for the most recent fiscal year that were attributed to work performed by persons other than the principal accountant’s full-time, permanent employees was zero percent (0%). |
| | |
| (g) | All non-audit fees billed by the registrant’s principal accountant for services rendered to the registrant for the fiscal years ended September 30, 2023, and 2024 respectively are disclosed in (b)-(d) above. There were no audit or non-audit services performed by the registrant’s principal accountant for the registrant’s adviser. |
| | |
| (h) | Not applicable. |
| | |
| (i) | Not applicable. |
| | |
| (j) | Not applicable. |
Item 5. Audit Committee of Listed Companies. Not applicable to open-end investment companies.
Item 6. Schedule of Investments. The Registrant’s schedule of investments in unaffiliated issuers is included in the Financial Statements under Item 7 of this form.
Item 7. Financial Statements and Financial Highlights for Open-End Management Investment Companies.
(a)
| |
| |
| |
| |
| |
| |
| |
| |
| |
| |
| |
| |
| |
| |
| |
| |
| |
| |
| |
| |
| Princeton Premium Fund |
| Class A Shares: PPFAX |
| Class I Shares: PPFIX |
| |
| |
| |
| |
| |
| Annual Financial Statements |
| September 30, 2024 |
| |
| |
| |
| |
| |
| www.PrincetonPremiumFund.com |
| 1-888-868-9501 |
| |
| |
| |
| |
| |
| |
| |
| |
| |
| |
| |
| |
| |
| |
| |
| |
| |
| |
| |
| |
| PRINCETON PREMIUM FUND |
| SCHEDULE OF INVESTMENTS |
| September 30, 2024 |
Principal
Amount ($) | | | | | Yield Rate (%) | | Maturity | | Fair Value | |
| | | | | U.S. GOVERNMENT & AGENCIES - 84.5% | | | | | | | | |
| | | | | U.S. TREASURY BILLS - 84.5% | | | | | | | | |
| | 28,000,000 | | | United States Treasury Bill(a)(d) | | 5.1413 | | 10/03/24 | | $ | 27,992,778 | |
| | 25,000,000 | | | United States Treasury Bill(a)(d) | | 5.1385 | | 10/10/24 | | | 24,970,953 | |
| | 26,000,000 | | | United States Treasury Bill(a)(d) | | 5.1107 | | 10/17/24 | | | 25,945,978 | |
| | 24,000,000 | | | United States Treasury Bill(a)(d) | | 5.1280 | | 10/24/24 | | | 23,927,780 | |
| | 27,000,000 | | | United States Treasury Bill(a)(d) | | 5.1225 | | 10/31/24 | | | 26,894,919 | |
| | 28,000,000 | | | United States Treasury Bill(a)(d) | | 5.0406 | | 11/07/24 | | | 27,865,468 | |
| | 27,000,000 | | | United States Treasury Bill(a)(d) | | 5.0236 | | 11/14/24 | | | 26,847,086 | |
| | 27,000,000 | | | United States Treasury Bill(a)(d) | | 5.0267 | | 11/21/24 | | | 26,823,259 | |
| | 25,000,000 | | | United States Treasury Bill(a)(d) | | 5.0110 | | 11/29/24 | | | 24,808,820 | |
| | 27,000,000 | | | United States Treasury Bill(a)(d) | | 4.9328 | | 12/05/24 | | | 26,780,040 | |
| | 30,000,000 | | | United States Treasury Bill(a)(d) | | 4.8849 | | 12/12/24 | | | 29,732,020 | |
| | 25,000,000 | | | United States Treasury Bill(a)(d) | | 4.9010 | | 12/19/24 | | | 24,752,953 | |
| | | | | TOTAL U.S. GOVERNMENT & AGENCIES (Cost $317,214,172) | | | | | | | 317,342,054 | |
| | | | | | | | | | | | | |
| Shares | | | | | | | | | Fair Value | |
| | | | | SHORT-TERM INVESTMENT - 9.5% | | | | | | | | |
| | | | | MONEY MARKET FUND - 9.5% | | | | | | | | |
| | 35,714,517 | | | Dreyfus Government Cash Management, Class I, 4.80% (Cost $35,714,517)(b) | | $ | 35,714,517 | |
| Contracts(c) | | | | | Broker | | Expiration
Date | | Exercise
Price | | | Notional
Value | | | Fair Value | |
| | | | | INDEX OPTIONS PURCHASED - 0.6% | | | | | | | | | | | | | | | | |
| | | | | PUT OPTIONS PURCHASED - 0.6% | | | | | | | | | | | | | | | | |
| | 1 | | | S&P 500 Index | | FCS | | 10/04/2024 | | $ | 5,230 | | | $ | 576,248 | | | $ | 35 | |
| | 3,832 | | | S&P 500 Index | | FCS | | 10/04/2024 | | | 5,240 | | | | 2,208,182,336 | | | | 143,700 | |
| | 5,269 | | | S&P 500 Index | | FCS | | 10/04/2024 | | | 5,250 | | | | 3,306,250,712 | | | | 197,587 | |
| | 4,551 | | | S&P 500 Index | | FCS | | 10/04/2024 | | | 5,275 | | | | 2,622,504,648 | | | | 170,663 | |
| | 9,102 | | | S&P 500 Index | | FCS | | 10/04/2024 | | | 5,290 | | | | 5,245,009,296 | | | | 341,325 | |
| | 1,962 | | | S&P 500 Index | | FCS | | 10/11/2024 | | | 5,500 | | | | 1.130,598,576 | | | | 1,491,120 | |
| | | | | TOTAL PUT OPTIONS PURCHASED (Cost - $6,327,051) | | | | | 2,344,430 | |
| | | | | | | | | | | | | | | | | | | | | |
| | | | | TOTAL INDEX OPTIONS PURCHASED (Cost - $6,327,051) | | | | | 2,344,430 | |
| | | | | | | | | | | | | | | | | | | | | |
| | | | | TOTAL INVESTMENTS - 94.6% (Cost $359,255,740) | | | | $ | 355,401,001 | |
| | | | | PUT OPTIONS WRITTEN - (0.7)% (Proceeds received - $6,709,643) | | | | | (2,521,185 | ) |
| | | | | OTHER ASSETS IN EXCESS OF LIABILITIES - 6.1% | | | | | 22,963,292 | |
| | | | | NET ASSETS - 100.0% | | | | $ | 375,843,108 | |
See accompanying notes to financial statements.
| PRINCETON PREMIUM FUND |
| SCHEDULE OF INVESTMENTS (Continued) |
| September 30, 2024 |
| Contracts(c) | | | | | Broker | | Expiration
Date | | Exercise
Price | | | Notional
Value | | | Fair Value | |
| | | | | WRITTEN INDEX OPTIONS - (0.7)% | | | | | | | | | | | | | | | | |
| | | | | PUT OPTIONS WRITTEN - (0.7)% | | | | | | | | | | | | | | | | |
| | 1 | | | S&P 500 Index | | FCS | | 10/04/2024 | | $ | 5,330 | | | $ | 576,248 | | | $ | 42 | |
| | 3,832 | | | S&P 500 Index | | FCS | | 10/04/2024 | | | 5,340 | | | | 2,208,182,336 | | | | 172,440 | |
| | 5,269 | | | S&P 500 Index | | FCS | | 10/04/2024 | | | 5,350 | | | | 3,036,250,712 | | | | 250,278 | |
| | 4,551 | | | S&P 500 Index | | FCS | | 10/04/2024 | | | 5,375 | | | | 2,622,504,648 | | | | 227,550 | |
| | 9,102 | | | S&P 500 Index | | FCS | | 10/04/2024 | | | 5,390 | | | | 5,245,009,296 | | | | 477,855 | |
| | 1,962 | | | S&P 500 Index | | FCS | | 10/11/2024 | | | 5,490 | | | | 1,130,598,576 | | | | 1,393,020 | |
| | | | | TOTAL PUT OPTIONS WRITTEN (Proceeds - $6,709,643) | | | | | 2,521,185 | |
| | | | | | | | | | | | | | | | | | | | | |
| | | | | TOTAL INDEX OPTIONS WRITTEN (Proceeds - $6,709,643) | | | | $ | 2,521,185 | |
| FCS | - StoneX Financial Inc. |
| (b) | Rate disclosed is the seven day effective yield as of September 30, 2024. |
| (c) | Each option contract allows the holder of the option to purchase or sell 100 shares of the underlying security. |
| (d) | All or a portion of these investments are segregated as collateral for option contracts. The amount of pledged securities collateral amounted to $317,342,054. |
See accompanying notes to financial statements.
| Princeton Premium Fund |
| STATEMENT OF ASSETS AND LIABILITIES |
| September 30, 2024 |
| ASSETS | | | | |
| Investment securities: | | | | |
| At cost | | $ | 359,255,740 | |
| At fair value | | $ | 355,401,001 | |
| Due from broker | | | 23,293,842 | |
| Receivable for fund shares sold | | | 385,771 | |
| Interest receivable | | | 98,358 | |
| Prepaid expenses and other assets | | | 24,515 | |
| TOTAL ASSETS | | | 379,203,487 | |
| | | | | |
| LIABILITIES | | | | |
| Options written, at fair value (proceeds $6,709,643) | | | 2,521,185 | |
| Investment advisory fees payable | | | 495,361 | |
| Payable for Fund shares redeemed | | | 228,350 | |
| Accrued expenses and other liabilities | | | 69,133 | |
| Payable to related parties | | | 41,682 | |
| Distribution (12b-1) fees payable | | | 4,668 | |
| TOTAL LIABILITIES | | | 3,360,379 | |
| NET ASSETS | | $ | 375,843,108 | |
| | | | | |
| Net Assets Consist Of: | | | | |
| Paid in capital | | $ | 375,715,226 | |
| Accumulated earnings | | | 127,882 | |
| NET ASSETS | | $ | 375,843,108 | |
| | | | | |
| Net Asset Value Per Share: | | | | |
| Class A Shares: | | | | |
| Net Assets | | $ | 22,816,034 | |
| Shares of beneficial interest outstanding ($0 par value, unlimited shares authorized) | | | 1,951,668 | |
| Net asset value (Net Assets ÷ Shares Outstanding), offering price and redemption price per share | | $ | 11.69 | |
| Maximum offering price per share (net asset value plus maximum sales charge of 5.75%) (a) | | $ | 12.40 | |
| | | | | |
| Class I Shares: | | | | |
| Net Assets | | $ | 353,027,074 | |
| Shares of beneficial interest outstanding ($0 par value, unlimited shares authorized) | | | 29,626,259 | |
| Net asset value (Net Assets ÷ Shares Outstanding), offering price and redemption price per share | | $ | 11.92 | |
| (a) | On investments of $25,000 or more, the offering price is reduced. |
See accompanying notes to financial statements.
| Princeton Premium Fund |
| STATEMENT OF OPERATIONS |
| For the Year Ended September 30, 2024 |
| INVESTMENT INCOME | | | | |
| Interest | | $ | 17,520,427 | |
| TOTAL INVESTMENT INCOME | | | 17,520,427 | |
| | | | | |
| EXPENSES | | | | |
| Investment advisory fees | | | 5,959,959 | |
| Distribution (12b-1) fees: | | | | |
| Class A | | | 57,009 | |
| Broker fees | | | 1,814,102 | |
| Administrative services fees | | | 261,419 | |
| Third Party Administrative Servicing fees | | | 253,999 | |
| Registration fees | | | 80,302 | |
| Accounting services fees | | | 75,128 | |
| Transfer agent fees | | | 57,047 | |
| Printing and postage expenses | | | 41,622 | |
| Custodian fees | | | 36,066 | |
| Compliance officer fees | | | 28,998 | |
| Audit and tax fees | | | 25,314 | |
| Legal fees | | | 22,463 | |
| Trustees fees and expenses | | | 21,785 | |
| Insurance expense | | | 6,149 | |
| Interest expense | | | 687 | |
| Other expenses | | | 10,707 | |
| TOTAL EXPENSES | | | 8,752,756 | |
| Less: Fees waived by the advisor | | | (236,053 | ) |
| NET EXPENSES | | | 8,516,703 | |
| NET INVESTMENT INCOME | | | 9,003,724 | |
| | | | | |
| REALIZED AND UNREALIZED GAIN (LOSS) ON INVESTMENTS | | | | |
| Net realized gain (loss) from: | | | | |
| Investments | | | (25,919,291 | ) |
| Options Written | | | 29,071,039 | |
| | | | 3,151,748 | |
| Net change in unrealized appreciation (depreciation) on: | | | | |
| Investments | | | (3,922,146 | ) |
| Options Written | | | 4,231,014 | |
| | | | 308,868 | |
| NET REALIZED AND UNREALIZED GAIN ON INVESTMENTS | | | 3,460,616 | |
| | | | | |
| NET INCREASE IN NET ASSETS RESULTING FROM OPERATIONS | | $ | 12,464,340 | |
See accompanying notes to financial statements.
| Princeton Premium Fund |
| STATEMENTS OF CHANGES IN NET ASSETS |
| | | Year Ended | | | Year Ended | |
| | | September 30, 2024 | | | September 30, 2023 | |
| FROM OPERATIONS | | | | | | | | |
| Net investment income | | $ | 9,003,724 | | | $ | 4,800,194 | |
| Net realized gain from investments and options written | | | 3,151,748 | | | | 16,655,266 | |
| Net change in unrealized appreciation (depreciation) on investments and options written | | | 308,868 | | | | (163,871 | ) |
| Net increase in net assets resulting from operations | | | 12,464,340 | | | | 21,291,589 | |
| | | | | | | | | |
| DISTRIBUTIONS TO SHAREHOLDERS | | | | | | | | |
| Total distributions paid: | | | | | | | | |
| Class A | | | (1,507,035 | ) | | | (935,012 | ) |
| Class I | | | (21,045,759 | ) | | | (14,293,602 | ) |
| Net decrease in net assets from distributions to shareholders | | | (22,552,794 | ) | | | (15,228,614 | ) |
| | | | | | | | | |
| FROM SHARES OF BENEFICIAL INTEREST | | | | | | | | |
| Proceeds from shares sold: | | | | | | | | |
| Class A | | | 6,346,483 | | | | 2,529,119 | |
| Class I | | | 176,021,447 | | | | 115,646,482 | |
| Net asset value of shares issued in reinvestment of distributions: | | | | | | | | |
| Class A | | | 1,483,536 | | | | 917,002 | |
| Class I | | | 19,484,870 | | | | 13,209,246 | |
| Payments for shares redeemed: | | | | | | | | |
| Class A | | | (3,993,746 | ) | | | (2,880,325 | ) |
| Class I | | | (118,688,015 | ) | | | (143,639,872 | ) |
| Net increase (decrease) in net assets from shares of beneficial interest | | | 80,654,575 | | | | (14,218,348 | ) |
| | | | | | | | | |
| TOTAL INCREASE (DECREASE) IN NET ASSETS | | | 70,566,121 | | | | (8,155,373 | ) |
| | | | | | | | | |
| NET ASSETS | | | | | | | | |
| Beginning of Year | | | 305,276,987 | | | | 313,432,360 | |
| End of Year | | $ | 375,843,108 | | | $ | 305,276,987 | |
| | | | | | | | | |
| SHARE ACTIVITY | | | | | | | | |
| Class A: | | | | | | | | |
| Shares Sold | | | 527,123 | | | | 212,786 | |
| Shares Reinvested | | | 125,662 | | | | 77,395 | |
| Shares Redeemed | | | (335,239 | ) | | | (241,196 | ) |
| Net increase in shares of beneficial interest outstanding | | | 317,546 | | | | 48,985 | |
| | | | | | | | | |
| Class I: | | | | | | | | |
| Shares Sold | | | 14,498,598 | | | | 9,533,180 | |
| Shares Reinvested | | | 1,620,604 | | | | 1,096,257 | |
| Shares Redeemed | | | (9,786,117 | ) | | | (11,858,310 | ) |
| Net increase (decrease) in shares of beneficial interest outstanding | | | 6,333,085 | | | | (1,228,873 | ) |
See accompanying notes to financial statements.
| Princeton Premium Fund |
| FINANCIAL HIGHLIGHTS |
Per Share Data and Ratios for a Share of Beneficial Interest Outstanding Throughout Each Year
| | | Year Ended | | | Year Ended | | | Year Ended | | | Year Ended | | | Year Ended | |
| Class A | | September 30, 2024 | | | September 30, 2023 | | | September 30, 2022 | | | September 30, 2021 | | | September 30, 2020 | |
| Net asset value, beginning of year | | $ | 12.04 | | | $ | 11.82 | | | $ | 12.44 | | | $ | 10.65 | | | $ | 10.66 | |
| Activity from investment operations: | | | | | | | | | | | | | | | | | | | | |
| Net investment income (loss) (1) | | | 0.29 | | | | 0.16 | | | | (0.18 | ) | | | (0.28 | ) | | | (0.15 | ) |
| Net realized and unrealized gain on investments and options written | | | 0.15 | | | | 0.64 | | | | 0.42 | | | | 2.12 | | | | 0.17 | |
| Total from investment operations | | | 0.44 | | | | 0.80 | | | | 0.24 | | | | 1.84 | | | | 0.02 | |
| Less distributions from: | | | | | | | | | | | | | | | | | | | | |
| Net investment income | | | (0.41 | ) | | | (0.35 | ) | | | — | | | | — | | | | — | |
| Net realized gains | | | (0.38 | ) | | | (0.23 | ) | | | (0.86 | ) | | | (0.05 | ) | | | (0.03 | ) |
| Return of capital | | | — | | | | — | | | | — | | | | — | | | | (0.00 | ) (9) |
| Total distributions | | | (0.79 | ) | | | (0.58 | ) | | | (0.86 | ) | | | (0.05 | ) | | | (0.03 | ) |
| Net asset value, end of year | | $ | 11.69 | | | $ | 12.04 | | | $ | 11.82 | | | $ | 12.44 | | | $ | 10.65 | |
| Total return (2) | | | 3.76 | % (10) | | | 6.90 | % (10) | | | 1.92 | % | | | 17.34 | % | | | 0.14 | % |
| Net assets, at end of year (000s) | | $ | 22,816 | | | $ | 19,682 | | | $ | 18,742 | | | $ | 3,606 | | | $ | 3,724 | |
| Ratio of gross expenses to average net assets (3) | | | 2.82 | % (8) | | | 3.09 | % (7) | | | 2.55 | % (6) | | | 2.83 | % (5) | | | 2.95 | % (4) |
| Ratio of net expenses to average net assets | | | 2.75 | % (8) | | | 3.00 | % (7) | | | 2.45 | % (6) | | | 2.44 | % (5) | | | 2.52 | % (4) |
| Ratio of net investment income (loss) to average net assets | | | 2.39 | % (8) | | | 1.32 | % (7) | | | (1.50 | )% (6) | | | (2.42 | )% (5) | | | (1.56 | )% (4) |
| Portfolio Turnover Rate | | | 0 | % | | | 0 | % | | | 0 | % | | | 0 | % | | | 0 | % |
| (1) | Per share amounts calculated using the average shares method, which more appropriately presents the per share data for the year. |
| (2) | Total returns shown assume changes in share price and reinvestment of dividends and capital gain distributions. Had the Advisor not waived a portion of its fees, total returns would have been lower. |
| (3) | Represents the ratio of expenses to average net assets absent fee waivers and/or expense reimbursements by the Advisor. |
| (4) | Includes 0.32% for the year ended September 30, 2020 attributed to margin expense on short sales, which are not subject to waiver by the Advisor. |
| (5) | Includes 0.24% for the year ended September 30, 2021 attributed to margin expense on short sales, which are not subject to waiver by the Advisor. |
| (6) | Includes 0.25% for the year ended September 30, 2022 attributed to margin expense on short sales, which are not subject to waiver by the Advisor. |
| (7) | Includes 0.80% for the year ended September 30, 2023 attributed to margin expense on short sales, which are not subject to waiver by the Advisor. |
| (8) | Includes 0.55% for the year ended September 30, 2024 attributed to margin expense on short sales, which are not subject to waiver by the Advisor. |
| (10) | Includes adjustments in accordance with accounting principles generally accepted in the United States of America and, consequently, the net asset value for financial reporting purposes and the returns based upon those net asset values may differ from the net asset values and returns for shareholder transactions. |
See accompanying notes to financial statements.
| Princeton Premium Fund |
| FINANCIAL HIGHLIGHTS |
Per Share Data and Ratios for a Share of Beneficial Interest Outstanding Throughout Each Year
| | | Year Ended | | | Year Ended | | | Year Ended | | | Year Ended | | | Year Ended | |
| Class I | | September 30, 2024 | | | September 30, 2023 | | | September 30, 2022 | | | September 30, 2021 | | | September 30, 2020 | |
| Net asset value, beginning of year | | $ | 12.26 | | | $ | 12.02 | | | $ | 12.59 | | | $ | 10.75 | | | $ | 10.74 | |
| Activity from investment operations: | | | | | | | | | | | | | | | | | | | | |
| Net investment income (loss) (1) | | | 0.32 | | | | 0.19 | | | | (0.15 | ) | | | (0.26 | ) | | | (0.14 | ) |
| Net realized and unrealized gain on investments and options written | | | 0.16 | | | | 0.65 | | | | 0.44 | | | | 2.15 | | | | 0.18 | |
| Total from investment operations | | | 0.48 | | | | 0.84 | | | | 0.29 | | | | 1.89 | | | | 0.04 | |
| Less distributions from: | | | | | | | | | | | | | | | | | | | | |
| Net investment income | | | (0.44 | ) | | | (0.37 | ) | | | — | | | | — | | | | — | |
| Net realized gains | | | (0.38 | ) | | | (0.23 | ) | | | (0.86 | ) | | | (0.05 | ) | | | (0.03 | ) |
| Return of capital | | | — | | | | — | | | | — | | | | — | | | | (0.00 | ) (9) |
| Total distributions | | | (0.82 | ) | | | (0.60 | ) | | | (0.86 | ) | | | (0.05 | ) | | | (0.03 | ) |
| Net asset value, end of year | | $ | 11.92 | | | $ | 12.26 | | | $ | 12.02 | | | $ | 12.59 | | | $ | 10.75 | |
| Total return (2) | | | 4.03 | % | | | 7.14 | % | | | 2.31 | % | | | 17.64 | % | | | 0.33 | % |
| Net assets, at end of year (000s) | | $ | 353,027 | | | $ | 285,595 | | | $ | 294,691 | | | $ | 68,434 | | | $ | 30,181 | |
| Ratio of gross expenses to average net assets (3) | | | 2.55 | % (8) | | | 2.81 | % (7) | | | 2.29 | % (6) | | | 2.58 | % (5) | | | 2.70 | % (4) |
| Ratio of net expenses to average net assets | | | 2.48 | % (8) | | | 2.72 | % (7) | | | 2.19 | % (6) | | | 2.19 | % (5) | | | 2.27 | % (4) |
| Ratio of net investment income (loss) to average net assets | | | 2.66 | % (8) | | | 1.56 | % (7) | | | (1.27 | )% (6) | | | (2.17 | )% (5) | | | (1.31 | )% (4) |
| Portfolio Turnover Rate | | | 0 | % | | | 0 | % | | | 0 | % | | | 0 | % | | | 0 | % |
| (1) | Per share amounts calculated using the average shares method, which more appropriately presents the per share data for the year. |
| (2) | Total returns shown assume changes in share price and reinvestment of dividends and capital gain distributions. Had the Advisor not waived a portion of its fees, total returns would have been lower. |
| (3) | Represents the ratio of expenses to average net assets absent fee waivers and/or expense reimbursements by the Advisor. |
| (4) | Includes 0.32% for the year ended September 30, 2020 attributed to margin expense on short sales, which are not subject to waiver by the Advisor. |
| (5) | Includes 0.24% for the year ended September 30, 2021 attributed to margin expense on short sales, which are not subject to waiver by the Advisor. |
| (6) | Includes 0.24% for the year ended September 30, 2022 attributed to margin expense on short sales, which are not subject to waiver by the Advisor. |
| (7) | Includes 0.77% for the year ended September 30, 2023 attributed to margin expense on short sales, which are not subject to waiver by the Advisor. |
| (8) | Includes 0.53% for the year ended September 30, 2024 attributed to margin expense on short sales, which are not subject to waiver by the Advisor. |
See accompanying notes to financial statements.
Princeton Premium Fund
NOTES TO FINANCIAL STATEMENTS
September 30, 2024
1. ORGANIZATION
The Princeton Premium Fund (the “Fund”) is a non-diversified series of shares of beneficial interest of Northern Lights Fund Trust (the “Trust”), a statutory trust organized under the laws of the State of Delaware on January 19, 2005, and registered under the Investment Company Act of 1940, as amended (the “1940 Act”), as an open-end management investment company. The investment objective of the Fund is to seek capital appreciation and income. The Fund commenced operations on November 16, 2016.
The Fund currently offers Class A and Class I shares. Class I shares are offered at net asset value (“NAV”). Class A shares are offered at NAV plus a maximum sales charge of 5.75%, which may be waived at Princeton Fund Advisors, LLC, (the “Advisor”) discretion. Class C shares are not available for purchase. Each class represents an interest in the same assets of the Fund and classes are identical except for differences in their sales charge structures and ongoing service and distribution charges. All classes of shares have equal voting privileges except that each class has exclusive voting rights with respect to its service and/or distribution plans. The Fund’s income, expenses (other than class specific distribution fees) and realized and unrealized gains and losses are allocated proportionately each day based upon the relative net assets of each class.
2. SIGNIFICANT ACCOUNTING POLICIES
The following is a summary of significant accounting policies followed by the Fund in preparation of its financial statements. The policies are in conformity with accounting principles generally accepted in the United States of America (“GAAP”). The preparation of the financial statements requires management to make estimates and assumptions that affect the reported amounts of assets and liabilities and disclosure of contingent assets and liabilities at the date of the financial statements and the reported amounts of income and expenses for the period. Actual results could differ from those estimates. The Fund is an investment company and accordingly follows the investment company accounting and reporting guidance of the Financial Accounting Standards Board (“FASB”) Accounting Standard Codification Topic 946 “Financial Services – Investment Companies”, including FASB Accounting Standard Update (“ASU”) 2013-08.
Security Valuation – Securities listed on an exchange are valued at the last reported sale price at the close of the regular trading session of the primary exchange on the business day the value is being determined, or in the case of securities listed on NASDAQ at the NASDAQ Official Closing Price (“NOCP”). In the absence of a sale, such securities shall be valued at the mean between the current bid and ask prices on the primary exchange on the day of valuation. Debt securities (other than short-term obligations) are valued each day by an independent pricing service approved by the Trust’s Board of Trustees (the “Board”) using methods which include current market quotations from a major market maker in the securities and based on methods which include the consideration of yields or prices of securities of comparable quality, coupon, maturity and type. Short-term debt obligations having 60 days or less remaining until maturity, at time of purchase, may be at amortized cost.
Princeton Premium Fund
NOTES TO FINANCIAL STATEMENTS (Continued)
September 30, 2024
The Fund may hold investments, such as private investments, interests in commodity pools, other non-traded securities or temporarily illiquid securities, for which market quotations are not readily available or are determined to be unreliable. These securities will be valued using the “fair value” procedures approved by the Board. The Board has delegated execution of these procedures to the Advisor as its valuation designee (the “Valuation Designee”). The Board may also enlist third party consultants such as a valuation specialist at a public accounting firm, valuation consultant or financial officer of a security issuer on an as-needed basis to assist the Valuation Designee in determining a security-specific fair value. The Board is responsible for reviewing and approving fair value methodologies utilized by the Valuation Designee, which approval shall be based upon whether the Valuation Designee followed the valuation procedures established by the Board.
Fair Valuation Process – The applicable investments are valued by the Valuation Designee pursuant to valuation procedures established by the Board. For example, fair value determinations are required for the following securities: (i) securities for which market quotations are insufficient or not readily available on a particular business day (including securities for which there is a short and temporary lapse in the provision of a price by the regular pricing source); (ii) securities for which, in the judgment of the Valuation Designee, the prices or values available do not represent the fair value of the instrument; factors which may cause the Valuation Designee to make such a judgment include, but are not limited to, the following: only a bid price or an ask price is available; the spread between bid and ask prices is substantial; the frequency of sales; the thinness of the market; the size of reported trades; and actions of the securities markets, such as the suspension or limitation of trading; (iii) securities determined to be illiquid; and (iv) securities with respect to which an event that will affect the value thereof has occurred (a “significant event”) since the closing prices were established on the principal exchange on which they are traded, but prior to the Fund’s calculation of its NAV. Specifically, interests in commodity pools or managed futures pools are valued on a daily basis by reference to the closing market prices of each futures contract or other asset held by a pool, as adjusted for pool expenses. Restricted or illiquid investments, such as private investments or non-traded securities are valued based upon the current bid for the security from two or more independent dealers or other parties reasonably familiar with the facts and circumstances of the security (who should take into consideration all relevant factors as may be appropriate under the circumstances). If a current bid from such independent dealers or other independent parties is unavailable, the Valuation Designee shall determine, the fair value of such security using the following factors: (i) the type of security; (ii) the cost at date of purchase; (iii) the size and nature of the Fund’s holdings; (iv) the discount from market value of unrestricted securities of the same class at the time of purchase and subsequent thereto; (v) information as to any transactions or offers with respect to the security; (vi) the nature and duration of restrictions on disposition of the security and the existence of any registration rights; (vii) how the yield of the security compares to similar securities of companies of similar or equal creditworthiness; (viii) the level of recent trades of similar or comparable securities; (ix) the liquidity characteristics of the security; (x) current market conditions; and (xi) the market value of any securities into which the security is convertible or exchangeable.
Options Transactions – When the Fund writes a call or put option, an amount equal to the premium received is included in the statement of assets and liabilities as a liability. The amount of the liability is subsequently marked-to-market to reflect the current market value of the option. If an option expires
Princeton Premium Fund
NOTES TO FINANCIAL STATEMENTS (Continued)
September 30, 2024
on its stipulated expiration date or if the Fund enters into a closing purchase transaction, a gain or loss is realized. When the Fund purchases or sells an option, an amount equal to the premium paid or received by the Fund is recorded as an investment and is subsequently adjusted to the current value of the option purchased. If an option expires on the stipulated expiration date or if the Fund enters into a closing sale transaction, a gain or loss is realized. Written and purchased options are non-income producing securities. With purchased options, there is minimal counterparty credit risk to the Fund since these options are exchange traded and the exchange’s clearinghouse, as counterparty to all exchange traded options, guarantees against a possible default. The Fund purchases and sells put options on the S&P 500 Index, utilizing a premium collection strategy that implements a put spread on the same option contract. For example, the Fund will sell a put option and buy back the same put option at a different price, thereby creating a defined risk trade. The difference is referred to as a “spread.” The Fund’s put spreads each utilize the S&P 500 Index contracts, same maturity date, and same number of contracts, but the options are at different strike prices. When the option expiration date arrives, if all options are out-of-the-money, they expire worthless and the Fund will retain the cash collected when opening the position, net of any cash (premium) paid to purchase the put positions.
Impact of Derivatives on the Statement of Assets and Liabilities and Statement of Operations
The derivative instruments outstanding, as of September 30, 2024, as disclosed in the Schedule of Investments and Statement of Assets and Liabilities, and the amounts of realized and changes in unrealized gains and losses on derivative instruments during the period, as disclosed in the Statement of Operations, serve as indicators of the volume of derivative activity for the Fund.
The following is a summary of the location of derivative investments on the Fund’s Statement of Assets and Liabilities for the year ended September 30, 2024:
| Derivative | | Risk Type | | Statement of Assets and Liabilities | | Fair Value | |
| Options purchased | | Equity | | Investment securities: at fair value | | $ | 2,344,430 | |
| Options written | | Equity | | Options written, at fair value | | | (2,521,185 | ) |
The following is a summary of the location of derivative investments on the Fund’s Statement of Operations for the year ended September 30, 2024:
| Derivative Investment Type | Location of Gain/Loss on Derivative |
| Option purchased | Net realized gain (loss) from Investments |
| | Net change in unrealized appreciation (depreciation) on Investments |
| Options written | Net realized gain (loss) from Options Written |
| | Net change in unrealized appreciation (depreciation) on Options Written |
Princeton Premium Fund
NOTES TO FINANCIAL STATEMENTS (Continued)
September 30, 2024
The following is a summary of the Fund’s derivative investments activity recognized in the Statement of Operations categorized by primary risk exposure for the year ended September 30, 2024:
| | | | | Realized gain | | | | |
| | | Primary Risk | | (loss) on options | | | Change in unrealized appreciation | |
| Derivative Investment Type | | Exposure | | contracts | | | (depreciation) on options contracts | |
| Options Purchased | | Equity | | $ | (25,919,125 | ) | | $ | (4,009,771 | ) |
| Options Written | | Equity | | | 29,071,039 | | | | 4,231,014 | |
There were no offsetting arrangements as of September 30, 2024.
The Fund utilizes various methods to measure the fair value of all of its investments on a recurring basis. GAAP establishes a hierarchy that prioritizes inputs to valuation methods. The three levels of input are:
Level 1 – Unadjusted quoted prices in active markets for identical assets and liabilities that the Fund has the ability to access.
Level 2 – Observable inputs other than quoted prices included in Level 1 that are observable for the asset or liability, either directly or indirectly. These inputs may include quoted prices for the identical instrument in an inactive market, prices for similar instruments, interest rates, prepayment speeds, credit risk, yield curves, default rates and similar data.
Level 3 – Unobservable inputs for the asset or liability, to the extent relevant observable inputs are not available, representing the Fund’s own assumptions about the assumptions a market participant would use in valuing the asset or liability, and would be based on the best information available.
The availability of observable inputs can vary from security to security and is affected by a wide variety of factors, including, for example, the type of security, whether the security is new and not yet established in the marketplace, the liquidity of markets, and other characteristics particular to the security. To the extent that valuation is based on models or inputs that are less observable or unobservable in the market, the determination of fair value requires more judgment. Accordingly, the degree of judgment exercised in determining fair value is greatest for instruments categorized in Level 3.
The inputs used to measure fair value may fall into different levels of the fair value hierarchy. In such cases, for disclosure purposes, the level in the fair value hierarchy within which the fair value measurement falls in its entirety, is determined based on the lowest level input that is significant to the fair value measurement in its entirety.
Princeton Premium Fund
NOTES TO FINANCIAL STATEMENTS (Continued)
September 30, 2024
The inputs or methodology used for valuing securities are not necessarily an indication of the risk associated with investing in those securities. The following tables summarize the inputs used as of September 30, 2024 for the Fund’s assets and liabilities measured at fair value:
| Assets * | | Level 1 | | | Level 2 | | | Level 3 | | | Total | |
| U.S. Treasury Bills | | $ | — | | | $ | 317,342,054 | | | $ | — | | | $ | 317,342,054 | |
| Put Options Purchased | | | 2,344,430 | | | | — | | | | — | | | | 2,344,430 | |
| Money Market Fund | | | 35,714,517 | | | | — | | | | — | | | | 35,714,517 | |
| Total | | $ | 38,058,947 | | | $ | 317,342,054 | | | $ | — | | | $ | 355,401,001 | |
| Liabilities * | | Level 1 | | | Level 2 | | | Level 3 | | | Total | |
| Put Options Written | | $ | 2,521,185 | | | $ | — | | | $ | — | | | $ | 2,521,185 | |
| Total | | $ | 2,521,185 | | | $ | — | | | $ | — | | | $ | 2,521,185 | |
The Fund did not hold any Level 3 securities during the year.
| * | See Schedule of Investments for industry classification. |
In accordance with its investment objectives the Fund may have increased or decreased exposure to one or more of the following risk factors defined below:
Commodity Risk – Commodity risk relates to the change in value of commodities or commodity indexes as they relate to increases or decreases in the commodities market. Commodities are physical assets that have tangible properties. Examples of these types of assets are crude oil, heating oil, metals, livestock, and agricultural products.
Credit Risk – Credit risk relates to the ability of the issuer to meet interest and principal payments, or both, as they come due. In general, lower-grade, higher-yield bonds are subject to credit risk to a greater extent than lower-yield, higher-quality bonds.
Equity Risk – Equity risk relates to the change in value of equity securities as they relate to increases or decreases in the general market.
Foreign Exchange Rate Risk – Foreign exchange rate risk relates to the change in the U.S. dollar value of a security held that is denominated in a foreign currency. The U.S. dollar value of a foreign currency denominated security will decrease as the dollar appreciates against the currency, while the U.S. dollar value will increase as the dollar depreciates against the currency.
Interest Rate Risk – Interest rate risk refers to the fluctuations in value of fixed-income securities resulting from the inverse relationship between price and yield. For example, an increase in general interest rates will tend to reduce the market value of already issued fixed-income investments, and a decline in general interest rates will tend to increase their value. In addition, debt securities with longer maturities, which tend to have higher yields, are subject to potentially greater fluctuations in value from changes in interest rates than obligations with shorter maturities.
Market and Geopolitical Risk. – The increasing interconnectivity between global economies and financial markets increases the likelihood that events or conditions in one region or financial market may adversely impact issuers in a different country, region or financial market. Securities in the Fund may underperform due to inflation (or expectations for inflation), interest rates, global demand for particular products or resources, natural disasters, climate-change and climate-related events, pandemics, epidemics, terrorism,
Princeton Premium Fund
NOTES TO FINANCIAL STATEMENTS (Continued)
September 30, 2024
regulatory events and governmental or quasi-governmental actions. The occurrence of global events similar to those in recent years may result in market volatility and may have long term effects on both the U.S. and global financial markets. It is difficult to predict when similar events affecting the U.S. or global financial markets may occur, the effects that such events may have and the duration of those effects. Any such event(s) could have a significant adverse impact on the value and risk profile of the Fund. It is not known how long such impacts, or any future impacts of other significant events described above, will or would last, but there could be a prolonged period of global economic slowdown, which may impact your investment. Therefore, the Fund could lose money over short periods due to short-term market movements and over longer periods during more prolonged market downturns. During a general market downturn, multiple asset classes may be negatively affected. Changes in market conditions and interest rates can have the same impact on all types of securities and instruments. In times of severe market disruptions, you could lose your entire investment.
Non-Diversified Risk – The Fund is non-diversified. This means that it may invest a larger portion of its assets in a limited number of securities or investments than a diversified fund. Because a relatively high percentage of the Fund’s assets may be invested in the same securities or in investments that could be in the same or related economic sectors, the Fund’s portfolio may be more susceptible to any single economic, technological or regulatory occurrence than the portfolio of a diversified fund.
Options Risk – Options are subject to changes in the underlying securities or index of securities on which such instruments are based. There is no guarantee that the Advisor’s Spread Traded options strategy will be effective or that suitable transactions will be available. The Fund’s Spread Traded option strategy’s profit potential is limited to the net premium received when entering the trades. The potential for loss is an amount equal to the 1) difference between either the strike price of the long put and the strike price of the short put, plus 2) any commissions paid. Maximum loss under the Spread Traded option strategy occurs from the put trade, when the underlying price is less than or equal to the strike price of the short put. A portion of any option premiums may be treated as short-term capital gains and when distributed to shareholders are usually taxable as ordinary income, which may have a higher tax rate than long-term capital gains for shareholders holding Fund shares in a taxable account.
Volatility Risk – Volatility risk refers to the magnitude of the movement, but not the direction of the movement, in a financial instrument’s price over a defined time period. Large increases or decreases in a financial instrument’s price over a relative time period typically indicate greater volatility risk, while small increases or decreases in its price typically indicate lower volatility risk.
Please refer to the Fund’s prospectus for a full listing of risks associated with these investments.
Security Transactions and Related Income – Security transactions are accounted for on the trade date. Interest income is recognized on an accrual basis. Discounts are accreted and premiums are amortized to the call date. Dividend income is recorded on the ex-dividend date. Realized gains or losses from sales of securities are determined by comparing the identified cost of the security lot sold with the net sales proceeds.
Princeton Premium Fund
NOTES TO FINANCIAL STATEMENTS (Continued)
September 30, 2024
Allocation of Income, Expenses, Gains and Losses – Income, expenses (other than those attributable to a specific class), realized and unrealized gains and losses are allocated on a daily basis to each class of shares based upon the relative proportion of net assets represented by such class. Operating expenses directly attributable to a specific class are charged against the operations of that class.
Trading Costs – Trading costs generally consists of brokerage commissions, brokerage fees, clearing fees, exchange and regulatory fees, transaction and National Futures Association fees. Fees vary by type of contract for each purchase and sale or sale and purchase (round turn) of futures, options on futures, and forward contracts. Commissions are paid on each individual purchase and sale transaction.
Dividends and Distributions to Shareholders – Dividends from net investment income, if any, are declared and paid quarterly. Distributable net realized capital gains, if any, are declared and distributed annually. Dividends from net investment income and distributions from net realized gains are determined in accordance with federal income tax regulations, which may differ from GAAP. These “book/tax” differences are considered either temporary (i.e., deferred losses, capital loss carry forwards) or permanent in nature. To the extent these differences are permanent in nature, such amounts are reclassified within the composition of net assets based on their federal tax-basis treatment; temporary differences do not require reclassification. Dividends and distributions to shareholders are recorded on the ex-dividend date.
Federal Income Taxes – The Fund complies with the requirements of the Internal Revenue Code applicable to regulated investment companies and distributes all of its taxable income to its shareholders. Therefore, no provision for Federal income tax is required. The Fund recognizes the tax benefits of uncertain tax positions only where the position is “more likely than not” to be sustained assuming examination by tax authorities. Management has analyzed the Fund’s tax positions, and has concluded that no liability for unrecognized tax benefits should be recorded related to uncertain tax positions taken in the Fund’s September 30, 2021 through September 30, 2023 tax returns or expected to be taken in the Fund’s September 30, 2024 tax returns. The Fund identifies its major tax jurisdictions as U.S. Federal, Ohio and foreign jurisdictions where the Fund makes significant investments; however the Fund is not aware of any tax positions for which it is reasonably possible that the total amounts of unrecognized tax benefits will change materially in the next six months.
Expenses – Expenses of the Trust that are directly identifiable to a specific fund are charged to that fund. Expenses, which are not readily identifiable to a specific fund, are allocated in such a manner as deemed equitable (as determined by the Board), taking into consideration the nature and type of expense and the relative sizes of the funds in the Trust.
Credit Facility – Effective August 1, 2023, the Fund entered into a revolving, uncommitted $160,000,000 line of credit with U.S. Bank National Association (the “Revolving Credit Agreement”) which expired on July 29, 2024. Effective July 29, 2024, the Fund entered into an amended and restated agreement, dated July 29, 2024, with a $150,000,000 line credit with U.S. Bank National Association (the “Amended and Restated Revolving Credit Agreement”) set to expire on July 28, 2025. Borrowings under the Amended and Restated Revolving Credit Agreement bear interest at Prime Rate minus 1% per month. There are no fees charged on the unused portion of the line of credit. For the year ended
Princeton Premium Fund
NOTES TO FINANCIAL STATEMENTS (Continued)
September 30, 2024
September 30, 2023 through September 30, 2024, amounts outstanding to the Fund under the credit facility at no time were permitted to exceed $150,000,000.
For the year ended September 30, 2024, the interest expense was $687 for the Fund. There was an outstanding balance of $0 as of September 30, 2024. The Fund did not draw on the line of credit for the period October 1, 2023 through September 30, 2024.
Indemnification – The Trust indemnifies its officers and Trustees for certain liabilities that may arise from the performance of their duties to the Trust. Additionally, in the normal course of business, the Fund enters into contracts that contain a variety of representations and warranties and which provide general indemnities. The Fund’s maximum exposure under these arrangements is unknown, as this would involve future claims that may be made against the Fund that have not yet occurred. However, based on experience, the risk of loss due to these warranties and indemnities appears to be remote.
3. INVESTMENT TRANSACTIONS
For the year ended September 30, 2024, cost of purchases and proceeds from sales of portfolio securities, other than short-term investments and U.S. Government securities, amounted to $0 and $0, respectively.
| 4. | INVESTMENT ADVISORY AGREEMENT AND TRANSACTIONS WITH RELATED PARTIES |
Princeton Fund Advisors, LLC serves as the Fund’s investment advisor.
Pursuant to an investment advisory agreement with the Trust, on behalf of the Fund, the Advisor, under the oversight of the Board, directs the daily operations of the Fund and supervises the performance of administrative and professional services provided by others. As compensation for its services and the related expenses borne by the Advisor, the Fund pays the Advisor a management fee, computed and accrued daily and paid monthly, at an annual rate of 1.75% of the Fund’s average daily net assets. For the year ended September 30, 2024, the Fund incurred advisory fees of $5,959,959 of which $495,361 is payable at September 30, 2024.
Pursuant to a written contract (the “Waiver Agreement”), the Advisor has agreed, at least until January 31, 2025, to waive a portion of its advisory fee and has agreed to reimburse the Fund for other expenses to the extent necessary so that the total expenses incurred by the Fund (excluding any front-end or contingent deferred loads; brokerage fees and commissions, acquired fund fees and expenses); fees and expenses associated with investments in other collective investment vehicles or derivative instruments (including for example options and swap fees and expenses); borrowing costs (such as interest and dividend expense on securities sold short); taxes; expenses incurred in connection with any merger or reorganization; and extraordinary expenses; such as litigation expenses (which may include indemnification of Fund officers and Trustees), and contractual indemnification of Fund service providers (other than the Advisor) do not exceed 2.20% and 1.95% per annum of the Fund’s average daily net assets for Class A, and Class I shares, respectively (the “Expense Limitation”). For the year ended September 30, 2024, the Advisor waived fees and reimbursed expenses in the amount of $236,053 pursuant to the Waiver Agreement.
Princeton Premium Fund
NOTES TO FINANCIAL STATEMENTS (Continued)
September 30, 2024
If the Advisor waives any fee or reimburses any expense pursuant to the Waiver Agreement, and the Fund’s Operating Expenses are subsequently less than the Expense Limitation, the Advisor shall be entitled to reimbursement by the Fund for such waived fees or reimbursed expenses provided that such reimbursement does not cause the Fund’s expenses to exceed the Expense Limitation. If Fund Operating Expenses subsequently exceed the Expense Limitation the reimbursements shall be suspended.
The Advisor may seek reimbursement only for expenses waived or paid by it during the three years prior to such reimbursement; provided, however, that such expenses may only be reimbursed to the extent they were waived or paid after the date of the Waiver Agreement (or any similar agreement). The Board may terminate this expense reimbursement arrangement on 60 days written notice to the Advisor.
The following amounts are subject to recapture by the Advisor by the following dates:
| 9/30/2025 | 9/30/2026 | 9/30/2027 |
| $ | 179,995 | $ | 279,504 | $ | 236,053 |
The Trust, with respect to the Fund’s Class A shares, has adopted the Trust’s Master Distribution and Shareholder Servicing Plan (the “Plan”) pursuant to Rule 12b-1 under the 1940 Act. The Plan provides that a monthly service and/or distribution fee is calculated by the Fund at an annual rate of 0.25% of the average daily net assets attributable to the Class A shares, respectively, and is paid to Northern Lights Distributors, LLC (the “Distributor”), to provide compensation for ongoing distribution-related activities or services and/or maintenance of the Fund’s shareholder accounts, not otherwise required to be provided by the Advisor. The Plan is a compensation plan, which means that compensation is provided regardless of 12b-1 expenses incurred. For the year ended September 30, 2024, the Fund’s Class A shares incurred $57,009 in fees under the Plan.
The Distributor acts as the Fund’s principal underwriter in a continuous public offering of the Fund’s Class A and Class I shares. For the year ended September 30, 2024, the Distributor received $28,209 in underwriting commissions for sales of Class A shares, of which $4,669 was retained by the principal underwriter or other affiliated broker-dealers.
Ultimus Fund Solutions, LLC (“UFS”) – UFS, provides administration, fund accounting, and transfer agent services to the Trust. Pursuant to separate servicing agreements with UFS, the Fund pays UFS customary fees for providing administration, fund accounting and transfer agency services to the Fund. Certain officers of the Trust are also officers of UFS, and are not paid any fees directly by the Fund for serving in such capacities.
Northern Lights Compliance Services, LLC (“NLCS”) – NLCS, an affiliate of UFS, provides a Chief Compliance Officer to the Trust, as well as related compliance services, pursuant to a consulting agreement between NLCS and the Trust. Under the terms of such agreement, NLCS receives customary fees from the Fund.
Princeton Premium Fund
NOTES TO FINANCIAL STATEMENTS (Continued)
September 30, 2024
Blu Giant, LLC (“Blu Giant”) – Blu Giant, an affiliate of UFS and NLCS, provides EDGAR conversion and filing services as well as print management services for the Fund on an ad-hoc basis. For the provision of these services, Blu Giant receives customary fees from the Fund.
5. CONTROL OWNERSHIP
The beneficial ownership, either directly or indirectly, of more than 25% of the voting securities of a portfolio creates presumption of the control of the portfolio, under section 2(a)(9) of the 1940 Act. As of September 30, 2024, the shareholders listed below each held more than 25% of the Fund and may be deemed to control the Fund.
| | % of Outstanding Shares |
| Pershing LLC | 33.0% |
| Charles Schwab | 32.6% |
6. DISTRIBUTIONS TO SHAREHOLDERS AND TAX COMPONENTS OF CAPITAL
The tax character of fund distributions paid for the year ended September 30, 2024, and September 30, 2023, was as follows:
| | | Fiscal Year Ended | | | Fiscal Year Ended | |
| | | September 30, 2024 | | | September 30, 2023 | |
| Ordinary Income | | $ | 14,248,670 | | | $ | 10,904,799 | |
| Long-Term Capital Gain | | | 8,304,124 | | | | 4,323,815 | |
| Return of Capital | | | — | | | | — | |
| | | $ | 22,552,794 | | | $ | 15,228,614 | |
As of September 30, 2024, the components of accumulated earnings/ (deficit) on a tax basis were as follows:
| Undistributed | | | Undistributed | | | Post October Loss | | | Capital Loss | | | Other | | | Unrealized | | | Total | |
| Ordinary | | | Long-Term | | | and | | | Carry | | | Book/Tax | | | Appreciation/ | | | Distributable Earnings/ | |
| Income | | | Gains | | | Late Year Loss | | | Forwards | | | Differences | | | (Depreciation) | | | (Accumulated Deficit) | |
| $ | — | | | $ | — | | | $ | — | | | $ | — | | | $ | — | | | $ | 127,882 | | | $ | 127,882 | |
The difference between book basis and tax basis accumulated realized gain/(loss) on security transactions and unrealized appreciation is primarily attributable to the mark-to-market on 1256 option contracts.
Permanent book and tax differences, primarily attributable to distributions in excess, resulted in reclassifications for the Fund for the fiscal year ended September 30, 2024, as follows:
| Paid In | | | Distributable | |
| Capital | | | Earnings | |
| $ | (3,895,831 | ) | | $ | 3,895,831 | |
Princeton Premium Fund
NOTES TO FINANCIAL STATEMENTS (Continued)
September 30, 2024
7. AGGREGATE UNREALIZED APPRECIATION AND DEPRECIATION – TAX BASIS
| | | | Gross | | | Gross | | | | |
| Cost for Federal | | | Unrealized | | | Unrealized | | | Tax Net Unrealized | |
| Tax purposes | | | Appreciation | | | Depreciation | | | Appreciation | |
| $ | 352,751,934 | | | $ | 4,316,340 | | | $ | (4,188,458 | ) | | $ | 127,882 | |
8. SUBSEQUENT EVENTS
Subsequent events after the date of the Statement of Assets and Liabilities have been evaluated through the date the financial statements were issued.
Management has determined that no events or transactions occurred requiring adjustment or disclosure in the financial statements.
Report of Independent Registered Public Accounting Firm
To the Board of Trustees of Northern Lights Fund Trust
and the Shareholders of Princeton Premium Fund
Opinion on the Financial Statements
We have audited the accompanying statement of assets and liabilities of Princeton Premium Fund (the Fund), a series of the Northern Lights Fund Trust, including the schedule of investments, as of September 30, 2024, the related statement of operations for the year then ended, the statements of changes in net assets for each of the two years in the period then ended, and the related notes to the financial statements (collectively, the financial statements), and the financial highlights for each of the five years in the period then ended. In our opinion, the financial statements and financial highlights present fairly, in all material respects, the financial position of the Fund as of September 30, 2024, the results of its operations for the year then ended, the changes in net assets for each of the two years in the period then ended, and the financial highlights for each of the five years in the period then ended, in conformity with accounting principles generally accepted in the United States of America.
Basis for Opinion
These financial statements are the responsibility of the Fund’s management. Our responsibility is to express an opinion on the Fund’s financial statements and financial highlights based on our audits. We are a public accounting firm registered with the Public Company Accounting Oversight Board (United States) (PCAOB) and are required to be independent with respect to the Fund in accordance with U.S. federal securities laws and the applicable rules and regulations of the Securities and Exchange Commission and the PCAOB.
We conducted our audits in accordance with the standards of the PCAOB. Those standards require that we plan and perform the audit to obtain reasonable assurance about whether the financial statements are free of material misstatement, whether due to error or fraud. The Fund is not required to have, nor were we engaged to perform, an audit of its internal control over financial reporting. As part of our audits, we are required to obtain an understanding of internal control over financial reporting but not for the purpose of expressing an opinion on the effectiveness of the Fund’s internal control over financial reporting. Accordingly, we express no such opinion.
Our audits included performing procedures to assess the risks of material misstatement of the financial statements, whether due to error or fraud, and performing procedures that respond to those risks. Such procedures included examining, on a test basis, evidence regarding the amounts and disclosures in the financial statements. Our procedures included confirmation of investments owned as of September 30, 2024, by correspondence with the custodian and brokers or by other appropriate auditing procedures where replies from brokers were not received. Our audits also included evaluating the accounting principles used and significant estimates made by management, as well as evaluating the overall presentation of the financial statements. We believe that our audits provide a reasonable basis for our opinion.
/s/ RSM US LLP
We have served as the auditor of one or more Princeton Fund Advisors, LLC advised investment companies since 2010.
Denver, Colorado
November 29, 2024
Princeton Premium Fund
SUPPLEMENTAL INFORMATION (Unaudited)
September 30, 2024
Renewal of Advisory Agreement*
In connection with the regular meeting held on June 26-27, 2024 of the Board of Trustees (the “Trustees” or the “Board”) of the Northern Lights Fund Trust (the “Trust”), including a majority of the Trustees who are not “interested persons,” as that term is defined in the Investment Company Act of 1940, as amended, discussed the re-approval of an investment advisory agreement (the “Advisory Agreement”) between Princeton Fund Advisors, LLC (“Advisor”) and the Trust, with respect to the Princeton Premium Fund (the “Fund”). In considering the re-approval of the Advisory Agreement, the Board received materials specifically relating to the Advisory Agreement.
The Trustees were assisted by independent legal counsel throughout the Advisory Agreement review process. The Trustees relied upon the advice of independent legal counsel and their own business judgment in determining the material factors to be considered in evaluating the Advisory Agreement and the weight to be given to each such factor. The conclusions reached by the Trustees were based on a comprehensive evaluation of all of the information provided and were not the result of any one factor. Moreover, each Trustee may have afforded different weight to the various factors in reaching his conclusions with respect to the Advisory Agreement.
Nature, Extent, and Quality of Services. The Trustees noted that Advisor was founded in 2011 and managed over $900 million in assets directly, and approximately $3.4 billion in assets with affiliates. The Trustees noted that Advisor both developed their own alternative strategies and partnered with reputable alternative strategy managers. The Trustees reviewed the background information of the key investment personnel responsible for servicing the Fund and acknowledged their extensive experience with hedge fund strategies and other alternative products. They considered the potential impact of the proposed Restructuring on the day-to-day operations of Advisor. The Trustees agreed that Advisor possessed adequate resources and expertise to support its investment strategies and agreed that they expected Advisor to continue providing high quality service to the Fund for the benefit of its respective shareholders.
Performance. The Trustee’s noted that the Fund’s returns were lower than the Fund’s peer group and category median returns over the prior one-year period but were higher than peer group median returns over the prior three-year and five- year periods. The Trustee’s acknowledged that the Fund’s returns were slightly lower than the peer group median returns on a since-inception basis. The Trustees agreed that the Fund’s performance was satisfactory.
Fees and Expenses. The Trustees noted that Advisor charged the Fund an annual advisory fee of 1.75%, which was higher than the Fund’s category average and median, but consistent with several of the peer funds. The Trustees further noted that the Fund had a net expense ratio of 2.72%, which was the highest in the Fund’s category. The Trustees acknowledged the complexity of the Fund’s strategy and the expertise and resources required to implement it. The Trustees agreed that the advisory fee was not unreasonable.
Economies of Scale. The Trustees considered whether Advisor had achieved economies of scale with respect to its relationship with the Fund. The Trustee’s considered Advisor’s
Princeton Premium Fund
SUPPLEMENTAL INFORMATION (Unaudited)(Continued)
September 30, 2024
statements that the Fund’s strategies presented some capacity limitations, which would limit potential growth and revenue to Advisor. They discussed the current asset levels of the Fund, and considered the additional responsibilities assumed by Advisor as a result of new 1940 Act regulations, and Advisor’s assessment of the additional resources expended by Advisor to ensure each Advisor’s compliance. The Board acknowledged that Advisor had waived a portion of its fees with respect to the Fund, providing shareholders with the benefits of a larger fund by reducing overall fees paid by the shareholders. The Trustees concluded that Advisor was appropriately providing a reasonable net expense ratio to all shareholders of the Fund.
Profitability. The Trustees reviewed the profitability analysis provided by Advisor in terms of actual dollars and as a percentage of revenue with respect to the Fund. The Trustees noted that Advisor had incurred a loss with respect to its relationship with the Fund. The Trustees noted Advisor’s assessment of the reasonableness of the profits, citing the business and other risks assumed by Advisor in managing publicly offered investments, the quality of services provided, and its internal targets for the business to warrant the use of its capital and the opportunity costs. The Trustees concluded that Advisor’s profitability with respect the Fund was not excessive.
Conclusion. Having requested and received such information from Advisor as the Trustees believed to be reasonably necessary to evaluate the terms of the Advisory Agreement, and as assisted by the advice of counsel, the Trustees concluded that the approval of the Advisory Agreement between the Trust and Advisor on behalf of the Fund was in the best interests of the Fund and the Fund’s respective shareholders.
| * | Due to the timing of the contract renewal schedule, these deliberations may or may not relate to the current performance results of the Fund. |
PROXY VOTING POLICY
Information regarding how the Fund voted proxies relating to portfolio securities for the most recent twelve month period ended June 30 as well as a description of the policies and procedures that the Fund uses to determine how to vote proxies is available without charge, upon request, by calling 1-888 -868-9501 or by referring to the Securities and Exchange Commission’s (“SEC”) website at http://www.sec.gov.
PORTFOLIO HOLDINGS
Funds file a complete schedule of portfolio holdings with the Securities and Exchange Commission (the “SEC”) for the first and third quarters of each fiscal year as an exhibit to its reports on Form N-PORT, within sixty days after the end of the period. Form N-PORT reports are available at the SEC’s website at www.sec.gov.
INVESTMENT ADVISOR
Princeton Fund Advisors, LLC
1580 Lincoln Street, Suite 680
Denver, CO 80203
ADMINISTRATOR
Ultimus Fund Solutions, LLC
225 Pictoria Drive, Suite 450
Cincinnati, OH 45246
Item 8. Changes in and Disagreements with Accountants for Open-End Management Investment Companies. Not applicable
Item 9. Proxy Disclosures for Open-End Management Investment Companies. Not applicable
Item 10. Remuneration Paid to Directors, Officers, and Others of Open-End Management Investment Companies. Included under Item 7 of this Form.
Item 11. Statement Regarding Basis for Approval of Investment Advisory Contract.
Included under Item 7 of this Form.
Item 12. Disclosure of Proxy Voting Policies and Procedures for Closed-End Management Investment Companies.
Not applicable.
Item 13. Portfolio Managers of Closed-End Management Investment Companies.
Not applicable.
Item 14. Purchases of Equity Securities by Closed-End Management Investment Company and Affiliated Purchasers.
Not applicable.
Item 15. Submission of Matters to a Vote of Security Holders.
None.
Item 16. Controls and Procedures.
| (a) | The registrant’s Principal Executive Officer and Principal Financial Officer have concluded that the registrant’s disclosure controls and procedures (as defined in Rule 30a-3(c) under the Act) are effective in design and operation and are sufficient to form the basis of the certifications required by Rule 30a-(2) under the Act, based on their evaluation of these disclosure controls and procedures as of a date within 90 days of this report on Form N-CSR. |
| (b) | There were no changes in the registrant’s internal control over financial reporting (as defined in Rule 30a-3(d) under the Act) during the period covered by this report that have materially affected, or are reasonably likely to materially affect, the registrant’s internal control over financial reporting. |
Item 17. Disclosure of Securities Lending Activities for Closed-End Management Investment Companies.
Not applicable.
Item 18. Recovery of Erroneously Awarded Compensation.
Item 19. Exhibits.
| (a)(1) | Code of Ethics for Principal Executive and Senior Financial Officers. Exhibit 99.CODE |
| (a)(3) | A separate certification for each principal executive officer and principal financial officer of the registrant as required by Rule 30a-2(a) under the Act (17 CFR 270.30a-2(a)): Attached hereto. Exhibit 99. CERT |
| (b) | Certifications required by Rule 30a-2(b) under the Act (17 CFR 270.30a-2(b)): Attached hereto Exhibit 99.906CERT |
SIGNATURES
Pursuant to the requirements of the Securities Exchange Act of 1934 and the Investment Company Act of 1940, the registrant has duly caused this report to be signed on its behalf by the undersigned, thereunto duly authorized.
(Registrant) Northern Lights Fund Trust
| By (Signature and Title) | |
| /s/ Kevin E. Wolf | |
| Kevin E. Wolf, Principal Executive Officer/President |
| | |
Pursuant to the requirements of the Securities Exchange Act of 1934 and the Investment Company Act of 1940, this report has been signed below by the following persons on behalf of the registrant and in the capacities and on the dates indicated.
| By (Signature and Title) | |
| /s/ Kevin E. Wolf | |
| Kevin E. Wolf, Principal Executive Officer/President |
| | |
| By (Signature and Title) | |
| /s/ James Colantino | |
| James Colantino, Principal Financial Officer/Treasurer |
| | |