Cautionary Statement
Davis Advisors is committed to communicating with our investment partners as candidly as possible because we believe our investors benefit from understanding our investment philosophy and approach. Our views and opinions regarding the investment prospects of our portfolio holdings include "forward looking statements" which may or may not be accurate over the long term. While we believe we have a reasonable basis for our appraisals and we have confidence in our opinions, actual results may differ materially from those we anticipate. These opinions are current as of the date of this report but are subject to change. The information provided in this report should not be considered a recommendation to buy, sell, or hold any particular security.
You can identify forward looking statements by words like "believe," "expect," "anticipate," or similar expressions when discussing prospects for particular portfolio holdings and/or of the Fund. We cannot assure future results and achievements. You should not place undue reliance on forward looking statements, which speak only as of the date of this report. We disclaim any obligation to update or alter any forward looking statements, whether as a result of new information, future events, or otherwise. This material must be preceded or accompanied by a prospectus. Please read the prospectus carefully for a discussion of investment objectives, risks, fees, and expenses. Current performance may be lower or higher than the performance quoted herein. You may obtain a current copy of the Fund's Prospectus or more current performance information by calling Investor Services at 1-800-432-2504 or on Clipper Fund's website (www.clipperfund.com).
CLIPPER FUNDSM | Table of Contents |
| 2 |
| | |
| 11 |
| | |
| 13 |
| | |
| 14 |
| | |
| 15 |
| | |
| 18 |
| | |
| 19 |
| | |
| 20 |
| | |
| 21 |
| | |
| 26 |
| | |
| 27 |
| | |
| 30 |
| | |
| 31 |
This Semi-Annual Report is authorized for use by existing shareholders. Prospective shareholders must receive a current Clipper Fund Prospectus, which contains more information about investment strategies, risks, fees, and expenses. Please read the prospectus carefully before investing or sending money.
Shares of Clipper Fund are not deposits or obligations of any bank, are not guaranteed by any bank, are not insured by the FDIC or any other agency, and involve investment risks, including possible loss of the principal amount invested.
Portfolio Proxy Voting Policies and Procedures
The Fund has adopted Portfolio Proxy Voting Policies and Procedures under which the Fund votes proxies relating to securities held by the Fund. A description of the Fund's Portfolio Proxy Voting Policies and Procedures is available (i) without charge, upon request, by calling the Fund toll-free at 1-800-432-2504, (ii) on the Fund's website at www.clipperfund.com, and (iii) on the SEC's website at www.sec.gov.
In addition, the Fund is required to file Form N-PX, with its complete proxy voting record for the 12 months ended June 30th, no later than August 31st of each year. The Fund's Form N-PX filing is available (i) without charge, upon request, by calling the Fund toll-free at 1-800-432-2504, (ii) on the Fund's website at www.clipperfund.com, and (iii) on the SEC's website at www.sec.gov.
Form N-Q
The Fund files its complete schedule of portfolio holdings with the SEC for the first and third quarters of each fiscal year on Form N-Q. The Fund's Form N-Q is available without charge, upon request, by calling 1-800-432-2504, on the Fund's website at www.clipperfund.com, and on the SEC's website at www.sec.gov. The Fund's Form N-Q may be reviewed and copied at the SEC's Public Reference Room in Washington, D.C., and information on the operation of the Public Reference Room may be obtained by calling 1-800-SEC-0330.
Summary
| · | For the one year period ending June 30, 2017, Clipper Fund returned 21.94% vs. 17.90% for the S&P 500 Index.1 |
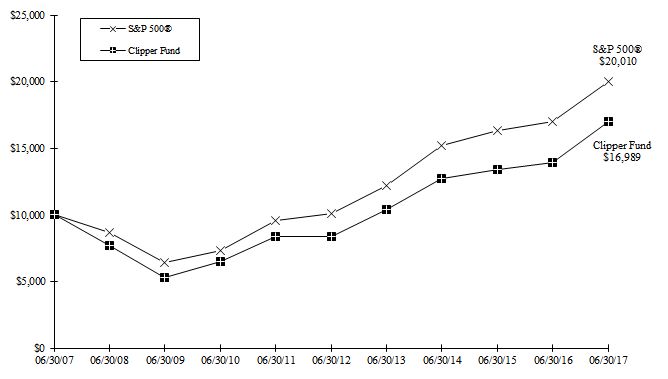
| · | Over the most recent one, three and five year periods, a $10,000 investment grew to $12,194, $13,369 and $20,338 respectively, exceeding the S&P 500 Index in all periods.1 |
| · | Risks in today's market include companies with peak profit margins, long-term bonds and overvalued dividend darlings.2 |
| · | Opportunities in today's market include global leaders selling at bargain prices, blue chips of tomorrow and beneficiaries of short-term misperceptions. |
| · | A true active management approach adds value over time and should have a place in every portfolio. |
| Average Annual Total Returns as of June 30, 2017 |
| | 1 Year | 3 Years | 5 Years | 10 Years | 15 Years | 20 Years |
| Clipper Fund | 21.94% | 10.16% | 15.25% | 5.44% | 6.04% | 8.02% |
S&P 500® Index | 17.90% | 9.61% | 14.63% | 7.18% | 8.34% | 7.15% |
The performance presented represents past performance and is not a guarantee of future results. Total return assumes reinvestment of dividends and capital gain distributions. Investment return and principal value will vary so that, when redeemed, an investor's shares may be worth more or less than their original cost. The total annual operating expense ratio as of the most recent prospectus was 0.72%. The total annual operating expense ratio may vary in future years. Current performance may be higher or lower than the performance quoted. For most recent month-end performance, visit clipperfund.com or call 800‑432‑2504. The Fund received favorable class action settlements from companies that it no longer owns. These settlements had a material impact on the investment performance of the Fund in 2009. This was a one-time event that is unlikely to be repeated. Clipper Fund was managed from inception, February 29, 1984, until December 31, 2005 by another Adviser. Davis Selected Advisers, L.P. took over management of the Fund on January 1, 2006.
Results of Our Investment Discipline
Clipper Fund results have exceeded the S&P 500 over the latest one, three and five year periods.
Over the latest one, three and five year periods, Clipper Fund has built shareholder wealth at a strong absolute rate and achieved relative results that exceed the S&P 500 Index. While active management has fallen out of fashion in recent years, we believe experience and judgment are valuable strengths in portfolio management and are pleased our results over the last five years bear this out. While the value of each dollar invested in Clipper Fund has more than doubled since we were entrusted with management of the Fund in January 2006, we still have ground to make up on a relative basis and intend to build on our improved results in the years ahead. Our confidence in our time-tested approach is reflected by our investment of more than $130 million in Clipper Fund alongside our shareholders.3
______________________________
This report includes candid statements and observations regarding investment strategies, individual securities, and economic and market conditions; however, there is no guarantee that these statements, opinions or forecasts will prove to be correct. Equity markets are volatile and an investor may lose money. Past performance is not a guarantee of future results.
1 Past performance is not a guarantee of future results.
2 While Davis Advisors attempts to manage risk there is no guarantee that an investor will not lose money. Equity markets are volatile and the investment return and principal value of an investment will vary.
3 As of June 30, 2017.
Not a part of Semi-Annual Report to Fund shareholders
CLIPPER FUNDSM | Shareholder Letter – (Continued) |
While our disciplined investment approach will not always be rewarded by the market over shorter periods, this active management strategy has produced positive returns for Clipper shareholders in all periods and relative outperformance over the last five years. The cornerstones of our discipline include rigorous research, focused investing, low expenses, alignment of interests, and a willingness to stand apart from the crowd.
Investment Outlook
Avoid reacting to short-term forecasts; instead build a portfolio for the long term.
Risks in today's market include companies with peak profit margins, long-term bonds and overvalued dividend darlings.
The iconoclastic economist John Kenneth Galbraith famously quipped the "primary function of economic forecasting is to make astrology look respectable." By contrasting the predictions of Wall Street's top strategists for annual stock market returns with what actually happened, the chart below shows the wisdom of Galbraith's insight. In some years, the predictions proved too optimistic and in others too pessimistic. But at no point, did the forecasts get it right.
 4
4The same unpredictability applies to many short-term forecasts including those related to the direction of interest rates, currency moves, economic indicators, and geopolitical events. Instead of reacting to such useless forecasts, successful investors must be prepared for a wide range of possible outcomes. In this way, managing a portfolio for the long term is similar to building a ship for an ocean crossing. Because conditions may be unpredictable, investors must balance the strength needed to endure the inevitable storms with the speed required to reach their destination. By focusing on sensible preparation rather than worthless predictions we have built wealth for our investors over decades.
Since most sectors, economies, markets, and asset classes move through long cycles, the first step for investors is understanding where they are in the cycle. In the most favorable parts of cycles, prices tend toward bubbles as investors become euphoric. In the troughs of cycles, prices move toward bargain levels as investors become pessimistic. For long-term investors, cyclical peaks represent risk and cyclical troughs present opportunities.
Today, on the risk side of the equation, three areas appear to be approaching cyclical peaks. First, following more than eight years of economic expansion, corporate profit margins have reached an all-time high. This trend has provided a wonderful tailwind for the average company's earnings growth and stock price. The other side of this cycle could lead to lower earnings at many companies with their share prices likely to follow suit. Recognizing this risk, we have focused our Portfolio on carefully selected companies with a favorable outlook for profit margins while avoiding the majority of companies where we believe margin compression is more likely.
__________________________
4 Source: Wall Street Journal Publications. From 1999 through 2005, numbers reflect Dow Jones Industrial Average forecasts. In 2006, the S&P 500® Index was used exclusively. Past performance is not a guarantee of future results.
Not a part of Semi-Annual Report to Fund shareholders
CLIPPER FUNDSM | Shareholder Letter – (Continued) |
 5
5
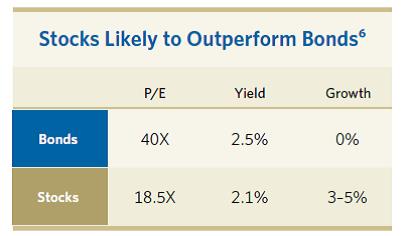
Second, despite some uptick over the last year, interest rates remain near 50 year lows. As a result, many investors have come to view bonds as "safe," forgetting that when interest rates eventually rise, bond prices will fall. In fact, a relatively modest 1% increase in interest rates would lop more than 20% off the price of a long-term bond. As shown in the chart below, bond valuations today reflect considerable euphoria compared to stocks. As a result, stocks are likely to produce far better returns than bonds in the decades ahead.
 6
6Third, within the stock market, investors have become infatuated by current dividend yield. As a result many of the so-called dividend darlings seem significantly overvalued. For example, the largest positions in the most widely held dividend mutual funds and exchange traded funds (ETFs) currently trade at a heady 25 times earnings while paying out 83% of earnings to cover their dividends. Shockingly, over the last five years, the revenue at these companies has actually declined at a rate of 1.2% per year. As with profit margins and interest rates, these dividend darlings seem to be approaching a cyclical extreme and therefore represent a risk we are careful to avoid in our Portfolio.
__________________________
5 http://z822j1x8tde3wuovlgo7ue15.wpengine.netdna-cdn.com/wp-content/uploads/2014/01/margins2.png
6 Source: Bloomberg. As of 1/21/17. Bonds Yield and P/E are represented by 10 Year Government Bond Yield and Stocks P/E are represented by S&P 500. P/E for stocks is forward 12 month estimate.
Not a part of Semi-Annual Report to Fund shareholders
CLIPPER FUNDSM | Shareholder Letter – (Continued) |
 7
7
Portfolio Update
Opportunities include global leaders selling at bargain prices, blue chips of tomorrow and beneficiaries of short-term misperceptions.
If risk lies in those areas of the market where companies are over-earning and overpriced then opportunity lies in those that are under-earning and underappreciated. We have identified four such opportunities in today's market.
Global Leaders Trading at Bargain Prices – Some of the strongest and best-known companies in the world make up the largest portion of the Portfolio. This fact is nothing new. What is unusual though is short-term economic concerns over the past year reduced the share prices of a handful of global leaders such as Berkshire Hathaway and United Technologies to bargain levels at a time of high valuations for the average company.8 Buying top tier businesses at bargain prices is a value investor's dream.
Dominant Lesser Known Businesses – Clipper Fund also invests in a group of lesser known businesses that dominate dull but necessary niches in the global economy. Whether they participate in unglamorous industries or are headquartered in different countries, these businesses are not household names to U.S. investors. As a result, their shares often trade at a discount to better-known companies despite having the same qualities of market dominance and durability as the global leaders described earlier. Such companies include: Johnson Controls, a leader in fire protection and security, building controls, and car batteries, Liberty Global, one of Europe's largest broadband providers, LafargeHolcim, the world's largest cement producer, and Safran, a leader in jet engines (the company has been an equal but less well-known partner of GE for more than 30 years). These companies combine the relevance and resilience of blue chip companies with below-average valuations.
Blue Chips of Tomorrow – Another theme is fast-moving companies that use innovation to disrupt the economics of larger but less agile competitors. Similar to evolution, capitalism is a process of constant change that rewards businesses that can adapt. Over the decades, we have seen many examples of today's disrupters emerging as tomorrow's blue chips. Several of Clipper Fund's core holdings reflect this dynamic. Amazon has not only revolutionized the retail business, but also the information and technology industry through Amazon Web Services (AWS). Alphabet (the parent company of Google) began by making the world's information accessible through the Internet and emerged as the largest and most profitable advertising firm in the world, the brains behind the vast majority of all smart phones, a leader in Internet video, and the emerging leader in artificial intelligence and self-driving cars.
______________________________
7 Source: Morningstar Direct "Stock Intersection" Report as of 12/31/16. Past performance is not a guarantee of future results.
8 Individual securities are discussed in this piece. While we believe we have a reasonable basis for our appraisals and we have confidence in our opinions, actual results may differ materially from those we anticipate. The return of a security to the Fund will vary based on weighting and timing of purchase. This is not a recommendation to buy, sell or hold any specific security. Past performance is not a guarantee of future results.
Not a part of Semi-Annual Report to Fund shareholders
CLIPPER FUNDSM | Shareholder Letter – (Continued) |
CarMax and Didi Chuxing are two additional examples of innovators that have been just as disruptive in their industries. CarMax brings trust, choice and quality into the murky but enormous used car industry. Didi Chuxing introduced a ride hailing service similar to Uber in China only five years ago and has revolutionized the taxi and car service industry there, becoming the largest ride hailing service in the world. Investors in such disruptive leaders stand to benefit not just from the growth in these companies' underlying businesses, but also from their gradual inclusion in the ranks of blue chip stocks.
Beneficiaries of Short-Term Misperceptions – Short-sighted investors often avoid companies that have suffered though challenging periods, creating an opportunity for long-term investors willing to look beyond today's headlines. In banking, for example, memories of the financial crisis of 2008–2009 combined with subsequent anti-banking rhetoric and media coverage have blinded investors to the fact carefully selected banks are both cheap and safe, in our opinion. Contrary to perception, many top tier banks are not only reporting record earnings but are also far better capitalized than at any time in the last 50 years. While unloved now, we believe the leading financial companies we own will be big contributors to Clipper Fund's future returns as the reality of their strong economic fundamentals and rising dividends eclipses current investor perceptions.
Similarly, investors have fled the energy sector in response to the dramatic (and unsustainable) collapse in oil prices. While oil prices are unknowable in the short term, they must exceed the cost of replacing reserves over time. This simple fact will eventually lead to higher energy prices and should drive future returns for the well-positioned, low-cost producers the Fund holds. As a result, we repositioned the energy portion of the Portfolio, adding to existing holdings and initiating new investments. We own a select group of innovative and well-positioned energy companies with the capital allocation discipline, management experience and low-cost, long-lived reserves that will allow them to increase production for decades to come. Holdings include Apache, Encana and Occidental Petroleum.
By focusing the Portfolio on these four areas of opportunities, we combine above-average resiliency and growth with below-average prices. Rather than trying to predict the unpredictable, this positioning prepares the Portfolio for a wide range of possible outcomes, balancing the strength needed to endure the inevitable storms with the growth required to reach our long-term goals.
Market Perspective
Active vs. passive: Has everything been said?
With regulatory encouragement, more than a trillion dollars has been switched from actively managed funds into passive index funds since 2007. Such huge fund flows create momentum, as more money is automatically invested in those stocks whose prices have already gone up. Unfortunately, momentum-based strategies lead to bubbles and bubbles eventually burst. Moreover, while passive investing may have beaten the average manager, a select few active managers have beaten the market over the long term. Clipper Fund, for example, managed by our predecessor James Gipson until 2005 and by Davis Advisors since, has beaten its benchmark since its inception in 1984.9
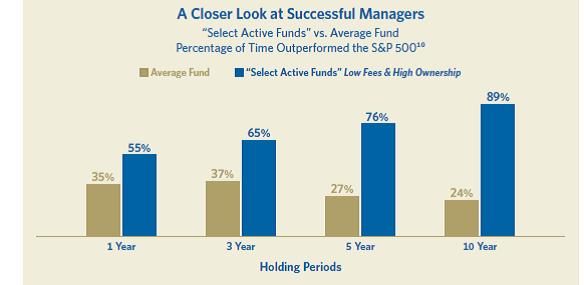
Based on our long experience, we would suggest there are certain quantifiable characteristics of successful active managers including lower than average fees, differentiation from the benchmark index (sometimes referred to as "active share"), low portfolio turnover, strong alignment of interests, experienced leadership, and a proven record. While conventional wisdom increasingly accepts that passive strategies are superior, the data is overwhelming that select active managers with the characteristics listed above can and have beaten the indexes over the long term. Data presented in the chart on the next page, for example, shows that managers with low fees and high ownership in their own funds have outperformed in 89% of all rolling 10-year periods.
___________________________
9 Benchmark is the S&P 500 Index. Past performance is not a guarantee of future results.
Not a part of Semi-Annual Report to Fund shareholders
CLIPPER FUNDSM | Shareholder Letter – (Continued) |
 10
10
Finally, beyond the strong long-term performance of select active managers described on the previous page, certain market environments tend to favor passive managers while others favor active managers. These periods tend to move in long cycles and, contrary to conventional wisdom, during many five-year stretches even the average active manager outperforms the index. The chart below indicates that we are at a cyclical high for passive outperformance and that such highs have historically been followed by sharp reversals.
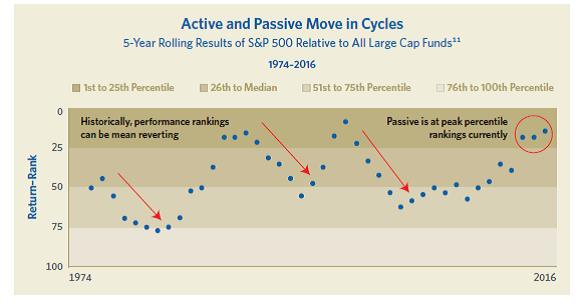 11
11
____________________________
10 Source: Capital Group, based on Morningstar data. Based on monthly rolling periods from July 1996 to June 2016. Funds in the "Average Fund" category are those U.S. domestic equity funds in the Morningstar Large Value, Large Blend and Large Growth categories. Funds in the "Select Active Funds" group are those U.S. domestic equity funds in the Morningstar Large Value, Large Blend and Large Growth categories filtered for the quartile with the lowest net expense ratios (NER) and the quartile with the highest manager ownership. U.S. index is S&P 500. The index is unmanaged and, therefore, has no expenses. Investors cannot invest directly in an index. Past performance is not a guarantee of future results.
11 Source: Morningstar Direct. Universe includes: Large Value, Large Blend and Large Growth.
Not a part of Semi-Annual Report to Fund shareholders
CLIPPER FUNDSM | Shareholder Letter – (Continued) |
As with the investment risks described earlier, cyclical peaks tend to represent risk for long-term investors. Given this long-term cyclical pattern, we expect, with apologies to Mark Twain, the death of active management has been greatly exaggerated.
Conclusion
Healthy investor behavior is essential for achieving long-term investment goals. Market dips are inevitable. Avoid overreacting.
In order to build wealth over the long term, investors must do two things right. First, they must choose investments that will generate satisfactory results. Second, they must ensure their own behavior does not detract from these results.
Up to this point, our discussion has focused on the reasons why our investments should generate good returns in the years ahead. In particular, we are avoiding the risks of peak profit margins, record low interest rates and overvalued dividend darlings while seizing the opportunities offered by global leaders selling at bargain prices, the blue chips of tomorrow and the beneficiaries of short-term misperceptions.
However, for investors to benefit from the wealth-building potential of these investments, they must also foster healthy investor behavior. Above all, they must have the conviction and discipline to stay the course when the headlines are bleak. This is nothing new. Since Clipper Fund was launched in 1984, an initial $10,000 has grown to more than $400,000. During the same period, the market suffered through three recessions, two major bear markets, a period of double-digit interest rates, two wars, the S&L crisis, the Russian default of 1998, the Internet bubble, the 9/11 terrorist attacks, the housing collapse, and the financial crisis of 2007-2008. During each one of these difficult periods, investors who panicked by selling at depressed prices locked in permanent losses, while those that stayed the course built wealth in the recoveries that followed.
Recognizing market dips are an unpleasant but inevitable part of the investment landscape can help investors develop healthier investor behavior. For example, since 1928, the market has suffered a 10% dip every eight months on average and a 20% decline every two-and-a-half years. Despite the fact such dips are a recurring aspect of stock market performance, they are always accompanied by blaring headlines, shouting pundits, and panicked investors. Knowing we will inevitably face such periods in the years ahead, we have focused the Portfolio on businesses whose strength, resiliency and durability should enable them to weather any storm we are likely to face. This knowledge gives us the confidence to stay the course when others are panicking.
As we look to the future, our proven investment discipline, experienced team and the carefully selected companies that make up Clipper Fund put us in a strong position to extend our record of building wealth for our investors. We look forward to continuing our investment journey together.
Sincerely,
| |
| Christopher C. Davis | Danton G. Goei |
| President & Portfolio Manager | Portfolio Manager |
| | |
| August 4, 2017 | |
Not a part of Semi-Annual Report to Fund shareholders
CLIPPER FUNDSM | Shareholder Letter – (Continued) |
This report is authorized for use by existing shareholders. A current Clipper Fund prospectus must accompany or precede this material if it is distributed to prospective shareholders. You should carefully consider the Fund's investment objective, risks, fees, and expenses before investing. Read the prospectus carefully before you invest or send money.
This report includes candid statements and observations regarding investment strategies, individual securities, and economic and market conditions; however, there is no guarantee that these statements, opinions or forecasts will prove to be correct. These comments may also include the expression of opinions that are speculative in nature and should not be relied on as statements of fact.
Objective and Risks. Clipper Fund's investment objective is long-term capital growth and capital preservation. There can be no assurance that the Fund will achieve its objective. The Fund invests primarily in equity securities issued by large companies with market capitalizations of at least $10 billion. Some important risks of an investment in the Fund are: common stock risk: an adverse event may have a negative impact on a company and could result in a decline in the price of its common stock; depositary receipts risk: depositary receipts may trade at a discount (or premium) to the underlying security and may be less liquid than the underlying securities listed on an exchange; fees and expenses risk: the Fund may not earn enough through income and capital appreciation to offset the operating expenses of the Fund; financial services risk: investing a significant portion of assets in the financial services sector may cause the Fund to be more sensitive to systemic risk, regulatory actions, changes in interest rates, non-diversified loan portfolios, credit, and competition; focused portfolio risk: investing in a limited number of companies causes changes in the value of a single security to have a more significant effect on the value of the Fund's total portfolio; foreign country risk: foreign companies may be subject to greater risk as foreign economies may not be as strong or diversified; As of June 30, 2017, the Fund had approximately 13.8% of assets invested in foreign companies; foreign currency risk: the change in value of a foreign currency against the U.S. dollar will result in a change in the U.S. dollar value of securities denominated in that foreign currency; headline risk: the Fund may invest in a company when the company becomes the center of controversy. The company's stock may never recover or may become worthless; large-capitalization companies risk: companies with $10 billion or more in market capitalization generally experience slower rates of growth in earnings per share than do mid- and small-capitalization companies; manager risk: poor security selection may cause the Fund to underperform relevant benchmarks; mid- and small-capitalization companies risk: companies with less than $10 billion in market capitalization typically have more limited product lines, markets and financial resources than larger companies, and may trade less frequently and in more limited volume; and stock market risk: stock markets have periods of rising prices and periods of falling prices, including sharp declines. See the prospectus for a complete description of the principal risks.
Davis Advisors is committed to communicating with our investment partners as candidly as possible because we believe our investors benefit from understanding our investment philosophy and approach. Our views and opinions include "forward-looking statements" which may or may not be accurate over the long term. Forward-looking statements can be identified by words like "believe," "expect," "anticipate," or similar expressions. You should not place undue reliance on forward-looking statements, which are current as of the date of this report. We disclaim any obligation to update or alter any forward-looking statements, whether as a result of new information, future events, or otherwise. While we believe we have a reasonable basis for our appraisals and we have confidence in our opinions, actual results may differ materially from those we anticipate.
The information provided in this material should not be considered a recommendation to buy, sell or hold any particular security. As of June 30, 2017, the top ten holdings of Clipper Fund were: Berkshire Hathaway-Class A, 7.33%; Alphabet, 7.14%; Amazon.com, 6.91%; United Technologies, 6.52%; Bank of New York Mellon, 6.22%; American Express, 6.04%; Wells Fargo, 5.97%; Markel, 5.12%; Johnson Controls International PLC, 4.91%; Apache, 4.67%.
Clipper Fund has adopted a Portfolio Holdings Disclosure policy that governs the release of non-public portfolio holding information. This policy is described in the prospectus. Holding percentages are subject to change. Visit clipperfund.com or call 800‑432‑2504 for the most current public portfolio holdings information.
Clipper Fund was managed from inception, February 29, 1984, until December 31, 2005 by another Adviser. Davis Selected Advisers, L.P. took over management of the Fund on January 1, 2006.
Not a part of Semi-Annual Report to Fund shareholders
CLIPPER FUNDSM | Shareholder Letter – (Continued) |
Broker-dealers and other financial intermediaries may charge Davis Advisors substantial fees for selling its funds and providing continuing support to clients and shareholders. For example, broker-dealers and other financial intermediaries may charge: sales commissions; distribution and service fees; and record-keeping fees. In addition, payments or reimbursements may be requested for: marketing support concerning Davis Advisors' products; placement on a list of offered products; access to sales meetings, sales representatives and management representatives; and participation in conferences or seminars,
sales or training programs for invited registered representatives and other employees, client and investor events, and other dealer-sponsored events. Financial advisors should not consider Davis Advisors' payment(s) to a financial intermediary as a basis for recommending Davis Advisors.
We gather our index data from a combination of reputable sources, including, but not limited to, Thomson Financial, Lipper and index websites.
The S&P 500 Index is an unmanaged index of 500 selected common stocks, most of which are listed on the New York Stock Exchange. The Index is adjusted for dividends, weighted towards stocks with large market capitalizations and represents approximately two-thirds of the total market value of all domestic common stocks. Investments cannot be made directly in an index.
Price/Earnings (P/E) Ratio is the weighted average of the price/earnings ratios of the stocks in a portfolio. The P/E ratio of a stock is calculated by dividing the current price of the stock by its trailing 12 months' earnings per share. Portfolio totals are computed using an inverse harmonic methodology.
John Kenneth Galbraith is not associated in any way with Davis Selected Advisers, Davis Advisors or their affiliates.
After October 31, 2017, this material must be accompanied by a supplement containing performance data for the most recent quarter end.
Shares of the Clipper Fund are not deposits or obligations of any bank, are not guaranteed by any bank, are not insured by the FDIC or any other agency, and involve investment risks, including possible loss of the principal amount invested.
06/17 Davis Distributors, LLC, 2949 East Elvira Road, Suite 101, Tucson, AZ 85756, 800‑432‑2504, clipperfund.com
Not a part of Semi-Annual Report to Fund shareholders
CLIPPER FUNDSM | Management's Discussion of Fund Performance |
Performance Overview
Clipper Fund underperformed the Standard & Poor's 500® Index ("S&P 500®") for the six-month period ended June 30, 2017 (the "period"). The Fund delivered a total return of 6.84%, versus a 9.34% return for the S&P 500®. Only two sectors1 within the S&P 500® reported negative performance, Energy (down 13%) and Telecommunication Services (down 11%). The third-weakest, but still positive, performing sector was Real Estate (up 6%). The sectors within the S&P 500® that reported the strongest performance were Information Technology (up 17%), Health Care (up 16%), and Consumer Discretionary (up 11%).
Detractors from Performance
The Fund's holdings in the Energy sector were the most significant detractor from performance2. The Fund's Energy holdings were down about 21%, compared to down 13% for the S&P 500® sector. When compared to the S&P 500®, the Fund suffered from an overweight position (average weighting of 11%, versus 7%) in the weakest performing sector of the period. All three of the Fund's Energy holdings reported negative performance and comprised the Fund's top three overall detractors, Apache3 (down 24%), Encana (down 25%), and Occidental Petroleum (down 14%), respectively.
When compared to the S&P 500®, the Fund suffered from underweight positions in the strongest performing sectors of the period, Information Technology (average weighting of 7%, versus 21%) and Health Care (average weighting of 4%, versus 14%). While the Fund's Information Technology holdings performed in-line with the S&P 500® Information Technology sector (both up 17%), the Fund's Health Care holdings underperformed the S&P 500® Health Care sector (up 10%, compared to up 16%). Valeant Pharmaceuticals (down 39%), which the Fund no longer owns, was a weak performer.
The Fund maintained its large position in Financials (average weighting of 39%, versus 15% for the S&P 500®); however, the Fund's Financial holdings slightly underperformed the S&P 500® sector (up 7%, compared to up 8%). U.S. Bancorp (up less than 1%) and Wells Fargo (up 2%) were key detractors. The Fund no longer owns U.S. Bancorp.
Additional detractors included CarMax (down 2%) and Liberty Global (up 5%), both from the Consumer Discretionary sector.
Given the strong market over the period, the Fund's 3% average weighting in cash and equivalents was a key detractor when compared to the S&P 500®.
Contributors to Performance
The Fund's holdings in the Consumer Discretionary sector made the most significant contribution to performance. The Fund's Consumer Discretionary holdings were up about 20%, compared to up 11% for the S&P 500® sector. Amazon (up 29%), the Fund's third-largest holding, was the Fund's top overall contributor for the period. Didi Chuxing (up 33%) was also a strong performer.
Returns from holdings in the Financials sector made a significant contribution to performance on an absolute basis. American Express (up 15%) and Bank of New York Mellon (up 9%) were key contributors.
The Fund's Industrial holdings were up about 15%, compared to up 10% for the S&P 500® sector. Safran (up 28%) and United Technologies (up 13%) were strong performers.
Additional contributors included Alphabet (up 18%), the Fund's second-largest holding, from the Information Technology sector; UnitedHealth Group (up 17%) from the Health Care sector; and Monsanto (up 14%) and LafargeHolcim (up 13%), both from the Materials sector.
The Fund had approximately 13% of its average net assets invested in foreign securities. As a whole, the Fund's foreign holdings outperformed its domestic holdings (up 8%, versus up 7%).
Clipper Fund's investment objective is to seek long-term capital growth and capital preservation. There can be no assurance that the Fund will achieve its objective. Clipper Fund's principal risks are: common stock risk, depositary receipts risk, fees and expenses risk, financial services risk, focused portfolio risk, foreign country risk, foreign currency risk, headline risk, large-capitalization companies risk, manager risk, mid- and small-capitalization companies risk, and stock market risk. See the prospectus for a full description of each risk.
Clipper Fund focuses its investments in fewer companies, and it may be subject to greater risks than a more diversified fund that is not allowed to focus its investments in a few companies. The Fund's investment performance, both good and bad, is expected to reflect the economic performance of its more focused portfolio.
Past performance does not guarantee future results, Fund prices fluctuate, and the value of an investment may be worth more or less than the purchase price. Data provided in this performance overview is for the six-month period ended June 30, 2017, unless otherwise noted. Return figures for underlying Fund positions reflect the return of the security from the beginning of the period or the date of first purchase if subsequent thereto through the end of the period or the date the position is completely liquidated. The actual contribution to the Fund will vary based on a number of factors (e.g., trading activity, weighting). Portfolio holding information is as of the end of the six-month period, June 30, 2017, unless otherwise noted.
1 | The companies included in the Standard & Poor's 500® Index are divided into eleven sectors. One or more industry groups make up a sector. For purposes of measuring concentration, the Fund generally classifies companies at the industry group or industry level. See the SAI for additional information regarding the Fund's concentration policy. |
2 | A company's or sector's contribution to or detraction from the Fund's performance is a product both of its appreciation or depreciation and its weighting within the Fund. For example, a 5% holding that rises 20% has twice as much impact as a 1% holding that rises 50%. |
3 | This Management Discussion of Fund Performance discusses a number of individual companies. The information provided in this report does not provide information reasonably sufficient upon which to base an investment decision and should not be considered a recommendation to purchase, sell, or hold any particular security. The Schedule of Investments lists the Fund's holdings of each company discussed. |
CLIPPER FUNDSM | Management's Discussion of Fund Performance – (Continued) |
Comparison of a $10,000 investment in Clipper Fund versus the Standard & Poor's 500® Index
over 10 years for an investment made on June 30, 2007
Average Annual Total Return for periods ended June 30, 2017
Fund & Benchmark Index | 1-Year | 5-Year | 10-Year | Since Fund's Inception (02/29/84) | Gross Expense Ratio | Net Expense Ratio |
| Clipper Fund | 21.94% | 15.25% | 5.44% | 11.74% | 0.72% | 0.72% |
Standard & Poor's 500® Index | 17.90% | 14.63% | 7.18% | 11.21% | | |
In 2009, the Fund received favorable class action settlements from companies which it no longer owns. These settlements had a material impact on the investment performance of the Fund, adding approximately 5% to the Fund's total return in 2009. This was a one-time event that is unlikely to be repeated.
The Standard & Poor's 500® Index is an unmanaged index of 500 selected common stocks, most of which are listed on the New York Stock Exchange. The Index is adjusted for dividends, weighted towards stocks with large market capitalizations, and represents approximately two-thirds of the total market value of all domestic common stocks. Investments cannot be made directly in the Index.
The performance data for Clipper Fund contained in this report represents past performance, assumes that all distributions were reinvested, and should not be considered as an indication of future performance from an investment in the Fund today. The investment return and principal value will fluctuate so that shares may be worth more or less than their original cost when redeemed. Fund performance changes over time and current performance may be higher or lower than stated. Returns shown do not reflect the deduction of taxes that a shareholder would pay on fund distributions or the redemption of fund shares. The operating expense ratio may vary in future years. For more current information please call Clipper Fund Investor Services at 1-800-432-2504.
Davis Selected Advisers, L.P. began serving as investment adviser to Clipper Fund on January 1, 2006. A different investment adviser managed the Fund through December 31, 2005.
CLIPPER FUNDSM | |
| | June 30, 2017 (Unaudited) |
| Portfolio Composition | | Industry Weightings |
| (% of Fund's 06/30/17 Net Assets) | | (% of 06/30/17 Stock Holdings) |
| | | | | | | |
| | | | | Fund | | S&P 500® |
| Common Stock (U.S.) | 83.83% | | Diversified Financials | 24.83% | | 5.26% |
| Common Stock (Foreign) | 10.93% | | Capital Goods | 16.19% | | 7.38% |
| Preferred Stock (Foreign) | 2.84% | | Retailing | 11.72% | | 5.47% |
| Short-Term Investments | 2.42% | | Banks | 10.34% | | 6.50% |
| Other Assets & Liabilities | (0.02)% | | Energy | 9.56% | | 6.05% |
| | 100.00% | | Information Technology | 7.36% | | 22.25% |
| | | | Materials | 7.15% | | 2.85% |
| | | | Insurance | 5.25% | | 2.78% |
| | | | Health Care | 4.11% | | 14.50% |
| | | | Media | 2.10% | | 3.05% |
| | | | Automobiles & Components | 1.39% | | 0.68% |
| | | | Food, Beverage & Tobacco | – | | 5.26% |
| | | | Utilities | – | | 3.16% |
| | | | Other | – | | 14.81% |
| | | | | 100.00% | | 100.00% |
| | | | | | | |
| | | | | | | |
| Top 10 Long-Term Holdings |
| (% of Fund's 06/30/17 Net Assets) |
| | | |
| Berkshire Hathaway Inc., Class A | Diversified Financial Services | 7.33% |
| Alphabet Inc.* | Software & Services | 7.14% |
| Amazon.com, Inc. | Retailing | 6.91% |
| United Technologies Corp. | Capital Goods | 6.52% |
| Bank of New York Mellon Corp. | Capital Markets | 6.22% |
| American Express Co. | Consumer Finance | 6.04% |
| Wells Fargo & Co. | Banks | 5.97% |
| Markel Corp. | Property & Casualty Insurance | 5.12% |
| Johnson Controls International PLC | Capital Goods | 4.91% |
| Apache Corp. | Energy | 4.67% |
*Alphabet Inc. holding includes Class A and Class C.
CLIPPER FUNDSM | Expense Example ( Unaudited) |
As a shareholder of the Fund, you incur ongoing costs only, including advisory and administrative fees and other Fund expenses. The Expense Example is intended to help you understand your ongoing costs (in dollars) of investing in the Fund and to compare these costs with the ongoing costs of investing in other mutual funds. The Expense Example is based on an investment of $1,000 invested at the beginning of the period and held for the entire period indicated, which is for the six-month period ended June 30, 2017.
Actual Expenses
The information represented in the row entitled "Actual" provides information about actual account values and actual expenses. You may use the information in this row, together with the amount you invested, to estimate the expenses that you paid over the period. Simply divide your account value by $1,000 (for example, an $8,600 account value divided by $1,000 = 8.6), then multiply the result by the number under the heading "Expenses Paid During Period" to estimate the expenses you paid on your account during this period. An annual maintenance fee of $10, charged on retirement plan accounts per Social Security Number, is not included in the Expense Example. If this fee was included, the estimate of expenses you paid during the period would be higher, and your ending account value would be lower, by this amount.
Hypothetical Example for Comparison Purposes
The information represented in the row entitled "Hypothetical" provides information about hypothetical account values and hypothetical expenses based on the Fund's actual expense ratio and an assumed rate of return of 5% per year before expenses, which is not the Fund's actual return. The hypothetical account values and expenses may not be used to estimate the actual ending account balance or expenses you paid for the period. You may use this information to compare the ongoing costs of investing in the Fund and other funds. To do so, compare this 5% hypothetical example with the 5% hypothetical examples that appear in the shareholder reports of the other funds. An annual maintenance fee of $10, charged on retirement plan accounts per Social Security Number, is not included in the Expense Example. If this fee was included, the estimate of expenses you paid during the period would be higher, and your ending account value would be lower, by this amount.
Please note that the expenses shown in the table are meant to highlight your ongoing costs only. Therefore, the information in the row entitled "Hypothetical" is useful in comparing ongoing costs only, and will not help you determine the relative total costs of owning different funds.
| | Beginning Account Value (01/01/17) | | Ending Account Value (06/30/17) | | Expenses Paid During Period* (01/01/17-06/30/17) |
| | | | | | |
| Actual | $1,000.00 | | $1,068.43 | | $3.69 |
| Hypothetical | $1,000.00 | | $1,021.22 | | $3.61 |
Hypothetical assumes 5% annual return before expenses.
* Expenses are equal to the Fund's annualized operating expense ratio (0.72%)**, multiplied by the average account value over the period, multiplied by 181/365 (to reflect the one-half year period).
** The expense ratio reflects the impact, if any, of certain reimbursements from the Adviser.
CLIPPER FUNDSM | |
| | June 30, 2017 (Unaudited) |
| | Shares | | Value
(Note 1) |
| COMMON STOCK – (94.76%) |
| | CONSUMER DISCRETIONARY – (12.01%) |
| | | Automobiles & Components – (1.35%) |
| | | Adient PLC | | | 228,819 | | $ | 14,960,186 |
| | Media – (2.06%) |
| | Liberty Global PLC, LiLAC Class C * | | | 113,705 | | | 2,434,424 |
| | Liberty Global PLC, Series C * | | | 650,773 | | | 20,291,102 |
| | | | 22,725,526 |
| | Retailing – (8.60%) |
| | Amazon.com, Inc. * | | | 78,896 | | | 76,371,328 |
| | CarMax, Inc. * | | | 297,342 | | | 18,750,387 |
| | | | 95,121,715 |
| | | | Total Consumer Discretionary | | | 132,807,427 |
| | ENERGY – (9.33%) |
| | Apache Corp. | | | 1,077,109 | | | 51,625,834 |
| | Encana Corp. (Canada) | | | 2,945,633 | | | 25,921,570 |
| | Occidental Petroleum Corp. | | | 428,843 | | | 25,674,831 |
| | Total Energy | | | 103,222,235 |
| | FINANCIALS – (39.45%) |
| | Banks – (10.10%) |
| | JPMorgan Chase & Co. | | | 498,422 | | | 45,555,771 |
| | Wells Fargo & Co. | | | 1,192,422 | | | 66,072,103 |
| | | | 111,627,874 |
| | Diversified Financials – (24.23%) |
| | | Capital Markets – (6.22%) |
| | Bank of New York Mellon Corp. | | | 1,348,743 | | | 68,812,868 |
| | Consumer Finance – (10.68%) |
| | American Express Co. | | | 793,176 | | | 66,817,146 |
| | Capital One Financial Corp. | | | 621,190 | | | 51,322,718 |
| | | 118,139,864 |
| | Diversified Financial Services – (7.33%) |
| | Berkshire Hathaway Inc., Class A * | | | 318 | | | 80,994,600 |
| | | | 267,947,332 |
| | Insurance – (5.12%) |
| | Property & Casualty Insurance – (5.12%) |
| | Markel Corp. * | | | 58,067 | | | 56,665,262 |
| | Total Financials | | | 436,240,468 |
| | HEALTH CARE – (4.01%) |
| | Health Care Equipment & Services – (4.01%) |
| | UnitedHealth Group Inc. | | | 239,054 | | | 44,325,393 |
| | Total Health Care | | | 44,325,393 |
| | INDUSTRIALS – (15.80%) |
| | Capital Goods – (15.80%) |
| | Johnson Controls International PLC | | | 1,252,396 | | | 54,303,891 |
| | Safran S.A. (France) | | | 527,268 | | | 48,322,050 |
| | United Technologies Corp. | | | 590,265 | | | 72,077,259 |
| | Total Industrials | | | 174,703,200 |
CLIPPER FUNDSM | Schedule of Investments – (Continued) |
| | June 30, 2017 (Unaudited) |
| | Shares/Units/ Principal | | Value
(Note 1) |
| COMMON STOCK – (CONTINUED) |
| | INFORMATION TECHNOLOGY – (7.18%) |
| | | Software & Services – (7.18%) |
| | | Alphabet Inc., Class A * | | | 42,960 | | $ | 39,939,053 |
| | Alphabet Inc., Class C * | | | 42,982 | | | 39,059,033 |
| | ASAC II L.P. *(a) | | | 407,313 | | | 395,704 |
| | | Total Information Technology | | | 79,393,790 |
| | MATERIALS – (6.98%) |
| | LafargeHolcim Ltd. (Switzerland) | | | 812,924 | | | 46,674,733 |
| | Monsanto Co. | | | 257,546 | | | 30,483,145 |
| | Total Materials | | | 77,157,878 |
| | | TOTAL COMMON STOCK – (Identified cost $712,867,209) | | | 1,047,850,391 |
| PREFERRED STOCK – (2.84%) |
| | CONSUMER DISCRETIONARY – (2.84%) |
| | Retailing – (2.84%) |
| | Didi Chuxing Joint Co., Series A (China)*(a) | | | 524,409 | | | 26,709,252 |
| | Didi Chuxing Joint Co., Series B (China)*(a) | | | 91,609 | | | 4,665,839 |
| | Total Consumer Discretionary | | | 31,375,091 |
| | TOTAL PREFERRED STOCK – (Identified cost $24,712,474) | | | 31,375,091 |
| SHORT-TERM INVESTMENTS – (2.42%) |
| | INTL FCStone Financial Inc. Joint Repurchase Agreement, 1.08%, 07/03/17, dated 06/30/17, repurchase value of $3,051,275 (collateralized by: U.S. Government agency mortgages in a pooled cash account, 2.00%-9.00%, 09/15/17-05/01/47, total market value $3,112,020) | | $ | 3,051,000 | | | 3,051,000 |
| | Mizuho Securities USA Inc. Joint Repurchase Agreement, 1.10%, 07/03/17, dated 06/30/17, repurchase value of $1,800,165 (collateralized by: U.S. Government agency mortgages in a pooled cash account, 4.00%, 07/01/46-06/01/47, total market value $1,836,000) | | | 1,800,000 | | | 1,800,000 |
| | Nomura Securities International, Inc. Joint Repurchase Agreement, 1.13%, 07/03/17, dated 06/30/17, repurchase value of $18,309,724 (collateralized by: U.S. Government agency mortgages in a pooled cash account, 3.00%-4.50%, 04/01/27-05/01/47, total market value $18,674,160) | | | 18,308,000 | | | 18,308,000 |
| | SunTrust Robinson Humphrey, Inc. Joint Repurchase Agreement, 1.27%, 07/03/17, dated 06/30/17, repurchase value of $3,662,388 (collateralized by: U.S. Government agency mortgages and obligations in a pooled cash account, 0.90%-3.329%, 12/28/17-07/01/40, total market value $3,735,240) | | | 3,662,000 | | | 3,662,000 |
| | TOTAL SHORT-TERM INVESTMENTS – (Identified cost $26,821,000) | | | 26,821,000 |
CLIPPER FUNDSM | Schedule of Investments – (Continued) |
| | June 30, 2017 (Unaudited) |
| | Total Investments – (100.02%) – (Identified cost $764,400,683) – (b) | | $ | 1,106,046,482 |
| | Liabilities Less Other Assets – (0.02%) | | | (234,857) |
| | Net Assets – (100.00%) | | $ | 1,105,811,625 |
| |
| | * | Non-income producing security. |
| |
| | (a) | Restricted Security – See Note 6 of the Notes to Financial Statements. |
| |
| | (b) | Aggregate cost for federal income tax purposes is $770,243,256. At June 30, 2017, unrealized appreciation (depreciation) of securities for federal income tax purposes is as follows: |
| |
| | Unrealized appreciation | | $ | 378,304,542 |
| | Unrealized depreciation | | | (42,501,316) |
| | Net unrealized appreciation | | $ | 335,803,226 |
| |
| See Notes to Financial Statements |
CLIPPER FUNDSM | Statement of Assets and Liabilities |
| | At June 30, 2017 (Unaudited) |
| ASSETS: | | | | | |
| Investments in securities at value* (see accompanying Schedule of Investments) | | $ | 1,106,046,482 |
| Cash | | | 1,551 |
| Receivables: | | | |
| | Capital stock sold | | | 670,600 |
| | Dividends and interest | | | 639,870 |
| Prepaid expenses | | | 4,842 |
| | | Total assets | | | 1,107,363,345 |
LIABILITIES: | | | |
| Payables: | | | |
| | Capital stock redeemed | | | 201,462 |
| | Investment securities purchased | | | 546,974 |
| Accrued investment advisory fee | | | 515,354 |
| Accrued transfer agent fees | | | 170,166 |
| Other accrued expenses | | | 117,764 |
| | Total liabilities | | | 1,551,720 |
NET ASSETS | | $ | 1,105,811,625 |
SHARES OUTSTANDING | | | 9,717,024 |
NET ASSET VALUE, offering, and redemption price per share (Net assets ÷ Shares outstanding) | | $ | 113.80 |
NET ASSETS CONSIST OF: | | | |
| Paid in capital | | $ | 752,067,330 |
| Undistributed net investment income | | | 579,990 |
| Accumulated net realized gains from investments and foreign currency transactions | | | 11,518,506 |
| Net unrealized appreciation on investments and foreign currency transactions | | | 341,645,799 |
| | Net Assets | | $ | 1,105,811,625 |
| | | | | |
| *Including: | | | |
| | Cost of investments | | $ | 764,400,683 |
| See Notes to Financial Statements |
CLIPPER FUNDSM | |
| | For the six months ended June 30, 2017 (Unaudited) |
| INVESTMENT INCOME: | | | | | | |
| Income: | | | |
| Dividends* | | $ | 8,699,225 |
| Interest | | | 106,053 |
| | | Total income | | | | 8,805,278 |
Expenses: | | | |
| Investment advisory fees (Note 3) | | $ | 3,087,589 | | | |
| Custodian fees | | | 81,036 | | | |
| Transfer agent fees | | | 615,751 | | | |
| Audit fees | | | 25,057 | | | |
| Legal fees | | | 9,332 | | | |
| Reports to shareholders | | | 41,501 | | | |
| Trustees' fees and expenses | | | 112,772 | | | |
| Registration and filing fees | | | 32,499 | | | |
| Miscellaneous | | | 29,935 | | | |
| | Total expenses | | | | 4,035,472 |
| Net investment income | | | 4,769,806 |
REALIZED & UNREALIZED GAIN (LOSS) ON INVESTMENTS AND FOREIGN CURRENCY TRANSACTIONS: | | | | | | |
| Net realized gain (loss) from: | | | |
| | Investment transactions | | | 22,236,298 |
| | Foreign currency transactions | | | (3,769) |
| Net realized gain | | | 22,232,529 |
| Net increase in unrealized appreciation | | | 49,916,911 |
| | Net realized and unrealized gain on investments and foreign currency transactions | | | | 72,149,440 |
| Net increase in net assets resulting from operations | | $ | 76,919,246 |
| | | | | | | | | |
| *Net of foreign taxes withheld of | | $ | 86,568 |
| See Notes to Financial Statements |
CLIPPER FUNDSM | Statements of Changes in Net Assets |
| | | Six months ended June 30, 2017 (Unaudited) | | Year ended December 31, 2016 |
OPERATIONS: | | | | | | |
| Net investment income | | $ | 4,769,806 | | $ | 7,043,302 |
| Net realized gain from investments and foreign currency transactions | | | 22,232,529 | | | 134,861,030 |
Net increase in unrealized appreciation on investments and foreign currency transactions | | | 49,916,911 | | | 15,474,808 |
| | Net increase in net assets resulting from operations | | | 76,919,246 | | | 157,379,140 |
DIVIDENDS AND DISTRIBUTIONS TO SHAREHOLDERS FROM: | | | | | | |
| Net investment income | | | (4,863,965) | | | (12,684,799) |
Realized gains from investment transactions | | | (17,643,793) | | | (108,976,945) |
CAPITAL SHARE TRANSACTIONS: | | | | | | |
| Net decrease in net assets resulting from capital share transactions (Note 4) | | | (160,581,002) | | | (39,837,748) |
| | Total decrease in net assets | | | (106,169,514) | | | (4,120,352) |
NET ASSETS: | | | | | | |
| Beginning of period | | | 1,211,981,139 | | | 1,216,101,491 |
End of period* | | $ | 1,105,811,625 | | $ | 1,211,981,139 |
| | | | | | | | |
| *Including undistributed net investment income of | | $ | 579,990 | | $ | 674,149 |
| See Notes to Financial Statements |
CLIPPER FUNDSM | Notes to Financial Statements |
| | June 30, 2017 (Unaudited) |
NOTE 1 - SUMMARY OF SIGNIFICANT ACCOUNTING POLICIES
Clipper Funds Trust, a Delaware statutory trust ("Trust"), on behalf of Clipper Fund ("Fund"), a series of the Trust, is registered under the Investment Company Act of 1940, as amended, as a non-diversified, open-end management investment company. The Fund follows the reporting guidance of the Financial Accounting Standards Board ("FASB") Accounting Standards Codification Topic 946, Financial Services – Investment Companies. The Fund's investment objective is long-term capital growth and capital preservation. Davis Selected Advisers, L.P. ("Davis Advisors" or "Adviser"), the Fund's investment adviser, seeks to invest the Fund's assets primarily in common stocks of large companies (generally, companies with market capitalizations of $10 billion or more at the time of initial purchase) that are trading at prices below the Adviser's estimate of their intrinsic values. The following is a summary of significant accounting policies consistently followed by the Fund in the preparation of its financial statements.
Security Valuation - The Fund calculates the net asset value of its shares as of the close of the New York Stock Exchange ("Exchange"), normally 4:00 P.M. Eastern time, on each day the Exchange is open for business. Securities listed on the Exchange (and other national exchanges including NASDAQ) are valued at the last reported sales price on the day of valuation. Listed securities for which no sale was reported on that date are valued at the last quoted bid price. Securities traded on foreign exchanges are valued based upon the last sales price on the principal exchange on which the security is traded prior to the time when the Fund's assets are valued. Securities (including restricted securities) for which market quotations are not readily available or securities whose values have been materially affected by what the Adviser identifies as a significant event occurring before the Fund's assets are valued but after the close of their respective exchanges will be fair valued using a fair valuation methodology applicable to the security type or the significant event as previously approved by the Fund's Pricing Committee and Board of Trustees. The Pricing Committee considers all facts it deems relevant that are reasonably available, through either public information or information available to the Adviser's portfolio management team, when determining the fair value of a security. To assess the appropriateness of security valuations, the Adviser may consider (i) comparing prior day prices and/or prices of comparable securities; (ii) comparing sale prices to the prior or current day prices and challenge those prices exceeding certain tolerance levels with the third-party pricing service or broker source; (iii) new rounds of financing; (iv) the performance of the market or the issuer's industry; (v) the liquidity of the security; (vi) the size of the holding in a fund; and/or (vii) any other appropriate information. The determination of a security's fair value price often involves the consideration of a number of subjective factors and is therefore subject to the unavoidable risk that the value assigned to a security may be higher or lower than the security's value would be if a reliable market quotation of the security was readily available. Fair value determinations are subject to review, approval, and ratification by the Fund's Board of Trustees at its next regularly scheduled meeting covering the calendar quarter in which the fair valuation was determined. Fair valuation methods used by the Fund may include, but are not limited to, valuing securities initially at cost (excluding commissions) and subsequently adjusting the value due to: additional transactions by the issuer, changes in company specific fundamentals and changes in the value of similar securities. Values may be further adjusted for any discounts related to security-specific resale restrictions.
Short-term securities purchased within 60 days to maturity are valued at amortized cost, which approximates market value.
The Fund's valuation procedures are reviewed and subject to approval by the Board of Trustees. There have been no significant changes to the fair valuation procedures during the period.
Fair Value Measurements - Fair value is defined as the price that the Fund would receive upon selling an investment in an orderly transaction to an independent buyer in the principal market for the investment. Various inputs are used to determine the fair value of the Fund's investments. These inputs are summarized in the three broad levels listed below.
| Level 1 – | quoted prices in active markets for identical securities |
| Level 2 – | other significant observable inputs (including quoted prices for similar investments, interest rates, prepayment speeds, credit risk, etc.) |
| Level 3 – | significant unobservable inputs (including the Fund's own assumptions in determining the fair value of investments) |
The inputs or methodologies used for valuing securities are not necessarily an indication of the risks associated with investing in those securities nor can it be assured that the Fund can obtain the fair value assigned to a security if it were to sell the security.
CLIPPER FUNDSM | Notes to Financial Statements – (Continued) |
| | June 30, 2017 (Unaudited) |
NOTE 1 - SUMMARY OF SIGNIFICANT ACCOUNTING POLICIES – (CONTINUED)
Fair Value Measurements - (Continued)
The following is a summary of the inputs used as of June 30, 2017 in valuing the Fund's investments carried at value:
| | Investments in Securities at Value |
| | Valuation Inputs |
| | | | Level 2: | | Level 3: | | |
| | | | Other Significant | | Significant | | |
| | Level 1: | | Observable | | Unobservable | | |
| | Quoted Prices | | Inputs | | Inputs | | Total |
Equity securities: | | | | | | | | | | | |
| Consumer Discretionary | $ | 132,807,427 | | $ | – | | $ | 31,375,091 | | $ | 164,182,518 |
| Energy | | 103,222,235 | | | – | | | – | | | 103,222,235 |
| Financials | | 436,240,468 | | | – | | | – | | | 436,240,468 |
| Health Care | | 44,325,393 | | | – | | | – | | | 44,325,393 |
| Industrials | | 174,703,200 | | | – | | | – | | | 174,703,200 |
| Information Technology | | 78,998,086 | | | – | | | 395,704 | | | 79,393,790 |
| Materials | | 77,157,878 | | | – | | | – | | | 77,157,878 |
| Short-term securities | | – | | | 26,821,000 | | | – | | | 26,821,000 |
| Total Investments | $ | 1,047,454,687 | | $ | 26,821,000 | | $ | 31,770,795 | | $ | 1,106,046,482 |
There were no transfers of investments between Level 1 and Level 2 of the fair value hierarchy during the six months ended June 30, 2017.
The following table reconciles the valuation of assets in which significant unobservable inputs (Level 3) were used in determining fair value during the six months ended June 30, 2017:
| Investment Securities: | | | |
| Beginning balance | | $ | 20,433,501 |
| Net change in unrealized appreciation (depreciation) | | | 6,671,455 |
| Cost of purchases | | | 4,665,839 |
| Ending balance | | $ | 31,770,795 |
| | | | |
Net change in unrealized appreciation (depreciation) during the period on Level 3 securities still held at June 30, 2017 and included in the change in net assets for the period | | $ | 6,671,455 |
There were no transfers of investments into or out of Level 3 of the fair value hierarchy during the period. The cost of purchases may include securities received through corporate actions or exchanges. Realized and unrealized gains (losses) are included in the related amounts on investments in the Statement of Operations.
The following table is a summary of those assets in which significant unobservable inputs (Level 3) were used by the Adviser in determining fair value. Note that these amounts exclude any valuations provided by a pricing service or broker.
| Assets Table |
| | | | | | | | | | | Impact to |
| Investments | | Fair Value at | | Valuation | | Unobservable | | | | Valuation from |
| at Value | | June 30, 2017 | | Technique | | Input | | Amount | | an Increase in Input |
| | | | | | | | | | | | |
| Common Stock | | $ | 395,704 | | Discounted Cash Flow | | Annualized Yield | | 2.44% | | Decrease |
| | | | | | | | | | | | |
| Preferred Stock | | | 31,375,091 | | Market Approach | | Transaction Price | | $50.9321 | | Increase |
| | | $ | 31,770,795 | | | | | | | | |
The significant unobservable inputs listed in the above table are used in the fair value measurement of equity securities, and if changed, would affect the fair value of the Fund's investments. The transaction price inputs are attributable to private securities and include assumptions made from private transactions. The "Impact to Valuation" represents the change in fair value measurement resulting from an increase in the corresponding input. A decrease in the input would have the opposite effect.
CLIPPER FUNDSM | Notes to Financial Statements – (Continued) |
| | June 30, 2017 (Unaudited) |
NOTE 1 - SUMMARY OF SIGNIFICANT ACCOUNTING POLICIES – (CONTINUED)
Master Repurchase Agreements - The Fund, along with other affiliated funds, may transfer uninvested cash balances into one or more master repurchase agreement accounts. These balances are invested in one or more repurchase agreements, secured by U.S. Government securities. A custodian bank holds securities pledged as collateral for repurchase agreements until the agreements mature. Each agreement requires that the market value of the collateral be sufficient to cover payments of interest and principal; however, in the event of default by the other party to the agreement, retention of the collateral may be subject to legal proceedings.
Currency Translation - The market values of all assets and liabilities denominated in foreign currencies are recorded in the financial statements after translation to the U.S. Dollar based upon the mean between the bid and offered quotations of the currencies against U.S. Dollars on the date of valuation. The cost basis of such assets and liabilities is determined based upon historical exchange rates. Income and expenses are translated at average exchange rates in effect as accrued or incurred.
Foreign Currency - The Fund may enter into forward purchases or sales of foreign currencies to hedge certain foreign currency denominated assets and liabilities against declines in market value relative to the U.S. Dollar. Forward currency contracts are marked-to-market daily and the change in market value is recorded by the Fund as an unrealized gain or loss. When the forward currency contract is closed, the Fund records a realized gain or loss equal to the difference between the value of the forward currency contract at the time it was opened and value at the time it was closed. Investments in forward currency contracts may expose the Fund to risks resulting from unanticipated movements in foreign currency exchange rates or failure of the counter-party to the agreement to perform in accordance with the terms of the contract.
Reported net realized foreign exchange gains or losses arise from the sales of foreign currencies, currency gains or losses realized between the trade and settlement dates on security transactions, the difference between the amounts of dividends, interest, and foreign withholding taxes recorded on the Fund's books, and the U.S. Dollar equivalent of the amounts actually received or paid. Net unrealized foreign exchange gains or losses arise from changes in the value of assets and liabilities other than investments in securities at fiscal year end, resulting from changes in the exchange rate. The Fund includes foreign currency gains and losses realized on the sales of investments together with market gains and losses on such investments in the Statement of Operations.
Federal Income Taxes - It is the Fund's policy to comply with the requirements of the Internal Revenue Code applicable to regulated investment companies, and to distribute substantially all of its taxable income, including any net realized gains on investments not offset by loss carryovers, to shareholders. Therefore, no provision for federal income tax or excise tax is required. The Adviser analyzed the Fund's tax positions taken on federal and state income tax returns for all open tax years and concluded that as of June 30, 2017, no provision for income tax is required in the Fund's financial statements related to those tax positions. The Fund's federal and state (Arizona) income and federal excise tax returns for tax years for which the applicable statutes of limitations have not expired are subject to examination by the Internal Revenue Service and state department of revenue. The earliest tax year that remains subject to examination by these jurisdictions is 2013.
Securities Transactions and Related Investment Income - Securities transactions are accounted for on the trade date (date the order to buy or sell is executed) with realized gain or loss on the sale of securities being determined based upon identified cost. Dividend income is recorded on the ex-dividend date. Interest income, which includes accretion of discount and amortization of premium, is accrued as earned.
Dividends and Distributions to Shareholders - Dividends and distributions to shareholders are recorded on the ex-dividend date. Net investment income (loss), net realized gains (losses), and net unrealized appreciation (depreciation) on investments may differ for financial statement and tax purposes primarily due to differing treatments of wash sales, foreign currency transactions, Trustees' deferred compensation, in-kind redemptions, corporate actions, and partnership income. The character of dividends and distributions made during the fiscal year from net investment income and net realized securities gains may differ from their ultimate characterization for federal income tax purposes. Also, due to the timing of dividends and distributions, the fiscal year in which amounts are distributed may differ from the fiscal year in which income or realized gain was recorded by the Fund. The Fund adjusts certain components of capital to reflect permanent differences between financial statement amounts and net income and realized gains/losses determined in accordance with income tax rules.
CLIPPER FUNDSM | Notes to Financial Statements – (Continued) |
| | June 30, 2017 (Unaudited) |
NOTE 1 - SUMMARY OF SIGNIFICANT ACCOUNTING POLICIES – (CONTINUED)
Indemnification - Under the Fund's organizational documents, its officers and trustees are indemnified against certain liabilities arising out of the performance of their duties to the Fund. In addition, some of the Fund's contracts with its service providers contain general indemnification clauses. The Fund's maximum exposure under these arrangements is unknown since the amount of any future claims that may be made against the Fund cannot be determined and the Fund has no historical basis for predicting the likelihood of any such claims.
Use of Estimates in Financial Statements - In preparing financial statements in conformity with accounting principles generally accepted in the United States of America, management makes estimates and assumptions that affect the reported amounts of assets and liabilities and disclosure of contingent assets and liabilities at the date of the financial statements, as well as the reported amounts of income and expenses during the reporting period. Actual results may differ from these estimates.
NOTE 2 - PURCHASES AND SALES OF SECURITIES
The cost of purchases and proceeds from sales of investment securities (excluding short-term securities) during the six months ended June 30, 2017 were $69,327,224 and $188,542,840, respectively.
NOTE 3 - FEES AND OTHER TRANSACTIONS WITH SERVICE PROVIDERS (INCLUDING AFFILIATES)
Davis Selected Advisers-NY, Inc. ("DSA-NY"), a wholly-owned subsidiary of the Adviser, acts as sub-adviser to the Fund. DSA-NY performs research and portfolio management services for the Fund under a Sub-Advisory Agreement with the Adviser. The Fund pays no fees directly to DSA-NY.
All officers of the Fund (including Interested Trustees) hold positions as executive officers with the Adviser or its affiliates.
Investment Advisory Fees - Advisory fees are paid monthly to the Adviser. The annual rate is 0.55% of the average net assets for the first $3 billion, 0.54% on the next $1 billion, 0.53% on the next $1 billion, 0.52% on the next $1 billion, 0.51% on the next $1 billion, 0.50% on the next $3 billion, and 0.485% of the average net assets greater than $10 billion. Advisory fees paid during the six months ended June 30, 2017 approximated 0.55% of average net assets.
Transfer Agent and Accounting Fees - Boston Financial Data Services, Inc. ("BFDS") is the Fund's primary transfer agent. The Adviser is also paid for certain transfer agent services. The fee paid to the Adviser for these services during the six months ended June 30, 2017amounted to $31,696. State Street Bank and Trust Company ("State Street Bank") is the Fund's primary accounting provider. Fees for such services are included in the custodian fees as State Street Bank also serves as the Fund's custodian.
NOTE 4 - CAPITAL STOCK
At June 30, 2017, there were unlimited shares of capital stock (no par value) authorized. Transactions in capital stock were as follows:
| | Six months ended June 30, 2017 (Unaudited) |
| | | Sold | | | Reinvestment of Distributions | | | Redeemed | | | Net Decrease |
| | | | | | | | | | | | |
| Shares | | 250,168 | | | 190,909 | | | (1,871,579) | | | (1,430,502) |
| Value | $ | 28,046,638 | | $ | 21,725,430 | | $ | (210,353,070) | | $ | (160,581,002) |
| | | | | | | | | | | | |
| |
| | Year ended December 31, 2016 |
| | | Sold | | | Reinvestment of Distributions | | | Redeemed | | | Net Decrease |
| | | | | | | | | | | | |
| Shares | | 1,781,804 | | | 1,116,730 | | | (3,398,093) | | | (499,559) |
| Value | $ | 191,024,475 | | $ | 117,780,922 | | $ | (348,643,145) | | $ | (39,837,748) |
| | | | | | | | | | | | |
CLIPPER FUNDSM | Notes to Financial Statements – (Continued) |
| | June 30, 2017 (Unaudited) |
NOTE 5 - SECURITIES LOANED
The Fund has entered into a securities lending arrangement with State Street Bank. Under the terms of the agreement, the Fund receives fee income from lending transactions; in exchange for such fees, State Street Bank is authorized to loan securities on behalf of the Fund, against receipt of collateral at least equal to the value of the securities loaned. As of June 30, 2017, the Fund did not have any securities on loan. The Fund bears the risk of any deficiency in the amount of the collateral available for return to a borrower due to a loss in an approved investment.
NOTE 6 - RESTRICTED SECURITIES
Restricted securities are not registered under the Securities Act of 1933 and may have contractual restrictions on resale. They are fair valued under methods approved by the Board of Trustees. The aggregate value of restricted securities amounted to $31,770,795 or 2.87% of the Fund's net assets as of June 30, 2017. Information regarding restricted securities is as follows:
| Security | | Initial Acquisition Date | | Units/Shares | | Cost per Unit/ Share | | Valuation per Unit/Share as of June 30, 2017 |
| | | | | | | | | | | |
| ASAC II L.P. | | 10/10/13 | | 407,313 | | $ | 1.00 | | $ | 0.9715 |
Didi Chuxing Joint Co., Series A, Pfd. | | 04/22/16 | | 524,409 | | | 38.2271 | | | 50.9321 |
Didi Chuxing Joint Co., Series B, Pfd | | 05/16/17 | | 91,609 | | | 50.9321 | | | 50.9321 |
NOTE 7 - IN-KIND REDEMPTION
In accordance with guidelines described in the Fund's prospectus, the Fund may distribute portfolio securities rather than cash as payment for a redemption of fund shares (in-kind redemption). For financial reporting purposes, the Fund recognizes a gain on in-kind redemptions to the extent the value of the distributed securities on the date of redemption exceeds the cost of those securities. Gains and losses realized on in-kind redemptions are not recognized for tax purposes and are reclassified from accumulated net realized gains (losses) from investments to paid-in capital on the Statement of Assets and Liabilities.
During the year ended December 31, 2016, the Fund's shareholders (including related parties) redeemed 361,565 shares in exchange for portfolio securities valued at $38,864,573. The Fund realized a gain of $12,732,235.
| The following financial information represents selected data for each share of capital stock outstanding throughout each period: |
| | Six months ended
June 30, 2017 | | Year ended December 31, |
| | (Unaudited) | | 2016 | | 2015 | | 2014 | | 2013 | | 2012 |
| Net Asset Value, Beginning of Period | | $ | 108.72 | | $ | 104.41 | | $ | 98.79 | | $ | 92.07 | | $ | 68.86 | | $ | 62.50 |
Income from Investment Operations: | | | | | | | | | | | | | | | | | | | | | | | | | | | | | | | |
Net Investment Incomea | | 0.47 | | 0.65 | | 0.51 | | 0.35 | | 0.47 | | 1.16 |
| Net Realized and Unrealized Gains | | 6.97 | | 15.00 | | 5.85 | | 6.78 | | 23.09 | | 6.54 |
| | Total from Investment Operations | | 7.44 | | 15.65 | | 6.36 | | 7.13 | | 23.56 | | 7.70 |
Dividends and Distributions: | | | | | | | | | | | | | | | | | | | | | | | | | | | | | | | |
| Dividends from Net Investment Income | | (0.51) | | (1.19) | | (0.50) | | (0.41) | | (0.35) | | (1.34) |
| Distributions from Realized Gains | | (1.85) | | (10.15) | | (0.24) | | – | | – | | – |
| | Total Dividends and Distributions | | (2.36) | | (11.34) | | (0.74) | | (0.41) | | (0.35) | | (1.34) |
| Net Asset Value, End of Period | | $ | 113.80 | | $ | 108.72 | | $ | 104.41 | | $ | 98.79 | | $ | 92.07 | | $ | 68.86 |
Total Returnb | | 6.84 | % | | 15.62 | % | | 6.44 | % | | 7.75 | % | | 34.22 | % | | 12.31 | % |
Ratios/Supplemental Data: | | | | | | | | | | | | | | | | | | | | | | | | | | | | | | | |
| Net Assets, End of Period (in millions) | | $ | 1,106 | | | $ | 1,212 | | | $ | 1,216 | | | $ | 1,109 | | | $ | 1,254 | | | $ | 1,015 | |
| Ratio of Expenses to Average Net Assets: | | | | | | | | | | | | | | | | | | | | | | | | | | | | | | | |
| | Gross | | 0.72 | %c | | 0.72 | % | | 0.72 | % | | 0.74 | % | | 0.74 | % | | 0.75 | % |
| | Netd | | 0.72 | %c | | 0.72 | % | | 0.72 | % | | 0.74 | % | | 0.74 | % | | 0.75 | % |
| Ratio of Net Investment Income to Average Net Assets | | 0.85 | %c | | 0.63 | % | | 0.50 | % | | 0.36 | % | | 0.58 | % | | 1.74 | % |
Portfolio Turnover Ratee | | 6 | % | | 33 | % | | 31 | % | | 38 | % | | 8 | % | | 6 | % |
| a | Per share calculations were based on average shares outstanding for the period. |
| |
| b | Assumes hypothetical initial investment on the business day before the first day of the fiscal period, with all dividends and distributions reinvested in additional shares on the reinvestment date, and redemption at the net asset value calculated on the last business day of the fiscal period. Total returns are not annualized for periods of less than one year. |
| |
| c | Annualized. |
| |
| d | The Net Ratio of Expenses to Average Net Assets reflects the impact, if any, of the reduction of expenses paid indirectly and of certain reimbursements. |
| |
| e | The lesser of purchases or sales of portfolio securities for a period, divided by the monthly average of the market value of portfolio securities owned during the period. Securities with a maturity or expiration date at the time of acquisition of one year or less are excluded from the calculation. |
| |
| See Notes to Financial Statements |
CLIPPER FUNDSM | Trustee Approval of Advisory Agreements ( Unaudited) |
Process of Annual Review
The Board of Trustees of Clipper Funds Trust oversees the management of the Fund and, as required by law, determines annually whether to approve the continuance of the Fund's advisory agreement with Davis Selected Advisers, L.P. and sub-advisory agreement with Davis Selected Advisers-NY, Inc. (jointly "Davis Advisors" and "Advisory Agreement").
With the assistance of counsel to the Independent Trustees, the Independent Trustees undertook a comprehensive review process in anticipation of their annual contract review meeting, held in April 2017. As part of this process, Davis Advisors provided the Independent Trustees with material (including recent investment performance and expense data) that was responsive to questions submitted to Davis Advisors by the Independent Trustees. At this meeting, the Independent Trustees reviewed and evaluated all information that they deemed reasonably necessary under the circumstances and were provided guidance by their independent counsel. Clipper Fund, Inc. was reorganized into Clipper Funds Trust in December 2014. For this reason, the review included historical information for Clipper Fund, Inc.
In reaching their decision, the Independent Trustees also took into account information furnished to them throughout the year and otherwise provided to them during their quarterly meetings or through other prior communications. The Independent Trustees concluded that they had been supplied with sufficient information and data to analyze the Advisory Agreement and that their questions had been sufficiently answered by Davis Advisors. Upon completion of this review, the Independent Trustees found that the terms of the Advisory Agreement are fair and reasonable and that continuation of the Advisory Agreement was in the best interest of Clipper Fund and its shareholders.
Reasons the Independent Trustees Approved Continuation of the Advisory Agreement
The Independent Trustees' determinations were based upon a comprehensive consideration of all information provided to them, and they did not identify any single item or piece of information as the controlling factor. Each Independent Trustee did not necessarily attribute the same weight to each factor. The following facts and conclusions were important, but not exclusive, to the Independent Trustees' recommendation to renew the Advisory Agreement.
The Independent Trustees considered the investment performance of the Fund on an absolute basis, as well as relative to its benchmark and other comparable funds. The Independent Trustees not only considered the investment performance of the Fund, but also the full range and quality of services provided by Davis Advisors to the Fund and its shareholders, including whether the Fund:
| 1. | Achieves satisfactory investment results over the long term, after all costs; |
| 2. | Efficiently and effectively handles shareholder transactions, inquiries, requests, and records, provides quality accounting, legal, and compliance services, and oversees third-party service providers; and |
| 3. | Fosters healthy investor behavior. |
Davis Advisors is reimbursed a portion of its costs in providing some, but not all, of these services.
A shareholder's ultimate return is the product of a fund's results as well as the shareholder's behavior, specifically, in selecting when to invest or redeem. The Independent Trustees concluded that, through its actions and communications, Davis Advisors has attempted to have a meaningful, positive impact on investor behavior.
Davis Advisors, its affiliates, and members of the Davis family are some of the largest shareholders in the Clipper Fund. The Independent Trustees considered that this investment tends to align the interests of management with other shareholders, as they face the same risks, pay the same fees, and are motivated to achieve satisfactory long-term returns. In addition, the Independent Trustees concluded that significant investments by Davis Advisors and the Davis family have contributed to the economies of scale that have lowered fees and expenses for Clipper Fund's shareholders over time.
CLIPPER FUNDSM | Trustee Approval of Advisory Agreement (Unaudited) – (Continued) |
Reasons the Independent Trustees Approved Continuation of the Advisory Agreement – (Continued)
The Independent Trustees noted the importance of reviewing quantitative measures, but recognized that qualitative factors are also important in assessing whether Clipper Fund's shareholders are likely to be well served by the renewal of the Advisory Agreement. They noted both the value and shortcomings of purely quantitative measures, including the data provided by independent service providers, and concluded that, while such measures and data may be informative, the judgment of the Independent Trustees must take many factors into consideration in representing the shareholders of the Clipper Fund, including those listed below. In connection with reviewing comparative performance information, the Independent Trustees generally give greater weight to longer-term measurements.
The Independent Trustees noted that Davis Advisors employs a disciplined, company-specific, research-driven, businesslike, long-term investment philosophy. The Independent Trustees considered the quality of Davis Advisors' investment process, as well as the experience, capability, and integrity of its senior management and other personnel.
The Independent Trustees recognized Davis Advisors' (i) efforts to minimize transaction costs by generally having a long-term time horizon and low portfolio turnover; (ii) focus on tax efficiency; (iii) record of generally producing satisfactory after-tax results over longer-term periods; (iv) efforts towards fostering healthy investor behavior by, among other things, providing informative and substantial educational material; and (v) efforts to promote shareholder interests by actively speaking out on corporate governance issues.
The Independent Trustees assessed (i) comparative fee and expense information for other funds, as selected and analyzed by a nationally recognized independent service provider; (ii) information regarding fees charged by Davis Advisors to other advisory clients, including funds that it sub-advises, and private accounts, as well as the differences in the services provided to such other clients; and (iii) the fee schedule and breakpoints of the Fund, including an assessment of competitive fee schedules and breakpoints, if applicable.
The Independent Trustees reviewed (i) the management fee schedule for the Fund; (ii) the profitability of the Fund to Davis Advisors; (iii) the extent to which economies of scale might be realized if the Fund's net assets increase; and (iv) whether the fee schedule should reflect those potential economies of scale, at this time. The Independent Trustees considered the nature, quality, and extent of the services being provided to the Fund and the costs incurred by Davis Advisors in providing such services. The Independent Trustees considered various potential benefits that Davis Advisors may receive in connection with the services it provides under the Advisory Agreement with the Fund, including a review of portfolio brokerage practices. The Independent Trustees noted that Davis Advisors does not use client commissions to pay for publications that are available to the general public or for research reports that are created by parties other than the broker-dealers providing trade execution, clearing and/or settlement services to the Fund.
The Independent Trustees compared the fees paid to Davis Advisors by Clipper Fund with those paid by Davis Advisors' sub-advised clients, private account clients, and managed money/wrap clients. To the extent sub-advised or private account fees were lower than fees paid by the Fund, the Independent Trustees noted that the range of services provided to the Fund were more extensive, with greater risks associated with operating SEC registered, publicly traded mutual funds. Serving as the primary adviser for mutual funds is more work because of the complex overlay of regulatory, tax, and accounting issues, which are unique to mutual funds. In addition, the operational work required to service shareholders is more extensive because of the significantly greater number of shareholders, and managing trading is more complex because of the more frequent fund flows. With respect to risk, not only has regulation become more complex and burdensome, but the scrutiny of regulators and shareholders has become more intense. The Independent Trustees concluded that reasonable justifications existed for the differences between the fee rates for Clipper Fund and Davis Advisors' other lines of business.
Clipper Fund
Davis Advisors began the day-to-day management of the Clipper Fund on January 1, 2006. The Independent Trustees noted that Clipper Fund outperformed its benchmark, the Standard & Poor's 500® Index ("S&P 500®"), over the one- and five-year time periods ended March 31, 2017. The Fund performed in-line with the S&P 500® over the three-year time period and underperformed the S&P 500® over the 10-year time period, all periods ended March 31, 2017.
CLIPPER FUNDSM | Trustee Approval of Advisory Agreement (Unaudited) – (Continued) |
Clipper Fund – (Continued)
Broadridge, an independent service provider, presented a report to the Independent Trustees that compared the Fund to all Lipper retail and institutional large-cap core funds (the "Performance Universe Average"), as well as the relevant Lipper Index. The report indicated that the Fund outperformed the Performance Universe Average and the Lipper Index over the one-, two-, three-, four-, and five-year time periods, but underperformed over the ten-year time period, all periods ended December 31, 2016.
The Independent Trustees also reviewed the Fund's performance versus both the S&P 500® and the Lipper Large-Cap Core category when measured over rolling five- and ten-year time frames. Since Davis Advisors took over management, the Fund outperformed the S&P 500® in 2 out of 7 rolling five-year time periods and outperformed the Lipper Large-Cap Core category in 3 out of 7 rolling five-year time periods, all periods ended December 31 for each year from 2010 through 2016. The Fund underperformed the S&P 500® and the Lipper Large-Cap Core category in 2 out of 2 rolling ten-year time periods, all periods ended December 31 for each year from 2015 through 2016.
The Independent Trustees considered Clipper Fund's management fee and total expense ratio. They observed that the Fund's management fee and total expense ratio were below the average and the median of its peer group, as determined by Broadridge. They noted that the Fund has an advisory fee schedule that begins at 0.55% and declines from there in a series of breakpoints. In addition, the Independent Trustees noted that the breakpoint discounts in the Fund's advisory fee schedule would provide for the sharing by Davis Advisors with Fund shareholders of any economies of scale that may exist in the management of the Fund. They also considered that, based on its asset level, the Fund does not qualify for a breakpoint in its advisory fee. In addition, the Independent Trustees noted that the Fund's advisory fee is identical to those paid by another open-end mutual fund that Davis Advisors serves as investment adviser, which has a higher asset level than the Fund.
Approval of Advisory Agreement
The Independent Trustees concluded that Davis Advisors had provided Clipper Fund and its shareholders a reasonable level of both investment and non-investment services. The Independent Trustees further concluded that shareholders have received a significant benefit from Davis Advisors' shareholder-oriented approach, as well as the execution of its investment discipline.
The Independent Trustees determined that the advisory fee for the Clipper Fund is reasonable in light of the nature, quality, and extent of the services being provided to the Fund, the costs incurred by Davis Advisors in providing such service, and in comparison to the range of the average advisory fees of its peer group, as determined by an independent service provider. The Independent Trustees found that the terms of the Advisory Agreement were fair and reasonable and that continuation of the Advisory Agreement was in the best interest of the Clipper Fund and its shareholders. The Independent Trustees and the full Board of Trustees therefore voted to continue the Advisory Agreement.
CLIPPER FUNDSM | Privacy Notice and Householding |
Privacy Notice
While you generally will be dealing with a broker-dealer or other financial adviser, we may collect information about you from your account application and other forms that you may deliver to us. We use this information to process your requests and transactions; for example, to provide you with additional information about the Fund, to open an account for you, or to process a transaction. In order to service your account and execute your transactions, we may provide your personal information to firms that assist us in servicing your account, such as our transfer agent. We may also provide your name and address to one of our agents for the purpose of mailing to you your account statement and other information about our products and services. We may also gather information through the use of "cookies" when you visit our website. These files help us to recognize repeat visitors and allow easy access to and use of the website. We require these outside firms and agents to protect the confidentiality of your information and to use the information only for the purpose for which the disclosure is made. We do not provide customer names and addresses to outside firms, organizations, or individuals except in furtherance of our business relationship with you or as otherwise allowed by law.
We restrict access to nonpublic personal information about you to those employees who need to know that information to provide products or services to you. We maintain physical, electronic and procedural safeguards that comply with federal standards to guard your personal information.
Householding
To avoid sending duplicate copies of materials to households, the Fund will mail only one copy of each prospectus, Annual, and Semi-Annual Report to shareholders having the same last name and address on the Fund's records. The consolidation of these mailings, called householding, benefits the Fund through reduced mailing expense. If you do not want the mailing of these documents to be combined with those to other members of your household, please contact the Clipper Fund by phone at 1-800-432-2504. Individual copies of current prospectuses and reports will be sent to you within 30 days after the Fund receives your request to stop householding.
For the purpose of their service as trustees to the Clipper Fund, the business address for each of the trustees is 2949 E. Elvira Road, Suite 101, Tucson, AZ 85756. Each Trustee serves until retirement, resignation, death, or removal. Trustees must retire from the Board of Trustees and cease being a Trustee at the close of business on the last day of the calendar year in which the Trustee attains age 78.
Name
(birthdate) | Position(s)
Held with
the Fund | Term of Office and Length of Time Served | Principal Occupation(s)
During Past Five Years | Number of Portfolios
Overseen | Other Directorships |
Independent Trustees
| | | | | | |
Francisco L. Borges (11/17/51) | Trustee | Trustee since 2014 | Chairman and Managing Partner, Landmark Partners, LLC (private equity firm) since March 1999. | 3 | Trustee, John S. and James L. Knight Foundation; Trustee, Connecticut Public Broadcasting Network; Chairman/Director, Assured Guaranty Ltd. (financial guaranty insurance business); Director, Leucadia National Corporation (holding company); Trustee, Millbrook School; Director, Selected Funds (consisting of two portfolios). |
| | | | | | |
Lawrence E. Harris (09/16/56) | Trustee | Director/ Trustee since 2006 | Fred V. Keenan Chair in Finance of the Marshall School of Business, University of Southern California, Los Angeles, CA. | 3 | Director, Interactive Brokers Group, Inc.; Director, Selected Funds (consisting of two portfolios). |
| | | | | | |
Steven N. Kearsley (09/29/41) | Trustee | Director/ Trustee since 2006 | Private Investor, Real Estate Development; Owner, Old Peak Tree Farm. | 3 | Director, Selected Funds (consisting of two portfolios). |
| | | | | | |
Katherine L. MacWilliams (01/19/56) | Trustee | Trustee since 2014 | Retired; Chief Financial Officer, Caridian BCT, Inc. (medical device company) 2008-2012. | 3 | Director, Selected Funds (consisting of two portfolios). |
| | | | | | |
James J. McMonagle (10/01/44) | Trustee/ Chairman | Trustee since 2014/Chairman since 2015 | Of Counsel to Vorys, Sater, Seymour and Pease LLP (law firm) since 2002. | 3 | Director, Owens Corning (producer of residential and commercial building materials); Director/ Chairman, Selected Funds (consisting of two portfolios). |
| | | | | | |
Richard O'Brien (09/12/45) | Trustee | Trustee since 2014 | Retired; Corporate Economist, HP Inc. | 3 | Director, Selected Funds (consisting of two portfolios). |
CLIPPER FUNDSM | Trustees and Officers – (Continued) |
Name (birthdate) | Position(s) Held With Fund | Term of Office and Length of Time Served | Principal Occupation(s) During Past Five Years | Number of Portfolios Overseen | Other Directorships |
Interested Trustees*
| | | | | | |
Andrew A. Davis (06/25/63) | Trustee | Trustee since 2014 | President or Vice President of each Selected Fund, Clipper Fund, and Davis Fund; President, Davis Selected Advisers, L.P., and also serves as an executive officer of certain companies affiliated with the Adviser. | 16 | Director, Selected Funds (consisting of two portfolios); Director, Davis Funds (consisting of 13 portfolios). |
| | | | | | |
Christopher C. Davis (07/13/65) | Trustee | Trustee since 2014 | President or Vice President of each Selected Fund, Davis Fund, Clipper Fund, and Davis Fundamental ETF; Chairman, Davis Selected Advisers, L.P., and also serves as an executive officer of certain companies affiliated with the Adviser, including sole member of the Adviser's general partner, Davis Investments, LLC. | 16 | Director, Selected Funds (consisting of two portfolios); Director, Davis Funds (consisting of 13 portfolios); Director, Graham Holdings Co. (educational and media company). |
* Andrew A. Davis and Christopher C. Davis own partnership units (directly, indirectly, or both) of the Adviser and are considered to be "interested persons" of the Funds as defined in the Investment Company Act of 1940. Andrew A. Davis and Christopher C. Davis are brothers.
Officers
Christopher C. Davis (born 07/13/65, Clipper Fund officer since 12/19/05). See description in the section on Interested Trustees.
Andrew A. Davis (born 06/25/63, Clipper Fund officer since 01/23/15). See description in the section on Interested Trustees.
Kenneth C. Eich (born 08/14/53, Clipper Fund officer since 12/19/05). Executive Vice President and Principal Executive Officer of Clipper Funds Trust (consisting of one portfolio), Davis Funds (consisting of 13 portfolios), and Selected Funds (consisting of two portfolios); Trustee/Chairman, Executive Vice President, and Principal Executive Officer of Davis Fundamental ETF Trust (consisting of three portfolios); Chief Operating Officer, Davis Selected Advisers, L.P., and also serves as an executive officer of certain companies affiliated with the Adviser.
Douglas A. Haines (born 03/04/71, Clipper Fund officer since 12/19/05). Vice President, Treasurer, Chief Financial Officer, Principal Financial Officer, and Principal Accounting Officer of Clipper Funds Trust (consisting of one portfolio), Davis Funds (consisting of 13 portfolios), Selected Funds (consisting of two portfolios), and Davis Fundamental ETF Trust (consisting of three portfolios); Vice President and Director of Fund Accounting, Davis Selected Advisers, L.P.
Sharra L. Haynes (born 09/25/66, Clipper Fund officer since 12/19/05). Vice President and Chief Compliance Officer of Clipper Funds Trust (consisting of one portfolio), Davis Funds (consisting of 13 portfolios), Selected Funds (consisting of two portfolios), and Davis Fundamental ETF Trust (consisting of three portfolios); Vice President and Chief Compliance Officer, Davis Selected Advisers, L.P., and also serves as an executive officer of certain companies affiliated with the Adviser.
Ryan M. Charles (born 07/25/78, Clipper Fund officer since 01/01/14). Vice President and Secretary of Clipper Funds Trust (consisting of one portfolio), Davis Funds (consisting of 13 portfolios), Selected Funds (consisting of two portfolios), and Davis Fundamental ETF Trust (consisting of three portfolios); Vice President, Chief Legal Officer and Secretary, Davis Selected Advisers, L.P., and also serves as an executive officer of certain companies affiliated with the Adviser.
| Investment Adviser |
| Davis Selected Advisers, L.P. (Doing business as "Davis Advisors") |
| 2949 East Elvira Road, Suite 101 |
| Tucson, Arizona 85756 |
| (800) 432-2504 |
| |
| Distributor |
| Davis Distributors, LLC |
| 2949 East Elvira Road, Suite 101 |
| Tucson, Arizona 85756 |
| |
| Transfer Agent |
| Boston Financial Data Services, Inc. |
| P.O. Box 55468 |
| Boston, Massachusetts 02205-5468 |
| |
| Custodian |
| State Street Bank and Trust Co. |
| One Lincoln Street |
| Boston, Massachusetts 02111 |
| |
| Counsel |
| Greenberg Traurig, LLP |
| 77 West Wacker Drive, Suite 3100 |
| Chicago, Illinois 60601 |
| |
| Independent Registered Public Accounting Firm |
| KPMG LLP |
| 1225 Seventeenth Street, Suite 800 |
| Denver, Colorado 80202 |
For more information about Clipper Fund including management fee, charges, and expenses, see the current prospectus, which must precede or accompany this report. The Fund's Statement of Additional Information contains additional information about the Fund's Trustees and is available without charge, upon request, by contacting the Fund at 1-800-432-2504 and on the Fund's website at www.clipperfund.com. Quarterly Fact Sheets are available on the Fund's website at www.clipperfund.com.
ITEM 2. CODE OF ETHICS
Not Applicable
ITEM 3. AUDIT COMMITTEE FINANCIAL EXPERT
The Fund's Board of Directors has determined that independent trustee Steven N. Kearsley qualifies as the "audit committee financial expert", as defined in Item 3 of form N-CSR.
ITEM 4. PRINCIPAL ACCOUNTANT FEES AND SERVICES
Not Applicable
ITEM 5. AUDIT COMMITTEE OF LISTED REGISTRANTS
Not Applicable
ITEM 6. SCHEDULE OF INVESTMENTS
Not Applicable. The complete Schedule of Investments is included in Item 1 of this for N-CSR
ITEM 7. DISCLOSURE OF PROXY VOTING POLICIES AND PROCEDURES FOR CLOSED-END MANAGEMENT INVESTMENT COMPANIES
Not Applicable
ITEM 8. PORTFOLIO MANAGERS OF CLOSED-END MANAGEMENT INVESTMENT COMPANIES
Not Applicable
ITEM 9. PURCHASES OF EQUITY SECURITIES BY CLOSED-END MANAGEMENT INVESTMENT COMPANIES AND AFFILIATED PURCHASERS
Not Applicable
ITEM 10. SUBMISSION OF MATTERS TO A VOTE OF SECURITY HOLDERS
There have been no changes to the procedure by which shareholders may recommend nominees to the registrant's Board of Trustees.
ITEM 11. CONTROLS AND PROCUDURES
| | (a) | The registrant's principal executive officer and principal financial officer have concluded that the registrant's disclosure controls and procedures (as defined in Rule 30a-3 (c) under the Investment Company Act of 1940, as amended) are effective as of a date within 90 days of the filing date of this report. |
| | (b) | There have been no significant changes in the registrant's internal controls or in other factors that could significantly affect these controls. |
ITEM 12. EXHIBITS
| (a)(1) | Not Applicable |
| | |
| (a)(2) | Certifications pursuant to Section 302 of the Sarbanes-Oxley Act of 2002 are attached. |
| | |
| (a)(3) | Not Applicable |
| | |
| (b) | Certifications pursuant to Section 906 of the Sarbanes-Oxley Act of 2002 are attached. |
SIGNATURES
Pursuant to the requirements of the Securities Exchange Act of 1934 and the Investment Company Act of 1940, the registrant has duly caused this report to be signed on its behalf by the undersigned, thereunto duly authorized.
CLIPPER FUNDS TRUST
| By | /s/ Kenneth C. Eich |
| | Kenneth C. Eich |
| | Principal Executive Officer |
Date: September 1, 2017
Pursuant to the requirements of the Securities Exchange Act of 1934 and the Investment Company Act of 1940, this report has been signed below by the following persons on behalf of the registrant and in the capacities and on the dates indicated.
| By | /s/ Kenneth C. Eich |
| | Kenneth C. Eich |
| | Principal Executive Officer |
Date: September 1, 2017
| By | /s/ Douglas A. Haines |
| | Douglas A. Haines |
| | Principal Financial Officer |
Date: September 1, 2017