Cautionary Statement
Davis Advisors is committed to communicating with our investment partners as candidly as possible because we believe our investors benefit from understanding our investment philosophy and approach. Our views and opinions regarding the investment prospects of our portfolio holdings include "forward looking statements" which may or may not be accurate over the long term. While we believe we have a reasonable basis for our appraisals and we have confidence in our opinions, actual results may differ materially from those we anticipate. These opinions are current as of the date of this report but are subject to change. The information provided in this report should not be considered a recommendation to buy, sell, or hold any particular security.
You can identify forward looking statements by words like "believe," "expect," "anticipate," or similar expressions when discussing prospects for particular portfolio holdings and/or of the Fund. We cannot assure future results and achievements. You should not place undue reliance on forward looking statements, which speak only as of the date of this report. We disclaim any obligation to update or alter any forward looking statements, whether as a result of new information, future events, or otherwise. This material must be preceded or accompanied by a prospectus. Please read the prospectus carefully for a discussion of investment objectives, risks, fees, and expenses. Current performance may be lower or higher than the performance quoted herein. You may obtain a current copy of the Fund's Prospectus or more current performance information by calling Investor Services at 1-800-432-2504 or on Clipper Fund's website (www.clipperfund.com).
CLIPPER FUNDSM | Table of Contents |
| 2 |
| | |
| 15 |
| | |
| 17 |
| | |
| 18 |
| | |
| 19 |
| | |
| 22 |
| | |
| 23 |
| | |
| 24 |
| | |
| 25 |
| | |
| 30 |
| | |
| 31 |
| | |
| 34 |
| | |
| 35 |
This Semi-Annual Report is authorized for use by existing shareholders. Prospective shareholders must receive a current Clipper Fund Prospectus, which contains more information about investment strategies, risks, fees, and expenses. Please read the prospectus carefully before investing or sending money.
Shares of Clipper Fund are not deposits or obligations of any bank, are not guaranteed by any bank, are not insured by the FDIC or any other agency, and involve investment risks, including possible loss of the principal amount invested.
Portfolio Proxy Voting Policies and Procedures
The Fund has adopted Portfolio Proxy Voting Policies and Procedures under which the Fund votes proxies relating to securities held by the Fund. A description of the Fund's Portfolio Proxy Voting Policies and Procedures is available (i) without charge, upon request, by calling the Fund toll-free at 1-800-432-2504, (ii) on the Fund's website at www.clipperfund.com, and (iii) on the SEC's website at www.sec.gov.
In addition, the Fund is required to file Form N-PX, with its complete proxy voting record for the 12 months ended June 30th, no later than August 31st of each year. The Fund's Form N-PX filing is available (i) without charge, upon request, by calling the Fund toll-free at 1-800-432-2504, (ii) on the Fund's website at www.clipperfund.com, and (iii) on the SEC's website at www.sec.gov.
Form N-Q
The Fund files its complete schedule of portfolio holdings with the SEC for the first and third quarters of each fiscal year on Form N-Q. The Fund's Form N-Q is available without charge, upon request, by calling 1-800-432-2504, on the Fund's website at www.clipperfund.com, and on the SEC's website at www.sec.gov. The Fund's Form N-Q may be reviewed and copied at the SEC's Public Reference Room in Washington, D.C., and information on the operation of the Public Reference Room may be obtained by calling 1-800-SEC-0330.
Summary
| · | Clipper Fund returned 2.5% in the first half of 2018.1 |
| · | Over the last three years, Clipper Fund outperformed the S&P 500 Index with a cumulative return of 43% versus 40% for the index. 1 |
| · | Over the most recent one, three and five year periods, a $10,000 investment in the Fund grew to $11,285, $14,310, and $18,401, respectively. 1 |
| · | At a time when active management investment strategies are out of favor, historical data indicates actively managed funds may be poised for a rebound. |
| · | Our Portfolio is positioned to take advantage of select opportunities we have identified in today's market, allowing us to build a concentrated portfolio of extraordinary and durable businesses purchased at discounts to intrinsic value. |
| Average Annual Total Returns as of June 30, 2018 |
| | YTD2 | 1 Year | 5 Years | 10 Years |
| Clipper Fund | 2.45% | 12.85% | 12.97% | 9.60% |
| S&P 500 Index | 2.65% | 14.37% | 13.42% | 10.17% |
The performance presented represents past performance and is not a guarantee of future results. Total return assumes reinvestment of dividends and capital gain distributions. Investment return and principal value will vary so that, when redeemed, an investor's shares may be worth more or less than their original cost. The total annual operating expense ratio as of the most recent prospectus was 0.71%. The total annual operating expense ratio may vary in future years. Current performance may be higher or lower than the performance quoted. For most recent month-end performance, visit clipperfund.com or call 800-432-2504. The Fund received favorable class action settlements from companies that it no longer owns. These settlements had a material impact on the investment performance of the Fund in 2009. This was a one-time event that is unlikely to be repeated. Clipper Fund was managed from inception, February 29, 1984, until December 31, 2005 by another Adviser. Davis Selected Advisers, L.P. took over management of the Fund on January 1, 2006.
_____________________________
This report includes candid statements and observations regarding investment strategies, individual securities, and economic and market conditions; however, there is no guarantee that these statements, opinions or forecasts will prove to be correct. These comments may also include the expression of opinions that are speculative in nature and should not be relied on as statements of fact.
1 Past performance is not a guarantee of future results. Investments cannot be made directly in an index.
2 Returns for periods less than one year are not annualized. Past performance is not a guarantee of future results.
Not a part of Semi-Annual Report to Fund shareholders
CLIPPER FUNDSM | Shareholder Letter – (Continued) |
Results of Our Investment Discipline
Our investment discipline has built wealth for shareholders over the long term3.
In the first of half of 2018, Clipper Fund continued its long record of building shareholder wealth, generating an absolute return of 2.5%.3 As shown in the chart below, the value of an initial $10,000 investment has increased in all periods shown since we assumed management of the Fund and is now worth almost $23,000.3
On a relative basis, we have beaten the market over the last three years, placing us in the top decile of all funds in our category.4 However, while the value of each dollar invested in Clipper Fund has appreciated almost 130% since we were entrusted with management of the Fund in January 2006, we still have ground to make up on a relative basis and intend to build on our improved results in the years ahead.3 Our confidence in our time-tested approach is reflected by our investment of more than $150 million in Clipper Fund alongside our shareholders.5
While our disciplined investment approach will not always be rewarded by the market over shorter periods, this active management strategy has produced positive returns for Clipper shareholders in all periods shown and relative outperformance over the last three years.3 The cornerstones of our discipline include rigorous research, focused investing, low expenses, alignment of interests, and a willingness to stand apart from the crowd.
_____________________________
3 As of June 30, 2018. Clipper Fund was managed from inception, February 29, 1984, until December 31, 2005 by another Adviser. Davis Selected Advisers, L.P. took over management of the Fund on January 1, 2006. Past performance is not a guarantee of future results.
4 Source: Lipper.
5 Includes Davis Advisors, Davis family and Foundation, our employees, and Fund directors who have more than $150 million invested in Clipper Fund. As of June 30, 2018.
Not a part of Semi-Annual Report to Fund shareholders
CLIPPER FUNDSM | Shareholder Letter – (Continued) |
Why Now May Be a Good Time to Invest in an Actively Managed Fund like Clipper Fund
Successful long-term investing requires a willingness to look beyond conventional thinking. Today, conventional wisdom argues passive investing is superior to active management. As a result, money has drained out of actively managed funds and poured into passive index funds and exchange-traded funds (ETFs).
While the data showing the S&P 500 Index has outperformed the average active manager over the long term is true, we believe the results are misleading in three important ways.
First, active and passive strategies have historically moved in a cycle. During parts of this cycle such as in the last decade or so, passive strategies tend to outperform. However, during other parts of the cycle, even the average active manager has outperformed the index over long periods of time. In general, the data shows a clear cyclical pattern in which periods of strong passive returns were followed by relatively stronger periods for active management. With the outperformance of passive strategies near an all-time high, the pattern of past cycles indicates the potential wisdom of moving toward active management now.
Second, while active managers tend to underperform when the S&P 500 Index gallops ahead, they tend to outperform when market returns moderate. While the direction of the market is unknowable in the short term, the fact the index has almost doubled in the last five years and the market has gone more than eight years without a 20% correction versus a historical average of two-and-a-half years leads us to expect more moderate returns in the years ahead.
Finally, certain active managers have outperformed in the vast majority of rolling 10 year periods. As a result, while the data shows the average active manager has underperformed, investors need not choose an average manager. In fact, increasing evidence suggests active managers with certain identifiable characteristics such as low fees, low turnover, proper incentives, an experienced team, and a differentiated portfolio are far more likely to outperform both the index and the average active manager. One recent study indicates that managers with low fees and a high investment in their own funds have outperformed in 89% of all rolling 10 year periods.6
Putting these thoughts together, we believe the headwinds active managers have faced in recent years could well become tailwinds in the years ahead. Howard Marks, the widely admired chairman of Oaktree Capital Management, recently asked, "…what happens when the majority of equity investment comes to be managed passively? Then prices will be freer to diverge from "fair," and bargains…should become more commonplace….Can you picture a world in which nobody's studying companies or assessing their stocks' fair value? I'd gladly be the only active investor working in that world."
While we cannot predict when this transition will occur, we would note over the last three years, the results of Clipper Fund have exceeded the S&P 500 Index by almost 300 basis points after all fees and expenses.7 While the investor herd continues to stampede into passive funds and ETFs, we are encouraged not just by these recent results but also by the data illustrating that identifiable factors such as relatively low expenses and alignment of interests, both of which are central to our firm's investment culture, have proven to be durable hallmarks of long-term outperformance.6
_____________________________
6 Source: Capital Group, based on Morningstar data. Based on monthly rolling periods from July 1996 to June 2016. Funds in the "Average Fund" group are those U.S. domestic equity funds in the Morningstar Large Value, Large Blend and Large Growth categories. "Funds with Low Fees and High Ownership" are those U.S. domestic equity funds in the Morningstar Large Value, Large Blend and Large Growth categories filtered for the quartile with the lowest net expense ratios (NER) and the quartile with the highest manager ownership. U.S. index is S&P 500 Index. The index is unmanaged and, therefore, has no expenses. Investors cannot invest directly in an index. For live funds, only the oldest share class was used. For dead funds with multiple share classes, the median monthly returns were used. Past performance is not a guarantee of future results.
7 Past performance is not a guarantee of future results. Investments cannot be made directly in an index.
Not a part of Semi-Annual Report to Fund shareholders
CLIPPER FUNDSM | Shareholder Letter – (Continued) |
How is Clipper Fund Positioned to Take Advantage of Select Opportunities in Today's Market?
In order to outperform the market, successful active managers must purchase securities that are mispriced by the market. Given that the market represents the collective efforts of thousands of investors (and computers), such mispricing is rare. However, we have identified a number of market dynamics that in our judgment create pockets of mispricing or what academics call market inefficiencies. At a time when conventional wisdom argues such inefficiencies cannot exist, we will examine the other side of the argument in this report by presenting the types of inefficiencies we have identified in today's market and, more important, the investment opportunities these inefficiencies have created. After all, these investment opportunities will drive shareholder returns in the years and decades to come.
Time Arbitrage – According to Morningstar, the average mutual fund has a turnover rate of 89%, meaning on average each investment is held for less than 18 months. As a result, most investment research is oriented toward short-term developments and predictions. This short-term orientation creates a disconnect between the perspective and desires of the majority of investors who are focused on short-term results and the goals and strategies of the best corporate executives who are trying to build long-term value. This disconnect in turn creates inefficiency and an investment opportunity when the market punishes companies for making wise long-term investments, such as opening up new markets, building customer loyalty, creating new products, or funding research and development at the expense of short-term earnings.
We call this inefficiency time arbitrage and consider it a significant contributor to our long-term investment success. When Wall Street analysts bemoan that a company cares more about customers than investors or is more focused on growth than quarterly earnings, our ears perk up as such criticism often signals opportunity. Two recent investments illustrate just such opportunities. First, our investment in United Technologies was made when Wall Street was criticizing the company for spending more than $10 billion in its Pratt & Whitney subsidiary to develop the revolutionary new geared turbo fan (GTF) jet engine.8 Our analysis indicates that, despite some short-term teething pains as the engine is being rolled out, the GTF engine is likely to be a huge revenue and profit generator for decades to come. Second, our investment in Capital One came as the company is making huge and costly investments in electronic banking and, more recently, in the up-front costs of aggressively growing its consumer loan portfolio. Because we expect both United Technologies and Capital One to earn a good return on the investments they have made in recent years, we were delighted Wall Street's short-term focus allowed us to purchase the shares at a discount.
Geographic Inefficiency – Most analysts date the beginning of globalization to the 1980s with the end of the cold war and the fall of what were called the Iron and Bamboo Curtains. Huge new markets opened up to U.S. companies while international companies gained access to our markets. The resulting acceleration in trade flows led to enormous progress by almost all measures. For example, U.S. gross domestic product (GDP) per capita rose from around $29,000 to more than $50,000 in constant currency,9 Global GDP per capita more than doubled from around $4,000 to more than $9,00010 and the percentage of the world living in extreme poverty fell from more than 40% to less than 10%.11
8 Individual securities are discussed in this piece. While we believe we have a reasonable basis for our appraisals and we have confidence in our opinions, actual results may differ materially from those we anticipate. The return of a security to the Fund will vary based on weighting and timing of purchase. This is not a recommendation to buy, sell or hold any specific security. Past performance is not a guarantee of future results.
9 https://www.theglobaleconomy.com/USA/GDP_per_capita_constant_dollars/
10 https://seekingalpha.com/article/108399-growth-in-world-per-capita-real-gdp-to-continue
11 https://ourworldindata.org/wp-content/uploads/2013/05/World-Poverty-Since-1820.png
Not a part of Semi-Annual Report to Fund shareholders
CLIPPER FUNDSM | Shareholder Letter – (Continued) |
As a result of globalization, the competitive landscape and growth opportunities for almost all businesses have changed dramatically. In this connected world, once entrenched U.S. companies face new competition from China, Latin America, India, and Eastern Europe. But competitive and nimble U.S. companies now also have the opportunity to sell their products and services in these huge and fast-growing emerging markets. Some of these companies have been significant beneficiaries. For example, we are amazed General Motors sells more cars and Boeing more planes in China than in the United States. On the other hand, companies that were not able to keep up faced a different fate. For example, two iconic U.S. beer companies, Anheuser-Busch and Miller, were taken over by foreign companies that trace their roots back to the emerging markets of Brazil and South Africa (Inbev and SAB) while Heineken, once considered a stodgy European company, went on the offensive and now earns almost two-thirds of its profits in emerging markets.12
These examples demonstrate how far globalization has come. Yet, even as businesses have globalized, Wall Street remains stubbornly and irrationally segmented by geography with domestic analysts and funds valuing and investing in U.S. companies, European analysts and funds in European companies, and emerging markets analysts and funds covering the rest. The problem is no company competes this way anymore. As a result, analysts studying an industry in a particular part of the world get an incomplete picture as they overlook competitors and opportunities presented in different geographies.
This incomplete picture creates an investment opportunity we refer to as geographic inefficiency. For example, if asked to name the world's largest manufacturers of jet engines, most U.S. investors would name General Electric (GE), Pratt & Whitney (discussed above) and, perhaps, a few might add Rolls Royce. But almost none would mention Safran, whose multi-decade partnership with GE makes the company the second largest jet engine manufacturer in the world. Because Safran is not so well known to U.S. investors (let alone included in any of the popular indexes such as the S&P 500), the company's shares trade at a discount to their intrinsic value, creating the opportunity to buy a world leader at a bargain price. A similar rationale applies to our investment in Ferguson PLC, which we believe is a wonderfully profitable and dominant distributor of plumbing fixtures whose shares trade in the United Kingdom even though the company earns more than 95% of its profits in the United States. As a result, U.S. analysts who historically assign high valuations to such well-positioned distributors overlook this jewel and do not include the company in any of the huge domestic indexes, allowing us to acquire the shares at a discounted price.
Accounting Distortions – Federal regulations require all public companies present their financial statements to investors in accordance with generally accepted accounting principles (GAAP). While these principles can lead to a fairly realistic representation of a company's financial condition, they can also create significant distortions that can lead to inefficiencies. In some cases, these distortions make a company appear more profitable simply because GAAP accounting allows for a certain amount of interpretation or discretion. CEOs, being only human, tend to choose interpretations that boost current profitability. Such areas of accounting discretion include revenue recognition, expense accruals, depreciation schedules, bad debt provisions, reserving practices, tax rates, lease treatments, and so on. As investors, we generally try to avoid companies that overstate current profitability as their stock shares are more expensive than they appear. Such overvaluation creates long-term risk as economic reality eventually trumps accounting distortions.
_____________________________
12 http://www.proactiveinvestors.co.uk/columns/fat-prophets/22814/heineken-remains-refreshing-22814.html
Not a part of Semi-Annual Report to Fund shareholders
CLIPPER FUNDSM | Shareholder Letter – (Continued) |
In contrast, we look for companies where our accounting analysis leads us to conclude the shares are cheaper than they appear on a reported GAAP basis. For decades, Berkshire Hathaway has been the best example as the company's unusual structure and history result in GAAP financial metrics significantly understating the company's intrinsic value. While we could write a tome on all the reasons this is so, we will instead commend Berkshire's annual reports to your attention as each one clearly (and entertainingly) spells out and quantifies the most important accounting distortions each year. Similarly, from its earliest days, Amazon has been managed to optimize the creation of true value rather than GAAP financial metrics. In fact, Amazon's outstanding CEO Jeff Bezos laid out this very principle in the company's 1997 annual report when he promised that "forced to choose between optimizing the appearance of our GAAP accounting and maximizing the present value of future cash flows, we'll take the cash flows." We couldn't agree more.
In the same way the unfavorable accounting distortions described above can create investment risks by making companies more expensive than they appear, the favorable accounting distortions we identify in companies like Berkshire Hathaway and Amazon create investment opportunities because the companies are cheaper than they appear.
Intangible Assets – Despite the success of computers in beating humans at games of skill such as chess and GO, judgment and character remain important but unquantifiable determinants of investment value. At a micro level, understanding why is easy. Simply imagine you inherit two businesses with identical histories and economics. Now imagine one of the businesses has a new CEO whose judgment, integrity and capability you admire greatly. The second business is run by a relative you cannot replace and consider deeply untrustworthy. While the past records of both businesses would be the same, your own judgment and knowledge would lead you to correctly value one above the other.
Similarly, in addition to our analysis of a company's competitive position, financial statements and current valuation, we use our judgment, experience and network to evaluate critical but intangible characteristics such as management quality, corporate culture and character. We consider it obvious what would be an important consideration in a private company will also be relevant for a public company.
Such "soft" considerations can help identify investment opportunities and avoid catastrophic risk. For example, in the years leading up to the financial crisis, there was little quantifiable difference between JPMorgan and Citigroup. Both were large money center banks with storied histories operating in roughly the same businesses. However, one was run by Jamie Dimon who is quoted as saying, "Don't do anything stupid. And don't waste money. Let everybody else waste money and do stupid things. Then we'll buy them." The other was run by a CEO who famously said, "As long as the music is playing, you've got to get up and dance." From the beginning of 2007 to today, shares of JPMorgan are up 185% while shares of Citigroup are down more than 85%. This insight into culture is the reason we have long invested in one and not the other. A more recent example is our investment in Didi Chuxing often referred to as the Uber of China. While many of the financial metrics of these two ride-sharing companies were similar, our research indicated the management, culture and market position of Didi were far superior to Uber. As a result, when given the opportunity to invest in Didi at a steep discount to Uber, we jumped at the chance. Since then, we believe Didi has gone from strength to strength while Uber's dysfunctional and misogynistic culture led to a management change and valuation mark down.
Not a part of Semi-Annual Report to Fund shareholders
CLIPPER FUNDSM | Shareholder Letter – (Continued) |
In sum, using our judgment and experience to evaluate the intangible assets of corporate culture and management quality has helped us identify wonderful investment opportunities such as JPMorgan and Didi while avoiding potentially catastrophic risks. As more and more money is invested passively or by computer, we expect our emphasis on such intangible assets to become even more valuable.
Sector Inefficiencies – Certain sectors of the market require deep industry-specific expertise to evaluate accurately. In a world when a significant amount of capital is passively invested based on index weightings, sector rotation and/or short-term research, fewer and fewer participants are willing or able to perform the in-depth research required to understand certain complicated industries. Having developed deep expertise in such sectors, we are often able to identify mispricings that occur at both a micro or company-specific level and at a macro or industry-wide level.
At the micro level, we have learned certain industries are characterized by what is often called domain knowledge, which means business practices, terminology and occasionally even accounting treatments are specific to that industry. Insurance, for example, is characterized by an unusual business model in which the companies are paid up-front for a service they may never have to deliver (i.e. a company is paid an insurance premium but the customer may never file a claim). In addition, the industry has a bizarre regulatory structure with each state having its own insurance commissioner and regulations, unique filing requirements, industry specific accounting and tax treatments, unusual measures of profitability (such as the combined ratio) and a host of mysterious acronyms such as DAC, IBNR and LAE, which stand for deferred acquisition cost, incurred but not reported, and loss adjustment expenses.
As a result, analysts and portfolio managers who approach this industry as generalists can overlook important clues that might distinguish one company from another. By developing a deep knowledge of this complex industry over the last five decades, we are occasionally able to identify competitive advantages that would not be apparent to a generalist. For example, while many investors considered Markel a simple insurance company, we have identified four enormous and durable competitive advantages that have allowed Markel to outperform for decades. First, the company had a proven ability to identify insurance niches in which Markel's underwriting expertise and price discipline allow the company to earn excess profits. Second, Markel has an outstanding, low-cost investment culture that has enabled the company to achieve superior investment returns for decades. Third, Markel has built a portfolio of wholly owned noninsurance subsidiaries that are worth substantially more than they are reported on the company's books. Finally, using everything from incentive systems and accounting choices to management tone and shareholder/employee communication, the company has built an extraordinarily distinctive corporate culture that fosters stewardship, accountability, and entrepreneurship. Putting these advantages together, our knowledge of the industry leads us to conclude Markel is a diamond in an otherwise dull industry or what my grandfather Shelby Cullom Davis called "a growth stock in disguise." Considering that our first research on this company dates back to 1991 when the stock traded around $20 a share and that shares now trade at more than $1,000 each, my grandfather's description is right on the mark.
At the macro level, certain volatile but durable sectors or industries commonly swing in and out of favor based on recent experiences. In banking, for example, memories of the financial crisis of 2008–2009 combined with subsequent anti-banking rhetoric and media coverage have blinded investors to the fact carefully selected banks are in our judgement both cheap and safe. Contrary to popular perception, many top tier banks are not only reporting record earnings but are also far better capitalized than at any time in the last 50 years. While unloved now, we believe the leading financial companies we own will be big contributors to Clipper Fund's future returns as the reality of their strong economic fundamentals and rising dividends eclipse current investor perceptions.
Not a part of Semi-Annual Report to Fund shareholders
CLIPPER FUNDSM | Shareholder Letter – (Continued) |
Similarly, although oil prices have risen more than 50% in the past year, the shares of many energy companies remain depressed as investors still recall the dramatic and unsustainable collapse in oil prices that occurred from 2014 through 2016. Taking advantage of this opportunity, we own shares in innovative, well-positioned companies such as Apache Corporation that should benefit as investor perceptions catch up with reality.
At a time when more money is flowing into passive investment strategies and fewer firms possess cumulative knowledge and industry expertise, we have built deep knowledge and understanding in a range of complicated and idiosyncratic but durable sectors such as insurance, banking and energy. This knowledge allows us to capitalize on the inefficiencies that appear from time to time at both the company specific as well as industry-wide level.
Index Distortions – Given the enormous size of the largest index funds and ETFs, companies that are not included in the most popular indexes can easily become relatively mispriced. Just imagine two companies with identical prospects but only one is included in the S&P 500. Although both would have the same intrinsic value, one would have fewer buyers as no index funds would hold it. As a result, that company would likely trade at a lower valuation. Last year we took advantage of just such a situation when Johnson Controls, a diversified industrial company we have long held, spun out its car seat manufacturing subsidiary Adient. Although Johnson Controls is included in the S&P 500, Adient was not. In fact, Adient was not added to any indexes. As a result, all of the index funds that received the shares of Adient in the spin off became forced sellers allowing us to acquire the shares at what we believe will prove to be a very attractive valuation.
Such index distortions also created an investment opportunity in the shares of Naspers, a holding company whose largest asset is a 30% ownership of Tencent, a Chinese media and internet company that is one of the best managed companies we know. Adding the market value of the company's stake in Tencent ($149 billion) to a conservative estimate of the value of the company's non-Tencent assets, which include an African pay TV service and a group of emerging market internet businesses worth approximately $17 billion, yields a total gross asset value of $163 billion. At current prices, Naspers' total enterprise value is just $91 billion, a 44% discount to total gross asset value. Although some discount is reasonable given issues related to liquidity, taxation and corporate structure, we believe this discount reflects a significant distortion that can be traced back to the wave of index investing. In particular, we believe although money has poured into Chinese, Asian and technology-related index funds and ETFs, not many investors are interested in investing in a South African index or holding company. As a result of this inefficiency, investors can purchase shares in what we believe to be one of the best companies in China at a steep discount simply by owning them through this South African vehicle.
Should the huge flows of funds out of active managers into passive investment alternatives continue, we would expect the valuation differences to widen creating more mispricing and investment opportunities.
Not a part of Semi-Annual Report to Fund shareholders
CLIPPER FUNDSM | Shareholder Letter – (Continued) |
Headline Risk13 – Finally, mispricings can be created because the structure and incentives of many money management firms make them reluctant to invest in companies that their clients might consider controversial. After all, when clients read in the newspaper about a company plagued by scandal, the last thing they want to see when they open their investment report is their expert money manager has purchased the scandal-plagued company they just read about. As a result, many investment managers either will not look at companies that are under a cloud or, if they had previously purchased them, will sell the entire position at discounted prices. The problem with this approach is their decision has nothing to do with the economics or prospects of the company in question, but instead is focused on short-term client perception.
As a result, shares in durable companies tainted by scandal can often represent buying opportunities that we refer to as headline risk investments. In evaluating these investments, our research focuses not on the past but on the future, asking whether the problems that have come to light can be fixed and if so whether the decline in share price represents a buying opportunity. Buying shares when a company is in the headlines for unfavorable reasons is never easy and in no way reflects a minimizing of a company's past mistakes. But organizations like people can learn from their mistakes and often emerge stronger. We believe our willingness to look beyond the headlines can lead to fantastic opportunities. Although there are no certainties, our analysis indicates that both Facebook and Wells Fargo will emerge from their recent scandals as better companies and that recent selling has been overdone. As a result, we established a position in Facebook this year and added to our position in Wells Fargo when the headlines were unfavorable.
With more than $150 million of our own money invested in Clipper Fund, our primary concern is making smart investment decisions rather than reacting to short-term investor perceptions14. Because our firm's incentives drive an investment culture rather than a sales culture, our willingness to invest in controversial companies should come as no surprise. While investing in companies with headline risk can unsettle clients in the short term, such a discipline reflects our alignment of interest with our shareholders over the long term. This alignment is an uncommon advantage given that 88% of all funds are overseen by managers who have less than $1 million invested alongside their clients.
_____________________________
13 While Davis Advisors researches companies subject to such contingencies, it cannot be correct every time, and the company's stock may never recover or may become worthless.
14 Includes Davis Advisors, Davis family and Foundation, our employees, and Fund directors who have more than $150 million invested in Clipper Fund. As of June 30, 2018.
Not a part of Semi-Annual Report to Fund shareholders
CLIPPER FUNDSM | Shareholder Letter – (Continued) |
Conclusion
So far in 2018 and indeed since we were entrusted with Clipper Fund's management on January 1, 2006, Clipper Fund has built wealth for investors.15 In addition, over the last three years when conventional wisdom has proclaimed the death of active investing, Clipper Fund has outperformed the S&P 500 after all expenses and ranks in the top decile of all managers in our category.16 While we have more than doubled the value of an investment made when we were entrusted with management of Clipper Fund in January 2006, we still have ground to make up on a relative basis and will do our best to build on our recent outperformance in the years ahead.
While the consensus wisdom currently favors passive investing, significant data shows active and passive strategies move in cycles. A review of these cycles indicates active investing strategies may be poised for a period of relatively stronger returns particularly if market returns moderate in the years ahead. Furthermore, contrary to consensus thinking, a select group of active managers with characteristics such as low costs, an alignment of interests with their shareholders and differentiation have outperformed in the vast majority of all rolling 10-year periods.
Our basis for believing select active managers like us can outperform the index rests on our conviction certain market dynamics create pockets of mispricing or inefficiency. These mispricings in turn create investment opportunities. In order to capitalize on these opportunities, we focus our investment discipline on the long term, analyze companies and industries from a global perspective, look beyond GAAP accounting, use judgment and experience to assess important intangibles such as management quality and corporate culture, cultivate the domain knowledge required to understand durable but complex industries, and are prepared to invest when companies are depressed by short-term scandals and unfavorable headlines. Above all, our significant co-investment creates a deep and rare alignment of interests with our shareholders that fosters a culture of stewardship and performance.
Finally, contrary to conventional wisdom, our confidence in our ability to outperform is consistent with the efficient market hypothesis that underpins passive investing for the simple reason that in order for the market to be efficient, excess returns must be available for select active investors. This somewhat counterintuitive notion is best explained by one of the greatest proponents of passive investing, Burt Malkiel, author of numerous articles as well as the best-selling book, A Random Walk Down Wall Street. As Mr. Malkiel notes, the "basic paradox in the theory of efficient markets (is that)…markets need some professionals to ensure that information is…incorporated into market prices, and those professionals have to earn above-market returns to compensate them for the time and effort involved in doing fundamental research." (Emphasis added.) We are determined to be among those select firms with the resources, skills, culture, structure, and incentives necessary to outperform over the long term.
_____________________________
15 As of June 30, 2018. Clipper Fund was managed from inception, February 29, 1984, until December 31, 2005 by another Adviser. Davis Selected Advisers, L.P. took over management of the Fund on January 1, 2006. Past performance is not a guarantee of future results.
16 Source: Lipper.
Not a part of Semi-Annual Report to Fund shareholders
CLIPPER FUNDSM | Shareholder Letter – (Continued) |
As always, we recognize and expect the years ahead will include times of market corrections and disruptions. While unpleasant, such periods are inevitable and generally create opportunities for investors with the judgment and experience to take advantage of them. In short, at a time when pundits and commentators are making the case experience and judgment do not matter and the best investors can hope for is an average result, we strongly disagree. We believe a carefully selected Portfolio of durable, well-managed businesses with competitive advantages, selling at a discount to true value and overseen by a seasoned team with a long track record of generating proven results will produce a better-than-average outcome. In investing, as in any other profession, skill matters. With more than $150 million invested alongside our shareholders, we have every incentive and intention to build on this record in the years and decades ahead. 17
We value the trust you have placed in us and look forward to continuing our investment journey together.
Sincerely,
| |
| Christopher C. Davis | Danton G. Goei |
| President & Portfolio Manager | Portfolio Manager |
| | |
| August 3, 2018 | |
_____________________________
17 Includes Davis Advisors, Davis family and Foundation, our employees, and Fund directors who have more than $150 million invested in Clipper Fund. As of June 30, 2018.
Not a part of Semi-Annual Report to Fund shareholders
CLIPPER FUNDSM | Shareholder Letter – (Continued) |
This report is authorized for use by existing shareholders. A current Clipper Fund prospectus must accompany or precede this material if it is distributed to prospective shareholders. You should carefully consider the Fund's investment objective, risks, fees, and expenses before investing. Read the prospectus carefully before you invest or send money.
This report includes candid statements and observations regarding investment strategies, individual securities, and economic and market conditions; however, there is no guarantee that these statements, opinions or forecasts will prove to be correct. These comments may also include the expression of opinions that are speculative in nature and should not be relied on as statements of fact.
Objective and Risks. Clipper Fund's investment objective is long-term capital growth and capital preservation. There can be no assurance that the Fund will achieve its objective. The Fund invests primarily in equity securities issued by large companies with market capitalizations of at least $10 billion. Some important risks of an investment in the Fund are: common stock risk: an adverse event may have a negative impact on a company and could result in a decline in the price of its common stock; depositary receipts risk: depositary receipts may trade at a discount (or premium) to the underlying security and may be less liquid than the underlying securities listed on an exchange; fees and expenses risk: the Fund may not earn enough through income and capital appreciation to offset the operating expenses of the Fund; financial services risk: investing a significant portion of assets in the financial services sector may cause the Fund to be more sensitive to systemic risk, regulatory actions, changes in interest rates, non-diversified loan portfolios, credit, and competition; focused portfolio risk: investing in a limited number of companies causes changes in the value of a single security to have a more significant effect on the value of the Fund's total portfolio; foreign country risk: foreign companies may be subject to greater risk as foreign economies may not be as strong or diversified; As of June 30, 2018, the Fund had approximately 15.0% of assets invested in foreign companies; foreign currency risk: the change in value of a foreign currency against the U.S. dollar will result in a change in the U.S. dollar value of securities denominated in that foreign currency; headline risk: the Fund may invest in a company when the company becomes the center of controversy. The company's stock may never recover or may become worthless; large-capitalization companies risk: companies with $10 billion or more in market capitalization generally experience slower rates of growth in earnings per share than do mid- and small-capitalization companies; manager risk: poor security selection may cause the Fund to underperform relevant benchmarks; mid- and small-capitalization companies risk: companies with less than $10 billion in market capitalization typically have more limited product lines, markets and financial resources than larger companies, and may trade less frequently and in more limited volume; and stock market risk: stock markets have periods of rising prices and periods of falling prices, including sharp declines. See the prospectus for a complete description of the principal risks.
Davis Advisors is committed to communicating with our investment partners as candidly as possible because we believe our investors benefit from understanding our investment philosophy and approach. Our views and opinions include "forward-looking statements" which may or may not be accurate over the long term. Forward-looking statements can be identified by words like "believe," "expect," "anticipate," or similar expressions. You should not place undue reliance on forward-looking statements, which are current as of the date of this report. We disclaim any obligation to update or alter any forward-looking statements, whether as a result of new information, future events, or otherwise. While we believe we have a reasonable basis for our appraisals and we have confidence in our opinions, actual results may differ materially from those we anticipate.
The information provided in this material should not be considered a recommendation to buy, sell or hold any particular security. As of June 30, 2018, the top ten holdings of Clipper Fund were: Alphabet Inc., 9.05%; Berkshire Hathaway, Inc., Class A, 7.63%; United Technologies Corp., 6.12%; Bank of New York Mellon Corp., 6.03%; Amazon.com, Inc., 6.01%; Capital One Financial Corp., 5.90%; Wells Fargo & Co., 5.63%; Apache Corp., 5.31%; Safran S.A., 5.31%; Markel Corp., 4.74%.
Clipper Fund has adopted a Portfolio Holdings Disclosure policy that governs the release of non-public portfolio holding information. This policy is described in the prospectus. Holding percentages are subject to change. Visit clipperfund.com or call 800‑432‑2504 for the most current public portfolio holdings information.
Clipper Fund was managed from inception, February 29, 1984, until December 31, 2005 by another Adviser. Davis Selected Advisers, L.P. took over management of the Fund on January 1, 2006.
Not a part of Semi-Annual Report to Fund shareholders
CLIPPER FUNDSM | Shareholder Letter – (Continued) |
Over the last five years, the high and low turnover rate for Clipper Fund was 38% and 8%, respectively.
We gather our index data from a combination of reputable sources, including, but not limited to, Thomson Financial, Lipper and index websites.
The S&P 500 Index is an unmanaged index of 500 selected common stocks, most of which are listed on the New York Stock Exchange. The index is adjusted for dividends, weighted towards stocks with large market capitalizations and represents approximately two-thirds of the total market value of all domestic common stocks. Investments cannot be made directly in an index.
After October 31, 2018, this material must be accompanied by a supplement containing performance and rating (ranking) data for the most recent quarter end.
Shares of the Clipper Fund are not deposits or obligations of any bank, are not guaranteed by any bank, are not insured by the FDIC or any other agency, and involve investment risks, including possible loss of the principal amount invested.
06/18 Davis Distributors, LLC, 2949 East Elvira Road, Suite 101, Tucson, AZ 85756, 800‑432‑2504, clipperfund.com
Not a part of Semi-Annual Report to Fund shareholders
CLIPPER FUNDSM | Management's Discussion of Fund Performance |
Performance Overview
Clipper Fund underperformed the Standard & Poor's 500® Index ("S&P 500®") for the six-month period ended June 30, 2018 (the "period"). The Fund delivered a total return of 2.45%, versus a 2.65% return for the S&P 500®. The sectors1 within the S&P 500® that reported the strongest performance were Consumer Discretionary (up 11%), Information Technology (up 11%), and Energy (up 7%). The sectors within the S&P 500® that reported the weakest performance were Consumer Staples (down 9%), Telecommunication Services (down 8%), and Industrials (down 5%).
Detractors from Performance
The Fund's Financial sector holdings were the most significant detractor2 from performance. The Fund was hindered by its significant overweight position in the Financial sector (40% average weighting, versus 16%) and from stock selection (down 4%, versus down 3%) when compared with the S&P 500®. Wells Fargo3 (down 7%), Capital One Financial (down 7%), Berkshire Hathaway (down 5%), and Markel (down 5%) were key detractors for the period.
Returns for the Fund's Information Technology holdings were in-line with those of the S&P 500® (both up 11%) and they were a significant contributor to the Fund's performance on an absolute basis. However, the Fund's performance was hindered compared to the S&P 500® as a result of its significant underweight position in this strong performing sector (12% average weighting, versus 24%).
The Fund's Material sector holdings detracted from performance on both an absolute and relative basis, due to weaker stock selection (down 11%, versus down 3% for the S&P 500®). The Fund's only Material holding for the period, LafargeHolcim (down 11%), hindered performance.
The Fund had a number of individual positions in the Consumer Discretionary sector that hindered performance during the period: the top detractor Adient (down 37%), Liberty Global (down 10%), Didi Chuxing (down 7%), and Naspers (down 9%) were all top detractors. Johnson Controls (down 11%) from the Industrial sector also hurt performance. The Fund no longer owns Liberty Global.
Contributors to Performance
On an absolute basis, the Fund's Consumer Discretionary holdings made the most significant contribution to performance (up 11%). The Fund also benefited on a relative basis due to its 16% average weighting, compared to a 13% average weighting for the S&P 500®. Amazon (up 45%) was the top contributor for the period.
The Fund's Industrial sector holdings made a significant contribution to performance when compared to the S&P 500® due to stock selection (up 3%, versus down 5%). Safran (up 20%) and Ferguson (up 13%) were key contributors during the period.
Returns from holdings in the Energy sector made a substantial contribution to relative and absolute performance (up 13%, compared to up 7% for the S&P 500®). Both Energy holdings, Apache (up 12%) and Occidental Petroleum (up 16%), were top contributors for the period.
The Fund's Information Technology holdings helped absolute performance. Facebook (up 28%), purchased during the period, Alphabet (up 7%), the Fund's top holding at roughly 9% of total net assets at the end of the period, and Alibaba (up 8%) were all top contributors.
Aetna (up 1%), a new purchase from Health Care, and Bank of New York Mellon (up 1%) from Financials, aided performance.
When compared to the S&P 500®, the Fund benefited significantly by not having any position in the two weakest sectors, Consumer Staples and Telecommunication Services.
The Fund had an average weighting of 15% of its net assets invested in foreign securities, which outperformed the domestic holdings (up 5%, versus up 2%).
Clipper Fund's investment objective is to seek long-term capital growth and capital preservation. There can be no assurance that the Fund will achieve its objective. Clipper Fund's principal risks are: common stock risk, depositary receipts risk, fees and expenses risk, financial services risk, focused portfolio risk, foreign country risk, foreign currency risk, headline risk, large-capitalization companies risk, manager risk, mid- and small-capitalization companies risk, and stock market risk. See the prospectus for a full description of each risk.
Clipper Fund focuses its investments in fewer companies, and it may be subject to greater risks than a more diversified fund that is not allowed to focus its investments in a few companies. The Fund's investment performance, both good and bad, is expected to reflect the economic performance of its more focused portfolio.
Past performance does not guarantee future results, Fund prices fluctuate, and the value of an investment may be worth more or less than the purchase price. Data provided in this performance overview is for the six-month period ended June 30, 2018, unless otherwise noted. Return figures for underlying Fund positions reflect the return of the security from the beginning of the period or the date of first purchase if subsequent thereto through the end of the period or the date the position is completely liquidated. The actual contribution to the Fund will vary based on a number of factors (e.g., trading activity, weighting). Portfolio holding information is as of the end of the six-month period, June 30, 2018, unless otherwise noted.
1 | The companies included in the Standard & Poor's 500® Index are divided into eleven sectors. One or more industry groups make up a sector. For purposes of measuring concentration, the Fund generally classifies companies at the industry group or industry level. See the SAI for additional information regarding the Fund's concentration policy. |
2 | A company's or sector's contribution to or detraction from the Fund's performance is a product both of its appreciation or depreciation and its weighting within the Fund. For example, a 5% holding that rises 20% has twice as much impact as a 1% holding that rises 50%. |
3 | This Management Discussion of Fund Performance discusses a number of individual companies. The information provided in this report does not provide information reasonably sufficient upon which to base an investment decision and should not be considered a recommendation to purchase, sell, or hold any particular security. The Schedule of Investments lists the Fund's holdings of each company discussed. |
CLIPPER FUNDSM | Management's Discussion of Fund Performance – (Continued) |
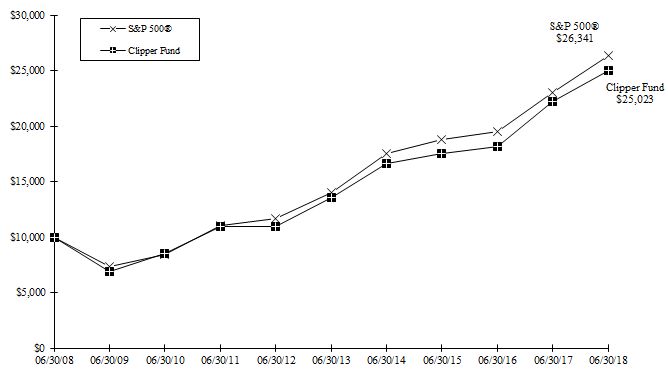
Comparison of a $10,000 investment in Clipper Fund versus the Standard & Poor's 500® Index
over 10 years for an investment made on June 30, 2008
Average Annual Total Return for periods ended June 30, 2018
Fund & Benchmark Index | 1-Year | 5-Year | 10-Year | Since Fund's Inception (02/29/84) | Gross Expense Ratio | Net Expense Ratio |
| Clipper Fund | 12.85% | 12.97% | 9.60% | 11.77% | 0.71% | 0.71% |
Standard & Poor's 500® Index | 14.37% | 13.42% | 10.17% | 11.30% | | |
In 2009, the Fund received favorable class action settlements from companies which it no longer owns. These settlements had a material impact on the investment performance of the Fund, adding approximately 5% to the Fund's total return in 2009. This was a one-time event that is unlikely to be repeated.
The Standard & Poor's 500® Index is an unmanaged index of 500 selected common stocks, most of which are listed on the New York Stock Exchange. The Index is adjusted for dividends, weighted towards stocks with large market capitalizations, and represents approximately two-thirds of the total market value of all domestic common stocks. Investments cannot be made directly in the Index.
The performance data quoted in this report represents past performance, assumes that all distributions were reinvested, and is not a guarantee of future results. The investment return and principal value will fluctuate so that shares may be worth more or less than their original cost when redeemed. Fund performance changes over time and current performance may be higher or lower than performance data quoted. Returns shown do not reflect the deduction of taxes that a shareholder would pay on fund distributions or the redemption of fund shares. The operating expense ratio may vary in future years. For more recent month-end performance information, please call Clipper Fund Investor Services at 1-800-432-2504 or visit the Fund's website at www.clipperfund.com.
Davis Selected Advisers, L.P. began serving as investment adviser to Clipper Fund on January 1, 2006. A different investment adviser managed the Fund through December 31, 2005.
CLIPPER FUNDSM | |
| | June 30, 2018 (Unaudited) |
| Portfolio Composition | | Industry Weightings |
| (% of Fund's 06/30/18 Net Assets) | | (% of 06/30/18 Stock Holdings) |
| | | | | | | |
| | | | | Fund | | S&P 500® |
| Common Stock (U.S.) | 83.37% | | Diversified Financials | 23.52% | | 5.32% |
| Common Stock (Foreign) | 12.47% | | Capital Goods | 18.12% | | 6.82% |
| Preferred Stock (Foreign) | 2.49% | | Information Technology | 14.63% | | 25.96% |
| Short-Term Investments | 2.14% | | Banks | 12.63% | | 6.14% |
| Other Assets & Liabilities | (0.47)% | | Retailing | 8.65% | | 7.15% |
| | 100.00% | | Energy | 8.42% | | 6.34% |
| | | | Insurance | 4.82% | | 2.39% |
| | | | Automobiles & Components | 3.81% | | 0.60% |
| | | | Health Care | 2.06% | | 14.08% |
| | | | Materials | 1.73% | | 2.61% |
| | | | Media | 1.61% | | 2.26% |
| | | | Food, Beverage & Tobacco | – | | 3.91% |
| | | | Utilities | – | | 2.95% |
| | | | Other | – | | 13.47% |
| | | | | 100.00% | | 100.00% |
| Top 10 Long-Term Holdings |
| (% of Fund's 06/30/18 Net Assets) |
| |
| Alphabet Inc.* | Software & Services | 9.05% |
| Berkshire Hathaway Inc., Class A | Diversified Financial Services | 7.63% |
| United Technologies Corp. | Capital Goods | 6.12% |
| Bank of New York Mellon Corp. | Capital Markets | 6.03% |
| Amazon.com, Inc. | Retailing | 6.01% |
| Capital One Financial Corp. | Consumer Finance | 5.90% |
| Wells Fargo & Co. | Banks | 5.63% |
| Apache Corp. | Energy | 5.31% |
| Safran S.A. | Capital Goods | 5.31% |
| Markel Corp. | Property & Casualty Insurance | 4.74% |
| |
| *Alphabet Inc. holding includes Class A and Class C. |
CLIPPER FUNDSM | Expense Ex ample ( Unaudited) |
As a shareholder of the Fund, you incur ongoing costs only, including advisory and administrative fees and other Fund expenses. The Expense Example is intended to help you understand your ongoing costs (in dollars) of investing in the Fund and to compare these costs with the ongoing costs of investing in other mutual funds. The Expense Example is based on an investment of $1,000 invested at the beginning of the period and held for the entire period indicated, which is for the six-month period ended June 30, 2018.
Actual Expenses
The information represented in the row entitled "Actual" provides information about actual account values and actual expenses. You may use the information in this row, together with the amount you invested, to estimate the expenses that you paid over the period. Simply divide your account value by $1,000 (for example, an $8,600 account value divided by $1,000 = 8.6), then multiply the result by the number under the heading "Expenses Paid During Period" to estimate the expenses you paid on your account during this period. An annual maintenance fee of $10, charged on retirement plan accounts per Social Security Number, is not included in the Expense Example. If this fee was included, the estimate of expenses you paid during the period would be higher, and your ending account value would be lower, by this amount.
Hypothetical Example for Comparison Purposes
The information represented in the row entitled "Hypothetical" provides information about hypothetical account values and hypothetical expenses based on the Fund's actual expense ratio and an assumed rate of return of 5% per year before expenses, which is not the Fund's actual return. The hypothetical account values and expenses may not be used to estimate the actual ending account balance or expenses you paid for the period. You may use this information to compare the ongoing costs of investing in the Fund and other funds. To do so, compare this 5% hypothetical example with the 5% hypothetical examples that appear in the shareholder reports of the other funds. An annual maintenance fee of $10, charged on retirement plan accounts per Social Security Number, is not included in the Expense Example. If this fee was included, the estimate of expenses you paid during the period would be higher, and your ending account value would be lower, by this amount.
Please note that the expenses shown in the table are meant to highlight your ongoing costs only. Therefore, the information in the row entitled "Hypothetical" is useful in comparing ongoing costs only, and will not help you determine the relative total costs of owning different funds.
| | Beginning Account Value (01/01/18) | | Ending Account Value (06/30/18) | | Expenses Paid During Period* (01/01/18-06/30/18) |
Actual | $1,000.00 | | $1,024.49 | | $3.56 |
| Hypothetical | $1,000.00 | | $1,021.27 | | $3.56 |
Hypothetical assumes 5% annual return before expenses.
* Expenses are equal to the Fund's annualized operating expense ratio (0.71%)**, multiplied by the average account value over the period, multiplied by 181/365 (to reflect the one-half year period).
** The expense ratio reflects the impact, if any, of certain reimbursements from the Adviser.
CLIPPER FUNDSM | |
| | June 30, 2018 (Unaudited) |
| | Shares | | Value
(Note 1) |
| COMMON STOCK – (95.84%) |
| | CONSUMER DISCRETIONARY – (11.34%) |
| | | Automobiles & Components – (3.75%) |
| | | | Adient PLC | | | 894,109 | | $ | 43,981,222 |
| | Media – (1.58%) |
| | Naspers Ltd. - N (South Africa) | | | 73,170 | | | 18,589,207 |
| | Retailing – (6.01%) |
| | Amazon.com, Inc. * | | | 41,546 | | | 70,619,891 |
| | | | Total Consumer Discretionary | | | 133,190,320 |
| | ENERGY – (8.29%) |
| | Apache Corp. | | | 1,333,999 | | | 62,364,453 |
| | Occidental Petroleum Corp. | | | 417,393 | | | 34,927,446 |
| | Total Energy | | | 97,291,899 |
| | FINANCIALS – (40.28%) |
| | Banks – (12.42%) |
| | JPMorgan Chase & Co. | | | 485,112 | | | 50,548,670 |
| | U.S. Bancorp | | | 583,000 | | | 29,161,660 |
| | Wells Fargo & Co. | | | 1,192,422 | | | 66,107,876 |
| | | | 145,818,206 |
| | Diversified Financials – (23.12%) |
| | | Capital Markets – (6.03%) |
| | Bank of New York Mellon Corp. | | | 1,312,723 | | | 70,795,151 |
| | Consumer Finance – (9.46%) |
| | American Express Co. | | | 426,126 | | | 41,760,348 |
| | Capital One Financial Corp. | | | 754,173 | | | 69,308,499 |
| | | 111,068,847 |
| | Diversified Financial Services – (7.63%) |
| | Berkshire Hathaway Inc., Class A * | | | 318 | | | 89,688,723 |
| | | | 271,552,721 |
| | Insurance – (4.74%) |
| | Property & Casualty Insurance – (4.74%) |
| | Markel Corp. * | | | 51,337 | | | 55,667,276 |
| | Total Financials | | | 473,038,203 |
| | HEALTH CARE – (2.03%) |
| | Health Care Equipment & Services – (2.03%) |
| | Aetna Inc. | | | 129,950 | | | 23,845,825 |
| | Total Health Care | | | 23,845,825 |
| | INDUSTRIALS – (17.82%) |
| | Capital Goods – (17.82%) |
| | Ferguson PLC (United Kingdom) | | | 309,527 | | | 25,122,652 |
| | Johnson Controls International PLC | | | 1,493,106 | | | 49,944,396 |
| | Safran S.A. (France) | | | 513,188 | | | 62,357,264 |
| | United Technologies Corp. | | | 574,505 | | | 71,830,360 |
| | Total Industrials | | | 209,254,672 |
CLIPPER FUNDSM | Schedule of Investments – (Continued) |
| | June 30, 2018 (Unaudited) |
| | Shares/Units/ Principal | | Value
(Note 1) |
| COMMON STOCK – (CONTINUED) |
| | INFORMATION TECHNOLOGY – (14.38%) |
| | | Software & Services – (14.38%) |
| | | Alibaba Group Holding Ltd., ADR (China)* | | | 110,000 | | $ | 20,408,300 |
| | Alphabet Inc., Class A * | | | 41,810 | | | 47,211,434 |
| | Alphabet Inc., Class C * | | | 52,972 | | | 59,098,212 |
| | ASAC II L.P. *(a)(b) | | | 407,313 | | | 397,741 |
| | Facebook, Inc., Class A * | | | 215,030 | | | 41,784,629 |
| | | Total Information Technology | | | 168,900,316 |
| | MATERIALS – (1.70%) |
| | LafargeHolcim Ltd. (Switzerland) | | | 411,214 | | | 19,943,359 |
| | Total Materials | | | 19,943,359 |
| | | TOTAL COMMON STOCK – (Identified cost $749,444,435) | | | 1,125,464,594 |
| PREFERRED STOCK – (2.49%) |
| | CONSUMER DISCRETIONARY – (2.49%) |
| | Retailing – (2.49%) |
| | Didi Chuxing Joint Co., Series A (China)*(a)(b) | | | 524,409 | | | 24,938,427 |
| | Didi Chuxing Joint Co., Series B (China)*(a)(b) | | | 91,609 | | | 4,356,494 |
| | Total Consumer Discretionary | | | 29,294,921 |
| | TOTAL PREFERRED STOCK – (Identified cost $24,712,474) | | | 29,294,921 |
| SHORT-TERM INVESTMENTS – (2.14%) |
| | INTL FCStone Financial Inc. Joint Repurchase Agreement, 2.12%, 07/02/18, dated 06/29/18, repurchase value of $8,020,417 (collateralized by: U.S. Government agency mortgages and obligation in a pooled cash account, 2.00%-10.00%, 08/01/18-07/01/48, total market value $8,179,380) | | $ | 8,019,000 | | | 8,019,000 |
| | Mizuho Securities USA Inc. Joint Repurchase Agreement, 2.10%, 07/02/18, dated 06/29/18, repurchase value of $2,734,478 (collateralized by: U.S. Government agency mortgages in a pooled cash account, 3.379%-5.00%, 04/01/27-02/01/48, total market value $2,788,680) | | | 2,734,000 | | | 2,734,000 |
| | Nomura Securities International, Inc. Joint Repurchase Agreement, 2.12%, 07/02/18, dated 06/29/18, repurchase value of $4,811,850 (collateralized by: U.S. Government agency mortgages and obligations in a pooled cash account, 0.00%-4.50%, 09/13/18-01/01/48, total market value $4,907,220) | | | 4,811,000 | | | 4,811,000 |
CLIPPER FUNDSM | Schedule of Investments – (Continued) |
| | June 30, 2018 (Unaudited) |
| | Principal | | Value
(Note 1) |
| SHORT-TERM INVESTMENTS – (CONTINUED) |
| | | SunTrust Robinson Humphrey, Inc. Joint Repurchase Agreement, 2.11%, 07/02/18, dated 06/29/18, repurchase value of $9,624,692 (collateralized by: U.S. Government agency mortgages in a pooled cash account, 2.50%-5.50%, 12/01/24-06/01/48, total market value $9,815,460) | | $ | 9,623,000 | | $ | 9,623,000 |
| | | | TOTAL SHORT-TERM INVESTMENTS – (Identified cost $25,187,000) | | | 25,187,000 |
| | Total Investments – (100.47%) – (Identified cost $799,343,909) | | | 1,179,946,515 |
| | Liabilities Less Other Assets – (0.47%) | | | (5,566,478) |
| | Net Assets – (100.00%) | | $ | 1,174,380,037 |
| |
| | ADR: American Depositary Receipt |
| |
| | * | Non-income producing security. |
| |
| | (a) | Restricted Security – See Note 6 of the Notes to Financial Statements. |
| |
| | (b) | The value of this security was determined using significant unobservable inputs. See Note 1 of the Notes to Financial Statements. |
| |
| See Notes to Financial Statements |
CLIPPER FUNDSM | Stateme nt of Assets and Liabilities |
| | At June 30, 2018 (Unaudited) |
| ASSETS: | | | | | |
| Investments in securities, at value* (see accompanying Schedule of Investments) | | $ | 1,179,946,515 |
| Cash | | | 498 |
| Receivables: | | | |
| | Capital stock sold | | | 142,337 |
| | Dividends and interest | | | 2,184,616 |
| Prepaid expenses | | | 4,766 |
| | | Total assets | | | 1,182,278,732 |
LIABILITIES: | | | |
| Payables: | | | |
| | Capital stock redeemed | | | 222,350 |
| | Investment securities purchased | | | 6,822,957 |
| Accrued investment advisory fee | | | 556,533 |
| Other accrued expenses | | | 296,855 |
| | Total liabilities | | | 7,898,695 |
NET ASSETS | | $ | 1,174,380,037 |
SHARES OUTSTANDING | | | 9,893,881 |
NET ASSET VALUE, offering, and redemption price per share (Net assets ÷ Shares outstanding) | | $ | 118.70 |
NET ASSETS CONSIST OF: | | | |
| Paid in capital | | $ | 771,808,504 |
| Undistributed net investment income | | | 639,179 |
| Accumulated net realized gains from investments and foreign currency transactions | | | 21,347,929 |
| Net unrealized appreciation on investments and foreign currency transactions | | | 380,584,425 |
| | Net Assets | | $ | 1,174,380,037 |
| | | | | |
| *Including: | | | |
| | Cost of investments | | $ | 799,343,909 |
| See Notes to Financial Statements |
CLIPPER FUNDSM | |
| | For the six months ended June 30, 2018 (Unaudited) |
| INVESTMENT INCOME: | | | | | | |
| Income: | | | |
| Dividends* | | $ | 9,517,496 |
| Interest | | | 378,310 |
| | | Total income | | | | 9,895,806 |
Expenses: | | | |
| Investment advisory fees (Note 3) | | $ | 3,245,221 | | | |
| Custodian fees | | | 94,031 | | | |
| Transfer agent fees | | | 592,533 | | | |
| Audit fees | | | 26,085 | | | |
| Legal fees | | | 11,543 | | | |
| Reports to shareholders | | | 34,496 | | | |
| Trustees' fees and expenses | | | 111,918 | | | |
| Registration and filing fees | | | 25,001 | | | |
| Miscellaneous | | | 29,083 | | | |
| | Total expenses | | | | 4,169,911 |
| Net investment income | | | 5,725,895 |
REALIZED & UNREALIZED GAIN (LOSS) ON INVESTMENTS AND FOREIGN CURRENCY TRANSACTIONS: | | | | | | |
| Net realized gain (loss) from: | | | |
| | Investment transactions | | | 47,890,136 |
| | Foreign currency transactions | | | (27,996) |
| Net realized gain | | | 47,862,140 |
| Net decrease in unrealized appreciation | | | (24,911,677) |
| | Net realized and unrealized gain on investments and foreign currency transactions | | | | 22,950,463 |
| Net increase in net assets resulting from operations | | $ | 28,676,358 |
| | | | | | | | | |
| *Net of foreign taxes withheld of | | $ | 142,428 |
| See Notes to Financial Statements |
CLIPPER FUNDSM | Statements of Changes in Net Assets |
| | | | | |
| | | Six months ended June 30, 2018 (Unaudited) | | Year ended December 31, 2017 |
| | | | | | | | |
| OPERATIONS: | | | | | | |
| Net investment income | | $ | 5,725,895 | | $ | 7,449,604 |
| Net realized gain from investments and foreign currency transactions | | | 47,862,140 | | | 66,290,087 |
Net increase (decrease) in unrealized appreciation on investments and foreign currency transactions | | | (24,911,677) | | | 113,767,214 |
| | Net increase in net assets resulting from operations | | | 28,676,358 | | | 187,506,905 |
DIVIDENDS AND DISTRIBUTIONS TO SHAREHOLDERS FROM: | | | | | | |
| Net investment income | | | (5,360,363) | | | (7,615,327) |
Realized gains from investment transactions | | | (39,293,369) | | | (60,675,478) |
CAPITAL SHARE TRANSACTIONS: | | | | | | |
Net increase (decrease) in net assets resulting from capital share transactions (Note 4) | | | 5,582,305 | | | (146,422,133) |
| | Total decrease in net assets | | | (10,395,069) | | | (27,206,033) |
NET ASSETS: | | | | | | |
| Beginning of period | | | 1,184,775,106 | | | 1,211,981,139 |
End of period* | | $ | 1,174,380,037 | | $ | 1,184,775,106 |
| | | | | | | | |
| *Including undistributed net investment income of | | $ | 639,179 | | $ | 273,647 |
| | | | | | | | |
| See Notes to Financial Statements |
CLIPPER FUNDSM | Notes to Fina ncial Statements |
| | June 30, 2018 (Unaudited) |
NOTE 1 - SUMMARY OF SIGNIFICANT ACCOUNTING POLICIES
Clipper Funds Trust, a Delaware statutory trust ("Trust"), on behalf of Clipper Fund ("Fund"), a series of the Trust, is registered under the Investment Company Act of 1940, as amended, as a non-diversified, open-end management investment company. The Fund follows the reporting guidance of the Financial Accounting Standards Board ("FASB") Accounting Standards Codification Topic 946, Financial Services – Investment Companies. The Fund's investment objective is long-term capital growth and capital preservation. Davis Selected Advisers, L.P. ("Davis Advisors" or "Adviser"), the Fund's investment adviser, seeks to invest the Fund's assets primarily in common stocks of large companies (generally, companies with market capitalizations of $10 billion or more at the time of initial purchase) that are trading at prices below the Adviser's estimate of their intrinsic values. The following is a summary of significant accounting policies consistently followed by the Fund in the preparation of its financial statements.
Security Valuation - The Fund calculates the net asset value of its shares as of the close of the New York Stock Exchange ("Exchange"), normally 4:00 P.M. Eastern time, on each day the Exchange is open for business. Securities listed on the Exchange (and other national exchanges including NASDAQ) are valued at the last reported sales price on the day of valuation. Listed securities for which no sale was reported on that date are valued at the last quoted bid price. Securities traded on foreign exchanges are valued based upon the last sales price on the principal exchange on which the security is traded prior to the time when the Fund's assets are valued. Securities (including restricted securities) for which market quotations are not readily available or securities whose values have been materially affected by what the Adviser identifies as a significant event occurring before the Fund's assets are valued but after the close of their respective exchanges will be fair valued using a fair valuation methodology applicable to the security type or the significant event as previously approved by the Fund's Pricing Committee and Board of Trustees. The Pricing Committee considers all facts it deems relevant that are reasonably available, through either public information or information available to the Adviser's portfolio management team, when determining the fair value of a security. To assess the appropriateness of security valuations, the Adviser may consider (i) comparing prior day prices and/or prices of comparable securities; (ii) comparing sale prices to the prior or current day prices and challenge those prices exceeding certain tolerance levels with the third-party pricing service or broker source; (iii) new rounds of financing; (iv) the performance of the market or the issuer's industry; (v) the liquidity of the security; (vi) the size of the holding in a fund; and/or (vii) any other appropriate information. The determination of a security's fair value price often involves the consideration of a number of subjective factors and is therefore subject to the unavoidable risk that the value assigned to a security may be higher or lower than the security's value would be if a reliable market quotation of the security was readily available. Fair value determinations are subject to review, approval, and ratification by the Fund's Board of Trustees at its next regularly scheduled meeting covering the calendar quarter in which the fair valuation was determined. Fair valuation methods used by the Fund may include, but are not limited to, valuing securities initially at cost (excluding commissions) and subsequently adjusting the value due to: additional transactions by the issuer, changes in company specific fundamentals and changes in the value of similar securities. Values may be further adjusted for any discounts related to security-specific resale restrictions.
Short-term securities purchased within 60 days to maturity are valued at amortized cost, which approximates market value.
The Fund's valuation procedures are reviewed and subject to approval by the Board of Trustees. There have been no significant changes to the fair valuation procedures during the period.
Fair Value Measurements - Fair value is defined as the price that the Fund would receive upon selling an investment in an orderly transaction to an independent buyer in the principal market for the investment. Various inputs are used to determine the fair value of the Fund's investments. These inputs are summarized in the three broad levels listed below.
Level 1 – quoted prices in active markets for identical securities
Level 2 – other significant observable inputs (including quoted prices for similar investments, interest rates, prepayment speeds, credit risk, etc.)
Level 3 – significant unobservable inputs (including the Fund's own assumptions in determining the fair value of investments)
The inputs or methodologies used for valuing securities are not necessarily an indication of the risks associated with investing in those securities nor can it be assured that the Fund can obtain the fair value assigned to a security if it were to sell the security.
CLIPPER FUNDSM | Notes to Financial Statements – (Continued) |
| | June 30, 2018 (Unaudited) |
NOTE 1 - SUMMARY OF SIGNIFICANT ACCOUNTING POLICIES – (CONTINUED)
Fair Value Measurements - (Continued)
The following is a summary of the inputs used as of June 30, 2018 in valuing the Fund's investments carried at value:
| | Investments in Securities at Value |
| | Valuation Inputs |
| | | | Level 2: | | Level 3: | | |
| | | | Other Significant | | Significant | | |
| | Level 1: | | Observable | | Unobservable | | |
| | Quoted Prices | | Inputs | | Inputs | | Total |
Equity securities: | | | | | | | | | | | |
| Consumer Discretionary | $ | 133,190,320 | | $ | – | | $ | 29,294,921 | | $ | 162,485,241 |
| Energy | | 97,291,899 | | | – | | | – | | | 97,291,899 |
| Financials | | 473,038,203 | | | – | | | – | | | 473,038,203 |
| Health Care | | 23,845,825 | | | – | | | – | | | 23,845,825 |
| Industrials | | 209,254,672 | | | – | | | – | | | 209,254,672 |
| Information Technology | | 168,502,575 | | | – | | | 397,741 | | | 168,900,316 |
| Materials | | 19,943,359 | | | – | | | – | | | 19,943,359 |
| Short-term securities | | – | | | 25,187,000 | | | – | | | 25,187,000 |
| Total Investments | $ | 1,125,066,853 | | $ | 25,187,000 | | $ | 29,692,662 | | $ | 1,179,946,515 |
There were no transfers of investments between Level 1 and Level 2 of the fair value hierarchy during the six months ended June 30, 2018.
The following table reconciles the valuation of assets in which significant unobservable inputs (Level 3) were used in determining fair value during the six months ended June 30, 2018. The net change in unrealized appreciation (depreciation) during the period on Level 3 securities still held at June 30, 2018 was $(2,073,978). There were no transfers of investments into or out of Level 3 of the fair value hierarchy during the period. The cost of purchases or proceeds from sales may include securities received or delivered through corporate actions or exchanges. Realized and unrealized gains (losses) are included in the related amounts on investments in the Statement of Operations.
| | | Beginning Balance January 1, 2018 | | Cost of Purchases | | Net Change in Unrealized Appreciation (Depreciation) | | Net Realized Gain (Loss) | | Proceeds from Sales | | Ending Balance June 30, 2018 |
| Investments in Securities: | | | | | | | | | | | | | | | | | | |
| Common Stock | | $ | 391,550 | | $ | – | | $ | 6,191 | | $ | – | | $ | – | | $ | 397,741 |
| Preferred Stock | | | 31,375,090 | | | – | | | (2,080,169) | | | – | | | – | | | 29,294,921 |
| Total Level 3 | | $ | 31,766,640 | | $ | – | | $ | (2,073,978) | | $ | – | | $ | – | | $ | 29,692,662 |
The following table is a summary of those assets in which significant unobservable inputs (Level 3) were used by the Adviser in determining fair value. Note that these amounts exclude any valuations provided by a pricing service or broker.
| | | Fair Value at | | Valuation | | Unobservable | | Amount(s) or | | Impact to Valuation from |
| | | June 30, 2018 | | Technique | | Input(s) | | Range | | an Increase in Input |
| Investments in Securities: | | | | | | | | | | | |
| Common Stock | | $ | 397,741 | | Discounted Cash Flow | | Annualized Yield | | 3.497% | | Decrease |
| | | | | | | | | | | | |
| Preferred Stock | | | 29,294,921 | | Market Approach | | Volume-Weighted Transaction Price | | $46.50-$48.36 | | Increase |
| Total Level 3 | | $ | 29,692,662 | | | | | | | | |
The significant unobservable inputs listed in the above table are used in the fair value measurement of equity securities, and if changed, would affect the fair value of the Fund's investments. The transaction price input is attributable to a private security and includes assumptions made from private transactions. The "Impact to Valuation from an Increase in Input" represents the change in fair value measurement resulting from an increase in the corresponding input. A decrease in the input would have the opposite effect.
CLIPPER FUNDSM | Notes to Financial Statements – (Continued) |
| | June 30, 2018 (Unaudited) |
NOTE 1 - SUMMARY OF SIGNIFICANT ACCOUNTING POLICIES – (CONTINUED)
Master Repurchase Agreements - The Fund, along with other affiliated funds, may transfer uninvested cash balances into one or more master repurchase agreement accounts. These balances are invested in one or more repurchase agreements, secured by U.S. Government securities. A custodian bank holds securities pledged as collateral for repurchase agreements until the agreements mature. Each agreement requires that the market value of the collateral be sufficient to cover payments of interest and principal; however, in the event of default by the other party to the agreement, retention of the collateral may be subject to legal proceedings.
Currency Translation - The market values of all assets and liabilities denominated in foreign currencies are recorded in the financial statements after translation to the U.S. Dollar based upon the mean between the bid and offered quotations of the currencies against U.S. Dollars on the date of valuation. The cost basis of such assets and liabilities is determined based upon historical exchange rates. Income and expenses are translated at average exchange rates in effect as accrued or incurred.
Foreign Currency - The Fund may enter into forward purchases or sales of foreign currencies to hedge certain foreign currency denominated assets and liabilities against declines in market value relative to the U.S. Dollar. Forward currency contracts are marked-to-market daily and the change in market value is recorded by the Fund as an unrealized gain or loss. When the forward currency contract is closed, the Fund records a realized gain or loss equal to the difference between the value of the forward currency contract at the time it was opened and value at the time it was closed. Investments in forward currency contracts may expose the Fund to risks resulting from unanticipated movements in foreign currency exchange rates or failure of the counter-party to the agreement to perform in accordance with the terms of the contract. There were no forward contracts entered into by the Fund.
Reported net realized foreign exchange gains or losses arise from the sales of foreign currencies, currency gains or losses realized between the trade and settlement dates on security transactions, the difference between the amounts of dividends, interest, and foreign withholding taxes recorded on the Fund's books, and the U.S. Dollar equivalent of the amounts actually received or paid. Net unrealized foreign exchange gains or losses arise from changes in the value of assets and liabilities other than investments in securities at fiscal year end, resulting from changes in the exchange rate. The Fund includes foreign currency gains and losses realized on the sales of investments together with market gains and losses on such investments in the Statement of Operations.
Federal Income Taxes - It is the Fund's policy to comply with the requirements of the Internal Revenue Code applicable to regulated investment companies, and to distribute substantially all of its taxable income, including any net realized gains on investments not offset by loss carryovers, to shareholders. Therefore, no provision for federal income or excise tax is required. The Adviser analyzed the Fund's tax positions taken on federal and state income tax returns for all open tax years and concluded that as of June 30, 2018, no provision for income tax is required in the Fund's financial statements related to these tax positions. The Fund's federal and state (Arizona) income and federal excise tax returns for tax years for which the applicable statutes of limitations have not expired are subject to examination by the Internal Revenue Service and state Department of Revenue. The earliest tax year that remains subject to examination by these jurisdictions is 2014.
At June 30, 2018, the aggregate cost of investments and unrealized appreciation (depreciation) for federal income tax purposes were as follows:
| Cost | | $ | 805,899,659 |
Unrealized appreciation | | | 386,338,285 |
| Unrealized depreciation | | | (12,291,429) |
| Net unrealized appreciation | | $ | 374,046,856 |
Securities Transactions and Related Investment Income - Securities transactions are accounted for on the trade date (date the order to buy or sell is executed) with realized gain or loss on the sale of securities being determined based upon identified cost. Dividend income is recorded on the ex-dividend date. Interest income, which includes accretion of discount and amortization of premium, is accrued as earned.
CLIPPER FUNDSM | Notes to Financial Statements – (Continued) |
| | June 30, 2018 (Unaudited) |
NOTE 1 - SUMMARY OF SIGNIFICANT ACCOUNTING POLICIES – (CONTINUED)
Dividends and Distributions to Shareholders - Dividends and distributions to shareholders are recorded on the ex-dividend date. Net investment income (loss), net realized gains (losses), and net unrealized appreciation (depreciation) on investments may differ for financial statement and tax purposes primarily due to differing treatments of wash sales, foreign currency transactions, deferred compensation, corporate actions, and partnership income. The character of dividends and distributions made during the fiscal year from net investment income and net realized securities gains may differ from their ultimate characterization for federal income tax purposes. Also, due to the timing of dividends and distributions, the fiscal year in which amounts are distributed may differ from the fiscal year in which income or realized gain was recorded by the Fund. The Fund adjusts certain components of capital to reflect permanent differences between financial statement amounts and net income and realized gains/losses determined in accordance with income tax rules.
Indemnification - Under the Fund's organizational documents, its officers and trustees are indemnified against certain liabilities arising out of the performance of their duties to the Fund. In addition, some of the Fund's contracts with its service providers contain general indemnification clauses. The Fund's maximum exposure under these arrangements is unknown since the amount of any future claims that may be made against the Fund cannot be determined and the Fund has no historical basis for predicting the likelihood of any such claims.
Use of Estimates in Financial Statements - In preparing financial statements in conformity with accounting principles generally accepted in the United States of America, management makes estimates and assumptions that affect the reported amounts of assets and liabilities and disclosure of contingent assets and liabilities at the date of the financial statements, as well as the reported amounts of income and expenses during the reporting period. Actual results may differ from these estimates.
Trustees Fees and Expenses - The Fund set up a Rabbi Trust to provide for the deferred compensation plan for Independent Trustees that enables them to elect to defer receipt of all or a portion of annual fees they are entitled to receive. The value of an eligible Trustees' account is based upon years of service and fees paid to each Trustee during the years of service. The amount paid to the Trustee by the Trust under the plan will be determined based upon the performance of the Funds in which the amounts are invested.
NOTE 2 - PURCHASES AND SALES OF SECURITIES
The cost of purchases and proceeds from sales of investment securities (excluding short-term securities) during the six months ended June 30, 2018 were $120,776,207 and $82,504,247, respectively.
NOTE 3 - FEES AND OTHER TRANSACTIONS WITH SERVICE PROVIDERS (INCLUDING AFFILIATES)
Davis Selected Advisers-NY, Inc. ("DSA-NY"), a wholly-owned subsidiary of the Adviser, acts as sub-adviser to the Fund. DSA-NY performs research and portfolio management services for the Fund under a Sub-Advisory Agreement with the Adviser. The Fund pays no fees directly to DSA-NY.
All officers of the Fund (including Interested Trustees) hold positions as executive officers with the Adviser or its affiliates.
Investment Advisory Fees - Advisory fees are paid monthly to the Adviser. The annual rate is 0.55% of the average net assets for the first $3 billion, 0.54% on the next $1 billion, 0.53% on the next $1 billion, 0.52% on the next $1 billion, 0.51% on the next $1 billion, 0.50% on the next $3 billion, and 0.485% of the average net assets greater than $10 billion. Advisory fees paid during the six months ended June 30, 2018 approximated 0.55% of average net assets.
Transfer Agent and Accounting Fees - DST Asset Manager Solutions, Inc. is the Fund's primary transfer agent. The Adviser is also paid for certain transfer agent services. The fee paid to the Adviser for these services during the six months ended June 30, 2018 amounted to $32,621. State Street Bank and Trust Company ("State Street Bank") is the Fund's primary accounting provider. Fees for such services are included in the custodian fees as State Street Bank also serves as the Fund's custodian.
CLIPPER FUNDSM | Notes to Financial Statements – (Continued) |
| | June 30, 2018 (Unaudited) |
NOTE 4 - CAPITAL STOCK
At June 30, 2018, there were unlimited shares of capital stock (no par value) authorized. Transactions in capital stock were as follows:
| | Six months ended June 30, 2018 (Unaudited) |
| | | Sold | | | Reinvestment of Distributions | | | Redeemed | | | Net Increase |
Shares | | 233,929 | | | 365,777 | | | (541,227) | | | 58,479 |
| Value | $ | 28,657,134 | | $ | 43,004,363 | | $ | (66,079,192) | | $ | 5,582,305 |
| |
| |
| | Year ended December 31, 2017 |
| | | Sold | | | Reinvestment of Distributions | | | Redeemed | | | Net Decrease |
Shares | | 509,897 | | | 563,465 | | | (2,385,486) | | | (1,312,124) |
| Value | $ | 58,605,409 | | $ | 65,865,984 | | $ | (270,893,526) | | $ | (146,422,133) |
| |
NOTE 5 - SECURITIES LOANED
The Fund has entered into a securities lending arrangement with State Street Bank. Under the terms of the agreement, the Fund receives fee income from lending transactions; in exchange for such fees, State Street Bank is authorized to loan securities on behalf of the Fund, against receipt of collateral at least equal to the value of the securities loaned. As of June 30, 2018, the Fund did not have any securities on loan. The Fund bears the risk of any deficiency in the amount of the collateral available for return to a borrower due to a loss in an approved investment.
NOTE 6 - RESTRICTED SECURITIES
Restricted securities are not registered under the Securities Act of 1933 and may have contractual restrictions on resale. They are fair valued under methods approved by the Board of Trustees. The aggregate value of restricted securities amounted to $29,692,662 or 2.53% of the Fund's net assets as of June 30, 2018. Information regarding restricted securities is as follows:
| Security | | Initial Acquisition Date | | Units/Shares | | Cost per Unit/ Share | | Valuation per Unit/Share as of June 30, 2018 |
| | | | | | | | | | | |
| ASAC II L.P. | | 10/10/13 | | 407,313 | | $ | 1.00 | | $ | 0.9765 |
| Didi Chuxing Joint Co., Series A, Pfd. | | 04/22/16 | | 524,409 | | | 38.2271 | | | 47.5553 |
| Didi Chuxing Joint Co., Series B, Pfd. | | 05/16/17 | | 91,609 | | | 50.9321 | | | 47.5553 |
| The following financial information represents selected data for each share of capital stock outstanding throughout each period: |
| | | | | | | | | | | | | | | | | | | | | | | | | | | | | | | | | | |
| | Six months ended
June 30, 2018 | | Year ended December 31, | |
| | (Unaudited) | | 2017 | | 2016 | | 2015 | | 2014 | | 2013 | |
| Net Asset Value, Beginning of Period | | $ | 120.46 | | $ | 108.72 | | $ | 104.41 | | $ | 98.79 | | $ | 92.07 | | $ | 68.86 | |
Income from Investment Operations: | | | | | | | | | | | | | | | | | | | | | | | | | | | | | | | | |
Net Investment Incomea | | 0.59 | | 0.75 | | 0.65 | | 0.51 | | 0.35 | | 0.47 | |
| Net Realized and Unrealized Gains | | 2.32 | | 18.16 | | 15.00 | | 5.85 | | 6.78 | | 23.09 | |
| | Total from Investment Operations | | 2.91 | | 18.91 | | 15.65 | | 6.36 | | 7.13 | | 23.56 | |
Dividends and Distributions: | | | | | | | | | | | | | | | | | | | | | | | | | | | | | | | | |
| Dividends from Net Investment Income | | (0.56) | | (0.80) | | (1.19) | | (0.50) | | (0.41) | | (0.35) | |
| Distributions from Realized Gains | | (4.11) | | (6.37) | | (10.15) | | (0.24) | | – | | – | |
| | Total Dividends and Distributions | | (4.67) | | (7.17) | | (11.34) | | (0.74) | | (0.41) | | (0.35) | |
| Net Asset Value, End of Period | | $ | 118.70 | | $ | 120.46 | | $ | 108.72 | | $ | 104.41 | | $ | 98.79 | | $ | 92.07 | |
| | | | | | | | | | | | | | | | | | | | | | | | | | | | | | | | | | |
Total Returnb | | 2.45 | % | | 17.69 | % | | 15.62 | % | | 6.44 | % | | 7.75 | % | | 34.22 | % | |
| | | | | | | | | | | | | | | | | | | | | | | | | | | | | | | | | | |
| Ratios/Supplemental Data: | | | | | | | | | | | | | | | | | | | | | | | | | | | | | | | | |
| Net Assets, End of Period (in millions) | | $ | 1,174 | | | $ | 1,185 | | | $ | 1,212 | | | $ | 1,216 | | | $ | 1,109 | | | $ | 1,254 | | |
| Ratio of Expenses to Average Net Assets: | | | | | | | | | | | | | | | | | | | | | | | | | | | | | | | | |
| | Gross | | 0.71 | %c | | 0.71 | % | | 0.72 | % | | 0.72 | % | | 0.74 | % | | 0.74 | % | |
| | Netd | | 0.71 | %c | | 0.71 | % | | 0.72 | % | | 0.72 | % | | 0.74 | % | | 0.74 | % | |
Ratio of Net Investment Income to Average Net Assets | | 0.97 | %c | | 0.66 | % | | 0.63 | % | | 0.50 | % | | 0.36 | % | | 0.58 | % | |
Portfolio Turnover Ratee | | 7 | % | | 17 | % | | 33 | % | | 31 | % | | 38 | % | | 8 | % | |
| a | Per share calculations were based on average shares outstanding for the period. |
| |
| b | Assumes hypothetical initial investment on the business day before the first day of the fiscal period, with all dividends and distributions reinvested in additional shares on the reinvestment date, and redemption at the net asset value calculated on the last business day of the fiscal period. Total returns are not annualized for periods of less than one year. |
| |
| c | Annualized. |
| |
| d | The Net Ratio of Expenses to Average Net Assets reflects the impact, if any, of certain reimbursements. |
| |
| e | The lesser of purchases or sales of portfolio securities for a period, divided by the monthly average of the market value of portfolio securities owned during the period. Securities with a maturity or expiration date at the time of acquisition of one year or less are excluded from the calculation. |
| |
| See Notes to Financial Statements |
CLIPPER FUNDSM | Trustee Approva l of Advisory Agreement ( Unaudited) |
Process of Annual Review
The Board of Trustees of Clipper Funds Trust oversees the management of the Fund and, as required by law, determines annually whether to approve the continuance of the Fund's advisory agreement with Davis Selected Advisers, L.P. and sub-advisory agreement with Davis Selected Advisers-NY, Inc. (jointly "Davis Advisors" and "Advisory Agreement").
With the assistance of counsel to the Independent Trustees, the Independent Trustees undertook a comprehensive review process in anticipation of their annual contract review, held in April 2018. As part of this process, Davis Advisors provided the Independent Trustees with material (including recent investment performance data) that was responsive to questions submitted to Davis Advisors by the Independent Trustees. At this meeting, the Independent Trustees reviewed and evaluated all information which they deemed reasonably necessary under the circumstances and were provided guidance by their independent counsel. Clipper Fund, Inc. was reorganized into Clipper Funds Trust in December 2014. For this reason, the review included historical information for Clipper Fund, Inc.
In reaching their decision, the Independent Trustees also took into account information furnished to them throughout the year and otherwise provided to them during their quarterly meetings or through other prior communications. The Independent Trustees concluded that they had been supplied with sufficient information and data to analyze the Advisory Agreement and that their questions had been sufficiently answered by Davis Advisors. Upon completion of this review, the Independent Trustees found that the terms of the Advisory Agreement are fair and reasonable and that continuation of the Advisory Agreement is in the best interests of Clipper Fund and its shareholders.
Reasons the Independent Trustees Approved Continuation of the Advisory Agreement
The Independent Trustees' determinations were based upon a comprehensive consideration of all information provided to them, and they did not identify any single item or piece of information as the controlling factor. Each Independent Trustee did not necessarily attribute the same weight to each factor. The following facts and conclusions were important, but not exclusive, to the Independent Trustees' recommendation to renew the Advisory Agreement.
The Independent Trustees considered the investment performance of the Fund on an absolute basis, as well as relative to its benchmark and other comparable funds. The Independent Trustees not only considered the investment performance of the Fund, but also the full range and quality of services provided by Davis Advisors to the Fund and its shareholders, including whether the Fund:
| 1. | Achieves satisfactory investment results over the long-term, after all costs; |
| 2. | Efficiently and effectively handles shareholder transactions, inquiries, requests and records, provides quality accounting, legal and compliance services, and oversees third-party service providers; and |
| 3. | Fosters healthy investor behavior. |
Davis Advisors is reimbursed a portion of its costs in providing some but not all of these services.
A shareholder's ultimate return is the product of a fund's results as well as the shareholder's behavior, specifically in selecting when to invest or redeem. The Independent Trustees concluded that, through its actions and communications, Davis Advisors has attempted to have a meaningful positive impact on investor behavior.
In aggregate, Davis Advisors, employees of Davis Advisors, and the Davis family have made significant investments in the Fund. The Independent Trustees considered that these investments tend to align Davis Advisors', Davis Advisors' employees, and Davis family's interests with other shareholders, as they face the same risks, pay the same fees, and are motivated to achieve satisfactory long-term returns. In addition, the Independent Trustees concluded that significant investments by Davis Advisors and the Davis family have contributed to the economies of scale that have lowered fees and expenses for Clipper Fund's shareholders over time.
CLIPPER FUNDSM | Trustee Approval of Advisory Agreement (Unaudited) – (Continued) |
Reasons the Independent Trustees Approved Continuation of the Advisory Agreement – (Continued)
The Independent Trustees noted the importance of reviewing quantitative measures, but recognized that qualitative factors are also important in assessing whether Clipper Fund's shareholders are likely to be well served by the renewal of the Advisory Agreement. They noted both the value and shortcomings of purely quantitative measures, including the data provided by independent service providers, and concluded that, while such measures and data may be informative, the judgment of the Independent Trustees must take many factors into consideration in representing the shareholders of the Clipper Fund, including those listed below. In connection with reviewing comparative performance information, the Independent Trustees generally give greater weight to longer-term measurements.
The Independent Trustees noted that Davis Advisors employs a disciplined, company-specific, research-driven, businesslike, long-term investment philosophy. The Independent Trustees considered the quality of Davis Advisors' investment process as well as the experience, capability and integrity of its senior management and other personnel.
The Independent Trustees recognized Davis Advisors' (a) efforts to minimize transaction costs by generally having a long- term time horizon and low portfolio turnover; (b) focus on tax efficiency; (c) record of generally producing satisfactory results over longer-term periods; (d) efforts towards fostering healthy investor behavior by, among other things, providing informative and substantial educational material; and (e) efforts to promote shareholder interests by actively speaking out on corporate governance issues.
The Independent Trustees assessed (a) comparative fee and expense information for other funds, as selected and analyzed by a nationally recognized independent service provider; (b) information regarding fees charged by Davis Advisors to other advisory clients, which includes other funds it advises, other funds which it sub-advises, and private accounts, as well as the differences in the services provided to such other clients; and (c) the fee schedules and breakpoints (if applicable) of each of the Funds, including an assessment of competitive fee schedules (and breakpoints, if applicable).
The Independent Trustees reviewed the management fee schedule for the Fund, the profitability of the Fund to Davis Advisors, the extent to which economies of scale might be realized if the Fund's net assets increase, and whether the fee schedule should reflect those potential economies of scale at this time. The Independent Trustees considered the nature, quality, and extent of the services being provided to the Fund and the costs incurred by Davis Advisors in providing such services. The Independent Trustees considered various potential benefits that Davis Advisors may receive in connection with the services it provides under the Advisory Agreement with the Fund, including a review of portfolio brokerage practices. The Independent Trustees noted that Davis Advisors does not use client commissions to pay for publications that are available to the general public or for research reports that are created by parties other than the broker-dealers providing trade execution, clearing and/or settlement services to the Fund.
The Independent Trustees compared the fees paid to Davis Advisors by Clipper Fund with those paid by Davis Advisors' sub-advised clients, private account clients, and managed money/wrap clients. To the extent sub-advised or private account fees were lower than fees paid by the Fund, the Independent Trustees noted that the range of services provided to the Fund is more extensive, with greater risks associated with operating SEC registered, publicly traded mutual funds. Serving as the primary adviser for mutual funds is more work because of the complex overlay of regulatory, tax, and accounting issues, which are unique to mutual funds. In addition, the operational work required to service shareholders is more extensive because of the significantly greater number of shareholders, and managing trading is more complex because of the more frequent fund flows. With respect to risk, not only has regulation become more complex and burdensome, but the scrutiny of regulators and shareholders has become more intense. The Independent Trustees concluded that reasonable justifications existed for any differences between the fee rates for Clipper Fund and Davis Advisors' other lines of business.
Clipper Fund
Davis Advisors began the day-to-day management of the Clipper Fund on January 1, 2006. The Independent Trustees noted that Clipper Fund outperformed its benchmark, the Standard & Poor's 500® Index ("S&P 500®"), over the three-year time period ended March 31, 2018. The Fund underperformed the S&P 500® over the one-, five-, and ten-year time periods, all periods ended March 31, 2018.
CLIPPER FUNDSM | Trustee Approval of Advisory Agreement (Unaudited) – (Continued) |
Clipper Fund – (Continued)
Broadridge, an independent service provider, presented a report to the Independent Trustees that compared the Fund to all Lipper retail and institutional large-cap core funds (the "Performance Universe Average"), as well as the relevant Lipper Index. The report indicated that the Fund outperformed the Performance Universe Average and the Lipper Index over the three-, four-, and five-year time periods, but underperformed over the one- and ten-year time periods, all periods ended December 31, 2017. The Fund outperformed the Performance Universe Average and performed in-line with the Lipper Index over the two-year period ended December 31, 2017.
The Independent Trustees also reviewed the Fund's performance versus both the S&P 500® and the Lipper Large-Cap Core category when measured over rolling five- and ten-year time frames. Since Davis Advisors took over management, the Fund outperformed the S&P 500® in 3 out of 8 rolling five-year time periods and outperformed the Lipper Large-Cap Core category in 4 out of 8 rolling five-year time periods, all periods ended December 31 for each year from 2010 through 2017. The Fund underperformed the S&P 500® and the Lipper Large-Cap Core category in 3 out of 3 rolling ten-year time periods, all periods ended December 31 for each year from 2015 through 2017.
The Independent Trustees considered Clipper Fund's management fee and total expense ratio. The current management fee was reasonable and below the average and median of its expense peer group, as determined by Broadridge. The Fund's total expense ratio was approximately in-line with the average and median ratios of its expense peers, as determined by Broadridge. They noted that the Fund has an advisory fee schedule that begins at 0.55% and declines from there in a series of breakpoints. In addition, the Independent Trustees noted that the breakpoint discounts in the Fund's advisory fee schedule would provide for the sharing by Davis Advisors with Fund shareholders of any economies of scale that may exist in the management of the Fund. They also considered that, based on its asset level, the Fund does not qualify for a breakpoint in its advisory fee. In addition, the Independent Trustees noted that the Fund's advisory fee schedule is identical to those paid by two other open-end mutual funds that Davis Advisors serves as investment adviser and that have a higher asset level than the Fund.
Approval of Advisory Agreement
The Independent Trustees concluded that Davis Advisors had provided Clipper Fund and its shareholders a reasonable level of both investment and non-investment services. The Independent Trustees further concluded that shareholders have received a significant benefit from Davis Advisors' shareholder-oriented approach, as well as the execution of its investment discipline.
The Independent Trustees determined that the advisory fee for the Clipper Fund is reasonable in light of the nature, quality, and extent of the services being provided to the Fund, the costs incurred by Davis Advisors in providing such service, and in comparison to the range of the average advisory fees of their peer group, as determined by an independent service provider. The Independent Trustees found that the terms of the Advisory Agreement were fair and reasonable and that continuation of the Advisory Agreement is in the best interest of the Clipper Fund and its shareholders. The Independent Trustees and the full Board of Trustees therefore voted to continue the Advisory Agreement.
CLIPPER FUNDSM | Privacy Noti ce and Householding |
Privacy Notice
While you generally will be dealing with a broker-dealer or other financial adviser, we may collect information about you from your account application and other forms that you may deliver to us. We use this information to process your requests and transactions; for example, to provide you with additional information about the Fund, to open an account for you, or to process a transaction. In order to service your account and execute your transactions, we may provide your personal information to firms that assist us in servicing your account, such as our transfer agent. We may also provide your name and address to one of our agents for the purpose of mailing to you your account statement and other information about our products and services. We may also gather information through the use of "cookies" when you visit our website. These files help us to recognize repeat visitors and allow easy access to and use of the website. We require these outside firms and agents to protect the confidentiality of your information and to use the information only for the purpose for which the disclosure is made. We do not provide customer names and addresses to outside firms, organizations, or individuals except in furtherance of our business relationship with you or as otherwise allowed by law.
We restrict access to nonpublic personal information about you to those employees who need to know that information to provide products or services to you. We maintain physical, electronic, and procedural safeguards that comply with federal standards to guard your personal information.
Householding
To avoid sending duplicate copies of materials to households, the Fund will mail only one copy of each prospectus, Annual, and Semi-Annual Report to shareholders having the same last name and address on the Fund's records. The consolidation of these mailings, called householding, benefits the Fund through reduced mailing expense. If you do not want the mailing of these documents to be combined with those to other members of your household, please contact the Clipper Fund by phone at 1-800-432-2504. Individual copies of current prospectuses and reports will be sent to you within 30 days after the Fund receives your request to stop householding.
For the purpose of their service as trustees to the Clipper Fund, the business address for each of the trustees is 2949 E. Elvira Road, Suite 101, Tucson, AZ 85756. Each Trustee serves until retirement, resignation, death, or removal. Trustees must retire from the Board of Trustees and cease being a Trustee at the close of business on the last day of the calendar year in which the Trustee attains age 78.
Name
(birthdate) | Position(s)
held with Fund | Term of Office and Length of Time Served | Principal Occupation(s)
During Past Five Years | Number of Portfolios
Overseen | Other Directorships |
Independent Trustees
| | | | | | |
Francisco L. Borges (11/17/51) | Trustee | Trustee since 2014 | Chairman and Managing Partner, Landmark Partners, LLC (private equity firm) since March 1999. | 3 | Trustee, John S. and James L. Knight Foundation; Trustee, Connecticut Public Broadcasting Network; Chairman/Director, Assured Guaranty Ltd. (financial guaranty insurance business); Director, Leucadia National Corporation (holding company); Trustee, Millbrook School; Director, Selected Funds (consisting of two portfolios). |
| | | | | | |
Lawrence E. Harris (09/16/56) | Trustee | Director/ Trustee since 2006 | Fred V. Keenan Chair in Finance of the Marshall School of Business, University of Southern California, Los Angeles, CA. | 3 | Director, Interactive Brokers Group, Inc.; Director, Selected Funds (consisting of two portfolios). |
| | | | | | |
Steven N. Kearsley (09/29/41) | Trustee | Director/ Trustee since 2006 | Private Investor, Real Estate Development; Owner, Old Peak Tree Farm. | 3 | Director, Selected Funds (consisting of two portfolios). |
| | | | | | |
Katherine L. MacWilliams (01/19/56) | Trustee | Trustee since 2014 | Retired; Chief Financial Officer, Caridian BCT, Inc. (medical device company) 2008-2012. | 3 | Director, Selected Funds (consisting of two portfolios). |
| | | | | | |
James J. McMonagle (10/01/44) | Trustee/ Chairman | Trustee since 2014/Chairman since 2015 | Of Counsel to Vorys, Sater, Seymour and Pease LLP (law firm) since 2002. | 3 | Director, Owens Corning (producer of residential and commercial building materials); Director/ Chairman, Selected Funds (consisting of two portfolios). |
| | | | | | |
Richard O'Brien (09/12/45) | Trustee | Trustee since 2014 | Retired; Corporate Economist, HP Inc. | 3 | Director, Selected Funds (consisting of two portfolios). |
CLIPPER FUNDSM | Trustees and Officers – (Continued) |
Name (birthdate) | Position(s) held with Fund | Term of Office and Length of Time Served | Principal Occupation(s) During Past Five Years | Number of Portfolios Overseen | Other Directorships |
Interested Trustees*
| | | | | | |
Andrew A. Davis (06/25/63) | Trustee | Trustee since 2014 | President or Vice President of each Selected Fund, Clipper Fund, and Davis Fund; President, Davis Selected Advisers, L.P., and also serves as an Executive Officer of certain companies affiliated with the Adviser. | 16 | Director, Selected Funds (consisting of two portfolios); Director, Davis Funds (consisting of 13 portfolios). |
| | | | | | |
Christopher C. Davis (07/13/65) | Trustee | Trustee since 2014 | President or Vice President of each Selected Fund, Davis Fund, Clipper Fund, and Davis Fundamental ETF; Chairman, Davis Selected Advisers, L.P., and also serves as an Executive Officer of certain companies affiliated with the Adviser, including sole member of the Adviser's general partner, Davis Investments, LLC. | 16 | Director, Selected Funds (consisting of two portfolios); Director, Davis Funds (consisting of 13 portfolios); Director, Graham Holdings Company (educational and media company); Director, The Coca Cola Company (beverage company). |
* Andrew A. Davis and Christopher C. Davis own partnership units (directly, indirectly, or both) of the Adviser and are considered to be "interested persons" of the Funds as defined in the Investment Company Act of 1940. Andrew A. Davis and Christopher C. Davis are brothers.
Officers
Christopher C. Davis (born 07/13/65, Clipper Fund officer since 12/19/05). See description in the section on Interested Trustees.
Andrew A. Davis (born 06/25/63, Clipper Fund officer since 01/23/15). See description in the section on Interested Trustees.
Kenneth C. Eich (born 08/14/53, Clipper Fund officer since 12/19/05). Executive Vice President and Principal Executive Officer of Clipper Funds Trust (consisting of one portfolio), Davis Funds (consisting of 13 portfolios), and Selected Funds (consisting of two portfolios); Trustee/Chairman, Executive Vice President, and Principal Executive Officer of Davis Fundamental ETF Trust (consisting of four portfolios); Chief Operating Officer, Davis Selected Advisers, L.P., and also serves as an Executive Officer of certain companies affiliated with the Adviser.
Douglas A. Haines (born 03/04/71, Clipper Fund officer since 12/19/05). Vice President, Treasurer, Chief Financial Officer, Principal Financial Officer, and Principal Accounting Officer of Clipper Funds Trust (consisting of one portfolio), Davis Funds (consisting of 13 portfolios), Selected Funds (consisting of two portfolios), and Davis Fundamental ETF Trust (consisting of four portfolios); Vice President and Director of Fund Accounting, Davis Selected Advisers, L.P.
Randi J. Roessler (born 06/26/81, Clipper Fund officer since 01/01/18). Vice President and Chief Compliance Officer of Clipper Funds Trust (consisting of one portfolio), Davis Funds (consisting of 13 portfolios), Selected Funds (consisting of two portfolios), and Davis Fundamental ETF Trust (consisting of four portfolios); Vice President and Chief Compliance Officer, Davis Selected Advisers, L.P., and also serves as an Executive Officer of certain companies affiliated with the Adviser.
Ryan M. Charles (born 07/25/78, Clipper Fund officer since 01/01/14). Vice President and Secretary of Clipper Funds Trust (consisting of one portfolio), Davis Funds (consisting of 13 portfolios), Selected Funds (consisting of two portfolios), and Davis Fundamental ETF Trust (consisting of four portfolios); Vice President, Chief Legal Officer and Secretary, Davis Selected Advisers, L.P., and also serves as an Executive Officer of certain companies affiliated with the Adviser.
| Investment Adviser |
| Davis Selected Advisers, L.P. (Doing business as "Davis Advisors") |
| 2949 East Elvira Road, Suite 101 |
| Tucson, Arizona 85756 |
| (800) 432-2504 |
| |
| Distributor |
| Davis Distributors, LLC |
| 2949 East Elvira Road, Suite 101 |
| Tucson, Arizona 85756 |
| |
| Transfer Agent |
| DST Asset Manager Solutions, Inc. |
| P.O. Box 55468 |
| Boston, Massachusetts 02205-5468 |
| |
| Custodian |
| State Street Bank and Trust Co. |
| One Lincoln Street |
| Boston, Massachusetts 02111 |
| |
| Counsel |
| Greenberg Traurig, LLP |
| 77 West Wacker Drive, Suite 3100 |
| Chicago, Illinois 60601 |
| |
| Independent Registered Public Accounting Firm |
| KPMG LLP |
| 1225 Seventeenth Street, Suite 800 |
| Denver, Colorado 80202 |
For more information about Clipper Fund including management fee, charges, and expenses, see the current prospectus, which must precede or accompany this report. The Fund's Statement of Additional Information contains additional information about the Fund's Trustees and is available without charge, upon request, by contacting the Fund at 1-800-432-2504 and on the Fund's website at www.clipperfund.com. Quarterly Fact Sheets are available on the Fund's website at www.clipperfund.com.