Lisa J. Cohen
Davis Selected Advisers, L.P.
Cautionary Statement
Davis Advisors is committed to communicating with our investment partners as candidly as possible because we believe our investors benefit from understanding our investment philosophy and approach. Our views and opinions regarding the investment prospects of our portfolio holdings include “forward looking statements” which may or may not be accurate over the long term. While we believe we have a reasonable basis for our appraisals and we have confidence in our opinions, actual results may differ materially from those we anticipate. These opinions are current as of the date of this report but are subject to change. The information provided in this report should not be considered a recommendation to buy, sell, or hold any particular security.
You can identify forward looking statements by words like “believe,” “expect,” “anticipate,” or similar expressions when discussing prospects for particular portfolio holdings and/or of the Fund. We cannot assure future results and achievements. You should not place undue reliance on forward looking statements, which speak only as of the date of this report. We disclaim any obligation to update or alter any forward looking statements, whether as a result of new information, future events, or otherwise. This material must be preceded or accompanied by a prospectus. Please read the prospectus carefully for a discussion of investment objectives, risks, fees, and expenses. Current performance may be lower or higher than the performance quoted herein. You may obtain a current copy of the Fund’s Prospectus or more current performance information by calling Investor Services at 1-800-432-2504 or on Clipper Fund’s website (www.clipperfund.com).
CLIPPER FUNDSM | Table of Contents |
| 2 |
| | |
| 15 |
| | |
| 17 |
| | |
| 19 |
| | |
| 20 |
| | |
| 22 |
| | |
| 23 |
| | |
| 24 |
| | |
| 25 |
| | |
| 31 |
| | |
| 32 |
| | |
| 33 |
| | |
| 34 |
| | |
| 35 |
This Annual Report is authorized for use by existing shareholders. Prospective shareholders must receive a current Clipper Fund (the “Fund”) prospectus, which contains more information about investment strategies, risks, fees, and expenses. Please read the prospectus carefully before investing or sending money.
Shares of the Fund are not deposits or obligations of any bank, are not guaranteed by any bank, are not insured by the FDIC or any other agency, and involve investment risks, including possible loss of the principal amount invested.
Portfolio Proxy Voting Policies and Procedures
The Fund has adopted Portfolio Proxy Voting Policies and Procedures under which the Fund votes proxies relating to securities held by the Fund. A description of the Fund’s Portfolio Proxy Voting Policies and Procedures is available (i) without charge, upon request, by calling the Fund toll-free at 1-800-432-2504, (ii) on the Fund’s website at www.clipperfund.com, and (iii) on the SEC’s website at www.sec.gov.
In addition, the Fund is required to file Form N-PX, with its complete proxy voting record for the 12 months ended June 30th, no later than August 31st of each year. The Fund’s Form N-PX filing is available (i) without charge, upon request, by calling the Fund toll-free at 1-800-432-2504, (ii) on the Fund’s website at www.clipperfund.com, and (iii) on the SEC’s website at www.sec.gov.
Quarterly Schedule of Investments
The Fund files its complete schedule of investments with the SEC on Form N-CSR (as of the end of the second and fourth quarters) and on Form N-PORT Part F (as of the end of the first and third quarters). The Fund’s Forms N-CSR (Annual and Semi-Annual Reports) and N-PORT Part F are available without charge, upon request, by calling 1-800-432-2504, on the Fund’s website at www.clipperfund.com, and on the SEC’s website at www.sec.gov. A list of the Fund’s quarter-end holdings is also available at www.clipperfund.com on or about the 15th day following each quarter end and remains available on the website until the list is updated for the subsequent quarter.
Executive Summary
| ◾ | Clipper Fund returned 17.8% in 2021. |
| ◾ | To find those select few companies that can grow at above-average rates and yet trade at a below-average valuation on current earnings, our research goes beyond simplistic categories to identify growth businesses with attractive valuations, as well as value businesses with attractive growth. By being highly selective, we have identified a portfolio of companies with this rare combination. |
| ◾ | Our disciplined portfolio reflects our conviction that the best way to build wealth is by finding those rare businesses that combine the best characteristics of both categories: substantial current earnings and bright future prospects. |
| ◾ | By being extremely selective, we have built a portfolio that has the best of both growth and value. While the earnings of our portfolio companies have grown more than 2% per year faster than the benchmark S&P 500 Index, they can currently be purchased at a 49% discount to the index. We consider this a value investor’s dream, as companies that grow profitably over time are more valuable than companies that don’t. |
| ◾ | Areas of opportunity include several dominant internet businesses (Amazon, Alphabet, and Meta [formerly Facebook]), financials (American Express, Bank of New York Mellon, Berkshire Hathaway, Capital One, JP Morgan, and Wells Fargo), overseas companies that serve the fast-growing and enormous Chinese middle class (Alibaba, JD.com, and Tencent [via Naspers/Prosus]), and bargain-priced growth companies in the technology ecosystem that supply today’s hardware infrastructure (Intel and Applied Materials). |
| ◾ | With more than $2 billion of our own money invested alongside clients, our interests are aligned, and our conviction is more than just words.1 |

The average annual total returns for Clipper Fund for periods ending December 31, 2021 are: 1 year, 17.78%; 5 years, 11.46%; and 10 years, 13.14%. The performance presented represents past performance and is not a guarantee of future results. Total return assumes reinvestment of dividends and capital gain distributions. Investment return and principal value will vary so that, when redeemed, an investor’s shares may be worth more or less than their original cost. For most recent month-end performance, visit clipperfund.com or call 800-432-2504. Current performance may be lower or higher than the performance quoted. The total annual operating expense ratio as of the most recent prospectus was 0.71%. The total annual operating expense ratio may vary in future years. Clipper Fund was managed from inception, February 29, 1984, until December 31, 2005 by another Adviser. Davis Selected Advisers, L.P. took over management of the Fund on January 1, 2006.
_________________________________________
This report includes candid statements and observations regarding investment strategies, individual securities, and economic and market conditions; however, there is no guarantee that these statements, opinions or forecasts will prove to be correct. Equity markets are volatile and an investor may lose money. All fund performance discussed within this piece are as of 12/31/21 unless otherwise noted. This is not a recommendation to buy, sell or hold any specific security. Past performance is not a guarantee of future results. The Attractive Growth and Undervalued reference in this piece relates to underlying characteristics of the portfolio holdings. There is no guarantee that the Fund performance will be positive as equity markets are volatile and an investor may lose money.
1 As of 12/31/21 Davis Advisors, the Davis family and Foundation, our employees, and Fund directors have more than $2 billion invested alongside clients in similarly managed accounts and strategies.
Not a part of Annual Report to Fund shareholders
CLIPPER FUNDSM | Shareholder Letter – (Continued) |
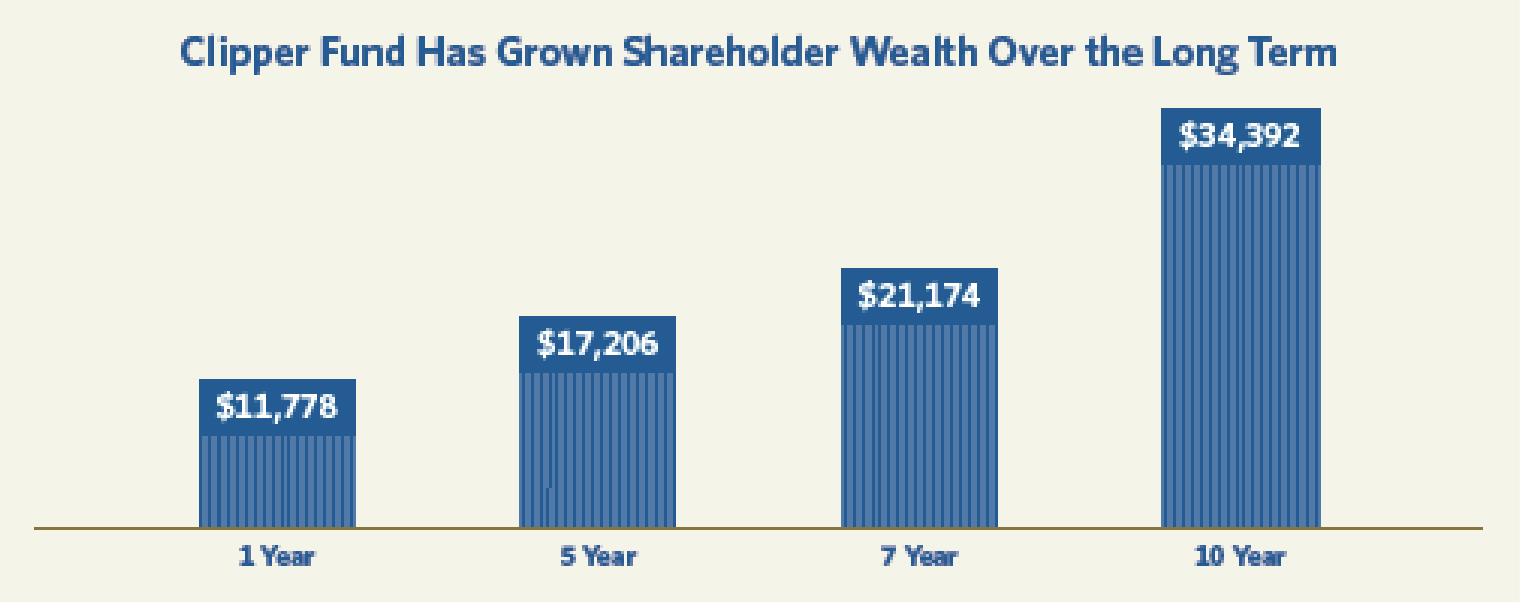
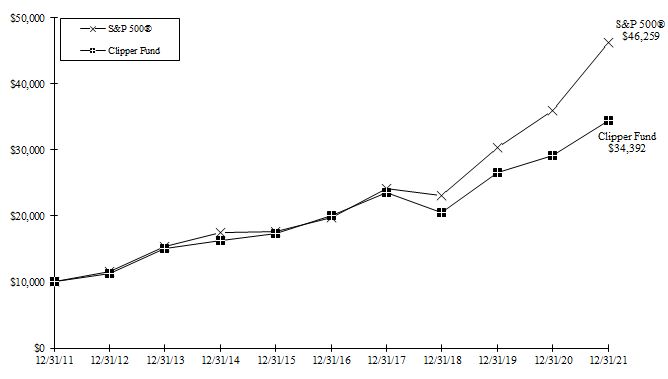
For more than 35 years, Clipper Fund has built wealth through recessions and expansions, crashes and bubbles, fear and euphoria. In 2021, we added to this record, increasing shareholder wealth by more than 17%.
The chart below shows the growth in the value of an initial $10,000 investment over various periods.
| Market Perspective: Looking Beyond Categories |
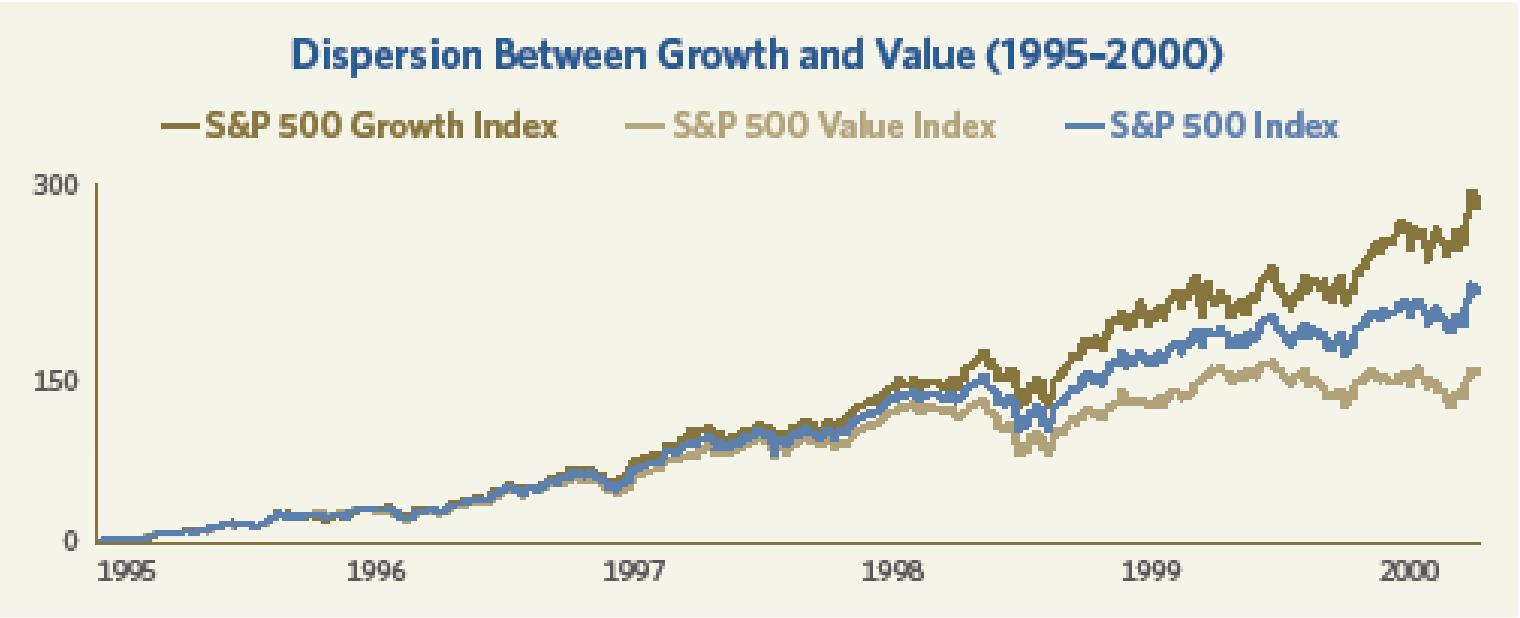
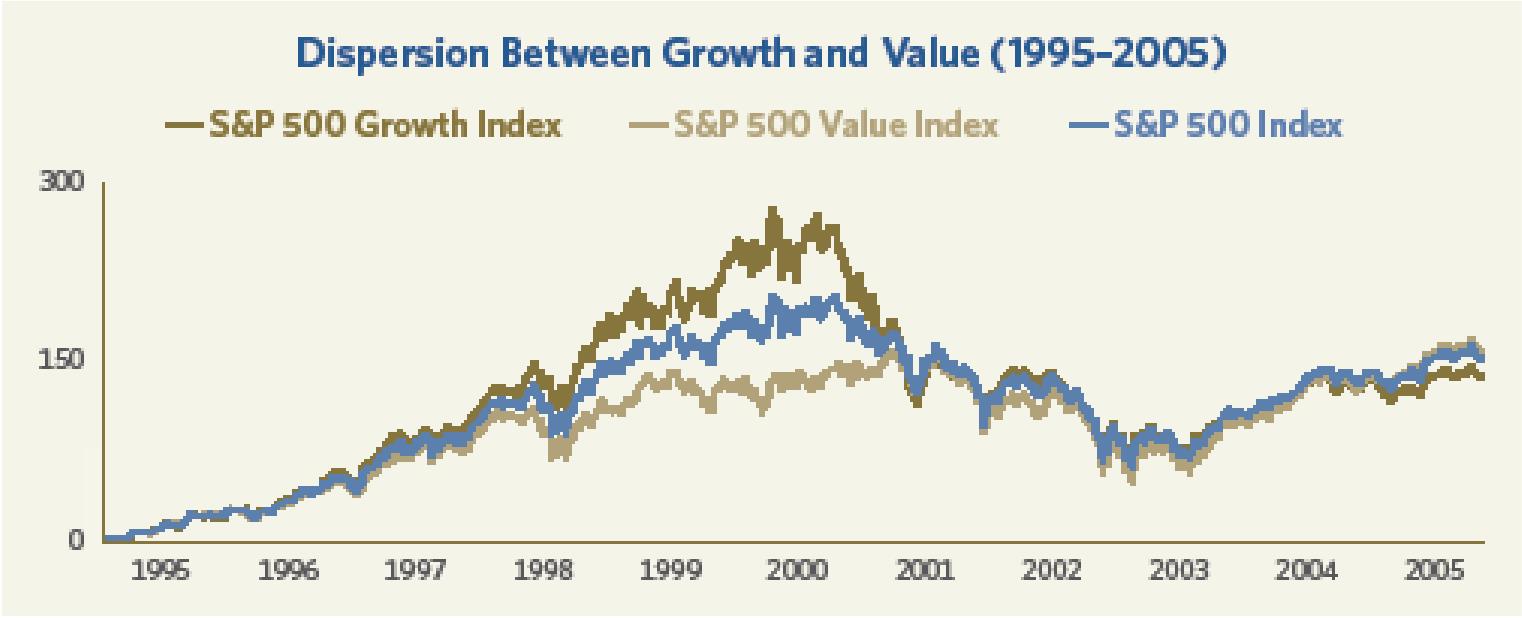
Commentators often divide investment approaches into two different categories: value and growth. Under this taxonomy, value investors tend to place a greater emphasis on a business’ current earnings, while growth investors tend to stress its future prospects. Because all businesses are worth the present value of current and future cash flow, any rational valuation methodology must incorporate both current earnings and future prospects. As a result, we have often argued that the division between growth and value can create real opportunities for investors willing to look beyond the categories, particularly when investors are flocking to one approach and dismissing the other. For example, as can be seen in the graph below, from 1995–2000, the S&P 500 Growth Index dramatically outperformed the S&P 500 Value Index by more than 11% per year.2
2 Source: Bloomberg. Graph is from 6/30/95–3/31/00.
Not a part of Annual Report to Fund shareholders
CLIPPER FUNDSM | Shareholder Letter – (Continued) |
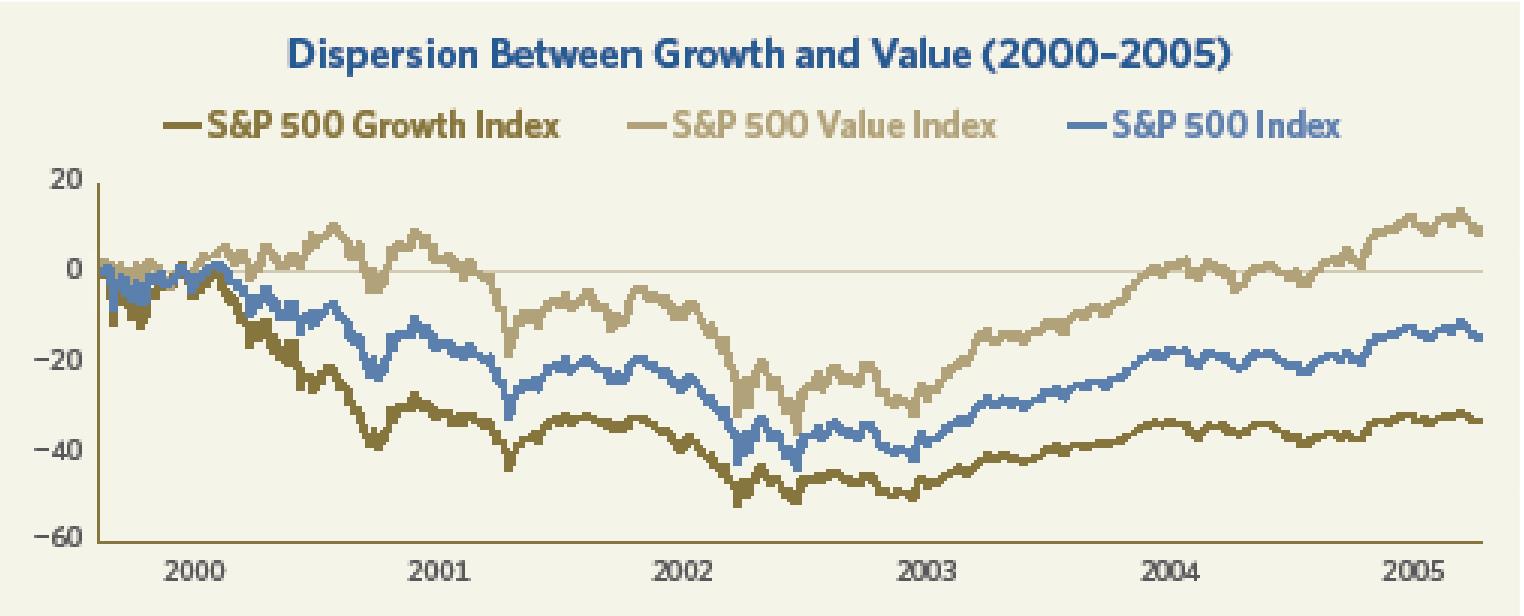
This enormous dispersion created great risk for those who jumped in late and great opportunity for those (including us) who could recognize that growth had become overvalued and were willing to search for opportunities in the unpopular value side of the market. Sure enough, over the next five years, investors in the S&P 500 Growth Index lost almost a third of their savings, while investors in the S&P 500 Value Index earned a positive return, outperforming by approximately 10% per year.
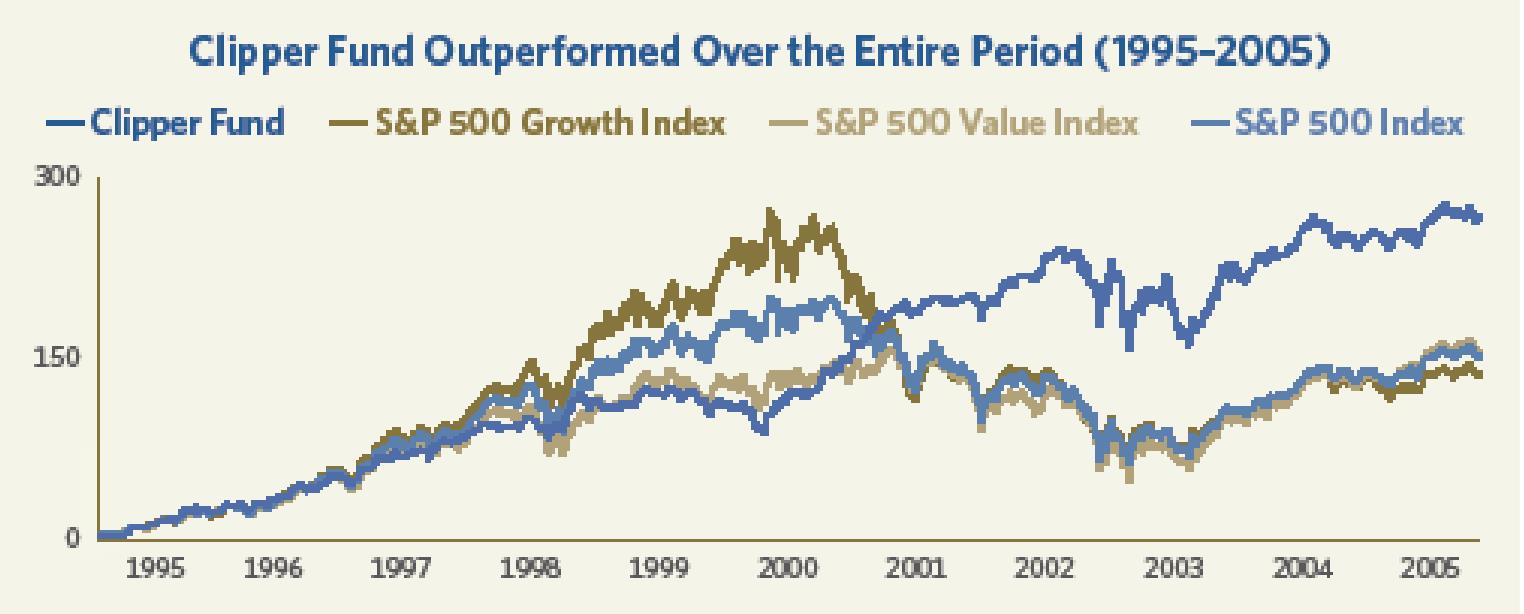
Because the broader S&P 500 Index combines both approaches, growth and value tend to converge over the long term, as can be seen in the graph below, combining both periods.
Not a part of Annual Report to Fund shareholders
CLIPPER FUNDSM | Shareholder Letter – (Continued) |
This convergence (or reversion) reinforces the opportunity and risk created when the two approaches significantly diverge over shorter time periods. More importantly, although Clipper Fund significantly underperformed during the period when growth was in vogue, the Fund’s stellar results in the period that followed more than made up this lost ground, as can be seen in the graph below.
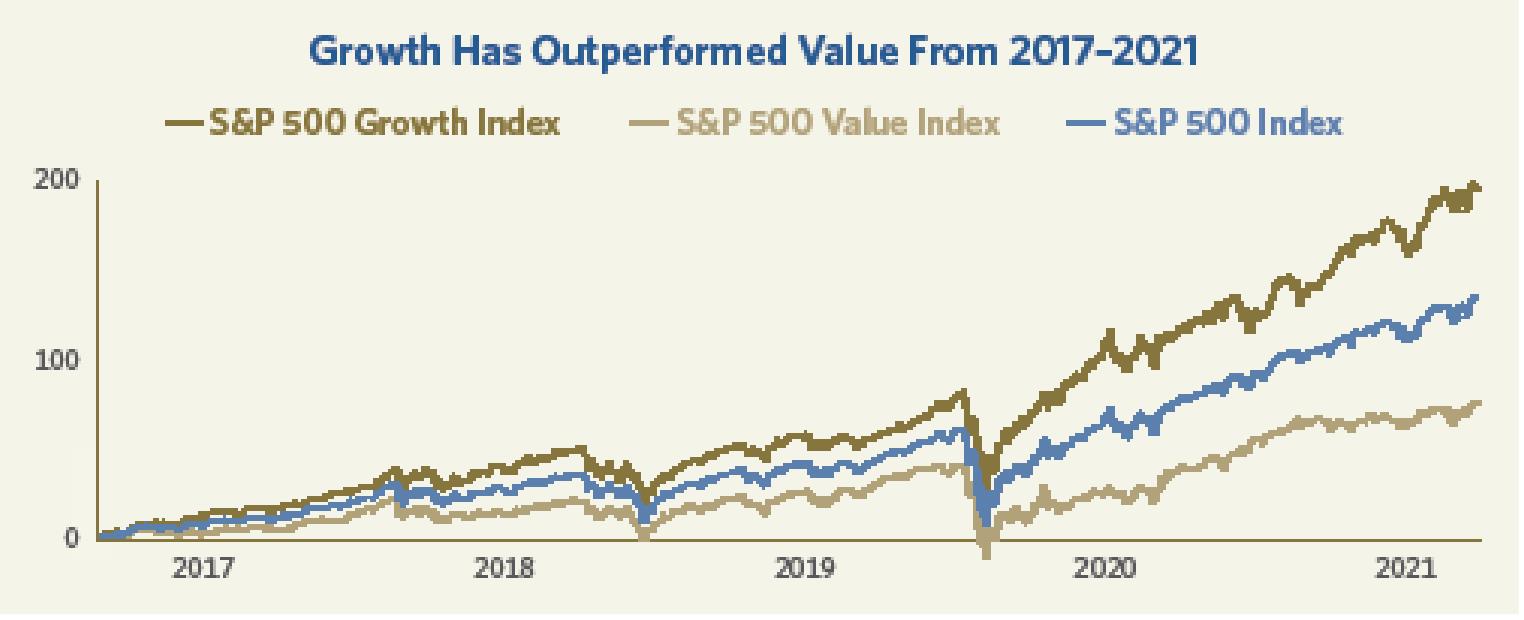
Today’s euphoric market and the enormous dispersion between growth and value bears striking similarities to the period of the late 1990s discussed on page 4. As shown in the graph below, over the last five years, in an almost perfect echo of the graph shown on page 3, the S&P 500 Growth Index has outperformed by a staggering 12% per year.
Now as then, we believe that speculative growth has become overvalued and presents risk not just of relative underperformance, but also of absolute losses. Just as importantly, we also see enormous opportunity for those who recognize this risk and are willing to search for opportunities in the unpopular side of the market. Historically, such periods of extreme dispersion have always come to an end. Although predicting timing is never easy, we believe this game is already in extra innings and that the inevitable reversion may be imminent.
This conviction is not just informed by graphs and history, but by the underlying fundamentals to which we now turn.
Not a part of Annual Report to Fund shareholders
CLIPPER FUNDSM | Shareholder Letter – (Continued) |
 Market Darlings Versus Durable Compounding Machines
While the above discussion of broad investment categories provides useful context, we always emphasize the old adage that investing is the art of the specific. With this in mind, an example may be helpful. Tesla, Nvidia and Shopify are three of the hottest momentum stocks in today’s market, each having compounded at triple-digit-rates over the last three years. Combined, these three have a market capitalization of roughly $2.3 trillion. In other words, should an investor happen to have a couple of trillion dollars lying around, one investment option, which we will call the Market Darlings portfolio, would be to buy 100% of these three remarkable growth companies and live off their current and future earnings.
An alternative option, which we will call the Durable Compounding Machines portfolio, would have the investor pay the same price of $2.3 trillion, but instead use it to buy 100% of Berkshire Hathaway, JP Morgan, Intel, Wells Fargo, Texas Instruments, Raytheon, Bank of New York Mellon and live off current and future earnings of these companies. Not coincidently, the Durable Compounding Machines portfolio represents a good cross-section of the holdings in Clipper Fund.
Because our hypothetical investor is going to live off the earnings of these businesses, both current earnings and future prospects are important investment considerations and should be carefully evaluated.
Let’s start with current earnings.
As can be seen in the table below, for roughly the same price of $2.3 trillion, the Market Darlings produce about $20 billion of current earnings, while the Durable Compounding Machines generate about $133 billion per year, almost seven times more. Consequently, from a current earnings point of view, it is no contest; any rational investor would choose the Durable Compounding Machines over the Market Darlings.
3 Source: Davis Advisors. Bloomberg and company filings. Not a recommendation to buy, sell, or hold any particular security. The companies in the Market Darlings category were selected based on their very large market capitalizations and valuations. The companies in the Durable Compounding Machines category mostly represent current Clipper Fund holdings with a market capitalization that was approximately equal to that of the Market Darlings as of 12/31/21.
Not a part of Annual Report to Fund shareholders
CLIPPER FUNDSM | Shareholder Letter – (Continued) |
But how about if we incorporate the bright future prospects of the Market Darlings? After all, few would argue that the Market Darlings, Tesla, Nvidia and Shopify, don’t have bright futures. The question is, how bright would their futures have to be to earn the $133 billion that the durable compounding machines are earning today.
Mathematically, the answer is simple. These companies would need to increase their earnings almost sevenfold which, while not impossible, is no easy feat. For example, a company would need to grow profits almost 21% per year for a decade to achieve this outcome. However, even if they accomplish this spectacular growth, the fact that the earnings wouldn’t be generated for many years requires that investors discount them back to the present. Using even a modest discount rate, the power of compounding reduces the present value of that $133 billion to a much smaller number. In the meantime, the owners of the Durable Compounding Machines are earning that amount today and given that these companies have had long records of growth through good times and bad, we believe they should have a bright future.
Selectivity, Growth and Value
As the above discussion makes clear, successful long-term investors must consider both a company’s current earnings and its future prospects when evaluating a potential investment. The Holy Grail is to identify those select few companies that are able to grow at above-average rates and yet trade at a below-average valuation on current earnings. By being highly selective, we have identified a portfolio of companies with this rare combination.
Selectivity means that we invest in fewer than one out of every 15 companies included in the S&P 500 Index. Just as with the best universities or best companies, the ability to select from a large pool of applicants creates the opportunity to choose only the most exceptional candidates and reject those that are average or worse. Our research efforts comb through hundreds of potential investments, seeking those whose business and financial characteristics can turn long-term investments into compounding machines.
In particular, we look for durable, growing businesses that can be purchased at attractive valuations and reject businesses that generate low returns, are stagnant, overvalued, overleveraged or competitively disadvantaged. While funds that passively mirror the S&P 500 Index are forced to invest in all companies, including those that we view as significantly overvalued or competitively challenged, our selective approach allows us to reject such companies. In this environment of wide dispersions, the ability to selectively reject certain companies and sectors from our portfolio may prove just as valuable as the ability to selectively invest in others.
By recognizing both the value of growth and the importance of value, our portfolio holds those select few businesses that combine the best characteristics of both categories: substantial current earnings and bright future prospects. After all, categories do not build wealth. Nor do average businesses. Instead, generational wealth is built by investing in those select few businesses that combine durable and resilient growth with attractive valuations. To find such an attractive combination, our research goes beyond simplistic categories to identify growth businesses with attractive valuations, as well as value businesses with attractive growth.
Undervalued Growth
Within the traditional growth category, growing euphoria has led to bubble prices for many companies, most especially those with new and unproven business models such as those discussed above. In contrast, our research focuses on a select handful of proven growth stalwarts whose shares still trade at reasonable valuations. For example, because of concerns about future litigation and regulation, several dominant internet businesses, including Amazon, Alphabet and Meta (formerly Facebook), trade at steep discounts to many unproven and unprofitable growth darlings that, in our view, trade at euphoric prices. While we expect a continued barrage of negative headlines around these names, as well as increased regulation in the years ahead, we do not expect a significant decline in their long-term profitability.
We have also found opportunities to buy proven growth companies at attractive prices by looking overseas at companies such as Alibaba, JD.com and Tencent that serve the fast-growing and enormous Chinese middle class.
Not a part of Annual Report to Fund shareholders
CLIPPER FUNDSM | Shareholder Letter – (Continued) |
Finally, we have found bargain-priced growth companies in less glamorous parts of the technology ecosystem. Like the manufacturers of picks and shovels during the Gold Rush, outstanding companies such as Intel and Applied Materials generate wonderful profits manufacturing the underlying hardware that enables such exciting but speculative new fields as self-driving cars, cloud computing, artificial intelligence, machine learning, software as a service and the Internet of Things.
Growing Value
In the same way our research focuses on durable growth companies that are not overvalued, we also seek out value companies capable of long-term growth. In doing so, we seek to avoid risks inherent in companies that we would classify as value traps or speculative value. While the shares of such companies may trade at cheap prices, their businesses are often fragile, impaired, prone to disruption or highly sensitive to the timing of an economic recovery. Decades of experience have taught us the dangers of owning weak businesses unable to withstand unexpected shocks, even if they sell at cheap prices. Although such speculative gambles may hit from time to time, poor businesses do not build generational wealth. Instead, our attention within the value part of the market remains steadfastly focused on companies that combine strength and resiliency with long-term growth, profitability and competitive advantages. In today’s uncertain economy, select financials represent the best combination of proven durability and low valuations.
Throughout the pandemic, high-quality financials demonstrated their resiliency. While their share prices gyrated wildly, their strong capital ratios and conservative loan portfolios allowed them to be part of the solution, rather than part of the problem. As investors consider the possibility of higher interest rates in the years ahead, financials should remain in favor, as most will earn higher profits while rates rise. The combination of rising dividends, falling share counts, resilient profits and some inflation protection should finally lead to the revaluation of select high-quality financials in the years ahead.
Although financial stocks have enjoyed a sharp recovery from last year’s panic-induced lows, we believe investors need not worry that they missed an opportunity. As can be seen in the chart below, financials remain one of the cheapest sectors in the market. What’s more, the current valuation of the financial sector is low, not just relative to the market, but even relative to its own historic discount.
4 As of 12/31/21. Source: Credit Suisse.
Not a part of Annual Report to Fund shareholders
CLIPPER FUNDSM | Shareholder Letter – (Continued) |
In sum, our willingness to look beyond simplistic definitions and categories has led to a portfolio that includes growth companies at value prices and value companies with long-term growth. As can be seen in the table below, by being extremely selective, we have built a portfolio that has the best of both growth and value. While the earnings of our portfolio companies have grown more than 2% per year faster than the benchmark S&P 500 Index, they can currently be purchased at a 49% discount to the index.
Conclusion
While the pandemic extracted an awful toll on so many families, it also highlighted the inventiveness, creativity and ingenuity of our society. From ecommerce to biotechnology, this has been a period of explosive innovation, adaptability and resiliency and a powerful reminder of two seemingly contradictory investment truths.
First, unexpected bad things can and will happen. Over our company’s history, we have navigated countless dire and unexpected crises, including the energy crisis, the hostage crisis, the inflation crisis, 9/11, the financial crisis, the COVID crisis and the ongoing climate crisis. As fiduciaries, we must incorporate both expected and unexpected challenges and crises into every aspect of our investment process.
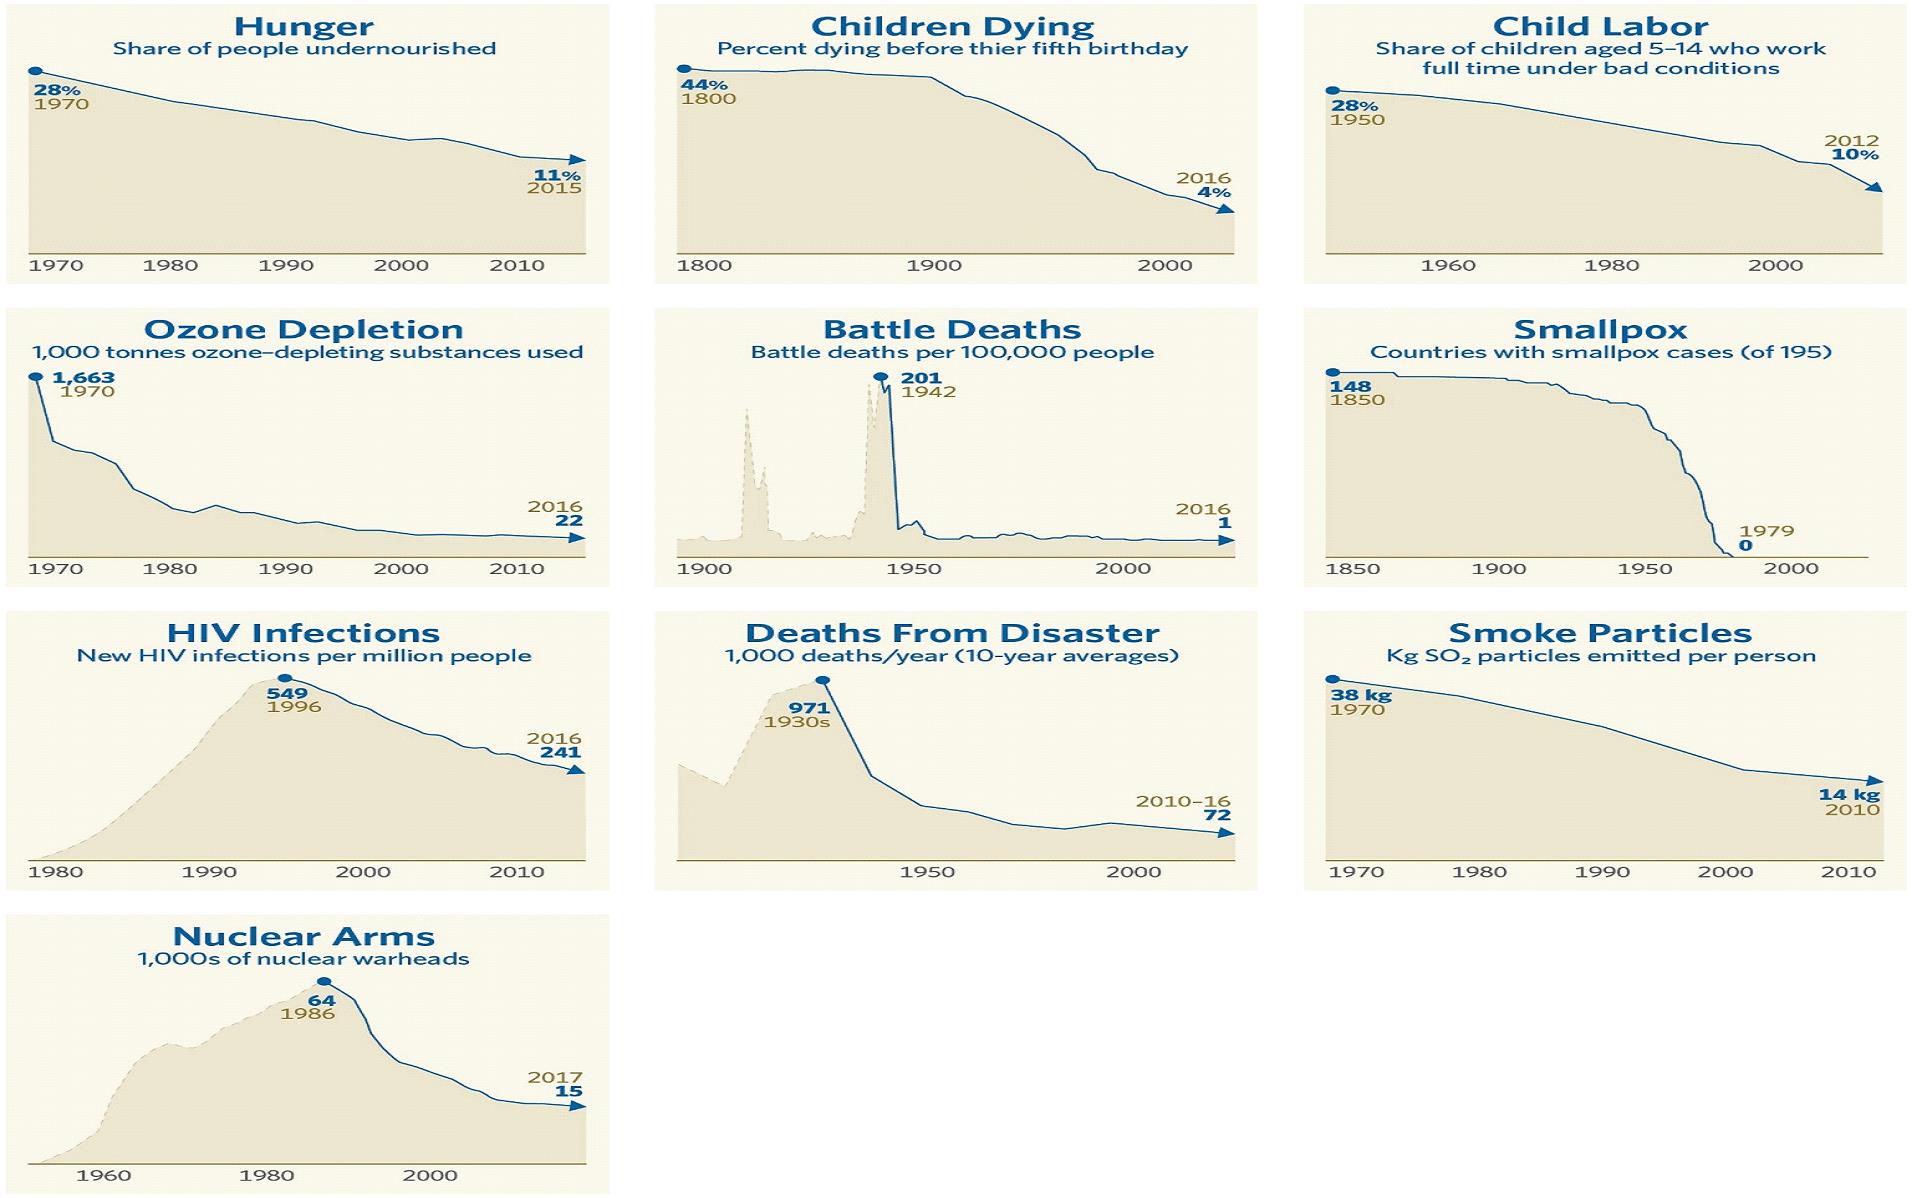
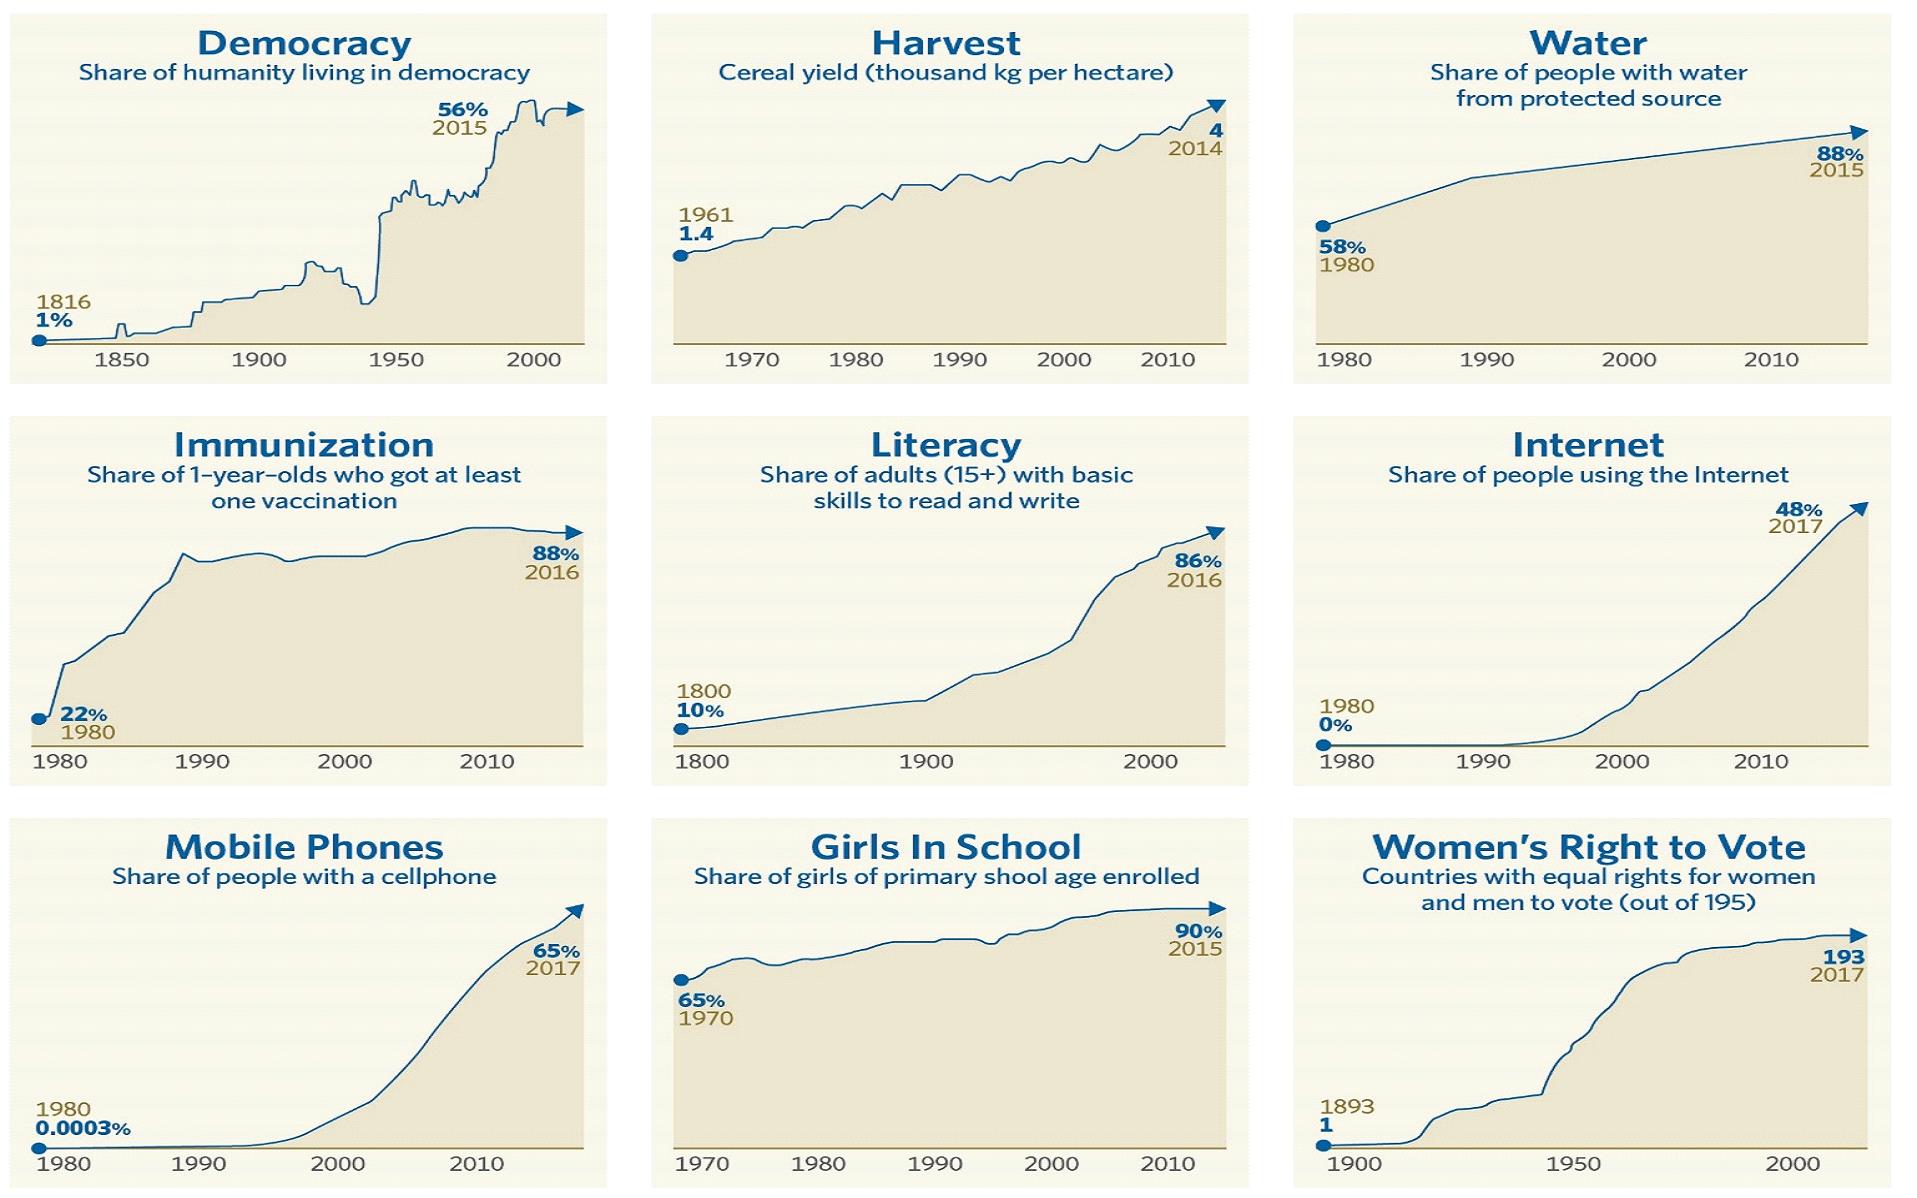
Second, we must also recognize the incredible power of innovation and invention. In the early stages of the pandemic, the most optimistic forecasts called for a vaccine in three-to-five years. And yet, scientists developed one in a matter of months. Similarly, over the longer term, human ingenuity has led to stunning progress in addressing a vast range of horrific global challenges. The graphs on the next pages offer a compelling, if incomplete, quantitative picture of this progress.
Not a part of Annual Report to Fund shareholders
CLIPPER FUNDSM | Shareholder Letter – (Continued) |
Bad Things Have Been Declining5
5 Source: https://www.gapminder.org/factfulness-book/32-improvements/
Not a part of Annual Report to Fund shareholders
CLIPPER FUNDSM | Shareholder Letter – (Continued) |
Good Things Have Been Increasing6
Betting against progress has been a losing proposition.
Thus, while we always ensure that our portfolio companies have the durability and strength to withstand unexpected shocks and crises, we also select those that have the ability to innovate, adapt and build wealth in an ever-changing and unpredictable world.
6 Source: https://www.gapminder.org/factfulness-book/32-improvements/
Not a part of Annual Report to Fund shareholders
CLIPPER FUNDSM | Shareholder Letter – (Continued) |
With more than $2 billion of our own money invested alongside clients, our interests are aligned, and our conviction is more than just words. This alignment is an uncommon advantage, given that 88% of all funds are overseen by managers who have less than $1 million invested alongside their clients.
Although our investment discipline may not be rewarded by the market over shorter periods, our proven active management approach has built wealth for our shareholders over many decades.
We value the trust you have placed in us and look forward to continuing our investment journey together.
Sincerely,
| |
| Christopher C. Davis | Danton G. Goei |
| President & Portfolio Manager | Portfolio Manager |
| | |
| February 4, 2022 | |
Not a part of Annual Report to Fund shareholders
CLIPPER FUNDSM | Shareholder Letter – (Continued) |
This report is authorized for use by existing shareholders. A current Clipper Fund prospectus must accompany or precede This report is authorized for use by existing shareholders. A current Clipper Fund prospectus must accompany or precede this material if it is distributed to prospective shareholders. You should carefully consider the Fund’s investment objective, risks, fees, and expenses before investing. Read the prospectus carefully before you invest or send money.
This report includes candid statements and observations regarding investment strategies, individual securities, and economic and market conditions; however, there is no guarantee that these statements, opinions or forecasts will prove to be correct. These comments may also include the expression of opinions that are speculative in nature and should not be relied on as statements of fact.
Davis Advisors is committed to communicating with our investment partners as candidly as possible because we believe our investors benefit from understanding our investment philosophy and approach. Our views and opinions include “forward-looking statements” which may or may not be accurate over the long term. Forward-looking statements can be identified by words like “believe,” “expect,” “anticipate,” or similar expressions. You should not place undue reliance on forward-looking statements, which are current as of the date of this report. We disclaim any obligation to update or alter any forward-looking statements, whether as a result of new information, future events, or otherwise. While we believe we have a reasonable basis for our appraisals and we have confidence in our opinions, actual results may differ materially from those we anticipate.
Objective and Risks. Clipper Fund’s investment objective is long-term capital growth and capital preservation. There can be no assurance that the Fund will achieve its objective. The Fund invests primarily in equity securities issued by large companies with market capitalizations of at least $10 billion. Some important risks of an investment in the Fund are: stock market risk: stock markets have periods of rising prices and periods of falling prices, including sharp declines; common stock risk: an adverse event may have a negative impact on a company and could result in a decline in the price of its common stock; financial services risk: investing a significant portion of assets in the financial services sector may cause the Fund to be more sensitive to systemic risk, regulatory actions, changes in interest rates, non-diversified loan portfolios, credit, and competition; focused portfolio risk: investing in a limited number of companies causes changes in the value of a single security to have a more significant effect on the value of the Fund’s total portfolio; foreign country risk: foreign companies may be subject to greater risk as foreign economies may not be as strong or diversified; As of 12/31/21, the Fund had approximately 12.7% of net assets invested in foreign companies; headline risk: the Fund may invest in a company when the company becomes the center of controversy. The company’s stock may never recover or may become worthless; large-capitalization companies risk: companies with $10 billion or more in market capitalization generally experience slower rates of growth in earnings per share than do mid- and small-capitalization companies; manager risk: poor security selection may cause the Fund to underperform relevant benchmarks; depositary receipts risk: depositary receipts may trade at a discount (or premium) to the underlying security and may be less liquid than the underlying securities listed on an exchange; fees and expenses risk: the Fund may not earn enough through income and capital appreciation to offset the operating expenses of the Fund; foreign currency risk: the change in value of a foreign currency against the U.S. dollar will result in a change in the U.S. dollar value of securities denominated in that foreign currency; and mid- and small-capitalization companies risk: companies with less than $10 billion in market capitalization typically have more limited product lines, markets and financial resources than larger companies, and may trade less frequently and in more limited volume. See the prospectus for a complete description of the principal risks.
The information provided in this material should not be considered a recommendation to buy, sell or hold any particular security. As of 12/31/21, the top ten holdings of Clipper Fund were: Alphabet*, 10.88%; Berkshire Hathaway, 8.98%; Wells Fargo, 7.82%; Capital One Financial, 7.50%; Bank of New York Mellon, 5.88%; Markel, 4.88%; U.S. Bancorp, 4.83%; Meta Platforms, 4.77%; Amazon.com, 4.58%; and Intel, 4.53%.
*Alphabet Inc. holding includes Class A and Class C.
Not a part of Annual Report to Fund shareholders
CLIPPER FUNDSM | Shareholder Letter – (Continued) |
Clipper Fund has adopted a Portfolio Holdings Disclosure policy that governs the release of non-public portfolio holding information. This policy is described in the prospectus. Holding percentages are subject to change. Visit clipperfund.com or call 800-432-2504 for the most current public portfolio holdings information.
Clipper Fund was managed from inception, 02/29/84, until 12/31/05 by another Adviser. Davis Selected Advisers, L.P. took over management of the Fund on 01/01/06.
Forward Price/Earnings (Forward P/E) Ratio is a stock’s current price divided by the company’s forecasted earnings for the following 12 months. The values for the portfolio and index are the weighted average of the p/e ratios of the stocks in the portfolio or index.
Five-Year EPS Growth Rate is the average annualized earning per share growth for a company over the past five years. The values for the portfolio and index are the weighted average of the five-year EPS Growth Rates of the stocks in the portfolio or index.
We gather our index data from a combination of reputable sources, including, but not limited to, Lipper, Wilshire, and index websites.
The S&P 500 Index is an unmanaged index of 500 selected common stocks, most of which are listed on the New York Stock Exchange. The index is adjusted for dividends, weighted towards stocks with large market capitalizations and represents approximately two-thirds of the total market value of all domestic common stocks. The S&P 500 Value Index represents the value companies of the S&P 500 Index. The S&P 500 Growth Index represents the growth companies of the S&P 500 Index. Investments cannot be made directly in an index.
After 04/30/22, this material must be accompanied by a supplement containing performance data for the most recent quarter end.
Shares of the Clipper Fund are not deposits or obligations of any bank, are not guaranteed by any bank, are not insured by the FDIC or any other agency, and involve investment risks, including possible loss of the principal amount invested.
12/21 Davis Distributors, LLC, 2949 East Elvira Road, Suite 101, Tucson, AZ 85756, 800‑432-2504, clipperfund.com
Not a part of Annual Report to Fund shareholders
CLIPPER FUNDSM | Management’s Discussion of Fund Performance |
Performance Overview
Clipper Fund underperformed the Standard & Poor’s 500® Index (“S&P 500®” or the “Index”) for the twelve-month period ended December 31, 2021 (the “period”). The Fund delivered a total return of 17.78%, versus a 28.71% return for the S&P 500®. The sectors1 within the Index that reported the strongest performance were Energy (up 55%), Real Estate (up 46%), and Information Technology (up 36%). The sectors within the Index that reported the weakest performance were Utilities (up 18%), Consumer Staples (up 19%), and Industrials (up 21%).
Detractors from Performance
The Fund’s Consumer Discretionary holdings were the most important detractor2 from performance both on an absolute basis and relative to the Index. The Fund’s holdings underperformed the S&P 500® sector (down 44%, versus up 24%). New Oriental Education & Technology3 (down 88%) was the largest detractor during the period. The Fund completely liquidated its position in New Oriental Education & Technology after the Chinese government placed new regulations on the company related to after-school tutoring and private educational services, one of which is mandating that it must now be registered as a non-profit organization. Alibaba (down 48%), Vroom (down 68%), Naspers (down 24%), and Prosus (down 23%) were also weaker performers from this sector. Vroom was a new holding during the period.
The Fund’s Industrials holdings were an important detractor from relative performance. The Fund’s holdings underperformed the Index sector (down 15%, versus up 21%) but a smaller average weighting (6%, versus 8% for the Index) in this lesser performing sector somewhat offset the impact from the weaker stock selection. The Fund held private equity shares of China ride hailing company Didi Chuxing. In June 2021, the company was renamed DiDi Global and shortly thereafter completed its initial public offering (“IPO”). DiDi Global was a top detractor from performance primarily due to its performance subsequent to the IPO. Including its pre-IPO performance, DiDi Global decreased 47% during the period.
Compared to the Index, the Fund’s performance was hindered by having a smaller weighting (6%, versus 27% for the Index) in the stronger performing Information Technology sector. The Fund also had no exposure in Energy and Real Estate, the two highest performing sectors of the S&P 500®, and relative performance suffered as a result.
Additional individual detractors from performance were Ping An Insurance (down 19%), Viatris (down 26%), and AIA Group (down 17%). Ping An Insurance was a new purchase during the period.
The Fund had an average weighting of 13% of net assets in foreign securities. The Fund’s foreign holdings significantly underperformed the U.S. holdings (down 50%, compared to up 36%).
Contributors to Performance
The Fund’s largest weighting was in Financials (average weight of 48%, compared to the Index sector’s 12%). These holdings were a significant contributor to both absolute and relative performance. The Fund’s holdings outperformed the Index sector (up 35%, versus up 31%). Of the top ten contributors during the period, six were from the Financials sector including Capital One Financial (up 49%), Wells Fargo (up 61%), Berkshire Hathaway (up 30%), Bank of New York Mellon (up 41%), American Express (up 37%), and JPMorgan Chase (up 28%). Berkshire Hathaway, Wells Fargo, Capital One Financial, and Bank of New York Mellon were all top five holdings at the end of the period, representing 8.98%, 7.82%, 7.50%, and 5.88% of net assets, respectively.
The Fund’s holdings in the Communication Services sector were also beneficial to performance on both an absolute and relative basis. The Fund’s Communication Services holdings outperformed the Index sector (up 51%, versus up 22%). Alphabet (up 65%), the parent company of Google, was the largest Fund holding at the end of the period, representing 10.88% of net assets. Meta Platforms (up 23%), formerly known as Facebook, was also a strong performer.
The Fund’s Information Technology position was a key performer. The Fund’s holdings outperformed the Index sector (up 45%, versus up 36%). Applied Materials (up 84%) was a top contributor to performance during the period.
Clipper Fund’s investment objective is to seek long-term capital growth and capital preservation. There can be no assurance that the Fund will achieve its objective. Clipper Fund’s principal risks are: stock market risk, common stock risk, financial services risk, focused portfolio risk, foreign country risk, headline risk, large-capitalization companies risk, manager risk, depositary receipts risk, fees and expenses risk, foreign currency risk, and mid- and small-capitalization companies risk. See the prospectus for a full description of each risk.
Clipper Fund focuses its investments in fewer companies, and it may be subject to greater risks than a more diversified fund that is not allowed to focus its investments in a few companies. The Fund’s investment performance, both positive and negative, is expected to reflect the economic performance of its more focused portfolio.
Past performance does not guarantee future results, Fund prices fluctuate, and the value of an investment may be worth more or less than the purchase price. Data provided in this performance overview is for the twelve-month period ended December 31, 2021, unless otherwise noted. Return figures for underlying Fund positions reflect the return of the security from the beginning of the period or the date of first purchase if subsequent thereto through the end of the period or the date the position is completely liquidated. The actual contribution to the Fund will vary based on a number of factors (e.g., trading activity, weighting). Portfolio holding information is as of the end of the twelve-month period, December 31, 2021, unless otherwise noted.
1 | The companies included in the Standard & Poor’s 500® Index are divided into eleven sectors. One or more industry groups make up a sector. For purposes of measuring concentration, the Fund generally classifies companies at the industry group or industry level. See the SAI for additional information regarding the Fund’s concentration policy. |
2 | A company’s or sector’s contribution to or detraction from the Fund’s performance is a product both of its appreciation or depreciation and its weighting within the Fund. For example, a 5% holding that rises 20% has twice as much impact as a 1% holding that rises 50%. |
3 | This Management Discussion of Fund Performance discusses a number of individual companies. The information provided in this report does not provide information reasonably sufficient upon which to base an investment decision and should not be considered a recommendation to purchase, sell, or hold any particular security. The Schedule of Investments lists the Fund’s holdings of each company discussed. |
CLIPPER FUNDSM | Management’s Discussion of Fund Performance – (Continued) |
Comparison of a $10,000 investment in Clipper Fund versus the Standard & Poor’s 500® Index
over 10 years for an investment made on December 31, 2011
Average Annual Total Return for periods ended December 31, 2021
Fund & Benchmark Index | 1-Year | 5-Year | 10-Year | Since Fund’s Inception (02/29/84) | Gross Expense Ratio | Net Expense Ratio |
| Clipper Fund | 17.78% | 11.46% | 13.14% | 11.66% | 0.71% | 0.71% |
Standard & Poor’s 500® Index | 28.71% | 18.46% | 16.54% | 12.03% | | |
The Standard & Poor’s 500® Index is an unmanaged index of 500 selected common stocks, most of which are listed on the New York Stock Exchange. The Index is adjusted for dividends, weighted towards stocks with large market capitalizations, and represents approximately two-thirds of the total market value of all domestic common stocks. Investments cannot be made directly in the Index.
The performance data quoted in this report represents past performance, assumes that all distributions were reinvested, and is not a guarantee of future results. The investment return and principal value will fluctuate so that shares may be worth more or less than their original cost when redeemed. Current performance may be higher or lower than performance data quoted. Returns shown do not reflect the deduction of taxes that a shareholder would pay on fund distributions or the redemption of fund shares. The operating expense ratio may vary in future years. For most recent month-end performance information, please call Clipper Fund Investor Services at 1-800-432-2504 or visit the Fund’s website at www.clipperfund.com.
Davis Selected Advisers, L.P. began serving as investment adviser to Clipper Fund on January 1, 2006. A different investment adviser managed the Fund through December 31, 2005.
CLIPPER FUNDSM | |
| | December 31, 2021 |
| Portfolio Composition | | Industry Weightings |
| (% of Fund’s 12/31/21 Net Assets) | | (% of 12/31/21 Stock Holdings) |
| | | | | | | |
| | | | | Fund | | S&P 500® |
| Common Stock (U.S.) | 85.65% | | Diversified Financials | 24.77% | | 4.89% |
Common Stock (Foreign) | 12.68% | | Banks | 20.76% | | 3.96% |
Short-Term Investments | 1.70% | | Media & Entertainment | 15.95% | | 8.99% |
Other Assets & Liabilities | (0.03)% | | Retailing | 9.39% | | 6.82% |
| | 100.00% | | Health Care | 8.83% | | 13.29% |
| | | | Information Technology | 8.68% | | 29.17% |
| | | | Insurance | 8.32% | | 1.83% |
| | | | Materials | 1.35% | | 2.56% |
| | | | Transportation | 1.05% | | 1.75% |
| | | | Capital Goods | 0.90% | | 5.16% |
| | | | Food, Beverage & Tobacco | – | | 2.87% |
| | | | Real Estate | – | | 2.77% |
| | | | Automobiles & Components | – | | 2.68% |
| | | | Energy | – | | 2.67% |
| | | | Other | – | | 10.59% |
| | | | | 100.00% | | 100.00% |
| Top 10 Long-Term Holdings |
| (% of Fund’s 12/31/21 Net Assets) |
| | | | | | |
Alphabet Inc.* | | | Media & Entertainment | | 10.88% |
Berkshire Hathaway Inc., Class A | | | Diversified Financial Services | | 8.98% |
Wells Fargo & Co. | | | Banks | | 7.82% |
Capital One Financial Corp. | | | Consumer Finance | | 7.50% |
Bank of New York Mellon Corp. | | | Capital Markets | | 5.88% |
Markel Corp. | | | Property & Casualty Insurance | | 4.88% |
U.S. Bancorp | | | Banks | | 4.83% |
Meta Platforms, Inc., Class A | | | Media & Entertainment | | 4.77% |
Amazon.com, Inc. | | | Retailing | | 4.58% |
Intel Corp. | | | Semiconductors & Semiconductor Equipment | | 4.53% |
| |
| |
*Alphabet Inc. holding includes Class A and Class C. |
CLIPPER FUNDSM | Fund Overview – (Continued) |
| | December 31, 2021 |
New Positions Added (01/01/21-12/31/21)
(Highlighted positions are those greater than 2.00% of the Fund’s 12/31/21 net assets)
| Security | Industry | Date of 1st Purchase | % of Fund’s 12/31/21 Net Assets |
DBS Group Holdings Ltd. | Banks | 10/28/21 | 2.65% |
JD.com, Inc., Class A, ADR | Retailing | 08/20/21 | 1.45% |
Ping An Insurance (Group) Co. | | | |
of China, Ltd. - H | Life & Health Insurance | 07/14/21 | 2.11% |
Teck Resources Ltd., Class B | Materials | 09/24/21 | 1.33% |
Vroom, Inc. | Retailing | 03/10/21 | 0.29% |
Positions Closed (01/01/21-12/31/21)
(Gains and losses greater than $25,000,000 are highlighted)
| Security | Industry | Date of Final Sale | Realized Gain (Loss) |
Ferguson PLC | Capital Goods | 11/17/21 | $ | 4,313,140 |
New Oriental Education & Technology | | | | |
Group, Inc., ADR | Consumer Services | 07/29/21 | | (28,969,283) |
Raytheon Technologies Corp. | Capital Goods | 11/16/21 | | 16,799,825 |
As a shareholder of the Fund, you incur ongoing costs only, including advisory and administrative fees and other Fund expenses. The Expense Example is intended to help you understand your ongoing costs (in dollars) of investing in the Fund and to compare these costs with the ongoing costs of investing in other mutual funds. The Expense Example is based on an investment of $1,000 invested at the beginning of the period and held for the entire period indicated which is for the six-month period ended December 31, 2021.
Actual Expenses
The information represented in the row entitled “Actual” provides information about actual account values and actual expenses. You may use the information in this row, together with the amount you invested, to estimate the expenses that you paid over the period. Simply divide your account value by $1,000 (for example, an $8,600 account value divided by $1,000 = 8.6), then multiply the result by the number under the heading “Expenses Paid During Period” to estimate the expenses you paid on your account during this period. An annual maintenance fee of $10, charged on retirement plan accounts per Social Security Number, is not included in the Expense Example. If this fee was included, the estimate of expenses you paid during the period would be higher, and your ending account value would be lower, by this amount.
Hypothetical Example for Comparison Purposes
The information represented in the row entitled “Hypothetical” provides information about hypothetical account values and hypothetical expenses based on the Fund’s actual expense ratio and an assumed rate of return of 5% per year before expenses, which is not the Fund’s actual return. The hypothetical account values and expenses may not be used to estimate the actual ending account balance or expenses you paid for the period. You may use this information to compare the ongoing costs of investing in the Fund and other funds. To do so, compare this 5% hypothetical example with the 5% hypothetical examples that appear in the shareholder reports of the other funds. An annual maintenance fee of $10, charged on retirement plan accounts per Social Security Number, is not included in the Expense Example. If this fee was included, the estimate of expenses you paid during the period would be higher, and your ending account value would be lower, by this amount.
Please note that the expenses shown in the table are meant to highlight your ongoing costs only. Therefore, the information in the row entitled “Hypothetical” is useful in comparing ongoing costs only, and will not help you determine the relative total costs of owning different funds.
| | Beginning Account Value (07/01/21) | | Ending Account Value (12/31/21) | | Expenses Paid During Period* (07/01/21-12/31/21) |
Actual | $1,000.00 | | $978.95 | | $3.59 |
| Hypothetical | $1,000.00 | | $1,021.58 | | $3.67 |
Hypothetical assumes 5% annual return before expenses.
* Expenses are equal to the Fund’s annualized operating expense ratio (0.72%)**, multiplied by the average account value over the period, multiplied by 184/365 (to reflect the one-half year period).
** The expense ratio reflects the impact, if any, of certain reimbursements from the Adviser.
CLIPPER FUNDSM | |
| | December 31, 2021 |
| | Shares/Units
| | Value
(Note 1)
|
| COMMON STOCK – (98.33%) |
| | COMMUNICATION SERVICES – (15.68%) |
| | | Media & Entertainment – (15.68%) |
| | | | | | | | | | |
| | | | | | | | |
| | | | | | | | |
| | Meta Platforms, Inc., Class A * | | | | | | |
| | | | | | Total Communication Services | | | |
| | CONSUMER DISCRETIONARY – (9.24%) |
| | Retailing – (9.24%) |
| | Alibaba Group Holding Ltd., ADR (China)* | | | | | | |
| | | | | | | | |
| | JD.com, Inc., Class A, ADR (China)* | | | | | | |
| | Naspers Ltd. - N (South Africa) | | | | | | |
| | Prosus N.V., Class N (Netherlands) | | | | | | |
| | | | | | | | |
| | Total Consumer Discretionary | | | |
| | FINANCIALS – (52.95%) |
| | Banks – (20.41%) |
| | | | | | | | |
| | DBS Group Holdings Ltd. (Singapore) | | | | | | |
| | | | | | | | |
| | | | | | | | |
| | | | | | | | |
| | | | 242,728,836 |
| | Diversified Financials – (24.36%) |
| | Capital Markets – (5.88%) |
| | Bank of New York Mellon Corp. | | | | | | |
| | Consumer Finance – (9.50%) |
| | | | | | | | |
| | Capital One Financial Corp. | | | | | | |
| | | 112,961,541 |
| | Diversified Financial Services – (8.98%) |
| | Berkshire Hathaway Inc., Class A * | | | | | | |
| | | | 289,647,561 |
| | Insurance – (8.18%) |
| | Life & Health Insurance – (3.30%) |
| | AIA Group Ltd. (Hong Kong) | | | | | | |
| | Ping An Insurance (Group) Co. of China, Ltd. - H (China) | | | | | | |
| | | | 39,224,518 |
| | Property & Casualty Insurance – (4.88%) |
| | | | | | | | |
| | | | 97,280,516 |
| | | | | |
| | HEALTH CARE – (8.68%) |
| | Health Care Equipment & Services – (5.70%) |
| | | | | | | | |
| | | | | | | | |
| | | | 67,792,049 |
CLIPPER FUNDSM | Schedule of Investments – (Continued) |
| | December 31, 2021 |
| | Shares/Principal
| | Value
(Note 1)
|
| COMMON STOCK – (CONTINUED) |
| | HEALTH CARE – (CONTINUED) |
| | | Pharmaceuticals, Biotechnology & Life Sciences – (2.98%) |
| | | | | | | | | | |
| | | | | | | | | |
| | INDUSTRIALS – (1.92%) |
| | Capital Goods – (0.89%) |
| | | | | | | | |
| | Transportation – (1.03%) |
| | DiDi Global Inc., Class A, ADS (China)* | | | | | | |
| | | | | |
| | INFORMATION TECHNOLOGY – (8.53%) |
| | Semiconductors & Semiconductor Equipment – (8.53%) |
| | | | | | | | |
| | | | | | | | |
| | Total Information Technology | | | |
| | MATERIALS – (1.33%) |
| | Teck Resources Ltd., Class B (Canada) | | | | | | |
| | | | | |
| | TOTAL COMMON STOCK – (Identified cost $666,359,207)
| | | |
| SHORT-TERM INVESTMENTS – (1.70%) |
| | StoneX Financial Inc. Joint Repurchase Agreement, 0.04%, 01/03/22, dated 12/31/21, repurchase value of $10,575,035 (collateralized by: U.S. Government agency mortgages and obligations in a pooled cash account, 0.50%-9.50%, 04/01/22-01/15/59, total market value $10,786,500) | | | | | | |
| | Truist Securities, Inc. Joint Repurchase Agreement, 0.05%, 01/03/22, dated 12/31/21, repurchase value of $9,627,040 (collateralized by: U.S. Government agency mortgages and obligation in a pooled cash account, 1.29%-3.00%, 01/28/30-01/01/52, total market value $9,819,540) | | | | | | |
| | TOTAL SHORT-TERM INVESTMENTS – (Identified cost $20,202,000)
| | | |
| | Total Investments – (100.03%) – (Identified cost $686,561,207) | | | 1,189,424,310 |
| | Liabilities Less Other Assets – (0.03%) | | | (302,572) |
| | Net Assets – (100.00%) | | $ | 1,189,121,738 |
| |
| | ADR: American Depositary Receipt |
| |
| | ADS: American Depositary Share |
| |
| | * | Non-income producing security. |
| |
| | (a) | Restricted Security – See Note 6 of the Notes to Financial Statements. |
| |
| | (b) | The value of this security was determined using significant unobservable inputs. See Note 1 of the Notes to Financial Statements. |
| |
| See Notes to Financial Statements |
CLIPPER FUNDSM | Statement of Assets and Liabilities |
| | At December 31, 2021 |
| ASSETS: | | | | | |
Investments in securities, at value* (see accompanying Schedule of Investments) | | $ | 1,189,424,310 |
Cash | | | 20,881 |
| Receivables: | | | |
| | | Capital stock sold | | | 383,540 |
| | Dividends and interest | | | 499,016 |
Prepaid expenses | | | 30,695 |
| | Total assets | | | 1,190,358,442 |
LIABILITIES: | | | |
| Payables: | | | |
| | Capital stock redeemed | | | 115,983 |
Accrued custodian fees | | | 337,600 |
Accrued investment advisory fees | | | 570,780 |
Accrued transfer agent fees | | | 143,638 |
Other accrued expenses | | | 68,703 |
| | | Total liabilities | | | 1,236,704 |
NET ASSETS | | $ | 1,189,121,738 |
SHARES OUTSTANDING | | | 8,718,966 |
NET ASSET VALUE, offering, and redemption price per share (Net assets ÷ Shares outstanding) | | $ | 136.38 |
NET ASSETS CONSIST OF: | | | |
Paid in capital | | $ | 660,402,494 |
Distributable earnings | | | 528,719,244 |
| | Net Assets | | $ | 1,189,121,738 |
| | | | | |
| *Including: | | | |
| | Cost of investments | | $ | 686,561,207 |
| See Notes to Financial Statements |
CLIPPER FUNDSM | |
| | For the year ended December 31, 2021 |
| INVESTMENT INCOME: | | | | | | |
| Income: | | | |
Dividends* | | $ | 12,623,833 |
Interest | | | 20,120 |
| | | Total income | | | | 12,643,953 |
Expenses: | | | |
Investment advisory fees (Note 3) | | $ | 6,694,094 | | | |
Custodian fees | | | 375,794 | | | |
Transfer agent fees | | | 1,108,697 | | | |
Audit fees | | | 50,736 | | | |
Legal fees | | | 20,285 | | | |
Reports to shareholders | | | 36,003 | | | |
Trustees’ fees and expenses | | | 240,359 | | | |
Registration and filing fees | | | 43,649 | | | |
Miscellaneous | | | 64,999 | | | |
| | Total expenses | | | | 8,634,616 |
| Net investment income | | | 4,009,337 |
REALIZED AND UNREALIZED GAIN (LOSS) ON INVESTMENTS AND FOREIGN CURRENCY TRANSACTIONS: | | | | | | |
| Net realized gain (loss) from: | | | |
| | | Investment transactions | | | 174,274,020 |
| | Foreign currency transactions | | | (19,186) |
| Net realized gain | | | 174,254,834 |
Net increase in unrealized appreciation | | | 13,380,351 |
| | Net realized and unrealized gain on investments and foreign currency transactions | | | | 187,635,185 |
| Net increase in net assets resulting from operations | | $ | 191,644,522 |
| | | | | | | | | |
*Net of foreign taxes withheld of | | $ | 51,939 |
| See Notes to Financial Statements |
CLIPPER FUNDSM | Statements of Changes in Net Assets |
| | | Year ended December 31, |
| | | 2021 | | 2020 |
OPERATIONS: | | | | | | |
Net investment income | | $ | 4,009,337 | | $ | 4,463,117 |
Net realized gain from investments and foreign currency transactions | | | 174,254,834 | | | 32,180,692 |
Net increase in unrealized appreciation on investments and foreign currency transactions | | | 13,380,351 | | | 48,073,903 |
| | Net increase in net assets resulting from operations | | | 191,644,522 | | | 84,717,712 |
DIVIDENDS AND DISTRIBUTIONS TO SHAREHOLDERS: | | | (151,299,101) | | | (26,382,562) |
CAPITAL SHARE TRANSACTIONS: | | | | | | |
Net increase (decrease) in net assets resulting from capital share transactions (Note 4) | | | 55,361,323 | | | (87,866,360) |
| |
Total increase (decrease) in net assets | | | 95,706,744 | | | (29,531,210) |
NET ASSETS: | | | | | | |
Beginning of year | | | 1,093,414,994 | | | 1,122,946,204 |
| End of year | | $ | 1,189,121,738 | | $ | 1,093,414,994 |
| See Notes to Financial Statements |
CLIPPER FUNDSM | Notes to Financial Statements |
| | December 31, 2021 |
NOTE 1 - SUMMARY OF SIGNIFICANT ACCOUNTING POLICIES
Clipper Funds Trust, a Delaware statutory trust (“Trust”), on behalf of Clipper Fund (“Fund”), a series of the Trust, is registered under the Investment Company Act of 1940, as amended, as a non-diversified, open-end management investment company. The Fund follows the reporting guidance of the Financial Accounting Standards Board (“FASB”) Accounting Standards Codification Topic 946, Financial Services – Investment Companies. The Fund’s investment objective is long-term capital growth and capital preservation. Davis Selected Advisers, L.P. (“Davis Advisors” or “Adviser”), the Fund’s investment adviser, seeks to invest the Fund’s assets primarily in common stocks of large companies (generally, companies with market capitalizations of $10 billion or more at the time of initial purchase) that are trading at prices below the Adviser’s estimate of their intrinsic values. The COVID-19 pandemic has caused market disruptions on a global scale and the long-term impact is uncertain. The aforementioned disruptions may adversely affect the value and liquidity of the Fund’s investments and thus Fund performance. The following is a summary of significant accounting policies followed by the Fund in the preparation of its financial statements.
Security Valuation - The Fund calculates the net asset value of its shares as of the close of the New York Stock Exchange (“Exchange”), normally 4:00 P.M. Eastern time, on each day the Exchange is open for business. Securities listed on the Exchange (and other national exchanges including NASDAQ) are valued at the last reported sales price on the day of valuation. Listed securities for which no sale was reported on that date are valued at the last quoted bid price. Securities traded on foreign exchanges are valued based upon the last sales price on the principal exchange on which the security is traded prior to the time when the Fund’s assets are valued. Securities (including restricted securities) for which market quotations are not readily available or securities whose values have been materially affected by what the Adviser identifies as a significant event occurring before the Fund’s assets are valued but after the close of their respective exchanges will be fair valued using a fair valuation methodology applicable to the security type or the significant event as previously approved by the Fund’s Pricing Committee and Board of Trustees. The Pricing Committee considers all facts it deems relevant that are reasonably available, through either public information or information available to the Adviser’s portfolio management team, when determining the fair value of a security. To assess the appropriateness of security valuations, the Adviser may consider (i) comparing prior day prices and/or prices of comparable securities; (ii) comparing sale prices to the prior or current day prices and challenge those prices exceeding certain tolerance levels with the third-party pricing service or broker source; (iii) new rounds of financing; (iv) the performance of the market or the issuer’s industry; (v) the liquidity of the security; (vi) the size of the holding in a fund; and/or (vii) any other appropriate information. The determination of a security’s fair value price often involves the consideration of a number of subjective factors and is therefore subject to the unavoidable risk that the value assigned to a security may be higher or lower than the security’s value would be if a reliable market quotation for the security was readily available. Fair value determinations are subject to review, approval, and ratification by the Fund’s Board of Trustees at its next regularly scheduled meeting covering the calendar quarter in which the fair valuation was determined. Fair valuation methods used by the Fund may include, but are not limited to, valuing securities initially at cost (excluding commissions) and subsequently adjusting the value due to: additional transactions by the issuer, changes in company specific fundamentals, and changes in the value of similar securities. Values may be further adjusted for any discounts related to security-specific resale restrictions.
Short-term investments purchased within 60 days to maturity are valued at amortized cost, which approximates market value.
The Fund’s valuation procedures are reviewed and subject to approval by the Board of Trustees. There have been no significant changes to the fair valuation procedures during the period.
Fair Value Measurements - Fair value is defined as the price that the Fund would receive upon selling an investment in an orderly transaction to an independent buyer in the principal market for the investment. Various inputs are used to determine the fair value of the Fund’s investments. These inputs are summarized in the three broad levels listed below.
Level 1 –
| quoted prices in active markets for identical securities |
Level 2 –
| other significant observable inputs (including quoted prices for similar investments, interest rates, prepayment speeds, credit risk, etc.) |
Level 3 –
| significant unobservable inputs (including the Fund’s own assumptions in determining the fair value of investments) |
The inputs or methodologies used for valuing securities are not necessarily an indication of the risks associated with investing in those securities nor can it be assured that the Fund can obtain the fair value assigned to a security if it were to sell the security.
CLIPPER FUNDSM | Notes to Financial Statements – (Continued) |
| | December 31, 2021 |
NOTE 1 - SUMMARY OF SIGNIFICANT ACCOUNTING POLICIES – (CONTINUED)
Fair Value Measurements - (Continued)
The following is a summary of the inputs used as of December 31, 2021 in valuing the Fund’s investments carried at value:
| | Investments in Securities at Value |
| | Valuation Inputs |
| | | | Level 2: | | Level 3: | | |
| | | | Other Significant | | Significant | | |
| | Level 1: | | Observable | | Unobservable | | |
| | Quoted Prices | | Inputs | | Inputs | | Total |
Common Stock: | | | | | | | | | | | |
| Communication Services | $ | 186,040,362 | | $ | – | | $ | 413,871 | | $ | 186,454,233 |
| Consumer Discretionary | | 109,799,130 | | | – | | | – | | | 109,799,130 |
| Financials | | 629,656,913 | | | – | | | – | | | 629,656,913 |
| Health Care | | 103,228,201 | | | – | | | – | | | 103,228,201 |
| Industrials | | 22,778,723 | | | – | | | – | | | 22,778,723 |
| Information Technology | | 101,475,149 | | | – | | | – | | | 101,475,149 |
| Materials | | 15,829,961 | | | – | | | – | | | 15,829,961 |
| Short-Term Investments | | – | | | 20,202,000 | | | – | | | 20,202,000 |
| Total Investments | $ | 1,168,808,439 | | $ | 20,202,000 | | $ | 413,871 | | $ | 1,189,424,310 |
The following table reconciles the valuation of assets in which significant unobservable inputs (Level 3) were used in determining fair value during the year ended December 31, 2021. The net change in unrealized appreciation (depreciation) during the period on Level 3 securities still held at December 31, 2021 was $(3,014)*. The cost of purchases or proceeds from sales may include securities received or delivered through corporate actions or exchanges. Realized and unrealized gains (losses) are included in the related amounts on investments in the Statement of Operations.
| | | Beginning Balance at January 1, 2021 | | Cost of Purchases | | Proceeds from Sales | | Net Change in Unrealized Appreciation (Depreciation)* | | Net Realized Gain (Loss) | | Transfers into Level 3 | | Transfers out of Level 3** | | | Ending Balance at December 31, 2021 |
| Investments in Securities: | | | | | | | | | | | | | | | | | | | | | | | | |
| Common Stock | | $ | 416,885 | | $ | – | | $ | – | | $ | (3,014) | | $ | – | | $ | – | | $ | – | | $ | 413,871 |
| Preferred Stock | | | 23,205,398 | | | – | | | – | | | 8,728,975 | | | – | | | – | | | (31,934,373) | | | – |
| Total Level 3 | | $ | 23,622,283 | | $ | – | | $ | – | | $ | 8,725,961 | | $ | – | | $ | – | | $ | (31,934,373) | | $ | 413,871 |
* Any difference between net change in unrealized appreciation (depreciation) and net change in unrealized appreciation (depreciation) on securities still held at December 31, 2021, may be due to investments no longer held or categorized as Level 3 at period end.
** During the year ended December 31, 2021, certain securities fair valued at $31,934,373 transferred out of Level 3 because observable market data became available for the securities.
The following table is a summary of those assets in which significant unobservable inputs (Level 3) were used by the Adviser in determining fair value. Note that these amounts exclude any valuations provided by a pricing service or broker.
| | | Fair Value at | | Valuation | | Unobservable | | Amount | | Impact to Valuation from |
| | | December 31, 2021 | | Technique | | Input | | | | an Increase in Input |
| Investments in Securities: | | | | | | | | | | | |
| Common Stock | | $ | 413,871 | | Discounted Cash Flow | | Annualized Yield | | 1.726% | | Decrease |
| Total Level 3 | | $ | 413,871 | | | | | | | | |
The significant unobservable input listed in the above table is used in the fair value measurement of common stock, and if changed, would affect the fair value of the Fund’s investments. The “Impact to Valuation from an Increase in Input” represents the change in fair value measurement resulting from an increase in the corresponding input. A decrease in the input would have the opposite effect.
CLIPPER FUNDSM | Notes to Financial Statements – (Continued) |
| | December 31, 2021 |
NOTE 1 - SUMMARY OF SIGNIFICANT ACCOUNTING POLICIES – (CONTINUED)
Master Repurchase Agreements - The Fund, along with other affiliated funds, may transfer uninvested cash balances into one or more master repurchase agreement accounts. These balances are invested in one or more repurchase agreements, secured by U.S. Government securities. A custodian bank holds securities pledged as collateral for repurchase agreements until the agreements mature. Each agreement requires that the market value of the collateral be sufficient to cover payments of interest and principal; however, in the event of default by the other party to the agreement, retention of the collateral may be subject to legal proceedings.
Currency Translation - The market values of all assets and liabilities denominated in foreign currencies are recorded in the financial statements after translation to the U.S. Dollar on the date of valuation using exchange rates determined as of the close of trading on the Exchange. The cost basis of such assets and liabilities is determined based upon historical exchange rates. Income and expenses are translated at average exchange rates in effect as accrued or incurred.
Foreign Currency - The Fund may enter into forward purchases or sales of foreign currencies to hedge certain foreign currency denominated assets and liabilities against declines in market value relative to the U.S. Dollar. Forward currency contracts are marked-to-market daily and the change in market value is recorded by the Fund as an unrealized gain or loss. When the forward currency contract is closed, the Fund records a realized gain or loss equal to the difference between the value of the forward currency contract at the time it was opened and value at the time it was closed. Investments in forward currency contracts may expose the Fund to risks resulting from unanticipated movements in foreign currency exchange rates or failure of the counter-party to the agreement to perform in accordance with the terms of the contract. There were no forward contracts entered into by the Fund.
Reported net realized foreign exchange gains or losses arise from the sales of foreign currencies, currency gains or losses realized between the trade and settlement dates on security transactions, the difference between the amounts of dividends, interest, and foreign withholding taxes recorded on the Fund’s books, and the U.S. Dollar equivalent of the amounts actually received or paid. Net unrealized foreign exchange gains or losses arise from changes in the value of assets and liabilities, other than investments in securities at fiscal period end, resulting from changes in the exchange rate. The Fund includes foreign currency gains and losses realized on the sales of investments together with market gains and losses on such investments in the Statement of Operations.
Federal Income Taxes - It is the Fund’s policy to comply with the requirements of the Internal Revenue Code applicable to regulated investment companies, and to distribute substantially all of its taxable income, including any net realized gains on investments not offset by loss carryovers, to shareholders. Therefore, no provision for federal income or excise tax is required. The Adviser analyzed the Fund’s tax positions taken on federal and state income tax returns for all open tax years and concluded that as of December 31, 2021, no provision for income tax is required in the Fund’s financial statements related to these tax positions. The Fund’s federal and state (Arizona) income and federal excise tax returns for tax years for which the applicable statutes of limitations have not expired are subject to examination by the Internal Revenue Service and state Department of Revenue. The earliest tax year that remains subject to examination by these jurisdictions is 2018.
At December 31, 2021, the aggregate cost of investments and unrealized appreciation (depreciation) for federal income tax purposes were as follows:
Cost | | $ | 691,802,104 |
Unrealized appreciation | | | 537,679,147 |
Unrealized depreciation | | | (40,056,941) |
| Net unrealized appreciation | | $ | 497,622,206 |
Securities Transactions and Related Investment Income - Securities transactions are accounted for on the trade date (date the order to buy or sell is executed) with realized gain or loss on the sale of securities being determined based upon identified cost. Dividend income is recorded on the ex-dividend date. Interest income, which includes accretion of discount and amortization of premium, is accrued as earned.
CLIPPER FUNDSM | Notes to Financial Statements – (Continued) |
| | December 31, 2021 |
NOTE 1 - SUMMARY OF SIGNIFICANT ACCOUNTING POLICIES – (CONTINUED)
Dividends and Distributions to Shareholders - Dividends and distributions to shareholders are recorded on the ex-dividend date. Net investment income (loss), net realized gains (losses), and net unrealized appreciation (depreciation) on investments [collectively “Distributable earnings (losses)”] may differ for financial statement and tax purposes primarily due to permanent and temporary differences which may include wash sales, foreign currency transactions, Trustee deferred compensation, corporate actions, equalization, passive foreign investment company shares, and partnership income. The character of dividends and distributions made during the fiscal year from net investment income and net realized securities gains may differ from their ultimate characterization for federal income tax purposes. Also, due to the timing of dividends and distributions, the fiscal year in which amounts are distributed may differ from the fiscal year in which income or realized gain was recorded by the Fund. The Fund adjusts certain components of capital to reflect permanent differences between financial statement amounts and net income and realized gains/losses determined in accordance with income tax rules. The Fund’s net assets have not been affected by these reclassifications. During the year ended December 31, 2021, amounts have been reclassified to reflect increases (decreases) as follows:
| Distributable earnings | $ | (4,521,229) |
| Paid in capital | | 4,521,229 |
The tax character of distributions paid during the years ended December 31, 2021 and 2020 was as follows:
| | 2021 | | 2020 |
| Ordinary income | $ | 4,366,083 | | $ | 8,750,099 |
| Long-term capital gain | | 146,933,018 | | | 17,632,463 |
| Total | $ | 151,299,101 | | $ | 26,382,562 |
As of December 31, 2021, the components of distributable earnings on a tax basis were as follows:
Undistributed ordinary income | $ | 1,430,095 |
| Undistributed long-term capital gain | | 29,881,821 |
Net unrealized appreciation on investments and foreign currency transactions | | 497,622,206 |
Other temporary differences | | (214,878) |
| Total | $ | 528,719,244 |
Indemnification - Under the Fund’s organizational documents, its officers and trustees are indemnified against certain liabilities arising out of the performance of their duties to the Fund. In addition, some of the Fund’s contracts with its service providers contain general indemnification clauses. The Fund’s maximum exposure under these arrangements is unknown since the amount of any future claims that may be made against the Fund cannot be determined and the Fund has no historical basis for predicting the likelihood of any such claims.
Use of Estimates in Financial Statements - In preparing financial statements in conformity with accounting principles generally accepted in the United States of America, management makes estimates and assumptions that affect the reported amounts of assets and liabilities and disclosure of contingent assets and liabilities at the date of the financial statements, as well as the reported amounts of income and expenses during the reporting period. Actual results may differ from these estimates.
Trustees Fees and Expenses - The Fund set up a Rabbi Trust to provide for the deferred compensation plan for Independent Trustees that enables them to elect to defer receipt of all or a portion of annual fees they are entitled to receive. The value of an eligible Trustees’ account is based upon years of service and fees paid to each Trustee during the years of service. The amount paid to the Trustee by the Trust under the plan will be determined based upon the performance of the Funds in which the amounts are invested.
CLIPPER FUNDSM | Notes to Financial Statements – (Continued) |
| | December 31, 2021 |
NOTE 2 - PURCHASES AND SALES OF SECURITIES
The cost of purchases and proceeds from sales of investment securities (excluding short-term investments) during the year ended December 31, 2021 were $286,433,672 and $394,267,643, respectively.
NOTE 3 - FEES AND OTHER TRANSACTIONS WITH SERVICE PROVIDERS (INCLUDING AFFILIATES)
Davis Selected Advisers-NY, Inc. (“DSA-NY”), a wholly-owned subsidiary of the Adviser, acts as sub-adviser to the Fund. DSA-NY performs research and portfolio management services for the Fund under a Sub-Advisory Agreement with the Adviser. The Fund pays no fees directly to DSA-NY.
All officers of the Fund (including Interested Trustees) hold positions as executive officers with the Adviser or its affiliates.
Investment Advisory Fees - Advisory fees are paid monthly to the Adviser. The annual rate is 0.55% of the average net assets for the first $3 billion, 0.54% on the next $1 billion, 0.53% on the next $1 billion, 0.52% on the next $1 billion, 0.51% on the next $1 billion, 0.50% on the next $3 billion, and 0.485% of the average net assets greater than $10 billion. Advisory fees paid during the year ended December 31, 2021 approximated 0.55% of average net assets.
Transfer Agent and Accounting Fees - DST Asset Manager Solutions, Inc. is the Fund’s primary transfer agent. The Adviser is also paid for certain transfer agent services. The fee paid to the Adviser for these services during the year ended December 31, 2021 amounted to $75,585. State Street Bank and Trust Company (“State Street Bank”) is the Fund’s primary accounting provider. Fees for such services are included in the custodian fees as State Street Bank also serves as the Fund’s custodian.
NOTE 4 - CAPITAL STOCK
At December 31, 2021, there were unlimited shares of capital stock (no par value) authorized. Transactions in capital stock were as follows:
| | Year ended December 31, 2021 |
| | | Sold | | | Reinvestment of Distributions | | | Redeemed | | | Net Increase |
| | | | | | | | | | | | |
| Shares | | 183,380 | | | 1,040,631 | | | (808,023) | | | 415,988 |
| Value | $ | 27,148,017 | | $ | 146,252,476 | | $ | (118,039,170) | | $ | 55,361,323 |
| | | | | | | | | | | | |
| |
| | Year ended December 31, 2020 |
| | | Sold | | | Reinvestment of Distributions | | | Redeemed | | | Net Decrease |
| | | | | | | | | | | | |
| Shares | | 380,073 | | | 194,647 | | | (1,419,985) | | | (845,265) |
| Value | $ | 40,415,448 | | $ | 25,241,807 | | $ | (153,523,615) | | $ | (87,866,360) |
| | | | | | | | | | | | |
NOTE 5 - SECURITIES LOANED
The Fund has entered into a securities lending arrangement with State Street Bank. Under the terms of the agreement, the Fund receives fee income from lending transactions; in exchange for such fees, State Street Bank is authorized to loan securities on behalf of the Fund, against receipt of collateral at least equal to the value of the securities loaned. As of December 31, 2021, the Fund did not have any securities on loan. The Fund bears the risk of any deficiency in the amount of the collateral available for return to a borrower due to a loss in an approved investment.
CLIPPER FUNDSM | Notes to Financial Statements – (Continued) |
| | December 31, 2021 |
NOTE 6 - RESTRICTED SECURITIES
Restricted securities are not registered under the Securities Act of 1933 and may have contractual restrictions on resale. They are fair valued under methods approved by the Board of Trustees. The aggregate value of restricted securities amounted to $413,871 or 0.03% of the Fund’s net assets as of December 31, 2021. Information regarding restricted securities is as follows:
| Security | | Initial Acquisition Date | | Units | | Cost per Unit | | Valuation per Unit as of December 31, 2021 |
ASAC II L.P. | | 10/10/13 | | 407,313 | | $ | 1.00 | | $ | 1.0161 |
| The following financial information represents selected data for each share of capital stock outstanding throughout each period: |
| | Year ended December 31, |
| | | | 2021 | | 2020 | | 2019 | | 2018 | | 2017 |
Net Asset Value, Beginning of Period | | $ | 131.69 | | $ | 122.75 | | $ | 96.09 | | $ | 120.46 | | $ | 108.72 |
Income (Loss) from Investment Operations: | | | | | | | | | | | | | | | | | | | | | | | | | |
Net Investment Incomea | | 0.49 | | 0.52 | | 0.67 | | 0.92 | | 0.75 |
| Net Realized and Unrealized Gains (Losses) | | 23.01 | | 11.65 | | 27.79 | | (15.56) | | 18.16 |
| | Total from Investment Operations | | 23.50 | | 12.17 | | 28.46 | | (14.64) | | 18.91 |
Dividends and Distributions: | | | | | | | | | | | | | | | | | | | | | | | | | |
| Dividends from Net Investment Income | | (0.49) | | (0.98) | | (1.10) | | (0.88) | | (0.80) |
| Distributions from Realized Gains | | (18.32) | | (2.25) | | (0.70) | | (8.85) | | (6.37) |
| | Total Dividends and Distributions | | (18.81) | | (3.23) | | (1.80) | | (9.73) | | (7.17) |
| Net Asset Value, End of Period | | $ | 136.38 | | $ | 131.69 | | $ | 122.75 | | $ | 96.09 | | $ | 120.46 |
Total Returnb | | 17.78 | % | | 9.96 | % | | 29.63 | % | | (12.92) | % | | 17.69 | % |
Ratios/Supplemental Data: | | | | | | | | | | | | | | | | | | | | | | | | | |
| Net Assets, End of Period (in millions) | | $ | 1,189
| | | $ | 1,093
| | | $ | 1,123
| | | $ | 940
| | | $ | 1,185
| |
Ratio of Expenses to Average Net Assets: | | | | | | | | | | | | | | | | | | | | | | | | | |
| | Gross | | 0.71 | % | | 0.71 | % | | 0.71 | % | | 0.71 | % | | 0.71 | % |
| | Netc | | 0.71 | % | | 0.71 | % | | 0.71 | % | | 0.71 | % | | 0.71 | % |
| Ratio of Net Investment Income to Average Net Assets | | 0.33 | % | | 0.45 | % | | 0.59 | % | | 0.77 | % | | 0.66 | % |
Portfolio Turnover Rated | | 25 | % | | 10 | % | | 7 | % | | 24 | % | | 17 | % |
a | Per share calculations were based on average shares outstanding for the period. |
| |
b | Assumes hypothetical initial investment on the business day before the first day of the fiscal period, with all dividends and distributions reinvested in additional shares on the reinvestment date, and redemption at the net asset value calculated on the last business day of the fiscal period. |
| |
c | The Net Ratio of Expenses to Average Net Assets reflects the impact, if any, of certain reimbursements. |
| |
d | The lesser of purchases or sales of portfolio securities for a period, divided by the monthly average of the market value of portfolio securities owned during the period. Securities with a maturity or expiration date at the time of acquisition of one year or less are excluded from the calculation. |
| |
| See Notes to Financial Statements |
CLIPPER FUNDSM | Report of Independent Registered Public Accounting Firm |
The Shareholders and Board of Trustees
Clipper Funds Trust:
Opinion on the Financial Statements
We have audited the accompanying statement of assets and liabilities of Clipper Fund (a series of Clipper Funds Trust) (the “Fund”), including the schedule of investments, as of December 31, 2021, the related statement of operations for the year then ended, the statements of changes in net assets for each of the years in the two-year period then ended, and the related notes (collectively, the financial statements) and the financial highlights for each of the years in the five-year period then ended. In our opinion, the financial statements and financial highlights present fairly, in all material respects, the financial position of the Fund as of December 31, 2021, the results of its operations for the year then ended, the changes in its net assets for each of the years in the two-year period then ended, and the financial highlights for each of the years in the five-year period then ended, in conformity with U.S. generally accepted accounting principles.
Basis for Opinion
These financial statements and financial highlights are the responsibility of the Fund’s management. Our responsibility is to express an opinion on these financial statements and financial highlights based on our audits. We are a public accounting firm registered with the Public Company Accounting Oversight Board (United States) (“PCAOB”) and are required to be independent with respect to the Fund in accordance with the U.S. federal securities laws and the applicable rules and regulations of the Securities and Exchange Commission and the PCAOB.
We conducted our audits in accordance with the standards of the PCAOB. Those standards require that we plan and perform the audit to obtain reasonable assurance about whether the financial statements and financial highlights are free of material misstatement, whether due to error or fraud. Our audits included performing procedures to assess the risks of material misstatement of the financial statements and financial highlights, whether due to error or fraud, and performing procedures that respond to those risks. Such procedures included examining, on a test basis, evidence regarding the amounts and disclosures in the financial statements and financial highlights. Such procedures also included confirmation of securities owned as of December 31, 2021, by correspondence with the custodian and brokers or by other appropriate auditing procedures. Our audits also included evaluating the accounting principles used and significant estimates made by management, as well as evaluating the overall presentation of the financial statements and financial highlights. We believe that our audits provide a reasonable basis for our opinion.
KPMG LLP
We have served as the Fund’s auditor since 2006.
Denver, Colorado
February 18, 2022
CLIPPER FUNDSM | Federal Income Tax Information ( Unaudited) |
In early 2022, shareholders received information regarding all dividends and distributions paid to them by the Fund during the calendar year 2021. Regulations of the U.S. Treasury Department require the Fund to report this information to the Internal Revenue Service.
The information and distributions reported herein may differ from the information reported as distributions taxable to certain shareholders for the calendar year 2021 with their 2021 Form 1099-DIV.
During the calendar year 2021, $4,366,083 of dividends paid by the Fund constituted income dividends for federal income tax purposes. The Fund designates $4,366,083 or 100% as income qualifying for the corporate dividends-received deduction.
For the calendar year 2021, certain dividends paid by the Fund constitute qualified dividend income for federal income tax purposes. The Fund designates $4,366,083 or 100% as qualified dividend income.
During the calendar year 2021, the Fund paid long-term capital gain distributions in the amount of $146,933,018. The Fund utilized equalization accounting for tax purposes, whereby a portion of redemption payments were treated as distributions of long-term capital gain. As a result, the Fund designated long-term capital gain distributions in the amount of $151,454,247.
The foregoing information is presented to assist shareholders in reporting dividends and distributions received from the Fund to the Internal Revenue Service. Because of the complexity of the federal regulations, which may affect your individual tax return and the many variations in state and local tax regulations, we recommend that you consult your tax adviser for specific guidance.
CLIPPER FUNDSM | Privacy Notice and Householding |
Privacy Notice
While you generally will be dealing with a broker-dealer or other financial adviser, we may collect information about you from your account application and other forms that you may deliver to us. We use this information to process your requests and transactions; for example, to provide you with additional information about the Fund, to open an account for you, or to process a transaction. In order to service your account and execute your transactions, we may provide your personal information to firms that assist us in servicing your account, such as our transfer agent. We may also provide your name and address to one of our agents for the purpose of mailing to you your account statement and other information about our products and services. We may also gather information through the use of “cookies” when you visit our website. These files help us to recognize repeat visitors and allow easy access to and use of the website. We require these outside firms and agents to protect the confidentiality of your information and to use the information only for the purpose for which the disclosure is made. We do not provide customer names and addresses to outside firms, organizations, or individuals except in furtherance of our business relationship with you or as otherwise allowed by law.
We restrict access to nonpublic personal information about you to those employees who need to know that information to provide products or services to you. We maintain physical, electronic, and procedural safeguards that comply with federal standards to guard your personal information.
Householding
The Fund may, on occasion, mail notices, reports, prospectuses, or proxy material to shareholders. To avoid sending duplicate copies of materials to households, the Fund will mail only one copy of these items to shareholders having the same last name and address on the Fund’s records. The consolidation of these mailings, called householding, benefits the Fund through reduced mailing expense. If you have a direct account with the Fund and you do not want the mailing of these documents to be combined with those to other members of your household, please contact Clipper Fund by phone at 1-800-432-2504. Your instructions will become effective within 30 days of your notice to the Fund.
For the purpose of their service as trustees to the Fund, the business address for each of the Trustees is 2949 E. Elvira Road, Suite 101, Tucson, AZ 85756. Each Trustee serves until retirement, resignation, death, or removal. After turning 75, each Trustee will be annually reviewed by the Independent Trustees, and a majority of the Independent Trustees (with such Trustee abstaining) may request such Trustee’s resignation as of the last business day of the year. Subject to further exceptions and exemptions that may be granted by the Independent Trustees, Trustees must retire from the Board and cease being a Trustee at the close of business on the last day of the calendar year in which the Trustee attains age 80.
Name, Date of Birth, Positions Held with Fund, Length of Service | Principal Occupation(s) During Past Five Years | Number of Portfolios Overseen | Other Directorships |
Independent Trustees
| | | | |
Francisco L. Borges (11/17/51) Trustee since 2014 | Chairman and Managing Partner, Landmark Partners, LLC (private equity firm) since March 1999. | 3 | Chairman and Trustee, John S. and James L. Knight Foundation; Chairman/Director, Assured Guaranty Ltd. (financial guaranty insurance business); Director, Jefferies Financial Group (holding company); Trustee, Millbrook School; Director, Selected Funds (consisting of two portfolios); Director, Hartford HealthCare (healthcare network). |
| | | | |
Lawrence E. Harris (09/16/56) Trustee/Director since 2006 | Fred V. Keenan Chair in Finance of the Marshall School of Business, University of Southern California, Los Angeles, CA. | 3 | Director, Interactive Brokers Group, Inc.; Director, Selected Funds (consisting of two portfolios). |
| | | | |
Steven N. Kearsley (09/29/41) Trustee/Director since 2006 | Private Investor, Real Estate Development. | 3 | Director, Selected Funds (consisting of two portfolios). |
| | | | |
Katherine L. MacWilliams (01/19/56) Trustee since 2014 | Retired; Chief Financial Officer, Caridian BCT, Inc. (medical device company) 2008-2012. | 3 | Director, Selected Funds (consisting of two portfolios). |
| | | | |
James J. McMonagle (10/01/44) Trustee since 2014 Chairman since 2015 | Of Counsel to Vorys, Sater, Seymour and Pease LLP (law firm) since 2002. | 3 | Director/Chairman, Selected Funds (consisting of two portfolios). |
| | | | |
Richard O’Brien (09/12/45) Trustee since 2014 | Retired; Corporate Economist, HP Inc. | 3 | Director, Selected Funds (consisting of two portfolios). |
Interested Trustees*
| | | | |
Andrew A. Davis (06/25/63) Trustee since 2014 | President or Vice President of each Selected Fund, Clipper Fund, and Davis Fund; President, Davis Selected Advisers, L.P., and also serves as an executive officer of certain companies affiliated with the Adviser. | 16 | Director, Selected Funds (consisting of two portfolios); Director, Davis Funds (consisting of 13 portfolios). |
| | | | |
Christopher C. Davis (07/13/65) Trustee since 2014 | President or Vice President of each Selected Fund, Davis Fund, Clipper Fund, and Davis ETF; Chairman, Davis Selected Advisers, L.P., and also serves as an executive officer of certain companies affiliated with the Adviser, including sole member of the Adviser’s general partner, Davis Investments, LLC. | 16 | Director, Selected Funds (consisting of two portfolios); Director, Davis Funds (consisting of 13 portfolios); Lead Independent Director, Graham Holdings Company (educational and media company); Director, The Coca-Cola Company (beverage company); Director, Berkshire Hathaway Inc. (financial services). |
* Andrew A. Davis and Christopher C. Davis own partnership units (directly, indirectly, or both) of the Adviser and are considered to be “interested persons” of the Funds as defined in the Investment Company Act of 1940. Andrew A. Davis and Christopher C. Davis are brothers.
Officers
Lisa J. Cohen (born 04/25/89, Clipper Fund officer since 2021). Vice President and Secretary of Clipper Funds Trust (consisting of one portfolio), Davis Funds (consisting of 13 portfolios), Selected Funds (consisting of two portfolios), and Davis Fundamental ETF Trust (consisting of four portfolios); Vice President, Senior Attorney, and Secretary, Davis Selected Advisers, L.P., and also serves as an executive officer of certain companies affiliated with the Adviser.
Andrew A. Davis (born 06/25/63, Clipper Fund officer since 2015). See description in the section on Interested Trustees.
Christopher C. Davis (born 07/13/65, Clipper Fund officer since 2005). See description in the section on Interested Trustees.
Kenneth C. Eich (born 08/14/53, Clipper Fund officer since 2005). Executive Vice President and Principal Executive Officer of Clipper Funds Trust (consisting of one portfolio), Davis Funds (consisting of 13 portfolios), and Selected Funds (consisting of two portfolios); Trustee/Chairman, Executive Vice President, and Principal Executive Officer of Davis Fundamental ETF Trust (consisting of four portfolios); Chief Operating Officer, Davis Selected Advisers, L.P., and also serves as an executive officer of certain companies affiliated with the Adviser.
Douglas A. Haines (born 03/04/71, Clipper Fund officer since 2005). Vice President, Treasurer, Chief Financial Officer, Principal Financial Officer, and Principal Accounting Officer of Clipper Funds Trust (consisting of one portfolio), Davis Funds (consisting of 13 portfolios), Selected Funds (consisting of two portfolios), and Davis Fundamental ETF Trust (consisting of four portfolios); Vice President and Director of Fund Accounting, Davis Selected Advisers, L.P.
Randi J. Roessler (born 06/26/81, Clipper Fund officer since 2018). Vice President and Chief Compliance Officer of Clipper Funds Trust (consisting of one portfolio), Davis Funds (consisting of 13 portfolios), Selected Funds (consisting of two portfolios), and Davis Fundamental ETF Trust (consisting of four portfolios); Vice President and Chief Compliance Officer, Davis Selected Advisers, L.P., and also serves as an executive officer of certain companies affiliated with the Adviser.
| Investment Adviser |
Davis Selected Advisers, L.P. (Doing business as “Davis Advisors”) |
2949 East Elvira Road, Suite 101 |
Tucson, Arizona 85756 |
(800) 432-2504 |
| |
| Distributor |
Davis Distributors, LLC |
2949 East Elvira Road, Suite 101 |
Tucson, Arizona 85756 |
| |
| Transfer Agent |
DST Asset Manager Solutions, Inc. |
P.O. Box 219167 |
Kansas City, Missouri 64121-9167 |
| |
Overnight Address: |
430 West 7th Street, Suite 219167 |
Kansas City, Missouri 64105-1407 |
| |
| Custodian |
State Street Bank and Trust Co. |
One Lincoln Street |
Boston, Massachusetts 02111 |
| |
| Legal Counsel |
Greenberg Traurig, LLP |
77 West Wacker Drive, Suite 3100 |
Chicago, Illinois 60601 |
| |
| Independent Registered Public Accounting Firm |
KPMG LLP |
1225 17th Street, Suite 800 |
Denver, Colorado 80202 |
For more information about Clipper Fund including management fee, charges, and expenses, see the current prospectus, which must precede or accompany this report. The Fund’s Statement of Additional Information contains additional information about the Fund’s Trustees and is available without charge, upon request, by contacting the Fund at 1-800-432-2504 and on the Fund’s website at www.clipperfund.com. Quarterly Fact Sheets are available on the Fund’s website at www.clipperfund.com.
ITEM 2. CODE OF ETHICS
The registrant has adopted a code of ethics that applies to the registrant’s principal executive officer, principal financial officer, principal accounting officer or controller, or persons performing similar functions.
A copy of the code of ethics is filed as an exhibit to this form N-CSR.
No substantive amendments were approved or waivers granted to this code of ethics during the period covered by this report.
ITEM 3. AUDIT COMMITTEE FINANCIAL EXPERT
The Fund’s Board of Trustees has determined that independent trustee Katherine MacWilliams qualifies as the “audit committee financial expert”, as defined in Item 3 of form N-CSR.
ITEM 4. PRINCIPAL ACCOUNTANT FEES AND SERVICES
(a)
| Audit Fees. The aggregate Audit Fees billed by KPMP LLP ("KPMG") for professional services rendered for the audits of the audits of the financial statements, or services that are normally provided in connection with statutory and regulatory filings or engagements for the fiscal year ends December 31, 2021 and December 31, 2020 were $50,736 and $49,728, respectively. |
| | |
(b)
| Audit-Related Fees. The aggregate Audit-Related Fees billed by KPMG for services rendered for assurance and related services that are not reasonably related to the performance of the audit or review of the fund financial statements, but not reported as Audit Fees for fiscal year ends December 31, 2021 and December 31, 2020 were $0 and $0, respectively. |
| | |
(c)
| Tax Fees. The aggregate Tax Fees billed by KPMG for professional services rendered for tax compliance, tax advice and tax planning for the fiscal year ends December 31, 2021 and December 31, 2020 were $10,160 and $9,725, respectively. Fees included in the Tax Fee category comprise all services performed by professional staff in the independent accountant's tax division except those services related to the audit. These services include preparation of tax returns, tax advice related to mergers and a review of the fund income and capital gain distributions. |
| | |
(d)
| All Other Fees. The aggregate Other Fees billed by KPMG for all other non-audit services rendered to the fund for the fiscal year ends December 31, 2021 and December 31, 2020 were $0 and $0, respectively. |
| | |
(e)(1)
| Audit Committee Pre-Approval Policies and Procedures. The fund Audit Committee must pre-approve all audit and non-audit services provided by the independent accountant relating to the operations or financial reporting of the funds. Prior to the commencement of any audit or non-audit services to a fund, the Audit Committee reviews the services to determine whether they are appropriate and permissible under applicable law. The fund Audit Committee has adopted a policy whereby audit and non-audit services performed by the fund independent accountant require pre-approval in advance at regularly scheduled Audit Committee meetings. If such a service is required between regularly scheduled Audit Committee meetings, pre-approval may be authorized by the Audit Committee Chairperson with ratification at the next scheduled audit committee meeting. |
| | |
(e)(2)
| No services included in (b) – (d) above were approved pursuant to paragraph (c)(7)(i)(C) of Rule 2-01 of Regulation S-X. |
| | |
(f)
| Not applicable |
| | |
(g)
| The Funds’ independent accountant did not provide any services to the investment advisor or any affiliate for the fiscal years ended December 31, 2021 and December 31, 2020. The fund has not paid any fees for non-audit not previously disclosed in items 4 (b) – (d). |
| | |
(h)
| The registrant’s audit committee of the Board of Trustees has considered whether the provision of non-audit services that were rendered to the registrant’s investment adviser, and any entity controlling, controlled by, or under common control with the investment adviser that provides ongoing services to the registrant that not pre-approved pursuant to paragraph (c)(7)(ii) of Rule 2-01 of Regulation S-X is compatible with maintaining the principal accountant’s independence. No such services were rendered. |
ITEM 5. AUDIT COMMITTEE OF LISTED REGISTRANTS
Not Applicable
ITEM 6. SCHEDULE OF INVESTMENTS
(a)
| Not Applicable. The complete Schedule of Investments is included in Item 1 of this Form N-CSR |
| | |
(b)
| Not Applicable. |
ITEM 7. DISCLOSURE OF PROXY VOTING POLICIES AND PROCEDURES FOR CLOSED-END MANAGEMENT INVESTMENT COMPANIES
Not Applicable
ITEM 8. PORTFOLIO MANAGERS OF CLOSED-END MANAGEMENT INVESTMENT COMPANIES
Not Applicable
ITEM 9. PURCHASES OF EQUITY SECURITIES BY CLOSED-END MANAGEMENT INVESTMENT COMPANIES AND AFFILIATED PURCHASERS
Not Applicable
ITEM 10. SUBMISSION OF MATTERS TO A VOTE OF SECURITY HOLDERS
There have been no changes to the procedure by which shareholders may recommend nominees to the registrant’s Board of Trustees.
ITEM 11. CONTROLS AND PROCUDURES
(a)
| The registrant’s principal executive officer and principal financial officer have concluded that the registrant’s disclosure controls and procedures (as defined in Rule 30a-3 (c) under the Investment Company Act of 1940, as amended) are effective as of a date within 90 days of the filing date of this report. |
| | |
(b)
| There have been no significant changes in the registrant’s internal controls or in other factors that could significantly affect these controls. |
ITEM 12. DISCLOSURE OF SECURITIES LENDING ACTIVITIES FOR CLOSED-END MANAGEMENT INVESTMENT COMPANIES
Not Applicable.
ITEM 13. EXHIBITS
(a)(1)
| The registrant’s code of ethics pursuant to Item 2 of Form N-CSR is filed as an exhibit to this form N-CSR. |
| | |
(a)(2)
| Certifications pursuant to Section 302 of the Sarbanes-Oxley Act of 2002 are attached. |
| | |
(b)
| Certifications pursuant to Section 906 of the Sarbanes-Oxley Act of 2002 are attached. |
SIGNATURES
Pursuant to the requirements of the Securities Exchange Act of 1934 and the Investment Company Act of 1940, the registrant has duly caused this report to be signed on its behalf by the undersigned, thereunto duly authorized.
CLIPPER FUNDS TRUST
By | /s/ Kenneth C. Eich |
| | Kenneth C. Eich |
| | Principal Executive Officer |
| | |
Date: February 18, 2022 |
Pursuant to the requirements of the Securities Exchange Act of 1934 and the Investment Company Act of 1940, this report has been signed below by the following persons on behalf of the registrant and in the capacities and on the dates indicated.
By | /s/ Kenneth C. Eich |
| | Kenneth C. Eich |
| | Principal Executive Officer |
| | |
Date: February 18, 2022 |
By | /s/ Douglas A. Haines |
| | Douglas A. Haines |
| | Principal Financial Officer and Principal Accounting Officer |
| | |
Date: February 18, 2022 |