_____________________________
Source: Lipper. Clipper Fund is classified as Large Cap Core. Lipper Total Return Rankings for Large-Cap Core Funds as of December 31, 2018 are: Rank/Number of funds: 1 Year, 712/738; 5 Year, 406/567; 10 Year, 132/443. The performance presented represents past performance and is not a guarantee of future results. Total return assumes reinvestment of dividends and capital gain distributions. See endnotes for additional disclosure.
2 This includes Davis Advisors, the Davis family, our employees, and Fund Directors. As of 12/31/18.
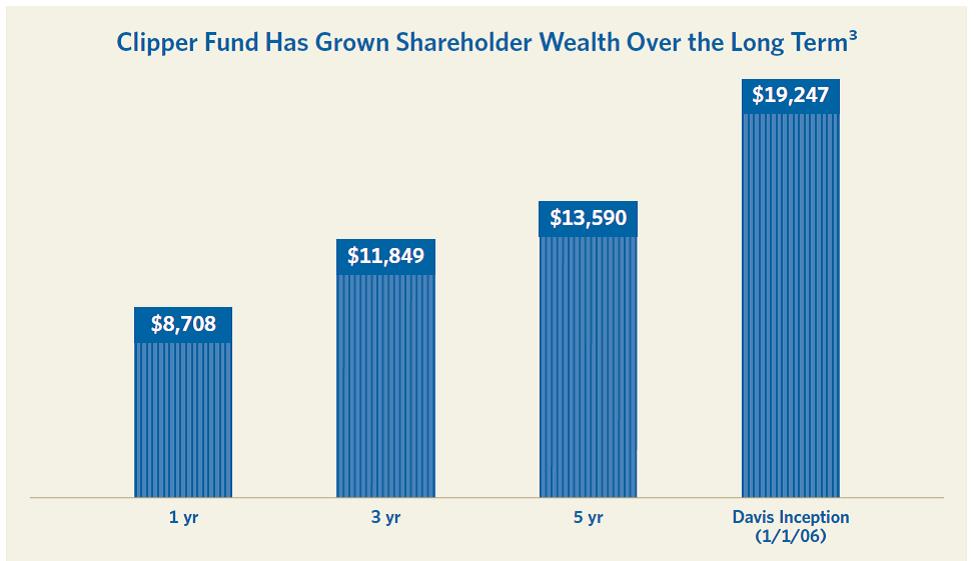
3 Past performance is not a guarantee of future results.
Not a part of Annual Report to Fund shareholders
CLIPPER FUNDSM | Shareholder Letter – (Continued) |
Although companies in historically less volatile sectors such as consumer products, health care and utilities seem safe looking backwards because of their long history of dividend payments and stable results, our analysis indicates many of these companies are significantly overpriced and, in many cases, may face the prospect of future dividend cuts and falling profits. For example, over the last five years, the top 10 holdings of the Standard and Poor’s Low Volatility Index have increased their total debt almost 50% and yet grown revenue only 1.3% per year. Amazingly, the market currently values this toxic combination of no growth and high leverage at a rich 24 times estimated earnings, a 30% premium to the overall market. This data makes clear where investors feel safe they are often taking risk.
In contrast, investors have been dumping shares of companies they perceive as risky. This perception may be based on the company having a relatively short operating history such as certain technology leaders like Google, the company having declined a great deal in the last recession such as large banks like Wells Fargo and JPMorgan, or because the company is headquartered outside the United States at a time when U.S. trade policy is hostile.4 In all cases, these perceptions are based on the past, not the present or the future. As a result, the selling pressure has driven down the prices of many companies Clipper Fund owns that we believe are far better positioned than the low volatility stocks investors are buying. For example, during the same five-year period that so-called safe haven stocks increased their total debt nearly 50%, only one of Clipper Fund’s top 10 holdings, United Technologies, increased its total debt; four more holdings have no net debt at all; and the remaining five holdings actually strengthened rather than weakened their balance sheets.5 Moreover, these 10 companies grew at far greater rates than the safe haven stocks and are projected to grow faster for years to come. We believe the chance to own such companies at lower valuations should pay off handsomely in the years ahead.
In short, if yesterday’s safe havens represent tomorrow’s risks, we believe our carefully selected portfolio companies should be tomorrow’s wealth builders. As a result, although periods of relative underperformance are never welcome, the dynamics that caused our recent decline seem poised to reverse in the months and years ahead.
Turning from the general to the specific, we are especially excited by the opportunities we see in four areas.
First, select financial companies are priced based on investors’ fear the history of the financial crisis is about to repeat. What many investors are forgetting is that some of the companies we own not only survived the financial crisis, but also took advantage of the demise of many of their competitors to expand their market share significantly and broaden their competitive advantages. Today’s financial leaders are not only more dominant, they are also stronger and better capitalized than at any time in the last 50 years. Looking ahead, we expect steadily rising dividends, increasing share repurchases and reliable earnings to gradually change investor perceptions. As a result, our high-quality financial holdings could be revalued upward and take the place of today’s dividend darlings.
Second, we are excited by the opportunity to own a handful of what we believe are the best industrial businesses and conglomerates in the world such as United Technologies, Berkshire Hathaway, and Safran. With investors skittish about the global economy, these companies have sold off far more than their business economics and competitive positions warrant. We would gladly take their long-term growth prospects over many of the so-called safe havens businesses that currently face shifting consumer preferences, falling margins and leveraged balance sheets.
Third, we own a class of companies that are still relatively young but that we expect to become the blue chips of tomorrow. While nervous investors cling to yesterday’s blue chips including well-known consumer brands, utilities, and media giants, they fail to recognize the enormous and permanent shifts in the underlying business landscape brought about by these emerging global leaders. For example, within the next few years, Amazon is expected to become the world’s largest retailer6, people are expected to spend more time on the internet than watching TV7, and information utilities like Google and Amazon Web Services should be as central to the economy as phone companies and other utilities that we consider yesterday’s blue chips but not tomorrow’s.
_____________________________
4 Individual securities are discussed in this piece. While we believe we have a reasonable basis for our appraisals and we have confidence in our opinions, actual results may differ materially from those we anticipate. The return of a security to the Fund will vary based on weighting and timing of purchase. This is not a recommendation to buy, sell or hold any specific security. Past performance is not a guarantee of future results.
5 Holdings are subject to change.
6 Source: https://www.cnbc.com/2018/05/15/amazons-us-sales-to-match-walmarts-within-three-years-jp-morgan-predicts.html
7 Source: https://www.recode.net/2018/6/8/17441288/internet-time-spent-tv-zenith-data-media
Not a part of Annual Report to Fund shareholders
CLIPPER FUNDSM | Shareholder Letter – (Continued) |
Finally, we seek opportunities in companies currently in the headlines for negative short-term results or other reasons because the structure and incentives of many money management firms make them reluctant to invest in companies their clients might consider controversial. After all, when clients read in the newspaper about a company plagued by scandal, the last thing they want to see when they open their investment report is their expert money manager has purchased the scandal-plagued company they just read about. As a result, many investment managers either will not look at companies that are under a cloud or, if they had previously purchased the shares, will sell the entire position at discounted prices. The problem with this approach is their decision has nothing to do with the economics of or prospects for the company in question, but instead is focused on short-term client perceptions.
As a result, shares in durable companies tainted by scandal can often represent buying opportunities that we refer to as headline risk investments.8 In evaluating these investments, our research focuses not on the past but on the future, asking whether the problems that have come to light can be fixed and if so whether the decline in share price represents a buying opportunity. Buying shares when a company is in the headlines for unfavorable reasons is never easy and in no way reflects minimizing a company’s past mistakes. But organizations like people can learn from their mistakes and often emerge stronger. We believe our willingness to look beyond the headlines can lead to fantastic opportunities. Although there are no certainties, our analysis indicates that several companies currently under a cloud will emerge from recent scandals as better companies and that recent selling has been overdone. As a result, we added to our holdings of Facebook during this period and initiated a new position in General Electric (GE).
With more than $125 million of our own money invested alongside clients, our primary concern is making smart investment decisions rather than reacting to short-term investor perceptions.9 Because our firm’s employee incentives drive an investment culture rather than a sales culture, our willingness to invest in controversial companies should come as no surprise. While investing in companies with headline risk can unsettle clients in the short term, such a discipline reflects our alignment of interest with our shareholders over the long term. This alignment is an uncommon advantage given that 88% of all funds are overseen by managers who have less than $1 million invested alongside their clients.
In sum, although not currently popular, the companies that make up Clipper Fund are both more durable and more attractively priced than many market darlings that are currently perceived as safe havens. Because we expect our Portfolio companies, particularly select leading financials, global industrials, internet giants, and a select few companies currently weighed down by negative headlines to post stronger than average results in the years ahead while many of today’s favorites including popular consumer and healthcare companies face falling margins and even dividend cuts, we believe we are well positioned to grow wealth on both a relative and an absolute basis in the years ahead.
Although our investment discipline has not always been rewarded by the market over shorter periods, our proven active management approach has created wealth for our shareholders in the long run. Looking ahead, we are confident that by standing apart from the crowd, keeping expenses low, investing alongside our shareholders, and ignoring short-term fads, we will build on these results in the years and decades ahead.
Recent Market Volatility Is Not Unusual
While the market’s recent price decline has left many investors unsettled, this increase in market volatility and stock price corrections reflect a return to normal market conditions rather than something unusual. In fact, what was truly unusual was the post financial crisis period of near zero interest rates and the market distortions they created. Although volatility and corrections are unpleasant, they are normal aspects of the stock market and, over the long term, create opportunities for investors able to look beyond the negative headlines.
_____________________________
8 The Fund may invest in a company when the company becomes the center of controversy after receiving adverse media attention concerning its operations, long-term prospects, management, or for other reasons. While Davis Advisors researches companies subject to such contingencies, it cannot be correct every time, and the company’s stock may never recover or may become worthless.
9 This includes Davis Advisors, the Davis family, our employees, and Fund Directors. As of 12/31/18.
Not a part of Annual Report to Fund shareholders
CLIPPER FUNDSM | Shareholder Letter – (Continued) |
In large part because of the distortions created after the financial crisis with essentially zero interest rates, quantitative easing, and government asset purchases, volatility among almost all asset classes from stocks, bonds, real estate, private equity, and venture capital investments has been extraordinarily and unsustainably low and investors have grown accustomed to only rising prices.
Based on long-term history, a double-digit market correction occurs in roughly half of all years and a 20% correction on average every 635 days. Having gone more than 2,200 days without a 20% correction, we should not be unduly alarmed or surprised by the market’s peak to trough decline of 19.4% in the second half of 2018. However, because such sudden declines can be unsettling, it is always helpful to put them in a longer term context. For example, faced with the blaring headlines that accompanied the fourth quarter market decline, investors could easily forget that over the last two years (including 2018!), the market is up more than 15%!10 As a result, trying to invest based on timing a correction has been a loser's game.
While we do not know if we are in the early stages of a substantial correction or whether we are simply returning to a period of more normal volatility, we do know substantial corrections are a normal part of the landscape. We also know with the media as an amplifier and the headlines blaring, investors will overreact. Here is a sample of headlines blaring just from recent weeks: "Market Rout," "Stocks Plunge" and "Carnage Continues." Reading such headlines, investors would hardly guess the market only declined about 5% in 2018, is up more than 15% in the last two years, 50% in the last five years and more than 200% in the last decade.
This increase in volatility may also be amplified by the increasing popularity of so-called momentum investing. In recent years, many quantitative funds have used a stock’s momentum as a key factor in determining its attractiveness as an investment. This approach suggests the more an investment goes up in price the more attractive it becomes. Conversely, the more an investment declines in price, the less attractive it becomes. The trouble with investing based on this backward-looking approach is that it flies in the face of common sense. Because a share of stock represents an ownership interest in a business and because the value of any business (or any asset for that matter) is simply the present value of all of the cash the business will generate in the future, paying a higher price will lower rather than raise future returns. To understand why, simply imagine a business that reliably earns $100,000 per year is purchased for $1 million, thus creating a 10% return on investment for the buyer. If a series of buyers are each willing to pay a successively higher and higher price for this business, the expected return for each would be lower. Although such a chain can continue for a long time with the ever-rising price attracting more attention and potential buyers to take their place at the end of the line, the ultimate return will still be determined by the relationship of the earnings generated divided by the price paid. In other words, sooner or later, the music stops, price and value converge, and the fool at the end of the line is left holding the bag. Investing in a way that is logically foolish simply because doing so has worked for some time seems like a recipe for disaster.
More important, momentum investing creates an opportunity for those who can remain steadfastly focused on value. For example, although Amazon remains one of our favorite companies, the stock became a favorite of momentum investors earlier this year resulting in the shares surging more than 70%. As a result, we were able to sell approximately 40% of our position at prices well above the current price. Conversely, when attractive companies have negative momentum, they often overshoot on the downside, creating an opportunity to add asound business at an attractive price. Although time will tell, we believe some of our recent investments were made at bargain prices in part because of the panicked selling of momentum investors.
While the current environment may be more challenging on investor nerves, the return of greater volatility should not be feared as it creates opportunities for long-term investors. Although such an environment creates more noise and distortions in the short term as investors overreact and flock to former safe havens, over time it creates greater differentiation. While the prices of our Portfolio companies may have lagged in this period, the fundamentals have improved, especially when compared to today’s market darlings. As a result, we see every reason for good results in the years ahead.
_____________________________
10 The market is represented by the S&P 500 Index. This represents the time period from 12/31/16 to 12/31/18. Past performance is not a guarantee of future results.
Not a part of Annual Report to Fund shareholders
CLIPPER FUNDSM | Shareholder Letter – (Continued) |
Conclusion
Clipper Fund achieved a double digit 10-year annualized return ending 2018, despite generating a negative return for the year 2018.11
On a relative basis, having outperformed the S&P 500 Index for the last five years through the middle of July 2018, our lagging relative results since then seem more reflective of shifting market sentiment than declines in the earnings and intrinsic value of our Portfolio companies. In fact, a closer study of the data indicates far more risk in those companies currently outperforming because they are perceived as safe havens and significantly more opportunity in some of our largest holdings, which have lagged because they are perceived to be risky. In the years ahead, the companies we own should build wealth for the simple reason they combine stronger balance sheets, higher growth rates, more durable business models, and lower valuations. These companies are the backbone of Clipper Fund and position us for the prospect of stronger relative and absolute results in the years ahead.
As always, we recognize and expect the years ahead will include times of market corrections, disruptions and periods, like the second half of 2018, in which our results lag. While unpleasant, such periods are inevitable and generally create opportunities for investors with the judgment and experience to take advantage of them. In short, at a time when pundits and commentators are making the case experience and judgment do not matter and the best investors can hope for is an average result, we strongly disagree. We believe a carefully selected Portfolio of durable, well-managed businesses with competitive advantages, selling at a discount to true value and overseen by a seasoned team with a long track record of generating proven results will produce a better-than-average outcome. In investing, as in any other profession, skill matters. With more than $125 million invested in Clipper Fund alongside our shareholders12, we have every incentive and intention to build on this record in the years and decades ahead.
We value the trust you have placed in us and look forward to continuing our investment journey together.
Sincerely,
| |
| Christopher C. Davis | Danton G. Goei |
| President & Portfolio Manager | Portfolio Manager |
| | |
| February 1, 2019 | |
_____________________________
11 Past performance is not a guarantee of future results.
12 This includes Davis Advisors, the Davis family, our employees, and Fund Directors. As of 12/31/18.
Not a part of Annual Report to Fund shareholders
CLIPPER FUNDSM | Shareholder Letter – (Continued) |
This report is authorized for use by existing shareholders. A current Clipper Fund prospectus must accompany or precede this material if it is distributed to prospective shareholders. You should carefully consider the Fund’s investment objective, risks, fees, and expenses before investing. Read the prospectus carefully before you invest or send money.
This report includes candid statements and observations regarding investment strategies, individual securities, and economic and market conditions; however, there is no guarantee that these statements, opinions or forecasts will prove to be correct. These comments may also include the expression of opinions that are speculative in nature and should not be relied on as statements of fact.
Objective and Risks. Clipper Fund’s investment objective is long-term capital growth and capital preservation. There can be no assurance that the Fund will achieve its objective. The Fund invests primarily in equity securities issued by large companies with market capitalizations of at least $10 billion. Some important risks of an investment in the Fund are: common stock risk: an adverse event may have a negative impact on a company and could result in a decline in the price of its common stock; depositary receipts risk: depositary receipts may trade at a discount (or premium) to the underlying security and may be less liquid than the underlying securities listed on an exchange; fees and expenses risk: the Fund may not earn enough through income and capital appreciation to offset the operating expenses of the Fund; financial services risk: investing a significant portion of assets in the financial services sector may cause the Fund to be more sensitive to systemic risk, regulatory actions, changes in interest rates, non-diversified loan portfolios, credit, and competition; focused portfolio risk: investing in a limited number of companies causes changes in the value of a single security to have a more significant effect on the value of the Fund’s total portfolio; foreign country risk: foreign companies may be subject to greater risk as foreign economies may not be as strong or diversified; As of December 31, 2018, the Fund had approximately 15.7% of assets invested in foreign companies; foreign currency risk: the change in value of a foreign currency against the U.S. dollar will result in a change in the U.S. dollar value of securities denominated in that foreign currency; headline risk: the Fund may invest in a company when the company becomes the center of controversy. The company’s stock may never recover or may become worthless; large-capitalization companies risk: companies with $10 billion or more in market capitalization generally experience slower rates of growth in earnings per share than do mid- and small-capitalization companies; manager risk: poor security selection may cause the Fund to underperform relevant benchmarks; mid- and small-capitalization companies risk: companies with less than $10 billion in market capitalization typically have more limited product lines, markets and financial resources than larger companies, and may trade less frequently and in more limited volume; and stock market risk: stock markets have periods of rising prices and periods of falling prices, including sharp declines. See the prospectus for a complete description of the principal risks.
Davis Advisors is committed to communicating with our investment partners as candidly as possible because we believe our investors benefit from understanding our investment philosophy and approach. Our views and opinions include “forward-looking statements” which may or may not be accurate over the long term. Forward-looking statements can be identified by words like “believe,” “expect,” “anticipate,” “should,” or similar expressions. You should not place undue reliance on forward-looking statements, which are current as of the date of this report. We disclaim any obligation to update or alter any forward-looking statements, whether as a result of new information, future events, or otherwise. While we believe we have a reasonable basis for our appraisals and we have confidence in our opinions, actual results may differ materially from those we anticipate.
The information provided in this material should not be considered a recommendation to buy, sell or hold any particular security. As of December 31, 2018, the top ten holdings of Clipper Fund were: Alphabet Inc.*, 10.48%; Berkshire Hathaway Inc., Class A, 10.35%; Amazon.com, Inc., 6.64%; Bank of New York Mellon Corp., 6.57%; United Technologies Corp., 6.51%; Capital One Financial Corp., 6.07%; Wells Fargo & Co., 5.85%; Markel Corp., 5.67%; American Express Co., 4.32%; JPMorgan Chase & Co., 3.95%.
* Alphabet Inc. holding includes Class A and Class C.
Clipper Fund has adopted a Portfolio Holdings Disclosure policy that governs the release of non-public portfolio holding information. This policy is described in the prospectus. Holding percentages are subject to change. Visit clipperfund.com or call 800‑432‑2504 for the most current public portfolio holdings information.
Not a part of Annual Report to Fund shareholders
CLIPPER FUNDSM | Shareholder Letter – (Continued) |
Lipper Rankings. Clipper Fund is categorized by Lipper as Large-Cap Core. The rankings show where the Fund would place within an all Large-Cap universe. Total returns rankings are based on total return performance without accounting for a sales charge. Past performance is not a guarantee of future results.
Clipper Fund was managed from inception, February 29, 1984, until December 31, 2005 by another Adviser. Davis Selected Advisers, L.P. took over management of the Fund on January 1, 2006.
We gather our index data from a combination of reputable sources, including, but not limited to, Thomson Financial, Lipper and index websites.
The S&P 500 Index is an unmanaged index of 500 selected common stocks, most of which are listed on the New York Stock Exchange. The Index is adjusted for dividends, weighted towards stocks with large market capitalizations and represents approximately two-thirds of the total market value of all domestic common stocks. Investments cannot be made directly in an index.
After April 30, 2019, this material must be accompanied by a supplement containing performance and rating (ranking) data for the most recent quarter end.
Shares of the Clipper Fund are not deposits or obligations of any bank, are not guaranteed by any bank, are not insured by the FDIC or any other agency, and involve investment risks, including possible loss of the principal amount invested.
12/18 Davis Distributors, LLC, 2949 East Elvira Road, Suite 101, Tucson, AZ 85756, 800‑432‑2504, clipperfund.com
Not a part of Annual Report to Fund shareholders
CLIPPER FUNDSM | Management’s Discussion of Fund Performance |
Performance Overview
Clipper Fund underperformed the Standard & Poor’s 500® Index (“S&P 500®”) for the twelve-month period ended December 31, 2018 (the “period”). The Fund delivered a total return of (12.92)%, versus a (4.38)% return for the S&P 500®. The sectors1 within the S&P 500® that reported the strongest performance were Health Care (up 6%), Consumer Discretionary (up 5%), and Utilities (up 4%). The sectors within the S&P 500® that reported the weakest performance were Energy (down 18%), Materials (down 15%), and Industrials (down 13%).
Detractors from Performance
The Fund’s Consumer Discretionary holdings were the most important detractor2 from performance relative to the S&P 500® and were also a significant absolute detractor during the period. Stock selection drove underperformance (down 15%, versus up 5%). Adient3 (down 80%), the top detractor, and New Oriental Education & Technology (down 29%) performed poorly. New Oriental Education & Technology was a new holding that was acquired during the second half of the period.
The Fund’s Financials sector holdings were the most significant detractor from absolute performance and they were also a hindrance when compared to the S&P 500®. While the Fund had slightly stronger stock selection in this sector than the S&P 500® (down 10%, versus down 11%), its significant overweight position in Financials hindered its performance relative to the S&P 500® (41% average weighting, versus 15%). Capital One (down 23%), Wells Fargo (down 22%), and Bank of New York Mellon (down 11%) were key detractors for the period.
The Fund was significantly underweight in the strongest performing sector within the S&P 500®, Health Care, which affected its relative performance (2% average weighting, versus 14% average weighting for the S&P 500®).
During the period, a new sector was launched, Communication Services. The Fund’s weak stock selection in the Communication Services sector hurt its absolute performance (down 33%), primarily due to Alphabet (down less than 1% in 2018) and Facebook (down 14% in 2018), two companies that moved from the Information Technology sector at the time of launch. Alphabet and Facebook returned -13% and -20%, respectively, after their move to Communication Services. The Fund initially sold Naspers (down 33%) in October and subsequently reestablished a position before year-end.
General Electric (down 45%), a new purchase, and United Technologies (down 15%) from the Industrials sector, Apache (down 36%) from the Energy sector, and LafargeHolcim (down 25%), a Materials holding, were also among the weakest performers during the period.
Contributors to Performance
Only two categories benefited the Fund during the period when compared to the S&P 500®. The Fund ended the period with approximately 4% of its net assets in repurchase agreements, which was beneficial to performance. Additionally, it was helpful that the Fund did not hold any Consumer Staples securities. Aside from this, each sector of the Fund detracted from performance relative to the Index and for this reason the following discussion is focused on absolute performance and contributions thereto.
The Fund’s Information Technology holdings were a positive absolute contributor during the period. As noted above, Alphabet was classified as a Communication Services holding at the end of the period but contributed heavily to Information Technology’s performance by returning 14% while classified in that sector.
The Fund’s Health Care holdings produced positive returns (up 17%). Aetna (up 18%), a new purchase, was among the top contributors for the period. Aetna merged into CVS Health, which was sold subsequent to the merger.
Amazon (up 28%), a Consumer Discretionary holding, was the top contributor for the period. Safran (up 19%) and Johnson Controls (up 2%), Industrials holdings, Occidental Petroleum (up 16%), an Energy security, Berkshire Hathaway (up 3%), a Financial holding, and Tencent Holdings (up 24%), a Communication Services holding, were among the strongest performers during the period. Tencent Holdings was purchased, and subsequently sold, during the period. Occidental Petroleum and Johnson Controls were also sold during the period.
The Fund had an average weighting of 14% of its net assets invested in foreign securities, which outperformed the domestic holdings (down 11%, versus down 14%).
Clipper Fund’s investment objective is to seek long-term capital growth and capital preservation. There can be no assurance that the Fund will achieve its objective. Clipper Fund’s principal risks are: common stock risk, depositary receipts risk, fees and expenses risk, financial services risk, focused portfolio risk, foreign country risk, foreign currency risk, headline risk, large-capitalization companies risk, manager risk, mid- and small-capitalization companies risk, and stock market risk. See the prospectus for a full description of each risk.
Clipper Fund focuses its investments in fewer companies, and it may be subject to greater risks than a more diversified fund that is not allowed to focus its investments in a few companies. The Fund’s investment performance, both good and bad, is expected to reflect the economic performance of its more focused portfolio.
Past performance does not guarantee future results, Fund prices fluctuate, and the value of an investment may be worth more or less than the purchase price. Data provided in this performance overview is for the twelve-month period ended December 31, 2018, unless otherwise noted. Return figures for underlying Fund positions reflect the return of the security from the beginning of the period or the date of first purchase if subsequent thereto through the end of the period or the date the position is completely liquidated. The actual contribution to the Fund will vary based on a number of factors (e.g., trading activity, weighting). Portfolio holding information is as of the end of the twelve-month period, December 31, 2018, unless otherwise noted.
1 | The companies included in the Standard & Poor’s 500® Index are divided into eleven sectors. One or more industry groups make up a sector. For purposes of measuring concentration, the Fund generally classifies companies at the industry group or industry level. See the SAI for additional information regarding the Fund’s concentration policy. |
2 | A company’s or sector’s contribution to or detraction from the Fund’s performance is a product both of its appreciation or depreciation and its weighting within the Fund. For example, a 5% holding that rises 20% has twice as much impact as a 1% holding that rises 50%. |
3 | This Management Discussion of Fund Performance discusses a number of individual companies. The information provided in this report does not provide information reasonably sufficient upon which to base an investment decision and should not be considered a recommendation to purchase, sell, or hold any particular security. The Schedule of Investments lists the Fund’s holdings of each company discussed. |
CLIPPER FUNDSM | Management’s Discussion of Fund Performance – (Continued) |
Comparison of a $10,000 investment in Clipper Fund versus the Standard & Poor’s 500® Index
over 10 years for an investment made on December 31, 2008
Average Annual Total Return for periods ended December 31, 2018
Fund & Benchmark Index | 1-Year | 5-Year | 10-Year | Since Fund’s Inception (02/29/84) | Gross Expense Ratio | Net Expense Ratio |
| Clipper Fund | (12.92)% | 6.32% | 12.70% | 11.06% | 0.71% | 0.71% |
Standard & Poor’s 500® Index | (4.38)% | 8.49% | 13.11% | 10.89% | | |
In 2009, the Fund received favorable class action settlements from companies which it no longer owns. These settlements had a material impact on the investment performance of the Fund, adding approximately 5% to the Fund’s total return in 2009. This was a one-time event that is unlikely to be repeated.
The Standard & Poor’s 500® Index is an unmanaged index of 500 selected common stocks, most of which are listed on the New York Stock Exchange. The Index is adjusted for dividends, weighted towards stocks with large market capitalizations, and represents approximately two-thirds of the total market value of all domestic common stocks. Investments cannot be made directly in the Index.
The performance data quoted in this report represents past performance, assumes that all distributions were reinvested, and is not a guarantee of future results. The investment return and principal value will fluctuate so that shares may be worth more or less than their original cost when redeemed. Fund performance changes over time and current performance may be higher or lower than performance data quoted. Returns shown do not reflect the deduction of taxes that a shareholder would pay on fund distributions or the redemption of fund shares. The operating expense ratio may vary in future years. For more recent month-end performance information, please call Clipper Fund Investor Services at 1-800-432-2504 or visit the Fund’s website at www.clipperfund.com.
Davis Selected Advisers, L.P. began serving as investment adviser to Clipper Fund on January 1, 2006. A different investment adviser managed the Fund through December 31, 2005.
CLIPPER FUNDSM | |
| | December 31, 2018 |
| Portfolio Composition | | Industry Weightings |
| (% of Fund’s 12/31/18 Net Assets) | | (% of 12/31/18 Stock Holdings) |
| | | | | | | |
| | | | | Fund | | S&P 500® |
| Common Stock (U.S.) | 81.07% | | Diversified Financials | 28.23% | | 5.32% |
| Common Stock (Foreign) | 12.63% | | Media & Entertainment | 15.92% | | 7.96% |
| Preferred Stock (Foreign) | 3.05% | | Capital Goods | 14.98% | | 6.45% |
| Short-Term Investments | 4.19% | | Banks | 13.05% | | 5.66% |
| Other Assets & Liabilities | (0.94)% | | Retailing | 11.67% | | 6.44% |
| | 100.00% | | Insurance | 5.86% | | 2.38% |
| | | | Energy | 3.85% | | 5.31% |
| | | | Consumer Services | 2.93% | | 1.87% |
| | | | Materials | 1.86% | | 2.73% |
| | | | Automobiles & Components | 1.65% | | 0.51% |
| | | | Information Technology | – | | 20.11% |
| | | | Health Care | – | | 15.53% |
| | | | Food, Beverage & Tobacco | – | | 4.00% |
| | | | Other | – | | 15.73% |
| | | | | 100.00% | | 100.00% |
| Top 10 Long-Term Holdings |
| (% of Fund’s 12/31/18 Net Assets) |
| | | |
| Alphabet Inc.* | Media & Entertainment | 10.48% |
| Berkshire Hathaway Inc., Class A | Diversified Financial Services | 10.35% |
| Amazon.com, Inc. | Retailing | 6.64% |
| Bank of New York Mellon Corp. | Capital Markets | 6.57% |
| United Technologies Corp. | Capital Goods | 6.51% |
| Capital One Financial Corp. | Consumer Finance | 6.07% |
| Wells Fargo & Co. | Banks | 5.85% |
| Markel Corp. | Property & Casualty Insurance | 5.67% |
| American Express Co. | Consumer Finance | 4.32% |
| JPMorgan Chase & Co. | Banks | 3.95% |
*Alphabet Inc. holding includes Class A and Class C.
CLIPPER FUNDSM | Fund Overview – (Continued) |
| | December 31, 2018 |
New Positions Added (01/01/18-12/31/18)
(Highlighted positions are those greater than 3.00% of the Fund’s 12/31/18 net assets)
| Security | Industry | Date of 1st Purchase | % of Fund’s 12/31/18 Net Assets |
| Aetna Inc. | Health Care Equipment & Services | 02/06/18 | – |
| Facebook, Inc., Class A | Media & Entertainment | 03/27/18 | 3.32% |
| General Electric Co. | Capital Goods | 07/06/18 | 3.16% |
| New Oriental Education & Technology | | | |
| Group, Inc., ADR | Consumer Services | 08/27/18 | 2.84% |
| Tencent Holdings Ltd. | Media & Entertainment | 10/30/18 | – |
| U.S. Bancorp | Banks | 06/18/18 | 2.83% |
Positions Closed (01/01/18-12/31/18)
(Gains and losses greater than $3,400,000 are highlighted)
| Security | Industry | Date of Final Sale | | Realized Gain (Loss) |
| CVS Health Corp. | Health Care Equipment & Services | 11/30/18 | $ | 4,344,107 |
| Johnson Controls International plc | Capital Goods | 08/29/18 | | 9,108,773 |
| Liberty Global plc, Series C | Media & Entertainment | 04/11/18 | | (3,120,821) |
| Occidental Petroleum Corp. | Energy | 07/31/18 | | 3,165,629 |
| Tencent Holdings Ltd. | Media & Entertainment | 12/11/18 | | 2,257,100 |
As a shareholder of the Fund, you incur ongoing costs only, including advisory and administrative fees and other Fund expenses. The Expense Example is intended to help you understand your ongoing costs (in dollars) of investing in the Fund and to compare these costs with the ongoing costs of investing in other mutual funds. The Expense Example is based on an investment of $1,000 invested at the beginning of the period and held for the entire period indicated, which is for the six-month period ended December 31, 2018.
Actual Expenses
The information represented in the row entitled “Actual” provides information about actual account values and actual expenses. You may use the information in this row, together with the amount you invested, to estimate the expenses that you paid over the period. Simply divide your account value by $1,000 (for example, an $8,600 account value divided by $1,000 = 8.6), then multiply the result by the number under the heading “Expenses Paid During Period” to estimate the expenses you paid on your account during this period. An annual maintenance fee of $10, charged on retirement plan accounts per Social Security Number, is not included in the Expense Example. If this fee was included, the estimate of expenses you paid during the period would be higher, and your ending account value would be lower, by this amount.
Hypothetical Example for Comparison Purposes
The information represented in the row entitled “Hypothetical” provides information about hypothetical account values and hypothetical expenses based on the Fund’s actual expense ratio and an assumed rate of return of 5% per year before expenses, which is not the Fund’s actual return. The hypothetical account values and expenses may not be used to estimate the actual ending account balance or expenses you paid for the period. You may use this information to compare the ongoing costs of investing in the Fund and other funds. To do so, compare this 5% hypothetical example with the 5% hypothetical examples that appear in the shareholder reports of the other funds. An annual maintenance fee of $10, charged on retirement plan accounts per Social Security Number, is not included in the Expense Example. If this fee was included, the estimate of expenses you paid during the period would be higher, and your ending account value would be lower, by this amount.
Please note that the expenses shown in the table are meant to highlight your ongoing costs only. Therefore, the information in the row entitled “Hypothetical” is useful in comparing ongoing costs only, and will not help you determine the relative total costs of owning different funds.
| | Beginning Account Value (07/01/18) | | Ending Account Value (12/31/18) | | Expenses Paid During Period* (07/01/18-12/31/18) |
Actual | $1,000.00 | | $850.03 | | $3.31 |
| Hypothetical | $1,000.00 | | $1,021.63 | | $3.62 |
Hypothetical assumes 5% annual return before expenses.
* Expenses are equal to the Fund’s annualized operating expense ratio (0.71%)**, multiplied by the average account value over the period, multiplied by 184/365 (to reflect the one-half year period).
** The expense ratio reflects the impact, if any, of certain reimbursements from the Adviser.
CLIPPER FUNDSM | |
| | December 31, 2018 |
| | Shares/Units | | Value
(Note 1) |
| COMMON STOCK – (93.70%) |
| | COMMUNICATION SERVICES – (15.40%) |
| | Media & Entertainment – (15.40%) |
| | | | | | | | |
| | | | | | | | |
| | | | | | | | |
| | Facebook, Inc., Class A * | | | | | | |
| | Naspers Ltd. - N (South Africa) | | | | | | |
| | | | Total Communication Services | | | |
| | CONSUMER DISCRETIONARY – (12.68%) |
| | Automobiles & Components – (1.60%) |
| | | | | | | | |
| | Consumer Services – (2.84%) |
| | New Oriental Education & Technology Group, Inc., ADR (China)* | | | | | | |
| | Retailing – (8.24%) |
| | Alibaba Group Holding Ltd., ADR (China)* | | | | | | |
| | | | | | | | |
| | | | 77,478,546 |
| | Total Consumer Discretionary | | | |
| | ENERGY – (3.72%) |
| | | | | | | | |
| | | | | |
| | FINANCIALS – (45.61%) |
| | Banks – (12.63%) |
| | | | | | | | |
| | | | | | | | |
| | | | | | | | |
| | | | 118,703,272 |
| | Diversified Financials – (27.31%) |
| | Capital Markets – (6.57%) |
| | Bank of New York Mellon Corp. | | | | | | |
| | Consumer Finance – (10.39%) |
| | | | | | | | |
| | Capital One Financial Corp. | | | | | | |
| | | 97,626,267 |
| | Diversified Financial Services – (10.35%) |
| | Berkshire Hathaway Inc., Class A * | | | | | | |
| | | | 256,724,139 |
| | Insurance – (5.67%) |
| | Property & Casualty Insurance – (5.67%) |
| | | | | | | | |
| | | | | |
| | INDUSTRIALS – (14.49%) |
| | Capital Goods – (14.49%) |
| | Ferguson PLC (United Kingdom) | | | | | | |
| | | | | | | | |
| | | | | | | | |
| | United Technologies Corp. | | | | | | |
| | | | | |
CLIPPER FUNDSM | Schedule of Investments – (Continued) |
| | December 31, 2018 |
| | Shares/Principal | | Value
(Note 1) |
| COMMON STOCK – (CONTINUED) |
| | MATERIALS – (1.80%) |
| | LafargeHolcim Ltd. (Switzerland) | | | | | | |
| | | | | | | | |
| | | | TOTAL COMMON STOCK – (Identified cost $708,780,980)
| | | |
| PREFERRED STOCK – (3.05%) |
| | CONSUMER DISCRETIONARY – (3.05%) |
| | Retailing – (3.05%) |
| | Didi Chuxing Joint Co., Series A (China)*(a)(b) | | | | | | |
| | Didi Chuxing Joint Co., Series B (China)*(a)(b) | | | | | | |
| | Total Consumer Discretionary | | | |
| | TOTAL PREFERRED STOCK – (Identified cost $24,712,474)
| | | |
| SHORT-TERM INVESTMENTS – (4.19%) |
| | INTL FCStone Financial Inc. Joint Repurchase Agreement, 3.05%, 01/02/19, dated 12/31/18, repurchase value of $15,609,645 (collateralized by: U.S. Government agency mortgages and obligations in a pooled cash account, 0.00%-10.25%, 01/15/19-09/20/68, total market value $15,919,140) | | | | | | |
| | Mizuho Securities USA Inc. Joint Repurchase Agreement, 2.90%, 01/02/19, dated 12/31/18, repurchase value of $1,274,205 (collateralized by: U.S. Government agency obligation in a pooled cash account, 2.625%, 12/31/23, total market value $1,299,480) | | | | | | |
| | Nomura Securities International, Inc. Joint Repurchase Agreement, 3.00%, 01/02/19, dated 12/31/18, repurchase value of $3,746,624 (collateralized by: U.S. Government agency mortgages in a pooled cash account, 3.34%-7.00%, 03/01/24-09/01/48, total market value $3,820,920) | | | | | | |
| | SunTrust Robinson Humphrey, Inc. Joint Repurchase Agreement, 3.21%, 01/02/19, dated 12/31/18, repurchase value of $18,731,340 (collateralized by: U.S. Government agency mortgages in a pooled cash account, 2.50%-5.00%, 10/01/20-11/20/48, total market value $19,102,560) | | | | | | |
| | TOTAL SHORT-TERM INVESTMENTS – (Identified cost $39,355,000)
| | | |
| |
Total Investments – (100.94%) – (Identified cost $772,848,454) | | | 948,840,299 |
| | Liabilities Less Other Assets – (0.94%) | | | (8,790,635) |
| | Net Assets – (100.00%) | | $ | 940,049,664 |
| |
| | ADR: American Depositary Receipt |
| |
| | * | Non-income producing security. |
| |
| | (a) | Restricted Security – See Note 6 of the Notes to Financial Statements. |
| |
| | (b) | The value of this security was determined using significant unobservable inputs. See Note 1 of the Notes to Financial Statements. |
| |
| See Notes to Financial Statements |
CLIPPER FUNDSM | Statement of Assets and Liabilities |
| | At December 31, 2018 |
| ASSETS: | | | | | |
| Investments in securities, at value* (see accompanying Schedule of Investments) | | $ | 948,840,299 |
| Cash | | | 230 |
| Receivables: | | | |
| | Capital stock sold | | | 1,262,338 |
| | Dividends and interest | | | 258,397 |
| Prepaid expenses | | | 29,188 |
| | | Total assets | | | 950,390,452 |
LIABILITIES: | | | |
| Payables: | | | |
| | Capital stock redeemed | | | 9,541,073 |
| Accrued investment advisory fee | | | 473,536 |
| Other accrued expenses | | | 326,179 |
| | Total liabilities | | | 10,340,788 |
NET ASSETS | | $ | 940,049,664 |
SHARES OUTSTANDING | | | 9,782,561 |
NET ASSET VALUE, offering, and redemption price per share (Net assets ÷ Shares outstanding) | | $ | 96.09 |
NET ASSETS CONSIST OF: | | | |
| Paid-in capital | | $ | 757,886,751 |
| Distributable earnings | | | 182,162,913 |
| | Net Assets | | $ | 940,049,664 |
| | | | | |
| *Including: | | | |
| | Cost of investments | | $ | 772,848,454 |
| See Notes to Financial Statements |
CLIPPER FUNDSM | |
| | For the year ended December 31, 2018 |
| INVESTMENT INCOME: | | | | | | |
| Income: | | | |
| Dividends* | | $ | 16,384,066 |
| Interest | | | 814,572 |
| | | Total income | | | | 17,198,638 |
Expenses: | | | |
| Investment advisory fees (Note 3) | | $ | 6,382,307 | | | |
| Custodian fees | | | 187,762 | | | |
| Transfer agent fees | | | 1,176,303 | | | |
| Audit fees | | | 52,170 | | | |
| Legal fees | | | 23,077 | | | |
| Reports to shareholders | | | 66,505 | | | |
| Trustees’ fees and expenses | | | 229,507 | | | |
| Registration and filing fees | | | 42,344 | | | |
| Miscellaneous | | | 59,501 | | | |
| | Total expenses | | | | 8,219,476 |
| Net investment income | | | 8,979,162 |
REALIZED & UNREALIZED GAIN (LOSS) ON INVESTMENTS AND FOREIGN CURRENCY TRANSACTIONS: | | | | | | |
| Net realized gain (loss) from: | | | |
| | Investment transactions | | | 80,252,465 |
| | Foreign currency transactions | | | (73,003) |
| Net realized gain | | | 80,179,462 |
| Net decrease in unrealized appreciation | | | (229,504,256) |
| | Net realized and unrealized loss on investments and foreign currency transactions | | | | (149,324,794) |
| Net decrease in net assets resulting from operations | | $ | (140,345,632) |
| | | | | | | | | |
| *Net of foreign taxes withheld of | | $ | 147,176 |
| See Notes to Financial Statements |
CLIPPER FUNDSM | Statements of Changes in Net Assets |
| | | Year ended December 31, |
| | | 2018 | | 2017* |
OPERATIONS: | | | | | | |
| Net investment income | | $ | 8,979,162 | | $ | 7,449,604 |
| Net realized gain from investments and foreign currency transactions | | | 80,179,462 | | | 66,290,087 |
Net increase (decrease) in unrealized appreciation on investments and foreign currency transactions | | | (229,504,256) | | | 113,767,214 |
| | | Net increase (decrease) in net assets resulting from operations | | | (140,345,632) | | | 187,506,905 |
DIVIDENDS AND DISTRIBUTIONS TO SHAREHOLDERS: | | | (92,616,319) | | | (68,290,805) |
CAPITAL SHARE TRANSACTIONS: | | | | | | |
| Net decrease in net assets resulting from capital share transactions (Note 4) | | | (11,763,491) | | | (146,422,133) |
| | Total decrease in net assets | | | (244,725,442) | | | (27,206,033) |
NET ASSETS: | | | | | | |
| Beginning of year | | | 1,184,775,106 | | | 1,211,981,139 |
| End of year | | $ | 940,049,664 | | $ | 1,184,775,106 |
| *Includes dividends and distributions to shareholders from net investment income $(7,615,327) and realized gains from investment transactions $(60,675,478). End of year net assets includes undistributed net investment income $273,647. |
| See Notes to Financial Statements |
CLIPPER FUNDSM | Notes to Financial Statements |
| | December 31, 2018 |
NOTE 1 - SUMMARY OF SIGNIFICANT ACCOUNTING POLICIES
Clipper Funds Trust, a Delaware statutory trust (“Trust”), on behalf of Clipper Fund (“Fund”), a series of the Trust, is registered under the Investment Company Act of 1940, as amended, as a non-diversified, open-end management investment company. The Fund follows the reporting guidance of the Financial Accounting Standards Board (“FASB”) Accounting Standards Codification Topic 946, Financial Services – Investment Companies. The Fund’s investment objective is long-term capital growth and capital preservation. Davis Selected Advisers, L.P. (“Davis Advisors” or “Adviser”), the Fund’s investment adviser, seeks to invest the Fund’s assets primarily in common stocks of large companies (generally, companies with market capitalizations of $10 billion or more at the time of initial purchase) that are trading at prices below the Adviser’s estimate of their intrinsic values. The following is a summary of significant accounting policies followed by the Fund in the preparation of its financial statements.
Security Valuation - The Fund calculates the net asset value of its shares as of the close of the New York Stock Exchange (“Exchange”), normally 4:00 P.M. Eastern time, on each day the Exchange is open for business. Securities listed on the Exchange (and other national exchanges including NASDAQ) are valued at the last reported sales price on the day of valuation. Listed securities for which no sale was reported on that date are valued at the last quoted bid price. Securities traded on foreign exchanges are valued based upon the last sales price on the principal exchange on which the security is traded prior to the time when the Fund’s assets are valued. Securities (including restricted securities) for which market quotations are not readily available or securities whose values have been materially affected by what the Adviser identifies as a significant event occurring before the Fund’s assets are valued but after the close of their respective exchanges will be fair valued using a fair valuation methodology applicable to the security type or the significant event as previously approved by the Fund’s Pricing Committee and Board of Trustees. The Pricing Committee considers all facts it deems relevant that are reasonably available, through either public information or information available to the Adviser’s portfolio management team, when determining the fair value of a security. To assess the appropriateness of security valuations, the Adviser may consider (i) comparing prior day prices and/or prices of comparable securities; (ii) comparing sale prices to the prior or current day prices and challenge those prices exceeding certain tolerance levels with the third-party pricing service or broker source; (iii) new rounds of financing; (iv) the performance of the market or the issuer’s industry; (v) the liquidity of the security; (vi) the size of the holding in a fund; and/or (vii) any other appropriate information. The determination of a security’s fair value price often involves the consideration of a number of subjective factors and is therefore subject to the unavoidable risk that the value assigned to a security may be higher or lower than the security’s value would be if a reliable market quotation of the security was readily available. Fair value determinations are subject to review, approval, and ratification by the Fund’s Board of Trustees at its next regularly scheduled meeting covering the calendar quarter in which the fair valuation was determined. Fair valuation methods used by the Fund may include, but are not limited to, valuing securities initially at cost (excluding commissions) and subsequently adjusting the value due to: additional transactions by the issuer, changes in company specific fundamentals and changes in the value of similar securities. Values may be further adjusted for any discounts related to security-specific resale restrictions.
Short-term securities purchased within 60 days to maturity are valued at amortized cost, which approximates market value.
The Fund’s valuation procedures are reviewed and subject to approval by the Board of Trustees. There have been no significant changes to the fair valuation procedures during the period.
Fair Value Measurements - Fair value is defined as the price that the Fund would receive upon selling an investment in an orderly transaction to an independent buyer in the principal market for the investment. Various inputs are used to determine the fair value of the Fund’s investments. These inputs are summarized in the three broad levels listed below.
Level 1 – quoted prices in active markets for identical securities
Level 2 – other significant observable inputs (including quoted prices for similar investments, interest rates, prepayment
speeds, credit risk, etc.)
Level 3 – significant unobservable inputs (including the Fund’s own assumptions in determining the fair value of investments)
The inputs or methodologies used for valuing securities are not necessarily an indication of the risks associated with investing in those securities nor can it be assured that the Fund can obtain the fair value assigned to a security if it were to sell the security.
CLIPPER FUNDSM | Notes to Financial Statements – (Continued) |
| | December 31, 2018 |
NOTE 1 - SUMMARY OF SIGNIFICANT ACCOUNTING POLICIES – (CONTINUED)
Fair Value Measurements - (Continued)
The following is a summary of the inputs used as of December 31, 2018 in valuing the Fund’s investments carried at value:
| | Investments in Securities at Value |
| | Valuation Inputs |
| | | | Level 2: | | Level 3: | | |
| | | | Other Significant | | Significant | | |
| | Level 1: | | Observable | | Unobservable | | |
| | Quoted Prices | | Inputs | | Inputs | | Total |
Common Stock: | | | | | | | | | | | |
| Communication Services | $ | 144,421,251 | | $ | – | | $ | 398,067 | | $ | 144,819,318 |
| Consumer Discretionary | | 119,173,170 | | | – | | | – | | | 119,173,170 |
| Energy | | 35,017,474 | | | – | | | – | | | 35,017,474 |
| Financials | | 428,717,784 | | | – | | | – | | | 428,717,784 |
| Industrials | | 136,231,472 | | | – | | | – | | | 136,231,472 |
| Materials | | 16,881,244 | | | – | | | – | | | 16,881,244 |
Preferred Stock: | | | | | | | | | | | |
| Consumer Discretionary | | – | | | – | | | 28,644,837 | | | 28,644,837 |
| Short-term securities | | – | | | 39,355,000 | | | – | | | 39,355,000 |
| Total Investments | $ | 880,442,395 | | $ | 39,355,000 | | $ | 29,042,904 | | $ | 948,840,299 |
The following table reconciles the valuation of assets in which significant unobservable inputs (Level 3) were used in determining fair value during the year ended December 31, 2018. The net change in unrealized appreciation (depreciation) during the period on Level 3 securities still held at December 31, 2018 was $(2,723,736). There were no transfers of investments into or out of Level 3 of the fair value hierarchy during the period. The cost of purchases or proceeds from sales may include securities received or delivered through corporate actions or exchanges. Realized and unrealized gains (losses) are included in the related amounts on investments in the Statement of Operations.
| | | Beginning Balance January 1, 2018 | | Cost of Purchases | | Net Change in Unrealized Appreciation (Depreciation) | | Net Realized Gain (Loss) | | Proceeds from Sales | | Ending Balance December 31, 2018 |
| Investments in Securities: | | | | | | | | | | | | | | | | | | |
| Common Stock | | $ | 391,550 | | $ | – | | $ | 6,517 | | $ | – | | $ | – | | $ | 398,067 |
| Preferred Stock | | | 31,375,090 | | | – | | | (2,730,253) | | | – | | | – | | | 28,644,837 |
| Total Level 3 | | $ | 31,766,640 | | $ | – | | $ | (2,723,736) | | $ | – | | $ | – | | $ | 29,042,904 |
The following table is a summary of those assets in which significant unobservable inputs (Level 3) were used by the Adviser in determining fair value. Note that these amounts exclude any valuations provided by a pricing service or broker.
| | | Fair Value at | | Valuation | | Unobservable | | | | Impact to Valuation from |
| | | December 31, 2018 | | Technique | | Input(s) | | Amount(s) | | an Increase in Input |
| Investments in Securities: | | | | | | | | | | | |
| Common Stock | | $ | 398,067 | | Discounted Cash Flow | | Annualized Yield | | 3.757% | | Decrease |
Preferred Stock | | | 28,644,837 | | Market Approach | | Transaction Price | | $46.50 | | Increase |
| Total Level 3 | | $ | 29,042,904 | | | | | | | | |
The significant unobservable inputs listed in the above table are used in the fair value measurement of equity securities, and if changed, would affect the fair value of the Fund’s investments. The transaction price input is attributable to a private security and includes assumptions made from private transactions. The “Impact to Valuation from an Increase in Input” represents the change in fair value measurement resulting from an increase in the corresponding input. A decrease in the input would have the opposite effect.
CLIPPER FUNDSM | Notes to Financial Statements – (Continued) |
| | December 31, 2018 |
NOTE 1 - SUMMARY OF SIGNIFICANT ACCOUNTING POLICIES – (CONTINUED)
Master Repurchase Agreements - The Fund, along with other affiliated funds, may transfer uninvested cash balances into one or more master repurchase agreement accounts. These balances are invested in one or more repurchase agreements, secured by U.S. Government securities. A custodian bank holds securities pledged as collateral for repurchase agreements until the agreements mature. Each agreement requires that the market value of the collateral be sufficient to cover payments of interest and principal; however, in the event of default by the other party to the agreement, retention of the collateral may be subject to legal proceedings.
Currency Translation - The market values of all assets and liabilities denominated in foreign currencies are recorded in the financial statements after translation to the U.S. Dollar based upon the mean between the bid and offered quotations of the currencies against U.S. Dollars on the date of valuation. The cost basis of such assets and liabilities is determined based upon historical exchange rates. Income and expenses are translated at average exchange rates in effect as accrued or incurred.
Foreign Currency - The Fund may enter into forward purchases or sales of foreign currencies to hedge certain foreign currency denominated assets and liabilities against declines in market value relative to the U.S. Dollar. Forward currency contracts are marked-to-market daily and the change in market value is recorded by the Fund as an unrealized gain or loss. When the forward currency contract is closed, the Fund records a realized gain or loss equal to the difference between the value of the forward currency contract at the time it was opened and value at the time it was closed. Investments in forward currency contracts may expose the Fund to risks resulting from unanticipated movements in foreign currency exchange rates or failure of the counter-party to the agreement to perform in accordance with the terms of the contract. There were no forward contracts entered into by the Fund.
Reported net realized foreign exchange gains or losses arise from the sales of foreign currencies, currency gains or losses realized between the trade and settlement dates on security transactions, the difference between the amounts of dividends, interest, and foreign withholding taxes recorded on the Fund’s books, and the U.S. Dollar equivalent of the amounts actually received or paid. Net unrealized foreign exchange gains or losses arise from changes in the value of assets and liabilities other than investments in securities at fiscal year end, resulting from changes in the exchange rate. The Fund includes foreign currency gains and losses realized on the sales of investments together with market gains and losses on such investments in the Statement of Operations.
Federal Income Taxes - It is the Fund’s policy to comply with the requirements of the Internal Revenue Code applicable to regulated investment companies, and to distribute substantially all of its taxable income, including any net realized gains on investments not offset by loss carryovers, to shareholders. Therefore, no provision for federal income or excise tax is required. The Adviser analyzed the Fund’s tax positions taken on federal and state income tax returns for all open tax years and concluded that as of December 31, 2018, no provision for income tax is required in the Fund’s financial statements related to these tax positions. The Fund’s federal and state (Arizona) income and federal excise tax returns for tax years for which the applicable statutes of limitations have not expired are subject to examination by the Internal Revenue Service and state Department of Revenue. The earliest tax year that remains subject to examination by these jurisdictions is 2015.
At December 31, 2018, the aggregate cost of investments and unrealized appreciation (depreciation) for federal income tax purposes were as follows:
| Cost | | $ | 773,727,068 |
Unrealized appreciation | | | 294,436,451 |
| Unrealized depreciation | | | (119,323,220) |
| Net unrealized appreciation | | $ | 175,113,231 |
Securities Transactions and Related Investment Income - Securities transactions are accounted for on the trade date (date the order to buy or sell is executed) with realized gain or loss on the sale of securities being determined based upon identified cost. Dividend income is recorded on the ex-dividend date. Interest income, which includes accretion of discount and amortization of premium, is accrued as earned.
CLIPPER FUNDSM | Notes to Financial Statements – (Continued) |
| | December 31, 2018 |
NOTE 1 - SUMMARY OF SIGNIFICANT ACCOUNTING POLICIES – (CONTINUED)
Dividends and Distributions to Shareholders - Dividends and distributions to shareholders are recorded on the ex-dividend date. Net investment income (loss), net realized gains (losses), and net unrealized appreciation (depreciation) on investments [collectively “Distributable earnings (losses)”] may differ for financial statement and tax purposes primarily due to differing treatments of wash sales, foreign currency transactions, deferred compensation, corporate actions, equalization accounting, and partnership income. The character of dividends and distributions made during the fiscal year from net investment income and net realized securities gains may differ from their ultimate characterization for federal income tax purposes. Also, due to the timing of dividends and distributions, the fiscal year in which amounts are distributed may differ from the fiscal year in which income or realized gain was recorded by the Fund. The Fund adjusts certain components of capital to reflect permanent differences between financial statement amounts and net income and realized gains/losses determined in accordance with income tax rules. The Fund’s net assets have not been affected by these reclassifications. During the year ended December 31, 2018, amounts have been reclassified to reflect increases (decreases) as follows:
| Distributable earnings | $ | (3,424,043) |
| Paid-in capital | | 3,424,043 |
The tax character of distributions paid during the years ended December 31, 2018 and 2017 was as follows:
| | 2018 | | 2017 |
| Ordinary income | $ | 9,363,107 | | $ | 15,612,366 |
| Long-term capital gain | | 83,253,212 | | | 52,678,439 |
| Total | $ | 92,616,319 | | $ | 68,290,805 |
As of December 31, 2018, the components of distributable earnings on a tax basis were as follows:
| Undistributed ordinary income | | $ | 857,741 |
| Undistributed long-term capital gain | | | 6,232,222 |
Net unrealized appreciation on investments and foreign currency transactions | | | 175,113,231 |
| Total | | $ | 182,203,194 |
Indemnification - Under the Fund’s organizational documents, its officers and trustees are indemnified against certain liabilities arising out of the performance of their duties to the Fund. In addition, some of the Fund’s contracts with its service providers contain general indemnification clauses. The Fund’s maximum exposure under these arrangements is unknown since the amount of any future claims that may be made against the Fund cannot be determined and the Fund has no historical basis for predicting the likelihood of any such claims.
Use of Estimates in Financial Statements - In preparing financial statements in conformity with accounting principles generally accepted in the United States of America, management makes estimates and assumptions that affect the reported amounts of assets and liabilities and disclosure of contingent assets and liabilities at the date of the financial statements, as well as the reported amounts of income and expenses during the reporting period. Actual results may differ from these estimates.
Trustees Fees and Expenses - The Fund set up a Rabbi Trust to provide for the deferred compensation plan for Independent Trustees that enables them to elect to defer receipt of all or a portion of annual fees they are entitled to receive. The value of an eligible Trustees’ account is based upon years of service and fees paid to each Trustee during the years of service. The amount paid to the Trustee by the Trust under the plan will be determined based upon the performance of the Funds in which the amounts are invested.
CLIPPER FUNDSM | Notes to Financial Statements – (Continued) |
| | December 31, 2018 |
NOTE 2 - PURCHASES AND SALES OF SECURITIES
The cost of purchases and proceeds from sales of investment securities (excluding short-term securities) during the year ended December 31, 2018 were $261,533,092 and $296,284,204, respectively.
NOTE 3 - FEES AND OTHER TRANSACTIONS WITH SERVICE PROVIDERS (INCLUDING AFFILIATES)
Davis Selected Advisers-NY, Inc. (“DSA-NY”), a wholly-owned subsidiary of the Adviser, acts as sub-adviser to the Fund. DSA-NY performs research and portfolio management services for the Fund under a Sub-Advisory Agreement with the Adviser. The Fund pays no fees directly to DSA-NY.
All officers of the Fund (including Interested Trustees) hold positions as executive officers with the Adviser or its affiliates.
Investment Advisory Fees - Advisory fees are paid monthly to the Adviser. The annual rate is 0.55% of the average net assets for the first $3 billion, 0.54% on the next $1 billion, 0.53% on the next $1 billion, 0.52% on the next $1 billion, 0.51% on the next $1 billion, 0.50% on the next $3 billion, and 0.485% of the average net assets greater than $10 billion. Advisory fees paid during the year ended December 31, 2018 approximated 0.55% of average net assets.
Transfer Agent and Accounting Fees - DST Asset Manager Solutions, Inc. is the Fund’s primary transfer agent. The Adviser is also paid for certain transfer agent services. The fee paid to the Adviser for these services during the year ended December 31, 2018 amounted to $69,438. State Street Bank and Trust Company (“State Street Bank”) is the Fund’s primary accounting provider. Fees for such services are included in the custodian fees as State Street Bank also serves as the Fund’s custodian.
NOTE 4 - CAPITAL STOCK
At December 31, 2018, there were unlimited shares of capital stock (no par value) authorized. Transactions in capital stock were as follows:
| | Year ended December 31, 2018 |
| | | Sold | | | Reinvestment of Distributions | | | Redeemed | | | Net Decrease |
| | | | | | | | | | | | |
| Shares | | 527,732 | | | 822,536 | | | (1,403,109) | | | (52,841) |
| Value | $ | 60,197,416 | | $ | 89,150,695 | | $ | (161,111,602) | | $ | (11,763,491) |
| | | | | | | | | | | | |
| |
| | Year ended December 31, 2017 |
| | | Sold | | | Reinvestment of Distributions | | | Redeemed | | | Net Decrease |
| | | | | | | | | | | | |
| Shares | | 509,897 | | | 563,465 | | | (2,385,486) | | | (1,312,124) |
| Value | $ | 58,605,409 | | $ | 65,865,984 | | $ | (270,893,526) | | $ | (146,422,133) |
| | | | | | | | | | | | |
CLIPPER FUNDSM | Notes to Financial Statements – (Continued) |
| | December 31, 2018 |
NOTE 5 - SECURITIES LOANED
The Fund has entered into a securities lending arrangement with State Street Bank. Under the terms of the agreement, the Fund receives fee income from lending transactions; in exchange for such fees, State Street Bank is authorized to loan securities on behalf of the Fund, against receipt of collateral at least equal to the value of the securities loaned. As of December 31, 2018, the Fund did not have any securities on loan. The Fund bears the risk of any deficiency in the amount of the collateral available for return to a borrower due to a loss in an approved investment.
NOTE 6 - RESTRICTED SECURITIES
Restricted securities are not registered under the Securities Act of 1933 and may have contractual restrictions on resale. They are fair valued under methods approved by the Board of Trustees. The aggregate value of restricted securities amounted to $29,042,904 or 3.09% of the Fund’s net assets as of December 31, 2018. Information regarding restricted securities is as follows:
| Security | | Initial Acquisition Date | | Units/Shares | | Cost per Unit/ Share | | Valuation per Unit/Share as of December 31, 2018 |
ASAC II L.P. | | 10/10/13 | | 407,313 | | $ | 1.00 | | $ | 0.9773 |
| Didi Chuxing Joint Co., Series A, Pfd. | | 04/22/16 | | 524,409 | | | 38.2271 | | | 46.50 |
| Didi Chuxing Joint Co., Series B, Pfd. | | 05/16/17 | | 91,609 | | | 50.9321 | | | 46.50 |
| The following financial information represents selected data for each share of capital stock outstanding throughout each period: |
| | Year ended December 31, |
| | 2018 | | 2017 | | 2016 | | 2015 | | 2014 |
| Net Asset Value, Beginning of Period | | $ | 120.46 | | $ | 108.72 | | $ | 104.41 | | $ | 98.79 | | $ | 92.07 |
Income (Loss) from Investment Operations: | | | | | | | | | | | | | | | | | | | | | | | | | |
Net Investment Incomea | | 0.92 | | 0.75 | | 0.65 | | 0.51 | | 0.35 |
| Net Realized and Unrealized Gains (Losses) | | (15.56) | | 18.16 | | 15.00 | | 5.85 | | 6.78 |
| | Total from Investment Operations | | (14.64) | | 18.91 | | 15.65 | | 6.36 | | 7.13 |
Dividends and Distributions: | | | | | | | | | | | | | | | | | | | | | | | | | |
| Dividends from Net Investment Income | | (0.88) | | (0.80) | | (1.19) | | (0.50) | | (0.41) |
| Distributions from Realized Gains | | (8.85) | | (6.37) | | (10.15) | | (0.24) | | – |
| | Total Dividends and Distributions | | (9.73) | | (7.17) | | (11.34) | | (0.74) | | (0.41) |
| Net Asset Value, End of Period | | $ | 96.09 | | $ | 120.46 | | $ | 108.72 | | $ | 104.41 | | $ | 98.79 |
Total Returnb | | (12.92) | % | | 17.69 | % | | 15.62 | % | | 6.44 | % | | 7.75 | % |
Ratios/Supplemental Data: | | | | | | | | | | | | | | | | | | | | | | | | | |
| Net Assets, End of Period (in millions) | | $ | 940
| | | $ | 1,185
|
| | $ | 1,212
| | | $ | 1,216
| | | $ | 1,109
| |
| Ratio of Expenses to Average Net Assets: | | | | | | | | | | | | | | | | | | | | | | | | | |
| | Gross | | 0.71 | % | | 0.71 | % | | 0.72 | % | | 0.72 | % | | 0.74 | % |
| | Netc | | 0.71 | % | | 0.71 | % | | 0.72 | % | | 0.72 | % | | 0.74 | % |
| Ratio of Net Investment Income to Average Net Assets | | 0.77 | % | | 0.66 | % | | 0.63 | % | | 0.50 | % | | 0.36 | % |
Portfolio Turnover Rated | | 24 | % | | 17 | % | | 33 | % | | 31 | % | | 38 | % |
| a | Per share calculations were based on average shares outstanding for the period. |
| |
| b | Assumes hypothetical initial investment on the business day before the first day of the fiscal period, with all dividends and distributions reinvested in additional shares on the reinvestment date, and redemption at the net asset value calculated on the last business day of the fiscal period. |
| |
| c | The Net Ratio of Expenses to Average Net Assets reflects the impact, if any, of certain reimbursements. |
| |
| d | The lesser of purchases or sales of portfolio securities for a period, divided by the monthly average of the market value of portfolio securities owned during the period. Securities with a maturity or expiration date at the time of acquisition of one year or less are excluded from the calculation. |
| |
| See Notes to Financial Statements |
CLIPPER FUNDSM | Report of Independent Registered Public Accounting Firm |
The Shareholders and Board of Trustees
Clipper Funds Trust:
Opinion on the Financial Statements
We have audited the accompanying statement of assets and liabilities of Clipper Fund (a series of Clipper Funds Trust) (the “Fund”), including the schedule of investments, as of December 31, 2018, the related statement of operations for the year then ended, the statements of changes in net assets for each of the years in the two-year period then ended, and the related notes (collectively, the “financial statements”) and the financial highlights for each of the years in the five-year period then ended. In our opinion, the financial statements and financial highlights present fairly, in all material respects, the financial position of the Fund as of December 31, 2018, the results of its operations for the year then ended, the changes in its net assets for each of the years in the two-year period then ended, and the financial highlights for each of the years in the five-year period then ended, in conformity with U.S. generally accepted accounting principles.
Basis for Opinion
These financial statements and financial highlights are the responsibility of the Fund’s management. Our responsibility is to express an opinion on these financial statements and financial highlights based on our audits. We are a public accounting firm registered with the Public Company Accounting Oversight Board (United States) (“PCAOB”) and are required to be independent with respect to the Fund in accordance with the U.S. federal securities laws and the applicable rules and regulations of the Securities and Exchange Commission and the PCAOB.
We conducted our audits in accordance with the standards of the PCAOB. Those standards require that we plan and perform the audit to obtain reasonable assurance about whether the financial statements and financial highlights are free of material misstatement, whether due to error or fraud. Our audits included performing procedures to assess the risks of material misstatement of the financial statements and financial highlights, whether due to error or fraud, and performing procedures that respond to those risks. Such procedures included examining, on a test basis, evidence regarding the amounts and disclosures in the financial statements and financial highlights. Such procedures also included confirmation of securities owned as of December 31, 2018, by correspondence with the custodian and brokers or by other appropriate auditing procedures. Our audits also included evaluating the accounting principles used and significant estimates made by management, as well as evaluating the overall presentation of the financial statements and financial highlights. We believe that our audits provide a reasonable basis for our opinion.
KPMG LLP
We have served as the Fund’s auditor since 2006.
Denver, Colorado
February 20, 2019
CLIPPER FUNDSM | Federal Income Tax Information (Unaudited) |
In early 2019, shareholders received information regarding all dividends and distributions paid to them by the Fund during the calendar year 2018. Regulations of the U.S. Treasury Department require the Fund to report this information to the Internal Revenue Service.
The information and distributions reported herein may differ from the information reported as distributions taxable to certain shareholders for the calendar year 2018 with their 2018 Form 1099-DIV.
During the calendar year 2018, $9,363,107 of dividends paid by the Fund constituted income dividends for federal income tax purposes. The Fund designates $8,970,916 or 96% as income qualifying for the corporate dividends-received deduction.
For the calendar year 2018, certain dividends paid by the Fund constitute qualified dividend income for federal income tax purposes. The Fund designates $9,268,784 or 99% as qualified dividend income.
During the calendar year 2018, the Fund paid long-term capital gain distributions in the amount of $83,253,212. The Fund utilized equalization accounting for tax purposes, whereby a portion of redemption payments were treated as distributions of long-term capital gain. As a result, the Fund designated long-term capital gain distributions in the amount of $86,677,256.
The foregoing information is presented to assist shareholders in reporting dividends and distributions received from the Fund to the Internal Revenue Service. Because of the complexity of the federal regulations, which may affect your individual tax return and the many variations in state and local tax regulations, we recommend that you consult your tax adviser for specific guidance.
CLIPPER FUNDSM | Privacy Notice and Householding |
Privacy Notice
While you generally will be dealing with a broker-dealer or other financial adviser, we may collect information about you from your account application and other forms that you may deliver to us. We use this information to process your requests and transactions; for example, to provide you with additional information about the Fund, to open an account for you, or to process a transaction. In order to service your account and execute your transactions, we may provide your personal information to firms that assist us in servicing your account, such as our transfer agent. We may also provide your name and address to one of our agents for the purpose of mailing to you your account statement and other information about our products and services. We may also gather information through the use of “cookies” when you visit our website. These files help us to recognize repeat visitors and allow easy access to and use of the website. We require these outside firms and agents to protect the confidentiality of your information and to use the information only for the purpose for which the disclosure is made. We do not provide customer names and addresses to outside firms, organizations, or individuals except in furtherance of our business relationship with you or as otherwise allowed by law.
We restrict access to nonpublic personal information about you to those employees who need to know that information to provide products or services to you. We maintain physical, electronic, and procedural safeguards that comply with federal standards to guard your personal information.
Householding
To avoid sending duplicate copies of materials to households, the Fund will mail only one copy of each prospectus, Annual, and Semi-Annual Report to shareholders having the same last name and address on the Fund’s records. The consolidation of these mailings, called householding, benefits the Fund through reduced mailing expense. If you do not want the mailing of these documents to be combined with those to other members of your household, please contact the Clipper Fund by phone at 1-800-432-2504. Individual copies of current prospectuses and reports will be sent to you within 30 days after the Fund receives your request to stop householding.
For the purpose of their service as trustees to the Fund, the business address for each of the Trustees is 2949 E. Elvira Road, Suite 101, Tucson, AZ 85756. Subject to exceptions and exemptions, which may be granted by the Independent Trustees, Trustees must retire at the close of business on the last day of the calendar year in which the Trustee attains age seventy-eight (78).
Name, Date of Birth, Position(s) Held with Fund, Length of Service | Principal Occupation(s) During Past Five Years | Number of Portfolios Overseen | Other Directorships |
Independent Trustees
Francisco L. Borges (11/17/51) Trustee since 2014 | Chairman and Managing Partner, Landmark Partners, LLC (private equity firm) since March 1999. | 3 | Trustee, John S. and James L. Knight Foundation; Trustee, Connecticut Public Broadcasting Network; Chairman/Director, Assured Guaranty Ltd. (financial guaranty insurance business); Director, Leucadia National Corporation (holding company); Trustee, Millbrook School; Director, Selected Funds (consisting of two portfolios). |
| | | | |
Lawrence E. Harris (09/16/56) Trustee/Director since 2006 | Fred V. Keenan Chair in Finance of the Marshall School of Business, University of Southern California, Los Angeles, CA. | 3 | Director, Interactive Brokers Group, Inc.; Director, Selected Funds (consisting of two portfolios). |
| | | | |
Steven N. Kearsley (09/29/41) Trustee/Director since 2006 | Private Investor, Real Estate Development; Owner, Old Peak Tree Farm. | 3 | Director, Selected Funds (consisting of two portfolios). |
| | | | |
Katherine L. MacWilliams (01/19/56) Trustee since 2014 | Retired; Chief Financial Officer, Caridian BCT, Inc. (medical device company) 2008-2012. | 3 | Director, Selected Funds (consisting of two portfolios). |
| | | | |
James J. McMonagle (10/01/44) Trustee since 2014 Chairman since 2015 | Of Counsel to Vorys, Sater, Seymour and Pease LLP (law firm) since 2002. | 3 | Director, Owens Corning (producer of residential and commercial building materials); Director/Chairman, Selected Funds (consisting of two portfolios). |
| | | | |
Richard O’Brien (09/12/45) Trustee since 2014 | Retired; Corporate Economist, HP Inc. | 3 | Director, Selected Funds (consisting of two portfolios). |
Interested Trustees*
Andrew A. Davis (06/25/63) Trustee since 2014 | President or Vice President of each Selected Fund, Clipper Fund, and Davis Fund; President, Davis Selected Advisers, L.P., and also serves as an Executive Officer of certain companies affiliated with the Adviser. | 16 | Director, Selected Funds (consisting of two portfolios); Director, Davis Funds (consisting of 13 portfolios). |
| | | | |
Christopher C. Davis (07/13/65) Trustee since 2014 | President or Vice President of each Selected Fund, Davis Fund, Clipper Fund, and Davis Fundamental ETF; Chairman, Davis Selected Advisers, L.P., and also serves as an Executive Officer of certain companies affiliated with the Adviser, including sole member of the Adviser’s general partner, Davis Investments, LLC. | 16 | Director, Selected Funds (consisting of two portfolios); Director, Davis Funds (consisting of 13 portfolios); Lead Independent Director, Graham Holdings Company (educational and media company); Director, The Coca Cola Company (beverage company). |
* Andrew A. Davis and Christopher C. Davis own partnership units (directly, indirectly, or both) of the Adviser and are considered to be “interested persons” of the Funds as defined in the Investment Company Act of 1940. Andrew A. Davis and Christopher C. Davis are brothers.
Officers
Andrew A. Davis (born 06/25/63, Clipper Fund officer since 01/23/15). See description in the section on Interested Trustees.
Christopher C. Davis (born 07/13/65, Clipper Fund officer since 12/19/05). See description in the section on Interested Trustees.
Kenneth C. Eich (born 08/14/53, Clipper Fund officer since 12/19/05). Executive Vice President and Principal Executive Officer of Clipper Funds Trust (consisting of one portfolio), Davis Funds (consisting of 13 portfolios), and Selected Funds (consisting of two portfolios); Trustee/Chairman, Executive Vice President, and Principal Executive Officer of Davis Fundamental ETF Trust (consisting of four portfolios); Chief Operating Officer, Davis Selected Advisers, L.P., and also serves as an Executive Officer of certain companies affiliated with the Adviser.
Douglas A. Haines (born 03/04/71, Clipper Fund officer since 12/19/05). Vice President, Treasurer, Chief Financial Officer, Principal Financial Officer, and Principal Accounting Officer of Clipper Funds Trust (consisting of one portfolio), Davis Funds (consisting of 13 portfolios), Selected Funds (consisting of two portfolios), and Davis Fundamental ETF Trust (consisting of four portfolios); Vice President and Director of Fund Accounting, Davis Selected Advisers, L.P.
Randi J. Roessler (born 06/26/81, Clipper Fund officer since 01/01/18). Vice President and Chief Compliance Officer of Clipper Funds Trust (consisting of one portfolio), Davis Funds (consisting of 13 portfolios), Selected Funds (consisting of two portfolios), and Davis Fundamental ETF Trust (consisting of four portfolios); Vice President and Chief Compliance Officer, Davis Selected Advisers, L.P., and also serves as an Executive Officer of certain companies affiliated with the Adviser.
Ryan M. Charles (born 07/25/78, Clipper Fund officer since 01/01/14). Vice President and Secretary of Clipper Funds Trust (consisting of one portfolio), Davis Funds (consisting of 13 portfolios), Selected Funds (consisting of two portfolios), and Davis Fundamental ETF Trust (consisting of four portfolios); Vice President, Chief Legal Officer and Secretary, Davis Selected Advisers, L.P., and also serves as an Executive Officer of certain companies affiliated with the Adviser.
| Investment Adviser |
| Davis Selected Advisers, L.P. (Doing business as “Davis Advisors”) |
| 2949 East Elvira Road, Suite 101 |
| Tucson, Arizona 85756 |
| (800) 432-2504 |
| |
| Distributor |
| Davis Distributors, LLC |
| 2949 East Elvira Road, Suite 101 |
| Tucson, Arizona 85756 |
| |
| Transfer Agent |
| DST Asset Manager Solutions, Inc. |
| P.O. Box 219167 |
| Kansas City, Missouri 64121-9167 |
| |
| Overnight Address: |
| 430 West 7th Street, Suite 219167 |
| Kansas City, Missouri 64105-1407 |
| |
| Custodian |
| State Street Bank and Trust Co. |
| One Lincoln Street |
| Boston, Massachusetts 02111 |
| |
| Counsel |
| Greenberg Traurig, LLP |
| 77 West Wacker Drive, Suite 3100 |
| Chicago, Illinois 60601 |
| |
| Independent Registered Public Accounting Firm |
| KPMG LLP |
| 1225 Seventeenth Street, Suite 800 |
| Denver, Colorado 80202 |
For more information about Clipper Fund including management fee, charges, and expenses, see the current prospectus, which must precede or accompany this report. The Fund’s Statement of Additional Information contains additional information about the Fund’s Trustees and is available without charge, upon request, by contacting the Fund at 1-800-432-2504 and on the Fund’s website at www.clipperfund.com. Quarterly Fact Sheets are available on the Fund’s website at www.clipperfund.com.