Ryan M. Charles
Davis Selected Advisers, L.P.
Cautionary Statement
Davis Advisors is committed to communicating with our investment partners as candidly as possible because we believe our investors benefit from understanding our investment philosophy and approach. Our views and opinions regarding the investment prospects of our portfolio holdings include "forward looking statements" which may or may not be accurate over the long term. While we believe we have a reasonable basis for our appraisals and we have confidence in our opinions, actual results may differ materially from those we anticipate. These opinions are current as of the date of this report but are subject to change. The information provided in this report should not be considered a recommendation to buy, sell, or hold any particular security.
You can identify forward looking statements by words like "believe," "expect," "anticipate," or similar expressions when discussing prospects for particular portfolio holdings and/or of the Fund. We cannot assure future results and achievements. You should not place undue reliance on forward looking statements, which speak only as of the date of this report. We disclaim any obligation to update or alter any forward looking statements, whether as a result of new information, future events, or otherwise. This material must be preceded or accompanied by a prospectus. Please read the prospectus carefully for a discussion of investment objectives, risks, fees, and expenses. Current performance may be lower or higher than the performance quoted herein. You may obtain a current copy of the Fund's Prospectus or more current performance information by calling Investor Services at 1-800-432-2504 or on Clipper Fund's website (www.clipperfund.com).
CLIPPER FUNDSM | Table of Contents |
| 2 |
| | |
| 9 |
| | |
| 11 |
| | |
| 13 |
| | |
| 14 |
| | |
| 16 |
| | |
| 17 |
| | |
| 18 |
| | |
| 19 |
| | |
| 24 |
| | |
| 25 |
| | |
| 26 |
| | |
| 27 |
| | |
| 28 |
This Annual Report is authorized for use by existing shareholders. Prospective shareholders must receive a current Clipper Fund Prospectus, which contains more information about investment strategies, risks, fees, and expenses. Please read the prospectus carefully before investing or sending money.
Shares of Clipper Fund are not deposits or obligations of any bank, are not guaranteed by any bank, are not insured by the FDIC or any other agency, and involve investment risks, including possible loss of the principal amount invested.
Portfolio Proxy Voting Policies and Procedures
The Fund has adopted Portfolio Proxy Voting Policies and Procedures under which the Fund votes proxies relating to securities held by the Fund. A description of the Fund's Portfolio Proxy Voting Policies and Procedures is available (i) without charge, upon request, by calling the Fund toll-free at 1-800-432-2504, (ii) on the Fund's website at www.clipperfund.com, and (iii) on the SEC's website at www.sec.gov.
In addition, the Fund is required to file Form N-PX, with its complete proxy voting record for the 12 months ended June 30th, no later than August 31st of each year. The Fund's Form N-PX filing is available (i) without charge, upon request, by calling the Fund toll-free at 1-800-432-2504, (ii) on the Fund's website at www.clipperfund.com, and (iii) on the SEC's website at www.sec.gov.
Form N-Q
The Fund files its complete schedule of portfolio holdings with the SEC for the first and third quarters of each fiscal year on Form N-Q. The Fund's Form N-Q is available without charge, upon request, by calling 1-800-432-2504, on the Fund's website at www.clipperfund.com, and on the SEC's website at www.sec.gov. The Fund's Form N-Q may be reviewed and copied at the SEC's Public Reference Room in Washington, DC, and information on the operation of the Public Reference Room may be obtained by calling 1-800-SEC-0330.
Results of Our Investment Discipline
Our investment discipline has built wealth for shareholders over the long term. Clipper Fund's 2015 results exceeded the market averages and compared well with other investors. More important, 2015 performance built on the improved absolute and relative results achieved since 2010. Specifically, shareholder wealth in Clipper Fund increased a cumulative 6%, 54% and 77% over the last one, three and five years, respectively.1 As Clipper Fund's managers, we have two objectives: to earn a satisfactory absolute investment return and to generate relative results in excess of the S&P 500® Index. In recent years, we have achieved both goals. Over longer periods, we have fired on only one cylinder as shown in the table below. Although we consider absolute returns paramount and more recent results satisfactory, we still have ground to make up since being entrusted with the Fund's management in 2006. However, the fact each dollar entrusted to us since we began managing Clipper near the highs of the last bull market is now worth 62% more despite the real estate bubble, the financial crisis, the great recession, the euro crisis, and the collapse of many well-regarded financial institutions means at least shareholder wealth has grown during these unprecedented times.1
| Average Annual Total Returns as of December 31, 2015 |
| | 1 Year | 3 Years | 5 Years | 10 Years | 15 Years | 20 Years | Since Inception (1/1/06)2 |
| Clipper Fund | 6.44% | 15.46% | 12.08% | 4.97% | 5.18% | 8.73% | 4.79% |
S&P 500® Index | 1.38% | 15.13% | 12.57% | 7.31% | 5.00% | 8.19% | 7.31% |
The performance presented represents past performance and is not a guarantee of future results. Total return assumes reinvestment of dividends and capital gain distributions. Investment return and principal value will vary so that, when redeemed, an investor's shares may be worth more or less than their original cost. The total annual operating expense ratio as of the most recent prospectus was 0.74%. The total annual operating expense ratio may vary in future years. Current performance may be higher or lower than the performance quoted. For most recent month-end performance, visit clipperfund.com or call 800-432-2504. The Fund received favorable class action settlements from companies that it no longer owns. These settlements had a material impact on the investment performance of the Fund in 2009. These were one-time events that are unlikely to be repeated. Clipper Fund was managed from inception, February 29, 1984, until December 31, 2005 by another Adviser. Davis Selected Advisers, L.P. took over management of the Fund on January 1, 2006.
Our focus on growing the absolute value of the funds entrusted to our care is driven in part by our significant co-investment. Our firm, our families and our colleagues collectively have more than $100 million invested alongside our shareholders.3 Our focus on absolute growth is also driven by our stewardship responsibility to Clipper Fund's shareholders. Whether saving for retirement, a child's education or some other purpose, shareholders are entrusting their savings to us with the hope we will help them achieve their financial goals by growing the value of their savings over the long term.
To achieve the goal of growing shareholder wealth over the long term, we invest exclusively in equities, using our time-tested research approach to seek out durable, well-managed businesses that can be purchased at attractive valuations. Although at times the rate of growth we achieve may be faster or slower, our steadfast focus on equities combined with an investment discipline centered on research, careful stock selection and a long-term perspective has helped us increase the value of our clients' savings.
However, we have not and will not retreat from our secondary goal of achieving returns that exceed the S&P 500® Index. As active managers, we know we will go through periods when our results trail the market, particularly when indexing and other
_________________________________
This report includes candid statements and observations regarding investment strategies, individual securities, and economic and market conditions; however, there is no guarantee that these statements, opinions or forecasts will prove to be correct. Equity markets are volatile and an investor may lose money. Past performance is not a guarantee of future results.
1 Past performance is not a guarantee of future results.
2 Date shown is the day Davis Advisors began management of the Fund. Prior to that date, the Fund was managed by a different investment adviser.
3 As of December 31, 2015.
Not a part of Annual Report to Fund shareholders
CLIPPER FUNDSM | Shareholder Letter – (Continued) |
momentum-based strategies are galloping ahead. We have been through such times before and have always emerged in a strong position. Recently, for example, the robust performance of a number of our large holdings, including Wells Fargo, Google (now renamed Alphabet, with Google just one part of its group of companies), Bank of New York Mellon, and Amazon.com, has driven strong absolute returns.4 At the same time, our decision to avoid a number of companies and sectors that have done particularly well but that do not offer investors sustainable long-term opportunities in our view has detracted from our relative results. Our decision to avoid these businesses rests on our experience, judgment and analysis, all of which indicate that in our opinion the companies are either overvalued or riskier than they appear. As has historically been the case, we believe the relative drag experienced by not owning such companies will reverse in the years ahead.
In the pages that follow, we will describe why we believe the combination of strong results at the companies we own, the faltering prospects of a number of widely held companies we have chosen to avoid and the opportunities presented by the stock market's recent volatility (more about this later) should lead to strong results in the years ahead. While too short a period to extrapolate, we are gratified our results over the last three years exceeded the market and compared favorably to other equity managers. More important, despite these good short-term results, many of our large holdings and new purchases trade at significant discounts to the averages, positioning us well for the years ahead should these companies be appropriately revalued.
Market Outlook
Volatility creates opportunity, not risk: Fluctuations and economic and political uncertainty are the rule, not the exception.
From the lows of 2009 until the middle of 2015, the market raced steadily higher. In fact, by August 2015 the market had enjoyed its longest stretch without a 10% correction in more than 20 years and the third longest stretch since 1928. In short, this was an exceptional period. Since then, market gyrations have reappeared with volatility increasing throughout the remainder of 2015 and thus far in 2016. Having grown accustomed to a constantly rising market and low volatility, commentators and newspapers are using words such as rout, collapse and turmoil. Such sensational headlines generate considerable excitement compared to statements that might suggest a 10%-20% decline after a 200% gain should not be cause for alarm, though this more sober language is more accurate. While the market generates a positive return in most years, occasional negative years are inevitable. In fact, in one out of four years since 1928, the market has generated a negative one year return.
As an uncommon but inevitable part of the investment landscape, stock market declines present both risks and opportunities. The risks are emotional and the opportunities economic. The emotional risk is that investors become so nervous and fearful they sell their investments at depressed prices. The economic opportunity is that investors recognize the chance to increase future returns by buying more at lower prices.
To avoid the risk and take advantage of the opportunity, investors must remember declining prices are not the same as declining values. Shoppers understand this difference and generally welcome falling prices as the chance to buy more for less. With stocks, the principle is the same and yet many investors' emotions lead them to react differently. Forgetting the wisdom of the adage "price is what you pay, value is what you get" they dread falling prices instead of welcoming them. Successful long-term investors must keep such irrational emotions in check.
The most effective way to combat such irrationality is to recognize that stocks represent ownership interests in real businesses and the value of a business is determined by the earnings and cash it produces over the long term. Because we tend to own companies for many years, we already incorporate a range of different economic and political environments into our valuations. After all, as Heraclitus observed more than two thousand years ago, "The only thing constant is change." Today, for example, commentators cite the risk of falling energy prices, rising interest rates, a weakening Chinese economy,
_________________________________
4 Individual securities are discussed in this piece. While we believe we have a reasonable basis for our appraisals and we have confidence in our opinions, actual results may differ materially from those we anticipate. The return of a security to the Fund will vary based on weighting and timing of purchase. This is not a recommendation to buy, sell or hold any specific security. Past performance is not a guarantee of future results.
Not a part of Annual Report to Fund shareholders
CLIPPER FUNDSM | Shareholder Letter – (Continued) |
and the strengthening dollar as major concerns. A few short years ago, they worried about the opposite: high energy prices, near zero interest rates, China's economic strength, and a weak dollar. We use this example not to minimize the importance of economic and political concerns but rather to highlight that such risks are a constant part of the investment landscape. What varies is investors' perception concerning these risks. When prices are high, investors optimistically focus only on the positives. When prices are low, they pessimistically focus only on the risks.
In managing Clipper Fund, we are determined to be neither optimists nor pessimists but realists, focused on facts not emotions. While the macroeconomic factors discussed above can have an impact on earnings in the short run, the key driver of long-term earnings power is the durability of a company's competitive advantage. In general, the various economic and political factors currently worrying investors and depressing prices have almost no impact on the long-term earnings power of the majority of companies we own.
By focusing on the steady and relentless growth in the earnings power and thus the value of our long-term holdings, we and our investors can tune out unsettling short-term price volatility. When the headlines emphasize turmoil and uncertainty, just remember in general the companies we own grow more valuable every day by serving new customers, expanding into new markets, developing new products, researching innovative technologies, and reinforcing their competitive advantages. Over the long term, this growth in value will drive shareholder returns. With such companies at the heart of our Portfolio, we intend to extend our record of growing the value of our clients' savings in the years and decades ahead.
The Portfolio
Long-term compounders, quality on sale, the blue chips of tomorrow, and timely investment themes.
The core of Clipper Fund includes an exceptional group of companies with fundamental competitive advantages. The specific nature of each company's competitive advantage can vary widely from economies of scale (Liberty Global) and geographic dominance (LafargeHolcim) to intellectual property (Monsanto) and brand equity (American Express and Activision, owner of brands such as World of Warcraft and Call of Duty). In some cases competitive advantage was built over centuries (Wells Fargo and Bank of New York Mellon), in others over decades (Berkshire Hathaway, CarMax and UnitedHealth Group), and in two extraordinary cases established in just a few short years (Google and Amazon). But whatever the nature or history of a company's competitive advantage, the result is the same: the ability to earn strong returns over the long term.
Although the short-term stock performance of these core holdings may be driven by the vagaries of market sentiment, their long-term returns will be driven by the competitive advantages of their underlying businesses. These advantages are the key requirement for a business to become a wealth-compounding machine.
While we build and manage the Portfolio from the bottom up, analyzing and evaluating each investment on its own merits, we would highlight three key investment themes as the biggest areas of opportunity in the current market environment.
First, one notable aspect of the recent sell-off in stocks has been its indiscriminate and broad-based nature. As investors increasingly succumb to fear and panic, they tend to disregard fundamentals and sell across the board. As a result, we have the unusual opportunity to acquire or add to a select handful of wonderful industrial leaders at bargain prices. Such opportunities are rare and precisely our area of expertise. While pinpointing a single reason why the share prices of a number of these high-quality companies have faltered, some concerns mentioned earlier, including currency effects, slowing Chinese growth and general economic concerns, may play a part. Whatever the cause, these companies' share prices have fallen significantly, allowing us to add to or build new positions at highly attractive valuations. We call this opportunity quality on sale. Importantly, while some of the factors mentioned might have a short-term impact on reported profits, none threatens the fundamental competitive advantages or durability of these companies' underlying businesses. As an example, the prices of United Technologies, Monsanto and LafargeHolcim have each fallen more than 20% with the result that shares in these outstanding companies can be purchased at a discount to the average company. Even Berkshire Hathaway's stock has languished to the point its shares now trade only slightly above the level at which management has indicated they would consider the shares sufficiently undervalued to begin a repurchase program.
Not a part of Annual Report to Fund shareholders
CLIPPER FUNDSM | Shareholder Letter – (Continued) |
A second area of opportunity is best captured by the statement today's disrupters are tomorrow's blue chips. Over the decades, we have often seen companies we considered disrupters underestimated and disregarded by investors who overemphasized the short operating histories and relative small size of these businesses while undervaluing their powerful and durable competitive advantages. But as disrupters relentlessly grow, perceptions change. Established competitors lose market share and disrupters become the new blue chips. Over the decades, we have seen companies such as Charles Schwab, once viewed as a fringe discount broker, become a trusted financial brand and Costco evolve from a niche retailer to a global retail giant. We have owned these companies for many years and continue to believe they have room to grow.
Today technology is accelerating the pace of disruption. This change is best seen by contrasting the history of a past disrupter Walmart with a new disrupter Amazon. Walmart opened its first store in 1962 and, with its everyday low pricing model, strong management and tight cost control, enjoyed real competitive advantages relative to the much larger and better regarded existing competition. Eighteen years later, the company reached $1 billion in sales and today has sales approaching $500 billion, dwarfing its competitors such as Kmart and Sears that have largely been left in the dust. In contrast, Amazon has disrupted entrenched competitors in a matter of years not decades. Remembering Walmart took 18 years to reach sales of $1 billion, we consider it astonishing that Amazon was selling approximately $95 billion worth of merchandise in its 18th year, almost 100 times more than Walmart sold during the comparable period in its history.
With Amazon achieving success at such a rapid pace, investors who were slow to study the company because of its short operating history not only missed out on its potential as an investment but also were slow to identify the threat it posed to so many other retailers. Companies ranging from Borders and Blockbuster to Circuit City and RadioShack have already filed for bankruptcy and many more are sure to follow. While extraordinary, Amazon is hardly a lone example. Companies such as Google, Netflix and Facebook have overpowered many traditional media businesses, Uber and AirBNB are challenging the taxi and hotel industries, and a number of new companies are using biotechnology to challenge traditional pharmaceutical businesses. The bottom line is technological disruption is rapidly changing the investment landscape, creating great opportunities for investors who can adapt and enormous risks for investors who cannot.
The third theme is our constant interest in those areas of the market most out of favor with investors provided the underlying companies deliver essential products and services that are difficult if not impossible to bypass. Today, two sectors fit the bill: financial services and energy. In each, we are interested only in those companies that will emerge from the turmoil in a stronger position. In the financial sector, for example, American Express, JPMorgan Chase and Wells Fargo have consistently generated strong long-term returns on equity even through the turmoil of the worst financial crisis since the 1930s. Each also took advantage of the chaos resulting from the crisis to grow market share and as a result all are enjoying record profitability despite being more conservatively capitalized. Looking ahead, although these companies are benefiting from today's benign credit environment, earnings per share at each should still rise as regulatory, legal and compliance costs moderate, interest rates normalize and shares are repurchased at bargain prices.
In the energy sector, the steep decline in oil and gas prices has led to collapsing profitability, causing investors to flee the sector. In such a chaotic price environment, we have focused on the basic economics of supply and demand. Starting with demand, energy consumption continues to rise as cars are still driven, homes heated and electricity produced. In fact, falling prices actually increase demand as cheap energy leads consumers to drive more, utilities to switch from higher cost alternatives and industrial companies to add capacity where lower cost energy is available. As for supply, economics dictate sooner or later prices must rise high enough that companies have an incentive to produce enough energy to satisfy demand. Our research conclusively indicates the price required for companies to produce the amount of oil and gas needed may be almost twice the current price. Although such imbalances can persist for years because of factors such as geopolitics and costs incurred that cannot be recovered, eventually prices must adjust. Our long-term perspective allows us to build positions in specific energy companies now that will benefit from the eventual and inevitable price increases we expect. In selecting individual companies, we continue to focus on those businesses with the lowest cost positions in some of the largest energy fields in North America. We look for the combination of sensible management, a strong balance sheet, great geological formations, and leading technology that gives companies a global competitive advantage. Recent purchases that meet these criteria include Cabot Oil & Gas, Apache and Encana.
Not a part of Annual Report to Fund shareholders
CLIPPER FUNDSM | Shareholder Letter – (Continued) |
Risk is Value Destruction not Price Volatility
Diminished purchasing power is the key value-destroying risk facing investors today.
Because we focus on value instead of price, we do not consider short-term stock market volatility a risk. Instead, we define risk as long-term value destruction. For today's investors, the potential loss of purchasing power on the dollars they save is one of the largest value-destroying risks they face.
Over virtually all periods of history, purchasing power erodes as prices for goods and services relentlessly rise. While this is a timeless concern, low current interest rates have made this a far greater risk for today's investors than at any time in the last 50 years. To understand this risk, consider that in the last 50 years the purchasing power of a dollar has declined more than 85%. In other words, if someone had put a one dollar bill under the mattress in 1965 and took it out today, that one dollar bill would only buy about one-sixth as much as it did in 1965. Such statistics are given life when we consider back then a McDonald's hamburger cost 15 cents, a gallon of gas cost 31 cents and a full year's university tuition (including room and board) cost less than $2,500.
Over this same period, however, people who chose to save their money rather than spend it were paid interest on their savings at a rate that had a reasonable chance of offsetting rising prices and thus maintaining their purchasing power. Over this entire period, for example, interest paid on a one year savings bond averaged approximately 5.5%. While interest rates fluctuated enormously during this period, only in the last five years have they fallen below 4% and now stand near zero, their lowest levels in more than a century.5
As a result, available interest rates seem unlikely to offset rising prices over the long term leaving savers, whether they are in bank deposits or government bonds, facing a high risk of diminished purchasing power in the years and decades ahead. As indicated by the amount of money pouring into both bank deposits and bond funds, savers seem unaware of the risk they are taking. Compared to such meager interest rates, the valuations of the companies we own in Clipper Fund are especially attractive. In fact, in a number of cases, these companies' current dividends now exceed bond yields and are likely to grow in the years ahead.
Conclusion
At a time of increasing volatility, economic uncertainty and low interest rates, the long- term outlook for the durable, well-run and attractively valued companies that make up Clipper Fund remains strong. We are gratified the Fund's performance has steadily improved in recent years and are committed to building on these gains. Based on the experience of our team and the characteristics of the companies we own, we remain confident about the future. As always, we are mindful of our responsibility and grateful for the trust you have placed in us.
Sincerely,
 |  |
| Christopher C. Davis | Danton G. Goei |
| President & Portfolio Manager | Portfolio Manager |
| |
| February 5, 2016 |
_________________________________
5 Source: Richard W. Paul & Associates.
Not a part of Annual Report to Fund shareholders
CLIPPER FUNDSM | Shareholder Letter – (Continued) |
This report is authorized for use by existing shareholders. A current Clipper Fund prospectus must accompany or precede this material if it is distributed to prospective shareholders. You should carefully consider the Fund's investment objective, risks, fees, and expenses before investing. Read the prospectus carefully before you invest or send money.
This report includes candid statements and observations regarding investment strategies, individual securities, and economic and market conditions; however, there is no guarantee that these statements, opinions or forecasts will prove to be correct. These comments may also include the expression of opinions that are speculative in nature and should not be relied on as statements of fact.
Objective and Risks. Clipper Fund's investment objective is long-term capital growth and capital preservation. There can be no assurance that the Fund will achieve its objective. The Fund invests primarily in equity securities issued by large companies with market capitalizations of at least $10 billion. Some important risks of an investment in the Fund are: stock market risk: stock markets have periods of rising prices and periods of falling prices, including sharp declines; manager risk: poor security selection may cause the Fund to underperform relevant benchmarks; common stock risk: an adverse event may have a negative impact on a company and could result in a decline in the price of its common stock; large-capitalization companies risk: companies with $10 billion or more in market capitalization generally experience slower rates of growth in earnings per share than do mid- and small-capitalization companies; mid- and small-capitalization companies risk: companies with less than $10 billion in market capitalization typically have more limited product lines, markets and financial resources than larger companies, and may trade less frequently and in more limited volume; headline risk: the Fund may invest in a company when the company becomes the center of controversy. The company's stock may never recover or may become worthless; focused portfolio risk: investing in a limited number of companies causes changes in the value of a single security to have a more significant effect on the value of the Fund's total portfolio; financial services risk: investing a significant portion of assets in the financial services sector may cause the Fund to be more sensitive to systemic risk, regulatory actions, changes in interest rates, non-diversified loan portfolios, credit, and competition; foreign country risk: foreign companies may be subject to greater risk as foreign economies may not be as strong or diversified; As of December 31, 2015, the Fund had approximately 4.7% of assets invested in foreign companies; foreign currency risk: the change in value of a foreign currency against the U.S. dollar will result in a change in the U.S. dollar value of securities denominated in that foreign currency; depositary receipts risk: depositary receipts may trade at a discount (or premium) to the underlying security and may be less liquid than the underlying securities listed on an exchange; and fees and expenses risk: the Fund may not earn enough through income and capital appreciation to offset the operating expenses of the Fund. See the prospectus for a complete description of the principal risks.
Davis Advisors is committed to communicating with our investment partners as candidly as possible because we believe our investors benefit from understanding our investment philosophy and approach. Our views and opinions include "forward-looking statements" which may or may not be accurate over the long term. Forward-looking statements can be identified by words like "believe," "expect," "anticipate," or similar expressions. You should not place undue reliance on forward-looking statements, which are current as of the date of this report. We disclaim any obligation to update or alter any forward-looking statements, whether as a result of new information, future events, or otherwise. While we believe we have a reasonable basis for our appraisals and we have confidence in our opinions, actual results may differ materially from those we anticipate.
Not a part of Annual Report to Fund shareholders
CLIPPER FUNDSM | Shareholder Letter – (Continued) |
The information provided in this material should not be considered a recommendation to buy, sell or hold any particular security. As of December 31, 2015, the top ten holdings of Clipper Fund were:
| Amazon.com, Inc. | 8.74% |
| Alphabet Inc.* | 7.38% |
| Berkshire Hathaway Inc., Class A | 7.17% |
| Markel Corp. | 6.90% |
| American Express Co. | 6.16% |
| ASAC II L.P. | 5.45% |
| United Technologies Corp. | 4.85% |
| Monsanto Co. | 4.83% |
| Bank of New York Mellon Corp. | 4.65% |
| JPMorgan Chase & Co. | 4.60% |
*Alphabet Inc. holding includes Class A and Class C.
Clipper Fund has adopted a Portfolio Holdings Disclosure policy that governs the release of non-public portfolio holding information. This policy is described in the prospectus. Holding percentages are subject to change. Visit clipperfund.com or call 800-432-2504 for the most current public portfolio holdings information.
Clipper Fund was managed from inception, February 29, 1984, until December 31, 2005 by another Adviser. Davis Selected Advisers, L.P. took over management of the Fund on January 1, 2006.
Broker-dealers and other financial intermediaries may charge Davis Advisors substantial fees for selling its funds and providing continuing support to clients and shareholders. For example, broker-dealers and other financial intermediaries may charge: sales commissions; distribution and service fees; and record-keeping fees. In addition, payments or reimbursements may be requested for: marketing support concerning Davis Advisors' products; placement on a list of offered products; access to sales meetings, sales representatives and management representatives; and participation in conferences or seminars, sales or training programs for invited registered representatives and other employees, client and investor events, and other dealer-sponsored events. Financial advisors should not consider Davis Advisors' payment(s) to a financial intermediary as a basis for recommending Davis Advisors.
We gather our index data from a combination of reputable sources, including, but not limited to, Thomson Financial, Lipper and index websites.
The S&P 500® Index is an unmanaged index of 500 selected common stocks, most of which are listed on the New York Stock Exchange. The Index is adjusted for dividends, weighted towards stocks with large market capitalizations and represents approximately two-thirds of the total market value of all domestic common stocks. Investments cannot be made directly in an index.
After April 30, 2016, this material must be accompanied by a supplement containing performance data for the most recent quarter end.
Shares of the Clipper Fund are not deposits or obligations of any bank, are not guaranteed by any bank, are not insured by the FDIC or any other agency, and involve investment risks, including possible loss of the principal amount invested.
12/15 Davis Distributors, LLC, 2949 East Elvira Road, Suite 101, Tucson, AZ 85756, 800-432-2504, clipperfund.com
Not a part of Annual Report to Fund shareholders
CLIPPER FUNDSM | Management's Discussion of Fund Performance |
Performance Overview
Clipper Fund outperformed the Standard & Poor's 500® Index (S&P 500®) for the twelve-month period ended December 31, 2015. The Fund delivered a total return of 6.44%, versus a 1.38% return for the S&P 500®.
The sectors1 within the S&P 500® that reported the strongest performance were Consumer Discretionary (up 10%), Health Care (up 7%), and Consumer Staples (up 7%). The sectors within the S&P 500® that reported the weakest performance were Energy (down 21%), Materials (down 8%), and Utilities (down 5%).
Contributors to Performance
The Fund's holdings in the Information Technology sector made significant contributions2 to performance. The Fund's Information Technology holdings were up about 54%, compared to up 5% for the S&P 500® sector. ASAC II L.P.3 (up 111%), an investment vehicle whose underlying assets are shares of the video game publisher Activision Blizzard, and Alphabet Inc. (up 46%), a holding company for Google, Inc., were strong performers. Alphabet Inc. was the Fund's second-largest holding.
Returns from holdings in the Consumer Discretionary sector also helped performance. The Fund's Consumer Discretionary holdings were up about 37%, compared to up 10% for the S&P 500® sector. Amazon (up 118%) was the Fund's overall top contributor and its largest holding.
Additional contributors included UnitedHealth Group (up 18%) and Laboratory Corp. of America (up 16%) from the Health Care sector; Costco (up 19%) from the Consumer Staples sector; and Markel (up 29%), JPMorgan Chase (up 10%), and Charles Schwab (up 10%) from the Financial sector. The Fund no longer holds Laboratory Corp. of America.
Detractors from Performance
The Fund's holdings in the Energy sector were the most significant detractor from performance. The Fund's Energy holdings were down about 56%, compared to down 21% for the S&P 500® sector. Leading detractors were Encana (down 62%) and Cabot Oil & Gas (down 47%).
Returns from holdings in the Materials sector also hurt performance. The Fund's Materials holdings were down about 25%, compared to down 8% for the S&P 500® sector. LafargeHolcim (down 35%), an international building materials company, was a leading detractor.
The Fund suffered from its heavily weighted position (43%, compared to 17% for the S&P 500® sector) in the weak performing Financial sector. American Express (down 24%) and Berkshire Hathaway (down 12%) detracted from performance.
Additional detractors included Las Vegas Sands (down 21%) and Liberty Global (down 11%) from the Consumer Discretionary sector.
Clipper Fund's investment objective is to seek long-term capital growth and capital preservation. There can be no assurance that the Fund will achieve its objective. Clipper Fund's principal risks are: stock market risk, manager risk, common stock risk, large-capitalization companies risk, mid- and small-capitalization companies risk, headline risk, focused portfolio risk, financial services risk, foreign country risk, foreign currency risk, depositary receipts risk, and fees and expenses risk. See the prospectus for a full description of each risk.
Clipper Fund focuses its investments in fewer companies, and it may be subject to greater risks than a more diversified fund that is not allowed to focus its investments in a few companies. The Fund's investment performance, both good and bad, is expected to reflect the economic performance of its more focused portfolio.
Past performance does not guarantee future results, fund prices fluctuate, and the value of an investment may be worth more or less than the purchase price. Data provided in this performance overview is for the period ended December 31, 2015, unless otherwise noted. Return figures for underlying fund positions reflect the return of the security from the beginning of the year or the date of first purchase if subsequent thereto through the end of the year or the date the position is completely liquidated. The actual contribution to the Fund will vary based on a number of factors (e.g. trading activity, weighting). Portfolio holding information is as of the end of the twelve-month period, December 31, 2015, unless otherwise noted.
1 The companies included in the Standard & Poor's 500® Index are divided into ten sectors. One or more industry groups make up a sector.
2 A company's or sector's contribution to or detraction from the Fund's performance is a product both of its appreciation or depreciation and its weighting within the Fund. For example, a 5% holding that rises 20% has twice as much impact as a 1% holding that rises 50%.
3 This Management Discussion of Fund Performance discusses a number of individual companies. The information provided in this report does not provide information reasonably sufficient upon which to base an investment decision and should not be considered a recommendation to purchase, sell, or hold any particular security. The Schedule of Investments lists the Fund's holdings of each company discussed.
CLIPPER FUNDSM | Management's Discussion of Fund Performance – (Continued) |
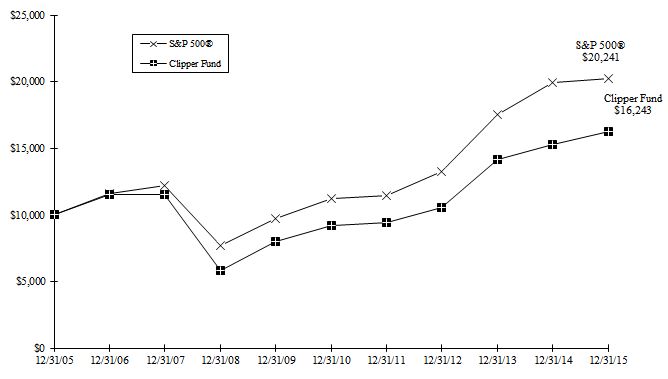
Comparison of a $10,000 investment in Clipper Fund versus the Standard & Poor's 500® Index
over 10 years for an investment made on December 31, 2005
Average Annual Total Return for periods ended December 31, 2015
Fund & Benchmark Index | 1-Year | 5-Year | 10-Year | Since Fund's Inception (02/29/84) | Gross Expense Ratio | Net Expense Ratio |
| Clipper Fund | 6.44% | 12.08% | 4.97% | 11.58% | 0.72% | 0.72% |
Standard & Poor's 500® Index | 1.38% | 12.57% | 7.31% | 11.06% | | |
In 2009, the Fund received favorable class action settlements from companies which it no longer owns. These settlements had a material impact on the investment performance of the Fund, adding approximately 5% to the Fund's total return in 2009. This was a one-time event that is unlikely to be repeated.
The Standard & Poor's 500® Index is an unmanaged index of 500 selected common stocks, most of which are listed on the New York Stock Exchange. The Index is adjusted for dividends, weighted towards stocks with large market capitalizations, and represents approximately two-thirds of the total market value of all domestic common stocks. Investments cannot be made directly in the Index.
The performance data for Clipper Fund contained in this report represents past performance, assumes that all distributions were reinvested, and should not be considered as an indication of future performance from an investment in the Fund today. The investment return and principal value will fluctuate so that shares may be worth more or less than their original cost when redeemed. Fund performance changes over time and current performance may be higher or lower than stated. Returns shown do not reflect the deduction of taxes that a shareholder would pay on fund distributions or the redemption of fund shares. The operating expense ratio may vary in future years. For more current information please call Clipper Fund Investor Services at 1-800-432-2504.
Davis Selected Advisers, L.P. began serving as investment adviser to Clipper Fund on January 1, 2006. A different investment adviser managed the Fund through December 31, 2005.
CLIPPER FUNDSM | |
| | December 31, 2015 |
| Portfolio Composition | | Industry Weightings |
| (% of Fund's 12/31/15 Net Assets) | | (% of 12/31/15 Stock Holdings) |
| | | | | | | |
| | | | | Fund | | S&P 500® |
| Common Stock (U.S.) | 89.52% | | Diversified Financials | 23.22% | | 4.97% |
| Common Stock (Foreign) | 4.72% | | Information Technology | 15.94% | | 20.69% |
| Short-Term Investments | 6.02% | | Banks | 9.71% | | 6.04% |
| Other Assets & Liabilities | (0.26)% | | Retailing | 9.27% | | 5.52% |
| | 100.00% | | Materials | 8.38% | | 2.76% |
| | | | Insurance | 7.32% | | 2.71% |
| | | | Energy | 6.85% | | 6.50% |
| | | | Capital Goods | 5.14% | | 7.25% |
| | | | Food & Staples Retailing | 4.71% | | 2.36% |
| | | | Health Care | 3.33% | | 15.15% |
| | | | Media | 3.31% | | 3.03% |
| | | | Consumer Services | 2.82% | | 1.90% |
| | | | Food, Beverage & Tobacco | – | | 5.64% |
| | | | Other | – | | 15.48% |
| | | | | 100.00% | | 100.00% |
| Top 10 Long-Term Holdings |
| (% of Fund's 12/31/15 Net Assets) |
| | | | | | |
| Amazon.com, Inc. | | | Retailing | | 8.74% |
| Alphabet Inc.* | | | Software & Services | | 7.38% |
| Berkshire Hathaway Inc., Class A | | | Diversified Financial Services | | 7.17% |
| Markel Corp. | | | Property & Casualty Insurance | | 6.90% |
| American Express Co. | | | Consumer Finance | | 6.16% |
| ASAC II L.P. | | | Software & Services | | 5.45% |
| United Technologies Corp. | | | Capital Goods | | 4.85% |
| Monsanto Co. | | | Materials | | 4.83% |
| Bank of New York Mellon Corp. | | | Capital Markets | | 4.65% |
| JPMorgan Chase & Co. | | | Banks | | 4.60% |
*Alphabet Inc. holding includes Class A and Class C.
CLIPPER FUNDSM | Fund Overview – (Continued) |
| | December 31, 2015 |
New Positions Added (01/01/15-12/31/15)
(Highlighted positions are those greater than 4.00% of the Fund's 12/31/15 net assets)
| Security | Industry | Date of 1st Purchase | % of Fund's 12/31/15 Net Assets |
| | | | |
| Apache Corp. | Energy | 12/15/15 | 1.76% |
| Cabot Oil & Gas Corp. | Energy | 04/29/15 | 3.04% |
| Citizens Financial Group Inc. | Banks | 03/25/15 | – |
| Express Scripts Holding Co. | Health Care Equipment & Services | 01/28/15 | – |
| Halliburton Co. | Energy | 01/12/15 | – |
| JPMorgan Chase & Co. | Banks | 02/25/15 | 4.60% |
| Monsanto Co. | Materials | 08/26/15 | 4.83% |
| United Technologies Corp. | Capital Goods | 08/10/15 | 4.85% |
Positions Closed (01/01/15-12/31/15)
(Gains and losses greater than $8,000,000 are highlighted)
| Security | Industry | Date of Final Sale | Realized Gain (Loss) |
| | | | | |
| Citizens Financial Group Inc. | Banks | 09/25/15 | $ | (208,429) |
| Everest Re Group, Ltd. | Reinsurance | 04/02/15 | | 9,689,089 |
| Express Scripts Holding Co. | Health Care Equipment & Services | 09/01/15 | | 432,735 |
| Halliburton Co. | Energy | 04/29/15 | | 5,780,035 |
| Laboratory Corp. of America Holdings | Health Care Equipment & Services | 08/18/15 | | 8,151,432 |
| SKBHC Holdings LLC | Banks | 10/01/15 | | 929,033 |
| Sysco Corp. | Food & Staples Retailing | 03/24/15 | | 3,139,361 |
As a shareholder of the Fund, you incur ongoing costs only, including advisory and administrative fees and other Fund expenses. The Expense Example is intended to help you understand your ongoing costs (in dollars) of investing in the Fund and to compare these costs with the ongoing costs of investing in other mutual funds. The Expense Example is based on an investment of $1,000 invested at the beginning of the period and held for the entire period indicated, which is for the six-month period ended December 31, 2015.
Actual Expenses
The information represented in the row entitled "Actual" provides information about actual account values and actual expenses. You may use the information in this row, together with the amount you invested, to estimate the expenses that you paid over the period. Simply divide your account value by $1,000 (for example, an $8,600 account value divided by $1,000 = 8.6), then multiply the result by the number under the heading "Expenses Paid During Period" to estimate the expenses you paid on your account during this period. An annual maintenance fee of $10, charged on retirement plan accounts per Social Security Number, is not included in the Expense Example. If this fee was included, the estimate of expenses you paid during the period would be higher, and your ending account value would be lower, by this amount.
Hypothetical Example for Comparison Purposes
The information represented in the row entitled "Hypothetical" provides information about hypothetical account values and hypothetical expenses based on the Fund's actual expense ratio and an assumed rate of return of 5% per year before expenses, which is not the Fund's actual return. The hypothetical account values and expenses may not be used to estimate the actual ending account balance or expenses you paid for the period. You may use this information to compare the ongoing costs of investing in the Fund and other funds. To do so, compare this 5% hypothetical example with the 5% hypothetical examples that appear in the shareholder reports of the other funds. An annual maintenance fee of $10, charged on retirement plan accounts per Social Security Number, is not included in the Expense Example. If this fee was included, the estimate of expenses you paid during the period would be higher, and your ending account value would be lower, by this amount.
Please note that the expenses shown in the table are meant to highlight your ongoing costs only. Therefore, the information in the row entitled "Hypothetical" is useful in comparing ongoing costs only, and will not help you determine the relative total costs of owning different funds.
| | Beginning Account Value (07/01/15) | | Ending Account Value (12/31/15) | | Expenses Paid During Period* (07/01/15-12/31/15) |
| | | | | | |
| Actual | $1,000.00 | | $1,026.55 | | $3.63 |
| Hypothetical | $1,000.00 | | $1,021.63 | | $3.62 |
Hypothetical assumes 5% annual return before expenses.
* Expenses are equal to the Fund's annualized operating expense ratio (0.71%)**, multiplied by the average account value over the period, multiplied by 184/365 (to reflect the one-half year period).
** The expense ratio reflects the impact, if any, of certain reimbursements from the Adviser.
CLIPPER FUNDSM | |
| | December 31, 2015 |
| | Shares | | Value
(Note 1) |
| COMMON STOCK – (94.24%) |
| | CONSUMER DISCRETIONARY – (14.51%) |
| | | Consumer Services – (2.65%) |
| | | Las Vegas Sands Corp. | | | 736,500 | | $ | 32,288,160 |
| | Media – (3.12%) |
| | Liberty Global PLC, LiLAC Class C * | | | 44,200 | | | 1,900,600 |
| | Liberty Global PLC, Series C * | | | 884,000 | | | 36,040,680 |
| | | | 37,941,280 |
| | Retailing – (8.74%) |
| | Amazon.com, Inc. * | | | 157,191 | | | 106,243,825 |
| | | | Total Consumer Discretionary | | | 176,473,265 |
| | CONSUMER STAPLES – (4.44%) |
| | Food & Staples Retailing – (4.44%) |
| | Costco Wholesale Corp. | | | 334,061 | | | 53,950,852 |
| | Total Consumer Staples | | | 53,950,852 |
| | ENERGY – (6.45%) |
| | Apache Corp. | | | 480,970 | | | 21,388,736 |
| | Cabot Oil & Gas Corp. | | | 2,088,700 | | | 36,949,103 |
| | Encana Corp. (Canada) | | | 3,948,730 | | | 20,099,036 |
| | Total Energy | | | 78,436,875 |
| | FINANCIALS – (37.93%) |
| | Banks – (9.15%) |
| | Banner Corp. (a) | | | 275,413 | | | 12,314,679 |
| | JPMorgan Chase & Co. | | | 847,500 | | | 55,960,425 |
| | Wells Fargo & Co. | | | 790,980 | | | 42,997,673 |
| | | | 111,272,777 |
| | Diversified Financials – (21.88%) |
| | | Capital Markets – (8.55%) |
| | Bank of New York Mellon Corp. | | | 1,372,319 | | | 56,566,989 |
| | Charles Schwab Corp. | | | 1,439,500 | | | 47,402,735 |
| | | 103,969,724 |
| | Consumer Finance – (6.16%) |
| | American Express Co. | | | 1,077,333 | | | 74,928,510 |
| | Diversified Financial Services – (7.17%) |
| | Berkshire Hathaway Inc., Class A * | | | 441 | | | 87,229,800 |
| | | | 266,128,034 |
| | Insurance – (6.90%) |
| | Property & Casualty Insurance – (6.90%) |
| | Markel Corp. * | | | 94,960 | | | 83,882,916 |
| | Total Financials | | | 461,283,727 |
| | HEALTH CARE – (3.14%) |
| | Health Care Equipment & Services – (3.14%) |
| | UnitedHealth Group Inc. | | | 324,720 | | | 38,200,061 |
| | Total Health Care | | | 38,200,061 |
| | INDUSTRIALS – (4.85%) |
| | Capital Goods – (4.85%) |
| | United Technologies Corp. | | | 613,500 | | | 58,938,945 |
| | Total Industrials | | | 58,938,945 |
CLIPPER FUNDSM | Schedule of Investments – (Continued) |
| | December 31, 2015 |
| | Shares/Units/ Principal | | Value
(Note 1) |
| COMMON STOCK – (CONTINUED) |
| | INFORMATION TECHNOLOGY – (15.02%) |
| | | Semiconductors & Semiconductor Equipment – (2.19%) |
| | | | Texas Instruments Inc. | | | 485,300 | | $ | 26,599,293 |
| | Software & Services – (12.83%) |
| | Alphabet Inc., Class A * | | | 58,360 | | | 45,404,663 |
| | Alphabet Inc., Class C * | | | 58,394 | | | 44,314,039 |
| | ASAC II L.P. *(a) | | | 24,200,000 | | | 66,320,100 |
| | | | 156,038,802 |
| | | | Total Information Technology | | | 182,638,095 |
| | MATERIALS – (7.90%) |
| | LafargeHolcim Ltd. (Switzerland)* | | | 734,355 | | | 37,285,370 |
| | Monsanto Co. | | | 596,710 | | | 58,787,869 |
| | Total Materials | | | 96,073,239 |
| | | | TOTAL COMMON STOCK – (Identified cost $869,741,936) | | | 1,145,995,059 |
| SHORT-TERM INVESTMENTS – (6.02%) |
| | Mizuho Securities USA Inc. Joint Repurchase Agreement, 0.27%, 01/04/16, dated 12/31/15, repurchase value of $19,860,596 (collateralized by: U.S. Government agency mortgages in a pooled cash account, 3.59%-6.50%, 06/01/22-12/01/45, total market value $20,257,200) | | $ | 19,860,000 | | | 19,860,000 |
| | Nomura Securities International, Inc. Joint Repurchase Agreement, 0.34%, 01/04/16, dated 12/31/15, repurchase value of $41,534,569 (collateralized by: U.S. Government agency mortgages and obligations in a pooled cash account, 1.168%-10.50%, 01/15/16-10/20/65, total market value $42,363,660) | | | 41,533,000 | | | 41,533,000 |
| | SunTrust Robinson Humphrey, Inc. Joint Repurchase Agreement, 0.45%, 01/04/16, dated 12/31/15, repurchase value of $11,867,593 (collateralized by: U.S. Government agency mortgages in a pooled cash account, 1.825%-2.967%, 01/01/21-01/01/46, total market value $12,104,340) | | | 11,867,000 | | | 11,867,000 |
| | TOTAL SHORT-TERM INVESTMENTS – (Identified cost $73,260,000) | | | 73,260,000 |
| | Total Investments – (100.26%) – (Identified cost $943,001,936) – (b) | | | 1,219,255,059 |
| | Liabilities Less Other Assets – (0.26%) | | | (3,153,568) |
| | Net Assets – (100.00%) | | $ | 1,216,101,491 |
| |
| | * | Non-Income producing security. |
| |
| | (a) | Restricted Security – See Note 5 of the Notes to Financial Statements. |
| |
| | (b) | Aggregate cost for federal income tax purposes is $943,132,864. At December 31, 2015 unrealized appreciation (depreciation) of securities for federal income tax purposes is as follows: |
| |
| | Unrealized appreciation | | $ | 397,907,040 |
| | Unrealized depreciation | | | (121,784,845) |
| | Net unrealized appreciation | | $ | 276,122,195 |
See Notes to Financial Statements
CLIPPER FUNDSM | Statement of Assets and Liabilities |
| | At December 31, 2015 |
| ASSETS: | | | | | |
| Investments in securities at value* (see accompanying Schedule of Investments) | | $ | 1,219,255,059 |
| Cash | | | 1,882 |
| Receivables: | | | |
| | Capital stock sold | | | 1,726,098 |
| | Dividends and interest | | | 51,221 |
| Prepaid expenses | | | 18,743 |
| | | Total assets | | | 1,221,053,003 |
LIABILITIES: | | | |
| Payables: | | | |
| | Capital stock redeemed | | | 367,359 |
| | Investment securities purchased | | | 3,680,187 |
| Accrued investment advisory fee | | | 587,025 |
| Other accrued expenses | | | 316,941 |
| | Total liabilities | | | 4,951,512 |
NET ASSETS | | $ | 1,216,101,491 |
SHARES OUTSTANDING | | | 11,647,085 |
NET ASSET VALUE, offering, and redemption price per share (Net assets ÷ Shares outstanding) | | $ | 104.41 |
NET ASSETS CONSIST OF: | | | |
| Paid in capital | | $ | 939,841,580 |
| Undistributed net investment income | | | 85,756 |
| Accumulated net realized losses from investments | | | (79,925) |
| Net unrealized appreciation on investments and foreign currency transactions | | | 276,254,080 |
| | Net Assets | | $ | 1,216,101,491 |
| | | | | |
| *Including: | | | |
| | Cost of Investments | | $ | 943,001,936 |
| See Notes to Financial Statements |
CLIPPER FUNDSM | |
| | For the year ended December 31, 2015 |
| INVESTMENT INCOME: | | | | | | |
| Income: | | | |
| Dividends* | | $ | 13,701,649 |
| Interest | | | 39,449 |
| | | Total income | | | | 13,741,098 |
Expenses: | | | |
| Investment advisory fees (Note 3) | | $ | 6,229,843 | | | |
| Custodian fees | | | 144,865 | | | |
| Transfer agent fees | | | 1,262,650 | | | |
| Audit fees | | | 49,200 | | | |
| Legal fees | | | 25,073 | | | |
| Reports to shareholders | | | 97,834 | | | |
| Trustees' fees and expenses | | | 156,832 | | | |
| Registration and filing fees | | | 70,687 | | | |
| Miscellaneous | | | 62,053 | | | |
| | Total expenses | | | | 8,099,037 |
| Net investment income | | | 5,642,061 |
REALIZED & UNREALIZED GAIN (LOSS) ON INVESTMENTS AND FOREIGN CURRENCY TRANSACTIONS: | | | | | | |
| Net realized gain from: | | | |
| | Investment transactions | | | 93,364,448 |
| | Foreign currency transactions | | | 735 |
| Net realized gain | | | 93,365,183 |
| Net decrease in unrealized appreciation | | | (31,142,071) |
| | Net realized and unrealized gain on investments and foreign currency transactions | | | | 62,223,112 |
| Net increase in net assets resulting from operations | | $ | 67,865,173 |
| | | | | | | | | |
| *Net of foreign taxes withheld as follows | | $ | 312,474 |
| | | | | | | | | |
| See Notes to Financial Statements |
CLIPPER FUNDSM | Statements of Changes in Net Assets |
| | | Year ended December 31, |
| | | 2015 | | 2014 |
OPERATIONS: | | | | | | |
| Net investment income | | $ | 5,642,061 | | $ | 4,431,185 |
| Net realized gain from investments and foreign currency transactions | | | 93,365,183 | | | 263,781,880 |
Net decrease in unrealized appreciation on investments and foreign currency transactions | | | (31,142,071) | | | (177,914,979) |
| | Net increase in net assets resulting from operations | | | 67,865,173 | | | 90,298,086 |
DIVIDENDS AND DISTRIBUTIONS TO SHAREHOLDERS FROM: | | | | | | |
| Net investment income | | | (5,798,098) | | | (4,669,695) |
| Realized gains from investment transactions | | | (2,783,086) | | | – |
CAPITAL SHARE TRANSACTIONS: | | | | | | |
Net increase (decrease) in net assets resulting from capital share transactions (Note 4) | | | 47,674,046 | | | (230,398,412) |
| | Total increase (decrease) in net assets | | | 106,958,035 | | | (144,770,021) |
NET ASSETS: | | | | | | |
| Beginning of year | | | 1,109,143,456 | | | 1,253,913,477 |
End of year* | | $ | 1,216,101,491 | | $ | 1,109,143,456 |
*Including undistributed net investment income of | | $ | 85,756 | | $ | 13,612 |
| See Notes to Financial Statements |
CLIPPER FUNDSM | Notes to Financial Statements |
| | December 31, 2015 |
NOTE 1 - SUMMARY OF SIGNIFICANT ACCOUNTING POLICIES
Clipper Funds Trust, a Delaware statutory trust ("Trust"), on behalf of Clipper Fund ("Fund"), a series of the Trust, is registered under the Investment Company Act of 1940, as amended, as a non-diversified, open-end management investment company. The Fund's investment objective is long-term capital growth and capital preservation. Davis Selected Advisers, L.P. ("Davis Advisors" or "Adviser"), the Fund's investment adviser, seeks to invest the Fund's assets primarily in common stocks of large companies (generally, companies with market capitalizations of $10 billion or more at the time of initial purchase) that are trading at prices below the Adviser's estimate of their intrinsic values. The following is a summary of significant accounting policies consistently followed by the Fund in the preparation of its financial statements.
Security Valuation - The Fund calculates the net asset value of its shares as of the close of the New York Stock Exchange ("Exchange"), normally 4:00 P.M. Eastern time, on each day the Exchange is open for business. Securities listed on the Exchange (and other national exchanges including NASDAQ) are valued at the last reported sales price on the day of valuation. Listed securities for which no sale was reported on that date are valued at the closing bid price. Securities traded on foreign exchanges are valued based upon the last sales price on the principal exchange on which the security is traded prior to the time when the Fund's assets are valued. Securities (including restricted securities) for which market quotations are not readily available or securities whose values have been materially affected by what the Adviser identifies as a significant event occurring before the Fund's assets are valued but after the close of their respective exchanges will be fair valued using a fair valuation methodology applicable to the security type or the significant event as previously approved by the Fund's Pricing Committee and Board of Trustees. The Pricing Committee considers all facts it deems relevant that are reasonably available, through either public information or information available to the Adviser's portfolio management team, when determining the fair value of a security. To assess the appropriateness of security valuations, the Adviser may consider (i) comparing prior day prices and/or prices of comparable securities; (ii) comparing sale prices to the prior or current day prices and challenge those prices exceeding certain tolerance levels with the third-party pricing service or broker source; (iii) new rounds of financing; (iv) the performance of the market or the issuer's industry; (v) the liquidity of the security; (vi) the size of the holding in a fund; and/or (vii) any other appropriate information. The determination of a security's fair value price often involves the consideration of a number of subjective factors and is therefore subject to the unavoidable risk that the value assigned to a security may be higher or lower than the security's value would be if a reliable market quotation of the security was readily available. Fair value determinations are subject to review, approval, and ratification by the Fund's Board of Trustees at its next regularly scheduled meeting covering the calendar quarter in which the fair valuation was determined. Fair valuation methods used by the Fund may include, but are not limited to, valuing securities initially at cost (excluding commissions) and subsequently adjusting the value due to: additional transactions by the issuer, changes in company specific fundamentals and changes in the value of similar securities. Values may be further adjusted for any discounts related to security-specific resale restrictions. The Fund may price partnerships by calculating the liquidation value of the investment on a daily basis using the closing price of the underlying stock and a waterfall schedule, which apportions the value of the partnership's interests based on the value of the net assets of the investment. A liquidity discount is then applied to the liquidation value.
Short-term securities purchased within 60 days to maturity are valued at amortized cost, which approximates market value.
The Fund's valuation procedures are reviewed and subject to approval by the Board of Trustees. There have been no significant changes to the fair valuation procedures during the period.
Fair Value Measurements - Fair value is defined as the price that the Fund would receive upon selling an investment in an orderly transaction to an independent buyer in the principal market for the investment. Various inputs are used to determine the fair value of the Fund's investments. These inputs are summarized in the three broad levels listed below.
Level 1 – quoted prices in active markets for identical securities
Level 2 – other significant observable inputs (including quoted prices for similar investments, interest rates, prepayment
speeds, credit risk, etc.)
Level 3 – significant unobservable inputs (including the Fund's own assumptions in determining the fair value of
investments)
The inputs or methodologies used for valuing securities are not necessarily an indication of the risks associated with investing in those securities nor can it be assured that the Fund can obtain the fair value assigned to a security if it were to sell the security.
CLIPPER FUNDSM | Notes to Financial Statements – (Continued) |
| | December 31, 2015 |
NOTE 1 - SUMMARY OF SIGNIFICANT ACCOUNTING POLICIES – (CONTINUED)
Fair Value Measurements - (Continued)
The following is a summary of the inputs used as of December 31, 2015 in valuing the Fund's investments carried at value:
| | Investments in Securities at Value |
| | Valuation Inputs |
| | | | Level 2: | | Level 3: | | |
| | | | Other Significant | | Significant | | |
| | Level 1: | | Observable | | Unobservable | | |
| | Quoted Prices | | Inputs | | Inputs | | Total |
Equity securities: | | | | | | | | | | | |
| Consumer Discretionary | $ | 176,473,265 | | $ | – | | $ | – | | $ | 176,473,265 |
| Consumer Staples | | 53,950,852 | | | – | | | – | | | 53,950,852 |
| Energy | | 78,436,875 | | | – | | | – | | | 78,436,875 |
| Financials | | 448,969,048 | | | 12,314,679 | | | – | | | 461,283,727 |
| Health Care | | 38,200,061 | | | – | | | – | | | 38,200,061 |
| Industrials | | 58,938,945 | | | – | | | – | | | 58,938,945 |
| Information Technology | | 116,317,995 | | | – | | | 66,320,100 | | | 182,638,095 |
| Materials | | 96,073,239 | | | – | | | – | | | 96,073,239 |
| Short-term securities | | – | | | 73,260,000 | | | – | | | 73,260,000 |
| Total Investments | $ | 1,067,360,280 | | $ | 85,574,679 | | $ | 66,320,100 | | $ | 1,219,255,059 |
There were no transfers of investments between Level 1 and Level 2 of the fair value hierarchy during the year ended December 31, 2015.
The following table reconciles the valuation of assets in which significant unobservable inputs (Level 3) were used in determining fair value during the year ended December 31, 2015:
| Investment Securities: | | | |
| Beginning balance | | $ | 44,076,158 |
| Net realized gain | | | 929,033 |
| Increase in unrealized appreciation | | | 32,623,114 |
| Proceeds from sales | | | (11,308,205) |
| Ending balance | | $ | 66,320,100 |
| | | | |
Increase in unrealized appreciation during the period on Level 3 securities still held at December 31, 2015 and included in the change in net assets for the period | | $ | 34,845,580 |
There were no transfers of investments into or out of Level 3 of the fair value hierarchy during the period. Realized and unrealized gains (losses) are included in the related amounts on investments in the Statement of Operations.
The following table is a summary of those assets in which significant unobservable inputs (Level 3) were used by the Adviser in determining fair value. Note that these amounts exclude any valuations provided by a pricing service or broker.
| Assets Table |
| | | Fair Value at | | Valuation | | Unobservable | | |
| Investments at Value | | December 31, 2015 | | Technique | | Input | | Amount |
| | | | | | | | | | |
| Equity Securities | | $ | 66,320,100 | | Liquidation proceeds/Waterfall methodology based on underlying investment value, then applying liquidity discount | | Discount rate | | | 7.40% |
The significant unobservable input used in the fair value measurement of equity securities is the discount rate, which, if changed, would affect the fair value of the Fund's investment. An increase in the discount rate would result in a decrease in the fair value of the investment.
CLIPPER FUNDSM | Notes to Financial Statements – (Continued) |
| | December 31, 2015 |
NOTE 1 - SUMMARY OF SIGNIFICANT ACCOUNTING POLICIES – (CONTINUED)
Master Repurchase Agreements - The Fund, along with other affiliated funds, may transfer uninvested cash balances into one or more master repurchase agreement accounts. These balances are invested in one or more repurchase agreements, secured by U.S. Government securities. A custodian bank holds securities pledged as collateral for repurchase agreements until the agreements mature. Each agreement requires that the market value of the collateral be sufficient to cover payments of interest and principal; however, in the event of default by the other party to the agreement, retention of the collateral may be subject to legal proceedings.
Currency Translation - The market values of all assets and liabilities denominated in foreign currencies are recorded in the financial statements after translation to the U.S. Dollar based upon the mean between the bid and offered quotations of the currencies against U.S. Dollars on the date of valuation. The cost basis of such assets and liabilities is determined based upon historical exchange rates. Income and expenses are translated at average exchange rates in effect as accrued or incurred.
Foreign Currency - The Fund may enter into forward purchases or sales of foreign currencies to hedge certain foreign currency denominated assets and liabilities against declines in market value relative to the U.S. Dollar. Forward currency contracts are marked-to-market daily and the change in market value is recorded by the Fund as an unrealized gain or loss. When the forward currency contract is closed, the Fund records a realized gain or loss equal to the difference between the value of the forward currency contract at the time it was opened and value at the time it was closed. Investments in forward currency contracts may expose the Fund to risks resulting from unanticipated movements in foreign currency exchange rates or failure of the counter-party to the agreement to perform in accordance with the terms of the contract.
Reported net realized foreign exchange gains or losses arise from the sales of foreign currencies, currency gains or losses realized between the trade and settlement dates on security transactions, the difference between the amounts of dividends, interest, and foreign withholding taxes recorded on the Fund's books, and the U.S. Dollar equivalent of the amounts actually received or paid. Net unrealized foreign exchange gains or losses arise from changes in the value of assets and liabilities other than investments in securities at fiscal year end, resulting from changes in the exchange rate. The Fund includes foreign currency gains and losses realized on the sales of investments together with market gains and losses on such investments in the Statement of Operations.
Federal Income Taxes - It is the Fund's policy to comply with the requirements of the Internal Revenue Code applicable to regulated investment companies, and to distribute substantially all of its taxable income, including any net realized gains on investments not offset by loss carryovers, to shareholders. Therefore, no provision for federal income tax or excise tax is required. The Adviser has analyzed the Fund's tax positions taken on federal and state income tax returns for all open tax years and has concluded that as of December 31, 2015, no provision for income tax is required in the Fund's financial statements related to those tax positions. The Fund's federal and state (Arizona) income and federal excise tax returns for tax years for which the applicable statutes of limitations have not expired are subject to examination by the Internal Revenue Service and state department of revenue. The earliest tax year that remains subject to examination by these jurisdictions is 2012.
During the year ended December 31, 2015, the Fund utilized $90,530,000 in capital loss carryforwards and thus did not have unused capital loss carryforwards available for federal income tax purposes at the end of the year.
CLIPPER FUNDSM | Notes to Financial Statements – (Continued) |
| | December 31, 2015 |
NOTE 1 - SUMMARY OF SIGNIFICANT ACCOUNTING POLICIES – (CONTINUED)
Securities Transactions and Related Investment Income - Securities transactions are accounted for on the trade date (date the order to buy or sell is executed) with realized gain or loss on the sale of securities being determined based upon identified cost. Dividend income is recorded on the ex-dividend date. Interest income, which includes accretion of discount and amortization of premium, is accrued as earned.
Dividends and Distributions to Shareholders - Dividends and distributions to shareholders are recorded on the ex-dividend date. Net investment income (loss), net realized gains (losses), and net unrealized appreciation (depreciation) on investments may differ for financial statement and tax purposes primarily due to differing treatments of wash sales, foreign currency transactions, and partnership income. The character of dividends and distributions made during the fiscal year from net investment income and net realized securities gains may differ from their ultimate characterization for federal income tax purposes. Also, due to the timing of dividends and distributions, the fiscal year in which amounts are distributed may differ from the fiscal year in which income or realized gain was recorded by the Fund. The Fund adjusts certain components of capital to reflect permanent differences between financial statement amounts and net income and realized gains/losses determined in accordance with income tax rules. Accordingly, during the year ended December 31, 2015, amounts have been reclassified to reflect a decrease in overdistributed net investment income of $228,181, a decrease in accumulated net realized gains from investments and foreign currency transactions of $315,916, and an increase in paid in capital of $87,735. Net assets have not been affected by this reclassification.
The tax character of distributions paid during the years ended December 31, 2015 and 2014 was as follows:
| | 2015 | | 2014 |
| Ordinary income | $ | 5,798,098 | | $ | 4,669,695 |
| Long-term capital gain | | 2,783,086 | | | – |
| Total | $ | 8,581,184 | | $ | 4,669,695 |
As of December 31, 2015, the components of distributable earnings on a tax basis were as follows:
| Undistributed net investment income | | $ | 85,756 |
| Undistributed long-term capital gain | | | 51,003 |
| Net unrealized appreciation on investments | | | 276,123,152 |
| Total | | $ | 276,259,911 |
Indemnification - Under the Fund's organizational documents, its officers and trustees are indemnified against certain liabilities arising out of the performance of their duties to the Fund. In addition, some of the Fund's contracts with its service providers contain general indemnification clauses. The Fund's maximum exposure under these arrangements is unknown since the amount of any future claims that may be made against the Fund cannot be determined and the Fund has no historical basis for predicting the likelihood of any such claims.
Use of Estimates in Financial Statements - In preparing financial statements in conformity with accounting principles generally accepted in the United States of America, management makes estimates and assumptions that affect the reported amounts of assets and liabilities and disclosure of contingent assets and liabilities at the date of the financial statements, as well as the reported amounts of income and expenses during the reporting period. Actual results may differ from these estimates.
NOTE 2 - PURCHASES AND SALES OF SECURITIES
The cost of purchases and proceeds from sales of investment securities (excluding short-term securities) during the year ended December 31, 2015 were $343,713,613 and $355,745,361, respectively.
CLIPPER FUNDSM | Notes to Financial Statements – (Continued) |
| | December 31, 2015 |
NOTE 3 - FEES AND OTHER TRANSACTIONS WITH SERVICE PROVIDERS (INCLUDING AFFILIATES)
Davis Selected Advisers-NY, Inc. ("DSA-NY"), a wholly-owned subsidiary of the Adviser, acts as sub-adviser to the Fund. DSA-NY performs research and portfolio management services for the Fund under a Sub-Advisory Agreement with the Adviser. The Fund pays no fees directly to DSA-NY.
Certain officers of the Fund are also officers of the general partner of the Adviser.
Investment Advisory Fees - Advisory fees are paid monthly to the Adviser. The annual rate is 0.55% of the average net assets for the first $3 billion, 0.54% on the next $1 billion, 0.53% on the next $1 billion, 0.52% on the next $1 billion, 0.51% on the next $1 billion, 0.50% on the next $3 billion, and 0.485% of the average net assets greater than $10 billion. Advisory fees paid during the year ended December 31, 2015 approximated 0.55% of average net assets.
Transfer Agent and Accounting Fees - Boston Financial Data Services, Inc. ("BFDS") is the Fund's primary transfer agent. The Adviser is also paid for certain transfer agent services. The fee paid to the Adviser for these services during the year ended December 31, 2015 amounted to $71,347. State Street Bank and Trust Company ("State Street Bank") is the Fund's primary accounting provider. Fees for such services are included in the custodian fees as State Street Bank also serves as the Fund's custodian.
NOTE 4 - CAPITAL STOCK
At December 31, 2015, there were unlimited shares of capital stock (no par value) authorized. Transactions in capital stock were as follows:
| | Year ended December 31, 2015 |
| | | Sold | | | Reinvestment of Distributions | | | Redeemed | | | Net Increase |
| | | | | | | | | | | | |
| Shares | | 2,603,387 | | | 79,474 | | | (2,263,543) | | | 419,318 |
| Value | $ | 271,372,070 | | $ | 8,298,750 | | $ | (231,996,774) | | $ | 47,674,046 |
| | | | | | | | | | | | |
| |
| | Year ended December 31, 2014 |
| | | Sold | | | Reinvestment of Distributions | | | Redeemed | | | Net Decrease |
| | | | | | | | | | | | |
| Shares | | 761,930 | | | 46,166 | | | (3,199,088) | | | (2,390,992) |
| Value | $ | 72,079,438 | | $ | 4,513,654 | | $ | (306,991,504) | | $ | (230,398,412) |
| | | | | | | | | | | | |
NOTE 5 - RESTRICTED SECURITIES
Restricted securities are not registered under the Securities Act of 1933 and may have contractual restrictions on resale. They are fair valued under methods approved by the Board of Trustees. The aggregate value of restricted securities amounted to $78,634,779 or 6.47% of the Fund's net assets as of December 31, 2015. Information regarding restricted securities is as follows:
| The following financial information represents selected data for each share of capital stock outstanding throughout each period: |
| | Year ended December 31, |
| | | | 2015 | | 2014 | | 2013 | | 2012 | | 2011 |
| Net Asset Value, Beginning of Period | | $ | 98.79 | | $ | 92.07 | | $ | 68.86 | | $ | 62.50 | | $ | 61.96 |
Income from Investment Operations: | | | | | | | | | | | | | | | | | | | | | | | | | |
Net Investment Incomea | | 0.51 | | 0.35 | | 0.47 | | 1.16 | | 0.66 |
| Net Realized and Unrealized Gains | | 5.85 | | 6.78 | | 23.09 | | 6.54 | | 0.75 |
| | Total from Investment Operations | | 6.36 | | 7.13 | | 23.56 | | 7.70 | | 1.41 |
Dividends and Distributions: | | | | | | | | | | | | | | | | | | | | | | | | | |
| Dividends from Net Investment Income | | (0.50) | | (0.41) | | (0.35) | | (1.34) | | (0.87) |
| Distributions from Realized Gains | | (0.24) | | – | | – | | – | | – |
| | Total Dividends and Distributions | | (0.74) | | (0.41) | | (0.35) | | (1.34) | | (0.87) |
Net Asset Value, End of Period | | $ | 104.41 | | $ | 98.79 | | $ | 92.07 | | $ | 68.86 | | $ | 62.50 |
Total Returnb | | 6.44 | % | | 7.75 | % | | 34.22 | % | | 12.31 | % | | 2.29 | % |
Ratios/Supplemental Data: | | | | | | | | | | | | | | | | | | | | | | | | | |
| Net Assets, End of Period (in millions) | | $ | 1,216 | | | $ | 1,109 | | | $ | 1,254 | | | $ | 1,015 | | | $ | 1,033 | |
| Ratio of Expenses to Average Net Assets: | | | | | | | | | | | | | | | | | | | | | | | | | |
| | Gross | | 0.72 | % | | 0.74 | % | | 0.74 | % | | 0.75 | % | | 0.75 | % |
| | Netc | | 0.72 | % | | 0.74 | % | | 0.74 | % | | 0.75 | % | | 0.75 | % |
Ratio of Net Investment Income to Average Net Assets | | 0.50 | % | | 0.36 | % | | 0.58 | % | | 1.74 | % | | 1.04 | % |
Portfolio Turnover Rated | | 31 | % | | 38 | % | | 8 | % | | 6 | % | | 15 | % |
| a | Per share calculations were based on average shares outstanding for the period. |
| | |
| b | Assumes hypothetical initial investment on the business day before the first day of the fiscal period, with all dividends and distributions reinvested in additional shares on the reinvestment date, and redemption at the net asset value calculated on the last business day of the fiscal period. |
| | |
| c | The Net Ratio of Expenses to Average Net Assets reflects the impact, if any, of the reduction of expenses paid indirectly and of certain reimbursements from the Adviser. |
| | |
| d | The lesser of purchases or sales of portfolio securities for a period, divided by the monthly average of the market value of portfolio securities owned during the period. Securities with a maturity or expiration date at the time of acquisition of one year or less are excluded from the calculation. |
| |
| See Notes to Financial Statements |
CLIPPER FUNDSM | Report of Independent Registered Public Accounting Firm |
The Shareholders and Board of Trustees
Clipper Funds Trust:
We have audited the accompanying statement of assets and liabilities of Clipper Fund (a series of Clipper Funds Trust), including the schedule of investments, as of December 31, 2015, and the related statement of operations for the year then ended, the statement of changes in net assets for each of the years in the two-year period then ended, and the financial highlights for each of the years in the five-year period then ended. These financial statements and financial highlights are the responsibility of the Fund's management. Our responsibility is to express an opinion on these financial statements and financial highlights based on our audits.
We conducted our audits in accordance with the standards of the Public Company Accounting Oversight Board (United States). Those standards require that we plan and perform the audit to obtain reasonable assurance about whether the financial statements and financial highlights are free of material misstatement. An audit includes examining, on a test basis, evidence supporting the amounts and disclosures in the financial statements. Our procedures included confirmation of securities owned as of December 31, 2015, by correspondence with the custodian and brokers or by other appropriate auditing procedures. An audit also includes assessing the accounting principles used and significant estimates made by management, as well as evaluating the overall financial statement presentation. We believe that our audits provide a reasonable basis for our opinion.
In our opinion, the financial statements and financial highlights referred to above present fairly, in all material respects, the financial position of Clipper Fund as of December 31, 2015, the results of its operations for the year then ended, the changes in its net assets for each of the years in the two-year period then ended, and the financial highlights for each of the years in the five-year period then ended, in conformity with U.S. generally accepted accounting principles.
KPMG LLP
Denver, Colorado
February 19, 2016
CLIPPER FUNDSM | Federal Income Tax Information (Unaudited) |
In early 2016, shareholders received information regarding all dividends and distributions paid to them by the Fund during the calendar year 2015. Regulations of the U.S. Treasury Department require the Fund to report this information to the Internal Revenue Service.
The information and distributions reported herein may differ from the information reported as distributions taxable to certain shareholders for the calendar year 2015 with their 2015 Form 1099-DIV.
During the calendar year 2015, $5,798,098 of dividends paid by the Fund constituted income dividends for federal income tax purposes. The Fund designates $5,798,098 or 100% as income qualifying for the corporate dividends-received deduction.
For the calendar year 2015, certain dividends paid by the Fund constitute qualified dividend income for federal income tax purposes. The Fund designates $5,798,098 or 100% as qualified dividend income.
During the calendar year ended December 31, 2015, the Fund declared and paid long-term capital gain distributions in the amount of $2,783,086.
The foregoing information is presented to assist shareholders in reporting dividends and distributions received from the Fund to the Internal Revenue Service. Because of the complexity of the federal regulations, which may affect your individual tax return and the many variations in state and local tax regulations, we recommend that you consult your tax adviser for specific guidance.
CLIPPER FUNDSM | Privacy Notice and Householding |
Privacy Notice
While you generally will be dealing with a broker-dealer or other financial adviser, we may collect information about you from your account application and other forms that you may deliver to us. We use this information to process your requests and transactions; for example, to provide you with additional information about the Fund, to open an account for you, or to process a transaction. In order to service your account and execute your transactions, we may provide your personal information to firms that assist us in servicing your account, such as our transfer agent. We may also provide your name and address to one of our agents for the purpose of mailing to you your account statement and other information about our products and services. We may also gather information through the use of "cookies" when you visit our website. These files help us to recognize repeat visitors and allow easy access to and use of the website. We require these outside firms and agents to protect the confidentiality of your information and to use the information only for the purpose for which the disclosure is made. We do not provide customer names and addresses to outside firms, organizations, or individuals except in furtherance of our business relationship with you or as otherwise allowed by law.
We restrict access to nonpublic personal information about you to those employees who need to know that information to provide products or services to you. We maintain physical, electronic and procedural safeguards that comply with federal standards to guard your personal information.
Householding
To avoid sending duplicate copies of materials to households, the Fund will mail only one copy of each prospectus, Annual, and Semi-Annual Report to shareholders having the same last name and address on the Fund's records. The consolidation of these mailings, called householding, benefits the Fund through reduced mailing expense. If you do not want the mailing of these documents to be combined with those to other members of your household, please contact the Clipper Fund by phone at 1-800-432-2504. Individual copies of current prospectuses and reports will be sent to you within 30 days after the Fund receives your request to stop householding.
For the purpose of their service as trustees to the Clipper Fund, the business address for each of the trustees is 2949 E. Elvira Road, Suite 101, Tucson, AZ 85756. Each Trustee serves until retirement, resignation, death, or removal. Trustees must retire from the Board of Trustees and cease being a Trustee at the close of business on the last day of the calendar year in which the Trustee attains age 75.
Name
(birthdate) | Position(s)
Held with
the Trust | Term of Office and Length of Time Served | Principal Occupation(s)
During Past 5 Years | Number of Portfolios in Fund Complex Overseen by Trustee | Other
Directorships
Held |
Independent Trustees
| | | | | | |
William P. Barr (05/23/50) | Trustee | Trustee since 2014 | Retired; Of Counsel to Kirkland & Ellis LLP (law firm) until July 2009; Executive Vice President and General Counsel, Verizon (telecommunications company) from 1994 through 2008. | 3 | Director, Time Warner, Inc. (media and entertainment company); Director, Dominion Resources (energy company); Director, Selected Funds (consisting of two portfolios). |
| | | | | | |
Francisco L. Borges (11/17/51) | Trustee | Trustee since 2014 | Chairman and Managing Partner, Landmark Partners, LLC (private equity firm) since March 1999. | 3 | Trustee, John S. and James L. Knight Foundation; Trustee, Connecticut Public Broadcasting Network; Director, University of Connecticut Health Center; Director, Assured Guaranty Ltd.; Director, Leucadia National Corporation (holding company); Trustee, Millbrook School; Director, Selected Funds (consisting of two portfolios). |
| | | | | | |
Lawrence E. Harris (09/16/56) | Trustee | Director/ Trustee since 2006 | Fred V. Keenan Chair in Finance of the Marshall School of Business, University of Southern California, Los Angeles, CA. | 3 | Director, Interactive Brokers Group, Inc.; Director, Selected Funds (consisting of two portfolios). |
| | | | | | |
Steven N. Kearsley (09/29/41) | Trustee | Director/ Trustee since 2006 | Private Investor, Real Estate Development; Owner, Old Peak Tree Farm. | 3 | Director, Selected Funds (consisting of two portfolios). |
| | | | | | |
Katherine L. MacWilliams (01/19/56) | Trustee | Trustee since 2014 | Retired; Chief Financial Officer, Caridian BCT, Inc. (medical device company) 2008-2012. | 3 | Director, Selected Funds (consisting of two portfolios). |
| | | | | | |
James J. McMonagle (10/01/44) | Trustee/ Chair | Trustee since 2014 | Chairman, Selected Funds Board of Directors since 1997; Of Counsel to Vorys, Sater, Seymour and Pease LLP (law firm) since 2002. | 3 | Director, Owens Corning (producer of residential and commercial building materials); Director/Chair, Selected Funds (consisting of two portfolios). |
| | | | | | |
Richard O'Brien (09/12/45) | Trustee | Trustee since 2014 | Retired; Corporate Economist, Hewlett-Packard Co. | 3 | Director, Selected Funds (consisting of two portfolios). |
CLIPPER FUNDSM | Trustees and Officers – (Continued) |
Name
(birthdate) | Position(s)
Held with
the Trust | Term of Office and Length of Time Served | Principal Occupation(s)
During Past 5 Years | Number of Portfolios in Fund Complex Overseen by Trustee | Other
Directorships
Held |
Interested Trustees*
| | | | | | |
Andrew A. Davis (06/25/63) | Trustee | Trustee since 2014 | President or Vice President of each Selected Fund and Davis Fund; President, Davis Selected Advisers, L.P., and also serves as an executive officer of certain companies affiliated with the Adviser. | 16 | Director, Selected Funds (consisting of two portfolios); Director, Davis Funds (consisting of 13 portfolios). |
| | | | | | |
Christopher C. Davis (07/13/65) | Trustee | Trustee since 2014 | President or Vice President of each Selected Fund, Davis Fund, and Clipper Fund; Chairman, Davis Selected Advisers, L.P., and also serves as an executive officer of certain companies affiliated with the Adviser, including sole member of the Adviser's general partner, Davis Investments, LLC; Employee of Shelby Cullom Davis & Co. (registered broker/dealer). | 16 | Director, Selected Funds (consisting of two portfolios); Director, Davis Funds (consisting of 13 portfolios); Director, Graham Holdings Co. (educational and media company). |
*Andrew A. Davis and Christopher C. Davis own partnership units (directly, indirectly, or both) of the Adviser and are considered to be "interested persons" of the Funds as defined in the Investment Company Act of 1940. Andrew A. Davis and Christopher C. Davis are brothers.
Officers
Christopher C. Davis (born 07/13/65, Clipper Fund officer since 12/19/05). See description in the section on Interested Trustees.
Kenneth C. Eich (born 08/14/53, Clipper Fund officer since 12/19/05). Executive Vice President and Principal Executive Officer of Clipper Funds Trust (consisting of one portfolio), each of the Davis Funds (consisting of 13 portfolios), and Selected Funds (consisting of two portfolios); Chief Operating Officer, Davis Selected Advisers, L.P., and also serves as an executive officer of certain companies affiliated with the Adviser.
Douglas A. Haines (born 03/04/71, Clipper Fund officer since 12/19/05). Vice President, Treasurer, Chief Financial Officer, Principal Financial Officer, and Principal Accounting Officer of Clipper Funds Trust (consisting of one portfolio), each of the Davis Funds (consisting of 13 portfolios), and Selected Funds (consisting of two portfolios); Vice President and Director of Fund Accounting, Davis Selected Advisers, L.P.
Sharra L. Haynes (born 09/25/66, Clipper Fund officer since 12/19/05). Vice President and Chief Compliance Officer of Clipper Funds Trust (consisting of one portfolio), each of the Davis Funds (consisting of 13 portfolios), and Selected Funds (consisting of two portfolios); Vice President and Chief Compliance Officer, Davis Selected Advisers, L.P., and also serves as an executive officer of certain companies affiliated with the Adviser.
Ryan M. Charles (born 07/25/78, Clipper Fund officer since 01/01/14). Vice President and Secretary of Clipper Funds Trust (consisting of one portfolio), each of the Davis Funds (consisting of 13 portfolios), and Selected Funds (consisting of two portfolios); Vice President, Chief Legal Officer and Secretary, Davis Selected Advisers, L.P., and also serves as an executive officer of certain companies affiliated with the Adviser.
| Investment Adviser |
| Davis Selected Advisers, L.P. (Doing business as "Davis Advisors") |
| 2949 East Elvira Road, Suite 101 |
| Tucson, Arizona 85756 |
| (800) 432-2504 |
| |
| Distributor |
| Davis Distributors, LLC |
| 2949 East Elvira Road, Suite 101 |
| Tucson, Arizona 85756 |
| |
| Transfer Agent |
| Boston Financial Data Services, Inc. |
| P.O. Box 55468 |
| Boston, Massachusetts 02205-5468 |
| |
| Custodian |
| State Street Bank and Trust Co. |
| One Lincoln Street |
| Boston, Massachusetts 02111 |
| |
| Counsel |
| Greenberg Traurig, LLP |
| 77 West Wacker Drive, Suite 3100 |
| Chicago, Illinois 60601 |
| |
| Independent Registered Public Accounting Firm |
| KPMG LLP |
| 1225 Seventeenth Street, Suite 800 |
| Denver, Colorado 80202 |
For more information about Clipper Fund including management fee, charges, and expenses, see the current prospectus, which must precede or accompany this report. The Fund's Statement of Additional Information contains additional information about the Fund's Trustees and is available without charge, upon request, by contacting the Fund at 1-800-432-2504 and on the Fund's website at www.clipperfund.com. Quarterly Fact Sheets are available on the Fund's website at www.clipperfund.com.
ITEM 2. CODE OF ETHICS
The registrant has adopted a code of ethics that applies to the registrant's principal executive officer, principal financial officer, principal accounting officer or controller, or persons performing similar functions.
A copy of the code of ethics is filed as an exhibit to this form N-CSR.
No waivers were granted to this code of ethics during the period covered by this report.
ITEM 3. AUDIT COMMITTEE FINANCIAL EXPERT
The Fund's Board of Directors has determined that independent trustee Katherine MacWilliams qualifies as the "audit committee financial expert", as defined in Item 3 of form N-CSR.
ITEM 4. PRINCIPAL ACCOUNTANT FEES AND SERVICES
| (a) | Audit Fees. The aggregate Audit Fees billed by KPMP LLP ("KPMG") for professional services rendered for the audits of the audits of the financial statements, or services that are normally provided in connection with statutory and regulatory filings or engagements for the fiscal year ends December 31, 2015 and December 31, 2014 were $49,200 and $49,200, respectively. |
| | |
| (b) | Audit-Related Fees. The aggregate Audit-Related Fees billed by KPMG for services rendered for assurance and related services that are not reasonably related to the performance of the audit or review of the fund financial statements, but not reported as Audit Fees for fiscal year ends December 31, 2015 and December 31, 2014 were $0 and $0, respectively. |
| | |
| (c) | Tax Fees. The aggregate Tax Fees billed by KPMG for professional services rendered for tax compliance, tax advice and tax planning for the fiscal year ends December 31, 2015 and December 31, 2014 were $8,085 and $7,525, respectively. Fees included in the Tax Fee category comprise all services performed by professional staff in the independent accountant's tax division except those services related to the audit. These services include preparation of tax returns, tax advice related to mergers and a review of the fund income and capital gain distributions. |
| | |
| (d) | All Other Fees. The aggregate Other Fees billed by KPMG for all other non-audit services rendered to the fund for the fiscal year ends December 31, 2015 and December 31, 2014 were $0 and $0, respectively. |
| | |
| (e)(1) | Audit Committee Pre-Approval Policies and Procedures. The fund Audit Committee must pre-approve all audit and non-audit services provided by the independent accountant relating to the operations or financial reporting of the funds. Prior to the commencement of any audit or non-audit services to a fund, the Audit Committee reviews the services to determine whether they are appropriate and permissible under applicable law. The fund Audit Committee has adopted a policy whereby audit and non-audit services performed by the fund independent accountant require pre-approval in advance at regularly scheduled Audit Committee meetings. If such a service is required between regularly scheduled Audit Committee meetings, pre-approval may be authorized by the Audit Committee Chairperson with ratification at the next scheduled audit committee meeting. |
| | |
| (2) | No services included in (b) – (d) above were approved pursuant to paragraph (c)(7)(i)(C) of Rule 2-01 of Regulation S-X. |
| | |
| (f) | Not applicable |
| | |
| (g) | The Funds' independent accountant did not provide any services to the investment advisor or any affiliate for the fiscal years ended December 31, 2015 and December 31, 2014. The fund has not paid any fees for non-audit not previously disclosed in items 4 (b) – (d). |
| | |
| (h) | The registrant's audit committee of the board of trustees has considered whether the provision of non-audit services that were rendered to the registrant's investment adviser, and any entity controlling, controlled by, or under common control with the investment adviser that provides ongoing services to the registrant that not pre-approved pursuant to paragraph (c)(7)(ii) of Rule 2-01 of Regulation S-X is compatible with maintaining the principal accountant's independence. No such services were rendered. |
ITEM 5. AUDIT COMMITTEE OF LISTED REGISTRANTS
Not Applicable
ITEM 6. SCHEDULE OF INVESTMENTS
Not Applicable. The complete Schedule of Investments is included in Item 1 of this for N-CSR
ITEM 7. DISCLOSURE OF PROXY VOTING POLICIES AND PROCEDURES FOR CLOSED-END MANAGEMENT INVESTMENT COMPANIES
Not Applicable
ITEM 8. PORTFOLIO MANAGERS OF CLOSED-END MANAGEMENT INVESTMENT COMPANIES
Not Applicable
ITEM 9. PURCHASES OF EQUITY SECURITIES BY CLOSED-END MANAGEMENT INVESTMENT COMPANIES AND AFFILIATED PURCHASERS
Not Applicable
ITEM 10. SUBMISSION OF MATTERS TO A VOTE OF SECURITY HOLDERS
There have been no changes to the procedure by which shareholders may recommend nominees to the registrant's Board of Trustees.
ITEM 11. CONTROLS AND PROCUDURES
| (a) | The registrant's principal executive officer and principal financial officer have concluded that the registrant's disclosure controls and procedures (as defined in Rule 30a-3 (c) under the Investment Company Act of 1940, as amended) are effective as of a date within 90 days of the filing date of this report. |
| | |
| (b) | There have been no significant changes in the registrant's internal controls or in other factors that could significantly affect these controls. |
ITEM 12. EXHIBITS
| (a)(1) | The registrant's code of ethics pursuant to Item 2 of Form N-CSR is filed as an exhibit to this form N-CSR. |
| | |
| (a)(2) | Certifications pursuant to Section 302 of the Sarbanes-Oxley Act of 2002 are attached. |
| | |
| (a)(3) | Not applicable |
| | |
| (b) | Certifications pursuant to Section 906 of the Sarbanes-Oxley Act of 2002 are attached. |
SIGNATURES
Pursuant to the requirements of the Securities Exchange Act of 1934 and the Investment Company Act of 1940, the registrant has duly caused this report to be signed on its behalf by the undersigned, thereunto duly authorized.
CLIPPER FUNDS TRUST
| By | /s/ Kenneth C. Eich |
| | Kenneth C. Eich |
| | Principal Executive Officer |
| | |
| Date: February 19, 2016 |
Pursuant to the requirements of the Securities Exchange Act of 1934 and the Investment Company Act of 1940, this report has been signed below by the following persons on behalf of the registrant and in the capacities and on the dates indicated.
| By | /s/ Kenneth C. Eich |
| | Kenneth C. Eich |
| | Principal Executive Officer |
| | |
| Date: February 19, 2016 |
| By | /s/ Douglas A. Haines |
| | Douglas A. Haines |
| | Principal Financial Officer |
| | |
| Date: February 19, 2016 |