UNITED STATES
SECURITIES AND EXCHANGE COMMISSION
Washington, DC 20549
FORM N-CSR
CERTIFIED SHAREHOLDER REPORT OF REGISTERED MANAGEMENT INVESTMENT COMPANY
Investment Company Act file number 811-21758
CLIPPER FUNDS TRUST
(Exact name of registrant as specified in charter)
2949 East Elvira Road, Suite 101
Tucson, AZ 85756
(Address of principal executive offices)
Ryan M. Charles
Davis Selected Advisers, L.P.
2949 East Elvira Road, Suite 101
Tucson, AZ 85756
(Name and address of agent for service)
Registrant's telephone number, including area code: 520-806-7600
Date of fiscal year end: December 31, 2016
Date of reporting period: December 31, 2016
____________________
ITEM 1. REPORT TO STOCKHOLDERS
CLIPPER FUNDSM |
Cautionary Statement
Davis Advisors is committed to communicating with our investment partners as candidly as possible because we believe our investors benefit from understanding our investment philosophy and approach. Our views and opinions regarding the investment prospects of our portfolio holdings include "forward looking statements" which may or may not be accurate over the long term. While we believe we have a reasonable basis for our appraisals and we have confidence in our opinions, actual results may differ materially from those we anticipate. These opinions are current as of the date of this report but are subject to change. The information provided in this report should not be considered a recommendation to buy, sell, or hold any particular security.
You can identify forward looking statements by words like "believe," "expect," "anticipate," or similar expressions when discussing prospects for particular portfolio holdings and/or of the Fund. We cannot assure future results and achievements. You should not place undue reliance on forward looking statements, which speak only as of the date of this report. We disclaim any obligation to update or alter any forward looking statements, whether as a result of new information, future events, or otherwise. This material must be preceded or accompanied by a prospectus. Please read the prospectus carefully for a discussion of investment objectives, risks, fees, and expenses. Current performance may be lower or higher than the performance quoted herein. You may obtain a current copy of the Fund's Prospectus or more current performance information by calling Investor Services at 1-800-432-2504 or on Clipper Fund's website (www.clipperfund.com).
CLIPPER FUNDSM | Table of Contents |
| 2 | |
| 8 | |
| 10 | |
| 12 | |
| 13 | |
| 16 | |
| 17 | |
| 18 | |
| 19 | |
| 25 | |
| 26 | |
| 27 | |
| 28 | |
| 29 |
This Annual Report is authorized for use by existing shareholders. Prospective shareholders must receive a current Clipper Fund Prospectus, which contains more information about investment strategies, risks, fees, and expenses. Please read the prospectus carefully before investing or sending money.
Shares of Clipper Fund are not deposits or obligations of any bank, are not guaranteed by any bank, are not insured by the FDIC or any other agency, and involve investment risks, including possible loss of the principal amount invested.
Portfolio Proxy Voting Policies and Procedures
The Fund has adopted Portfolio Proxy Voting Policies and Procedures under which the Fund votes proxies relating to securities held by the Fund. A description of the Fund's Portfolio Proxy Voting Policies and Procedures is available (i) without charge, upon request, by calling the Fund toll-free at 1-800-432-2504, (ii) on the Fund's website at www.clipperfund.com, and (iii) on the SEC's website at www.sec.gov.
In addition, the Fund is required to file Form N-PX, with its complete proxy voting record for the 12 months ended June 30th, no later than August 31st of each year. The Fund's Form N-PX filing is available (i) without charge, upon request, by calling the Fund toll-free at 1-800-432-2504, (ii) on the Fund's website at www.clipperfund.com, and (iii) on the SEC's website at www.sec.gov.
Form N-Q
The Fund files its complete schedule of portfolio holdings with the SEC for the first and third quarters of each fiscal year on Form N-Q. The Fund's Form N-Q is available without charge, upon request, by calling 1-800-432-2504, on the Fund's website at www.clipperfund.com, and on the SEC's website at www.sec.gov. The Fund's Form N-Q may be reviewed and copied at the SEC's Public Reference Room in Washington, D.C., and information on the operation of the Public Reference Room may be obtained by calling 1-800-SEC-0330.
CLIPPER FUNDSM |
Summary
| • | In 2016, Clipper Fund returned 15.62% vs. 11.96% for the S&P 500® Index.1 |
| • | Over the most recent one, three and five year periods, a $10,000 investment grew to $11,562, $13,260, and $19,988 respectively, exceeding the S&P 500® Index in all periods.1 |
| • | Opportunities in today's market include global leaders selling at bargain prices, dominant lesser-known businesses in necessary economic niches, blue chips of tomorrow, and beneficiaries of short-term misperceptions.2 |
| • | Risks in today's market include overvalued dividend darlings and companies with near peak profit margins.3 |
| Average Annual Total Returns as of December 31, 2016 | |||||
| 1 Year | 5 Years | 10 Years | 15 Years | 20 Years | |
| Clipper Fund | 15.62% | 14.86% | 5.00% | 5.51% | 8.55% |
S&P 500® Index | 11.96% | 14.66% | 6.95% | 6.69% | 7.68% |
The performance presented represents past performance and is not a guarantee of future results. Total return assumes reinvestment of dividends and capital gain distributions. Investment return and principal value will vary so that, when redeemed, an investor's shares may be worth more or less than their original cost. The total annual operating expense ratio as of the most recent prospectus was 0.72%. The total annual operating expense ratio may vary in future years. Current performance may be higher or lower than the performance quoted. For most recent month-end performance, visit clipperfund.com or call 800‑432‑2504. The Fund received favorable class action settlements from companies that it no longer owns. These settlements had a material impact on the investment performance of the Fund in 2009. This was a one-time event that is unlikely to be repeated. Clipper Fund was managed from inception, February 29, 1984, until December 31, 2005 by another Adviser. Davis Selected Advisers, L.P. took over management of the Fund on January 1, 2006.
Results of Our Investment Discipline
Clipper Fund results have exceeded the S&P 500® Index over the latest one, three and five year periods.
Over the latest one, three and five year periods, Clipper Fund has built shareholder wealth at a strong absolute rate and achieved relative results that exceed the S&P 500® Index. While active management has fallen out of fashion in recent years, we believe experience and judgment are valuable strengths in portfolio management and are pleased our results over the last five years bear this out. However, we still have ground to make up since being entrusted with management of the Fund in January 2006 and intend to build on our improved results in the years ahead. Our confidence in our time-tested approach is reflected by our investment of more than $100 million in Clipper Fund alongside our shareholders.4
This report includes candid statements and observations regarding investment strategies, individual securities, and economic and market conditions; however, there is no guarantee that these statements, opinions or forecasts will prove to be correct. Equity markets are volatile and an investor may lose money. Past performance is not a guarantee of future results.
1 Past performance is not a guarantee of future results.
2 While we research companies subject to such contingencies, we cannot be correct every time, and a company's stock may never recover.
3 While Davis Advisors attempts to manage risk there is no guarantee that an investor will not lose money. Equity markets are volatile and the investment return and principal value of an investment will vary. Diversification does not ensure against loss.
4 As of December 31, 2016.
Not a part of Annual Report to Fund shareholders
2
CLIPPER FUNDSM | Shareholder Letter – (Continued) |
Results of Our Investment Discipline – (Continued)
While our disciplined investment approach will not always be rewarded by the market over shorter periods, this active management strategy has produced positive returns for Clipper shareholders over the most recent 10 year period. The cornerstones of our discipline include rigorous research, focused investing, low expenses, alignment of interests, and a willingness to stand apart from the crowd.
Investment Outlook
Equities should outperform bonds over the next decade.5 Avoid overpriced dividend darlings. Focus on the important and knowable.
The last five years have been filled with the unexpected. Time and again, professional forecasters and pundits have been proven wrong: from the rise of ISIS to the collapse in energy prices; from Facebook's poorly received initial public offering to the bankruptcy of Detroit; from Brexit to the election of Donald Trump. Yet through it all, Clipper Fund has grown the value of a dollar invested five years ago by almost 100%, showing that while short-term predictions may be worthless, long-term preparation is invaluable.
The essence of our preparation is a relentless focus on what is both knowable and important. For example, while the short-term outlook for bond markets may not be predictable, we know today's historically low interest rates leave bondholders with less upside potential and more downside potential than at any other time in modern history. With the yield on long-term government bonds now comparable to the dividend yield on stocks, we expect stocks to handily outperform bonds in the decades ahead.
Another fact that is both knowable and important is market dips are inevitable. For example, since 1928 the market has experienced a 10% dip about every eight months and a 20% dip every two and a half years on average. Yet, when we experience such a dip, the media act as if the world is coming to an end. As a result, many investors panic and sell at low prices creating a buying opportunity for those who can keep their heads. Since stocks are one of best ways to build long-term wealth, the years ahead are likely to reward those investors who have a long-term perspective, flexibility and steady nerves and to penalize those investors who are frozen by indecision, committed to passive investment strategies or likely to panic during market downturns.
A final important and knowable fact is investors often feel safest when risks are greatest. From internet mania to the housing boom, what looked like a sure thing in the rear view mirror ended up a speculative bubble. Two sectors where investors feel safe today have risen to levels that appear risky to us. First, many popular dividend-paying stocks, often referred to as dividend darlings, have been bid up to premium valuations that could spell trouble for investors who assume dividends are guaranteed. Second, with regulatory encouragement, roughly a trillion dollars has been switched from actively managed funds into passive index funds since 2007. Such huge fund flows create momentum, as more money is automatically invested in those stocks whose prices have already gone up. Unfortunately, momentum-based strategies lead to bubbles and bubbles eventually burst. Moreover, while passive investing may have beaten the average manager, a select group of funds have beaten the market over longer periods. Clipper Fund, for example, managed by our predecessor James Gipson until 2005 and by Davis Advisors since, has beaten the benchmarks since its inception in 1984.6 Happily, as more money flows into passive index strategies that employ no securities analysis, more investment opportunities are available for investors like us who do. After all, finding undervalued companies is far easier when fewer investors are looking.
5 Common stocks and bonds represent different asset classes subject to different risks and rewards. Unlike bonds, the Fund does not offer a fixed rate of return if held to maturity, and the Fund has risks not associated with holding a bond. Bonds are considered to have less risk than equities. Future economic events may favor one asset class over another.
6 In the last five years, 59% of actively managed funds underperformed the S&P 500® Index.
Not a part of Annual Report to Fund shareholders
3
CLIPPER FUNDSM | Shareholder Letter – (Continued) |
The Portfolio
Global leaders trading at bargain prices. Dominant lesser-known businesses. Blue chips of tomorrow. Beneficiaries of short-term misperceptions.
While we have individually analyzed each of the 24 companies Clipper Fund holds, four broad themes characterize the majority of these businesses. These themes have allowed us to create a powerful combination of growth and value in Clipper Fund.
Global Leaders Trading at Bargain Prices - Some of the strongest and best-known companies in the world make up the largest portion of the Portfolio. This fact is nothing new. What is unusual though is short-term economic concerns over the past year have reduced the share prices of a handful of global leaders such as Berkshire Hathaway, United Technologies, American Express, and Monsanto to bargain levels at a time of high valuations for the average company.7 Buying top tier businesses at bargain prices is a value investor's dream.
Dominant Lesser-Known Businesses - Clipper Fund also invests in a group of lesser-known businesses that dominate dull but necessary niches in the global economy. Whether they participate in unglamorous industries or are headquartered in different countries, these businesses are not household names to U.S. investors. As a result, their shares often trade at a discount to better-known companies despite having the same qualities of market dominance and durability as the global leaders described above. Such companies include Johnson Control's leadership in fire and security, building controls, and car batteries; Liberty Global's strength in European cable TV and broadband; LafargeHolcim's dominance of the world cement industry; and Safran's leadership in jet engines (the company has been an equal but less well-known partner of General Electric for more than 30 years). These companies combine the relevance and resilience of blue chip companies with below-average valuations.
Blue Chips of Tomorrow - Another theme is fast-moving companies that use innovation to disrupt the economics of larger but less agile competitors. Similar to evolution, capitalism is a process of constant change that rewards businesses that can adapt. Over the decades, we have seen many examples of today's disrupters emerging as tomorrow's blue chips. Several of Clipper Fund's core holdings reflect this dynamic. Amazon has not only revolutionized the retail business, but also the information and technology industry through Amazon Web Services (AWS). Alphabet (the parent company of Google) began by making the world's information accessible through the internet and emerged as the largest and most profitable advertising firm in the world, the brains behind the vast majority of all smart phones, a leader in internet video, and the emerging leader in artificial intelligence and self-driving cars.
CarMax, the nation's largest used car retailer, and Didi Chuxing, a ride hailing business comparable to Uber that dominates the Chinese market, are two additional examples of innovators that have been just as disruptive in their industries. Using a combination of huge selection, no-haggle pricing and long-term warranties, CarMax brings trust, choice and quality into the murky but enormous used car industry. Didi Chuxing is the unquestioned leader in the world's largest ride sharing market, China. With a staggering 85% market share and ride volume still growing nearly 20% a year, this powerhouse business should experience strong growth for years to come. Investors in such disruptive leaders stand to benefit not just from the growth in these companies' underlying businesses, but also from their gradual inclusion in the ranks of blue chip stocks.
7 Individual securities are discussed in this piece. While we believe we have a reasonable basis for our appraisals and we have confidence in our opinions, actual results may differ materially from those we anticipate. The return of a security to the Fund will vary based on weighting and timing of purchase. This is not a recommendation to buy, sell or hold any specific security. Past performance is not a guarantee of future results.
Not a part of Annual Report to Fund shareholders
4
CLIPPER FUNDSM | Shareholder Letter – (Continued) |
The Portfolio – (Continued)
Beneficiaries of Short-Term Misperceptions - Short-sighted investors avoid companies that face short-term misperceptions, creating an opportunity for long-term investors willing to look beyond today's headlines. In banking, for example, memories of the financial crisis of 2008–2009 combined with subsequent anti-banking rhetoric and media coverage have blinded investors to the fact carefully selected banks are both cheap and safe, in our opinion. Contrary to perception, many top tier banks are not only reporting record earnings but are also far better capitalized than at any time in the last 50 years. While unloved now, we believe the leading financial companies we own will be big contributors to Clipper Fund's future returns as the reality of their strong economic fundamentals and rising dividends eclipses current investor perceptions.
Similarly, over the past year, investors fled the energy sector in response to the dramatic (and unsustainable) collapse in oil prices. While oil prices are unknowable in the short term, they must exceed the cost of replacing reserves over time. This simple fact should eventually lead to higher energy prices and should drive future returns for the well-positioned, low-cost producers the Fund holds. As a result, we repositioned the energy portion of the Portfolio, adding to existing holdings and initiating new investments. We own a select group of innovative and well-positioned energy companies with the capital allocation discipline, management experience and low-cost, long-lived reserves that should allow them to increase production for decades to come. Holdings include Occidental Petroleum, Apache, and Encana.
All in all, the carefully selected companies that make up Clipper Fund combine above-average resiliency and growth with below-average prices.
Conclusion
Today, as always, when confronted with background noise, investors benefit from tuning out the static of short-term market predictions and company forecasts and focusing instead on long-term opportunities and risks. Today, we see significant opportunity in areas of the markets that are overlooked and risk in popular areas of the market where investors feel safest. This combination creates opportunity for those who can be flexible and independent. At a time when pundits and commentators are making the case that experience and judgment do not matter and that the best investors can hope for is an average result, we strongly disagree. We believe a carefully selected Portfolio of durable, well-managed businesses with competitive advantages, selling at a discount to true value and overseen by a seasoned team with proven results will lead to a better-than-average outcome. In investing, as in any other profession, skill matters. Since our firm's founding more than 47 years ago, we have demonstrated the value of that skill by building wealth for our shareholders. With the vast majority of our net worth invested alongside our shareholders, we have every incentive and intention to build on this record in the years and decades ahead.
Sincerely,
 |  |
| Christopher C. Davis | Danton G. Goei |
| President & Portfolio Manager | Portfolio Manager |
| February 3, 2017 |
Not a part of Annual Report to Fund shareholders
5
CLIPPER FUNDSM | Shareholder Letter – (Continued) |
This report is authorized for use by existing shareholders. A current Clipper Fund prospectus must accompany or precede this material if it is distributed to prospective shareholders. You should carefully consider the Fund's investment objective, risks, fees, and expenses before investing. Read the prospectus carefully before you invest or send money.
This report includes candid statements and observations regarding investment strategies, individual securities, and economic and market conditions; however, there is no guarantee that these statements, opinions or forecasts will prove to be correct. These comments may also include the expression of opinions that are speculative in nature and should not be relied on as statements of fact.
Objective and Risks. Clipper Fund's investment objective is long-term capital growth and capital preservation. There can be no assurance that the Fund will achieve its objective. The Fund invests primarily in equity securities issued by large companies with market capitalizations of at least $10 billion. Some important risks of an investment in the Fund are: stock market risk: stock markets have periods of rising prices and periods of falling prices, including sharp declines; manager risk: poor security selection may cause the Fund to underperform relevant benchmarks; common stock risk: an adverse event may have a negative impact on a company and could result in a decline in the price of its common stock; large-capitalization companies risk: companies with $10 billion or more in market capitalization generally experience slower rates of growth in earnings per share than do mid- and small-capitalization companies; mid- and small-capitalization companies risk: companies with less than $10 billion in market capitalization typically have more limited product lines, markets and financial resources than larger companies, and may trade less frequently and in more limited volume; headline risk: the Fund may invest in a company when the company becomes the center of controversy. The company's stock may never recover or may become worthless; focused portfolio risk: investing in a limited number of companies causes changes in the value of a single security to have a more significant effect on the value of the Fund's total portfolio; financial services risk: investing a significant portion of assets in the financial services sector may cause the Fund to be more sensitive to systemic risk, regulatory actions, changes in interest rates, non-diversified loan portfolios, credit, and competition; foreign country risk: foreign companies may be subject to greater risk as foreign economies may not be as strong or diversified; As of December 31, 2016, the Fund had approximately 11.7% of assets invested in foreign companies; foreign currency risk: the change in value of a foreign currency against the U.S. dollar will result in a change in the U.S. dollar value of securities denominated in that foreign currency; depositary receipts risk: depositary receipts may trade at a discount (or premium) to the underlying security and may be less liquid than the underlying securities listed on an exchange; and fees and expenses risk: the Fund may not earn enough through income and capital appreciation to offset the operating expenses of the Fund. See the prospectus for a complete description of the principal risks.
Davis Advisors is committed to communicating with our investment partners as candidly as possible because we believe our investors benefit from understanding our investment philosophy and approach. Our views and opinions include "forward-looking statements" which may or may not be accurate over the long term. Forward-looking statements can be identified by words like "believe," "expect," "anticipate," or similar expressions. You should not place undue reliance on forward-looking statements, which are current as of the date of this report. We disclaim any obligation to update or alter any forward-looking statements, whether as a result of new information, future events, or otherwise. While we believe we have a reasonable basis for our appraisals and we have confidence in our opinions, actual results may differ materially from those we anticipate.
Not a part of Annual Report to Fund shareholders
6
CLIPPER FUNDSM | Shareholder Letter – (Continued) |
The information provided in this material should not be considered a recommendation to buy, sell, or hold any particular security. As of December 31, 2016, the top ten holdings of Clipper Fund were:
| Berkshire Hathaway Inc., Class A | 8.32% |
| Alphabet Inc.* | 6.33% |
| Amazon.com, Inc. | 6.31% |
| United Technologies Corp. | 6.09% |
| American Express Co. | 5.53% |
| Wells Fargo & Co. | 5.42% |
| Apache Corp. | 5.41% |
| Bank of New York Mellon Corp. | 5.27% |
| JPMorgan Chase & Co. | 5.07% |
| Markel Corp. | 4.33% |
*Alphabet Inc. holding includes Class A and Class C.
Clipper Fund has adopted a Portfolio Holdings Disclosure policy that governs the release of non-public portfolio holding information. This policy is described in the prospectus. Holding percentages are subject to change. Visit clipperfund.com or call 800‑432‑2504 for the most current public portfolio holdings information.
Broker-dealers and other financial intermediaries may charge Davis Advisors substantial fees for selling its funds and providing continuing support to clients and shareholders. For example, broker-dealers and other financial intermediaries may charge: sales commissions; distribution and service fees; and record-keeping fees. In addition, payments or reimbursements may be requested for: marketing support concerning Davis Advisors' products; placement on a list of offered products; access to sales meetings, sales representatives and management representatives; and participation in conferences or seminars, sales or training programs for invited registered representatives and other employees, client and investor events, and other dealer-sponsored events. Financial advisors should not consider Davis Advisors' payment(s) to a financial intermediary as a basis for recommending Davis Advisors.
We gather our index data from a combination of reputable sources, including, but not limited to, Thomson Financial, Lipper and index websites.
The S&P 500® Index is an unmanaged index of 500 selected common stocks, most of which are listed on the New York Stock Exchange. The Index is adjusted for dividends, weighted towards stocks with large market capitalizations and represents approximately two-thirds of the total market value of all domestic common stocks. Investments cannot be made directly in an index.
After April 30, 2017, this material must be accompanied by a supplement containing performance data for the most recent quarter end.
Shares of the Clipper Fund are not deposits or obligations of any bank, are not guaranteed by any bank, are not insured by the FDIC or any other agency, and involve investment risks, including possible loss of the principal amount invested.
12/16 Davis Distributors, LLC, 2949 East Elvira Road, Suite 101, Tucson, AZ 85756, 800‑432‑2504, clipperfund.com
Not a part of Annual Report to Fund shareholders
7
CLIPPER FUNDSM |
Performance Overview
Clipper Fund outperformed the Standard & Poor's 500® Index ("S&P 500®") for the twelve-month period ended December 31, 2016 (the "period"). The Fund delivered a total return of 15.62%, versus an 11.96% return for the S&P 500®. The sectors1 within the S&P 500® that reported the strongest performance were Energy (up 27%), Telecommunication Services (up 23%), and Financials (up 20%). Only one sector within the S&P 500® reported negative performance figures, Health Care (down 3%). The second- and third-weakest, but still positive, performing sectors were Real Estate (up 3%) and Consumer Staples (up 5%). During the third quarter, the Real Estate sector was added to the S&P 500® Index by moving it out from under the Financials sector.
Contributors to Performance
When compared to the S&P 500®, the Fund's holdings in the Energy sector were the most significant contributor to performance2. The Fund's Energy holdings were up about 63%, compared to up 27% for the S&P 500® sector. The Fund benefited from an overweight position (11%, versus 7%) in the strongest performing sector of the period and from the Fund's top two overall contributors, Encana3 (up 132%) and Apache (up 46%), respectively. Cabot Oil & Gas (up 39%) was also a strong performer; however, the Fund no longer owns this holding.
A significant portion of the Fund's investments remained in Financials. Returns from holdings in the Financials sector made the most significant contribution to performance, on an absolute basis. The Fund's Financial holdings were up about 17%, compared to up 20% for the S&P 500® sector. The Fund's largest holding, Berkshire Hathaway (up 23%), along with JPMorgan Chase (up 35%), Bank of New York Mellon (up 17%), and Charles Schwab (up 21%), were all key contributors. The Fund no longer owns Charles Schwab.
Additional contributors included Johnson Controls (up 28%) and United Technologies (up 17%), both from the Industrials sector, and UnitedHealth Group (up 38%) from the Health Care sector. The Fund acquired Johnson Controls as the result of a merger with Tyco International (purchased during the first quarter of the period).
Detractors from Performance
When compared to the S&P 500®, the Fund's holdings in the Information Technology sector were the most significant detractor from performance. The Fund's Information Technology holdings were up about 11%, compared to up 14% for the S&P 500® sector. The Fund also suffered from an underweight position (10%, versus 20%).
Returns from holdings in the Health Care sector were the most significant detractor from performance, on an absolute basis. The Fund had two Health Care holdings during the period. Although the Fund held an underweight position (4%, versus 15%) in the weakest performing sector of the period, the Fund's overall top detractor, Valeant Pharmaceuticals (down 78%), hindered performance.
Additional detractors included Liberty Global (down 22%) from the Consumer Discretionary sector, Costco (down 11%) from the Consumer Staples sector, Occidental Petroleum (down 3%) from the Energy sector, and Banner (down 5%) from the Financials sector. The Fund no longer owns Costco or Banner.
The Fund had approximately 12% of its net assets invested in foreign securities. As a whole, the Fund's foreign holdings significantly underperformed its domestic holdings (down 6%, versus up 18%).
Clipper Fund's investment objective is to seek long-term capital growth and capital preservation. There can be no assurance that the Fund will achieve its objective. Clipper Fund's principal risks are: stock market risk, manager risk, common stock risk, large-capitalization companies risk, mid- and small-capitalization companies risk, headline risk, focused portfolio risk, financial services risk, foreign country risk, foreign currency risk, depositary receipts risk, and fees and expenses risk. See the prospectus for a full description of each risk.
Clipper Fund focuses its investments in fewer companies, and it may be subject to greater risks than a more diversified fund that is not allowed to focus its investments in a few companies. The Fund's investment performance, both good and bad, is expected to reflect the economic performance of its more focused portfolio.
Past performance does not guarantee future results, Fund prices fluctuate, and the value of an investment may be worth more or less than the purchase price. Data provided in this performance overview is for the twelve-month period ended December 31, 2016, unless otherwise noted. Return figures for underlying Fund positions reflect the return of the security from the beginning of the period or the date of first purchase if subsequent thereto through the end of the period or the date the position is completely liquidated. The actual contribution to the Fund will vary based on a number of factors (e.g. trading activity, weighting). Portfolio holding information is as of the end of the twelve-month period, December 31, 2016, unless otherwise noted.
1 The companies included in the Standard & Poor's 500® Index are divided into eleven sectors. One or more industry groups make up a sector.
2 | A company's or sector's contribution to or detraction from the Fund's performance is a product both of its appreciation or depreciation and its weighting within the Fund. For example, a 5% holding that rises 20% has twice as much impact as a 1% holding that rises 50%. |
3 | This Management Discussion of Fund Performance discusses a number of individual companies. The information provided in this report does not provide information reasonably sufficient upon which to base an investment decision and should not be considered a recommendation to purchase, sell, or hold any particular security. The Schedule of Investments lists the Fund's holdings of each company discussed. |
8
CLIPPER FUNDSM | Management's Discussion of Fund Performance – (Continued) |
Comparison of a $10,000 investment in Clipper Fund versus the Standard & Poor's 500® Index
over 10 years for an investment made on December 31, 2006
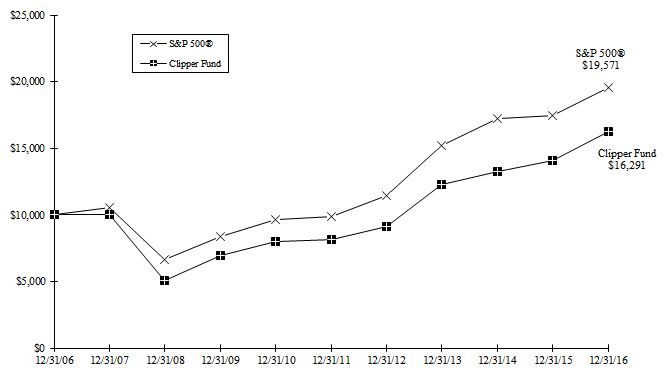
Average Annual Total Return for periods ended December 31, 2016
Fund & Benchmark Index | 1-Year | 5-Year | 10-Year | Since Fund's Inception (02/29/84) | Gross Expense Ratio | Net Expense Ratio |
| Clipper Fund | 15.62% | 14.86% | 5.00% | 11.70% | 0.72% | 0.72% |
Standard & Poor's 500® Index | 11.96% | 14.66% | 6.95% | 11.09% |
In 2009, the Fund received favorable class action settlements from companies which it no longer owns. These settlements had a material impact on the investment performance of the Fund, adding approximately 5% to the Fund's total return in 2009. This was a one-time event that is unlikely to be repeated.
The Standard & Poor's 500® Index is an unmanaged index of 500 selected common stocks, most of which are listed on the New York Stock Exchange. The Index is adjusted for dividends, weighted towards stocks with large market capitalizations, and represents approximately two-thirds of the total market value of all domestic common stocks. Investments cannot be made directly in the Index.
The performance data for Clipper Fund contained in this report represents past performance, assumes that all distributions were reinvested, and should not be considered as an indication of future performance from an investment in the Fund today. The investment return and principal value will fluctuate so that shares may be worth more or less than their original cost when redeemed. Fund performance changes over time and current performance may be higher or lower than stated. Returns shown do not reflect the deduction of taxes that a shareholder would pay on fund distributions or the redemption of fund shares. The operating expense ratio may vary in future years. For more current information please call Clipper Fund Investor Services at 1-800-432-2504.
Davis Selected Advisers, L.P. began serving as investment adviser to Clipper Fund on January 1, 2006. A different investment adviser managed the Fund through December 31, 2005.
9
CLIPPER FUNDSM | |
| December 31, 2016 |
| Portfolio Composition | Industry Weightings | |||||
| (% of Fund's 12/31/16 Net Assets) | (% of 12/31/16 Stock Holdings) | |||||
| Fund | S&P 500® | |||||
| Common Stock (U.S.) | 81.30% | Diversified Financials | 20.57% | 5.30% | ||
| Common Stock (Foreign) | 10.00% | Banks | 15.15% | 6.72% | ||
| Preferred Stock (Foreign) | 1.65% | Capital Goods | 14.50% | 7.40% | ||
| Short-Term Investments | 6.95% | Energy | 12.90% | 7.56% | ||
| Other Assets & Liabilities | 0.10% | Retailing | 10.50% | 5.40% | ||
| 100.00% | Materials | 7.02% | 2.84% | |||
| Information Technology | 6.84% | 20.78% | ||||
| Insurance | 4.66% | 2.78% | ||||
| Health Care | 4.47% | 13.63% | ||||
| Media | 2.20% | 3.07% | ||||
| Automobiles & Components | 1.19% | 0.73% | ||||
| Food, Beverage & Tobacco | – | 5.34% | ||||
| Utilities | – | 3.17% | ||||
| Other | – | 15.28% | ||||
| 100.00% | 100.00% | |||||
| Top 10 Long-Term Holdings | |||||
| (% of Fund's 12/31/16 Net Assets) | |||||
| Berkshire Hathaway Inc., Class A | Diversified Financial Services | 8.32% | |||
| Alphabet Inc.* | Software & Services | 6.33% | |||
| Amazon.com, Inc. | Retailing | 6.31% | |||
| United Technologies Corp. | Capital Goods | 6.09% | |||
| American Express Co. | Consumer Finance | 5.53% | |||
| Wells Fargo & Co. | Banks | 5.42% | |||
| Apache Corp. | Energy | 5.41% | |||
| Bank of New York Mellon Corp. | Capital Markets | 5.27% | |||
| JPMorgan Chase & Co. | Banks | 5.07% | |||
| Markel Corp. | Property & Casualty Insurance | 4.33% | |||
*Alphabet Inc. holding includes Class A and Class C.
10
CLIPPER FUNDSM | Fund Overview – (Continued) |
| December 31, 2016 |
New Positions Added (01/01/16-12/31/16)
(Highlighted positions are those greater than 3.25% of the Fund's 12/31/16 net assets)
| Security | Industry | Date of 1st Purchase | % of Fund's 12/31/16 Net Assets |
| CarMax, Inc. | Retailing | 01/14/16 | 1.80% |
| Didi Chuxing Joint Co., Series A, Pfd. | Retailing | 04/22/16 | 1.65% |
| Johnson Controls International PLC | Capital Goods | 02/05/16 | 4.26% |
| Occidental Petroleum Corp. | Energy | 05/06/16 | 3.32% |
| Safran S.A. | Capital Goods | 05/19/16 | 3.13% |
| U.S. Bancorp | Banks | 06/09/16 | 3.59% |
| Valeant Pharmaceuticals International, Inc. | Pharmaceuticals, Biotechnology & Life Sciences | 03/02/16 | 0.55% |
Positions Closed (01/01/16-12/31/16)
(Gains and losses greater than $20,000,000 are highlighted)
| Security | Industry | Date of Final Sale | Realized Gain (Loss) | |
| Activision Blizzard, Inc. | Software & Services | 07/29/16 | $ | 47,133,813 |
| Banner Corp. | Banks | 04/26/16 | 3,198,947 | |
| Cabot Oil & Gas Corp. | Energy | 05/10/16 | (12,791,579) | |
| Charles Schwab Corp. | Capital Markets | 12/08/16 | 16,427,212 | |
| Costco Wholesale Corp. | Food & Staples Retailing | 02/05/16 | 31,415,726 | |
| Las Vegas Sands Corp. | Consumer Services | 03/02/16 | (16,565,134) | |
| Texas Instruments Inc. | Semiconductors & Semiconductor Equipment | 03/02/16 | 17,358,911 |
11
CLIPPER FUNDSM |
As a shareholder of the Fund, you incur ongoing costs only, including advisory and administrative fees and other Fund expenses. The Expense Example is intended to help you understand your ongoing costs (in dollars) of investing in the Fund and to compare these costs with the ongoing costs of investing in other mutual funds. The Expense Example is based on an investment of $1,000 invested at the beginning of the period and held for the entire period indicated, which is for the six-month period ended December 31, 2016.
Actual Expenses
The information represented in the row entitled "Actual" provides information about actual account values and actual expenses. You may use the information in this row, together with the amount you invested, to estimate the expenses that you paid over the period. Simply divide your account value by $1,000 (for example, an $8,600 account value divided by $1,000 = 8.6), then multiply the result by the number under the heading "Expenses Paid During Period" to estimate the expenses you paid on your account during this period. An annual maintenance fee of $10, charged on retirement plan accounts per Social Security Number, is not included in the Expense Example. If this fee was included, the estimate of expenses you paid during the period would be higher, and your ending account value would be lower, by this amount.
Hypothetical Example for Comparison Purposes
The information represented in the row entitled "Hypothetical" provides information about hypothetical account values and hypothetical expenses based on the Fund's actual expense ratio and an assumed rate of return of 5% per year before expenses, which is not the Fund's actual return. The hypothetical account values and expenses may not be used to estimate the actual ending account balance or expenses you paid for the period. You may use this information to compare the ongoing costs of investing in the Fund and other funds. To do so, compare this 5% hypothetical example with the 5% hypothetical examples that appear in the shareholder reports of the other funds. An annual maintenance fee of $10, charged on retirement plan accounts per Social Security Number, is not included in the Expense Example. If this fee was included, the estimate of expenses you paid during the period would be higher, and your ending account value would be lower, by this amount.
Please note that the expenses shown in the table are meant to highlight your ongoing costs only. Therefore, the information in the row entitled "Hypothetical" is useful in comparing ongoing costs only, and will not help you determine the relative total costs of owning different funds.
Beginning Account Value (07/01/16) | Ending Account Value (12/31/16) | Expenses Paid During Period* (07/01/16-12/31/16) | |||
| Actual | $1,000.00 | $1,141.29 | $3.82 | ||
| Hypothetical | $1,000.00 | $1,021.57 | $3.61 |
Hypothetical assumes 5% annual return before expenses.
* Expenses are equal to the Fund's annualized operating expense ratio (0.71%)**, multiplied by the average account value over the period, multiplied by 184/366 (to reflect the one-half year period).
** The expense ratio reflects the impact, if any, of certain reimbursements.
12
| Shares | Value (Note 1) | |||||||||||
| COMMON STOCK – (91.30%) | ||||||||||||
| CONSUMER DISCRETIONARY – (11.26%) | ||||||||||||
| Automobiles & Components – (1.11%) | ||||||||||||
| Adient PLC * | 228,819 | $ | 13,408,793 | |||||||||
| Media – (2.04%) | ||||||||||||
| Liberty Global PLC, LiLAC Class C * | 129,685 | 2,745,432 | ||||||||||
| Liberty Global PLC, Series C * | 742,193 | 22,043,132 | ||||||||||
| 24,788,564 | ||||||||||||
| Retailing – (8.11%) | ||||||||||||
| Amazon.com, Inc. * | 101,956 | 76,453,746 | ||||||||||
| CarMax, Inc. * | 339,112 | 21,835,421 | ||||||||||
| 98,289,167 | ||||||||||||
| Total Consumer Discretionary | 136,486,524 | |||||||||||
| ENERGY – (11.99%) | ||||||||||||
| Apache Corp. | 1,033,659 | 65,606,337 | ||||||||||
| Encana Corp. (Canada) | 3,359,403 | 39,439,391 | ||||||||||
| Occidental Petroleum Corp. | 565,413 | 40,274,368 | ||||||||||
| Total Energy | 145,320,096 | |||||||||||
| FINANCIALS – (37.53%) | ||||||||||||
| Banks – (14.08%) | ||||||||||||
| JPMorgan Chase & Co. | 711,542 | 61,398,959 | ||||||||||
| U.S. Bancorp | 847,299 | 43,525,750 | ||||||||||
| Wells Fargo & Co. | 1,192,422 | 65,714,376 | ||||||||||
| 170,639,085 | ||||||||||||
| Diversified Financials – (19.12%) | ||||||||||||
| Capital Markets – (5.27%) | ||||||||||||
| Bank of New York Mellon Corp. | 1,348,743 | 63,903,443 | ||||||||||
| Consumer Finance – (5.53%) | ||||||||||||
| American Express Co. | 904,586 | 67,011,731 | ||||||||||
| Diversified Financial Services – (8.32%) | ||||||||||||
| Berkshire Hathaway Inc., Class A * | 413 | 100,821,973 | ||||||||||
| 231,737,147 | ||||||||||||
| Insurance – (4.33%) | ||||||||||||
| Property & Casualty Insurance – (4.33%) | ||||||||||||
| Markel Corp. * | 58,067 | 52,521,602 | ||||||||||
| Total Financials | 454,897,834 | |||||||||||
| HEALTH CARE – (4.15%) | ||||||||||||
| Health Care Equipment & Services – (3.60%) | ||||||||||||
| UnitedHealth Group Inc. | 272,634 | 43,632,345 | ||||||||||
| Pharmaceuticals, Biotechnology & Life Sciences – (0.55%) | ||||||||||||
| Valeant Pharmaceuticals International, Inc. (Canada)* | 459,670 | 6,674,409 | ||||||||||
| Total Health Care | 50,306,754 | |||||||||||
| INDUSTRIALS – (13.48%) | ||||||||||||
| Capital Goods – (13.48%) | ||||||||||||
| Johnson Controls International PLC | 1,252,396 | 51,586,191 | ||||||||||
| Safran S.A. (France) | 527,268 | 37,975,076 | ||||||||||
| United Technologies Corp. | 673,175 | 73,793,444 | ||||||||||
| Total Industrials | 163,354,711 | |||||||||||
13
CLIPPER FUNDSM | Schedule of Investments – (Continued) |
| December 31, 2016 |
Shares/Units/ Principal | Value (Note 1) | ||||||||||
| COMMON STOCK – (CONTINUED) | |||||||||||
| INFORMATION TECHNOLOGY – (6.36%) | |||||||||||
| Software & Services – (6.36%) | |||||||||||
| Alphabet Inc., Class A * | 48,990 | $ | 38,822,126 | ||||||||
| Alphabet Inc., Class C * | 49,022 | 37,836,160 | |||||||||
| ASAC II L.P. *(a) | 407,313 | 386,866 | |||||||||
| Total Information Technology | 77,045,152 | ||||||||||
| MATERIALS – (6.53%) | |||||||||||
| LafargeHolcim Ltd. (Switzerland) | 705,594 | 37,074,057 | |||||||||
| Monsanto Co. | 399,246 | 42,004,672 | |||||||||
| Total Materials | 79,078,729 | ||||||||||
TOTAL COMMON STOCK – (Identified cost $814,761,212) | 1,106,489,800 | ||||||||||
| PREFERRED STOCK – (1.65%) | |||||||||||
| CONSUMER DISCRETIONARY – (1.65%) | |||||||||||
| Retailing – (1.65%) | |||||||||||
| Didi Chuxing Joint Co., Series A (China)*(a) | 524,409 | 20,046,635 | |||||||||
TOTAL PREFERRED STOCK – (Identified cost $20,046,635) | 20,046,635 | ||||||||||
| SHORT-TERM INVESTMENTS – (6.95%) | |||||||||||
INTL FCStone Financial Inc. Joint Repurchase Agreement, 0.62%, 01/03/17, dated 12/30/16, repurchase value of $12,463,859 (collateralized by: U.S. Government agency mortgages and obligations in a pooled cash account, 0.00%-9.50%, 02/15/17-12/01/46, total market value $12,712,260) | $ | 12,463,000 | 12,463,000 | ||||||||
Mizuho Securities USA Inc. Joint Repurchase Agreement, 0.45%, 01/03/17, dated 12/30/16, repurchase value of $4,462,223 (collateralized by: U.S. Government agency mortgage in a pooled cash account, 3.50%, 09/01/46, total market value $4,551,240) | 4,462,000 | 4,462,000 | |||||||||
Nomura Securities International, Inc. Joint Repurchase Agreement, 0.50%, 01/03/17, dated 12/30/16, repurchase value of $49,855,770 (collateralized by: U.S. Government agency mortgages and obligation in a pooled cash account, 1.375%-7.50%, 08/01/20-12/01/46, total market value $50,850,060) | 49,853,000 | 49,853,000 | |||||||||
SunTrust Robinson Humphrey, Inc. Joint Repurchase Agreement, 0.49%, 01/03/17, dated 12/30/16, repurchase value of $17,449,950 (collateralized by: U.S. Government agency mortgages and obligations in a pooled cash account, 1.77%-5.50%, 10/05/23-12/01/46, total market value $17,797,980) | 17,449,000 | 17,449,000 | |||||||||
TOTAL SHORT-TERM INVESTMENTS – (Identified cost $84,227,000) | 84,227,000 | ||||||||||
14
CLIPPER FUNDSM | Schedule of Investments – (Continued) |
| December 31, 2016 |
| Total Investments – (99.90%) – (Identified cost $919,034,847) – (b) | $ | 1,210,763,435 | |||||
| Other Assets Less Liabilities – (0.10%) | 1,217,704 | ||||||
| Net Assets – (100.00%) | $ | 1,211,981,139 | |||||
| * | Non-Income producing security. | ||||||
| (a) | Restricted Security – See Note 6 of the Notes to Financial Statements. | ||||||
| (b) | Aggregate cost for federal income tax purposes is $924,877,421. At December 31, 2016, unrealized appreciation (depreciation) of securities for federal income tax purposes is as follows: | ||||||
| Unrealized appreciation | $ | 350,233,237 | |||||
| Unrealized depreciation | (64,347,223) | ||||||
| Net unrealized appreciation | $ | 285,886,014 | |||||
| See Notes to Financial Statements | |||||||
15
| ASSETS: | |||||||
| Investments in securities at value* (see accompanying Schedule of Investments) | $ | 1,210,763,435 | |||||
| Cash | 1,283 | ||||||
| Receivables: | |||||||
| Capital stock sold | 1,031,502 | ||||||
| Dividends and interest | 986,385 | ||||||
| Investment securities sold | 547,726 | ||||||
| Prepaid expenses | 28,532 | ||||||
| Total assets | 1,213,358,863 | ||||||
LIABILITIES: | |||||||
| Payables: | |||||||
| Capital stock redeemed | 489,276 | ||||||
| Accrued investment advisory fee | 584,490 | ||||||
| Accrued transfer agent fees | 160,593 | ||||||
| Other accrued expenses | 143,365 | ||||||
| Total liabilities | 1,377,724 | ||||||
NET ASSETS | $ | 1,211,981,139 | |||||
SHARES OUTSTANDING | 11,147,526 | ||||||
NET ASSET VALUE, offering, and redemption price per share (Net assets ÷ Shares outstanding) | $ | 108.72 | |||||
NET ASSETS CONSIST OF: | |||||||
| Paid-in capital | $ | 912,648,332 | |||||
| Undistributed net investment income | 674,149 | ||||||
| Accumulated net realized gains from investments | 6,929,770 | ||||||
| Net unrealized appreciation on investments and foreign currency transactions | 291,728,888 | ||||||
| Net Assets | $ | 1,211,981,139 | |||||
| *Including: | |||||||
| Cost of investments | $ | 919,034,847 | |||||
| See Notes to Financial Statements |
16
CLIPPER FUNDSM | |
| For the year ended December 31, 2016 |
| INVESTMENT INCOME: | ||||||||||
| Income: | ||||||||||
| Dividends* | $ | 14,985,919 | ||||||||
| Interest | 133,350 | |||||||||
| Net securities lending fees | 3,627 | |||||||||
| Total income | 15,122,896 | |||||||||
Expenses: | ||||||||||
| Investment advisory fees (Note 3) | $ | 6,197,397 | ||||||||
| Custodian fees | 131,408 | |||||||||
| Transfer agent fees | 1,264,433 | |||||||||
| Audit fees | 48,175 | |||||||||
| Legal fees | 18,805 | |||||||||
| Reports to shareholders | 93,216 | |||||||||
| Trustees' fees and expenses | 209,474 | |||||||||
| Registration and filing fees | 68,833 | |||||||||
| Miscellaneous | 47,853 | |||||||||
| Total expenses | 8,079,594 | |||||||||
| Net investment income | 7,043,302 | |||||||||
REALIZED & UNREALIZED GAIN ON INVESTMENTS AND FOREIGN CURRENCY TRANSACTIONS: | ||||||||||
| Net realized gain from: | ||||||||||
| Investment transactions | 134,831,515 | |||||||||
| Foreign currency transactions | 29,515 | |||||||||
| Net realized gain | 134,861,030 | |||||||||
| Net increase in unrealized appreciation | 15,474,808 | |||||||||
Net realized and unrealized gain on investments and foreign currency transactions | 150,335,838 | |||||||||
| Net increase in net assets resulting from operations | $ | 157,379,140 | ||||||||
| *Net of foreign taxes withheld of | $ | 92,779 | ||||||||
| See Notes to Financial Statements |
17
CLIPPER FUNDSM |
| Year ended December 31, | ||||||||
| 2016 | 2015 | |||||||
OPERATIONS: | ||||||||
| Net investment income | $ | 7,043,302 | $ | 5,642,061 | ||||
| Net realized gain from investments and foreign currency transactions | 134,861,030 | 93,365,183 | ||||||
Net increase (decrease) in unrealized appreciation on investments and foreign currency transactions | 15,474,808 | (31,142,071) | ||||||
| Net increase in net assets resulting from operations | 157,379,140 | 67,865,173 | ||||||
DIVIDENDS AND DISTRIBUTIONS TO SHAREHOLDERS FROM: | ||||||||
| Net investment income | (12,684,799) | (5,798,098) | ||||||
| Realized gains from investment transactions | (108,976,945) | (2,783,086) | ||||||
CAPITAL SHARE TRANSACTIONS: | ||||||||
Net increase (decrease) in net assets resulting from capital share transactions (Note 4) | (39,837,748) | 47,674,046 | ||||||
| Total increase (decrease) in net assets | (4,120,352) | 106,958,035 | ||||||
NET ASSETS: | ||||||||
| Beginning of year | 1,216,101,491 | 1,109,143,456 | ||||||
End of year* | $ | 1,211,981,139 | $ | 1,216,101,491 | ||||
| *Including undistributed net investment income of | $ | 674,149 | $ | 85,756 | ||||
| See Notes to Financial Statements |
18
CLIPPER FUNDSM | |
| December 31, 2016 |
NOTE 1 - SUMMARY OF SIGNIFICANT ACCOUNTING POLICIES
Clipper Funds Trust, a Delaware statutory trust ("Trust"), on behalf of Clipper Fund ("Fund"), a series of the Trust, is registered under the Investment Company Act of 1940, as amended, as a non-diversified, open-end management investment company. The Fund follows the reporting guidance of the Financial Accounting Standards Board ("FASB") Accounting Standards Codification Topic 946, Financial Services – Investment Companies. The Fund's investment objective is long-term capital growth and capital preservation. Davis Selected Advisers, L.P. ("Davis Advisors" or "Adviser"), the Fund's investment adviser, seeks to invest the Fund's assets primarily in common stocks of large companies (generally, companies with market capitalizations of $10 billion or more at the time of initial purchase) that are trading at prices below the Adviser's estimate of their intrinsic values. The following is a summary of significant accounting policies consistently followed by the Fund in the preparation of its financial statements.
Security Valuation - The Fund calculates the net asset value of its shares as of the close of the New York Stock Exchange ("Exchange"), normally 4:00 P.M. Eastern time, on each day the Exchange is open for business. Securities listed on the Exchange (and other national exchanges including NASDAQ) are valued at the last reported sales price on the day of valuation. Listed securities for which no sale was reported on that date are valued at the closing bid price. Securities traded on foreign exchanges are valued based upon the last sales price on the principal exchange on which the security is traded prior to the time when the Fund's assets are valued. Securities (including restricted securities) for which market quotations are not readily available or securities whose values have been materially affected by what the Adviser identifies as a significant event occurring before the Fund's assets are valued but after the close of their respective exchanges will be fair valued using a fair valuation methodology applicable to the security type or the significant event as previously approved by the Fund's Pricing Committee and Board of Trustees. The Pricing Committee considers all facts it deems relevant that are reasonably available, through either public information or information available to the Adviser's portfolio management team, when determining the fair value of a security. To assess the appropriateness of security valuations, the Adviser may consider (i) comparing prior day prices and/or prices of comparable securities; (ii) comparing sale prices to the prior or current day prices and challenge those prices exceeding certain tolerance levels with the third-party pricing service or broker source; (iii) new rounds of financing; (iv) the performance of the market or the issuer's industry; (v) the liquidity of the security; (vi) the size of the holding in a fund; and/or (vii) any other appropriate information. The determination of a security's fair value price often involves the consideration of a number of subjective factors and is therefore subject to the unavoidable risk that the value assigned to a security may be higher or lower than the security's value would be if a reliable market quotation of the security was readily available. Fair value determinations are subject to review, approval, and ratification by the Fund's Board of Trustees at its next regularly scheduled meeting covering the calendar quarter in which the fair valuation was determined. Fair valuation methods used by the Fund may include, but are not limited to, valuing securities initially at cost (excluding commissions) and subsequently adjusting the value due to: additional transactions by the issuer, changes in company specific fundamentals and changes in the value of similar securities. Values may be further adjusted for any discounts related to security-specific resale restrictions.
Short-term securities purchased within 60 days to maturity are valued at amortized cost, which approximates market value.
The Fund's valuation procedures are reviewed and subject to approval by the Board of Trustees. There have been no significant changes to the fair valuation procedures during the period.
Fair Value Measurements - Fair value is defined as the price that the Fund would receive upon selling an investment in an orderly transaction to an independent buyer in the principal market for the investment. Various inputs are used to determine the fair value of the Fund's investments. These inputs are summarized in the three broad levels listed below.
| Level 1 – | quoted prices in active markets for identical securities |
| Level 2 – | other significant observable inputs (including quoted prices for similar investments, interest rates, prepayment speeds, credit risk, etc.) |
| Level 3 – | significant unobservable inputs (including the Fund's own assumptions in determining the fair value of investments) |
The inputs or methodologies used for valuing securities are not necessarily an indication of the risks associated with investing in those securities nor can it be assured that the Fund can obtain the fair value assigned to a security if it were to sell the security.
19
CLIPPER FUNDSM | Notes to Financial Statements – (Continued) |
| December 31, 2016 |
NOTE 1 - SUMMARY OF SIGNIFICANT ACCOUNTING POLICIES – (CONTINUED)
Fair Value Measurements - (Continued)
The following is a summary of the inputs used as of December 31, 2016 in valuing the Fund's investments carried at value:
| Investments in Securities at Value | |||||||||||
| Valuation Inputs | |||||||||||
| Level 2: | Level 3: | ||||||||||
| Other Significant | Significant | ||||||||||
| Level 1: | Observable | Unobservable | |||||||||
| Quoted Prices | Inputs | Inputs | Total | ||||||||
Equity securities: | |||||||||||
| Consumer Discretionary | $ | 136,486,524 | $ | – | $ | 20,046,635 | $ | 156,533,159 | |||
| Energy | 145,320,096 | – | – | 145,320,096 | |||||||
| Financials | 454,897,834 | – | – | 454,897,834 | |||||||
| Health Care | 50,306,754 | – | – | 50,306,754 | |||||||
| Industrials | 163,354,711 | – | – | 163,354,711 | |||||||
| Information Technology | 76,658,286 | – | 386,866 | 77,045,152 | |||||||
| Materials | 79,078,729 | – | – | 79,078,729 | |||||||
| Short-term securities | – | 84,227,000 | – | 84,227,000 | |||||||
| Total Investments | $ | 1,106,102,934 | $ | 84,227,000 | $ | 20,433,501 | $ | 1,210,763,435 | |||
There were no transfers of investments between Level 1 and Level 2 of the fair value hierarchy during the year ended December 31, 2016.
The following table reconciles the valuation of assets in which significant unobservable inputs (Level 3) were used in determining fair value during the year ended December 31, 2016:
| Investment Securities: | |||
| Beginning balance | $ | 66,320,100 | |
| Net change in unrealized appreciation (depreciation) | (42,140,547) | ||
| Cost of purchases | 29,890,071 | ||
| Proceeds from sales | (33,636,123) | ||
| Ending balance | $ | 20,433,501 | |
Net change in unrealized appreciation (depreciation) during the period on Level 3 securities still held at December 31, 2016 and included in the change in net assets for the period | $ | (20,447) |
There were no transfers of investments into or out of Level 3 of the fair value hierarchy during the period. The cost of purchases or proceeds from sales may include securities received or delivered through corporate actions or exchanges. Realized and unrealized gains (losses) are included in the related amounts on investments in the Statement of Operations.
The following table is a summary of those assets in which significant unobservable inputs (Level 3) were used by the Adviser in determining fair value. Note that these amounts exclude any valuations provided by a pricing service or broker.
| Assets Table | |||||||||||||||
| Fair Value at | Valuation | Unobservable | |||||||||||||
| Investments at Value | December 31, 2016 | Technique | Input | Amount | |||||||||||
| Discounted Cash Flow | Annualized Yield | ||||||||||||||
| Common Stock | $ | 386,866 | 2.523% | ||||||||||||
| Preferred Stock | 20,046,635 | Market Approach | Transaction Price | $38.2271 | |||||||||||
| $ | 20,433,501 | ||||||||||||||
The significant unobservable inputs listed in the above table are used in the fair value measurement of equity securities, and if changed, would affect the fair value of the Fund's investments. The transaction price inputs are attributable to private securities and include assumptions made from private transactions. An increase or decrease in these inputs would result in higher or lower fair value measurements.
20
CLIPPER FUNDSM | Notes to Financial Statements – (Continued) |
| December 31, 2016 |
NOTE 1 - SUMMARY OF SIGNIFICANT ACCOUNTING POLICIES – (CONTINUED)
Master Repurchase Agreements - The Fund, along with other affiliated funds, may transfer uninvested cash balances into one or more master repurchase agreement accounts. These balances are invested in one or more repurchase agreements, secured by U.S. Government securities. A custodian bank holds securities pledged as collateral for repurchase agreements until the agreements mature. Each agreement requires that the market value of the collateral be sufficient to cover payments of interest and principal; however, in the event of default by the other party to the agreement, retention of the collateral may be subject to legal proceedings.
Currency Translation - The market values of all assets and liabilities denominated in foreign currencies are recorded in the financial statements after translation to the U.S. Dollar based upon the mean between the bid and offered quotations of the currencies against U.S. Dollars on the date of valuation. The cost basis of such assets and liabilities is determined based upon historical exchange rates. Income and expenses are translated at average exchange rates in effect as accrued or incurred.
Foreign Currency - The Fund may enter into forward purchases or sales of foreign currencies to hedge certain foreign currency denominated assets and liabilities against declines in market value relative to the U.S. Dollar. Forward currency contracts are marked-to-market daily and the change in market value is recorded by the Fund as an unrealized gain or loss. When the forward currency contract is closed, the Fund records a realized gain or loss equal to the difference between the value of the forward currency contract at the time it was opened and value at the time it was closed. Investments in forward currency contracts may expose the Fund to risks resulting from unanticipated movements in foreign currency exchange rates or failure of the counter-party to the agreement to perform in accordance with the terms of the contract.
Reported net realized foreign exchange gains or losses arise from the sales of foreign currencies, currency gains or losses realized between the trade and settlement dates on security transactions, the difference between the amounts of dividends, interest, and foreign withholding taxes recorded on the Fund's books, and the U.S. Dollar equivalent of the amounts actually received or paid. Net unrealized foreign exchange gains or losses arise from changes in the value of assets and liabilities other than investments in securities at fiscal year end, resulting from changes in the exchange rate. The Fund includes foreign currency gains and losses realized on the sales of investments together with market gains and losses on such investments in the Statement of Operations.
Federal Income Taxes - It is the Fund's policy to comply with the requirements of the Internal Revenue Code applicable to regulated investment companies, and to distribute substantially all of its taxable income, including any net realized gains on investments not offset by loss carryovers, to shareholders. Therefore, no provision for federal income tax or excise tax is required. The Adviser has analyzed the Fund's tax positions taken on federal and state income tax returns for all open tax years and has concluded that as of December 31, 2016, no provision for income tax is required in the Fund's financial statements related to those tax positions. The Fund's federal and state (Arizona) income and federal excise tax returns for tax years for which the applicable statutes of limitations have not expired are subject to examination by the Internal Revenue Service and state department of revenue. The earliest tax year that remains subject to examination by these jurisdictions is 2013.
21
CLIPPER FUNDSM | Notes to Financial Statements – (Continued) |
| December 31, 2016 |
NOTE 1 - SUMMARY OF SIGNIFICANT ACCOUNTING POLICIES – (CONTINUED)
Securities Transactions and Related Investment Income - Securities transactions are accounted for on the trade date (date the order to buy or sell is executed) with realized gain or loss on the sale of securities being determined based upon identified cost. Dividend income is recorded on the ex-dividend date. Interest income, which includes accretion of discount and amortization of premium, is accrued as earned.
Dividends and Distributions to Shareholders - Dividends and distributions to shareholders are recorded on the ex-dividend date. Net investment income (loss), net realized gains (losses), and net unrealized appreciation (depreciation) on investments may differ for financial statement and tax purposes primarily due to differing treatments of wash sales, foreign currency transactions, deferred compensation, in-kind redemptions, corporate actions, and partnership income. The character of dividends and distributions made during the fiscal year from net investment income and net realized securities gains may differ from their ultimate characterization for federal income tax purposes. Also, due to the timing of dividends and distributions, the fiscal year in which amounts are distributed may differ from the fiscal year in which income or realized gain was recorded by the Fund. The Fund adjusts certain components of capital to reflect permanent differences between financial statement amounts and net income and realized gains/losses determined in accordance with income tax rules. Accordingly, during the year ended December 31, 2016, amounts have been reclassified to reflect an increase in undistributed net investment income of $6,229,890, a decrease in accumulated net realized gains from investments and foreign currency transactions of $18,874,390, and an increase in paid in capital of $12,644,500. Net assets have not been affected by this reclassification.
The tax character of distributions paid during the years ended December 31, 2016 and 2015 was as follows:
| 2016 | 2015 | ||||
| Ordinary income | $ | 12,684,799 | $ | 5,798,098 | |
| Long-term capital gain | 108,976,945 | 2,783,086 | |||
| Total | $ | 121,661,744 | $ | 8,581,184 | |
As of December 31, 2016, the components of distributable earnings on a tax basis were as follows:
| Undistributed net investment income | $ | 684,954 | |
| Undistributed long-term capital gain | 12,772,341 | ||
| Net unrealized appreciation on investments | 285,886,314 | ||
| Total | $ | 299,343,609 |
Indemnification - Under the Fund's organizational documents, its officers and trustees are indemnified against certain liabilities arising out of the performance of their duties to the Fund. In addition, some of the Fund's contracts with its service providers contain general indemnification clauses. The Fund's maximum exposure under these arrangements is unknown since the amount of any future claims that may be made against the Fund cannot be determined and the Fund has no historical basis for predicting the likelihood of any such claims.
Use of Estimates in Financial Statements - In preparing financial statements in conformity with accounting principles generally accepted in the United States of America, management makes estimates and assumptions that affect the reported amounts of assets and liabilities and disclosure of contingent assets and liabilities at the date of the financial statements, as well as the reported amounts of income and expenses during the reporting period. Actual results may differ from these estimates.
NOTE 2 - PURCHASES AND SALES OF SECURITIES
The cost of purchases and proceeds from sales of investment securities (excluding short-term securities) during the year ended December 31, 2016 were $362,075,691 and $531,827,324, respectively.
22
CLIPPER FUNDSM | Notes to Financial Statements – (Continued) |
| December 31, 2016 |
NOTE 3 - FEES AND OTHER TRANSACTIONS WITH SERVICE PROVIDERS (INCLUDING AFFILIATES)
Davis Selected Advisers-NY, Inc. ("DSA-NY"), a wholly-owned subsidiary of the Adviser, acts as sub-adviser to the Fund. DSA-NY performs research and portfolio management services for the Fund under a Sub-Advisory Agreement with the Adviser. The Fund pays no fees directly to DSA-NY.
All officers of the Fund (including some Interested Trustees) hold positions as executive officers with the Adviser or its affiliates.
Investment Advisory Fees - Advisory fees are paid monthly to the Adviser. The annual rate is 0.55% of the average net assets for the first $3 billion, 0.54% on the next $1 billion, 0.53% on the next $1 billion, 0.52% on the next $1 billion, 0.51% on the next $1 billion, 0.50% on the next $3 billion, and 0.485% of the average net assets greater than $10 billion. Advisory fees paid during the year ended December 31, 2016 approximated 0.55% of average net assets.
Transfer Agent and Accounting Fees - Boston Financial Data Services, Inc. ("BFDS") is the Fund's primary transfer agent. The Adviser is also paid for certain transfer agent services. The fee paid to the Adviser for these services during the year ended December 31, 2016 amounted to $70,416. State Street Bank and Trust Company ("State Street Bank") is the Fund's primary accounting provider. Fees for such services are included in the custodian fees as State Street Bank also serves as the Fund's custodian.
NOTE 4 - CAPITAL STOCK
At December 31, 2016, there were unlimited shares of capital stock (no par value) authorized. Transactions in capital stock were as follows:
| Year ended December 31, 2016 | |||||||||||
| Sold | Reinvestment of Distributions | Redeemed | Net Decrease | ||||||||
| Shares | 1,781,804 | 1,116,730 | (3,398,093) | (499,559) | |||||||
| Value | $ | 191,024,475 | $ | 117,780,922 | $ | (348,643,145) | $ | (39,837,748) | |||
| Year ended December 31, 2015 | |||||||||||
| Sold | Reinvestment of Distributions | Redeemed | Net Increase | ||||||||
| Shares | 2,603,387 | 79,474 | (2,263,543) | 419,318 | |||||||
| Value | $ | 271,372,070 | $ | 8,298,750 | $ | (231,996,774) | $ | 47,674,046 | |||
NOTE 5 - SECURITIES LOANED
The Fund has entered into a securities lending arrangement with State Street Bank. Under the terms of the agreement, the Fund receives fee income from lending transactions; in exchange for such fees, State Street Bank is authorized to loan securities on behalf of the Fund, against receipt of collateral at least equal to the value of the securities loaned. As of December 31, 2016, the Fund did not have any securities on loan. The Fund bears the risk of any deficiency in the amount of the collateral available for return to a borrower due to a loss in an approved investment.
23
CLIPPER FUNDSM | Notes to Financial Statements – (Continued) |
| December 31, 2016 |
NOTE 6 - RESTRICTED SECURITIES
Restricted securities are not registered under the Securities Act of 1933 and may have contractual restrictions on resale. They are fair valued under methods approved by the Board of Trustees. The aggregate value of restricted securities amounted to $20,433,501 or 1.69% of the Fund's net assets as of December 31, 2016. Information regarding restricted securities is as follows:
| Security | Initial Acquisition Date | Units/Shares | Cost per Unit/ Share | Valuation per Unit/Share as of December 31, 2016 | |||||||
| ASAC II L.P. | 10/10/13 | 407,313 | $ | 1.00 | $ | 0.9498 | |||||
| Didi Chuxing Joint Co., Series A, Pfd. | 04/22/16 | 524,409 | 38.2271 | 38.2271 | |||||||
NOTE 7 - IN-KIND REDEMPTION
In accordance with guidelines described in the Fund's prospectus, the Fund may distribute portfolio securities rather than cash as payment for a redemption of fund shares (in-kind redemption). For financial reporting purposes, the Fund recognizes a gain on in-kind redemptions to the extent the value of the distributed securities on the date of redemption exceeds the cost of those securities. Gains and losses realized on in-kind redemptions are not recognized for tax purposes and are reclassified from accumulated net realized gains (losses) from investments to paid-in capital on the Statement of Assets and Liabilities.
During the year ended December 31, 2016, the Fund's shareholders (including related parties) redeemed 361,565 shares in exchange for portfolio securities valued at $38,864,573. The Fund realized a gain of $12,732,235.
NOTE 8 - NEW PRONOUNCEMENTS
In October 2016, the SEC voted to approve rules to modernize and enhance reporting of information provided by registered investment companies ("Reporting Modernization Rules"). The new rules also make certain amendments to Regulation S-X to require standardized, more detailed disclosure in registered investment company financial statements. The compliance date for the amendments to Regulation S-X is August 1, 2017. The Adviser is currently evaluating the amendments and their impacts, if any, on the Fund's financial statements.
24
CLIPPER FUNDSM |
| The following financial information represents selected data for each share of capital stock outstanding throughout each period: |
| Year ended December 31, | ||||||||||||||||||||||||||||
| 2016 | 2015 | 2014 | 2013 | 2012 | ||||||||||||||||||||||||
| Net Asset Value, Beginning of Period | $ | 104.41 | $ | 98.79 | $ | 92.07 | $ | 68.86 | $ | 62.50 | ||||||||||||||||||
Income from Investment Operations: | ||||||||||||||||||||||||||||
Net Investment Incomea | 0.65 | 0.51 | 0.35 | 0.47 | 1.16 | |||||||||||||||||||||||
| Net Realized and Unrealized Gains | 15.00 | 5.85 | 6.78 | 23.09 | 6.54 | |||||||||||||||||||||||
| Total from Investment Operations | 15.65 | 6.36 | 7.13 | 23.56 | 7.70 | |||||||||||||||||||||||
Dividends and Distributions: | ||||||||||||||||||||||||||||
| Dividends from Net Investment Income | (1.19) | (0.50) | (0.41) | (0.35) | (1.34) | |||||||||||||||||||||||
| Distributions from Realized Gains | (10.15) | (0.24) | – | – | – | |||||||||||||||||||||||
| Total Dividends and Distributions | (11.34) | (0.74) | (0.41) | (0.35) | (1.34) | |||||||||||||||||||||||
| Net Asset Value, End of Period | $ | 108.72 | $ | 104.41 | $ | 98.79 | $ | 92.07 | $ | 68.86 | ||||||||||||||||||
Total Returnb | 15.62 | % | 6.44 | % | 7.75 | % | 34.22 | % | 12.31 | % | ||||||||||||||||||
Ratios/Supplemental Data: | ||||||||||||||||||||||||||||
| Net Assets, End of Period (in millions) | $ | 1,212 | $ | 1,216 | $ | 1,109 | $ | 1,254 | $ | 1,015 | ||||||||||||||||||
| Ratio of Expenses to Average Net Assets: | ||||||||||||||||||||||||||||
| Gross | 0.72 | % | 0.72 | % | 0.74 | % | 0.74 | % | 0.75 | % | ||||||||||||||||||
Netc | 0.72 | % | 0.72 | % | 0.74 | % | 0.74 | % | 0.75 | % | ||||||||||||||||||
Ratio of Net Investment Income to Average Net Assets | 0.63 | % | 0.50 | % | 0.36 | % | 0.58 | % | 1.74 | % | ||||||||||||||||||
Portfolio Turnover Rated | 33 | % | 31 | % | 38 | % | 8 | % | 6 | % | ||||||||||||||||||
| a | Per share calculations were based on average shares outstanding for the period. |
| b | Assumes hypothetical initial investment on the business day before the first day of the fiscal period, with all dividends and distributions reinvested in additional shares on the reinvestment date, and redemption at the net asset value calculated on the last business day of the fiscal period. |
| c | The Net Ratio of Expenses to Average Net Assets reflects the impact, if any, of the reduction of expenses paid indirectly and of certain reimbursements. |
| d | The lesser of purchases or sales of portfolio securities for a period, divided by the monthly average of the market value of portfolio securities owned during the period. Securities with a maturity or expiration date at the time of acquisition of one year or less are excluded from the calculation. |
| See Notes to Financial Statements | |
25
CLIPPER FUNDSM |
The Shareholders and Board of Trustees
Clipper Funds Trust:
We have audited the accompanying statement of assets and liabilities of Clipper Fund (a series of Clipper Funds Trust), including the schedule of investments, as of December 31, 2016, and the related statement of operations for the year then ended, the statements of changes in net assets for each of the years in the two-year period then ended, and the financial highlights for each of the years in the five-year period then ended. These financial statements and financial highlights are the responsibility of the Fund's management. Our responsibility is to express an opinion on these financial statements and financial highlights based on our audits.
We conducted our audits in accordance with the standards of the Public Company Accounting Oversight Board (United States). Those standards require that we plan and perform the audit to obtain reasonable assurance about whether the financial statements and financial highlights are free of material misstatement. An audit includes examining, on a test basis, evidence supporting the amounts and disclosures in the financial statements. Our procedures included confirmation of securities owned as of December 31, 2016, by correspondence with the custodian or by other appropriate auditing procedures. An audit also includes assessing the accounting principles used and significant estimates made by management, as well as evaluating the overall financial statement presentation. We believe that our audits provide a reasonable basis for our opinion.
In our opinion, the financial statements and financial highlights referred to above present fairly, in all material respects, the financial position of Clipper Fund as of December 31, 2016, the results of its operations for the year then ended, the changes in its net assets for each of the years in the two-year period then ended, and the financial highlights for each of the years in the five-year period then ended, in conformity with U.S. generally accepted accounting principles.
KPMG LLP
Denver, Colorado
February 17, 2017
26
CLIPPER FUNDSM |
In early 2017, shareholders received information regarding all dividends and distributions paid to them by the Fund during the calendar year 2016. Regulations of the U.S. Treasury Department require the Fund to report this information to the Internal Revenue Service.
The information and distributions reported herein may differ from the information reported as distributions taxable to certain shareholders for the calendar year 2016 with their 2016 Form 1099-DIV.
During the calendar year 2016, $12,684,799 of dividends paid by the Fund constituted income dividends for federal income tax purposes. The Fund designates $11,371,083 or 90% as income qualifying for the corporate dividends-received deduction.
For the calendar year 2016, certain dividends paid by the Fund constitute qualified dividend income for federal income tax purposes. The Fund designates $12,684,799 or 100% as qualified dividend income.
During the calendar year ended December 31, 2016, the Fund declared and paid long-term capital gain distributions in the amount of $108,976,945.
The foregoing information is presented to assist shareholders in reporting dividends and distributions received from the Fund to the Internal Revenue Service. Because of the complexity of the federal regulations, which may affect your individual tax return and the many variations in state and local tax regulations, we recommend that you consult your tax adviser for specific guidance.
27
CLIPPER FUNDSM |
Privacy Notice
While you generally will be dealing with a broker-dealer or other financial adviser, we may collect information about you from your account application and other forms that you may deliver to us. We use this information to process your requests and transactions; for example, to provide you with additional information about the Fund, to open an account for you, or to process a transaction. In order to service your account and execute your transactions, we may provide your personal information to firms that assist us in servicing your account, such as our transfer agent. We may also provide your name and address to one of our agents for the purpose of mailing to you your account statement and other information about our products and services. We may also gather information through the use of "cookies" when you visit our website. These files help us to recognize repeat visitors and allow easy access to and use of the website. We require these outside firms and agents to protect the confidentiality of your information and to use the information only for the purpose for which the disclosure is made. We do not provide customer names and addresses to outside firms, organizations, or individuals except in furtherance of our business relationship with you or as otherwise allowed by law.
We restrict access to nonpublic personal information about you to those employees who need to know that information to provide products or services to you. We maintain physical, electronic and procedural safeguards that comply with federal standards to guard your personal information.
Householding
To avoid sending duplicate copies of materials to households, the Fund will mail only one copy of each prospectus, Annual, and Semi-Annual Report to shareholders having the same last name and address on the Fund's records. The consolidation of these mailings, called householding, benefits the Fund through reduced mailing expense. If you do not want the mailing of these documents to be combined with those to other members of your household, please contact the Clipper Fund by phone at 1-800-432-2504. Individual copies of current prospectuses and reports will be sent to you within 30 days after the Fund receives your request to stop householding.
28
CLIPPER FUNDSM |
For the purpose of their service as trustees to the Clipper Fund, the business address for each of the trustees is 2949 E. Elvira Road, Suite 101, Tucson, AZ 85756. Each Trustee serves until retirement, resignation, death, or removal. Trustees must retire from the Board of Trustees and cease being a Trustee at the close of business on the last day of the calendar year in which the Trustee attains age 78.
Name (birthdate) | Position(s) Held with the Fund | Term of Office and Length of Time Served | Principal Occupation(s) During Past Five Years | Number of Portfolios Overseen | Other Directorships |
Independent Trustees
Francisco L. Borges (11/17/51) | Trustee | Trustee since 2014 | Chairman and Managing Partner, Landmark Partners, LLC (private equity firm) since March 1999. | 3 | Trustee, John S. and James L. Knight Foundation; Trustee, Connecticut Public Broadcasting Network; Director, University of Connecticut Health Center; Director, Assured Guaranty Ltd.; Director, Leucadia National Corporation (holding company); Trustee, Millbrook School; Director, Selected Funds (consisting of two portfolios). |
Lawrence E. Harris (09/16/56) | Trustee | Director/ Trustee since 2006 | Fred V. Keenan Chair in Finance of the Marshall School of Business, University of Southern California, Los Angeles, CA. | 3 | Director, Interactive Brokers Group, Inc.; Director, Selected Funds (consisting of two portfolios). |
Steven N. Kearsley (09/29/41) | Trustee | Director/ Trustee since 2006 | Private Investor, Real Estate Development; Owner, Old Peak Tree Farm. | 3 | Director, Selected Funds (consisting of two portfolios). |
Katherine L. MacWilliams (01/19/56) | Trustee | Trustee since 2014 | Retired; Chief Financial Officer, Caridian BCT, Inc. (medical device company) 2008-2012. | 3 | Director, Selected Funds (consisting of two portfolios). |
James J. McMonagle (10/01/44) | Trustee/ Chairman | Trustee since 2014/Chairman since 2015 | Of Counsel to Vorys, Sater, Seymour and Pease LLP (law firm) since 2002. | 3 | Director, Owens Corning (producer of residential and commercial building materials); Director/ Chairman, Selected Funds (consisting of two portfolios). |
Richard O'Brien (09/12/45) | Trustee | Trustee since 2014 | Retired; Corporate Economist, HP Inc. | 3 | Director, Selected Funds (consisting of two portfolios). |
29
CLIPPER FUNDSM | Trustees and Officers – (Continued) |
Name (birthdate) | Position(s) Held With Fund | Term of Office and Length of Time Served | Principal Occupation(s) During Past Five Years | Number of Portfolios Overseen | Other Directorships |
Interested Trustees*
Andrew A. Davis (06/25/63) | Trustee | Trustee since 2014 | President or Vice President of each Selected Fund and Davis Fund; President, Davis Selected Advisers, L.P., and also serves as an executive officer of certain companies affiliated with the Adviser. | 16 | Director, Selected Funds (consisting of two portfolios); Director, Davis Funds (consisting of 13 portfolios). |
Christopher C. Davis (07/13/65) | Trustee | Trustee since 2014 | President or Vice President of each Selected Fund, Davis Fund, Clipper Fund, and Davis Fundamental ETF; Chairman, Davis Selected Advisers, L.P., and also serves as an executive officer of certain companies affiliated with the Adviser, including sole member of the Adviser's general partner, Davis Investments, LLC. | 16 | Director, Selected Funds (consisting of two portfolios); Director, Davis Funds (consisting of 13 portfolios); Director, Graham Holdings Co. (educational and media company). |
* Andrew A. Davis and Christopher C. Davis own partnership units (directly, indirectly, or both) of the Adviser and are considered to be "interested persons" of the Funds as defined in the Investment Company Act of 1940. Andrew A. Davis and Christopher C. Davis are brothers.
Officers
Christopher C. Davis (born 07/13/65, Clipper Fund officer since 12/19/05). See description in the section on Interested Trustees.
Andrew A. Davis (born 06/25/63, Clipper Fund officer since 01/23/15). See description in the section on Interested Trustees.
Kenneth C. Eich (born 08/14/53, Clipper Fund officer since 12/19/05). Executive Vice President and Principal Executive Officer of Clipper Funds Trust (consisting of one portfolio), Davis Funds (consisting of 13 portfolios), and Selected Funds (consisting of two portfolios); Trustee/Chairman, Executive Vice President, and Principal Executive Officer of Davis Fundamental ETF Trust (consisting of three portfolios); Chief Operating Officer, Davis Selected Advisers, L.P., and also serves as an executive officer of certain companies affiliated with the Adviser.
Douglas A. Haines (born 03/04/71, Clipper Fund officer since 12/19/05). Vice President, Treasurer, Chief Financial Officer, Principal Financial Officer, and Principal Accounting Officer of Clipper Funds Trust (consisting of one portfolio), Davis Funds (consisting of 13 portfolios), Selected Funds (consisting of two portfolios), and Davis Fundamental ETF Trust (consisting of three portfolios); Vice President and Director of Fund Accounting, Davis Selected Advisers, L.P.
Sharra L. Haynes (born 09/25/66, Clipper Fund officer since 12/19/05). Vice President and Chief Compliance Officer of Clipper Funds Trust (consisting of one portfolio), Davis Funds (consisting of 13 portfolios), Selected Funds (consisting of two portfolios), and Davis Fundamental ETF Trust (consisting of three portfolios); Vice President and Chief Compliance Officer, Davis Selected Advisers, L.P., and also serves as an executive officer of certain companies affiliated with the Adviser.
Ryan M. Charles (born 07/25/78, Clipper Fund officer since 01/01/14). Vice President and Secretary of Clipper Funds Trust (consisting of one portfolio), Davis Funds (consisting of 13 portfolios), Selected Funds (consisting of two portfolios), and Davis Fundamental ETF Trust (consisting of three portfolios); Vice President, Chief Legal Officer and Secretary, Davis Selected Advisers, L.P., and also serves as an executive officer of certain companies affiliated with the Adviser.
30
CLIPPER FUNDSM |
| Investment Adviser |
| Davis Selected Advisers, L.P. (Doing business as "Davis Advisors") |
| 2949 East Elvira Road, Suite 101 |
| Tucson, Arizona 85756 |
| (800) 432-2504 |
| Distributor |
| Davis Distributors, LLC |
| 2949 East Elvira Road, Suite 101 |
| Tucson, Arizona 85756 |
| Transfer Agent |
| Boston Financial Data Services, Inc. |
| P.O. Box 55468 |
| Boston, Massachusetts 02205-5468 |
| Custodian |
| State Street Bank and Trust Co. |
| One Lincoln Street |
| Boston, Massachusetts 02111 |
| Counsel |
| Greenberg Traurig, LLP |
| 77 West Wacker Drive, Suite 3100 |
| Chicago, Illinois 60601 |
| Independent Registered Public Accounting Firm |
| KPMG LLP |
| 1225 Seventeenth Street, Suite 800 |
| Denver, Colorado 80202 |
For more information about Clipper Fund including management fee, charges, and expenses, see the current prospectus, which must precede or accompany this report. The Fund's Statement of Additional Information contains additional information about the Fund's Trustees and is available without charge, upon request, by contacting the Fund at 1-800-432-2504 and on the Fund's website at www.clipperfund.com. Quarterly Fact Sheets are available on the Fund's website at www.clipperfund.com.
ITEM 2. CODE OF ETHICS
The registrant has adopted a code of ethics that applies to the registrant's principal executive officer, principal financial officer, principal accounting officer or controller, or persons performing similar functions.
A copy of the code of ethics is filed as an exhibit to this form N-CSR.
No waivers were granted to this code of ethics during the period covered by this report.
ITEM 3. AUDIT COMMITTEE FINANCIAL EXPERT
The Fund's Board of Directors has determined that independent trustee Katherine MacWilliams qualifies as the "audit committee financial expert", as defined in Item 3 of form N-CSR.
ITEM 4. PRINCIPAL ACCOUNTANT FEES AND SERVICES
| (a) | Audit Fees. The aggregate Audit Fees billed by KPMP LLP ("KPMG") for professional services rendered for the audits of the audits of the financial statements, or services that are normally provided in connection with statutory and regulatory filings or engagements for the fiscal year ends December 31, 2016 and December 31, 2015 were $48,175 and $49,200, respectively. |
| (b) | Audit-Related Fees. The aggregate Audit-Related Fees billed by KPMG for services rendered for assurance and related services that are not reasonably related to the performance of the audit or review of the fund financial statements, but not reported as Audit Fees for fiscal year ends December 31, 2016 and December 31, 2015 were $0 and $0, respectively. |
| (c) | Tax Fees. The aggregate Tax Fees billed by KPMG for professional services rendered for tax compliance, tax advice and tax planning for the fiscal year ends December 31, 2016 and December 31, 2015 were $7,865 and $7,569, respectively. Fees included in the Tax Fee category comprise all services performed by professional staff in the independent accountant's tax division except those services related to the audit. These services include preparation of tax returns, tax advice related to mergers and a review of the fund income and capital gain distributions. |
| (d) | All Other Fees. The aggregate Other Fees billed by KPMG for all other non-audit services rendered to the fund for the fiscal year ends December 31, 2016 and December 31, 2015 were $275 and $0, respectively. |
| (e)(1) | Audit Committee Pre-Approval Policies and Procedures. The fund Audit Committee must pre-approve all audit and non-audit services provided by the independent accountant relating to the operations or financial reporting of the funds. Prior to the commencement of any audit or non-audit services to a fund, the Audit Committee reviews the services to determine whether they are appropriate and permissible under applicable law. The fund Audit Committee has adopted a policy whereby audit and non-audit services performed by the fund independent accountant require pre-approval in advance at regularly scheduled Audit Committee meetings. If such a service is required between regularly scheduled Audit Committee meetings, pre-approval may be authorized by the Audit Committee Chairperson with ratification at the next scheduled audit committee meeting. |
| (e)(2) | No services included in (b) – (d) above were approved pursuant to paragraph (c)(7)(i)(C) of Rule 2-01 of Regulation S-X. |
| (f) | Not applicable |
| (g) | The Funds' independent accountant did not provide any services to the investment advisor or any affiliate for the fiscal years ended December 31, 2016 and December 31, 2015. The fund has not paid any fees for non-audit not previously disclosed in items 4 (b) – (d). |
| (h) | The registrant's audit committee of the board of trustees has considered whether the provision of non-audit services that were rendered to the registrant's investment adviser, and any entity controlling, controlled by, or under common control with the investment adviser that provides ongoing services to the registrant that not pre-approved pursuant to paragraph (c)(7)(ii) of Rule 2-01 of Regulation S-X is compatible with maintaining the principal accountant's independence. No such services were rendered. |
ITEM 5. AUDIT COMMITTEE OF LISTED REGISTRANTS
Not Applicable
ITEM 6. SCHEDULE OF INVESTMENTS
Not Applicable. The complete Schedule of Investments is included in Item 1 of this for N-CSR
ITEM 7. DISCLOSURE OF PROXY VOTING POLICIES AND PROCEDURES FOR CLOSED-END MANAGEMENT INVESTMENT COMPANIES
Not Applicable
ITEM 8. PORTFOLIO MANAGERS OF CLOSED-END MANAGEMENT INVESTMENT COMPANIES
Not Applicable
ITEM 9. PURCHASES OF EQUITY SECURITIES BY CLOSED-END MANAGEMENT INVESTMENT COMPANIES AND AFFILIATED PURCHASERS
Not Applicable
ITEM 10. SUBMISSION OF MATTERS TO A VOTE OF SECURITY HOLDERS
There have been no changes to the procedure by which shareholders may recommend nominees to the registrant's Board of Trustees.
ITEM 11. CONTROLS AND PROCUDURES
| (a) | The registrant's principal executive officer and principal financial officer have concluded that the registrant's disclosure controls and procedures (as defined in Rule 30a-3 (c) under the Investment Company Act of 1940, as amended) are effective as of a date within 90 days of the filing date of this report. |
| (b) | There have been no significant changes in the registrant's internal controls or in other factors that could significantly affect these controls. |
ITEM 12. EXHIBITS
| (a)(1) | The registrant's code of ethics pursuant to Item 2 of Form N-CSR is filed as an exhibit to this form N-CSR. |
| (a)(2) | Certifications pursuant to Section 302 of the Sarbanes-Oxley Act of 2002 are attached. |
| (a)(3) | Not applicable |
| (b) | Certifications pursuant to Section 906 of the Sarbanes-Oxley Act of 2002 are attached. |
SIGNATURES
Pursuant to the requirements of the Securities Exchange Act of 1934 and the Investment Company Act of 1940, the registrant has duly caused this report to be signed on its behalf by the undersigned, thereunto duly authorized.
CLIPPER FUNDS TRUST
| By | /s/ Kenneth C. Eich |
| Kenneth C. Eich | |
| Principal Executive Officer | |
| Date: February 17, 2017 | |
Pursuant to the requirements of the Securities Exchange Act of 1934 and the Investment Company Act of 1940, this report has been signed below by the following persons on behalf of the registrant and in the capacities and on the dates indicated.
| By | /s/ Kenneth C. Eich |
| Kenneth C. Eich | |
| Principal Executive Officer | |
| Date: February 17, 2017 | |
| By | /s/ Douglas A. Haines |
| Douglas A. Haines | |
| Principal Financial Officer | |
| Date: February 17, 2017 | |