UNITED STATES
SECURITIES AND EXCHANGE COMMISSION
Washington, D.C. 20549
FORM 10-Q
x QUARTERLY REPORT UNDER SECTION 13 OR 15(d) OF THE
SECURITIES EXCHANGE ACT OF 1934.
For the quarterly period ended September 30, 2010
OR
o TRANSITION REPORT PURSUANT TO SECTION 13 OR 15(d)
OF THE SECURITIES EXCHANGE ACT OF 1934.
Commission File Number 1-33094
AMERICAN CARESOURCE HOLDINGS, INC.
(Exact name of registrant as specified in its charter)
| | | | |
| | DELAWARE | | 20-0428568 | |
| | (State or other jurisdiction of | | (I.R.S. employer | |
| | incorporation or organization) | | identification no.) | |
| | | | | |
| | | 5429 LYNDON B. JOHNSON FREEWAY | | |
| | | SUITE 850 | | |
| | | DALLAS, TEXAS | | |
| | | 75240 | | |
| | | (Address of principal executive offices) | | |
| | | (Zip code) | | |
(972) 308-6830
(Registrant’s telephone number, including area code)
Indicate by check mark whether the registrant (1) has filed all reports required to be filed by Section 13 or 15(d) of the Securities Exchange Act of 1934 during the preceding 12 months (or for such shorter period that the registrant was required to file such reports), and (2) has been subject to such filing requirements for the past 90 days. Yes x No o
Indicate by check mark whether the registrant has submitted electronically and posted on its corporate Web site, if any, every Interactive Data File required to be submitted and posted pursuant to Rule 405 of Regulation S-T (§232.405 of this chapter) during the preceding 12 months (or for such shorter period that the registrant was required to submit and post such files). Yes o No o
Indicate by check mark whether the registrant is a large accelerated filer, an accelerated filer, a non-accelerated filer or a smaller reporting company. See the definitions of “accelerated filer”,” large accelerated filer” and “smaller reporting company” in Rule 12b-2 of the Exchange Act.
| |
Large accelerated filer o | Non-accelerated filer o |
Accelerated filer o (do not check if a smaller reporting company) | Smaller Reporting Company x |
Indicated by check mark whether the registrant is a shell company (as defined in Rule 12b-2 of the Act.) Yes o No x
Indicate the number of shares outstanding of each of the issuer’s classes of common stock, as of the latest practicable date: The number of shares of co mmon stock of registrant outstanding on November 8, 2010 was 16,922,042.
TABLE OF CONTENTS
AMERICAN CARESOURCE HOLDINGS, INC.
FORM 10-Q
FOR THE QUARTER ENDED SEPTEMBER 30, 2010
PART I. FINANCIAL INFORMATION
ITEM 1. Financial Statements
AMERICAN CARESOURCE HOLDINGS, INC.
CONSOLIDATED INCOME STATEMENTS
(Unaudited)
(amounts in thou sands, except per share data)
| | | | | | | | | | | | | | | |
| | Three months ended September 30, | | Nine months ended September 30, |
| | 2010 | | 2009 | | 2010 | | 2009 |
| Net revenues | $ | 14,823 | | | $ | 18,235 | | | $ | 45,272 | | | $ | 51,425 | |
| Cost of revenues: | | | | | | | |
| Provider payments | 11,129 | | | 13,800 | | | 33,351 | | | 38,670 | |
| Administrative fees | 799 | | | 963 | | | 2,552 | | | 2,682 | |
| Claims administration and provider development | 1,189 | | | 1,178 | | | 3,597 | | | 3,259 | |
| Total cost of revenues | 13,117 | | | 15,941 | | | 39,500 | | | 44,611 | |
| Contribution margin | 1,706 | | | 2,294 | | | 5,772 | | | 6,814 | |
| | | | | | | | | | | | |
| Selling, general and administrative expenses | 1,446 | | | 1,980 | | | 4,722 | | | 5,735 | |
| Depreciation and amortization | 197 | | | 155 | | | 571 | | | 401 | |
| Total operating expenses | 1,643 | | | 2,135 | | | 5,293 | | | 6,136 | |
| | | | | | | | |
| Operating income | 63 | | | 159 | | | 479 | | | 678 | |
| | | | | | | | | | | | |
| Other income (expense): | | | | | | | | | | | |
| Interest income, net | 22 | | | 31 | | | 67 | | | 107 | |
| Unrealized gain (loss) on warrant derivative | 2 | | | (22 | ) | | 18 | | | 232 | |
| Total other income, net | 24 | | | 9 | | | 85 | | | 339 | |
| | | | | | | | | | | | |
| Income before income taxes | 87 | | | 168 | | | 564 | | | 1,017 | |
| Income tax provision | 43 | | | 21 | | | 220 | | | 57 | |
| Net income | $ | 44 | | | $ | 147 | | | $ | 344 | | | $ | 960 | |
| Earnings per common share: | | | | | | | | &n bsp; | | | |
| Basic | $ | 0.00 | | | $ | 0.01 | | | $ | 0.02 | | | $ | 0.06 | |
| Diluted | $ | 0.00 | | | $ | 0.01 | | | $ | 0.02 | | | $ | 0.04 | |
| | | | | | | | | | | | |
| Basic weighted average common shares outstanding | 16,631 | | | 15,432 | | | 16,413 | | | 15,425 | |
| Diluted weighted average common shares outstanding | 17,124 | | | 17,572 | | | 17,169 | ; | | 17,972 | |
See accompanying notes.
AMERICAN CARESOURCE HOLDINGS, INC.
CONSOLIDATED BALANCE SHEETS
(amounts in thousands except per share amounts)
| | | | | | | |
| | September 30, 2010 (Unaudited) | | December 31, 2009 |
| | |
| ASSETS | | | |
| Current assets: | | | |
| Cash and cash equivalents | $ | 11,987 | &nb sp; | | $ | 11,868 | |
| Accounts receivable, net | 6,391 | | | 7,474 | ; |
| Prepaid expenses and other current assets | 718 | | | 822 | |
| Deferred income taxes | 143 | | | 576 | |
| Total current assets | 19,239 | | | 20,740 | |
| | | | | | |
| Property and equipment, net | 1,853 | | | 1,762 | |
| | | | | |
| Other assets: | | | | |
| Deferred income taxes | 557 | | | 317 | |
| Other non-current assets | 402 | | | 657 | |
| Intangible assets, net | 1,057 | | | 1,153 | |
| Goodwill | 4,361 | | | 4,361 | |
| | $ | 27,469 | | | $ | 28,990 | |
| LIABILITIES AND SHAREHOLDERS' EQUITY | | | | | |
| Current liabilities: | | | | | |
| Due to service providers | $ | 5,389 | | | $ | 7,702 | |
| Accounts payable and accrued liabilities | 1,701 | | | 1,980 | |
| Total current liabilities | 7,090 | | | 9,682 | |
| | | | | | |
| Warrant derivative liability | — | | | 18 | |
| | | | | |
| Commitments and contingencies | | | | | |
| | | | | |
| Shareholders' equity: | | | | |
| Preferred stock, $0.01 par value; 10,000 shares authorized, none issued | — | | | — | |
| Common stock, $0.01 par value; 40,000 shares authorized; 16,922 and 15,642 shares issued and outstanding in 2010 and 2009, respectively | 169 | | | 156 | |
| Additional paid-in capital | 21,337 | | | 20,605 | |
| Accumulated deficit | (1,127 | ) | | (1,471 | ) |
| Total shareholders' equity | 20,379 | | | 19,290 | |
| | $ | 27,469 | | | $ | 28,990 | |
See accompanying notes.
AMERICAN CARESOURCE HOLDINGS, INC.
CONSOLIDATED STATEMENT OF STOCKHOLDERS' EQUITY
(U naudited)
(amounts in thousands)
| | | | | | | | | | | | | | | | | | |
| | | | | | Additional | | | | Total |
| | Common Stock | | Paid-in | | Accumulated | | Stockholders' |
| | Shares | | Amount | | Capital | | Deficit | | Equity |
| Balance at December 31, 2009 | 15,642 | | | $ | 156 | | | $ | 20,605 | | | $ | (1,471 | ) | | $ | 19,290 | |
| Net income | — | | | — | | | — | | | 344 | | | 344 | |
| Stock-based compensation expense | — | | | — | | | 606 | | | — | | | 606 | |
| Issuance of common stock upon exercise of restricted stock units | 23 | | | 1 | | | (19 | ) | | — | | | (18 | ) |
| Issuance of common stock upon exercise of stock warrants | 1,257 | | | 12 | | | 145 | | | — | | | 157 | |
| Balance at September 30, 2010 | 16,922 | | | $ | 169 | | | $ | 21,337 | | | $ | (1,127 | ) | | $ | 20,379 | |
See accompanying notes.
AMERICAN CARESOURCE HOLDINGS, INC.
CONSOLIDATED STATEMENTS OF CASH FLOWS
(Unaudited)
(amounts in thousands)
| | | | | | | |
| | Nine months ended September 30, |
| | 2010 | | 2009 |
| Cash flows from operating activities: | | | |
| Net income | $ | 344 | | | $ | 960 | |
| Adjustments to reconcile net income to net cash provided by operations: | | | |
| Stock-based compensation expense | 606 | | | 1,026 | |
| Depreciation and amortization | 571 | | | 401 | |
| Unrealized gain on warrant derivative | (18 | ) | | (232 | ) |
| Amortization of long-term client agreement | 187 | | | 188 | |
| Client administration fee expense related to warrants | 150 | | | 106 | |
| Deferred income taxes | 193 | | | — | |
| Changes in operating assets and liabilities: | | | |
| Accounts receivable | 1,083 | | | (1,420 | ) |
| Prepaid expenses and other assets | 22 | | | (125 | ) |
| Accounts payable and accrued liabilities | (298 | ) | | (1,001 | ) |
| Due to service providers | (2,313 | ) | | 902 | |
| Net cash provided by operating activities | 527 | | | 805 | |
| | | | | | |
| Cash flows from investing activities: | | | | | |
| Investment in software development costs | (283 | ) | | (464 | ) |
| Additions to property and equipment | (282 | ) | | (593 | ) |
| Net cash used in investing activities | (565 | ) | | (1,057 | ) |
| | | | | | |
| Cash flows from financing activities: | | | | | |
| Proceeds from exercise of equity warrants | 157 | | | 13 | |
| Proceeds from exercise of equity incentive awards | — | | | 3 | |
| Net cash provided by financing activities | 157 | | | 16 | |
| | | | | | |
| Net increase (decrease) in cash and cash equivalents | 119 | | | (236 | ) |
| Cash and cash equivalents at beginning of period | 11,868 | | | 10,578 | |
| | | | | | |
| Cash and cash equivalents at end of period | $ | 11,987 | | | $ | 10,342 | |
| | | | | | |
| Supplemental cash flow information: | | | |
| Cash paid for taxes | $ | 134 | | | $ | — | |
| | | | |
| Supplemental non-cash financing activity: | | | |
| Warrants issued as payment of client administrative fees | — | | | 311 | |
| Income tax withholdings on exercise of equity incentives | $ | 19 | | | $ | — | |
See accompanying notes.
AMERICAN CARESOURCE HOLDINGS, INC.
NOTES TO UNAUDITED CONSOLIDATED FINANCIAL STATEMENTS
(Unaudited)
(tables in thousands, except per share data)
| |
| (1) | Description of Business and Basis of Presentation |
American CareSource Holdings, Inc. (“ACS,” “Company,” the “Registrant,” & ldquo;we,” “us,” or “our,”) is an ancillary benefits management company that offers cost effective access to a comprehensive national network of ancillary healthcare service providers. The Company’s clients are national, regional and local health plans, which include preferred provider organizations (“PPOs”), third party administrators (“TPAs”), insurance companies, large self-funded organizations and Taft-Hartley union plans (i.e., employee benefit plans that are self-administered under collective bargaining agreements), that engage the Company to provide them with a complete outsourced solution designed to manage each payor’s obligations to its covered lives. The Company offers payors this solution by:
| |
| • | lowering our payors’ ancillary care costs throughout our network of high quality, cost effective ancillary service providers that we have under contract at more favorable terms than our payors could generally obtain on their own; |
| |
| • | providing payors with a comprehensive network of ancillary healthcare services providers that is tailored to each payor’s specific needs and is available to each payor’s covered lives for covered services; |
| |
| • | providing payors with claims management, reporting, and processing and payment services; |
| |
| • | performing network/needs analysis to assess the benefits to payors of adding additional/different service providers to the payor specific provider networks ; and |
| |
| • | credentialing network service providers for inclusion in the payor specific provider networks. |
ACS was incorporated under the laws of the State of Delaware on November 24, 2003 as a wholly-owned subsidiary of Patient Infosystems, Inc. (“Patient Infosystems”) in order to facilitate Patient Infosystems’ acquisition of substantially all of the assets of American CareSource Corporation. American CareSource Corporation had been in operation since 1997. The predecessor company to American CareSource Corporation, Physician’s Referral Network, had been in operation since 1995. On December 23, 2005, the Company became an independent company when Patient Infosystems distributed by dividend to its stockholders substantially all of its shares of the Company. Ancillary Care Services, Inc. is a wholly owned subsidiary of the Company.
The accompanying unaudited condensed consolidated financial statements have been prepared in accordance with accounting principles generally accepted in the United States (“GAAP”), interim reporting requirements of Form 10-Q and Rule 8-03 of Regulation S-X of the rules and regulations of the Securities and Exchange Commission (“SEC”). Consequently, financial information and disclosures normally included in financial statements prepared annually in accordance with GAAP have been condensed or omitted. Balance sheet amounts are as of September 30, 2010 and December 31, 2009 and operating results are for the three and nine months ended September 30, 2010 and 2009, and include all normal and recurring adjustments that we consider necessary for the fair, summarized presentation of our financial position and operating results. As these are condensed financial statements, readers of this report should, therefore, refer to the consolidated financial statements and the notes included in our Annual Report on Form 10-K for the fiscal year ended December 31, 2009, filed with the SEC on March 26, 2010.
The Company uses the “management approach” for reporting information about segments in annual and interim financial statements. The management approach is based on the way the chief operating decision-maker organizes segments within a company for making operating decisions and assessing performance. Reportable segments are based on products and services, geography, legal structure, management structure and any other manner in which management disaggregates a company. Based on the “management approach&rd quo; model, the Company has determined that its business is comprised of a single operating segment.
Our interim results of operations are not necessarily indicative of results of operations that will be realized for the full fiscal year.
Prior year operating results amounts have been reclassified to conform with the current year presentation.
The Company recognizes revenue on the services that it provides, which includes (i) providing payor clients with a comprehensive network of ancillary healthcare providers, (ii) providing claims management, reporting, processing and payment services, (iii) providing network/need analysis to assess the benefits to payor clients of adding additional/different service providers to the client-specific provider networks and (iv) providing credentialing of network services providers for inclusion in the client payor-specific provider networks. Revenue is recognized when services are delivered, which occurs after processed claims are billed to the client payors and collections are reasonably assured. The Company estimates revenues and costs of revenues using average h istorical collection rates and average historical margins earned on claims. Periodically, revenues are adjusted to reflect actual cash collections so that revenues recognized accurately reflect cash collected.
The Company determines whether it is acting as a principal or agent in the fulfillment of the services rendered. After careful evaluation of the key gross and net revenue recognition indicators, the Company acknowledges that while the determination of gross versus net reporting is highly judgmental in nature, the Company has concluded that its circumstances are most consistent with those key indicators that support gross revenue reporting.
Following are the key indicators that support the Company’s conclusion that it acts as a principal when settling claims for service providers through its contracted service provider network:
| |
| • | The Company is the primary obligor in the arrangement. The Company has assessed its role as primary obligor as a strong indicator of gross reporting. The Company believes that it is the primary obligor in its transactions because it is responsible for providing the services desired by its client payors. The Company has distinct, separately negotiated contractual relationships with its client payors and with the ancillary health care providers in its networks. The Company does not negotiate “on behalf of” its client payors and does not hold itself out as the agent of the client payors when negotiating the terms of the Company’s ancillary healthcare service provider agreements. The Company’s agreements contractually prohibit client payors and service providers to enter into direct contractual r elationships with one another. The client payors have no control over the terms of the Company’s agreements with the service providers. In executing transactions, the Company assumes key performance-related risks. The client payors hold the Company responsible for fulfillment, as the provider, of all of the services the client payors are entitled to under their contracts; client payors do not look to the service providers for fulfillment. In addition, the Company bears the pricing/margin risk as the principal in the transactions. Because the contracts with the client payors and service providers are separately negotiated, the Company has complete discretion in negotiating both the prices it charges its client payors and the financial terms of its agreements with the service providers. Since the Company’s profit is the spread between the amounts received from the client payors and the amount paid to the service providers, it bears s ignificant pricing/margin risk. There is no guaranteed mark-up payable to the Company on the amount the Company has contracted. Thus, the Company bears the risk that amounts paid to the service provider will be greater than the amounts received from the client payors, resulting in a loss or negative claim. |
| |
| • | The Company has latitude in establishing pricing. As stated above, the Company has complete latitude in negotiating the price to be paid to the Company by each client payor and the price to be paid to each contracted service provider. This type of pricing latitude indicates that the Company has the risks and rewards normally attributed to a principal in the transactions. |
| |
| • | The Company changes the product or performs part of the services. The Company provides the benefits associated with the relationships it builds with the client payors and the services providers. While the parties could deal with each other directly, the client payors would not have the benefit of the Company’s experience and expertise in assembling a comprehensive network of service providers, in claims management, reporting and processing and payment services, in performing network/needs analysis to assess the benefits to client payors of adding additional/different service providers to the client payor-specific provider networks, and in credentialing network service providers. |
| |
| • | The Company has complete discretion in supplier selection. One of the key factors considered by client payors who engage the Company is to have the Company undertake the responsibility for identifying, qualifying, contracting with and managing the relationships with the ancillary healthcare service providers. As part of the contractual arrangement between the Company and its client payors, the payors identify their obligations to their respective covered lives and then work with the Company to determine the types of ancillary healthcare services required in order for the payors to meet their obligations. The Company may select the providers and contract with them to provide services at its discretion. |
| |
| • | The Company is involved in the determination of product or service specifications. The Company works with its client payors to determine the types of ancillary healthcare services required in order for the payors to meet their obligations to their respective covered lives. In some respects, the Company is customizing the product through its efforts and ability to assemble a c omprehensive network of providers for its customers that is tailored to each client payor’s specific needs. In addition, as part of its claims processing and payment services, the Company works with the client payors, on the one hand, and the providers, on the other, to set claims review, management and payment specifications. |
| |
| • | The supplier (and not the Company) has credit risk. The Company believes it has some level of credit risk, but that risk is mitigated because the Company does not remit payment to providers unless and until it has received payment from the relevant client payors following the Company’s processing of a claim. |
| |
| • | The amount that the Company earns is not fixed. The Company does not earn a fixed amount per transaction nor does it realize a per-person per-month charge for its services. |
The Company has evaluated the other indicators of gross and net revenue recognition, including whether or not the Company has general inventory risk. The Company does not have any general inventory risk, as its business is not related to the manufacture, purchase or delivery of goods and it does not purchase in advance any of the services to be provided by the ancillary healthcare se rvice providers. While the absence of this risk would be one indicator in support of net revenue reporting, as described in detail above, the Company has carefully evaluated all of the key gross and net revenue recognition indicators and has concluded that its circumstances are most consistent with those key indicators that support gross revenue reporting.
If the Company were to report its revenues net of provider payments rather than on a gross reporting basis, for the three and nine months ended September 30, 2010, its net revenues would have been approximately $3.7 million and $11.9 million, respectively. For the three and nine months ended September 30, 2009, its net revenues would have been approximately $4.4 million and $12.8 million, respectively.
During the three and nine months ended September 30, 2010 and 2009, two of the Company’s clients comprised a significant portion of the Company’s revenues. The following is a summary of the approximate amounts of the Company’s revenue and accounts receivable contributed by each of those clients as of the dates and for the periods presented (amounts in thousands):
| | | | | | | | | | | | | | | | | | | | | | | | | | | | | | | | | | | |
| | | | Periods ended September 30, 2010 | | | | Periods ended September 30, 2009 |
| | As of September 30, 2010 | | Three months | | Nine months | | As of September 30, 2009 | | Three months | | Nine months |
| | Accounts Recievable | | Revenue | | % of Total Revenues | | | Revenue | ; | % of Total Revenues | | | Accounts Recievable | | Revenue | | % of Total Revenues | | | Revenue | | % of Total Revenues | |
| |
| Client A | $ | 2,747 | | | $ | 6,708 | | | 45 | % | | $ | 22,265 | | | 49 | % | | $ | 3,257 | | | $ | 8,910 | | | 49 | % | | $ | 25,827 | | | 50 | % |
| Client B | 1,789 | | | 3,889 | | | 26 | % | | 13,189 | | | 29 | % | | 2,870 | | | 6,417 | | | 35 | % | | 19,714 | | | 38 | % |
| Others | 1,855 | | | 4,226 | | | 29 | % | | 9,818 | | | 22 | % | | 1,145 | | | 2,908 | | | 16 | % | | 5,884 | | | 12 | % |
| | $ | 6,391 | | | $ | 14,823 | | | 100 | % | | $ | 45,272 | | | 100 | % | | $ | 7,272 | | | $ | 18,235 | | | 100 | % | | $ | 51,425 | | | 100 | % |
The following table details the reconciliation of basic earnings per share to diluted earnings per share (amounts in thousands except per share amounts):
| | | | | | | | | | | | | | | |
| | Three months ended September 30, | | Nine months ended September 30, |
| | 2010 | | 2009 | | 2010 | | 2009 |
| Numerator for basic and diluted earnings per share: | | | | | | | |
| Net income for basic earnings per share | $ | 44 | | &n bsp; | $ | 147 | | | $ | 344 | | | $ | 960 | |
| Less: | | | | | | | |
| Unrealized gain on warrant derivative liability | 2 | | | — | | | 18 | | | 232 | |
| Net income for diluted earnings per share | 42 | | | 147 | | | 326 | | | 728 | |
| Denominator: | | | | | | | | | | | |
| | | | | | | | | | & nbsp; | | |
| Weighted-average basic common shares outstanding | 16,631 | | | 15,432 | | | 16,413 | | | 15,425 | |
| Assumed conversion of dilutive securities: | | | | | | | |
| Stock options | 239 | | | 545 | | | 282 | | | 829 | |
| Stock warrants | 254 | | | 1,595 | | | 474 | | | 1,716 | |
| Restricted Stock Units | — | | | — | | | — | | | 2 | |
| Potentially dilutive common shares | 493 | | | 2,140 | | | 756 | | | 2,547 | |
| | | | | | | | | | | | |
| Denominator for diluted earnings per share - Adjusted weighted - average shares | 17,124 | | | 17,572 | | | 17,169 | | | 17,972 | |
| Earnings per common share: | | | | | | | | | | | |
| Basic | $ | 0.00 | | | $ | 0.01 | | | $ | 0.02 | | | $ | 0.06 | |
| Diluted | $ | 0.00 | | | $ | 0.01 | | | $ | 0.02 | | | $ | 0.04 | |
For purposes of this calculation, outstanding stock options, stock warrants, and unvested restricted stock units are considered common stock equivalents using the treasury stock method, and are the only such equivalents outstanding. For the three and nine months ended September 30, 2010, options to purchase approximately 1.9 million shares of common stock, warrants to purchase approximately 325,000 shares of common stock, and approximately 57,000 unvested restricted sto ck units were excluded from the calculation as their impact would be anti-dilutive.
| |
| (4) | Significant Agreements |
On December 31, 2008, we entered into an amendment (the “Amendment”) to our Provider Service Agreement with one of our significant clients. The purpose of the Amendment is, among other things, to facilitate and accelerate the integration into the Company’s business model of one of the client’s affiliates, adjust the administrative fees outlined in the previous amendment, define and clarify the exclusivity and levels of cooperation contemplated by the previous amendments, and extend the partnership between the Company and the client and the duration of their Provider Service Agreement to December 31, 2012. Under a strategic contracting plan that the Amendment requires the parties to develop, the Company will be the exclusive outsourced ancillary contracting and network management provider for the client’s group health clients and any third party administrators.
As part of the Amendment, the Company agreed to pay to the client $1.0 million for costs incurred in connection with the integration of and access to the Company’s network by members of the affiliate’s network, including, but not limited to, costs associated with salaries, benefits, and third party contracts. The payment was made in April 2009. The Company will continue to pay an administrative fee to the client designed to reimburse and compensate for the work that it is required to perform to support the Company’s program. The Company recognized the $1.0 million fee as a prepaid expense and is amortizing it over the term of the agreement as an administrative fee. During the three and nine months ended September 30, 2010, we recorded amortization related to the agreement of $62,500 and $187,500 respectively. At September 30, 2010, $250,000 was classified as a current asset on the consolidated balance sheet representing the amount to be amortized during the subsequent twelve-month period. The remaining $312,500 balance was classified as a long-term other asset at September 30, 2010.
During the nine months ended September 30, 2010, one of our significant customers, accounting for 26% and 29% of our revenues during the three and nine months ended September 30, 2010, respectively, merged with a large supplier of independent, network-based cost management solutions. The contract with the customer expires on May 21, 2011 and will automatically renew for succe ssive one-year terms unless either party delivers written notice of non-renewal at least ninety days prior to expiration.
During the nine months ended September 30, 2010, an ancillary service provider terminated its agreement with the Company to provide laboratory services in Texas to clients of the Company on an “as needed” basis. Services provided by the provider accounted for approximately 4.2% of the Company’s revenues for the nine months ended September 30, 2010.
On January 22, 2010, Series A warrants to purchase approximately 872,000 shares of the Company’s common stock were exercised through a cashless net exercise. Approximately 727,000 shares of common stock were issued as a result of the exercise. The exercise price of the warrants was $0.40 per share.
On August 15, 2010, Series B warrants to purchase approximately 631,000 shares of the Company’s common stock were exercised. Warrants to purchase approximately 320,000 shares of common stock were exercised through a cash exercise, generating approximately $157,000 of cash proceeds. Warrants to purchase approximately 311,000 shares of common stock were exercised through a cashless net exercise. Approximately 210,000 shares of common stock were issued as a result of the cashless exercise. The exercise price of the warrants was $0.49 per share.
As of September 30, 2010, we have the following warrants to purchase shares of common stock outstanding:
Series C warrants to purchase approximately 100,000 shares of common stock expiring February 17, 2011 with an exercise price of $5.50.
Series D warrants to purchase approximately 225,000 shares of common stock expiring May 20 , 2012 with an exercise price of $1.84.
The warrant derivative liability recorded at fair value on the balance sheet as of September 30, 2010 is categorized based upon the level of judgment associated with the inputs used to measure their fair value. Hierarchical levels, are directly related to the amount of subjectivity associated with the inputs to fair valuation of these liabilities is as follows:
Level 1 — Inputs are unadjusted, quoted prices in active markets for identical assets or liabilities at the measurement date;
Level 2 — Inputs other than Level 1 inputs that are either directly or indirectly observable; and
Level 3 — Unobservable inputs, for which little or no market data exist, therefore requiring an entity to develop its own assumptions.
The following table summarizes the warrant derivative liability measured at fair value on a recurring basis as of the dates presented, segregated by the level of the valuation inputs within the fair value hierarchy utilized to measure fair value (amounts in thousands):
| | | | | | | | | | | | | | | |
| | Total | | Quoted prices in active markets for identical assets (Level 1) | | Significant other observable inputs (Level 2) | | Significant unobservable inputs (Level 3) |
| September 30, 2010 | $ | — | | | $ | — | | | $ | — | | | $ | — | |
| December 31, 2009 | 18 | | | — | | | — | | | 18 | |
Equity-linked financial instruments consist of stock warrants issued by the Company that contain a strike price adjustment feature. We calculated the fair value of the warrants using the Black–Scholes–Merton valuation model. During the three and nine months ended September 30, 2010 we recorded unrealized gains on warrant derivatives of approximately $2,000 and $18,000, respectively, related to the change in fair value of the warrants. During the three and nine months ended September 30, 2009 we recorded an unrealized loss of approximately $22,000 and an unrealized gain on warrant derivatives of approximately $232,000, respectively, related to the change in fair value of the warrants.
The assumptions used in the Black-Scholes-Merton valuation model were as follows:
| | | | | | | |
| | September 30,
2010 | | December 31,
2009 |
| Exercise price | $ | 5.50 | | | $ | 5.50 | |
| Expected volatility | 56.8 | % | | 68.9 | % |
| Expected life (years) | 0.45 | | | 1.2 | |
| Risk free interest rate | 0.18 | % | | 0.6 | % |
| Forfeiture rate | — | | | — | |
| Dividend rate | — | | | — | |
The following table reflects the activity for liabi lities measured at fair value using Level 3 inputs for the nine month period ended September 30, 2010:
| | | | | | | |
| ($ in thousands) | 2010 | | 2009 |
| Balance as of January 1 | $ | 18 | | | $ | 374 | |
| Sales of warrant derivative | — | | | (32 | ) |
| Unrealized gains related to the change in fair value | (18 | ) | | (232 | ) |
| Balance as of September 30 | $ | — | | | $ | 110 | |
In addition, the Company’s financial instruments consist primarily of cash and cash equivalents, accounts receivable, accounts payable and accrued expenses. The fair value of financial instruments is determined by reference to various market data and other valuation techniques, as appropriate. Unless otherwise disclosed, the fair value of short-term financial instruments approximates their recorded values due to the short-term nature of the instruments.
| |
| (7) | Software Development Costs |
In accordance with FASB ASC 350-40-25, the Company capitalizes costs associated with internal-use software during the application development stage. Application development stage costs generally include costs associated with internal-use software configuration, c oding, installation and testing. Costs of significant upgrades and enhancements that result in additional functionality also are capitalized, whereas costs incurred for maintenance and minor upgrades and enhancements are expensed as incurred. Capitalized costs include external direct costs of materials and services utilized in developing or obtaining internal-use software and payroll and payroll-related expenses for employees who are directly associated with and devote time to the internal-use software project. Capitalization of such costs begins when the preliminary project stage is complete and ceases no later than the point at which the project is substantially complete and ready for its intended purpose. Capitalized costs are amortized using the straight-line method over the useful life of the software, which is typically five years.
Duri ng the three and nine months ended September 30, 2010 and September 30, 2009, the Company capitalized costs related to enhancements to its internal information technology claims management applications. The applications were originally developed in 2005 and from time to time, the Company will enhance the functionality and reporting capabilities of the applications. The enhancements are typically developed by the Company's internal information technology group. Periodically, third-party consultants will be utilized to perform the development. For internal resources, the Company capitalizes salary and related benefits, while it capitalizes the cost of external consultants.
During the three and nine months ended September 30, 2010, the Company capitalized approximately $101,000 and $283,000, respectively, compared to $135,000 and $464,000 for the c orresponding prior year periods, respectively.
The effective income tax rates for the three and nine months ended September 30, 2010 and 2009 were different from the statutory United States federal income tax rate of 35% primarily due to state income taxes and permanent differences.
| |
| (9) | Recent Accounting Pronouncements |
In January 2010, the Financial Accounting Standards Board (“FASB”) issued Accounting Standards Update No. 2010-06, Improving Disclosures about Fair Value Measurements. The Update provides amendments to FASB ASC 820-10 that requires entities to disclose separately the amounts of significant transfers in and out of Level 1 and Level 2 fair value measurements and describe the reasons for the transfers. In addition, the Update requires entities to present separately information about purchases, sales, issuances, and settlements in the reconciliation for fair value measurements using significant unobservable inputs (Level 3). The disclosures related to Level 1 and Level 2 fair value measurements are effective for us in 2010 and the disclosures related to Level 3 fair value measurements are effective for us in 2011. The Update requires new disclosures only, and will have no impact on our consolidated financial position, results of operations, or cash flows.
We evaluate events and transactions that occur after the balance sheet date as potential subsequent events. The fo llowing event occurred subsequent to September 30, 2010:
On October 21, 2010 William J. Simpson, Jr. was appointed to the Board of Directors.
FORWARD-LOOKING STATEMENTS
This document contains forward-looking statements within the meaning of Section 27A of the Securities Act of 1933, as amended, and Section 21E of the Securities Exchange Act of 1934, as amended. These statements can be identified by forward-looking words such as “may,” “will,” “expect,” “intend”, &ld quo;anticipate,” “believe,” “estimate” and “continue” or similar words and discuss the Company’s plans and objectives for future operations, including its services, contain projections of the Company’s future operating results or financial condition, and discuss its expectations with respect to the growth in health care costs in the United States, the demand for ancillary benefits management services, and the Company’s competitive advantages, or contain other “forward-looking” information.
Such forward-looking statements are based on current information, assumptions and belief of management, and are not guarantees of future performance. Substantial risks and uncertaintie s could cause actual results to differ materially from those indicated by such forward-looking statements, including, but not limited to, changes in national health care policy, regulation, and/or reimbursement, general economic conditions (including the recent economic downturns and increases in unemployment), lower than anticipated demand for ancillary services, pricing, market acceptance/preference, the Company’s ability to integrate with its clients, consolidation in the industry that may affect the Company’s key clients, changes in the business decisions by significant clients, increased competition, the Company’s inability to attract or maintain providers or clients or achieve its financial results, the Company’s inability to manage growth, implementation and performance difficulties, and other risk factors detailed from time to time in the Company’s periodic filings with the Securities and Exchange Commission, including its Annual Report on Form 10-K for the year ended December 31, 2009 and the quarterly reports on Form 10-Q filed for each of the subsequent quarters.
Do not place undue reliance on these forward-looking statements, which speak only as of the date this document was prepared. All forward-looking statements included herein are expressly qualified in their entirety by the cautionary statements contained or referred to in this section. Except to the extent required by applicable securities laws and regulations, the Company undertakes no obligation to update or revise these forward-looking statements to reflect events or circumstances a fter the date of this document or to reflect the occurrence of unanticipated events.
ITEM 2. Management's Discussion and Analysis of Financial Condition and Results of Operations
GENERAL
Management’s discussion and analysis provides a review of the Company’s operating results for the three and nine months ended September 30, 2010 and its financial condition at September 30, 2010. The focus of this review is on the underlying business reasons for significant changes and trends affecting the revenues, net income and financial condition of the Company. This review should be read in conjunction with the accompanying unaudited consolidated financial statements and the audited consolidated financial statements and the notes thereto included in our Annual Report on Form 10-K for the year ended December 31, 2009.
OVERVIEW
American CareSource Holdings, Inc. (the “Company”, “ACS”, “we”, & ldquo;us”, or “our”) is an ancillary benefits management company that offers cost effective access to a comprehensive national network of ancillary healthcare service providers. The Company’s customers include self-insured employers, indemnity insurers, PPOs, HMOs, third-party administrators and federal and local governments that engage the Company to provide them with a complete outsourced solutions designed to manage each customer’s obligations to its covered lives. The Company offers its customers this solution by executing the following:
| |
| • &n bsp; | lowering our payors’ ancillary care costs throughout our network of high quality, cost effective providers that we have under contract at more favorable terms than our payors could generally obtain on their own; |
| |
| • | providing pay ors with a comprehensive network of ancillary healthcare services providers that is tailored to each payor’s specific needs and is available to each payor’s covered lives for covered services; |
| |
| • | providing payors with claims management, reporting, and processing and payment services; |
| |
| • | performing network/needs analysis to assess the benefits to payors of adding additional/different service providers to the payor -specific provider networks; and |
| |
| • | credentialing network service providers for inclusion in the payor -specific provider networks. |
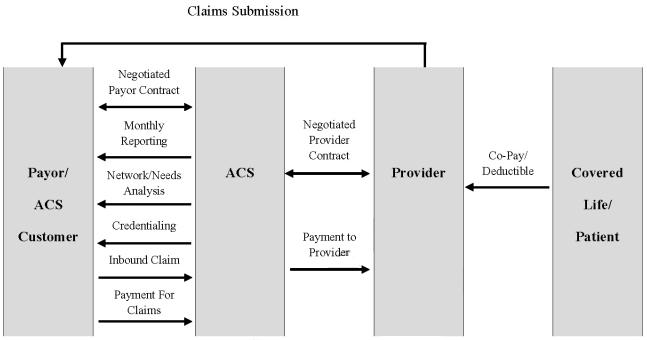
The Company’s b usiness model, illustrating the relationships among the persons involved, directly or indirectly, in the Company’s business and its generation of revenue and expenses is depicted below:
Our clients route healthcare claims to us after a service has been performed by participant providers in our network. We process those claims and charge the client/payor according to its contractual rate for the services according to our contract with the client/payor. In processing the claim, we are paid directly by the client or the insurer for the service. We then pay the provider of service according to its contractual rate. We assume the risk of generating positive margin, the difference between the payment we receive for the service and the amount we are obligated to pay the original provider of service or member of its proprietary network.
The Company recognizes revenues for ancillary healthcare services when services by providers have been authorized and performed, the claim has been billed to the payor and collections from payors are reasonably assured. Cost of revenues for ancillary healthcare services consist of amounts due to providers for providing ancillary health care services, client administration fees paid to our client payors to reimburse them for routing the claims to us for processing, and the Company’s related direct labor and overhead of processing invoices, collections and payments. The Company is not liable for costs incurred by independent contract service providers until payment is received by us from the payors. The Company recognizes actual or estimated liabilities to independent contract service providers as the related revenues are recognized.
The Company markets its products to preferred provider organizations (“PPOs”), third party administrators (“TPAs”), insurance companies, large self-funded organizations and Taft-Hartley union plans, such as employee benefit plans that are self-administered under collective bargaining agreements.
The Company is seeking growth from increasing its number of client payor and service provider relationships by focusing on providing in-network services for its payors and aggressively pursuing middle-market insurance companies, TPAs and direct payors. The Company continues to derive a significant amount of its revenues from its traditional PPO relationships, but we have shifted our focus and we now aggressively target TPAs and direct payors, which have accounted for a significant portion of the $3.1 million of incremental revenue in 2010. Despite the growth from new clients, we continue to see revenue declines from our two most significant clients, both of which are PPOs. Revenue from the two clients have declined 14% and 33% during the nine months ended Septemb er 30, 2010 as compared to the same period in 2009. While our new client additions in 2010 have offset some of these aforementioned declines and will continue to, we cannot be certain that revenue and operating income will not continue to decline further as a result of the loss of business from our two largest clients.
CRITICAL ACCOUNTING POLICIES AND ESTIMATES
Management’s discussion and analysis of our financial condition and results of operations is based upon our condensed consolidated financial statements. These condensed consolidated financial statements have been prepared following the requirements of accounting principles generally accepted in the United States (“GAAP”) for interim periods and require us to make estimates and judgments that affect the reported amounts of assets, liabilities, revenues and expenses, and related disclosure of contingent assets and liabilities. On an ongoing basis, we evaluate our estimates, including those related to revenue recognition, provider cost recognition, the resulting contribution margins, amortization and potential impairment of intangible assets and goodwill and stock-based compensation expense. As these are condense d consolidated financial statements, you should also read expanded information about our critical accounting policies and estimates provided in Item 7, “Management’s Discussion and Analysis of Financial Condition and Results of Operations” under the heading “Critical Accounting Policies,” included in our Annual Report on Form 10-K for the year ended December 31, 2009. There have been no material changes to our critical accounting policies and estimates from the information provided in our Form 10-K for the year ended December 31, 2009.
ANALYSIS OF RESULTS OF OPERATIONS
Revenues
T he following table sets forth a comparison of our revenues for the periods presented ended September 30:
| | | | | | | | | | | | | | | | | | | | | | | | | | | | | |
| | Third Quarter | | Nine Months |
| | | | | | Change | | | | | | Change |
| ($ in thousands) | 2010 | | 2009 | | $ | | % | | 2010 | | 2009 | | $ | | % |
| Net revenues | $ | 14,823 | | | $ | 18,235 | | | $ | (3,412 | ) | | (19 | )% | | $ | 45,272 | | | $ | 51,425 | | | $ | (6,153 | ) | | (12 | )% |
The Company’s net revenues are generated from ancillary healthcare service claims. Revenue is recognized when we bill our client payors for services performed and collection is reasona bly assured. The decrease in revenue for the three months ended September 30, 2010 as compared to the same period in 2009 was due primarily to a 33% and 42% decline in billed claims volume from our two significant clients, respectively. Claims volume declined due to the following factors:
| |
| •& nbsp; | Loss of covered lives and payor groups due to the declining US economy, reduction in jobs and macroeconomic factors; |
| |
| • | Stronger presence of larger carriers in the market; |
| |
| • | Loss of key relationship with a national laboratory services provider in the third quarter of 2009; |
| |
| • | Loss of key relationship with a national laboratory services provider in the second q uarter of 2010; and |
| |
| • | Transition status of one of our key accounts related to a business combination. |
The drop in claims volume resulted in a net $4.7 million, or 31%, decline in revenues from our two significant clients in the third quarter compared to the corresponding prior year quarter. The decline was partially offset by $1.8 million of revenue generated from ten new clients implemented in 2010 and a movement in the mix of provider specialties that generate revenue away from lower revenue-per-claim services, partially as a result of losing two key laboratory service providers discussed above, compared to the third quarter of 2009. The following tables detail the change in client accounts for the periods presented:
| | | | | | | | | | | | | | | | | | | | | | | | | | |
| | Revenue | | Billed Claims Volume |
| | Third Quarter | | Change | | Third Quarter | | Change |
| (in thousands) | 2010 | | 2009 | | $ | | % | | 2010 | | 2009 | | Claims | | % |
| Client A | $ | 6,708 | | | $ | 8,910 | | | $ | (2,202 | ) | | (25 | )% | | 29 | | | 43 | | | (14 | ) | | (33 | )% |
| Client B | 3,889 | | | 6,417 | | | (2,528 | ) | | (39 | )% | | 19 | | | 33 | | | (14 | ) | | (42 | )% |
| Other clients | 2,475 | | | 2,908 | | | (433 | ) | | (15 | )% | | 20 | | | 25 | | | (5 | ) | | (20 | )% |
| Clients implemented in 2010 | 1,751 | | | — | | | 1,751 | | | nm | | | 8 | | | — | | | 8 | | | nm | |
| Total | $ | 14,823 | | | $ | 18,235 | | | $ | (3,412 | ) | | (19 | )% | | 76 | | | 101 | | | (25 | ) | | (25 | )% |
The decrease in revenue for the nine months ended September 30, 2010 as compared to the same period in 2009 was due primarily to a 20% and 31% decline in billed claims volume from our two significant clients, respectively. The decline in claims volume is due to the factors described above. The drop in claims volume resulted in a $10.0 million, or 22%, decline in revenues from the two clients in the nine months ended September 30, 2010 compared to the corresponding prior year period. The declines were partially offset by an incremental $0.8 million of revenue generated from other clients, primarily those implemented in 2009, and $3.1 million from clients implemented during the nine months ended September 30, 2010. Both increases were a direct result of a concentrated effort to diversify and our client base. The following tables detail the change in client accounts for the periods presented:
| | | | | | | | | | | | | | | | | | | | | | | | | | |
| | Revenue | | Billed Claims Volume |
| | Nine Months | | Change | | Nine Months | | Change |
| (in thousands) | 2010 | | 2009 | | $ | | % | | 2010 | | 2009 | | Claims | | % |
| Client A | $ | 22,265 | | | $ | 25,826 | | | $ | (3,561 | ) | | (14 | )% | | 95 | | | 119 | | | (24 | ) | | (20 | )% |
| Client B | 13,189 | | | 19,714 | | | (6,525 | ) | | (33 | )% | | 75 | | | 109 | | | (34 | ) | | (31 | )% |
| Other clients | 6,673 | | | 5,885 | | | 788 | | | 13 | % | | 63 | | | 54 | | | 9 | | | 17 | % |
| Clients implemented in 2010 | 3,145 | | | — | | | 3,145 | | &n bsp; | nm | | | 14 | | | — | | | 14 | | | nm | |
| Total | $ | 45,272 | | | $ | 51,425 | | | $ | (6,153 | ) | | (12 | )% | | 247 | | | 282 | | | (35 | ) | | (12 | )% |
We attempt to enhance our existing client relationships through focused efforts to recruit and add ancillary service providers that will be more attractive to our clients’ base of lives and secure greater cost savings for our clients, and through programs to educate our client payors so that they may fully utilize our network.
The Company is seeking growth from increasing its number of client payor and service provider relationships by focusing on providing in-network services for its payors and aggressively pursuing middle-market insurance companies, TPAs and direct payors. The Company continues to derive a significant amount of its revenues from its traditional PPO relationships, but we have shifted our focus and we now aggressively target TPAs and direct payors, which have accounted for a significant portion of the $3.1 million of incremental revenue in 2010. Despite the growth from new clients, we continue to see revenue declines from our two most significant clients, both of which are PPOs. Revenue from the two clients have declined 14% and 33% during the nine months ended September 30, 2010 as compared to the same period in 2009. While our new client additions in 2010 have offset some of these aforementioned declines and will continue to, we cannot be certain that revenue and operating income will not continue to decline further as a result of the loss of business from our two largest clients.
Revenue per claim increased for the three months ended September 30, 2010 due to the change in mix of provider specialties driving our revenue and claim volume when compared to the prior year period. Higher revenue per claim categories such as dialysis generated a higher percent of total revenue during the quarter, while lower revenue p er claim categories such as laboratory services generated a lower percent of total revenue during the quarter.
Revenue per claim for the nine months ended September 30, 2010 was flat when compared to the corresponding prior year period.
Revenue per c laim can vary significantly depending upon factors including the types of services provided to clients’ members, the quantity of services delivered, client negotiated pricing, provider negotiated service rates, the rate of collections based upon the client and members financial responsibility and other factors. The following table provides information with respect to claims processed, claims billed and the associated revenue per claim metrics for the periods ended September 30:
| | | | | | | | | | | |
| | Three months ended | | Nine months ended |
| | 2010 | | 2009 | | 2010 | | 2009 |
| Claims processed (in thousands) | 111 | | | 117 | | | 315 | | | 329 | |
| | | | | | | | |
| Claims billed (in thousands) | 76 | & nbsp; | | 101 | | | 247 | | | 282 | |
| | | | | | | | |
| Revenue per billed claim | 195 | | | 181 | | | 183 | | | 182 | |
Cost of Revenues and Contribution Margin
The following tables set forth a comparison of the components of our cost of revenues, for the periods presented ended September 30:
| | | | | | | | | | | | | | | | | | | | |
| | Third Quarter |
| | | | | | | | | | Chan ge |
| ($ in thousands) | 2010 | | % of revenues | | 2009 | | % of revenues | | $ | | % |
| Provider payments | $ | 11,129 | | | 75.1 | % | | $ | 13,800 | | | 75.7 | % | | $ | (2,671 | ) | | (19 | )% |
| Administrative fees | 799 | | | 5.4 | % | | 963 | | | 5.3 | % | | (164 | ) | | (17 | )% |
| Claims administration and provider development | 1,189 | | | 8.0 | % | | 1,178 | | | 6.5 | % | | 11 | | | 1 | % |
| Total cost of revenues | $ | 13,117 | | | 88.5 | % | | $ | 15,941 | | | 87.5 | % | | $ | (2,824 | ) | | (18 | )% |
| | | | | | | | | | | | | | | | | | | | |
| | Nine Months |
| | | | | | | | | | Change |
| ($ in thousands) | 2010 | | % of revenues | | 2009 | | % of revenues | | $ | | % |
| Provider payments | $ | 33,351 | | | 73.7 | % | | $ | 38,670 | | | 75.2 | % | | $ | (5,319 | ) | | (14 | )% |
| Administrative fees | 2,552 | | | 5.6 | % | | 2,682 | | | 5.2 | % | | (130 | ) | | (5 | )% |
| Claims administration and provider development | 3,597 | | | 7.9 | % | | 3,259 | | | 6.3 | % | | 338 | | | 10 | % |
| Total cost of revenues | $ | 39,500 | | | 87.2 | % | | $ | 44,611 | | | 86.7 | % | | $ | (5,111 | ) | | (11 | )% |
Cost of revenues is comprised of payments to our providers, administrative fees paid to our client payors for converting claims to electronic data interchange and routing them to both the Company for processing and to their payors for payment, and the costs of our claims administration and provider development organizations. Payments to providers is the largest component of our cost of revenues and it consists of our payments for ancillary care services in accordance with contracts negotiated separately with providers for specific ancillary services.
Following is an explanation of the changes in the components of co sts of revenues during the three and nine months ended September 30, 2010 as compared to the same periods in 2009:
Provider payments. The 19% and 14% decrease in provider payments for the three and nine months ended September 30, 2010, respectively, is consistent with the decline in revenue, primarily related to our two significant clients. The decrease in provider payments as a percent of net revenues from 75.7% and 75.2% during the three and nine months ended September 30, 2009, respectively, to 75.1% and 73.7% during the corresponding periods in 2010, respectively, is due primarily to the change in the mix of specialties from which we generated revenue, in addition to the improvement in margins in certain specialty categories. Categories that carry higher margins, such as dialysis services, diagnostic imaging services, rehabilitation services and durable medical equipment, were a larger percent of our revenues as compared to the third quarter a nd nine months ended September 30, 2009, while margins in these categories improved in the three and nine months ended September 30, 2010 compared to the corresponding prior year periods. These category margins are impacted by the execution of new provider agreements, pricing for associated services on recently implemented and existing client contracts, the mix of services delivered in each category and the mix of providers delivering the services.
Administrative fees. Administrative fees paid to clients as a percent of net revenues were flat at 5.4% and 5.6% during the three and nine months ended September 30, 2010, respectively, compared to 5.3% and 5.2% during the corresponding periods in 2009, respectively.
Claims administration and provider development. Our claims administration organization consists of our operations and information technology groups. Our operations group is responsible for all aspects of the claims management and processing including billing, quality assurance and collections efforts. Our information technology g roup is responsible for maintaining and enhancing the technological capabilities and applications with the claims management process. Our provider development group is responsible for developing our network of ancillary healthcare service providers, which includes contracting with providers to be included in the network, credentialing new service providers and maintaining a relationship with existing providers, all for the purpose of enhancing our ancillary service provider network offering to our client payors.
The following table details the costs within the claims administration and provider development groups for the periods presented:
| | | | | | | | | | | | | | | | | | | | | | | | | | | | | | | | | | | | | | | | | | | | |
| | Third Quarter |
| | Claims Administration | | Provider Development | | Total |
| | | | | | Increase | | | | | | Increase | | | | | | Increase |
| ($ in thousands) | 2010 | | 2009 | | (Decrease) | | 2010 | | 2009 | | (Decrease) | | 2010 | | 2009 | | (Decrease) |
| Total wages, incentives and benefits | $ | 719 | | | $ | 602 | | | $ | 117 | | | 19 | % | | $ | 307 | | | $ | 409 | | | $ | (102 | ) | | (25 | )% | | $ | 1,026 | | | $ | 1,011 | | | $ | 15 | | | 1 | % |
| Other | 31 | | | 18 | | | 13 | | | nm | | | 132 | | | 149 | | | (17 | ) | | (11 | )% | | 163 | | | 167 | | | (4 | ) | | (2 | )% |
| | $ | 750 | | | $ | 620 | | | $ | 130 | | | 21 | % | | $ | 439 | | | $ | 558 | | | $ | (119 | ) | | (21 | )% | | $ | 1,189 | | | $ | 1,178 | | | $ | 11 | | | 1 | % |
| | | | | | | | | | | | | | | | | | | | | | | | | | | | | | | | | | | | | | | | | | | | |
| | Nine Months |
| | Claims Administration | | Provider Development | | Total |
| | | | | | Increase | | | | | | Increase | | | | | | Increase |
| ($ in thousands) | 2010 | | 2009 | | (Decrease) | | 2010 | | 2009 | | (Decrease) | | 2010 | | 2009 | | (Decrease) |
| Total wages, incentives and benefits | $ | 2,071 | | | $ | 1,744 | &nbs p; | | $ | 327 | | | 19 | % | | $ | 1,085 | | | $ | 1,089 | | | $ | (4 | ) | | (0 | )% | | $ | 3,156 | | | $ | 2,833 | | | $ | 323 | | | 11 | % |
| Other | 75 | | | (2 | ) | | 77 | | | nm | | | 366 | | | 428 | | | (62 | ) | | (14 | )% | | 441 | | | 426 | | | 15 | | | 4 | % |
| | $ | 2,146 | | | $ | 1,742 | | | $ | 404 | | | 23 | % | | $ | 1,451 | | | $ | 1,517 | | | $ | (66 | ) | | (4 | )% | | $ | 3,597 | | | $ | 3,259 | | | $ | 338 | | | 10 | % |
The increase in the costs during the three and nine months ended September 30, 2010 compared to the corresponding prior year periods is due to investments in claims administration, primarily in the Information Technology group. Wages, incentives and benefits increased as a result of the resource additions in claims administration. Ending headcounts for the periods ended September 30, 2010 and 2009 were as follows: Operations -- 22 and 20, respectively; Information Technology -- 14 and 10, respectively; and Provider Development -- 11 and 13, respectively. The increases in headcount were made to increase our Information Technology staff, which maintains and enhances our internal claims processing systems. Such enhancements are primarily focused on providing increased functionality and efficiencies within the claims processing function. In addition, during the three months ended September 30, 2010, the provider development group experienced 33% turnover of its full-time employees.
We monitor the efficiency, effectiveness, and scalability of our claims administration group by evaluating cost per claim. Cost per claim is calculated by dividing the cost of our claims administration group (which includes the costs associated with our Operati ons and Information Technology groups), which is detailed above, by the number of processed claims for the period. Following is the cost per claim for the periods presented:
| | | | | | | | | | | | | | | | | | | | | | | | | | | | | |
| | Third Quarter | | Nine Months |
| | | | | | Change | | | | | | Change |
| ($ in thousands except per claim data) | 2010 | | 2009 | | $ | | % | 2010 | | 2009 | | $ | | % |
| Cost of claims administration | $ | 750 | | | $ | 620 | | | $ | 130 | | | 21 | % | | $ | 2,146 | | | $ | 1,742 | | | $ | 404 | | | 23 | % |
| Processed claims | 111 | | | 117 | | | (6 | ) | | (5 | )% | | 315 | | | 329 | | | (14 | ) | | (4 | )% |
| Cost per claim | 6.76 | | | 5.30 | | | 1.46 | | | 28 | % | | 6.81 | | | 5.29 | | | 1.52 | | | 29 | % |
The increase in cost per claim for the three and nine months ended September 30, 2010 compared to the same prior year periods is due to less than expected claims volume during 2010 which is consistent with the decline in revenue compared to the p rior year, and resource additions in Claims Administration organization, primarily the Information Technology group. While we attempt to gain efficiency through process improvements and utilization of technology, cost per claim is impacted by variations in claim volume.
The following table sets forth a comparison of contribution margin percentage for the periods presented ending September 30:
| | | | | | | | | | | | | | | | | |
| | Third Quarter | | Nine months |
| | 2010 | | 2009 | | Change % pts | | 2010 | | 2009 | | Change % pts |
| Contribution margin percentage | 11.5 | % | | 12.6 | % | | (1.1 | )% | | 12.7 | % | | 13.3 | % | | (0.6 | )% |
Contribution margin percentage is calculated by dividing the difference between net revenues and total cost of revenues by net revenues. The factors driving the overall decline in contribution margin percentage was discussed in detail above. Our contribution margin percentage fluctuates from quarter to quarter due to changes in the prices we charge our client payors as compared to the financial terms of our provider agreements, changes in costs of our claims administration and provider development organizations and changes in the mix of services we provide and overall pricing pressures which have resulted in lower margins. There can be no assurances that we will be able to maintain contribution margin at current levels, either in absolute or in percentage terms.
Selling, General and Administrative Expenses
The following table sets forth a comparison of our selling, general and administrative (“SG&A”) expenses for the periods presented ending September 30:
| | | | | | | | | | | | | | | | | | | | | | | | | | | | | |
| | Third Quarter | | Nine Months |
| | | | | | Change | | | | | | Change |
| ($ in thousands) | 2010 | | 2009 | | $ | | % | 2010 | | 2009 | | $ | | % |
| Selling, general and administrative expenses | $ | 1,446 | | | $ | 1,980 | | | $ | (534 | ) | | (27 | )% | | $ | 4,722 | | | $ | 5,735 | | | $ | (1,013 | ) | | (18 | )% |
| Percentage of total net revenues | 9.8 | % | | 10.9 | % | | | | | | | | 10.4 | % | | 11.2 | % | | | | | | |
Selling, general and administrative (“SG&A”) expenses consist primarily of salaries and related benefits, travel costs, sal es commissions, sales materials, other marketing related expenses, costs of corporate operations, finance and accounting, human resources and other general operating expenses of the Company.
The components of selling, general and administrative expenses are as follows for the periods presented ending September 30:
| | | | | | | | | | | | | | | | | | | | | | | | | | | | | | | | | | | | | | | | | | | | |
| | Third Quarter |
| ($ in thousands) | Finance & Administration | | Sales & Marketing | | Total |
Selling, general and administrative expenses | 2010 | | 2009 | | Increase (Decrease) | | 2010 | | 2009 | | Increase (Decrease) | | 2010 | | 2009 | | Increase (Decrease) |
| Total wages, commissions, incentives and benefits | $ | 319 | | | $ | 444 | | | $ | (125 | ) | | (28 | )% | | $ | 186 | | | $ | 362 | | | $ | (176 | ) | | (49 | )% | | $ | 505 | | | $ | 806 | | | $ | (301 | ) | | (37 | )% |
| Professional fees (legal, accounting, marketing and consulting) | 167 | | | 201 | | | (34 | ) | | (17 | )% | | 59 | | | 35 | | | 24 | | | 69 | % | | 226 | | | 236 | | | (10 | ) | | (4 | )% |
| Stock-based compensation expense | 197 | | | 284 | | | (87 | ) | | (31 | )% | | — | | | — | | | — | | | nm | | | 197 | | | 284 | | | (87 | ) | | (31 | )% |
| Other | 423 | | | 354 | | | 69 | | | 19 | % | | 95 | | | 77 | | | 18 | | | 23 | % | | 518 | | | 431 | | | 87 | | | 20 | % |
| Severance | — | | | 223 | | | (223 | ) | | (100 | )% | | — | | | — | | | — | | | nm | | | — | | | 223 | | | (223 | ) | | (100 | )% |
| Total selling, general and administrative expenses | $ | 1,106 | | | $ | 1,506 | | | $ | (400 | ) | | (27 | )% | | $ | 340 | | | $ | 474 | | | $ | (134 | ) | | (28 | )% | | $ | 1,446 | | | $ | 1,980 | | | $ | (534 | ) | | (27 | )% |
The decrease in SG&A in the third quarter of 2010 compared to the same prior year period is due to the following:
| |
| • &n bsp; | Salaries, wages and benefits decreased approximately $301,000 due primarily to the departures of our former Senior Vice President of Sales and Marketing and former Chief Financial Officer during the first quarter of 2010. Also, effective July 31, 2009, we made organizational changes, which included the reorganization of our sales and marketing and client development groups. As a result, we eliminated the Vice President of Client Development position resulting in severance of approximately $223,000. In addition, charges related to our executive incentive plan, which is based on our operating results, declined by 84% when comparing the three months ended September 30, 2010 to the same prior year period; and |
| |
| • | A reduction in our stock-based compensation expense of approximately $87,000 related mainly to the forfeiture of non-vested equity incentive awards that were awarded to our former Chairman of the Board of Directors, our former Chief Fina ncial Officer, and our former Senior Vice President of Sales and Marketing. |
| |
| • | Other SG&A expense includes resource based allocations of shared services and common expenses. |
The components of selling, general and administrative expenses are as follows for the periods presented ending September 30:
| | | | | | | | | | | | | | | | | | | | | | | | | | | | | | | | | | | | | | | | | | | | |
| | Nine Months |
| ($ in thousands) | Finance & Administration | | Sales & Marketing | | Total |
Selling, general and administrative expenses | 2010 | | 2009 | | Increase (Decrease) | | 2010 | | 2009 | | Increase (Decrease) | | 2010 | | 2009 | | Increase (Decrease) |
| Total wages, commissions, incentives and benefits | $ | 1,027 | | | $ | 1,258 | | | $ | (231 | ) | | (18 | )% | | $ | 733 | | | $ | 1,301 | | | $ | (568 | ) | | (44 | )% | | $ | 1,760 | | | $ | 2,559 | | | $ | (799 | ) | | (31 | )% |
| Professional fees (legal, accounting, marketing and consulting) | 644 | | | 642 | | | 2 | | | 0 | % | | 180 | | | 164 | | | 16 | | | 10 | % | | 824 | | | 806 | | | 18 | | | 2 | % |
| Stock-based compensation expense | 476 | | | 813 | | | (337 | ) | | (41 | )% | | — | | | — | | | — | | | nm | | | 476 | | | 813 | | | (337 | ) | | (41 | )% |
| Other | 1,208 | | | 1,044 | | | 164 | | | 16 | % | | 311 | | | 290 | | | 21 | | | 7 | % | | 1,519 | | | 1,334 | | | 185 | | | 14 | % |
| Severance costs | 143 | | | 223 | | | (80 | ) | | (36 | )% | | — | | | — | | | — | | | nm | | | 143 | | | 223 | | | (80 | ) | | (36 | )% |
| Total selling, general and administrative expenses | $ | 3,498 | | | $ | 3,980 | | | $ | (482 | ) | | (12 | )% | | $ | 1,224 | | | $ | 1,755 | | | $ | (531 | ) | | (30 | )% | | $ | 4,722 | | | $ | 5,735 | | | $ | (1,013 | ) | | (18 | )% |
For the nine months ended September 30, 2010, SG&A expenses include approximately $143,000 of severance costs related to the departure of our former Chief Financial Officer in March 2010. For the nine months ended September 30, 2009, SG&A expenses include approximately $223,000 of severance costs related to the departure of our Vice President of Client Development. Excluding those costs, SG&A expenses were approximately $4.6 million and $5.5 million respectively, and declined 17% compared to the same prior year period. In addition, excluding the severance charges, SG&A expense was 10.1% of revenue for the nine months ended September 30, 2010, while with the severance charge, SG&A expense was 10.4% of revenue. Excluding the severance charges, SG&A expense was 10.7% of revenue for the nine months ended September 30, 2009, while with the severance charge, SG&A expense was 11.2% of revenue.
The decrease in SG&A (excluding the severance charge described above) for the nine months ended September 30, 2010 compared to the same prior year period is due to the following:
| |
| • | Salaries, wages and benefits decreased approximately $799,000 due primarily to the departures of our former Senior Vice President of Sales and Marketing and former Chief Financial Officer during the first quarter of 2010. Also, effe ctive July 31, 2009, we made organizational changes, which included the reorganization of our sales and marketing and client development groups. In addition, charges related to our executive incentive plan, which is based on our operating results, declined by 85% when comparing the the same prior year period; and |
| |
| • | A reduction in our stock-based compensation expense of approximately $337,000 related mainly to the forfeiture of non-vested equity incentive awards that were awarded to our former Chairman of the Board of Directors, our former Chief Financial Officer, and our former Senior Vice President of Sales and Marketing. |
| |
| • | Other SG&A expense includes resource based allocations of shared services and common expenses. |
Depreciation and Amortization
The following table sets forth a comparison of depreciation and amortization for the periods presented ending September 30:
| | | | | | | | | | | | | | | | | | | | | | | | | | | | | |
| | Third Quarter | | Change | | Nine Months | | Change |
| ($ in thousands) | 2010 | | 2009 | | $ | | % | | 2010 | | 2009 | | $ | | % |
| Depreciation | $ | 165 | | | $ | 123 | | | $ | 60 | | | 49 | % | | $ | 4 75 | | | $ | 305 | | | $ | 129 | | | 42 | % |
| Amortization | 32 | | | 32 | | | — | | | nm | | | 96 | | | 96 | | | — | | | nm | |
| Total Depreciation and amortization | $ | 197 | | | $ | 155 | | | $ | 60 | | | 39 | % | | $ | 571 | | | $ | 401 | | | $ | 129 | | | 32 | % |
The increase in depreciation expense is primarily due to increased capital expenditures during 2009 related to the continued development of our technology infrastructure and facility improvements to accommodate our increase in headcount during 2009.
Operating Income
Operating income for the three months ended September 30, 2010 and 2009 was $63,000 and $159,000, respectively. For the nine months ended September 30, 2009, operating income was $479,000 and $678,000, respectively. The decline in operating income is the result of lower claims volume and the resulting decline in revenue. The impact of the revenue decline on operating income was offset by the 27% and 18% declines in SG&A expenses for the three and nine months ended September 30, 2010, respectively, as compared to the same prior year periods.
Income Tax Provision
The effective income tax rates for the three and nine months ended September 30, 2010 and 2009 were different from the statutory United States federal income tax rate of 35% primarily due to state income taxes and permanent differences.
FINANCIAL CONDITION AND LIQUIDITY
As of September 30, 2010 the Company had working capital of $12.1 million compared to $ 11.1 million at December 31, 2009. Our cash and cash equivalents balance increased to $12.0 million as of September 30, 2010 compared to $11.9 million at December 31, 2009. The increas e in cash is primarily related to proceeds received from the exercise of equity warrants during the nine months ended September 30, 2010.
For the nine months ended September 30, 2010, operating activities provided net cash of approximately $527,000 , the primary components of which were net income of approximately $344,000, adjusted for non-cash items including: share-based compensation expense of approximately $606,000, depreciation and amortization of approximately $571,000, an unrealized gain on the warrant derivative of approximately $18,000, amortization of the warrant costs of approximately of $150,000, amort ization of the costs associated with the amendment to the contract with one of our significant clients of approximately $187,000, and a decrease in deferred taxes of approximately $193,000 , as well as, a net cash outflow from net operating assets and liabilities of approximately $1.5 million. The net cash outflow from net operating assets and liabilities was due primarily to a decline in revenue during the nine months ended September 30, 2010 as compared to prior periods, the timing of payments made to us by our clients, and the timing of provider payments made during the nine months related to cash received from claims prior to December 31, 2009.
Investing activities during the nine months ended September 30, 2010 were comprised of investments in software development of approximately $283,000 and in property and equipment of approximately $282,000. The software development costs relate primarily to enhancements of our internal billing system, while the increase in property and equipment relates primarily to investments in computer equipment.
Financing activities during the nine months ended September 30, 2010 generated cash of approximately $157,000 related to the cash exercise of Series B warrants to purchase approximately 320,000 shares of common stock. The exercise price of the warrants was $0.49 per share.
Historically, we have relied on external sources of capital, including indebtedness or issuance of equity securities, and during the past two years, earnings, to fund our operations. We believe our current cash balance of $12.0 million as of September 30, 2010 and expected future cash flows from operations will be sufficient to meet our anticipated cash needs for working capital, capital expenditures and other activities through at least the next twelve months. If operating cash flows are not sufficient to meet our needs, we believe that credit or access to capital through issuance of equity would be available to us. However, as a result of the tightening in the credit markets, low level of liquidity in many financial markets and extreme volatility in fixed income, credit, currency and equity markets, there cannot be assurances that, if necessary, we would be successful in obtaining sufficient capital financing on commercially reasonable terms or at all.
INFLATION
Inflation did not have a significant impact on the Company’s costs during the quarters ended September 30, 2010 and September 30, 2009, respectively. The Company continues to monitor the impact of inflation in order to minimize its effects through pricing strategies, productivity improvements and cost reductions.
OFF-BALANCE SHEET ARRANGEMENTS
The Company does not have any off-balance sheet arrangements as of September 30, 2010 or 2009 or for the periods then ended.
ITEM 3. Quantitative and Qualitative Disclosures About Market Risk
Not applicable.
ITEM 4. ; Controls and Procedures
Evaluation of Disclosure Controls and Procedures. Our management, with the participation of our Chief Executive Officer and Chief Financial Officer, has evaluated the effectiveness of our disclosure controls and procedures as of September 30, 2010. Based upon this evaluation, our Chief Executive Officer and Chief Financial Officer concluded that our disclosure controls and procedures (as defined in Rules 13a-15(e) and 15d-15(e) under the Securities Exchange Act of 1934, as amended (the “Exchange Act”)) are effective to ensure that information required to the disclosed by us in reports we file or submit under the Exchange Act is recorded, processed, summarized and reported within the time periods specified in the SEC’s rules and forms, and is accumulated and communicated to our management, including our Chief Executive Officer and Chief Financial Officer, as appropriate to allow timely decisions regarding required disclosures.
Changes in Internal Controls Over Financial Reporting. Our management, with the participation of our Chief Executive Officer and Chief Financial Officer, has concluded that th ere were no changes in the Company’s internal controls over financial reporting (as defined in Rules 13a-15(f) and 15d-15(f) under the Exchange Act) since the last fiscal quarter that have materially affected the Company’s internal controls over financial reporting or are reasonably likely to materially affect internal controls over financial reporting.
PART II. OTHER INFORMATION
ITEM 1A. Risk Factors
In addition to the other information set forth in this report, one should carefully consider the discussion of various risks and uncertainties contained in Part I, “Item 1A. Risk Factors” in our 2009 Annual Report on Form 10-K. We believe those risk factors are the most relevant to our business and could cause our results to differ materially from the forward-looking statements made by us. Please note, however, that those are not the only risk factors facing us. Duri ng the nine months ended September 30, 2010, one of our significant customers, accounting for 26% and 29% of our revenues during the three and nine months ended September 30, 2 010, respectively, merged with a large supplier of independent, network-based cost management solutions. The contract with the customer expires on May 21, 2011 and will automatically renew for successive one-year terms unless either party delivers written notice of non-renewal at least ninety days prior to expiration. We expect that revenue from this customer will continue to decline as its business is integrated with its acquiror, and that even if our contract were to be renewed, it would be on a limited basis. In addition, our business is also subject to the effects of changes in our provider base. Although we have very limited concentration of providers, Clinical Pathology Laboratories, Inc., one of our laboratory specialty providers in Texas, accounting for approximately 4.2% of the Company’s revenues for the nine months ended September 30, 2010 terminated its relationship with us effective June 30, 2010.
Our business, financial condition and results of operations could be seriously harmed if any of these risks or uncertainties actually occur or materialize. In that event, the market price for our common stock could decline, and our shareholders may lose all or part of their investment.
During the nine months ended September 30, 2010, President Obama signed the Patient Protection and Affordable Care Act and the Health Care and Educational Affordability Reconciliation Act legislating broad-based changes to the U.S. health care system. Among other things, the health reform legislation includes guaranteed coverage requirements, eliminates pre-existing condition exclusions and annual and lifetime maximum limits, restricts the extent to which policies can be rescinded, and imposes new and significant taxes on health insurers and health care benefits.
Provisions of the health reform legislation become effective at various dates over the next several years. The Department of Health and Human Services, the National Association of Insurance Commissioners, the Department of Labor and the Treasury Department have yet to issue necessary enabling regulations and guidance with respect to the health care reform legislation.
Due to the breadth and complexity of the health reform legislation, the lack of implementing regulations and interpretive g uidance, and the phased-in nature of the implementation, it is difficult to predict the overall impact of the health reform legislation on our business over the coming years. Possible adverse affects of the health reform legislation include reduced revenues, increased costs, exposure to expanded liability, and requirement for us to revise the ways in which we conduct business or risk of loss of business. In addition, our results of operations, our financial position, including our ability to maintain the value of our goodwill, and cash flows could be materially adversely affected.
ITEM 2. Unregistered Sales of Equity Securities and Use of Proceeds
On January 22, 2010, the Company issued 727,498 shares of common stock in connection with the cashless exercise of the remaining Series A warrants. The exercise price of the warrants was $0.40 per share.
On March 15, 2010, the Company issued 5,038 shares of its common stock related to 7,090 vested restricted stock units granted to officers of the Company in 2009. The holders of th e restricted stock units forfeited the right to acquire 2,052 share of its common stock to cover income tax withholdings related to the grant.
On August 15, 2010, the Company issued 530,198 shares of common stock in connection with the exercise of the remaining Series B warrants, whereby 320,248 shares were issued by utilizing a cash exercise and 209,950 shares were issued under a cashless exercise. The exercise price of the warrants was $0.49 per share.
The share issuances described above were not registered under the Securi ties Act of 1933, as amended (the “Securities Act”). The issuances were each exempt from registration pursuant to Section 4(2) of the Securities Act and Regulation D thereunder, as they were transactions by the issuer that did not involve public offerings of securities and involved conversions of awards to people no longer employed by the Company.
ITEM 6. Exhibits
| |
| Provider Services Agreement, dated as of August 1, 2002, by and among the Company, HealthSmart Holdings, Inc. and HealthSmar t Preferred Care II, L.P, and Amendment No. 1, 2, 3 and 4 thereto, dated September 1, 2005, January 1, 2007, July 31, 2007, and December 20, 2008, respectively. |
| Ancillary Care Services Network Access Agreement, dated as of July 2, 2007, by and between the Company and Texas True Choice, Inc. and its subsidiaries, and Amendment thereto, dated December 31, 2009. |
| Certification Pursuant to Section 302 of the Sarbanes-Oxley Act of 2002 |
| Certification Pursuant to Section 302 of the Sarbanes-Oxley Act of 2002 |
| Certifications Pursuant to 18 U.S.C. Section 1350, as adopted pursuant to Section 906 of the Sarbanes-Oxley Act of 2002 |
* Certain confidential portions of this exhibit have been omitted and filed separately with the Securities and Exchange Commission pursuant to a request for confidential treatment under Rule 24b-2 of the Securities Exchange Act of 1934.
SIGNATURES
Pursuant to the requirements of the Securities Exchange Act of 1934, the registrant has duly caused this report to be signed on its behalf by the undersigned thereunto duly authorized.
| | | |
| | | AMERICAN CARESOURCE HOLDINGS, INC. |
| | | | |
| | | By: | /s/ David S. Boone |
| | | | David S. Boone |
| | | | Chief Executive Officer (Principal Executive Officer) |
| | | |
| | | By: | /s/ Matthew D. Thompson |
| | | | Matthew D. Thompson |
| | | | Chief Financial Officer (Principal Financial Officer and Principal Accounting Officer) |
| Date: | November 12, 2010 | | |