UNITED STATES
SECURITIES AND EXCHANGE COMMISSION
Washington, D.C. 20549
FORM 10-Q
x QUARTERLY REPORT UNDER SECTION 13 OR 15(d) OF THE
SECURITIES EXCHANGE ACT OF 1934.
For the quarterly period ended September 30, 2009
OR
o TRANSITION REPORT PURSUANT TO SECTION 13 OR 15(d)
OF THE SECURITIES EXCHANGE ACT OF 1934.
Commission File Number 1-33094
AMERICAN CARESOURCE HOLDINGS, INC.
(Exact name of registrant as specified in its charter)
| DELAWARE | 20-0428568 |
| (State or other jurisdiction of | (I.R.S. employer |
| incorporation or organization) | identification no.) |
| 5429 LYNDON B. JOHNSON FREEWAY |
| SUITE 850 |
| DALLAS, TEXAS |
| 75240 |
| (Address of principal executive offices) |
| (Zip code) |
(972) 308-6830
(Registrant’s telephone number, including area code)
Indicate by check mark whether the registrant (1) has filed all reports required to be filed by Section 13 or 15(d) of the Securities Exchange Act of 1934 during the preceding 12 months (or for such shorter period that the registrant was required to file such reports), and (2) has been subject to such filing requirements for the past 90 days. Yes x No o
Indicate by check mark whether the registrant has submitted electronically and posted on its corporate Web site, if any, every Interactive Data File required to be submitted and posted pursuant to Rule 405 of Regulation S-T (§232.405 of this chapter) during the preceding 12 months (or for such shorter period that the registrant was required to submit and post such files). Yes o No o
Indicate by check mark whether the registrant is a large accelerated filer, an accelerated filer, a non-accelerated filer or a smaller reporting company. See the definitions of “accelerated filer”,” large accelerated filer” and “smaller reporting company” in Rule 12b-2 of the Exchange Act.
Large accelerated filer o | Non-accelerated filer o |
Accelerated filer o (do not check if a smaller reporting company) | Smaller Reporting Company x |
Indicated by check mark whether the registrant is a shell company (as defined in Rule 12b-2 of the Act.) Yes o No x
Indicate the number of shares outstanding of each of the issuer’s classes of common stock, as of the latest practicable date: The number of shares of common stock of registrant outstanding on November 6, 2009 was 15,432,338.
TABLE OF CONTENTS
AMERICAN CARESOURCE HOLDINGS, INC.
FORM 10-Q
FOR THE QUARTER ENDED SEPTEMBER 30, 2009
| Part I | | Financial Information | 1 |
| | Item 1. | | 1 |
| | | | 1 |
| | | | 2 |
| | | | 3 |
| | | | 4 |
| | | | 5 |
| | Item 2. | | 10 |
| | Item 3. | | 20 |
| Part II | | Other Information | 20 |
| | Item 1. | | 20 |
| | Item 2. | | 21 |
| | Item 6. | | 21 |
| | | Signatures | 22 |
| ITEM 1. | Financial Statements |
AMERICAN CARESOURCE HOLDINGS, INC.
CONSOLIDATED STATEMENTS OF INCOME
(Unaudited)
| | | Three months ended | | | Nine months ended | |
| | | September 30, | | | September 30, | |
| | | 2009 | | | 2008 | | | 2009 | | | 2008 | |
| Net revenues | | $ | 18,234,674 | | | $ | 16,110,795 | | | $ | 51,424,977 | | | $ | 40,628,998 | |
| Cost of revenues: | | | | | | | | | | | | | | | | |
| Provider payments | | | 13,799,863 | | | | 11,744,523 | | | | 38,670,094 | | | | 29,690,099 | |
| Administrative fees | | | 900,573 | | | | 927,932 | | | | 2,494,245 | | | | 2,380,627 | |
| Claims administration and provider development | | | 1,177,813 | | | | 881,897 | | | | 3,258,654 | | | | 2,395,341 | |
| Total cost of revenues | | | 15,878,249 | | | | 13,554,352 | | | | 44,422,993 | | | | 34,466,067 | |
| Contribution margin | | | 2,356,425 | | | | 2,556,443 | | | | 7,001,984 | | | | 6,162,931 | |
| | | | | | | | | | | | | | | | | |
| Selling, general and administrative expenses | | | 2,041,884 | | | | 1,488,455 | | | | 5,923,449 | | | | 3,795,813 | |
| Depreciation and amortization | | | 155,448 | | | | 105,887 | | | | 400,560 | | | | 294,559 | |
| Total operating expenses | | | 2,197,332 | | | | 1,594,342 | | | | 6,324,009 | | | | 4,090,372 | |
| Operating income | | | 159,093 | | | | 962,101 | | | | 677,975 | | | | 2,072,559 | |
| | | | | | | | | | | | | | | | | |
| Other income (expense): | | | | | | | | | | | | | | | | |
| Interest income | | | 30,729 | | | | 65,531 | | | | 107,397 | | | | 137,439 | |
| Interest expense | | | (128 | ) | | | (1,067 | ) | | | (440 | ) | | | (4,511 | ) |
| Unrealized gain (loss) on warrant derivative | | | (21,923 | ) | | | - | | | | 232,186 | | | | - | |
| Total other income, net | | | 8,678 | | | | 64,464 | | | | 339,143 | | | | 132,928 | |
| | | | | | | | | | | | | | | | | |
| Income before income taxes | | | 167,771 | | | | 1,026,565 | | | | 1,017,118 | | | | 2,205,487 | |
| Income tax provision | | | 20,555 | | | | 25,559 | | | | 57,067 | | | | 61,623 | |
| Net income | | $ | 147,216 | | | $ | 1,001,006 | | | $ | 960,051 | | | $ | 2,143,864 | |
| Earnings per common share: | | | | | | | | | | | | | | | | |
| Basic | | $ | 0.01 | | | $ | 0.07 | | | $ | 0.06 | | | $ | 0.14 | |
| Diluted | | $ | 0.01 | | | $ | 0.06 | | | $ | 0.05 | | | $ | 0.12 | |
| | | | | | | | | | | | | | | | | |
| Basic weighted average common shares outstanding | | | 15,432,338 | | | | 15,139,839 | | | | 15,425,567 | | | | 15,029,161 | |
| Diluted weighted average common shares outstanding | | | 17,572,875 | | | | 18,044,602 | | | | 17,971,805 | | | | 17,577,846 | |
| |
| CONSOLIDATED BALANCE SHEETS | |
| | |
| | | September 30, | | | | |
| | | 2009 | | | December 31, | |
| | | (Unaudited) | | | 2008 | |
| ASSETS | | | | | | |
| Current assets: | | | | | | |
| Cash and cash equivalents | | $ | 10,341,501 | | | $ | 10,577,829 | |
| Accounts receivable, net | | | 7,208,922 | | | | 5,788,457 | |
| Prepaid expenses and other current assets | | | 716,621 | | | | 489,928 | |
| Deferred income taxes | | | 5,886 | | | | 5,886 | |
| Total current assets | | | 18,272,930 | | | | 16,862,100 | |
| | | | | | | | | |
| Property and equipment, net | | | 1,691,376 | | | | 915,224 | |
| | | | | | | | | |
| Other assets: | | | | | | | | |
| Deferred income taxes | | | 243,959 | | | | 243,959 | |
| Other non-current assets | | | 775,160 | | | | 883,155 | |
| Intangible assets, net | | | 1,184,607 | | | | 1,280,656 | |
| Goodwill | | | 4,361,299 | | | | 4,361,299 | |
| | | $ | 26,529,331 | | | $ | 24,546,393 | |
| LIABILITIES AND SHAREHOLDERS' EQUITY | | | | | | | | |
| Current liabilities: | | | | | | | | |
| Due to service providers | | $ | 6,866,804 | | | $ | 5,964,392 | |
| Accounts payable and accrued liabilities | | | 2,081,439 | | | | 3,111,862 | |
| Total current liabilities | | | 8,948,243 | | | | 9,076,254 | |
| | | | | | | | | |
| Warrant derivative liability | | | 109,616 | | | | - | |
| Long-term debt | | | - | | | | 3,053 | |
| | | | | | | | | |
| Commitments and contingencies | | | | | | | | |
| | | | | | | | | |
| Shareholders' equity: | | | | | | | | |
Preferred stock, $0.01 par value; 10,000,000 shares authorized, none issued | | | - | | | | - | |
Common stock, $0.01 par value; 40,000,000 shares authorized; 15,432,338 and 15,406,972 shares issued and outstanding in 2009 and 2008, respectively | | | 154,323 | | | | 154,069 | |
| Additional paid-in capital | | | 20,148,268 | | | | 19,046,367 | |
| Accumulated deficit | | | (2,831,119 | ) | | | (3,733,350 | ) |
| Total shareholders' equity | | | 17,471,472 | | | | 15,467,086 | |
| | | $ | 26,529,331 | | | $ | 24,546,393 | |
| |
| CONSOLIDATED STATEMENT OF STOCKHOLDERS' EQUITY | |
| (Unaudited) | |
| | |
| | | | | | | | | Additional | | | | | | Total | |
| | | Common Stock | | | Paid-in | | | Accumulated | | | Stockholders' | |
| | | Shares | | | Amount | | | Capital | | | Deficit | | | Equity | |
| Balance at December 31, 2008 | | | 15,406,972 | | | $ | 154,069 | | | $ | 19,046,367 | | | $ | (3,733,350 | ) | | $ | 15,467,086 | |
Cumulative effect of change in accounting principle-January 1, 2009 reclassification of embedded feature of equity-linked financial instrument to derivative warrant liability | | | - | | | | - | | | | (316,376 | ) | | | (57,820 | ) | | | (374,196 | ) |
| Net income | | | - | | | | - | | | | - | | | | 960,051 | | | | 960,051 | |
| Stock-based compensation expense | | | - | | | | - | | | | 1,026,388 | | | | - | | | | 1,026,388 | |
Issuance of common stock upon exercise of stock options | | | 11,922 | | | | 119 | | | | (3,742 | ) | | | - | | | | (3,623 | ) |
Issuance of common stock warrants for payment of client management fees | | | - | | | | - | | | | 311,259 | | | | - | | | | 311,259 | |
Issuance of common stock upon exercise of stock warrants | | | 13,444 | | | | 135 | | | | 84,030 | | | | - | | | | 84,165 | |
| Balance at September 30, 2009 | | | 15,432,338 | | | $ | 154,323 | | | $ | 20,148,268 | | | $ | (2,831,119 | ) | | $ | 17,471,472 | |
CONSOLIDATED STATEMENTS OF CASH FLOWS
(Unaudited)
| | | Nine months ended September 30, | |
| | | 2009 | | | 2008 | |
| Cash flows from operating activities: | | | | | | |
| Net income | | $ | 960,051 | | | $ | 2,143,864 | |
| Adjustments to reconcile net income to net cash | | | | | | | | |
| provided by operations: | | | | | | | | |
| Stock-based compensation expense | | | 1,026,338 | | | | 485,568 | |
| Depreciation and amortization | | | 400,560 | | | | 294,559 | |
| Unrealized gain on warrant derivative | | | (232,186 | ) | | | - | |
| Amortization of long-term client agreement | | | 187,500 | | | | - | |
| Client administration fee expense related to warrants | | | 106,105 | | | | 54,467 | |
| Changes in operating assets and liabilities: | | | | | | | | |
| Accounts receivable | | | (1,420,465 | ) | | | (1,309,032 | ) |
| Prepaid expenses and other assets | | | (124,655 | ) | | | 205,510 | |
| Accounts payable and accrued liabilities | | | (993,256 | ) | | | 599,448 | |
| Due to service providers | | | 902,413 | | | | 1,733,044 | |
| Net cash provided by operating activities | | | 812,405 | | | | 4,207,428 | |
| | | | | | | | | |
| Cash flows from investing activities: | | | | | | | | |
| Redemption of certificate of deposit | | | - | | | | 145,000 | |
| Investment in software development costs | | | (464,194 | ) | | | (351,605 | ) |
| Additions to property and equipment | | | (592,544 | ) | | | (258,065 | ) |
| Net cash used in investing activities | | | (1,056,738 | ) | | | (464,670 | ) |
| | | | | | | | | |
| Cash flows from financing activities: | | | | | | | | |
| Payments on long-term debt | | | (7,355 | ) | | | (89,369 | ) |
| Proceeds from exercise of stock warrants | | | 12,650 | | | | 127,428 | |
| Proceeds from exercise of stock options | | | 2,710 | | | | 168,033 | |
| Net cash provided by financing activities | | | 8,005 | | | | 206,092 | |
| | | | | | | | | |
| Net increase (decrease) in cash and cash equivalents | | | (236,328 | ) | | | 3,948,850 | |
| Cash and cash equivalents at beginning of period | | | 10,577,829 | | | | 4,272,498 | |
| | | | | | | | | |
| Cash and cash equivalents at end of period | | $ | 10,341,501 | | | $ | 8,221,348 | |
| | | | | | | | | |
| Supplemental non-cash activity: | | | | | | | | |
| Warrants issued as payment of client administrative fees | | $ | 311,259 | | | $ | 161,311 | |
NOTES TO UNAUDITED CONSOLIDATED FINANCIAL STATEMENTS
(Unaudited)
(tables in thousands, except per share data)
| (1) | Description of Business and Basis of Presentation |
American CareSource Holdings, Inc. (“ACS,” “Company,” the “Registrant,” “we,” “us,” or “our,”) is an ancillary benefits management company that offers cost effective access to a comprehensive national network of ancillary healthcare service providers. The Company’s healthcare payor customers, which include preferred provider organizations (“PPOs”), third party administrators (“TPAs”), insurance companies, large self-funded organizations and Taft-Hartley union plans (i.e., employee benefit plans that are self-administered under collective bargaining agreements), engage the Company to provide them with a complete outsourced solution designed to manage each customer’s obligations to its covered persons. The Company offers its customers this solution by:
| | providing payor customers with a comprehensive network of ancillary healthcare services providers that is tailored to each payor customer’s specific needs and is available to each payor customer’s covered persons for covered services; |
| | providing payor customers with claims management, reporting, and processing and payment services; |
| | performing network/needs analysis to assess the benefits to payor customers of adding additional/different service providers to the payor customer-specific provider networks; and |
| | credentialing network service providers for inclusion in the payor customer-specific provider networks. |
ACS was incorporated in Delaware in 2003 as a wholly-owned subsidiary of Patient Infosystems, Inc. (“Patient Infosystems”) in order to facilitate Patient Infosystems’ acquisition of substantially all of the assets of American CareSource Corporation. American CareSource Corporation had been in operation since 1997, and its predecessor company, Physician’s Referral Network, had been in operation since 1995. In December 2005, Patient Infosystems distributed substantially all of its shares of the Company to its then-current stockholders through a dividend, and since that time ACS has been an independent, publicly-traded company.
The accompanying unaudited condensed consolidated financial statements have been prepared in accordance with accounting principles generally accepted in the United States (“GAAP”) interim reporting requirements of Form 10-Q and Rule 8-03 of Regulation S-X of the rules and regulations of the Securities and Exchange Commission (“SEC”). Consequently, financial information and disclosures normally included in financial statements prepared annually in accordance with GAAP have been condensed or omitted. Balance sheet amounts are as of September 30, 2009 and December 31, 2008 and operating result amounts are for the three and nine months ended September 30, 2009 and 2008, and include all normal and recurring adjustments that we consider necessary for the fair, summarized presentation of our financial position and operating results. As these are condensed financial statements, readers of this report should, therefore, refer to the consolidated financial statements and the notes included in our Annual Report on Form 10-K for the fiscal year ended December 31, 2008, filed with the SEC on March 31, 2009.
The Company uses the “management approach” for reporting information about segments in annual and interim financial statements. The management approach is based on the way the chief operating decision-maker organizes segments within a company for making operating decisions and assessing performance. Reportable segments are based on products and services, geography, legal structure, management structure and any other manner in which management disaggregates a company. Based on the “management approach” model, the Company has determined that its business is comprised of a single operating segment.
Our interim results of operations are not necessarily indicative of results of operations that will be realized for the full fiscal year.
The Company recognizes revenue on the services that it provides, which includes (i) providing payor clients with a comprehensive network of ancillary healthcare providers, (ii) providing claims management, reporting, processing and payment services, (iii) providing network/need analysis to assess the benefits to payor clients of adding what additional/different service providers to the client-specific provider networks and (iv) providing credentialing of network services providers for inclusion in the client payor-specific provider networks. Revenue is recognized when services are delivered, which occurs after processed claims are billed to the client payors and collections are reasonably assured. The Company estimates revenues and costs of revenues using average historical collection rates and average historical margins earned on claims. Periodically, revenues are adjusted to reflect actual cash collections so that revenues recognized accurately reflect cash collected.
The Company determines whether it is acting as a principal or agent in the fulfillment of the services rendered. After careful evaluation of the key gross and net revenue recognition indicators, the Company acknowledges that while the determination of gross versus net reporting is highly judgmental in nature, the Company has concluded that its circumstances are most consistent with those key indicators that support gross revenue reporting.
Following are the key indicators that support the Company’s conclusion that it acts as a principal when settling claims for service providers through its contracted service provider network:
| | The Company is the primary obligor in the arrangement . The Company has assessed its role as primary obligor as a strong indicator of gross reporting. The Company believes that it is the primary obligor in its transactions because it is responsible for providing the services desired by its client payors. The Company has distinct, separately negotiated contractual relationships with its client payors and with the ancillary health care providers in its networks. The Company does not negotiate “on behalf of” its client payors and does not hold itself out as the agent of the client payors when negotiating the terms of the Company’s ancillary healthcare service provider agreements. The Company’s agreements contractually prohibit client payors and service providers to enter into direct contractual relationships with one another. The client payors have no control over the terms of the Company’s agreements with the service providers. In executing transactions, the Company assumes key performance-related risks. The client payors hold the Company responsible for fulfillment, as the provider, of all of the services the client payors are entitled to under their contracts; client payors do not look to the service providers for fulfillment. In addition, the Company bears the pricing/margin risk as the principal in the transactions. Because the contracts with the client payors and service providers are separately negotiated, the Company has complete discretion in negotiating both the prices it charges its client payors and the financial terms of its agreements with the service providers. Since the Company’s profit is the spread between the amounts received from the client payors and the amount paid to the service providers, it bears significant pricing/margin risk. There is no guaranteed mark-up payable to the Company on the amount the Company has contracted. Thus, the Company bears the risk that amounts paid to the service provider will be greater than the amounts received from the client payors, resulting in a loss or negative claim. |
| | The Company has latitude in establishing pricing . As stated above, the Company has complete latitude in negotiating the price to be paid to the Company by each client payor and the price to be paid to each contracted service provider. This type of pricing latitude indicates that the Company has the risks and rewards normally attributed to a principal in the transactions. |
| | The Company changes the product or performs part of the services . The Company provides the benefits associated with the relationships it builds with the client payors and the services providers. While the parties could deal with each other directly, the client payors would not have the benefit of the Company’s experience and expertise in assembling a comprehensive network of service providers, in claims management, reporting and processing and payment services, in performing network/needs analysis to assess the benefits to client payors of adding additional/different service providers to the client payor-specific provider networks, and in credentialing network service providers. |
| | The Company has discretion in supplier selection . The Company has complete discretion in supplier selection. One of the key factors considered by client payors who engage the Company is to have the Company undertake the responsibility for identifying, qualifying, contracting with and managing the relationships with the ancillary healthcare service providers. As part of the contractual arrangement between the Company and its client payors, the payors identify their obligations to their respective covered persons and then work with the Company to determine the types of ancillary healthcare services required in order for the payors to meet their obligations. The Company may select the providers and contract with them to provide services at its discretion. |
| | The Company is involved in the determination of product or service specifications . The Company works with its client payors to determine the types of ancillary healthcare services required in order for the payors to meet their obligations to their respective covered persons. In some respects, the Company is customizing the product through its efforts and ability to assemble a comprehensive network of providers for its customers that is tailored to each client payor’s specific needs. In addition, as part of its claims processing and payment services, the Company works with the client payors, on the one hand, and the providers, on the other, to set claims review, management and payment specifications. |
| | The supplier (and not the Company) has credit risk . The Company believes it has some level of credit risk, but that risk is mitigated because the Company does not remit payment to providers unless and until it has received payment from the relevant client payors following the Company’s processing of a claim. |
| | The amount that the Company earns is not fixed . The Company does not earn a fixed amount per transaction nor does it realize a per person per month charge for its services. |
The Company has evaluated the other indicators of gross and net revenue recognition, including whether or not the Company has general inventory risk. The Company does not have any general inventory risk, as its business is not related to the manufacture, purchase or delivery of goods and it does not purchase in advance any of the services to be provided by the ancillary healthcare service providers. While the absence of this risk would be one indicator in support of net revenue reporting, as described in detail above, the Company has carefully evaluated all of the key gross and net revenue recognition indicators and has concluded that its circumstances are most consistent with those key indicators that support gross revenue reporting.
If the Company were to report its revenues net of provider payments rather than on a gross reporting basis, for the three and nine months ended September 30, 2009, its net revenues would have been approximately $4.5 million and $12.9 million, respectively. For the three and nine months ended September 30, 2008, its net revenues would have been approximately $4.4 million and $10.9 million, respectively.
| | | | | | Periods ended September 30, 2009 | | | | | | Periods ended September 30, 2008 | |
| | | As of September | | | | | | | | | | | | | | | As of September | | | | | | | | | | | | | |
| | | 30, 2009 | | | Three months | | | Nine months | | | 30, 2008 | | | Three months | | | Nine months | |
| | | Accounts | | | | | | % of Total | | | | | | % of Total | | | Accounts | | | | | | % of Total | | | | | | % of Total | |
| | | receivable | | | Revenue | | | Revenues | | | Revenue | | | Revenues | | | receivable | | | Revenue | | | Revenues | | | Revenue | | | Revenues | |
| Customer A | | $ | 3,257 | | | $ | 8,910 | | | | 49 | % | | $ | 25,827 | | | | 50 | % | | $ | 2,803 | | | $ | 9,419 | | | | 58 | % | | $ | 24,366 | | | | 60 | % |
| Customer B | | | 2,870 | | | | 6,417 | | | | 35 | % | | | 19,714 | | | | 38 | % | | | 1,998 | | | | 6,265 | | | | 39 | % | | | 15,305 | | | | 38 | % |
| Others | | | 1,145 | | | | 2,908 | | | | 16 | % | | | 5,884 | | | | 12 | % | | | 159 | | | | 427 | | | | 3 | % | | | 958 | | | | 2 | % |
| | | $ | 7,272 | | | $ | 18,235 | | | | 100 | % | | $ | 51,425 | | | | 100 | % | | $ | 4,960 | | | $ | 16,111 | | | | 100 | % | | $ | 40,629 | | | | 100 | % |
The following table details the reconciliation of basic earnings per share to diluted earnings per share (amounts in thousands except per share amounts):
| | | Three months ended | | | Nine months ended | |
| | | September 30, | | | September 30, | |
| | | 2009 | | | 2008 | | | 2009 | | | 2008 | |
| Numerator for basic and diluted earnings per share: | | | | | | | | | | | | |
| Net income | | $ | 147 | | | $ | 1,001 | | | $ | 960 | | | $ | 2,144 | |
| Denominator: | | | | | | | | | | | | | | | | |
| | | | | | | | | | | | | | | | | |
| Weighted-average basic common shares outstanding | | | 15,432 | | | | 15,140 | | | | 15,425 | | | | 15,029 | |
| Assumed conversion of dilutive securities: | | | | | | | | | | | | | | | | |
| Stock options | | | 545 | | | | 1,158 | | | | 829 | | | | 941 | |
| Warrants | | | 1,595 | | | | 1,747 | | | | 1,716 | | | | 1,608 | |
| Restricted Stock Units | | | - | | | | - | | | | 2 | | | | - | |
| Potentially dilutive common shares | | | 2,140 | | | | 2,905 | | | | 2,547 | | | | 2,549 | |
| | | | | | | | | | | | | | | | | |
| Denominator for diluted earnings | | | | | | | | | | | | | | | | |
| per share - Adjusted weighted - average shares | | | 17,572 | | | | 18,045 | | | | 17,972 | | | | 17,578 | |
| Earnings per common share: | | | | | | | | | | | | | | | | |
| Basic | | $ | 0.01 | | | $ | 0.07 | | | $ | 0.06 | | | $ | 0.14 | |
| Diluted | | $ | 0.01 | | | $ | 0.06 | | | $ | 0.05 | | | $ | 0.12 | |
| (4) | Significant Client Agreements |
On December 31, 2008, we entered into an amendment (the “Amendment”) to our Provider Service Agreement with one of our significant clients. The purpose of the Amendment is, among other things, to facilitate and accelerate the integration into the Company’s business model of one of the client’s affiliates, adjust the administrative fees outlined in the previous amendment, define and clarify the exclusivity and levels of cooperation contemplated by the previous amendments, and extend the partnership between the Company and the client and the duration of their Provider Service Agreement to December 31, 2012. Under a strategic contracting plan that the Amendment requires the parties to develop, the Company will be the exclusive outsourced ancillary contracting and network management provider for the client’s group health clients and any third party administrators (TPAs).
As part of the Amendment, the Company agreed to pay to the client $1,000,000 for costs incurred in connection with the integration of and access to the Company’s network by members of the affiliate’s network, including, but not limited to, costs associated with salaries, benefits, and third party contracts. The payment was made in April 2009. The Company will continue to pay an administrative fee to the client designed to reimburse and compensate for the work that it is required to perform to support the Company’s program. The Company recognized the $1,000,000 fee as a prepaid expense which is being amortized over the term of the agreement. During the three and nine months ended September 30, 2009, we recorded amortization related to the agreement of $62,500 and $187,500, respectively. At September 30, 2009, $250,000 was classified as a current asset on the consolidated balance sheet representing the amount to be amortized during the subsequent twelve-month period. The remaining $562,500 balance was classified as a long-term other asset at September 30, 2009.
In September 2008, additional accounting guidance was issued relating to determining whether an instrument (or embedded feature) is indexed to entity’s own stock. The guidance mandates a two-step process for evaluating whether an equity-linked financial instrument or embedded feature is indexed to the entity’s own stock. Warrants to purchase 109,095 shares of common stock issued by the Company contain a strike price adjustment feature, which upon adoption, resulted in the instruments no longer being considered indexed to the Company’s own stock. Accordingly, adoption changed the current classification (from equity to liability) and the related accounting for these warrants outstanding as of January 1, 2009. As of that date, we reclassified the warrants, based on a fair value of $3.43 per warrant, as calculated using the Black–Scholes–Merton valuation model. During the nine months ended September 30, 2009, the liability was adjusted for warrants exercised and the change in fair value of the warrants. A liability of $109,616 related to the stock warrants is included as a warrant derivative liability in our consolidated balance sheet as of September 30, 2009. During the three and nine months ended September 30, 2009, we recorded an unrealized loss on warrant derivative of $21,923 and an unrealized gain on warrant derivative of $232,186, respectively, related to the change in fair value of the warrants.
Effective May 21, 2007, the Company signed an Ancillary Care Services Network Access Agreement (“the agreement”) with Texas True Choice, Inc. (“TTC”). As partial compensation under the agreement, the Company issued to an affiliate of TTC, warrants to purchase a total of 225,000 shares of the Company’s common stock at an exercise price of $1.84, the closing price of our stock on May 21, 2007. As of September 30, 2009, 75%, or warrant to purchase 168,750 shares had vested with the remaining 25% vesting in May 2010. According to the agreement, TTC must provide two years notice in the event of termination. Since the measurement date for the fourth and final tranche of warrants had been reached as of June 30, 2009, we recorded the fair value of 25% of the warrants, or warrant to acquire 56,250 shares, which were recorded as other non-current assets and will be amortized over the related contract period. The total fair value of the fourth tranche of warrants was $311,259, which was recorded based on the Black-Scholes-Merton method.
The Company is required to disclose the fair value measurements The warrant derivative liability recorded at fair value in the balance sheet as of September 30, 2009 is categorized based upon the level of judgment associated with the inputs used to measure their fair value. Hierarchical levels, are directly related to the amount of subjectivity associated with the inputs to fair valuation of these liabilities is as follows:
Level 1 — Inputs are unadjusted, quoted prices in active markets for identical assets or liabilities at the measurement date;
Level 2 — Inputs other than Level 1 inputs that are either directly or indirectly observable; and
Level 3 — Unobservable inputs, for which little or no market data exist, therefore requiring an entity to develop its own assumptions.
The following table summarizes the financial liabilities measured at fair value on a recurring basis as of September 30, 2009, segregated by the level of the valuation inputs within the fair value hierarchy utilized to measure fair value (amounts in thousands):
| | | Total | | | Quoted prices in active markets for identical assets (Level 1) | | | Significant other observable inputs (Level 2) | | | Significant unobservable inputs (Level 3) | |
| Warrant derivative liability | | $ | 110 | | | $ | — | | | $ | — | | | $ | 110 | |
Equity-linked financial instruments consist of stock warrants issued by the Company that contain a strike price adjustment feature, as described in Note 5 in the Notes to the Consolidated Financial Statements. We calculated the fair value of the warrants using the Black–Scholes–Merton valuation model. During the three and nine months ended September 30, 2009, we recognized an unrealized loss of $21,923 and an unrealized gain of $232,186, respectively, related to the change in the fair value of the warrant derivative liability.
The assumptions used in the Black-Scholes-Merton valuation model were as follows:
| | | January 1, | | | September 30, | |
| | | 2009 | | | 2009 | |
| Fair value | | $ | 3.43 | | | $ | 1.10 | |
| Expected volatility | | | 73.4 | % | | | 70.1 | % |
| Expected life (years) | | | 2.13 | | | | 1.41 | |
| Risk free interest rate | | | 0.8 | % | | | 0.7 | % |
| Forfeiture rate | | | — | | | | — | |
| Dividend rate | | | — | | | | — | |
The following table reflects the activity for liabilities measured at fair value using Level 3 inputs for the nine months ended September 30, 2009 (amounts in thousands):
| Initial recognition of warrant derivative as of January 1, 2009 | | $ | 374 | |
| Sales of warrant derivative | | | (32 | ) |
| Unrealized gains related to the change in fair value | | | (232 | ) |
| Balance as of September 30, 2009 | | $ | 110 | |
In addition, the Company’s financial instruments consist primarily of cash and cash equivalents, accounts receivable, accounts payable and accrued expenses. The fair value of instruments is determined by reference to various market data and other valuation techniques, as appropriate. Unless otherwise disclosed, the fair value of short-term financial instruments approximates their recorded values due to the short-term nature of the instruments.
| (7) | Recent Accounting Pronouncements |
Effective July 2009, the FASB Accounting Standards Codification (“ASC”), also known collectively as the “Codification,” is considered the single source of authoritative U.S. accounting and reporting standards, except for additional authoritative rules and interpretive releases issued by the SEC. Non-authoritative guidance and literature would include, among other things, FASB Concepts Statements, American Institute of Certified Public Accountants Issue Papers and Technical Practice Aids and accounting textbooks. The Codification was developed to organize GAAP pronouncements by topic so that users can more easily access authoritative accounting guidance. It is organized by topic, subtopic, section, and paragraph, each of which is identified by a numerical designation. This statement applies beginning in third quarter 2009. All accounting references have been updated, and therefore SFAS references have been removed.
We evaluate events and transactions that occur after the balance sheet date as potential subsequent events. We performed this evaluation through November 9, 2009, the date on which we issued our financial statements. No events occurred as of that date that required disclosure.
FORWARD-LOOKING STATEMENTS
This document contains forward-looking statements within the meaning of Section 27A of the Securities Act of 1933, as amended, and Section 21E of the Securities Exchange Act of 1934, as amended. These statements can be identified by forward-looking words such as “may,” “will,” “expect,” “intend”, “anticipate,” “believe,” “estimate” and “continue” or similar words and discuss the Company’s plans and objectives for future operations, including its services, contain projections of the Company’s future operating results or financial condition, and discuss its expectations with respect to the growth in health care costs in the United States, the demand for ancillary benefits management services, and the Company’s competitive advantages, or contain other “forward-looking” information.
Such forward-looking statements are based on current information, assumptions and belief of management, and are not guarantees of future performance. Substantial risks and uncertainties could cause actual results to differ materially from those indicated by such forward-looking statements, including, but not limited to, changes in national health care policy, regulation, and/or reimbursement, general economic conditions (including the recent economic downturns and increases in unemployment), lower than anticipated demand for ancillary services, pricing, market acceptance/preference, the Company’s ability to integrate with its clients, consolidation in the industry that may affect the Company’s key clients, changes in the business decisions by significant clients, increased competition, the Company’s inability to attract or maintain providers or clients or achieve its financial results, the Company’s inability to manage growth, implementation and performance difficulties, and other risk factors detailed from time to time in the Company’s periodic filings with the Securities and Exchange Commission, including its Annual Report on Form 10-K for the year ended December 31, 2008 and the quarterly reports on Form 10-Q filed for each of the subsequent quarters.
Do not place undue reliance on these forward-looking statements, which speak only as of the date this document was prepared. All forward-looking statements included herein are expressly qualified in their entirety by the cautionary statements contained or referred to in this section. Except to the extent required by applicable securities laws and regulations, the Company undertakes no obligation to update or revise these forward-looking statements to reflect events or circumstances after the date of this document or to reflect the occurrence of unanticipated events.
| Management’s Discussion and Analysis of Financial Condition and Results of Operations |
GENERAL
Management’s discussion and analysis provides a review of the Company’s operating results for the three and nine months ended September 30, 2009 and its financial condition at September 30, 2009. The focus of this review is on the underlying business reasons for significant changes and trends affecting the revenues, net income and financial condition of the Company. This review should be read in conjunction with the accompanying unaudited consolidated financial statements and the audited consolidated financial statements and the notes thereto included in our Annual Report on Form 10-K for the year ended December 31, 2008.
OVERVIEW
American CareSource Holdings, Inc. (the “Company”, “ACS”, “we”, “us”, or “our”) is an ancillary benefits management company that offers cost effective access to a comprehensive national network of ancillary healthcare service providers. The Company’s healthcare payor customers, which include preferred provider organizations (“PPOs”), third party administrators (“TPAs”), insurance companies, large self-funded organizations and Taft-Hartley union plans (i.e., employee benefit plans that are self-administered under collective bargaining agreements), engage the Company to provide them with a complete outsourced solution designed to manage each customer’s obligations to its covered persons. The Company offers its customers this solution by:
| | · | providing payor customers with a comprehensive network of ancillary healthcare services providers that is tailored to each payor customer’s specific needs and is available to each payor customer’s covered persons for covered services; |
| | · | providing payor customers with claims management, reporting, and processing and payment services; |
| | · | performing network/needs analysis to assess the benefits to payor customers of adding additional/different service providers to the payor customer-specific provider networks; and |
| | · | credentialing network service providers for inclusion in the payor customer-specific provider networks. |
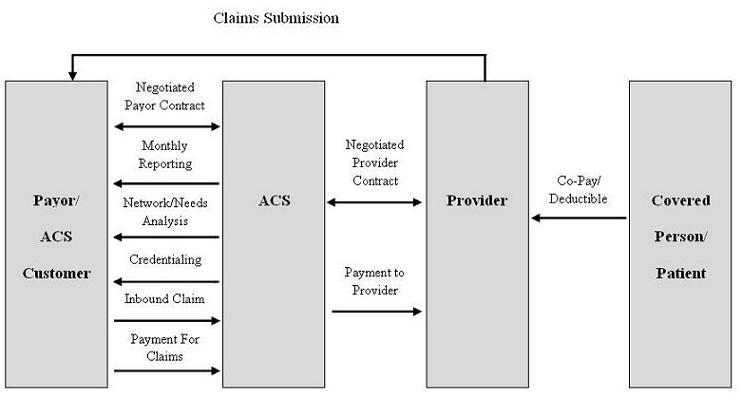
The Company’s business model, illustrating the relationships among the persons involved, directly or indirectly, in the Company’s business and its generation of revenue and expenses is depicted below:
Our clients route healthcare claims to us after service has been performed by participant providers in our network. We process those claims and charge the client/payor according to its contractual rate for the services according to our contract with the client/payor. In processing the claim, we are paid directly by the client or the insurer for the service. We then pay the provider of service according to its independently-negotiated contractual rate. We assume the risk of generating positive margin, the difference between the payment we receive for the service and the amount we are obligated to pay the provider of service.
The Company recognizes revenues for ancillary healthcare services when services by providers have been authorized and performed, the claim has been billed to the payor and collections from payors are reasonably assured. Cost of revenues for ancillary healthcare services consist of amounts due to providers for providing ancillary health care services, client administration fees paid to our client payors to reimburse them for routing the claims to us for processing, and the Company’s related direct labor and overhead of processing invoices, collections and payments. The Company is not liable for costs incurred by independent contract service providers until payment is received by us from the payors. The Company recognizes actual or estimated liabilities to independent contract service providers as the related revenues are recognized.
The Company markets its products to preferred provider organizations (“PPOs”), third party administrators (“TPAs”), insurance companies, large self-funded organizations and Taft-Hartley union plans, such as employee benefit plans that are self-administered under collective bargaining agreements.
The Company is seeking continuing growth in the number of client payor and service provider relationships by focusing on providing in-network services for its payors and aggressively pursuing additional PPOs, TPAs and other direct payors as its primary sales target. The Company believes that this strategy should increase the volume of claims the Company can process in addition to the expansion in the number of lives that are eligible to receive ancillary health care benefits. No assurances can be given that the Company can expand its service provider or payor relationships, nor that any such expansion will result in an improvement in the results of operations of the Company.
Although the Company has continued to experience revenue growth from 2008 to 2009, its financial condition has been impacted by the current economic crisis. First, the unemployment rate has caused fewer people to participate in insurance programs with our customers. Second, plan participants, seeking to spend less money, appear to be making less frequent use of some ancillary services. Third, the possibility exists that client and, or provider consolidation within our industry could adversely affect our business. To the extent that these trends continue, or become worse, we may receive less revenue and our profitability and growth could be adversely affected, depending on the extent of the declines. Finally, as with any business, the deterioration of the financial condition or sale or change of control of our significant customers (with two customers accounting for in excess of 84% and 88% of our revenue during the three and nine months ended September 30, 2009, respectively) could have a corresponding adverse effect on us. Additional risks that we do not consider material, or of which we are not currently aware, may also have an adverse impact on us.
CRITICAL ACCOUNTING POLICIES AND ESTIMATES
Management’s discussion and analysis of our financial condition and results of operations is based upon our condensed consolidated financial statements. These condensed consolidated financial statements have been prepared following the requirements of accounting principles generally accepted in the United States (“GAAP”) for interim periods and require us to make estimates and judgments that affect the reported amounts of assets, liabilities, revenues and expenses, and related disclosure of contingent assets and liabilities. On an ongoing basis, we evaluate our estimates, including those related to revenue recognition, provider cost recognition, the resulting contribution margins, amortization and potential impairment of intangible assets and goodwill and stock-based compensation expense. As these are condensed consolidated financial statements, you should also read expanded information about our critical accounting policies and estimates provided in Item 7, “Management’s Discussion and Analysis of Financial Condition and Results of Operations” under the heading “Critical Accounting Policies,” included in our Annual Report on Form 10-K for the year ended December 31, 2008. There have been no material changes to our critical accounting policies and estimates from the information provided in our Form 10-K for the year ended December 31, 2008.
ANALYSIS OF RESULTS OF OPERATIONS
Revenues
The following table sets forth a comparison of our revenues for the periods presented ended September 30:
| | | Third Quarter | | | Nine Months | |
| | | | | | | | | Change | | | | | | | | | Change | |
| ($ in thousands) | | 2009 | | | 2008 | | | $ | | | % | | | 2009 | | | 2008 | | | $ | | | % | |
| Net revenues | | $ | 18,235 | | | $ | 16,111 | | | $ | 2,124 | | | | 13 | % | | $ | 51,425 | | | $ | 40,629 | | | $ | 10,796 | | | | 27 | % |
The Company’s net revenues are generated from ancillary healthcare service claims. Revenue is recognized when we bill our client payors for services performed. The increase in revenue for the three and nine months ended September 30, 2009 as compared to the same periods in 2008 was due primarily to the progression of our client relationships, which allowed the Company access to a greater number of payors and allowed us to benefit from the external growth and expansion of our clients. In addition, revenues were positively impacted by growth in our ancillary service provider network.
During the three months and nine months ended September 30, 2009, revenues from seven clients (one of which is an affiliate of one of our two existing significant customers), all added in 2008 increased over the same prior year periods by $1.5 million and $3.2 million, respectively, which was due to the progression and development of our client relationships, resulting in an increased number of payors and increased claims volume. Clients added during 2009 contributed an incremental $2.1 million and $3.2 million for the three and nine months ended September 30, 2009. The increases are a direct result of a concentrated effort to diversify our revenue base. For the three and nine months ended September 30, 2009, our two significant customers accounted for 84% and 88%, respectively, as compared to 97% and 98% for the same periods in 2008, respectively.
The increase in revenues in the third quarter of 2009 from clients added in 2008 and 2009, was offset by a decline in revenues from our legacy clients (those added in 2007 or earlier) of $1.5 million, or 10%. The decrease was attributable primarily to reductions in revenue from our two largest customers, which were impacted by macro-economic factors, as previously discussed. Revenues from those same clients added in 2007 and prior increased $4.4 million, or 11%, for the nine months ended September 30, 2009 compared to the prior year period.
The following table details revenues generated by clients and the periods in which those clients were added for the periods presented ended September 30 (amounts in thousands):
| Year of implementation | | 2007 and prior | | | 2008 | | | 2009 | | | Total | |
| Third quarter 2009 | | $ | 14,355 | | | $ | 1,754 | | | $ | 2,126 | | | $ | 18,235 | |
| Third quarter 2008 | | | 15,886 | | | | 225 | | | | - | | | | 16,111 | |
| | | | | | | | | | | | | | | | | |
| Nine months 2009 | | $ | 44,747 | | | $ | 3,478 | | | $ | 3,200 | | | $ | 51,425 | |
| Nine months 2008 | | | 40,395 | | | | 234 | | | | - | | | | 40,629 | |
In addition, during the three and nine months ended September 30, 2009, the number of billed claims increased by 29% and 42%, respectively, compared to the same prior year periods. The increase in claim volume was driven by the expansion of existing client relationships, new clients implemented during the first nine months of 2009 as well as through expansion of our network of service providers.
Revenue per claim declined for the periods presented due to lower than estimated collection rates related to our new client relationships, limited benefits offered by certain recently implemented clients and the change in mix of provider specialties driving our claim volume during the first nine months of 2009. In particular, we have experienced accelerated growth in categories such as laboratory services with lower average revenue per claim while other higher average revenue per claim categories such as dialysis services have not grown as rapidly. The decline was offset somewhat by an increase in claims from the diagnostic imaging services category. Revenues from the diagnostic imaging services increased as a percent of total revenue for the third quarter 2009 as compared to the same prior year period as a result of our expanding relationship with a third-party which manages and maintains a national imaging network. Revenue per claim can vary significantly depending upon factors including the types of services consumed by clients members, the quantity of services delivered, client negotiated pricing, provider negotiated service rates, the rate of collections based upon the client and members financial responsibility and other factors. The following table provides information with respect to claims processed, claims billed and the associated revenue per claim metrics for the periods ended September 30:
| | | Three months ended | | | Nine months ended | |
| | | 2009 | | | 2008 | | | 2009 | | | 2008 | |
| Claims processed (in thousands) | | | 117 | | | | 87 | | | | 329 | | | | 220 | |
| Claims billed (in thousands) | | | 101 | | | | 78 | | | | 282 | | | | 198 | |
| | | | | | | | | | | | | | | | | |
| Revenue per processed claim | | $ | 156 | | | $ | 185 | | | $ | 156 | | | $ | 185 | |
| Revenue per billed claim | | | 181 | | | | 207 | | | | 182 | | | | 205 | |
The following table sets forth a comparison of the components of our cost of revenues, for the three months ended September 30:
| | | Third Quarter | |
| | | | | | | | | | | | | | | Change | |
| | | | | | % of | | | | | | % of | | | | | | | |
| ($ in thousands) | | 2009 | | | revenues | | | 2008 | | | revenues | | | $ | | | % | |
| Provider payments | | $ | 13,800 | | | | 75.7 | % | | $ | 11,744 | | | | 72.9 | % | | $ | 2,056 | | | | 17.5 | % |
| Administrative fees | | | 900 | | | | 4.9 | | | | 928 | | | | 5.8 | | | | (28 | ) | | | (3.0 | ) |
Claims administration and provider development | | | 1,178 | | | | 6.5 | | | | 882 | | | | 5.5 | | | | 296 | | | | 33.6 | |
| Total cost of revenues | | $ | 15,878 | | | | 87.1 | % | | $ | 13,554 | | | | 84.2 | % | | $ | 2,324 | | | | 17.1 | % |
The following table sets forth a comparison of the components of our cost of revenues, for the nine months ended September 30:
| | | Nine Months | |
| | | | | | | | | | | | | | | Change | |
| | | | | | % of | | | | | | % of | | | | | | | |
| ($ in thousands) | | 2009 | | | revenues | | | 2008 | | | revenues | | | $ | | | % | |
| Provider payments | | $ | 38,670 | | | | 75.2 | % | | $ | 26,690 | | | | 73.1 | % | | $ | 11,980 | | | | 44.9 | % |
| Administrative fees | | | 2,495 | | | | 4.9 | | | | 2,381 | | | | 5.9 | | | | 114 | | | | 4.8 | |
| | | | | | | | | | | | | | | | | | | | | | | | | |
Claims administration and provider development | | | 3,258 | | | | 6.3 | | | | 2,395 | | | | 5.9 | | | | 863 | | | | 36.0 | |
| Total cost of revenues | | $ | 44,423 | | | | 86.4 | % | | $ | 31,466 | | | | 77.4 | % | | $ | 12,957 | | | | 41.1 | % |
Cost of revenues is comprised of payments to our providers, administrative fees paid to our client payors for converting claims to electronic data interchange and routing them to both the Company for processing and to their payors for payment, and the costs of our claims administration and provider development organizations. Payments to providers is the largest component of our cost of revenues and it consists of our payments for ancillary care services in accordance with contracts negotiated separately with providers for specific ancillary services.
In the third quarter of 2009, cost of revenues related to payments to providers increased as compared to the third quarter of 2008 as a result of increased claims volume and increased revenues, and the fluctuation in the mix of types of services provided by the Company. Payments made to providers as a percent of net revenues were 75.7% during the third quarter of 2009 and 72.9% during the same period in 2008. Provider payments as a percent of revenues increased due primarily to lower margins in our laboratory services, dialysis services and infusion services specialties. These category margins were impacted by the execution of new provider agreements, pricing for associated services on recently implemented and existing client contracts, the mix of services delivered in each category, the mix of providers delivering the services and overall pricing pressures which have resulted in lower client rates.
Further, in the third quarter of 2009, administrative fees increased due to increased claim volume as a result of expanded relationships with existing clients as well as increased services provided to recently implemented clients. Administrative fees paid to clients as a percent of net revenues were 4.9% during the third quarter of 2009 and 5.8% during the same period in 2008. The decrease in administrative fees as a percent of net revenues was due to a shift in revenues to clients that carry lower contracted administrative fee rates.
During the nine months ended September 30, 2009, provider payments were 75.2% of revenues, compared to 73.1% for the same prior year period. Provider payments as a percent of revenues increased due primarily to lower margins in our dialysis and infusion services specialties, offset by improvements in margins in our laboratory and diagnostic imaging specialties. These category margins were impacted by the execution of new provider agreements, pricing for associated services on recently implemented and existing client contracts, the mix of services delivered in each category, the mix of providers delivering the services and overall pricing pressures which have resulted in lower client rates.
Further, during the first nine months of 2009, administrative fees increased due to increased claim volume as a result of expanded relationships with existing clients as well as recently implemented clients. Administrative fees paid to clients as a percent of net revenues were 4.9% during the first nine months of 2009 and 5.9% during the same period in 2008. The decrease in administrative fees as a percent of net revenues was due to a shift in revenues to clients that carry lower contracted administrative fee rates.
The detail of the costs of our claims administration and provider development organizations are as follows for the periods presented ending September 30 (amounts in thousands):
| | | Third Quarter | |
| | | Claims Administration | | | Provider Development | | | Total | |
| | | | | | | | | Increase | | | | | | | | | Increase | | | | | | | | | Increase | |
| | | 2009 | | | 2008 | | | (Decrease) | | | 2009 | | | 2008 | | | (Decrease) | | | 2009 | | | 2008 | | | (Decrease) | |
| Total wages, incentives and benefits | | $ | 602 | | | $ | 471 | | | $ | 131 | | | | 28 | % | | $ | 409 | | | $ | 222 | | | $ | 187 | | | | 84 | % | | $ | 1,011 | | | $ | 693 | | | $ | 318 | | | | 46 | % |
| Contract labor and consulting fees | | | 142 | | | | 194 | | | | (52 | ) | | | -27 | % | | | 24 | | | | 3 | | | | 21 | | | | nm | % | | | 166 | | | | 197 | | | | (31 | ) | | | (16) | % |
| Capitalized development costs | | | (135 | ) | | | (68 | ) | | | (67 | ) | | | 99 | % | | | - | | | | - | | | | - | | | | 0 | % | | | (135 | ) | | | (68 | ) | | | (67 | ) | | | 98 | % |
| Other | | | 37 | | | | 2 | | | | 35 | | | | nm | % | | | 22 | | | | 9 | | | | 13 | | | | 144 | % | | | 59 | | | | 11 | | | | 48 | | | | 436 | % |
| Allocation of shared overheads | | | (35 | ) | | | (19 | ) | | | (16 | ) | | | 84 | % | | | 112 | | | | 68 | | | | 44 | | | | 65 | % | | | 77 | | | | 49 | | | | 28 | | | | 57 | % |
| | | $ | 611 | | | $ | 580 | | | $ | 31 | | | | 5 | % | | $ | 567 | | | $ | 302 | | | $ | 265 | | | | 88 | % | | $ | 1,178 | | | $ | 882 | | | $ | 296 | | | | 34 | % |
The increase in costs during the second quarter of 2009 as compared to the same prior year period is due primarily to the following:
| | · | Investments in our claims administration and provider development organizations. Wages, incentives and benefits increased due to resource additions. Headcount as of September 30, 2009 and 2008 were as follows: Operations -- 20 and 15, respectively; Information Technology -- 10 and 8, respectively; and Provider Development -- 13 and 11, respectively. The increases in headcount were made to facilitate growth through the enhancement of our network of ancillary care providers, and to grow our claims processing and management capabilities consistent with growth in claims volume; |
| | · | We incurred incremental costs in our provider development organization; consultants were hired which assisted us in improving the integrity of our provider data, creating mechanisms to manage provider credentialing to facilitate greater quality in our network and supplementing our provider data; and |
| | · | The aforementioned cost increases were offset by a decrease in consulting fees related to an information technology initiative in which a platform was developed to create data analysis efficiencies. The fees were primarily incurred during the second and third quarters of 2008. |
The detail of the costs of our claims administration and provider development organizations are as follows for the periods presented ending September 30 (amounts in thousands):
| | | Nine Months | |
| | | Claims Administration | | | Provider Development | | | Total | |
| | | | | | | | | Increase | | | | | | | | | Increase | | | | | | | | | Increase | |
| | | 2009 | | | 2008 | | | (Decrease) | | | 2009 | | | 2008 | | | (Decrease) | | | 2009 | | | 2008 | | | (Decrease) | |
| Total wages, incentives and benefits | | $ | 1,744 | | | $ | 1,298 | | | $ | 446 | | | | 34 | % | | $ | 1,089 | | | $ | 596 | | | $ | 493 | | | | 83 | % | | $ | 2,834 | | | $ | 1,894 | | | $ | 940 | | | | 50 | % |
| Contract labor and consulting fees | | | 431 | | | | 540 | | | | (109 | ) | | | -20 | % | | | 27 | | | | 13 | | | | 14 | | | | 107 | % | | | 458 | | | | 553 | | | | (95 | ) | | | (17) | % |
| Capitalized development costs | | | (464 | ) | | | (352 | ) | | | (112 | ) | | | 32 | % | | | - | | | | - | | | | - | | | | 0 | % | | | (464 | ) | | | (352 | ) | | | (112 | ) | | | 32 | % |
| Other | | | 100 | | | | 60 | | | | 40 | | | | 66 | % | | | 116 | | | | 15 | | | | 101 | | | | 673 | % | | | 216 | | | | 75 | | | | 141 | | | | 188 | % |
| Allocation of shared overheads | | | (84 | ) | | | 46 | | | | (130 | ) | | | 283 | % | | | 299 | | | | 179 | | | | 120 | | | | 67 | % | | | 215 | | | | 225 | | | | (10 | ) | | | 4 | % |
| | | $ | 1,727 | | | $ | 1,592 | | | $ | 135 | | | | 8 | % | | $ | 1,531 | | | $ | 803 | | | $ | 728 | | | | 91 | % | | $ | 3,258 | | | $ | 2,395 | | | $ | 863 | | | | 36 | % |
The increase in costs during the nine months ended September 30, 2009 as compared to the same prior year period is due primarily to the following:
| | · | Investments in our claims administration and provider development organizations. Wages, incentives and benefits increased due to resource additions as described above; |
| | · | The utilization of consultants by our provider development organization which assisted us in improving the integrity of our provider data, creating mechanisms to manage provider credentialing to facilitate greater quality in our network and supplementing our provider data; and |
| | · | The aforementioned cost increases were offset by a decrease in consulting fees related to an information technology initiative in which a platform was developed to create data analysis efficiencies. The fees were primarily incurred during the second and third quarters of 2008. |
The following table sets forth a comparison of contribution margin percentage for the periods presented ending September 30:
| | | Second Quarter | | | Nine months | |
| | | | | | | | | Change | | | | | | | | | Change | |
| | | 2009 | | | 2008 | | | % pts | | | 2009 | | | 2008 | | | % pts | |
| Contribution margin percentage | | | 12.9 | % | | | 15.9 | % | | | (3.0) | % | | | 13.6 | % | | | 15.2 | % | | | (1.6) | % |
Contribution margin percentage is calculated by dividing the difference between net revenues and total cost of revenues by net revenues. The contribution margin was impacted by changes in its components for the three and nine month periods as follows: Provider payments – declines of 2.2% and 1.8%, respectively; administrative fees – increases of 0.9% and 1.0%, respectively; and cost of claims administration and provider development – declines of 1.5% and 0.7%, respectively. The overall decline in contribution margin percentage was discussed in detail in the preceding comments. Our contribution margin percentage fluctuates from quarter to quarter due to changes in the prices we charge our client payors as compared to the financial terms of our provider agreements, changes in costs of our claims administration and provider development organizations and changes in the mix of services we provide. There can be no assurances that we will be able to maintain contribution margin at current levels, either in absolute or in percentage terms.
Selling, General and Administrative Expenses
The following table sets forth a comparison of our selling, general and administrative (“SG&A”) expenses for the three months ended September 30:
| | | Third Quarter | | | Nine Months | |
| | | | | | | | | Change | | | | | | | | | Change | |
| ($ in thousands) | | 2009 | | | 2008 | | | $ | | | % | | | 2009 | | | 2008 | | | $ | | | % | |
Selling, general and administrative expenses | | $ | 2,042 | | | $ | 1,488 | | | $ | 554 | | | | 37 | % | | $ | 5,923 | | | $ | 3,796 | | | $ | 2,127 | | | | 56 | % |
| Percentage of total net revenues | | | 11.2 | % | | | 9.2 | % | | | | | | | | | | | 11.5 | % | | | 9.3 | % | | | | | | | | |
Selling, general and administrative (“SG&A”) expenses consist primarily of salaries and related benefits, travel costs, sales commissions, sales materials, other marketing related expenses, costs of corporate operations, finance and accounting, human resources and other general operating expenses of the Company.
Selling, general and administrative expenses represent the following costs for the periods presented ending September 30 (amounts in thousands):
| | | Third Quarter | |
| | | Finance & Administration | | | Sales & Marketing | | | Total | |
Selling, general and administrative expenses | | 2009 | | | 2008 | | | Increase (Decrease) | | | 2009 | | | 2008 | | | Increase (Decrease) | | | 2009 | | | 2008 | | | Increase (Decrease) | |
Total wages, commissions, incentives and benefits | | $ | 441 | | | $ | 464 | | | $ | (23 | ) | | | (5) | % | | $ | 362 | | | $ | 182 | | | $ | 180 | | | | 99 | % | | $ | 803 | | | $ | 646 | | | $ | 157 | | | | 24 | % |
Professional fees (legal, accounting and consulting) | | | 201 | | | | 125 | | | | 76 | | | | 61 | % | | | 5 | | | | 19 | | | | (14 | ) | | | (74) | % | | | 206 | | | | 144 | | | | 62 | | | | 43 | % |
| Stock-based compensation expense | | | 283 | | | | 169 | | | | 114 | | | | 67 | % | | | - | | | | - | | | | - | | | | 0 | % | | | 283 | | | | 169 | | | | 114 | | | | 67 | % |
| Investor relations costs | | | 73 | | | | 24 | | | | 49 | | | | 204 | % | | | - | | | | - | | | | - | | | | 0 | % | | | 73 | | | | 24 | | | | 49 | | | | 204 | % |
| Recruiting costs | | | 11 | | | | 169 | | | | (158 | ) | | | (93) | % | | | - | | | | - | | | | - | | | | 0 | % | | | 11 | | | | 169 | | | | (158 | ) | | | -93 | % |
| Marketing costs | | | - | | | | - | | | | - | | | | 0 | % | | | 92 | | | | 5 | | | | 87 | | | | nm | % | | | 92 | | | | 5 | | | | 87 | | | | nm | % |
| Banking fees | | | 46 | | | | 28 | | | | 18 | | | | 64 | % | | | - | | | | - | | | | - | | | | 0 | % | | | 46 | | | | 28 | | | | 18 | | | | 64 | % |
| Other | | | 78 | | | | 100 | | | | (22 | ) | | | (22) | % | | | 21 | | | | 11 | | | | 10 | | | | 91 | % | | | 99 | | | | 111 | | | | (12 | ) | | | (11) | % |
| Allocation of shared overheads | | | 145 | | | | 159 | | | | (14 | ) | | | -9 | % | | | 61 | | | | 33 | | | | 28 | | | | 85 | % | | | 206 | | | | 192 | | | | 14 | | | | 7 | % |
| Restructuring charge | | | | | | | | | | | | | | | | | | | | | | | | | | | | | | | | | | | 223 | | | | — | | | | 223 | | | | 100 | % |
Total selling, general and administrative expenses | | $ | 1,278 | | | $ | 1,238 | | | $ | 40 | | | | 3 | % | | $ | 541 | | | $ | 250 | | | $ | 291 | | | | 116 | % | | $ | 2,042 | | | $ | 1,488 | | | $ | 554 | | | | 37 | % |
The increase in SG&A, reflected in the above table is related to the following:
| | · | Increased headcount in our sales and marketing group. Wages, commissions, incentives and benefits during the second quarter of 2009 reflect the addition of five resources. These resources were added during late-2008 and the first quarter of 2009. Headcount as of September 30, 2009 and 2008 were as follows: Finance & Administration – 10 and 8, respectively; and Sales & Marketing – 7 and 5, respectively. |
| | · | Increased compensation costs related to our stock-based incentive plans. The increase in these costs are the direct result of the increase in the fair value of our common stock (as calculated under the Black-Scholes-Merton valuation model) which is directly related to the increase in the value of our common stock. As a result, stock-based awards made in late-2008 and early-2009 had higher associated costs than those awarded during the same prior year periods. |
| | · | Increased professional fees. During the three months ended September 30, 2009, fees for our audit-related activities increased over the same prior year period and we implemented an enhanced compensation plan for our Board of Directors. |
| | · | Marketing costs included $62,500 of amortization of the amendment of our client agreement with one of our significant clients. The $1 million payment is being amortized over a four-year period, which is the term of the amended agreement. |
| | · | The increases were offset by a decline in recruiting costs of $158,000. During the third quarter 2008, we incurred significant costs associated with increasing our headcount to support strategic initiatives. |
In addition, during the three months ended September 30, 2009 we made organizational changes to bring our internal cost structure in line with expected levels of revenue while reorganizing our functional groups to ensure that we capitalize on certain market opportunities. We eliminated approximately six positions, including our Vice President of Client Development and other administrative personnel.
In connection with the reorganization, we incurred certain charges in the third quarter of 2009. Those charges, which are primarily comprised of employee severance costs and related fringe benefits, totaled approximately $223,357. The majority of the payments will be made by December 31, 2009. For the three months ended September 30, 2009, SG&A, excluding the restructuring charge, as a percent of revenues was 9.9%.
Selling, general and administrative expenses represent the following costs for the nine months ended September 30 (amounts in thousands):
| | | Nine Months | |
| | | Finance & Administration | | | Sales & Marketing | | | Total | |
| Selling, general and administrative expenses | | 2009 | | | 2008 | | | Increase (Decrease) | | | 2009 | | | 2008 | | | Increase (Decrease) | | | 2009 | | | 2008 | | | Increase (Decrease) | |
Total wages, commissions, incentives and benefits | | $ | 1,253 | | | $ | 1,192 | | | $ | 61 | | | | 5 | % | | $ | 1,300 | | | $ | 418 | | | $ | 882 | | | | 211 | % | | $ | 2,553 | | | $ | 1,610 | | | $ | 943 | | | | 59 | % |
Professional fees (legal, accounting and consulting) | | | 643 | | | | 438 | | | | 205 | | | | 47 | % | | | 105 | | | | 37 | | | | 68 | | | | 184 | % | | | 748 | | | | 475 | | | | 273 | | | | 57 | % |
Stock-based compensation expense | | | 812 | | | | 485 | | | | 327 | | | | 67 | % | | | - | | | | - | | | | - | | | | 0 | % | | | 812 | | | | 485 | | | | 327 | | | | 67 | % |
Investor relations costs | | | 209 | | | | 86 | | | | 123 | | | | 143 | % | | | - | | | | - | | | | - | | | | 0 | % | | | 209 | | | | 86 | | | | 123 | | | | 143 | % |
Recruiting costs | | | 76 | | | | 251 | | | | (175 | ) | | | -70 | % | | | - | | | | - | | | | - | | | | 0 | % | | | 76 | | | | 251 | | | | (175 | ) | | | -70 | % |
Marketing costs | | | - | | | | - | | | | - | | | | 0 | % | | | 247 | | | | 18 | | | | 229 | | | | nm | % | | | 247 | | | | 18 | | | | 229 | | | | nm | % |
Banking fees | | | 120 | | | | 86 | | | | 34 | | | | 40 | % | | | - | | | | - | | | | - | | | | 0 | % | | | 120 | | | | 86 | | | | 34 | | | | 40 | % |
Other | | | 246 | | | | 242 | | | | 4 | | | | 2 | % | | | 103 | | | | 32 | | | | 71 | | | | 222 | % | | | 349 | | | | 274 | | | | 75 | | | | 27 | % |
Allocation of shared overheads | | | 385 | | | | 432 | | | | (47 | ) | | | -11 | % | | | 201 | | | | 79 | | | | 122 | | | | 154 | % | | | 586 | | | | 511 | | | | 75 | | | | 15 | % |
| Restructuring charge | | | | | | | | | | | | | | | | | | | | | | | | | | | | | | | | | | | 223 | | | | — | | | | 223 | | | | 100 | % |
Total selling, general and administrative expenses | | $ | 3,744 | | | $ | 3,212 | | | $ | 532 | | | | 17 | % | | $ | 1,956 | | | $ | 584 | | | $ | 1,372 | | | | 235 | % | | $ | 5,923 | | | $ | 3,796 | | | $ | 2,127 | | | | 56 | % |
The increase in SG&A, reflected in the above table is related to the following:
| | · | Increased headcount in our sales and marketing group. Wages, commissions, incentives and benefits during the nine months ended September 30, 2009 reflect the addition of resources as described above; |
| | · | Increased compensation costs related to our stock-based incentive plans. The increase in these costs are the direct result of the increase in the fair value of our common stock (as calculated under the Black-Scholes-Merton valuation model) which is directly related to the increase in the value of our common stock. As a result, stock-based awards made in late-2008 and early-2009 had higher associated costs than those awarded during the same prior year periods. |
| | · | Increased professional fees. During the nine months ended September 30, 2009, fees for our audit-related activities increased over the same prior year period, we implemented an enhanced compensation plan for our Board of Directors and we incurred costs related to strategic marketing initiatives related to branding and product identification. We do not anticipate our consulting costs to continue at these levels during the remainder of 2009 as we incurred a disproportionate amount of costs during the nine months ended September 30, 2009. |
| | · | Marketing costs included $187,500 of amortization of the amendment of our client agreement with one of our significant clients. The $1 million payment is being amortized over a four-year period, which is the term of the amended agreement. |
| | · | Other costs increased primarily due to increased travel expenses related to client and investor relations activities during the first nine months of 2009 compared to the same prior year period and a one-time payment of $75,000 paid to one of our executive officers for relocation costs. |
In addition, as described above, we incurred a restructuring charge of $223,357 during the three months ended September 30, 2009. For the nine months ended September 30, 2009, SG&A, excluding the restructuring charge, as a percent of revenues was 11.1%.
Unrealized Gain (Loss) on Warrant Derivative
During the three and nine months ended September, 30, 2009, we had unrealized losses of $21,923 and unrealized gains of $232,186, respectively, related to warrants accounted for under the liability method. In September 2008, the Financial Accounting Standards Board (“FASB”) ratified EITF 07-5. The Company uses a two-step process for evaluating whether an equity-linked financial instrument or embedded feature is indexed to the entity’s own stock. Warrants to purchase 109,095 shares of common stock issued by the Company contain a strike price adjustment feature, which results in the instruments no longer being considered indexed to the Company’s own stock and required the Company to record these warrants under the liability accounting method. Accordingly, on January 1, 2009, the Company adopted current accounting guidance that changed the current classification (from equity to liability) and the related accounting for these warrants. As of that date, we reclassified the warrants, based on a fair value of $3.43 per warrant, as calculated using the Black–Scholes–Merton valuation model. During the first nine months of 2009, the liability was adjusted for warrants exercised and the change in fair value of the warrants. A liability of $109,616 related to the stock warrants is included as a warrant derivative liability in our consolidated balance sheet as of September 30, 2009. The unrealized gain on the warrant derivative reflects the change in fair value of the warrants.
Depreciation and Amortization
The following table sets forth a comparison of depreciation and amortization for the periods presented ending September 30:
| | | Third Quarter | | | Change | | | Nine Months | | | Change | |
| ($ in thousands) | | 2009 | | | 2008 | | | $ | | | % | | | 2009 | | | 2008 | | | $ | | | % | |
| Depreciation | | $ | 123 | | | $ | 53 | | | $ | 70 | | | | 132 % | | | $ | 305 | | | $ | 135 | | | $ | 170 | | | | 126 | % |
| Amortization | | | 32 | | | | 53 | | | | (21 | ) | | | (40 | )% | | | 96 | | | | 160 | | | | (64 | ) | | | (40 | )% |
| Total Depreciation | | | | | | | | | | | | | | | | | | | | | | | | | | | | | | | | |
| and amortization | | $ | 155 | | | $ | 106 | | | $ | 49 | | | | 46 | % | | $ | 401 | | | $ | 295 | | | $ | 106 | | | | 36 | % |
Amortization of intangibles consists of amortization of $32,000 of the capitalized value of provider contracts that were acquired in the 2003 acquisition of the assets of our predecessor, American CareSource Corporation by Patient Infosystems (now CareGuide, Inc.), our former parent corporation. Amortization in the third quarter and the nine months ended September 30, 2008 included amortization of approximately $21,000 and $63,000, respectively, related to the value assigned to software as part of the aforementioned transaction. The balance became fully amortized as of December 31, 2008.
The increase in depreciation expense is due to increased capital expenditures (primarily internally developed software) during 2008 and the nine months ended September 30, 2009 due to new capabilities and functionality within our internal systems.
Income Tax Provision
For the three months ended September 30, 2009 and 2008, a provision for income taxes of $20,555 and $25,559, respectively, was recorded. For the nine months ended September 30, 2009 and 2008, a provision for income taxes of $57,067 and $61,623, respectively, was recorded. The provision for the aforementioned periods represents our estimated margin tax liability in the State of Texas. Because we continue to believe that we should maintain our valuation allowance on our net operating loss carryforward, which was approximately $5.0 million at December 31, 2008, and any federal taxes related to our current year income would be offset by the net operating loss carryforward,. we have no federal income tax provision for the three and nine months ended September 30, 2009.
FINANCIAL CONDITION AND LIQUIDITY
As of September 30, 2009, the Company had working capital of $9.3 million compared to $7.8 million at December 31, 2008. Our cash and cash equivalents balance decreased to $10.3 million as of September 30, 2009 compared to $10.6 million at December 31, 2008. The decrease in cash is primarily related to the $1 million payment made to one of our significant customers as required by the amendment of our agreement with that client. The decrease was offset by cash generated from operations.
For the nine months ended September 30, 2009, operating activities provided net cash of approximately $812,405, the primary components of which were net income of approximately $960,000, adjusted for non-cash items including: share-based compensation expense of approximately $1.0 million, depreciation and amortization of approximately $401,000, an unrealized gain on the warrant derivative of approximately $232,000, and amortization of the warrant costs of approximately of $106,000 and amortization of the costs associated with the amendment to the contract with one of our significant clients of $187,500, as well as, a net cash outflow from net operating assets and liabilities of approximately $1.6 million, compared to the corresponding prior year quarter. The net cash outflow from net operating assets and liabilities was due primarily to the previously mentioned $1 million payment made to one of our significant clients and the timing of collection of claims paid to us by our clients and payments made by us to the service providers in our network.
Investing activities during the nine months ended September 30, 2009 were comprised of investments in software development costs of approximately $464,000 and in property and equipment of approximately $593,000. The software development costs relate primarily to enhancements to our internal billing system, while the increase in property and equipment relates primarily to investments in computer equipment and leasehold improvements made to our expanded lease space to accommodate continued growth and increased headcount.
Historically, we have relied on external sources of capital, including indebtedness or issuance of equity securities to fund our operations. We believe our current cash balance of $10.3 million as of September 30, 2009 and expected future cash flows from operations will be sufficient to meet our anticipated cash needs for working capital, capital expenditures and other activities through at least the next twelve months. If operating cash flows are not sufficient to meet our needs, we believe that credit or access to capital through issuance of equity would be available to us. However, as a result of the tightening in the credit markets, low level of liquidity in many financial markets and extreme volatility in fixed income, credit, currency and equity markets, there can be assurances that, if necessary, we would be successful in obtaining sufficient capital financing on commercially reasonable terms or at all.
INFLATION
Inflation did not have a significant impact on the Company’s costs during the quarters ended September 30, 2009 and September 30, 2008, respectively. The Company continues to monitor the impact of inflation in order to minimize its effects through pricing strategies, productivity improvements and cost reductions.
OFF-BALANCE SHEET ARRANGEMENTS
The Company does not have any off-balance sheet arrangements as of September 30, 2009 or 2008 or for the periods then ended.
| Evaluation of Disclosure Controls and Procedures |
Evaluation of Disclosure Controls and Procedures . Our management, with the participation of our Chief Executive Officer and Chief Financial Officer, has evaluated the effectiveness of our disclosure controls and procedures as of September 30, 2009. Based upon this evaluation, our Chief Executive Officer and Chief Financial Officer concluded that our disclosure controls and procedures (as defined in Rules 13a-15(e) and 15d-15(e) under the Securities Exchange Act of 1934, as amended (the “Exchange Act”)) are effective to ensure that information required to the disclosed by us in reports we file or submit under the Exchange Act is recorded, processed, summarized and reported within the time periods specified in the SEC’s rules and forms, and is accumulated and communicated to our management, including our Chief Executive Officer and Chief Financial Officer, as appropriate to allow timely decisions regarding required disclosures.
Changes in Internal Controls Over Financial Reporting . Our management, with the participation of our Chief Executive Officer and Chief Financial Officer, has concluded that there were no changes in the Company’s internal controls over financial reporting (as defined in Rules 13a-15(f) and 15d-15(f) under the Exchange Act) since the last fiscal quarter that have materially affected the Company’s internal controls over financial reporting or are reasonably likely to materially affect internal controls over financial reporting, including any corrective actions with regard to significant deficiencies and material weaknesses.
In addition to the other information set forth in this report, one should carefully consider the discussion of various risks and uncertainties contained in Part I, “Item 1A. Risk Factors” in our 2008 Annual Report on Form 10-K. We believe those risk factors are the most relevant to our business and could cause our results to differ materially from the forward-looking statements made by us. Please note, however, that those are not the only risk factors facing us. During the nine months ended September 30, 2009, one of our significant customers, accounting for 35% of our revenues during the three months ended September 30, 2009, entered into a merger agreement with a large supplier of independent, network-based cost management solutions. We will seek to continue our existing relationship with the resulting organization, but we cannot assume that our position with our customer will not be affected. In addition, our business is also subject to the effects of changes in our provider base. Although we have very limited concentration of providers, Quest Diagnostics, Inc., one of our laboratory specialty providers, accounting for approximately 6% of our revenues during the nine months ended September 30, 2009, recently terminated its relationship with us.
Our business, financial condition and results of operations could be seriously harmed if any of these risks or uncertainties actually occur or materialize. In that event, the market price for our common stock could decline, and our shareholders may lose all or part of their investment. During the three months ended September 30, 2009, there were no material changes in the information regarding risk factors contained in our Annual Report on Form 10-K for the year ended December 31, 2008.
| Unregistered Sales of Equity Securities and Use of Proceeds |
On January 20, 2009, the Company issued an aggregate of 7,144 shares of its common stock in connection with an exercise by an accredited investor of restricted warrants to purchase an aggregate of 7,144 shares for an aggregate exercise price of $39,292, which was received in December 2008.
On April 21, 2009, the Company issued 1,863 shares of its common stock in connection with a cashless exercise by an accredited investor of restricted warrants to purchase an aggregate of 2,000 shares. The Holder of the warrant forfeited the right to acquire 137 shares of its common stock under the warrant as consideration for this cashless exercise.
On May 7, 2009, the Company issued 1,864 shares of its common stock in connection with a cashless exercise by an accredited investor of restricted warrants to purchase an aggregate of 2,000 shares. The Holder of the warrant forfeited the right to acquire 136 shares of its common stock under the warrant as consideration for this cashless exercise.
On May 21, 2009, the Company issued an aggregate of 2,300 shares of its common stock in connection with an exercise by an accredited investor of restricted warrants to purchase an aggregate of 2,300 shares for an aggregate exercise price of $12,650.
This share issuances described above were each not registered under the Securities Act of 1933, as amended (the “Securities Act”). The issuance were each exempt from registration pursuant to Section 4(2) of the Securities Act and Regulation D thereunder, as it was a transaction by the issuer that did not involve public offerings of securities and involved a sale made to an accredited investor.
| Exhibit 31.1 | Certification Pursuant to Section 302 of the Sarbanes-Oxley Act of 2002 |
| Exhibit 31.2 | Certification Pursuant to Section 302 of the Sarbanes-Oxley Act of 2002 |
| Exhibit 32.1 | Certifications Pursuant to 18 U.S.C. Section 1350, as adopted pursuant to Section 906 of the Sarbanes-Oxley Act of 2002 |
Pursuant to the requirements of the Securities Exchange Act of 1934, the registrant has duly caused this report to be signed on its behalf by the undersigned thereunto duly authorized.
| | AMERICAN CARESOURCE HOLDINGS, INC. | |
| | | | |
| | By: | /s/ David S. Boone | |
| | | David S. Boone | |
| | | President and Chief Executive Officer (principal executive officer and an authorized signatory) |
| | | | |
| | | | |
| | By: | /s/ Steven J. Armond | |
| | | Steven J. Armond | |
| | | Chief Financial Officer (principal financial officer and an authorized signatory) |
| | | | |
| | | | |
| | By: | /s/ Matthew D. Thompson | |
| | | Matthew D. Thompson | |
| | | Controller (principal accounting officer and an authorized signatory) |
| | | | |
Date: November 9, 2009