UNITED STATES
SECURITIES AND EXCHANGE COMMISSION
Washington, D.C. 20549
FORM N-CSR
CERTIFIED SHAREHOLDER REPORT OF REGISTERED
MANAGEMENT INVESTMENT COMPANIES
| Investment Company Act file number | 811-21714 | |
| MML Series Investment Fund II |
| (Exact name of registrant as specified in charter) |
| 100 Bright Meadow Blvd., Enfield, CT 06082 | |
| (Address of principal executive offices) | (Zip code) |
| Paul LaPiana |
| 100 Bright Meadow Blvd., Enfield, CT 06082 |
| (Name and address of agent for service) |
| Registrant's telephone number, including area code: | (860) 562-1000 | |
| Date of fiscal year end: | 12/31/2020 | |
| | | |
| Date of reporting period: | 12/31/2020 | |
Item 1. Reports to Stockholders.

This material must be preceded or accompanied by a current prospectus (or summary prospectus, if available) for the MML Series Investment Fund II. Investors should consider a Fund’s investment objective, risks, and charges and expenses carefully before investing. This and other information about the investment company is available in the prospectus (or summary prospectus, if available). Read it carefully before investing.
[THIS PAGE INTENTIONALLY LEFT BLANK]
MML Series Investment Fund II – President’s Letter to Shareholders (Unaudited) |
To Our Shareholders

Paul LaPiana
“We encourage you to maintain perspective when it comes to retirement investing, despite short-term changes in the markets or day-to-day events that may seem unsettling. MassMutual’s view is that changing market conditions have the potential to reward patient investors.”
December 31, 2020
Markets advanced despite pandemic challenges
I am pleased to present you with the MML Series Investment Fund II Annual Report, covering the year ended December 31, 2020 (the “fiscal year”). U.S. stocks were up over 18% for the reporting period, despite the global economic recession brought on by the COVID-19 pandemic, as investors looked past rising coronavirus case levels and responded positively to the global rollout of vaccinations, additional global fiscal stimulus, and a post-Brexit trade agreement between the U.K. and European Union. (“Brexit” – an abbreviation for “British exit” – refers to the United Kingdom’s withdrawal from the European Union.) A swift response to the pandemic by the Federal Reserve Board and Congress delivered unprecedented monetary and fiscal stimulus to support the U.S. economy and financial markets. The global response was similar in speed and magnitude. U.S. bond investors enjoyed positive returns in a falling yield environment, fueled by lower economic growth expectations, interest rate decreases, and supportive central bank policy.
Despite the ongoing challenges that investors face, it’s important to keep in mind that market conditions are cyclical and subject to change anytime. In MassMutual’s view, the market environment that ensued from the pandemic (with stocks largely selling off and then, for the most part, recovering) underscores the importance of maintaining a long-term perspective and avoiding reacting to current events. That’s why we continue to believe that retirement investors should create and maintain a plan that focuses on their goals, how long they have to invest, and how comfortable they are with market volatility.
Suggestions for retirement investors under any market conditions
● | You are likely in it for the long run. Investing for retirement doesn’t happen overnight. Most people save and invest for retirement throughout their working years. Although the financial markets will go up and down over time, taking a long-term approach to investing gives you more time to ride out the downturns as you work toward your retirement income goals. |
● | Keep contributing. While it’s impossible to control how your investments perform, you can control how often and how much you save. Saving as much as possible and increasing your contributions regularly is one way smart retirement investors can help boost their retirement savings, regardless of the investment environment.* |
● | Invest continually. Financial professionals often advise their clients to stay in the market, regardless of short-term results. Here’s why: Individuals who can invest in all market conditions have the potential to be rewarded even during market downturns, when more favorable prices may enable them to accumulate larger positions. This has the potential to put them at an advantage when the markets turn around. |
● | Monitor your asset allocation and diversify. Stocks, bonds, and short-term/money market investments are asset classes that tend to behave differently, depending upon the economic and market environment. Those broad asset classes contain an even greater array of asset sub-categories (such as small-cap stocks, international stocks, and high-yield bonds). Most financial professionals agree that investors can take advantage of different opportunities in the market and reduce the risk of over-exposure to one or two poorly performing asset types by selecting a number of investments that represent a mix of asset classes and sub-categories.* |
*Systematic investing and asset allocation do not ensure a profit or protect against loss in a declining market. Systematic investing involves continuous investment in securities regardless of fluctuating price levels. Investors should consider their ability to continue investing through periods of low price levels.
(Continued)
1
MML Series Investment Fund II – President’s Letter to Shareholders (Unaudited) (Continued) |
If you work with a financial professional, you may wish to consider checking in with him or her to help you determine if:
● | you are saving enough for retirement; |
● | your retirement account is invested properly for all market conditions, based on your goals and objectives, as well as your investment time horizon; and |
● | you are taking the right steps to help reduce your longevity risk, which is the chance that you could “run out” of retirement savings during your lifetime. |
We live mutual, every day
MassMutual believes that humanity brings out the best in one another. That’s why, for nearly 170 years, through ups and downs and good times and bad, we have continually believed that we are stronger when we rely on one another. That’s also why we encourage you to maintain perspective when it comes to retirement investing, despite short-term changes in the markets or day-to-day events that may seem unsettling. MassMutual’s view is that changing market conditions have the potential to reward patient investors. Thank you for your continued confidence and trust in MassMutual.
Sincerely,

Paul LaPiana, CFP®
President
© 2021 Massachusetts Mutual Life Insurance Company (MassMutual®), Springfield, MA 01111-0001. All rights reserved. www.MassMutual.com Underwriter: MML Distributors, LLC (MMLD) Member FINRA and SIPC (www.FINRA.org and www.SIPC.org), 1295 State Street, Springfield, MA 01111. MMLD is a wholly owned subsidiary of MassMutual. Investment advisory services provided to the Funds by MML Investment Advisers, LLC (MML Advisers), a wholly owned subsidiary of MassMutual. The information provided is the opinion of MML Advisers as of 1/1/21 and is subject to change without notice. It is not to be construed as tax, legal, or investment advice. Of course, past performance does not guarantee future results.
2
MML Series Investment Fund II – Economic and Market Overview (Unaudited) |
December 31, 2020
Market Highlights
● | For the reporting period from January 1, 2020 through December 31, 2020, U.S. stocks were up over 18%, despite the global economic recession brought on by the COVID-19 pandemic. |
● | The first quarter of 2020 was one of the most difficult quarters on record for the markets. COVID-19 fears turned to reality as “social distancing,” shuttered businesses, and the associated lost economic activity became the new norm. |
● | A swift response to the pandemic by the Federal Reserve Board and Congress delivered unprecedented monetary and fiscal stimulus to support the U.S. economy and financial markets. The global response was similar in speed and magnitude. |
● | Investors ended the period looking past rising COVID-19 cases and responding positively to the global rollout of COVID-19 vaccinations, additional global fiscal stimulus, and a post-Brexit trade agreement between the U.K. and European Union. |
● | Foreign stocks in developed markets and emerging markets also experienced gains in the fiscal year, aided by increasing economic activity in the second half of the year and the weakening of the U.S. dollar. |
● | U.S. bond investors enjoyed positive returns in a falling yield environment, fueled by lower economic growth expectations, interest rate declines, and supportive global central bank policy. |
Market Environment
Global stock investors experienced significant levels of volatility for the fiscal year beginning January 1, 2020. U.S. stocks rose steadily until mid-February, when the severity of the COVID-19 crisis was becoming apparent with rising case counts, hospitalizations, and deaths. Investor sentiment quickly turned negative, with March marking the end of the 11-year bull market. The S&P 500® Index* fell 34% from its February high to its March low, as the reality that the COVID-19 crisis had stalled the global economy and the imminence of a recession became evident.
Investors started the second quarter of 2020 facing increasing COVID-19 deaths, record unemployment levels, and expectations for an unprecedented decline in economic activity. Despite this, global markets ultimately recorded a strong second quarter, with investors responding positively to the massive amounts of monetary and fiscal stimulus. In addition, progress in combating COVID-19 and increasing economic activity, helped to fuel the market turnaround. Central banks supported bond market liquidity and kept interest rates low through government and corporate bond purchases.
Better-than-expected second-quarter corporate earnings, a strong rebound in housing demand, and progress on COVID-19 therapeutics and vaccine research helped to tamp down investor concerns and drove many stocks, especially in the information technology sector, to new highs in the third quarter of 2020. Positive economic and market momentum continued into the fourth quarter of the year, as investors looked past rising COVID-19 cases, responded positively to the global rollout of COVID-19 vaccinations and the signing of a $900 billion COVID-19 relief bill in the U.S. in late December, and cheered the post-Brexit trade agreement between the U.K. and European Union. (“Brexit” – an abbreviation for “British exit” – refers to the United Kingdom’s withdrawal from the European Union.) Improved expectations for economic activity in 2021 helped propel interest rates higher and the yield curve steeper.
The broad market S&P 500 Index delivered a strong 18.40% return for the fiscal year. The Dow Jones Industrial AverageSM was also up a healthy 9.72%. The technology-heavy NASDAQ Composite Index was one of the biggest winners, up 44.92% for the fiscal year. Small- and mid-cap stock indexes generally outperformed their larger peers, while growth stocks outperformed their value counterparts by over 35% during the period.
Eight of 11 sectors delivered positive returns for the fiscal year, led by information technology, consumer discretionary, communication services, and materials, which all enjoyed double-digit growth and beat the S&P 500 Index. The energy sector was the worst performer for the fiscal year, down nearly 34%. The financial and real estate sectors also ended in negative territory.
* Indexes referenced, other than the MSCI Indexes, are unmanaged, do not incur fees, expenses, or taxes, and cannot be purchased directly for investment. The MSCI Indexes are unmanaged, do not incur fees or expenses, and cannot be purchased directly for investment.
3
MML Series Investment Fund II – Economic and Market Overview (Unaudited) (Continued) |
Developed international markets, as measured by the MSCI EAFE® Index, had a respectable year, ending the fiscal year up 7.82%. Emerging-market stocks, as measured by the MSCI Emerging Markets Index, fared significantly better, ending up 18.31% for the period. Both developed international and emerging-market stocks benefited from increasing economic activity in the second half of the fiscal year, as well as the weakening U.S. dollar.
Bond yields fell sharply during the fiscal year, with the 10-year U.S. Treasury bond yield falling from a high of 1.88% in January 2020 to end the fiscal year at 0.93%. Falling yields generally produce rising bond prices; consequently, bond index returns benefited. The Bloomberg Barclays U.S. Aggregate Bond Index ended the period up 7.51%. Investment-grade corporate bonds also advanced. The Bloomberg Barclays U.S. Corporate Bond Index, which tracks investment-grade corporate bonds, ended the period with a 9.89% gain. The Bloomberg Barclays U.S. Corporate High Yield Bond Index also ended in positive territory, advancing 7.11%, despite a rising level of corporate bankruptcies.
As we enter 2021, we view the stock markets as extended and valuations high relative to market history. While the prospect of lower financing, labor, and energy costs support a bull case, there is substantial uncertainty regarding the impacts of the U.S. presidential election, the timeline for large-scale COVID-19 vaccine deployment, and the health of the global economy. Against this backdrop, we feel that diversification across global assets could be a smart approach for what we believe may well be a bumpy ride in 2021.
At MassMutual, we remain convinced that a broadly diversified portfolio aligned with a long-term strategy is the wisest course for those investors seeking retirement income. We remind you that it is important to maintain perspective and have realistic expectations about the future performance of your investment portfolio. As described in this report, financial markets can reverse suddenly, stumble along sideways, and reverse again. As always, we recommend that you work with a personal financial professional, who can help you define an investment strategy that aligns with your comfort level with respect to markets like these, with how long you have to save and invest, and with your specific financial goals and risk tolerance. Thank you for your confidence in MassMutual.
The information provided is the opinion of MML Investment Advisers, LLC as of 1/1/2021 and is subject to change without notice. It is not to be construed as tax, legal, or investment advice. Of course, past performance does not guarantee future results.
4
MML Blend Fund – Portfolio Manager Report (Unaudited) |
What is the investment approach of MML Blend Fund, and who is the Fund’s subadviser?
This Fund seeks to achieve as high a level of total rate of return over an extended period of time as is considered consistent with prudent investment risk and the preservation of capital. The Fund is a “fund of funds” and seeks to achieve its investment objective by investing substantially all of its assets in a combination of exchange-traded funds (ETFs) selected by the Fund’s subadviser, BlackRock Investment Management, LLC (BlackRock), using an asset allocation strategy. The ETFs are advised by an affiliate of BlackRock. The Fund invests in ETFs that invest primarily in U.S. equity securities and fixed income securities. Effective November 18, 2020, BlackRock replaced Barings LLC (Barings) as subadviser of the Fund.
How did the Fund perform during the 12 months ended December 31, 2020?
The Fund’s Initial Class shares returned 12.87%,* significantly underperforming the 18.40% return of the S&P 500® Index (the “stock component’s benchmark”), which measures the performance of 500 widely held stocks in the U.S. equity market. The Fund outperformed the 7.51% return of the Bloomberg Barclays U.S. Aggregate Bond Index (the “bond component’s benchmark”), which measures the performance of the investment grade, U.S. dollar-denominated, fixed-rate taxable bond market, including Treasuries, government-related and corporate securities, mortgage-backed securities (MBS) (agency fixed-rate and hybrid ARM pass-throughs), asset-backed securities (ABS), and commercial mortgage-backed securities (CMBS). The Fund underperformed the 13.57% return of the Lipper Balanced Fund Index, an unmanaged, equally weighted index of the 30 largest mutual funds within the Lipper Balanced Category. Finally, the Fund underperformed the 15.37% return of the Custom Balanced Index (the “blend benchmark”), which comprises the stock component’s benchmark and the bond component’s benchmark. The weightings of each index are 60% and 40%, respectively.
* | The Fund’s investment strategy changed on November 18, 2020. The performance results shown above would not necessarily have been achieved had the Fund’s current investment strategy been in effect for the entire period for which performance results are presented. |
For a discussion on the economic and market environment during the 12-month period ended December 31, 2020, please see the Economic and Market Overview, beginning on page 3.
Subadviser discussion of factors that contributed to the Fund’s performance
For the portion of the year that Barings served as subadviser of the Fund (January 1, 2020–November 17, 2020), the Fund held an overweight allocation to equities, which benefited performance. The Fund’s bond portfolio was underweight U.S. Treasuries, relative to the bond component’s benchmark, which detracted dramatically from returns during the market decline, but helped performance during the recovery. Within the equity segment of the Fund, an underweight allocation to the poorly performing energy sector, relative to the stock component’s benchmark, also benefited the Fund. Within the energy sector, the Fund held an overweight stake in Cabot Oil and Gas, a smaller exploration company. Cabot declined 1%, relative to 38% for other energy companies, and this helped performance.
The Fund’s significantly overweight position in the technology sector contributed to full-year returns, although specific Fund holdings (and allocations to those holdings) within the sector hampered returns. For example, the Fund was overweight in Intel, a semiconductor manufacturer that was down 22%; and its underweight allocation to Nvidia (another semiconductor manufacturer), detracted from returns, since Nvidia advanced 128% during the period. In the Fund’s bond segment, an overweight allocation to investment-grade corporates was a positive contributor to performance. Within securitized sectors, agency mortgage-backed securities (MBS) contributed positively to performance, while commercial mortgage-backed securities (CMBS) and residential mortgage-backed securities (RMBS) detracted over the period. Derivatives can be used for hedging, speculation, or both. In the bond segment, the Fund used derivative instruments for yield curve, duration, downside hedging, and to gain exposures. In aggregate, these positions positively contributed to performance.
For the part of the year that BlackRock served as subadviser of the Fund (November 18, 2020–December 31, 2020), the Fund outperformed both the stock component’s benchmark and the bond component’s benchmark. BlackRock constructs the Fund’s portfolio by using only passive instruments, but deviates in exposure from the benchmark through its allocation to low-cost ETFs. With respect to the equity component, the Fund invests in small- and mid-cap companies through allocations to the S&P Midcap 400 Index, the S&P SmallCap 600 Index, and the S&P Total-U.S. Stock Market Index (a broad-based benchmark that expands market capitalization coverage beyond the S&P 500 Index to include approximately 2500 mid-, small-, and micro-cap
5
MML Blend Fund – Portfolio Manager Report (Unaudited) (Continued) |
companies). Sector allocations played an important role in the Fund’s performance during the period. For example, the Fund’s underweight to energy, a sector that had a late-period rebound after lagging broad markets for the majority of the year, hampered returns. On the other hand, having an overweight position in small- and mid-cap companies benefited the Fund, as ETF holdings IJH, a mid cap stock ETF, and IJR, a small cap stock ETF, returned 7.0% and 9.0%, respectively. The largest contributors to returns in IJR were mining company Cleveland-Cliffs, business analytics provider MicroStrategy, and games retailer GameStop. The largest contributors to returns in IJH were solar energy provider Enphase Energy, photovoltaics company SolarEdge Technology, and lighting manufacturer Cree, Inc. The blend component of the Fund allocates roughly 40% of its assets into fixed-income ETFs, and deviates from the bond component’s benchmark exposure by allocating small amounts into high-yield credits through HYG, a high-yield bond ETF; and IUSB, an ETF that tracks the Barclays Universal Index, a broad-based fixed-income index that expands coverage beyond the bond component’s benchmark to include roughly 7% of its exposure into high-yield credit quality. Within fixed income, sector allocation affected performance, as the Fund’s underweights in both the securitized sector and U.S. Treasuries hindered returns. Conversely, the Fund’s overweight corporate exposure contributed to performance, as investment-grade credit spreads narrowed from 1.17% to 1.03% from November 18 to December 31, while high-yield credit spreads narrowed from 4.42% to 3.86%. Credit spreads are the differences in yields between comparable bonds, with narrowing spreads often indicating improving private creditworthiness.
Subadviser outlook
BlackRock notes that the allocations used to build the Fund’s portfolio are meant to be strategic and long-term asset allocations, designed with low-cost vehicles and to minimize turnover. At year end, relative to the stock component’s benchmark, the Fund held overweight allocations to mid-, small-, and micro-cap securities. As optimism has risen in U.S. equities based on hopes of an effective vaccination rollout and less uncertainty in the political environment, Fund management’s outlook for equities has been positive. Within fixed income, the Fund is overweight corporate exposure relative to the bond component’s benchmark. Spreads have narrowed significantly, with little room for further compression, but Fund management believes that the asset class could remain an attractive source of income after yields plummeted in 2020.
MML Blend Fund
Largest Holdings
(% of Net Assets) on 12/31/20 |
iShares Core S&P Total US Stock Market ETF | 30.3% |
iShares Core S&P 500 ETF | 27.6% |
iShares Core Total USD Bond Market ETF | 15.7% |
iShares Core U.S. Aggregate Bond ETF | 15.7% |
iShares iBoxx High Yield Corporate Bond ETF | 3.9% |
iShares 5-10 Year Investment Grade Corporate Bond ETF | 3.9% |
iShares Core S&P Mid-Cap ETF | 2.0% |
iShares Core S&P Small-Cap ETF | 0.8% |
| | 99.9% |
| | |
MML Blend Fund
Sector Table
(% of Net Assets) on 12/31/20 |
Mutual Funds | 101.8% |
Total Long-Term Investments | 101.8% |
Short-Term Investments and Other Assets and Liabilities | (1.8)% |
Net Assets | 100.0% |
| | |
6
MML Blend Fund – Portfolio Manager Report (Unaudited) (Continued) |
GROWTH OF $10,000 INVESTMENT - INITIAL CLASS

The graph above illustrates a representative class of the Fund’s historical performance for the past 10 fiscal years or since inception (for Funds lacking 10-year records) in comparison to its benchmark index, as well as one or more additional indexes, if applicable. The performance of other share classes will be greater than or less than the class depicted above.
Average Annual Total Returns (for the periods ended 12/31/2020) | | |
| Inception Date
of Class | 1 Year | 5 Years | 10 Years |
Initial Class | 02/03/1984 | 12.87% | 10.57% | 10.06% |
Service Class | 08/15/2008 | 12.57% | 10.29% | 9.78% |
S&P 500 Index* | | 18.40% | 15.22% | 13.88% |
Bloomberg Barclays U.S. Aggregate Bond Index | | 7.51% | 4.44% | 3.84% |
Lipper Balanced Fund Index | | 13.57% | 9.60% | 8.28% |
Custom Balanced Index | | 15.37% | 11.23% | 10.12% |
* Benchmark
Generally accepted accounting principles require adjustments to be made to the net assets of the Fund at period end for financial reporting purposes only, and as such, the total return based on the unadjusted net asset value per share may differ from the total return reported in the financial highlights.
Performance results in the graph and table reflect the percentage change in net asset value, including reinvestment of dividends and capital gains distributions. Investors should note that the Fund is a professionally managed mutual fund, while the index or indexes shown above are unmanaged, cannot be purchased directly, and, with the exception of any peer group index, do not incur expenses.
Performance data quoted in the graph and table represents past performance; past performance is not predictive of future results. The investment return and principal value of shares of the Fund fluctuate, so your shares, when sold, may be worth more or less than their original cost. Current performance of the Fund may be lower or higher than the performance quoted. Performance data current to the most recent month end may be obtained by calling 1-888-309-3539.
Investors should read the Fund’s prospectus with regard to the Fund’s investment objectives, risks, and charges and expenses in conjunction with these financial statements. The Fund’s return reflects changes in the net asset value per share without the deduction of any product charges (e.g., cost of insurance, mortality and expense risk charges, administrative fees, and CDSL). The inclusion of these charges would have reduced the performance shown here.
7
MML Dynamic Bond Fund – Portfolio Manager Report (Unaudited) |
What is the investment approach of MML Dynamic Bond Fund, and who is the Fund’s subadviser?
The Fund seeks to maximize current income and total return by investing, under normal circumstances, at least 80% of its net assets (plus the amount of any borrowings for investment purposes) in bonds, which may include securities issued or guaranteed by the U.S. Government, its agencies, instrumentalities, or sponsored corporations; corporate obligations (including foreign hybrid securities); mortgage-backed securities; asset-backed securities; foreign securities (corporate and government); emerging market securities (corporate and government); bank loans and assignments; and other securities bearing fixed or variable interest rates of any maturity. The Fund may invest a portion of its net assets in inverse floaters and interest-only and principal-only securities, which may experience high volatility in response to changes in interest rates. The Fund may invest in other investment companies, including other open-end or closed-end investment companies, exchange-traded funds (ETFs), and domestic or foreign private investment vehicles, including investment companies sponsored or managed by the Fund’s subadviser and its affiliates. The Fund’s subadviser is DoubleLine Capital LP (DoubleLine).
How did the Fund perform during the 12 months ended December 31, 2020?
The Fund’s Class II shares returned 3.91%, underperforming the 7.51% return of the Bloomberg Barclays U.S. Aggregate Bond Index (the “benchmark”), which measures the performance of the investment grade, U.S. dollar-denominated, fixed-rate taxable bond market, including Treasuries, government-related and corporate securities, mortgage-backed securities (MBS) (agency fixed-rate and hybrid ARM pass-throughs), asset-backed securities (ABS), and commercial mortgage-backed securities (CMBS).
For a discussion on the economic and market environment during the 12-month period ended December 31, 2020, please see the Economic and Market Overview, beginning on page 3.
Subadviser discussion of factors that contributed to the Fund’s performance
For the year ended December 31, 2020, the Fund’s shorter-duration profile and overweight credit positioning, relative to the benchmark, were the primary drivers of its underperformance. (Duration is a measure of a bond fund’s sensitivity to interest rates. The longer the duration, the greater the price impact on the bond or portfolio when interest rates rise or fall.)
The emergence of COVID-19 and the subsequent lockdowns it caused throughout the world all but halted economic activity during the first quarter of 2020. As global economies locked down, investors fled risk assets in search of safety, causing yields to fall sharply, credit spreads to blow out, and central banks to take swift policy actions to aid economic recovery. (Bond prices move in the opposite direction of interest rates or yields; when yields rise, the prices of existing bonds fall – and vice versa.) While the injection of monetary and fiscal support into many global economies led to a strong recovery in the price of risk assets during the second half of the year, many sectors still finished the year with spreads (i.e., the differences in yields between comparable Treasury and non-Treasury securities) at wider levels than they started it with.
Floating-rate sectors such as collateralized loan obligations (CLOs) and bank loans underperformed the benchmark, as they became less attractive to investors when their coupons fell as global central banks slashed their borrowing rates to stimulate the economy during the pandemic. Commercial mortgage-backed securities (CMBS) posted negative returns for the year, as economic sectors within the asset class, such as retail and hospitality, were more acutely impacted by the pandemic-induced lockdowns.
U.S. Treasuries were the top-performing asset class over the period and benefited from the steep drop in interest rates across all tenors of the U.S. Treasury curve. The investment-grade corporate credit sector also posted strong returns due to its longer-duration profile and the targeted Federal Reserve (the “Fed”) purchase support it received early in the pandemic. While the performance of higher-beta corporate sectors, such as high yield and emerging market debt, were negatively impacted at the beginning of the pandemic, they were among the best-performing asset classes during the fourth quarter of 2020, as the recovery in corporate credit outpaced that of securitized credit in the Fund at the end of the year.
8
MML Dynamic Bond Fund – Portfolio Manager Report (Unaudited) (Continued) |
Subadviser outlook
Fund management notes that structured product spreads lagged the recovery of corporate spreads during the second half of 2020. (Structured products are pre-packaged investments that ordinarily consist of assets linked to interest plus one or more derivatives.) They believe the Fund is well positioned to take advantage of the potential outperformance in securitized credit as the global economy continues to recover and COVID-19 vaccines become more widely available. The Fed has signaled it will continue its policy of low rates and quantitative easing to support the U.S. economy, which Fund management believes could foster a constructive environment for risk assets. As the U.S. budget deficit continues to reach new all-time highs, they believe that additional fiscal stimulus from the Democratic-controlled government – combined with Fed purchase support – could lead to higher inflation and put upward pressure on the intermediate to long tenors of the U.S. Treasury curve. Given this view, Fund management plans to continue positioning the Fund with a shorter duration than the benchmark.
MML Dynamic Bond Fund
Portfolio Characteristics
(% of Net Assets) on 12/31/20 |
Corporate Debt | 26.1% |
Non-U.S. Government Agency Obligations | 25.4% |
U.S. Treasury Obligations | 24.3% |
U.S. Government Agency Obligations and Instrumentalities | 17.9% |
Bank Loans | 3.8% |
Sovereign Debt Obligations | 1.4% |
Municipal Obligations | 0.1% |
Total Long-Term Investments | 99.0% |
Short-Term Investments and Other Assets and Liabilities | 1.0% |
Net Assets | 100.0% |
| | |
9
MML Dynamic Bond Fund – Portfolio Manager Report (Unaudited) (Continued) |
GROWTH OF $10,000 INVESTMENT - CLASS II
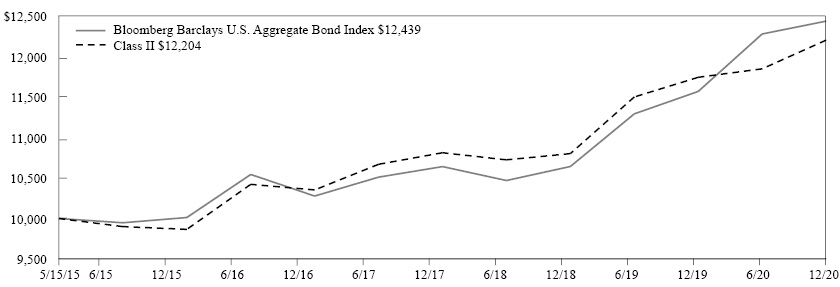
The graph above illustrates a representative class of the Fund’s historical performance for the past 10 fiscal years or since inception (for Funds lacking 10-year records) in comparison to its benchmark index, as well as one or more additional indexes, if applicable. The performance of other share classes will be greater than or less than the class depicted above.
Average Annual Total Returns (for the periods ended 12/31/2020) | | |
| Inception Date
of Class | 1 Year | 5 Years | Since Inception
05/15/2015 |
Class II | 05/15/2015 | 3.91% | 4.35% | 3.60% |
Service Class I | 05/15/2015 | 3.51% | 4.06% | 3.33% |
Bloomberg Barclays U.S. Aggregate Bond Index | | 7.51% | 4.44% | 3.95% |
Generally accepted accounting principles require adjustments to be made to the net assets of the Fund at period end for financial reporting purposes only, and as such, the total return based on the unadjusted net asset value per share may differ from the total return reported in the financial highlights.
Performance results in the graph and table reflect the percentage change in net asset value, including reinvestment of dividends and capital gains distributions. Investors should note that the Fund is a professionally managed mutual fund, while the index or indexes shown above are unmanaged, cannot be purchased directly, and, with the exception of any peer group index, do not incur expenses.
Performance data quoted in the graph and table represents past performance; past performance is not predictive of future results. The investment return and principal value of shares of the Fund fluctuate, so your shares, when sold, may be worth more or less than their original cost. Current performance of the Fund may be lower or higher than the performance quoted. Performance data current to the most recent month end may be obtained by calling 1-888-309-3539.
Investors should read the Fund’s prospectus with regard to the Fund’s investment objectives, risks, and charges and expenses in conjunction with these financial statements. The Fund’s return reflects changes in the net asset value per share without the deduction of any product charges (e.g., cost of insurance, mortality and expense risk charges, administrative fees, and CDSL). The inclusion of these charges would have reduced the performance shown here.
10
MML Equity Fund – Portfolio Manager Report (Unaudited) |
What is the investment approach of MML Equity Fund, and who are the Fund’s subadvisers?
The Fund’s primary objective is to achieve a superior total rate of return over an extended period of time from both capital appreciation and current income. Its secondary objective is the preservation of capital when business and economic conditions indicate that investing for defensive purposes is appropriate. The Fund invests primarily in common stocks of companies that the subadvisers believe are undervalued in the marketplace, with a focus on securities of larger size companies. Under normal circumstances, the Fund invests at least 80% of its net assets (plus the amount of any borrowings for investment purposes) in common stocks, preferred stocks, securities convertible into common or preferred stocks, and other securities, such as warrants and stock rights, whose value is based on stock prices. The Fund typically invests most of its assets in securities of U.S. companies, but may invest up to 25% of its total assets in foreign securities and American Depositary Receipts (“ADRs”), including emerging market securities. The Fund’s two subadvisers are T. Rowe Price Associates, Inc. (T. Rowe Price), which managed approximately 36% of the Fund’s portfolio; and Brandywine Global Investment Management, LLC (Brandywine Global), which managed approximately 64% of the Fund’s portfolio, as of December 31, 2020.
How did the Fund perform during the 12 months ended December 31, 2020?
The Fund’s Initial Class shares returned 3.03%, outperforming the 2.80% return of the Russell 1000® Value Index (the “benchmark”), which measures the performance of the large-cap value segment of U.S. equity securities. It includes the Russell 1000 Index companies with lower price-to-book ratios and lower expected growth values. It is market-capitalization weighted.
For a discussion on the economic and market environment during the 12-month period ended December 31, 2020, please see the Economic and Market Overview, beginning on page 3.
Subadviser discussion of factors that contributed to the Fund’s performance
With respect to the Brandywine Global component of the Fund, the Fund’s price momentum factor helped performance by reducing the Fund component’s energy weighting earlier in the year. Banks and financial companies languished from the collapse in the yield curve and the lack of need for financing. (The yield curve is a graph showing the term structure of interest rates by plotting the yields of all bonds of comparable quality with maturities ranging from the shortest – typically one month – to the longest – typically 30 years – available. The resulting curve shows whether short-term interest rates are higher or lower than long-term rates.) The Fund component’s large overweight in the financial sector, relative to the benchmark, detracted from returns until the last quarter of 2020, when market participation was broader. Increased demand for home computing equipment and services proved positive for the Fund component’s performance, as the Fund component had a large overweight allocation to the technology sector.
Within the T. Rowe Price component of the Fund, stock selection and sector allocation were the primary drivers of the Fund component’s relative outperformance. Information technology, health care, and energy were the largest relative contributors – whereas consumer staples and consumer discretionary detracted from relative performance. With respect to specific Fund component holdings, within information technology, Microsoft and Qualcomm performed well. Shares of Microsoft rose over the year, following strong quarterly earnings reports highlighted by robust growth within the software giant’s intelligent cloud segment. In health care, Danaher was a standout, as shares of the company finished higher due to better-than-anticipated revenue growth and margin performance as a result of Danaher’s recently acquired Cytiva business, which posted a strong increase in organic order growth. On the downside, the consumer staples sector detracted from the Fund component’s relative performance due to underperforming Fund component holdings, such as Tyson Foods. During the first half of the year, shares of the company lagged the broader market as the company grappled with uncertainty stemming from the coronavirus outbreak and a shift from commercial to residential food consumption. Fund component holdings in consumer discretionary, including Royal Caribbean Group and McDonald’s, also weighed on relative returns.
11
MML Equity Fund – Portfolio Manager Report (Unaudited) (Continued) |
Subadviser outlook
Brandywine Global’s strategy tends to lag during tight periods of narrow leadership when valuations are ignored. While the extreme events of 2020 proved challenging, the same growth factors that have driven market returns over much of this extended bull market underperformed in the fourth quarter as the markets surged higher. The spread in large-cap valuations between growth and value narrowed slightly; however, it continued to be well above average. Brandywine Global sees this rotation in leadership and a broadening of market participation as positives for value investing and their investment approach.
T. Rowe Price expects the cyclical rally to continue into 2021 as the vaccines are rolled out. They believe that, in an environment where the economy continues to normalize, value has the potential to outperform, given a higher concentration of cyclically sensitive companies. They also believe that the potential for rate stabilization, combined with consumer strength, provides the prospect for financials to rebound. In the long term, T. Rowe Price’s focus remains on avoiding secular risk and keeping the quality of the Fund component’s portfolio high.
MML Equity Fund
Largest Holdings
(% of Net Assets) on 12/31/20 |
JP Morgan Chase & Co. | 3.6% |
Bank of America Corp. | 2.8% |
UnitedHealth Group, Inc. | 2.6% |
Johnson & Johnson | 2.5% |
Broadcom, Inc. | 1.9% |
Verizon Communications, Inc. | 1.8% |
Comcast Corp. Class A | 1.8% |
Morgan Stanley | 1.7% |
Alphabet, Inc. Class C | 1.6% |
Oracle Corp. | 1.6% |
| | 21.9% |
| | |
MML Equity Fund
Sector Table
(% of Net Assets) on 12/31/20 |
Financial | 24.4% |
Consumer, Non-cyclical | 21.9% |
Technology | 13.3% |
Industrial | 12.0% |
Consumer, Cyclical | 8.9% |
Communications | 8.2% |
Utilities | 4.2% |
Basic Materials | 3.9% |
Energy | 2.2% |
Mutual Funds | 0.5% |
Total Long-Term Investments | 99.5% |
Short-Term Investments and Other Assets and Liabilities | 0.5% |
Net Assets | 100.0% |
| | |
12
MML Equity Fund – Portfolio Manager Report (Unaudited) (Continued) |
GROWTH OF $10,000 INVESTMENT - INITIAL CLASS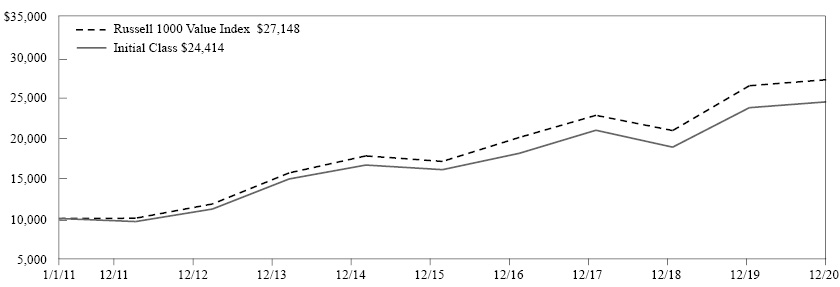
The graph above illustrates a representative class of the Fund’s historical performance for the past 10 fiscal years or since inception (for Funds lacking 10-year records) in comparison to its benchmark index, as well as one or more additional indexes, if applicable. The performance of other share classes will be greater than or less than the class depicted above.
Average Annual Total Returns (for the periods ended 12/31/2020) | | |
| Inception Date
of Class | 1 Year | 5 Years | 10 Years |
Initial Class | 12/31/1973 | 3.03% | 8.77% | 9.34% |
Service Class | 08/15/2008 | 2.77% | 8.50% | 9.06% |
Russell 1000 Value Index | | 2.80% | 9.74% | 10.50% |
Generally accepted accounting principles require adjustments to be made to the net assets of the Fund at period end for financial reporting purposes only, and as such, the total return based on the unadjusted net asset value per share may differ from the total return reported in the financial highlights.
Performance results in the graph and table reflect the percentage change in net asset value, including reinvestment of dividends and capital gains distributions. Investors should note that the Fund is a professionally managed mutual fund, while the index or indexes shown above are unmanaged, cannot be purchased directly, and, with the exception of any peer group index, do not incur expenses.
Performance data quoted in the graph and table represents past performance; past performance is not predictive of future results. The investment return and principal value of shares of the Fund fluctuate, so your shares, when sold, may be worth more or less than their original cost. Current performance of the Fund may be lower or higher than the performance quoted. Performance data current to the most recent month end may be obtained by calling 1-888-309-3539.
Investors should read the Fund’s prospectus with regard to the Fund’s investment objectives, risks, and charges and expenses in conjunction with these financial statements. The Fund’s return reflects changes in the net asset value per share without the deduction of any product charges (e.g., cost of insurance, mortality and expense risk charges, administrative fees, and CDSL). The inclusion of these charges would have reduced the performance shown here.
13
MML Equity Momentum Fund – Portfolio Manager Report (Unaudited) |
What is the investment approach of MML Equity Momentum Fund, formerly known as MML Asset Momentum Fund, and who is the Fund’s subadviser?
The Fund seeks growth of capital over the long-term by investing primarily in common stocks of large capitalization U.S. companies. The Fund’s subadviser, Invesco Advisers, Inc. (Invesco), and sub-subadviser, Invesco Capital Management LLC (ICM), invest the Fund’s assets using an indexing strategy. Under normal circumstances, the Fund invests at least 80% of its net assets (plus the amount of any borrowings for investment purposes) in the equity securities of companies included within the S&P 500® Momentum Index* (the “Index”). Effective on November 18, 2020, Invesco replaced Barings LLC (Barings) as subadviser of the Fund and ICM became sub-subadviser of the Fund.
* | The “S&P 500 Momentum Index” is a product of S&P Dow Jones Indices LLC or its affiliates (“SPDJI”) and has been licensed for use by MassMutual. Standard & Poor’s® and S&P® are registered trademarks of Standard & Poor’s Financial Services LLC (“S&P”) and Dow Jones® is a registered trademark of Dow Jones Trademark Holdings LLC (“Dow Jones”). The Fund is not sponsored, endorsed, sold or promoted by SPDJI, Dow Jones, S&P, their respective affiliates, and none of such parties make any representation regarding the advisability of investing in such product(s) nor do they have any liability for any errors, omissions, or interruptions of the S&P 500 Momentum Index. |
How did the Fund perform during the 12 months ended December 31, 2020?
The Fund’s Class II shares returned 20.26%,** significantly underperforming the 28.32% return of the Index, which measures the performance of securities in the S&P 500 universe that exhibit persistence in their relative performance. The S&P 500 Momentum Index became the Fund’s benchmark on November 18, 2020, because the S&P 500 Momentum Index more closely represents the Fund’s investment strategy than does the Fund’s former benchmark, the S&P 500® Index. In addition, the Fund outperformed the 18.40% return of the S&P 500® Index, which measures the performance of 500 widely held stocks in the U.S. equity market.
** | The Fund’s investment strategy changed on November 18, 2020. The performance results shown above would not necessarily have been achieved had the Fund’s current investment strategy been in effect for the entire period for which performance results are presented. |
For a discussion on the economic and market environment during the 12-month period ended December 31, 2020, please see the Economic and Market Overview, beginning on page 3.
Subadviser discussion of factors that contributed to the Fund’s performance
For the portion of the year that Barings served as subadviser of the Fund (January 1, 2020–November 17, 2020), the Fund’s investments in both value and international equities hampered its performance relative to the benchmark. One detractor from performance was oil refiner Marathon Petroleum, a Fund holding that underperformed the S&P 500 Index by 42%. Another Fund holding, entertainment company Fox Corporate, trailed the S&P 500 by 37%. Outside of the U.S., the Fund’s investments in Brazil and Mexico also detracted from performance. The Fund’s investment in Brazil lost about 30% of its value due to a combination of stock market downturn and currency depreciation. On the other side of the ledger, the Fund’s positions in growth stocks generated significant gains. One specific Fund holding that was a key contributor was swimming pool distributor Pool Corporation, which gained 56% due to a strong demand for its products. Overweighting technology stocks, relative to the benchmark, also contributed to performance, as the technology industry benefited significantly from the rapid shift to work-from-home across the world. Barings used derivative instruments to gain exposure to global assets and to hedge downside risk of securities – which, in the aggregate, contributed to performance. Derivatives are securities that derive their value from the performance of one or more other investments and take the form of a contract between two or more parties.
For the part of the year that Invesco served as subadviser of the Fund (November 18, 2020–December 31, 2020), the largest detractor from the Fund’s performance was the financials sector. Due to poor returns earlier in the year (arising from unemployment and falling gross domestic product), financials initially exhibited poor price momentum, which led the Fund to significantly underweight the sector. When financials surged in December 2020, on investor hopes of a second round of stimulus payments, the Fund’s performance suffered. Turning to the positive, the largest contributor to the Fund’s performance was the information technology sector, which continued to outperform as the U.S. economy began to lock back down and more people
14
MML Equity Momentum Fund – Portfolio Manager Report (Unaudited) (Continued) |
returned to working from home due to a second wave of COVID-19. Because of the significant outperformance of the larger companies in the information technology sector earlier in the year, the Fund had overweight allocations to many of them, which benefited the Fund as the lockdowns resumed.
Subadviser outlook
The Fund aims to offer shareholders access to the highest-momentum stocks within the S&P 500 Index. This goal is not expected to change, and the Fund aims to continue to offer this clearly defined exposure to shareholders for the foreseeable future. Fund management notes that, as the strategy is designed to track an index, Fund positioning results from a rules-based investment process.
MML Equity Momentum Fund
Largest Holdings
(% of Net Assets) on 12/31/20 |
Apple, Inc. | 9.1% |
Microsoft Corp. | 8.7% |
Amazon.com, Inc. | 8.4% |
NVIDIA Corp. | 5.7% |
Facebook, Inc. Class A | 5.6% |
PayPal Holdings, Inc. | 3.9% |
Netflix, Inc. | 2.8% |
Adobe, Inc. | 2.6% |
AbbVie, Inc. | 2.6% |
Thermo Fisher Scientific, Inc. | 2.3% |
| | 51.7% |
| | |
MML Equity Momentum Fund
Sector Table
(% of Net Assets) on 12/31/20 |
Technology | 38.0% |
Consumer, Non-cyclical | 24.7% |
Communications | 19.3% |
Consumer, Cyclical | 8.3% |
Financial | 3.6% |
Basic Materials | 2.6% |
Industrial | 1.8% |
Utilities | 1.7% |
Total Long-Term Investments | 100.0% |
Short-Term Investments and Other Assets and Liabilities | 0.0% |
Net Assets | 100.0% |
| | |
15
MML Equity Momentum Fund – Portfolio Manager Report (Unaudited) (Continued) |
GROWTH OF $10,000 INVESTMENT - CLASS II

The graph above illustrates a representative class of the Fund’s historical performance for the past 10 fiscal years or since inception (for Funds lacking 10-year records) in comparison to its benchmark index, as well as one or more additional indexes, if applicable. The performance of other share classes will be greater than or less than the class depicted above.
Average Annual Total Returns (for the periods ended 12/31/2020) | | |
| Inception Date
of Class | 1 Year | 5 Years | Since Inception
05/15/2015 |
Class II | 05/15/2015 | 20.26% | 15.32% | 12.33% |
Service Class I | 05/15/2015 | 20.00% | 15.03% | 12.04% |
S&P 500 Momentum Index* | | 28.32% | 17.03% | 15.50% |
S&P 500 Index | | 18.40% | 15.22% | 12.92% |
* Benchmark
Generally accepted accounting principles require adjustments to be made to the net assets of the Fund at period end for financial reporting purposes only, and as such, the total return based on the unadjusted net asset value per share may differ from the total return reported in the financial highlights.
Performance results in the graph and table reflect the percentage change in net asset value, including reinvestment of dividends and capital gains distributions. Investors should note that the Fund is a professionally managed mutual fund, while the index or indexes shown above are unmanaged, cannot be purchased directly, and, with the exception of any peer group index, do not incur expenses.
Performance data quoted in the graph and table represents past performance; past performance is not predictive of future results. The investment return and principal value of shares of the Fund fluctuate, so your shares, when sold, may be worth more or less than their original cost. Current performance of the Fund may be lower or higher than the performance quoted. Performance data current to the most recent month end may be obtained by calling 1-888-309-3539.
Investors should read the Fund’s prospectus with regard to the Fund’s investment objectives, risks, and charges and expenses in conjunction with these financial statements. The Fund’s return reflects changes in the net asset value per share without the deduction of any product charges (e.g., cost of insurance, mortality and expense risk charges, administrative fees, and CDSL). The inclusion of these charges would have reduced the performance shown here.
16
MML Equity Rotation Fund – Portfolio Manager Report (Unaudited) |
What is the investment approach of MML Equity Rotation Fund, and who is the Fund’s subadviser?
The Fund seeks growth of capital over the long-term by investing primarily in common stocks of large- and medium-capitalization U.S. companies. The Fund’s subadviser, Invesco Advisers, Inc. (Invesco), and sub-subadviser, Invesco Capital Management LLC (ICM), invest the Fund’s assets using an indexing strategy. Under normal circumstances, the Fund invests at least 80% of its net assets (plus the amount of any borrowings for investment purposes) in the equity securities of companies included within the Russell 1000® Invesco Dynamic Multifactor Index*. Effective on November 23, 2020, Invesco replaced Barings LLC (Barings) as subadviser of the Fund and ICM became sub-subadviser of the Fund.
* | The Fund is not in any way connected to or sponsored, endorsed, sold or promoted by the London Stock Exchange Group plc and its group undertakings (collectively, the “LSE Group”). FTSE Russell is a trading name of certain of the LSE Group companies. All rights in the Russell 1000® Invesco Dynamic Multifactor Index (the “Index”) vest in the relevant LSE Group company which owns the Index. “Russell 1000®” and “Russell®” are trade marks of the relevant LSE Group company and are used by any other LSE Group company under license. |
How did the Fund perform during the 12 months ended December 31, 2020?
The Fund’s Class II shares returned 22.92%,** outperforming the 20.96% return of the Russell 1000 Index (the “benchmark”), which measures the performance of the large-cap segment of U.S. equity securities. It is a subset of the Russell 3000 Index and includes approximately 1000 of the largest securities based on a combination of their market cap and current index membership. The Fund outperformed the 18.40% return of the S&P 500® Index, which measures the performance of 500 widely held stocks in the U.S. equity market. Finally, the Fund outperformed the 20.92% return of the Russell 1000 Invesco Dynamic Multifactor Index, which reflects a dynamic combination of factor exposures drawn from constituent stocks of the Russell 1000 Index. The Russell 1000 Index became the Fund’s benchmark on November 23, 2020, because the Russell 1000 Index more closely represents the Fund’s investment strategy than does the Fund’s former benchmark, the S&P 500® Index.
** | The Fund’s investment strategy changed on November 23, 2020. The performance results shown above would not necessarily have been achieved had the Fund’s current investment strategy been in effect for the entire period for which performance results are presented. |
For a discussion on the economic and market environment during the 12-month period ended December 31, 2020, please see the Economic and Market Overview, beginning on page 3.
Subadviser discussion of factors that contributed to the Fund’s performance
For the portion of the year that Barings served as subadviser of the Fund (January 1, 2020–November 22, 2020), the Fund was significantly overweight, relative to the benchmark, in the technology sector. With respect to specific Fund holdings, the Fund held an overweight stake in Veeva Systems, a cloud-based company that aids in drug development; it rose 88% during the performance period. The Fund’s overweight allocation to “old tech” companies also benefited the Fund. Specifically, technology giant Apple was a Fund holding that advanced 62% during the period. The Fund was also overweight in financials for most of the year. Ultimately, however, low interest rates and the small margin between short- and long-term interest rates proved a drag on bank earnings. One Fund holding within the sector, Keycorp (a Cleveland-based bank), was down 20% for the period and detracted from the Fund’s performance.
Invesco served as subadviser of the Fund from November 23, 2020 through December 31, 2020. Prior to that, in mid-2020, the leading economic indicators that drive the positioning of the Fund’s underlying strategy suggested that the pandemic-related economic contraction had ended and the strategy shifted towards a “recovery” regime, with significant tilts towards both smaller companies and companies that exhibit greater value characteristics. The strategy was still in this position when Invesco began managing the Fund. During the reporting period, there was a significant resurgence in COVID-19 cases. This led the U.S. economy to begin to shut down again, with a broad tilt back to employees who could working remotely. This was significantly detrimental to the types of brick-and-mortar retailers that typically exhibit strong value characteristics. The Fund’s emphasis on smaller value stocks also led to an underweight in the information technology sector, which benefited most during the COVID-19 resurgence. For example, the largest single detractor was the technology device manufacturer and electronic services provider Apple. The lack of exposure to Apple caused a significant amount of the Fund’s underperformance for the period.
17
MML Equity Rotation Fund – Portfolio Manager Report (Unaudited) (Continued) |
Subadviser outlook
As of the year-end evaluation, Fund management determined that the short-term economic growth rate was beginning to exceed the longer-term average. Because of this, in January 2021, the Fund shifted into an “expansion” stance, reducing the strength of the tilts to smaller-size and value stocks and tilting toward momentum stocks – i.e., stocks that have seen rapid recent increases in their prices. The rationale for this shift is the theory that the stocks that have benefited from this stock market rally will continue to benefit. Fund management will continue to evaluate this decision monthly, and modify exposures as the regime indicators warrant. Fund management notes that as the strategy is designed to track an index, the Fund’s positioning is a result of a rules-based investment process.
MML Equity Rotation Fund
Largest Holdings
(% of Net Assets) on 12/31/20 |
ViacomCBS, Inc. Class B | 1.0% |
United Rentals, Inc. | 0.9% |
Cardinal Health, Inc. | 0.9% |
AES Corp. | 0.9% |
Synchrony Financial | 0.9% |
Discover Financial Services | 0.9% |
Hewlett Packard Enterprise Co. | 0.8% |
Delta Air Lines, Inc. | 0.8% |
MGM Resorts International | 0.8% |
International Paper Co. | 0.7% |
| | 8.6% |
| | |
MML Equity Rotation Fund
Sector Table
(% of Net Assets) on 12/31/20 |
Financial | 28.7% |
Consumer, Cyclical | 19.8% |
Industrial | 14.3% |
Consumer, Non-cyclical | 11.5% |
Communications | 6.1% |
Basic Materials | 5.6% |
Technology | 5.1% |
Energy | 5.0% |
Utilities | 3.8% |
Mutual Funds | 0.1% |
Total Long-Term Investments | 100.0% |
Short-Term Investments and Other Assets and Liabilities | 0.0% |
Net Assets | 100.0% |
| | |
18
MML Equity Rotation Fund – Portfolio Manager Report (Unaudited) (Continued) |
GROWTH OF $10,000 INVESTMENT - CLASS II

The graph above illustrates a representative class of the Fund’s historical performance for the past 10 fiscal years or since inception (for Funds lacking 10-year records) in comparison to its benchmark index, as well as one or more additional indexes, if applicable. The performance of other share classes will be greater than or less than the class depicted above.
Average Annual Total Returns (for the periods ended 12/31/2020) | | |
| Inception Date
of Class | 1 Year | 5 Years | Since Inception
05/15/2015 |
Class II | 05/15/2015 | 22.92% | 14.81% | 12.60% |
Service Class I | 05/15/2015 | 22.57% | 14.52% | 12.32% |
Russell 1000 Index* | | 20.96% | 15.60% | 13.09% |
Russell 1000 Invesco Dynamic Multifactor Index | | 20.92% | 18.22% | 16.00% |
S&P 500 Index | | 18.40% | 15.22% | 12.92% |
* Benchmark
Generally accepted accounting principles require adjustments to be made to the net assets of the Fund at period end for financial reporting purposes only, and as such, the total return based on the unadjusted net asset value per share may differ from the total return reported in the financial highlights.
Performance results in the graph and table reflect the percentage change in net asset value, including reinvestment of dividends and capital gains distributions. Investors should note that the Fund is a professionally managed mutual fund, while the index or indexes shown above are unmanaged, cannot be purchased directly, and, with the exception of any peer group index, do not incur expenses.
Performance data quoted in the graph and table represents past performance; past performance is not predictive of future results. The investment return and principal value of shares of the Fund fluctuate, so your shares, when sold, may be worth more or less than their original cost. Current performance of the Fund may be lower or higher than the performance quoted. Performance data current to the most recent month end may be obtained by calling 1-888-309-3539.
Investors should read the Fund’s prospectus with regard to the Fund’s investment objectives, risks, and charges and expenses in conjunction with these financial statements. The Fund’s return reflects changes in the net asset value per share without the deduction of any product charges (e.g., cost of insurance, mortality and expense risk charges, administrative fees, and CDSL). The inclusion of these charges would have reduced the performance shown here.
19
MML High Yield Fund – Portfolio Manager Report (Unaudited) |
What is the investment approach of MML High Yield Fund, and who is the Fund’s subadviser?
The Fund seeks to achieve a high level of total return, with an emphasis on current income, by investing primarily in high yield debt and related securities. The Fund invests primarily in lower rated U.S. debt securities (“junk” or “high yield” bonds), including securities in default. Under normal circumstances, the Fund invests at least 80% of its net assets (plus the amount of any borrowings for investment purposes) in lower rated fixed income securities (rated below Baa3 by Moody’s, below BBB- by Standard & Poor’s or the equivalent by any NRSRO (using the lower rating) or, if unrated, determined to be of below investment grade quality by the Fund’s subadviser). The Fund’s subadviser is Barings LLC (Barings).
How did the Fund perform during the 12 months ended December 31, 2020?
The Fund’s Class II shares returned 5.56%, underperforming the 7.11% return of the Bloomberg Barclays U.S. Corporate High-Yield Bond Index (the “benchmark”), which measures the performance of U.S. dollar-denominated, non-investment grade, fixed-rate, taxable corporate bonds, including corporate bonds, fixed-rate bullet, putable, and callable bonds, SEC Rule 144A securities, original issue zeros, pay-in-kind bonds, fixed-rate and fixed-to-floating capital securities.
For a discussion on the economic and market environment during the 12-month period ended December 31, 2020, please see the Economic and Market Overview, beginning on page 3.
Subadviser discussion of factors that contributed to the Fund’s performance
The U.S. high yield market saw unprecedented volatility to begin 2020, as the COVID-19 pandemic spread across the globe. Following sharp, dramatic declines, in tandem with other risk asset classes, high-yield bonds made a strong recovery throughout the remaining three quarters of the year – ultimately ending 2020 with a positive return. Lower-quality issues underperformed the broader market as a result of more substantial declines in March, despite outperforming during the final two quarters of the year. Transportation issuers ended the year in deeply negative territory, while outperformers included the banking and other industrial sectors. Sectors most heavily impacted by the COVID-19 pandemic also underperformed, while still ending the year in positive territory.
During the year, the Fund’s holdings in the double-B and triple-C categories lagged the benchmark due to the underperformance of specific credits; however, a bias toward lower-rated credits was a positive contributor. The Fund outperformed relative to the benchmark across single-Bs and certain below-triple-C-rated credits, which recovered after earlier losses in the year. The Fund’s transportation and energy credits were the largest detractors, whereas its holdings in the communications and technology sectors were the top relative performers across industries, with each benefiting from prudent credit positioning.
Fund holdings that were the largest detractors from performance included Fieldwood Energy, a private exploration and production company with operations focused in the Gulf of Mexico; American Airlines, the world’s largest passenger airline; and Tullow Oil, a U.K.-based, independent public exploration and production company that focuses primarily in offshore regions of Africa. Fund holdings that were top contributors to performance in 2020 included Ford Motor Company, one of the world’s largest automobile manufacturers; Occidental Petroleum, a U.S.-based chemicals and energy company; and Veritas, an information management software provider offering backup and recovery, appliances, and storage management.
Subadviser outlook
Fund management notes that, while it appears that economic activity may potentially pause in many geographic regions over the near term, they believe that what awaits on the other side will be a powerful mix of fiscal stimulus, multiple vaccines, pent-up demand for services, and increased employment gains associated with a broad reopening of the global economy. Their view is that the markets were already discounting many of these elements as 2020 came to a close. That being said, they believe defaults will continue to compress as we move throughout 2021, which could justify current spread levels. For Fund management, one point of focus moving forward will be Treasury rates, as we come through the other side of this soft patch. Hence, Fund management could opportunistically reduce exposure to longer-duration, lower-yielding positions in 2021.
20
MML High Yield Fund – Portfolio Manager Report (Unaudited) (Continued) |
MML High Yield Fund
Portfolio Characteristics
(% of Net Assets) on 12/31/20 |
Corporate Debt | 90.1% |
Bank Loans | 7.0% |
Common Stock | 0.6% |
Total Long-Term Investments | 97.7% |
Short-Term Investments and Other Assets and Liabilities | 2.3% |
Net Assets | 100.0% |
| | |
21
MML High Yield Fund – Portfolio Manager Report (Unaudited) (Continued) |
GROWTH OF $10,000 INVESTMENT - CLASS II
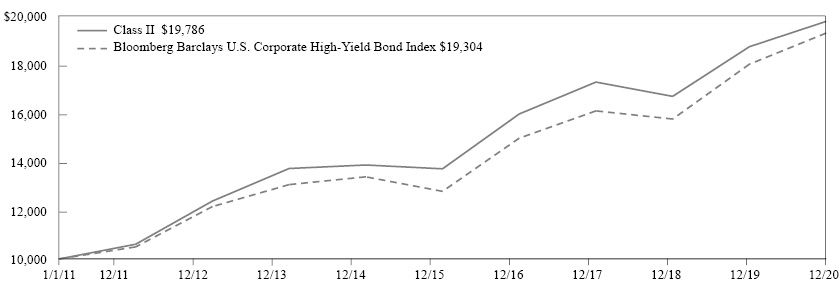
The graph above illustrates a representative class of the Fund’s historical performance for the past 10 fiscal years or since inception (for Funds lacking 10-year records) in comparison to its benchmark index, as well as one or more additional indexes, if applicable. The performance of other share classes will be greater than or less than the class depicted above.
Average Annual Total Returns (for the periods ended 12/31/2020) | | |
| Inception Date
of Class | 1 Year | 5 Years | 10 Years |
Class II | 05/03/2010 | 5.56% | 7.61% | 7.06% |
Service Class I | 05/03/2010 | 5.38% | 7.35% | 6.80% |
Bloomberg Barclays U.S. Corporate High-Yield Bond Index | | 7.11% | 8.59% | 6.80% |
Generally accepted accounting principles require adjustments to be made to the net assets of the Fund at period end for financial reporting purposes only, and as such, the total return based on the unadjusted net asset value per share may differ from the total return reported in the financial highlights.
Performance results in the graph and table reflect the percentage change in net asset value, including reinvestment of dividends and capital gains distributions. Investors should note that the Fund is a professionally managed mutual fund, while the index or indexes shown above are unmanaged, cannot be purchased directly, and, with the exception of any peer group index, do not incur expenses.
Performance data quoted in the graph and table represents past performance; past performance is not predictive of future results. The investment return and principal value of shares of the Fund fluctuate, so your shares, when sold, may be worth more or less than their original cost. Current performance of the Fund may be lower or higher than the performance quoted. Performance data current to the most recent month end may be obtained by calling 1-888-309-3539.
Investors should read the Fund’s prospectus with regard to the Fund’s investment objectives, risks, and charges and expenses in conjunction with these financial statements. The Fund’s return reflects changes in the net asset value per share without the deduction of any product charges (e.g., cost of insurance, mortality and expense risk charges, administrative fees, and CDSL). The inclusion of these charges would have reduced the performance shown here.
22
MML Inflation-Protected and Income Fund – Portfolio Manager Report (Unaudited) |
What is the investment approach of MML Inflation-Protected and Income Fund, and who is the Fund’s subadviser?
The Fund seeks to achieve as high a total rate of real return on an annual basis as is considered consistent with prudent investment risk and the preservation of capital. Under normal circumstances, the Fund invests at least 80% of its net assets (plus the amount of any borrowings for investment purposes) in inflation-indexed bonds and other income-producing securities. The Fund’s subadviser is Barings LLC (Barings).
How did the Fund perform during the 12 months ended December 31, 2020?
The Fund’s Initial Class shares returned 11.11%, outperforming the 10.99% return of the Bloomberg Barclays U.S. Treasury Inflation Protected Securities (TIPS) Index (Series-L) (the “benchmark”), which measures the performance of rules-based, market value-weighted inflation-protected securities issued by the U.S. Treasury. It is a subset of the Global Inflation-Linked Index (Series-L).
How do inflation-indexed bonds protect against inflation?
Like many other fixed-income securities, inflation-indexed bonds pay income twice a year, based on a stated coupon rate. However, both the principal and the interest payment are adjusted for the level of inflation. The inflation rate – as measured by the Consumer Price Index for All Urban Consumers (CPI-U) – results in an adjustment to the principal amount of an inflation-protected security. The coupon rate is then applied to the adjusted principal amount to determine the interest payment. For example, assuming an inflation rate of 3%, a security with a par value of $1,000 and an annual coupon rate of 1.75%, the adjusted principal amount after one year would be $1,030 ($1,000 increased by 3%). The semi-annual interest payment would be calculated by multiplying $1,030 by 1.75% and dividing by 2 instead of using the original $1,000 par value to calculate the amount of interest.
For a discussion on the economic and market environment during the 12-month period ended December 31, 2020, please see the Economic and Market Overview, beginning on page 3.
Subadviser discussion of factors that contributed to the Fund’s performance
Consumer prices, as measured by the U.S. Bureau of Labor Statistics, were down for the year 2020, as unadjusted Headline CPI came in at 1.4%, down from 2.3% at 2019 year end. (CPI measures changes in the price of a market basket of consumer goods and services. Core CPI does not include food and energy prices. Headline CPI includes food and energy.) While food/beverages and other goods and services were main drivers of inflation, the headline decrease was driven in large part by energy prices. As of December 2020, Core CPI decreased to 1.6%, down from 2.3% at 2019 year end. Core CPI is running below the 2% inflation objective of the Federal Open Market Committee (FOMC).
TIPS positioning in aggregate contributed to Fund performance during the period. The Fund’s underweight positioning, relative to the benchmark, in short-maturity inflation securities was offset by allocations to high-quality income-producing assets that earned higher yields than U.S. Treasuries. Tactical positioning in 5-year inflation instruments contributed substantially to performance, while 30-year inflation securities detracted.
In addition to TIPS, the Fund invested in high-quality income-producing securities, including asset-backed securities (ABS) and money market securities. The income earned by these asset classes contributed positively over the year. Asset-backed securities contributed substantially to performance. Fund holdings in auto loans and student loans within the ABS sector were the primary contributors. High-quality commercial paper was also a driver of the Fund’s performance over the year. (Commercial paper is the commonly used name for short-term unsecured promissory notes sold by banks and corporations to meet short-term debt obligations.)
The Fund may use derivative instruments for yield curve and duration management, as well as for replicating cash bonds and gaining market exposure in order to implement manager views. Derivatives are securities that derive their value from the performance of one or more other investments and take the form of a contract between two or more parties. Overall these derivative positions modestly contributed to performance.
23
MML Inflation-Protected and Income Fund – Portfolio Manager Report (Unaudited) (Continued) |
Subadviser outlook
The U.S. Federal Reserve (the “Fed”) has signaled a “wait and see” pause in rate actions. In the most recent FOMC statement, the Committee indicated that unless there is a significant change in the outlook for full employment and stable inflation, a rate hike would not be likely. While the Committee painted a grim picture in the near term, there is optimism beyond that, as there is hopefulness that the vaccine will ultimately contain the COVID-19 virus. There are also concerns about the longer-term effects the pandemic may inflict on the workforce. As a result, members maintained the target range for the federal funds rate at 0.00% to 0.25%.
Heading into 2021, Fund management believes that investors should expect continued dovish monetary and fiscal policy. The new Biden administration and fully Democratic-controlled Congress have signaled lofty spending ambitions, which should provide tailwinds for inflation. Although the global COVID-19 crisis creates significant disinflationary headwinds, government spending and accommodative monetary policy could dampen the effects. Though inflation markets have priced in much of the recent fiscal policy expectations, Fund management remains constructive, given the progress made on the COVID-19 vaccine and the Fed’s commitment to keep interest rates low in 2021.
MML Inflation-Protected
and Income Fund
Portfolio Characteristics
(% of Net Assets) on 12/31/20 |
Non-U.S. Government Agency Obligations | 55.9% |
U.S. Treasury Obligations | 18.1% |
U.S. Government Agency Obligations and Instrumentalities | 3.9% |
Purchased Options | 0.4% |
Municipal Obligations | 0.0% |
Total Long-Term Investments | 78.3% |
Short-Term Investments and Other Assets and Liabilities | 21.7% |
Net Assets | 100.0% |
| | |
24
MML Inflation-Protected and Income Fund – Portfolio Manager Report (Unaudited) (Continued) |
GROWTH OF $10,000 INVESTMENT - INITIAL CLASS

The graph above illustrates a representative class of the Fund’s historical performance for the past 10 fiscal years or since inception (for Funds lacking 10-year records) in comparison to its benchmark index, as well as one or more additional indexes, if applicable. The performance of other share classes will be greater than or less than the class depicted above.
Average Annual Total Returns (for the periods ended 12/31/2020) | | |
| Inception Date
of Class | 1 Year | 5 Years | 10 Years |
Initial Class | 08/30/2002 | 11.11% | 5.22% | 3.83% |
Service Class | 08/15/2008 | 10.88% | 4.96% | 3.57% |
Bloomberg Barclays U.S. Treasury Inflation Protected Securities (TIPS) Index (Series-L) | | 10.99% | 5.08% | 3.81% |
Generally accepted accounting principles require adjustments to be made to the net assets of the Fund at period end for financial reporting purposes only, and as such, the total return based on the unadjusted net asset value per share may differ from the total return reported in the financial highlights.
Performance results in the graph and table reflect the percentage change in net asset value, including reinvestment of dividends and capital gains distributions. Investors should note that the Fund is a professionally managed mutual fund, while the index or indexes shown above are unmanaged, cannot be purchased directly, and, with the exception of any peer group index, do not incur expenses.
Performance data quoted in the graph and table represents past performance; past performance is not predictive of future results. The investment return and principal value of shares of the Fund fluctuate, so your shares, when sold, may be worth more or less than their original cost. Current performance of the Fund may be lower or higher than the performance quoted. Performance data current to the most recent month end may be obtained by calling 1-888-309-3539.
Investors should read the Fund’s prospectus with regard to the Fund’s investment objectives, risks, and charges and expenses in conjunction with these financial statements. The Fund’s return reflects changes in the net asset value per share without the deduction of any product charges (e.g., cost of insurance, mortality and expense risk charges, administrative fees, and CDSL). The inclusion of these charges would have reduced the performance shown here.
25
MML Managed Bond Fund – Portfolio Manager Report (Unaudited) |
What is the investment approach of MML Managed Bond Fund, and who is the Fund’s subadviser?
The Fund’s investment objective is to achieve as high a total rate of return on an annual basis as is considered consistent with the preservation of capital. Under normal circumstances, the Fund invests at least 80% of its net assets (plus the amount of any borrowings for investment purposes) in investment grade fixed income securities (rated Baa3 or higher by Moody’s, BBB- or higher by Standard & Poor’s or the equivalent by any NRSRO, or, if unrated, determined to be of comparable quality by the subadviser). The Fund’s subadviser is Barings LLC (Barings).
How did the Fund perform during the 12 months ended December 31, 2020?
The Fund’s Initial Class shares returned 7.71%, outperforming the 7.51% return of the Bloomberg Barclays U.S. Aggregate Bond Index (the “benchmark”), which measures the performance of the investment grade, U.S. dollar-denominated, fixed-rate taxable bond market, including Treasuries, government-related and corporate securities, mortgage-backed securities (MBS) (agency fixed-rate and hybrid ARM pass-throughs), asset-backed securities (ABS), and commercial mortgage-backed securities (CMBS).
For a discussion on the economic and market environment during the 12-month period ended December 31, 2020, please see the Economic and Market Overview, beginning on page 3.
Subadviser discussion of factors that contributed to the Fund’s performance
From both a relative and an absolute perspective, the Fund enjoyed a very strong year performance-wise. The U.S. Federal Reserve (the “Fed”) took an expedited course to stem volatility by implementing several programs meant to get the market back on course after the onset of the COVID-19 pandemic. These programs, many of which have now expired, largely accomplished what they were set to correct – as market liquidity, investor sentiment, and security prices regained much of the ground lost at the start of the crisis. U.S. Government bond yields fell sharply over the year, in part due to the Fed’s multiple emergency rate cuts. Credit spreads widened, then finished the year close to where they began, as the economy progressed through its recession. (Credit spreads are the differences in yields between comparable bonds, with tightening spreads often indicating decreasing yields and increasing prices for bonds.) In the end, both factors contributed to strong total returns for most investment-grade sectors.
For the year ended December 31, 2020, the Fund had an overweight allocation, relative to the benchmark, to the corporate sector, which was a primary driver of the Fund’s performance. The Fund’s allocations to integrated oil, life insurance, and finance were top contributing industry holdings. Secondary oil & gas producers, gas pipelines, and property and casualty insurance were among the top detracting industry holdings. The Fund’s overweight allocation to BBB quality holdings was the top-performing quality position over the period. During the year, the Fund held an underweight stake in Treasuries, which detracted from relative performance.
Notable performance detractors for the year were in the securitized sectors – in particular, asset-backed securities (ABS) backed by private student loans and aviation collateral. The Fund held an overweight to this sector. Out-of-benchmark active allocations in commercial mortgage-backed securities (CMBS) and residential mortgage-backed securities (RMBS) both detracted from performance.
The portfolio management team generally keeps portfolio duration (interest rate sensitivity) in line with that of the benchmark – meaning that duration management was only a modest detractor from performance for the year.
The Fund uses derivative instruments for yield curve, duration, downside hedging and to gain exposures. They may also be used as a substitute for a direct investment. Derivatives are securities that derive their value from the performance of one or more other investments and take the form of a contract between two or more parties. In aggregate, these positions contributed positively to performance.
26
MML Managed Bond Fund – Portfolio Manager Report (Unaudited) (Continued) |
Subadviser outlook
Given the supportive fundamental and technical pictures for risk assets, Fund management believes that spreads could tighten in 2021 as many forecasts are suggesting. In this environment, they view that one way to take advantage of tightening spreads is to buy higher-beta credits that have not yet recovered. In the investment-grade corporate space, for instance, Fund management continues to see value in bonds rated BBB with solid fundamentals that look well positioned to weather an extended COVID-19 period.
Despite the weakness in 2020, Fund management views that securitized sectors still represent good value – as they believe the U.S. consumer remains on solid ground heading into 2021. Consequently, the Fund is overweight in this space going into the new year. Finally, barring additional growth weakness, Fund management feels that U.S. government yields will be range-bound in 2021, but may experience some upward pressure. Fund management believes that lower interest rates would require a marked deterioration in future growth prospects. Conversely, their view is that higher rates will only manifest alongside a sharp pick-up in inflation expectations. The Fund plans to hold a neutral duration position against its benchmark.
MML Managed Bond Fund
Portfolio Characteristics
(% of Net Assets) on 12/31/20 |
Corporate Debt | 39.0% |
Non-U.S. Government Agency Obligations | 32.7% |
U.S. Government Agency Obligations and Instrumentalities | 21.4% |
U.S. Treasury Obligations | 3.4% |
Sovereign Debt Obligations | 0.8% |
Municipal Obligations | 0.3% |
Purchased Options | 0.2% |
Total Long-Term Investments | 97.8% |
Short-Term Investments and Other Assets and Liabilities | 2.2% |
Net Assets | 100.0% |
| | |
27
MML Managed Bond Fund – Portfolio Manager Report (Unaudited) (Continued) |
GROWTH OF $10,000 INVESTMENT - INITIAL CLASS
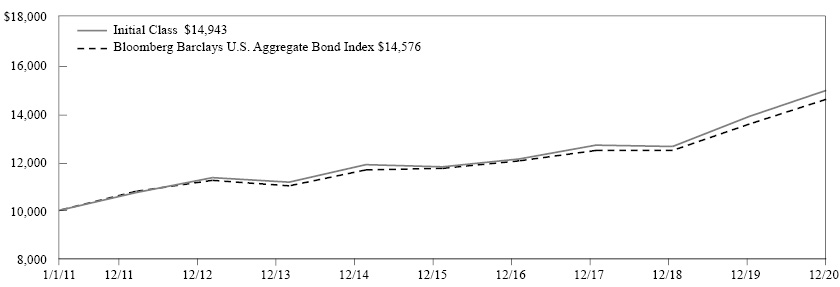
The graph above illustrates a representative class of the Fund’s historical performance for the past 10 fiscal years or since inception (for Funds lacking 10-year records) in comparison to its benchmark index, as well as one or more additional indexes, if applicable. The performance of other share classes will be greater than or less than the class depicted above.
Average Annual Total Returns (for the periods ended 12/31/2020) | | |
| Inception Date
of Class | 1 Year | 5 Years | 10 Years |
Initial Class | 12/16/1981 | 7.71% | 4.84% | 4.10% |
Service Class | 08/15/2008 | 7.44% | 4.58% | 3.84% |
Bloomberg Barclays U.S. Aggregate Bond Index | | 7.51% | 4.44% | 3.84% |
Generally accepted accounting principles require adjustments to be made to the net assets of the Fund at period end for financial reporting purposes only, and as such, the total return based on the unadjusted net asset value per share may differ from the total return reported in the financial highlights.
Performance results in the graph and table reflect the percentage change in net asset value, including reinvestment of dividends and capital gains distributions. Investors should note that the Fund is a professionally managed mutual fund, while the index or indexes shown above are unmanaged, cannot be purchased directly, and, with the exception of any peer group index, do not incur expenses.
Performance data quoted in the graph and table represents past performance; past performance is not predictive of future results. The investment return and principal value of shares of the Fund fluctuate, so your shares, when sold, may be worth more or less than their original cost. Current performance of the Fund may be lower or higher than the performance quoted. Performance data current to the most recent month end may be obtained by calling 1-888-309-3539.
Investors should read the Fund’s prospectus with regard to the Fund’s investment objectives, risks, and charges and expenses in conjunction with these financial statements. The Fund’s return reflects changes in the net asset value per share without the deduction of any product charges (e.g., cost of insurance, mortality and expense risk charges, administrative fees, and CDSL). The inclusion of these charges would have reduced the performance shown here.
28
MML Short-Duration Bond Fund – Portfolio Manager Report (Unaudited) |
What is the investment approach of MML Short-Duration Bond Fund, and who is the Fund’s subadviser?
The Fund seeks to achieve a high total rate of return primarily from current income while minimizing fluctuations in capital values by investing primarily in a diversified portfolio of short-term investment grade fixed income securities. Under normal circumstances, the Fund invests at least 80% of its net assets (plus the amount of any borrowings for investment purposes) in investment grade fixed income securities (rated Baa3 or higher by Moody’s, BBB- or higher by Standard & Poor’s or the equivalent by any NRSRO, or, if unrated, determined to be of comparable quality by the subadviser). The Fund’s subadviser is Barings LLC (Barings).
How did the Fund perform during the 12 months ended December 31, 2020?
The Fund’s Class II shares returned 1.55%, underperforming the 3.08% return of the Bloomberg Barclays U.S. Aggregate 1-3 Year Bond Index (the “benchmark”). The Bloomberg Barclays U.S. Aggregate 1-3 Year Bond Index became the Fund’s benchmark on November 1,2020, because the Bloomberg Barclays U.S. Aggregate 1-3 Year Bond Index more closely represents the Fund’s investment strategy than does the Fund’s former benchmark, The Bloomberg Barclays U.S. 1-3 Year Government Bond Index. The Bloomberg Barclays U.S. Aggregate 1-3 Year Bond Index measures the performance of investment grade, U.S. dollar-denominated, fixed-rate taxable bond market securities with maturities of 1-3 years, including Treasuries, government-related and corporate securities, MBS, ABS, and CMBS. The Fund underperformed the 3.14% return of the Bloomberg Barclays U.S. 1-3 Year Government Bond Index in the period. The Bloomberg Barclays U.S. 1-3 Year Government Bond Index measures the performance of the U.S. Treasury and U.S. Agency Indexes with maturities of 1-3 years, including Treasuries and U.S. agency debentures. It is a component of the U.S. Government/Credit Index and the U.S. Aggregate Index.
For a discussion on the economic and market environment during the 12-month period ended December 31, 2020, please see the Economic and Market Overview, beginning on page 3.
Subadviser discussion of factors that contributed to the Fund’s performance
The U.S. Federal Reserve (the “Fed”) took an expedited course to stem volatility by implementing several programs meant to get the market back on course after the onset of the COVID-19 pandemic. These programs can be seen as providing beneficial aid to the market. These programs, many of which have now expired, largely accomplished what they were set to correct – as market liquidity, investor sentiment, and security prices regained much of the ground lost at the start of the crisis. U.S. Government bond yields fell sharply over the year, in part due to the Fed’s multiple emergency rate cuts. Credit spreads widened, then finished the year close to where they began, as the economy progressed through its recession. (Credit spreads are the differences in yields between comparable bonds, with tightening spreads often indicating decreasing yields and increasing prices for bonds.) In the end, both factors contributed to strong total returns for most investment-grade sectors. Shorter-maturity yields, where the Fund’s holdings tend to be heavily focused, continued to fall, resulting in a meaningful decline in the overall Fund yield as compared to one year ago.
The biggest detractor, relative to the Fund’s benchmark, was its duration positioning – a measure of price sensitivity to changes in yields. As of year end, the Fund’s duration stood at 0.5 years, versus 2.0 years for the benchmark. The Fund’s duration position was held short for most of 2020, based on the Fund’s long-standing rules-based approach to managing interest rate risk. Unfortunately, having a shorter duration than the benchmark in a year when market yields fell substantially resulted in a meaningful performance drag versus the benchmark.
The securitized sector was a relatively neutral contributor to Fund performance over the period. The Fund held an overweight allocation to the sector, relative to the benchmark. Asset-backed securities (ABS) were a positive contributor to performance, as were commercial mortgage backed securities (CMBS). Residential mortgage-backed securities (RMBS) detracted from performance.
The Fund’s positioning in corporate bonds was a significant contributor to the Fund’s full-year performance. The Fund was overweight this sector compared to the benchmark. Banking, secondary oil & gas producers, and life insurance were among the top positive contributing industry holdings. Property and casualty insurance, health care supply, and real estate investment
29
MML Short-Duration Bond Fund – Portfolio Manager Report (Unaudited) (Continued) |
trusts (REITs) were among the top detracting industry holdings. Fund holdings rated BBB and a small allocation to BB-quality holdings contributed to performance. The Fund had an underweight allocation to Treasuries over the period, which detracted from its relative performance.
The Fund uses derivative instruments for yield curve, duration, downside hedging and to gain exposures. They may also be used as a substitute for a direct investment. Derivatives are securities that derive their value from the performance of one or more other investments and take the form of a contract between two or more parties. In aggregate, these positions contributed positively to performance.
Subadviser outlook
Despite the weakness in 2020, Fund management believes that securitized sectors still represent good value – as they believe that the U.S. consumer remains on solid ground heading into the first quarter of 2021. Consequently, the Fund is overweight in this space going into the new year.
Barring additional growth weakness, Fund management feels that U.S. government yields will likely be range-bound in 2021, but may experience some upward pressure. Fund management believes lower interest rates would require a marked deterioration in future growth prospects. Conversely, their view is that higher rates will only manifest alongside a sharp pick-up in inflation expectations. Fund management believes that the Fund could perform positively in the case of a sharp rise in interest rates, given its short relative duration positioning compared to the benchmark.
MML Short-Duration Bond Fund
Portfolio Characteristics
(% of Net Assets) on 12/31/20 |
Non-U.S. Government Agency Obligations | 48.4% |
Corporate Debt | 44.2% |
U.S. Government Agency Obligations and Instrumentalities | 1.6% |
U.S. Treasury Obligations | 0.7% |
Municipal Obligations | 0.2% |
Purchased Options | 0.0% |
Total Long-Term Investments | 95.1% |
Short-Term Investments and Other Assets and Liabilities | 4.9% |
Net Assets | 100.0% |
| | |
30
MML Short-Duration Bond Fund – Portfolio Manager Report (Unaudited) (Continued) |
GROWTH OF $10,000 INVESTMENT - CLASS II

The graph above illustrates a representative class of the Fund’s historical performance for the past 10 fiscal years or since inception (for Funds lacking 10-year records) in comparison to its benchmark index, as well as one or more additional indexes, if applicable. The performance of other share classes will be greater than or less than the class depicted above.
Average Annual Total Returns (for the periods ended 12/31/2020) | | |
| Inception Date
of Class | 1 Year | 5 Years | 10 Years |
Class II | 05/03/2010 | 1.55% | 2.57% | 2.27% |
Service Class I | 05/03/2010 | 1.34% | 2.32% | 2.02% |
Bloomberg Barclays U.S. Aggregate 1-3 Year Bond Index* | | 3.08% | 2.17% | 1.60% |
Bloomberg Barclays U.S. 1-3 Year Government Bond Index | | 3.14% | 1.92% | 1.32% |
* Benchmark
Generally accepted accounting principles require adjustments to be made to the net assets of the Fund at period end for financial reporting purposes only, and as such, the total return based on the unadjusted net asset value per share may differ from the total return reported in the financial highlights.
Performance results in the graph and table reflect the percentage change in net asset value, including reinvestment of dividends and capital gains distributions. Investors should note that the Fund is a professionally managed mutual fund, while the index or indexes shown above are unmanaged, cannot be purchased directly, and, with the exception of any peer group index, do not incur expenses.
Performance data quoted in the graph and table represents past performance; past performance is not predictive of future results. The investment return and principal value of shares of the Fund fluctuate, so your shares, when sold, may be worth more or less than their original cost. Current performance of the Fund may be lower or higher than the performance quoted. Performance data current to the most recent month end may be obtained by calling 1-888-309-3539.
Investors should read the Fund’s prospectus with regard to the Fund’s investment objectives, risks, and charges and expenses in conjunction with these financial statements. The Fund’s return reflects changes in the net asset value per share without the deduction of any product charges (e.g., cost of insurance, mortality and expense risk charges, administrative fees, and CDSL). The inclusion of these charges would have reduced the performance shown here.
31
MML Small Cap Equity Fund – Portfolio Manager Report (Unaudited) |
What is the investment approach of MML Small Cap Equity Fund, and who is the Fund’s subadviser?
The Fund seeks capital appreciation by investing primarily in common stocks of small-capitalization U.S. companies that the Fund’s subadviser believes have favorable business trends or prospects based on fundamental analysis. Under normal circumstances, the Fund invests at least 80% of its net assets (plus the amount of any borrowings for investment purposes) in securities of companies whose market capitalizations at the time of purchase are within the market capitalization range of companies included in the Russell 2000® Index. The Fund’s subadviser is Invesco Advisers, Inc. (Invesco).
How did the Fund perform during the 12 months ended December 31, 2020?
The Fund’s Initial Class shares returned 20.70%, outperforming the 19.96% return of the Russell 2000 Index (the “benchmark”), which measures the performance of the small-cap segment of the U.S. equity universe. It is a subset of the Russell 3000 Index and includes approximately 2000 of the smallest securities based on a combination of their market cap and current index membership.
For a discussion on the economic and market environment during the 12-month period ended December 31, 2020, please see the Economic and Market Overview, beginning on page 3.
Subadviser discussion of factors that contributed to the Fund’s performance
Stock selection within the health care and communication services sectors was the primary driver of the Fund’s outperformance of the benchmark for the year ended December 31, 2020. This was partially offset by weaker stock selection in the consumer discretionary and information technology sectors.
Fund holdings that were top contributors to the Fund’s relative performance included Quidel, Renewable Energy Group, and Zynga. Quidel, which specializes in rapid diagnostic testing, has been a major beneficiary of the COVID-19 pandemic. In addition to already-strong demand for its point-of-care testing for the flu, the company received FDA Emergency Use Authorization (EUA) to market its rapid point-of-care COVID-19 antigen test. Renewable Energy, a pure play in renewable fuels, benefited from a growing interest in the sector, as the demand outlook has improved since more U.S. states have been adopting low carbon fuel standard (LCFS) programs. Zynga, a mobile gaming company, experienced strong top-line growth and improved profitability. The company has also benefited from an increase in gaming driven by social distancing mandates associated with COVID-19.
Fund holdings that were top detractors from relative performance during the year included Matador Resources, Houghton Mifflin Harcourt, and Noble Midstream. Matador Resources, an exploration & production (E&P) company, was negatively affected by low oil prices and decreased demand that was exacerbated by the pandemic and an increase in supply driven by the Russia-Saudi Arabia price war earlier in 2020. Fund management exited the position. Noble Midstream, a pipeline company, was negatively affected by the significant drop in oil prices. Given less growth potential around new pipeline capacity and the desire to maintain financial leverage, Noble Midstream was forced to cut its distribution sharply. Houghton Mifflin, a provider of textbooks and education services, was negatively affected by pandemic-induced U.S. school closures. Fund management eliminated this position from the Fund’s portfolio.
Subadviser outlook
These are the late innings of the pandemic-induced recession, in the view of Fund management. They believe life could start to normalize in the second quarter of 2021, and could essentially return to normal sometime in the third quarter. However, they do not think a simple resumption of the previous economic trend is possible. Even with government assistance programs, businesses and jobs have been permanently lost, and the reallocation of people and resources in the economy could take time.
Fund management continues to maintain its discipline around valuation, focusing on companies they believe have skilled management teams and are out-executing their peers. The evidence of this, in their view, is companies with high returns on invested capital, consistently strong pricing power, and/or rising market share prices. During times of economic volatility, they believe such companies widen their lead over their weaker competitors.
32
MML Small Cap Equity Fund – Portfolio Manager Report (Unaudited) (Continued) |
MML Small Cap Equity Fund
Largest Holdings
(% of Net Assets) on 12/31/20 |
Renewable Energy Group, Inc. | 2.3% |
AutoNation, Inc. | 2.3% |
ASGN, Inc. | 2.2% |
Rexnord Corp. | 2.0% |
WSFS Financial Corp. | 2.0% |
Korn Ferry | 1.9% |
j2 Global, Inc. | 1.9% |
LHC Group, Inc. | 1.8% |
Visteon Corp. | 1.8% |
KBR, Inc. | 1.7% |
| | 19.9% |
| | |
MML Small Cap Equity Fund
Sector Table
(% of Net Assets) on 12/31/20 |
Consumer, Non-cyclical | 26.2% |
Financial | 20.0% |
Industrial | 15.2% |
Consumer, Cyclical | 13.0% |
Technology | 12.7% |
Energy | 3.4% |
Utilities | 3.1% |
Basic Materials | 2.9% |
Communications | 2.2% |
Mutual Funds | 0.5% |
Diversified | 0.3% |
Total Long-Term Investments | 99.5% |
Short-Term Investments and Other Assets and Liabilities | 0.5% |
Net Assets | 100.0% |
| | |
33
MML Small Cap Equity Fund – Portfolio Manager Report (Unaudited) (Continued) |
GROWTH OF $10,000 INVESTMENT - INITIAL CLASS

The graph above illustrates a representative class of the Fund’s historical performance for the past 10 fiscal years or since inception (for Funds lacking 10-year records) in comparison to its benchmark index, as well as one or more additional indexes, if applicable. The performance of other share classes will be greater than or less than the class depicted above.
Average Annual Total Returns (for the periods ended 12/31/2020) | | |
| Inception Date
of Class | 1 Year | 5 Years | 10 Years |
Initial Class | 06/01/1998 | 20.70% | 13.14% | 12.35% |
Service Class | 08/15/2008 | 20.39% | 12.85% | 12.07% |
Russell 2000 Index | | 19.96% | 13.26% | 11.20% |
Generally accepted accounting principles require adjustments to be made to the net assets of the Fund at period end for financial reporting purposes only, and as such, the total return based on the unadjusted net asset value per share may differ from the total return reported in the financial highlights.
Performance results in the graph and table reflect the percentage change in net asset value, including reinvestment of dividends and capital gains distributions. Investors should note that the Fund is a professionally managed mutual fund, while the index or indexes shown above are unmanaged, cannot be purchased directly, and, with the exception of any peer group index, do not incur expenses.
Performance data quoted in the graph and table represents past performance; past performance is not predictive of future results. The investment return and principal value of shares of the Fund fluctuate, so your shares, when sold, may be worth more or less than their original cost. Current performance of the Fund may be lower or higher than the performance quoted. Performance data current to the most recent month end may be obtained by calling 1-888-309-3539.
Investors should read the Fund’s prospectus with regard to the Fund’s investment objectives, risks, and charges and expenses in conjunction with these financial statements. The Fund’s return reflects changes in the net asset value per share without the deduction of any product charges (e.g., cost of insurance, mortality and expense risk charges, administrative fees, and CDSL). The inclusion of these charges would have reduced the performance shown here.
34
MML Special Situations Fund – Portfolio Manager Report (Unaudited) |
What is the investment approach of MML Special Situations Fund, and who is the Fund’s subadviser?
The Fund seeks growth of capital over the long-term by investing primarily in common stocks of U.S. companies of any size. The Fund’s subadviser, Invesco Advisers, Inc. (Invesco), and sub-subadviser, Invesco Capital Management LLC (ICM), invest the Fund’s assets using an indexing strategy. Under normal circumstances, the Fund invests primarily (at least 80% of its net assets) in the equity securities of companies included within the S&P U.S. IPO and Spin-Off Index*. Effective on November 18, 2020, Invesco replaced Barings LLC (Barings) as subadviser of the Fund and ICM became sub-subadviser of the Fund.
* | The “S&P U.S. IPO and Spin-Off Index” is a product of S&P Dow Jones Indices LLC or its affiliates (“SPDJI”) and has been licensed for use by MassMutual. Standard & Poor’s® and S&P® are registered trademarks of Standard & Poor’s Financial Services LLC (“S&P”) and Dow Jones® is a registered trademark of Dow Jones Trademark Holdings LLC (“Dow Jones”). The Fund is not sponsored, endorsed, sold or promoted by SPDJI, Dow Jones, S&P, their respective affiliates, and none of such parties make any representation regarding the advisability of investing in such product(s) nor do they have any liability for any errors, omissions, or interruptions of the S&P U.S. IPO and Spin-Off Index. |
How did the Fund perform during the 12 months ended December 31, 2020?
The Fund’s Class II shares returned 29.61%,** outperforming, by a wide margin, the 20.89% return of the Russell 3000® Index (the “benchmark”), which measures the performance of the 3,000 largest U.S. companies based on market capitalization. The Fund underperformed the 29.77% return of its supplemental index, the S&P U.S. IPO and Spin-Off Index, which measures the performance of U.S. companies that have had initial public offerings (“IPOs”) or have been spun off from a parent company within the past five years. The Russell 3000 Index became the Fund’s benchmark on November 18,2020, because the Russell 3000 Index more closely represents the Fund’s investment strategy than does the Fund’s former benchmark, the S&P 500® Index. The Fund outperformed the 18.40% return of the S&P 500 Index over the period. The S&P 500 Index which measures the performance of 500 widely held stocks in the U.S. equity market.
For a discussion on the economic and market environment during the 12-month period ended December 31, 2020, please see the Economic and Market Overview, beginning on page 3.
Subadviser discussion of factors that contributed to the Fund’s performance
For the portion of the year that Barings served as subadviser of the Fund (January 1, 2020–November 17, 2020), 38% of the Fund’s portfolio was held in industrial companies. Two of the newest members of this group were Carrier Global, the air conditioning company; and Otis Worldwide, the elevator company, which were the spinoffs of United Technologies (now Raytheon Technologies). Carrier was up 134% during the performance period, and it was one of the companies Fund management increased the Fund’s exposure to in April. Otis was up 42% for the period, and Fund management also increased the Fund’s stake in this holding during the period. On the downside, Fund holding Lamb Weston, a company that makes french fries for restaurants, was spun off from Conagra Brands, a large food company. Restaurants were one of the hardest-hit industries during the pandemic, and Lamb Weston declined 18% during the performance period. The Fund increased its position in Lamb Weston in June, which amplified the drag this holding had on the Fund’s performance during the reporting period.
For the part of the year that Invesco served as subadviser of the Fund (November 18, 2020–December 31, 2020), the Fund underperformed the benchmark by slightly over 2% – due entirely to the information technology sector. Within the sector, there were two main causes for underperformance. First, by the nature of its objective to invest in newly public companies, the Fund will not invest in large established IT companies such as the technology device manufacturer Apple. Over the reporting period, such companies surged, based on expanding lockdowns across the U.S. Second, the Fund’s largest holding within the sector, the video conferencing company Zoom Video Communications, saw a significant pullback after surging earlier in the year. Turning to the positive, the communications services sector proved to be a bright spot, as two Fund holdings within the sector contributed to performance. The Fund’s largest holding in the sector, social networking company Snap Inc., jumped early in December, upon announcing a cross-platform posting agreement with the much-larger social networking company Twitter. Additionally, the cable TV and internet provider Altice, which was assembled by a European parent and had its initial public offering (IPO) in 2017, surged on improving revenue guidance during the reporting period.
Subadviser outlook
As a passive product, MML Special Situations Fund will continue to provide diversified exposure to newly public companies within the United States for the foreseeable future. Fund management notes that, as the strategy is designed to track an index, the Fund’s positioning results from a rules-based investment process.
35
MML Special Situations Fund – Portfolio Manager Report (Unaudited) (Continued) |
MML Special Situations Fund
Largest Holdings
(% of Net Assets) on 12/31/20 |
Snap, Inc. Class A | 7.6% |
Uber Technologies, Inc. | 7.1% |
Dow, Inc. | 6.9% |
Zoom Video Communications, Inc. Class A | 6.6% |
Pinterest, Inc. | 5.6% |
Carrier Global Corp. | 5.1% |
Corteva, Inc. | 4.8% |
Otis Worldwide Corp. | 4.7% |
Fortive Corp. | 4.1% |
Invitation Homes, Inc. | 2.8% |
| | 55.3% |
| | |
MML Special Situations Fund
Sector Table
(% of Net Assets) on 12/31/20 |
Communications | 26.4% |
Industrial | 17.5% |
Consumer, Non-cyclical | 15.8% |
Technology | 11.8% |
Financial | 11.3% |
Basic Materials | 8.3% |
Consumer, Cyclical | 7.4% |
Mutual Funds | 2.0% |
Energy | 1.6% |
Total Long-Term Investments | 102.1% |
Short-Term Investments and Other Assets and Liabilities | (2.1)% |
Net Assets | 100.0% |
| | |
36
MML Special Situations Fund – Portfolio Manager Report (Unaudited) (Continued) |
GROWTH OF $10,000 INVESTMENT - CLASS II

The graph above illustrates a representative class of the Fund’s historical performance for the past 10 fiscal years or since inception (for Funds lacking 10-year records) in comparison to its benchmark index, as well as one or more additional indexes, if applicable. The performance of other share classes will be greater than or less than the class depicted above.
Average Annual Total Returns (for the periods ended 12/31/2020) | | |
| Inception Date
of Class | 1 Year | 5 Years | Since Inception
05/15/2015 |
Class II | 05/15/2015 | 29.61% | 15.99% | 10.67% |
Service Class I | 05/15/2015 | 29.24% | 15.71% | 10.41% |
Rusell 3000 Index* | | 20.89% | 15.43% | 12.86% |
S&P U.S. IPO and Spin-Off Index | | 29.77% | 15.55% | 12.19% |
S&P 500 Index | | 18.40% | 15.22% | 12.92% |
* Benchmark
Generally accepted accounting principles require adjustments to be made to the net assets of the Fund at period end for financial reporting purposes only, and as such, the total return based on the unadjusted net asset value per share may differ from the total return reported in the financial highlights.
Performance results in the graph and table reflect the percentage change in net asset value, including reinvestment of dividends and capital gains distributions. Investors should note that the Fund is a professionally managed mutual fund, while the index or indexes shown above are unmanaged, cannot be purchased directly, and, with the exception of any peer group index, do not incur expenses.
Performance data quoted in the graph and table represents past performance; past performance is not predictive of future results. The investment return and principal value of shares of the Fund fluctuate, so your shares, when sold, may be worth more or less than their original cost. Current performance of the Fund may be lower or higher than the performance quoted. Performance data current to the most recent month end may be obtained by calling 1-888-309-3539.
Investors should read the Fund’s prospectus with regard to the Fund’s investment objectives, risks, and charges and expenses in conjunction with these financial statements. The Fund’s return reflects changes in the net asset value per share without the deduction of any product charges (e.g., cost of insurance, mortality and expense risk charges, administrative fees, and CDSL). The inclusion of these charges would have reduced the performance shown here.
37
MML Strategic Emerging Markets Fund – Portfolio Manager Report (Unaudited) |
What is the investment approach of MML Strategic Emerging Markets Fund, and who is the Fund’s subadviser?
The Fund seeks long-term capital growth by investing mainly in common stocks of issuers in developing and emerging markets throughout the world and, at times, it may invest up to 100% of its total assets in foreign securities. Under normal market conditions, the Fund will invest at least 80% of its net assets (plus the amount of any borrowings for investment purposes) in equity securities of issuers whose principal activities are in a developing (or emerging) market, i.e., are in a developing market or are economically tied to a developing market country. The Fund will invest in at least three developing markets. The Fund focuses on companies with above-average earnings growth. In general, countries may be considered developing or emerging markets if they are included in any one of the MSCI emerging markets indexes, classified as a developing or emerging market, or classified under a similar or corresponding classification, by organizations such as the World Bank and the International Monetary Fund, or have economies, industries, and stock markets with similar characteristics. The Fund’s subadviser is Invesco Advisers, Inc. (Invesco).
How did the Fund perform during the 12 months ended December 31, 2020?
The Fund’s Service Class I Shares returned 17.26%, underperforming the 18.31% return of the MSCI® Emerging Market Index (the “benchmark”), which measures the performance of the large and mid cap segments of emerging market equity securities.
For a discussion on the economic and market environment during the 12-month period ended December 31, 2020, please see the Economic and Market Overview, beginning on page 3.
Subadviser discussion of factors that contributed to the Fund’s performance
An underweight allocation to the information technology sector was the largest detractor from the Fund’s relative performance for the year ended December 31, 2020. Stock selection in the consumer staples and consumer discretionary sectors also detracted from the Fund’s full-year returns. From a sector perspective, the largest performance driver was stock selection in, and an overweight allocation, relative to the benchmark, to the health care sector. Stock selection in the financial and communication services sectors also contributed to the Fund’s relative performance.
From a country perspective, the largest detractor from the Fund’s performance was an underweight allocation to South Korea. An overweight stake in Mexico and an overweight allocation to, and stock selection within, Peru also detracted from the Fund’s relative returns. On the other hand, the greatest performance driver for the year was stock selection in China. Stock selection in, and an overweight allocation to, Brazil contributed to the Fund’s full-year returns, along with an underweight allocation to Thai equities.
From a Fund holding perspective, the greatest detractors for the year were FirstRand, Fomento Economico Mexicano, and Credicorp. FirstRand is one of the largest banks in South Africa. The South African banking sector is an attractive one, given its concentration, and FirstRand is well positioned, with its industry-leading return on equity, conservative provisioning, and culture of entrepreneurship and innovation. Nevertheless, the challenging economic conditions in South Africa generated severe macro headwinds that impacted both the sector and the stock. Consequently, the Fund reduced its position in the bank. Fomento Economico Mexicano transformed itself over the past several years from one of the largest beverage companies in Latin America to a leading retail operator. More recently, they have moved into the pharmacy business. While the company has strong expansion and long-term growth prospects, the Mexican economy created a challenging backdrop in the near term. Credicorp is a Peruvian bank that offers retail and commercial banking services, along with brokerage services and asset management. Like many lending institutions globally, difficult macroeconomic situations either caused or exacerbated by COVID-19 put pressure on the lending institution.
Fund holdings that were the top absolute contributors for the year included Taiwan Semiconductor Manufacturing (TSMC), Tencent, and Meituan. TSMC is the world’s preeminent semiconductor foundry. While handset sales were sluggish in 2020, there is potential for further upside to 5G demand due to the release of Apple’s iPhone 12 and long-term partner MediaTek’s (a Taiwanese fabless semiconductor company) release of affordable 5G handset models in the market. (A fabless company designs, verifies, and sells semiconductors under its own brand or for other brands – but outsources the fabrication of its hardware.) Tencent is a Chinese internet company with operations spread across China’s technology infrastructure; it is the largest gaming company in the world. Tencent released Moonlight Blade, an in-house developed MMORPG (massive multiplayer online role-
38
MML Strategic Emerging Markets Fund – Portfolio Manager Report (Unaudited) (Continued) |
playing game), which quickly became China’s most downloaded game. Meituan is a Chinese tech company that facilitates delivery, shopping, and booking in several service categories, including food delivery, restaurant reservations, beauty services, and hotel and travel reservations through its web-based platform. Meituan has improved key operational metrics in its main profit driver – food delivery – through improved economies of scale, an increase in transacting users, and active merchants. Fund management reduced the Fund’s position in Meituan after the extraordinary appreciation in its share price over the past year.
Subadviser outlook
During this period of crisis and uncertainty, Fund management remains focused on understanding the macroeconomic pressures that are idiosyncratic to emerging markets; however, they are unwavering in their approach as bottom-up investors, which focuses on the long term and avoids tactical decisions. Fund management will continue to seek high-quality companies that, in their view, have durable long-term growth potential, supported by strong competitive positions, balance sheets, and cash flows that could allow them to thrive in the post-coronavirus world.
MML Strategic Emerging Markets Fund
Largest Holdings
(% of Net Assets) on 12/31/20 |
Taiwan Semiconductor Manufacturing Co. Ltd. | 8.3% |
Tencent Holdings Ltd. | 7.1% |
Housing Development Finance Corp. Ltd. | 4.9% |
Kering SA | 4.6% |
Kotak Mahindra Bank Ltd. | 4.0% |
AIA Group Ltd. | 3.9% |
Yum China Holdings, Inc. | 3.6% |
Alibaba Group Holding Ltd. Sponsored ADR | 3.4% |
Novatek PJSC Sponsored GDR Registered | 3.3% |
Yandex NV Class A | 3.2% |
| | 46.3% |
| | |
MML Strategic Emerging Markets Fund
Sector Table
(% of Net Assets) on 12/31/20 |
Financial | 24.3% |
Consumer, Cyclical | 19.0% |
Communications | 17.5% |
Technology | 12.9% |
Consumer, Non-cyclical | 12.3% |
Industrial | 5.0% |
Basic Materials | 4.5% |
Energy | 3.4% |
Mutual Funds | 0.4% |
Total Long-Term Investments | 99.3% |
Short-Term Investments and Other Assets and Liabilities | 0.7% |
Net Assets | 100.0% |
| | |
39
MML Strategic Emerging Markets Fund – Portfolio Manager Report (Unaudited) (Continued) |
GROWTH OF $10,000 INVESTMENT - SERVICE CLASS I

The graph above illustrates a representative class of the Fund’s historical performance for the past 10 fiscal years or since inception (for Funds lacking 10-year records) in comparison to its benchmark index, as well as one or more additional indexes, if applicable. The performance of other share classes will be greater than or less than the class depicted above.
Average Annual Total Returns (for the periods ended 12/31/2020) | | |
| Inception Date
of Class | 1 Year | 5 Years | 10 Years |
Class II | 05/01/2009 | 17.55% | 13.03% | 2.38% |
Service Class I | 08/27/2008 | 17.26% | 12.75% | 2.13% |
MSCI Emerging Markets Index | | 18.31% | 12.81% | 3.63% |
Generally accepted accounting principles require adjustments to be made to the net assets of the Fund at period end for financial reporting purposes only, and as such, the total return based on the unadjusted net asset value per share may differ from the total return reported in the financial highlights.
Performance results in the graph and table reflect the percentage change in net asset value, including reinvestment of dividends and capital gains distributions. Investors should note that the Fund is a professionally managed mutual fund, while the index or indexes shown above are unmanaged, cannot be purchased directly, and, with the exception of any peer group index, do not incur expenses.
Performance data quoted in the graph and table represents past performance; past performance is not predictive of future results. The investment return and principal value of shares of the Fund fluctuate, so your shares, when sold, may be worth more or less than their original cost. Current performance of the Fund may be lower or higher than the performance quoted. Performance data current to the most recent month end may be obtained by calling 1-888-309-3539.
Investors should read the Fund’s prospectus with regard to the Fund’s investment objectives, risks, and charges and expenses in conjunction with these financial statements. The Fund’s return reflects changes in the net asset value per share without the deduction of any product charges (e.g., cost of insurance, mortality and expense risk charges, administrative fees, and CDSL). The inclusion of these charges would have reduced the performance shown here.
40
MML U.S. Government Money Market Fund – Portfolio Manager Report (Unaudited) |
What is the investment approach of MML U.S. Government Money Market Fund, and who is the Fund’s subadviser?
The Fund seeks current income consistent with preservation of capital and liquidity. The Fund normally invests at least 99.5% of its total assets in cash, U.S. Government securities, and/or repurchase agreements fully collateralized by cash or U.S. Government securities. Under normal circumstances, the Fund invests at least 80% of its net assets in U.S. Government securities and repurchase agreements that are fully collateralized by U.S. Government securities. The Fund seeks to maintain, but does not guarantee, a stable $1.00 share price. You could lose money by investing in the Fund. Although the Fund seeks to preserve the value of your investment at $1.00 per share, it cannot guarantee it will do so. An investment in the Fund is not insured or guaranteed by the Federal Deposit Insurance Corporation or any other government agency. The Fund’s sponsor has no legal obligation to provide financial support to the Fund, and you should not expect that the sponsor will provide financial support to the Fund at any time. The Fund’s subadviser is Barings LLC (Barings).
How did the Fund perform during the 12 months ended December 31, 2020?
The Fund’s Initial Class shares returned 0.23%, underperforming the 0.58% return of the FTSE 3 Month US T Bill Index (the “benchmark”), which measures the performance of the last three three-month Treasury bill month-end rates.
For a discussion on the economic and market environment during the 12-month period ended December 31, 2020, please see the Economic and Market Overview, beginning on page 3.
Subadviser discussion of factors that contributed to the Fund’s performance
The Federal Reserve (the “Fed”) decreased the federal funds target rate from 1.50%-1.75% to 0.00%-0.25% in March 2020 as a result of the market volatility brought on by the global pandemic. Prolonged COVID-19 lockdowns were cited as having an adverse effect on the economy, and as a result, the Fed took a more accommodative stance as the economy moved into recessionary territory.
LIBOR (London Interbank Offered Rate) rates decreased, with one-month LIBOR down 1.63% to 0.14% over the year and three-month LIBOR down 1.67% to 0.24% over the 12-month period. The sharp unexpected decrease in LIBOR earlier in the year had a negative effect on the Fund’s performance due to the number of adjustable rate issues in the Fund that were tied to LIBOR and the Secured Overnight Financing Rate (SOFR). Normally, the Fed ratchets interest rates up or down in 25 basis point increments, based upon their view of the underlying economy; however, the unforeseen global pandemic caused the Fed to act quickly and dramatically in early 2020. Currently, the yield curve out to one year is extremely flat, with no expected rate hike on the horizon. (The yield curve is a graph showing the term structure of interest rates by plotting the yields of all bonds of comparable quality with maturities ranging from the shortest – typically one month – to the longest – typically 30 years – available. The resulting curve shows whether short-term interest rates are higher or lower than long-term rates.)
Subadviser outlook
Barring any unexpected pickup in inflation brought on by the high volume of cash in the banking system, Fund management feels that front-end U.S. government yields will likely be range-bound in 2021. They believe that Treasury Bill supply cuts will be smaller than the $1-1.3 trillion that was expected prior to the results of the Georgia Senatorial seat run-offs. Their view is that the expected decline could be significantly lower with the recent change in control of the Senate, although the size and timing of the stimulus package or packages could have an effect on the supply changes. However, they believe that increasing bank reserves could hold front-end rates down, especially in the early part of 2021.
Fund management believes that Democratic Congressional control increases the likelihood of a $1 trillion near-term COVID-19 stimulus package and passage of a $2-4 trillion spending package later in 2021. Their view is that the smaller first package could be for COVID-19 relief and the larger second package could be aimed at items on Biden’s agenda for infrastructure, green energy, and health care expansion. Regardless, Fund management opines that the Fed will almost surely keep the federal funds rate between 0.00%-0.25% for the duration of 2021, making absolute yields paltry at best. In such a scenario, Fund management believes that money market funds will only add value as a safe place to park cash while waiting for other opportunities to emerge.
41
MML U.S. Government Money Market Fund – Portfolio Manager Report (Unaudited) (Continued) |
MML U.S. Government
Money Market Fund
Portfolio Characteristics
(% of Net Assets) on 12/31/20 |
Discount Notes | 79.7% |
Repurchase Agreement | 6.7% |
U.S. Treasury Bill | 13.8% |
Total Short-Term Investments | 100.2% |
Other Assets & Liabilities | (0.2)% |
Net Assets | 100.0% |
| | |
42
MML U.S. Government Money Market Fund – Portfolio Manager Report (Unaudited) (Continued) |
GROWTH OF $10,000 INVESTMENT - INITIAL CLASS

The graph above illustrates the Fund’s historical performance for the past 10 fiscal years or since inception (for Funds lacking 10-year records) in comparison to its benchmark index, as well as one or more additional indexes, if applicable.
Average Annual Total Returns (for the periods ended 12/31/2020) | | |
| Inception Date
of Class | 1 Year | 5 Years | 10 Years |
Initial Class | 12/16/1981 | 0.23% | 0.75% | 0.37% |
FTSE 3 Month US T Bill Index | | 0.58% | 1.16% | 0.60% |
Generally accepted accounting principles require adjustments to be made to the net assets of the Fund at period end for financial reporting purposes only, and as such, the total return based on the unadjusted net asset value per share may differ from the total return reported in the financial highlights.
Performance results in the graph and table reflect the percentage change in net asset value, including reinvestment of dividends and capital gains distributions. Investors should note that the Fund is a professionally managed mutual fund, while the index or indexes shown above are unmanaged, cannot be purchased directly, and, with the exception of any peer group index, do not incur expenses.
Performance data quoted in the graph and table represents past performance; past performance is not predictive of future results. The investment return and principal value of shares of the Fund fluctuate, so your shares, when sold, may be worth more or less than their original cost. Current performance of the Fund may be lower or higher than the performance quoted. Performance data current to the most recent month end may be obtained by calling 1-888-309-3539.
Investors should read the Fund’s prospectus with regard to the Fund’s investment objectives, risks, and charges and expenses in conjunction with these financial statements. The Fund’s return reflects changes in the net asset value per share without the deduction of any product charges (e.g., cost of insurance, mortality and expense risk charges, administrative fees, and CDSL). The inclusion of these charges would have reduced the performance shown here.
You could lose money by investing in the Fund. Although the Fund seeks to preserve the value of your investment at $1.00 per share, it cannot guarantee it will do so. An investment in the Fund is not insured or guaranteed by the Federal Deposit Insurance Corporation or any other government agency. The Fund’s sponsor has no legal obligation to provide financial support to the Fund, and you should not expect that the sponsor will provide financial support to the Fund at any time.
43
MML Blend Fund – Portfolio of Investments |
December 31, 2020 |
| | | Number of
Shares | | | Value | |
MUTUAL FUNDS — 101.8% |
Diversified Financial Services — 101.8% |
iShares 5-10 Year Investment Grade Corporate Bond ETF | | | 492,455 | | | $ | 30,428,794 | |
iShares Core S&P 500 ETF | | | 570,739 | | | | 214,249,713 | |
iShares Core S&P Mid-Cap ETF | | | 66,563 | | | | 15,298,174 | |
iShares Core S&P Small-Cap ETF (a) | | | 71,365 | | | | 6,558,444 | |
iShares Core S&P Total US Stock Market ETF | | | 2,729,859 | | | | 235,368,443 | |
iShares Core Total USD Bond Market ETF | | | 2,237,711 | | | | 122,134,266 | |
iShares Core U.S. Aggregate Bond ETF | | | 1,033,057 | | | | 122,097,007 | |
iShares iBoxx High Yield Corporate Bond ETF (a) | | | 350,956 | | | | 30,638,459 | |
State Street Navigator Securities Lending Prime Portfolio (b) | | | 14,726,250 | | | | 14,726,250 | |
| | | | | | | | | |
TOTAL MUTUAL FUNDS (Cost $770,487,321) | | | | | | | 791,499,550 | |
| | | | | | | | | |
TOTAL LONG-TERM INVESTMENTS (Cost $770,487,321) | | | | | | | 791,499,550 | |
| | | Principal
Amount | | | | | |
SHORT-TERM INVESTMENTS — 0.1% |
Repurchase Agreement — 0.1% |
Fixed Income Clearing Corp., Repurchase Agreement, dated 12/31/20, 0.000%, due 1/04/21 (c) | | $ | 1,084,404 | | | | 1,084,404 | |
| | | | | | | | | |
TOTAL SHORT-TERM INVESTMENTS (Cost $1,084,404) | | | | | | | 1,084,404 | |
| | | | | | | | | |
TOTAL INVESTMENTS — 101.9% (Cost $771,571,725) (d) | | | | | | | 792,583,954 | |
| | | | | | | | | |
Other Assets/(Liabilities) — (1.9)% | | | | | | | (14,989,436 | ) |
| | | | | | | | | |
NET ASSETS — 100.0% | | | | | | $ | 777,594,518 | |
Abbreviation Legend
Notes to Portfolio of Investments
Percentages are stated as a percent of net assets.
(a) | Denotes all or a portion of security on loan. The total value of securities on loan as of December 31, 2020, was $20,897,235 or 2.69% of net assets. Total securities on loan may be less than the amounts identified in the Portfolio of Investments. The Fund received $6,634,127 of non-cash collateral (U.S. Treasury and/or Agency obligations) related to securities lending activity. This amount is not reflected on either the Portfolio of Investments or the Statement of Assets and Liabilities. (Note 2). |
(b) | Represents investment of security lending cash collateral. (Note 2). |
(c) | Maturity value of $1,084,404. Collateralized by U.S. Government Agency obligations with a rate of 0.000%, maturity date of 12/30/21, and an aggregate market value, including accrued interest, of $1,106,112. |
(d) | See Note 6 for aggregate cost for federal tax purposes. |
The accompanying notes are an integral part of the financial statements.
44
MML Dynamic Bond Fund – Portfolio of Investments |
December 31, 2020 |
| | | Principal
Amount | | | Value | |
BONDS & NOTES — 99.0% |
BANK LOANS — 3.8% |
Advertising — 0.0% |
Clear Channel Outdoor Holdings, Inc., Term Loan B, 3 mo. LIBOR + 3.500% | | | | | | | | |
3.714% VRN 8/21/26 | | $ | 39,799 | | | $ | 38,235 | |
Terrier Media Buyer, Inc., Term Loan B, 1 mo. LIBOR + 4.250% | | | | | | | | |
4.397% VRN 12/17/26 | | | 59,400 | | | | 59,382 | |
| | | | | | | | 97,617 | |
Aerospace & Defense — 0.1% |
TransDigm, Inc., 2020 Term Loan F, 1 mo. LIBOR + 2.250% | | | | | | | | |
2.397% VRN 12/09/25 | | | 170,021 | | | | 166,391 | |
Airlines — 0.0% |
American Airlines, Inc., 2017 Incremental Term Loan, 1 mo. LIBOR + 2.000% | | | | | | | | |
2.159% VRN 12/15/23 | | | 74,081 | | | | 66,387 | |
Kestrel Bidco Inc., Term Loan B, 6 mo. LIBOR + 3.000% | | | | | | | | |
4.000% VRN 12/11/26 | | | 69,413 | | | | 66,420 | |
| | | | | | | | 132,807 | |
Auto Parts & Equipment — 0.0% |
Clarios Global LP, USD Term Loan B, 1 mo. LIBOR + 3.500% | | | | | | | | |
3.647% VRN 4/30/26 | | | 148,503 | | | | 147,729 | |
Biotechnology — 0.0% |
Aldevron LLC, 2019 Term Loan B, 1 mo. LIBOR + 4.250% | | | | | | | | |
5.250% VRN 10/12/26 | | | 109,200 | | | | 109,427 | |
Building Materials — 0.0% |
CP Atlas Buyer, Inc. | | | | | | | | |
2020 Term Loan B1, 3 mo. LIBOR + 4.500% | | | | | | | | |
5.250% VRN 11/23/27 | | | 90,000 | | | | 90,112 | |
2020 Delayed Draw Term Loan B2, 3 mo. LIBOR + 4.500% | | | | | | | | |
5.250% VRN 11/23/27 | | | 30,000 | | | | 30,038 | |
| | | | | | | | 120,150 | |
Chemicals — 0.1% |
Axalta Coating Systems US Holdings, Inc., USD Term Loan B3, 3 mo. LIBOR + 1.750% | | | | | | | | |
2.004% VRN 6/01/24 | | | 274,151 | | | | 271,752 | |
| | | Principal
Amount | | | Value | |
GrafTech Finance, Inc., 2018 Term Loan B, 1 mo. LIBOR + 3.500% | | | | | | | | |
4.500% VRN 2/12/25 | | $ | 23,866 | | | $ | 23,816 | |
| | | | | | | | 295,568 | |
Commercial Services — 0.2% |
AlixPartners LLP, 2017 Term Loan B, 1 mo. LIBOR + 2.500% | | | | | | | | |
2.647% VRN 4/04/24 | | | 222,268 | | | | 219,525 | |
Allied Universal Holdco LLC, 2019 Term Loan B, 1 mo. LIBOR + 4.250% | | | | | | | | |
4.397% VRN 7/10/26 | | | 128,700 | | | | 128,029 | |
Mister Car Wash Holdings, Inc., 2019 Term Loan B, 1 mo. LIBOR + 3.250% | | | | | | | | |
3.402% VRN 5/14/26 | | | 64,836 | | | | 63,169 | |
Prime Security Services Borrower LLC, 2019 Term Loan B1, 1 mo. LIBOR + 3.250%, 3 mo. LIBOR + 3.250% | | | | | | | | |
4.250% VRN 9/23/26 | | | 130,430 | | | | 130,757 | |
| | | | | | | | 541,480 | |
Computers — 0.1% |
Flexential Intermediate Corp., 2017 1st Lien Term Loan, 3 mo. LIBOR + 3.500% | | | | | | | | |
3.754% VRN 8/01/24 | | | 29,693 | | | | 26,419 | |
Surf Holdings, LLC, USD Term Loan, 3 mo. LIBOR + 3.500% | | | | | | | | |
3.726% VRN 3/05/27 | | | 129,350 | | | | 128,056 | |
| | | | | | | | 154,475 | |
Distribution & Wholesale — 0.0% |
American Tire Distributors Holdings, Inc., 2015 Term Loan, 1 mo. LIBOR + 7.500%, 3 mo. LIBOR + 7.500% | | | | | | | | |
8.500% VRN 9/02/24 | | | 29,624 | | | | 28,157 | |
Diversified Financial Services — 0.1% |
Blackhawk Network Holdings, Inc., 2018 1st Lien Term Loan, 1 mo. LIBOR + 3.000% | | | | | | | | |
3.147% VRN 6/15/25 | | | 115,136 | | | | 111,862 | |
Camelot U.S. Acquisition 1 Co., 2020 Incremental Term Loan B, 1 mo. LIBOR + 3.000% | | | | | | | | |
4.000% VRN 10/30/26 | | | 120,000 | | | | 119,887 | |
Deerfield Dakota Holding LLC, 2020 USD Term Loan B, 3 mo. LIBOR + 3.750% | | | | | | | | |
4.750% VRN 4/09/27 | | | 119,425 | | | | 119,444 | |
| | | | | | | | 351,193 | |
The accompanying notes are an integral part of the financial statements.
45
MML Dynamic Bond Fund – Portfolio of Investments (Continued) |
| | | Principal
Amount | | | Value | |
Electrical Components & Equipment — 0.0% |
Energizer Holdings, Inc., 2020 Term Loan, | | | | | | | | |
2.750% 12/22/27 | | $ | 105,000 | | | $ | 104,804 | |
Electronics — 0.1% |
Compass Power Generation LLC, 2018 Term Loan B, 1 mo. LIBOR + 3.500% | | | | | | | | |
4.500% VRN 12/20/24 | | | 54,052 | | | | 52,485 | |
Tech Data Corp., ABL Term Loan, 1 mo. LIBOR + 3.500% | | | | | | | | |
3.645% VRN 6/30/25 | | | 105,000 | | | | 105,557 | |
| | | | | | | | 158,042 | |
Engineering & Construction — 0.0% |
Brand Energy & Infrastructure Services, Inc., 2017 Term Loan, 3 mo. LIBOR + 4.250% | | | | | | | | |
5.250% VRN 6/21/24 | | | 64,435 | | | | 62,707 | |
Entertainment — 0.0% |
Playtika Holding Corp., Term Loan B, 3 mo. LIBOR + 6.000% | | | | | | | | |
7.000% VRN 12/10/24 | | | 43,846 | | | | 44,061 | |
Environmental Controls — 0.1% |
Filtration Group Corp., 2018 1st Lien Term Loan, 1 mo. LIBOR + 3.000% | | | | | | | | |
3.147% VRN 3/29/25 | | | 200,848 | | | | 198,498 | |
Foods — 0.1% |
H Food Holdings LLC, 2018 Term Loan B, 1 mo. LIBOR + 3.687% | | | | | | | | |
3.834% VRN 5/23/25 | | | 49,430 | | | | 48,503 | |
JBS USA LUX SA, 2019 Term Loan B, 1 mo. LIBOR + 2.000% | | | | | | | | |
2.147% VRN 5/01/26 | | | 253,068 | | | | 250,854 | |
United Natural Foods, Inc., Term Loan B, 1 mo. LIBOR + 4.250% | | | | | | | | |
4.397% VRN 10/22/25 | | | 17,045 | | | | 16,928 | |
| | | | | | | | 316,285 | |
Forest Products & Paper — 0.0% |
Asplundh Tree Expert LLC, Term Loan B, 1 mo. LIBOR + 2.500% | | | | | | | | |
2.647% VRN 9/07/27 | | | 69,825 | | | | 69,956 | |
Gas — 0.0% |
Pacific Gas & Electric Company, 2020 Term Loan, 1 mo. LIBOR + 4.500% | | | | | | | | |
5.500% VRN 6/23/25 | | | 74,625 | | | | 75,390 | |
| | | Principal
Amount | | | Value | |
Health Care – Products — 0.1% |
Avantor Funding, Inc., 2020 Incremental Term Loan B4, 1 mo. LIBOR + 2.500% | | | | | | | | |
3.500% VRN 11/08/27 | | $ | 130,000 | | | $ | 130,082 | |
Sotera Health Holdings, LLC, 2019 Term Loan, 3 mo. LIBOR + 4.500% | | | | | | | | |
5.500% VRN 12/11/26 | | | 141,381 | | | | 141,793 | |
| | | | | | | | 271,875 | |
Health Care – Services — 0.2% |
Air Methods Corp., 2017 Term Loan B, 3 mo. LIBOR + 3.500% | | | | | | | | |
4.500% VRN 4/22/24 | | | 54,577 | | | | 52,421 | |
Envision Healthcare Corp., 2018 1st Lien Term Loan, 1 mo. LIBOR + 3.750% | | | | | | | | |
3.897% VRN 10/10/25 | | | 44,545 | | | | 37,023 | |
Gentiva Health Services, Inc., 2020 Term Loan, 1 mo. LIBOR + 3.250% | | | | | | | | |
3.438% VRN 7/02/25 | | | 182,882 | | | | 181,626 | |
HC Group Holdings II, Inc., Term Loan B, 1 mo. LIBOR + 4.250% | | | | | | | | |
4.397% VRN 8/06/26 | | | 154,221 | | | | 153,900 | |
Radiology Partners, Inc., 2018 1st Lien Term Loan B, 1 mo. LIBOR +4.25%, 1 year LIBOR +4.25% | | | | | | | | |
4.396% - 5.295% VRN 7/09/25 | | | 120,000 | | | | 117,826 | |
RegionalCare Hospital Partners Holdings, Inc., 2018 Term Loan B, 1 mo. LIBOR + 3.750% | | | | | | | | |
3.897% VRN 11/16/25 | | | 95,193 | | | | 94,825 | |
Select Medical Corp., 2017 Term Loan B, 3 mo. LIBOR + 2.250% | | | | | | | | |
2.530% VRN 3/06/25 | | | 115,000 | | | | 113,850 | |
Team Health Holdings, Inc., 1st Lien Term Loan, 1 mo. LIBOR + 2.750% | | | | | | | | |
3.750% VRN 2/06/24 | | | 24,743 | | | | 21,973 | |
| | | | | | | | 773,444 | |
Household Products & Wares — 0.0% |
Diamond (BC) B.V., USD Term Loan, 3 mo. LIBOR + 3.000% | | | | | | | | |
3.214% VRN 9/06/24 | | | 74,147 | | | | 72,973 | |
Kronos Acquisition Holdings, Inc., 2020 Term Loan B, | | | | | | | | |
0.000% 12/17/26 (a) | | | 65,000 | | | | 64,919 | |
| | | | | | | | 137,892 | |
Insurance — 0.3% |
Acrisure LLC, 2020 Term Loan B, 1 mo. LIBOR + 3.500% | | | | | | | | |
3.647% VRN 2/15/27 | | | 123,431 | | | | 120,834 | |
The accompanying notes are an integral part of the financial statements.
46
MML Dynamic Bond Fund – Portfolio of Investments (Continued) |
| | | Principal
Amount | | | Value | |
AssuredPartners, Inc., 2020 Term Loan B, 1 mo. LIBOR + 3.500% | | | | | | | | |
3.647% VRN 2/12/27 | | $ | 241,848 | | | $ | 237,993 | |
Asurion LLC | | | | | | | | |
2020 Term Loan B8, 3 mo. LIBOR + 3.250% | | | | | | | | |
0.000% VRN 12/23/26 (a) | | | 155,000 | | | | 153,248 | |
2018 Term Loan B6, 1 mo. LIBOR + 3.000% | | | | | | | | |
3.147% VRN 11/03/23 | | | 70,273 | | | | 69,541 | |
2017 2nd Lien Term Loan, 1 mo. LIBOR + 6.500% | | | | | | | | |
6.647% VRN 8/04/25 | | | 46,970 | | | | 47,263 | |
OneDigital Borrower LLC | | | | | | | | |
2020 Delayed Draw Term Loan, | | | | | | | | |
0.000% 11/16/27 (b) | | | 26,563 | | | | 26,563 | |
2020 Term Loan, 3 mo. LIBOR + 4.500% | | | | | | | | |
5.250% VRN 11/16/27 | | | 154,727 | | | | 154,727 | |
Sedgwick Claims Management Services, Inc., 2019 Term Loan B, 1 mo. LIBOR + 4.000% | | | | | | | | |
4.147% VRN 9/03/26 | | | 34,475 | | | | 34,324 | |
| | | | | | | | 844,493 | |
Internet — 0.2% |
Go Daddy Operating Co, LLC, 2020 Term Loan B3, 1 mo. LIBOR + 2.500% | | | | | | | | |
2.647% VRN 8/10/27 | | | 84,575 | | | | 84,822 | |
Go Daddy Operating Co. LLC, 2017 Repriced Term Loan, 1 mo. LIBOR + 1.750% | | | | | | | | |
1.897% VRN 2/15/24 | | | 242,487 | | | | 242,184 | |
Uber Technologies, Inc., 2018 Term Loan, 1 mo. LIBOR + 4.000% | | | | | | | | |
5.000% VRN 4/04/25 | | | 113,783 | | | | 114,091 | |
Web.com Group, Inc., 2018 Term Loan B, 1 mo. LIBOR + 3.750% | | | | | | | | |
3.898% VRN 10/10/25 | | | 40,000 | | | | 39,383 | |
| | | | | | | | 480,480 | |
Investment Companies — 0.1% |
Solenis Holdings LLC, 2018 1st Lien Term Loan, 3 mo. LIBOR + 4.000% | | | | | | | | |
4.233% VRN 6/26/25 | | | 73,794 | | | | 73,628 | |
UFC Holdings LLC, 2019 Term Loan, 6 mo. LIBOR + 3.250% | | | | | | | | |
4.250% VRN 4/29/26 | | | 197,232 | | | | 196,400 | |
| | | | | | | | 270,028 | |
| | | Principal
Amount | | | Value | |
Leisure Time — 0.0% |
ClubCorp Holdings, Inc., 2017 Term Loan B, 3 mo. LIBOR + 2.750% | | | | | | | | |
3.004% VRN 9/18/24 | | $ | 34,642 | | | $ | 32,255 | |
Lodging — 0.1% |
Caesars Resort Collection LLC | | | | | | | | |
2017 1st Lien Term Loan B, 1 mo. LIBOR + 2.750% | | | | | | | | |
2.897% VRN 12/23/24 | | | 157,964 | | | | 154,786 | |
2020 Term Loan B1, 1 mo. LIBOR + 4.500% | | | | | | | | |
4.647% VRN 7/21/25 | | | 59,850 | | | | 59,869 | |
Golden Nugget, Inc., 2017 Incremental Term Loan B, 2 mo. LIBOR + 2.500% | | | | | | | | |
3.250% VRN 10/04/23 | | | 154,130 | | | | 148,471 | |
Hilton Worldwide Finance LLC, 2019 Term Loan B2, 1 mo. LIBOR + 1.750% | | | | | | | | |
1.898% VRN 6/22/26 | | | 65,000 | | | | 64,167 | |
| | | | | | | | 427,293 | |
Machinery - Diversified — 0.1% |
Titan Acquisition Ltd., 2018 Term Loan B, 6 mo. LIBOR + 3.000% | | | | | | | | |
3.267% VRN 3/28/25 | | | 39,593 | | | | 38,527 | |
Vertical US Newco, Inc., USD Term Loan B, 6 mo. LIBOR + 4.250% | | | | | | | | |
4.567% - 4.570% VRN 7/30/27 | | | 200,000 | | | | 200,678 | |
| | | | | | | | 239,205 | |
Media — 0.3% |
Arches Buyer Inc., 2020 Term Loan, 1 mo. LIBOR + 4.000% | | | | | | | | |
4.500% VRN 12/06/27 | | | 120,000 | | | | 120,060 | |
Cengage Learning, Inc., 2016 Term Loan B, 3 mo. LIBOR + 4.250% | | | | | | | | |
5.250% VRN 6/07/23 | | | 74,302 | | | | 71,101 | |
CSC Holdings LLC, 2019 Term Loan B5, 1 mo. LIBOR + 2.500% | | | | | | | | |
2.659% VRN 4/15/27 | | | 202,698 | | | | 200,586 | |
E.W. Scripps Co.(The), 2019 Term Loan B2, 1 mo. LIBOR + 2.500% | | | | | | | | |
2.647% VRN 5/01/26 | | | 306,276 | | | | 302,319 | |
Getty Images, Inc., 2019 USD Term Loan B, 1 mo. LIBOR + 4.500% | | | | | | | | |
4.688% VRN 2/19/26 | | | 34,273 | | | | 33,673 | |
Radiate Holdco, LLC, 2020 Term Loan, 1 mo. LIBOR + 3.500% | | | | | | | | |
4.250% VRN 9/25/26 | | | 135,000 | | | | 135,063 | |
| | | | | | | | 862,802 | |
The accompanying notes are an integral part of the financial statements.
47
MML Dynamic Bond Fund – Portfolio of Investments (Continued) |
| | | Principal
Amount | | | Value | |
Oil & Gas Services — 0.0% |
Illuminate Buyer, LLC, Term Loan, 1 mo. LIBOR + 4.000% | | | | | | | | |
4.147% VRN 6/30/27 | | $ | 85,000 | | | $ | 84,964 | |
Packaging & Containers — 0.1% |
Flex Acquisition Co., Inc. | | | | | | | | |
2018 Incremental Term Loan, 3 mo. LIBOR + 3.000% | | | | | | | | |
3.225% VRN 6/29/25 | | | 24,973 | | | | 24,642 | |
1st Lien Term Loan, 1 mo. LIBOR + 3.000%, 3 mo. LIBOR + 3.000% | | | | | | | | |
4.000% VRN 12/29/23 | | | 71,410 | | | | 70,941 | |
Graham Packaging Company, Inc. ., Term Loan, 1 mo. LIBOR + 3.750% | | | | | | | | |
4.500% VRN 8/04/27 | | | 78,373 | | | | 78,560 | |
Klockner-Pentaplast of America, Inc., USD 2017 Term Loan B2, 6 mo. LIBOR + 4.250% | | | | | | | | |
5.250% VRN 6/30/22 | | | 9,809 | | | | 9,774 | |
| | | | | | | | 183,917 | |
Pharmaceuticals — 0.1% |
Parexel International Corp., Term Loan B, 1 mo. LIBOR + 2.750% | | | | | | | | |
2.897% VRN 9/27/24 | | | 155,000 | | | | 152,167 | |
Pipelines — 0.0% |
Blackstone CQP Holdco LP, Term Loan B, 3 mo. LIBOR + 3.500% | | | | | | | | |
3.736% VRN 9/30/24 | | | 79,196 | | | | 78,899 | |
Buckeye Partners LP, 2019 Term Loan B, 1 mo. LIBOR + 2.750% | | | | | | | | |
2.897% VRN 11/01/26 | | | 69,475 | | | | 69,334 | |
| | | | | | | | 148,233 | |
Retail — 0.2% |
Bass Pro Group, LLC, Term Loan B, 1 mo. LIBOR + 5.000% | | | | | | | | |
5.750% VRN 9/25/24 | | | 59,538 | | | | 59,645 | |
Harbor Freight Tools USA, Inc., 2020 Term Loan B, 1 mo. LIBOR + 3.250% | | | | | | | | |
4.000% VRN 10/19/27 | | | 100,000 | | | | 99,833 | |
IRB Holding Corp, 2020 Term Loan B, 6 mo. LIBOR + 2.750% | | | | | | | | |
3.750% VRN 2/05/25 | | | 152,924 | | | | 151,446 | |
PetSmart, Inc., Consenting Term Loan, 3 mo. LIBOR + 3.500% | | | | | | | | |
4.500% VRN 3/11/22 | | | 182,661 | | | | 182,146 | |
| | | | | | | | 493,070 | |
| | | Principal
Amount | | | Value | |
Software — 0.8% |
Ascend Learning LLC, 2017 Term Loan B, | | | | | | | | |
4.000% 7/12/24 | | $ | 157,834 | | | $ | 156,848 | |
Castle US Holding Corp., USD Term Loan B, 3 mo. LIBOR + 3.750% | | | | | | | | |
4.004% VRN 1/29/27 | | | 159,000 | | | | 155,671 | |
Cornerstone OnDemand, Inc., Term Loan B, 1 mo. LIBOR + 4.250% | | | | | | | | |
4.394% VRN 4/22/27 | | | 85,521 | | | | 85,811 | |
Cvent, Inc., 1st Lien Term Loan, 1 mo. LIBOR + 3.750% | | | | | | | | |
3.897% VRN 11/29/24 | | | 98,982 | | | | 95,023 | |
Dun & Bradstreet Corp. (The), Term Loan, 1 mo. LIBOR + 3.750% | | | | | | | | |
3.898% VRN 2/06/26 | | | 173,838 | | | | 173,765 | |
Finastra USA, Inc. | | | | | | | | |
USD 1st Lien Term Loan, 6 mo. LIBOR + 3.500% | | | | | | | | |
4.500% VRN 6/13/24 | | | 63,845 | | | | 62,468 | |
USD 2nd Lien Term Loan, 6 mo. LIBOR + 7.250% | | | | | | | | |
8.250% VRN 6/13/25 | | | 20,000 | | | | 20,007 | |
Greeneden U.S. Holdings II, LLC, 2020 USD Term Loan B, 3 mo. LIBOR + 4.000% | | | | | | | | |
4.750% VRN 12/01/27 | | | 248,399 | | | | 248,632 | |
Hyland Software, Inc., 2018 1st Lien Term Loan, 1 mo. LIBOR + 3.500% | | | | | | | | |
4.250% VRN 7/01/24 | | | 222,714 | | | | 222,961 | |
ION Trading Technologies S.a.r.l., USD Incremental Term Loan B, 3 mo. LIBOR + 4.000% | | | | | | | | |
5.000% VRN 11/21/24 | | | 19,742 | | | | 19,671 | |
Milano Acquisition Corp., Term Loan B, 3 mo. LIBOR + 4.000% | | | | | | | | |
4.750% VRN 10/01/27 | | | 125,000 | | | | 124,791 | |
Mitchell International, Inc., 2017 1st Lien Term Loan, 1 mo. LIBOR + 3.250% | | | | | | | | |
3.397% VRN 11/29/24 | | | 148,473 | | | | 145,597 | |
Project Alpha Intermediate Holding, Inc., 2017 Term Loan B, 3 mo. LIBOR + 3.500% | | | | | | | | |
4.500% VRN 4/26/24 | | | 188,257 | | | | 186,296 | |
Solera LLC, USD Term Loan B, 1 mo. LIBOR + 2.750% | | | | | | | | |
2.897% VRN 3/03/23 | | | 182,901 | | | | 181,300 | |
Sophia, L.P., 2020 1st Lien Term Loan, 3 mo. LIBOR + 3.750% | | | | | | | | |
4.500% VRN 10/07/27 | | | 150,000 | | | | 150,107 | |
The accompanying notes are an integral part of the financial statements.
48
MML Dynamic Bond Fund – Portfolio of Investments (Continued) |
| | | Principal
Amount | | | Value | |
Tempo Acquisition LLC, 2020 Extended Term Loan, 1 mo. LIBOR + 3.250% | | | | | | | | |
3.750% VRN 11/02/26 | | $ | 201,768 | | | $ | 200,129 | |
Tibco Software, Inc., 2020 Term Loan B3, 1 mo. LIBOR + 3.750% | | | | | | | | |
3.900% VRN 6/30/26 | | | 129,313 | | | | 126,605 | |
Ultimate Software Group, Inc. (The) | | | | | | | | |
Term Loan B, 1 mo. LIBOR + 3.750% | | | | | | | | |
3.897% VRN 5/04/26 | | | 138,732 | | | | 138,516 | |
2020 Incremental Term Loan B, 3 mo. LIBOR + 4.000% | | | | | | | | |
4.750% VRN 5/04/26 | | | 104,738 | | | | 105,202 | |
VS Buyer, LLC, Term Loan B, 1 mo. LIBOR + 3.250% | | | | | | | | |
3.397% VRN 2/28/27 | | | 148,925 | | | | 147,994 | |
| | | | | | | | 2,747,394 | |
Telecommunications — 0.3% |
Altice France S.A., 2018 Term Loan B13, 3 mo. LIBOR + 4.000% | | | | | | | | |
4.237% VRN 8/14/26 | | | 154,101 | | | | 153,202 | |
Avaya, Inc. | | | | | | | | |
2018 Term Loan B, 1 mo. LIBOR + 4.250% | | | | | | | | |
4.409% VRN 12/15/24 | | | 31,219 | | | | 31,273 | |
2020 Term Loan B, 1 mo. LIBOR + 4.250% | | | | | | | | |
4.409% VRN 12/15/27 | | | 38,781 | | | | 38,765 | |
Delta TopCo, Inc., 2020 Term Loan B, 6 mo. LIBOR + 3.750% | | | | | | | | |
4.500% VRN 12/01/27 | | | 70,000 | | | | 69,927 | |
Intelsat Jackson Holdings S.A. | | | | | | | | |
2020 DIP Term Loan, 3 mo. LIBOR + 5.500% | | | | | | | | |
6.500% VRN 7/13/22 | | | 23,306 | | | | 23,737 | |
2017 Term Loan B3, Prime + 3.250% | | | | | | | | |
8.000% 11/27/23 | | | 155,000 | | | | 156,938 | |
Level 3 Financing, Inc., 2019 Term Loan B, 1 mo. LIBOR + 1.750% | | | | | | | | |
1.897% VRN 3/01/27 | | | 250,000 | | | | 245,573 | |
MLN US HoldCo LLC, 2018 1st Lien Term Loan, 1 mo. LIBOR + 4.500% | | | | | | | | |
4.652% VRN 11/30/25 | | | 19,798 | | | | 17,856 | |
Nexstar Broadcasting, Inc., 2019 Term Loan B4, 3 mo. LIBOR + 2.750% | | | | | | | | |
2.905% VRN 9/18/26 | | | 176,173 | | | | 174,787 | |
| | | Principal
Amount | | | Value | |
Zayo Group Holdings, Inc., USD Term Loan, 1 mo. LIBOR + 3.000% | | | | | | | | |
3.147% VRN 3/09/27 | | $ | 204,882 | | | $ | 203,345 | |
| | | | | | | | 1,115,403 | |
| | | | | | | | | |
TOTAL BANK LOANS (Cost $12,399,830) | | | | | | | 12,439,652 | |
| | | | | | | | | |
CORPORATE DEBT — 26.1% |
Advertising — 0.1% |
The Interpublic Group of Cos., Inc. | | | | | | | | |
5.400% 10/01/48 | | | 250,000 | | | | 342,541 | |
Aerospace & Defense — 0.4% |
The Boeing Co. | | | | | | | | |
2.950% 2/01/30 | | | 235,000 | | | | 243,051 | |
Lockheed Martin Corp. | | | | | | | | |
4.700% 5/15/46 | | | 280,000 | | | | 394,345 | |
Northrop Grumman Corp. | | | | | | | | |
5.150% 5/01/40 | | | 250,000 | | | | 345,550 | |
TransDigm, Inc. | | | | | | | | |
5.500% 11/15/27 | | | 100,000 | | | | 105,130 | |
6.250% 3/15/26 (c) | | | 150,000 | | | | 159,750 | |
6.375% 6/15/26 | | | 60,000 | | | | 62,100 | |
8.000% 12/15/25 (c) | | | 15,000 | | | | 16,580 | |
Triumph Group, Inc. | | | | | | | | |
7.750% 8/15/25 | | | 55,000 | | | | 50,256 | |
| | | | | | | | 1,376,762 | |
Agriculture — 0.4% |
Altria Group, Inc. | | | | | | | | |
4.800% 2/14/29 | | | 385,000 | | | | 461,267 | |
BAT Capital Corp. | | | | | | | | |
3.462% 9/06/29 | | | 595,000 | | | | 649,017 | |
Imperial Brands Finance PLC | | | | | | | | |
3.500% 7/26/26 (c) | | | 265,000 | | | | 293,318 | |
| | | | | | | | 1,403,602 | |
Airlines — 0.2% |
Delta Air Lines, Inc./SkyMiles IP Ltd. | | | | | | | | |
4.750% 10/20/28 (c) | | | 40,000 | | | | 43,660 | |
Latam Finance Ltd. | | | | | | | | |
6.875% 4/11/24 (c) (d) | | | 200,000 | | | | 102,200 | |
7.000% 3/01/26 (c) (d) | | | 300,000 | | | | 151,575 | |
Mileage Plus Holdings LLC / Mileage Plus Intellectual Property Assets Ltd. | | | | | | | | |
6.500% 6/20/27 (c) | | | 100,000 | | | | 107,500 | |
Southwest Airlines Co. | | | | | | | | |
4.750% 5/04/23 | | | 200,000 | | | | 217,377 | |
| | | | | | | | 622,312 | |
The accompanying notes are an integral part of the financial statements.
49
MML Dynamic Bond Fund – Portfolio of Investments (Continued) |
| | | Principal
Amount | | | Value | |
Auto Manufacturers — 0.4% |
Ford Motor Co. | | | | | | | | |
9.000% 4/22/25 | | $ | 65,000 | | | $ | 79,691 | |
General Motors Financial Co., Inc. 3 mo. USD LIBOR + .990% | | | | | | | | |
1.228% FRN 1/05/23 | | | 575,000 | | | | 574,454 | |
Hyundai Capital America | | | | | | | | |
1.800% 10/15/25 (c) | | | 5,000 | | | | 5,126 | |
2.650% 2/10/25 (c) | | | 410,000 | | | | 430,798 | |
Volkswagen Group of America Finance LLC | | | | | | | | |
4.250% 11/13/23 (c) | | | 220,000 | | | | 241,961 | |
| | | | | | | | 1,332,030 | |
Auto Parts & Equipment — 0.0% |
Clarios Global LP/Clarios US Finance Co. | | | | | | | | |
6.250% 5/15/26 (c) | | | 115,000 | | | | 123,338 | |
Banks — 4.1% |
Banco BBVA Peru SA 5 year CMT + 2.750% | | | | | | | | |
5.250% VRN 9/22/29 (c) | | | 100,000 | | | | 109,750 | |
Banco de Credito del Peru 5 year CMT + 3.000% | | | | | | | | |
3.125% VRN 7/01/30 (c) | | | 200,000 | | | | 204,752 | |
Banco de Credito del Peru/Panama 3 mo. USD LIBOR + 7.043% | | | | | | | | |
6.125% VRN 4/24/27 (c) | | | 150,000 | | | | 158,439 | |
Banco de Reservas de la Republica Dominicana | | | | | | | | |
7.000% 2/01/23 (c) | | | 200,000 | | | | 208,752 | |
Banco Internacional del Peru SAA Interbank 1 year CMT + 3.711% | | | | | | | | |
4.000% VRN 7/08/30 (c) | | | 150,000 | | | | 155,063 | |
Banco Latinoamericano de Comercio Exterior SA | | | | | | | | |
2.375% 9/14/25 (c) | | | 200,000 | | | | 204,802 | |
Banco Macro SA 5 year USD Swap + 5.463% | | | | | | | | |
6.750% VRN 11/04/26 (c) | | | 200,000 | | | | 171,502 | |
Banco Mercantil del Norte SA/Grand Cayman 10 year CMT + 5.353% | | | | | | | | |
7.625% VRN (c) (e) | | | 400,000 | | | | 453,004 | |
Banco Santander SA 3 mo. USD LIBOR + 1.090% | | | | | | | | |
1.303% FRN 2/23/23 | | | 400,000 | | | | 404,286 | |
Bank of America Corp. 3 mo. USD LIBOR + 1.210% | | | | | | | | |
3.974% VRN 2/07/30 | | | 350,000 | | | | 412,241 | |
| | | Principal
Amount | | | Value | |
Bank of Montreal 5 year USD Swap + 1.432% | | | | | | | | |
3.803% VRN 12/15/32 | | $ | 300,000 | | | $ | 340,047 | |
Bank of New Zealand | | | | | | | | |
3.500% 2/20/24 (c) | | | 530,000 | | | | 575,827 | |
The Bank of Nova Scotia | | | | | | | | |
1.625% 5/01/23 | | | 217,000 | | | | 223,244 | |
Barclays PLC 3 mo. USD LIBOR + 1.380% | | | | | | | | |
1.601% FRN 5/16/24 | | | 425,000 | | | | 430,729 | |
BDO Unibank, Inc. | | | | | | | | |
2.950% 3/06/23 (c) | | | 300,000 | | | | 311,419 | |
BNP Paribas SA SOFR + 1.507% | | | | | | | | |
3.052% VRN 1/13/31 (c) | | | 390,000 | | | | 425,579 | |
Citigroup, Inc. 3 mo. USD LIBOR + 1.100% | | | | | | | | |
1.322% FRN 5/17/24 | | | 635,000 | | | | 643,595 | |
Commonwealth Bank of Australia | | | | | | | | |
4.316% 1/10/48 (c) | | | 305,000 | | | | 388,958 | |
Credit Agricole SA | | | | | | | | |
3.750% 4/24/23 (c) | | | 535,000 | | | | 574,311 | |
Credit Suisse Group AG 3 mo. USD LIBOR + 1.240% | | | | | | | | |
1.460% FRN 6/12/24 (c) | | | 430,000 | | | | 436,095 | |
DBS Group Holdings Ltd. 5 year USD Swap + 2.390% | | | | | | | | |
3.600% VRN (c) (e) | | | 600,000 | | | | 604,500 | |
Gilex Holding Sarl | | | | | | | | |
8.500% 5/02/23 (c) | | | 150,000 | | | | 156,377 | |
8.500% 5/02/23 (c) | | | 150,000 | | | | 156,377 | |
HSBC Holdings PLC 3 mo. USD LIBOR + 1.380% | | | | | | | | |
1.600% FRN 9/12/26 | | | 510,000 | | | | 518,419 | |
JP Morgan Chase & Co. SOFR + 2.040% | | | | | | | | |
2.522% VRN 4/22/31 | | | 275,000 | | | | 295,587 | |
Lloyds Banking Group PLC 3 mo. USD LIBOR + 1.205% | | | | | | | | |
3.574% VRN 11/07/28 | | | 400,000 | | | | 451,697 | |
Macquarie Group Ltd. | | | | | | | | |
3 mo. USD LIBOR + 1.023% 3.189% VRN 11/28/23 (c) | | | 60,000 | | | | 62,724 | |
3 mo. USD LIBOR + 1.330% 4.150% VRN 3/27/24 (c) | | | 280,000 | | | | 300,861 | |
Malayan Banking Bhd 5 year USD Swap + 2.542% | | | | | | | | |
3.905% VRN 10/29/26 (c) | | | 300,000 | | | | 305,793 | |
Mitsubishi UFJ Financial Group, Inc. | | | | | | | | |
1.412% 7/17/25 | | | 435,000 | | | | 446,882 | |
The accompanying notes are an integral part of the financial statements.
50
MML Dynamic Bond Fund – Portfolio of Investments (Continued) |
| | | Principal
Amount | | | Value | |
Morgan Stanley 3 mo. USD LIBOR + 1.340% | | | | | | | | |
3.591% VRN 7/22/28 | | $ | 230,000 | | | $ | 262,590 | |
Multibank, Inc. | | | | | | | | |
4.375% 11/09/22 (c) | | | 200,000 | | | | 206,202 | |
NongHyup Bank | | | | | | | | |
1.250% 7/20/25 (c) | | | 200,000 | | | | 203,699 | |
Sumitomo Mitsui Financial Group, Inc. 3 mo. USD LIBOR + .740% | | | | | | | | |
0.958% FRN 1/17/23 | | | 615,000 | | | | 619,194 | |
The Bank of Nova Scotia | | | | | | | | |
3.400% 2/11/24 | | | 100,000 | | | | 108,817 | |
The Goldman Sachs Group, Inc. 3 mo. USD LIBOR + 1.170% | | | | | | | | |
1.391% FRN 5/15/26 | | | 515,000 | | | | 525,081 | |
Union Bank of the Philippines | | | | | | | | |
3.369% 11/29/22 (c) | | | 400,000 | | | | 417,522 | |
United Overseas Bank Ltd. | | | | | | | | |
5 year USD Swap + 1.654% 2.880% VRN 3/08/27 (c) | | | 200,000 | | | | 203,742 | |
5 year USD Swap + 1.794% 3.875% VRN (c) (e) | | | 300,000 | | | | 310,875 | |
Wells Fargo & Co. | | | | | | | | |
3 mo. USD LIBOR + 1.170% 2.879% VRN 10/30/30 | | | 115,000 | | | | 125,464 | |
3 mo. USD LIBOR + 1.170% 3.196% VRN 6/17/27 | | | 195,000 | | | | 216,247 | |
| | | | | | | | 13,331,045 | |
Beverages — 0.3% |
Anheuser-Busch InBev Worldwide, Inc. | | | | | | | | |
4.600% 4/15/48 | | | 355,000 | | | | 449,217 | |
Constellation Brands, Inc. | | | | | | | | |
2.875% 5/01/30 | | | 25,000 | | | | 27,395 | |
3.150% 8/01/29 | | | 200,000 | | | | 222,730 | |
Keurig Dr Pepper, Inc. | | | | | | | | |
3.800% 5/01/50 | | | 140,000 | | | | 167,679 | |
| | | | | | | | 867,021 | |
Biotechnology — 0.1% |
Royalty Pharma PLC | | | | | | | | |
3.300% 9/02/40 (c) | | | 235,000 | | | | 247,093 | |
Building Materials — 0.3% |
Builders FirstSource, Inc. | | | | | | | | |
5.000% 3/01/30 (c) | | | 80,000 | | | | 86,650 | |
6.750% 6/01/27 (c) | | | 110,000 | | | | 119,318 | |
Carrier Global Corp. | | | | | | | | |
3.377% 4/05/40 | | | 235,000 | | | | 257,801 | |
Griffon Corp. | | | | | | | | |
5.750% 3/01/28 | | | 170,000 | | | | 179,775 | |
| | | Principal
Amount | | | Value | |
Owens Corning | | | | | | | | |
4.400% 1/30/48 | | $ | 175,000 | | | $ | 210,748 | |
| | | | | | | | 854,292 | |
Chemicals — 0.5% |
Braskem Netherlands Finance BV 5 year CMT + 8.220% | | | | | | | | |
8.500% VRN 1/23/81 (c) | | | 200,000 | | | | 222,502 | |
DuPont de Nemours, Inc. | | | | | | | | |
5.419% 11/15/48 | | | 155,000 | | | | 225,239 | |
MEGlobal Canada ULC | | | | | | | | |
5.000% 5/18/25 (c) | | | 400,000 | | | | 450,000 | |
Nutrien Ltd. | | | | | | | | |
4.200% 4/01/29 | | | 265,000 | | | | 316,866 | |
Syngenta Finance NV | | | | | | | | |
5.676% 4/24/48 (c) | | | 200,000 | | | | 207,834 | |
WR Grace & Co-Conn | | | | | | | | |
4.875% 6/15/27 (c) | | | 165,000 | | | | 174,986 | |
| | | | | | | | 1,597,427 | |
Coal — 0.1% |
Peabody Energy Corp. | | | | | | | | |
6.000% 3/31/22 (c) | | | 105,000 | | | | 76,650 | |
SunCoke Energy Partners LP/SunCoke Energy Partners Finance Corp. | | | | | | | | |
7.500% 6/15/25 (c) | | | 120,000 | | | | 119,124 | |
| | | | | | | | 195,774 | |
Commercial Services — 0.3% |
Allied Universal Holdco LLC / Allied Universal Finance Corp. | | | | | | | | |
6.625% 7/15/26 (c) | | | 70,000 | | | | 74,641 | |
9.750% 7/15/27 (c) | | | 130,000 | | | | 141,700 | |
Garda World Security Corp. | | | | | | | | |
8.750% 5/15/25 (c) | | | 95,000 | | | | 98,800 | |
Jaguar Holding Co. II / Pharmaceutical Product Development LLC | | | | | | | | |
5.000% 6/15/28 (c) | | | 50,000 | | | | 53,375 | |
MPH Acquisition Holdings LLC | | | | | | | | |
5.750% 11/01/28 (c) | | | 120,000 | | | | 117,936 | |
Prime Security Services Borrower LLC / Prime Finance, Inc. | | | | | | | | |
3.375% 8/31/27 (c) | | | 110,000 | | | | 109,175 | |
PSA Treasury Pte Ltd. | | | | | | | | |
2.125% 9/05/29 (c) | | | 200,000 | | | | 211,083 | |
Verscend Escrow Corp. | | | | | | | | |
9.750% 8/15/26 (c) | | | 237,000 | | | | 256,849 | |
| | | | | | | | 1,063,559 | |
The accompanying notes are an integral part of the financial statements.
51
MML Dynamic Bond Fund – Portfolio of Investments (Continued) |
| | | Principal
Amount | | | Value | |
Computers — 0.2% |
Apple, Inc. | | | | | | | | |
4.650% 2/23/46 | | $ | 200,000 | | | $ | 284,291 | |
NetApp, Inc. | | | | | | | | |
1.875% 6/22/25 | | | 230,000 | | | | 240,240 | |
Tempo Acquisition LLC / Tempo Acquisition Finance Corp. | | | | | | | | |
6.750% 6/01/25 (c) | | | 190,000 | | | | 196,375 | |
| | | | | | | | 720,906 | |
Distribution & Wholesale — 0.0% |
Performance Food Group, Inc. | | | | | | | | |
5.500% 10/15/27 (c) | | | 115,000 | | | | 121,325 | |
Diversified Financial Services — 1.8% |
AerCap Ireland Capital DAC/AerCap Global Aviation Trust | | | | | | | | |
3.500% 1/15/25 | | | 450,000 | | | | 477,820 | |
Air Lease Corp. | | | | | | | | |
3.750% 2/01/22 | | | 370,000 | | | | 379,863 | |
Avolon Holdings Funding Ltd. | | | | | | | | |
3.250% 2/15/27 (c) | | | 340,000 | | | | 346,908 | |
Banco BTG Pactual SA 5 year CMT + 5.257% | | | | | | | | |
7.750% VRN 2/15/29 (c) | | | 200,000 | | | | 217,752 | |
BOC Aviation Ltd. 3 mo. USD LIBOR + 1.125% | | | | | | | | |
1.376% FRN 9/26/23 (c) | | | 565,000 | | | | 560,025 | |
Capital One Financial Corp. 3 mo. USD LIBOR + .720% | | | | | | | | |
0.934% FRN 1/30/23 | | | 140,000 | | | | 140,668 | |
Credito Real SAB de CV SOFOM ER 5 year CMT + 7.026% | | | | | | | | |
9.125% VRN (c) (e) | | | 200,000 | | | | 192,002 | |
Discover Financial Services | | | | | | | | |
4.100% 2/09/27 | | | 470,000 | | | | 541,478 | |
Global Aircraft Leasing Co. Ltd. | | | | | | | | |
6.500% 9/15/24 (c) | | | 108,806 | | | | 97,109 | |
Interoceanica IV Finance Ltd. | | | | | | | | |
0.000% 11/30/25 (c) | | | 624,586 | | | | 593,576 | |
Mexarrend SAPI de CV | | | | | | | | |
10.250% 7/24/24 (c) | | | 200,000 | | | | 182,002 | |
Nationstar Mortgage Holdings, Inc. | | | | | | | | |
5.500% 8/15/28 (c) | | | 75,000 | | | | 78,750 | |
Navient Corp. | | | | | | | | |
5.000% 3/15/27 | | | 60,000 | | | | 60,525 | |
NFP Corp. | | | | | | | | |
6.875% 8/15/28 (c) | | | 70,000 | | | | 74,738 | |
OneMain Finance Corp. | | | | | | | | |
5.375% 11/15/29 | | | 55,000 | | | | 61,875 | |
6.625% 1/15/28 | | | 120,000 | | | | 142,500 | |
| | | Principal
Amount | | | Value | |
Operadora de Servicios Mega SA de CV Sofom ER | | | | | | | | |
8.250% 2/11/25 (c) | | $ | 200,000 | | | $ | 208,500 | |
PennyMac Financial Services, Inc. | | | | | | | | |
5.375% 10/15/25 (c) | | | 105,000 | | | | 111,037 | |
SPARC EM SPC Panama Metro Line 2 SP | | | | | | | | |
0.000% 12/05/22 (c) | | | 100,819 | | | | 98,174 | |
Synchrony Financial | | | | | | | | |
3.950% 12/01/27 | | | 320,000 | | | | 358,922 | |
The Charles Schwab Corp. | | | | | | | | |
3.550% 2/01/24 | | | 340,000 | | | | 371,700 | |
Unifin Financiera SAB de CV 5 year CMT + 6.308% | | | | | | | | |
8.875% VRN (c) (e) | | | 600,000 | | | | 456,006 | |
| | | | | | | | 5,751,930 | |
Electric — 3.2% |
AES Andres BV/Dominican Power Partners/Empresa Generadora de Electricidad It | | | | | | | | |
7.950% 5/11/26 (c) | | | 500,000 | | | | 516,250 | |
AES Argentina Generacion SA | | | | | | | | |
7.750% 2/02/24 (c) | | | 150,000 | | | | 122,251 | |
AES Gener SA 5 year USD Swap + 4.644% | | | | | | | | |
7.125% VRN 3/26/79 (c) | | | 200,000 | | | | 222,000 | |
American Electric Power Co., Inc. | | | | | | | | |
2.950% 12/15/22 | | | 313,000 | | | | 326,890 | |
Arizona Public Service Co. | | | | | | | | |
3.350% 5/15/50 | | | 130,000 | | | | 150,955 | |
Calpine Corp. | | | | | | | | |
4.625% 2/01/29 (c) | | | 40,000 | | | | 41,131 | |
5.125% 3/15/28 (c) | | | 100,000 | | | | 105,197 | |
DTE Energy Co. | | | | | | | | |
3.800% 3/15/27 | | | 500,000 | | | | 574,368 | |
Duke Energy Corp. | | | | | | | | |
3.950% 8/15/47 | | | 240,000 | | | | 291,349 | |
Duke Energy Progress, Inc. | | | | | | | | |
4.150% 12/01/44 | | | 315,000 | | | | 399,737 | |
Empresa Electrica Angamos SA | | | | | | | | |
4.875% 5/25/29 (c) | | | 147,800 | | | | 147,800 | |
Empresa Electrica Guacolda SA | | | | | | | | |
4.560% 4/30/25 (c) | | | 400,000 | | | | 360,110 | |
Entergy Corp. | | | | | | | | |
2.800% 6/15/30 | | | 110,000 | | | | 118,798 | |
Eversource Energy | | | | | | | | |
1.650% 8/15/30 | | | 250,000 | | | | 248,987 | |
Georgia Power Co. | | | | | | | | |
2.200% 9/15/24 | | | 385,000 | | | | 405,601 | |
The accompanying notes are an integral part of the financial statements.
52
MML Dynamic Bond Fund – Portfolio of Investments (Continued) |
| | | Principal
Amount | | | Value | |
Korea East-West Power Co. Ltd. | | | | | | | | |
1.750% 5/06/25 (c) | | $ | 200,000 | | | $ | 208,854 | |
LLPL Capital Pte Ltd. | | | | | | | | |
6.875% 2/04/39 (c) | | | 281,700 | | | | 332,124 | |
Minejesa Capital BV | | | | | | | | |
4.625% 8/10/30 (c) | | | 400,000 | | | | 430,600 | |
Monongahela Power Co. | | | | | | | | |
5.400% 12/15/43 (c) | | | 145,000 | | | | 196,353 | |
NextEra Energy Capital Holdings, Inc. | | | | | | | | |
2.250% 6/01/30 | | | 750,000 | | | | 786,312 | |
3.550% 5/01/27 | | | 195,000 | | | | 222,027 | |
NRG Energy, Inc. | | | | | | | | |
2.000% 12/02/25 (c) | | | 145,000 | | | | 150,362 | |
3.625% 2/15/31 (c) | | | 145,000 | | | | 149,176 | |
Pacific Gas and Electric Co. | | | | | | | | |
2.500% 2/01/31 | | | 230,000 | | | | 230,840 | |
Pampa Energia SA | | | | | | | | |
9.125% 4/15/29 (c) | | | 150,000 | | | | 131,625 | |
PG&E Corp. | | | | | | | | |
5.000% 7/01/28 | | | 45,000 | | | | 47,925 | |
Pike Corp. | | | | | | | | |
5.500% 9/01/28 (c) | | | 85,000 | | | | 89,781 | |
PSEG Power LLC | | | | | | | | |
3.850% 6/01/23 | | | 260,000 | | | | 279,732 | |
Sierra Pacific Power Co. | | | | | | | | |
2.600% 5/01/26 | | | 1,000,000 | | | | 1,085,865 | |
The Southern Co. | | | | | | | | |
3.700% 4/30/30 | | | 500,000 | | | | 578,983 | |
State Grid Overseas Investment Ltd. | | | | | | | | |
3.750% 5/02/23 (c) | | | 200,000 | | | | 212,788 | |
Transelec SA | | | | | | | | |
3.875% 1/12/29 (c) | | | 250,000 | | | | 281,877 | |
Xcel Energy, Inc. | | | | | | | | |
3.300% 6/01/25 | | | 1,000,000 | | | | 1,099,179 | |
| | | | | | | | 10,545,827 | |
Electrical Components & Equipment — 0.0% |
Energizer Holdings, Inc. | | | | | | | | |
4.750% 6/15/28 (c) | | | 110,000 | | | | 115,775 | |
Electronics — 0.2% |
Arrow Electronics, Inc. | | | | | | | | |
3.875% 1/12/28 | | | 195,000 | | | | 219,889 | |
Roper Technologies, Inc. | | | | | | | | |
1.750% 2/15/31 | | | 455,000 | | | | 453,249 | |
| | | | | | | | 673,138 | |
Energy – Alternate Sources — 0.1% |
Empresa Electrica Cochrane SpA | | | | | | | | |
5.500% 5/14/27 (c) | | | 180,560 | | | | 190,491 | |
| | | Principal
Amount | | | Value | |
UEP Penonome II SA | | | | | | | | |
6.500% 10/01/38 (c) | | $ | 200,000 | | | $ | 208,354 | |
| | | | | | | | 398,845 | |
Engineering & Construction — 0.2% |
Sydney Airport Finance Co. Pty Ltd. | | | | | | | | |
3.375% 4/30/25 (c) | | | 300,000 | | | | 323,638 | |
3.625% 4/28/26 (c) | | | 300,000 | | | | 329,506 | |
| | | | | | | | 653,144 | |
Entertainment — 0.3% |
Bally’s Corp. | | | | | | | | |
6.750% 6/01/27 (c) | | | 135,000 | | | | 144,787 | |
Caesars Entertainment, Inc. | | | | | | | | |
6.250% 7/01/25 (c) | | | 105,000 | | | | 111,825 | |
Caesars Resort Collection LLC/CRC Finco, Inc. | | | | | | | | |
5.250% 10/15/25 (c) | | | 130,000 | | | | 131,377 | |
Cedar Fair LP | | | | | | | | |
5.250% 7/15/29 | | | 75,000 | | | | 77,216 | |
Lions Gate Capital Holdings LLC | | | | | | | | |
6.375% 2/01/24 (c) | | | 160,000 | | | | 164,000 | |
Live Nation Entertainment, Inc. | | | | | | | | |
6.500% 5/15/27 (c) | | | 90,000 | | | | 100,667 | |
Scientific Games International, Inc. | | | | | | | | |
7.250% 11/15/29 (c) | | | 75,000 | | | | 82,313 | |
Six Flags Theme Parks, Inc. | | | | | | | | |
7.000% 7/01/25 (c) | | | 180,000 | | | | 194,400 | |
| | | | | | | | 1,006,585 | |
Environmental Controls — 0.1% |
GFL Environmental, Inc. | | | | | | | | |
3.500% 9/01/28 (c) | | | 140,000 | | | | 142,538 | |
3.750% 8/01/25 (c) | | | 100,000 | | | | 102,500 | |
4.000% 8/01/28 (c) | | | 140,000 | | | | 141,050 | |
| | | | | | | | 386,088 | |
Foods — 0.6% |
Albertsons Cos., Inc. / Safeway, Inc. / New Albertsons LP / Albertson’s LLC | | | | | | | | |
3.500% 3/15/29 (c) | | | 75,000 | | | | 75,890 | |
4.625% 1/15/27 (c) | | | 95,000 | | | | 101,056 | |
B&G Foods, Inc. | | | | | | | | |
5.250% 9/15/27 | | | 50,000 | | | | 53,160 | |
Campbell Soup Co. | | | | | | | | |
2.375% 4/24/30 | | | 115,000 | | | | 121,476 | |
JBS USA LUX SA/JBS USA Finance, Inc. | | | | | | | | |
5.750% 6/15/25 (c) | | | 20,000 | | | | 20,650 | |
Kraft Heinz Foods Co. | | | | | | | | |
5.000% 7/15/35 | | | 40,000 | | | | 48,490 | |
The accompanying notes are an integral part of the financial statements.
53
MML Dynamic Bond Fund – Portfolio of Investments (Continued) |
| | | Principal
Amount | | | Value | |
5.200% 7/15/45 | | $ | 115,000 | | | $ | 136,741 | |
The Kroger Co. | | | | | | | | |
3.400% 4/15/22 | | | 195,000 | | | | 201,099 | |
Mondelez International, Inc. | | | | | | | | |
1.500% 5/04/25 | | | 130,000 | | | | 134,452 | |
1.875% 10/15/32 | | | 240,000 | | | | 243,730 | |
Pilgrim’s Pride Corp. | | | | | | | | |
5.875% 9/30/27 (c) | | | 85,000 | | | | 92,192 | |
Post Holdings, Inc. | | | | | | | | |
4.625% 4/15/30 (c) | | | 110,000 | | | | 115,716 | |
Smithfield Foods, Inc. | | | | | | | | |
4.250% 2/01/27 (c) | | | 365,000 | | | | 405,466 | |
Sysco Corp. | | | | | | | | |
3.300% 2/15/50 | | | 330,000 | | | | 345,072 | |
US Foods, Inc. | | | | | | | | |
6.250% 4/15/25 (c) | | | 15,000 | | | | 16,031 | |
| | | | | | | | 2,111,221 | |
Gas — 0.3% |
The Brooklyn Union Gas Co. | | | | | | | | |
4.487% 3/04/49 (c) | | | 335,000 | | | | 443,686 | |
The East Ohio Gas Co. | | | | | | | | |
3.000% 6/15/50 (c) | | | 245,000 | | | | 267,062 | |
ENN Energy Holdings Ltd. | | | | | | | | |
3.250% 7/24/22 (c) | | | 200,000 | | | | 205,380 | |
NiSource, Inc. | | | | | | | | |
3.600% 5/01/30 | | | 110,000 | | | | 127,289 | |
| | | | | | | | 1,043,417 | |
Health Care – Products — 0.0% |
Ortho-Clinical Diagnostics, Inc. / Ortho-Clinical Diagnostics SA | | | | | | | | |
7.250% 2/01/28 (c) | | | 140,000 | | | | 147,700 | |
Health Care – Services — 0.5% |
Anthem, Inc. | | | | | | | | |
2.375% 1/15/25 | | | 215,000 | | | | 229,953 | |
Centene Corp. | | | | | | | | |
3.000% 10/15/30 | | | 60,000 | | | | 63,594 | |
CHS/Community Health Systems, Inc. | | | | | | | | |
6.000% 1/15/29 (c) | | | 35,000 | | | | 37,809 | |
HCA, Inc. | | | | | | | | |
4.125% 6/15/29 | | | 175,000 | | | | 203,014 | |
Health Care Service Corp. | | | | | | | | |
3.200% 6/01/50 (c) | | | 50,000 | | | | 54,085 | |
Legacy LifePoint Health LLC | | | | | | | | |
4.375% 2/15/27 (c) | | | 90,000 | | | | 90,113 | |
Legacy LifePoint Health LLC | | | | | | | | |
6.750% 4/15/25 (c) | | | 55,000 | | | | 59,060 | |
Radiology Partners, Inc. | | | | | | | | |
9.250% 2/01/28 (c) | | | 95,000 | | | | 106,638 | |
| | | Principal
Amount | | | Value | |
RP Escrow Issuer LLC | | | | | | | | |
5.250% 12/15/25 (c) | | $ | 105,000 | | | $ | 109,731 | |
Select Medical Corp. | | | | | | | | |
6.250% 8/15/26 (c) | | | 150,000 | | | | 161,538 | |
Tenet Healthcare Corp. | | | | | | | | |
5.125% 11/01/27 (c) | | | 155,000 | | | | 164,106 | |
6.125% 10/01/28 (c) | | | 130,000 | | | | 135,457 | |
West Street Merger Sub, Inc. | | | | | | | | |
6.375% 9/01/25 (c) | | | 145,000 | | | | 148,625 | |
| | | | | | | | 1,563,723 | |
Home Builders — 0.0% |
Mattamy Group Corp. | | | | | | | | |
4.625% 3/01/30 (c) | | | 120,000 | | | | 127,200 | |
Home Furnishing — 0.1% |
Tempur Sealy International, Inc. | | | | | | | | |
5.500% 6/15/26 | | | 238,000 | | | | 247,687 | |
Household Products & Wares — 0.1% |
Kronos Acquisition Holdings, Inc. | | | | | | | | |
9.000% 8/15/23 (c) | | | 105,000 | | | | 107,572 | |
Kronos Acquisition Holdings, Inc. / KIK Custom Products, Inc. | | | | | | | | |
5.000% 12/31/26 (c) | | | 25,000 | | | | 26,080 | |
7.000% 12/31/27 (c) | | | 25,000 | | | | 26,176 | |
| | | | | | | | 159,828 | |
Insurance — 0.6% |
Alliant Holdings Intermediate LLC / Alliant Holdings Co-Issuer | | | | | | | | |
6.750% 10/15/27 (c) | | | 80,000 | | | | 85,600 | |
Athene Global Funding | | | | | | | | |
3.000% 7/01/22 (c) | | | 400,000 | | | | 413,635 | |
Berkshire Hathaway Finance Corp. | | | | | | | | |
2.850% 10/15/50 | | | 140,000 | | | | 149,936 | |
Equitable Holdings, Inc. | | | | | | | | |
3.900% 4/20/23 | | | 385,000 | | | | 414,216 | |
GTCR AP Finance, Inc. | | | | | | | | |
8.000% 5/15/27 (c) | | | 95,000 | | | | 103,165 | |
Prudential Financial, Inc. | | | | | | | | |
3.905% 12/07/47 | | | 185,000 | | | | 222,657 | |
Willis North America, Inc. | | | | | | | | |
4.500% 9/15/28 | | | 360,000 | | | | 433,907 | |
| | | | | | | | 1,823,116 | |
Internet — 0.3% |
Expedia, Inc. Co. | | | | | | | | |
3.800% 2/15/28 | | | 200,000 | | | | 214,827 | |
JD.com, Inc. | | | | | | | | |
3.375% 1/14/30 | | | 400,000 | | | | 434,660 | |
Tencent Holdings Ltd. | | | | | | | | |
2.390% 6/03/30 (c) | | | 300,000 | | | | 308,268 | |
The accompanying notes are an integral part of the financial statements.
54
MML Dynamic Bond Fund – Portfolio of Investments (Continued) |
| | | Principal
Amount | | | Value | |
Uber Technologies, Inc. | | | | | | | | |
7.500% 9/15/27 (c) | | $ | 90,000 | | | $ | 99,000 | |
| | | | | | | | 1,056,755 | |
Investment Companies — 0.1% |
Temasek Financial I Ltd. Co. | | | | | | | | |
1.000% 10/06/30 (c) | | | 350,000 | | | | 342,041 | |
Iron & Steel — 0.2% |
CSN Islands XII Corp. | | | | | | | | |
7.000% (c) (e) | | | 200,000 | | | | 198,310 | |
POSCO | | | | | | | | |
2.375% 1/17/23 (c) | | | 200,000 | | | | 206,110 | |
2.750% 7/15/24 (c) | | | 200,000 | | | | 211,324 | |
| | | | | | | | 615,744 | |
Leisure Time — 0.1% |
Carnival Corp. | | | | | | | | |
11.500% 4/01/23 (c) | | | 30,000 | | | | 34,701 | |
Viking Cruises Ltd. | | | | | | | | |
13.000% 5/15/25 (c) | | | 30,000 | | | | 35,850 | |
5.875% 9/15/27 (c) | | | 160,000 | | | | 156,477 | |
| | | | | | | | 227,028 | |
Lodging — 0.1% |
Boyd Gaming Corp. | | | | | | | | |
4.750% 12/01/27 | | | 150,000 | | | | 155,812 | |
Hilton Domestic Operating Co., Inc. | | | | | | | | |
5.375% 5/01/25 (c) | | | 20,000 | | | | 21,250 | |
5.750% 5/01/28 (c) | | | 20,000 | | | | 21,750 | |
MGM Resorts International | | | | | | | | |
6.750% 5/01/25 | | | 135,000 | | | | 146,124 | |
Wyndham Hotels & Resorts, Inc. | | | | | | | | |
4.375% 8/15/28 (c) | | | 75,000 | | | | 77,929 | |
| | | | | | | | 422,865 | |
Media — 0.5% |
CCO Holdings LLC/CCO Holdings Capital Corp. | | | | | | | | |
4.750% 3/01/30 (c) | | | 105,000 | | | | 113,295 | |
Cengage Learning, Inc. | | | | | | | | |
9.500% 6/15/24 (c) | | | 75,000 | | | | 70,125 | |
Charter Communications Operating LLC/Charter Communications Operating Capital | | | | | | | | |
4.908% 7/23/25 | | | 325,000 | | | | 377,471 | |
Comcast Corp. | | | | | | | | |
1.500% 2/15/31 | | | 295,000 | | | | 293,004 | |
3.400% 4/01/30 | | | 195,000 | | | | 225,489 | |
Diamond Sports Group LLC/Diamond Sports Finance Co. | | | | | | | | |
5.375% 8/15/26 (c) | | | 50,000 | | | | 40,625 | |
| | | Principal
Amount | | | Value | |
DISH DBS Corp. | | | | | | | | |
5.875% 11/15/24 | | $ | 40,000 | | | $ | 41,941 | |
GCI LLC | | | | | | | | |
4.750% 10/15/28 (c) | | | 90,000 | | | | 95,989 | |
Gray Escrow, Inc. | | | | | | | | |
7.000% 5/15/27 (c) | | | 145,000 | | | | 158,775 | |
iHeartCommunications, Inc. | | | | | | | | |
8.375% 5/01/27 | | | 25,000 | | | | 26,687 | |
Nexstar Broadcasting, Inc. | | | | | | | | |
5.625% 7/15/27 (c) | | | 65,000 | | | | 69,631 | |
Radiate Holdco LLC / Radiate Finance, Inc. | | | | | | | | |
4.500% 9/15/26 (c) | | | 75,000 | | | | 77,344 | |
Scripps Escrow II, Inc. | | | | | | | | |
3.875% 1/15/29 (c) | | | 40,000 | | | | 41,571 | |
Scripps Escrow, Inc. | | | | | | | | |
5.875% 7/15/27 (c) | | | 80,000 | | | | 83,576 | |
| | | | | | | | 1,715,523 | |
Mining — 0.4% |
Anglo American Capital PLC | | | | | | | | |
4.500% 3/15/28 (c) | | | 385,000 | | | | 452,079 | |
Arconic Corp. | | | | | | | | |
6.125% 2/15/28 (c) | | | 110,000 | | | | 118,594 | |
Novelis Corp. | | | | | | | | |
4.750% 1/30/30 (c) | | | 50,000 | | | | 53,868 | |
Vedanta Resources Co. | | | | | | | | |
9.250% 4/23/26 (c) | | | 200,000 | | | | 150,500 | |
Vedanta Resources Ltd. | | | | | | | | |
6.125% 8/09/24 (c) | | | 600,000 | | | | 430,500 | |
| | | | | | | | 1,205,541 | |
Miscellaneous - Manufacturing — 0.2% |
Bombardier, Inc. | | | | | | | | |
6.000% 10/15/22 (c) | | | 90,000 | | | | 88,349 | |
Gates Global LLC / Gates Corp. | | | | | | | | |
6.250% 1/15/26 (c) | | | 65,000 | | | | 68,250 | |
General Electric Co. | | | | | | | | |
5.875% 1/14/38 | | | 210,000 | | | | 284,621 | |
6.875% 1/10/39 | | | 110,000 | | | | 161,929 | |
| | | | | | | | 603,149 | |
Oil & Gas — 1.6% |
Apache Corp. | | | | | | | | |
4.375% 10/15/28 | | | 60,000 | | | | 62,459 | |
4.625% 11/15/25 | | | 40,000 | | | | 42,281 | |
Canacol Energy Ltd. | | | | | | | | |
7.250% 5/03/25 (c) | | | 200,000 | | | | 214,252 | |
Cenovus Energy, Inc. | | | | | | | | |
5.375% 7/15/25 | | | 65,000 | | | | 73,284 | |
The accompanying notes are an integral part of the financial statements.
55
MML Dynamic Bond Fund – Portfolio of Investments (Continued) |
| | | Principal
Amount | | | Value | |
Cosan Overseas Ltd. | | | | | | | | |
8.250% (c) (e) | | $ | 500,000 | | | $ | 513,755 | |
Delek & Avner Tamar Bond Ltd. | | | | | | | | |
5.082% 12/30/23 (c) | | | 100,000 | | | | 103,970 | |
Diamondback Energy, Inc. | | | | | | | | |
2.875% 12/01/24 | | | 59,000 | | | | 62,018 | |
EQT Corp. | | | | | | | | |
7.875% STEP 2/01/25 | | | 60,000 | | | | 68,325 | |
Exxon Mobil Corp. | | | | | | | | |
2.610% 10/15/30 | | | 165,000 | | | | 180,227 | |
4.227% 3/19/40 | | | 190,000 | | | | 236,616 | |
Gran Tierra Energy International Holdings Ltd. | | | | | | | | |
6.250% 2/15/25 (c) | | | 400,000 | | | | 272,004 | |
Hilcorp Energy I LP / Hilcorp Finance Co. | | | | | | | | |
6.250% 11/01/28 (c) | | | 100,000 | | | | 102,125 | |
Indigo Natural Resources LLC | | | | | | | | |
6.875% 2/15/26 (c) | | | 50,000 | | | | 51,125 | |
Marathon Petroleum Corp. | | | | | | | | |
5.125% 12/15/26 | | | 360,000 | | | | 429,112 | |
Medco Bell Pte Ltd. | | | | | | | | |
6.375% 1/30/27 (c) | | | 200,000 | | | | 204,100 | |
MEG Energy Corp. | | | | | | | | |
7.125% 2/01/27 (c) | | | 105,000 | | | | 108,412 | |
Occidental Petroleum Corp. | | | | | | | | |
3.500% 8/15/29 | | | 65,000 | | | | 59,486 | |
6.125% 1/01/31 | | | 85,000 | | | | 90,967 | |
6.625% 9/01/30 | | | 60,000 | | | | 65,145 | |
8.000% 7/15/25 | | | 50,000 | | | | 56,950 | |
Parkland Corp. | | | | | | | | |
5.875% 7/15/27 (c) | | | 135,000 | | | | 145,966 | |
Petronas Capital Ltd. | | | | | | | | |
3.500% 4/21/30 (c) | | | 200,000 | | | | 229,552 | |
Pioneer Natural Resources Co. | | | | | | | | |
1.900% 8/15/30 | | | 300,000 | | | | 297,350 | |
PTTEP Treasury Center Co. Ltd. | | | | | | | | |
2.587% 6/10/27 (c) | | | 200,000 | | | | 208,609 | |
QEP Resources, Inc. | | | | | | | | |
5.625% 3/01/26 | | | 165,000 | | | | 180,931 | |
Reliance Industries Ltd. | | | | | | | | |
5.400% 2/14/22 (c) | | | 500,000 | | | | 523,503 | |
Saudi Arabian Oil Co. | | | | | | | | |
1.625% 11/24/25 (c) | | | 200,000 | | | | 204,945 | |
Sunoco LP / Sunoco Finance Corp. | | | | | | | | |
4.500% 5/15/29 (c) | | | 35,000 | | | | 36,400 | |
5.500% 2/15/26 | | | 130,000 | | | | 133,250 | |
6.000% 4/15/27 | | | 90,000 | | | | 95,672 | |
| | | Principal
Amount | | | Value | |
Transocean Poseidon Ltd. | | | | | | | | |
6.875% 2/01/27 (c) | | $ | 150,000 | | | $ | 136,500 | |
Transocean, Inc. | | | | | | | | |
11.500% 1/30/27 (c) | | | 36,000 | | | | 25,740 | |
WPX Energy, Inc. | | | | | | | | |
4.500% 1/15/30 | | | 65,000 | | | | 68,900 | |
5.875% 6/15/28 | | | 60,000 | | | | 65,402 | |
| | | | | | | | 5,349,333 | |
Oil & Gas Services — 0.1% |
Halliburton Co. | | | | | | | | |
2.920% 3/01/30 | | | 125,000 | | | | 131,743 | |
Schlumberger Investment SA | | | | | | | | |
2.650% 6/26/30 | | | 85,000 | | | | 90,744 | |
USA Compression Partners LP / USA Compression Finance Corp. | | | | | | | | |
6.875% 9/01/27 | | | 185,000 | | | | 197,502 | |
| | | | | | | | 419,989 | |
Packaging & Containers — 0.3% |
CCL Industries, Inc. | | | | | | | | |
3.050% 6/01/30 (c) | | | 165,000 | | | | 179,939 | |
Flex Acquisition Co., Inc. | | | | | | | | |
6.875% 1/15/25 (c) | | | 90,000 | | | | 91,350 | |
Packaging Corp. of America | | | | | | | | |
3.400% 12/15/27 | | | 215,000 | | | | 242,239 | |
Silgan Holdings, Inc. | | | | | | | | |
4.125% 2/01/28 | | | 110,000 | | | | 114,263 | |
WRKCo, Inc. | | | | | | | | |
3.750% 3/15/25 | | | 370,000 | | | | 412,457 | |
| | | | | | | | 1,040,248 | |
Pharmaceuticals — 1.2% |
AbbVie, Inc. | | | | | | | | |
4.700% 5/14/45 | | | 260,000 | | | | 340,136 | |
Bausch Health Cos., Inc. | | | | | | | | |
6.250% 2/15/29 (c) | | | 170,000 | | | | 184,662 | |
Becton Dickinson and Co. | | | | | | | | |
2.894% 6/06/22 | | | 520,000 | | | | 537,491 | |
Bristol-Myers Squibb Co. | | | | | | | | |
4.350% 11/15/47 | | | 355,000 | | | | 478,142 | |
Cigna Corp. | | | | | | | | |
3 mo. USD LIBOR + .890% 1.127% FRN 7/15/23 | | | 205,000 | | | | 207,320 | |
4.900% 12/15/48 | | | 265,000 | | | | 364,411 | |
CVS Health Corp. | | | | | | �� | | |
5.050% 3/25/48 | | | 180,000 | | | | 243,950 | |
Eli Lilly and Co. | | | | | | | | |
2.250% 5/15/50 | | | 463,000 | | | | 455,068 | |
Merck & Co., Inc. | | | | | | | | |
3.400% 3/07/29 | | | 385,000 | | | | 447,898 | |
The accompanying notes are an integral part of the financial statements.
56
MML Dynamic Bond Fund – Portfolio of Investments (Continued) |
| | | Principal
Amount | | | Value | |
Shire Acquisitions Investments Ireland DAC | | | | | | | | |
2.875% 9/23/23 | | $ | 380,000 | | | $ | 402,963 | |
Viatris, Inc. | | | | | | | | |
1.650% 6/22/25 (c) | | | 135,000 | | | | 139,630 | |
| | | | | | | | 3,801,671 | |
Pipelines — 1.1% |
Antero Midstream Partners LP / Antero Midstream Finance Corp. | | | | | | | | |
5.750% 3/01/27 (c) | | | 54,000 | | | | 53,055 | |
Cheniere Energy Partners LP | | | | | | | | |
5.250% 10/01/25 | | | 30,000 | | | | 30,787 | |
5.625% 10/01/26 | | | 95,000 | | | | 98,800 | |
Enable Midstream Partners LP | | | | | | | | |
4.400% 3/15/27 | | | 120,000 | | | | 121,094 | |
Energy Transfer Operating LP | | | | | | | | |
4.750% 1/15/26 | | | 420,000 | | | | 475,227 | |
EQM Midstream Partners LP | | | | | | | | |
6.500% 7/01/27 (c) | | | 120,000 | | | | 135,124 | |
Fermaca Enterprises S de RL de CV | | | | | | | | |
6.375% 3/30/38 (c) | | | 211,835 | | | | 244,987 | |
GNL Quintero SA | | | | | | | | |
4.634% 7/31/29 (c) | | | 250,000 | | | | 278,500 | |
Hess Midstream Operations LP | | | | | | | | |
5.125% 6/15/28 (c) | | | 110,000 | | | | 114,984 | |
Kinder Morgan Energy Partners LP | | | | | | | | |
6.950% 1/15/38 | | | 300,000 | | | | 410,493 | |
NuStar Logistics LP | | | | | | | | |
6.375% 10/01/30 | | | 90,000 | | | | 101,952 | |
ONEOK, Inc. | | | | | | | | |
3.400% 9/01/29 | | | 90,000 | | | | 96,319 | |
Peru LNG SRL | | | | | | | | |
5.375% 3/22/30 (c) | | | 250,000 | | | | 223,000 | |
Rattler Midstream LP | | | | | | | | |
5.625% 7/15/25 (c) | | | 55,000 | | | | 58,094 | |
Sabine Pass Liquefaction LLC | | | | | | | | |
5.000% 3/15/27 | | | 170,000 | | | | 200,441 | |
Sunoco Logistics Partners Operations LP | | | | | | | | |
3.900% 7/15/26 | | | 750,000 | | | | 821,825 | |
Targa Resources Partners LP/Targa Resources Partners Finance Corp. | | | | | | | | |
5.500% 3/01/30 | | | 100,000 | | | | 108,570 | |
Western Midstream Operating LP | | | | | | | | |
4.100% STEP 2/01/25 | | | 75,000 | | | | 77,293 | |
| | | | | | | | 3,650,545 | |
| | | Principal
Amount | | | Value | |
Real Estate — 0.0% |
Realogy Group LLC / Realogy Co-Issuer Corp. | | | | | | | | |
7.625% 6/15/25 (c) | | $ | 50,000 | | | $ | 54,286 | |
Real Estate Investment Trusts (REITS) — 1.1% |
Alexandria Real Estate Equities, Inc. | | | | | | | | |
4.000% 1/15/24 | | | 320,000 | | | | 352,176 | |
American Tower Corp. | | | | | | | | |
3.375% 10/15/26 | | | 472,000 | | | | 530,222 | |
3.600% 1/15/28 | | | 370,000 | | | | 420,269 | |
Boston Properties LP | | | | | | | | |
3.400% 6/21/29 | | | 335,000 | | | | 373,948 | |
Crown Castle International Corp. | | | | | | | | |
3.650% 9/01/27 | | | 360,000 | | | | 406,435 | |
3.700% 6/15/26 | | | 700,000 | | | | 788,825 | |
4.000% 3/01/27 | | | 225,000 | | | | 258,402 | |
Equinix, Inc. | | | | | | | | |
1.800% 7/15/27 | | | 130,000 | | | | 133,821 | |
ESH Hospitality, Inc. | | | | | | | | |
5.250% 5/01/25 (c) | | | 70,000 | | | | 71,750 | |
Iron Mountain, Inc. | | | | | | | | |
4.500% 2/15/31 (c) | | | 60,000 | | | | 62,850 | |
National Retail Properties, Inc. | | | | | | | | |
2.500% 4/15/30 | | | 115,000 | | | | 118,383 | |
Simon Property Group LP | | | | | | | | |
2.450% 9/13/29 | | | 25,000 | | | | 26,261 | |
VICI Properties LP / VICI Note Co., Inc. | | | | | | | | |
3.750% 2/15/27 (c) | | | 15,000 | | | | 15,337 | |
4.125% 8/15/30 (c) | | | 60,000 | | | | 63,338 | |
| | | | | | | | 3,622,017 | |
Retail — 0.8% |
Asbury Automotive Group, Inc. | | | | | | | | |
4.500% 3/01/28 | | | 16,000 | | | | 16,680 | |
4.750% 3/01/30 | | | 16,000 | | | | 17,160 | |
Beacon Roofing Supply, Inc. | | | | | | | | |
4.875% 11/01/25 (c) | | | 160,000 | | | | 163,800 | |
CK Hutchison International 20 Ltd. | | | | | | | | |
2.500% 5/08/30 (c) | | | 200,000 | | | | 211,205 | |
Costco Wholesale Corp. | | | | | | | | |
1.750% 4/20/32 | | | 75,000 | | | | 77,949 | |
Dollar Tree, Inc. | | | | | | | | |
4.000% 5/15/25 | | | 375,000 | | | | 423,454 | |
Golden Nugget, Inc. | | | | | | | | |
6.750% 10/15/24 (c) | | | 175,000 | | | | 173,743 | |
Group 1 Automotive, Inc. | | | | | | | | |
4.000% 8/15/28 (c) | | | 25,000 | | | | 25,770 | |
The accompanying notes are an integral part of the financial statements.
57
MML Dynamic Bond Fund – Portfolio of Investments (Continued) |
| | | Principal
Amount | | | Value | |
The Home Depot, Inc. | | | | | | | | |
3.900% 6/15/47 | | $ | 170,000 | | | $ | 217,106 | |
IRB Holding Corp. | | | | | | | | |
6.750% 2/15/26 (c) | | | 120,000 | | | | 123,900 | |
7.000% 6/15/25 (c) | | | 60,000 | | | | 65,550 | |
McDonald’s Corp. | | | | | | | | |
3.600% 7/01/30 | | | 205,000 | | | | 240,270 | |
4.450% 3/01/47 | | | 190,000 | | | | 246,874 | |
PetSmart, Inc. | | | | | | | | |
5.875% 6/01/25 (c) | | | 39,000 | | | | 40,073 | |
7.125% 3/15/23 (c) | | | 75,000 | | | | 75,000 | |
Staples, Inc. | | | | | | | | |
7.500% 4/15/26 (c) | | | 115,000 | | | | 120,091 | |
Target Corp. | | | | | | | | |
3.375% 4/15/29 | | | 405,000 | | | | 474,769 | |
| | | | | | | | 2,713,394 | |
Semiconductors — 0.5% |
Broadcom, Inc. | | | | | | | | |
3.150% 11/15/25 | | | 295,000 | | | | 322,126 | |
Lam Research Corp. | | | | | | | | |
2.875% 6/15/50 | | | 185,000 | | | | 199,342 | |
Marvell Technology Group Ltd. | | | | | | | | |
4.200% 6/22/23 | | | 385,000 | | | | 416,631 | |
Micron Technology, Inc. | | | | | | | | |
2.497% 4/24/23 | | | 190,000 | | | | 197,983 | |
NXP BV / NXP Funding LLC / NXP USA, Inc. | | | | | | | | |
3.875% 6/18/26 (c) | | | 190,000 | | | | 217,574 | |
Texas Instruments, Inc. | | | | | | | | |
1.750% 5/04/30 | | | 105,000 | | | | 108,893 | |
| | | | | | | | 1,462,549 | |
Software — 0.2% |
Activision Blizzard, Inc. | | | | | | | | |
1.350% 9/15/30 | | | 230,000 | | | | 225,795 | |
BY Crown Parent LLC / BY Bond Finance, Inc. | | | | | | | | |
4.250% 1/31/26 (c) | | | 50,000 | | | | 51,250 | |
Oracle Corp. | | | | | | | | |
3.850% 4/01/60 | | | 240,000 | | | | 295,132 | |
| | | | | | | | 572,177 | |
Telecommunications — 1.0% |
AT&T, Inc. | | | | | | | | |
3.500% 9/15/53 (c) | | | 679,000 | | | | 679,997 | |
Avaya, Inc. | | | | | | | | |
6.125% 9/15/28 (c) | | | 80,000 | | | | 85,461 | |
CenturyLink, Inc. | | | | | | | | |
4.000% 2/15/27 (c) | | | 85,000 | | | | 87,762 | |
5.125% 12/15/26 (c) | | | 105,000 | | | | 110,876 | |
| | | Principal
Amount | | | Value | |
Corning, Inc. | | | | | | | | |
4.375% 11/15/57 | | $ | 180,000 | | | $ | 225,098 | |
Digicel Group 0.5 Ltd. | | | | | | | | |
7.000% (c) (e) | | | 78,040 | | | | 21,461 | |
8.000% 4/01/25 (c) | | | 52,337 | | | | 27,346 | |
Front Range BidCo, Inc. | | | | | | | | |
4.000% 3/01/27 (c) | | | 90,000 | | | | 90,225 | |
6.125% 3/01/28 (c) | | | 50,000 | | | | 52,875 | |
Frontier Communications Corp. | | | | | | | | |
5.000% 5/01/28 (c) | | | 60,000 | | | | 62,550 | |
5.875% 10/15/27 (c) | | | 30,000 | | | | 32,437 | |
6.750% 5/01/29 (c) | | | 30,000 | | | | 32,100 | |
Gogo Intermediate Holdings LLC / Gogo Finance Co., Inc. | | | | | | | | |
9.875% 5/01/24 (c) | | | 75,000 | | | | 80,305 | |
GTT Communications, Inc. | | | | | | | | |
7.875% 12/31/24 (c) | | | 50,000 | | | | 20,000 | |
Intelsat Jackson Holdings SA | | | | | | | | |
8.500% 10/15/24 (c) (d) | | | 85,000 | | | | 60,775 | |
Ooredoo International Finance Ltd. | | | | | | | | |
3.250% 2/21/23 (c) | | | 400,000 | | | | 418,000 | |
T-Mobile USA, Inc. | | | | | | | | |
2.550% 2/15/31 (c) | | | 500,000 | | | | 525,035 | |
3.500% 4/15/25 (c) | | | 220,000 | | | | 243,096 | |
Telesat Canada/telesat L | | | | | | | | |
6.500% 10/15/27 (c) | | | 40,000 | | | | 41,800 | |
Verizon Communications, Inc. | | | | | | | | |
2.650% 11/20/40 | | | 25,000 | | | | 25,244 | |
4.400% 11/01/34 | | | 335,000 | | | | 418,057 | |
| | | | | | | | 3,340,500 | |
Transportation — 0.6% |
Burlington Northern Santa Fe LLC | | | | | | | | |
3.050% 2/15/51 | | | 85,000 | | | | 96,803 | |
CSX Corp. | | | | | | | | |
3.800% 11/01/46 | | | 400,000 | | | | 479,176 | |
Empresa de Transporte de Pasajeros Metro SA | | | | | | | | |
5.000% 1/25/47 (c) | | | 750,000 | | | | 956,250 | |
FedEx Corp. | | | | | | | | |
4.750% 11/15/45 | | | 195,000 | | | | 253,777 | |
Fideicomiso PA Pacifico Tres | | | | | | | | |
8.250% 1/15/35 (c) | | | 200,000 | | | | 241,600 | |
| | | | | | | | 2,027,606 | |
Trucking & Leasing — 0.1% |
Penske Truck Leasing Co. LP/PTL Finance Corp. | | | | | | | | |
4.200% 4/01/27 (c) | | | 185,000 | | | | 212,841 | |
The accompanying notes are an integral part of the financial statements.
58
MML Dynamic Bond Fund – Portfolio of Investments (Continued) |
| | | Principal
Amount | | | Value | |
Water — 0.1% |
Essential Utilities, Inc. | | | | | | | | |
2.704% 4/15/30 | | $ | 220,000 | | | $ | 238,500 | |
| | | | | | | | | |
TOTAL CORPORATE DEBT (Cost $80,189,210) | | | | | | | 85,648,553 | |
| | | | | | | | | |
MUNICIPAL OBLIGATIONS — 0.1% |
Missouri Highway & Transportation Commission, Revenue Bonds | | | | | | | | |
5.063% 5/01/24 | | | 135,000 | | | | 153,689 | |
State of California BAB, General Obligation | | | | | | | | |
7.550% 4/01/39 | | | 190,000 | | | | 333,602 | |
| | | | | | | | 487,291 | |
| | | | | | | | | |
TOTAL MUNICIPAL OBLIGATIONS (Cost $428,519) | | | | | | | 487,291 | |
| | | | | | | | | |
NON-U.S. GOVERNMENT AGENCY OBLIGATIONS — 25.4% |
Commercial Mortgage-Backed Securities — 7.9% |
BANK | | | | | | | | |
Series 2020-BN28, Class AS, 2.140% 3/15/63 | | | 380,000 | | | | 384,192 | |
Series 2018-BN10, Class C, 4.163% VRN 2/15/61 (f) | | | 310,000 | | | | 326,970 | |
Series 2017-BNK5, Class C, 4.254% VRN 6/15/60 (f) | | | 200,000 | | | | 212,123 | |
Benchmark Mortgage Trust | | | | | | | | |
Series 2020-B19, Class AS, 2.148% 9/15/53 | | | 380,000 | | | | 392,470 | |
Series 2020-B18, Class C, 3.647% VRN 7/15/53 (f) | | | 354,000 | | | | 373,455 | |
Series 2020-B18, Class AGNF, 4.139% 7/15/53 (c) | | | 378,000 | | | | 372,549 | |
BFLD 2019-DPLO, Series 2019-DPLO, Class E, 1 mo. USD LIBOR + 2.240% | | | | | | | | |
2.399% FRN 10/15/34 (c) | | | 491,000 | | | | 461,185 | |
BX Trust, Series 2019-OC11, Class E, | | | | | | | | |
4.076% VRN 12/09/41 (c) (f) | | | 391,000 | | | | 390,309 | |
CFCRE Commercial Mortgage Trust, Series 2016-C3, Class XA, | | | | | | | | |
0.996% VRN 1/10/48 (f) | | | 5,564,858 | | | | 235,868 | |
CHT Mortgage Trust | | | | | | | | |
Series 2017-CSMO, Class E, 1 mo. USD LIBOR + 3.000% 3.159% FRN 11/15/36 (c) | | | 273,000 | | | | 261,407 | |
Series 2017-CSMO, Class F, 1 mo. USD LIBOR + 3.741% 3.900% FRN 11/15/36 (c) | | | 320,000 | | | | 308,100 | |
| | | Principal
Amount | | | Value | |
Citigroup Commercial Mortgage Trust | | | | | | | | |
Series 2016-GC36, Class D, 2.850% 2/10/49 (c) | | $ | 201,000 | | | $ | 133,276 | |
Series 2019-GC41, Class B, 3.199% 8/10/56 | | | 377,000 | | | | 405,943 | |
Series 2020-420K, Class D, 3.312% VRN 11/10/42 (c) (f) | | | 200,000 | | | | 198,370 | |
Series 2020-420K, Class E, 3.312% VRN 11/10/42 (c) (f) | | | 200,000 | | | | 187,288 | |
Series 2015-GC31, Class C, 4.055% VRN 6/10/48 (f) | | | 700,000 | | | | 684,222 | |
Series 2017-C4, Class B, 4.096% VRN 10/12/50 (f) | | | 340,000 | | | | 377,502 | |
COMM Mortgage Trust | | | | | | | | |
Series 2014-CR20, Class C, 4.511% VRN 11/10/47 (f) | | | 411,000 | | | | 433,906 | |
Series 2015-LC23, Class C, 4.617% VRN 10/10/48 (f) | | | 470,000 | | | | 466,688 | |
Commercial Mortgage Pass-Through Certificates, Series 2016-CR28, Class C, | | | | | | | | |
4.639% VRN 2/10/49 (f) | | | 465,000 | | | | 469,256 | |
CSAIL Commercial Mortgage Trust | | | | | | | | |
Series 2015-C1, Class XA, 0.827% VRN 4/15/50 (f) | | | 8,156,958 | | | | 224,892 | |
Series 2020-C19, Class C, 3.614% VRN 3/15/53 (f) | | | 332,000 | | | | 346,586 | |
Series 2019-C16, Class B, 3.885% 6/15/52 | | | 334,000 | | | | 372,803 | |
Series 2016-C6, Class B, 3.924% VRN 1/15/49 (f) | | | 298,000 | | | | 326,230 | |
Series 2015-C4, Class C, 4.563% VRN 11/15/48 (f) | | | 427,000 | | | | 456,634 | |
Series 2018-C14, Class C, 4.891% VRN 11/15/51 (f) | | | 405,000 | | | | 430,031 | |
Series 2016-C6, Class C, 4.953% VRN 1/15/49 (f) | | | 378,000 | | | | 391,932 | |
DBGS Mortgage Trust, Series 2018-5BP, Class F, 1 mo. USD LIBOR + 2.450% | | | | | | | | |
2.609% FRN 6/15/33 (c) | | | 550,000 | | | | 502,437 | |
Fontainebleau Miami Beach Trust | | | | | | | | |
Series 2019-FBLU, Class E, 3.963% VRN 12/10/36 (c) (f) | | | 262,000 | | | | 262,483 | |
Series 2019-FBLU, Class G, 3.963% VRN 12/10/36 (c) (f) | | | 236,000 | | | | 219,772 | |
Grace Trust, Series 2020-GRCE, Class D, | | | | | | | | |
2.680% VRN 12/10/40 (c) (f) | | | 125,000 | | | | 123,289 | |
GS Mortgage Securities Trust | | | | | | | | |
Series 2015-GS1, Class XA, 0.762% VRN 11/10/48 (f) | | | 7,855,254 | | | | 255,525 | |
The accompanying notes are an integral part of the financial statements.
59
MML Dynamic Bond Fund – Portfolio of Investments (Continued) |
| | | Principal
Amount | | | Value | |
Series 2018-RIVR, Class C, 1 mo. USD LIBOR + 1.250% 1.409% FRN 7/15/35 (c) | | $ | 329,000 | | | $ | 305,825 | |
Series 2013-GC10, Class XA, 1.489% VRN 2/10/46 (f) | | | 4,388,781 | | | | 116,497 | |
Series 2019-SOHO, Class E, 1 mo. USD LIBOR + 1.875% 2.034% FRN 6/15/36 (c) | | | 318,000 | | | | 295,137 | |
Series 2014-GC26, Class D, 4.511% VRN 11/10/47 (c) (f) | | | 1,258,000 | | | | 818,411 | |
Series 2016-GS2, Class C, 4.709% VRN 5/10/49 (f) | | | 340,000 | | | | 370,561 | |
GSCG Trust, Series 2019-600C, Class E, | | | | | | | | |
3.985% VRN 9/06/34 (c) (f) | | | 497,000 | | | | 478,348 | |
HPLY Trust, Series 2019-HIT, Class F, 1 mo. USD LIBOR + 3.150% | | | | | | | | |
3.309% FRN 11/15/36 (c) | | | 409,208 | | | | 370,491 | |
JP Morgan Chase Commercial Mortgage Securities Trust | | | | | | | | |
Series 2015-JP1, Class XA, 0.936% VRN 1/15/49 (f) | | | 4,025,872 | | | | 148,307 | |
Series 2016-JP2, Class B, 3.460% 8/15/49 | | | 174,000 | | | | 181,093 | |
JPMBB Commercial Mortgage Securities Trust | | | | | | | | |
Series 2015-C30, Class XA, 0.507% VRN 7/15/48 (f) | | | 9,346,656 | | | | 186,855 | |
Series 2015-C29, Class XA, 0.654% VRN 5/15/48 (f) | | | 7,779,231 | | | | 187,626 | |
Series 2014-C25, Class XA, 0.846% VRN 11/15/47 (f) | | | 4,121,147 | | | | 110,573 | |
Series 2015-C28, Class XA, 0.970% VRN 10/15/48 (f) | | | 6,702,455 | | | | 211,953 | |
Series 2015-C27, Class D, 3.807% VRN 2/15/48 (c) (f) | | | 704,000 | | | | 564,024 | |
Series 2015-C28, Class B, 3.986% 10/15/48 | | | 340,000 | | | | 359,730 | |
Series 2015-C29, Class C, 4.197% VRN 5/15/48 (f) | | | 162,000 | | | | 158,969 | |
Series 2015-C33, Class C, 4.612% VRN 12/15/48 (f) | | | 527,000 | | | | 526,532 | |
Series 2015-C32, Class C, 4.649% VRN 11/15/48 (f) | | | 87,000 | | | | 79,451 | |
JPMDB Commercial Mortgage Securities Trust, Series 2020-COR7, Class C, | | | | | | | | |
3.726% VRN 5/13/53 (f) | | | 327,000 | | | | 353,553 | |
MF1 Ltd., Series 2020-FL3, Class AS, 1 mo. USD LIBOR + 2.850% | | | | | | | | |
3.009% FRN 7/15/35 (c) | | | 318,000 | | | | 321,457 | |
| | | Principal
Amount | | | Value | |
Morgan Stanley Bank of America Merrill Lynch Trust | | | | | | | | |
Series 2015-C27, Class D, 3.237% VRN 12/15/47 (c) (f) | | $ | 504,000 | | | $ | 437,063 | |
Series 2015-C23, Class C, 4.145% VRN 7/15/50 (f) | | | 650,000 | | | | 682,700 | |
Series 2015-C27, Class C, 4.523% VRN 12/15/47 (f) | | | 351,000 | | | | 363,857 | |
Morgan Stanley Capital I Trust, Series 2015-UBS8, Class XA, | | | | | | | | |
0.874% VRN 12/15/48 (f) | | | 6,225,023 | | | | 222,947 | |
MSCG Trust, Series 2018-SELF, Class F, 1 mo. USD LIBOR + 3.050% | | | | | | | | |
3.209% FRN 10/15/37 (c) | | | 413,000 | | | | 386,851 | |
Natixis Commercial Mortgage Securities Trust, Series 2018-FL1, Class C, 1 mo. USD LIBOR + 2.200% | | | | | | | | |
2.341% FRN 6/15/35 (c) | | | 368,000 | | | | 336,625 | |
One Market Plaza Trust, Series 2017-1MKT, Class E | | | | | | | | |
4.142% 2/10/32 (c) | | | 381,000 | | | | 386,600 | |
SG Commercial Mortgage Securities Trust | | | | | | | | |
Series 2016-C5, Class XA, 1.958% VRN 10/10/48 (f) | | | 3,808,661 | | | | 246,629 | |
Series 2016-C5, Class B, 3.933% 10/10/48 | | | 411,000 | | | | 427,104 | |
UBS Commercial Mortgage Trust | | | | | | | | |
Series 2017-C2, Class B, 3.993% VRN 8/15/50 (f) | | | 332,000 | | | | 354,809 | |
Series 2017-C1, Class B, 4.036% 6/15/50 | | | 328,000 | | | | 357,729 | |
Series 2017-C6, Class B, 4.154% VRN 12/15/50 (f) | | | 340,000 | | | | 378,072 | |
Wells Fargo Commercial Mortgage Trust | | | | | | | | |
Series 2015-NXS2, Class XA, 0.664% VRN 7/15/58 (f) | | | 10,167,703 | | | | 255,688 | |
Series 2015-P2, Class XA, 0.921% VRN 12/15/48 (f) | | | 4,420,833 | | | | 168,903 | |
Series 2019-C53, Class XA, 1.021% VRN 10/15/52 (f) | | | 4,348,616 | | | | 304,895 | |
Series 2020-C57, Class XA, 2.101% VRN 8/15/53 (f) | | | 2,234,328 | | | | 346,647 | |
Series 2016-C35, Class B, 3.438% 7/15/48 | | | 328,000 | | | | 344,198 | |
Series 2016-NXS6, Class B, 3.811% 11/15/49 | | | 248,000 | | | | 261,047 | |
Series 2014-LC16, Class D, 3.938% 8/15/50 (c) | | | 169,000 | | | | 62,693 | |
The accompanying notes are an integral part of the financial statements.
60
MML Dynamic Bond Fund – Portfolio of Investments (Continued) |
| | | Principal
Amount | | | Value | |
Series 2015-C28, Class C, 4.094% VRN 5/15/48 (f) | | $ | 248,000 | | | $ | 253,781 | |
Series 2019-C50, Class B, 4.192% 5/15/52 | | | 409,000 | | | | 429,794 | |
Series 2019-C50, Class C, 4.345% 5/15/52 | | | 409,000 | | | | 419,461 | |
Series 2016-LC24, Class C, 4.465% VRN 10/15/49 (f) | | | 325,000 | | | | 326,419 | |
Series 2016-C37, Class C, 4.489% VRN 12/15/49 (f) | | | 376,000 | | | | 387,270 | |
Series 2015-NXS4, Class C, 4.699% VRN 12/15/48 (f) | | | 421,000 | | | | 447,846 | |
Series 2019-C49, Class C, 4.866% VRN 3/15/52 (f) | | | 248,000 | | | | 271,701 | |
| | | | | | | | 25,994,415 | |
Home Equity Asset-Backed Securities — 1.6% |
GSAA Home Equity Trust, Series 2007-10, Class A2A | | | | | | | | |
6.500% 11/25/37 | | | 3,722,280 | | | | 2,496,262 | |
Morgan Stanley ABS Capital I, Inc. Trust, Series 2006-HE6, Class A2C, 1 mo. USD LIBOR + .150% | | | | | | | | |
0.298% FRN 9/25/36 | | | 5,788,399 | | | | 2,565,294 | |
| | | | | | | | 5,061,556 | |
Other Asset-Backed Securities — 8.9% |
AASET US Ltd., Series 2018-1A, Class A | | | | | | | | |
3.844% 1/16/38 (c) | | | 513,749 | | | | 485,599 | |
Blackbird Capital Aircraft Lease Securitization Ltd., Series 2016-1A, Class B, | | | | | | | | |
5.682% STEP 12/16/41 (c) | | | 760,417 | | | | 662,271 | |
BlueMountain CLO Ltd. | | | | | | | | |
Series 2015-3A, Class CR, 3 mo. USD LIBOR + 2.600% 2.818% FRN 4/20/31 (c) | | | 1,000,000 | | | | 919,512 | |
Series 2013-1A, Class CR, 3 mo. USD LIBOR + 4.150% 4.368% FRN 1/20/29 (c) | | | 1,000,000 | | | | 965,151 | |
CLI Funding LLC, Series 2019-1A, Class A | | | | | | | | |
3.710% 5/18/44 (c) | | | 420,959 | | | | 429,202 | |
CLI Funding VI LLC, Series 2020-3A, Class A | | | | | | | | |
2.070% 10/18/45 (c) | | | 243,125 | | | | 242,185 | |
Dryden 40 Senior Loan Fund, Series 2015-40A, Class DR, 3 mo. USD LIBOR + 3.100% | | | | | | | | |
3.321% FRN 8/15/31 (c) | | | 500,000 | | | | 498,056 | |
| | | Principal
Amount | | | Value | |
Gilbert Park CLO Ltd. | | | | | | | | |
Series 2017-1A, Class D, 3 mo. USD LIBOR + 2.950% 3.187% FRN 10/15/30 (c) | | $ | 500,000 | | | $ | 495,301 | |
Series 2017-1A, Class E, 3 mo. USD LIBOR + 6.400% 6.637% FRN 10/15/30 (c) | | | 1,000,000 | | | | 986,665 | |
Global SC Finance SRL, Series 2014-1A, Class A1 | | | | | | | | |
3.190% 7/17/29 (c) | | | 254,417 | | | | 253,144 | |
Grippen Park CLO Ltd., Series 2017-1A, Class D, 3 mo. USD LIBOR + 3.300% | | | | | | | | |
3.518% FRN 1/20/30 (c) | | | 1,000,000 | | | | 993,862 | |
Helios Issuer LLC | | | | | | | | |
Series 2020-AA, Class A, 2.980% 6/20/47 (c) | | | 461,106 | | | | 475,193 | |
Series 2017-1A, Class A, 4.940% 9/20/49 (c) | | | 211,236 | | | | 220,875 | |
Hero Funding Trust, Series 2016-4A, Class A2 | | | | | | | | |
4.290% 9/20/47 (c) | | | 193,214 | | | | 204,768 | |
Highbridge Loan Management Ltd., Series 13A-18, Class D, 3 mo. USD LIBOR + 3.000% | | | | | | | | |
3.237% FRN 10/15/30 (c) | | | 500,000 | | | | 479,678 | |
Invitation Homes Trust | | | | | | | | |
Series 2018-SFR1, Class C, 1 mo. USD LIBOR + 1.250% 1.403% FRN 3/17/37 (c) | | | 1,145,000 | | | | 1,143,584 | |
Series 2018-SFR1, Class D, 1 mo. USD LIBOR + 1.450% 1.603% FRN 3/17/37 (c) | | | 749,727 | | | | 749,419 | |
JOL Air Ltd., Series 2019-1, Class A | | | | | | | | |
3.967% 4/15/44 (c) | | | 438,749 | | | | 423,569 | |
Long Beach Mortgage Loan Trust, Series 2006-7, Class 1A, 1 mo. USD LIBOR + .155% | | | | | | | | |
0.303% FRN 8/25/36 | | | 3,136,782 | | | | 2,065,341 | |
MACH 1 Cayman Ltd., Series 2019-1, Class A | | | | | | | | |
3.474% 10/15/39 (c) | | | 439,702 | | | | 424,772 | |
Madison Park Funding Ltd., Series 2014-14A, Class DRR, 3 mo. USD LIBOR + 2.950% | | | | | | | | |
3.166% FRN 10/22/30 (c) | | | 500,000 | | | | 485,367 | |
Merrill Lynch Mortgage Investors Trust, Series 2006-OPT1, Class A2C, 1 mo. USD LIBOR + .150% | | | | | | | | |
0.298% FRN 8/25/37 | | | 1,836,055 | | | | 1,760,033 | |
Mosaic Solar Loans LLC | | | | | | | | |
Series 2020-1A, Class A, 2.100% 4/20/46 (c) | | | 446,372 | | | | 455,649 | |
The accompanying notes are an integral part of the financial statements.
61
MML Dynamic Bond Fund – Portfolio of Investments (Continued) |
| | | Principal
Amount | | | Value | |
Series 2020-2A, Class B, 2.210% 8/20/46 (c) | | $ | 488,803 | | | $ | 480,280 | |
Series 2017-1A, Class A, 4.450% 6/20/42 (c) | | | 370,809 | | | | 398,778 | |
Newark BSL CLO 2 Ltd., Series 2017-1A, Class C, 3 mo. USD LIBOR + 3.650% | | | | | | | | |
3.865% FRN 7/25/30 (c) | | | 500,000 | | | | 500,126 | |
Oak Hill Credit Partners Ltd., Series 2018-1A, Class D, 3 mo. USD LIBOR + 3.050% | | | | | | | | |
3.268% FRN 10/20/30 (c) | | | 500,000 | | | | 493,767 | |
Octagon Investment Partners Ltd., Series 2017-1A, Class C, 3 mo. USD LIBOR + 3.500% | | | | | | | | |
3.718% FRN 3/17/30 (c) | | | 1,000,000 | | | | 987,210 | |
Primose Funding LLC, Series 2019-1A, Class A2 | | | | | | | | |
4.475% 7/30/49 (c) | | | 990,000 | | | | 1,022,710 | |
Sprite Ltd., Series 2017-1, Class A | | | | | | | | |
4.250% 12/15/37 (c) | | | 321,594 | | | | 303,539 | |
START Ireland, Series 2019-1, Class A | | | | | | | | |
4.089% 3/15/44 (c) | | | 314,382 | | | | 305,839 | |
Sunrun Atlas Issuer 2019-2 LLC, Series 2019-2, Class A | | | | | | | | |
3.610% 2/01/55 (c) | | | 731,683 | | | | 781,774 | |
Symphony CLO Ltd., Series 2015-16A, Class DR, 3 mo. USD LIBOR + 3.050% | | | | | | | | |
3.287% FRN 10/15/31 (c) | | | 500,000 | | | | 482,752 | |
Taco Bell Funding LLC, Series 2018-1A, Class A2I | | | | | | | | |
4.318% 11/25/48 (c) | | | 980,000 | | | | 993,819 | |
Textainer Marine Containers VII Ltd., Series 2019-1A, Class A | | | | | | | | |
3.960% 4/20/44 (c) | | | 433,333 | | | | 438,177 | |
Textainer Marine Containers VIII Ltd., Series 2020-2A, Class A | | | | | | | | |
2.100% 9/20/45 (c) | | | 488,361 | | | | 494,436 | |
Thunderbolt Aircraft Lease Ltd. | | | | | | | | |
Series 2018-A, Class A, 4.147% STEP 9/15/38 (c) | | | 442,900 | | | | 425,409 | |
Series 2017-A, Class A, 4.212% STEP 5/17/32 (c) | | | 856,678 | | | | 826,988 | |
TPG Real Estate Finance Issuer Ltd., Series 2018-FL2, Class AS, 1 mo. USD LIBOR + 1.450% | | | | | | | | |
1.603% FRN 11/15/37 (c) | | | 314,000 | | | | 312,138 | |
Trip Rail Master Funding LLC, Series 2017-1A, Class A1 | | | | | | | | |
2.709% 8/15/47 (c) | | | 99,970 | | | | 100,097 | |
| | | Principal
Amount | | | Value | |
Vantage Data Centers LLC, Series 2020-2A, Class A2 | | | | | | | | |
1.992% 9/15/45 (c) | | $ | 375,000 | | | $ | 377,357 | |
VB-S1 Issuer LLC, Series 2020-1A, Class C2 | | | | | | | | |
3.031% 6/15/50 (c) | | | 500,000 | | | | 523,252 | |
Vericrest Opportunity Loan Trust | | | | | | | | |
Series 2020-NPL3, Class A1A, 2.981% STEP 2/25/50 (c) | | | 482,937 | | | | 484,295 | |
Series 2019-NPL2, Class A1, 3.967% STEP 2/25/49 (c) | | | 606,065 | | | | 610,512 | |
Westcott Park CLO Ltd., Series 2016-1A, Class DR, 3 mo. USD LIBOR + 3.250% | | | | | | | | |
3.468% FRN 7/20/28 (c) | | | 500,000 | | | | 497,597 | |
Willis Engine Structured Trust IV, Series 2018-A, Class A, | | | | | | | | |
4.750% STEP 9/15/43 (c) | | | 764,272 | | | | 659,589 | |
Wind River CLO Ltd., Series 2017-1A, Class D, 3 mo. USD LIBOR + 3.750% | | | | | | | | |
3.968% FRN 4/18/29 (c) | | | 1,000,000 | | | | 998,533 | |
| | | | | | | | 29,318,170 | |
Student Loans Asset-Backed Securities — 0.4% |
College Avenue Student Loans LLC, Series 2018-A, Class A1, 1 mo. USD LIBOR + 1.200% | | | | | | | | |
1.348% FRN 12/26/47 (c) | | | 342,284 | | | | 343,999 | |
SoFi Professional Loan Program LLC | | | | | | | | |
Series 2017-D, Class BFX, 3.610% 9/25/40 (c) | | | 350,000 | | | | 358,542 | |
Series 2018-B, Class BFX, 3.830% 8/25/47 (c) | | | 500,000 | | | | 519,446 | |
| | | | | | | | 1,221,987 | |
Whole Loan Collateral Collateralized Mortgage Obligations — 6.2% |
CIM Trust, Series 2017-6, Class A1, | | | | | | | | |
3.015% VRN 6/25/57 (c) (f) | | | 1,650,508 | | | | 1,650,708 | |
Citigroup Mortgage Loan Trust, Series 2007-AR5, Class 1A2A, | | | | | | | | |
3.551% VRN 4/25/37 (f) | | | 1,106,215 | | | | 1,037,504 | |
Countrywide Alternative Loan Trust | | | | | | | | |
Series 2006-13T1, Class A11, 6.000% 5/25/36 | | | 1,914,717 | | | | 1,359,805 | |
Series 2006-36T2, Class 2A1, 6.250% 12/25/36 | | | 3,345,675 | | | | 2,201,167 | |
Countrywide Home Loans Mortgage Pass-Through Trust | | | | | | | | |
Series 2007-HYB2, Class 3A1, 3.081% VRN 2/25/47 (f) | | | 1,173,767 | | | | 1,048,136 | |
The accompanying notes are an integral part of the financial statements.
62
MML Dynamic Bond Fund – Portfolio of Investments (Continued) |
| | | Principal
Amount | | | Value | |
Series 2007-14, Class A6, 6.000% 9/25/37 | | $ | 1,464,695 | | | $ | 1,153,844 | |
HarborView Mortgage Loan Trust, Series 2006-11, Class A1A, 1 mo. USD LIBOR + .340% | | | | | | | | |
0.492% FRN 12/19/36 | | | 940,044 | | | | 847,096 | |
IndyMac INDX Mortgage Loan Trust, Series 2007-AR5, Class 2A1, | | | | | | | | |
3.357% VRN 5/25/37 (f) | | | 2,333,032 | | | | 2,075,482 | |
Lehman XS Trust, Series 2007-12N, Class 1A3A, 1 mo. LIBOR + .200% | | | | | | | | |
0.348% FRN 7/25/47 | | | 2,689,422 | | | | 2,555,819 | |
Morgan Stanley Mortgage Loan Trust, Series 2005-3AR, Class 2A1, | | | | | | | | |
2.998% VRN 7/25/35 (f) | | | 382,548 | | | | 370,294 | |
Nomura Asset Acceptance Corp. Alternative Loan Trust, Series 2006-AR1, Class 2A1, | | | | | | | | |
3.236% VRN 2/25/36 (f) | | | 2,193,547 | | | | 1,889,980 | |
RBSSP Resecuritization Trust, Series 2009-5, Class 2A3, | | | | | | | | |
6.500% VRN 10/26/37 (c) (f) | | | 928,311 | | | | 669,935 | |
RFMSI Trust, Series 2007-S4, Class A5, 1 mo. USD LIBOR + .600% | | | | | | | | |
6.000% FRN 4/25/37 | | | 247,599 | | | | 235,646 | |
Structured Adjustable Rate Mortgage Loan Trust, Series 2008-1, Class A2, | | | | | | | | |
2.913% VRN 10/25/37 (f) | | | 878,508 | | | | 775,617 | |
Voyager OPTONE Delaware Trust, Series 2009-1, Class SAC3, 1 mo. LIBOR | | | | | | | | |
19.662% VRN 2/25/38 (c) | | | 2,147,531 | | | | 1,604,338 | |
Washington Mutual Mortgage Pass-Through Certificates Trust, Series 2006-4, Class 3A5, | | | | | | | | |
6.350% STEP 5/25/36 | | | 955,948 | | | | 901,473 | |
| | | | | | | | 20,376,844 | |
Whole Loan Collateral Planned Amortization Classes — 0.4% |
Countrywide Alternative Loan Trust, Series 2006-19CB, Class A15 | | | | | | | | |
6.000% 8/25/36 | | | 1,726,303 | | | | 1,418,938 | |
| | | | | | | | | |
TOTAL NON-U.S. GOVERNMENT AGENCY OBLIGATIONS (Cost $87,390,953) | | | | | | | 83,391,910 | |
| | | | | | | | | |
SOVEREIGN DEBT OBLIGATIONS — 1.4% |
Abu Dhabi Government International Bond | | | | | | | | |
0.750% 9/02/23 (c) | | | 200,000 | | | | 200,500 | |
3.125% 4/16/30 (c) | | | 200,000 | | | | 225,840 | |
| | | Principal
Amount | | | Value | |
Indonesia Government International Bond | | | | | | | | |
3.375% 4/15/23 (c) | | $ | 200,000 | | | $ | 212,015 | |
Korea Electric Power Corp. | | | | | | | | |
1.125% 6/15/25 (c) | | | 200,000 | | | | 203,172 | |
Mexico Government International Bond | | | | | | | | |
3.750% 1/11/28 | | | 535,000 | | | | 601,072 | |
4.150% 3/28/27 | | | 343,000 | | | | 395,740 | |
Panama Government International Bond | | | | | | | | |
3.750% 3/16/25 | | | 200,000 | | | | 221,252 | |
4.000% 9/22/24 | | | 200,000 | | | | 221,252 | |
Perusahaan Penerbit SBSN Indonesia | | | | | | | | |
4.150% 3/29/27 (c) | | | 200,000 | | | | 229,082 | |
Peruvian Government International Bond | | | | | | | | |
2.392% 1/23/26 | | | 100,000 | | | | 106,651 | |
2.783% 1/23/31 | | | 300,000 | | | | 328,953 | |
Philippine Government International Bond | | | | | | | | |
1.648% 6/10/31 | | | 400,000 | | | | 405,001 | |
Qatar Government International Bond | | | | | | | | |
3.375% 3/14/24 (c) | | | 400,000 | | | | 433,000 | |
3.875% 4/23/23 (c) | | | 200,000 | | | | 214,960 | |
Saudi Government International Bond | | | | | | | | |
2.375% 10/26/21 (c) | | | 200,000 | | | | 202,981 | |
2.900% 10/22/25 (c) | | | 250,000 | | | | 269,337 | |
| | | | | | | | 4,470,808 | |
| | | | | | | | | |
TOTAL SOVEREIGN DEBT OBLIGATIONS (Cost $4,215,566) | | | | | | | 4,470,808 | |
| | | | | | | | | |
U.S. GOVERNMENT AGENCY OBLIGATIONS AND INSTRUMENTALITIES — 17.9% |
Collateralized Mortgage Obligations — 11.2% |
Federal Home Loan Mortgage Corp. 3.500% 7/15/49 | | | 3,266,848 | | | | 3,447,015 | |
Federal Home Loan Mortgage Corp. REMICS | | | | | | | | |
Series 4934, Class P, 2.500% 11/15/40 | | | 2,241,241 | | | | 2,373,354 | |
Series 4093, Class PA, 3.000% 8/15/42 | | | 2,532,349 | | | | 2,628,541 | |
Series 4481, Class B, 3.000% 12/15/42 | | | 3,271,439 | | | | 3,341,321 | |
Series 4483, Class CA, 3.000% 6/15/44 | | | 3,731,143 | | | | 3,917,887 | |
Series 4750, Class PA, .000% 7/15/46 | | | 1,292,763 | | | | 1,328,257 | |
The accompanying notes are an integral part of the financial statements.
63
MML Dynamic Bond Fund – Portfolio of Investments (Continued) |
| | | Principal
Amount | | | Value | |
Federal Home Loan Mortgage Corp. SCRT Series 2018-2, Class HV 3.000% VRN 11/25/57 (f) | | $ | 2,758,567 | | | $ | 2,966,928 | |
Federal Home Loan Mortgage Corp. STRIPS | | | | | | | | |
Series 355, Class 300, 3.000% 8/15/47 | | | 2,372,614 | | | | 2,556,641 | |
Series 358, Class 300, 3.000% 10/15/47 | | | 2,073,911 | | | | 2,235,725 | |
Federal National Mortgage Association REMICS | | | | | | | | |
Series 2018-21, Class PO, 0.000% 4/25/48 | | | 1,764,892 | | | | 1,626,977 | |
Series 2015-9, Class HA, 3.000% 1/25/45 | | | 568,191 | | | | 607,518 | |
Government National Mortgage Association | | | | | | | | |
Series 2015-74, Class LZ, 3.500% 5/20/45 | | | 3,481,405 | | | | 3,692,402 | |
Series 2015-92, Class CZ, 3.500% 6/20/45 | | | 5,539,442 | | | | 5,964,998 | |
| | | | | | | | 36,687,564 | |
Pass-Through Securities — 6.7% |
Federal Home Loan Mortgage Corp. | | | | | | | | |
Pool #RE6066 2.000% 10/01/50 | | | 6,863,484 | | | | 7,058,192 | |
Pool #BL5484 2.260% 1/01/30 | | | 3,000,000 | | | | 3,269,514 | |
Pool #G08520 2.500% 1/01/43 | | | 871,208 | | | | 925,594 | |
Pool #SB0048 3.000% 8/01/34 | | | 1,888,835 | | | | 2,012,106 | |
Pool #G08632 3.500% 3/01/45 | | | 1,446,361 | | | | 1,561,272 | |
Federal National Mortgage Association | | | | | | | | |
Pool #MA4158 2.000% 10/01/50 | | | 3,953,369 | | | | 4,109,996 | |
Pool #MA2248 3.000% 4/01/45 | | | 922,943 | | | | 959,054 | |
Pool #AS7661 3.000% 8/01/46 | | | 686,437 | | | | 710,719 | |
Pool #AX2501 4.000% 10/01/44 | | | 1,264,666 | | | | 1,381,879 | |
| | | | | | | | 21,988,326 | |
| | | | | | | | | |
TOTAL U.S. GOVERNMENT AGENCY OBLIGATIONS AND INSTRUMENTALITIES (Cost $55,322,883) | | | | | | | 58,675,890 | |
| | | Principal
Amount | | | Value | |
U.S. TREASURY OBLIGATIONS — 24.3% |
U.S. Treasury Bonds & Notes — 24.3% |
U.S. Treasury Bond | | | | | | | | |
1.125% 8/15/40 | | $ | 4,440,000 | | | $ | 4,204,778 | |
1.250% 5/15/50 | | | 4,700,000 | | | | 4,265,906 | |
1.625% 11/15/50 | | | 3,710,000 | | | | 3,695,944 | |
2.750% 11/15/42 | | | 165,000 | | | | 204,357 | |
2.750% 11/15/47 | | | 2,600,000 | | | | 3,264,866 | |
4.750% 2/15/37 | | | 2,400,000 | | | | 3,656,801 | |
U.S. Treasury Note | | | | | | | | |
0.125% 6/30/22 | | | 2,910,000 | | | | 2,910,399 | |
0.250% 11/15/23 | | | 340,000 | | | | 340,918 | |
0.375% 11/30/25 | | | 8,040,000 | | | | 8,051,348 | |
0.500% 6/30/27 | | | 4,570,000 | | | | 4,550,174 | |
0.500% 10/31/27 | | | 480,000 | | | | 476,168 | |
0.625% 11/30/27 | | | 11,330,000 | | | | 11,327,145 | |
0.875% 11/15/30 | | | 5,260,000 | | | | 5,242,245 | |
1.625% 10/31/26 | | | 3,800,000 | | | | 4,052,112 | |
2.125% 9/30/24 | | | 3,890,000 | | | | 4,163,975 | |
2.250% 10/31/24 | | | 3,860,000 | | | | 4,155,521 | |
2.250% 3/31/26 | | | 3,200,000 | | | | 3,508,592 | |
2.250% 11/15/27 | | | 3,890,000 | | | | 4,318,878 | |
2.625% 1/31/26 | | | 500,000 | | | | 556,820 | |
2.750% 2/28/25 | | | 2,380,000 | | | | 2,623,484 | |
3.000% 9/30/25 | | | 3,800,000 | | | | 4,275,976 | |
| | | | | | | | 79,846,407 | |
| | | | | | | | | |
TOTAL U.S. TREASURY OBLIGATIONS (Cost $78,569,129) | | | | | | | 79,846,407 | |
| | | | | | | | | |
TOTAL BONDS & NOTES (Cost $318,516,090) | | | | | | | 324,960,511 | |
| | | | | | | | | |
TOTAL LONG-TERM INVESTMENTS (Cost $318,516,090) | | | | | | | 324,960,511 | |
The accompanying notes are an integral part of the financial statements.
64
MML Dynamic Bond Fund – Portfolio of Investments (Continued) |
| | | Principal
Amount | | | Value | |
SHORT-TERM INVESTMENTS — 0.8% |
Repurchase Agreement — 0.7% |
Fixed Income Clearing Corp., Repurchase Agreement, dated 12/31/20, 0.000%, due 1/04/21 (g) | | $ | 2,155,811 | | | $ | 2,155,811 | |
U.S. Treasury Bill — 0.1% |
U.S. Treasury Bill | | | | | | | | |
0.000% 5/06/21 | | | 250,000 | | | | 249,930 | |
| | | | | | | | | |
TOTAL SHORT-TERM INVESTMENTS (Cost $2,405,736) | | | | | | | 2,405,741 | |
| | | | | | | | | |
TOTAL INVESTMENTS — 99.8% (Cost $320,921,826) (h) | | | | | | | 327,366,252 | |
| | | | | | | | | |
Less Unfunded Loan Commitments — (0.00)% | | | | | | | (14,897 | ) |
| | | | | | | | | |
NET INVESTMENTS — 99.8% (Cost $320,906,929) | | | | | | | 327,351,355 | |
| | | | | | | | | |
Other Assets/(Liabilities) — 0.2% | | | | | | | 620,099 | |
| | | | | | | | | |
NET ASSETS — 100.0% | | | | | | $ | 327,971,454 | |
Abbreviation Legend
CLO | Collateralized Loan Obligation |
REMICS | Real Estate Mortgage Investment Conduits |
SCRT | Seasoned Credit Risk Transfer |
STRIPS | Separate Trading of Registered Interest and Principal of Securities |
Notes to Portfolio of Investments
Percentages are stated as a percent of net assets.
(a) | All or a portion of the security represents unsettled loan commitments at December 31, 2020 where the rate will be determined at time of settlement. |
(b) | Unfunded or partially unfunded loan commitments. |
(c) | Security is exempt from registration under Regulation S or Rule 144A of the Securities Act of 1933. These securities are considered restricted and may be resold in transactions exempt from registration. At December 31, 2020, the aggregate market value of these securities amounted to $80,556,959 or 24.56% of net assets. |
(d) | Security is currently in default due to bankruptcy or failure to make payment of principal or interest of the issuer. Income is not being accrued. At December 31, 2020, these securities amounted to a value of $314,550 or 0.10% of net assets. |
(e) | Security is perpetual and has no stated maturity date. |
(f) | Certain variable rate securities are not based on a published reference rate and spread but are determined by the issuer or agent and are based on current market conditions. These securities do not indicate a reference rate and spread in their description above. The rates shown are the current interest rates at December 31, 2020. |
(g) | Maturity value of $2,155,811. Collateralized by U.S. Government Agency obligations with a rate of 0.000%, maturity date of 12/30/21, and an aggregate market value, including accrued interest, of $2,198,940. |
(h) | See Note 6 for aggregate cost for federal tax purposes. |
Currency Legend
The accompanying notes are an integral part of the financial statements.
65
MML Equity Fund – Portfolio of Investments |
December 31, 2020 |
| | | Number of
Shares | | | Value | |
EQUITIES — 99.0% |
COMMON STOCK — 98.9% |
Basic Materials — 3.9% |
Chemicals — 2.1% |
Air Liquide SA | | | 3,364 | | | $ | 552,129 | |
Albemarle Corp. | | | 6,200 | | | | 914,624 | |
Celanese Corp. | | | 7,800 | | | | 1,013,532 | |
Covestro AG (a) | | | 11,781 | | | | 726,684 | |
DuPont de Nemours, Inc. | | | 25,800 | | | | 1,834,638 | |
Eastman Chemical Co. | | | 7,900 | | | | 792,212 | |
FMC Corp. | | | 8,500 | | | | 976,905 | |
Huntsman Corp. | | | 11,300 | | | | 284,082 | |
Linde PLC | | | 17,442 | | | | 4,596,142 | |
LyondellBasell Industries NV Class A | | | 22,700 | | | | 2,080,682 | |
The Mosaic Co. | | | 25,100 | | | | 577,551 | |
PPG Industries, Inc. | | | 16,069 | | | | 2,317,471 | |
| | | | | | | | 16,666,652 | |
Forest Products & Paper — 0.6% |
International Paper Co. | | | 102,095 | | | | 5,076,163 | |
Iron & Steel — 0.3% |
Nucor Corp. | | | 20,000 | | | | 1,063,800 | |
Reliance Steel & Aluminum Co. | | | 4,200 | | | | 502,950 | |
Steel Dynamics, Inc. | | | 13,900 | | | | 512,493 | |
| | | | | | | | 2,079,243 | |
Mining — 0.9% |
BHP Group Ltd. | | | 29,372 | | | | 956,907 | |
Freeport-McMoRan, Inc. | | | 63,300 | | | | 1,647,066 | |
Newmont Corp. | | | 53,100 | | | | 3,180,159 | |
Southern Copper Corp. | | | 14,633 | | | | 952,901 | |
| | | | | | | | 6,737,033 | |
| | | | | | | | 30,559,091 | |
Communications — 8.2% |
Advertising — 0.1% |
The Interpublic Group of Cos., Inc. | | | 19,000 | | | | 446,880 | |
Internet — 2.2% |
Alphabet, Inc. Class C (b) | | | 7,341 | | | | 12,860,551 | |
CDW Corp. | | | 9,400 | | | | 1,238,826 | |
eBay, Inc. | | | 47,300 | | | | 2,376,825 | |
NortonLifeLock, Inc. | | | 33,600 | | | | 698,208 | |
| | | | | | | | 17,174,410 | |
Media — 2.4% |
Comcast Corp. Class A | | | 262,900 | | | | 13,775,960 | |
Discovery, Inc. Class A (b) (c) | | | 10,600 | | | | 318,954 | |
Fox Corp. Class A | | | 18,700 | | | | 544,544 | |
The Walt Disney Co. (b) | | | 23,213 | | | | 4,205,731 | |
| | | | | | | | 18,845,189 | |
| | | Number of
Shares | | | Value | |
Telecommunications — 3.5% |
Ciena Corp. (b) | | | 10,200 | | | $ | 539,070 | |
Cisco Systems, Inc. | | | 239,900 | | | | 10,735,525 | |
Corning, Inc. | | | 41,500 | | | | 1,494,000 | |
Juniper Networks, Inc. | | | 19,500 | | | | 438,945 | |
Verizon Communications, Inc. | | | 240,500 | | | | 14,129,375 | |
| | | | | | | | 27,336,915 | |
| | | | | | | | 63,803,394 | |
Consumer, Cyclical — 8.9% |
Apparel — 0.1% |
Deckers Outdoor Corp. (b) | | | 600 | | | | 172,068 | |
Hanesbrands, Inc. | | | 13,700 | | | | 199,746 | |
Skechers U.S.A., Inc. Class A (b) | | | 7,800 | | | | 280,332 | |
| | | | | | | | 652,146 | |
Auto Manufacturers — 1.9% |
Cummins, Inc. | | | 9,700 | | | | 2,202,870 | |
Ford Motor Co. | | | 257,900 | | | | 2,266,941 | |
General Motors Co. | | | 199,353 | | | | 8,301,059 | |
PACCAR, Inc. | | | 22,900 | | | | 1,975,812 | |
| | | | | | | | 14,746,682 | |
Auto Parts & Equipment — 0.1% |
Gentex Corp. | | | 13,900 | | | | 471,627 | |
Lear Corp. | | | 3,500 | | | | 556,605 | |
| | | | | | | | 1,028,232 | |
Distribution & Wholesale — 0.3% |
LKQ Corp. (b) | | | 20,100 | | | | 708,324 | |
W.W. Grainger, Inc. | | | 3,300 | | | | 1,347,522 | |
| | | | | | | | 2,055,846 | |
Entertainment — 0.1% |
Live Nation Entertainment, Inc. (b) | | | 9,600 | | | | 705,408 | |
Home Builders — 0.6% |
D.R. Horton, Inc. | | | 24,100 | | | | 1,660,972 | |
Lennar Corp. Class A | | | 31,964 | | | | 2,436,616 | |
PulteGroup, Inc. | | | 17,700 | | | | 763,224 | |
Toll Brothers, Inc. | | | 7,200 | | | | 312,984 | |
| | | | | | | | 5,173,796 | |
Home Furnishing — 0.1% |
Whirlpool Corp. | | | 4,200 | | | | 758,058 | |
Housewares — 0.1% |
Newell Brands, Inc. | | | 28,000 | | | | 594,440 | |
Leisure Time — 0.1% |
Brunswick Corp. | | | 4,500 | | | | 343,080 | |
Polaris, Inc. | | | 2,500 | | | | 238,200 | |
| | | | | | | | 581,280 | |
The accompanying notes are an integral part of the financial statements.
66
MML Equity Fund – Portfolio of Investments (Continued) |
| | | Number of
Shares | | | Value | |
Lodging — 0.5% |
Hilton Worldwide Holdings, Inc. | | | 19,773 | | | $ | 2,199,944 | |
Hyatt Hotels Corp. Class A (c) | | | 2,600 | | | | 193,050 | |
Marriott International, Inc. Class A | | | 9,237 | | | | 1,218,545 | |
MGM Resorts International | | | 9,739 | | | | 306,876 | |
| | | | | | | | 3,918,415 | |
Retail — 4.9% |
Advance Auto Parts, Inc. | | | 4,500 | | | | 708,795 | |
AutoZone, Inc. (b) | | | 1,500 | | | | 1,778,160 | |
Best Buy Co., Inc. | | | 17,100 | | | | 1,706,409 | |
CarMax, Inc. (b) | | | 6,500 | | | | 613,990 | |
Dollar General Corp. | | | 16,200 | | | | 3,406,860 | |
Dollar Tree, Inc. (b) | | | 15,500 | | | | 1,674,620 | |
Genuine Parts Co. | | | 9,500 | | | | 954,085 | |
The Home Depot, Inc. | | | 5,500 | | | | 1,460,910 | |
Lowe’s Cos., Inc. | | | 48,400 | | | | 7,768,684 | |
McDonald’s Corp. | | | 10,809 | | | | 2,319,395 | |
O’Reilly Automotive, Inc. (b) | | | 5,263 | | | | 2,381,876 | |
Ross Stores, Inc. | | | 3,981 | | | | 488,907 | |
Target Corp. | | | 33,100 | | | | 5,843,143 | |
The TJX Cos., Inc. | | | 32,164 | | | | 2,196,479 | |
Tractor Supply Co. | | | 6,600 | | | | 927,828 | |
Williams-Sonoma, Inc. | | | 4,500 | | | | 458,280 | |
Yum! Brands, Inc. | | | 36,505 | | | | 3,962,983 | |
| | | | | | | | 38,651,404 | |
Textiles — 0.1% |
Mohawk Industries, Inc. (b) | | | 4,700 | | | | 662,465 | |
| | | | | | | | 69,528,172 | |
Consumer, Non-cyclical — 21.9% |
Agriculture — 1.3% |
Archer-Daniels-Midland Co. | | | 36,800 | | | | 1,855,088 | |
Bunge Ltd. | | | 9,200 | | | | 603,336 | |
Darling Ingredients, Inc. (b) | | | 5,200 | | | | 299,936 | |
Philip Morris International, Inc. | | | 93,822 | | | | 7,767,523 | |
| | | | | | | | 10,525,883 | |
Beverages — 0.1% |
The Coca-Cola Co. | | | 21,800 | | | | 1,195,512 | |
Biotechnology — 1.9% |
Alexion Pharmaceuticals, Inc. (b) | | | 12,400 | | | | 1,937,376 | |
Amgen, Inc. | | | 34,700 | | | | 7,978,224 | |
Bio-Rad Laboratories, Inc. Class A (b) | | | 1,500 | | | | 874,410 | |
Corteva, Inc. | | | 23,800 | | | | 921,536 | |
Regeneron Pharmaceuticals, Inc. (b) | | | 5,900 | | | | 2,850,349 | |
| | | | | | | | 14,561,895 | |
Commercial Services — 0.7% |
AMERCO | | | 1,300 | | | | 590,148 | |
Quanta Services, Inc. | | | 9,100 | | | | 655,382 | |
| | | Number of
Shares | | | Value | |
Robert Half International, Inc. | | | 7,600 | | | $ | 474,848 | |
Service Corp. International | | | 11,500 | | | | 564,650 | |
United Rentals, Inc. (b) | | | 14,300 | | | | 3,316,313 | |
| | | | | | | | 5,601,341 | |
Foods — 0.9% |
Conagra Brands, Inc. | | | 32,300 | | | | 1,171,198 | |
Ingredion, Inc. | | | 4,100 | | | | 322,547 | |
The J.M. Smucker Co. | | | 6,500 | | | | 751,400 | |
The Kraft Heinz Co. | | | 92,700 | | | | 3,212,982 | |
Tyson Foods, Inc. Class A | | | 19,400 | | | | 1,250,136 | |
| | | | | | | | 6,708,263 | |
Health Care – Products — 2.7% |
Boston Scientific Corp. (b) | | | 7,100 | | | | 255,245 | |
Danaher Corp. | | | 31,953 | | | | 7,098,039 | |
Hologic, Inc. (b) | | | 14,600 | | | | 1,063,318 | |
Medtronic PLC | | | 28,114 | | | | 3,293,274 | |
Stryker Corp. | | | 10,291 | | | | 2,521,707 | |
Thermo Fisher Scientific, Inc. | | | 13,294 | | | | 6,192,079 | |
Zimmer Biomet Holdings, Inc. | | | 2,107 | | | | 324,668 | |
| | | | | | | | 20,748,330 | |
Health Care – Services — 5.4% |
Anthem, Inc. | | | 22,564 | | | | 7,245,075 | |
Centene Corp. (b) | | | 3,211 | | | | 192,756 | |
DaVita, Inc. (b) | | | 8,100 | | | | 950,940 | |
HCA Healthcare, Inc. | | | 44,553 | | | | 7,327,187 | |
Humana, Inc. | | | 7,500 | | | | 3,077,025 | |
Laboratory Corp. of America Holdings (b) | | | 5,700 | | | | 1,160,235 | |
Molina Healthcare, Inc. (b) | | | 3,300 | | | | 701,844 | |
Quest Diagnostics, Inc. | | | 7,900 | | | | 941,443 | |
UnitedHealth Group, Inc. | | | 57,012 | | | | 19,992,968 | |
Universal Health Services, Inc. Class B | | | 4,500 | | | | 618,750 | |
| | | | | | | | 42,208,223 | |
Household Products & Wares — 0.2% |
Avery Dennison Corp. | | | 8,400 | | | | 1,302,924 | |
Pharmaceuticals — 8.7% |
AbbVie, Inc. | | | 28,537 | | | | 3,057,739 | |
AmerisourceBergen Corp. | | | 12,000 | | | | 1,173,120 | |
Bausch Health Cos., Inc. (b) (c) | | | 29,029 | | | | 603,803 | |
Becton Dickinson and Co. | | | 1,499 | | | | 375,080 | |
Cardinal Health, Inc. | | | 17,000 | | | | 910,520 | |
Cigna Corp. | | | 20,500 | | | | 4,267,690 | |
Elanco Animal Health, Inc. (b) | | | 51,028 | | | | 1,565,029 | |
Eli Lilly and Co. | | | 61,300 | | | | 10,349,892 | |
Henry Schein, Inc. (b) | | | 8,500 | | | | 568,310 | |
Jazz Pharmaceuticals PLC (b) | | | 3,400 | | | | 561,170 | |
Johnson & Johnson | | | 124,516 | | | | 19,596,328 | |
The accompanying notes are an integral part of the financial statements.
67
MML Equity Fund – Portfolio of Investments (Continued) |
| | | Number of
Shares | | | Value | |
McKesson Corp. | | | 10,600 | | | $ | 1,843,552 | |
Merck & Co., Inc. | | | 148,300 | | | | 12,130,940 | |
Pfizer, Inc. | | | 301,779 | | | | 11,108,485 | |
| | | | | | | | 68,111,658 | |
| | | | | | | | 170,964,029 | |
Energy — 2.2% |
Oil & Gas — 1.6% |
EOG Resources, Inc. | | | 52,900 | | | | 2,638,123 | |
Exxon Mobil Corp. | | | 127,000 | | | | 5,234,940 | |
Phillips 66 | | | 28,800 | | | | 2,014,272 | |
TOTAL SE | | | 14,491 | | | | 625,114 | |
Valero Energy Corp. | | | 26,900 | | | | 1,521,733 | |
| | | | | | | | 12,034,182 | |
Pipelines — 0.6% |
Cheniere Energy, Inc. (b) | | | 16,700 | | | | 1,002,501 | |
The Williams Cos., Inc. | | | 191,808 | | | | 3,845,751 | |
| | | | | | | | 4,848,252 | |
| | | | | | | | 16,882,434 | |
Financial — 24.4% |
Banks — 12.7% |
Bank of America Corp. | | | 726,719 | | | | 22,026,853 | |
The Bank of New York Mellon Corp. | | | 58,600 | | | | 2,486,984 | |
Citizens Financial Group, Inc. | | | 28,200 | | | | 1,008,432 | |
Comerica, Inc. | | | 9,100 | | | | 508,326 | |
Commerce Bancshares, Inc. | | | 6,872 | | | | 451,491 | |
Cullen/Frost Bankers, Inc. | | | 3,400 | | | | 296,582 | |
East West Bancorp, Inc. | | | 9,300 | | | | 471,603 | |
Fifth Third Bancorp | | | 47,000 | | | | 1,295,790 | |
The Goldman Sachs Group, Inc. | | | 30,235 | | | | 7,973,272 | |
Huntington Bancshares, Inc. | | | 57,900 | | | | 731,277 | |
JP Morgan Chase & Co. | | | 220,300 | | | | 27,993,521 | |
KeyCorp | | | 64,500 | | | | 1,058,445 | |
Morgan Stanley | | | 194,263 | | | | 13,312,843 | |
Northern Trust Corp. | | | 13,700 | | | | 1,276,018 | |
The PNC Financial Services Group, Inc. | | | 47,444 | | | | 7,069,156 | |
Regions Financial Corp. | | | 63,400 | | | | 1,022,008 | |
Signature Bank | | | 3,700 | | | | 500,573 | |
State Street Corp. | | | 23,300 | | | | 1,695,774 | |
SVB Financial Group (b) | | | 3,400 | | | | 1,318,622 | |
US Bancorp | | | 86,873 | | | | 4,047,413 | |
Wells Fargo & Co. | | | 73,651 | | | | 2,222,787 | |
Zions Bancorp NA | | | 10,800 | | | | 469,152 | |
| | | | | | | | 99,236,922 | |
Diversified Financial Services — 3.4% |
Ally Financial, Inc. | | | 24,700 | | | | 880,802 | |
Ameriprise Financial, Inc. | | | 8,200 | | | | 1,593,506 | |
BlackRock, Inc. | | | 9,100 | | | | 6,566,014 | |
| | | Number of
Shares | | | Value | |
Capital One Financial Corp. | | | 48,008 | | | $ | 4,745,591 | |
The Charles Schwab Corp. | | | 54,216 | | | | 2,875,617 | |
Discover Financial Services | | | 12,000 | | | | 1,086,360 | |
LPL Financial Holdings, Inc. | | | 5,300 | | | | 552,366 | |
Nasdaq, Inc. | | | 10,800 | | | | 1,433,592 | |
Raymond James Financial, Inc. | | | 9,000 | | | | 861,030 | |
SEI Investments Co. | | | 9,500 | | | | 545,965 | |
Synchrony Financial | | | 38,600 | | | | 1,339,806 | |
T. Rowe Price Group, Inc. | | | 14,900 | | | | 2,255,711 | |
Visa, Inc. Class A | | | 5,000 | | | | 1,093,650 | |
The Western Union Co. | | | 23,200 | | | | 509,008 | |
| | | | | | | | 26,339,018 | |
Insurance — 6.5% |
Aflac, Inc. | | | 46,400 | | | | 2,063,408 | |
The Allstate Corp. | | | 20,100 | | | | 2,209,593 | |
American Financial Group, Inc. | | | 5,800 | | | | 508,196 | |
American International Group, Inc. | | | 128,809 | | | | 4,876,709 | |
Assurant, Inc. | | | 3,900 | | | | 531,258 | |
Chubb Ltd. | | | 45,770 | | | | 7,044,918 | |
Equitable Holdings, Inc. | | | 168,732 | | | | 4,317,852 | |
Everest Re Group Ltd. | | | 2,300 | | | | 538,407 | |
First American Financial Corp. | | | 6,100 | | | | 314,943 | |
Globe Life, Inc. | | | 13,600 | | | | 1,291,456 | |
The Hartford Financial Services Group, Inc. | | | 43,296 | | | | 2,120,638 | |
Lincoln National Corp. | | | 12,700 | | | | 638,937 | |
Loews Corp. | | | 17,300 | | | | 778,846 | |
Markel Corp. (b) | | | 890 | | | | 919,637 | |
Marsh & McLennan Cos., Inc. | | | 14,923 | | | | 1,745,991 | |
MetLife, Inc. | | | 118,237 | | | | 5,551,227 | |
Old Republic International Corp. | | | 12,500 | | | | 246,375 | |
Primerica, Inc. | | | 2,300 | | | | 308,039 | |
Principal Financial Group, Inc. | | | 27,169 | | | | 1,347,854 | |
The Progressive Corp. | | | 38,700 | | | | 3,826,656 | |
Prudential Financial, Inc. | | | 26,100 | | | | 2,037,627 | |
The Travelers Cos., Inc. | | | 41,900 | | | | 5,881,503 | |
Voya Financial, Inc. | | | 8,800 | | | | 517,528 | |
W.R. Berkley Corp. | | | 11,700 | | | | 777,114 | |
| | | | | | | | 50,394,712 | |
Real Estate — 0.2% |
CBRE Group, Inc. Class A (b) | | | 22,200 | | | | 1,392,384 | |
Jones Lang LaSalle, Inc. | | | 3,400 | | | | 504,458 | |
| | | | | | | | 1,896,842 | |
Real Estate Investment Trusts (REITS) — 1.6% |
Digital Realty Trust, Inc. | | | 3,330 | | | | 464,568 | |
Prologis, Inc. | | | 75,472 | | | | 7,521,539 | |
Sun Communities, Inc. | | | 3,289 | | | | 499,764 | |
Welltower, Inc. | | | 25,334 | | | | 1,637,083 | |
The accompanying notes are an integral part of the financial statements.
68
MML Equity Fund – Portfolio of Investments (Continued) |
| | | Number of
Shares | | | Value | |
Weyerhaeuser Co. | | | 80,620 | | | $ | 2,703,189 | |
| | | | | | | | 12,826,143 | |
| | | | | | | | 190,693,637 | |
Industrial — 12.0% |
Aerospace & Defense — 0.3% |
General Dynamics Corp. | | | 16,900 | | | | 2,515,058 | |
Building Materials — 0.8% |
Fortune Brands Home & Security, Inc. | | | 8,000 | | | | 685,760 | |
Johnson Controls International PLC | | | 88,158 | | | | 4,107,281 | |
Masco Corp. | | | 17,300 | | | | 950,289 | |
Owens Corning | | | 7,200 | | | | 545,472 | |
| | | | | | | | 6,288,802 | |
Electrical Components & Equipment — 0.4% |
Emerson Electric Co. | | | 34,300 | | | | 2,756,691 | |
Schneider Electric SE | | | 5,118 | | | | 740,296 | |
| | | | | | | | 3,496,987 | |
Electronics — 1.5% |
Agilent Technologies, Inc. | | | 19,938 | | | | 2,362,454 | |
Allegion PLC | | | 3,700 | | | | 430,606 | |
Arrow Electronics, Inc. (b) | | | 5,000 | | | | 486,500 | |
Honeywell International, Inc. | | | 23,196 | | | | 4,933,789 | |
Hubbell, Inc. | | | 4,200 | | | | 658,518 | |
Jabil, Inc. | | | 9,800 | | | | 416,794 | |
Keysight Technologies, Inc. (b) | | | 7,409 | | | | 978,655 | |
Roper Technologies, Inc. | | | 2,381 | | | | 1,026,425 | |
Sensata Technologies Holding PLC (b) | | | 9,300 | | | | 490,482 | |
| | | | | | | | 11,784,223 | |
Engineering & Construction — 0.3% |
Jacobs Engineering Group, Inc. | | | 21,756 | | | | 2,370,534 | |
Environmental Controls — 0.1% |
Pentair PLC | | | 11,000 | | | | 583,990 | |
Hand & Machine Tools — 0.2% |
Snap-on, Inc. | | | 3,600 | | | | 616,104 | |
Stanley Black & Decker, Inc. | | | 4,591 | | | | 819,769 | |
| | | | | | | | 1,435,873 | |
Machinery – Construction & Mining — 0.6% |
BWX Technologies, Inc. | | | 3,800 | | | | 229,064 | |
Caterpillar, Inc. | | | 22,506 | | | | 4,096,542 | |
Oshkosh Corp. | | | 4,100 | | | | 352,887 | |
| | | | | | | | 4,678,493 | |
Machinery – Diversified — 1.2% |
AGCO Corp. | | | 4,300 | | | | 443,287 | |
Deere & Co. | | | 18,114 | | | | 4,873,572 | |
Dover Corp. | | | 9,500 | | | | 1,199,375 | |
Rockwell Automation, Inc. | | | 6,548 | | | | 1,642,304 | |
| | | Number of
Shares | | | Value | |
Westinghouse Air Brake Technologies Corp. | | | 12,500 | | | $ | 915,000 | |
| | | | | | | | 9,073,538 | |
Miscellaneous - Manufacturing — 2.1% |
3M Co. | | | 38,160 | | | | 6,669,986 | |
Carlisle Cos., Inc. | | | 3,200 | | | | 499,776 | |
General Electric Co. | | | 585,982 | | | | 6,328,606 | |
ITT, Inc. | | | 5,700 | | | | 439,014 | |
Parker-Hannifin Corp. | | | 7,500 | | | | 2,043,075 | |
Textron, Inc. | | | 15,100 | | | | 729,783 | |
| | | | | | | | 16,710,240 | |
Packaging & Containers — 1.6% |
Amcor PLC | | | 103,600 | | | | 1,219,372 | |
Berry Global Group, Inc. (b) | | | 7,500 | | | | 421,425 | |
Crown Holdings, Inc. (b) | | | 8,900 | | | | 891,780 | |
Packaging Corp. of America | | | 42,036 | | | | 5,797,184 | |
Sealed Air Corp. | | | 10,200 | | | | 467,058 | |
Sonoco Products Co. | | | 5,700 | | | | 337,725 | |
WestRock Co. | | | 78,809 | | | | 3,430,556 | |
| | | | | | | | 12,565,100 | |
Transportation — 2.9% |
CSX Corp. | | | 45,300 | | | | 4,110,975 | |
FedEx Corp. | | | 9,154 | | | | 2,376,562 | |
Knight-Swift Transportation Holdings, Inc. | | | 10,000 | | | | 418,200 | |
Norfolk Southern Corp. | | | 16,907 | | | | 4,017,272 | |
Union Pacific Corp. | | | 11,820 | | | | 2,461,160 | |
United Parcel Service, Inc. Class B | | | 54,745 | | | | 9,219,058 | |
| | | | | | | | 22,603,227 | |
| | | | | | | | 94,106,065 | |
Technology — 13.3% |
Computers — 2.0% |
Apple, Inc. | | | 7,937 | | | | 1,053,161 | |
Cognizant Technology Solutions Corp. Class A | | | 35,300 | | | | 2,892,835 | |
Genpact Ltd. | | | 12,500 | | | | 517,000 | |
Hewlett Packard Enterprise Co. | | | 85,500 | | | | 1,013,175 | |
HP, Inc. | | | 85,200 | | | | 2,095,068 | |
International Business Machines Corp. | | | 51,600 | | | | 6,495,408 | |
Leidos Holdings, Inc. | | | 5,700 | | | | 599,184 | |
NetApp, Inc. | | | 14,700 | | | | 973,728 | |
| | | | | | | | 15,639,559 | |
Semiconductors — 8.0% |
Analog Devices, Inc. | | | 16,200 | | | | 2,393,226 | |
Applied Materials, Inc. | | | 129,117 | | | | 11,142,797 | |
ASML Holding NV | | | 3,691 | | | | 1,800,174 | |
Broadcom, Inc. | | | 34,163 | | | | 14,958,270 | |
KLA Corp. | | | 6,100 | | | | 1,579,351 | |
The accompanying notes are an integral part of the financial statements.
69
MML Equity Fund – Portfolio of Investments (Continued) |
| | | Number of
Shares | | | Value | |
Lam Research Corp. | | | 10,392 | | | $ | 4,907,830 | |
Micron Technology, Inc. (b) | | | 103,205 | | | | 7,758,952 | |
NVIDIA Corp. | | | 3,803 | | | | 1,985,927 | |
NXP Semiconductor NV | | | 29,327 | | | | 4,663,286 | |
Qorvo, Inc. (b) | | | 6,400 | | | | 1,064,128 | |
QUALCOMM, Inc. | | | 52,813 | | | | 8,045,532 | |
Texas Instruments, Inc. | | | 11,976 | | | | 1,965,621 | |
| | | | | | | | 62,265,094 | |
Software — 3.3% |
CDK Global, Inc. | | | 6,900 | | | | 357,627 | |
Citrix Systems, Inc. | | | 5,800 | | | | 754,580 | |
Fidelity National Information Services, Inc. | | | 1,800 | | | | 254,628 | |
Fiserv, Inc. (b) | | | 11,853 | | | | 1,349,583 | |
Microsoft Corp. | | | 39,996 | | | | 8,895,910 | |
Oracle Corp. | | | 194,300 | | | | 12,569,267 | |
salesforce.com, Inc. (b) | | | 1,300 | | | | 289,289 | |
Synopsys, Inc. (b) | | | 6,702 | | | | 1,737,426 | |
| | | | | | | | 26,208,310 | |
| | | | | | | | 104,112,963 | |
Utilities — 4.1% |
Electric — 4.0% |
AES Corp. | | | 91,375 | | | | 2,147,312 | |
Ameren Corp. | | | 26,051 | | | | 2,033,541 | |
Dominion Energy, Inc. | | | 4,288 | | | | 322,458 | |
Entergy Corp. | | | 7,375 | | | | 736,320 | |
Exelon Corp. | | | 64,400 | | | | 2,718,968 | |
FirstEnergy Corp. | | | 10,600 | | | | 324,466 | |
NextEra Energy, Inc. | | | 109,524 | | | | 8,449,777 | |
NRG Energy, Inc. | | | 16,100 | | | | 604,555 | |
OGE Energy Corp. | | | 11,200 | | | | 356,832 | |
Pinnacle West Capital Corp. | | | 9,800 | | | | 783,510 | |
Public Service Enterprise Group, Inc. | | | 81,134 | | | | 4,730,112 | |
Sempra Energy | | | 38,297 | | | | 4,879,421 | |
The Southern Co. | | | 42,619 | | | | 2,618,085 | |
Vistra Corp. | | | 28,100 | | | | 552,446 | |
| | | | | | | | 31,257,803 | |
Gas — 0.1% |
UGI Corp. | | | 13,700 | | | | 478,952 | |
| | | | | | | | 31,736,755 | |
| | | | | | | | | |
TOTAL COMMON STOCK (Cost $609,037,079) | | | | | | | 772,386,540 | |
| | | Number of
Shares | | | Value | |
PREFERRED STOCK — 0.1% |
Utilities — 0.1% |
Electric — 0.1% |
The Southern Co. Convertible 6.750% | | | 7,930 | | | $ | 411,567 | |
| | | | | | | | | |
TOTAL PREFERRED STOCK (Cost $396,500) | | | | | | | 411,567 | |
| | | | | | | | | |
TOTAL EQUITIES (Cost $609,433,579) | | | | | | | 772,798,107 | |
| | | | | | | | | |
MUTUAL FUNDS — 0.5% |
Diversified Financial Services — 0.5% |
iShares Russell 1000 Value ETF (c) | | | 26,739 | | | | 3,656,023 | |
State Street Navigator Securities Lending Prime Portfolio (d) | | | 273,983 | | | | 273,983 | |
| | | | | | | | 3,930,006 | |
| | | | | | | | | |
TOTAL MUTUAL FUNDS (Cost $3,303,154) | | | | | | | 3,930,006 | |
| | | | | | | | | |
TOTAL LONG-TERM INVESTMENTS (Cost $612,736,733) | | | | | | | 776,728,113 | |
| | | | | | | | | |
SHORT-TERM INVESTMENTS — 0.4% |
Mutual Fund — 0.1% |
T. Rowe Price Government Reserve Investment Fund | | | 454,618 | | | | 454,618 | |
| | | Principal
Amount | | | | | |
Repurchase Agreement — 0.3% |
Fixed Income Clearing Corp., Repurchase Agreement, dated 12/31/20, 0.000%, due 1/04/21 (e) | | $ | 2,699,237 | | | | 2,699,237 | |
| | | | | | | | | |
TOTAL SHORT-TERM INVESTMENTS (Cost $3,153,855) | | | | | | | 3,153,855 | |
| | | | | | | | | |
TOTAL INVESTMENTS — 99.9% (Cost $615,890,588) (f) | | | | | | | 779,881,968 | |
| | | | | | | | | |
Other Assets/(Liabilities) — 0.1% | | | | | | | 927,355 | |
| | | | | | | | | |
NET ASSETS — 100.0% | | | | | | $ | 780,809,323 | |
Abbreviation Legend
The accompanying notes are an integral part of the financial statements.
70
MML Equity Fund – Portfolio of Investments (Continued) |
Notes to Portfolio of Investments
Percentages are stated as a percent of net assets.
(a) | Security is exempt from registration under Regulation S or Rule 144A of the Securities Act of 1933. These securities are considered restricted and may be resold in transactions exempt from registration. At December 31, 2020, the aggregate market value of these securities amounted to $726,684 or 0.09% of net assets. |
(b) | Non-income producing security. |
(c) | Denotes all or a portion of security on loan. The total value of securities on loan as of December 31, 2020, was $3,054,690 or 0.39% of net assets. Total securities on loan may be less than the amounts identified in the Portfolio of Investments. The Fund received $3,015,508 of non-cash collateral (U.S. Treasury and/or Agency obligations) related to securities lending activity. This amount is not reflected on either the Portfolio of Investments or the Statement of Assets and Liabilities. (Note 2). |
(d) | Represents investment of security lending cash collateral. (Note 2). |
(e) | Maturity value of $2,699,237. Collateralized by U.S. Government Agency obligations with a rate of 0.000%, maturity date of 12/30/21, and an aggregate market value, including accrued interest, of $2,753,294. |
(f) | See Note 6 for aggregate cost for federal tax purposes. |
The accompanying notes are an integral part of the financial statements.
71
MML Equity Momentum Fund – Portfolio of Investments |
December 31, 2020 |
| | | Number of
Shares | | | Value | |
EQUITIES — 100.0% |
COMMON STOCK — 100.0% |
Basic Materials — 2.6% |
Chemicals — 1.7% |
Air Products & Chemicals, Inc. | | | 715 | | | $ | 195,352 | |
Linde PLC | | | 1,906 | | | | 502,250 | |
| | | | | | | | 697,602 | |
Mining — 0.9% |
Newmont Corp. | | | 5,775 | | | | 345,865 | |
| | | | | | | | 1,043,467 | |
Communications — 19.3% |
Internet — 17.2% |
Amazon.com, Inc. (a) | | | 1,035 | | | | 3,370,923 | |
eBay, Inc. | | | 2,823 | | | | 141,856 | |
Facebook, Inc. Class A (a) | | | 8,196 | | | | 2,238,819 | |
Netflix, Inc. (a) | | | 2,062 | | | | 1,114,985 | |
NortonLifeLock, Inc. | | | 4,107 | | | | 85,343 | |
| | | | | | | | 6,951,926 | |
Media — 1.4% |
Charter Communications, Inc. Class A (a) | | | 829 | | | | 548,425 | |
Telecommunications — 0.7% |
T-Mobile US, Inc. (a) | | | 2,214 | | | | 298,558 | |
| | | | | | | | 7,798,909 | |
Consumer, Cyclical — 8.3% |
Auto Manufacturers — 0.3% |
PACCAR, Inc. | | | 1,182 | | | | 101,983 | |
Distribution & Wholesale — 0.3% |
Fastenal Co. | | | 2,881 | | | | 140,679 | |
Home Builders — 0.5% |
D.R. Horton, Inc. | | | 1,211 | | | | 83,462 | |
Lennar Corp. Class A | | | 1,000 | | | | 76,230 | |
PulteGroup, Inc. | | | 841 | | | | 36,264 | |
| | | | | | | | 195,956 | |
Retail — 7.2% |
Chipotle Mexican Grill, Inc. (a) | | | 109 | | | | 151,151 | |
Costco Wholesale Corp. | | | 1,435 | | | | 540,679 | |
Dollar General Corp. | | | 1,269 | | | | 266,871 | |
Domino’s Pizza, Inc. | | | 200 | | | | 76,692 | |
The Home Depot, Inc. | | | 3,364 | | | | 893,546 | |
Lowe’s Cos., Inc. | | | 3,123 | | | | 501,273 | |
Target Corp. | | | 2,249 | | | | 397,016 | |
Tractor Supply Co. | | | 435 | | | | 61,152 | |
| | | | | | | | 2,888,380 | |
| | | | | | | | 3,326,998 | |
| | | Number of
Shares | | | Value | |
Consumer, Non-cyclical — 24.7% |
Beverages — 0.1% |
Brown-Forman Corp. Class B | | | 613 | | | $ | 48,691 | |
Biotechnology — 3.3% |
Amgen, Inc. | | | 2,324 | | | | 534,334 | |
Bio-Rad Laboratories, Inc. Class A (a) | | | 127 | | | | 74,033 | |
Regeneron Pharmaceuticals, Inc. (a) | | | 751 | | | | 362,816 | |
Vertex Pharmaceuticals, Inc. (a) | | | 1,457 | | | | 344,347 | |
| | | | | | | | 1,315,530 | |
Commercial Services — 5.9% |
IHS Markit Ltd. | | | 1,125 | | | | 101,059 | |
MarketAxess Holdings, Inc. | | | 171 | | | | 97,566 | |
Moody’s Corp. | | | 511 | | | | 148,313 | |
PayPal Holdings, Inc. (a) | | | 6,677 | | | | 1,563,753 | |
Rollins, Inc. | | | 1,302 | | | | 50,869 | |
S&P Global, Inc. | | | 963 | | | | 316,567 | |
Verisk Analytics, Inc. | | | 524 | | | | 108,777 | |
| | | | | | | | 2,386,904 | |
Foods — 1.2% |
Campbell Soup Co. | | | 628 | | | | 30,364 | |
Conagra Brands, Inc. | | | 1,786 | | | | 64,760 | |
General Mills, Inc. | | | 2,147 | | | | 126,244 | |
Hormel Foods Corp. | | | 1,068 | | | | 49,779 | |
Kellogg Co. | | | 838 | | | | 52,149 | |
The Kroger Co. | | | 5,250 | | | | 166,740 | |
| | | | | | | | 490,036 | |
Health Care – Products — 6.3% |
Danaher Corp. | | | 3,239 | | | | 719,512 | |
Hologic, Inc. (a) | | | 958 | | | | 69,771 | |
IDEXX Laboratories, Inc. (a) | | | 355 | | | | 177,454 | |
Intuitive Surgical, Inc. (a) | | | 391 | | | | 319,877 | |
ResMed, Inc. | | | 688 | | | | 146,241 | |
Thermo Fisher Scientific, Inc. | | | 2,024 | | | | 942,739 | |
West Pharmaceutical Services, Inc. | | | 530 | | | | 150,154 | |
| | | | | | | | 2,525,748 | |
Health Care – Services — 0.2% |
DaVita, Inc. (a) | | | 352 | | | | 41,325 | |
Quest Diagnostics, Inc. | | | 444 | | | | 52,911 | |
| | | | | | | | 94,236 | |
Household Products & Wares — 0.6% |
Church & Dwight Co., Inc. | | | 951 | | | | 82,956 | |
The Clorox Co. | | | 748 | | | | 151,036 | |
| | | | | | | | 233,992 | |
Pharmaceuticals — 7.1% |
AbbVie, Inc. | | | 9,640 | | | | 1,032,926 | |
Bristol-Myers Squibb Co. | | | 11,041 | | | | 684,873 | |
DexCom, Inc. (a) | | | 688 | | | | 254,367 | |
The accompanying notes are an integral part of the financial statements.
72
MML Equity Momentum Fund – Portfolio of Investments (Continued) |
| | | Number of
Shares | | | Value | |
Eli Lilly and Co. | | | 3,578 | | | $ | 604,110 | |
Zoetis, Inc. | | | 1,742 | | | | 288,301 | |
| | | | | | | | 2,864,577 | |
| | | | | | | | 9,959,714 | |
Financial — 3.6% |
Diversified Financial Services — 0.2% |
Nasdaq, Inc. | | | 450 | | | | 59,733 | |
Real Estate Investment Trusts (REITS) — 3.4% |
American Tower Corp. | | | 1,333 | | | | 299,205 | |
Crown Castle International Corp. | | | 1,372 | | | | 218,409 | |
Digital Realty Trust, Inc. | | | 1,169 | | | | 163,087 | |
Equinix, Inc. | | | 482 | | | | 344,235 | |
Prologis, Inc. | | | 2,567 | | | | 255,827 | |
SBA Communications Corp. | | | 357 | | | | 100,721 | |
| | | | | | | | 1,381,484 | |
| | | | | | | | 1,441,217 | |
Industrial — 1.8% |
Building Materials — 0.3% |
Fortune Brands Home & Security, Inc. | | | 470 | | | | 40,289 | |
Masco Corp. | | | 1,099 | | | | 60,368 | |
| | | | | | | | 100,657 | |
Electronics — 0.7% |
Agilent Technologies, Inc. | | | 1,341 | | | | 158,895 | |
Garmin Ltd. | | | 521 | | | | 62,343 | |
PerkinElmer, Inc. | | | 490 | | | | 70,315 | |
| | | | | | | | 291,553 | |
Machinery – Diversified — 0.3% |
Rockwell Automation, Inc. | | | 405 | | | | 101,578 | |
Transportation — 0.5% |
J.B. Hunt Transport Services, Inc. | | | 273 | | | | 37,305 | |
Kansas City Southern | | | 341 | | | | 69,608 | |
Old Dominion Freight Line, Inc. | | | 542 | | | | 105,788 | |
| | | | | | | | 212,701 | |
| | | | | | | | 706,489 | |
Technology — 38.0% |
Computers — 9.4% |
Apple, Inc. | | | 27,700 | | | | 3,675,513 | |
Fortinet, Inc. (a) | | | 673 | | | | 99,961 | |
| | | | | | | | 3,775,474 | |
Semiconductors — 11.1% |
Advanced Micro Devices, Inc. (a) | | | 8,442 | | | | 774,216 | |
KLA Corp. | | | 571 | | | | 147,838 | |
Lam Research Corp. | | | 728 | | | | 343,813 | |
NVIDIA Corp. | | | 4,437 | | | | 2,317,001 | |
Qorvo, Inc. (a) | | | 566 | | | | 94,109 | |
QUALCOMM, Inc. | | | 4,557 | | | | 694,213 | |
| | | Number of
Shares | | | Value | |
Skyworks Solutions, Inc. | | | 847 | | | $ | 129,489 | |
| | | | | | | | 4,500,679 | |
Software — 17.5% |
Activision Blizzard, Inc. | | | 4,858 | | | | 451,065 | |
Adobe, Inc. (a) | | | 2,096 | | | | 1,048,252 | |
Akamai Technologies, Inc. (a) | | | 561 | | | | 58,899 | |
ANSYS, Inc. (a) | | | 395 | | | | 143,701 | |
Autodesk, Inc. (a) | | | 922 | | | | 281,523 | |
Cadence Design Systems, Inc. (a) | | | 1,196 | | | | 163,170 | |
Citrix Systems, Inc. | | | 643 | | | | 83,654 | |
Electronic Arts, Inc. | | | 1,600 | | | | 229,760 | |
Jack Henry & Associates, Inc. | | | 278 | | | | 45,033 | |
Microsoft Corp. | | | 15,849 | | | | 3,525,135 | |
MSCI, Inc. | | | 411 | | | | 183,524 | |
ServiceNow, Inc. (a) | | | 876 | | | | 482,177 | |
Synopsys, Inc. (a) | | | 715 | | | | 185,357 | |
Take-Two Interactive Software, Inc. (a) | | | 418 | | | | 86,856 | |
Tyler Technologies, Inc. (a) | | | 228 | | | | 99,527 | |
| | | | | | | | 7,067,633 | |
| | | | | | | | 15,343,786 | |
Utilities — 1.7% |
Electric — 1.5% |
NextEra Energy, Inc. | | | 7,853 | | | | 605,859 | |
Water — 0.2% |
American Water Works Co., Inc. | | | 611 | | | | 93,770 | |
| | | | | | | | 699,629 | |
| | | | | | | | | |
TOTAL COMMON STOCK (Cost $38,554,907) | | | | | | | 40,320,209 | |
| | | | | | | | | |
TOTAL EQUITIES (Cost $38,554,907) | | | | | | | 40,320,209 | |
| | | | | | | | | |
TOTAL LONG-TERM INVESTMENTS (Cost $38,554,907) | | | | | | | 40,320,209 | |
| | | | | | | | | |
TOTAL INVESTMENTS — 100.0% (Cost $38,554,907) (b) | | | | | | | 40,320,209 | |
| | | | | | | | | |
Other Assets/(Liabilities) — 0.0% | | | | | | | 18,474 | |
| | | | | | | | | |
NET ASSETS — 100.0% | | | | | | $ | 40,338,683 | |
Notes to Portfolio of Investments
Percentages are stated as a percent of net assets.
(a) | Non-income producing security. |
(b) | See Note 6 for aggregate cost for federal tax purposes. |
The accompanying notes are an integral part of the financial statements.
73
MML Equity Rotation Fund – Portfolio of Investments |
December 31, 2020 |
| | | Number of
Shares | | | Value | |
EQUITIES — 99.9% |
COMMON STOCK — 99.9% |
Basic Materials — 5.6% |
Chemicals — 3.4% |
Ashland Global Holdings, Inc. | | | 1,273 | | | $ | 100,822 | |
Axalta Coating Systems Ltd. (a) | | | 2,952 | | | | 84,280 | |
Cabot Corp. | | | 1,261 | | | | 56,594 | |
Celanese Corp. | | | 1,091 | | | | 141,764 | |
CF Industries Holdings, Inc. | | | 4,888 | | | | 189,214 | |
The Chemours Co. | | | 3,757 | | | | 93,136 | |
Eastman Chemical Co. | | | 2,168 | | | | 217,407 | |
Huntsman Corp. | | | 4,620 | | | | 116,147 | |
The Mosaic Co. | | | 4,599 | | | | 105,823 | |
NewMarket Corp. | | | 64 | | | | 25,490 | |
Olin Corp. | | | 3,311 | | | | 81,318 | |
Valvoline, Inc. | | | 3,357 | | | | 77,681 | |
W.R. Grace & Co. | | | 762 | | | | 41,773 | |
Westlake Chemical Corp. | | | 782 | | | | 63,811 | |
| | | | | | | | 1,395,260 | |
Forest Products & Paper — 0.7% |
International Paper Co. | | | 6,185 | | | | 307,518 | |
Iron & Steel — 1.5% |
Nucor Corp. | | | 4,984 | | | | 265,099 | |
Reliance Steel & Aluminum Co. | | | 1,452 | | | | 173,877 | |
Steel Dynamics, Inc. | | | 4,642 | | | | 171,151 | |
| | | | | | | | 610,127 | |
| | | | | | | | 2,312,905 | |
Communications — 6.1% |
Advertising — 1.0% |
The Interpublic Group of Cos., Inc. | | | 8,884 | | | | 208,952 | |
Omnicom Group, Inc. | | | 3,231 | | | | 201,517 | |
| | | | | | | | 410,469 | |
Internet — 0.8% |
Expedia Group, Inc. | | | 1,922 | | | | 254,473 | |
TripAdvisor, Inc. (a) | | | 2,278 | | | | 65,561 | |
| | | | | | | | 320,034 | |
Media — 3.1% |
Discovery, Inc. Class A (a) (b) | | | 3,581 | | | | 107,752 | |
Discovery, Inc. Class C (a) | | | 7,457 | | | | 195,299 | |
DISH Network Corp. Class A (a) | | | 3,592 | | | | 116,165 | |
Fox Corp. Class A | | | 3,992 | | | | 116,247 | |
Fox Corp. Class B (a) | | | 2,610 | | | | 75,377 | |
News Corp. Class A | | | 6,078 | | | | 109,222 | |
News Corp. Class B | | | 1,932 | | | | 34,332 | |
Nexstar Media Group, Inc. Class A | | | 896 | | | | 97,834 | |
ViacomCBS, Inc. Class B | | | 11,565 | | | | 430,912 | |
| | | | | | | | 1,283,140 | |
| | | Number of
Shares | | | Value | |
Telecommunications — 1.2% |
CenturyLink, Inc. | | | 16,908 | | | $ | 164,853 | |
Ciena Corp. (a) | | | 2,702 | | | | 142,801 | |
CommScope Holding Co., Inc. (a) | | | 4,380 | | | | 58,692 | |
EchoStar Corp. Class A (a) | | | 1,089 | | | | 23,076 | |
Switch, Inc. Class A | | | 1,434 | | | | 23,474 | |
Telephone & Data Systems, Inc. | | | 2,279 | | | | 42,321 | |
United States Cellular Corp. (a) | | | 326 | | | | 10,005 | |
ViaSat, Inc. (a) | | | 1,305 | | | | 42,608 | |
| | | | | | | | 507,830 | |
| | | | | | | | 2,521,473 | |
Consumer, Cyclical — 19.8% |
Airlines — 3.1% |
Alaska Air Group, Inc. | | | 2,757 | | | | 143,364 | |
American Airlines Group, Inc. (b) | | | 9,648 | | | | 152,149 | |
Copa Holdings SA Class A | | | 710 | | | | 54,833 | |
Delta Air Lines, Inc. | | | 8,552 | | | | 343,876 | |
JetBlue Airways Corp. (a) | | | 6,247 | | | | 90,831 | |
Southwest Airlines Co. | | | 4,590 | | | | 213,940 | |
United Airlines Holdings, Inc. (a) | | | 6,620 | | | | 286,315 | |
| | | | | | | | 1,285,308 | |
Apparel — 2.6% |
Capri Holdings Ltd. (a) | | | 3,263 | | | | 137,046 | |
Carter’s, Inc. | | | 984 | | | | 92,565 | |
Columbia Sportswear Co. | | | 337 | | | | 29,447 | |
Hanesbrands, Inc. | | | 7,999 | | | | 116,625 | |
PVH Corp. | | | 1,603 | | | | 150,506 | |
Ralph Lauren Corp. | | | 1,101 | | | | 114,218 | |
Skechers U.S.A., Inc. Class A (a) | | | 2,811 | | | | 101,027 | |
Tapestry, Inc. | | | 6,329 | | | | 196,705 | |
Under Armour, Inc. Class A (a) | | | 4,385 | | | | 75,291 | |
Under Armour, Inc. Class C (a) | | | 4,295 | | | | 63,910 | |
| | | | | | | | 1,077,340 | |
Auto Parts & Equipment — 1.3% |
Allison Transmission Holdings, Inc. | | | 2,601 | | | | 112,181 | |
BorgWarner, Inc. | | | 4,738 | | | | 183,076 | |
Lear Corp. | | | 1,365 | | | | 217,076 | |
| | | | | | | | 512,333 | |
Distribution & Wholesale — 0.7% |
LKQ Corp. (a) | | | 5,669 | | | | 199,775 | |
Univar Solutions, Inc. (a) | | | 3,888 | | | | 73,911 | |
| | | | | | | | 273,686 | |
Entertainment — 0.2% |
Lions Gate Entertainment Corp. Class A (a) | | | 1,346 | | | | 15,304 | |
Lions Gate Entertainment Corp. Class B (a) | | | 2,594 | | | | 26,926 | |
The accompanying notes are an integral part of the financial statements.
74
MML Equity Rotation Fund – Portfolio of Investments (Continued) |
| | | Number of
Shares | | | Value | |
Six Flags Entertainment Corp. | | | 1,730 | | | $ | 58,993 | |
| | | | | | | | 101,223 | |
Food Services — 0.5% |
Aramark | | | 5,222 | | | | 200,943 | |
Home Builders — 1.1% |
PulteGroup, Inc. | | | 4,666 | | | | 201,198 | |
Thor Industries, Inc. (b) | | | 1,292 | | | | 120,143 | |
Toll Brothers, Inc. | | | 2,669 | | | | 116,021 | |
| | | | | | | | 437,362 | |
Home Furnishing — 1.4% |
Leggett & Platt, Inc. | | | 3,039 | | | | 134,628 | |
Tempur Sealy International, Inc. (a) | | | 6,829 | | | | 184,383 | |
Whirlpool Corp. | | | 1,433 | | | | 258,642 | |
| | | | | | | | 577,653 | |
Housewares — 0.6% |
Newell Brands, Inc. | | | 8,793 | | | | 186,675 | |
The Scotts Miracle-Gro Co. | | | 363 | | | | 72,288 | |
| | | | | | | | 258,963 | |
Leisure Time — 2.4% |
Brunswick Corp. | | | 689 | | | | 52,529 | |
Carnival Corp. | | | 10,756 | | | | 232,975 | |
Harley-Davidson, Inc. | | | 3,522 | | | | 129,258 | |
Norwegian Cruise Line Holdings Ltd. (a) | | | 5,879 | | | | 149,503 | |
Polaris, Inc. | | | 1,335 | | | | 127,199 | |
Royal Caribbean Cruises Ltd. | | | 3,903 | | | | 291,515 | |
| | | | | | | | 982,979 | |
Lodging — 1.3% |
Extended Stay America, Inc. | | | 4,011 | | | | 59,403 | |
Hyatt Hotels Corp. Class A | | | 792 | | | | 58,806 | |
MGM Resorts International | | | 10,731 | | | | 338,134 | |
Wyndham Destinations, Inc. | | | 1,932 | | | | 86,669 | |
| | | | | | | | 543,012 | |
Retail — 4.1% |
Advance Auto Parts, Inc. | | | 598 | | | | 94,191 | |
AutoNation, Inc. (a) | | | 1,361 | | | | 94,984 | |
Casey’s General Stores, Inc. | | | 654 | | | | 116,818 | |
Darden Restaurants, Inc. | | | 1,395 | | | | 166,172 | |
Dick’s Sporting Goods, Inc. | | | 1,433 | | | | 80,549 | |
Foot Locker, Inc. | | | 2,395 | | | | 96,854 | |
The Gap, Inc. | | | 4,237 | | | | 85,545 | |
Genuine Parts Co. | | | 1,356 | | | | 136,183 | |
Kohl’s Corp. | | | 3,561 | | | | 144,897 | |
L Brands, Inc. | | | 5,245 | | | | 195,062 | |
MSC Industrial Direct Co., Inc. Class A | | | 973 | | | | 82,112 | |
Nordstrom, Inc. (b) | | | 2,540 | | | | 79,273 | |
| | | Number of
Shares | | | Value | |
Nu Skin Enterprises, Inc. Class A | | | 1,186 | | | $ | 64,791 | |
Penske Automotive Group, Inc. | | | 721 | | | | 42,820 | |
Qurate Retail, Inc. | | | 8,770 | | | | 96,207 | |
Williams-Sonoma, Inc. | | | 1,043 | | | | 106,219 | |
| | | | | | | | 1,682,677 | |
Textiles — 0.5% |
Mohawk Industries, Inc. (a) | | | 1,324 | | | | 186,618 | |
| | | | | | | | 8,120,097 | |
Consumer, Non-cyclical — 11.5% |
Beverages — 0.4% |
Molson Coors Beverage Co. Class B | | | 3,853 | | | | 174,117 | |
Commercial Services — 3.6% |
ADT, Inc. | | | 2,124 | | | | 16,673 | |
AMERCO | | | 161 | | | | 73,088 | |
Euronet Worldwide, Inc. (a) | | | 687 | | | | 99,560 | |
FTI Consulting, Inc. (a) | | | 292 | | | | 32,622 | |
Graham Holdings Co. Class B | | | 94 | | | | 50,138 | |
H&R Block, Inc. | | | 4,373 | | | | 69,356 | |
John Wiley & Sons, Inc. Class A | | | 977 | | | | 44,610 | |
Macquarie Infrastructure Corp. | | | 1,717 | | | | 64,473 | |
ManpowerGroup, Inc. | | | 1,334 | | | | 120,300 | |
Nielsen Holdings PLC | | | 4,694 | | | | 97,964 | |
Quanta Services, Inc. | | | 3,125 | | | | 225,063 | |
Robert Half International, Inc. | | | 2,100 | | | | 131,208 | |
Sabre Corp. | | | 6,420 | | | | 77,168 | |
United Rentals, Inc. (a) | | | 1,634 | | | | 378,941 | |
| | | | | | | | 1,481,164 | |
Cosmetics & Personal Care — 0.1% |
Coty, Inc. Class A | | | 6,531 | | | | 45,848 | |
Foods — 1.6% |
Flowers Foods, Inc. | | | 2,032 | | | | 45,984 | |
Ingredion, Inc. | | | 1,482 | | | | 116,589 | |
Pilgrim’s Pride Corp. (a) | | | 1,195 | | | | 23,434 | |
Post Holdings, Inc. (a) | | | 778 | | | | 78,586 | |
Seaboard Corp. | | | 6 | | | | 18,186 | |
Sprouts Farmers Market, Inc. (a) | | | 2,671 | | | | 53,687 | |
Tyson Foods, Inc. Class A | | | 2,276 | | | | 146,665 | |
US Foods Holding Corp. (a) | | | 5,037 | | | | 167,783 | |
| | | | | | | | 650,914 | |
Health Care – Products — 0.3% |
Envista Holdings Corp. (a) | | | 3,678 | | | | 124,059 | |
Health Care – Services — 2.3% |
Acadia Healthcare Co., Inc. (a) | | | 2,031 | | | | 102,078 | |
DaVita, Inc. (a) | | | 1,889 | | | | 221,769 | |
Encompass Health Corp. | | | 1,678 | | | | 138,754 | |
Molina Healthcare, Inc. (a) | | | 1,164 | | | | 247,559 | |
The accompanying notes are an integral part of the financial statements.
75
MML Equity Rotation Fund – Portfolio of Investments (Continued) |
| | | Number of
Shares | | | Value | |
Universal Health Services, Inc. Class B | | | 1,682 | | | $ | 231,275 | |
| | | | | | | | 941,435 | |
Household Products & Wares — 0.2% |
Spectrum Brands Holdings, Inc. | | | 987 | | | | 77,953 | |
Pharmaceuticals — 3.0% |
AmerisourceBergen Corp. | | | 1,181 | | | | 115,455 | |
Cardinal Health, Inc. | | | 6,693 | | | | 358,477 | |
Henry Schein, Inc. (a) | | | 3,259 | | | | 217,897 | |
Herbalife Nutrition Ltd. (a) | | | 1,155 | | | | 55,498 | |
Jazz Pharmaceuticals PLC (a) | | | 1,207 | | | | 199,215 | |
Premier, Inc. Class A | | | 1,254 | | | | 44,015 | |
Viatris, Inc. (a) | | | 11,794 | | | | 221,019 | |
| | | | | | | | 1,211,576 | |
| | | | | | | | 4,707,066 | |
Energy — 5.0% |
Oil & Gas — 3.5% |
Apache Corp. | | | 8,700 | | | | 123,453 | |
Cabot Oil & Gas Corp. | | | 5,265 | | | | 85,714 | |
Cimarex Energy Co. | | | 2,329 | | | | 87,361 | |
Continental Resources, Inc. | | | 1,694 | | | | 27,612 | |
Devon Energy Corp. | | | 8,782 | | | | 138,843 | |
Diamondback Energy, Inc. | | | 3,614 | | | | 174,918 | |
EQT Corp. | | | 6,164 | | | | 78,344 | |
Helmerich & Payne, Inc. | | | 2,368 | | | | 54,843 | |
HollyFrontier Corp. | | | 3,463 | | | | 89,518 | |
Marathon Oil Corp. | | | 18,164 | | | | 121,154 | |
Murphy Oil Corp. | | | 3,296 | | | | 39,882 | |
Occidental Petroleum Corp. | | | 13,541 | | | | 234,395 | |
Parsley Energy, Inc. Class A | | | 6,966 | | | | 98,917 | |
WPX Energy, Inc. (a) | | | 9,360 | | | | 76,284 | |
| | | | | | | | 1,431,238 | |
Oil & Gas Services — 0.7% |
Baker Hughes Co. | | | 5,767 | | | | 120,242 | |
Halliburton Co. | | | 10,052 | | | | 189,983 | |
| | | | | | | | 310,225 | |
Pipelines — 0.8% |
Cheniere Energy, Inc. (a) | | | 2,298 | | | | 137,949 | |
Equitrans Midstream Corp. | | | 5,560 | | | | 44,702 | |
Targa Resources Corp. | | | 5,291 | | | | 139,577 | |
| | | | | | | | 322,228 | |
| | | | | | | | 2,063,691 | |
Financial — 28.7% |
Banks — 7.8% |
Associated Banc-Corp. | | | 3,435 | | | | 58,567 | |
Bank of Hawaii Corp. | | | 554 | | | | 42,447 | |
Bank OZK | | | 2,833 | | | | 88,588 | |
| | | Number of
Shares | | | Value | |
Citizens Financial Group, Inc. | | | 6,536 | | | $ | 233,727 | |
Comerica, Inc. | | | 3,187 | | | | 178,026 | |
Cullen/Frost Bankers, Inc. | | | 783 | | | | 68,301 | |
East West Bancorp, Inc. | | | 3,135 | | | | 158,976 | |
F.N.B. Corp. | | | 7,307 | | | | 69,417 | |
Fifth Third Bancorp | | | 6,588 | | | | 181,631 | |
First Citizens BancShares, Inc. Class A | | | 150 | | | | 86,141 | |
First Hawaiian, Inc. | | | 2,938 | | | | 69,278 | |
First Horizon Corp. | | | 7,144 | | | | 91,157 | |
Huntington Bancshares, Inc. | | | 16,352 | | | | 206,526 | |
KeyCorp | | | 13,481 | | | | 221,223 | |
M&T Bank Corp. | | | 1,088 | | | | 138,502 | |
PacWest Bancorp | | | 2,645 | | | | 67,183 | |
Pinnacle Financial Partners, Inc. | | | 1,705 | | | | 109,802 | |
Popular, Inc. | | | 2,003 | | | | 112,809 | |
Regions Financial Corp. | | | 13,860 | | | | 223,423 | |
Signature Bank | | | 818 | | | | 110,667 | |
Synovus Financial Corp. | | | 3,377 | | | | 109,313 | |
TCF Financial Corp. | | | 2,194 | | | | 81,222 | |
Umpqua Holdings Corp. | | | 3,186 | | | | 48,236 | |
Webster Financial Corp. | | | 2,077 | | | | 87,546 | |
Western Alliance Bancorp | | | 2,246 | | | | 134,648 | |
Wintrust Financial Corp. | | | 1,326 | | | | 81,005 | |
Zions Bancorp NA | | | 3,588 | | | | 155,863 | |
| | | | | | | | 3,214,224 | |
Diversified Financial Services — 6.6% |
Affiliated Managers Group, Inc. | | | 1,082 | | | | 110,039 | |
Air Lease Corp. | | | 2,459 | | | | 109,229 | |
Alliance Data Systems Corp. | | | 1,076 | | | | 79,732 | |
Ally Financial, Inc. | | | 8,521 | | | | 303,859 | |
Credit Acceptance Corp. (a) (b) | | | 99 | | | | 34,268 | |
Discover Financial Services | | | 3,888 | | | | 351,981 | |
Eaton Vance Corp. | | | 1,848 | | | | 125,535 | |
Evercore, Inc. Class A | | | 906 | | | | 99,334 | |
Franklin Resources, Inc. | | | 1,923 | | | | 48,056 | |
Interactive Brokers Group, Inc. Class A | | | 1,667 | | | | 101,554 | |
Invesco Ltd. | | | 8,656 | | | | 150,874 | |
Jefferies Financial Group, Inc. | | | 5,139 | | | | 126,419 | |
Lazard Ltd. Class A | | | 2,333 | | | | 98,686 | |
LPL Financial Holdings, Inc. | | | 1,510 | | | | 157,372 | |
OneMain Holdings, Inc. | | | 1,514 | | | | 72,914 | |
Raymond James Financial, Inc. | | | 1,108 | | | | 106,002 | |
Santander Consumer USA Holdings, Inc. | | | 1,710 | | | | 37,654 | |
SLM Corp. | | | 8,652 | | | | 107,198 | |
Synchrony Financial | | | 10,147 | | | | 352,202 | |
The Western Union Co. | | | 5,463 | | | | 119,858 | |
| | | | | | | | 2,692,766 | |
The accompanying notes are an integral part of the financial statements.
76
MML Equity Rotation Fund – Portfolio of Investments (Continued) |
| | | Number of
Shares | | | Value | |
Insurance — 9.4% |
Alleghany Corp. | | | 240 | | | $ | 144,886 | |
American Financial Group, Inc. | | | 1,684 | | | | 147,552 | |
American National Group, Inc. | | | 168 | | | | 16,148 | |
Arch Capital Group Ltd. (a) | | | 4,548 | | | | 164,046 | |
Assurant, Inc. | | | 1,359 | | | | 185,123 | |
Assured Guaranty Ltd. | | | 925 | | | | 29,128 | |
Athene Holding Ltd. Class A (a) | | | 2,667 | | | | 115,054 | |
Axis Capital Holdings Ltd. | | | 1,921 | | | | 96,799 | |
Brighthouse Financial, Inc. (a) | | | 2,284 | | | | 82,692 | |
Cincinnati Financial Corp. | | | 2,734 | | | | 238,870 | |
CNA Financial Corp. | | | 533 | | | | 20,766 | |
Everest Re Group Ltd. | | | 866 | | | | 202,722 | |
Fidelity National Financial, Inc. | | | 3,473 | | | | 135,760 | |
First American Financial Corp. | | | 2,498 | | | | 128,972 | |
Globe Life, Inc. | | | 1,319 | | | | 125,252 | |
The Hanover Insurance Group, Inc. | | | 875 | | | | 102,305 | |
The Hartford Financial Services Group, Inc. | | | 4,653 | | | | 227,904 | |
Kemper Corp. | | | 1,425 | | | | 109,483 | |
Lincoln National Corp. | | | 1,749 | | | | 87,992 | |
Loews Corp. | | | 4,299 | | | | 193,541 | |
Markel Corp. (a) | | | 116 | | | | 119,863 | |
Mercury General Corp. | | | 618 | | | | 32,266 | |
MGIC Investment Corp. | | | 7,819 | | | | 98,128 | |
Old Republic International Corp. | | | 6,520 | | | | 128,509 | |
Primerica, Inc. | | | 500 | | | | 66,965 | |
Principal Financial Group, Inc. | | | 5,445 | | | | 270,126 | |
Reinsurance Group of America, Inc. | | | 1,551 | | | | 179,761 | |
RenaissanceRe Holdings Ltd. | | | 786 | | | | 130,335 | |
Unum Group | | | 4,700 | | | | 107,818 | |
Voya Financial, Inc. | | | 1,584 | | | | 93,155 | |
W.R. Berkley Corp. | | | 981 | | | | 65,158 | |
White Mountains Insurance Group Ltd. | | | 31 | | | | 31,021 | |
| | | | | | | | 3,878,100 | |
Real Estate — 0.9% |
CBRE Group, Inc. Class A (a) | | | 2,478 | | | | 155,420 | |
The Howard Hughes Corp. (a) | | | 279 | | | | 22,022 | |
Jones Lang LaSalle, Inc. | | | 1,179 | | | | 174,928 | |
| | | | | | | | 352,370 | |
Real Estate Investment Trusts (REITS) — 3.5% |
AGNC Investment Corp. | | | 5,395 | | | | 84,162 | |
Apartment Income Corp. (a) | | | 1,142 | | | | 43,864 | |
Apartment Investment and Management Co. Class A | | | 1,134 | | | | 5,988 | |
Apple Hospitality REIT, Inc. | | | 4,751 | | | | 61,335 | |
Brandywine Realty Trust | | | 1,948 | | | | 23,201 | |
Brixmor Property Group, Inc. | | | 5,818 | | | | 96,288 | |
| | | Number of
Shares | | | Value | |
Corporate Office Properties Trust | | | 1,121 | | | $ | 29,236 | |
Douglas Emmett, Inc. | | | 1,200 | | | | 35,016 | |
Empire State Realty Trust, Inc. Class A | | | 3,315 | | | | 30,896 | |
EPR Properties | | | 1,487 | | | | 48,328 | |
Equity Commonwealth | | | 985 | | | | 26,871 | |
Host Hotels & Resorts, Inc. | | | 9,353 | | | | 136,834 | |
Iron Mountain, Inc. (b) | | | 2,052 | | | | 60,493 | |
Kimco Realty Corp. | | | 4,172 | | | | 62,622 | |
Lamar Advertising Co. Class A | | | 547 | | | | 45,521 | |
New Residential Investment Corp. | | | 3,292 | | | | 32,722 | |
Outfront Media, Inc. | | | 3,258 | | | | 63,726 | |
Paramount Group, Inc. | | | 1,746 | | | | 15,784 | |
Park Hotels & Resorts, Inc. | | | 5,543 | | | | 95,062 | |
SL Green Realty Corp. (b) | | | 1,201 | | | | 71,556 | |
Spirit Realty Capital, Inc. | | | 1,044 | | | | 41,937 | |
Starwood Property Trust, Inc. | | | 3,370 | | | | 65,041 | |
STORE Capital Corp. | | | 1,552 | | | | 52,737 | |
Vornado Realty Trust | | | 4,030 | | | | 150,480 | |
Weingarten Realty Investors | | | 2,749 | | | | 59,571 | |
| | | | | | | | 1,439,271 | |
Savings & Loans — 0.5% |
New York Community Bancorp, Inc. | | | 5,262 | | | | 55,514 | |
People’s United Financial, Inc. | | | 4,623 | | | | 59,776 | |
Sterling Bancorp | | | 4,494 | | | | 80,802 | |
| | | | | | | | 196,092 | |
| | | | | | | | 11,772,823 | |
Industrial — 14.3% |
Aerospace & Defense — 1.1% |
Hexcel Corp. | | | 1,909 | | | | 92,567 | |
Howmet Aerospace, Inc. | | | 9,017 | | | | 257,345 | |
Spirit AeroSystems Holdings, Inc. Class A | | | 2,428 | | | | 94,911 | |
| | | | | | | | 444,823 | |
Building Materials — 1.0% |
Armstrong World Industries, Inc. | | | 423 | | | | 31,467 | |
Eagle Materials, Inc. | | | 556 | | | | 56,351 | |
MDU Resources Group, Inc. | | | 4,597 | | | | 121,085 | |
Owens Corning | | | 2,479 | | | | 187,809 | |
| | | | | | | | 396,712 | |
Electrical Components & Equipment — 0.3% |
Acuity Brands, Inc. | | | 908 | | | | 109,950 | |
Energizer Holdings, Inc. | | | 565 | | | | 23,831 | |
| | | | | | | | 133,781 | |
Electronics — 2.1% |
Arrow Electronics, Inc. (a) | | | 1,785 | | | | 173,680 | |
Avnet, Inc. | | | 2,279 | | | | 80,016 | |
Hubbell, Inc. | | | 585 | | | | 91,722 | |
The accompanying notes are an integral part of the financial statements.
77
MML Equity Rotation Fund – Portfolio of Investments (Continued) |
| | | Number of
Shares | | | Value | |
Jabil, Inc. | | | 3,377 | | | $ | 143,624 | |
nVent Electric PLC | | | 3,488 | | | | 81,235 | |
Sensata Technologies Holding PLC (a) | | | 1,863 | | | | 98,255 | |
SYNNEX Corp. | | | 966 | | | | 78,671 | |
Woodward, Inc. | | | 870 | | | | 105,731 | |
| | | | | | | | 852,934 | |
Engineering & Construction — 0.4% |
AECOM (a) | | | 3,504 | | | | 174,429 | |
Environmental Controls — 0.2% |
Clean Harbors, Inc. (a) | | | 1,124 | | | | 85,536 | |
Hand & Machine Tools — 0.8% |
Lincoln Electric Holdings, Inc. | | | 702 | | | | 81,607 | |
Regal Beloit Corp. | | | 933 | | | | 114,582 | |
Snap-on, Inc. | | | 733 | | | | 125,446 | |
| | | | | | | | 321,635 | |
Machinery – Construction & Mining — 0.5% |
Oshkosh Corp. | | | 1,556 | | | | 133,925 | |
Vertiv Holdings Co. | | | 4,627 | | | | 86,386 | |
| | | | | | | | 220,311 | |
Machinery – Diversified — 1.5% |
AGCO Corp. | | | 1,413 | | | | 145,666 | |
Crane Co. | | | 1,119 | | | | 86,902 | |
Curtiss-Wright Corp. | | | 707 | | | | 82,260 | |
Flowserve Corp. | | | 3,004 | | | | 110,697 | |
Gates Industrial Corp. PLC (a) | | | 1,011 | | | | 12,900 | |
GrafTech International Ltd. | | | 1,538 | | | | 16,395 | |
The Middleby Corp. (a) | | | 1,267 | | | | 163,342 | |
| | | | | | | | 618,162 | |
Metal Fabricate & Hardware — 0.5% |
The Timken Co. | | | 1,450 | | | | 112,172 | |
Valmont Industries, Inc. | | | 486 | | | | 85,016 | |
| | | | | | | | 197,188 | |
Miscellaneous - Manufacturing — 1.2% |
Carlisle Cos., Inc. | | | 747 | | | | 116,667 | |
ITT, Inc. | | | 990 | | | | 76,250 | |
Textron, Inc. | | | 5,200 | | | | 251,316 | |
Trinity Industries, Inc. | | | 2,057 | | | | 54,284 | |
| | | | | | | | 498,517 | |
Packaging & Containers — 2.8% |
Berry Global Group, Inc. (a) | | | 3,046 | | | | 171,155 | |
Crown Holdings, Inc. (a) | | | 2,044 | | | | 204,809 | |
Graphic Packaging Holding Co. | | | 6,421 | | | | 108,772 | |
Packaging Corp. of America | | | 962 | | | | 132,669 | |
Sealed Air Corp. | | | 2,577 | | | | 118,001 | |
Silgan Holdings, Inc. | | | 1,782 | | | | 66,076 | |
Sonoco Products Co. | | | 1,656 | | | | 98,118 | |
| | | Number of
Shares | | | Value | |
WestRock Co. | | | 5,857 | | | $ | 254,955 | |
| | | | | | | | 1,154,555 | |
Shipbuilding — 0.3% |
Huntington Ingalls Industries, Inc. | | | 587 | | | | 100,072 | |
Transportation — 1.6% |
C.H. Robinson Worldwide, Inc. | | | 1,286 | | | | 120,717 | |
Kirby Corp. (a) | | | 1,373 | | | | 71,162 | |
Knight-Swift Transportation Holdings, Inc. | | | 1,284 | | | | 53,697 | |
Landstar System, Inc. | | | 548 | | | | 73,794 | |
Ryder System, Inc. | | | 1,219 | | | | 75,285 | |
Schneider National, Inc. Class B | | | 1,336 | | | | 27,655 | |
XPO Logistics, Inc. (a) | | | 2,073 | | | | 247,102 | |
| | | | | | | | 669,412 | |
| | | | | | | | 5,868,067 | |
Technology — 5.1% |
Computers — 3.4% |
CACI International, Inc. Class A (a) | | | 524 | | | | 130,649 | |
Dell Technologies C (a) | | | 3,495 | | | | 256,149 | |
DXC Technology Co. | | | 5,831 | | | | 150,148 | |
Hewlett Packard Enterprise Co. | | | 29,409 | | | | 348,497 | |
NCR Corp. (a) | | | 2,936 | | | | 110,305 | |
NetApp, Inc. | | | 3,881 | | | | 257,077 | |
Science Applications International Corp. | | | 1,327 | | | | 125,587 | |
| | | | | | | | 1,378,412 | |
Office & Business Equipment — 0.2% |
Xerox Holdings Corp. | | | 4,189 | | | | 97,143 | |
Semiconductors — 0.7% |
ON Semiconductor Corp. (a) | | | 8,064 | | | | 263,935 | |
Software — 0.8% |
CDK Global, Inc. | | | 1,913 | | | | 99,151 | |
Change Healthcare, Inc. (a) | | | 5,602 | | | | 104,477 | |
Concentrix Corp. (a) | | | 961 | | | | 94,851 | |
Teradata Corp. (a) | | | 1,796 | | | | 40,356 | |
| | | | | | | | 338,835 | |
| | | | | | | | 2,078,325 | |
Utilities — 3.8% |
Electric — 3.1% |
AES Corp. | | | 15,070 | | | | 354,145 | |
CenterPoint Energy, Inc. | | | 10,289 | | | | 222,654 | |
Hawaiian Electric Industries, Inc. | | | 1,657 | | | | 58,641 | |
NRG Energy, Inc. | | | 5,566 | | | | 209,003 | |
OGE Energy Corp. | | | 2,022 | | | | 64,421 | |
PG&E Corp. (a) | | | 12,175 | | | | 151,701 | |
Vistra Corp. | | | 10,514 | | | | 206,705 | |
| | | | | | | | 1,267,270 | |
The accompanying notes are an integral part of the financial statements.
78
MML Equity Rotation Fund – Portfolio of Investments (Continued) |
| | | Number of
Shares | | | Value | |
Gas — 0.7% |
National Fuel Gas Co. | | | 1,923 | | | $ | 79,093 | |
NiSource, Inc. | | | 3,585 | | | | 82,240 | |
UGI Corp. | | | 3,836 | | | | 134,106 | |
| | | | | | | | 295,439 | |
| | | | | | | | 1,562,709 | |
| | | | | | | | | |
TOTAL COMMON STOCK (Cost $38,709,523) | | | | | | | 41,007,156 | |
| | | | | | | | | |
TOTAL EQUITIES (Cost $38,709,523) | | | | | | | 41,007,156 | |
| | | | | | | | | |
MUTUAL FUNDS — 0.1% |
Diversified Financial Services — 0.1% |
State Street Navigator Securities Lending Prime Portfolio (c) | | | 30,445 | | | | 30,445 | |
| | | | | | | | | |
TOTAL MUTUAL FUNDS (Cost $30,445) | | | | | | | 30,445 | |
| | | | | | | | | |
TOTAL LONG-TERM INVESTMENTS (Cost $38,739,968) | | | | | | | 41,037,601 | |
| | | Principal
Amount | | | | | |
SHORT-TERM INVESTMENTS — 0.7% |
Repurchase Agreement — 0.7% |
Fixed Income Clearing Corp., Repurchase Agreement, dated 12/31/20, 0.000%, due 1/04/21 (d) | | $ | 274,992 | | | | 274,992 | |
| | | | | | | | | |
TOTAL SHORT-TERM INVESTMENTS (Cost $274,992) | | | | | | | 274,992 | |
| | | | | | | | | |
TOTAL INVESTMENTS — 100.7% (Cost $39,014,960) (e) | | | | | | | 41,312,593 | |
| | | | | | | | | |
Other Assets/(Liabilities) — (0.7)% | | | | | | | (269,262 | ) |
| | | | | | | | | |
NET ASSETS — 100.0% | | | | | | $ | 41,043,331 | |
Notes to Portfolio of Investments
Percentages are stated as a percent of net assets.
(a) | Non-income producing security. |
(b) | Denotes all or a portion of security on loan. The total value of securities on loan as of December 31, 2020, was $425,922 or 1.04% of net assets. Total securities on loan may be less than the amounts identified in the Portfolio of Investments. The Fund received $408,867 of non-cash collateral (U.S. Treasury and/or Agency obligations) related to securities lending activity. This amount is not reflected on either the Portfolio of Investments or the Statement of Assets and Liabilities. (Note 2). |
(c) | Represents investment of security lending cash collateral. (Note 2). |
(d) | Maturity value of $274,992. Collateralized by U.S. Government Agency obligations with a rate of 0.000%, maturity date of 12/30/21, and an aggregate market value, including accrued interest, of $280,573. |
(e) | See Note 6 for aggregate cost for federal tax purposes. |
The accompanying notes are an integral part of the financial statements.
79
MML High Yield Fund – Portfolio of Investments |
December 31, 2020 |
| | | Number of
Shares | | | Value | |
EQUITIES — 0.6% |
COMMON STOCK — 0.6% |
Energy — 0.6% |
Oil & Gas — 0.6% |
Fieldwood Energy LLC (a) | | | 3,193 | | | $ | — | |
Fieldwood Energy LLC (a) | | | 13,011 | | | | — | |
Jupiter Resources, Inc. (a) (b) (c) | | | 191,606 | | | | 613,139 | |
| | | | | | | | 613,139 | |
| | | | | | | | | |
TOTAL COMMON STOCK (Cost $1,318,416) | | | | | | | 613,139 | |
| | | | | | | | | |
TOTAL EQUITIES (Cost $1,318,416) | | | | | | | 613,139 | |
| | | Principal
Amount | | | | | |
BONDS & NOTES — 97.1% |
BANK LOANS — 7.0% |
Advertising — 0.4% |
Clear Channel Outdoor Holdings, Inc., Term Loan B, 3 mo. LIBOR + 3.500% | | | | | | | | |
3.714% VRN 8/21/26 | | $ | 469,811 | | | | 451,352 | |
Entertainment — 0.3% |
Delta 2 (LUX) S.A.R.L., 2018 USD Term Loan, 1 mo. LIBOR + 2.500% | | | | | | | | |
3.500% VRN 2/01/24 | | | 259,676 | | | | 256,524 | |
Health Care - Services — 0.5% | | | | | | | | |
Radiology Partners, Inc., 2018 1st Lien Term Loan B, | | | | | | | | |
0.000% 7/09/25 (d) | | | 471,000 | | | | 462,465 | |
Household Products & Wares — 0.4% | | | | |
Kronos Acquisition Holdings, Inc., 2020 Term Loan B, | | | | | | | | |
0.000% 12/17/26 (d) | | | 403,224 | | | | 402,720 | |
Oil & Gas — 0.0% |
Fieldwood Energy LLC, Exit 2nd Lien Term Loan, | | | | | | | | |
0.000% 4/11/23 (e) | | | 387,384 | | | | 89 | |
Packaging & Containers — 2.2% |
BWAY Holding Co., 2017 Term Loan B, 3 mo. LIBOR + 3.250% | | | | | | | | |
3.480% VRN 4/03/24 | | | 1,181,435 | | | | 1,138,608 | |
Consolidated Energy Finance, SA, Term Loan B, 1 mo. LIBOR + 2.500% | | | | | | | | |
2.645% VRN 5/07/25 | | | 881,225 | | | | 840,468 | |
| | | Principal
Amount | | | Value | |
Trident TPI Holdings, Inc., 2017 USD Term Loan B1, 3 mo. LIBOR + 3.000% | | | | | | | | |
4.000% VRN 10/17/24 | | $ | 161,306 | | | $ | 158,922 | |
| | | | | | | | 2,137,998 | |
Software — 3.2% |
Banff Merger Sub, Inc., 2018 USD Term Loan B, 1 mo. LIBOR + 4.250% | | | | | | | | |
4.397% VRN 10/02/25 | | | 858,454 | | | | 853,913 | |
Finastra USA, Inc. | | | | | | | | |
USD 1st Lien Term Loan, 6 mo. LIBOR + 3.500% | | | | | | | | |
4.500% VRN 6/13/24 | | | 917,056 | | | | 897,284 | |
USD 2nd Lien Term Loan, 6 mo. LIBOR + 7.250% | | | | | | | | |
8.250% VRN 6/13/25 | | | 1,400,000 | | | | 1,400,504 | |
| | | | | | | | 3,151,701 | |
| | | | | | | | | |
TOTAL BANK LOANS (Cost $7,067,659) | | | | | | | 6,862,849 | |
| | | | | | | | | |
CORPORATE DEBT — 90.1% |
Advertising — 0.6% |
Terrier Media Buyer, Inc. | | | | | | | | |
8.875% 12/15/27 (f) | | | 523,000 | | | | 576,608 | |
Aerospace & Defense — 2.6% |
TransDigm, Inc. | | | | | | | | |
6.250% 3/15/26 (f) | | | 316,000 | | | | 336,540 | |
6.375% 6/15/26 | | | 154,000 | | | | 159,390 | |
8.000% 12/15/25 (f) | | | 255,000 | | | | 281,852 | |
Triumph Group, Inc. | | | | | | | | |
5.250% 6/01/22 | | | 305,000 | | | | 290,512 | |
6.250% 9/15/24 (f) | | | 306,000 | | | | 302,940 | |
7.750% 8/15/25 | | | 1,243,000 | | | | 1,135,791 | |
| | | | | | | | 2,507,025 | |
Airlines — 0.7% |
American Airlines, Inc. | | | | | | | | |
11.750% 7/15/25 (f) | | | 379,000 | | | | 437,082 | |
Mileage Plus Holdings LLC / Mileage Plus Intellectual Property Assets Ltd. | | | | | | | | |
6.500% 6/20/27 (f) | | | 265,000 | | | | 284,875 | |
| | | | | | | | 721,957 | |
Auto Manufacturers — 4.8% |
Ford Motor Co. | | | | | | | | |
7.450% 7/16/31 | | | 472,000 | | | | 605,340 | |
8.500% 4/21/23 | | | 312,000 | | | | 351,159 | |
9.000% 4/22/25 | | | 241,000 | | | | 295,468 | |
The accompanying notes are an integral part of the financial statements.
80
MML High Yield Fund – Portfolio of Investments (Continued) |
| | | Principal
Amount | | | Value | |
9.625% 4/22/30 | | $ | 726,000 | | | $ | 1,024,567 | |
Ford Motor Credit Co. LLC | | | | | | | | |
3.087% 1/09/23 | | | 92,000 | | | | 93,605 | |
3.664% 9/08/24 | | | 200,000 | | | | 205,250 | |
4.125% 8/17/27 | | | 289,000 | | | | 302,728 | |
4.134% 8/04/25 | | | 200,000 | | | | 209,750 | |
4.542% 8/01/26 | | | 1,039,000 | | | | 1,109,132 | |
JB Poindexter & Co., Inc. | | | | | | | | |
7.125% 4/15/26 (f) | | | 435,000 | | | | 460,013 | |
| | | | | | | | 4,657,012 | |
Auto Parts & Equipment — 0.9% |
Adient Global Holdings Ltd. | | | | | | | | |
4.875% 8/15/26 (f) | | | 170,000 | | | | 174,675 | |
American Axle & Manufacturing, Inc. | | | | | | | | |
6.500% 4/01/27 | | | 219,000 | | | | 230,498 | |
Clarios Global LP/Clarios US Finance Co. | | | | | | | | |
8.500% 5/15/27 (f) | | | 467,000 | | | | 507,353 | |
| | | | | | | | 912,526 | |
Building Materials — 1.7% |
Cornerstone Building Brands, Inc. | | | | | | | | |
6.125% 1/15/29 (f) | | | 171,000 | | | | 181,688 | |
CP Atlas Buyer, Inc. | | | | | | | | |
7.000% 12/01/28 (f) | | | 208,000 | | | | 216,320 | |
Forterra Finance LLC / FRTA Finance Corp. | | | | | | | | |
6.500% 7/15/25 (f) | | | 150,000 | | | | 161,250 | |
Griffon Corp. | | | | | | | | |
5.750% 3/01/28 | | | 211,000 | | | | 223,132 | |
James Hardie International Finance DAC | | | | | | | | |
4.750% 1/15/25 (f) | | | 126,000 | | | | 128,168 | |
5.000% 1/15/28 (f) | | | 322,000 | | | | 342,019 | |
PGT Innovations, Inc. | | | | | | | | |
6.750% 8/01/26 (f) | | | 368,000 | | | | 391,460 | |
| | | | | | | | 1,644,037 | |
Chemicals — 1.9% |
CF Industries, Inc. | | | | | | | | |
4.950% 6/01/43 | | | 63,000 | | | | 77,333 | |
5.375% 3/15/44 | | | 240,000 | | | | 303,781 | |
Consolidated Energy Finance SA | | | | | | | | |
6.875% 6/15/25 (f) | | | 915,000 | | | | 927,581 | |
Ingevity Corp. | | | | | | | | |
3.875% 11/01/28 (f) | | | 203,000 | | | | 204,522 | |
Nouryon Holding BV | | | | | | | | |
8.000% 10/01/26 (f) | | | 141,000 | | | | 149,813 | |
| | | Principal
Amount | | | Value | |
Valvoline, Inc. | | | | | | | | |
4.375% 8/15/25 | | $ | 157,000 | | | $ | 162,145 | |
| | | | | | | | 1,825,175 | |
Coal — 2.3% |
Peabody Energy Corp. | | | | | | | | |
6.000% 3/31/22 (f) | | | 1,350,000 | | | | 985,500 | |
SunCoke Energy Partners LP/SunCoke Energy Partners Finance Corp. | | | | | | | | |
7.500% 6/15/25 (f) | | | 759,000 | | | | 753,459 | |
Warrior Met Coal, Inc. | | | | | | | | |
8.000% 11/01/24 (f) | | | 534,000 | | | | 546,015 | |
| | | | | | | | 2,284,974 | |
Commercial Services — 0.9% |
Prime Security Services Borrower LLC / Prime Finance, Inc. | | | | | | | | |
6.250% 1/15/28 (f) | | | 802,000 | | | | 861,019 | |
Computers — 2.3% |
Banff Merger Sub, Inc. | | | | | | | | |
9.750% 9/01/26 (f) | | | 466,000 | | | | 503,350 | |
Dell International LLC/EMC Corp. | | | | | | | | |
7.125% 6/15/24 (f) | | | 904,000 | | | | 937,561 | |
Diebold Nixdorf, Inc. | | | | | | | | |
9.375% 7/15/25 (f) | | | 675,000 | | | | 756,000 | |
| | | | | | | | 2,196,911 | |
Distribution & Wholesale — 2.0% |
Core & Main Holdings LP | | | | | | | | |
8.625% 9/15/24 (f) | | | 155,000 | | | | 158,488 | |
Core & Main LP | | | | | | | | |
6.125% 8/15/25 (f) | | | 313,000 | | | | 323,564 | |
KAR Auction Services, Inc. | | | | | | | | |
5.125% 6/01/25 (f) | | | 475,000 | | | | 488,789 | |
Resideo Funding, Inc. | | | | | | | | |
6.125% 11/01/26 (f) | | | 666,000 | | | | 700,965 | |
Univar Solutions USA, Inc. | | | | | | | | |
5.125% 12/01/27 (f) | | | 254,000 | | | | 268,287 | |
| | | | | | | | 1,940,093 | |
Diversified Financial Services — 3.5% |
Alliance Data Systems Corp. | | | | | | | | |
4.750% 12/15/24 (f) | | | 767,000 | | | | 774,670 | |
7.000% 1/15/26 (f) | | | 169,000 | | | | 178,768 | |
Global Aircraft Leasing Co. Ltd. | | | | | | | | |
6.500% 9/15/24 (f) | | | 1,395,301 | | | | 1,245,306 | |
LPL Holdings, Inc. | | | | | | | | |
4.625% 11/15/27 (f) | | | 346,000 | | | | 358,110 | |
5.750% 9/15/25 (f) | | | 87,000 | | | | 89,995 | |
OneMain Finance Corp. | | | | | | | | |
4.000% 9/15/30 | | | 169,000 | | | | 175,356 | |
The accompanying notes are an integral part of the financial statements.
81
MML High Yield Fund – Portfolio of Investments (Continued) |
| | | Principal
Amount | | | Value | |
5.375% 11/15/29 | | $ | 552,000 | | | $ | 621,000 | |
| | | | | | | | 3,443,205 | |
Electric — 1.8% |
FirstEnergy Corp. | | | | | | | | |
2.250% 9/01/30 | | | 148,000 | | | | 143,161 | |
4.850% STEP 7/15/47 | | | 352,000 | | | | 438,062 | |
7.375% 11/15/31 | | | 48,000 | | | | 68,446 | |
PG&E Corp. | | | | | | | | |
5.000% 7/01/28 | | | 567,000 | | | | 603,855 | |
Pike Corp. | | | | | | | | |
5.500% 9/01/28 (f) | | | 447,000 | | | | 472,144 | |
| | | | | | | | 1,725,668 | |
Engineering & Construction — 0.4% |
New Enterprise Stone & Lime Co., Inc. | | | | | | | | |
9.750% 7/15/28 (f) | | | 323,000 | | | | 353,685 | |
Entertainment — 2.4% |
Banijay Entertainment SASU | | | | | | | | |
5.375% 3/01/25 (f) | | | 241,000 | | | | 249,795 | |
Caesars Entertainment, Inc. | | | | | | | | |
8.125% 7/01/27 (f) | | | 443,000 | | | | 490,411 | |
Caesars Resort Collection LLC/CRC Finco, Inc. | | | | | | | | |
5.250% 10/15/25 (f) | | | 266,000 | | | | 268,817 | |
CCM Merger, Inc. | | | | | | | | |
6.375% 5/01/26 (f) | | | 193,000 | | | | 202,650 | |
Cinemark USA, Inc. | | | | | | | | |
5.125% 12/15/22 | | | 271,000 | | | | 265,580 | |
Live Nation Entertainment, Inc. | | | | | | | | |
4.750% 10/15/27 (f) | | | 407,000 | | | | 417,142 | |
Scientific Games International, Inc. | | | | | | | | |
7.250% 11/15/29 (f) | | | 187,000 | | | | 205,233 | |
8.250% 3/15/26 (f) | | | 37,000 | | | | 39,871 | |
8.625% 7/01/25 (f) | | | 147,000 | | | | 160,965 | |
| | | | | | | | 2,300,464 | |
Foods — 4.6% |
JBS USA LUX SA/JBS USA Finance, Inc. | | | | | | | | |
6.750% 2/15/28 (f) | | | 824,000 | | | | 925,764 | |
JBS USA LUX SA/JBS USA Food Co./JBS USA Finance, Inc. | | | | | | | | |
5.500% 1/15/30 (f) | | | 826,000 | | | | 948,876 | |
6.500% 4/15/29 (f) | | | 1,094,000 | | | | 1,273,525 | |
Kraft Heinz Foods Co. | | | | | | | | |
3.750% 4/01/30 (f) | | | 126,000 | | | | 134,665 | |
3.875% 5/15/27 (f) | | | 250,000 | | | | 269,340 | |
4.250% 3/01/31 (f) | | | 204,000 | | | | 227,472 | |
5.200% 7/15/45 | | | 178,000 | | | | 211,652 | |
6.500% 2/09/40 | | | 94,000 | | | | 127,061 | |
| | | Principal
Amount | | | Value | |
6.875% 1/26/39 | | $ | 206,000 | | | $ | 285,445 | |
Simmons Foods, Inc. | | | | | | | | |
7.750% 1/15/24 (f) | | | 100,000 | | | | 104,125 | |
| | | | | | | | 4,507,925 | |
Forest Products & Paper — 0.2% |
Clearwater Paper Corp. | | | | | | | | |
4.750% 8/15/28 (f) | | | 230,000 | | | | 238,050 | |
Hand & Machine Tools — 0.7% |
Apex Tool Group LLC/BC Mountain Finance, Inc. | | | | | | | | |
9.000% 2/15/23 (f) | | | 701,000 | | | | 686,980 | |
Health Care – Services — 3.1% |
Centene Corp. | | | | | | | | |
4.625% 12/15/29 | | | 918,000 | | | | 1,019,173 | |
Molina Healthcare, Inc. | | | | | | | | |
3.875% 11/15/30 (f) | | | 164,000 | | | | 175,890 | |
4.375% 6/15/28 (f) | | | 200,000 | | | | 210,500 | |
Radiology Partners, Inc. | | | | | | | | |
9.250% 2/01/28 (f) | | | 300,000 | | | | 336,750 | |
RP Escrow Issuer LLC | | | | | | | | |
5.250% 12/15/25 (f) | | | 191,000 | | | | 199,606 | |
Tenet Healthcare Corp. | | | | | | | | |
4.625% 7/15/24 | | | 400,000 | | | | 410,008 | |
4.625% 9/01/24 (f) | | | 323,000 | | | | 333,498 | |
6.125% 10/01/28 (f) | | | 350,000 | | | | 364,693 | |
| | | | | | | | 3,050,118 | |
Home Builders — 2.7% |
Brookfield Residential Properties, Inc. | | | | | | | | |
6.375% 5/15/25 (f) | | | 491,000 | | | | 505,116 | |
Brookfield Residential Properties, Inc. / Brookfield Residential US Corp. | | | | | | | | |
4.875% 2/15/30 (f) | | | 261,000 | | | | 269,809 | |
Empire Communities Corp. | | | | | | | | |
7.000% 12/15/25 (f) | | | 123,000 | | | | 129,625 | |
M/I Homes, Inc. | | | | | | | | |
4.950% 2/01/28 | | | 368,000 | | | | 389,546 | |
Mattamy Group Corp. | | | | | | | | |
4.625% 3/01/30 (f) | | | 668,000 | | | | 708,080 | |
STL Holding Co. LLC | | | | | | | | |
7.500% 2/15/26 (f) | | | 440,000 | | | | 455,400 | |
TRI Pointe Group, Inc. | | | | | | | | |
5.700% 6/15/28 | | | 153,000 | | | | 172,737 | |
| | | | | | | | 2,630,313 | |
Household Products & Wares — 0.2% |
Kronos Acquisition Holdings, Inc. / KIK Custom Products, Inc. | | | | | | | | |
7.000% 12/31/27 (f) | | | 180,000 | | | | 188,464 | |
The accompanying notes are an integral part of the financial statements.
82
MML High Yield Fund – Portfolio of Investments (Continued) |
| | | Principal
Amount | | | Value | |
Insurance — 1.8% |
Acrisure LLC/Acrisure Finance, Inc. | | | | | | | | |
7.000% 11/15/25 (f) | | $ | 691,000 | | | $ | 719,366 | |
8.125% 2/15/24 (f) | | | 509,000 | | | | 538,886 | |
AssuredPartners, Inc. | | | | | | | | |
5.625% 1/15/29 (f) | | | 183,000 | | | | 191,006 | |
Highlands Holdings Bond Issuer Ltd. / Highlands Holdings Bond Co-Issuer, Inc. | | | | | | | | |
7.625% 10/15/25 (f) | | | 293,000 | | | | 312,777 | |
| | | | | | | | 1,762,035 | |
Internet — 1.4% |
Netflix, Inc. | | | | | | | | |
4.875% 6/15/30 (f) | | | 321,000 | | | | 369,150 | |
5.375% 11/15/29 (f) | | | 523,000 | | | | 616,486 | |
Northwest Fiber LLC / Northwest Fiber Finance Sub, Inc. | | | | | | | | |
10.750% 6/01/28 (f) | | | 169,000 | | | | 192,660 | |
Uber Technologies, Inc. | | | | | | | | |
6.250% 1/15/28 (f) | | | 174,000 | | | | 189,225 | |
| | | | | | | | 1,367,521 | |
Investment Companies — 0.1% |
Icahn Enterprises LP/ Icahn Enterprises Finance Corp. | | | | | | | | |
4.750% 9/15/24 | | | 141,000 | | | | 146,464 | |
Iron & Steel — 0.3% |
Big River Steel LLC / BRS Finance Corp. | | | | | | | | |
6.625% 1/31/29 (f) | | | 254,000 | | | | 274,320 | |
Leisure Time — 1.2% |
Carlson Travel, Inc. | | | | | | | | |
6.750% 12/15/25 (f) | | | 296,000 | | | | 243,830 | |
11.500% 12/15/26 (f) | | | 994,257 | | | | 539,384 | |
NCL Corp. Ltd. | | | | | | | | |
5.875% 3/15/26 (f) | | | 358,000 | | | | 376,552 | |
| | | | | | | | 1,159,766 | |
Lodging — 1.9% |
Wyndham Destinations, Inc. | | | | | | | | |
6.625% 7/31/26 (f) | | | 213,000 | | | | 243,885 | |
Wyndham Hotels & Resorts, Inc. | | | | | | | | |
4.375% 8/15/28 (f) | | | 185,000 | | | | 192,224 | |
Wynn Las Vegas LLC/Wynn Las Vegas Capital Corp. | | | | | | | | |
5.250% 5/15/27 (f) | | | 385,000 | | | | 396,839 | |
5.500% 3/01/25 (f) | | | 740,000 | | | | 772,375 | |
Wynn Macau Ltd. | | | | | | | | |
5.125% 12/15/29 (f) | | | 268,000 | | | | 273,695 | |
| | | | | | | | 1,879,018 | |
| | | Principal
Amount | | | Value | |
Machinery – Diversified — 0.5% |
Clark Equipment Co. | | | | | | | | |
5.875% 6/01/25 (f) | | $ | 321,000 | | | $ | 338,655 | |
Welbilt, Inc. | | | | | | | | |
9.500% 2/15/24 | | | 133,000 | | | | 137,461 | |
| | | | | | | | 476,116 | |
Media — 5.9% |
Altice Financing SA | | | | | | | | |
5.000% 1/15/28 (f) | | | 316,000 | | | | 323,785 | |
Block Communications, Inc. | | | | | | | | |
4.875% 3/01/28 (f) | | | 340,000 | | | | 350,200 | |
CCO Holdings LLC/CCO Holdings Capital Corp. | | | | | | | | |
4.500% 8/15/30 (f) | | | 452,000 | | | | 479,685 | |
4.750% 3/01/30 (f) | | | 236,000 | | | | 254,644 | |
Clear Channel Worldwide Holdings, Inc. | | | | | | | | |
5.125% 8/15/27 (f) | | | 313,000 | | | | 316,130 | |
9.250% 2/15/24 | | | 402,000 | | | | 407,025 | |
CSC Holdings LLC | | | | | | | | |
3.375% 2/15/31 (f) | | | 500,000 | | | | 490,625 | |
DISH DBS Corp. | | | | | | | | |
7.750% 7/01/26 | | | 217,000 | | | | 243,042 | |
DISH Network Corp. | | | | | | | | |
3.375% 8/15/26 | | | 680,000 | | | | 648,198 | |
iHeartCommunications, Inc. | | | | | | | | |
8.375% 5/01/27 | | | 482,000 | | | | 514,516 | |
LCPR Senior Secured Financing DAC | | | | | | | | |
6.750% 10/15/27 (f) | | | 314,000 | | | | 337,942 | |
Midcontinent Communications / Midcontinent Finance Corp. | | | | | | | | |
5.375% 8/15/27 (f) | | | 205,000 | | | | 214,225 | |
Nexstar Broadcasting, Inc. | | | | | | | | |
4.750% 11/01/28 (f) | | | 118,000 | | | | 123,458 | |
Townsquare Media, Inc. | | | | | | | | |
6.500% 4/01/23 (f) | | | 124,000 | | | | 126,182 | |
Virgin Media Finance PLC | | | | | | | | |
5.000% 7/15/30 (f) | | | 147,000 | | | | 152,512 | |
Virgin Media Secured Finance PLC | | | | | | | | |
4.500% 8/15/30 (f) | | | 280,000 | | | | 292,600 | |
Ziggo BV | | | | | | | | |
5.500% 1/15/27 (f) | | | 440,000 | | | | 459,250 | |
| | | | | | | | 5,734,019 | |
Mining — 4.4% |
Compass Minerals International, Inc. | | | | | | | | |
4.875% 7/15/24 (f) | | | 294,000 | | | | 305,025 | |
6.750% 12/01/27 (f) | | | 192,000 | | | | 207,840 | |
The accompanying notes are an integral part of the financial statements.
83
MML High Yield Fund – Portfolio of Investments (Continued) |
| | | Principal
Amount | | | Value | |
First Quantum Minerals Ltd. | | | | | | | | |
6.875% 10/15/27 (f) | | $ | 600,000 | | | $ | 651,000 | |
7.250% 4/01/23 (f) | | | 659,000 | | | | 679,215 | |
7.500% 4/01/25 (f) | | | 647,000 | | | | 673,689 | |
Freeport-McMoRan, Inc. | | | | | | | | |
4.125% 3/01/28 | | | 69,000 | | | | 72,364 | |
4.375% 8/01/28 | | | 359,000 | | | | 381,437 | |
4.625% 8/01/30 | | | 200,000 | | | | 219,500 | |
Hecla Mining Co. | | | | | | | | |
7.250% 2/15/28 | | | 226,000 | | | | 246,905 | |
Hudbay Minerals, Inc. | | | | | | | | |
6.125% 4/01/29 (f) | | | 147,000 | | | | 158,392 | |
Kinross Gold Corp. | | | | | | | | |
6.875% 9/01/41 | | | 476,000 | | | | 654,629 | |
Northwest Acquisitions ULC/Dominion Finco, Inc. | | | | | | | | |
7.125% 11/01/22 (e) (f) | | | 884,000 | | | | 5,967 | |
| | | | | | | | 4,255,963 | |
Miscellaneous - Manufacturing — 0.8% |
Gates Global LLC / Gates Corp. | | | | | | | | |
6.250% 1/15/26 (f) | | | 700,000 | | | | 735,000 | |
Oil & Gas — 8.3% |
Antero Resources Corp. | | | | | | | | |
8.375% 7/15/26 (f) (g) | | | 156,000 | | | | 159,228 | |
Apache Corp. | | | | | | | | |
4.750% 4/15/43 | | | 65,000 | | | | 67,396 | |
5.100% 9/01/40 | | | 130,000 | | | | 138,612 | |
5.350% 7/01/49 | | | 197,000 | | | | 202,128 | |
Continental Resources, Inc. | | | | | | | | |
4.375% 1/15/28 | | | 168,000 | | | | 172,234 | |
5.750% 1/15/31 (f) | | | 178,000 | | | | 197,576 | |
CVR Energy, Inc. | | | | | | | | |
5.750% 2/15/28 (f) | | | 1,323,000 | | | | 1,253,542 | |
Hilcorp Energy I LP / Hilcorp Finance Co. | | | | | | | | |
5.000% 12/01/24 (f) | | | 79,000 | | | | 78,638 | |
5.750% 10/01/25 (f) | | | 43,000 | | | | 43,484 | |
6.250% 11/01/28 (f) | | | 365,000 | | | | 372,756 | |
MEG Energy Corp. | | | | | | | | |
7.125% 2/01/27 (f) | | | 379,000 | | | | 391,317 | |
Nabors Industries Ltd. | | | | | | | | |
7.250% 1/15/26 (f) | | | 184,000 | | | | 129,015 | |
7.500% 1/15/28 (f) | | | 119,000 | | | | 81,479 | |
Neptune Energy Bondco PLC | | | | | | | | |
6.625% 5/15/25 (f) | | | 594,000 | | | | 587,626 | |
Occidental Petroleum Corp. | | | | | | | | |
2.700% 2/15/23 | | | 32,000 | | | | 31,970 | |
2.900% 8/15/24 | | | 93,000 | | | | 89,513 | |
3.500% 6/15/25 | | | 190,000 | | | | 183,532 | |
| | | Principal
Amount | | | Value | |
4.200% 3/15/48 | | $ | 31,000 | | | $ | 25,265 | |
4.400% 4/15/46 | | | 198,000 | | | | 172,550 | |
4.400% 8/15/49 | | | 78,000 | | | | 65,738 | |
4.500% 7/15/44 | | | 81,000 | | | | 68,648 | |
5.875% 9/01/25 | | | 178,000 | | | | 189,570 | |
6.125% 1/01/31 | | | 210,000 | | | | 224,742 | |
6.200% 3/15/40 | | | 550,000 | | | | 544,500 | |
6.375% 9/01/28 | | | 182,000 | | | | 192,010 | |
6.450% 9/15/36 | | | 215,000 | | | | 225,105 | |
6.600% 3/15/46 | | | 352,000 | | | | 357,166 | |
6.950% 7/01/24 | | | 88,000 | | | | 95,040 | |
Ovintiv Exploration, Inc. | | | | | | | | |
5.375% 1/01/26 | | | 88,000 | | | | 94,437 | |
5.625% 7/01/24 | | | 56,000 | | | | 59,984 | |
Ovintiv, Inc. | | | | | | | | |
6.500% 8/15/34 | | | 108,000 | | | | 125,068 | |
6.500% 2/01/38 | | | 47,000 | | | | 52,483 | |
7.200% 11/01/31 | | | 29,000 | | | | 34,322 | |
7.375% 11/01/31 | | | 89,000 | | | | 105,674 | |
8.125% 9/15/30 | | | 84,000 | | | | 102,576 | |
Parkland Corp. | | | | | | | | |
5.875% 7/15/27 (f) | | | 247,000 | | | | 267,064 | |
PBF Holding Co. LLC / PBF Finance Corp. | | | | | | | | |
6.000% 2/15/28 | | | 1,474,000 | | | | 842,022 | |
9.250% 5/15/25 (f) | | | 82,000 | | | | 80,844 | |
| | | | | | | | 8,104,854 | |
Oil & Gas Services — 0.7% |
Welltec A/S | | | | | | | | |
9.500% 12/01/22 (f) | | | 683,000 | | | | 635,190 | |
Packaging & Containers — 1.2% |
Mauser Packaging Solutions Holding Co. | | | | | | | | |
7.250% 4/15/25 (f) | | | 781,000 | | | | 788,810 | |
Trident TPI Holdings, Inc. | | | | | | | | |
9.250% 8/01/24 (f) | | | 386,000 | | | | 411,090 | |
| | | | | | | | 1,199,900 | |
Pharmaceuticals — 2.0% |
Bausch Health Americas, Inc. | | | | | | | | |
8.500% 1/31/27 (f) | | | 250,000 | | | | 278,042 | |
Bausch Health Cos., Inc. | | | | | | | | |
5.000% 1/30/28 (f) | | | 446,000 | | | | 459,621 | |
5.250% 1/30/30 (f) | | | 320,000 | | | | 336,000 | |
6.125% 4/15/25 (f) | | | 75,000 | | | | 77,300 | |
Endo DAC / Endo Finance LLC / Endo Finco, Inc. | | | | | | | | |
6.000% 6/30/28 (f) | | | 115,000 | | | | 97,750 | |
The accompanying notes are an integral part of the financial statements.
84
MML High Yield Fund – Portfolio of Investments (Continued) |
| | | Principal
Amount | | | Value | |
Par Pharmaceutical, Inc. | | | | | | | | |
7.500% 4/01/27 (f) | | $ | 629,000 | | | $ | 682,465 | |
| | | | | | | | 1,931,178 | |
Pipelines — 4.0% |
Blue Racer Midstream LLC / Blue Racer Finance Corp. | | | | | | | | |
7.625% 12/15/25 (f) | | | 127,000 | | | | 135,255 | |
Buckeye Partners LP | | | | | | | | |
5.850% 11/15/43 | | | 66,000 | | | | 64,940 | |
Cheniere Energy Partners LP | | | | | | | | |
5.625% 10/01/26 | | | 325,000 | | | | 338,000 | |
DCP Midstream Operating LP | | | | | | | | |
5.625% 7/15/27 | | | 216,000 | | | | 239,760 | |
6.450% 11/03/36 (f) | | | 10,000 | | | | 10,800 | |
EnLink Midstream LLC | | | | | | | | |
5.375% 6/01/29 | | | 173,000 | | | | 168,243 | |
EnLink Midstream Partners LP | | | | | | | | |
4.850% 7/15/26 | | | 56,000 | | | | 54,675 | |
5.600% 4/01/44 | | | 257,000 | | | | 206,243 | |
EQM Midstream Partners LP | | | | | | | | |
6.000% 7/01/25 (f) | | | 182,000 | | | | 199,290 | |
6.500% 7/01/27 (f) | | | 151,000 | | | | 170,031 | |
Genesis Energy LP/Genesis Energy Finance Corp. | | | | | | | | |
6.500% 10/01/25 | | | 440,000 | | | | 427,900 | |
Harvest Midstream I LP | | | | | | | | |
7.500% 9/01/28 (f) | | | 228,000 | | | | 242,535 | |
PBF Logistics LP / PBF Logistics Finance Corp. | | | | | | | | |
6.875% 5/15/23 | | | 400,000 | | | | 383,000 | |
Targa Resources Partners LP/Targa Resources Partners Finance Corp. | | | | | | | | |
4.875% 2/01/31 (f) | | | 295,000 | | | | 321,429 | |
5.000% 1/15/28 | | | 33,000 | | | | 34,833 | |
5.500% 3/01/30 | | | 28,000 | | | | 30,400 | |
6.875% 1/15/29 | | | 61,000 | | | | 68,701 | |
Western Midstream Operating LP | | | | | | | | |
5.050% STEP 2/01/30 | | | 145,000 | | | | 162,372 | |
5.300% 3/01/48 | | | 399,000 | | | | 395,393 | |
5.450% 4/01/44 | | | 202,000 | | | | 204,277 | |
| | | | | | | | 3,858,077 | |
Real Estate Investment Trusts (REITS) — 3.2% |
ESH Hospitality, Inc. | | | | | | | | |
4.625% 10/01/27 (f) | | | 388,000 | | | | 397,700 | |
Iron Mountain, Inc. | | | | | | | | |
5.250% 7/15/30 (f) | | | 303,000 | | | | 327,240 | |
| | | Principal
Amount | | | Value | |
Park Intermediate Holdings LLC / PK Domestic Property LLC / PK Finance Co-Issuer | | | | | | | | |
5.875% 10/01/28 (f) | | $ | 108,000 | | | $ | 115,020 | |
RHP Hotel Properties LP/RHP Finance Corp. | | | | | | | | |
4.750% 10/15/27 | | | 425,000 | | | | 439,875 | |
5.000% 4/15/23 | | | 789,000 | | | | 790,973 | |
Service Properties Trust | | | | | | | | |
3.950% 1/15/28 | | | 73,000 | | | | 70,536 | |
4.375% 2/15/30 | | | 115,000 | | | | 112,125 | |
4.950% 2/15/27 | | | 58,000 | | | | 58,290 | |
7.500% 9/15/25 | | | 467,000 | | | | 538,133 | |
Uniti Group LP / Uniti Fiber Holdings, Inc. / CSL Capital LLC | | | | | | | | |
7.125% 12/15/24 (f) | | | 45,000 | | | | 45,450 | |
7.875% 2/15/25 (f) | | | 25,000 | | | | 26,855 | |
Uniti Group LP / Uniti Group Finance, Inc. / CSL Capital LLC | | | | | | | | |
8.250% 10/15/23 | | | 169,000 | | | | 170,268 | |
| | | | | | | | 3,092,465 | |
Retail — 0.9% |
LBM Acquisition LLC | | | | | | | | |
6.250% 1/15/29 (f) | | | 143,000 | | | | 147,648 | |
Penske Automotive Group, Inc. | | | | | | | | |
3.500% 9/01/25 | | | 500,000 | | | | 508,125 | |
Staples, Inc. | | | | | | | | |
7.500% 4/15/26 (f) | | | 253,000 | | | | 264,200 | |
| | | | | | | | 919,973 | |
Software — 3.4% |
Avaya Holdings Corp., Convertible, | | | | | | | | |
2.250% 6/15/23 | | | 335,000 | | | | 348,957 | |
BY Crown Parent LLC | | | | | | | | |
7.375% 10/15/24 (f) | | | 191,000 | | | | 194,343 | |
Solera LLC/ Solera Finance, Inc. | | | | | | | | |
10.500% 3/01/24 (f) | | | 465,000 | | | | 481,856 | |
Veritas US, Inc./Veritas Bermuda Ltd. | | | | | | | | |
10.500% 2/01/24 (f) | | | 2,296,000 | | | | 2,330,440 | |
| | | | | | | | 3,355,596 | |
Storage & Warehousing — 1.1% |
LBC Tank Terminals Holding Netherlands BV | | | | | | | | |
6.875% 5/15/23 (f) | | | 1,111,000 | | | | 1,111,000 | |
Telecommunications — 4.0% |
Avaya, Inc. | | | | | | | | |
6.125% 9/15/28 (f) | | | 107,000 | | | | 114,304 | |
CenturyLink, Inc. | | | | | | | | |
5.125% 12/15/26 (f) | | | 526,000 | | | | 555,435 | |
The accompanying notes are an integral part of the financial statements.
85
MML High Yield Fund – Portfolio of Investments (Continued) |
| | | Principal
Amount | | | Value | |
CommScope Technologies Finance LLC | | | | | | | | |
6.000% 6/15/25 (f) | | $ | 196,000 | | | $ | 200,410 | |
CommScope Technologies LLC | | | | | | | | |
5.000% 3/15/27 (f) | | | 174,000 | | | | 171,390 | |
CommScope, Inc. | | | | | | | | |
7.125% 7/01/28 (f) | | | 200,000 | | | | 213,000 | |
Consolidated Communications, Inc. | | | | | | | | |
6.500% 10/01/28 (f) | | | 391,000 | | | | 418,370 | |
Hughes Satellite Systems Corp. | | | | | | | | |
6.625% 8/01/26 | | | 687,000 | | | | 777,320 | |
Sprint Capital Corp. | | | | | | | | |
8.750% 3/15/32 | | | 126,000 | | | | 199,505 | |
Sprint Corp. | | | | | | | | |
7.625% 3/01/26 | | | 386,000 | | | | 479,101 | |
Telecom Italia Capital | | | | | | | | |
6.000% 9/30/34 | | | 150,000 | | | | 182,714 | |
ViaSat, Inc. | | | | | | | | |
6.500% 7/15/28 (f) | | | 387,000 | | | | 418,815 | |
Windstream Escrow LLC / Windstream Escrow Finance Corp. | | | | | | | | |
7.750% 8/15/28 (f) | | | 206,000 | | | | 207,442 | |
| | | | | | | | 3,937,806 | |
Toys, Games & Hobbies — 0.6% |
Mattel, Inc. | | | | | | | | |
6.750% 12/31/25 (f) | | | 305,000 | | | | 321,918 | |
5.875% 12/15/27 (f) | | | 224,000 | | | | 248,920 | |
| | | | | | | | 570,838 | |
Transportation — 2.1% |
Kenan Advantage Group, Inc. | | | | | | | | |
7.875% 7/31/23 (f) | | | 1,700,000 | | | | 1,700,000 | |
XPO Logistics, Inc. | | | | | | | | |
6.250% 5/01/25 (f) | | | 350,000 | | | | 376,649 | |
| | | | | | | | 2,076,649 | |
| | | | | | | | | |
TOTAL CORPORATE DEBT (Cost $84,855,673) | | | | | | | 87,835,957 | |
| | | | | | | | | |
TOTAL BONDS & NOTES (Cost $91,923,332) | | | | | | | 94,698,806 | |
| | | | | | | | | |
TOTAL LONG-TERM INVESTMENTS (Cost $93,241,748) | | | | | | | 95,311,945 | |
| | | Principal
Amount | | | Value | |
SHORT-TERM INVESTMENTS — 1.9% |
Repurchase Agreement — 1.9% |
Fixed Income Clearing Corp., Repurchase Agreement, dated 12/31/20, 0.000%, due 1/04/21 (h) | | $ | 1,812,986 | | | $ | 1,812,986 | |
| | | | | | | | | |
TOTAL SHORT-TERM INVESTMENTS (Cost $1,812,986) | | | | | | | 1,812,986 | |
| | | | | | | | | |
TOTAL INVESTMENTS — 99.6% (Cost $95,054,734) (i) | | | | | | | 97,124,931 | |
| | | | | | | | | |
Other Assets/(Liabilities) — 0.4% | | | | | | | 406,785 | |
| | | | | | | | | |
NET ASSETS — 100.0% | | | | | | $ | 97,531,716 | |
Abbreviation Legend
Notes to Portfolio of Investments
Percentages are stated as a percent of net assets.
(a) | Non-income producing security. |
(b) | This security is fair valued in good faith in accordance with procedures approved by the Board of Trustees. At December 31, 2020, these securities amounted to a value of $613,139 or 0.63% of net assets. |
(c) | Investment was valued using significant unobservable inputs. |
(d) | All or a portion of the security represents unsettled loan commitments at December 31, 2020 where the rate will be determined at time of settlement. |
(e) | Security is currently in default due to bankruptcy or failure to make payment of principal or interest of the issuer. Income is not being accrued. At December 31, 2020, these securities amounted to a value of $6,056 or 0.01% of net assets. |
(f) | Security is exempt from registration under Regulation S or Rule 144A of the Securities Act of 1933. These securities are considered restricted and may be resold in transactions exempt from registration. At December 31, 2020, the aggregate market value of these securities amounted to $60,536,809 or 62.07% of net assets. |
(g) | A portion of this security is purchased on a when-issued, delayed-delivery or forward commitment basis. (Note 2). |
(h) | Maturity value of $1,812,986. Collateralized by U.S. Government Agency obligations with a rate of 0.000%, maturity date of 12/30/21, and an aggregate market value, including accrued interest, of $1,849,247. |
(i) | See Note 6 for aggregate cost for federal tax purposes. |
The accompanying notes are an integral part of the financial statements.
86
MML High Yield Fund – Portfolio of Investments (Continued) |
Notes to Portfolio of Investments (Continued)
Country weightings, as a percentage of net assets, is as follows:
United States | | | 81.8 | % |
Canada | | | 6.8 | % |
Netherlands | | | 1.8 | % |
Luxembourg | | | 1.7 | % |
Cayman Islands | | | 1.6 | % |
United Kingdom | | | 1.2 | % |
Ireland | | | 0.9 | % |
Bermuda | | | 0.9 | % |
Denmark | | | 0.7 | % |
France | | | 0.3 | % |
Total Long-Term Investments | | | 97.7 | % |
Short-Term Investments and Other Assets and Liabilities | | | 2.3 | % |
Net Assets | | | 100.0 | % |
The accompanying notes are an integral part of the financial statements.
87
MML Inflation-Protected and Income Fund – Portfolio of Investments |
December 31, 2020 |
| | | Principal
Amount | | | Value | |
BONDS & NOTES — 77.9% |
MUNICIPAL OBLIGATIONS — 0.0% |
Louisiana State Public Facilities Authority, Revenue Bonds, Series 2011-A, Class A2, 3 mo. USD LIBOR | | | | | | | | |
1.111% FRN 4/26/27 | | $ | 17,519 | | | $ | 17,537 | |
| | | | | | | | | |
TOTAL MUNICIPAL OBLIGATIONS (Cost $17,519) | | | | | | | 17,537 | |
| | | | | | | | | |
NON-U.S. GOVERNMENT AGENCY OBLIGATIONS — 55.9% |
Auto Floor Plan Asset-Backed Securities — 3.0% |
Navistar Financial Dealer Note Master Owner Trust II | | | | | | | | |
Series 2019-1, Class A, 1 mo. USD LIBOR + .640% 0.788% FRN 5/25/24 (a) | | | 5,700,000 | | | | 5,707,726 | |
Series 2019-1, Class B, 1 mo. USD LIBOR + .750% 0.898% FRN 5/25/24 (a) | | | 3,000,000 | | | | 2,995,833 | |
Series 2019-1, Class C, 1 mo. USD LIBOR + .950% 1.098% FRN 5/25/24 (a) | | | 1,300,000 | | | | 1,295,949 | |
| | | | | | | | 9,999,508 | |
Automobile Asset-Backed Securities — 8.4% |
American Credit Acceptance Receivables Trust | | | | | | | | |
Series 2019-1, Class C, 3.500% 4/14/25 (a) | | | 1,300,000 | | | | 1,320,872 | |
Series 2018-3, Class C, 3.750% 10/15/24 (a) | | | 1,608,456 | | | | 1,615,963 | |
AmeriCredit Automobile Receivables Trust, Series 2020-2, Class A2A | | | | | | | | |
0.600% 12/18/23 | | | 3,220,444 | | | | 3,226,322 | |
Avis Budget Rental Car Funding AESOP LLC, Series 2019-1A, Class C | | | | | | | | |
4.530% 3/20/23 (a) | | | 388,000 | | | | 391,904 | |
CarMax Auto Owner Trust, Series 2017-2, Class D | | | | | | | | |
3.390% 10/16/23 | | | 2,400,000 | | | | 2,428,654 | |
Chesapeake Funding II LLC, Series 2018-1A, Class A2, 1 mo. USD LIBOR + .450% | | | | | | | | |
0.609% FRN 4/15/30 (a) | | | 368,033 | | | | 368,319 | |
Drive Auto Receivables Trust, Series 2019-1, Class C | | | | | | | | |
3.780% 4/15/25 | | | 963,000 | | | | 981,769 | |
| | | Principal
Amount | | | Value | |
Exeter Automobile Receivables Trust | | | | | | | | |
Series 2020-2A, Class A, 1.130% 8/15/23 (a) | | $ | 462,565 | | | $ | 463,846 | |
Series 2019-1A, Class B, 3.450% 2/15/23 (a) | | | 61,223 | | | | 61,260 | |
Flagship Credit Auto Trust | | | | | | | | |
Series 2016-4, Class C, 2.710% 11/15/22 (a) | | | 109,458 | | | | 109,640 | |
Series 2018-2, Class A, 2.970% 10/17/22 (a) | | | 84,662 | | | | 84,721 | |
Hertz Fleet Lease Funding LP, Series 2018-1, Class A1, 1 mo. USD LIBOR + .500% | | | | | | | | |
0.649% FRN 5/10/32 (a) | | | 967,702 | | | | 967,598 | |
Hertz Vehicle Financing II LP | | | | | | | | |
Series 2017-1A, Class B, 3.560% 10/25/21 (a) | | | 2,530,000 | | | | 2,525,113 | |
Series 2019-2A, Class C, 4.260% 5/25/25 (a) | | | 2,525,000 | | | | 2,504,767 | |
OneMain Direct Auto Receivables Trust, Series 2018-1A, Class A | | | | | | | | |
3.430% 12/16/24 (a) | | | 357,016 | | | | 360,574 | |
OSCAR US Funding XI LLC, Series 2019-2A, Class A2 | | | | | | | | |
2.490% 8/10/22 (a) | | | 779,040 | | | | 783,000 | |
Santander Drive Auto Receivables Trust, Series 2020-2, Class A2A | | | | | | | | |
0.620% 5/15/23 | | | 3,486,625 | | | | 3,489,638 | |
Tesla Auto Lease Trust, Series 2018-B, Class A | | | | | | | | |
3.710% 8/20/21 (a) | | | 3,277,514 | | | | 3,297,566 | |
World Omni Auto Receivables Trust, Series 2019-C, Class A2B, 1 mo. USD LIBOR + .230% | | | | | | | | |
0.389% FRN 2/15/23 | | | 3,009,387 | | | | 3,010,613 | |
| | | | | | | | 27,992,139 | |
Commercial Mortgage-Backed Securities — 3.7% |
BHMS Mortgage Trust, Series 2018-ATLS, Class B, 1 mo. USD LIBOR + 1.500% | | | | | | | | |
1.659% FRN 7/15/35 (a) | | | 1,700,000 | | | | 1,632,042 | |
BX Commercial Mortgage Trust | | | | | | | | |
Series 2020-BXLP, Class E, 1 mo. USD LIBOR + 1.600% 1.759% FRN 12/15/36 (a) | | | 1,298,811 | | | | 1,276,490 | |
Series 2018-IND, Class E, 1 mo. USD LIBOR + 1.700% 1.859% FRN 11/15/35 (a) | | | 1,582,000 | | | | 1,577,597 | |
Series 2019-XL, Class F, 1 mo. USD LIBOR + 2.000% 2.159% FRN 10/15/36 (a) | | | 1,661,271 | | | | 1,639,002 | |
The accompanying notes are an integral part of the financial statements.
88
MML Inflation-Protected and Income Fund – Portfolio of Investments (Continued) |
| | | Principal
Amount | | | Value | |
CAMB Commercial Mortgage Trust, Series 2019-LIFE, Class D, 1 mo. USD LIBOR + 1.750% | | | | | | | | |
1.909% FRN 12/15/37 (a) | | $ | 308,865 | | | $ | 308,890 | |
Credit Suisse Mortgage Capital Certificates, Series 2019-ICE4, Class D, 1 mo. USD LIBOR + 1.600% | | | | | | | | |
1.759% FRN 5/15/36 (a) | | | 4,000,000 | | | | 3,960,039 | |
DBJPM 17-C6 Mortgage Trust, Series 2017-C6, Class A1 | | | | | | | | |
1.907% 6/10/50 | | | 448,996 | | | | 451,850 | |
JP Morgan Chase Commercial Mortgage Securities Corp., Series 2018-LAQ, Class A, 1 mo. USD LIBOR + 1.000% | | | | | | | | |
1.159% FRN 6/15/32 (a) | | | 1,097,564 | | | | 1,083,896 | |
KNDL Mortgage Trust, Series 2019-KNSQ, Class E, 1 mo. USD LIBOR + 1.800% | | | | | | | | |
1.959% FRN 5/15/36 (a) | | | 476,000 | | | | 473,666 | |
| | | | | | | | 12,403,472 | |
Home Equity Asset-Backed Securities — 1.2% |
Asset Backed Securities Corp. Home Equity Loan Trust, Series 2006-HE3, Class A4, 1 mo. USD LIBOR + .170% | | | | | | | | |
0.318% FRN 3/25/36 | | | 115,180 | | | | 114,690 | |
Centex Home Equity Loan Trust 2005-D, Series 2005-D, Class M3, 1 mo. USD LIBOR + .720% | | | | | | | | |
0.868% FRN 10/25/35 | | | 2,478,400 | | | | 2,467,128 | |
RASC Trust, Series 2005-EMX1, Class M1, 1 mo. USD LIBOR + .645% | | | | | | | | |
0.793% FRN 3/25/35 | | | 1,419,247 | | | | 1,405,729 | |
| | | | | | | | 3,987,547 | |
Other Asset-Backed Securities — 19.5% |
321 Henderson Receivables I LLC Series 2006-1A, Class A1, 1 mo. USD LIBOR + .200% | | | | | | | | |
0.359% FRN 3/15/41 (a) | | | 199,933 | | | | 197,326 | |
Series 2006-2A, Class A1, 1 mo. USD LIBOR + .200% | | | | | | | | |
0.359% FRN 6/15/41 (a) | | | 892,767 | | | | 864,644 | |
321 Henderson Receivables LLC | | | | | | | | |
Series 2006-3A, Class A1, 1 mo. USD LIBOR + .200% 0.359% FRN 9/15/41 (a) | | | 101,202 | | | | 99,177 | |
Series 2006-4A, Class A1, 1 mo. USD LIBOR + .200% 0.359% FRN 12/15/41 (a) | | | 112,554 | | | | 111,590 | |
| | | Principal
Amount | | | Value | |
Series 2007-1A, Class A1, 1 mo. USD LIBOR + .200% 0.359% FRN 3/15/42 (a) | | $ | 520,439 | | | $ | 502,767 | |
AASET Trust | | | | | | | | |
Series 2017-1A, Class A, 3.967% 5/16/42 (a) | | | 159,224 | | | | 147,665 | |
Series 2018-2A, Class A, 4.454% 11/18/38 (a) | | | 1,581,830 | | | | 1,494,386 | |
Affirm Asset Securitization Trust | | | | | | | | |
Series 2020-Z2, Class A, 1.900% 1/15/25 (a) | | | 3,455,703 | | | | 3,453,439 | |
Series 2020-Z1, Class A, 3.460% 10/15/24 (a) | | | 2,360,770 | | | | 2,356,857 | |
AIMCO CLO, Series 2015-AA, Class AR, 3 mo. USD LIBOR + .850% | | | | | | | | |
1.087% FRN 1/15/28 (a) | | | 2,273,533 | | | | 2,268,756 | |
Arbor Realty Commercial Real Estate Notes, Series 2018-FL1, Class A, 1 mo. USD LIBOR + 1.150% | | | | | | | | |
1.309% FRN 6/15/28 (a) | | | 780,000 | | | | 771,751 | |
Avant Loans Funding Trust, Series 2019-B, Class A | | | | | | | | |
2.720% 10/15/26 (a) | | | 505,079 | | | | 506,596 | |
Avery Point IV CLO Ltd., Series 2014-1A, Class AR, 3 mo. USD LIBOR + 1.100% | | | | | | | | |
1.315% FRN 4/25/26 (a) | | | 252,689 | | | | 252,723 | |
BCC Funding XIV LLC, Series 2018-1A, Class A2 | | | | | | | | |
2.960% 6/20/23 (a) | | | 27,190 | | | | 27,197 | |
Carlyle Global Market Strategies CLO Ltd., Series 2013-2A, Class AR, 3 mo. USD LIBOR + .890% | | | | | | | | |
1.108% FRN 1/18/29 (a) | | | 1,997,380 | | | | 1,985,967 | |
CCG Receivables Trust, Series 2018-2, Class A2 | | | | | | | | |
3.090% 12/15/25 (a) | | | 260,318 | | | | 262,791 | |
Elara HGV Timeshare Issuer LLC, Series 2014-A, Class B, | | | | | | | | |
3.020% VRN 2/25/27 (a) (b) | | | 89,164 | | | | 89,069 | |
FCI Funding LLC, Series 2019-1A, Class A | | | | | | | | |
3.630% 2/18/31 (a) | | | 148,174 | | | | 150,474 | |
First Franklin Mortgage Loan Trust, Series 2005-FF9, Class A4, 1 mo. USD LIBOR + .720% | | | | | | | | |
0.868% FRN 10/25/35 | | | 1,079,267 | | | | 1,073,118 | |
KREF Ltd. | | | | | | | | |
Series 2018-FL1, Class A, 1 mo. USD LIBOR + 1.100% 1.253% FRN 6/15/36 (a) | | | 3,980,000 | | | | 3,973,255 | |
The accompanying notes are an integral part of the financial statements.
89
MML Inflation-Protected and Income Fund – Portfolio of Investments (Continued) |
| | | Principal
Amount | | | Value | |
Series 2018-FL1, Class AS, 1 mo. USD LIBOR + 1.350% 1.503% FRN 6/15/36 (a) | | $ | 2,000,000 | | | $ | 1,995,086 | |
Series 2018-FL1, Class D, 1 mo. USD LIBOR + 2.550% 2.703% FRN 6/15/36 (a) | | | 2,450,000 | | | | 2,390,241 | |
LCM Ltd., Series 19A, Class AR, 3 mo. USD LIBOR + 1.240% | | | | | | | | |
1.477% FRN 7/15/27 (a) | | | 1,228,375 | | | | 1,228,448 | |
Lendmark Funding Trust, Series 2018-1A, Class A | | | | | | | | |
3.810% 12/21/26 (a) | | | 630,000 | | | | 637,755 | |
Marlette Funding Trust | | | | | | | | |
Series 2019-4A, Class A, 2.390% 12/17/29 (a) | | | 2,911,873 | | | | 2,934,770 | |
Series 2019-3A, Class A, 2.690% 9/17/29 (a) | | | 1,680,673 | | | | 1,692,544 | |
Series 2019-2A, Class A, 3.130% 7/16/29 (a) | | | 2,528,095 | | | | 2,549,632 | |
Series 2019-1A, Class A, 3.440% 4/16/29 (a) | | | 3,501,589 | | | | 3,526,915 | |
Series 2019-2A, Class B, 3.530% 7/16/29 (a) | | | 385,000 | | | | 393,638 | |
Series 2018-1A, Class C, 3.690% 3/15/28 (a) | | | 1,259,322 | | | | 1,262,084 | |
Series 2018-3A, Class B, 3.860% 9/15/28 (a) | | | 1,505,315 | | | | 1,510,261 | |
MVW Owner Trust, Series 2017-1A, Class A | | | | | | | | |
2.420% 12/20/34 (a) | | | 66,234 | | | | 67,471 | |
Neuberger Berman CLO XX Ltd., Series 2015-20A, Class AR, 3 mo. USD LIBOR + .800% | | | | | | | | |
1.037% FRN 1/15/28 (a) | | | 2,185,361 | | | | 2,179,321 | |
NP SPE II LLC, Series 2019-1A, Class A1 | | | | | | | | |
2.574% 9/20/49 (a) | | | 329,358 | | | | 329,445 | |
NRZ Advance Receivables Trust 2015-ON1, Series 2020-T3, Class CT3 | | | | | | | | |
1.814% 10/15/52 (a) | | | 894,000 | | | | 893,999 | |
OCP CLO Ltd., Series 2015-10A, Class A1R, 3 mo. USD LIBOR + .820% | | | | | | | | |
1.035% FRN 10/26/27 (a) | | | 1,431,406 | | | | 1,428,221 | |
Orange Lake Timeshare Trust, Series 2016-A, Class A | | | | | | | | |
2.610% 3/08/29 (a) | | | 157,611 | | | | 158,636 | |
PFS Financing Corp. | | | | | | | | |
Series 2019-B, Class A, 1 mo. USD LIBOR + .550% 0.709% FRN 9/15/23 (a) | | | 400,000 | | | | 400,356 | |
| | | Principal
Amount | | | Value | |
Series 2019-B, Class B, 1 mo. USD LIBOR + .800% 0.959% FRN 9/15/23 (a) | | $ | 900,000 | | | $ | 897,490 | |
Planet Fitness Master Issuer LLC, Series 2018-1A, Class A2I | | | | | | | | |
4.262% 9/05/48 (a) | | | 2,346,000 | | | | 2,356,321 | |
PNMAC GMSR Issuer Trust, Series 2018-GT1, Class A, 1 mo. USD LIBOR + 2.850% | | | | | | | | |
2.998% FRN 2/25/23 (a) | | | 440,000 | | | | 432,562 | |
Saxon Asset Securities Trust, Series 2006-2, Class A3C, 1 mo. USD LIBOR + .150% | | | | | | | | |
0.298% FRN 9/25/36 | | | 875,716 | | | | 873,878 | |
SCF Equipment Leasing LLC, Series 2020-1A, Class A2 | | | | | | | | |
0.680% 10/20/25 (a) | | | 1,579,000 | | | | 1,582,286 | |
Sierra Receivables Funding LLC | | | | | | | | |
Series 2019-3A, Class C, 3.000% 8/20/36 (a) | | | 2,032,376 | | | | 2,040,531 | |
Series 2019-1A, Class C, 3.770% 1/20/36 (a) | | | 441,916 | | | | 443,588 | |
Series 2019-3A, Class D, 4.180% 8/20/36 (a) | | | 520,403 | | | | 521,732 | |
Series 2019-1A, Class D, 4.750% 1/20/36 (a) | | | 399,829 | | | | 402,543 | |
SoFi Consumer Loan Program Trust | | | | | | | | |
Series 2017-4, Class A, 2.500% 5/26/26 (a) | | | 125,253 | | | | 125,745 | |
Series 2017-6, Class A2, 2.820% 11/25/26 (a) | | | 149,118 | | | | 149,731 | |
Series 2016-1A, Class A, 3.260% 8/25/25 (a) | | | 195,336 | | | | 196,535 | |
SoFi Consumer Loan Program LLC, Series 2016-2A, Class B, | | | | | | | | |
4.770% VRN 10/27/25 (a) (b) | | | 1,458,623 | | | | 1,466,168 | |
Structured Asset Investment Loan Trust, Series 2005-2, Class M2, 1 mo. USD LIBOR + .735% | | | | | | | | |
0.883% FRN 3/25/35 | | | 1,844,819 | | | | 1,829,897 | |
Structured Asset Securities Corp. Mortgage Loan Trust, Series 2006-GEL1, Class M2, 1 mo. USD LIBOR + 1.200% | | | | | | | | |
1.348% FRN 11/25/35 (a) | | | 994,223 | | | | 948,615 | |
TLF National Tax Lien Trust, Series 2017-1A, Class A | | | | | | | | |
3.090% 12/15/29 (a) | | | 375,264 | | | | 377,804 | |
Trip Rail Master Funding LLC, Series 2017-1A, Class A1 | | | | | | | | |
2.709% 8/15/47 (a) | | | 63,981 | | | | 64,062 | |
The accompanying notes are an integral part of the financial statements.
90
MML Inflation-Protected and Income Fund – Portfolio of Investments (Continued) |
| | | Principal
Amount | | | Value | |
Upstart Securitization Trust, Series 2020-3, Class A | | | | | | | | |
1.702% 11/20/30 (a) | | $ | 3,511,887 | | | $ | 3,507,697 | |
Verizon Owner Trust., Series 2018-1A, Class A1A | | | | | | | | |
2.820% 9/20/22 (a) | | | 431,214 | | | | 432,931 | |
Westgate Resorts LLC | | | | | | | | |
Series 2017-1A, Class A, 3.050% 12/20/30 (a) | | | 199,040 | | | | 201,190 | |
Series 2018-1A, Class A, 3.380% 12/20/31 (a) | | | 312,670 | | | | 317,664 | |
| | | | | | | | 65,337,341 | |
Student Loans Asset-Backed Securities — 11.8% |
Brazos Higher Education Authority, Inc. | | | | | | | | |
Series 2006-2, Class A10, 3 mo. USD LIBOR + .120% 0.371% FRN 6/25/26 | | | 915,457 | | | | 906,162 | |
Series 2006-2, Class B2, 1.659% 6/25/42 | | | 1,200,000 | | | | 1,188,325 | |
Chase Education Loan Trust, Series 2007-A, Class A4, 3 mo. USD LIBOR + .100% | | | | | | | | |
0.351% FRN 6/28/39 | | | 3,141,109 | | | | 2,985,943 | |
College Loan Corp. Trust I, Series 2005-2, Class B, 3 mo. USD LIBOR + .490% | | | | | | | | |
0.727% FRN 1/15/37 | | | 400,483 | | | | 360,082 | |
Commonbond Student Loan Trust, Series 2018-CGS, Class C | | | | | | | | |
4.350% 2/25/46 (a) | | | 33,490 | | | | 33,562 | |
DRB Prime Student Loan Trust | | | | | | | | |
Series 2016-R, Class A1, 1 mo. USD LIBOR + 1.900% 2.045% FRN 10/25/44 (a) | | | 516,457 | | | | 519,281 | |
Series 2016-A, Class A1, 1 mo. USD LIBOR + 2.000% 2.148% FRN 4/25/40 (a) | | | 148,571 | | | | 147,062 | |
Earnest Student Loan Program LLC, Series 2016-B, Class A1, 1 mo. USD LIBOR + 2.050% | | | | | | | | |
2.200% FRN 2/26/35 (a) | | | 122,046 | | | | 115,466 | |
ECMC Group Student Loan Trust | | | | | | | | |
Series 2017-1A, Class A, 1 mo. USD LIBOR + 1.200% 1.348% FRN 12/27/66 (a) | | | 1,311,177 | | | | 1,316,853 | |
Series 2016-1A, Class A, 1 mo. USD LIBOR + 1.350% 1.498% FRN 7/26/66 (a) | | | 876,951 | | | | 889,407 | |
EdLinc Student Loan Funding Trust, Series 2017-A, Class A, PRIME - 1.150% | | | | | | | | |
3.600% FRN 12/01/47 (a) | | | 575,960 | | | | 569,549 | |
| | | Principal
Amount | | | Value | |
Edsouth Indenture | | | | | | | | |
No.9 LLC, Series 2015-1, Class A, 1 mo. USD LIBOR + .800% 0.948% FRN 10/25/56 (a) | | $ | 341,525 | | | $ | 338,769 | |
No.10 LLC, Series 2015-2, Class B, 1 mo. USD LIBOR + 1.500% 1.648% FRN 12/25/58 (a) | | | 1,000,000 | | | | 985,534 | |
ELFI Graduate Loan Program LLC, Series 2018-A, Class A1, 1 mo. USD LIBOR + .750% | | | | | | | | |
0.898% FRN 8/25/42 (a) | | | 367,428 | | | | 364,839 | |
Goal Capital Funding Trust, Series 2010-1, Class A, 3 mo. USD LIBOR + .700% | | | | | | | | |
0.907% FRN 8/25/48 (a) | | | 236,321 | | | | 233,535 | |
JP Morgan Student Loan Trust, Series 2007-A, Class B, 3 mo. USD LIBOR + .350% | | | | | | | | |
0.572% FRN 6/28/39 (a) | | | 450,074 | | | | 406,085 | |
KeyCorp Student Loan Trust | | | | | | | | |
Series 2000-A, Class A2, 3 mo. USD LIBOR + .320% 0.527% FRN 5/25/29 | | | 8,314 | | | | 8,315 | |
Series 2005-A, Class 2B, 3 mo. USD LIBOR + .730% 0.981% FRN 9/27/38 | | | 1,398,031 | | | | 1,393,889 | |
Laurel Road Prime Student Loan Trust, Series 2019-A, Class A1FX | | | | | | | | |
2.340% 10/25/48 (a) | | | 466,284 | | | | 457,248 | |
Navient Student Loan Trust | | | | | | | | |
Series 2017-3A, Class A2, 1 mo. USD LIBOR + .600% 0.748% FRN 7/26/66 (a) | | | 684,193 | | | | 683,508 | |
Series 2018-1A, Class A3, 1 mo. USD LIBOR + .720% 0.868% FRN 3/25/67 (a) | | | 1,120,000 | | | | 1,109,686 | |
Series 2016-3A, Class A2, 1 mo. USD LIBOR + .850% 0.998% FRN 6/25/65 (a) | | | 7,551 | | | | 7,553 | |
Series 2017-1A, Class A3, 1 mo. USD LIBOR + 1.150% 1.298% FRN 7/26/66 (a) | | | 410,000 | | | | 417,707 | |
Series 2015-AA, Class A2B, 1 mo. USD LIBOR + 1.200% 1.359% FRN 12/15/28 (a) | | | 304,296 | | | | 304,845 | |
Series 2016-5A, Class A, 1 mo. USD LIBOR + 1.250% 1.398% FRN 6/25/65 (a) | | | 1,944,010 | | | | 1,961,526 | |
Series 2016-6A, Class A3, 1 mo. USD LIBOR + 1.300% 1.448% FRN 3/25/66 (a) | | | 2,200,000 | | | | 2,216,453 | |
Series 2019-3A, Class B, 1 mo. USD LIBOR + 1.550% 1.698% FRN 7/25/68 (a) | | | 2,900,000 | | | | 2,899,966 | |
The accompanying notes are an integral part of the financial statements.
91
MML Inflation-Protected and Income Fund – Portfolio of Investments (Continued) |
| | | Principal
Amount | | | Value | |
Nelnet Private Education Loan Trust, Series 2016-A, Class A1A, 1 mo. USD LIBOR + 1.750% | | | | | | | | |
1.898% FRN 12/26/40 (a) | | $ | 210,264 | | | $ | 211,209 | |
Nelnet Student Loan Trust | | | | | | | | |
Series 2005-2, Class B, 3 mo. USD LIBOR + .170% 0.406% FRN 3/23/37 | | | 854,830 | | | | 729,101 | |
Series 2006-2, Class B, 3 mo. USD LIBOR + .200% 0.415% FRN 1/25/38 | | | 633,948 | | | | 541,918 | |
Series 2006-3, Class B, 3 mo. USD LIBOR + .250% 0.501% FRN 6/25/41 | | | 295,057 | | | | 254,923 | |
Series 2004-3, Class B, 3 mo. USD LIBOR + .350% 0.565% FRN 10/25/40 | | | 997,579 | | | | 900,910 | |
Series 2014-2A, Class B, 1 mo. USD LIBOR + 1.500% 1.648% FRN 6/25/41 (a) | | | 375,000 | | | | 355,939 | |
SLC Student Loan Trust | | | | | | | | |
Series 2006-2, Class B, 3 mo. USD LIBOR + .230% 0.447% FRN 12/15/39 | | | 1,108,726 | | | | 990,188 | |
Series 2005-2, Class B, 3 mo. USD LIBOR + .280% 0.497% FRN 3/15/40 | | | 1,676,209 | | | | 1,464,889 | |
SLM Private Credit Student Loan Trust, Series 2004-B, Class B, 3 mo. USD LIBOR + .470% | | | | | | | | |
0.687% FRN 9/15/33 | | | 203,401 | | | | 203,159 | |
SLM Student Loan Trust | | | | | | | | |
Series 2005-5, Class A4, 3 mo. USD LIBOR + .140% 0.355% FRN 10/25/28 | | | 311,693 | | | | 309,819 | |
Series 2006-4, Class B, 3 mo. USD LIBOR + .200% 0.415% FRN 1/25/70 | | | 329,280 | | | | 293,893 | |
Series 2006-5, Class B, 3 mo. USD LIBOR + .210% 0.425% FRN 10/25/40 | | | 349,440 | | | | 312,384 | |
Series 2006-2, Class B, 3 mo. USD LIBOR + .220% 0.435% FRN 1/25/41 | | | 386,610 | | | | 341,762 | |
Series 2003-14, Class A6, 3 mo. USD LIBOR + .300% 0.515% FRN 7/25/25 | | | 210,065 | | | | 208,900 | |
Series 2005-8, Class B, 3 mo. USD LIBOR + .310% 0.525% FRN 1/25/55 | | | 348,716 | | | | 322,754 | |
Series 2004-8, Class B, 3 mo. USD LIBOR + .460% 0.675% FRN 1/25/40 | | | 385,228 | | | | 347,712 | |
| | | Principal
Amount | | | Value | |
Series 2004-3, Class B, 3 mo. USD LIBOR + .470% 0.685% FRN 10/25/64 | | $ | 266,731 | | | $ | 248,114 | |
Series 2003-11, Class B, 3 mo. USD LIBOR + .650% 0.867% FRN 12/15/38 | | | 391,173 | | | | 358,971 | |
SMB Private Education Loan Trust | | | | | | | | |
Series 2019-B, Class A1, 1 mo. USD LIBOR + .350% 0.509% FRN 7/15/26 (a) | | | 71,500 | | | | 71,475 | |
Series 2018-B, Class A2B, 1 mo. USD LIBOR + .720% 0.879% FRN 1/15/37 (a) | | | 1,244,862 | | | | 1,243,758 | |
Series 2019-A, Class A2B, 1 mo. USD LIBOR + .870% 1.029% FRN 7/15/36 (a) | | | 1,586,405 | | | | 1,579,677 | |
Series 2014-A, Class A2B, 1 mo. USD LIBOR + 1.150% 1.309% FRN 5/15/26 (a) | | | 503,585 | | | | 504,455 | |
Series 2014-A, Class A2A, 3.050% 5/15/26 (a) | | | 113,027 | | | | 114,037 | |
SoFi Alternative Trust, Series 2019-C, Class PT, | | | | | | | | |
4.974% VRN 1/25/45 (a) (b) | | | 1,434,685 | | | | 1,547,602 | |
SoFi Professional Loan Program LLC | | | | | | | | |
Series 2017-A, Class A1, 1 mo. USD LIBOR + .700% 0.848% FRN 3/26/40 (a) | | | 203,413 | | | | 203,209 | |
Series 2016-A, Class A1, 1 mo. USD LIBOR + 1.750% 1.898% FRN 8/25/36 (a) | | | 194,733 | | | | 196,074 | |
Series 2019-C, Class A1FX, 2.130% 11/16/48 (a) | | | 810,292 | | | | 814,548 | |
Series 2016-B, Class A2B, 2.740% 10/25/32 (a) | | | 1,798,389 | | | | 1,824,256 | |
| | | | | | | | 39,316,786 | |
Whole Loan Collateral Collateralized Mortgage Obligations — 8.3% |
Angel Oak Mortgage Trust, Series 2018-3, Class A3, | | | | | | | | |
3.238% VRN 5/25/59 (a) (b) | | | 996,176 | | | | 1,008,709 | |
Banc of America Funding, Series 2006-G, Class 2A1, 1 mo. USD LIBOR + .440% | | | | | | | | |
0.592% FRN 7/20/36 | | | 995,256 | | | | 986,663 | |
BRAVO Residential Funding Trust, Series 2019-NQM1, Class A1, | | | | | | | | |
2.666% VRN 7/25/59 (a) (b) | | | 5,825,344 | | | | 5,972,827 | |
CIM Trust, Series 2019-INV3, Class A11, 1 mo. USD LIBOR + 1.000% | | | | | | | | |
1.100% FRN 8/25/49 (a) | | | 2,778,168 | | | | 2,783,744 | |
The accompanying notes are an integral part of the financial statements.
92
MML Inflation-Protected and Income Fund – Portfolio of Investments (Continued) |
| | | Principal
Amount | | | Value | |
Citigroup Mortgage Loan Trust, Series 2019-IMC1, Class A3, | | | | | | | | |
3.030% VRN 7/25/49 (a) (b) | | $ | 854,683 | | | $ | 872,167 | |
Deephaven Residential Mortgage Trust | | | | | | | | |
Series 2018-1A, Class A2, 3.027% VRN 12/25/57 (a) (b) | | | 206,346 | | | | 207,898 | |
Series 2018-2A, Class A1, 3.479% VRN 4/25/58 (a) (b) | | | 716,615 | | | | 726,495 | |
Series 2018-4A, Class A3, 4.285% VRN 10/25/58 (a) (b) | | | 1,284,010 | | | | 1,285,042 | |
HomeBanc Mortgage Trust, Series 2005-3, Class A1, 1 mo. USD LIBOR + .480% | | | | | | | | |
0.628% FRN 7/25/35 | | | 1,438,679 | | | | 1,430,701 | |
JP Morgan Mortgage Trust | | | | | | | | |
Series 2018-1, Class A5, 3.500% VRN 6/25/48 (a) (b) | | | 125,938 | | | | 127,104 | |
Series 2018-3, Class A5, 3.500% VRN 9/25/48 (a) (b) | | | 287,085 | | | | 290,321 | |
Series 2017-6, Class A5, 3.500% VRN 12/25/48 (a) (b) | | | 166,391 | | | | 167,793 | |
New Residential Mortgage Loan Trust, Series 2019-NQM1, Class A3, | | | | | | | | |
3.928% VRN 1/25/49 (a) (b) | | | 866,104 | | | | 883,171 | |
Onslow Bay Financial LLC, Series 2020-EXP1, Class 2A2, 1 mo. USD LIBOR + .950% | | | | | | | | |
1.098% FRN 2/25/60 (a) | | | 1,448,924 | | | | 1,451,169 | |
Opteum Mortgage Acceptance Corp. Asset Backed Pass-Through Certificates, Series 2005-4, Class 1APT, 1 mo. USD LIBOR + .620% | | | | | | | | |
0.768% FRN 11/25/35 | | | 755,375 | | | | 732,982 | |
PSMC Trust, Series 2018-1, Class A3, | | | | | | | | |
3.500% VRN 2/25/48 (a) (b) | | | 154,938 | | | | 155,958 | |
Sequoia Mortgage Trust | | | | | | | | |
Series 2018-3, Class A4, 3.500% VRN 3/25/48 (a) (b) | | | 184,734 | | | | 186,272 | |
Series 2018-CH1, Class A10, 4.000% VRN 2/25/48 (a) (b) | | | 149,270 | | | | 150,303 | |
Series 2018-CH2, Class A12, 4.000% VRN 6/25/48 (a) (b) | | | 490,454 | | | | 495,358 | |
Series 2018-CH3, Class A11, 4.000% VRN 8/25/48 (a) (b) | | | 92,169 | | | | 92,498 | |
Starwood Mortgage Residential Trust, Series 2019-INV1, Class A3, | | | | | | | | |
2.916% VRN 9/27/49 (a) (b) | | | 919,707 | | | | 944,042 | |
Verus Securitization Trust | | | | | | | | |
Series 2019-INV2, Class A3, 3.219% VRN 7/25/59 (a) (b) | | | 894,965 | | | | 921,096 | |
Series 2019-1, Class A1, 3.836% VRN 2/25/59 (a) (b) | | | 1,605,010 | | | | 1,627,563 | |
| | | Principal
Amount | | | Value | |
Series 2019-1, Class A3, 4.040% VRN 2/25/59 (a) (b) | | $ | 4,257,297 | | | $ | 4,350,772 | |
| | | | | | | | 27,850,648 | |
| | | | | | | | | |
TOTAL NON-U.S. GOVERNMENT AGENCY OBLIGATIONS (Cost $186,587,155) | | | | | | | 186,887,441 | |
| | | | | | | | | |
U.S. GOVERNMENT AGENCY OBLIGATIONS AND INSTRUMENTALITIES — 3.9% |
Pass-Through Securities — 0.1% |
Federal Home Loan Mortgage Corp. Pool #1Q0239, 1 year CMT + 2.212% 3.235% 3/01/37 | | | 170,798 | | | | 180,433 | |
Whole Loans — 3.8% |
Federal Home Loan Mortgage Corp. REMICS | | | | | | | | |
Series 2020-DNA6, Class M1, SOFR + 0.900% 0.977% FRN 12/25/50 (a) | | | 1,728,000 | | | | 1,727,995 | |
Series 2020-DNA5, Class M1, SOFR + 1.300% 1.382% FRN 10/25/50 (a) | | | 1,645,000 | | | | 1,649,203 | |
Federal Home Loan Mortgage Corp. Structured Agency Credit Risk Debt Notes | | | | | | | | |
Series 2020-DNA3, Class M1, 1 mo. USD LIBOR + 1.500% 1.648% FRN 6/25/50 (a) | | | 3,332,219 | | | | 3,336,697 | |
Series 2020-DNA4, Class M1, 1 mo. USD LIBOR + 1.500% 1.648% FRN 8/25/50 (a) | | | 3,967,458 | | | | 3,978,342 | |
Series 2020-DNA5, Class M2, SOFR30A + 2.800% 2.882% FRN 10/25/50 (a) | | | 504,000 | | | | 509,364 | |
Series 2020-DNA3, Class M2, 1 mo. USD LIBOR + 3.000% 3.148% FRN 6/25/50 (a) | | | 1,100,000 | | | | 1,105,982 | |
Federal National Mortgage Association Connecticut Avenue Securities Trust, Series 2019-R03, Class 1M2, 1 mo. USD LIBOR + 2.150% | | | | | | | | |
2.298% FRN 9/25/31 (a) | | | 666,248 | | | | 663,991 | |
| | | | | | | | 12,971,574 | |
| | | | | | | | | |
TOTAL U.S. GOVERNMENT AGENCY OBLIGATIONS AND INSTRUMENTALITIES (Cost $13,132,692) | | | | | | | 13,152,007 | |
The accompanying notes are an integral part of the financial statements.
93
MML Inflation-Protected and Income Fund – Portfolio of Investments (Continued) |
| | | Principal
Amount | | | Value | |
U.S. TREASURY OBLIGATIONS — 18.1% |
U.S. Treasury Bonds & Notes — 18.1% |
U.S. Treasury Inflation Index | | | | | | | | |
0.125% 10/15/24 | | $ | 2,537,225 | | | $ | 2,720,315 | |
0.125% 4/15/25 | | | 604,842 | | | | 650,646 | |
0.125% 10/15/25 | | | 903,168 | | | | 981,972 | |
0.125% 7/15/26 | | | 1,249,234 | | | | 1,373,750 | |
0.125% 1/15/30 | | | 3,643,380 | | | | 4,063,982 | |
0.125% 7/15/30 | | | 4,062,280 | | | | 4,556,524 | |
0.250% 1/15/25 | | | 3,765,274 | | | | 4,062,770 | |
0.250% 7/15/29 | | | 3,410,158 | | | | 3,859,961 | |
0.250% 2/15/50 | | | 2,557,295 | | | | 3,046,411 | |
0.375% 7/15/25 (c) | | | 2,876,760 | | | | 3,159,454 | |
0.375% 7/15/27 | | | 53,223 | | | | 59,875 | |
0.500% 4/15/24 | | | 2,787,534 | | | | 2,987,888 | |
0.500% 1/15/28 | | | 1,345,916 | | | | 1,526,002 | |
0.625% 4/15/23 | | | 2,148,974 | | | | 2,262,718 | |
0.625% 1/15/24 | | | 1,339,140 | | | | 1,437,187 | |
0.625% 1/15/26 | | | 904,083 | | | | 1,009,100 | |
0.625% 2/15/43 | | | 453,016 | | | | 564,494 | |
0.750% 7/15/28 | | | 1,841,243 | | | | 2,141,236 | |
0.750% 2/15/42 | | | 1,094,723 | | | | 1,392,921 | |
0.750% 2/15/45 | | | 1,161,038 | | | | 1,496,665 | |
0.875% 1/15/29 | | | 2,062,440 | | | | 2,423,582 | |
0.875% 2/15/47 | | | 539,340 | | | | 724,808 | |
1.000% 2/15/48 | | | 844,728 | | | | 1,175,437 | |
1.375% 2/15/44 | | | 1,899,325 | | | | 2,734,063 | |
2.125% 2/15/41 | | | 772,863 | | | | 1,211,694 | |
2.375% 1/15/25 | | | 2,831,809 | | | | 3,308,865 | |
2.500% 1/15/29 | | | 727,668 | | | | 955,794 | |
3.375% 4/15/32 | | | 366,740 | | | | 558,615 | |
3.625% 4/15/28 | | | 724,455 | | | | 995,956 | |
3.875% 4/15/29 | | | 2,217,474 | | | | 3,194,808 | |
| | | | | | | | 60,637,493 | |
| | | | | | | | | |
TOTAL U.S. TREASURY OBLIGATIONS (Cost $57,517,619) | | | | | | | 60,637,493 | |
| | | | | | | | | |
TOTAL BONDS & NOTES (Cost $257,254,985) | | | | | | | 260,694,478 | |
| | | | | | | | | |
TOTAL PURCHASED OPTIONS (#) — 0.4% (Cost $1,845,236) | | | | | | | 1,199,703 | |
| | | | | | | | | |
TOTAL LONG-TERM INVESTMENTS (Cost $259,100,221) | | | | | | | 261,894,181 | |
| | | Principal
Amount | | | Value | |
SHORT-TERM INVESTMENTS — 18.6% |
Commercial Paper — 17.1% |
American Electric Power, Inc. | | | | | | | | |
0.213% 1/25/21 (a) | | $ | 4,000,000 | | | $ | 3,999,436 | |
American Honda Finance Corp. | | | | | | | | |
0.284% 2/05/21 | | | 4,000,000 | | | | 3,998,752 | |
CenterPoint Energy, Inc. | | | | | | | | |
0.233% 1/08/21 (a) | | | 3,000,000 | | | | 2,999,925 | |
Duke Energy Corp. | | | | | | | | |
0.223% 1/05/21 (a) | | | 2,000,000 | | | | 1,999,975 | |
Fidelity National Information Services, Inc. | | | | | | | | |
0.304% 1/06/21 (a) | | | 2,000,000 | | | | 1,999,957 | |
Intercontinental Exchange, Inc. | | | | | | | | |
0.284% 3/01/21 (a) (d) | | | 3,000,000 | | | | 2,998,179 | |
0.355% 4/05/21 (a) (d) | | | 1,000,000 | | | | 998,952 | |
National Grid Holdings | | | | | | | | |
0.304% 2/18/21 (a) | | | 4,000,000 | | | | 3,998,666 | |
NiSource, Inc. | | | | | | | | |
0.243% 1/19/21 (a) | | | 2,000,000 | | | | 1,999,807 | |
Public Service Enterprise Group, Inc. | | | | | | | | |
0.254% 1/20/21 (a) | | | 4,000,000 | | | | 3,999,584 | |
Schlumberger Holdings Corp. | | | | | | | | |
0.254% 1/11/21 (a) | | | 1,000,000 | | | | 999,985 | |
Suncor Energy, Inc. | | | | | | | | |
0.233% 1/06/21 (a) | | | 4,000,000 | | | | 3,999,900 | |
Telus Corp. | | | | | | | | |
0.162% 2/04/21 (a) | | | 4,000,000 | | | | 3,999,117 | |
Transcanada Pipelines Ltd. | | | | | | | | |
0.304% 1/14/21 (a) | | | 2,000,000 | | | | 1,999,870 | |
0.325% 1/14/21 | | | 1,000,000 | | | | 999,935 | |
Vodafone Group PLC | | | | | | | | |
0.325% 1/07/21 (a) | | | 2,000,000 | | | | 1,999,942 | |
0.355% 1/04/21 (a) | | | 2,000,000 | | | | 1,999,967 | |
Volkswagen Credit, Inc. | | | | | | | | |
0.254% 1/19/21 (a) | | | 4,000,000 | | | | 3,999,614 | |
Walgreens Boots Alliance, Inc. | | | | | | | | |
0.274% 1/08/21 (a) | | | 1,000,000 | | | | 999,948 | |
0.304% 2/19/21 (a) | | | 2,000,000 | | | | 1,999,075 | |
Waste Management, Inc. | | | | | | | | |
0.356% 7/01/21 (a) | | | 5,000,000 | | | | 4,991,963 | |
| | | | | | | | 56,982,549 | |
The accompanying notes are an integral part of the financial statements.
94
MML Inflation-Protected and Income Fund – Portfolio of Investments (Continued) |
| | | Principal
Amount | | | Value | |
Repurchase Agreement — 1.5% |
Fixed Income Clearing Corp., Repurchase Agreement, dated 12/31/20, 0.000%, due 1/04/21 (e) | | $ | 4,836,327 | | | $ | 4,836,327 | |
| | | | | | | | | |
TOTAL SHORT-TERM INVESTMENTS (Cost $61,818,287) | | | | | | | 61,818,876 | |
| | | | | | | | | |
TOTAL INVESTMENTS — 96.9% (Cost $320,918,508) (f) | | | | | | | 323,713,057 | |
| | | | | | | | | |
Other Assets/(Liabilities) — 3.1% | | | | | | | 10,493,781 | |
| | | | | | | | | |
NET ASSETS — 100.0% | | | | | | $ | 334,206,838 | |
Abbreviation Legend
CLO | Collateralized Loan Obligation |
REMICS | Real Estate Mortgage Investment Conduits |
Notes to Portfolio of Investments
Percentages are stated as a percent of net assets.
(a) | Security is exempt from registration under Regulation S or Rule 144A of the Securities Act of 1933. These securities are considered restricted and may be resold in transactions exempt from registration. At December 31, 2020, the aggregate market value of these securities amounted to $212,667,132 or 63.63% of net assets. |
(b) | Certain variable rate securities are not based on a published reference rate and spread but are determined by the issuer or agent and are based on current market conditions. These securities do not indicate a reference rate and spread in their description above. The rates shown are the current interest rates at December 31, 2020. |
(c) | A portion of this security is pledged/held as collateral for open derivatives. (Note 2). |
(d) | This security is fair valued in good faith in accordance with procedures approved by the Board of Trustees. At December 31, 2020, these securities amounted to a value of $3,997,131 or 1.20% of net assets. |
(e) | Maturity value of $4,836,327. Collateralized by U.S. Government Agency obligations with a rate of 0.000%, maturity date of 12/30/21, and an aggregate market value, including accrued interest, of $4,933,056. |
(f) | See Note 6 for aggregate cost for federal tax purposes. |
Country weightings, as a percentage of net assets, is as follows:
United States | | | 72.6 | % |
Cayman Islands | | | 5.5 | % |
Japan | | | 0.2 | % |
Total Long-Term Investments | | | 78.3 | % |
Short-Term Investments and Other Assets and Liabilities | | | 21.7 | % |
Net Assets | | | 100.0 | % |
(#) Interest Rate Swaptions Purchased
| | | | | | | | Paid by Fund | | | Received by Fund | | | | | | | | | | | | | | | | | | | | | |
Description | Counterparty | | Expiration
Date | | | Rate | | | Frequency | | | Rate | | | Frequency | | | Notional
Amount | | | Value | | | Premium
Paid
(Received) | | | Unrealized
Appreciation/
(Depreciation) | |
Call | | | | | | | | | | | | | | | | | | | | | | | | | | | | | | | | | | | | | | | | | |
10-Year Interest Rate Swap, 12/15/42 | Barclays Bank PLC* | | | 12/13/32 | | | | 3-Month USD LIBOR BBA | | | | Quarterly | | | | 2.44% | | | | Semi-Annually | | | | USD | | | | 1,967,000 | | | $ | 197,093 | | | $ | 98,334 | | | $ | 98,759 | |
| | | | | | | | | | | | | | | | | | | | | | | | | | | | | | | | | | | | | | | | | | |
Put | | | | | | | | | | | | | | | | | | | | | | | | | | | | | | | | | | | | | | | | | |
10-Year Interest Rate Swap, 12/15/42 | Barclays Bank PLC* | | | 12/13/32 | | | | 2.94% | | | | Semi-Annually | | | | 3-Month USD LIBOR BBA | | | | Quarterly | | | | USD | | | | 22,880,000 | | | $ | 673,130 | | | $ | 1,143,841 | | | $ | (470,711 | ) |
10-Year Interest Rate Swap, 2/02/43 | Credit Suisse International* | | | 1/31/33 | | | | 3.11% | | | | Semi-Annually | | | | 3-Month USD LIBOR BBA | | | | Quarterly | | | | USD | | | | 12,590,000 | | | | 329,480 | | | | 603,061 | | | | (273,581 | ) |
| | | | | | | | | | | | | | | | | | | | | | | | | | | | | | | | | 1,002,610 | | | | 1,746,902 | | | | (744,292 | ) |
| | | | | | | | | | | | | | | | | | | | | | | | | | | | | | | | $ | 1,199,703 | | | $ | 1,845,236 | | | $ | (645,533 | ) |
The accompanying notes are an integral part of the financial statements.
95
MML Inflation-Protected and Income Fund – Portfolio of Investments (Continued) |
Futures contracts
| | Expiration
Date | | | Number of
Contracts | | | Notional
Amount | | | Value/ Net
Unrealized
Appreciation/
(Depreciation) | |
Long | | | | | | | | | | | | | | | | |
U.S. Treasury Long Bond | | | 3/22/21 | | | | 38 | | | $ | 6,619,888 | | | $ | (38,763 | ) |
U.S. Treasury Note 2 Year | | | 3/31/21 | | | | 3 | | | | 662,353 | | | | 577 | |
U.S. Treasury Note 5 Year | | | 3/31/21 | | | | 50 | | | | 6,296,281 | | | | 11,922 | |
| | | | | | | | | | | | | | $ | (26,264 | ) |
Short | | | | | | | | | | | | | | | | |
U.S. Treasury Ultra 10 Year | | | 3/22/21 | | | | 40 | | | $ | (6,278,684 | ) | | $ | 24,309 | |
U.S. Treasury Ultra Bond | | | 3/22/21 | | | | 21 | | | | (4,537,065 | ) | | | 52,252 | |
| | | | | | | | | | | | | | $ | 76,561 | |
OTC Interest Rate Swaps
Paid by the Fund | Received by the Fund | | | | | | | | | | | | | | | | | | | | | | | | | |
Rate/
Reference | | Frequency | | Rate/
Reference | | Frequency | | Counterparty | | Termination
Date | | | Notional
Amount | | | Value | | | Upfront
Premium
Paid/
(Received) | | | Unrealized
Appreciation
(Depreciation) | |
1.978% | | | Maturity | | U.S. Consumer Price Index | | | Maturity | | Bank of America N.A.* | | | 12/24/22 | | | | USD | | | | 10,000,000 | | | $ | 18,155 | | | $ | — | | | $ | 18,155 | |
1.833% | | | Maturity | | U.S. Consumer Price Index | | | Maturity | | Goldman Sachs & Co.* | | | 8/28/23 | | | | USD | | | | 500,000 | | | | 6,893 | | | | — | | | | 6,893 | |
1.880% | | | Maturity | | U.S. Consumer Price Index | | | Maturity | | Goldman Sachs & Co.* | | | 8/28/25 | | | | USD | | | | 2,000,000 | | | | 35,840 | | | | — | | | | 35,840 | |
1.643% | | | Maturity | | U.S. Consumer Price Index | | | Maturity | | Goldman Sachs International* | | | 12/09/21 | | | | USD | | | | 3,500,000 | | | | (4,270 | ) | | | — | | | | (4,270 | ) |
1.180% | | | Maturity | | U.S. Consumer Price Index | | | Maturity | | Goldman Sachs International* | | | 6/22/22 | | | | USD | | | | 3,000,000 | | �� | | 66,248 | | | | — | | | | 66,248 | |
2.000% | | | Maturity | | U.S. Consumer Price Index | | | Maturity | | JP Morgan Chase Bank N.A.* | | | 12/24/23 | | | | USD | | | | 4,000,000 | | | | 8,731 | | | | — | | | | 8,731 | |
| | | | | | | | | | | | | | | | | | | | | | | | | $ | 131,597 | | | $ | — | | | $ | 131,597 | |
The accompanying notes are an integral part of the financial statements.
96
MML Inflation-Protected and Income Fund – Portfolio of Investments (Continued) |
OTC Total Return Swaps
Paid by the Fund | | Received by the Fund | | | | | | | | | | | | | | | | | | | | | | | | | |
Rate/
Reference | | Frequency | | | Rate/
Reference | | | Frequency | | | Counterparty | | | Termination
Date | | | No. of
Contracts/
Notional | | | Value | | | Upfront
Premium
Received
(Paid)/
Received | | | Unrealized
Appreciation
(Depreciation) | |
0.29% | | | Maturity | | | | Bloomberg Barclays US Treasury Inflation Notes TR Index | | | | Maturity | | | | BNP Paribas SA* | | | | 1/29/21 | | | | 42,656,014 | | | $ | 1,003,009 | | | $ | — | | | $ | 1,003,009 | |
0.30% | | | Maturity | | | | Bloomberg Barclays US Treasury Inflation Notes TR Index | | | | Maturity | | | | BNP Paribas SA* | | | | 2/26/21 | | | | 64,794,997 | | | | 806,909 | | | | — | | | | 806,909 | |
0.29% | | | Maturity | | | | Bloomberg Barclays US Treasury Inflation Notes TR Index | | | | Maturity | | | | Goldman Sachs International* | | | | 1/29/21 | | | | 53,814,689 | | | | 1,265,393 | | | | — | | | | 1,265,393 | |
0.30% | | | Maturity | | | | Bloomberg Barclays US Treasury Inflation Notes TR Index | | | | Maturity | | | | Goldman Sachs International* | | | | 2/26/21 | | | | 53,995,831 | | | | 672,425 | | | | — | | | | 672,425 | |
0.26% | | | Maturity | | | | Bloomberg Barclays US Treasury Inflation Notes TR Index | | | | Maturity | | | | Goldman Sachs International* | | | | 5/28/21 | | | | 33,123,588 | | | | 755,428 | | | | — | | | | 755,428 | |
| | | | | | | | | | | | | | | | | | | | | | | | | | | $ | 4,503,164 | | | $ | — | | | $ | 4,503,164 | |
* | Contracts are subject to a Master Netting Agreement. |
Currency Legend
The accompanying notes are an integral part of the financial statements.
97
MML Managed Bond Fund – Portfolio of Investments |
December 31, 2020 |
| | | Principal
Amount | | | Value | |
BONDS & NOTES — 97.6% |
CORPORATE DEBT — 39.0% |
Aerospace & Defense — 0.2% |
BAE Systems PLC | | | | | | | | |
1.900% 2/15/31 (a) | | $ | 595,000 | | | $ | 601,518 | |
Raytheon Technologies Corp. | | | | | | | | |
4.500% 6/01/42 | | | 1,000,000 | | | | 1,304,011 | |
| | | | | | | | 1,905,529 | |
Agriculture — 0.8% |
BAT Capital Corp. | | | | | | | | |
2.259% 3/25/28 | | | 725,000 | | | | 752,583 | |
4.700% 4/02/27 | | | 1,050,000 | | | | 1,234,668 | |
4.758% 9/06/49 | | | 540,000 | | | | 626,053 | |
Bunge Ltd. Finance Corp. | | | | | | | | |
3.250% 8/15/26 | | | 1,179,000 | | | | 1,310,416 | |
Imperial Brands Finance PLC | | | | | | | | |
3.875% 7/26/29 (a) | | | 2,764,000 | | | | 3,089,444 | |
Reynolds American, Inc. | | | | | | | | |
5.850% 8/15/45 | | | 985,000 | | | | 1,259,569 | |
| | | | | | | | 8,272,733 | |
Airlines — 0.3% |
Delta Air Lines, Inc. / SkyMiles IP Ltd. | | | | | | | | |
4.500% 10/20/25 (a) | | | 980,000 | | | | 1,047,482 | |
Spirit Airlines Pass-Through Trust, Series 2015-1, Class A, | | | | | | | | |
4.100% 10/01/29 | | | 1,384,317 | | | | 1,315,916 | |
United Airlines Pass-Through Trust, Series 2018-1, Class B, | | | | | | | | |
4.600% 9/01/27 | | | 465,264 | | | | 460,316 | |
| | | | | | | | 2,823,714 | |
Auto Manufacturers — 1.6% |
Ford Motor Credit Co. LLC | | | | | | | | |
3.087% 1/09/23 | | | 1,410,000 | | | | 1,434,597 | |
4.140% 2/15/23 | | | 1,360,000 | | | | 1,400,800 | |
General Motors Co. | | | | | | | | |
4.200% 10/01/27 | | | 565,000 | | | | 640,225 | |
5.150% 4/01/38 | | | 800,000 | | | | 961,880 | |
General Motors Financial Co., Inc. | | | | | | | | |
3.500% 11/07/24 | | | 2,100,000 | | | | 2,269,385 | |
4.150% 6/19/23 | | | 2,193,000 | | | | 2,359,276 | |
4.200% 11/06/21 | | | 1,216,000 | | | | 1,253,352 | |
Hyundai Capital America | | | | | | | | |
2.850% 11/01/22 (a) | | | 1,705,000 | | | | 1,766,889 | |
3.000% 2/10/27 (a) | | | 4,225,000 | | | | 4,586,558 | |
| | | | | | | | 16,672,962 | |
| | | Principal
Amount | | | Value | |
Banks — 6.0% |
ABN AMRO Bank NV | | | | | | | | |
4.750% 7/28/25 (a) | | $ | 310,000 | | | $ | 356,764 | |
Associated Banc-Corp. | | | | | | | | |
4.250% 1/15/25 | | | 2,411,000 | | | | 2,612,423 | |
Bank of America Corp. | | | | | | | | |
SOFR + 2.150% 2.592% VRN 4/29/31 | | | 1,255,000 | | | | 1,345,057 | |
4.183% 11/25/27 | | | 1,090,000 | | | | 1,264,494 | |
3 mo. USD LIBOR + 1.814% 4.244% VRN 4/24/38 | | | 1,150,000 | | | | 1,416,704 | |
3 mo. USD LIBOR + 1.310% 4.271% VRN 7/23/29 | | | 475,000 | | | | 565,604 | |
6.110% 1/29/37 | | | 1,550,000 | | | | 2,257,623 | |
7.750% 5/14/38 | | | 400,000 | | | | 682,003 | |
The Bank of Nova Scotia 3 mo. USD LIBOR + 2.648% | | | | | | | | |
4.650% VRN (b) | | | 3,575,000 | | | | 3,592,875 | |
Barclays Bank PLC | | | | | | | | |
10.179% 6/12/21 (a) | | | 3,351,000 | | | | 3,485,203 | |
Barclays PLC | | | | | | | | |
3 mo. USD LIBOR + 1.380% 1.601% FRN 5/16/24 | | | 2,085,000 | | | | 2,113,106 | |
4.337% 1/10/28 | | | 920,000 | | | | 1,056,885 | |
BPCE SA SOFR + 1.520% | | | | | | | | |
1.652% VRN 10/06/26 (a) | | | 3,635,000 | | | | 3,719,814 | |
Citigroup, Inc. | | | | | | | | |
4.125% 7/25/28 | | | 1,725,000 | | | | 2,017,699 | |
4.450% 9/29/27 | | | 450,000 | | | | 531,962 | |
6.625% 6/15/32 | | | 375,000 | | | | 531,597 | |
Credit Suisse AG | | | | | | | | |
6.500% 8/08/23 (a) | | | 3,069,000 | | | | 3,451,962 | |
Deutsche Bank AG | | | | | | | | |
3.150% 1/22/21 | | | 1,998,000 | | | | 2,000,216 | |
Discover Bank 5 year USD Swap + 1.730% | | | | | | | | |
4.682% VRN 8/09/28 | | | 2,905,000 | | | | 3,088,015 | |
First Republic Bank | | | | | | | | |
4.375% 8/01/46 | | | 3,210,000 | | | | 4,063,079 | |
Fulton Financial Corp. | | | | | | | | |
3.600% 3/16/22 | | | 1,565,000 | | | | 1,605,715 | |
The Goldman Sachs Group, Inc. | | | | | | | | |
4.250% 10/21/25 | | | 550,000 | | | | 630,741 | |
5.950% 1/15/27 | | | 1,410,000 | | | | 1,777,376 | |
6.750% 10/01/37 | | | 1,145,000 | | | | 1,752,034 | |
HSBC Holdings PLC | | | | | | | | |
4.250% 3/14/24 | | | 1,225,000 | | | | 1,351,595 | |
4.250% 8/18/25 | | | 2,662,000 | | | | 3,024,492 | |
JP Morgan Chase & Co. | | | | | | | | |
5.600% 7/15/41 | | | 1,125,000 | | | | 1,701,903 | |
The accompanying notes are an integral part of the financial statements.
98
MML Managed Bond Fund – Portfolio of Investments (Continued) |
| | | Principal
Amount | | | Value | |
Morgan Stanley | | | | | | | | |
4.350% 9/08/26 | | $ | 3,200,000 | | | $ | 3,772,762 | |
Nordea Bank Abp 5 year CMT + 4.110% | | | | | | | | |
6.625% VRN (a) (b) | | | 1,133,000 | | | | 1,300,117 | |
Societe Generale SA 1 year CMT + 1.100% | | | | | | | | |
1.488% VRN 12/14/26 (a) | | | 1,415,000 | | | | 1,427,500 | |
Valley National Bancorp | | | | | | | | |
5.125% 9/27/23 | | | 1,530,000 | | | | 1,666,402 | |
Wells Fargo & Co. | | | | | | | | |
5.375% 11/02/43 | | | 909,000 | | | | 1,263,059 | |
| | | | | | | | 61,426,781 | |
Beverages — 0.7% |
Anheuser-Busch Cos. LLC/Anheuser-Busch InBev Worldwide, Inc. | | | | | | | | |
4.900% 2/01/46 | | | 3,475,000 | | | | 4,518,302 | |
Bacardi Ltd. | | | | | | | | |
5.150% 5/15/38 (a) | | | 450,000 | | | | 575,592 | |
Molson Coors Beverage Co. | | | | | | | | |
4.200% 7/15/46 | | | 1,124,000 | | | | 1,289,746 | |
5.000% 5/01/42 | | | 360,000 | | | | 450,537 | |
| | | | | | | | 6,834,177 | |
Chemicals — 1.0% |
DuPont de Nemours, Inc. | | | | | | | | |
5.319% 11/15/38 | | | 1,750,000 | | | | 2,370,212 | |
Nutrition & Biosciences, Inc. | | | | | | | | |
1.832% 10/15/27 (a) | | | 755,000 | | | | 778,152 | |
Syngenta Finance NV | | | | | | | | |
4.441% 4/24/23 (a) | | | 2,065,000 | | | | 2,167,078 | |
5.182% 4/24/28 (a) | | | 865,000 | | | | 927,426 | |
Yara International ASA | | | | | | | | |
3.148% 6/04/30 (a) | | | 295,000 | | | | 319,421 | |
4.750% 6/01/28 (a) | | | 3,328,000 | | | | 3,946,365 | |
| | | | | | | | 10,508,654 | |
Computers — 0.8% |
Apple, Inc. | | | | | | | | |
2.650% 5/11/50 | | | 700,000 | | | | 742,942 | |
Dell International LLC/EMC Corp. | | | | | | | | |
6.020% 6/15/26 (a) | | | 2,702,000 | | | | 3,296,292 | |
Genpact Luxembourg Sarl | | | | | | | | |
3.700% STEP 4/01/22 | | | 2,400,000 | | | | 2,447,049 | |
Leidos, Inc. | | | | | | | | |
2.300% 2/15/31 (a) | | | 1,260,000 | | | | 1,282,931 | |
4.375% 5/15/30 (a) | | | 575,000 | | | | 688,534 | |
| | | | | | | | 8,457,748 | |
| | | Principal
Amount | | | Value | |
Diversified Financial Services — 3.4% |
AerCap Ireland Capital DAC/AerCap Global Aviation Trust | | | | | | | | |
4.500% 9/15/23 | | $ | 1,370,000 | | | $ | 1,485,385 | |
6.500% 7/15/25 | | | 645,000 | | | | 771,065 | |
Aircastle Ltd. | | | | | | | | |
4.400% 9/25/23 | | | 3,095,000 | | | | 3,279,646 | |
5.000% 4/01/23 | | | 1,750,000 | | | | 1,865,333 | |
Antares Holdings LP | | | | | | | | |
6.000% 8/15/23 (a) | | | 2,945,000 | | | | 3,003,379 | |
8.500% 5/18/25 (a) | | | 720,000 | | | | 776,155 | |
Ares Finance Co. LLC | | | | | | | | |
4.000% 10/08/24 (a) | | | 2,080,000 | | | | 2,234,062 | |
Avolon Holdings Funding Ltd. | | | | | | | | |
3.250% 2/15/27 (a) | | | 1,365,000 | | | | 1,392,734 | |
Brookfield Finance, Inc. | | | | | | | | |
4.350% 4/15/30 | | | 2,825,000 | | | | 3,383,119 | |
4.850% 3/29/29 | | | 1,752,000 | | | | 2,146,267 | |
GE Capital International Funding Co. Unlimited Co. | | | | | | | | |
4.418% 11/15/35 | | | 335,000 | | | | 399,838 | |
Global Aircraft Leasing Co. Ltd. | | | | | | | | |
6.500% 9/15/24 (a) | | | 1,398,937 | | | | 1,248,551 | |
Lazard Group LLC | | | | | | | | |
3.625% 3/01/27 | | | 1,253,000 | | | | 1,377,632 | |
4.500% 9/19/28 | | | 755,000 | | | | 896,059 | |
LeasePlan Corp. NV | | | | | | | | |
2.875% 10/24/24 (a) | | | 1,535,000 | | | | 1,621,970 | |
Legg Mason, Inc. | | | | | | | | |
5.625% 1/15/44 | | | 1,195,000 | | | | 1,714,770 | |
Park Aerospace Holdings Ltd. | | | | | | | | |
4.500% 3/15/23 (a) | | | 1,550,000 | | | | 1,624,284 | |
5.250% 8/15/22 (a) | | | 5,055,000 | | | | 5,305,272 | |
| | | | | | | | 34,525,521 | |
Electric — 1.3% |
Appalachian Power Co. | | | | | | | | |
4.500% 3/01/49 | | | 1,250,000 | | | | 1,629,651 | |
CMS Energy Corp. | | | | | | | | |
4.875% 3/01/44 | | | 780,000 | | | | 1,027,329 | |
Entergy Arkansas LLC | | | | | | | | |
2.650% 6/15/51 | | | 1,765,000 | | | | 1,809,556 | |
Entergy Louisiana LLC | | | | | | | | |
4.950% 1/15/45 | | | 1,005,000 | | | | 1,109,065 | |
FirstEnergy Transmission LLC | | | | | | | | |
4.550% 4/01/49 (a) | | | 880,000 | | | | 1,027,691 | |
Infraestructura Energetica Nova SAB de CV | | | | | | | | |
3.750% 1/14/28 (a) | | | 820,000 | | | | 874,325 | |
The accompanying notes are an integral part of the financial statements.
99
MML Managed Bond Fund – Portfolio of Investments (Continued) |
| | | Principal
Amount | | | Value | |
ITC Holdings Corp. | | | | | | | | |
2.950% 5/14/30 (a) | | $ | 895,000 | | | $ | 978,261 | |
Nevada Power Co. | | | | | | | | |
6.650% 4/01/36 | | | 550,000 | | | | 839,864 | |
Oncor Electric Delivery Co. | | | | | | | | |
7.500% 9/01/38 | | | 495,000 | | | | 824,371 | |
Pacific Gas and Electric Co. | | | | | | | | |
2.500% 2/01/31 | | | 775,000 | | | | 777,830 | |
Potomac Electric Power Co. | | | | | | | | |
4.150% 3/15/43 | | | 700,000 | | | | 883,496 | |
Xcel Energy, Inc. | | | | | | | | |
6.500% 7/01/36 | | | 1,250,000 | | | | 1,877,290 | |
| | | | | | | | 13,658,729 | |
Foods — 0.3% |
JBS USA LUX SA/JBS USA Food Co./JBS USA Finance, Inc. | | | | | | | | |
5.500% 1/15/30 (a) | | | 776,000 | | | | 891,438 | |
Mars, Inc. | | | | | | | | |
3.950% 4/01/49 (a) | | | 660,000 | | | | 841,014 | |
Smithfield Foods, Inc. | | | | | | | | |
3.000% 10/15/30 (a) | | | 943,000 | | | | 997,766 | |
| | | | | | | | 2,730,218 | |
Forest Products & Paper — 0.1% |
Fibria Overseas Finance Ltd. | | | | | | | | |
4.000% 1/14/25 | | | 1,250,000 | | | | 1,335,950 | |
Gas — 0.4% |
CenterPoint Energy Resources Corp. | | | | | | | | |
6.625% 11/01/37 | | | 1,250,000 | | | | 1,789,955 | |
NiSource, Inc. | | | | | | | | |
4.800% 2/15/44 | | | 1,035,000 | | | | 1,355,594 | |
5.800% 2/01/42 | | | 950,000 | | | | 1,327,912 | |
| | | | | | | | 4,473,461 | |
Health Care – Services — 0.2% |
City of Hope | | | | | | | | |
4.378% 8/15/48 | | | 1,050,000 | | | | 1,275,822 | |
Humana, Inc. | | | | | | | | |
4.800% 3/15/47 | | | 830,000 | | | | 1,108,719 | |
| | | | | | | | 2,384,541 | |
Insurance — 5.1% |
Allstate Corp. 3 mo. USD LIBOR + 2.938% | | | | | | | | |
5.750% VRN 8/15/53 | | | 4,260,000 | | | | 4,558,456 | |
American International Group, Inc. | | | | | | | | |
3.400% 6/30/30 | | | 745,000 | | | | 853,660 | |
4.500% 7/16/44 | | | 725,000 | | | | 929,002 | |
3 mo. USD LIBOR + 2.868% 5.750% VRN 4/01/48 | | | 2,860,000 | | | | 3,269,323 | |
| | | Principal
Amount | | | Value | |
AmTrust Financial Services, Inc. | | | | | | | | |
6.125% 8/15/23 | | $ | 3,370,000 | | | $ | 3,327,980 | |
Arch Capital Group US, Inc. | | | | | | | | |
5.144% 11/01/43 | | | 540,000 | | | | 727,145 | |
Athene Global Funding | | | | | | | | |
2.500% 1/14/25 (a) | | | 2,780,000 | | | | 2,912,150 | |
Athene Holding Ltd. | | | | | | | | |
4.125% 1/12/28 | | | 4,328,000 | | | | 4,823,090 | |
6.150% 4/03/30 | | | 200,000 | | | | 248,806 | |
AXIS Specialty Finance LLC | | | | | | | | |
3.900% 7/15/29 | | | 1,110,000 | | | | 1,223,998 | |
5 year CMT + 3.186% 4.900% VRN 1/15/40 | | | 1,315,000 | | | | 1,375,847 | |
AXIS Specialty Finance PLC | | | | | | | | |
4.000% 12/06/27 | | | 2,500,000 | | | | 2,787,497 | |
Brighthouse Financial, Inc. | | | | | | | | |
3.700% 6/22/27 | | | 1,175,000 | | | | 1,277,840 | |
4.700% 6/22/47 | | | 1,125,000 | | | | 1,174,776 | |
5.625% 5/15/30 | | | 1,055,000 | | | | 1,302,377 | |
CNO Financial Group, Inc. | | | | | | | | |
5.250% 5/30/25 | | | 2,621,000 | | | | 3,042,396 | |
Enstar Group Ltd. | | | | | | | | |
4.500% 3/10/22 | | | 920,000 | | | | 954,985 | |
4.950% 6/01/29 | | | 1,600,000 | | | | 1,809,868 | |
Equitable Holdings, Inc. | | | | | | | | |
5.000% 4/20/48 | | | 900,000 | | | | 1,185,437 | |
Markel Corp. | | | | | | | | |
3.350% 9/17/29 | | | 585,000 | | | | 657,743 | |
New York Life Insurance Co. | | | | | | | | |
3.750% 5/15/50 (a) | | | 510,000 | | | | 610,079 | |
Prudential Financial, Inc. | | | | | | | | |
5 year CMT + 3.035% 3.700% VRN 10/01/50 | | | 460,000 | | | | 486,579 | |
3 mo. USD LIBOR + 3.920% 5.625% VRN 6/15/43 | | | 1,025,000 | | | | 1,099,235 | |
3 mo. USD LIBOR + 2.665% 5.700% VRN 9/15/48 | | | 2,440,000 | | | | 2,817,017 | |
3 mo. USD LIBOR + 4.175% 5.875% VRN 9/15/42 | | | 550,000 | | | | 590,229 | |
Reinsurance Group of America, Inc. | | | | | | | | |
3.150% 6/15/30 | | | 1,160,000 | | | | 1,268,364 | |
Teachers Insurance & Annuity Association of America | | | | | | | | |
4.270% 5/15/47 (a) | | | 750,000 | | | | 937,847 | |
USF&G Capital I | | | | | | | | |
8.500% 12/15/45 (a) | | | 885,000 | | | | 1,425,681 | |
Voya Financial, Inc. 3 mo. USD LIBOR + 2.084% | | | | | | | | |
4.700% VRN 1/23/48 | | | 1,080,000 | | | | 1,122,120 | |
The accompanying notes are an integral part of the financial statements.
100
MML Managed Bond Fund – Portfolio of Investments (Continued) |
| | | Principal
Amount | | | Value | |
Willis North America, Inc. | | | | | | | | |
2.950% 9/15/29 | | $ | 905,000 | | | $ | 990,176 | |
XLIT Ltd. | | | | | | | | |
4.450% 3/31/25 | | | 2,250,000 | | | | 2,567,680 | |
| | | | | | | | 52,357,383 | |
Internet — 0.1% |
Amazon.com, Inc. | | | | | | | | |
4.050% 8/22/47 | | | 775,000 | | | | 1,023,350 | |
Investment Companies — 1.4% |
Ares Capital Corp. | | | | | | | | |
3.500% 2/10/23 | | | 2,600,000 | | | | 2,738,908 | |
4.200% 6/10/24 | | | 1,450,000 | | | | 1,565,183 | |
BlackRock TCP Capital Corp. | | | | | | | | |
3.900% 8/23/24 | | | 2,910,000 | | | | 3,040,489 | |
4.125% 8/11/22 | | | 2,870,000 | | | | 2,992,405 | |
Sixth Street Specialty Lending, Inc. | | | | | | | | |
3.875% 11/01/24 | | | 3,575,000 | | | | 3,685,311 | |
| | | | | | | | 14,022,296 | |
Iron & Steel — 0.2% |
Vale Overseas Ltd. | | | | | | | | |
6.250% 8/10/26 | | | 1,250,000 | | | | 1,550,000 | |
6.875% 11/21/36 | | | 630,000 | | | | 923,347 | |
| | | | | | | | 2,473,347 | |
Machinery – Diversified — 0.3% |
CNH Industrial Capital LLC | | | | | | | | |
1.950% 7/02/23 | | | 560,000 | | | | 576,490 | |
3.875% 10/15/21 | | | 2,280,000 | | | | 2,333,535 | |
| | | | | | | | 2,910,025 | |
Media — 1.2% |
Charter Communications Operating LLC/Charter Communications Operating Capital | | | | | | | | |
6.484% 10/23/45 | | | 735,000 | | | | 1,039,628 | |
Comcast Corp. | | | | | | | | |
3.450% 2/01/50 | | | 940,000 | | | | 1,109,262 | |
3.969% 11/01/47 | | | 630,000 | | | | 789,970 | |
4.750% 3/01/44 | | | 880,000 | | | | 1,206,001 | |
6.950% 8/15/37 | | | 265,000 | | | | 426,993 | |
Discovery Communications LLC | | | | | | | | |
4.000% 9/15/55 (a) | | | 1,210,000 | | | | 1,354,351 | |
4.650% 5/15/50 | | | 490,000 | | | | 612,865 | |
Time Warner Cable, Inc. | | | | | | | | |
6.750% 6/15/39 | | | 985,000 | | | | 1,401,858 | |
ViacomCBS, Inc. | | | | | | | | |
4.200% 5/19/32 | | | 1,472,000 | | | | 1,773,976 | |
4.950% 1/15/31 | | | 1,008,000 | | | | 1,265,169 | |
| | | Principal
Amount | | | Value | |
The Walt Disney Co. | | | | | | | | |
3.600% 1/13/51 | | $ | 1,515,000 | | | $ | 1,833,906 | |
| | | | | | | | 12,813,979 | |
Metal Fabricate & Hardware — 0.2% |
The Timken Co. | | | | | | | | |
4.500% 12/15/28 | | | 2,055,000 | | | | 2,301,413 | |
Mining — 0.5% |
Glencore Finance Canada Ltd. | | | | | | | | |
5.550% STEP 10/25/42 (a) | | | 894,000 | | | | 1,096,384 | |
Glencore Funding LLC | | | | | | | | |
3.875% 10/27/27 (a) | | | 975,000 | | | | 1,098,728 | |
4.625% 4/29/24 (a) | | | 1,565,000 | | | | 1,747,763 | |
Teck Resources Ltd. | | | | | | | | |
6.000% 8/15/40 | | | 850,000 | | | | 1,065,004 | |
| | | | | | | | 5,007,879 | |
Miscellaneous - Manufacturing — 0.1% |
General Electric Co. | | | | | | | | |
4.125% 10/09/42 | | | 113,000 | | | | 132,465 | |
6.875% 1/10/39 | | | 298,000 | | | | 438,681 | |
| | | | | | | | 571,146 | |
Oil & Gas — 2.6% |
BP Capital Markets PLC 5 year CMT + 4.036% | | | | | | | | |
4.375% VRN (b) | | | 1,500,000 | | | | 1,605,075 | |
Cenovus Energy, Inc. | | | | | | | | |
4.250% 4/15/27 | | | 1,125,000 | | | | 1,228,526 | |
6.750% 11/15/39 | | | 765,000 | | | | 1,011,402 | |
Devon Energy Corp. | | | | | | | | |
5.850% 12/15/25 | | | 1,510,000 | | | | 1,774,761 | |
EQT Corp. | | | | | | | | |
3.900% 10/01/27 | | | 4,510,000 | | | | 4,480,459 | |
7.875% STEP 2/01/25 | | | 1,725,000 | | | | 1,964,344 | |
Marathon Petroleum Corp. | | | | | | | | |
4.500% 4/01/48 | | | 510,000 | | | | 565,335 | |
6.500% 3/01/41 | | | 1,120,000 | | | | 1,503,712 | |
Occidental Petroleum Corp. | | | | | | | | |
6.600% 3/15/46 | | | 1,258,000 | | | | 1,276,461 | |
Ovintiv Exploration, Inc. | | | | | | | | |
5.375% 1/01/26 | | | 1,650,000 | | | | 1,770,694 | |
5.625% 7/01/24 | | | 975,000 | | | | 1,044,356 | |
5.750% 1/30/22 | | | 1,904,000 | | | | 1,977,593 | |
Ovintiv, Inc. | | | | | | | | |
6.500% 2/01/38 | | | 545,000 | | | | 608,577 | |
Patterson-UTI Energy, Inc. | | | | | | | | |
3.950% 2/01/28 | | | 1,680,000 | | | | 1,550,872 | |
Petroleos Mexicanos | | | | | | | | |
5.350% 2/12/28 | | | 665,000 | | | | 657,851 | |
6.375% 1/23/45 | | | 595,000 | | | | 545,318 | |
The accompanying notes are an integral part of the financial statements.
101
MML Managed Bond Fund – Portfolio of Investments (Continued) |
| | | Principal
Amount | | | Value | |
6.500% 3/13/27 | | $ | 585,000 | | | $ | 616,116 | |
6.625% 6/15/35 | | | 140,000 | | | | 138,600 | |
Saudi Arabian Oil Co. | | | | | | | | |
4.250% 4/16/39 (a) | | | 2,075,000 | | | | 2,433,118 | |
| | | | | | | | 26,753,170 | |
Oil & Gas Services — 0.4% |
Halliburton Co. | | | | | | | | |
5.000% 11/15/45 | | | 1,000,000 | | | | 1,188,774 | |
National Oilwell Varco, Inc. | | | | | | | | |
3.600% 12/01/29 | | | 1,570,000 | | | | 1,641,741 | |
3.950% 12/01/42 | | | 1,506,000 | | | | 1,532,039 | |
| | | | | | | | 4,362,554 | |
Packaging & Containers — 0.1% |
WRKCo, Inc. | | | | | | | | |
3.000% 6/15/33 | | | 655,000 | | | | 719,627 | |
Pharmaceuticals — 1.4% |
AbbVie, Inc. | | | | | | | | |
4.050% 11/21/39 | | | 1,045,000 | | | | 1,264,685 | |
4.700% 5/14/45 | | | 1,260,000 | | | | 1,648,351 | |
Bristol-Myers Squibb Co. | | | | | | | | |
4.350% 11/15/47 | | | 830,000 | | | | 1,117,909 | |
Cigna Corp. | | | | | | | | |
4.800% 7/15/46 | | | 880,000 | | | | 1,159,915 | |
CVS Health Corp. | | | | | | | | |
4.300% 3/25/28 | | | 240,000 | | | | 285,591 | |
5.050% 3/25/48 | | | 455,000 | | | | 616,652 | |
6.125% 9/15/39 | | | 560,000 | | | | 790,406 | |
CVS Pass-Through Trust | | | | | | | | |
5.926% 1/10/34 (a) | | | 1,035,925 | | | | 1,256,456 | |
7.507% 1/10/32 (a) | | | 882,768 | | | | 1,085,203 | |
McKesson Corp. | | | | | | | | |
6.000% 3/01/41 | | | 550,000 | | | | 762,534 | |
Takeda Pharmaceutical Co. Ltd. | | | | | | | | |
3.375% 7/09/60 | | | 970,000 | | | | 1,075,575 | |
Utah Acquisition Sub, Inc. | | | | | | | | |
5.250% 6/15/46 | | | 1,375,000 | | | | 1,801,360 | |
Viatris, Inc. | | | | | | | | |
2.700% 6/22/30 (a) | | | 1,235,000 | | | | 1,310,490 | |
| | | | | | | | 14,175,127 | |
Pipelines — 2.1% |
Energy Transfer Operating LP | | | | | | | | |
4.200% 4/15/27 | | | 1,085,000 | | | | 1,195,846 | |
6.125% 12/15/45 | | | 1,000,000 | | | | 1,181,297 | |
3 mo. USD LIBOR + 4.028% 6.250% VRN (b) | | | 2,370,000 | | | | 1,884,150 | |
EnLink Midstream Partners LP | | | | | | | | |
4.150% 6/01/25 | | | 2,924,000 | | | | 2,850,900 | |
4.850% 7/15/26 | | | 951,000 | | | | 928,499 | |
| | | Principal
Amount | | | Value | |
Enterprise Products Operating LLC | | | | | | | | |
3 mo. USD LIBOR + 3.033% 5.250% VRN 8/16/77 | | $ | 1,775,000 | | | $ | 1,799,617 | |
3 mo. USD LIBOR + 2.570% 5.375% VRN 2/15/78 | | | 1,205,000 | | | | 1,217,643 | |
EQM Midstream Partners LP | | | | | | | | |
4.750% 7/15/23 | | | 2,325,000 | | | | 2,444,691 | |
MPLX LP | | | | | | | | |
4.500% 4/15/38 | | | 595,000 | | | | 680,570 | |
3 mo. USD LIBOR + 4.652% 6.875% VRN (b) | | | 1,775,000 | | | | 1,712,875 | |
Plains All American Pipeline LP 3 mo. USD LIBOR + 4.110% | | | | | | | | |
6.125% VRN (b) | | | 2,345,000 | | | | 1,905,312 | |
Plains All American Pipeline LP/PAA Finance Corp. | | | | | | | | |
3.800% 9/15/30 | | | 1,150,000 | | | | 1,236,309 | |
4.500% 12/15/26 | | | 617,000 | | | | 691,109 | |
4.700% 6/15/44 | | | 1,195,000 | | | | 1,239,106 | |
6.650% 1/15/37 | | | 375,000 | | | | 457,764 | |
Sunoco Logistics Partners Operations LP | | | | | | | | |
5.300% 4/01/44 | | | 525,000 | | | | 567,329 | |
| | | | | | | | 21,993,017 | |
Private Equity — 0.7% |
Apollo Management Holdings LP 5 year CMT + 3.266% | | | | | | | | |
4.950% VRN 1/14/50 (a) | | | 805,000 | | | | 822,705 | |
Carlyle Finance Subsidiary LLC | | | | | | | | |
3.500% 9/19/29 (a) | | | 1,100,000 | | | | 1,208,905 | |
Hercules Capital, Inc. | | | | | | | | |
4.625% 10/23/22 | | | 2,910,000 | | | | 2,958,246 | |
KKR Group Finance Co. VI LLC | | | | | | | | |
3.750% 7/01/29 (a) | | | 1,260,000 | | | | 1,466,140 | |
KKR Group Finance Co. VIII LLC | | | | | | | | |
3.500% 8/25/50 (a) | | | 710,000 | | | | 787,960 | |
| | | | | | | | 7,243,956 | |
Real Estate Investment Trusts (REITS) — 2.4% |
Agree LP | | | | | | | | |
2.900% 10/01/30 | | | 470,000 | | | | 499,277 | |
American Tower Trust #1 | | | | | | | | |
3.652% 3/15/48 (a) | | | 1,910,000 | | | | 2,099,583 | |
Crown Castle International Corp. | | | | | | | | |
5.200% 2/15/49 | | | 120,000 | | | | 163,413 | |
Highwoods Realty LP | | | | | | | | |
4.125% 3/15/28 | | | 475,000 | | | | 534,265 | |
Host Hotels & Resorts LP | | | | | | | | |
3.500% 9/15/30 | | | 2,120,000 | | | | 2,233,512 | |
The accompanying notes are an integral part of the financial statements.
102
MML Managed Bond Fund – Portfolio of Investments (Continued) |
| | | Principal
Amount | | | Value | |
SBA Tower Trust | | | | | | | | |
1.884% 7/15/50 (a) | | $ | 1,441,000 | | | $ | 1,483,111 | |
Service Properties Trust | | | | | | | | |
4.500% 6/15/23 | | | 760,000 | | | | 763,800 | |
4.950% 10/01/29 | | | 1,155,000 | | | | 1,157,888 | |
Spirit Realty LP | | | | | | | | |
3.200% 1/15/27 | | | 2,280,000 | | | | 2,421,894 | |
3.400% 1/15/30 | | | 515,000 | | | | 558,531 | |
4.000% 7/15/29 | | | 1,290,000 | | | | 1,452,408 | |
4.450% 9/15/26 | | | 133,000 | | | | 150,055 | |
STORE Capital Corp. | | | | | | | | |
2.750% 11/18/30 | | | 370,000 | | | | 376,282 | |
4.625% 3/15/29 | | | 1,881,000 | | | | 2,182,096 | |
Tanger Properties LP | | | | | | | | |
3.875% 12/01/23 | | | 1,448,000 | | | | 1,503,975 | |
VEREIT Operating Partnership LP | | | | | | | | |
2.850% 12/15/32 | | | 95,000 | | | | 99,337 | |
3.100% 12/15/29 | | | 2,790,000 | | | | 3,010,123 | |
3.400% 1/15/28 | | | 365,000 | | | | 402,939 | |
4.625% 11/01/25 | | | 2,260,000 | | | | 2,601,276 | |
WP Carey, Inc. | | | | | | | | |
2.400% 2/01/31 | | | 470,000 | | | | 488,118 | |
4.250% 10/01/26 | | | 757,000 | | | | 871,204 | |
| | | | | | | | 25,053,087 | |
Retail — 0.6% |
Advance Auto Parts, Inc. | | | | | | | | |
1.750% 10/01/27 | | | 315,000 | | | | 319,913 | |
AutoZone, Inc. | | | | | | | | |
1.650% 1/15/31 | | | 975,000 | | | | 967,029 | |
El Puerto de Liverpool SAB de CV | | | | | | | | |
3.950% 10/02/24 (a) | | | 2,620,000 | | | | 2,813,251 | |
Starbucks Corp. | | | | | | | | |
2.550% 11/15/30 | | | 1,595,000 | | | | 1,724,984 | |
| | | | | | | | 5,825,177 | |
Semiconductors — 0.2% |
Microchip Technology, Inc. | | | | | | | | |
0.972% 2/15/24 (a) | | | 1,685,000 | | | | 1,689,125 | |
Software — 0.4% |
Broadridge Financial Solutions, Inc. | | | | | | | | |
2.900% 12/01/29 | | | 1,210,000 | | | | 1,325,410 | |
Microsoft Corp. | | | | | | | | |
4.450% 11/03/45 | | | 2,064,000 | | | | 2,929,173 | |
| | | | | | | | 4,254,583 | |
Telecommunications — 1.6% |
AT&T, Inc. | | | | | | | | |
1.650% 2/01/28 | | | 680,000 | | | | 693,800 | |
3.500% 9/15/53 (a) | | | 1,578,000 | | | | 1,580,316 | |
3.550% 9/15/55 (a) | | | 5,153,000 | | | | 5,135,507 | |
| | | Principal
Amount | | | Value | |
Crown Castle Towers LLC | | | | | | | | |
3.222% 5/15/42 (a) | | $ | 1,700,000 | | | $ | 1,718,085 | |
4.241% 7/15/48 (a) | | | 2,750,000 | | | | 3,170,966 | |
Qwest Corp | | | | | | | | |
6.750% 12/01/21 | | | 725,000 | | | | 758,459 | |
Telefonica Emisiones SAU | | | | | | | | |
4.665% 3/06/38 | | | 1,105,000 | | | | 1,326,530 | |
Verizon Communications, Inc. | | | | | | | | |
2.875% 11/20/50 | | | 755,000 | | | | 760,741 | |
2.987% 10/30/56 (a) | | | 1,257,000 | | | | 1,265,312 | |
| | | | | | | | 16,409,716 | |
Transportation — 0.3% |
Autoridad del Canal de Panama | | | | | | | | |
4.950% 7/29/35 (a) | | | 1,050,000 | | | | 1,325,636 | |
CSX Corp. | | | | | | | | |
4.750% 11/15/48 | | | 650,000 | | | | 891,593 | |
Norfolk Southern Corp. | | | | | | | | |
4.050% 8/15/52 | | | 860,000 | | | | 1,094,802 | |
| | | | | | | | 3,312,031 | |
| | | | | | | | | |
TOTAL CORPORATE DEBT (Cost $365,744,532) | | | | | | | 401,282,706 | |
| | | | | | | | | |
MUNICIPAL OBLIGATIONS — 0.3% |
JobsOhio Beverage System Series B, Revenue Bonds | | | | | | | | |
4.532% 1/01/35 | | | 1,950,000 | | | | 2,499,295 | |
| | | | | | | | | |
TOTAL MUNICIPAL OBLIGATIONS (Cost $2,074,878) | | | | | | | 2,499,295 | |
| | | | | | | | | |
NON-U.S. GOVERNMENT AGENCY OBLIGATIONS — 32.7% |
Automobile Asset-Backed Securities — 1.4% |
AmeriCredit Automobile Receivables Trust, Series 2020-3, Class D | | | | | | | | |
1.490% 9/18/26 | | | 422,000 | | | | 422,574 | |
Avis Budget Rental Car Funding AESOP LLC, Series 2019-1A, Class C | | | | | | | | |
4.530% 3/20/23 (a) | | | 1,271,000 | | | | 1,283,789 | |
CarMax Auto Owner Trust | | | | | | | | |
Series 2020-4, Class D, 1.750% 4/15/27 | | | 3,900,000 | | | | 3,899,042 | |
Series 2019-3, Class D, 2.850% 1/15/26 | | | 1,974,000 | | | | 2,032,213 | |
Carvana Auto Receivables Trust, Series 2019-4A, Class D | | | | | | | | |
3.070% 7/15/25 (a) | | | 1,625,000 | | | | 1,671,206 | |
The accompanying notes are an integral part of the financial statements.
103
MML Managed Bond Fund – Portfolio of Investments (Continued) |
| | | Principal
Amount | | | Value | |
OneMain Direct Auto Receivables Trust, Series 2019-1A, Class B | | | | | | | | |
3.950% 11/14/28 (a) | | $ | 1,774,000 | | | $ | 1,936,561 | |
Santander Drive Auto Receivables Trust, Series 2020-4, Class D | | | | | | | | |
1.480% 1/15/27 | | | 504,000 | | | | 504,623 | |
Santander Revolving Auto Loan Trust | | | | | | | | |
Series 2019-A, Class B, 2.800% 1/26/32 (a) | | | 856,000 | | | | 896,505 | |
Series 2019-A, Class C, 3.000% 1/26/32 (a) | | | 561,000 | | | | 589,064 | |
Series 2019-A, Class D, 3.450% 1/26/32 (a) | | | 1,087,000 | | | | 1,138,133 | |
| | | | | | | | 14,373,710 | |
Commercial Mortgage-Backed Securities — 6.2% |
Aventura Mall Trust, Series 2018-AVM, Class C, | | | | | | | | |
4.112% VRN 7/05/40 (a) (c) | | | 4,270,000 | | | | 3,954,490 | |
BAMLL Commercial Mortgage Securities Trust, Series 2018-DSNY, Class C, 1 mo. USD LIBOR + 1.350% | | | | | | | | |
1.509% FRN 9/15/34 (a) | | | 670,000 | | | | 648,325 | |
BANK | | | | | | | | |
Series 2020-BN30, Class MCDF, 2.918% VRN 12/10/53 (c) | | | 2,100,000 | | | | 2,029,158 | |
Series 2019-BN17, Class B, 4.128% VRN 4/15/52 (c) | | | 441,000 | | | | 506,667 | |
Series 2019-BN16, Class AS, 4.267% 2/15/52 | | | 665,833 | | | | 783,986 | |
Series 2019-BN16, Class B, 4.438% VRN 2/15/52 (c) | | | 547,420 | | | | 635,288 | |
BBCMS Mortgage Trust | | | | | | | | |
Series 2020-C7, Class AS, 2.444% 4/15/53 | | | 1,326,000 | | | | 1,403,166 | |
Series 2018-CHRS, Class B, 4.267% VRN 8/05/38 (a) (c) | | | 2,250,000 | | | | 2,053,364 | |
Series 2018-CHRS, Class C, 4.267% VRN 8/05/38 (a) (c) | | | 1,610,000 | | | | 1,363,989 | |
Series 2018-CHRS, Class D, 4.267% VRN 8/05/38 (a) (c) | | | 1,370,000 | | | | 1,058,610 | |
Bear Stearns Commercial Mortgage Securities, Series 2007-T26, Class AM, | | | | | | | | |
5.432% VRN 1/12/45 (c) | | | 361,164 | | | | 357,672 | |
BHMS Mortgage Trust | | | | | | | | |
Series 2018-ATLS, Class A, 1 mo. USD LIBOR + 1.250% 1.409% FRN 7/15/35 (a) | | | 4,450,000 | | | | 4,339,295 | |
Series 2018-ATLS, Class B, 1 mo. USD LIBOR + 1.500% 1.659% FRN 7/15/35 (a) | | | 4,950,000 | | | | 4,752,122 | |
| | | Principal
Amount | | | Value | |
BX Commercial Mortgage Trust | | | | | | | | |
Series 2020-BXLP, Class E, 1 mo. USD LIBOR + 1.600% 1.759% FRN 12/15/36 (a) | | $ | 4,113,235 | | | $ | 4,042,547 | |
Series 2018-IND, Class E, 1 mo. USD LIBOR + 1.700% 1.859% FRN 11/15/35 (a) | | | 1,876,000 | | | | 1,870,779 | |
Series 2019-XL, Class E, 1 mo. USD LIBOR + 1.800% 1.959% FRN 10/15/36 (a) | | | 1,641,336 | | | | 1,631,637 | |
Series 2019-XL, Class F, 1 mo. USD LIBOR + 2.000% 2.159% FRN 10/15/36 (a) | | | 1,982,134 | | | | 1,955,564 | |
CAMB Commercial Mortgage Trust, Series 2019-LIFE, Class D, 1 mo. USD LIBOR + 1.750% | | | | | | | | |
1.909% FRN 12/15/37 (a) | | | 898,516 | | | | 898,589 | |
Century Plaza Towers | | | | | | | | |
Series 2019-CPT, Class D, 2.997% VRN 11/13/39 (a) (c) | | | 982,000 | | | | 981,643 | |
Series 2019-CPT, Class E, 2.997% VRN 11/13/39 (a) (c) | | | 1,556,000 | | | | 1,497,069 | |
Cold Storage Trust, Series 2020-ICE5, Class D, 1 mo. USD LIBOR + 2.100% | | | | | | | | |
2.259% FRN 11/15/37 (a) | | | 3,500,000 | | | | 3,501,089 | |
COMM 2020-CX Mortgage Trust, Series 2020-CX, Class B | | | | | | | | |
2.446% 11/10/46 (a) | | | 1,056,000 | | | | 1,097,771 | |
Commercial Mortgage Pass-Through Certificates | | | | | | | | |
Series 2012-CR4, Class B, 3.703% 10/15/45 (a) | | | 1,060,000 | | | | 729,726 | |
Series 2014-UBS2, Class AM, 4.199% 3/10/47 | | | 1,375,000 | | | | 1,479,436 | |
Series 2015-CR23, Class C, 4.291% VRN 5/10/48 (c) | | | 1,000,000 | | | | 1,046,194 | |
Series 2014-LC17, Class C, 4.553% VRN 10/10/47 (c) | | | 2,908,000 | | | | 2,961,063 | |
Credit Suisse Mortgage Capital Certificates, Series 2019-ICE4, Class E, 1 mo. USD LIBOR + 2.150% | | | | | | | | |
2.309% FRN 5/15/36 (a) | | | 570,000 | | | | 561,459 | |
Jackson Park Trust, Series 2019-LIC, Class C, | | | | | | | | |
3.131% VRN 10/14/39 (a) (c) | | | 2,300,000 | | | | 2,288,745 | |
KNDL Mortgage Trust, Series 2019-KNSQ, Class E, 1 mo. USD LIBOR + 1.800% | | | | | | | | |
1.959% FRN 5/15/36 (a) | | | 1,505,000 | | | | 1,497,621 | |
The accompanying notes are an integral part of the financial statements.
104
MML Managed Bond Fund – Portfolio of Investments (Continued) |
| | | Principal
Amount | | | Value | |
Manhattan West, Series 2020-1MW, Class B, | | | | | | | | |
2.335% VRN 9/10/39 (a) (c) | | $ | 2,122,000 | | | $ | 2,217,181 | |
MFT Trust | | | | | | | | |
Series 2020-ABC, Class A, 3.358% 2/10/42 (a) | | | 919,000 | | | | 966,759 | |
Series 2020-ABC, Class B, 3.477% VRN 2/10/42 (a) (c) | | | 1,003,000 | | | | 1,040,472 | |
MKT Mortgage Trust | | | | | | | | |
Series 2020-525M, Class D, 2.941% VRN 2/12/40 (a) (c) | | | 475,000 | | | | 473,835 | |
Series 2020-525M, Class E, 2.941% VRN 2/12/40 (a) (c) | | | 976,000 | | | | 936,121 | |
Morgan Stanley Capital I Trust | | | | | | | | |
Series 2019-L2, Class AS, 4.272% 3/15/52 | | | 1,950,000 | | | | 2,251,604 | |
Series 2018-H3, Class B, 4.620% VRN 7/15/51 (c) | | | 760,000 | | | | 877,809 | |
Series 2011-C2, Class B, 5.200% VRN 6/15/44 (a) (c) | | | 1,325,000 | | | | 1,336,178 | |
Wells Fargo Commercial Mortgage Trust | | | | | | | | |
Series 2018-C45, Class AS, 4.405% VRN 6/15/51 (c) | | | 1,450,000 | | | | 1,690,895 | |
Series 2018-C45, Class B, 4.556% 6/16/51 | | | 400,000 | | | | 464,968 | |
| | | | | | | | 64,182,886 | |
Other Asset-Backed Securities — 15.8% |
321 Henderson Receivables LLC, Series 2015-1A, Class A | | | | | | | | |
3.260% 9/15/72 (a) | | | 1,821,047 | | | | 1,990,840 | |
522 Funding CLO I Ltd., Series 2018-2A, Class C, 3 mo. USD LIBOR + 2.250% | | | | | | | | |
2.468% FRN 10/20/31 (a) | | | 820,000 | | | | 813,301 | |
AASET Trust | | | | | | | | |
Series 2020-1A, Class A, 3.351% 1/16/40 (a) | | | 1,517,578 | | | | 1,428,510 | |
Series 2019-1, Class A, 3.844% 5/15/39 (a) | | | 1,664,975 | | | | 1,572,389 | |
Series 2018-2A, Class A, 4.454% 11/18/38 (a) | | | 994,046 | | | | 939,095 | |
Adams Outdoor Advertising LP, Series 2018-1, Class A | | | | | | | | |
4.810% 11/15/48 (a) | | | 1,905,559 | | | | 2,009,321 | |
AGL CLO 7 Ltd., Series 2020-7A, Class A1, 3 mo. USD LIBOR + 1.800% | | | | | | | | |
2.050% FRN 7/15/31 (a) | | | 375,000 | | | | 376,298 | |
| | | Principal
Amount | | | Value | |
AIMCO CLO, Series 2019-10A, Class C, 3 mo. USD LIBOR + 2.450% | | | | | | | | |
2.666% FRN 7/22/32 (a) | | $ | 2,000,000 | | | $ | 1,998,576 | |
Allegro CLO X Ltd., Series 2019-1A, Class C, 3 mo. USD LIBOR + 2.750% | | | | | | | | |
2.968% FRN 4/20/32 (a) | | | 2,200,000 | | | | 2,200,979 | |
Anchorage Capital CLO Ltd., Series 2020-15A, Class A, 3 mo. USD LIBOR + 1.850% | | | | | | | | |
2.089% FRN 7/20/31 (a) | | | 1,500,000 | | | | 1,506,072 | |
Atrium XV, Series 15A, Class B, 3 mo. USD LIBOR + 1.750% | | | | | | | | |
1.959% FRN 1/23/31 (a) | | | 1,190,000 | | | | 1,188,543 | |
Avery Point VII CLO Ltd., Series 2015-7A, Class DR, 3 mo. USD LIBOR + 3.600% | | | | | | | | |
3.837% FRN 1/15/28 (a) | | | 1,000,000 | | | | 995,015 | |
Ballyrock CLO Ltd., Series 2019-2A, Class C, 3 mo. USD LIBOR + 4.100% | | | | | | | | |
4.324% FRN 11/20/30 (a) | | | 400,000 | | | | 400,429 | |
Benefit Street Partners CLO X Ltd., Series 2016-10A, Class CR, 3 mo. USD LIBOR + 3.500% | | | | | | | | |
3.737% FRN 1/15/29 (a) | | | 500,000 | | | | 493,003 | |
Benefit Street Partners CLO XVIII Ltd., Series 2019-18A, Class B, 3 mo. USD LIBOR + 1.950% | | | | | | | | |
2.187% FRN 10/15/32 (a) | | | 500,000 | | | | 500,592 | |
BRE Grand Islander Timeshare Issuer LLC, Series 2017-1A, Class A | | | | | | | | |
2.940% 5/25/29 (a) | | | 458,988 | | | | 460,913 | |
Business Jet Securities 2020-1 LLC, Series 2020-1A, Class A | | | | | | | | |
2.981% 11/15/35 (a) | | | 757,216 | | | | 767,427 | |
Canyon Capital CLO 2019-2 Ltd., Series 2019-2A, Class A, 3 mo. USD LIBOR + 1.370% | | | | | | | | |
1.607% FRN 10/15/32 (a) | | | 1,400,000 | | | | 1,401,442 | |
Canyon Capital CLO Ltd., Series 2019-2A, Class C, 3 mo. USD LIBOR + 2.750% | | | | | | | | |
2.987% FRN 10/15/32 (a) | | | 250,000 | | | | 250,274 | |
Capital Automotive REIT | | | | | | | | |
Series 2020-1A, Class A3, 3.250% 2/15/50 (a) | | | 473,478 | | | | 478,926 | |
Series 2014-1A, Class A, 3.660% 10/15/44 (a) | | | 831,278 | | | | 830,838 | |
Series 2020-1A, Class A6, 3.810% 2/15/50 (a) | | | 397,834 | | | | 407,302 | |
The accompanying notes are an integral part of the financial statements.
105
MML Managed Bond Fund – Portfolio of Investments (Continued) |
| | | Principal
Amount | | | Value | |
Series 2017-1A, Class A2, 4.180% 4/15/47 (a) | | $ | 919,408 | | | $ | 921,526 | |
Carlyle Global Market Strategies CLO Ltd., Series 2015-3A, Class CR, 3 mo. USD LIBOR + 2.850% | | | | | | | | |
3.072% FRN 7/28/28 (a) | | | 330,000 | | | | 320,246 | |
Castlelake Aircraft Securitization Trust, Series 2019-1A, Class A | | | | | | | | |
3.967% 4/15/39 (a) | | | 1,271,632 | | | | 1,209,314 | |
Castlelake Aircraft Structured Trust, Series 2018-1, Class A | | | | | | | | |
4.125% 6/15/43 (a) | | | 1,249,760 | | | | 1,187,902 | |
CBAM Ltd. | | | | | | | | |
Series 2019-10A, Class B, 3 mo. USD LIBOR + 2.050% 2.268% FRN 4/20/32 (a) | | | 1,900,000 | | | | 1,902,417 | |
Series 2018-6A, Class B1R, 3 mo. USD LIBOR + 2.100% 2.337% FRN 1/15/31 (a) | | | 900,000 | | | | 900,165 | |
Cedar Funding IX CLO Ltd., Series 2018-9A, Class A1, 3 mo. USD LIBOR + .980% | | | | | | | | |
1.198% FRN 4/20/31 (a) | | | 750,000 | | | | 747,437 | |
CF Hippolyta LLC | | | | | | | | |
Series 2020-1, Class A1, 1.690% 7/15/60 (a) | | | 1,145,255 | | | | 1,166,574 | |
Series 2020-1, Class B1, 2.280% 7/15/60 (a) | | | 522,045 | | | | 530,121 | |
CIFC Funding Ltd. | | | | | | | | |
Series 2017-5A, Class A1, 3 mo. USD LIBOR + 1.180% 1.398% FRN 11/16/30 (a) | | | 2,330,000 | | | | 2,329,222 | |
Series 2020-1A, Class A1, 3 mo. USD LIBOR + 1.700% 1.937% FRN 7/15/32 (a) | | | 1,000,000 | | | | 1,003,139 | |
Clear Creek CLO Ltd., Series 2015-1A, Class AR, 3 mo. USD LIBOR + 1.200% | | | | | | | | |
1.418% FRN 10/20/30 (a) | | | 2,040,000 | | | | 2,037,987 | |
CLI Funding VI LLC, Series 2020-3A, Class A | | | | | | | | |
2.070% 10/18/45 (a) | | | 1,604,625 | | | | 1,598,423 | |
DB Master Finance LLC, Series 2019-1A, Class A23 | | | | | | | | |
4.352% 5/20/49 (a) | | | 1,538,525 | | | | 1,661,094 | |
Domino’s Pizza Master Issuer LLC | | | | | | | | |
Series 2019-1A, Class A2, 3.668% 10/25/49 (a) | | | 1,089,000 | | | | 1,153,474 | |
Series 2017-1A, Class A23, 4.118% 7/25/47 (a) | | | 756,600 | | | | 809,571 | |
Series 2015-1A, Class A2II, 4.474% 10/25/45 (a) | | | 2,968,250 | | | | 3,138,677 | |
| | | Principal
Amount | | | Value | |
Dryden 72 CLO Ltd., Series 2019-72A, Class B, 3 mo. USD LIBOR + 1.900% | | | | | | | | |
2.121% FRN 5/15/32 (a) | | $ | 1,500,000 | | | $ | 1,500,614 | |
Eaton Vance CLO Ltd. | | | | | | | | |
Series 2020-1A, Class C, 3 mo. USD LIBOR + 2.800% 0.000% FRN 10/15/30 (a) | | | 350,000 | | | | 350,963 | |
Series 2018-1A, Class B, 3 mo. USD LIBOR + 1.750% 1.987% FRN 10/15/30 (a) | | | 1,700,000 | | | | 1,700,007 | |
Series 2019-1A, Class B, 3 mo. USD LIBOR + 1.950% 2.187% FRN 4/15/31 (a) | | | 1,800,000 | | | | 1,802,522 | |
Elmwood CLO II Ltd., Series 2019-2A, Class A, 3 mo. USD LIBOR + 1.450% | | | | | | | | |
1.668% FRN 4/20/31 (a) | | | 2,900,000 | | | | 2,902,552 | |
Elmwood CLO III Ltd., Series 2019-3A, Class B, 3 mo. USD LIBOR + 1.950% | | | | | | | | |
2.187% FRN 10/15/32 (a) | | | 350,000 | | | | 350,803 | |
FCI Funding LLC, Series 2019-1A, Class A | | | | | | | | |
3.630% 2/18/31 (a) | | | 238,839 | | | | 242,546 | |
Flatiron CLO Ltd. | | | | | | | | |
Series 2019-1A, Class B, 3 mo. USD LIBOR + 1.900% 2.121% FRN 11/16/32 (a) | | | 350,000 | | | | 350,552 | |
Series 2019-1A, Class C, 3 mo. USD LIBOR + 2.700% 2.921% FRN 11/16/32 (a) | | | 250,000 | | | | 250,610 | |
Global SC Finance SRL, Series 2014-1A, Class A1 | | | | | | | | |
3.190% 7/17/29 (a) | | | 179,167 | | | | 178,270 | |
Goodgreen Trust | | | | | | | | |
Series 2019-2A, Class A, 2.760% 10/15/54 (a) | | | 2,658,768 | | | | 2,748,076 | |
Series 2016-1A, Class A, 3.230% 10/15/52 (a) | | | 1,492,190 | | | | 1,537,242 | |
Series 2017-1A, Class A, 3.740% 10/15/52 (a) | | | 704,582 | | | | 742,829 | |
Series 2019-1A, Class A, 3.860% 10/15/54 (a) | | | 1,222,730 | | | | 1,292,362 | |
Harbor Park CLO Ltd., Series 2018-1A, Class B1, 3 mo. USD LIBOR + 1.700% | | | | | | | | |
1.918% FRN 1/20/31 (a) | | | 1,290,000 | | | | 1,290,059 | |
Helios Issuer LLC, Series 2017-1A, Class A | | | | | | | | |
4.940% 9/20/49 (a) | | | 1,478,654 | | | | 1,546,124 | |
The accompanying notes are an integral part of the financial statements.
106
MML Managed Bond Fund – Portfolio of Investments (Continued) |
| | | Principal
Amount | | | Value | |
Hero Funding Trust | | | | | | | | |
Series 2016-3A, Class A1, 3.080% 9/20/42 (a) | | $ | 780,050 | | | $ | 800,638 | |
Series 2017-3A, Class A1, 3.190% 9/20/48 (a) | | | 813,530 | | | | 837,952 | |
Series 2017-2A, Class A1, 3.280% 9/20/48 (a) | | | 241,039 | | | | 249,069 | |
Series 2016-4A, Class A1, 3.570% 9/20/47 (a) | | | 966,072 | | | | 1,012,834 | |
Series 2017-2A, Class A2, 4.070% 9/20/48 (a) | | | 193,861 | | | | 202,151 | |
Series 2018-1A, Class A2, 4.670% 9/20/48 (a) | | | 1,459,545 | | | | 1,562,661 | |
Horizon Aircraft Finance Ltd. | | | | | | | | |
Series 2019-2, Class A, 3.425% 11/15/39 (a) | | | 2,862,548 | | | | 2,765,976 | |
Series 2019-1, Class A, 3.721% 7/15/39 (a) | | | 1,310,595 | | | | 1,264,344 | |
Series 2018-1, Class A, 4.458% 12/15/38 (a) | | | 940,892 | | | | 908,830 | |
HPS Loan Management 15-2019 Ltd., Series 15A-19, Class A1, 3 mo. USD LIBOR + 1.320% | | | | | | | | |
1.536% FRN 7/22/32 (a) | | | 1,300,000 | | | | 1,300,725 | |
ICG US CLO Ltd., Series 2019-1A, Class A1A, 3 mo. USD LIBOR + 1.380% | | | | | | | | |
1.595% FRN 10/26/32 (a) | | | 750,000 | | | | 750,986 | |
J.G. Wentworth LLC, Series 2018-2A, Class A | | | | | | | | |
3.960% 10/15/75 (a) | | | 1,355,028 | | | | 1,556,001 | |
KKR CLO Ltd., Series 28A, Class A, 3 mo. USD LIBOR + 1.140% | | | | | | | | |
1.357% FRN 3/15/31 (a) | | | 900,000 | | | | 897,708 | |
KREF Ltd., Series 2018-FL1, Class C, 1 mo. USD LIBOR + 2.000% | | | | | | | | |
2.153% FRN 6/15/36 (a) | | | 1,670,000 | | | | 1,641,564 | |
Labrador Aviation Finance Ltd., Series 2016-1A, Class A1 | | | | | | | | |
4.300% 1/15/42 (a) | | | 2,151,381 | | | | 2,033,366 | |
Lunar Aircraft Ltd., Series 2020-1A, Class A | | | | | | | | |
3.376% 2/15/45 (a) | | | 945,046 | | | | 892,542 | |
MACH 1 Cayman Ltd., Series 2019-1, Class A | | | | | | | | |
3.474% 10/15/39 (a) | | | 1,948,759 | | | | 1,882,588 | |
Madison Park Funding Ltd. | | | | | | | | |
Series 2018-28A, Class B, 3 mo. USD LIBOR + 1.600% 1.837% FRN 7/15/30 (a) | | | 1,665,000 | | | | 1,655,604 | |
| | | Principal
Amount | | | Value | |
Series 2018-29A, Class C, 3 mo. USD LIBOR + 2.200% 2.418% FRN 10/18/30 (a) | | $ | 620,000 | | | $ | 614,523 | |
Magnetite XXVI Ltd., Series 2020-26A, Class A, 3 mo. USD LIBOR + 1.750% | | | | | | | | |
1.987% FRN 7/15/30 (a) | | | 1,500,000 | | | | 1,504,871 | |
Magnetite XXVII Ltd., Series 2020-27A, Class C, 3 mo. USD LIBOR + 2.650% | | | | | | | | |
2.862% FRN 7/20/33 (a) | | | 450,000 | | | | 450,989 | |
Mosaic Solar Loans LLC | | | | | | | | |
Series 2018-1A, Class A, 4.010% 6/22/43 (a) | | | 273,643 | | | | 295,360 | |
Series 2017-1A, Class A, 4.450% 6/20/42 (a) | | | 281,815 | | | | 303,071 | |
MP CLO III Ltd., Series 2013-1A, Class AR, 3 mo. USD LIBOR + 1.250% | | | | | | | | |
1.468% FRN 10/20/30 (a) | | | 1,750,000 | | | | 1,743,621 | |
MVW Owner Trust, Series 2017-1A, Class A | | | | | | | | |
2.420% 12/20/34 (a) | | | 150,531 | | | | 153,342 | |
NP SPE LLC, Series 2017-1A, Class A2 | | | | | | | | |
4.219% 10/21/47 (a) | | | 2,260,000 | | | | 2,399,278 | |
Oak Street Investment Grade Net Lease Fund, Series 2020-1A, Class A5 | | | | | | | | |
3.390% 11/20/50 (a) | | | 1,200,000 | | | | 1,198,390 | |
OCP CLO 2018-15 Ltd., Series 2018-15A, Class A1, | | | | | | | | |
1.318% FRN 7/20/31 (a) (c) | | | 250,000 | | | | 249,423 | |
OHA Credit Funding Ltd. | | | | | | | | |
Series 2019-4A, Class A1, 3 mo. USD LIBOR + 1.330% 1.546% FRN 10/22/32 (a) | | | 1,000,000 | | | | 1,001,217 | |
Series 2019-4A, Class C, 3 mo. USD LIBOR + 2.650% 2.866% FRN 10/22/32 (a) | | | 500,000 | | | | 501,573 | |
OHA Loan Funding 2015-1 Ltd., Series 2015-1A, Class A1R2, 3 mo. USD LIBOR + 1.340% | | | | | | | | |
1.561% FRN 11/15/32 (a) | | | 550,000 | | | | 550,626 | |
OneMain Financial Issuance Trust | | | | | | | | |
Series 2020-2A, Class B, 2.210% 9/14/35 (a) | | | 396,000 | | | | 401,425 | |
Series 2019-2A, Class A, 3.140% 10/14/36 (a) | | | 8,400,000 | | | | 9,067,391 | |
Oxford Finance Funding Trust, Series 2020-1A, Class A2 | | | | | | | | |
3.101% 2/15/28 (a) | | | 1,536,000 | | | | 1,570,625 | |
The accompanying notes are an integral part of the financial statements.
107
MML Managed Bond Fund – Portfolio of Investments (Continued) |
| | | Principal
Amount | | | Value | |
Pioneer Aircraft Finance Ltd., Series 2019-1, Class A | | | | | | | | |
3.967% 6/15/44 (a) | | $ | 1,510,877 | | | $ | 1,435,293 | |
Planet Fitness Master Issuer LLC, Series 2019-1A, Class A2 | | | | | | | | |
3.858% 12/05/49 (a) | | | 2,298,780 | | | | 2,226,581 | |
PNMAC GMSR Issuer Trust, Series 2018-GT1, Class A, 1 mo. USD LIBOR + 2.850% | | | | | | | | |
2.998% FRN 2/25/23 (a) | | | 1,270,000 | | | | 1,248,530 | |
Rockford Tower CLO Ltd., Series 2019-1A, Class B1, 3 mo. USD LIBOR + 2.050% | | | | | | | | |
2.268% FRN 4/20/32 (a) | | | 1,500,000 | | | | 1,500,675 | |
RR 3 Ltd., Series 2018-3A, Class A1R2, 3 mo. USD LIBOR + 1.090% | | | | | | | | |
1.327% FRN 1/15/30 (a) | | | 2,450,000 | | | | 2,443,363 | |
RR 6 Ltd., Series 2019-6A, Class A1A, 3 mo. USD LIBOR + 1.250% | | | | | | | | |
1.487% FRN 4/15/30 (a) | | | 600,000 | | | | 600,011 | |
Sierra Receivables Funding LLC | | | | | | | | |
Series 2020-2A, Class B, 2.320% 7/20/37 (a) | | | 865,998 | | | | 875,270 | |
Series 2018-3A, Class D, 5.200% 9/20/35 (a) | | | 666,114 | | | | 665,918 | |
Stack Infrastructure Issuer LLC, Series 2020-1A, Class A2 | | | | | | | | |
1.893% 8/25/45 (a) | | | 874,000 | | | | 883,221 | |
Steele Creek CLO Ltd., Series 2018-2A, Class C, 3 mo. USD LIBOR + 2.300% | | | | | | | | |
2.520% FRN 8/18/31 (a) | | | 1,170,000 | | | | 1,140,745 | |
Store Master Funding I-VII | | | | | | | | |
Series 2019-1, Class A2, 3.650% 11/20/49 (a) | | | 2,851,957 | | | | 2,908,432 | |
Series 2018-1A, Class A2, 4.290% 10/20/48 (a) | | | 1,291,964 | | | | 1,350,877 | |
Structured Asset Securities Corp. Mortgage Loan Trust, Series 2006-GEL1, Class M2, 1 mo. USD LIBOR + 1.200% | | | | | | | | |
1.348% FRN 11/25/35 (a) | | | 2,811,250 | | | | 2,682,291 | |
Structured Receivables Finance LLC, Series 2010-B, Class A | | | | | | | | |
3.730% 8/15/36 (a) | | | 134,434 | | | | 140,959 | |
Sunnova Helios II Issuer LLC, Series 2018-1A, Class A | | | | | | | | |
4.870% 7/20/48 (a) | | | 439,146 | | | | 470,097 | |
SuttonPark Structured Settlements LLC, Series 2017-1A, Class A | | | | | | | | |
4.190% 1/15/71 (a) | | | 1,909,722 | | | | 2,206,937 | |
| | | Principal
Amount | | | Value | |
Taco Bell Funding LLC, Series 2018-1A, Class A2II | | | | | | | | |
4.940% 11/25/48 (a) | | $ | 1,117,200 | | | $ | 1,228,430 | |
TAL Advantage VII LLC, Series 2020-1A, Class A | | | | | | | | |
2.050% 9/20/45 (a) | | | 4,381,875 | | | | 4,385,820 | |
Textainer Marine Containers VII Ltd., Series 2019-1A, Class A | | | | | | | | |
3.960% 4/20/44 (a) | | | 474,933 | | | | 480,242 | |
Tif Funding II LLC, Series 2020-1A, Class A | | | | | | | | |
2.090% 8/20/45 (a) | | | 629,850 | | | | 634,492 | |
Trinity Rail Leasing LP | | | | | | | | |
Series 2019-2A, Class A2, 3.100% 10/18/49 (a) | | | 3,289,000 | | | | 3,431,820 | |
Series 2018-1A, Class A2, 4.620% 6/17/48 (a) | | | 2,420,000 | | | | 2,545,661 | |
Trip Rail Master Funding LLC, Series 2017-1A, Class A1 | | | | | | | | |
2.709% 8/15/47 (a) | | | 125,963 | | | | 126,122 | |
Triton Container Finance VIII LLC, Series 2020-1A, Class A | | | | | | | | |
2.110% 9/20/45 (a) | | | 3,083,059 | | | | 3,112,928 | |
Vantage Data Centers LLC, Series 2020-2A, Class A2 | | | | | | | | |
1.992% 9/15/45 (a) | | | 1,301,000 | | | | 1,309,178 | |
Vivint Solar Financing V LLC, Series 2018-1A, Class B | | | | | | | | |
7.370% 4/30/48 (a) | | | 2,430,695 | | | | 2,584,254 | |
WAVE LLC | | | | | | | | |
Series 2019-1A, Class A, 3.597% 9/15/44 (a) | | | 3,817,896 | | | | 3,723,051 | |
Series 2017-1A, Class C, 6.656% 11/15/42 (a) | | | 1,874,228 | | | | 1,152,169 | |
WAVE Trust, Series 2017-1A, Class A | | | | | | | | |
3.844% 11/15/42 (a) | | | 3,084,017 | | | | 2,992,508 | |
Willis Engine Structured Trust IV, Series 2018-A, Class A, | | | | | | | | |
4.750% STEP 9/15/43 (a) | | | 1,146,408 | | | | 989,383 | |
Wind River CLO Ltd. | | | | | | | | |
Series 2018-2A, Class B, 3 mo. USD LIBOR + 1.750% 1.987% FRN 7/15/30 (a) | | | 1,150,000 | | | | 1,146,030 | |
Series 2016-2A, Class BR, 3 mo. USD LIBOR + 1.800% 2.014% FRN 11/01/31 (a) | | | 900,000 | | | | 895,728 | |
| | | | | | | | 162,151,785 | |
Student Loans Asset-Backed Securities — 9.0% |
Chase Education Loan Trust, Series 2007-A, Class A4, 3 mo. USD LIBOR + .100% | | | | | | | | |
0.351% FRN 6/28/39 | | | 5,235,182 | | | | 4,976,572 | |
The accompanying notes are an integral part of the financial statements.
108
MML Managed Bond Fund – Portfolio of Investments (Continued) |
| | | Principal
Amount | | | Value | |
College Avenue Student Loans LLC | | | | | | | | |
Series 2019-A, Class B, 3.810% 12/28/48 (a) | | $ | 2,244,000 | | | $ | 2,306,396 | |
Series 2019-A, Class C, 4.460% 12/28/48 (a) | | | 1,281,000 | | | | 1,297,229 | |
College Loan Corp. Trust I, Series 2007-1, Class B2, 28 day ARS | | | | | | | | |
FRN 1/25/47 | | | 900,000 | | | | 717,728 | |
ECMC Group Student Loan Trust | | | | | | | | |
Series 2018-2A, Class A, 1 mo. USD LIBOR + .800% 0.948% FRN 9/25/68 (a) | | | 1,947,823 | | | | 1,932,044 | |
Series 2017-1A, Class A, 1 mo. USD LIBOR + 1.200% 1.348% FRN 12/27/66 (a) | | | 2,122,857 | | | | 2,132,048 | |
EdLinc Student Loan Funding, Series 2017-A, Class A, PRIME - 1.150% | | | | | | | | |
3.600% FRN 12/01/47 (a) | | | 1,683,577 | | | | 1,664,837 | |
Education Services of America | | | | | | | | |
Series 2014-4, Class B, 1 mo. USD LIBOR + 1.500% 1.648% FRN 6/25/48 (a) | | | 1,200,000 | | | | 1,159,442 | |
Series 2015-1, Class B, 1 mo. USD LIBOR + 1.500% 1.648% FRN 10/25/56 (a) | | | 1,100,000 | | | | 1,062,489 | |
Educational Funding of the South, Inc., Series 2011-1, Class B, 3 mo. USD LIBOR + 3.700% | | | | | | | | |
3.915% FRN 4/25/46 | | | 625,000 | | | | 594,894 | |
EDvestinU Private Education Loan Issue No 1 LLC, Series 2019-A, Class A, | | | | | | | | |
3.580% VRN 11/25/38 (a) (c) | | | 1,251,578 | | | | 1,318,147 | |
Higher Education Funding I | | | | | | | | |
Series 2004-1, Class B2, 28 day ARS 0.000% FRN 1/01/44 (a) | | | 450,000 | | | | 393,449 | |
Series 2004-1, Class B1, 28 day ARS 0.000% FRN 1/01/44 (a) | | | 450,000 | | | | 400,127 | |
Laurel Road Prime Student Loan Trust, Series 2017-B, Class BFX | | | | | | | | |
3.020% 8/25/42 (a) | | | 547,785 | | | | 551,692 | |
Navient Private Education Loan Trust, Series 2020-IA, Class B | | | | | | | | |
2.950% 4/15/69 (a) | | | 2,352,000 | | | | 2,343,186 | |
Navient Private Education Refi Loan Trust | | | | | | | | |
Series 2019-CA, Class B, 3.670% 2/15/68 (a) | | | 2,249,000 | | | | 2,294,432 | |
Series 2019-A, Class B, 3.900% 1/15/43 (a) | | | 1,190,000 | | | | 1,230,150 | |
Series 2018-CA, Class B, 4.220% 6/16/42 (a) | | | 1,530,000 | | | | 1,598,580 | |
| | | Principal
Amount | | | Value | |
Navient Student Loan Trust | | | | | | | | |
Series 2018-3A, Class A3, 1 mo. USD LIBOR + .800% 0.948% FRN 3/25/67 (a) | | $ | 4,700,000 | | | $ | 4,695,614 | |
Series 2019-1A, Class A2, 1 mo. USD LIBOR + .900% 1.048% FRN 12/27/67 (a) | | | 4,530,000 | | | | 4,518,505 | |
Series 2016-7A, Class A, 1 mo. USD LIBOR + 1.150% 1.298% FRN 3/25/66 (a) | | | 1,708,017 | | | | 1,728,254 | |
Series 2016-5A, Class A, 1 mo. USD LIBOR + 1.250% 1.398% FRN 6/25/65 (a) | | | 3,073,387 | | | | 3,101,079 | |
Series 2016-6A, Class A3, 1 mo. USD LIBOR + 1.300% 1.448% FRN 3/25/66 (a) | | | 7,050,000 | | | | 7,102,725 | |
Series 2015-3, Class B, 1 mo. USD LIBOR + 1.500% 1.648% FRN 10/25/58 | | | 940,000 | | | | 897,551 | |
Series 2016-2, Class A3, 1 mo. USD LIBOR + 1.500% 1.648% FRN 6/25/65 (a) | | | 2,370,000 | | | | 2,446,906 | |
Series 2019-BA, Class B, 4.040% 12/15/59 (a) | | | 2,950,000 | | | | 3,052,428 | |
Nelnet Private Education Loan Trust, Series 2016-A, Class A1B | | | | | | | | |
3.600% 12/26/40 (a) | | | 303,755 | | | | 305,201 | |
Nelnet Student Loan Trust | | | | | | | | |
Series 2005-4, Class A4A, 0.000% FRN 3/22/32 (c) | | | 315,057 | | | | 302,836 | |
Series 2006-3, Class B, 3 mo. USD LIBOR + .250% 0.501% FRN 6/25/41 | | | 548,503 | | | | 473,896 | |
Series 2019-2A, Class A, 1 mo. USD LIBOR + .900% 1.048% FRN 6/27/67 (a) | | | 1,609,862 | | | | 1,594,456 | |
Series 2019-1A, Class B, 1 mo. USD LIBOR + 1.400% 1.548% FRN 4/25/67 (a) | | | 3,250,000 | | | | 3,067,263 | |
Series 2019-5, Class B, 3.450% 10/25/67 (a) | | | 2,150,000 | | | | 2,083,403 | |
SLC Student Loan Trust, Series 2007-1, Class A5, 3 mo. USD LIBOR + .090% | | | | | | | | |
0.311% FRN 2/15/68 | | | 4,000,000 | | | | 3,744,458 | |
SLM Student Loan Trust | | | | | | | | |
Series 2006-2, Class R, 0.000% 1/25/41 | | | 7,308 | | | | 4,019,400 | |
Series 2006-5, Class B, 3 mo. USD LIBOR + .210% 0.425% FRN 10/25/40 | | | 1,803,985 | | | | 1,612,681 | |
Series 2005-6, Class B, 3 mo. USD LIBOR + .290% 0.505% FRN 1/25/44 | | | 1,876,117 | | | | 1,673,320 | |
The accompanying notes are an integral part of the financial statements.
109
MML Managed Bond Fund – Portfolio of Investments (Continued) |
| | | Principal
Amount | | | Value | |
Series 2003-14, Class A7, 3 mo. USD LIBOR + .600% 0.815% FRN 10/25/65 (a) | | $ | 2,620,000 | | | $ | 2,597,285 | |
SoFi Alternative Trust, Series 2019-C, Class PT, | | | | | | | | |
4.974% VRN 1/25/45 (a) (c) | | | 4,495,346 | | | | 4,849,153 | |
SoFi Professional Loan Program LLC | | | | | | | | |
Series 2019-A, Class R1, 0.000% 6/15/48 (a) | | | 6,724,700 | | | | 1,448,500 | |
Series 2017-D, Class R1, 0.000% 9/25/40 (a) | | | 4,688,500 | | | | 1,357,133 | |
Series 2018-A, Class R1, 0.000% 2/25/42 (a) | | | 3,759,800 | | | | 1,390,652 | |
Series 2018-B, Class R1, 0.000% 8/26/47 (a) | | | 3,324,300 | | | | 1,233,044 | |
Series 2018-D, Class R1, 0.000% 2/25/48 (a) | | | 4,961,600 | | | | 1,097,010 | |
Series 2017-C, Class C, 4.210% VRN 7/25/40 (a) (c) | | | 990,000 | | | | 1,040,392 | |
South Carolina Student Loan Corp., Series 2014-1, Class B, 1 mo. USD LIBOR + 1.500% | | | | | | | | |
1.655% FRN 8/01/35 | | | 3,050,000 | | | | 2,930,547 | |
| | | | | | | | 92,337,134 | |
Whole Loan Collateral Collateralized Mortgage Obligations — 0.3% |
Bank of America Mortgage Securities, Series 2004-G, Class 2A7, | | | | | | | | |
3.076% VRN 8/25/34 (c) | | | 16,721 | | | | 16,389 | |
JP Morgan Mortgage Trust, Series 2017-1, Class A11, | | | | | | | | |
3.500% VRN 1/25/47 (a) (c) | | | 1,543,830 | | | | 1,577,702 | |
PSMC Trust, Series 2018-2, Class A1, | | | | | | | | |
3.500% VRN 6/25/48 (a) (c) | | | 1,233,274 | | | | 1,257,826 | |
Wells Fargo Mortgage Backed Securities Trust, Series 2019-1, Class A1, | | | | | | | | |
4.000% VRN 11/25/48 (a) (c) | | | 602,204 | | | | 617,344 | |
| | | | | | | | 3,469,261 | |
| | | | | | | | | |
TOTAL NON-U.S. GOVERNMENT AGENCY OBLIGATIONS (Cost $338,354,007) | | | | | | | 336,514,776 | |
| | | | | | | | | |
SOVEREIGN DEBT OBLIGATIONS — 0.8% |
Colombia Government International Bond | | | | | | | | |
6.125% 1/18/41 | | | 2,080,000 | | | | 2,787,200 | |
Mexico Government International Bond | | | | | | | | |
4.750% 3/08/44 | | | 3,727,000 | | | | 4,425,850 | |
| | | Principal
Amount | | | Value | |
6.750% 9/27/34 | | $ | 685,000 | | | $ | 965,000 | |
| | | | | | | | 8,178,050 | |
| | | | | | | | | |
TOTAL SOVEREIGN DEBT OBLIGATIONS (Cost $6,705,365) | | | | | | | 8,178,050 | |
| | | | | | | | | |
U.S. GOVERNMENT AGENCY OBLIGATIONS AND INSTRUMENTALITIES — 21.4% |
Collateralized Mortgage Obligations — 0.0% |
Federal Home Loan Mortgage Corp. Series 2178, Class PB 7.000% 8/15/29 | | | 29,825 | | | | 33,853 | |
Pass-Through Securities — 21.1% |
Federal Home Loan Mortgage Corp. | | | | | | | | |
Pool #RA4245 2.000% 12/01/50 | | | 2,600,000 | | | | 2,709,509 | |
Pool #RA4255 2.000% 1/01/51 | | | 5,475,000 | | | | 5,719,287 | |
Pool #J13972 3.500% 1/01/26 | | | 25,611 | | | | 27,246 | |
Pool #C91344 3.500% 11/01/30 | | | 80,987 | | | | 87,020 | |
Pool #C91424 3.500% 1/01/32 | | | 50,767 | | | | 54,787 | |
Pool #RA2483 3.500% 6/01/50 | | | 9,374,075 | | | | 9,984,633 | |
Pool #C91239 4.500% 3/01/29 | | | 4,005 | | | | 4,426 | |
Pool #C91251 4.500% 6/01/29 | | | 26,039 | | | | 28,776 | |
Pool #C90939 5.500% 12/01/25 | | | 13,913 | | | | 15,554 | |
Pool #D97258 5.500% 4/01/27 | | | 9,844 | | | | 11,030 | |
Pool #C91026 5.500% 4/01/27 | | | 23,884 | | | | 26,762 | |
Pool #C91074 5.500% 8/01/27 | | | 2,517 | | | | 2,820 | |
Pool #D97417 5.500% 10/01/27 | | | 9,170 | | | | 10,280 | |
Pool #C91128 5.500% 12/01/27 | | | 1,312 | | | | 1,471 | |
Pool #C91148 5.500% 1/01/28 | | | 59,505 | | | | 66,711 | |
Pool #C91176 5.500% 5/01/28 | | | 20,284 | | | | 22,740 | |
Pool #C91217 5.500% 11/01/28 | | | 6,563 | | | | 7,364 | |
Federal National Mortgage Association | | | | | | | | |
Pool #775539 12 mo. USD LIBOR + 1.641% 2.516% FRN 5/01/34 | | | 13,648 | | | | 14,189 | |
Pool #MA3029 3.000% 6/01/32 | | | 2,522,977 | | | | 2,663,981 | |
Pool #MA3090 3.000% 8/01/32 | | | 1,061,889 | | | | 1,121,236 | |
Pool #AO8180 3.000% 9/01/42 | | | 20,469 | | | | 21,871 | |
Pool #AB7397 3.000% 12/01/42 | | | 118,949 | | | | 127,097 | |
Pool #AB7401 3.000% 12/01/42 | | | 101,658 | | | | 108,622 | |
Pool #AP8668 3.000% 12/01/42 | | | 136,015 | | | | 145,332 | |
Pool #AR1975 3.000% 12/01/42 | | | 29,297 | | | | 31,303 | |
Pool #AR0306 3.000% 1/01/43 | | | 8,614 | | | | 9,202 | |
Pool #AR5391 3.000% 1/01/43 | | | 58,936 | | | | 62,974 | |
Pool #AL3215 3.000% 2/01/43 | | | 95,906 | | | | 102,446 | |
Pool #AR4109 3.000% 2/01/43 | | | 96,490 | | | | 103,070 | |
Pool #AR4432 3.000% 3/01/43 | | | 42,904 | | | | 45,830 | |
Pool #AT0169 3.000% 3/01/43 | | | 209,490 | | | | 223,775 | |
Pool #AB8809 3.000% 3/01/43 | | | 49,784 | | | | 53,179 | |
The accompanying notes are an integral part of the financial statements.
110
MML Managed Bond Fund – Portfolio of Investments (Continued) |
| | | Principal
Amount | | | Value | |
Pool #MA1368 3.000% 3/01/43 | | $ | 184,335 | | | $ | 196,905 | |
Pool #AR2174 3.000% 4/01/43 | | | 184,472 | | | | 197,050 | |
Pool #AS1304 3.500% 12/01/28 | | | 898,169 | | | | 962,550 | |
Pool #MA1356 3.500% 2/01/43 | | | 7,155,601 | | | | 7,807,262 | |
Pool #CA6096 3.500% 6/01/50 | | | 8,797,563 | | | | 9,472,293 | |
Pool #FM4017 3.500% 8/01/50 | | | 874,635 | | | | 925,043 | |
Pool #AA3980 4.500% 4/01/28 | | | 47,309 | | | | 51,206 | |
Pool #CA1909 4.500% 6/01/48 | | | 4,719,545 | | | | 5,130,474 | |
Pool #AD6437 5.000% 6/01/40 | | | 332,810 | | | | 383,749 | |
Pool #AD6996 5.000% 7/01/40 | | | 2,130,785 | | | | 2,456,916 | |
Pool #AL8173 5.000% 2/01/44 | | | 905,177 | | | | 1,041,741 | |
Pool #AD0836 5.500% 11/01/28 | | | 46,361 | | | | 51,963 | |
Government National Mortgage Association | | | | | | | | |
Pool #371146 7.000% 9/15/23 | | | 43 | | | | 45 | |
Pool #352022 7.000% 11/15/23 | | | 1,967 | | | | 2,080 | |
Pool #374440 7.000% 11/15/23 | | | 169 | | | | 178 | |
Pool #491089 7.000% 12/15/28 | | | 6,079 | | | | 6,616 | |
Pool #480539 7.000% 4/15/29 | | | 205 | | | | 231 | |
Pool #488634 7.000% 5/15/29 | | | 1,878 | | | | 2,136 | |
Pool #500928 7.000% 5/15/29 | | | 3,009 | | | | 3,455 | |
Pool #499410 7.000% 7/15/29 | | | 1,082 | | | | 1,246 | |
Pool #510083 7.000% 7/15/29 | | | 735 | | | | 839 | |
Pool #493723 7.000% 8/15/29 | | | 2,200 | | | | 2,537 | |
Pool #581417 7.000% 7/15/32 | | | 4,300 | | | | 4,895 | |
Government National Mortgage Association II | | | | | | | | |
Pool# MA6656 3.000% 5/20/50 | | | 9,474,649 | | | | 9,909,876 | |
Pool# MA6710 3.000% 6/20/50 | | | 9,576,461 | | | | 10,041,055 | |
Pool #008746 1 year CMT + 1.500% 3.125% FRN 11/20/25 | | | 2,405 | | | | 2,445 | |
Pool #080136 1 year CMT + 1.500% 3.125% FRN 11/20/27 | | | 564 | | | | 576 | |
Pool #MA4321 3.500% 3/20/47 | | | 5,850,303 | | | | 6,297,877 | |
Government National Mortgage Association II TBA | | | | | | | | |
Pool #MA188 3.000% 8/01/49 (d) | | | 11,950,000 | | | | 12,496,152 | |
Pool #207 3.500% 6/01/49 (d) | | | 29,120,000 | | | | 30,862,651 | |
Uniform Mortgage Backed Securities TBA | | | | | | | | |
Pool #801 2.000% 6/01/35 (d) | | | 43,225,000 | | | | 45,203,892 | |
Pool #4241 3.000% 7/01/49 (d) | | | 29,475,000 | | | | 30,884,273 | |
Pool #1963 3.500% 3/01/49 (d) | | | 18,250,000 | | | | 19,296,524 | |
| | | | | | | | 217,311,254 | |
| | | Principal
Amount | | | Value | |
Whole Loans — 0.3% |
Federal Home Loan Mortgage Corp. Structured Agency Credit Risk Debt Notes | | | | | | | | |
Series 2016-HQA3, Class M2, 1 mo. USD LIBOR + 1.350% 1.498% FRN 3/25/29 | | $ | 54,173 | | | $ | 54,184 | |
Series 2020-DNA3, Class M1, 1 mo. USD LIBOR + 1.500% 1.648% FRN 6/25/50 (a) | | | 912,889 | | | | 914,116 | |
Series 2020-DNA3, Class M2, 1 mo. USD LIBOR + 3.000% 3.148% FRN 6/25/50 (a) | | | 1,908,000 | | | | 1,918,377 | |
| | | | | | | | 2,886,677 | |
| | | | | | | | | |
TOTAL U.S. GOVERNMENT AGENCY OBLIGATIONS AND INSTRUMENTALITIES (Cost $218,606,997) | | | | | | | 220,231,784 | |
| | | | | | | | | |
U.S. TREASURY OBLIGATIONS — 3.4% |
U.S. Treasury Bonds & Notes — 3.4% |
U.S. Treasury Bond | | | | | | | | |
2.250% 8/15/49 (e) | | | 14,400,000 | | | | 16,491,181 | |
3.500% 2/15/39 (e) | | | 9,500,000 | | | | 12,893,586 | |
U.S. Treasury Note | | | | | | | | |
0.250% 10/31/25 | | | 5,300,000 | | | | 5,276,802 | |
| | | | | | | | 34,661,569 | |
| | | | | | | | | |
TOTAL U.S. TREASURY OBLIGATIONS (Cost $33,644,524) | | | | | | | 34,661,569 | |
| | | | | | | | | |
TOTAL BONDS & NOTES (Cost $965,130,303) | | | | | | | 1,003,368,180 | |
| | | | | | | | | |
TOTAL PURCHASED OPTIONS (#) — 0.2% (Cost $2,989,580) | | | | | | | 2,021,202 | |
| | | | | | | | | |
TOTAL LONG-TERM INVESTMENTS (Cost $968,119,883) | | | | | | | 1,005,389,382 | |
| | | | | | | | | |
SHORT-TERM INVESTMENTS — 13.9% |
Commercial Paper — 13.4% |
American Electric Power, Inc. | | | | | | | | |
0.213% 1/25/21 (a) | | | 2,000,000 | | | | 1,999,718 | |
0.243% 2/11/21 (a) | | | 9,000,000 | | | | 8,997,522 | |
American Honda Finance Corp. | | | | | | | | |
0.274% 2/16/21 | | | 11,000,000 | | | | 10,995,462 | |
The accompanying notes are an integral part of the financial statements.
111
MML Managed Bond Fund – Portfolio of Investments (Continued) |
| | | Principal
Amount | | | Value | |
Duke Energy Corp. | | | | | | | | |
0.223% 1/19/21 (a) | | $ | 3,000,000 | | | $ | 2,999,710 | |
Entergy Corp. | | | | | | | | |
0.274% 3/02/21 (a) | | | 11,000,000 | | | | 10,993,644 | |
FMC Technologies, Inc. | | | | | | | | |
0.274% 2/01/21 (a) | | | 8,000,000 | | | | 7,998,414 | |
Intercontinental Exchange, Inc. | | | | | | | | |
0.274% 2/02/21 (a) (f) | | | 3,000,000 | | | | 2,999,067 | |
0.355% 5/24/21 (a) (f) | | | 5,000,000 | | | | 4,991,135 | |
National Grid PLC | | | | | | | | |
0.294% 1/11/21 (a) | | | 11,000,000 | | | | 10,999,496 | |
NiSource, Inc. | | | | | | | | |
0.243% 1/19/21 (a) | | | 1,000,000 | | | | 999,903 | |
0.254% 1/14/21 (a) | | | 2,000,000 | | | | 1,999,870 | |
Public Service Enterprise Group, Inc. | | | | | | | | |
0.254% 1/20/21 (a) | | | 9,000,000 | | | | 8,999,065 | |
0.284% 2/23/21 (a) | | | 2,000,000 | | | | 1,999,244 | |
Schlumberger Holdings Corp. | | | | | | | | |
0.254% 1/11/21 (a) | | | 1,000,000 | | | | 999,985 | |
Spire, Inc. | | | | | | | | |
0.264% 1/13/21 (a) | | | 1,000,000 | | | | 999,941 | |
Suncor Energy, Inc. | | | | | | | | |
0.233% 1/06/21 (a) | | | 11,000,000 | | | | 10,999,725 | |
Telus Corp. | | | | | | | | |
0.162% 2/04/21 (a) | | | 6,000,000 | | | | 5,998,676 | |
0.193% 1/28/21 (a) | | | 5,000,000 | | | | 4,999,172 | |
Transcanada Pipelines Ltd. | | | | | | | | |
0.284% 1/21/21 (a) | | | 2,000,000 | | | | 1,999,778 | |
0.304% 1/14/21 (a) | | | 5,000,000 | | | | 4,999,675 | |
0.325% 1/14/21 (a) | | | 1,000,000 | | | | 999,935 | |
VF Corp. | | | | | | | | |
0.254% 2/08/21 (a) | | | 2,000,000 | | | | 1,999,575 | |
Vodafone Group PLC | | | | | | | | |
0.325% 1/07/21 (a) | | | 2,000,000 | | | | 1,999,942 | |
0.365% 1/04/21 (a) | | | 8,000,000 | | | | 7,999,867 | |
Walgreens Boots Alliance, Inc. | | | | | | | | |
0.274% 1/08/21 (a) | | | 3,000,000 | | | | 2,999,845 | |
0.304% 2/05/21 (a) | | | 8,000,000 | | | | 7,997,536 | |
Waste Management, Inc. | | | | | | | | |
0.233% 1/06/21 (a) | | | 1,000,000 | | | | 999,978 | |
0.356% 7/01/21 (a) | | | 5,000,000 | | | | 4,991,962 | |
| | | | | | | | 137,957,842 | |
Repurchase Agreement — 0.1% |
Fixed Income Clearing Corp., Repurchase Agreement, dated 12/31/20, 0.000%, due 1/04/21 (g) | | | 1,309,931 | | | | 1,309,931 | |
| | | Principal
Amount | | | Value | |
U.S. Treasury Bill — 0.4% |
U.S. Treasury Bill | | | | | | | | |
0.000% 1/28/21 | | $ | 4,000,000 | | | $ | 3,999,847 | |
| | | | | | | | | |
TOTAL SHORT-TERM INVESTMENTS (Cost $143,270,005) | | | | | | | 143,267,620 | |
| | | | | | | | | |
TOTAL INVESTMENTS — 111.7% (Cost $1,111,389,888) (h) | | | | | | | 1,148,657,002 | |
| | | | | | | | | |
Other Assets/(Liabilities) — (11.7)% | | | | | | | (120,511,143 | ) |
| | | | | | | | | |
NET ASSETS — 100.0% | | | | | | $ | 1,028,145,859 | |
Abbreviation Legend
CLO | Collateralized Loan Obligation |
Notes to Portfolio of Investments
Percentages are stated as a percent of net assets.
(a) | Security is exempt from registration under Regulation S or Rule 144A of the Securities Act of 1933. These securities are considered restricted and may be resold in transactions exempt from registration. At December 31, 2020, the aggregate market value of these securities amounted to $526,469,815 or 51.21% of net assets. |
(b) | Security is perpetual and has no stated maturity date. |
(c) | Certain variable rate securities are not based on a published reference rate and spread but are determined by the issuer or agent and are based on current market conditions. These securities do not indicate a reference rate and spread in their description above. The rates shown are the current interest rates at December 31, 2020. |
(d) | A portion of this security is purchased on a when-issued, delayed-delivery or forward commitment basis. (Note 2). |
(e) | A portion of this security is pledged/held as collateral for open derivatives. (Note 2). |
(f) | This security is fair valued in good faith in accordance with procedures approved by the Board of Trustees. At December 31, 2020, these securities amounted to a value of $7,990,202 or 0.78% of net assets. |
(g) | Maturity value of $1,309,931. Collateralized by U.S. Government Agency obligations with a rate of 0.000%, maturity date of 12/30/21, and an aggregate market value, including accrued interest, of $1,336,144. |
(h) | See Note 6 for aggregate cost for federal tax purposes. |
The accompanying notes are an integral part of the financial statements.
112
MML Managed Bond Fund – Portfolio of Investments (Continued) |
Notes to Portfolio of Investments (Continued)
Country weightings, as a percentage of net assets, is as follows:
United States | | | 80.9 | % |
Cayman Islands | | | 7.6 | % |
United Kingdom | | | 1.9 | % |
Canada | | | 1.4 | % |
Bermuda | | | 1.4 | % |
Mexico | | | 1.1 | % |
Netherlands | | | 0.7 | % |
France | | | 0.5 | % |
Norway | | | 0.4 | % |
Switzerland | | | 0.3 | % |
Colombia | | | 0.3 | % |
Ireland | | | 0.3 | % |
Luxembourg | | | 0.2 | % |
Saudi Arabia | | | 0.2 | % |
Germany | | | 0.2 | % |
Spain | | | 0.1 | % |
Panama | | | 0.1 | % |
Finland | | | 0.1 | % |
Japan | | | 0.1 | % |
Barbados | | | 0.0 | % |
Total Long-Term Investments | | | 97.8 | % |
Short-Term Investments and Other Assets and Liabilities | | | 2.2 | % |
Net Assets | | | 100.0 | % |
(#) Interest Rate Swaptions Purchased
| | | | | | | | Paid by Fund | | | Received by Fund | | | | | | | | | | | | | | | | | | | | | |
Description | Counterparty | | Expiration
Date | | | Rate | | | Frequency | | | Rate | | | Frequency | | | Notional
Amount | | | Value | | | Premium
Paid
(Received) | | | Unrealized
Appreciation/
(Depreciation) | |
Call | | | | | | | | | | | | | | | | | | | | | | | | | | | | | | | | | | | | | | | | | |
10-Year Interest Rate Swap, 12/15/42 | Barclays Bank PLC* | | | 12/13/32 | | 3-Month USD LIBOR BBA | | | Quarterly | | | | 2.44% | | | | Semi-Annually | | | | USD | | | | 3,700,000 | | | $ | 370,740 | | | $ | 184,972 | | | $ | 185,768 | |
| | | | | | | | | | | | | | | | | | | | | | | | | | | | | | | | | | | | | | | | | | |
Put | | | | | | | | | | | | | | | | | | | | | | | | | | | | | | | | | | | | | | | | | |
10-Year Interest Rate Swap, 12/15/42 | Barclays Bank PLC* | | | 12/13/32 | | | | 2.94% | | | | Semi-Annually | | 3-Month USD LIBOR BBA | | | Quarterly | | | | USD | | | | 56,100,000 | | | $ | 1,650,462 | | | $ | 2,804,608 | | | $ | (1,154,146 | ) |
| | | | | | | | | | | | | | | | | | | | | | | | | | | | | | | | $ | 2,021,202 | | | $ | 2,989,580 | | | $ | (968,378 | ) |
The accompanying notes are an integral part of the financial statements.
113
MML Managed Bond Fund – Portfolio of Investments (Continued) |
Futures contracts
| | Expiration
Date | | | Number of
Contracts | | | Notional
Amount | | | Value/ Net
Unrealized
Appreciation/
(Depreciation) | |
Long | | | | | | | | | | | | | | | | |
U.S. Treasury Long Bond | | | 3/22/21 | | | | 90 | | | $ | 15,713,673 | | | $ | (126,798 | ) |
U.S. Treasury Ultra Bond | | | 3/22/21 | | | | 241 | | | | 52,469,128 | | | | (1,000,565 | ) |
U.S. Treasury Note 2 Year | | | 3/31/21 | | | | 494 | | | | 109,056,802 | | | | 105,620 | |
U.S. Treasury Note 5 Year | | | 3/31/21 | | | | 342 | | | | 43,053,285 | | | | 94,825 | |
| | | | | | | | | | | | | | $ | (926,918 | ) |
Short | | | | | | | | | | | | | | | | |
90 Day Eurodollar | | | 3/15/21 | | | | 9 | | | $ | (2,194,845 | ) | | $ | (51,330 | ) |
U.S. Treasury Ultra 10 Year | | | 3/22/21 | | | | 16 | | | | (2,500,808 | ) | | | (942 | ) |
90 Day Eurodollar | | | 9/13/21 | | | | 17 | | | | (4,146,456 | ) | | | (96,319 | ) |
90 Day Eurodollar | | | 3/14/22 | | | | 15 | | | | (3,657,513 | ) | | | (85,737 | ) |
90 Day Eurodollar | | | 9/19/22 | | | | 14 | | | | (3,412,279 | ) | | | (80,546 | ) |
90 Day Eurodollar | | | 3/13/23 | | | | 12 | | | | (2,923,010 | ) | | | (69,340 | ) |
90 Day Eurodollar | | | 12/18/23 | | | | 15 | | | | (3,650,388 | ) | | | (81,425 | ) |
90 Day Eurodollar | | | 12/16/24 | | | | 40 | | | | (9,722,367 | ) | | | (202,633 | ) |
| | | | | | | | | | | | | | $ | (668,272 | ) |
* | Contracts are subject to a Master Netting Agreement. |
Currency Legend
The accompanying notes are an integral part of the financial statements.
114
MML Short-Duration Bond Fund – Portfolio of Investments |
December 31, 2020 |
| | | Principal
Amount | | | Value | |
BONDS & NOTES — 95.1% |
CORPORATE DEBT — 44.2% |
Agriculture — 1.0% |
BAT Capital Corp. | | | | | | | | |
3.222% 8/15/24 | | $ | 415,000 | | | $ | 449,288 | |
Imperial Brands Finance PLC | | | | | | | | |
3.125% 7/26/24 (a) | | | 400,000 | | | | 428,379 | |
3.500% 2/11/23 (a) | | | 387,000 | | | | 405,144 | |
Reynolds American, Inc. | | | | | | | | |
4.450% 6/12/25 | | | 505,000 | | | | 575,192 | |
| | | | | | | | 1,858,003 | |
Airlines — 0.1% |
Delta Air Lines, Inc. / SkyMiles IP Ltd. | | | | | | | | |
4.500% 10/20/25 (a) | | | 185,000 | | | | 197,739 | |
Auto Manufacturers — 1.9% |
Ford Motor Credit Co. LLC | | | | | | | | |
3 mo. USD LIBOR + .810% 1.048% FRN 4/05/21 | | | 405,000 | | | | 403,265 | |
3 mo. USD LIBOR + 1.235% 1.456% FRN 2/15/23 | | | 275,000 | | | | 265,384 | |
3.087% 1/09/23 | | | 260,000 | | | | 264,536 | |
3.350% 11/01/22 | | | 365,000 | | | | 371,387 | |
General Motors Co. | | | | | | | | |
6.125% 10/01/25 | | | 135,000 | | | | 163,751 | |
General Motors Financial Co., Inc. | | | | | | | | |
3.250% 1/05/23 | | | 829,000 | | | | 869,296 | |
Harley-Davidson Financial Services, Inc. | | | | | | | | |
3.350% 6/08/25 (a) | | | 209,000 | | | | 226,387 | |
Hyundai Capital America | | | | | | | | |
2.375% 2/10/23 (a) | | | 600,000 | | | | 618,373 | |
2.850% 11/01/22 (a) | | | 320,000 | | | | 331,615 | |
Nissan Motor Acceptance Corp. | | | | | | | | |
1.900% 9/14/21 (a) | | | 200,000 | | | | 201,384 | |
| | | | | | | | 3,715,378 | |
Banks — 9.8% |
ABN AMRO Bank NV | | | | | | | | |
4.750% 7/28/25 (a) | | | 435,000 | | | | 500,620 | |
Africa Finance Corp. | | | | | | | | |
3.125% 6/16/25 (a) | | | 957,000 | | | | 986,906 | |
Banco Santander SA | | | | | | | | |
2.746% 5/28/25 | | | 200,000 | | | | 213,505 | |
3.500% 4/11/22 | | | 600,000 | | | | 623,072 | |
Bank of America Corp. 3 mo. USD LIBOR + .930% | | | | | | | | |
2.816% VRN 7/21/23 | | | 1,910,000 | | | | 1,983,403 | |
The Bank of Nova Scotia | | | | | | | | |
4.500% 12/16/25 | | | 829,000 | | | | 966,566 | |
| | | Principal
Amount | | | Value | |
Barclays Bank PLC | | | | | | | | |
10.179% 6/12/21 (a) | | $ | 504,000 | | | $ | 524,184 | |
Barclays PLC 3 mo. USD LIBOR + 1.380% | | | | | | | | |
1.601% FRN 5/16/24 | | | 485,000 | | | | 491,538 | |
BPCE SA | | | | | | | | |
5.700% 10/22/23 (a) | | | 825,000 | | | | 933,767 | |
Citigroup, Inc. | | | | | | | | |
4.400% 6/10/25 | | | 835,000 | | | | 954,661 | |
Credit Suisse AG | | | | | | | | |
6.500% 8/08/23 (a) | | | 930,000 | | | | 1,046,049 | |
Danske Bank A/S | | | | | | | | �� |
5.000% 1/12/22 (a) | | | 455,000 | | | | 475,001 | |
Deutsche Bank AG SOFR + 2.159% | | | | | | | | |
2.222% VRN 9/18/24 | | | 685,000 | | | | 704,686 | |
Discover Bank | | | | | | | | |
3.350% 2/06/23 | | | 673,000 | | | | 710,141 | |
4.200% 8/08/23 | | | 310,000 | | | | 338,928 | |
The Goldman Sachs Group, Inc. | | | | | | | | |
4.250% 10/21/25 | | | 1,845,000 | | | | 2,115,849 | |
HSBC Holdings PLC | | | | | | | | |
4.250% 3/14/24 | | | 865,000 | | | | 954,392 | |
Mitsubishi UFJ Financial Group, Inc. | | | | | | | | |
2.665% 7/25/22 | | | 820,000 | | | | 848,383 | |
Morgan Stanley | | | | | | | | |
SOFR + 1.990% 2.188% VRN 4/28/26 | | | 425,000 | | | | 448,903 | |
4.100% 5/22/23 | | | 424,000 | | | | 460,139 | |
Societe Generale SA 1 year CMT + 1.100% | | | | | | | | |
1.488% VRN 12/14/26 (a) | | | 525,000 | | | | 529,638 | |
Sumitomo Mitsui Financial Group, Inc. | | | | | | | | |
1.474% 7/08/25 | | | 335,000 | | | | 343,087 | |
2.448% 9/27/24 | | | 520,000 | | | | 553,804 | |
3.748% 7/19/23 | | | 151,000 | | | | 163,441 | |
Synchrony Bank | | | | | | | | |
3.000% 6/15/22 | | | 470,000 | | | | 485,336 | |
UBS Group AG | | | | | | | | |
4.125% 9/24/25 (a) | | | 355,000 | | | | 406,496 | |
| | | | | | | | 18,762,495 | |
Beverages — 1.0% |
Bacardi Ltd. | | | | | | | | |
4.450% 5/15/25 (a) | | | 778,000 | | | | 868,525 | |
Molson Coors Beverage Co. | | | | | | | | |
2.100% 7/15/21 | | | 230,000 | | | | 231,931 | |
3.000% 7/15/26 | | | 505,000 | | | | 550,537 | |
3.500% 5/01/22 | | | 197,000 | | | | 204,849 | |
| | | | | | | | 1,855,842 | |
The accompanying notes are an integral part of the financial statements.
115
MML Short-Duration Bond Fund – Portfolio of Investments (Continued) |
| | | Principal
Amount | | | Value | |
Chemicals — 1.5% |
Alpek SAB de CV | | | | | | | | |
4.500% 11/20/22 (a) | | $ | 412,000 | | | $ | 435,179 | |
DuPont de Nemours, Inc. | | | | | | | | |
4.493% 11/15/25 | | | 705,000 | | | | 822,982 | |
LYB International Finance III LLC | | | | | | | | |
1.250% 10/01/25 | | | 185,000 | | | | 188,240 | |
Nutrition & Biosciences, Inc. | | | | | | | | |
1.230% 10/01/25 (a) | | | 360,000 | | | | 363,821 | |
RPM International, Inc. | | | | | | | | |
3.450% 11/15/22 | | | 8,000 | | | | 8,310 | |
Syngenta Finance NV | | | | | | | | |
4.441% 4/24/23 (a) | | | 570,000 | | | | 598,176 | |
4.892% 4/24/25 (a) | | | 335,000 | | | | 359,541 | |
| | | | | | | | 2,776,249 | |
Commercial Services — 0.8% |
Adani Ports & Special Economic Zone Ltd. | | | | | | | | |
3.375% 7/24/24 (a) | | | 1,443,000 | | | | 1,500,922 | |
Computers — 1.1% |
Dell International LLC / EMC Corp. | | | | | | | | |
4.000% 7/15/24 (a) | | | 414,000 | | | | 456,487 | |
5.850% 7/15/25 (a) | | | 432,000 | | | | 518,753 | |
Genpact Luxembourg Sarl | | | | | | | | |
3.700% STEP 4/01/22 | | | 635,000 | | | | 647,448 | |
Leidos, Inc. | | | | | | | | |
2.950% 5/15/23 (a) | | | 390,000 | | | | 410,322 | |
| | | | | | | | 2,033,010 | |
Diversified Financial Services — 4.0% |
AerCap Ireland Capital DAC / AerCap Global Aviation Trust | | | | | | | | |
2.875% 8/14/24 | | | 1,025,000 | | | | 1,065,986 | |
AerCap Ireland Capital DAC/AerCap Global Aviation Trust | | | | | | | | |
4.500% 9/15/23 | | | 255,000 | | | | 276,477 | |
Aircastle Ltd. | | | | | | | | |
5.000% 4/01/23 | | | 1,010,000 | | | | 1,076,564 | |
Antares Holdings LP | | | | | | | | |
6.000% 8/15/23 (a) | | | 473,000 | | | | 482,376 | |
Avolon Holdings Funding Ltd. | | | | | | | | |
2.875% 2/15/25 (a) | | | 335,000 | | | | 341,588 | |
BGC Partners, Inc. | | | | | | | | |
4.375% 12/15/25 (a) | | | 350,000 | | | | 370,219 | |
Brookfield Finance, Inc. | | | | | | | | |
4.000% 4/01/24 | | | 580,000 | | | | 636,658 | |
Lazard Group LLC | | | | | | | | |
3.750% 2/13/25 | | | 805,000 | | | | 893,960 | |
| | | Principal
Amount | | | Value | |
LeasePlan Corp. NV | | | | | | | | |
2.875% 10/24/24 (a) | | $ | 280,000 | | | $ | 295,864 | |
Park Aerospace Holdings Ltd. | | | | | | | | |
5.250% 8/15/22 (a) | | | 1,250,000 | | | | 1,311,887 | |
SPARC EM SPC Panama Metro Line 2 SP | | | | | | | | |
0.000% 12/05/22 (a) | | | 233,565 | | | | 227,436 | |
Synchrony Financial | | | | | | | | |
2.850% 7/25/22 | | | 605,000 | | | | 624,753 | |
| | | | | | | | 7,603,768 | |
Electric — 1.6% |
Alliant Energy Finance LLC | | | | | | | | |
1.400% 3/15/26 (a) | | | 260,000 | | | | 261,121 | |
American Electric Power Co., Inc. | | | | | | | | |
1.000% 11/01/25 | | | 470,000 | | | | 475,594 | |
Enel Finance International NV | | | | | | | | |
2.875% 5/25/22 (a) | | | 285,000 | | | | 294,055 | |
Entergy Texas, Inc. | | | | | | | | |
2.550% 6/01/21 | | | 95,000 | | | | 95,657 | |
National Central Cooling Co. PJSC | | | | | | | | |
2.500% 10/21/27 (a) | | | 618,000 | | | | 626,368 | |
Pacific Gas and Electric Co. | | | | | | | | |
1.750% 6/16/22 | | | 970,000 | | | | 972,737 | |
Puget Energy, Inc. | | | | | | | | |
6.000% 9/01/21 | | | 260,000 | | | | 269,073 | |
| | | | | | | | 2,994,605 | |
Gas — 0.4% |
NiSource, Inc. | | | | | | | | |
0.950% 8/15/25 | | | 670,000 | | | | 674,047 | |
Housewares — 0.5% |
Newell Brands, Inc. | | | | | | | | |
4.350% STEP 4/01/23 | | | 979,000 | | | | 1,026,863 | |
Insurance — 2.8% |
AmTrust Financial Services, Inc. | | | | | | | | |
6.125% 8/15/23 | | | 620,000 | | | | 612,269 | |
Athene Global Funding | | | | | | | | |
2.750% 6/25/24 (a) | | | 1,020,000 | | | | 1,078,473 | |
CNO Financial Group, Inc. | | | | | | | | |
5.250% 5/30/25 | | | 685,000 | | | | 795,132 | |
Enstar Group Ltd. | | | | | | | | |
4.500% 3/10/22 | | | 685,000 | | | | 711,049 | |
Jackson National Life Global Funding | | | | | | | | |
2.500% 6/27/22 (a) | | | 495,000 | | | | 510,640 | |
Lincoln National Corp. | | | | | | | | |
4.000% 9/01/23 | | | 122,000 | | | | 133,075 | |
Trinity Acquisition PLC | | | | | | | | |
3.500% 9/15/21 | | | 600,000 | | | | 610,749 | |
The accompanying notes are an integral part of the financial statements.
116
MML Short-Duration Bond Fund – Portfolio of Investments (Continued) |
| | | Principal
Amount | | | Value | |
Unum Group | | | | | | | | |
3.875% 11/05/25 | | $ | 620,000 | | | $ | 686,988 | |
Willis Towers Watson PLC | | | | | | | | |
5.750% 3/15/21 | | | 190,000 | | | | 191,913 | |
| | | | | | | | 5,330,288 | |
Investment Companies — 1.5% |
Ares Capital Corp. | | | | | | | | |
4.200% 6/10/24 | | | 953,000 | | | | 1,028,703 | |
BlackRock TCP Capital Corp. | | | | | | | | |
3.900% 8/23/24 | | | 360,000 | | | | 376,143 | |
4.125% 8/11/22 | | | 675,000 | | | | 703,789 | |
Sixth Street Specialty Lending, Inc. | | | | | | | | |
3.875% 11/01/24 | | | 755,000 | | | | 778,296 | |
| | | | | | | | 2,886,931 | |
Iron & Steel — 1.9% |
Reliance Steel & Aluminum Co. | | | | | | | | |
1.300% 8/15/25 | | | 355,000 | | | | 360,563 | |
Severstal OAO Via Steel Capital SA | | | | | | | | |
3.150% 9/16/24 (a) | | | 1,443,000 | | | | 1,507,756 | |
Steel Dynamics, Inc. | | | | | | | | |
2.400% 6/15/25 | | | 165,000 | | | | 175,373 | |
2.800% 12/15/24 | | | 250,000 | | | | 268,773 | |
Vale Overseas Ltd. | | | | | | | | |
6.250% 8/10/26 | | | 1,030,000 | | | | 1,277,200 | |
| | | | | | | | 3,589,665 | |
Lodging — 0.7% |
Las Vegas Sands Corp. | | | | | | | | |
3.200% 8/08/24 | | | 1,025,000 | | | | 1,085,653 | |
Marriott International, Inc. /MD | | | | | | | | |
5.750% 5/01/25 | | | 161,000 | | | | 188,322 | |
| | | | | | | | 1,273,975 | |
Machinery – Diversified — 0.4% |
CNH Industrial Capital LLC | | | | | | | | |
1.950% 7/02/23 | | | 120,000 | | | | 123,534 | |
3.875% 10/15/21 | | | 635,000 | | | | 649,910 | |
| | | | | | | | 773,444 | |
Media — 1.1% |
Sirius XM Radio, Inc. | | | | | | | | |
3.875% 8/01/22 (a) | | | 1,047,000 | | | | 1,062,705 | |
ViacomCBS, Inc. | | | | | | | | |
4.750% 5/15/25 | | | 840,000 | | | | 975,226 | |
| | | | | | | | 2,037,931 | |
Mining — 0.5% |
Glencore Finance Canada Ltd. | | | | | | | | |
4.250% STEP 10/25/22 (a) | | | 254,000 | | | | 270,554 | |
Glencore Funding LLC | | | | | | | | |
4.125% 5/30/23 (a) | | | 360,000 | | | | 389,322 | |
| | | Principal
Amount | | | Value | |
Kinross Gold Corp. | | | | | | | | |
5.125% 9/01/21 | | $ | 370,000 | | | $ | 376,678 | |
| | | | | | | | 1,036,554 | |
Oil & Gas — 2.1% |
Cenovus Energy, Inc. | | | | | | | | |
3.000% 8/15/22 | | | 500,000 | | | | 510,910 | |
Continental Resources, Inc. | | | | | | | | |
5.000% 9/15/22 | | | 390,000 | | | | 390,585 | |
EQT Corp. | | | | | | | | |
3.000% 10/01/22 | | | 565,000 | | | | 569,237 | |
7.875% STEP 2/01/25 | | | 320,000 | | | | 364,400 | |
Occidental Petroleum Corp. | | | | | | | | |
5.500% 12/01/25 | | | 1,100,000 | | | | 1,146,871 | |
Ovintiv Exploration, Inc. | | | | | | | | |
5.625% 7/01/24 | | | 505,000 | | | | 540,923 | |
Petroleos Mexicanos | | | | | | | | |
4.625% 9/21/23 | | | 495,000 | | | | 514,181 | |
| | | | | | | | 4,037,107 | |
Pharmaceuticals — 1.5% |
AbbVie, Inc. | | | | | | | | |
3.800% 3/15/25 | | | 495,000 | | | | 552,013 | |
Cardinal Health, Inc. 3 mo. USD LIBOR + .770% | | | | | | | | |
0.987% FRN 6/15/22 | | | 590,000 | | | | 594,195 | |
McKesson Corp. | | | | | | | | |
0.900% 12/03/25 | | | 695,000 | | | | 698,474 | |
Mylan, Inc. | | | | | | | | |
3.125% 1/15/23 (a) | | | 525,000 | | | | 551,067 | |
Teva Pharmaceutical Finance Netherlands III BV | | | | | | | | |
2.200% 7/21/21 | | | 240,000 | | | | 239,400 | |
Viatris, Inc. | | | | | | | | |
1.650% 6/22/25 (a) | | | 190,000 | | | | 196,516 | |
| | | | | | | | 2,831,665 | |
Pipelines — 1.6% |
Energy Transfer Operating LP | | | | | | | | |
4.200% 9/15/23 | | | 960,000 | | | | 1,034,714 | |
EnLink Midstream Partners LP | | | | | | | | |
4.400% 4/01/24 | | | 490,000 | | | | 483,517 | |
EQM Midstream Partners LP | | | | | | | | |
4.750% 7/15/23 | | | 505,000 | | | | 530,997 | |
Plains All American Pipeline LP / PAA Finance Corp. | | | | | | | | |
3.600% 11/01/24 | | | 120,000 | | | | 127,890 | |
Plains All American Pipeline LP/PAA Finance Corp. | | | | | | | | |
4.650% 10/15/25 | | | 760,000 | | | | 849,665 | |
| | | | | | | | 3,026,783 | |
The accompanying notes are an integral part of the financial statements.
117
MML Short-Duration Bond Fund – Portfolio of Investments (Continued) |
| | | Principal
Amount | | | Value | |
Private Equity — 0.3% |
Hercules Capital, Inc. | | | | | | | | |
4.625% 10/23/22 | | $ | 610,000 | | | $ | 620,113 | |
Real Estate — 0.8% |
Country Garden Holdings Co. Ltd. | | | | | | | | |
8.000% 1/27/24 (a) | | | 1,351,000 | | | | 1,459,759 | |
Real Estate Investment Trusts (REITS) — 2.7% |
CubeSmart LP | | | | | | | | |
4.375% 12/15/23 | | | 313,000 | | | | 342,546 | |
Essex Portfolio LP | | | | | | | | |
3.500% 4/01/25 | | | 130,000 | | | | 144,044 | |
3.875% 5/01/24 | | | 170,000 | | | | 186,978 | |
Federal Realty Investment Trust | | | | | | | | |
1.250% 2/15/26 | | | 350,000 | | | | 356,424 | |
Host Hotels & Resorts LP | | | | | | | | |
3.750% 10/15/23 | | | 950,000 | | | | 1,003,097 | |
SBA Tower Trust | | | | | | | | |
1.884% 7/15/50 (a) | | | 287,000 | | | | 295,387 | |
Service Properties Trust | | | | | | | | |
4.350% 10/01/24 | | | 510,000 | | �� | | 503,625 | |
Tanger Properties LP | | | | | | | | |
3.875% 12/01/23 | | | 610,000 | | | | 633,581 | |
Trust Fibra Uno | | | | | | | | |
5.250% 1/30/26 (a) | | | 680,000 | | | | 766,700 | |
VEREIT Operating Partnership LP | | | | | | | | |
4.600% 2/06/24 | | | 570,000 | | | | 626,875 | |
4.625% 11/01/25 | | | 335,000 | | | | 385,587 | |
| | | | | | | | 5,244,844 | |
Retail — 1.1% |
O’Reilly Automotive, Inc. | | | | | | | | |
3.800% 9/01/22 | | | 123,000 | | | | 128,749 | |
3.850% 6/15/23 | | | 873,000 | | | | 935,263 | |
QVC, Inc. | | | | | | | | |
4.375% 3/15/23 | | | 1,060,000 | | | | 1,111,675 | |
| | | | | | | | 2,175,687 | |
Semiconductors — 0.2% |
Microchip Technology, Inc. | | | | | | | | |
0.972% 2/15/24 (a) | | | 330,000 | | | | 330,808 | |
Storage & Warehousing — 0.4% |
GLP China Holdings Ltd. | | | | | | | | |
4.974% 2/26/24 (a) | | | 730,000 | | | | 781,914 | |
Telecommunications — 0.9% |
Juniper Networks, Inc. | | | | | | | | |
1.200% 12/10/25 | | | 165,000 | | | | 166,963 | |
Qwest Corp | | | | | | | | |
6.750% 12/01/21 | | | 485,000 | | | | 507,383 | |
Sprint Communications, Inc. | | | | | | | | |
9.250% 4/15/22 | | | 330,000 | | | | 360,816 | |
| | | Principal
Amount | | | Value | |
Telefonaktiebolaget LM Ericsson | | | | | | | | |
4.125% 5/15/22 | | $ | 628,000 | | | $ | 653,120 | |
| | | | | | | | 1,688,282 | |
| | | | | | | | | |
TOTAL CORPORATE DEBT (Cost $81,286,524) | | | | | | | 84,124,671 | |
| | | | | | | | | |
MUNICIPAL OBLIGATIONS — 0.2% |
Louisiana State Public Facilities Authority, Revenue Bonds, Series 2011-A, Class A2, 3 mo. USD LIBOR | | | | | | | | |
1.111% FRN 4/26/27 | | | 7,397 | | | | 7,405 | |
Pennsylvania Higher Education Assistance Agency, Revenue Bonds, Series 2006-2, Class B, | | | | | | | | |
1.410% FRN 10/25/42 (b) | | | 400,000 | | | | 398,004 | |
| | | | | | | | | |
TOTAL MUNICIPAL OBLIGATIONS (Cost $401,897) | | | | | | | 405,409 | |
| | | | | | | | | |
NON-U.S. GOVERNMENT AGENCY OBLIGATIONS — 48.4% |
Auto Floor Plan Asset-Backed Securities — 0.2% |
Navistar Financial Dealer Note Master Owner Trust II | | | | | | | | |
Series 2019-1, Class C, 1 mo. USD LIBOR + .950% 1.098% FRN 5/25/24 (a) | | | 236,000 | | | | 235,265 | |
Series 2019-1, Class D, 1 mo. USD LIBOR + 1.450% 1.598% FRN 5/25/24 (a) | | | 214,000 | | | | 213,912 | |
| | | | | | | | 449,177 | |
Automobile Asset-Backed Securities — 6.1% |
AmeriCredit Automobile Receivables Trust | | | | | | | | |
Series 2020-3, Class D, 1.490% 9/18/26 | | | 92,000 | | | | 92,125 | |
Series 2020-1, Class D, 1.800% 12/18/25 | | | 947,000 | | | | 962,804 | |
Avis Budget Rental Car Funding AESOP LLC | | | | | | | | |
Series 2020-1A, Class C, 3.020% 8/20/26 (a) | | | 1,259,000 | | | | 1,226,170 | |
Series 2019-3A, Class C, 3.150% 3/20/26 (a) | | | 1,083,000 | | | | 1,064,163 | |
Series 2019-1A, Class C, 4.530% 3/20/23 (a) | | | 233,000 | | | | 235,345 | |
Series 2018-1A, Class C, 4.730% 9/20/24 (a) | | | 500,000 | | | | 515,648 | |
The accompanying notes are an integral part of the financial statements.
118
MML Short-Duration Bond Fund – Portfolio of Investments (Continued) |
| | | Principal
Amount | | | Value | |
Canadian Pacer Auto Receivables Trust, Series 2018-2A, Class B | | | | | | | | |
3.630% 1/19/24 (a) | | $ | 180,000 | | | $ | 183,060 | |
Carmax Auto Owner Trust, Series 2019-4, Class D | | | | | | | | |
2.800% 4/15/26 | | | 560,000 | | | | 564,499 | |
Carvana Auto Receivables Trust, Series 2019-4A, Class D | | | | | | | | |
3.070% 7/15/25 (a) | | | 719,000 | | | | 739,444 | |
Drive Auto Receivables Trust, Series 2019-4, Class D | | | | | | | | |
2.700% 2/16/27 | | | 550,000 | | | | 566,478 | |
Exeter Automobile Receivables Trust, Series 2019-3A, Class D | | | | | | | | |
3.110% 8/15/25 (a) | | | 400,000 | | | | 411,446 | |
Hertz Fleet Lease Funding LP, Series 2019-1, Class D | | | | | | | | |
3.440% 1/10/33 (a) | | | 649,000 | | | | 623,790 | |
Hertz Vehicle Financing II LP | | | | | | | | |
Series 2019-3A, Class B, 3.030% 12/26/25 (a) | | | 410,000 | | | | 408,865 | |
Series 2017-1A, Class B, 3.560% 10/25/21 (a) | | | 910,000 | | | | 908,242 | |
Hertz Vehicle Financing LLC, Series 2018-3A, Class B | | | | | | | | |
4.370% 7/25/24 (a) | | | 330,000 | | | | 329,983 | |
Hertz Vehicle Financing LP, Series 2016-2A, Class C | | | | | | | | |
4.990% 3/25/22 (a) | | | 1,800,000 | | | | 1,772,726 | |
Santander Drive Auto Receivables Trust, Series 2020-4, Class D | | | | | | | | |
1.480% 1/15/27 | | | 108,000 | | | | 108,134 | |
Santander Revolving Auto Loan Trust | | | | | | | | |
Series 2019-A, Class B, 2.800% 1/26/32 (a) | | | 170,000 | | | | 178,044 | |
Series 2019-A, Class C, 3.000% 1/26/32 (a) | | | 101,000 | | | | 106,052 | |
Series 2019-A, Class D, 3.450% 1/26/32 (a) | | | 215,000 | | | | 225,114 | |
Tesla Auto Lease Trust, Series 2020-A, Class C | | | | | | | | |
1.680% 2/20/24 (a) | | | 456,000 | | | | 461,703 | |
| | | | | | | | 11,683,835 | |
Commercial Mortgage-Backed Securities — 5.0% |
BAMLL Commercial Mortgage Securities Trust | | | | | | | | |
Series 2018-DSNY, Class C, 1 mo. USD LIBOR + 1.350% 1.509% FRN 9/15/34 (a) | | | 130,000 | | | | 125,795 | |
Series 2019-BPR, Class CMP, 3.895% VRN 11/05/32 (a) (b) | | | 370,000 | | | | 340,966 | |
| | | Principal
Amount | | | Value | |
Series 2019-BPR, Class DMP, 3.895% VRN 11/05/32 (a) (b) | | $ | 450,000 | | | $ | 387,161 | |
BHMS Mortgage Trust | | | | | | | | |
Series 2018-ATLS, Class A, 1 mo. USD LIBOR + 1.250% 1.409% FRN 7/15/35 (a) | | | 770,000 | | | | 750,844 | |
Series 2018-ATLS, Class B, 1 mo. USD LIBOR + 1.500% 1.659% FRN 7/15/35 (a) | | | 950,000 | | | | 912,023 | |
BX Commercial Mortgage Trust | | | | | | | | |
Series 2020-BXLP, Class D, 1 mo. USD LIBOR + 1.250% 1.409% FRN 12/15/36 (a) | | | 649,406 | | | | 643,115 | |
Series 2020-BXLP, Class E, 1 mo. USD LIBOR + 1.600% 1.759% FRN 12/15/36 (a) | | | 766,299 | | | | 753,129 | |
Series 2018-IND, Class E, 1 mo. USD LIBOR + 1.700% 1.859% FRN 11/15/35 (a) | | | 728,000 | | | | 725,974 | |
Series 2019-XL, Class E, 1 mo. USD LIBOR + 1.800% 1.959% FRN 10/15/36 (a) | | | 299,978 | | | | 298,205 | |
Series 2019-XL, Class F, 1 mo. USD LIBOR + 2.000% 2.159% FRN 10/15/36 (a) | | | 841,078 | | | | 829,803 | |
CAMB Commercial Mortgage Trust, Series 2019-LIFE, Class E, 1 mo. USD LIBOR + 2.150% | | | | | | | | |
2.309% FRN 12/15/37 (a) | | | 545,194 | | | | 541,680 | |
Commercial Mortgage Trust | | | | | | | | |
Series 2014-CR14, Class A2, 3.147% 2/10/47 | | | 90,050 | | | | 90,292 | |
Series 2015-DC1, Class B, 4.035% VRN 2/10/48 (b) | | | 333,000 | | | | 352,613 | |
Credit Suisse Mortgage Capital Certificates, Series 2019-ICE4, Class D, 1 mo. USD LIBOR + 1.600% | | | | | | | | |
1.759% FRN 5/15/36 (a) | | | 200,000 | | | | 198,002 | |
Hudson Yards Mortgage Trust, Series 2019-30HY, Class E, | | | | | | | | |
3.443% VRN 7/10/39 (a) (b) | | | 700,000 | | | | 720,046 | |
KNDL Mortgage Trust, Series 2019-KNSQ, Class E, 1 mo. USD LIBOR + 1.800% | | | | | | | | |
1.959% FRN 5/15/36 (a) | | | 251,000 | | | | 249,769 | |
Morgan Stanley Bank of America Merrill Lynch Trust, Series 2013-C7, Class B | | | | | | | | |
3.769% 2/15/46 | | | 250,000 | | | | 251,562 | |
Morgan Stanley Capital I Trust, Series 2012-STAR, Class D, | | | | | | | | |
3.926% VRN 8/05/34 (a) (b) | | | 400,000 | | | | 388,928 | |
The accompanying notes are an integral part of the financial statements.
119
MML Short-Duration Bond Fund – Portfolio of Investments (Continued) |
| | | Principal
Amount | | | Value | |
One New York Plaza Trust 2020-1NYP | | | | | | | | |
Series 2020-1NYP, Class C, 1 mo. USD LIBOR + 2.200% 2.359% FRN 1/15/26 (a) | | $ | 616,000 | | | $ | 616,185 | |
Series 2020-1NYP, Class D, 1 mo. USD LIBOR + 2.750% 2.909% FRN 1/15/26 (a) | | | 414,000 | | | | 414,123 | |
| | | | | | | | 9,590,215 | |
Home Equity Asset-Backed Securities — 0.0% |
Credit Suisse Seasoned Loan Trust, Series 2006-1, Class A, 1 mo. USD LIBOR + .240% | | | | | | | | |
0.388% FRN 10/25/34 (a) | | | 51,635 | | | | 51,289 | |
Other Asset-Backed Securities — 22.5% |
321 Henderson Receivables I LLC, Series 2006-1A, Class A1, 1 mo. USD LIBOR + .200% | | | | | | | | |
0.359% FRN 3/15/41 (a) | | | 24,607 | | | | 24,286 | |
321 Henderson Receivables I LLC, Series 2010-3A, Class A | | | | | | | | |
3.820% 12/15/48 (a) | | | 152,428 | | | | 163,521 | |
AASET Trust | | | | | | | | |
Series 2017-1A, Class A, 3.967% 5/16/42 (a) | | | 142,463 | | | | 132,121 | |
Series 2018-2A, Class A, 4.454% 11/18/38 (a) | | | 276,604 | | | | 261,313 | |
Adams Outdoor Advertising LP, Series 2018-1, Class A | | | | | | | | |
4.810% 11/15/48 (a) | | | 383,027 | | | | 403,884 | |
Affirm Asset Securitization Trust | | | | | | | | |
Series 2020-Z2, Class A, 1.900% 1/15/25 (a) | | | 1,796,966 | | | | 1,795,788 | |
Series 2020-A, Class A, 2.100% 2/18/25 (a) | | | 1,235,000 | | | | 1,241,446 | |
Series 2020-Z1, Class A, 3.460% 10/15/24 (a) | | | 346,738 | | | | 346,164 | |
Ares LV CLO Ltd., Series 2020-55A, Class A1, 3 mo. USD LIBOR + 1.700% | | | | | | | | |
1.937% FRN 4/15/31 (a) | | | 500,000 | | | | 501,570 | |
Bain Capital Credit CLO Ltd. | | | | | | | | |
Series 2016-2A, Class BR, 3 mo. USD LIBOR + 1.800% 2.037% FRN 1/15/29 (a) | | | 750,000 | | | | 750,000 | |
Series 2020-2A, Class A, 3 mo. USD LIBOR + 1.850% 2.068% FRN 7/21/31 (a) | | | 500,000 | | | | 501,517 | |
Benefit Street Partners CLO X Ltd., Series 2016-10A, Class A2R, 3 mo. USD LIBOR + 1.750% | | | | | | | | |
1.987% FRN 1/15/29 (a) | | | 500,000 | | | | 499,998 | |
| | | Principal
Amount | | | Value | |
BRE Grand Islander Timeshare Issuer LLC | | | | | | | | |
Series 2017-1A, Class A, 2.940% 5/25/29 (a) | | $ | 90,458 | | | $ | 90,837 | |
Series 2019-A, Class B, 3.780% 9/26/33 (a) | | | 256,213 | | | | 259,024 | |
Business Jet Securities 2020-1 LLC, Series 2020-1A, Class A | | | | | | | | |
2.981% 11/15/35 (a) | | | 247,552 | | | | 250,890 | |
Capital Automotive REIT | | | | | | | | |
Series 2017-1A, Class A1, 3.870% 4/15/47 (a) | | | 239,046 | | | | 239,385 | |
Series 2017-1A, Class A2, 4.180% 4/15/47 (a) | | | 597,615 | | | | 598,992 | |
CARS-DB4 LP, Series 2020-1A, Class B1 | | | | | | | | |
4.170% 2/15/50 (a) | | | 484,000 | | | | 503,990 | |
Castlelake Aircraft Structured Trust, Series 2018-1, Class A | | | | | | | | |
4.125% 6/15/43 (a) | | | 270,416 | | | | 257,031 | |
Cbam CLO Management Cbam, Series 2018-6A, Class A1R, 3 mo. USD LIBOR + 1.270% | | | | | | | | |
1.507% FRN 1/15/31 (a) | | | 500,000 | | | | 500,022 | |
Cedar Funding IX CLO Ltd., Series 2018-9A, Class A1, 3 mo. USD LIBOR + .980% | | | | | | | | |
1.198% FRN 4/20/31 (a) | | | 250,000 | | | | 249,146 | |
CF Hippolyta LLC, Series 2020-1, Class B1 | | | | | | | | |
2.280% 7/15/60 (a) | | | 96,392 | | | | 97,883 | |
CIFC Funding IV Ltd., Series 2015-4A, Class A2R, | | | | | | | | |
2.068% FRN 10/20/27 (a) (b) | | | 300,000 | | | | 300,029 | |
DB Master Finance LLC | | | | | | | | |
Series 2019-1A, Class A2I, 3.787% 5/20/49 (a) | | | 272,550 | | | | 277,865 | |
Series 2019-1A, Class A2II, 4.021% 5/20/49 (a) | | | 321,925 | | | | 337,136 | |
Diamond Resorts Owner Trust, Series 2018-1, Class A | | | | | | | | |
3.700% 1/21/31 (a) | | | 140,389 | | | | 143,287 | |
Domino’s Pizza Master Issuer LLC, Series 2018-1A, Class A2I | | | | | | | | |
4.116% 7/25/48 (a) | | | 351,900 | | | | 368,716 | |
Elara HGV Timeshare Issuer LLC | | | | | | | | |
Series 2017-A, Class A, 2.690% 3/25/30 (a) | | | 98,828 | | | | 98,516 | |
Series 2016-A, Class A, 2.730% 4/25/28 (a) | | | 179,188 | | | | 178,441 | |
Series 2017-A, Class B, 2.960% 3/25/30 (a) | | | 292,823 | | | | 287,950 | |
The accompanying notes are an integral part of the financial statements.
120
MML Short-Duration Bond Fund – Portfolio of Investments (Continued) |
| | | Principal
Amount | | | Value | |
Series 2014-A, Class B, 3.020% VRN 2/25/27 (a) (b) | | $ | 20,764 | | | $ | 20,742 | |
Series 2019-A, Class C, 3.450% 1/25/34 (a) | | | 606,352 | | | | 595,603 | |
Elmwood CLO II Ltd., Series 2019-2A, Class A, 3 mo. USD LIBOR + 1.450% | | | | | | | | |
1.668% FRN 4/20/31 (a) | | | 350,000 | | | | 350,308 | |
FCI Funding LLC, Series 2019-1A, Class A | | | | | | | | |
3.630% 2/18/31 (a) | | | 80,689 | | | | 81,941 | |
Goodgreen Trust | | | | | | | | |
Series 2019-2A, Class A, 2.760% 10/15/54 (a) | | | 548,745 | | | | 567,177 | |
Series 2016-1A, Class A, 3.230% 10/15/52 (a) | | | 273,488 | | | | 281,745 | |
Series 2019-1A, Class A, 3.860% 10/15/54 (a) | | | 263,666 | | | | 278,681 | |
Series 2018-1A, Class A, 3.930% VRN 10/15/53 (a) (b) | | | 236,689 | | | | 252,316 | |
Hero Funding Trust | | | | | | | | |
Series 2017-3A, Class A1, 3.190% 9/20/48 (a) | | | 159,617 | | | | 164,408 | |
Series 2016-4A, Class A1, 3.570% 9/20/47 (a) | | | 160,368 | | | | 168,131 | |
Series 2015-1A, Class A, 3.840% 9/21/40 (a) | | | 329,418 | | | | 348,194 | |
Series 2018-1A, Class A2, 4.670% 9/20/48 (a) | | | 290,791 | | | | 311,335 | |
Hilton Grand Vacations Trust, Series 2017-AA, Class B | | | | | | | | |
2.960% 12/26/28 (a) | | | 111,869 | | | | 112,778 | |
HIN Timeshare Trust, Series 2020-A, Class B | | | | | | | | |
2.230% 10/09/39 (a) | | | 951,489 | | | | 966,817 | |
Horizon Aircraft Finance III Ltd, Series 2019-2, Class B | | | | | | | | |
4.458% 11/15/39 (a) | | | 683,333 | | | | 585,792 | |
Horizon Aircraft Finance Ltd. | | | | | | | | |
Series 2019-2, Class A, 3.425% 11/15/39 (a) | | | 386,309 | | | | 373,276 | |
Series 2018-1, Class A, 4.458% 12/15/38 (a) | | | 532,581 | | | | 514,432 | |
KDAC Aviation Finance Ltd., Series 2017-1A, Class A | | | | | | | | |
4.212% 12/15/42 (a) | | | 190,448 | | | | 171,777 | |
| | | Principal
Amount | | | Value | |
KKR CLO Ltd., Series 28A, Class A, 3 mo. USD LIBOR + 1.140% | | | | | | | | |
1.357% FRN 3/15/31 (a) | | $ | 250,000 | | | $ | 249,363 | |
KREF Ltd. | | | | | | | | |
Series 2018-FL1, Class A, 1 mo. USD LIBOR + 1.100% 1.253% FRN 6/15/36 (a) | | | 800,000 | | | | 798,644 | |
Series 2018-FL1, Class AS, 1 mo. USD LIBOR + 1.350% 1.503% FRN 6/15/36 (a) | | | 1,150,000 | | | | 1,147,174 | |
Lendmark Funding Trust, Series 2018-1A, Class A | | | | | | | | |
3.810% 12/21/26 (a) | | | 350,000 | | | | 354,308 | |
Lunar Aircraft Ltd., Series 2020-1A, Class A | | | | | | | | |
3.376% 2/15/45 (a) | | | 172,806 | | | | 163,205 | |
MACH 1 Cayman Ltd., Series 2019-1, Class A | | | | | | | | |
3.474% 10/15/39 (a) | | | 353,520 | | | | 341,516 | |
Magnetite XXVI Ltd., Series 2020-26A, Class A, 3 mo. USD LIBOR + 1.750% | | | | | | | | |
1.987% FRN 7/15/30 (a) | | | 750,000 | | | | 752,435 | |
Mariner Finance Issuance Trust, Series 2018-AA, Class A | | | | | | | | |
4.200% 11/20/30 (a) | | | 777,119 | | | | 784,648 | |
Marlette Funding Trust | | | | | | | | |
Series 2019-2A, Class A, 3.130% 7/16/29 (a) | | | 47,312 | | | | 47,715 | |
Series 2019-2A, Class B, 3.530% 7/16/29 (a) | | | 146,000 | | | | 149,276 | |
Mosaic Solar Loans LLC | | | | | | | | |
Series 2018-2GS, Class A, 4.200% 2/22/44 (a) | | | 217,550 | | | | 234,255 | |
Series 2017-1A, Class A, 4.450% 6/20/42 (a) | | | 55,621 | | | | 59,817 | |
Neuberger Berman CLO Ltd., Series 2015-20A, Class BR, 3 mo. USD LIBOR + 1.250% | | | | | | | | |
1.487% FRN 1/15/28 (a) | | | 600,000 | | | | 595,246 | |
NP SPE II LLC | | | | | | | | |
Series 2019-1A, Class A1, 2.574% 9/20/49 (a) | | | 194,072 | | | | 194,123 | |
Series 2017-1A, Class A1, 3.372% 10/21/47 (a) | | | 130,255 | | | | 134,708 | |
NRZ Advance Receivables Trust 2015-ON1, Series 2020-T3, Class DT3 | | | | | | | | |
2.458% 10/15/52 (a) | | | 411,000 | | | | 411,003 | |
The accompanying notes are an integral part of the financial statements.
121
MML Short-Duration Bond Fund – Portfolio of Investments (Continued) |
| | | Principal
Amount | | | Value | |
Oak Street Investment Grade Net Lease Fund Series 2020-1, Series 2020-1A, Class A3 | | | | | | | | |
2.260% 11/20/50 (a) | | $ | 400,000 | | | $ | 399,585 | |
OCP CLO Ltd., Series 2015-8A, Class A2AR, 3 mo. USD LIBOR + 1.450% | | | | | | | | |
1.668% FRN 4/17/27 (a) | | | 650,000 | | | | 649,883 | |
OneMain Financial Issuance Trust, Series 2019-2A, Class C | | | | | | | | |
3.660% 10/14/36 (a) | | | 600,000 | | | | 619,373 | |
Orange Lake Timeshare Trust | | | | | | | | |
Series 2016-A, Class B, 2.910% 3/08/29 (a) | | | 126,532 | | | | 125,781 | |
Series 2019-A, Class D, 4.930% 4/09/38 (a) | | | 474,486 | | | | 458,224 | |
Oxford Finance Funding Trust, Series 2020-1A, Class A2 | | | | | | | | |
3.101% 2/15/28 (a) | | | 281,000 | | | | 287,334 | |
Planet Fitness Master Issuer LLC, Series 2018-1A, Class A2I | | | | | | | | |
4.262% 9/05/48 (a) | | | 586,500 | | | | 589,080 | |
PNMAC GMSR Issuer Trust, Series 2018-GT1, Class A, 1 mo. USD LIBOR + 2.850% | | | | | | | | |
2.998% FRN 2/25/23 (a) | | | 250,000 | | | | 245,774 | |
RAMP Series 2005-EFC1 Trust, Series 2005-EFC1, Class M5, 1 mo. USD LIBOR + .975% | | | | | | | | |
1.123% FRN 5/25/35 | | | 500,000 | | | | 493,206 | |
Recette CLO Ltd., Series 2015-1A, Class CR, 3 mo. USD LIBOR + 1.700% | | | | | | | | |
1.918% FRN 10/20/27 (a) | | | 250,000 | | | | 249,738 | |
Rockford Tower CLO Ltd., Series 2017-3A, Class A, 3 mo. USD LIBOR + 1.190% | | | | | | | | |
1.408% FRN 10/20/30 (a) | | | 1,000,000 | | | | 1,000,008 | |
RR 3 Ltd., Series 2018-3A, Class A1R2, 3 mo. USD LIBOR + 1.090% | | | | | | | | |
1.327% FRN 1/15/30 (a) | | | 400,000 | | | | 398,916 | |
RR 6 Ltd., Series 2019-6A, Class A1A, 3 mo. USD LIBOR + 1.250% | | | | | | | | |
1.487% FRN 4/15/30 (a) | | | 250,000 | | | | 250,005 | |
SBA Tower Trust, Series 2014-2A, Class C, | | | | | | | | |
3.869% STEP 10/15/49 (a) | | | 430,000 | | | | 459,796 | |
Sierra Receivables Funding LLC | | | | | | | | |
Series 2016-2A, Class B, 2.780% 7/20/33 (a) | | | 80,996 | | | | 80,933 | |
Series 2017-1A, Class A, 2.910% 3/20/34 (a) | | | 138,286 | | | | 140,329 | |
��
| | | Principal
Amount | | | Value | |
Series 2019-3A, Class C, 3.000% 8/20/36 (a) | | $ | 314,875 | | | $ | 316,139 | |
Series 2020-2A, Class C, 3.510% 7/20/37 (a) | | | 104,663 | | | | 106,930 | |
Series 2018-1A, Class B, 4.036% 4/20/35 | | | 299,045 | | | | 305,971 | |
Series 2019-1A, Class D, 4.750% 1/20/36 (a) | | | 252,524 | | | | 254,238 | |
SoFi Consumer Loan Program Trust, Series 2016-1A, Class A | | | | | | | | |
3.260% 8/25/25 (a) | | | 115,469 | | | | 116,178 | |
SoFi Consumer Loan Program Trust, Series 2019-3, Class D | | | | | | | | |
3.890% 5/25/28 (a) | | | 772,000 | | | | 780,585 | |
SpringCastle America Funding LLC, Series 2020-AA, Class A | | | | | | | | |
1.970% 9/25/37 (a) | | | 870,307 | | | | 875,628 | |
Stack Infrastructure Issuer LLC, Series 2020-1A, Class A2 | | | | | | | | |
1.893% 8/25/45 (a) | | | 162,000 | | | | 163,709 | |
Store Master Funding I-VII, Series 2018-1A, Class A3 | | | | | | | | |
4.400% 10/20/48 (a) | | | 513,933 | | | | 527,231 | |
Structured Asset Securities Corp. Mortgage Loan Trust, Series 2006-GEL1, Class M2, 1 mo. USD LIBOR + 1.200% | | | | | | | | |
1.348% FRN 11/25/35 (a) | | | 205,701 | | | | 196,265 | |
TAL Advantage VII LLC, Series 2020-1A, Class B | | | | | | | | |
3.820% 9/20/45 (a) | | | 876,375 | | | | 873,430 | |
TICP CLO XI Ltd., Series 2018-11A, Class A, | | | | | | | | |
1.398% FRN 10/20/31 (a) (b) | | | 400,000 | | | | 400,001 | |
TLF National Tax Lien Trust, Series 2017-1A, Class A | | | | | | | | |
3.090% 12/15/29 (a) | | | 288,544 | | | | 290,496 | |
Trafigura Securitisation Finance PLC | | | | | | | | |
Series 2018-1A, Class A1, 1 mo. USD LIBOR + .730% 0.889% FRN 3/15/22 (a) | | | 610,000 | | | | 609,701 | |
Series 2018-1A, Class B, 4.290% 3/15/22 (a) | | | 920,000 | | | | 920,791 | |
Treman Park CLO Ltd., Series 2015-1A, Class ARR, 3 mo. USD LIBOR + 1.070% | | | | | | | | |
1.288% FRN 10/20/28 (a) | | | 1,000,000 | | | | 1,000,020 | |
Trinity Rail Leasing LP, Series 2019-1A, Class A | | | | | | | | |
3.820% 4/17/49 (a) | | | 632,086 | | | | 661,060 | |
The accompanying notes are an integral part of the financial statements.
122
MML Short-Duration Bond Fund – Portfolio of Investments (Continued) |
| | | Principal
Amount | | | Value | |
Trip Rail Master Funding LLC | | | | | | | | |
Series 2017-1A, Class A1, 2.709% 8/15/47 (a) | | $ | 35,989 | | | $ | 36,035 | |
Series 2011-1A, Class A2, 6.024% 7/15/41 (a) | | | 668,991 | | | | 691,484 | |
Triton Container Finance VIII LLC, Series 2020-1A, Class A | | | | | | | | |
2.110% 9/20/45 (a) | | | 587,249 | | | | 592,938 | |
Upstart Securitization Trust, Series 2020-3, Class A | | | | | | | | |
1.702% 11/20/30 (a) | | | 1,109,017 | | | | 1,107,694 | |
Vantage Data Centers LLC, Series 2020-1A, Class A2 | | | | | | | | |
1.645% 9/15/45 (a) | | | 675,000 | | | | 679,626 | |
VSE VOI Mortgage LLC, Series 2018-A, Class C | | | | | | | | |
4.020% 2/20/36 (a) | | | 145,938 | | | | 143,459 | |
Welk Resorts LLC | | | | | | | | |
Series 2015-AA, Class A, 2.790% 6/16/31 (a) | | | 30,312 | | | | 30,305 | |
Series 2017-AA, Class B, 3.410% 6/15/33 (a) | | | 105,416 | | | | 104,122 | |
Westgate Resorts LLC | | | | | | | | |
Series 2017-1A, Class A, 3.050% 12/20/30 (a) | | | 74,640 | | | | 75,446 | |
Series 2018-1A, Class A, 3.380% 12/20/31 (a) | | | 168,060 | | | | 170,744 | |
Willis Engine Structured Trust IV, Series 2018-A, Class A, | | | | | | | | |
4.750% STEP 9/15/43 (a) | | | 220,790 | | | | 190,548 | |
| | | | | | | | 42,892,376 | |
Student Loans Asset-Backed Securities — 8.0% |
Access Group, Inc., Series 2015-1, Class B, 1 mo. USD LIBOR + 1.500% | | | | | | | | |
1.648% FRN 7/25/58 (a) | | | 140,000 | | | | 127,989 | |
College Avenue Student Loans LLC | | | | | | | | |
Series 2018-A, Class A1, 1 mo. USD LIBOR + 1.200% 1.348% FRN 12/26/47 (a) | | | 410,741 | | | | 412,798 | |
Series 2017-A, Class A1, FRN, 1 mo. USD LIBOR + 1.650% 1.798% FRN 11/26/46 (a) | | | 331,850 | | | | 333,288 | |
Series 2017-A, Class B, 4.500% 11/26/46 (a) | | | 700,000 | | | | 715,431 | |
College Loan Corp. Trust I, Series 2005-2, Class B, 3 mo. USD LIBOR + .490% | | | | | | | | |
0.727% FRN 1/15/37 | | | 160,193 | | | | 144,033 | |
Commonbond Student Loan Trust | | | | | | | | |
Series 2019-AGS, Class B, 3.040% 1/25/47 (a) | | | 378,421 | | | | 377,238 | |
| | | Principal
Amount | | | Value | |
Series 2018-AGS, Class C, 3.820% 2/25/44 (a) | | $ | 34,993 | | | $ | 35,482 | |
Series 2018-BGS, Class C, 4.120% 9/25/45 (a) | | | 40,350 | | | | 40,651 | |
Series 2018-CGS, Class C, 4.350% 2/25/46 (a) | | | 21,075 | | | | 21,120 | |
Series 2017-AGS, Class C, 5.280% 5/25/41 (a) | | | 74,980 | | | | 76,985 | |
Credit Suisse ABS Repackaging Trust, Series 2013-A, Class B | | | | | | | | |
2.500% 1/25/30 (a) | | | 53,212 | | | | 53,441 | |
DRB Prime Student Loan Trust, Series 2016-R, Class A1, 1 mo. USD LIBOR + 1.900% | | | | | | | | |
2.045% FRN 10/25/44 (a) | | | 95,480 | | | | 96,001 | |
Earnest Student Loan Program LLC, Series 2016-B, Class A1, 1 mo. USD LIBOR + 2.050% | | | | | | | | |
2.200% FRN 2/26/35 (a) | | | 49,722 | | | | 47,042 | |
ECMC Group Student Loan Trust, Series 2018-2A, Class A, 1 mo. USD LIBOR + .800% | | | | | | | | |
0.948% FRN 9/25/68 (a) | | | 389,565 | | | | 386,409 | |
EdLinc Student Loan Funding, Series 2017-A, Class A, PRIME - 1.150% | | | | | | | | |
3.600% FRN 12/01/47 (a) | | | 310,133 | | | | 306,680 | |
ELFI Graduate Loan Program LLC, Series 2018-A, Class B | | | | | | | | |
4.000% 8/25/42 (a) | | | 166,158 | | | | 164,825 | |
Higher Education Funding I, Series 2004-1, Class B1, 28 day ARS | | | | | | | | |
1.796% FRN 1/01/44 (a) | | | 950,000 | | | | 844,712 | |
Laurel Road Prime Student Loan Trust | | | | | | | | |
Series 2019-A, Class BFX, 3.000% 10/25/48 (a) | | | 256,646 | | | | 259,603 | |
Series 2017-B, Class CFX, 3.610% 8/25/42 (a) | | | 172,101 | | | | 164,003 | |
Series 2018-B, Class BFX, 3.720% 5/26/43 (a) | | | 191,151 | | | | 194,353 | |
Navient Private Education Loan Trust, Series 2018-BA, Class A2B, 1 mo. USD LIBOR + .720% | | | | | | | | |
0.879% FRN 12/15/59 (a) | | | 141,838 | | | | 141,304 | |
Navient Private Education Refi Loan Trust, Series 2020-BA, Class B | | | | | | | | |
2.770% 1/15/69 (a) | | | 2,200,000 | | | | 2,232,892 | |
Navient Student Loan Trust, Series 2018-1A, Class A3, 1 mo. USD LIBOR + .720% | | | | | | | | |
0.868% FRN 3/25/67 (a) | | | 850,000 | | | | 842,173 | |
The accompanying notes are an integral part of the financial statements.
123
MML Short-Duration Bond Fund – Portfolio of Investments (Continued) |
| | | Principal
Amount | | | Value | |
Nelnet Private Education Loan Trust | | | | | | | | |
Series 2016-A, Class A1A, 1 mo. USD LIBOR + 1.750% 1.898% FRN 12/26/40 (a) | | $ | 83,438 | | | $ | 83,813 | |
Series 2016-A, Class A1B, 3.600% 12/26/40 (a) | | | 60,083 | | | | 60,369 | |
Nelnet Student Loan Trust | | | | | | | | |
Series 2007-2A, Class A4A2, 28 day ARS 1.497% FRN 6/25/35 (a) | | | 600,000 | | | | 575,566 | |
Series 2014-1A, Class B, 1 mo. USD LIBOR + 1.500% 1.648% FRN 10/25/47 (a) | | | 270,000 | | | | 254,084 | |
Series 2015-3A, Class B, 1 mo. USD LIBOR + 1.500% 1.650% FRN 6/25/54 (a) | | | 130,000 | | | | 125,723 | |
SLC Student Loan Trust, Series 2005-1, Class B, 3 mo. USD LIBOR + .200% | | | | | | | | |
0.421% FRN 2/15/45 | | | 290,514 | | | | 261,462 | |
SLM Student Loan Trust | | | | | | | | |
Series 2006-2, Class R, 0.000% 1/25/41 | | | 1,396 | | | | 767,800 | |
Series 2006-7, Class B, 3 mo. USD LIBOR + .200% 0.415% FRN 1/27/42 | | | 901,701 | | | | 798,977 | |
Series 2006-5, Class B, 3 mo. USD LIBOR + .210% 0.425% FRN 10/25/40 | | | 349,440 | | | | 312,384 | |
Series 2005-6, Class B, 3 mo. USD LIBOR + .290% 0.505% FRN 1/25/44 | | | 473,966 | | | | 422,733 | |
Series 2003-14, Class A6, 3 mo. USD LIBOR + .300% 0.515% FRN 7/25/25 | | | 78,774 | | | | 78,338 | |
Series 2005-9, Class B, 3 mo. USD LIBOR + .300% 0.515% FRN 1/25/41 | | | 356,259 | | | | 330,454 | |
Series 2005-8, Class B, 3 mo. USD LIBOR + .310% 0.525% FRN 1/25/55 | | | 140,288 | | | | 129,844 | |
SMB Private Education Loan Trust | | | | | | | | |
Series 2018-C, Class A2B, 1 mo. USD LIBOR + .750% 0.909% FRN 11/15/35 (a) | | | 432,588 | | | | 429,260 | |
Series 2019-A, Class A2B, 1 mo. USD LIBOR + .870% 1.029% FRN 7/15/36 (a) | | | 487,827 | | | | 485,758 | |
Series 2019-B, Class A2B, 1 mo. USD LIBOR + 1.000% 1.159% FRN 6/15/37 (a) | | | 500,000 | | | | 500,753 | |
Series 2016-C, Class A2B, 1 mo. USD LIBOR + 1.100% 1.259% FRN 9/15/34 (a) | | | 157,936 | | | | 159,408 | |
Series 2014-A, Class A2B, 1 mo. USD LIBOR + 1.150% 1.309% FRN 5/15/26 (a) | | $ | 100,717 | | | $ | 100,891 | |
Series 2016-B, Class A2B, 1 mo. USD LIBOR + 1.450% 1.609% FRN 2/17/32 (a) | | | 69,384 | | | | 69,693 | |
SoFi Professional Loan Program LLC | | | | | | | | |
Series 2017-D, Class R1, 0.000% 9/25/40 (a) | | | 1,000,000 | | | | 289,460 | |
Series 2018-A, Class R1, 0.000% 2/25/42 (a) | | | 1,000,000 | | | | 369,874 | |
Series 2018-D, Class R1, 0.000% 2/25/48 (a) | | | 956,000 | | | | 211,372 | |
Series 2019-A, Class R1, 0.000% 6/15/48 (a) | | | 1,314,800 | | | | 283,208 | |
Series 2016-D, Class A1, 1 mo. USD LIBOR + .950% 1.098% FRN 1/25/39 (a) | | | 25,213 | | | | 25,233 | |
Series 2016-B, Class A1, 1 mo. USD LIBOR + 1.200% 1.348% FRN 6/25/33 (a) | | | 45,582 | | | | 45,822 | |
| | | | | | | | 15,190,732 | |
Whole Loan Collateral Collateralized Mortgage Obligations — 6.3% |
Angel Oak Mortgage Trust | | | | | | | | |
Series 2020-5, Class A2, 1.579% VRN 5/25/65 (a) (b) | | | 389,146 | | | | 391,096 | |
Series 2020-5, Class A3, 2.041% VRN 5/25/65 (a) (b) | | | 350,755 | | | | 352,489 | |
Series 2018-3, Class A3, 3.238% VRN 5/25/59 (a) (b) | | | 216,560 | | | | 219,285 | |
Series 2019-6, Class M1, 3.389% VRN 11/25/59 (a) (b) | | | 800,000 | | | | 813,397 | |
Bank of America Mortgage Securities, Series 2004-G, Class 2A7, | | | | | | | | |
3.076% VRN 8/25/34 (b) | | | 3,185 | | | | 3,122 | |
BRAVO Residential Funding Trust, Series 2020-NQM1, Class A3, | | | | | | | | |
2.406% VRN 5/25/60 (a) (b) | | | 373,168 | | | | 378,089 | |
CIM Trust, Series 2019-INV3, Class A11, 1 mo. USD LIBOR + 1.000% | | | | | | | | |
1.100% FRN 8/25/49 (a) | | | 1,041,813 | | | | 1,043,904 | |
Citigroup Mortgage Loan Trust | | | | | | | | |
Series 2019-IMC1, Class A3, 3.030% VRN 7/25/49 (a) (b) | | | 385,533 | | | | 393,420 | |
Series 2019-IMC1, Class M1, 3.170% VRN 7/25/49 (a) (b) | | | 391,000 | | | | 403,233 | |
Deephaven Residential Mortgage Trust | | | | | | | | |
Series 2018-1A, Class A2, 3.027% VRN 12/25/57 (a) (b) | | | 118,395 | | | | 119,286 | |
Series 2019-4A, Class M1, 3.484% VRN 10/25/59 (a) (b) | | | 550,000 | | | | 558,243 | |
The accompanying notes are an integral part of the financial statements.
124
MML Short-Duration Bond Fund – Portfolio of Investments (Continued) |
| | | Principal
Amount | | | Value | |
Series 2018-2A, Class A3, 3.684% VRN 4/25/58 (a) (b) | | $ | 346,132 | | | $ | 345,849 | |
Series 2018-3A, Class A3, 3.963% VRN 8/25/58 (a) (b) | | | 236,395 | | | | 239,496 | |
Series 2018-4A, Class A3, 4.285% VRN 10/25/58 (a) (b) | | | 368,559 | | | | 368,855 | |
Homeward Opportunities Fund I Trust, Series 2020-2, Class A1, | | | | | | | | |
1.657% VRN 5/25/65 (a) (b) | | | 361,339 | | | | 364,356 | |
JP Morgan Mortgage Trust | | | | | | | | |
Series 2018-1, Class A5, 3.500% VRN 6/25/48 (a) (b) | | | 73,126 | | | | 73,803 | |
Series 2018-3, Class A5, 3.500% VRN 9/25/48 (a) (b) | | | 169,641 | | | | 171,553 | |
Series 2018-4, Class A15, 3.500% VRN 10/25/48 (a) (b) | | | 12,715 | | | | 12,703 | |
Series 2017-6, Class A5, 3.500% VRN 12/25/48 (a) (b) | | | 92,766 | | | | 93,549 | |
New Residential Mortgage Loan Trust | | | | | | | | |
Series 2016-4A, Class A1, 3.750% VRN 11/25/56 (a) (b) | | | 209,359 | | | | 221,698 | |
Series 2019-NQM2, Class A3, 3.752% VRN 4/25/49 (a) (b) | | | 153,052 | | | | 155,918 | |
Series 2019-NQM1, Class A3, 3.928% VRN 1/25/49 (a) (b) | | | 364,675 | | | | 371,861 | |
PSMC Trust | | | | | | | | |
Series 2018-1, Class A3, 3.500% VRN 2/25/48 (a) (b) | | | 95,346 | | | | 95,974 | |
Series 2018-2, Class A3, 3.500% VRN 6/25/48 (a) (b) | | | 60,016 | | | | 60,155 | |
Sequoia Mortgage Trust | | | | | | | | |
Series 2018-3, Class A4, 3.500% VRN 3/25/48 (a) (b) | | | 142,245 | | | | 143,430 | |
Series 2018-5, Class A4, 3.500% VRN 5/25/48 (a) (b) | | | 52,627 | | | | 52,817 | |
Series 2018-CH1, Class A10, 4.000% VRN 2/25/48 (a) (b) | | | 74,635 | | | | 75,151 | |
Series 2018-CH2, Class A12, 4.000% VRN 6/25/48 (a) (b) | | | 192,335 | | | | 194,258 | |
Series 2018-CH3, Class A11, 4.000% VRN 8/25/48 (a) (b) | | | 67,914 | | | | 68,156 | |
Shellpoint Co-Originator Trust, Series 2016-1, Class 2A3, | | | | | | | | |
3.000% VRN 10/25/31 (a) (b) | | | 367,808 | | | | 376,386 | |
Starwood Mortgage Residential Trust, Series 2019-INV1, Class A3, | | | | | | | | |
2.916% VRN 9/27/49 (a) (b) | | | 532,984 | | | | 547,086 | |
TIAA Bank Mortgage Loan Trust, Series 2018-2, Class A4, | | | | | | | | |
3.500% VRN 7/25/48 (a) (b) | | | 30,524 | | | | 30,581 | |
| | | Principal
Amount | | | Value | |
Verus Securitization Trust | | | | | | | | |
Series 2020-1, Class M1, 3.021% VRN 1/25/60 (a) (b) | | $ | 1,034,000 | | | $ | 1,037,525 | |
Series 2019-4, Class M1, 3.207% VRN 11/25/59 (a) (b) | | | 430,000 | | | | 433,335 | |
Series 2019-INV2, Class A3, 3.219% VRN 7/25/59 (a) (b) | | | 813,605 | | | | 837,360 | |
Series 2019-INV3, Class M1, 3.279% VRN 11/25/59 (a) (b) | | | 265,000 | | | | 271,249 | |
Series 2020-4, Class M1, 3.291% VRN 5/25/65 (a) (b) | | | 548,000 | | | | 561,829 | |
| | | | | | | | 11,880,497 | |
Whole Loan Collateral Support Collateralized Mortgage Obligations — 0.3% |
Onslow Bay Financial LLC, Series 2020-INV1, Class A21, | | | | | | | | |
3.500% VRN 12/25/49 (a) (b) | | | 520,687 | | | | 532,230 | |
| | | | | | | | | |
TOTAL NON-U.S. GOVERNMENT AGENCY OBLIGATIONS (Cost $92,960,525) | | | | | | | 92,270,351 | |
| | | | | | | | | |
U.S. GOVERNMENT AGENCY OBLIGATIONS AND INSTRUMENTALITIES — 1.6% |
Pass-Through Securities — 0.0% |
Federal National Mortgage Association Pool #775539 12 mo. USD LIBOR + 1.641% 2.516% 5/01/34 | | | 2,600 | | | | 2,703 | |
Government National Mortgage Association | | | | | | | | |
Pool #371146 7.000% 9/15/23 | | | 26 | | | | 27 | |
Pool #352022 7.000% 11/15/23 | | | 396 | | | | 419 | |
Pool #491089 7.000% 12/15/28 | | | 1,172 | | | | 1,275 | |
Pool #500928 7.000% 5/15/29 | | | 557 | | | | 640 | |
Pool #499410 7.000% 7/15/29 | | | 206 | | | | 237 | |
Pool #510083 7.000% 7/15/29 | | | 140 | | | | 160 | |
Pool #493723 7.000% 8/15/29 | | | 413 | | | | 477 | |
Pool #581417 7.000% 7/15/32 | | | 819 | | | | 932 | |
Government National Mortgage Association II | | | | | | | | |
Pool #008746 1 year CMT + 1.500% 3.125% FRN 11/20/25 | | | 460 | | | | 467 | |
Pool #080136 1 year CMT + 1.500% 3.125% FRN 11/20/27 | | | 104 | | | | 106 | |
| | | | | | | | 7,443 | |
The accompanying notes are an integral part of the financial statements.
125
MML Short-Duration Bond Fund – Portfolio of Investments (Continued) |
| | | Principal
Amount | | | Value | |
Whole Loans — 1.6% |
Federal Home Loan Mortgage Corp. Structured Agency Credit Risk Debt Notes | | | | | | | | |
Series 2020-DNA3, Class M1, 1 mo. USD LIBOR + 1.500% 1.648% FRN 6/25/50 (a) | | $ | 170,082 | | | $ | 170,310 | |
Series 2020-DNA5, Class M2, SOFR30A + 2.800% 2.882% FRN 10/25/50 (a) | | | 566,000 | | | | 572,024 | |
Series 2020-DNA3, Class M2, 1 mo. USD LIBOR + 3.000% 3.148% FRN 6/25/50 (a) | | | 1,436,000 | | | | 1,443,810 | |
Federal National Mortgage Association Connecticut Avenue Securities Trust | | | | | | | | |
Series 2019-R03, Class 1M2, 1 mo. USD LIBOR + 2.150% 2.298% FRN 9/25/31 (a) | | | 366,582 | | | | 365,340 | |
Series 2019-R02, Class 1M2, 1 mo. USD LIBOR + 2.300% 2.448% FRN 8/25/31 (a) | | | 445,527 | | | | 444,094 | |
| | | | | | | | 2,995,578 | |
| | | | | | | | | |
TOTAL U.S. GOVERNMENT AGENCY OBLIGATIONS AND INSTRUMENTALITIES (Cost $2,995,966) | | | | | | | 3,003,021 | |
| | | | | | | | | |
U.S. TREASURY OBLIGATIONS — 0.7% |
U.S. Treasury Bonds & Notes — 0.7% |
U.S. Treasury Note | | | | | | | | |
8.000% 11/15/21 (c) | | | 1,220,000 | | | | 1,302,708 | |
| | | | | | | | | |
TOTAL U.S. TREASURY OBLIGATIONS (Cost $1,395,661) | | | | | | | 1,302,708 | |
| | | | | | | | | |
TOTAL BONDS & NOTES (Cost $179,040,573) | | | | | | | 181,106,160 | |
| | | | | | | | | |
TOTAL PURCHASED OPTIONS (#) — 0.0% (Cost $147,532) | | | | | | | 80,604 | |
| | | | | | | | | |
TOTAL LONG-TERM INVESTMENTS (Cost $179,188,105) | | | | | | | 181,186,764 | |
| | | Principal
Amount | | | Value | |
SHORT-TERM INVESTMENTS — 4.7% |
Commercial Paper — 4.5% |
CenterPoint Energy, Inc. | | | | | | | | |
0.233% 1/08/21 (a) | | $ | 2,000,000 | | | $ | 1,999,950 | |
Duke Energy Corp. | | | | | | | | |
0.223% 1/19/21 (a) | | | 2,000,000 | | | | 1,999,807 | |
National Grid PLC | | | | | | | | |
0.254% 1/06/21 (a) | | | 1,500,000 | | | | 1,499,967 | |
Standard Chartered Bank | | | | | | | | |
0.284% 5/10/21 (a) | | | 1,000,000 | | | | 999,231 | |
Suncor Energy, Inc. | | | | | | | | |
0.254% 1/07/21 (a) | | | 1,000,000 | | | | 999,971 | |
Transcanada Pipeline Ltd. | | | | | | | | |
0.304% 1/14/21 (a) | | | 1,000,000 | | | | 999,935 | |
| | | | | | | | 8,498,861 | |
Repurchase Agreement — 0.2% |
Fixed Income Clearing Corp., Repurchase Agreement, dated 12/31/20, 0.000%, due 1/04/21 (d) | | | 388,093 | | | | 388,093 | |
| | | | | | | | | |
TOTAL SHORT-TERM INVESTMENTS (Cost $8,886,578) | | | | | | | 8,886,954 | |
| | | | | | | | | |
TOTAL INVESTMENTS — 99.8% (Cost $188,074,683) (e) | | | | | | | 190,073,718 | |
| | | | | | | | | |
Other Assets/(Liabilities) — 0.2% | | | | | | | 396,269 | |
| | | | | | | | | |
NET ASSETS — 100.0% | | | | | | $ | 190,469,987 | |
Abbreviation Legend
CLO | Collateralized Loan Obligation |
The accompanying notes are an integral part of the financial statements.
126
MML Short-Duration Bond Fund – Portfolio of Investments (Continued) |
Notes to Portfolio of Investments
Percentages are stated as a percent of net assets.
(a) | Security is exempt from registration under Regulation S or Rule 144A of the Securities Act of 1933. These securities are considered restricted and may be resold in transactions exempt from registration. At December 31, 2020, the aggregate market value of these securities amounted to $123,463,882 or 64.82% of net assets. |
(b) | Certain variable rate securities are not based on a published reference rate and spread but are determined by the issuer or agent and are based on current market conditions. These securities do not indicate a reference rate and spread in their description above. The rates shown are the current interest rates at December 31, 2020. |
(c) | A portion of this security is pledged/held as collateral for open derivatives. (Note 2). |
(d) | Maturity value of $388,093. Collateralized by U.S. Government Agency obligations with a rate of 0.000%, maturity date of 12/30/21, and an aggregate market value, including accrued interest, of $395,939. |
(e) | See Note 6 for aggregate cost for federal tax purposes. |
Country weightings, as a percentage of net assets, is as follows:
United States | | | 70.4 | % |
Cayman Islands | | | 9.7 | % |
United Kingdom | | | 1.8 | % |
Ireland | | | 1.6 | % |
Canada | | | 1.6 | % |
Bermuda | | | 1.4 | % |
Netherlands | | | 1.2 | % |
Luxembourg | | | 1.1 | % |
Japan | | | 1.0 | % |
Mexico | | | 0.9 | % |
India | | | 0.8 | % |
France | | | 0.8 | % |
Switzerland | | | 0.8 | % |
Spain | | | 0.4 | % |
Hong Kong | | | 0.4 | % |
Germany | | | 0.4 | % |
Sweden | | | 0.3 | % |
United Arab Emirates | | | 0.3 | % |
Denmark | | | 0.2 | % |
Total Long-Term Investments | | | 95.1 | % |
Short-Term Investments and Other Assets and Liabilities | | | 4.9 | % |
Net Assets | | | 100.0 | % |
(#) Interest Rate Swaptions Purchased
| | | | | | | | Paid by Fund | | | Received by Fund | | | | | | | | | | | | | | | | | | | | | |
Description | Counterparty | | Expiration
Date | | | Rate | | | Frequency | | | Rate | | | Frequency | | | Notional Amount | | | Value | | | Premium
Paid
(Received) | | | Unrealized
Appreciation/
(Depreciation) | |
Put | | | | | | | | | | | | | | | | | | | | | | | | | | | | | | | | | | | | | | | | | |
10-Year Interest Rate Swap, 2/02/43 | Credit Suisse International* | | | 1/31/33 | | | | 3.11% | | | | Semi-Annually | | | | 3-Month USD LIBOR BBA | | | | Quarterly | | | | USD | | | | 3,080,000 | | | $ | 80,604 | | | $ | 147,532 | | | $ | (66,928 | ) |
The accompanying notes are an integral part of the financial statements.
127
MML Short-Duration Bond Fund – Portfolio of Investments (Continued) |
Futures contracts
| | Expiration
Date | | | Number of
Contracts | | | Notional
Amount | | | Value/ Net
Unrealized
Appreciation/
(Depreciation) | |
Long | | | | | | | | | | | | | | | | |
U.S. Treasury Note 10 Year | | | 3/22/21 | | | | 152 | | | $ | 20,993,118 | | | $ | (5,243 | ) |
| | | | | | | | | | | | | | | | | |
Short | | | | | | | | | | | | | | | | |
90 Day Eurodollar | | | 3/15/21 | | | | 2 | | | $ | (487,743 | ) | | $ | (11,407 | ) |
U.S. Treasury Ultra 10 Year | | | 3/22/21 | | | | 54 | | | | (8,494,701 | ) | | | 51,295 | |
U.S. Treasury Note 2 Year | | | 3/31/21 | | | | 97 | | | | (21,410,939 | ) | | | (23,788 | ) |
U.S. Treasury Note 5 Year | | | 3/31/21 | | | | 548 | | | | (68,977,791 | ) | | | (160,116 | ) |
90 Day Eurodollar | | | 9/13/21 | | | | 3 | | | | (731,728 | ) | | | (16,997 | ) |
90 Day Eurodollar | | | 3/14/22 | | | | 3 | | | | (731,503 | ) | | | (17,147 | ) |
90 Day Eurodollar | | | 9/19/22 | | | | 3 | | | | (731,203 | ) | | | (17,260 | ) |
90 Day Eurodollar | | | 3/13/23 | | | | 2 | | | | (487,168 | ) | | | (11,557 | ) |
90 Day Eurodollar | | | 12/18/23 | | | | 3 | | | | (730,078 | ) | | | (16,285 | ) |
90 Day Eurodollar | | | 12/16/24 | | | | 7 | | | | (1,701,414 | ) | | | (35,461 | ) |
| | | | | | | | | | | | | | $ | (258,723 | ) |
* | Contracts are subject to a Master Netting Agreement. |
Currency Legend
The accompanying notes are an integral part of the financial statements.
128
MML Small Cap Equity Fund – Portfolio of Investments |
December 31, 2020 |
| | | Number of
Shares | | | Value | |
EQUITIES — 99.0% |
COMMON STOCK — 99.0% |
Basic Materials — 2.9% |
Forest Products & Paper — 0.6% |
Schweitzer-Mauduit International, Inc. | | | 20,097 | | | $ | 808,100 | |
Mining — 2.3% |
Compass Minerals International, Inc. | | | 23,614 | | | | 1,457,456 | |
Kaiser Aluminum Corp. | | | 15,484 | | | | 1,531,368 | |
| | | | | | | | 2,988,824 | |
| | | | | | | | 3,796,924 | |
Communications — 2.2% |
Internet — 1.7% |
Q2 Holdings, Inc. (a) (b) | | | 17,127 | | | | 2,167,079 | |
Telecommunications — 0.5% |
EchoStar Corp. Class A (a) | | | 29,545 | | | | 626,059 | |
| | | | | | | | 2,793,138 | |
Consumer, Cyclical — 13.0% |
Auto Parts & Equipment — 3.0% |
Dorman Products, Inc. (a) | | | 16,999 | | | | 1,475,853 | |
Visteon Corp. (a) | | | 18,656 | | | | 2,341,701 | |
| | | | | | | | 3,817,554 | |
Entertainment — 0.5% |
Cedar Fair LP (c) | | | 17,353 | | | | 682,667 | |
Retail — 9.5% |
AutoNation, Inc. (a) | | | 42,024 | | | | 2,932,855 | |
Big Lots, Inc. (b) | | | 13,855 | | | | 594,795 | |
BJ’s Wholesale Club Holdings, Inc. (a) | | | 43,463 | | | | 1,620,301 | |
Denny’s Corp. (a) | | | 51,368 | | | | 754,082 | |
Foot Locker, Inc. | | | 15,904 | | | | 643,158 | |
Jack in the Box, Inc. | | | 19,222 | | | | 1,783,801 | |
Ollie’s Bargain Outlet Holdings, Inc. (a) (b) | | | 5,492 | | | | 449,081 | |
Suburban Propane Partners LP (c) | | | 99,093 | | | | 1,472,522 | |
Texas Roadhouse, Inc. | | | 26,355 | | | | 2,059,907 | |
| | | | | | | | 12,310,502 | |
| | | | | | | | 16,810,723 | |
Consumer, Non-cyclical — 26.2% |
Biotechnology — 4.8% |
ADC Therapeutics SA (a) (b) | | | 10,499 | | | | 336,073 | |
Avid Bioservices, Inc. (a) | | | 9,214 | | | | 106,330 | |
Axsome Therapeutics, Inc. (a) (b) | | | 5,602 | | | | 456,395 | |
Emergent BioSolutions, Inc. (a) | | | 20,264 | | | | 1,815,654 | |
NeoGenomics, Inc. (a) (b) | | | 27,271 | | | | 1,468,271 | |
Twist Bioscience Corp. (a) | | | 10,029 | | | | 1,416,997 | |
Zai Lab Ltd. ADR (a) | | | 4,469 | | | | 604,835 | |
| | | | | | | | 6,204,555 | |
| | | Number of
Shares | | | Value | |
Commercial Services — 5.3% |
ASGN, Inc. (a) | | | 34,897 | | | $ | 2,914,946 | |
Korn Ferry | | | 57,233 | | | | 2,489,636 | |
Monro, Inc. | | | 26,902 | | | | 1,433,877 | |
| | | | | | | | 6,838,459 | |
Foods — 2.7% |
BellRing Brands, Inc. Class A (a) | | | 64,030 | | | | 1,556,569 | |
The Simply Good Foods Co. (a) (b) | | | 63,739 | | | | 1,998,855 | |
| | | | | | | | 3,555,424 | |
Health Care – Products — 6.2% |
Adaptive Biotechnologies Corp. (a) | | | 13,564 | | | | 802,039 | |
AtriCure, Inc. (a) | | | 25,121 | | | | 1,398,486 | |
Inspire Medical Systems, Inc. (a) | | | 8,628 | | | | 1,622,841 | |
iRhythm Technologies, Inc. (a) | �� | | 4,925 | | | | 1,168,259 | |
OraSure Technologies, Inc. (a) | | | 32,695 | | | | 346,077 | |
Repligen Corp. (a) | | | 4,907 | | | | 940,328 | |
Tandem Diabetes Care, Inc. (a) | | | 18,468 | | | | 1,767,018 | |
| | | | | | | | 8,045,048 | |
Health Care – Services — 4.5% |
Addus HomeCare Corp. (a) | | | 17,497 | | | | 2,048,724 | |
LHC Group, Inc. (a) | | | 11,047 | | | | 2,356,546 | |
Tenet Healthcare Corp. (a) | | | 35,424 | | | | 1,414,480 | |
| | | | | | | | 5,819,750 | |
Household Products & Wares — 1.5% |
Acco Brands Corp. | | | 227,534 | | | | 1,922,662 | |
Pharmaceuticals — 1.2% |
Collegium Pharmaceutical, Inc. (a) | | | 30,826 | | | | 617,445 | |
G1 Therapeutics, Inc. (a) (b) | | | 29,753 | | | | 535,256 | |
uniQure NV (a) | | | 11,231 | | | | 405,776 | |
| | | | | | | | 1,558,477 | |
| | | | | | | | 33,944,375 | |
Diversified — 0.3% |
Holding Company – Diversified — 0.3% |
Social Capital Hedosophia Holdings Corp. III Class A (a) | | | 24,503 | | | | 410,915 | |
Energy — 3.4% |
Energy – Alternate Sources — 2.3% |
Renewable Energy Group, Inc. (a) | | | 42,856 | | | | 3,035,062 | |
Oil & Gas — 0.6% |
CNX Resources Corp. (a) | | | 70,242 | | | | 758,614 | |
Pipelines — 0.5% |
Noble Midstream Partners LP (c) | | | 59,918 | | | | 624,345 | |
| | | | | | | | 4,418,021 | |
Financial — 20.0% |
Banks — 5.4% |
The Bank of NT Butterfield & Son Ltd. | | | 45,604 | | | | 1,421,021 | |
The accompanying notes are an integral part of the financial statements.
129
MML Small Cap Equity Fund – Portfolio of Investments (Continued) |
| | | Number of
Shares | | | Value | |
BankUnited, Inc. | | | 47,469 | | | $ | 1,650,972 | |
Cathay General Bancorp | | | 33,705 | | | | 1,084,964 | |
CIT Group, Inc. | | | 33,234 | | | | 1,193,100 | |
Heritage Financial Corp. | | | 40,856 | | | | 955,622 | |
Signature Bank | | | 5,383 | | | | 728,266 | |
| | | | | | | | 7,033,945 | |
Diversified Financial Services — 3.1% |
Federated Hermes, Inc. | | | 28,882 | | | | 834,401 | |
Focus Financial Partners, Inc. Class A (a) | | | 30,975 | | | | 1,347,413 | |
Stifel Financial Corp. | | | 37,233 | | | | 1,878,777 | |
| | | | | | | | 4,060,591 | |
Insurance — 0.3% |
Selectquote, Inc. (a) (b) | | | 19,526 | | | | 405,165 | |
Real Estate Investment Trusts (REITS) — 5.8% |
Brandywine Realty Trust | | | 102,364 | | | | 1,219,155 | |
DiamondRock Hospitality Co. | | | 199,816 | | | | 1,648,482 | |
EPR Properties | | | 38,367 | | | | 1,246,927 | |
Four Corners Property Trust, Inc. | | | 71,996 | | | | 2,143,321 | |
National Storage Affiliates Trust | | | 35,726 | | | | 1,287,208 | |
| | | | | | | | 7,545,093 | |
Savings & Loans — 5.4% |
Berkshire Hills Bancorp, Inc. | | | 41,401 | | | | 708,785 | |
OceanFirst Financial Corp. | | | 49,634 | | | | 924,681 | |
Pacific Premier Bancorp, Inc. | | | 50,313 | | | | 1,576,306 | |
Sterling Bancorp | | | 63,325 | | | | 1,138,584 | |
WSFS Financial Corp. | | | 57,427 | | | | 2,577,324 | |
| | | | | | | | 6,925,680 | |
| | | | | | | | 25,970,474 | |
Industrial — 15.2% |
Building Materials — 1.9% |
Masonite International Corp. (a) | | | 13,851 | | | | 1,362,107 | |
Summit Materials, Inc. Class A (a) | | | 57,197 | | | | 1,148,516 | |
| | | | | | | | 2,510,623 | |
Electrical Components & Equipment — 1.9% |
Energizer Holdings, Inc. | | | 28,479 | | | | 1,201,244 | |
EnerSys | | | 14,364 | | | | 1,193,074 | |
| | | | | | | | 2,394,318 | |
Electronics — 1.1% |
Atkore International Group, Inc. (a) | | | 35,121 | | | | 1,443,824 | |
Engineering & Construction — 3.5% |
Comfort Systems USA, Inc. | | | 12,201 | | | | 642,505 | |
KBR, Inc. | | | 72,924 | | | | 2,255,539 | |
TopBuild Corp. (a) | | | 8,967 | | | | 1,650,645 | |
| | | | | | | | 4,548,689 | |
| | | Number of
Shares | | | Value | |
Environmental Controls — 0.4% |
US Ecology, Inc. | | | 15,231 | | | $ | 553,342 | |
Machinery – Diversified — 1.1% |
Chart Industries, Inc. (a) | | | 12,031 | | | | 1,417,132 | |
Metal Fabricate & Hardware — 2.7% |
Rexnord Corp. | | | 66,075 | | | | 2,609,302 | |
Valmont Industries, Inc. | | | 4,881 | | | | 853,833 | |
| | | | | | | | 3,463,135 | |
Miscellaneous - Manufacturing — 1.1% |
EnPro Industries, Inc. | | | 18,738 | | | | 1,415,094 | |
Transportation — 1.5% |
CryoPort, Inc. (a) (b) | | | 25,603 | | | | 1,123,460 | |
Hub Group, Inc. Class A (a) | | | 13,587 | | | | 774,459 | |
| | | | | | | | 1,897,919 | |
| | | | | | | | 19,644,076 | |
Technology — 12.7% |
Computers — 2.5% |
CACI International, Inc. Class A (a) | | | 7,064 | | | | 1,761,267 | |
Perspecta, Inc. | | | 62,505 | | | | 1,505,121 | |
| | | | | | | | 3,266,388 | |
Semiconductors — 4.7% |
Allegro MicroSystems, Inc. (a) | | | 16,514 | | | | 440,263 | |
Brooks Automation, Inc. | | | 26,653 | | | | 1,808,406 | |
MKS Instruments, Inc. | | | 14,377 | | | | 2,163,020 | |
Semtech Corp. (a) | | | 23,961 | | | | 1,727,348 | |
| | | | | | | | 6,139,037 | |
Software — 5.5% |
1Life Healthcare, Inc. (a) (b) | | | 23,019 | | | | 1,004,779 | |
Bottomline Technologies de, Inc. (a) | | | 37,076 | | | | 1,955,388 | |
Envestnet, Inc. (a) | | | 11,538 | | | | 949,462 | |
Everbridge, Inc. (a) | | | 5,013 | | | | 747,288 | |
j2 Global, Inc. (a) | | | 25,008 | | | | 2,443,032 | |
| | | | | | | | 7,099,949 | |
| | | | | | | | 16,505,374 | |
Utilities — 3.1% |
Electric — 2.1% |
Avista Corp. | | | 29,732 | | | | 1,193,443 | |
Evoqua Water Technologies Corp. (a) | | | 55,752 | | | | 1,504,189 | |
| | | | | | | | 2,697,632 | |
Gas — 1.0% |
National Fuel Gas Co. | | | 19,907 | | | | 818,775 | |
The accompanying notes are an integral part of the financial statements.
130
MML Small Cap Equity Fund – Portfolio of Investments (Continued) |
| | | Number of
Shares | | | Value | |
South Jersey Industries, Inc. | | | 25,211 | | | $ | 543,297 | |
| | | | | | | | 1,362,072 | |
| | | | | | | | 4,059,704 | |
| | | | | | | | | |
TOTAL COMMON STOCK (Cost $89,567,436) | | | | | | | 128,353,724 | |
| | | | | | | | | |
TOTAL EQUITIES (Cost $89,567,436) | | | | | | | 128,353,724 | |
| | | | | | | | | |
MUTUAL FUNDS — 0.5% |
Diversified Financial Services — 0.5% |
State Street Navigator Securities Lending Prime Portfolio (d) | | | 610,629 | | | | 610,629 | |
| | | | | | | | | |
TOTAL MUTUAL FUNDS (Cost $610,629) | | | | | | | 610,629 | |
| | | | | | | | | |
TOTAL LONG-TERM INVESTMENTS (Cost $90,178,065) | | | | | | | 128,964,353 | |
| | | Principal
Amount | | | | | |
SHORT-TERM INVESTMENTS — 1.1% |
Repurchase Agreement — 1.1% |
Fixed Income Clearing Corp., Repurchase Agreement, dated 12/31/20, 0.000%, due 1/04/21 (e) | | $ | 1,459,998 | | | | 1,459,998 | |
| | | | | | | | | |
TOTAL SHORT-TERM INVESTMENTS (Cost $1,459,998) | | | | | | | 1,459,998 | |
| | | | | | | | | |
TOTAL INVESTMENTS — 100.6% (Cost $91,638,063) (f) | | | | | | | 130,424,351 | |
| | | | | | | | | |
Other Assets/(Liabilities) — (0.6)% | | | | | | | (836,048 | ) |
| | | | | | | | | |
NET ASSETS — 100.0% | | | | | | $ | 129,588,303 | |
Abbreviation Legend
ADR | American Depositary Receipt |
Notes to Portfolio of Investments
Percentages are stated as a percent of net assets.
(a) | Non-income producing security. |
(b) | Denotes all or a portion of security on loan. The total value of securities on loan as of December 31, 2020, was $8,370,606 or 6.46% of net assets. Total securities on loan may be less than the amounts identified in the Portfolio of Investments. The Fund received $7,963,702 of non-cash collateral (U.S. Treasury and/or Agency obligations) related to securities lending activity. This amount is not reflected on either the Portfolio of Investments or the Statement of Assets and Liabilities. (Note 2). |
(c) | Security is a Master Limited Partnership. |
(d) | Represents investment of security lending cash collateral. (Note 2). |
(e) | Maturity value of $1,459,998. Collateralized by U.S. Government Agency obligations with a rate of 0.000%, maturity date of 12/30/21, and an aggregate market value, including accrued interest, of $1,489,266. |
(f) | See Note 6 for aggregate cost for federal tax purposes. |
The accompanying notes are an integral part of the financial statements.
131
MML Special Situations Fund – Portfolio of Investments |
December 31, 2020 |
| | | Number of
Shares | | | Value | |
EQUITIES — 100.1% |
COMMON STOCK — 100.1% |
Basic Materials — 8.3% |
Chemicals — 7.6% |
Dow, Inc. | | | 45,082 | | | $ | 2,502,051 | |
GCP Applied Technologies, Inc. (a) | | | 2,992 | | | | 70,761 | |
Ingevity Corp. (a) | | | 2,561 | | | | 193,944 | |
| | | | | | | | 2,766,756 | |
Mining — 0.7% |
Alcoa Corp. (a) | | | 11,537 | | | | 265,928 | |
| | | | | | | | 3,032,684 | |
Communications — 26.4% |
Internet — 24.5% |
Chewy, Inc. Class A (a) (b) | | | 4,688 | | | | 421,404 | |
DoorDash, Inc. Class A (a) | | | 2,134 | | | | 304,628 | |
Lyft, Inc. Class A (a) (b) | | | 15,335 | | | | 753,409 | |
Pinterest, Inc. (a) | | | 31,054 | | | | 2,046,459 | |
Snap, Inc. Class A (a) | | | 55,539 | | | | 2,780,838 | |
Uber Technologies, Inc. (a) | | | 50,948 | | | | 2,598,348 | |
| | | | | | | | 8,905,086 | |
Media — 1.9% |
Altice USA, Inc. Class A (a) | | | 15,120 | | | | 572,594 | |
Madison Square Garden Entertainment Corp. (a) | | | 1,095 | | | | 115,019 | |
| | | | | | | | 687,613 | |
| | | | | | | | 9,592,699 | |
Consumer, Cyclical — 7.4% |
Apparel — 0.3% |
Kontoor Brands, Inc. (a) (b) | | | 2,911 | | | | 118,070 | |
Auto Parts & Equipment — 0.9% |
Adient PLC (a) | | | 5,826 | | | | 202,570 | |
Veoneer, Inc. (a) (b) | | | 5,817 | | | | 123,902 | |
| | | | | | | | 326,472 | |
Distribution & Wholesale — 2.0% |
IAA, Inc. (a) | | | 8,354 | | | | 542,843 | |
Resideo Technologies, Inc. (a) | | | 8,718 | | | | 185,345 | |
| | | | | | | | 728,188 | |
Entertainment — 2.8% |
Penn National Gaming, Inc. (a) | | | 9,168 | | | | 791,840 | |
Warner Music Group Corp. Class A | | | 5,497 | | | | 208,831 | |
| | | | | | | | 1,000,671 | |
Lodging — 1.4% |
Hilton Grand Vacations, Inc. (a) | | | 5,281 | | | | 165,559 | |
Wyndham Hotels & Resorts, Inc. | | | 5,789 | | | | 344,098 | |
| | | | | | | | 509,657 | |
| | | | | | | | 2,683,058 | |
| | | Number of
Shares | | | Value | |
Consumer, Non-cyclical — 15.8% |
Biotechnology — 5.9% |
Corteva, Inc. | | | 45,285 | | | $ | 1,753,435 | |
Maravai LifeSciences Holdings, Inc. (a) | | | 3,958 | | | | 111,022 | |
Royalty Pharma PLC Class A (b) | | | 5,299 | | | | 265,215 | |
| | | | | | | | 2,129,672 | |
Foods — 3.2% |
Lamb Weston Holdings, Inc. | | | 9,086 | | | | 715,432 | |
US Foods Holding Corp. (a) | | | 13,731 | | | | 457,379 | |
| | | | | | | | 1,172,811 | |
Health Care – Products — 2.6% |
Avantor, Inc. (a) | | | 31,975 | | | | 900,096 | |
Varex Imaging Corp. (a) | | | 2,432 | | | | 40,566 | |
| | | | | | | | 940,662 | |
Health Care – Services — 0.8% |
PPD, Inc. (a) | | | 6,726 | | | | 230,164 | |
Sotera Health Co. (a) | | | 2,927 | | | | 80,317 | |
| | | | | | | | 310,481 | |
Household Products & Wares — 0.3% |
Reynolds Consumer Products, Inc. | | | 3,383 | | | | 101,625 | |
Pharmaceuticals — 3.0% |
Covetrus, Inc. (a) | | | 6,150 | | | | 176,751 | |
Elanco Animal Health, Inc. (a) | | | 29,298 | | | | 898,570 | |
| | | | | | | | 1,075,321 | |
| | | | | | | | 5,730,572 | |
Energy — 1.6% |
Energy – Alternate Sources — 0.6% |
Array Technologies, Inc. (a) | | | 4,886 | | | | 210,782 | |
Oil & Gas Services — 0.5% |
ChampionX Corp. (a) | | | 11,532 | | | | 176,440 | |
Pipelines — 0.5% |
Equitrans Midstream Corp. | | | 25,226 | | | | 202,817 | |
| | | | | | | | 590,039 | |
Financial — 11.3% |
Diversified Financial Services — 1.4% |
Rocket Cos., Inc. (a) (b) | | | 7,159 | | | | 144,755 | |
Tradeweb Markets, Inc. Class A | | | 5,670 | | | | 354,091 | |
| | | | | | | | 498,846 | |
Insurance — 3.2% |
Athene Holding Ltd. Class A (a) | | | 7,734 | | | | 333,645 | |
Brighthouse Financial, Inc. (a) | | | 5,554 | | | | 201,082 | |
Equitable Holdings, Inc. | | | 24,854 | | | | 636,014 | |
| | | | | | | | 1,170,741 | |
Real Estate — 0.2% |
Newmark Group, Inc. Class A | | | 9,872 | | | | 71,967 | |
The accompanying notes are an integral part of the financial statements.
132
MML Special Situations Fund – Portfolio of Investments (Continued) |
| | | Number of
Shares | | | Value | |
Real Estate Investment Trusts (REITS) — 6.5% |
Invitation Homes, Inc. | | | 34,806 | | | $ | 1,033,738 | |
JBG SMITH Properties | | | 6,905 | | | | 215,919 | |
Park Hotels & Resorts, Inc. | | | 14,620 | | | | 250,733 | |
VICI Properties, Inc. | | | 33,343 | | | | 850,247 | |
| | | | | | | | 2,350,637 | |
| | | | | | | | 4,092,191 | |
Industrial — 17.5% |
Building Materials — 5.8% |
The AZEK Co., Inc. (a) | | | 6,525 | | | | 250,886 | |
Carrier Global Corp. | | | 49,527 | | | | 1,868,159 | |
| | | | | | | | 2,119,045 | |
Electronics — 5.5% |
Fortive Corp. | | | 20,938 | | | | 1,482,829 | |
nVent Electric PLC | | | 10,576 | | | | 246,315 | |
Vontier Corp. (a) | | | 8,359 | | | | 279,191 | |
| | | | | | | | 2,008,335 | |
Engineering & Construction — 1.2% |
Arcosa, Inc. | | | 2,995 | | | | 164,515 | |
frontdoor, Inc. (a) | | | 5,302 | | | | 266,214 | |
| | | | | | | | 430,729 | |
Machinery – Diversified — 5.0% |
Otis Worldwide Corp. | | | 25,104 | | | | 1,695,775 | |
Welbilt, Inc. (a) | | | 7,991 | | | | 105,481 | |
| | | | | | | | 1,801,256 | |
| | | | | | | | 6,359,365 | |
Technology — 11.8% |
Computers — 0.6% |
Perspecta, Inc. | | | 8,490 | | | | 204,439 | |
Software — 11.2% |
Avaya Holdings Corp. (a) | | | 4,657 | | | | 89,182 | |
C3.ai, Inc. (a) | | | 979 | | | | 135,836 | |
Concentrix Corp. (a) | | | 2,556 | | | | 252,277 | |
Dropbox, Inc. Class A (a) | | | 18,244 | | | | 404,834 | |
Snowflake, Inc. Class A (a) (b) | | | 2,015 | | | | 567,021 | |
Zoom Video Communications, Inc. Class A (a) | | | 7,109 | | | | 2,398,008 | |
ZoomInfo Technologies, Inc. Class A (a) (b) | | | 5,072 | | | | 244,623 | |
| | | | | | | | 4,091,781 | |
| | | | | | | | 4,296,220 | |
| | | | | | | | | |
TOTAL COMMON STOCK (Cost $31,818,475) | | | | | | | 36,376,828 | |
| | | | | | | | | |
TOTAL EQUITIES (Cost $31,818,475) | | | | | | | 36,376,828 | |
| | | Number of
Shares | | | Value | |
MUTUAL FUNDS — 2.0% |
Diversified Financial Services — 2.0% |
State Street Navigator Securities Lending Prime Portfolio (c) | | | 729,174 | | | $ | 729,174 | |
| | | | | | | | | |
TOTAL MUTUAL FUNDS (Cost $729,174) | | | | | | | 729,174 | |
| | | | | | | | | |
TOTAL LONG-TERM INVESTMENTS (Cost $32,547,649) | | | | | | | 37,106,002 | |
| | | | | | | | | |
TOTAL INVESTMENTS — 102.1% (Cost $32,547,649) (d) | | | | | | | 37,106,002 | |
| | | | | | | | | |
Other Assets/(Liabilities) — (2.1)% | | | | | | | (749,340 | ) |
| | | | | | | | | |
NET ASSETS — 100.0% | | | | | | $ | 36,356,662 | |
Notes to Portfolio of Investments
Percentages are stated as a percent of net assets.
(a) | Non-income producing security. |
(b) | Denotes all or a portion of security on loan. The total value of securities on loan as of December 31, 2020, was $2,089,646 or 5.75% of net assets. Total securities on loan may be less than the amounts identified in the Portfolio of Investments. The Fund received $1,416,859 of non-cash collateral (U.S. Treasury and/or Agency obligations) related to securities lending activity. This amount is not reflected on either the Portfolio of Investments or the Statement of Assets and Liabilities. (Note 2). |
(c) | Represents investment of security lending cash collateral. (Note 2). |
(d) | See Note 6 for aggregate cost for federal tax purposes. |
The accompanying notes are an integral part of the financial statements.
133
MML Strategic Emerging Markets Fund – Portfolio of Investments |
December 31, 2020 |
| | | Number of
Shares | | | Value | |
EQUITIES — 98.9% |
COMMON STOCK — 95.5% |
Belgium — 1.1% |
Anheuser-Busch InBev SA | | | 17,176 | | | $ | 1,200,302 | |
Bermuda — 1.6% |
Credicorp Ltd. | | | 6,412 | | | | 1,051,696 | |
Jardine Strategic Holdings Ltd. | | | 33,489 | | | | 833,357 | |
| | | | | | | | 1,885,053 | |
Brazil — 3.4% |
Ambev SA | | | 197,913 | | | | 598,051 | |
B3 SA - Brasil Bolsa Balcao | | | 85,253 | | | | 1,022,604 | |
Vale SA Sponsored ADR | | | 131,868 | | | | 2,210,108 | |
| | | | | | | | 3,830,763 | |
Cayman Islands — 23.3% |
Alibaba Group Holding Ltd. Sponsored ADR (a) | | | 16,495 | | | | 3,838,881 | |
Alibaba Group Holding Ltd. (a) | | | 6,400 | | | | 186,993 | |
Blue Moon Group Holdings Ltd. (a) (b) | | | 66,432 | | | | 130,765 | |
Budweiser Brewing Co. APAC Ltd. (b) | | | 235,300 | | | | 777,852 | |
Hansoh Pharmaceutical Group Co. Ltd. (a) (b) | | | 80,000 | | | | 389,068 | |
Huazhu Group Ltd. ADR | | | 76,424 | | | | 3,441,373 | |
Innovent Biologics, Inc. (a) (b) | | | 67,000 | | | | 711,616 | |
Meituan (a) | | | 23,800 | | | | 910,263 | |
NetEase, Inc. ADR | | | 450 | | | | 43,096 | |
New Oriental Education & Technology Group, Inc. Sponsored ADR (a) | | | 3,231 | | | | 600,352 | |
OneConnect Financial Technology Co. Ltd. (a) | | | 44,824 | | | | 883,481 | |
Pagseguro Digital Ltd. Class A (a) | | | 23,303 | | | | 1,325,475 | |
Pinduoduo, Inc. ADR (a) | | | 12,416 | | | | 2,205,951 | |
Tencent Holdings Ltd. | | | 110,509 | | | | 8,074,586 | |
Wuxi Biologics Cayman, Inc. (a) (b) | | | 49,500 | | | | 659,343 | |
ZTO Express Cayman, Inc. (a) | | | 5,387 | | | | 157,581 | |
ZTO Express Cayman, Inc. ADR | | | 81,146 | | | | 2,366,217 | |
| | | | | | | | 26,702,893 | |
Chile — 0.8% |
Falabella SA | | | 231,502 | | | | 860,092 | |
China — 4.6% |
Jiangsu Hengrui Medicine Co. Ltd. Class A | | | 150,787 | | | | 2,575,870 | |
Ping An Insurance Group Co. of China Ltd. Class A | | | 188,962 | | | | 2,514,254 | |
Remegen Co. Ltd. (a) (b) | | | 12,159 | | | | 148,999 | |
| | | | | | | | 5,239,123 | |
| | | Number of
Shares | | | Value | |
Colombia — 0.4% |
Grupo Aval Acciones y Valores SA (c) | | | 67,275 | | | $ | 462,852 | |
Egypt — 0.7% |
Commercial International Bank Egypt SAE | | | 197,436 | | | | 743,060 | |
France — 5.4% |
Kering SA | | | 7,195 | | | | 5,230,748 | |
LVMH Moet Hennessy Louis Vuitton SE | | | 79 | | | | 49,362 | |
Pernod Ricard SA | | | 4,922 | | | | 943,489 | |
| | | | | | | | 6,223,599 | |
Hong Kong — 3.9% |
AIA Group Ltd. | | | 366,600 | | | | 4,515,657 | |
India — 14.6% |
HDFC Bank Ltd. (a) | | | 52,639 | | | | 1,038,433 | |
Housing Development Finance Corp. Ltd. | | | 161,114 | | | | 5,661,599 | |
Infosys Ltd. | | | 72,314 | | | | 1,241,769 | |
Kotak Mahindra Bank Ltd. (a) | | | 166,034 | | | | 4,543,354 | |
Oberoi Realty Ltd. (a) | | | 62,677 | | | | 498,405 | |
Tata Consultancy Services Ltd. | | | 70,775 | | | | 2,779,588 | |
Zee Entertainment Enterprises Ltd. | | | 315,798 | | | | 970,790 | |
| | | | | | | | 16,733,938 | |
Indonesia — 1.2% |
Bank Central Asia Tbk PT | | | 372,900 | | | | 898,480 | |
Indocement Tunggal Prakarsa Tbk PT | | | 248,897 | | | | 256,797 | |
Semen Indonesia Persero Tbk PT | | | 286,200 | | | | 253,612 | |
| | | | | | | | 1,408,889 | |
Italy — 2.0% |
Moncler SpA (a) | | | 6,265 | | | | 383,206 | |
PRADA SpA (a) | | | 292,800 | | | | 1,936,481 | |
| | | | | | | | 2,319,687 | |
Luxembourg — 0.1% |
Allegro.eu SA (a) (b) | | | 5,831 | | | | 132,499 | |
Mexico — 5.6% |
Alsea SAB de CV (a) | | | 178,974 | | | | 232,132 | |
Fomento Economico Mexicano SAB de CV | | | 269,818 | | | | 2,046,465 | |
Fomento Economico Mexicano SAB de CV Sponsored ADR | | | 7,681 | | | | 581,989 | |
Grupo Aeroportuario del Sureste SAB de CV Class B (a) | | | 29,864 | | | | 494,930 | |
Grupo Financiero Inbursa SAB de CV Class O (a) | | | 383,734 | | | | 386,058 | |
Grupo Mexico SAB de CV Series B | | | 552,967 | | | | 2,345,028 | |
Wal-Mart de Mexico SAB de CV | | | 101,000 | | | | 283,721 | |
| | | | | | | | 6,370,323 | |
The accompanying notes are an integral part of the financial statements.
134
MML Strategic Emerging Markets Fund – Portfolio of Investments (Continued) |
| | | Number of
Shares | | | Value | |
Netherlands — 3.2% |
Yandex NV Class A (a) | | | 52,425 | | | $ | 3,647,731 | |
Philippines — 2.6% |
Ayala Land, Inc. | | | 1,165,900 | | | | 992,983 | |
SM Investments Corp. | | | 68,500 | | | | 1,498,416 | |
SM Prime Holdings, Inc. | | | 603,812 | | | | 484,147 | |
| | | | | | | | 2,975,546 | |
Republic of Korea — 1.7% |
AMOREPACIFIC Group | | | 3,734 | | | | 188,865 | |
Samsung Biologics Co. Ltd. (a) (b) | | | 2,243 | | | | 1,702,292 | |
| | | | | | | | 1,891,157 | |
Russia — 4.3% |
Novatek PJSC Sponsored GDR Registered (b) | | | 307 | | | | 50,164 | |
Novatek PJSC Sponsored GDR Registered (b) | | | 23,575 | | | | 3,824,878 | |
Polyus PJSC (a) | | | 1,511 | | | | 311,773 | |
Polyus PJSC GDR (b) (d) | | | 9 | | | | 907 | |
Polyus PJSC GDR (b) (d) | | | 3,164 | | | | 318,931 | |
Sberbank of Russia PJSC | | | 116,447 | | | | 426,742 | |
| | | | | | | | 4,933,395 | |
South Africa — 0.6% |
FirstRand Ltd. | | | 202,967 | | | | 707,768 | |
Switzerland — 1.7% |
Cie Financiere Richemont SA Registered | | | 22,046 | | | | 1,992,128 | |
Taiwan — 8.6% |
MediaTek, Inc. | | | 12,000 | | | | 320,470 | |
Taiwan Semiconductor Manufacturing Co. Ltd. | | | 505,000 | | | | 9,484,648 | |
| | | | | | | | 9,805,118 | |
Turkey — 0.5% |
Akbank T.A.S. (a) | | | 574,977 | | | | 537,975 | |
United States — 3.6% |
Yum China Holdings, Inc. | | | 72,601 | | | | 4,144,791 | |
| | | | | | | | | |
TOTAL COMMON STOCK (Cost $78,137,268) | | | | | | | 109,264,339 | |
| | | | | | | | | |
PREFERRED STOCK — 3.4% |
Brazil — 1.5% |
Lojas Americanas SA 0.640% | | | 337,522 | | | | 1,716,247 | |
India — 0.0% |
Zee Entertainment Enterprises Ltd. | | | | | | | | |
6.000% | | | 503,840 | | | | 27,444 | |
| | | Number of
Shares | | | Value | |
Singapore — 1.9% |
Grab Holdings, Inc. (Acquired 6/18/19, Cost $2,160,355) (a) (d) (e) (f) | | | 350,542 | | | $ | 2,160,355 | |
| | | | | | | | | |
TOTAL PREFERRED STOCK (Cost $3,951,070) | | | | | | | 3,904,046 | |
| | | | | | | | | |
TOTAL EQUITIES (Cost $82,088,338) | | | | | | | 113,168,385 | |
| | | | | | | | | |
MUTUAL FUNDS — 0.4% |
United States — 0.4% |
State Street Navigator Securities Lending Prime Portfolio (g) | | | 486,403 | | | | 486,403 | |
| | | | | | | | | |
TOTAL MUTUAL FUNDS (Cost $486,403) | | | | | | | 486,403 | |
| | | | | | | | | |
WARRANTS — 0.0% |
Switzerland — 0.0% |
Cie Financiere Richemont SA, Expires 11/22/23, Strike 67.00 (a) | | | 48,648 | | | | 12,639 | |
| | | | | | | | | |
TOTAL WARRANTS (Cost $0) | | | | | | | 12,639 | |
| | | | | | | | | |
TOTAL LONG-TERM INVESTMENTS (Cost $82,574,741) | | | | | | | 113,667,427 | |
| | | Principal
Amount | | | | | |
SHORT-TERM INVESTMENTS — 0.9% |
Repurchase Agreement — 0.9% |
Fixed Income Clearing Corp., Repurchase Agreement, dated 12/31/20, 0.000%, due 1/04/21 (h) | | $ | 966,520 | | | | 966,520 | |
| | | | | | | | | |
TOTAL SHORT-TERM INVESTMENTS (Cost $966,520) | | | | | | | 966,520 | |
| | | | | | | | | |
TOTAL INVESTMENTS — 100.2% (Cost $83,541,261) (i) | | | | | | | 114,633,947 | |
| | | | | | | | | |
Other Assets/(Liabilities) — (0.2)% | | | | | | | (252,183 | ) |
| | | | | | | | | |
NET ASSETS — 100.0% | | | | | | $ | 114,381,764 | |
The accompanying notes are an integral part of the financial statements.
135
MML Strategic Emerging Markets Fund – Portfolio of Investments (Continued) |
Abbreviation Legend
ADR | American Depositary Receipt |
GDR | Global Depositary Receipt |
Notes to Portfolio of Investments
Percentages are stated as a percent of net assets.
(a) | Non-income producing security. |
(b) | Security is exempt from registration under Regulation S or Rule 144A of the Securities Act of 1933. These securities are considered restricted and may be resold in transactions exempt from registration. At December 31, 2020, the aggregate market value of these securities amounted to $8,847,314 or 7.73% of net assets. |
(c) | Denotes all or a portion of security on loan. The total value of securities on loan as of December 31, 2020, was $461,579 or 0.40% of net assets. Total securities on loan may be less than the amounts identified in the Portfolio of Investments. (Note 2). |
(d) | This security is fair valued in good faith in accordance with procedures approved by the Board of Trustees. At December 31, 2020, these securities amounted to a value of $2,480,193 or 2.17% of net assets. |
(e) | Investment was valued using significant unobservable inputs. |
(f) | Restricted security. Certain securities are restricted as to resale. At December 31, 2020, these securities amounted to a value of $2,160,355 or 1.89% of net assets. The Fund generally bears the costs, if any, associated with the disposition of restricted securities. |
(g) | Represents investment of security lending cash collateral. (Note 2). |
(h) | Maturity value of $966,520. Collateralized by U.S. Government Agency obligations with a rate of 0.000%, maturity date of 12/30/21, and an aggregate market value, including accrued interest, of $985,852. |
(i) | See Note 6 for aggregate cost for federal tax purposes. |
Sector weightings, as a percentage of net assets, is as follows:
Financial | | | 24.3 | % |
Consumer, Cyclical | | | 19.0 | % |
Communications | | | 17.5 | % |
Technology | | | 12.9 | % |
Consumer, Non-cyclical | | | 12.3 | % |
Industrial | | | 5.0 | % |
Basic Materials | | | 4.5 | % |
Energy | | | 3.4 | % |
Mutual Funds | | | 0.4 | % |
Total Long-Term Investments | | | 99.3 | % |
Short-Term Investments and Other Assets and Liabilities | | | 0.7 | % |
Net Assets | | | 100.0 | % |
The accompanying notes are an integral part of the financial statements.
136
MML U.S. Government Money Market Fund – Portfolio of Investments |
December 31, 2020 |
| | | Principal
Amount | | | Value | |
SHORT-TERM INVESTMENTS — 100.2% |
Discount Notes — 79.7% |
Federal Farm Credit Bank | | | | | | | | |
SOFR + .080% 0.170% FRN , 1/01/21, 1/14/21 (a) | | $ | 2,000,000 | | | $ | 2,000,000 | |
1.544% , 1/29/21, 1/29/21 (a) | | | 100,000 | | | | 99,882 | |
Federal Home Loan Bank | | | | | | | | |
0.030% , 1/20/21, 1/20/21 (a) | | | 6,300,000 | | | | 6,299,900 | |
3 mo. USD LIBOR - .170% 0.064% FRN , 1/06/21, 1/06/21 (a) | | | 5,600,000 | | | | 5,600,016 | |
0.076% , 2/03/21, 2/03/21 (a) | | | 11,300,000 | | | | 11,299,223 | |
0.076% , 3/10/21, 3/10/21 (a) | | | 4,400,000 | | | | 4,399,377 | |
0.081% , 1/08/21, 1/08/21 (a) | | | 1,500,000 | | | | 1,499,977 | |
0.086% , 1/06/21, 1/06/21 (a) | | | 3,000,000 | | | | 2,999,965 | |
0.086% , 3/03/21, 3/03/21 (a) | | | 4,000,000 | | | | 3,999,424 | |
0.086% , 3/17/21, 3/17/21 (a) | | | 15,500,000 | | | | 15,497,255 | |
0.087% , 6/02/21, 6/02/21 (a) | | | 4,000,000 | | | | 3,998,547 | |
SOFR + .015% 0.105% FRN , 1/04/21, 5/19/21 (a) | | | 15,000,000 | | | | 15,000,000 | |
SOFR + .015% 0.105% FRN , 1/04/21, 5/21/21 (a) | | | 2,000,000 | | | | 2,000,000 | |
SOFR + .015% 0.105% FRN , 1/04/21, 6/15/21 (a) | | | 16,000,000 | | | | 16,000,000 | |
0.107% , 4/28/21, 4/28/21 (a) | | | 12,396,000 | | | | 12,391,770 | |
SOFR + .020% 0.110% FRN , 1/04/21, 8/23/21 (a) | | | 15,000,000 | | | | 15,000,000 | |
SOFR + .030% 0.120% FRN , 1/04/21, 1/28/21 (a) | | | 14,000,000 | | | | 14,000,000 | |
SOFR + .050% 0.140% FRN , 1/04/21, 1/28/21 (a) | | | 2,400,000 | | | | 2,400,000 | |
SOFR + .055% 0.145% FRN , 1/04/21, 5/13/22 (a) | | | 10,000,000 | | | | 10,000,000 | |
SOFR + .060% 0.150% FRN , 1/04/21, 2/11/22 (a) | | | 6,500,000 | | | | 6,500,000 | |
SOFR + .065% 0.155% FRN , 1/04/21, 2/26/21 (a) | | | 5,000,000 | | | | 5,000,000 | |
0.376% , 1/20/21, 1/20/21 (a) | | | 15,000,000 | | | | 14,997,071 | |
Federal Home Loan Mortgage Corp. SOFR + .030% 0.120% FRN, 1/01/21, 1/12/21(a) | | | 7,000,000 | | | | 7,000,001 | |
| | | | | | | | 177,982,408 | |
| | | Principal
Amount | | | Value | |
Repurchase Agreement — 6.7% |
HSBC Securities (USA) Inc., Tri-Party Repurchase Agreement, dated 12/31/20, 0.050%, due 1/04/21 (b) | | $ | 15,000,000 | | | $ | 15,000,000 | |
U.S. Treasury Bill — 13.8% |
U.S. Treasury Bill | | | | | | | | |
0.000% 1/14/21 | | | 8,500,000 | | | | 8,499,732 | |
0.000% 1/28/21 | | | 9,900,000 | | | | 9,899,443 | |
0.000% 2/02/21 | | | 8,300,000 | | | | 8,299,563 | |
0.000% 4/08/21 | | | 4,200,000 | | | | 4,199,083 | |
| | | | | | | | 30,897,821 | |
| | | | | | | | | |
TOTAL SHORT-TERM INVESTMENTS (Cost $223,880,229) | | | | | | | 223,880,229 | |
| | | | | | | | | |
TOTAL INVESTMENTS — 100.2% (Cost $223,880,229) (c) | | | | | | | 223,880,229 | |
| | | | | | | | | |
Other Assets/(Liabilities) — (0.2)% | | | | | | | (492,206 | ) |
| | | | | | | | | |
NET ASSETS — 100.0% | | | | | | $ | 223,388,023 | |
Abbreviation Legend
Notes to Portfolio of Investments
Percentages are stated as a percent of net assets.
(a) | The stated maturity dates reflect reset date and final maturity date, respectively. |
(b) | Maturity value of $15,000,083. Collateralized by U.S. Government Agency obligations with rates ranging from 0.000% - 3.000%, maturity dates ranging from 8/15/45 - 2/15/49, and an aggregate market value, including accrued interest, of $15,300,000. |
(c) | See Note 6 for aggregate cost for federal tax purposes. |
Currency Legend
The accompanying notes are an integral part of the financial statements.
137
MML Series Investment Fund II – Financial Statements | |
Statements of Assets and Liabilities
December 31, 2020 | |
| | | MML
Blend Fund | | | MML
Dynamic
Bond Fund | |
Assets: | | | | | | | | |
Investments, at value (Note 2) (a) | | $ | 791,499,550 | | | $ | 324,945,614 | |
Repurchase agreements, at value (Note 2) (b) | | | 1,084,404 | | | | 2,155,811 | |
Other short-term investments, at value (Note 2) (c) | | | — | | | | 249,930 | |
Total investments (d) | | | 792,583,954 | | | | 327,351,355 | |
Cash | | | — | | | | — | |
Foreign currency, at value (e) | | | — | | | | — | |
Receivables from: | | | | | | | | |
Investments sold | | | | | | | | |
Regular delivery | | | 2,586,915 | | | | 111,684 | |
Fund shares sold | | | 314,772 | | | | 521 | |
Collateral pledged for open futures contracts (Note 2) | | | — | | | | — | |
Investment adviser (Note 3) | | | — | | | | — | |
Interest and dividends | | | 6,699 | | | | 1,689,968 | |
Interest tax reclaim | | | 592 | | | | — | |
Foreign taxes withheld | | | — | | | | — | |
Open swap agreements, at value (Note 2) | | | — | | | | — | |
Total assets | | | 795,492,932 | | | | 329,153,528 | |
Liabilities: | | | | | | | | |
Payables for: | | | | | | | | |
Investments purchased | | | | | | | | |
Regular delivery | | | 2,173,064 | | | | 332,168 | |
Delayed delivery | | | — | | | | — | |
Collateral held for open swap agreements (Note 2) | | | — | | | | — | |
Collateral held for open purchased options (Note 2) | | | — | | | | — | |
Interest and dividends | | | — | | | | — | |
Fund shares repurchased | | | 380,121 | | | | 533,732 | |
Collateral held for securities on loan (Note 2) (f) | | | 14,726,250 | | | | — | |
Open swap agreements, at value (Note 2) | | | — | | | | — | |
Trustees’ fees and expenses (Note 3) | | | 179,788 | | | | 33,787 | |
Variation margin on open derivative instruments (Note 2) | | | — | | | | — | |
Affiliates (Note 3): | | | | | | | | |
Administration fees | | | — | | | | 42,711 | |
Investment advisory fees | | | 266,454 | | | | 113,894 | |
Service fees | | | 112,061 | | | | 7,613 | |
Due to custodian | | | 3 | | | | — | |
Commitment and Contingent Liabilities (Note 9) | | | — | | | | — | |
Accrued expense and other liabilities | | | 60,673 | | | | 118,169 | |
Total liabilities | | | 17,898,414 | | | | 1,182,074 | |
Net assets | | $ | 777,594,518 | | | $ | 327,971,454 | |
Net assets consist of: | | | | | | | | |
Paid-in capital | | $ | 531,312,376 | | | $ | 312,028,865 | |
Accumulated Gain (Loss) | | | 246,282,142 | | | | 15,942,589 | |
Net assets | | $ | 777,594,518 | | | $ | 327,971,454 | |
(a) | Cost of investments: | | $ | 770,487,321 | | | $ | 318,501,193 | |
(b) | Cost of repurchase agreements: | | $ | 1,084,404 | | | $ | 2,155,811 | |
(c) | Cost of other short-term investments: | | $ | — | | | $ | 249,925 | |
(d) | Securities on loan with market value of: | | $ | 20,897,235 | | | $ | — | |
(e) | Cost of foreign currency: | | $ | — | | | $ | — | |
(f) | Non-cash collateral is not included. | | | | | | | | |
The accompanying notes are an integral part of the financial statements.
138
| | MML
Equity Fund | | | MML
Equity
Momentum
Fund | | | MML
Equity
Rotation Fund | | | MML
High Yield Fund | | | MML
Inflation-
Protected and
Income Fund | |
| | | | | | | | | | | | | | | | | | | | |
| | $ | 776,728,113 | | | $ | 40,320,209 | | | $ | 41,037,601 | | | $ | 95,311,945 | | | $ | 261,894,181 | |
| | | 2,699,237 | | | | — | | | | 274,992 | | | | 1,812,986 | | | | 4,836,327 | |
| | | 454,618 | | | | — | | | | — | | | | — | | | | 56,982,549 | |
| | | 779,881,968 | | | | 40,320,209 | | | | 41,312,593 | | | | 97,124,931 | | | | 323,713,057 | |
| | | — | | | | 44,022 | | | | — | | | | 256,773 | | | | — | |
| | | — | | | | 3,748 | | | | — | | | | — | | | | — | |
| | | | | | | | | | | | | | | | | | | | |
| | | | | | | | | | | | | | | | | | | | |
| | | 784,539 | | | | — | | | | — | | | | 3,379 | | | | 944,722 | |
| | | 1,149,065 | | | | 33 | | | | 39 | | | | 4,038 | | | | 9,957,536 | |
| | | — | | | | — | | | | — | | | | — | | | | 125,000 | |
| | | — | | | | — | | | | — | | | | 5,845 | | | | 13,040 | |
| | | 666,921 | | | | 12,470 | | | | 55,853 | | | | 1,601,054 | | | | 341,030 | |
| | | — | | | | — | | | | — | | | | — | | | | — | |
| | | 20,332 | | | | 9,382 | | | | — | | | | — | | | | — | |
| | | — | | | | — | | | | — | | | | — | | | | 4,639,031 | |
| | | 782,502,825 | | | | 40,389,864 | | | | 41,368,485 | | | | 98,996,020 | | | | 339,733,416 | |
| | | | | | | | | | | | | | | | | | | | |
| | | | | | | | | | | | | | | | | | | | |
| | | | | | | | | | | | | | | | | | | | |
| | | 628,917 | | | | — | | | | 241,347 | | | | 1,036,885 | | | | — | |
| | | — | | | | — | | | | — | | | | 157,342 | | | | — | |
| | | — | | | | — | | | | — | | | | — | | | | 3,340,000 | |
| | | — | | | | — | | | | — | | | | — | | | | 1,290,000 | |
| | | — | | | | — | | | | — | | | | — | | | | 256,509 | |
| | | 173,902 | | | | — | | | | — | | | | 114,005 | | | | 300,096 | |
| | | 273,983 | | | | — | | | | 30,445 | | | | — | | | | — | |
| | | — | | | | — | | | | — | | | | — | | | | 4,270 | |
| | | 222,924 | | | | 2,092 | | | | 2,179 | | | | 19,181 | | | | 77,148 | |
| | | — | | | | — | | | | — | | | | — | | | | 7,616 | |
| | | | | | | | | | | | | | | | | | | | |
| | | — | | | | 5,023 | | | | 5,137 | | | | 12,525 | | | | — | |
| | | 267,335 | | | | 20,093 | | | | 15,410 | | | | 50,102 | | | | 156,160 | |
| | | 56,432 | | | | 1,224 | | | | 1,291 | | | | 28,460 | | | | 28,729 | |
| | | — | | | | — | | | | — | | | | — | | | | — | |
| | | — | | | | — | | | | — | | | | — | | | | — | |
| | | 70,009 | | | | 22,749 | | | | 29,345 | | | | 45,804 | | | | 66,050 | |
| | | 1,693,502 | | | | 51,181 | | | | 325,154 | | | | 1,464,304 | | | | 5,526,578 | |
| | $ | 780,809,323 | | | $ | 40,338,683 | | | $ | 41,043,331 | | | $ | 97,531,716 | | | $ | 334,206,838 | |
| | | | | | | | | | | | | | | | | | | | |
| | $ | 647,002,950 | | | $ | 32,241,381 | | | $ | 29,624,060 | | | $ | 101,164,604 | | | $ | 301,299,873 | |
| | | 133,806,373 | | | | 8,097,302 | | | | 11,419,271 | | | | (3,632,888 | ) | | | 32,906,965 | |
| | $ | 780,809,323 | | | $ | 40,338,683 | | | $ | 41,043,331 | | | $ | 97,531,716 | | | $ | 334,206,838 | |
| | $ | 612,736,733 | | | $ | 38,554,907 | | | $ | 38,739,968 | | | $ | 93,241,748 | | | $ | 259,100,221 | |
| | $ | 2,699,237 | | | $ | — | | | $ | 274,992 | | | $ | 1,812,986 | | | $ | 4,836,327 | |
| | $ | 454,618 | | | $ | — | | | $ | — | | | $ | — | | | $ | 56,981,960 | |
| | $ | 3,054,690 | | | $ | — | | | $ | 425,922 | | | $ | — | | | $ | — | |
| | $ | — | | | $ | 3,705 | | | $ | — | | | $ | — | | | $ | — | |
| | | | | | | | | | | | | | | | | | | | |
The accompanying notes are an integral part of the financial statements.
139
MML Series Investment Fund II – Financial Statements (Continued) | |
Statements of Assets and Liabilities
December 31, 2020 | |
| | | MML
Blend Fund | | | MML
Dynamic
Bond Fund | |
Initial Class shares: | | | | | | | | |
Net assets | | $ | 591,889,296 | | | $ | — | |
Shares outstanding (a) | | | 23,872,409 | | | | — | |
Net asset value, offering price and redemption price per share | | $ | 24.79 | | | $ | — | |
Class II shares: | | | | | | | | |
Net assets | | $ | — | | | $ | 315,513,674 | |
Shares outstanding (a) | | | — | | | | 30,229,445 | |
Net asset value, offering price and redemption price per share | | $ | — | | | $ | 10.44 | |
Service Class shares: | | | | | | | | |
Net assets | | $ | 185,705,222 | | | $ | — | |
Shares outstanding (a) | | | 7,529,909 | | | | — | |
Net asset value, offering price and redemption price per share | | $ | 24.66 | | | $ | — | |
Service Class I shares: | | | | | | | | |
Net assets | | $ | — | | | $ | 12,457,780 | |
Shares outstanding (a) | | | — | | | | 1,198,582 | |
Net asset value, offering price and redemption price per share | | $ | — | | | $ | 10.39 | |
(a) | Authorized unlimited number of shares with no par value. |
The accompanying notes are an integral part of the financial statements.
140
| | MML
Equity Fund | | | MML
Equity
Momentum
Fund | | | MML
Equity
Rotation Fund | | | MML
High Yield Fund | | | MML
Inflation-
Protected and
Income Fund | |
| | | | | | | | | | | | | | | | | | | | |
| | $ | 686,468,379 | | | $ | — | | | $ | — | | | $ | — | | | $ | 288,025,514 | |
| | | 27,416,967 | | | | — | | | | — | | | | — | | | | 25,236,678 | |
| | $ | 25.04 | | | $ | — | | | $ | — | | | $ | — | | | $ | 11.41 | |
| | | | | | | | | | | | | | | | | | | | |
| | $ | — | | | $ | 38,291,057 | | | $ | 38,833,638 | | | $ | 50,804,724 | | | $ | — | |
| | | — | | | | 2,888,630 | | | | 2,625,041 | | | | 5,030,345 | | | | — | |
| | $ | — | | | $ | 13.26 | | | $ | 14.79 | | | $ | 10.10 | | | $ | — | |
| | | | | | | | | | | | | | | | | | | | |
| | $ | 94,340,944 | | | $ | — | | | $ | — | | | $ | — | | | $ | 46,181,324 | |
| | | 3,833,235 | | | | — | | | | — | | | | — | | | | 4,077,648 | |
| | $ | 24.61 | | | $ | — | | | $ | — | | | $ | — | | | $ | 11.33 | |
| | | | | | | | | | | | | | | | | | | | |
| | $ | — | | | $ | 2,047,626 | | | $ | 2,209,693 | | | $ | 46,726,992 | | | $ | — | |
| | | — | | | | 155,630 | | | | 150,027 | | | | 4,654,895 | | | | — | |
| | $ | — | | | $ | 13.16 | | | $ | 14.73 | | | $ | 10.04 | | | $ | — | |
The accompanying notes are an integral part of the financial statements.
141
MML Series Investment Fund II – Financial Statements (Continued) | |
Statements of Assets and Liabilities
December 31, 2020 | |
| | | MML
Managed
Bond Fund | | | MML
Short-Duration
Bond Fund | |
Assets: | | | | | | | | |
Investments, at value (Note 2) (a) | | $ | 1,005,389,382 | | | $ | 181,186,764 | |
Repurchase agreements, at value (Note 2) (b) | | | 1,309,931 | | | | 388,093 | |
Other short-term investments, at value (Note 2) (c) | | | 141,957,689 | | | | 8,498,861 | |
Total investments (d) | | | 1,148,657,002 | | | | 190,073,718 | |
Cash | | | 589 | | | | 42,592 | |
Foreign currency, at value (e) | | | — | | | | — | |
Receivables from: | | | | | | | | |
Investments sold | | | | | | | | |
Regular delivery | | | — | | | | — | |
Delayed delivery | | | 6,463,867 | | | | — | |
Fund shares sold | | | 16,099,393 | | | | 1,367 | |
Investment adviser (Note 3) | | | — | | | | — | |
Variation margin on open derivative instruments (Note 2) | | | 230,327 | | | | — | |
Interest and dividends | | | 5,658,455 | | | | 951,183 | |
Interest tax reclaim | | | — | | | | 351 | |
Foreign taxes withheld | | | — | | | | — | |
Total assets | | | 1,177,109,633 | | | | 191,069,211 | |
Liabilities: | | | | | | | | |
Payables for: | | | | | | | | |
Investments purchased | | | | | | | | |
Regular delivery | | | — | | | | — | |
Delayed delivery | | | 144,718,879 | | | | — | |
Collateral held for open purchased options (Note 2) | | | 2,105,000 | | | | 150,000 | |
Collateral held for when-issued securities (Note 2) | | | 350,000 | | | | — | |
Fund shares repurchased | | | 969,038 | | | | 235,969 | |
Collateral held for securities on loan (Note 2) (f) | | | — | | | | — | |
Trustees’ fees and expenses (Note 3) | | | 219,765 | | | | 32,027 | |
Variation margin on open derivative instruments (Note 2) | | | — | | | | 23,804 | |
Affiliates (Note 3): | | | | | | | | |
Administration fees | | | — | | | | 24,572 | |
Investment advisory fees | | | 341,949 | | | | 57,334 | |
Service fees | | | 164,731 | | | | 27,971 | |
Commitment and Contingent Liabilities (Note 9) | | | — | | | | — | |
Accrued expense and other liabilities | | | 94,412 | | | | 47,547 | |
Total liabilities | | | 148,963,774 | | | | 599,224 | |
Net assets | | $ | 1,028,145,859 | | | $ | 190,469,987 | |
Net assets consist of: | | | | | | | | |
Paid-in capital | | $ | 940,703,340 | | | $ | 193,793,064 | |
Accumulated Gain (Loss) | | | 87,442,519 | | | | (3,323,077 | ) |
Net assets | | $ | 1,028,145,859 | | | $ | 190,469,987 | |
(a) | Cost of investments: | | $ | 968,119,883 | | | $ | 179,188,105 | |
(b) | Cost of repurchase agreements: | | $ | 1,309,931 | | | $ | 388,093 | |
(c) | Cost of other short-term investments: | | $ | 141,960,074 | | | $ | 8,498,485 | |
(d) | Securities on loan with market value of: | | $ | — | | | $ | — | |
(e) | Cost of foreign currency: | | $ | — | | | $ | — | |
(f) | Non-cash collateral is not included. | | | | | | | | |
The accompanying notes are an integral part of the financial statements.
142
| | MML
Small Cap
Equity Fund | | | MML
Special
Situations Fund | | | MML
Strategic
Emerging
Markets Fund | | | MML
U.S. Government
Money
Market Fund | |
| | | | | | | | | | | | | | | | |
| | $ | 128,964,353 | | | $ | 37,106,002 | | | $ | 113,667,427 | | | $ | — | |
| | | 1,459,998 | | | | — | | | | 966,520 | | | | 15,000,000 | |
| | | — | | | | — | | | | — | | | | 208,880,229 | |
| | | 130,424,351 | | | | 37,106,002 | | | | 114,633,947 | | | | 223,880,229 | |
| | | — | | | | 13,802 | | | | — | | | | 13,687 | |
| | | — | | | | — | | | | 65,805 | | | | — | |
| | | | | | | | | | | | | | | | |
| | | | | | | | | | | | | | | | |
| | | 118,019 | | | | — | | | | 1,233,496 | | | | — | |
| | | — | | | | — | | | | — | | | | — | |
| | | 35,436 | | | | 68 | | | | 216 | | | | 128,119 | |
| | | — | | | | — | | | | — | | | | 77,640 | |
| | | — | | | | — | | | | — | | | | — | |
| | | 67,668 | | | | 20,467 | | | | 41,040 | | | | 13,492 | |
| | | — | | | | — | | | | — | | | | — | |
| | | — | | | | — | | | | 9,869 | | | | — | |
| | | 130,645,474 | | | | 37,140,339 | | | | 115,984,373 | | | | 224,113,167 | |
| | | | | | | | | | | | | | | | |
| | | | | | | | | | | | | | | | |
| | | | | | | | | | | | | | | | |
| | | — | | | | — | | | | 172,040 | | | | — | |
| | | — | | | | — | | | | — | | | | — | |
| | | — | | | | — | | | | — | | | | — | |
| | | — | | | | — | | | | — | | | | — | |
| | | 291,366 | | | | — | | | | 172,520 | | | | 555,980 | |
| | | 610,629 | | | | 729,174 | | | | 486,403 | | | | — | |
| | | 28,141 | | | | 1,821 | | | | 13,469 | | | | 46,512 | |
| | | — | | | | — | | | | — | | | | — | |
| | | | | | | | | | | | | | | | |
| | | — | | | | 4,648 | | | | 15,521 | | | | — | |
| | | 69,274 | | | | 18,595 | | | | 113,850 | | | | 93,030 | |
| | | 14,719 | | | | 665 | | | | 10,449 | | | | — | |
| | | — | | | | — | | | | — | | | | — | |
| | | 43,042 | | | | 28,774 | | | | 618,357 | | | | 29,622 | |
| | | 1,057,171 | | | | 783,677 | | | | 1,602,609 | | | | 725,144 | |
| | $ | 129,588,303 | | | $ | 36,356,662 | | | $ | 114,381,764 | | | $ | 223,388,023 | |
| | | | | | | | | | | | | | | | |
| | $ | 81,125,034 | | | $ | 25,727,910 | | | $ | 67,575,908 | | | $ | 223,426,146 | |
| | | 48,463,269 | | | | 10,628,752 | | | | 46,805,856 | | | | (38,123 | ) |
| | $ | 129,588,303 | | | $ | 36,356,662 | | | $ | 114,381,764 | | | $ | 223,388,023 | |
| | $ | 90,178,065 | | | $ | 32,547,649 | | | $ | 82,574,741 | | | $ | — | |
| | $ | 1,459,998 | | | $ | — | | | $ | 966,520 | | | $ | 15,000,000 | |
| | $ | — | | | $ | — | | | $ | — | | | $ | 208,880,229 | |
| | $ | 8,370,606 | | | $ | 2,089,646 | | | $ | 461,579 | | | $ | — | |
| | $ | — | | | $ | — | | | $ | 64,451 | | | $ | — | |
| | | | | | | | | | | | | | | | |
The accompanying notes are an integral part of the financial statements.
143
MML Series Investment Fund II – Financial Statements (Continued) | |
Statements of Assets and Liabilities
December 31, 2020 | |
| | | MML
Managed
Bond Fund | | | MML
Short-Duration
Bond Fund | |
Initial Class shares: | | | | | | | | |
Net assets | | $ | 756,217,631 | | | $ | — | |
Shares outstanding (a) | | | 55,634,398 | | | | — | |
Net asset value, offering price and redemption price per share | | $ | 13.59 | | | $ | — | |
Class II shares: | | | | | | | | |
Net assets | | $ | — | | | $ | 142,513,880 | |
Shares outstanding (a) | | | — | | | | 14,485,252 | |
Net asset value, offering price and redemption price per share | | $ | — | | | $ | 9.84 | |
Service Class shares: | | | | | | | | |
Net assets | | $ | 271,928,228 | | | $ | — | |
Shares outstanding (a) | | | 20,100,809 | | | | — | |
Net asset value, offering price and redemption price per share | | $ | 13.53 | | | $ | — | |
Service Class I shares: | | | | | | | | |
Net assets | | $ | — | | | $ | 47,956,107 | |
Shares outstanding (a) | | | — | | | | 4,890,725 | |
Net asset value, offering price and redemption price per share | | $ | — | | | $ | 9.81 | |
(a) | Authorized unlimited number of shares with no par value. |
The accompanying notes are an integral part of the financial statements.
144
| | MML
Small Cap
Equity Fund | | | MML
Special
Situations Fund | | | MML
Strategic
Emerging
Markets Fund | | | MML
U.S. Government
Money
Market Fund | |
| | | | | | | | | | | | | | | | |
| | $ | 104,243,415 | | | $ | — | | | $ | — | | | $ | 223,388,023 | |
| | | 9,382,467 | | | | — | | | | — | | | | 223,388,957 | |
| | $ | 11.11 | | | $ | — | | | $ | — | | | $ | 1.00 | |
| | | | | | | | | | | | | | | | |
| | $ | — | | | $ | 35,231,795 | | | $ | 96,845,841 | | | $ | — | |
| | | — | | | | 2,367,895 | | | | 6,710,731 | | | | — | |
| | $ | — | | | $ | 14.88 | | | $ | 14.43 | | | $ | — | |
| | | | | | | | | | | | | | | | |
| | $ | 25,344,888 | | | $ | — | | | $ | — | | | $ | — | |
| | | 2,331,431 | | | | — | | | | — | | | | — | |
| | $ | 10.87 | | | $ | — | | | $ | — | | | $ | — | |
| | | | | | | | | | | | | | | | |
| | $ | — | | | $ | 1,124,867 | | | $ | 17,535,923 | | | $ | — | |
| | | — | | | | 76,022 | | | | 1,214,891 | | | | — | |
| | $ | — | | | $ | 14.80 | | | $ | 14.43 | | | $ | — | |
The accompanying notes are an integral part of the financial statements.
145
MML Series Investment Fund II – Financial Statements (Continued) | |
Statements of Operations
For the Year Ended December 31, 2020 | |
| | | MML
Blend Fund | | | MML
Dynamic
Bond Fund | |
Investment income (Note 2): | | | | | | | | |
Dividends (a) | | $ | 12,113,266 | | | $ | — | |
Interest (b) | | | 7,296,263 | | | | 12,377,492 | |
Securities lending net income | | | 17,451 | | | | 2,279 | |
Total investment income | | | 19,426,980 | | | | 12,379,771 | |
Expenses (Note 3): | | | | | | | | |
Investment advisory fees | | | 2,955,590 | | | | 1,414,398 | |
Custody fees | | | 89,876 | | | | 105,435 | |
Interest expense | | | — | | | | — | |
Audit fees | | | 40,415 | | | | 57,905 | |
Legal fees | | | 26,677 | | | | 9,655 | |
Proxy fees | | | 1,134 | | | | 1,140 | |
Shareholder reporting fees | | | 80,610 | | | | 59,209 | |
Trustees’ fees | | | 30,552 | | | | 15,356 | |
| | | | 3,224,854 | | | | 1,663,098 | |
Administration fees: | | | | | | | | |
Class II | | | — | | | | 513,576 | |
Service Class I | | | — | | | | 16,823 | |
Distribution and Service fees: | | | | | | | | |
Service Class | | | 410,064 | | | | — | |
Service Class I | | | — | | | | 28,038 | |
Total expenses | | | 3,634,918 | | | | 2,221,535 | |
Expenses waived (Note 3): | | | | | | | | |
Initial Class fees reimbursed by adviser | | | — | | | | — | |
Service Class fees reimbursed by adviser | | | — | | | | — | |
Class II advisory fees waived | | | — | | | | — | |
Service Class I advisory fees waived | | | — | | | | — | |
Net expenses: | | | 3,634,918 | | | | 2,221,535 | |
Net investment income (loss) | | | 15,792,062 | | | | 10,158,236 | |
Realized and unrealized gain (loss): | | | | | | | | |
Net realized gain (loss) on: | | | | | | | | |
Investment transactions | | | 207,781,865 | | | | 6,427,123 | |
Futures contracts | | | 2,713,504 | | | | — | |
Swap agreements | | | 244,885 | | | | — | |
Foreign currency transactions | | | — | | | | — | |
Forward contracts | | | — | | | | — | |
Net realized gain (loss) | | | 210,740,254 | | | | 6,427,123 | |
Net change in unrealized appreciation (depreciation) on: | | | | | | | | |
Investment transactions | | | (138,571,303 | ) | | | (2,444,603 | ) |
Futures contracts | | | 488,282 | | | | — | |
Swap agreements | | | — | | | | — | |
Translation of assets and liabilities in foreign currencies | | | — | | | | — | |
Forward contracts | | | — | | | | — | |
Net change in unrealized appreciation (depreciation) | | | (138,083,021 | ) | | | (2,444,603 | ) |
Net realized gain (loss) and change in unrealized appreciation (depreciation) | | | 72,657,233 | | | | 3,982,520 | |
Net increase (decrease) in net assets resulting from operations | | $ | 88,449,295 | | | $ | 14,140,756 | |
(a) | Net of foreign withholding tax of: | | $ | — | | | $ | — | |
(b) | Net of foreign withholding tax of: | | $ | 2,818 | | | $ | 174 | |
The accompanying notes are an integral part of the financial statements.
146
| | MML
Equity Fund | | | MML
Equity
Momentum
Fund | | | MML
Equity
Rotation Fund | | | MML
High Yield Fund | | | MML
Inflation-
Protected and
Income Fund | |
| | | | | | | | | | | | | | | | | | | | |
| | $ | 18,290,369 | | | $ | 283,721 | | | $ | 651,658 | | | $ | — | | | $ | — | |
| | | 9,007 | | | | 90,821 | | | | 1,113 | | | | 7,902,087 | | | | 7,542,070 | |
| | | 12,523 | | | | 17,734 | | | | 753 | | | | 28,614 | | | | 1,553 | |
| | | 18,311,899 | | | | 392,276 | | | | 653,524 | | | | 7,930,701 | | | | 7,543,623 | |
| | | | | | | | | | | | | | | | | | | | |
| | | 2,934,337 | | | | 205,373 | | | | 152,978 | | | | 706,163 | | | | 1,854,867 | |
| | | 90,016 | | | | 17,069 | | | | 15,507 | | | | 65,435 | | | | 46,417 | |
| | | — | | | | — | | | | — | | | | — | | | | 444,154 | |
| | | 39,624 | | | | 33,220 | | | | 33,220 | | | | 39,859 | | | | 41,859 | |
| | | 17,644 | | | | 1,347 | | | | 1,355 | | | | 2,197 | | | | 9,175 | |
| | | 1,134 | | | | 1,134 | | | | 1,134 | | | | 1,134 | | | | 1,134 | |
| | | 84,064 | | | | 13,586 | | | | 13,289 | | | | 29,093 | | | | 55,007 | |
| | | 30,572 | | | | 1,445 | | | | 1,424 | | | | 5,230 | | | | 14,154 | |
| | | 3,197,391 | | | | 273,174 | | | | 218,907 | | | | 849,111 | | | | 2,466,767 | |
| | | | | | | | | | | | | | | | | | | | |
| | | — | | | | 48,609 | | | | 48,224 | | | | 109,658 | | | | — | |
| | | — | | | | 2,734 | | | | 2,769 | | | | 66,883 | | | | — | |
| | | | | | | | | | | | | | | | | | | | |
| | | 214,477 | | | | — | | | | — | | | | — | | | | 111,676 | |
| | | — | | | | 4,557 | | | | 4,615 | | | | 111,471 | | | | — | |
| | | 3,411,868 | | | | 329,074 | | | | 274,515 | | | | 1,137,123 | | | | 2,578,443 | |
| | | | | | | | | | | | | | | | | | | | |
| | | — | | | | — | | | | — | | | | — | | | | (20,994 | ) |
| | | — | | | | — | | | | — | | | | — | | | | (3,385 | ) |
| | | — | | | | (11,193 | ) | | | (2,029 | ) | | | (51,133 | ) | | | — | |
| | | — | | | | (600 | ) | | | (116 | ) | | | (31,253 | ) | | | — | |
| | | 3,411,868 | | | | 317,281 | | | | 272,370 | | | | 1,054,737 | | | | 2,554,064 | |
| | | 14,900,031 | | | | 74,995 | | | | 381,154 | | | | 6,875,964 | | | | 4,989,559 | |
| | | | | | | | | | | | | | | | | | | | |
| | | | | | | | | | | | | | | | | | | | |
| | | (38,496,485 | ) | | | 4,761,880 | | | | 9,527,241 | | | | (5,851,673 | ) | | | 18,731,929 | |
| | | — | | | | 4,505,446 | | | | — | | | | — | | | | (440,672 | ) |
| | | — | | | | — | | | | — | | | | — | | | | 15,992,429 | |
| | | 4,574 | | | | (4,256 | ) | | | — | | | | — | | | | 1 | |
| | | — | | | | 8,222 | | | | — | | | | — | | | | — | |
| | | (38,491,911 | ) | | | 9,271,292 | | | | 9,527,241 | | | | (5,851,673 | ) | | | 34,283,687 | |
| | | | | | | | | | | | | | | | | | | | |
| | | 40,370,174 | | | | (1,885,077 | ) | | | (2,274,868 | ) | | | 3,918,300 | | | | (9,668,975 | ) |
| | | — | | | | (677,644 | ) | | | — | | | | — | | | | 91,932 | |
| | | — | | | | — | | | | — | | | | — | | | | 4,073,862 | |
| | | (183 | ) | | | 2,036 | | | | — | | | | — | | | | — | |
| | | — | | | | (1,731 | ) | | | — | | | | — | | | | — | |
| | | 40,369,991 | | | | (2,562,416 | ) | | | (2,274,868 | ) | | | 3,918,300 | | | | (5,503,181 | ) |
| | | 1,878,080 | | | | 6,708,876 | | | | 7,252,373 | | | | (1,933,373 | ) | | | 28,780,506 | |
| | $ | 16,778,111 | | | $ | 6,783,871 | | | $ | 7,633,527 | | | $ | 4,942,591 | | | $ | 33,770,065 | |
| | $ | 42,451 | | | $ | 2,725 | | | $ | 1,771 | | | $ | — | | | $ | — | |
| | $ | — | | | $ | — | | | $ | — | | | $ | — | | | $ | — | |
The accompanying notes are an integral part of the financial statements.
147
MML Series Investment Fund II – Financial Statements (Continued) |
Statements of Operations
For the Year Ended December 31, 2020 | |
| | | MML
Managed
Bond Fund | | | MML
Short-Duration
Bond Fund | |
Investment income (Note 2): | | | | | | | | |
Dividends (a) | | $ | 1,008,947 | | | $ | 175,380 | |
Interest (b) | | | 36,819,894 | | | | 6,711,990 | |
Securities lending net income | | | 13,841 | | | | 989 | |
Total investment income | | | 37,842,682 | | | | 6,888,359 | |
Expenses (Note 3): | | | | | | | | |
Investment advisory fees | | | 4,053,886 | | | | 676,838 | |
Custody fees | | | 93,127 | | | | 33,659 | |
Audit fees | | | 42,016 | | | | 40,606 | |
Legal fees | | | 35,749 | | | | 2,798 | |
Proxy fees | | | 1,134 | | | | 1,134 | |
Shareholder reporting fees | | | 111,521 | | | | 39,001 | |
Trustees’ fees | | | 44,296 | | | | 8,378 | |
| | | | 4,381,729 | | | | 802,414 | |
Administration fees: | | | | | | | | |
Class II | | | — | | | | 234,274 | |
Service Class I | | | — | | | | 55,799 | |
Distribution and Service fees: | | | | | | | | |
Service Class | | | 648,050 | | | | — | |
Service Class I | | | — | | | | 92,998 | |
Total expenses | | | 5,029,779 | | | | 1,185,485 | |
Expenses waived (Note 3): | | | | | | | | |
Initial Class fees reimbursed by adviser | | | — | | | | — | |
Class II fees reimbursed by adviser | | | — | | | | — | |
Service Class I fees reimbursed by adviser | | | — | | | | — | |
Class II advisory fees waived | | | — | | | | — | |
Service Class I advisory fees waived | | | — | | | | — | |
Net expenses: | | | 5,029,779 | | | | 1,185,485 | |
Net investment income (loss) | | | 32,812,903 | | | | 5,702,874 | |
Realized and unrealized gain (loss): | | | | | | | | |
Net realized gain (loss) on: | | | | | | | | |
Investment transactions | | | 14,579,480 | | | | 890,156 | |
Futures contracts | | | 14,754,297 | | | | (3,834,570 | ) |
Swap agreements | | | 802,496 | | | | 146,163 | |
Foreign currency transactions | | | — | | | | — | |
Net realized gain (loss) | | | 30,136,273 | | | | (2,798,251 | ) |
Net change in unrealized appreciation (depreciation) on: | | | | | | | | |
Investment transactions | | | 12,127,815 | | | | 291,224 | |
Futures contracts | | | 581,116 | | | | (462,606 | ) |
Translation of assets and liabilities in foreign currencies | | | — | | | | — | |
Net change in unrealized appreciation (depreciation) | | | 12,708,931 | | | | (171,382 | ) |
Net realized gain (loss) and change in unrealized appreciation (depreciation) | | | 42,845,204 | | | | (2,969,633 | ) |
Net increase (decrease) in net assets resulting from operations | | $ | 75,658,107 | | | $ | 2,733,241 | |
(a) | Net of foreign withholding tax of: | | $ | — | | | $ | — | |
(b) | Net of foreign withholding tax of: | | $ | — | | | $ | 5,091 | |
* | Net of net increase (decrease) in accrued foreign capital gains tax of: | | $ | — | | | $ | — | |
The accompanying notes are an integral part of the financial statements.
148
| | MML
Small Cap
Equity Fund | | | MML
Special
Situations Fund | | | MML
Strategic
Emerging
Markets Fund | | | MML
U.S. Government
Money
Market Fund | |
| | | | | | | | | | | | | | | | |
| | $ | 1,575,419 | | | $ | 348,860 | | | $ | 1,646,081 | | | $ | — | |
| | | 1,836 | | | | 551 | | | | 6,185 | | | | 989,122 | |
| | | 15,029 | | | | 2,165 | | | | 14,144 | | | | — | |
| | | 1,592,284 | | | | 351,576 | | | | 1,666,410 | | | | 989,122 | |
| | | | | | | | | | | | | | | | |
| | | 684,597 | | | | 166,546 | | | | 1,350,654 | | | | 925,503 | |
| | | 23,702 | | | | 14,854 | | | | 164,782 | | | | 22,527 | |
| | | 39,017 | | | | 33,205 | | | | 52,724 | | | | 33,778 | |
| | | 2,465 | | | | 1,340 | | | | 2,740 | | | | 1,753 | |
| | | 1,134 | | | | 1,134 | | | | 1,134 | | | | 1,134 | |
| | | 23,263 | | | | 12,416 | | | | 27,222 | | | | 17,751 | |
| | | 4,502 | | | | 1,136 | | | | 5,564 | | | | 7,749 | |
| | | 778,680 | | | | 230,631 | | | | 1,604,820 | | | | 1,010,195 | |
| | | | | | | | | | | | | | | | |
| | | — | | | | 40,291 | | | | 169,409 | | | | — | |
| | | — | | | | 1,346 | | | | 23,541 | | | | — | |
| | | | | | | | | | | | | | | | |
| | | 52,180 | | | | — | | | | — | | | | — | |
| | | — | | | | 2,243 | | | | 39,236 | | | | — | |
| | | 830,860 | | | | 274,511 | | | | 1,837,006 | | | | 1,010,195 | |
| | | | | | | | | | | | | | | | |
| | | — | | | | — | | | | — | | | | (427,017 | ) |
| | | — | | | | — | | | | (8,494 | ) | | | — | |
| | | — | | | | — | | | | (1,267 | ) | | | — | |
| | | — | | | | (2,111 | ) | | | (45,165 | ) | | | — | |
| | | — | | | | (68 | ) | | | (6,288 | ) | | | — | |
| | | 830,860 | | | | 272,332 | | | | 1,775,792 | | | | 583,178 | |
| | | 761,424 | | | | 79,244 | | | | (109,382 | ) | | | 405,944 | |
| | | | | | | | | | | | | | | | |
| | | | | | | | | | | | | | | | |
| | | 8,225,016 | | | | 9,047,920 | | | | 16,988,124 | | | | 699 | |
| | | — | | | | — | | | | — | | | | — | |
| | | — | | | | — | | | | — | | | | — | |
| | | — | | | | — | | | | (55,019 | ) | | | — | |
| | | 8,225,016 | | | | 9,047,920 | | | | 16,933,105 | | | | 699 | |
| | | | | | | | | | | | | | | | |
| | | 13,174,273 | | | | (841,173 | ) | | | 4,073,155 | * | | | — | |
| | | — | | | | — | | | | — | | | | — | |
| | | — | | | | — | | | | 1,075 | | | | — | |
| | | 13,174,273 | | | | (841,173 | ) | | | 4,074,230 | | | | — | |
| | | 21,399,289 | | | | 8,206,747 | | | | 21,007,335 | | | | 699 | |
| | $ | 22,160,713 | | | $ | 8,285,991 | | | $ | 20,897,953 | | | $ | 406,643 | |
| | $ | — | | | $ | — | | | $ | 198,442 | | | $ | — | |
| | $ | — | | | $ | — | | | $ | 71 | | | $ | — | |
| | $ | — | | | $ | — | | | $ | (242,354 | ) | | $ | — | |
The accompanying notes are an integral part of the financial statements.
149
MML Series Investment Fund II – Financial Statements (Continued) | |
Statements of Changes in Net Assets | |
| | | MML Blend Fund | |
| | | Year
Ended
December 31, 2020 | | | Year
Ended
December 31, 2019 | |
Increase (Decrease) in Net Assets: | | | | | | | | |
Operations: | | | | | | | | |
Net investment income (loss) | | $ | 15,792,062 | | | $ | 15,290,622 | |
Net realized gain (loss) | | | 210,740,254 | | | | 34,015,197 | |
Net change in unrealized appreciation (depreciation) | | | (138,083,021 | ) | | | 84,549,765 | |
Net increase (decrease) in net assets resulting from operations | | | 88,449,295 | | | | 133,855,584 | |
Distributions to shareholders (Note 2): | | | | | | | | |
Initial Class | | | (24,201,102 | ) | | | (40,979,710 | ) |
Class II | | | — | | | | — | |
Service Class | | | (7,363,875 | ) | | | (9,724,022 | ) |
Service Class I | | | — | | | | — | |
Total distributions | | | (31,564,977 | ) | | | (50,703,732 | ) |
Net fund share transactions (Note 5): | | | | | | | | |
Initial Class | | | (26,430,530 | ) | | | (18,577,665 | ) |
Class II | | | — | | | | — | |
Service Class | | | 10,443,244 | | | | 26,512,166 | |
Service Class I | | | — | | | | — | |
Increase (decrease) in net assets from fund share transactions | | | (15,987,286 | ) | | | 7,934,501 | |
Total increase (decrease) in net assets | | | 40,897,032 | | | | 91,086,353 | |
Net assets | | | | | | | | |
Beginning of year | | | 736,697,486 | | | | 645,611,133 | |
End of year | | $ | 777,594,518 | | | $ | 736,697,486 | |
The accompanying notes are an integral part of the financial statements.
150
| | MML Dynamic
Bond Fund | | | MML Equity Fund | |
| | Year
Ended
December 31, 2020 | | | Year
Ended
December 31, 2019 | | | Year
Ended
December 31, 2020 | | | Year
Ended
December 31, 2019 | |
| | | | | | | | | | | | | | | | |
| | | | | | | | | | | | | | | | |
| | $ | 10,158,236 | | | $ | 14,878,045 | | | $ | 14,900,031 | | | $ | 16,545,336 | |
| | | 6,427,123 | | | | (21,876 | ) | | | (38,491,911 | ) | | | 79,293,871 | |
| | | (2,444,603 | ) | | | 20,729,688 | | | | 40,369,991 | | | | 83,074,237 | |
| | | 14,140,756 | | | | 35,585,857 | | | | 16,778,111 | | | | 178,913,444 | |
| | | | | | | | | | | | | | | | |
| | | — | | | | — | | | | (84,655,474 | ) | | | (50,723,440 | ) |
| | | (1,117,750 | ) | | | (14,724,090 | ) | | | — | | | | — | |
| | | — | | | | — | | | | (11,874,652 | ) | | | (6,619,264 | ) |
| | | (38,159 | ) | | | (274,456 | ) | | | — | | | | — | |
| | | (1,155,909 | ) | | | (14,998,546 | ) | | | (96,530,126 | ) | | | (57,342,704 | ) |
| | | | | | | | | | | | | | | | |
| | | — | | | | — | | | | 27,526,408 | | | | (12,725,542 | ) |
| | | (85,156,775 | ) | | | (52,559,883 | ) | | | — | | | | — | |
| | | — | | | | — | | | | 6,609,630 | | | | (100,034 | ) |
| | | 1,972,496 | | | | 3,527,101 | | | | — | | | | — | |
| | | (83,184,279 | ) | | | (49,032,782 | ) | | | 34,136,038 | | | | (12,825,576 | ) |
| | | (70,199,432 | ) | | | (28,445,471 | ) | | | (45,615,977 | ) | | | 108,745,164 | |
| | | | | | | | | | | | | | | | |
| | | 398,170,886 | | | | 426,616,357 | | | | 826,425,300 | | | | 717,680,136 | |
| | $ | 327,971,454 | | | $ | 398,170,886 | | | $ | 780,809,323 | | | $ | 826,425,300 | |
The accompanying notes are an integral part of the financial statements.
151
MML Series Investment Fund II – Financial Statements (Continued) |
Statements of Changes in Net Assets | |
| | | MML Equity
Momentum Fund | |
| | | Year
Ended
December 31, 2020 | | | Year
Ended
December 31, 2019 | |
Increase (Decrease) in Net Assets: | | | | | | | | |
Operations: | | | | | | | | |
Net investment income (loss) | | $ | 74,995 | | | $ | 216,363 | |
Net realized gain (loss) | | | 9,271,292 | | | | 3,366,615 | |
Net change in unrealized appreciation (depreciation) | | | (2,562,416 | ) | | | 5,677,370 | |
Net increase (decrease) in net assets resulting from operations | | | 6,783,871 | | | | 9,260,348 | |
Distributions to shareholders (Note 2): | | | | | | | | |
Class II | | | (3,595,440 | ) | | | (1,657,921 | ) |
Service Class I | | | (192,350 | ) | | | (93,583 | ) |
Total distributions | | | (3,787,790 | ) | | | (1,751,504 | ) |
Net fund share transactions (Note 5): | | | | | | | | |
Class II | | | 3,595,440 | | | | 1,657,921 | |
Service Class I | | | 12,771 | | | | 100,596 | |
Increase (decrease) in net assets from fund share transactions | | | 3,608,211 | | | | 1,758,517 | |
Total increase (decrease) in net assets | | | 6,604,292 | | | | 9,267,361 | |
Net assets | | | | | | | | |
Beginning of year | | | 33,734,391 | | | | 24,467,030 | |
End of year | | $ | 40,338,683 | | | $ | 33,734,391 | |
The accompanying notes are an integral part of the financial statements.
152
| | MML Equity
Rotation Fund | | | MML High Yield
Fund | |
| | Year
Ended
December 31, 2020 | | | Year
Ended
December 31, 2019 | | | Year
Ended
December 31, 2020 | | | Year
Ended
December 31, 2019 | |
| | | | | | | | | | | | | | | | |
| | | | | | | | | | | | | | | | |
| | $ | 381,154 | | | $ | 259,945 | | | $ | 6,875,964 | | | $ | 7,496,907 | |
| | | 9,527,241 | | | | 242,105 | | | | (5,851,673 | ) | | | (2,648,142 | ) |
| | | (2,274,868 | ) | | | 4,240,106 | | | | 3,918,300 | | | | 9,543,649 | |
| | | 7,633,527 | | | | 4,742,156 | | | | 4,942,591 | | | | 14,392,414 | |
| | | | | | | | | | | | | | | | |
| | | (1,109,325 | ) | | | (657,606 | ) | | | (18,037 | ) | | | (5,130,049 | ) |
| | | (58,536 | ) | | | (34,524 | ) | | | (10,822 | ) | | | (2,664,581 | ) |
| | | (1,167,861 | ) | | | (692,130 | ) | | | (28,859 | ) | | | (7,794,630 | ) |
| | | | | | | | | | | | | | | | |
| | | 1,109,325 | | | | 657,606 | | | | (38,713,456 | ) | | | 2,719,177 | |
| | | (22,466 | ) | | | 73,105 | | | | (2,723,722 | ) | | | 5,213,508 | |
| | | 1,086,859 | | | | 730,711 | | | | (41,437,178 | ) | | | 7,932,685 | |
| | | 7,552,525 | | | | 4,780,737 | | | | (36,523,446 | ) | | | 14,530,469 | |
| | | | | | | | | | | | | | | | |
| | | 33,490,806 | | | | 28,710,069 | | | | 134,055,162 | | | | 119,524,693 | |
| | $ | 41,043,331 | | | $ | 33,490,806 | | | $ | 97,531,716 | | | $ | 134,055,162 | |
The accompanying notes are an integral part of the financial statements.
153
MML Series Investment Fund II – Financial Statements (Continued) | |
Statements of Changes in Net Assets | |
| | | MML Inflation-
Protected
and Income Fund | |
| | | Year
Ended
December 31, 2020 | | | Year
Ended
December 31, 2019 | |
Increase (Decrease) in Net Assets: | | | | | | | | |
Operations: | | | | | | | | |
Net investment income (loss) | | $ | 4,989,559 | | | $ | 8,153,425 | |
Net realized gain (loss) | | | 34,283,687 | | | | 194,123 | |
Net change in unrealized appreciation (depreciation) | | | (5,503,181 | ) | | | 20,740,223 | |
Net increase (decrease) in net assets resulting from operations | | | 33,770,065 | | | | 29,087,771 | |
Distributions to shareholders (Note 2): | | | | | | | | |
Initial Class | | | (316,265 | ) | | | (7,592,814 | ) |
Class II | | | — | | | | — | |
Service Class | | | (51,184 | ) | | | (933,563 | ) |
Service Class I | | | — | | | | — | |
Total distributions | | | (367,449 | ) | | | (8,526,377 | ) |
Net fund share transactions (Note 5): | | | | | | | | |
Initial Class | | | (55,189,580 | ) | | | (15,902,153 | ) |
Class II | | | — | | | | — | |
Service Class | | | (1,503,656 | ) | | | (467,712 | ) |
Service Class I | | | — | | | | — | |
Increase (decrease) in net assets from fund share transactions | | | (56,693,236 | ) | | | (16,369,865 | ) |
Total increase (decrease) in net assets | | | (23,290,620 | ) | | | 4,191,529 | |
Net assets | | | | | | | | |
Beginning of year | | | 357,497,458 | | | | 353,305,929 | |
End of year | | $ | 334,206,838 | | | $ | 357,497,458 | |
The accompanying notes are an integral part of the financial statements.
154
| | MML Managed
Bond Fund | | | MML Short-
Duration Bond
Fund | |
| | Year
Ended
December 31, 2020 | | | Year
Ended
December 31, 2019 | | | Year
Ended
December 31, 2020 | | | Year
Ended
December 31, 2019 | |
| | | | | | | | | | | | | | | | |
| | | | | | | | | | | | | | | | |
| | $ | 32,812,903 | | | $ | 37,758,398 | | | $ | 5,702,874 | | | $ | 6,010,397 | |
| | | 30,136,273 | | | | 30,487,594 | | | | (2,798,251 | ) | | | (2,113,237 | ) |
| | | 12,708,931 | | | | 36,271,548 | | | | (171,382 | ) | | | 4,826,501 | |
| | | 75,658,107 | | | | 104,517,540 | | | | 2,733,241 | | | | 8,723,661 | |
| | | | | | | | | | | | | | | | |
| | | (733,340 | ) | | | (31,524,049 | ) | | | — | | | | — | |
| | | — | | | | — | | | | (433 | ) | | | (5,669,696 | ) |
| | | (249,878 | ) | | | (8,931,167 | ) | | | — | | | | — | |
| | | — | | | | — | | | | (90 | ) | | | (986,511 | ) |
| | | (983,218 | ) | | | (40,455,216 | ) | | | (523 | ) | | | (6,656,207 | ) |
| | | | | | | | | | | | | | | | |
| | | (146,860,069 | ) | | | 18,148,687 | | | | — | | | | — | |
| | | — | | | | — | | | | (31,387,317 | ) | | | (2,604,729 | ) |
| | | (11,498,251 | ) | | | (3,868,313 | ) | | | — | | | | — | |
| | | — | | | | — | | | | 11,114,998 | | | | 5,283,556 | |
| | | (158,358,320 | ) | | | 14,280,374 | | | | (20,272,319 | ) | | | 2,678,827 | |
| | | (83,683,431 | ) | | | 78,342,698 | | | | (17,539,601 | ) | | | 4,746,281 | |
| | | | | | | | | | | | | | | | |
| | | 1,111,829,290 | | | �� | 1,033,486,592 | | | | 208,009,588 | | | | 203,263,307 | |
| | $ | 1,028,145,859 | | | $ | 1,111,829,290 | | | $ | 190,469,987 | | | $ | 208,009,588 | |
The accompanying notes are an integral part of the financial statements.
155
MML Series Investment Fund II – Financial Statements (Continued) | |
Statements of Changes in Net Assets | |
| | | MML Small Cap
Equity Fund | |
| | | Year
Ended
December 31, 2020 | | | Year
Ended
December 31, 2019 | |
Increase (Decrease) in Net Assets: | | | | | | | | |
Operations: | | | | | | | | |
Net investment income (loss) | | $ | 761,424 | | | $ | 829,975 | |
Net realized gain (loss) | | | 8,225,016 | | | | 769,551 | |
Net change in unrealized appreciation (depreciation) | | | 13,174,273 | | | | 24,207,655 | |
Net increase (decrease) in net assets resulting from operations | | | 22,160,713 | | | | 25,807,181 | |
Distributions to shareholders (Note 2): | | | | | | | | |
Initial Class | | | (1,276,608 | ) | | | (8,162,126 | ) |
Class II | | | — | | | | — | |
Service Class | | | (269,088 | ) | | | (1,918,740 | ) |
Service Class I | | | — | | | | — | |
Total distributions | | | (1,545,696 | ) | | | (10,080,866 | ) |
Net fund share transactions (Note 5): | | | | | | | | |
Initial Class | | | (6,927,012 | ) | | | (737,342 | ) |
Class II | | | — | | | | — | |
Service Class | | | (1,506,540 | ) | | | 1,383,266 | |
Service Class I | | | — | | | | — | |
Increase (decrease) in net assets from fund share transactions | | | (8,433,552 | ) | | | 645,924 | |
Total increase (decrease) in net assets | | | 12,181,465 | | | | 16,372,239 | |
Net assets | | | | | | | | |
Beginning of year | | | 117,406,838 | | | | 101,034,599 | |
End of year | | $ | 129,588,303 | | | $ | 117,406,838 | |
The accompanying notes are an integral part of the financial statements.
156
| | MML Special
Situations Fund | | | MML Strategic
Emerging Markets
Fund | |
| | Year
Ended
December 31, 2020 | | | Year
Ended
December 31, 2019 | | | Year
Ended
December 31, 2020 | | | Year
Ended
December 31, 2019 | |
| | | | | | | | | | | | | | | | |
| | | | | | | | | | | | | | | | |
| | $ | 79,244 | | | $ | 40,854 | | | $ | (109,382 | ) | | $ | 590,631 | |
| | | 9,047,920 | | | | 1,339,970 | | | | 16,933,105 | | | | 8,154,908 | |
| | | (841,173 | ) | | | 4,017,254 | | | | 4,074,230 | | | | 22,397,203 | |
| | | 8,285,991 | | | | 5,398,078 | | | | 20,897,953 | | | | 31,142,742 | |
| | | | | | | | | | | | | | | | |
| | | — | | | | — | | | | — | | | | — | |
| | | (3,959,893 | ) | | | (38,829 | ) | | | (3,818,915 | ) | | | (320,921 | ) |
| | | — | | | | — | | | | — | | | | — | |
| | | (127,231 | ) | | | — | | | | (476,372 | ) | | | (885 | ) |
| | | (4,087,124 | ) | | | (38,829 | ) | | | (4,295,287 | ) | | | (321,806 | ) |
| | | | | | | | | | | | | | | | |
| | | — | | | | — | | | | — | | | | — | |
| | | 3,959,893 | | | | 38,829 | | | | (42,829,509 | ) | | | (14,466,841 | ) |
| | | — | | | | — | | | | — | | | | — | |
| | | 31,014 | | | | 40,985 | | | | (1,756,826 | ) | | | (441,125 | ) |
| | | 3,990,907 | | | | 79,814 | | | | (44,586,335 | ) | | | (14,907,966 | ) |
| | | 8,189,774 | | | | 5,439,063 | | | | (27,983,669 | ) | | | 15,912,970 | |
| | | | | | | | | | | | | | | | |
| | | 28,166,888 | | | | 22,727,825 | | | | 142,365,433 | | | | 126,452,463 | |
| | $ | 36,356,662 | | | $ | 28,166,888 | | | $ | 114,381,764 | | | $ | 142,365,433 | |
The accompanying notes are an integral part of the financial statements.
157
MML Series Investment Fund II – Financial Statements (Continued) |
Statements of Changes in Net Assets |
| | | MML U.S. Government
Money Market Fund | |
| | | Year
Ended
December 31, 2020 | | | Year
Ended
December 31, 2019 | |
Increase (Decrease) in Net Assets: | | | | | | | | |
Operations: | | | | | | | | |
Net investment income (loss) | | $ | 405,944 | | | $ | 2,960,327 | |
Net realized gain (loss) | | | 699 | | | | 1,649 | |
Net change in unrealized appreciation (depreciation) | | | — | | | | — | |
Net increase (decrease) in net assets resulting from operations | | | 406,643 | | | | 2,961,976 | |
Distributions to shareholders (Note 2): | | | | | | | | |
Initial Class | | | (405,972 | ) | | | (2,960,404 | ) |
Total distributions | | | (405,972 | ) | | | (2,960,404 | ) |
Net fund share transactions (Note 5): | | | | | | | | |
Initial Class | | | 48,488,132 | | | | (4,204,843 | ) |
Increase (decrease) in net assets from fund share transactions | | | 48,488,132 | | | | (4,204,843 | ) |
Total increase (decrease) in net assets | | | 48,488,803 | | | | (4,203,271 | ) |
Net assets | | | | | | | | |
Beginning of year | | | 174,899,220 | | | | 179,102,491 | |
End of year | | $ | 223,388,023 | | | $ | 174,899,220 | |
The accompanying notes are an integral part of the financial statements.
158
MML Series Investment Fund II – Financial Statements (Continued) |
Financial Highlights (For a share outstanding throughout each period) |
MML Blend Fund
| | | Income (loss) from investment
operations | Less distributions to shareholders | | | Ratios / Supplemental Data |
| | Net
asset
value,
beginning
of the
period | Net
investment
income
(loss)c | Net
realized and
unrealized
gain (loss)
on
investments | Total
income
(loss) from
investment
operations | From net
investment
income | From net
realized
gains | Total
distributions | Net
asset
value,
end of
the
period | Total
returnm | Net
assets,
end of
the
period
(000’s) | Ratio of
expenses
to average
daily net
assetsw | Net
investment
income
(loss) to
average
daily net
assets |
Initial Class | | | | | | | | | | | |
12/31/20 | $ 22.93 | $ 0.51 | $ 2.37 | $ 2.88 | $ — | $ (1.02) | $ (1.02) | 24.79 | 12.87% | $ 591,889 | 0.45% | 2.26% |
12/31/19 | 20.35 | 0.49 | 3.71 | 4.20 | (0.53) | (1.09) | (1.62) | 22.93 | 21.38% | 574,827 | 0.45% | 2.24% |
12/31/18 | 23.33 | 0.47 | (1.39) | (0.92) | (0.48) | (1.58) | (2.06) | 20.35 | (4.34%) | 527,007 | 0.45% | 2.12% |
12/31/17 | 21.54 | 0.42 | 2.74 | 3.16 | (0.47) | (0.90) | (1.37) | 23.33 | 15.25% | 607,368 | 0.45% | 1.91% |
12/31/16 | 22.22 | 0.43 | 1.48 | 1.91 | (0.46) | (2.13) | (2.59) | 21.54 | 9.42% | 581,972 | 0.46% | 2.03% |
Service Class | | | | | | | | | | | |
12/31/20 | $ 22.87 | $ 0.46 | $ 2.35 | $ 2.81 | $ — | $ (1.02) | $ (1.02) | 24.66 | 12.57% | $ 185,705 | 0.70% | 2.01% |
12/31/19 | 20.29 | 0.43 | 3.71 | 4.14 | (0.47) | (1.09) | (1.56) | 22.87 | 21.08% | 161,870 | 0.70% | 1.99% |
12/31/18 | 23.27 | 0.42 | (1.40) | (0.98) | (0.42) | (1.58) | (2.00) | 20.29 | (4.58%) | 118,604 | 0.70% | 1.89% |
12/31/17 | 21.50 | 0.37 | 2.72 | 3.09 | (0.42) | (0.90) | (1.32) | 23.27 | 14.97% | 88,119 | 0.70% | 1.66% |
12/31/16 | 22.18 | 0.37 | 1.48 | 1.85 | (0.40) | (2.13) | (2.53) | 21.50 | 9.15% | 60,018 | 0.71% | 1.78% |
| | Year ended December 31 |
| | 2020 | 2019 | 2018 | 2017 | 2016 |
Portfolio turnover ratex | 231% | 132% | 86% | 134% | 175% |
c | Per share amount calculated on the average shares method. |
m | Total return does not reflect expenses that apply at the separate account level or to related insurance products. Inclusion of these charges would reduce the total return figures for all periods shown. |
w | Effective November 18, 2020, the expenses of the underlying funds are not included in the Fund’s expense ratio. The Fund indirectly bears its proportionate share of the expenses of any underlying fund. |
x | Effective November 18, 2020, the amount does not include the portfolio activity of any underlying fund. |
The accompanying notes are an integral part of the financial statements.
159
MML Series Investment Fund II – Financial Statements (Continued) |
Financial Highlights (For a share outstanding throughout each period) |
MML Dynamic Bond Fund
| | | Income (loss) from investment
operations | Less distributions to shareholders | | | Ratios / Supplemental Data |
| | Net
asset
value,
beginning
of the
period | Net
investment
income
(loss)c,j | Net
realized
and
unrealized
gain (loss)
on
investments | Total
income
(loss) from
investment
operations | From net
investment
income | From net
realized
gains | Total
distributions | Net
asset
value,
end of
the
period | Total
returnm | Net
assets,
end of
the
period
(000’s) | Ratio of
expenses to
average daily
net assets
before
expense
waivers | Ratio of
expenses to
average daily
net assets
after
expense
waiversj | Net
investment
income (loss)
to average
daily net
assets |
Class II | | | | | | | | | | | |
12/31/20 | $ 10.08 | $ 0.29 | $ 0.10 | $ 0.39 | $ (0.03) | $ — | $ (0.03) | $ 10.44 | 3.91% | $ 315,514 | 0.62% | N/A | 2.88% |
12/31/19 | 9.61 | 0.35 | 0.48 | 0.83 | (0.36) | — | (0.36) | 10.08 | 8.73% | 388,029 | 0.60% | 0.60%l | 3.55% |
12/31/18 | 9.95 | 0.34 | (0.35) | (0.01) | (0.33) | — | (0.33) | 9.61 | (0.10%) | 420,344 | 0.59% | 0.59%l | 3.52% |
12/31/17 | 9.89 | 0.30 | 0.14 | 0.44 | (0.34) | (0.04) | (0.38) | 9.95 | 4.45% | 447,146 | 0.59% | 0.59%l | 3.00% |
12/31/16 | 9.71 | 0.33 | 0.15 | 0.48 | (0.30) | — | (0.30) | 9.89 | 4.94% | 421,624 | 0.59% | 0.59%l | 3.27% |
Service Class I | | | | | | | | | | | | |
12/31/20 | $ 10.07 | $ 0.27 | $ 0.08 | $ 0.35 | $ (0.03) | $ — | $ (0.03) | $ 10.39 | 3.51% | $ 12,458 | 0.87% | N/A | 2.62% |
12/31/19 | 9.59 | 0.33 | 0.48 | 0.81 | (0.33) | — | (0.33) | 10.07 | 8.53% | 10,142 | 0.85% | 0.85%l | 3.28% |
12/31/18 | 9.93 | 0.32 | (0.35) | (0.03) | (0.31) | — | (0.31) | 9.59 | (0.33%) | 6,272 | 0.84% | 0.84%l | 3.30% |
12/31/17 | 9.88 | 0.28 | 0.12 | 0.40 | (0.31) | (0.04) | (0.35) | 9.93 | 4.11% | 4,412 | 0.84% | 0.84%l | 2.77% |
12/31/16 | 9.71 | 0.31 | 0.14 | 0.45 | (0.28) | — | (0.28) | 9.88 | 4.67% | 2,907 | 0.84% | 0.84%l | 3.14% |
| | Year ended December 31 |
| | 2020 | 2019 | 2018 | 2017 | 2016 |
Portfolio turnover rate | 159% | 54% | 68% | 100% | 79% |
c | Per share amount calculated on the average shares method. |
j | Computed after giving effect to an agreement by MML Advisers to waive certain fees and expenses of the Fund. |
l | Expenses incurred during the period fell under the expense cap. |
m | Total return does not reflect expenses that apply at the separate account level or to related insurance products. Inclusion of these charges would reduce the total return figures for all periods shown. |
The accompanying notes are an integral part of the financial statements.
160
MML Series Investment Fund II – Financial Statements (Continued) |
Financial Highlights (For a share outstanding throughout each period) |
MML Equity Fund
| | | Income (loss) from investment
operations | Less distributions to shareholders | | | Ratios / Supplemental Data |
| | Net
asset
value,
beginning
of the
period | Net
investment
income
(loss)c | Net
realized and
unrealized
gain (loss)
on
investments | Total
income
(loss) from
investment
operations | From net
investment
income | From net
realized
gains | Total
distributions | Net
asset
value,
end of
the
period | Total
returnm | Net
assets,
end of
the
period
(000’s) | Ratio of
expenses
to average
daily net
assets | Net
investment
income
(loss) to
average
daily net
assets |
Initial Class | | | | | | | | | | | |
12/31/20 | $ 28.10 | $ 0.51 | $ (0.12)aa | $ 0.39 | $ (0.59) | $ (2.86) | $ (3.45) | $ 25.04 | 3.03% | $ 686,468 | 0.45% | 2.13% |
12/31/19 | 24.16 | 0.57 | 5.42 | 5.99 | (0.57) | (1.48) | (2.05) | 28.10 | 25.92% | 729,367 | 0.44% | 2.14% |
12/31/18 | 31.69 | 0.60 | (3.06) | (2.46) | (0.57) | (4.50) | (5.07) | 24.16 | (9.99%) | 634,703 | 0.44% | 2.00% |
12/31/17 | 28.08 | 0.52 | 3.85 | 4.37 | (0.55) | (0.21) | (0.76) | 31.69 | 15.79% | 774,278 | 0.43% | 1.73% |
12/31/16 | 27.08 | 0.58 | 2.69 | 3.27 | (0.49) | (1.78) | (2.27) | 28.08 | 12.59% | 727,540 | 0.44% | 2.15% |
Service Class | | | | | | | | | | | |
12/31/20 | $ 27.68 | $ 0.44 | $ (0.13)aa | $ 0.31 | $ (0.52) | $ (2.86) | $ (3.38) | $ 24.61 | 2.77% | $ 94,341 | 0.70% | 1.88% |
12/31/19 | 23.82 | 0.50 | 5.34 | 5.84 | (0.50) | (1.48) | (1.98) | 27.68 | 25.61% | 97,058 | 0.69% | 1.89% |
12/31/18 | 31.31 | 0.52 | (3.01) | (2.49) | (0.50) | (4.50) | (5.00) | 23.82 | (10.22%) | 82,977 | 0.69% | 1.75% |
12/31/17 | 27.77 | 0.44 | 3.80 | 4.24 | (0.49) | (0.21) | (0.70) | 31.31 | 15.50% | 94,815 | 0.68% | 1.49% |
12/31/16 | 26.81 | 0.50 | 2.67 | 3.17 | (0.43) | (1.78) | (2.21) | 27.77 | 12.31% | 82,045 | 0.69% | 1.90% |
| | Year ended December 31 |
| | 2020 | 2019 | 2018 | 2017 | 2016 |
Portfolio turnover rate | 82% | 113% | 41% | 70% | 47% |
c | Per share amount calculated on the average shares method. |
m | Total return does not reflect expenses that apply at the separate account level or to related insurance products. Inclusion of these charges would reduce the total return figures for all periods shown. |
aa | The amount shown for a share outstanding does not correspond with the aggregate net realized and unrealized gain (loss) for the period due to the timing of purchases and redemptions of Fund shares in relation to the fluctuating market values of the Fund. |
The accompanying notes are an integral part of the financial statements.
161
MML Series Investment Fund II – Financial Statements (Continued) |
Financial Highlights (For a share outstanding throughout each period) |
MML Equity Momentum Fund
| | | Income (loss) from investment
operations | Less distributions to shareholders | | | Ratios / Supplemental Data |
| | Net
asset
value,
beginning
of the
period | Net
investment
income
(loss)c,j | Net
realized
and
unrealized
gain (loss)
on
investments | Total
income
(loss) from
investment
operations | From net
investment
income | From net
realized
gains | Total
distributions | Net
asset
value,
end of
the
period | Total
returnm | Net
assets,
end of
the
period
(000’s) | Ratio of
expenses
to average
daily net
assets
before
expense
waivers | Ratio of
expenses
to average
daily net
assets
after
expense
waiversj | Net
investment
income
(loss) to
average
daily net
assets |
Class II | | | | | | | | | | | |
12/31/20 | $ 12.19 | $ 0.03 | $ 2.39 | $ 2.42 | $ (0.03) | $ (1.32) | $ (1.35) | $ 13.26 | 20.26% | $ 38,291 | 0.95% | 0.91% | 0.23% |
12/31/19 | 9.33 | 0.08 | 3.45 | 3.53 | (0.10) | (0.57) | (0.67) | 12.19 | 37.93% | 31,840 | 1.02% | 0.98% | 0.75% |
12/31/18 | 12.44 | 0.07 | (2.05) | (1.98) | (0.02) | (1.11) | (1.13) | 9.33 | (16.69%) | 23,087 | 0.93% | 0.80% | 0.58% |
12/31/17 | 10.32 | 0.05 | 3.40 | 3.45 | (0.18) | (1.15) | (1.33) | 12.44 | 33.92% | 27,728 | 0.93% | 0.80% | 0.45% |
12/31/16 | 9.43 | 0.02 | 0.94 | 0.96 | (0.07) | — | (0.07) | 10.32 | 10.20% | 20,688 | 0.97% | 0.80% | 0.25% |
Service Class I | | | | | | | | | | | |
12/31/20 | $ 12.11 | $ (0.00)d | $ 2.37 | $ 2.37 | $ (0.00)d | $ (1.32) | $ (1.32) | $ 13.16 | 20.00% | $ 2,048 | 1.20% | 1.16% | (0.02%) |
12/31/19 | 9.28 | 0.06 | 3.42 | 3.48 | (0.08) | (0.57) | (0.65) | 12.11 | 37.51% | 1,894 | 1.27% | 1.23% | 0.49% |
12/31/18 | 12.41 | 0.04 | (2.05) | (2.01) | (0.01) | (1.11) | (1.12) | 9.28 | (16.93%) | 1,380 | 1.18% | 1.05% | 0.35% |
12/31/17 | 10.29 | 0.02 | 3.41 | 3.43 | (0.16) | (1.15) | (1.31) | 12.41 | 33.77% | 1,519 | 1.18% | 1.05% | 0.21% |
12/31/16 | 9.42 | 0.01 | 0.92 | 0.93 | (0.06) | — | (0.06) | 10.29 | 9.85% | 929 | 1.22% | 1.05% | 0.13% |
| | Year ended December 31 |
| | 2020 | 2019 | 2018 | 2017 | 2016 |
Portfolio turnover rate | 144% | 14% | 115% | 19% | 82% |
c | Per share amount calculated on the average shares method. |
d | Amount is less than $0.005 per share. |
j | Computed after giving effect to an agreement by MML Advisers to waive certain fees and expenses of the Fund. |
m | Total return does not reflect expenses that apply at the separate account level or to related insurance products. Inclusion of these charges would reduce the total return figures for all periods shown. |
The accompanying notes are an integral part of the financial statements.
162
MML Series Investment Fund II – Financial Statements (Continued) |
Financial Highlights (For a share outstanding throughout each period) |
MML Equity Rotation Fund
| | | Income (loss) from investment
operations | Less distributions to shareholders | | | Ratios / Supplemental Data |
| | Net
asset
value,
beginning
of the
period | Net
investment
income
(loss)c,j | Net
realized
and
unrealized
gain (loss)
on
investments | Total
income
(loss) from
investment
operations | From net
investment
income | From net
realized
gains | Total
distributions | Net
asset
value,
end of
the
period | Total
returnm | Net
assets,
end of
the
period
(000’s) | Ratio of
expenses
to average
daily net
assets
before
expense
waivers | Ratio of
expenses
to average
daily net
assets
after
expense
waiversj | Net
investment
income
(loss) to
average
daily net
assets |
Class II | | | | | | | | | | | |
12/31/20 | $ 12.40 | $ 0.14 | $ 2.68 | $ 2.82 | $ (0.21) | $ (0.22) | $ (0.43) | $ 14.79 | 22.92% | $ 38,834 | 0.79% | 0.79%k | 1.13% |
12/31/19 | 10.89 | 0.10 | 1.67 | 1.77 | (0.05) | (0.21) | (0.26) | 12.40 | 16.50% | 31,593 | 0.86% | 0.83% | 0.84% |
12/31/18 | 13.89 | 0.12 | (1.23) | (1.11) | (0.12) | (1.77) | (1.89) | 10.89 | (8.86%) | 27,112 | 0.75% | 0.65% | 0.86% |
12/31/17 | 11.28 | 0.10 | 3.30 | 3.40 | (0.10) | (0.69) | (0.79) | 13.89 | 30.09% | 29,745 | 0.76% | 0.65% | 0.79% |
12/31/16 | 9.71 | 0.13 | 1.57 | 1.70 | (0.13) | — | (0.13) | 11.28 | 17.48% | 22,878 | 0.76% | 0.65% | 1.28% |
Service Class I | | | | | | | | | | | |
12/31/20 | $ 12.36 | $ 0.11 | $ 2.66 | $ 2.77 | $ (0.18) | $ (0.22) | $ (0.40) | $ 14.73 | 22.57% | $ 2,210 | 1.04% | 1.04%k | 0.88% |
12/31/19 | 10.85 | 0.07 | 1.67 | 1.74 | (0.02) | (0.21) | (0.23) | 12.36 | 16.30% | 1,898 | 1.11% | 1.08% | 0.59% |
12/31/18 | 13.85 | 0.08 | (1.22) | (1.14) | (0.09) | (1.77) | (1.86) | 10.85 | (9.10%) | 1,598 | 1.00% | 0.90% | 0.61% |
12/31/17 | 11.27 | 0.07 | 3.28 | 3.35 | (0.08) | (0.69) | (0.77) | 13.85 | 29.68% | 1,435 | 1.01% | 0.90% | 0.57% |
12/31/16 | 9.71 | 0.09 | 1.58 | 1.67 | (0.11) | — | (0.11) | 11.27 | 17.22% | 431 | 1.01% | 0.90% | 0.92% |
| | Year ended December 31 |
| | 2020 | 2019 | 2018 | 2017 | 2016 |
Portfolio turnover rate | 137% | 172% | 102% | 63% | 90% |
c | Per share amount calculated on the average shares method. |
j | Computed after giving effect to an agreement by MML Advisers to waive certain fees and expenses of the Fund. |
k | Amount waived had no impact on the ratio of expenses to average daily net assets. |
m | Total return does not reflect expenses that apply at the separate account level or to related insurance products. Inclusion of these charges would reduce the total return figures for all periods shown. |
The accompanying notes are an integral part of the financial statements.
163
MML Series Investment Fund II – Financial Statements (Continued) |
Financial Highlights (For a share outstanding throughout each period) |
MML High Yield Fund
| | | Income (loss) from investment
operations | Less distributions to shareholders | | | Ratios / Supplemental Data |
| | Net
asset
value,
beginning
of the
period | Net
investment
income
(loss)c,j | Net
realized
and
unrealized
gain (loss)
on
investments | Total
income
(loss) from
investment
operations | From net
investment
income | From net
realized
gains | Tax
return of
capital | Total
distributions | Net
asset
value,
end of
the
period | Total
returnm | Net
assets,
end of
the
period
(000’s) | Ratio of
expenses
to average
daily net
assets
before
expense
waivers | Ratio of
expenses
to average
daily net
assets
after
expense
waiversj | Net
investment
income
(loss) to
average
daily net
assets |
Class II | | | | | | | | | | | | |
12/31/20 | $ 9.57 | $ 0.55 | $ (0.02) | $ 0.53 | $ (0.00)d | $ — | $ — | $ (0.00)d | $ 10.10 | 5.56% | $ 50,805 | 0.87% | 0.80% | 5.93% |
12/31/19 | 9.07 | 0.57 | 0.52 | 1.09 | (0.59) | — | — | (0.59) | 9.57 | 12.25% | 86,651 | 0.88% | 0.80% | 5.98% |
12/31/18 | 10.01 | 0.62 | (0.94) | (0.32) | (0.62) | — | (0.00)d | (0.62) | 9.07 | (3.40%) | 79,542 | 0.85% | 0.75% | 6.29% |
12/31/17 | 9.93 | 0.69 | 0.11 | 0.80 | (0.67) | — | (0.05) | (0.72) | 10.01 | 8.22% | 95,599 | 0.84% | 0.74% | 6.71% |
12/31/16 | 9.17 | 0.71 | 0.76 | 1.47 | (0.71) | — | — | (0.71) | 9.93 | 16.48% | 95,180 | 0.84% | 0.74% | 7.42% |
Service Class I | | | | | | | | | | | | |
12/31/20 | $ 9.53 | $ 0.52 | $ (0.01) | $ 0.51 | $ (0.00)d | $ — | $ — | $ (0.00)d | $ 10.04 | 5.38% | $ 46,727 | 1.12% | 1.05% | 5.69% |
12/31/19 | 9.04 | 0.54 | 0.52 | 1.06 | (0.57) | — | — | (0.57) | 9.53 | 11.86% | 47,405 | 1.13% | 1.05% | 5.73% |
12/31/18 | 9.97 | 0.59 | (0.92) | (0.33) | (0.60) | — | (0.00)d | (0.60) | 9.04 | (3.54%) | 39,983 | 1.10% | 1.00% | 6.04% |
12/31/17 | 9.90 | 0.66 | 0.11 | 0.77 | (0.66) | — | (0.04) | (0.70) | 9.97 | 7.88% | 38,967 | 1.09% | 0.99% | 6.45% |
12/31/16 | 9.14 | 0.69 | 0.75 | 1.44 | (0.68) | — | — | (0.68) | 9.90 | 16.25% | 30,946 | 1.09% | 0.99% | 7.19% |
| | Year ended December 31 |
| | 2020 | 2019 | 2018 | 2017 | 2016 |
Portfolio turnover rate | 73% | 54% | 39% | 63% | 59% |
c | Per share amount calculated on the average shares method. |
d | Amount is less than $0.005 per share. |
j | Computed after giving effect to an agreement by MML Advisers to waive certain fees and expenses of the Fund. |
m | Total return does not reflect expenses that apply at the separate account level or to related insurance products. Inclusion of these charges would reduce the total return figures for all periods shown. |
The accompanying notes are an integral part of the financial statements.
164
MML Series Investment Fund II – Financial Statements (Continued) |
Financial Highlights (For a share outstanding throughout each period) |
MML Inflation-Protected and Income Fund
| | | Income (loss) from investment
operations | Less distributions to shareholders | | | Ratios / Supplemental Data |
| | Net
asset
value,
beginning
of the
period | Net
investment
income
(loss)c,j | Net
realized
and
unrealized
gain (loss)
on
investments | Total
income
(loss) from
investment
operations | From net
investment
income | From net
realized
gains | Tax
return of
capital | Total
distributions | Net
asset
value,
end of
the
period | Total
returnm | Net
assets,
end of
the
period
(000’s) | Ratio of
expenses
to average
daily net
assets
before
expense
waivers
(including
(interest
expense)p | Ratio of
expenses
to average
daily net
assets after
expense
waivers
(including
interest
expense)j,p | Ratio of
expenses
to average
daily net
assets after
expense
waivers
(excluding
interest
expense)j | Net
investment
income
(loss) to
average
daily net
assets
(including
interest
expense)p |
Initial Class | | | | | | | | | | | | | |
12/31/20 | $ 10.28 | $ 0.17 | $ 0.97 | $ 1.14 | $ (0.01) | $ — | $ — | $ (0.01) | $ 11.41 | 11.11% | $ 288,026 | 0.75% | 0.74% | 0.60% | 1.54% |
12/31/19 | 9.72 | 0.23 | 0.58 | 0.81 | (0.25) | — | — | (0.25) | 10.28 | 8.31% | 314,261 | 2.34% | N/A | 0.60% | 2.29% |
12/31/18 | 10.16 | 0.30 | (0.43) | (0.13) | (0.31) | — | — | (0.31) | 9.72 | (1.29%) | 311,927 | 2.08% | N/A | 0.60% | 2.97% |
12/31/17 | 10.18 | 0.24 | 0.08 | 0.32 | (0.28) | — | (0.06) | (0.34) | 10.16 | 3.21% | 377,984 | 1.50% | N/A | 0.59% | 2.33% |
12/31/16 | 9.92 | 0.21 | 0.30 | 0.51 | (0.25) | — | — | (0.25) | 10.18 | 5.10% | 375,135 | 1.13% | N/A | 0.60% | 2.00% |
Service Class | | | | | | | | | | | | | |
12/31/20 | $ 10.23 | $ 0.14 | $ 0.97 | $ 1.11 | $ (0.01) | $ — | $ — | $ (0.01) | $ 11.33 | 10.88% | $ 46,181 | 0.98% | 0.98%k | 0.85% | 1.29% |
12/31/19 | 9.68 | 0.20 | 0.58 | 0.78 | (0.23) | — | — | (0.23) | 10.23 | 8.05% | 43,237 | 2.59% | N/A | 0.85% | 2.02% |
12/31/18 | 10.12 | 0.27 | (0.42) | (0.15) | (0.29) | — | — | (0.29) | 9.68 | (1.54%) | 41,379 | 2.33% | N/A | 0.85% | 2.72% |
12/31/17 | 10.14 | 0.21 | 0.09 | 0.30 | (0.26) | — | (0.06) | (0.32) | 10.12 | 2.96% | 46,104 | 1.75% | N/A | 0.84% | 2.08% |
12/31/16 | 9.87 | 0.18 | 0.31 | 0.49 | (0.22) | — | — | (0.22) | 10.14 | 4.90% | 47,025 | 1.38% | N/A | 0.85% | 1.77% |
| | Year ended December 31 |
| | 2020 | 2019 | 2018 | 2017 | 2016 |
Portfolio turnover rate | 84% | 44% | 51% | 34% | 41% |
c | Per share amount calculated on the average shares method. |
j | Computed after giving effect to an agreement by MML Advisers to waive certain fees and expenses of the Fund. |
k | Amount waived had no impact on the ratio of expenses to average daily net assets. |
m | Total return does not reflect expenses that apply at the separate account level or to related insurance products. Inclusion of these charges would reduce the total return figures for all periods shown. |
p | Interest expense incurred as a result of entering into reverse repurchase agreements is included in the Fund’s net expenses in the Statements of Operations. Income earned on investing proceeds from reverse repurchase agreements is included in interest income in the Statements of Operations. |
The accompanying notes are an integral part of the financial statements.
165
MML Series Investment Fund II – Financial Statements (Continued) |
Financial Highlights (For a share outstanding throughout each period) |
MML Managed Bond Fund
| | | Income (loss) from investment
operations | Less distributions to shareholders | | | Ratios / Supplemental Data |
| | Net
asset
value,
beginning
of the
period | Net
investment
income
(loss)c | Net
realized
and
unrealized
gain (loss)
on
investments | Total
income
(loss) from
investment
operations | From net
investment
income | From net
realized
gains | Total
distributions | Net
asset
value,
end of
the
period | Total
returnm | Net
assets,
end of
the
period
(000’s) | Ratio of
expenses
to average
daily net
assets | Net
investment
income
(loss) to
average
daily net
assets |
Initial Class | | | | | | | | | | |
12/31/20 | $ 12.64 | $ 0.42 | $ 0.54 | $ 0.96 | $ (0.01) | $ — | $ (0.01) | $ 13.59 | 7.62% | $ 756,218 | 0.43% | 3.25% |
12/31/19 | 11.93 | 0.43 | 0.74 | 1.17 | (0.46) | — | (0.46) | 12.64 | 9.85% | 846,138 | 0.42% | 3.43% |
12/31/18 | 12.41 | 0.40 | (0.46) | (0.06) | (0.42) | — | (0.42) | 11.93 | (0.44%) | 778,603 | 0.42% | 3.34% |
12/31/17 | 12.24 | 0.35 | 0.22 | 0.57 | (0.40) | — | (0.40) | 12.41 | 4.69% | 953,592 | 0.40% | 2.78% |
12/31/16 | 12.31 | 0.33 | 0.02 | 0.35 | (0.36) | (0.06) | (0.42) | 12.24 | 2.75% | 941,621 | 0.39% | 2.61% |
Service Class | | | | | | | | | | | |
12/31/20 | $ 12.61 | $ 0.39 | $ 0.54 | $ 0.93 | $ (0.01) | $ — | $ (0.01) | $ 13.53 | 7.40% | $ 271,928 | 0.68% | 3.01% |
12/31/19 | 11.91 | 0.40 | 0.73 | 1.13 | (0.43) | — | (0.43) | 12.61 | 9.57% | 265,691 | 0.67% | 3.19% |
12/31/18 | 12.39 | 0.37 | (0.46) | (0.09) | (0.39) | — | (0.39) | 11.91 | (0.69%) | 254,883 | 0.67% | 3.10% |
12/31/17 | 12.22 | 0.31 | 0.23 | 0.54 | (0.37) | — | (0.37) | 12.39 | 4.43% | 279,082 | 0.65% | 2.53% |
12/31/16 | 12.29 | 0.29 | 0.03 | 0.32 | (0.33) | (0.06) | (0.39) | 12.22 | 2.49% | 260,735 | 0.64% | 2.36% |
| | Year ended December 31 |
| | 2020 | 2019 | 2018 | 2017 | 2016 |
Portfolio turnover rate | 226% | 260% | 138% | 237% | 314% |
c | Per share amount calculated on the average shares method. |
m | Total return does not reflect expenses that apply at the separate account level or to related insurance products. Inclusion of these charges would reduce the total return figures for all periods shown. |
The accompanying notes are an integral part of the financial statements.
166
MML Series Investment Fund II – Financial Statements (Continued) |
Financial Highlights (For a share outstanding throughout each period) |
MML Short-Duration Bond Fund
| | | Income (loss) from investment
operations | Less distributions to shareholders | | | Ratios / Supplemental Data |
| | Net
asset
value,
beginning
of the
period | Net
investment
income
(loss)c,j | Net
realized
and
unrealized
gain (loss)
on
investments | Total
income
(loss) from
investment
operations | From net
investment
income | From net
realized
gains | Tax
return of
capital | Total
distributions | Net
asset
value,
end of
the
period | Total
returnm | Net
assets,
end of
the
period
(000’s) | Ratio of
expenses
to average
daily net
assets
before
expense
waivers | Ratio of
expenses
to average
daily net
assets
after
expense
waiversj | Net
investment
income
(loss) to
average
daily net
assets |
Class II | | | | | | | | | | | | |
12/31/20 | $ 9.69 | $ 0.29 | $ (0.14) | $ 0.15 | $ (0.00)d | $ — | $ — | $ (0.00)d | $ 9.84 | 1.55% | $ 142,514 | 0.56% | N/A | 3.00% |
12/31/19 | 9.59 | 0.29 | 0.13 | 0.42 | (0.32) | — | — | (0.32) | 9.69 | 4.45% | 171,740 | 0.57% | 0.57%k | 3.00% |
12/31/18 | 9.73 | 0.26 | (0.11) | 0.15 | (0.29) | — | — | (0.29) | 9.59 | 1.53% | 172,577 | 0.56% | 0.55% | 2.66% |
12/31/17 | 9.75 | 0.20 | 0.05 | 0.25 | (0.27) | — | (0.00)d | (0.27) | 9.73 | 2.55% | 213,602 | 0.55% | 0.55%k | 2.08% |
12/31/16 | 9.70 | 0.18 | 0.09 | 0.27 | (0.22) | — | — | (0.22) | 9.75 | 2.80% | 203,294 | 0.56% | 0.55% | 1.84% |
Service Class I | | | | | | | | | | | | |
12/31/20 | $ 9.68 | $ 0.26 | $ (0.13) | $ 0.13 | $ (0.00)d | $ — | $ — | $ (0.00)d | $ 9.81 | 1.34% | $ 47,956 | 0.81% | N/A | 2.74% |
12/31/19 | 9.58 | 0.27 | 0.13 | 0.40 | (0.30) | — | — | (0.30) | 9.68 | 4.17% | 36,270 | 0.82% | 0.82%k | 2.76% |
12/31/18 | 9.72 | 0.23 | (0.11) | 0.12 | (0.26) | — | — | (0.26) | 9.58 | 1.29% | 30,686 | 0.81% | 0.80% | 2.42% |
12/31/17 | 9.74 | 0.18 | 0.04 | 0.22 | (0.24) | — | (0.00)d | (0.24) | 9.72 | 2.29% | 30,951 | 0.80% | 0.80%k | 1.83% |
12/31/16 | 9.69 | 0.16 | 0.09 | 0.25 | (0.20) | — | — | (0.20) | 9.74 | 2.55% | 31,787 | 0.81% | 0.80% | 1.60% |
| | Year ended December 31 |
| | 2020 | 2019 | 2018 | 2017 | 2016 |
Portfolio turnover rate | 44% | 53% | 54% | 51% | 96% |
c | Per share amount calculated on the average shares method. |
d | Amount is less than $0.005 per share. |
j | Computed after giving effect to an agreement by MML Advisers to waive certain fees and expenses of the Fund. |
k | Amount waived had no impact on the ratio of expenses to average daily net assets. |
m | Total return does not reflect expenses that apply at the separate account level or to related insurance products. Inclusion of these charges would reduce the total return figures for all periods shown. |
The accompanying notes are an integral part of the financial statements.
167
MML Series Investment Fund II – Financial Statements (Continued) |
Financial Highlights (For a share outstanding throughout each period) |
MML Small Cap Equity Fund
| | | Income (loss) from investment
operations | Less distributions to shareholders | | | Ratios / Supplemental Data |
| | Net
asset
value,
beginning
of the
period | Net
investment
income
(loss)c | Net
realized
and
unrealized
gain (loss)
on
investments | Total
income
(loss) from
investment
operations | From net
investment
income | From net
realized
gains | Total
distributions | Net
asset
value,
end of
the
period | Total
returnm | Net
assets,
end of
the
period
(000’s) | Ratio of
expenses
to average
daily net
assets | Net
investment
income
(loss) to
average
daily net
assets |
Initial Class | | | | | | | | | | |
12/31/20 | $ 9.34 | $ 0.07 | $ 1.84 | $ 1.91 | $ (0.05) | $ (0.09) | $ (0.14) | $ 11.11 | 20.70% | $ 104,243 | 0.73% | 0.77% |
12/31/19 | 8.17 | 0.07 | 1.96 | 2.03 | (0.05) | (0.81) | (0.86) | 9.34 | 26.46% | 94,712 | 0.74% | 0.79% |
12/31/18 | 10.30 | 0.07 | (0.82) | (0.75) | (0.05) | (1.33) | (1.38) | 8.17 | (10.19%) | 82,609 | 0.71% | 0.66% |
12/31/17 | 9.45 | 0.06 | 1.27 | 1.33 | (0.09) | (0.39) | (0.48) | 10.30 | 14.37% | 102,033 | 0.71% | 0.64% |
12/31/16 | 8.27 | 0.10 | 1.37 | 1.47 | (0.09) | (0.20) | (0.29) | 9.45 | 18.21% | 97,747 | 0.72% | 1.21% |
Service Class | | | | | | | | | | | |
12/31/20 | $ 9.14 | $ 0.04 | $ 1.81 | $ 1.85 | $ (0.03) | $ (0.09) | $ (0.12) | $ 10.87 | 20.39% | $ 25,345 | 0.98% | 0.52% |
12/31/19 | 8.01 | 0.05 | 1.91 | 1.96 | (0.02) | (0.81) | (0.83) | 9.14 | 26.15% | 22,695 | 0.99% | 0.54% |
12/31/18 | 10.13 | 0.04 | (0.80) | (0.76) | (0.03) | (1.33) | (1.36) | 8.01 | (10.41%) | 18,425 | 0.96% | 0.41% |
12/31/17 | 9.31 | 0.04 | 1.24 | 1.28 | (0.07) | (0.39) | (0.46) | 10.13 | 14.08% | 17,644 | 0.96% | 0.40% |
12/31/16 | 8.15 | 0.08 | 1.35 | 1.43 | (0.07) | (0.20) | (0.27) | 9.31 | 17.92% | 13,279 | 0.97% | 0.96% |
| | Year ended December 31 |
| | 2020 | 2019 | 2018 | 2017 | 2016 |
Portfolio turnover rate | 36% | 27% | 50% | 47% | 63% |
c | Per share amount calculated on the average shares method. |
m | Total return does not reflect expenses that apply at the separate account level or to related insurance products. Inclusion of these charges would reduce the total return figures for all periods shown. |
The accompanying notes are an integral part of the financial statements.
168
MML Series Investment Fund II – Financial Statements (Continued) |
Financial Highlights (For a share outstanding throughout each period) |
MML Special Situations Fund
| | | Income (loss) from investment
operations | Less distributions to shareholders | | | Ratios / Supplemental Data |
| | Net
asset
value,
beginning
of the
period | Net
investment
income
(loss)c,j | Net
realized
and
unrealized
gain (loss)
on
investments | Total
income
(loss) from
investment
operations | From net
investment
income | From net
realized
gains | Tax
return of
capital | Total
distributions | Net
asset
value,
end of
the
period | Total
returnm | Net
assets,
end of
the
period
(000’s) | Ratio of
expenses
to average
daily net
assets
before
expense
waivers | Ratio of
expenses
to average
daily net
assets
after
expense
waiversj | Net
investment
income
(loss) to
average
daily net
assets |
Class II | | | | | | | | | | | | |
12/31/20 | $ 12.98 | $ 0.04 | $ 3.70 | $ 3.74 | $ (0.04) | $ (1.80) | $ — | $ (1.84) | $ 14.88 | 29.61% | $ 35,232 | 0.98% | 0.97% | 0.29% |
12/31/19 | 10.51 | 0.02 | 2.47 | 2.49 | (0.02) | — | — | (0.02) | 12.98 | 23.68% | 27,196 | 1.05% | 1.01% | 0.16% |
12/31/18 | 11.52 | 0.07 | (0.62) | (0.55) | (0.06) | (0.40) | — | (0.46) | 10.51 | (4.83%) | 21,976 | 0.94% | 0.80% | 0.55% |
12/31/17 | 9.71 | 0.01 | 1.82 | 1.83 | (0.02) | — | — | (0.02) | 11.52 | 18.82% | 23,093 | 0.94% | 0.80% | 0.13% |
12/31/16 | 8.43 | 0.04 | 1.30 | 1.34 | (0.04) | — | (0.02) | (0.06) | 9.71 | 15.84% | 19,441 | 0.93% | 0.80% | 0.43% |
Service Class I | | | | | | | | | | | | |
12/31/20 | $ 12.93 | $ 0.01 | $ 3.66 | $ 3.67 | $ (0.00)d | $ (1.80) | $ — | $ (1.80) | $ 14.80 | 29.24% | $ 1,125 | 1.23% | 1.22% | 0.04% |
12/31/19 | 10.47 | (0.01) | 2.47 | 2.46 | — | — | — | — | 12.93 | 23.50% | 971 | 1.30% | 1.26% | (0.09%) |
12/31/18 | 11.49 | 0.03 | (0.61) | (0.58) | (0.04) | (0.40) | — | (0.44) | 10.47 | (5.13%) | 752 | 1.19% | 1.05% | 0.29% |
12/31/17 | 9.69 | (0.01) | 1.81 | 1.80 | — | — | — | — | 11.49 | 18.58% | 601 | 1.19% | 1.05% | (0.13%) |
12/31/16 | 8.42 | 0.02 | 1.29 | 1.31 | (0.03) | — | (0.01) | (0.04) | 9.69 | 15.54% | 359 | 1.18% | 1.05% | 0.18% |
| | Year ended December 31 |
| | 2020 | 2019 | 2018 | 2017 | 2016 |
Portfolio turnover rate | 146% | 62% | 33% | 48% | 74% |
c | Per share amount calculated on the average shares method. |
d | Amount is less than $0.005 per share. |
j | Computed after giving effect to an agreement by MML Advisers to waive certain fees and expenses of the Fund. |
m | Total return does not reflect expenses that apply at the separate account level or to related insurance products. Inclusion of these charges would reduce the total return figures for all periods shown. |
The accompanying notes are an integral part of the financial statements.
169
MML Series Investment Fund II – Financial Statements (Continued) |
Financial Highlights (For a share outstanding throughout each period) |
��
MML Strategic Emerging Markets Fund
| | | Income (loss) from investment
operations | Less distributions to shareholders | | | Ratios / Supplemental Data |
| | Net
asset
value,
beginning
of the
period | Net
investment
income
(loss)c,j | Net
realized
and
unrealized
gain (loss)
on
investments | Total
income
(loss) from
investment
operations | From net
investment
income | From net
realized
gains | Total
distributions | Net
asset
value,
end of
the
period | Total
returnm | Net
assets,
end of
the
period
(000’s) | Ratio of
expenses to
average
daily net
assets
before
expense
waivers | Ratio of
expenses
to average
daily net
assets
after
expense
waiversj | Net
investment
income
(loss) to
average
daily net
assets |
Class II | | | | | | | | | | | |
12/31/20 | $ 12.67 | $ (0.01) | $ 2.16 | $ 2.15 | $ (0.05) | $ (0.34) | $ (0.39) | $ 14.43 | 17.55% | $ 96,846 | 1.40% | 1.35% | (0.05%) |
12/31/19 | 10.12 | 0.05 | 2.53 | 2.58 | (0.03) | — | (0.03) | 12.67 | 25.53% | 125,192 | 1.33% | 1.29% | 0.45% |
12/31/18 | 11.57 | 0.05 | (1.48) | (1.43) | (0.02) | — | (0.02) | 10.12 | (12.40%) | 112,363 | 1.57% | 1.35% | 0.41% |
12/31/17 | 8.64 | 0.02 | 2.92 | 2.94 | (0.01) | — | (0.01) | 11.57 | 34.02% | 95,374 | 1.50% | 1.37% | 0.23% |
12/31/16 | 8.15 | 0.02 | 0.51 | 0.53 | (0.04) | — | (0.04) | 8.64 | 6.49% | 86,289 | 1.50% | 1.40% | 0.29% |
Service Class I | | | | | | | | | | | | |
12/31/20 | $ 12.68 | $ (0.04) | $ 2.15 | $ 2.11 | $ (0.02) | $ (0.34) | $ (0.36) | $ 14.43 | 17.18% | $ 17,536 | 1.65% | 1.60% | (0.32%) |
12/31/19 | 10.13 | 0.02 | 2.53 | 2.55 | (0.00)d | — | (0.00)d | 12.68 | 25.18% | 17,174 | 1.58% | 1.54% | 0.19% |
12/31/18 | 11.59 | 0.02 | (1.48) | (1.46) | — | — | — | 10.13 | (12.60%) | 14,089 | 1.82% | 1.60% | 0.15% |
12/31/17 | 8.66 | (0.00)d | 2.93 | 2.93 | — | — | — | 11.59 | 33.83% | 14,758 | 1.75% | 1.62% | (0.04%) |
12/31/16 | 8.17 | 0.00d | 0.51 | 0.51 | (0.02) | — | (0.02) | 8.66 | 6.24% | 9,913 | 1.75% | 1.65% | 0.03% |
| | Year ended December 31 |
| | 2020 | 2019 | 2018 | 2017 | 2016 |
Portfolio turnover rate | 35% | 31% | 38% | 36% | 32% |
c | Per share amount calculated on the average shares method. |
d | Amount is less than $0.005 per share. |
j | Computed after giving effect to an agreement by MML Advisers to waive certain fees and expenses of the Fund. |
m | Total return does not reflect expenses that apply at the separate account level or to related insurance products. Inclusion of these charges would reduce the total return figures for all periods shown. |
The accompanying notes are an integral part of the financial statements.
170
MML Series Investment Fund II – Financial Statements (Continued) |
Financial Highlights (For a share outstanding throughout each period) |
MML U. S. Government Money Market Fund
| | | Income (loss) from investment
operations | Less distributions to shareholders | | | Ratios / Supplemental Data |
| | Net
asset
value,
beginning
of the
period | Net
investment
income
(loss)c,j | Net
realized
and
unrealized
gain (loss)
on
investments | Total income
(loss) from
investment
operations | From net
investment
income | From net
realized
gains | Total
distributions | Net
asset
value,
end of
the
period | Total
returnm | Net
assets,
end of
the
period
(000’s) | Ratio of
expenses to
average
daily net
assets
before
expense
waivers | Ratio of
expenses
to average
daily net
assets
after
expense
waiversj | Net
investment
income
(loss) to
average
daily net
assets |
Initial Class | | | | | | | | | | | |
12/31/20 | $ 1.00 | $ 0.00d | $ 0.00d | $ 0.00d | $ (0.00)d | $ — | $ (0.00)d | $ 1.00 | 0.23% | $ 223,388 | 0.52% | 0.30% | 0.21% |
12/31/19 | 1.00 | 0.02 | 0.00d | 0.02 | (0.02) | — | (0.02) | 1.00 | 1.71% | 174,899 | 0.54% | N/A | 1.69% |
12/31/18 | 1.00 | 0.01 | 0.00d | 0.01 | (0.01) | — | (0.01) | 1.00 | 1.32% | 179,102 | 0.54% | N/A | 1.35% |
12/31/17 | 1.00 | 0.00d | 0.00d | 0.00d | (0.00)d | (0.00)d | (0.00)d | 1.00 | 0.36% | 149,271 | 0.54% | N/A | 0.35% |
12/31/16 | 1.00 | 0.00d | 0.00d | 0.00d | (0.00)d | — | (0.00)d | 1.00 | 0.11% | 166,136 | 0.54% | 0.40% | 0.00%e |
c | Per share amount calculated on the average shares method. |
d | Amount is less than $0.005 per share. |
e | Amount is less than 0.005%. |
j | Computed after giving effect to an agreement by MML Advisers to waive certain fees and expenses of the Fund. |
m | Total return does not reflect expenses that apply at the separate account level or to related insurance products. Inclusion of these charges would reduce the total return figures for all periods shown. |
The accompanying notes are an integral part of the financial statements.
171
Notes to Financial Statements |
MML Series Investment Fund II (the “Trust”) is registered under the Investment Company Act of 1940, as amended (the “1940 Act”), as an open-end management investment company. The Trust is organized under the laws of the Commonwealth of Massachusetts as a Massachusetts business trust pursuant to an Agreement and Declaration of Trust dated February 8, 2005, which was amended and restated as of February 28, 2005 and December 15, 2011, as it may be further amended from time to time. The Trust consists of the following series (each individually referred to as a “Fund” or collectively as the “Funds”):
MML Blend Fund (“Blend Fund”)
MML Dynamic Bond Fund (“Dynamic Bond Fund”)
MML Equity Fund (“Equity Fund”)
MML Equity Momentum Fund (formerly known as MML Asset Momentum Fund) (“Equity Momentum Fund’)
MML Equity Rotation Fund (“Equity Rotation Fund”)
MML High Yield Fund (“High Yield Fund”)
MML Inflation-Protected and Income Fund (“Inflation-Protected and Income Fund”)
MML Managed Bond Fund (“Managed Bond Fund”)
MML Short-Duration Bond Fund (“Short-Duration Bond Fund”)
MML Small Cap Equity Fund (“Small Cap Equity Fund”)
MML Special Situations Fund (“Special Situations Fund”)
MML Strategic Emerging Markets Fund (“Strategic Emerging Markets Fund”)
MML U.S. Government Money Market Fund (“U.S. Government Money Market Fund”)
The Trust makes shares of the Funds available for the investment of assets of various separate investment accounts established by Massachusetts Mutual Life Insurance Company (“MassMutual”) and by life insurance companies which are subsidiaries of MassMutual. Shares of the Trust are not offered to the general public. MassMutual, MML Bay State Life Insurance Company, C.M. Life Insurance Company, and the Conservative Allocation Fund, Balanced Allocation Fund, Moderate Allocation Fund, Growth Allocation Fund, and Aggressive Allocation Fund, which are “funds of funds” series of MML Series Investment Fund, another open-end management investment company sponsored by MassMutual, are the record owners of all of the outstanding shares of the Funds.
Each share class of a Fund represents an interest in the same portfolio of assets. The principal difference among the classes is the level of service and administration fees, and shareholder and distribution service expenses borne by the classes. Because each class will have different fees and expenses, performance and share prices will vary between the classes. The classes of shares are offered to different types of investors, as outlined in the Funds’ Prospectus.
2. | Significant Accounting Policies |
The following is a summary of significant accounting policies followed consistently by each Fund in the preparation of the financial statements in conformity with accounting principles generally accepted in the United States of America (“generally accepted accounting principles”). The preparation of the financial statements in accordance with generally accepted accounting principles requires management to make estimates and assumptions that affect the reported amounts and disclosures in the financial statements. Actual results could differ from those estimates.
Each Fund is an investment company and accordingly follows the investment company accounting and reporting guidance of the Financial Accounting Standards Board (“FASB”) Accounting Standards Codification Topic 946, Financial Services – Investment Companies.
Investment Valuation
The net asset value of each Fund’s shares is determined once daily as of the close of regular trading on the New York Stock Exchange (“NYSE”), on each day the NYSE is open for trading (a “business day”). The NYSE normally closes at 4:00 p.m. Eastern Time, but may close earlier on some days. If the NYSE is scheduled to close early, the business day will be considered to end as of the time of the NYSE’s scheduled close. A Fund will not treat an intraday disruption in NYSE trading or other event
172
Notes to Financial Statements (Continued) |
that causes an unscheduled closing of the NYSE as a close of business of the NYSE for these purposes and will instead fair value securities in accordance with procedures approved annually by the Board of Trustees (“Trustees”), and under the general oversight of the Trustees. On holidays and other days when the NYSE is closed, each Fund’s net asset value generally is not calculated and the Funds do not anticipate accepting buy or sell orders. However, the value of each Fund’s assets may still be affected on such days to the extent that a Fund holds foreign securities that trade on days that foreign securities markets are open.
Equity securities and derivative contracts that are actively traded on a national securities exchange or contract market are valued on the basis of information furnished by a pricing service, which provides the last reported sale price, or, in the case of futures contracts, the settlement price, for securities or derivatives listed on the exchange or contract market or the official closing price on the NASDAQ National Market System (“NASDAQ System”), or in the case of over-the-counter (“OTC”) securities for which an official closing price is unavailable or not reported on the NASDAQ System, the last reported bid price. Portfolio securities traded on more than one national securities exchange are valued at the last price at the close of the exchange representing the principal market for such securities. Debt securities (with the exception of debt securities held by the U.S. Government Money Market Fund) are valued on the basis of valuations furnished by a pricing service, which generally determines valuations taking into account factors such as institutional-size trading in similar securities, yield, quality, coupon rate, maturity, type of issue, trading characteristics, and other market data. Shares of other open-end mutual funds are valued at their closing net asset values as reported on each business day. The U.S. Government Money Market Fund’s debt securities are typically valued at amortized cost, but may be valued using a vendor quote if the Fund’s investment adviser determines it more closely approximates current market value, in accordance with Rule 2a-7 under the 1940 Act pursuant to which the U.S. Government Money Market Fund must adhere to certain conditions. It is the intention of the U.S. Government Money Market Fund to maintain a stable net asset value per share of $1.00, although this cannot be assured.
Investments for which market quotations are readily available are marked to market daily based on those quotations. Market quotations may be provided by third-party vendors or market makers, and may be determined on the basis of a variety of factors, such as broker quotations, financial modeling, and other market data, such as market indexes and yield curves, counterparty information, and foreign exchange rates. U.S. Government and agency securities may be valued on the basis of market quotations or using a model that may incorporate market observable data such as reported sales of similar securities, broker quotes, yields, bids, offers, quoted market prices, and reference data. The fair values of OTC derivative contracts, including forward, swap, and option contracts related to interest rates, foreign currencies, credit standing of reference entities, equity prices, or commodity prices, may be based on market quotations or may be modeled using a series of techniques, including simulation models, depending on the contract and the terms of the transaction. The fair values of asset-backed securities and mortgage-backed securities are estimated based on models that consider the estimated cash flows of each debt tranche of the issuer, established benchmark yield, and estimated tranche-specific spread to the benchmark yield based on the unique attributes of the tranche, including, but not limited to, prepayment speed assumptions and attributes of the collateral. Restricted securities are generally valued at a discount to similar publicly traded securities.
Investments for which market quotations are not available or for which a pricing service or vendor does not provide a value, or for which such market quotations or values are considered by the investment adviser or subadviser to be unreliable (including, for example, certain foreign securities, thinly-traded securities, certain restricted securities, certain initial public offerings, or securities whose values may have been affected by a significant event) are stated at fair valuations determined in good faith by the Funds’ Valuation Committee1 in accordance with procedures approved annually by the Trustees, and under the general oversight of the Trustees. The Funds’ Valuation Committee employs various methods to determine fair valuations including a regular review of significant inputs and assumptions and review of any related market activity. The Funds’ Valuation Committee reports to the Trustees at its regularly scheduled meetings. It is possible that fair value prices will be used by the Funds to a significant extent. The value determined for an investment using the Funds’ fair value procedures may differ from recent market prices for the investment and may be significantly different from the value realized upon the sale of such investment.
1 | The voting members of the Valuation Committee consist of the President, Treasurer, Assistant Treasurers, Vice Presidents (except for the CCO, Secretary, and Assistant Secretaries) of the Trust, as well as such other members as the Trustees may from time to time designate. The non-voting members of the Valuation Committee consist of the CCO, Secretary, and Assistant Secretaries. The Valuation Committee reviews and determines the fair valuation of portfolio securities and the Funds’ pricing procedures in general. |
173
Notes to Financial Statements (Continued) |
The Funds may invest in securities that are traded principally in foreign markets and that trade on weekends and other days when the Funds do not price their shares. As a result, the values of the Funds’ portfolio securities may change on days when the prices of the Funds’ shares are not calculated. The prices of the Funds’ shares will reflect any such changes when the prices of the Funds’ shares are next calculated, which is the next business day. The Funds may use fair value pricing more frequently for securities primarily traded in foreign markets because, among other things, most foreign markets close well before the Funds value their securities. The earlier close of these foreign markets gives rise to the possibility that significant events, including broad market moves, may have occurred in the interim. The Funds’ investments may be priced based on fair values provided by a third-party vendor, based on certain factors and methodologies applied by such vendor, in the event that there is movement in the U.S. market, between the close of the foreign market and the time the Funds calculate their net asset values. All assets and liabilities expressed in foreign currencies are converted into U.S. dollars at the mean between the buying and selling rates of such currencies against the U.S. dollar at the end of each business day.
For investments in equity or debt issued by privately held companies or funds (“Private Company” or collectively, the “Private Companies”) and any other investments fair valued using significant unobservable inputs, as described below, the fair valuation approaches used by third party service providers and/or the Funds’ subadvisers utilize one or a combination of, but not limited to, the following inputs:
| Market approach: (i) recent market transactions, including subsequent rounds of financing, in the underlying investment or comparable issuers; (ii) recapitalizations and other transactions across the capital structure; and (iii) market multiples of comparable issuers. |
| Income approach: (i) future cash flows discounted to present value and adjusted as appropriate for liquidity, credit, and/or market risks; (ii) quoted prices for similar investments or assets in active markets; and (iii) other risk factors, such as interest rates, yield curves, volatilities, prepayment speeds, loss severities, credit risks, recovery rates, liquidation amounts, and/or default rates. |
| Cost approach: (i) audited or unaudited financial statements, investor communications, and financial or operational metrics issued by the Private Company; (ii) changes in the valuation of relevant indices or publicly traded companies comparable to the Private Company; (iii) relevant news and other public sources; and (iv) known secondary market transactions in the Private Company’s interests and merger or acquisition activity in companies comparable to the Private Company. |
Investments in series of preferred stock issued by Private Companies are typically valued utilizing Market approach in determining the enterprise value of the company. Such investments often contain rights and preferences that differ from other series of preferred and common stock of the same issuer. Valuation techniques such as the current value method (“CVM”), an option pricing model (“OPM”), a probability weighted expected return model (“PWERM”), or a hybrid of those techniques are used in allocating enterprise value of the company, as deemed appropriate under the circumstances. The CVM allocates value among the various parts of a company’s capital structure assuming that the value of convertible preferred stock is represented by the most favorable claim the preferred stockholders have on the enterprise value as of the valuation date. The use of OPM and PWERM techniques involve a determination of the exit scenarios of the investment in order to appropriately allocate the enterprise value of the company among the various parts of its capital structure.
The Private Companies are not subject to the public company disclosure, timing, and reporting standards as other investments held by a Fund. Typically, the most recently available information for a Private Company is as of a date that is earlier than the date a Fund is calculating its net asset value. This factor may result in a difference between the value of the investment and the price a Fund could receive upon the sale of the investment.
Fair value is defined as the price that would be received to sell an asset or paid to transfer a liability in an orderly transaction between market participants at the measurement date. A three-tier hierarchy is utilized to maximize the use of observable market data inputs and minimize the use of unobservable inputs and to establish classification of fair value measurements for disclosure purposes. Inputs refer broadly to the assumptions that market participants would use in pricing the asset or liability, including assumptions about risk, for example, the risk inherent in a particular valuation technique used to measure fair value (such as a pricing model) and/or the risk inherent in the inputs to the valuation technique. Inputs may be observable or unobservable.
174
Notes to Financial Statements (Continued) |
Observable inputs are inputs that reflect the assumptions market participants would use in pricing the asset or liability and are developed based on market data obtained from sources independent of the reporting entity. Unobservable inputs are inputs that reflect the reporting entity’s own assumptions about the assumptions market participants would use in pricing the asset or liability and are developed based on the best information available in the circumstances. The three-tier hierarchy of inputs is summarized in the three broad Levels listed below. The inputs or methodology used for valuing investments are not necessarily an indication of the risk associated with investing in those investments and the determination of the significance of a particular input to the fair value measurement in its entirety requires judgment and consideration of factors specific to each security.
Level 1 – quoted prices (unadjusted) in active markets for identical investments that the Funds can access at the measurement date
Level 2 – other significant observable inputs (including quoted prices for similar investments, interest rates, prepayment speeds, credit risk, etc.)
Level 3 – significant unobservable inputs, to the extent observable inputs are not available (including the Funds’ own assumptions in determining the fair value of investments)
The availability of observable inputs can vary from security to security and is affected by a wide variety of factors, including, for example, the type of security, whether the security is new and not yet established in the marketplace, the liquidity of markets, and other characteristics particular to the security. To the extent that valuation is based on models or inputs that are less observable or unobservable in the market, the determination of fair value requires more judgment. Accordingly, the degree of judgment exercised in determining fair value is greatest for instruments categorized in Level 3.
Changes in valuation techniques may result in transfers in or out of an investment’s assigned Level within the hierarchy. In addition, in periods of market dislocation, the observability of prices and inputs may be reduced for many instruments. This condition, as well as changes related to liquidity of investments, could cause a security to be reclassified between Levels.
In certain cases, the inputs used to measure fair value may fall into different Levels of the fair value hierarchy. In such cases, for disclosure purposes, the Level in the fair value hierarchy within which the fair value measurement falls is determined based on the lowest Level input that is significant to the overall fair value measurement.
The U.S. Government Money Market Fund characterized all investments at Level 2, as of December 31, 2020. The Blend Fund, Equity Momentum Fund, Equity Rotation Fund, Small Cap Equity Fund, and Special Situations Fund characterized all long-term investments at Level 1, and all short-term investments at Level 2, as of December 31, 2020. For each Fund noted in the preceding sentences, the level classification by major category of investments is the same as the category presentation in the Portfolio of Investments.
The following is the aggregate value by input level, as of December 31, 2020, for the remaining Funds’ investments:
| | | Level 1 | | | Level 2 | | | Level 3 | | | Total | |
Dynamic Bond Fund | | | | | | | | | | | | | | | | |
Asset Investments | | | | | | | | | | | | | | | | |
Bank Loans (less Unfunded Loan Commitments) | | $ | — | | | $ | 12,424,379 | | | $ | — | | | $ | 12,424,379 | |
Corporate Debt | | | — | | | | 85,648,553 | | | | — | | | | 85,648,553 | |
Municipal Obligations | | | — | | | | 487,291 | | | | — | | | | 487,291 | |
Non-U.S. Government Agency Obligations | | | — | | | | 83,391,910 | | | | — | | | | 83,391,910 | |
Sovereign Debt Obligations | | | — | | | | 4,470,808 | | | | — | | | | 4,470,808 | |
U.S. Government Agency Obligations and Instrumentalities | | | — | | | | 58,675,890 | | | | — | | | | 58,675,890 | |
U.S. Treasury Obligations | | | — | | | | 79,846,407 | | | | — | | | | 79,846,407 | |
Short-Term Investments | | | — | | | | 2,405,741 | | | | — | | | | 2,405,741 | |
Unfunded Loan Commitments*** | | | — | | | | 376 | | | | — | | | | 376 | |
Total Investments | | $ | — | | | $ | 327,351,355 | | | $ | — | | | $ | 327,351,355 | |
| | | | | | | | | | | | | | | | | |
175
Notes to Financial Statements (Continued) |
| | | Level 1 | | | Level 2 | | | Level 3 | | | Total | |
Equity Fund | | | | | | | | | | | | | | | | |
Asset Investments | | | | | | | | | | | | | | | | |
Common Stock | | $ | 768,785,410 | | | $ | 3,601,130 | * | | $ | — | | | $ | 772,386,540 | |
Preferred Stock | | | 411,567 | | | | — | | | | — | | | | 411,567 | |
Mutual Funds | | | 3,930,006 | | | | — | | | | — | | | | 3,930,006 | |
Short-Term Investments | | | 454,618 | | | | 2,699,237 | | | | — | | | | 3,153,855 | |
Total Investments | | $ | 773,581,601 | | | $ | 6,300,367 | | | $ | — | | | $ | 779,881,968 | |
| | | | | | | | | | | | | | | | | |
High Yield Fund | | | | | | | | | | | | | | | | |
Asset Investments | | | | | | | | | | | | | | | | |
Common Stock | | $ | — | | | $ | — | | | $ | 613,139 | ** | | $ | 613,139 | |
Bank Loans | | | — | | | | 6,862,849 | | | | — | | | | 6,862,849 | |
Corporate Debt | | | — | | | | 87,835,957 | | | | — | | | | 87,835,957 | |
Short-Term Investments | | | — | | | | 1,812,986 | | | | — | | | | 1,812,986 | |
Total Investments | | $ | — | | | $ | 96,511,792 | | | $ | 613,139 | | | $ | 97,124,931 | |
| | | | | | | | | | | | | | | | | |
Inflation-Protected and Income Fund | | | | | | | | | | | | | | | | |
Asset Investments | | | | | | | | | | | | | | | | |
Municipal Obligations | | $ | — | | | $ | 17,537 | | | $ | — | | | $ | 17,537 | |
Non-U.S. Government Agency Obligations | | | — | | | | 186,887,441 | | | | — | | | | 186,887,441 | |
U.S. Government Agency Obligations and Instrumentalities | | | — | | | | 13,152,007 | | | | — | | | | 13,152,007 | |
U.S. Treasury Obligations | | | — | | | | 60,637,493 | | | | — | | | | 60,637,493 | |
Purchased Options | | | — | | | | 1,199,703 | | | | — | | | | 1,199,703 | |
Short-Term Investments | | | — | | | | 61,818,876 | | | | — | | | | 61,818,876 | |
Total Investments | | $ | — | | | $ | 323,713,057 | | | $ | — | | | $ | 323,713,057 | |
Asset Derivatives | | | | | | | | | | | | | | | | |
Futures Contracts | | $ | 89,060 | | | $ | — | | | $ | — | | | $ | 89,060 | |
Swap Agreements | | | — | | | | 4,639,031 | | | | — | | | | 4,639,031 | |
Total | | $ | 89,060 | | | $ | 4,639,031 | | | $ | — | | | $ | 4,728,091 | |
Liability Derivatives | | | | | | | | | | | | | | | | |
Futures Contracts | | $ | (38,763 | ) | | $ | — | | | $ | — | | | $ | (38,763 | ) |
Swap Agreements | | | — | | | | (4,270 | ) | | | — | | | | (4,270 | ) |
Total | | $ | (38,763 | ) | | $ | (4,270 | ) | | $ | — | | | $ | (43,033 | ) |
| | | | | | | | | | | | | | | | | |
Managed Bond Fund | | | | | | | | | | | | | | | | |
Asset Investments | | | | | | | | | | | | | | | | |
Corporate Debt | | $ | — | | | $ | 401,282,706 | | | $ | — | | | $ | 401,282,706 | |
Municipal Obligations | | | — | | | | 2,499,295 | | | | — | | | | 2,499,295 | |
Non-U.S. Government Agency Obligations | | | — | | | | 336,514,776 | | | | — | | | | 336,514,776 | |
Sovereign Debt Obligations | | | — | | | | 8,178,050 | | | | — | | | | 8,178,050 | |
U.S. Government Agency Obligations and Instrumentalities | | | — | | | | 220,231,784 | | | | — | | | | 220,231,784 | |
U.S. Treasury Obligations | | | — | | | | 34,661,569 | | | | — | | | | 34,661,569 | |
Purchased Options | | | — | | | | 2,021,202 | | | | — | | | | 2,021,202 | |
Short-Term Investments | | | — | | | | 143,267,620 | | | | — | | | | 143,267,620 | |
Total Investments | | $ | — | | | $ | 1,148,657,002 | | | $ | — | | | $ | 1,148,657,002 | |
Asset Derivatives | | | | | | | | | | | | | | | | |
Futures Contracts | | $ | 200,445 | | | $ | — | | | $ | — | | | $ | 200,445 | |
Liability Derivatives | | | | | | | | | | | | | | | | |
Futures Contracts | | $ | (1,795,635 | ) | | $ | — | | | $ | — | | | $ | (1,795,635 | ) |
| | | | | | | | | | | | | | | | | |
176
Notes to Financial Statements (Continued) |
| | | Level 1 | | | Level 2 | | | Level 3 | | | Total | |
Short-Duration Bond Fund | | | | | | | | | | | | | | | | |
Asset Investments | | | | | | | | | | | | | | | | |
Corporate Debt | | $ | — | | | $ | 84,124,671 | | | $ | — | | | $ | 84,124,671 | |
Municipal Obligations | | | — | | | | 405,409 | | | | — | | | | 405,409 | |
Non-U.S. Government Agency Obligations | | | — | | | | 92,270,351 | | | | — | | | | 92,270,351 | |
U.S. Government Agency Obligations and Instrumentalities | | | — | | | | 3,003,021 | | | | — | | | | 3,003,021 | |
U.S. Treasury Obligations | | | — | | | | 1,302,708 | | | | — | | | | 1,302,708 | |
Purchased Options | | | — | | | | 80,604 | | | | — | | | | 80,604 | |
Short-Term Investments | | | — | | | | 8,886,954 | | | | — | | | | 8,886,954 | |
Total Investments | | $ | — | | | $ | 190,073,718 | | | $ | — | | | $ | 190,073,718 | |
Asset Derivatives | | | | | | | | | | | | | | | | |
Futures Contracts | | $ | 51,295 | | | $ | — | | | $ | — | | | $ | 51,295 | |
Liability Derivatives | | | | | | | | | | | | | | | | |
Futures Contracts | | $ | (315,261 | ) | | $ | — | | | $ | — | | | $ | (315,261 | ) |
| | | | | | | | | | | | | | | | | |
Strategic Emerging Markets Fund | | | | | | | | | | | | | | | | |
Asset Investments | | | | | | | | | | | | | | | | |
Common Stock* | | | | | | | | | | | | | | | | |
Belgium | | $ | — | | | $ | 1,200,302 | | | $ | — | | | $ | 1,200,302 | |
Bermuda | | | 1,051,696 | | | | 833,357 | | | | — | | | | 1,885,053 | |
Brazil | | | 2,210,108 | | | | 1,620,655 | | | | — | | | | 3,830,763 | |
Cayman Islands | | | 14,835,591 | | | | 11,867,302 | | | | — | | | | 26,702,893 | |
Chile | | | — | | | | 860,092 | | | | — | | | | 860,092 | |
China | | | 148,999 | | | | 5,090,124 | | | | — | | | | 5,239,123 | |
Colombia | | | 462,852 | | | | — | | | | — | | | | 462,852 | |
Egypt | | | — | | | | 743,060 | | | | — | | | | 743,060 | |
France | | | — | | | | 6,223,599 | | | | — | | | | 6,223,599 | |
Hong Kong | | | — | | | | 4,515,657 | | | | — | | | | 4,515,657 | |
India | | | — | | | | 16,733,938 | | | | — | | | | 16,733,938 | |
Indonesia | | | — | | | | 1,408,889 | | | | — | | | | 1,408,889 | |
Italy | | | — | | | | 2,319,687 | | | | — | | | | 2,319,687 | |
Luxembourg | | | — | | | | 132,499 | | | | — | | | | 132,499 | |
Mexico | | | 6,370,323 | | | | — | | | | — | | | | 6,370,323 | |
Netherlands | | | 3,647,731 | | | | — | | | | — | | | | 3,647,731 | |
Philippines | | | — | | | | 2,975,546 | | | | — | | | | 2,975,546 | |
Republic of Korea | | | — | | | | 1,891,157 | | | | — | | | | 1,891,157 | |
Russia | | | 50,164 | | | | 4,883,231 | | | | — | | | | 4,933,395 | |
South Africa | | | — | | | | 707,768 | | | | — | | | | 707,768 | |
Switzerland | | | — | | | | 1,992,128 | | | | — | | | | 1,992,128 | |
Taiwan | | | — | | | | 9,805,118 | | | | — | | | | 9,805,118 | |
Turkey | | | — | | | | 537,975 | | | | — | | | | 537,975 | |
United States | | | 4,144,791 | | | | — | | | | — | | | | 4,144,791 | |
Preferred Stock* | | | | | | | | | | | | | | | | |
Brazil | | | — | | | | 1,716,247 | | | | — | | | | 1,716,247 | |
India | | | 27,444 | | | | — | | | | — | | | | 27,444 | |
Singapore | | | — | | | | — | | | | 2,160,355 | | | | 2,160,355 | |
Mutual Funds | | | 486,403 | | | | — | | | | — | | | | 486,403 | |
Warrants | | | 12,639 | | | | — | | | | — | | | | 12,639 | |
Short-Term Investments | | | — | | | | 966,520 | | | | — | | | | 966,520 | |
Total Investments | | $ | 33,448,741 | | | $ | 79,024,851 | | | $ | 2,160,355 | | | $ | 114,633,947 | |
* | Includes foreign equity securities whose values were adjusted to reflect market trading of comparable securities or other correlated instruments after the close of trading in their respective foreign markets, as applicable. |
177
Notes to Financial Statements (Continued) |
** | None of the unobservable inputs for Level 3 assets, individually or collectively, had a material impact on the Fund(s). Level 3 investments at December 31, 2020 in relation to net assets were not significant and accordingly, a reconciliation of Level 3 assets for the year ended December 31, 2020 is not presented. |
*** | Unfunded loan commitments are valued at the unrealized appreciation (depreciation) on the commitment. |
For certain Fund(s) the Statement of Assets and Liabilities shows receivables from investments sold on a delayed delivery basis and collateral pledged for open futures contracts, as well as, any applicable liabilities for investments purchased on a delayed delivery basis, amounts due to custodian, collateral held for open purchased options, collateral held for when-issued securities, collateral held for open swap agreements, and collateral held for securities on loan. These amounts approximate fair value and would be categorized at Level 2 for each applicable Fund as of December 31, 2020.
The Funds, with the exception of the High Yield Fund, had no Level 3 transfers during the year ended December 31, 2020. The High Yield Fund had Level 3 transfers during the year ended December 31, 2020; however, none of the transfers individually or collectively had a material impact on the High Yield Fund.
Following is a reconciliation of investments for which significant unobservable inputs (Level 3) were used in determining value:
Asset Valuation Inputs
| | | Investments in Securities | |
| | | Balance
as of
12/31/19 | | | Accrued
Discounts
(Premiums) | | | Realized
Gain (Loss) | | | Change in
Unrealized
Appreciation
(Depreciation) | | | Purchases | | | (Sales) | | | Transfers into
Level 3 | | | Transfers
(out) of
Level 3 | | | Balance
as of
12/31/20 | | | Net Change
in Unrealized
Appreciation
(Depreciation)
from
Investments
Still Held as
of 12/31/20 | |
Strategic Emerging Markets Fund | | | | | | | | | | | | | | | | | | | | | | | | | | | | | | | | |
Preferred Stock | | $ | 2,160,355 | | | $ | — | | | $ | — | | | $ | — | | | $ | — | | | $ | — | | | $ | — | | | $ | — | | | $ | 2,160,355 | | | $ | — | |
The Strategic Emerging Markets Fund fair values certain of its Level 3 investments using acquisition cost, although the transaction may not have occurred during the current reporting period. These investments are generally privately held investments, but may include defaulted securities and new debt issuances. There may not be a secondary market for such investments, and/or there are a limited number of investors. The determination to fair value such investments at cost is based upon factors consistent with the principles of fair value measurement that are reasonably available to the Valuation Committee. Valuations are reviewed by members of the Valuation Committee utilizing available market information to determine if the carrying value of these investments should be adjusted. Such market data may include, but is not limited to, observations of the trading multiples of public companies considered comparable to the private companies being valued, financial or operational information released by the company, and/or news or corporate events that affect the investment, also referred to as enterprise value (EV) to earnings before interest, taxes, depreciation, and amortization (EBITDA) ratios. Valuations may be adjusted to account for company-specific issues, the lack of liquidity inherent in a nonpublic investment and the fact that comparable public companies are not identical to the investments being fair valued by the Strategic Emerging Markets Fund. All market variables are assessed on a regular frequency and calibrated as necessary.
Strategic Emerging Markets Fund | | Fair Value
Amount | | Valuation Technique | Unobservable Input Description | | Value/ Weighted
Average Range | |
Preferred Stock — $ 2,160,355 | | | | | |
Grab Holdings, Inc. | | $ | 2,160,355 | | Market Approach | Market Transaction | | | $6.16 | |
Total | | $ | 2,160,355 | | | | | | | |
178
Notes to Financial Statements (Continued) |
Derivative Instruments
Derivatives are financial instruments whose values are based on the values of one or more indicators, such as a security, asset, currency, interest rate, or index. Derivative transactions can create investment leverage and may be highly volatile. Losses from derivatives can be substantially greater than the derivatives’ original cost and can sometimes be unlimited. A Fund may not be able to close out a derivative transaction at a favorable time or price.
At December 31, 2020, and during the year then ended, the Fund(s) had the following derivatives and transactions in derivatives, grouped into the indicated risk categories:
| | | Credit Risk | | | Equity Risk | | | Foreign
Exchange Risk | | | Interest
Rate Risk | | | Total | |
Blend Fund | | | | | | | | | | | | | | | | | | | | |
Realized Gain (Loss)# | | | | | | | | | | | | | | | | | | | | |
Purchased Options | | $ | — | | | $ | — | | | $ | — | | | $ | 12,637 | | | $ | 12,637 | |
Futures Contracts | | | — | | | | — | | | | — | | | | 2,713,504 | | | | 2,713,504 | |
Swap Agreements | | | 244,885 | | | | — | | | | — | | | | — | | | | 244,885 | |
Total Realized Gain (Loss) | | $ | 244,885 | | | $ | — | | | $ | — | | | $ | 2,726,141 | | | $ | 2,971,026 | |
Blend Fund (Continued) | | | | | | | | | | | | | | | | | | | | |
Change in Appreciation (Depreciation)## | | | | | | | | | | | | | | | | | | | | |
Purchased Options | | $ | — | | | $ | — | | | $ | — | | | $ | 171,649 | | | $ | 171,649 | |
Futures Contracts | | | — | | | | — | | | | — | | | | 488,282 | | | | 488,282 | |
Total Change in Appreciation (Depreciation) | | $ | — | | | $ | — | | | $ | — | | | $ | 659,931 | | | $ | 659,931 | |
| | | | | | | | | | | | | | | | | |
Equity Momentum Fund | | | | | | | | | | | | | | | | | | | | |
Realized Gain (Loss)# | | | | | | | | | | | | | | | | | | | | |
Purchased Options | | $ | — | | | $ | 201,594 | | | $ | — | | | $ | — | | | $ | 201,594 | |
Forward Contracts | | | — | | | | — | | | | 8,222 | | | | — | | | | 8,222 | |
Futures Contracts | | | — | | | | 4,505,446 | | | | — | | | | — | | | | 4,505,446 | |
Total Realized Gain (Loss) | | $ | — | | | $ | 4,707,040 | | | $ | 8,222 | | | $ | — | | | $ | 4,715,262 | |
Change in Appreciation (Depreciation)## | | | | | | | | | | | | | | | | | | | | |
Purchased Options | | $ | — | | | $ | (96,000 | ) | | $ | — | | | $ | — | | | $ | (96,000 | ) |
Forward Contracts | | | — | | | | — | | | | (1,731 | ) | | | — | | | | (1,731 | ) |
Futures Contracts | | | — | | | | (677,644 | ) | | | — | | | | — | | | | (677,644 | ) |
Total Change in Appreciation (Depreciation) | | $ | — | | | $ | (773,644 | ) | | $ | (1,731 | ) | | $ | — | | | $ | (775,375 | ) |
| | | | | | | | | | | | | | | | | | | | | |
Inflation-Protected and Income Fund | | | | | | | | | | | | | | | | |
Asset Derivatives | | | | | | | | | | | | | | | | | | | | |
Purchased Options* | | $ | — | | | $ | — | | | $ | — | | | $ | 1,199,703 | | | $ | 1,199,703 | |
Futures Contracts^^ | | | — | | | | — | | | | — | | | | 89,060 | | | | 89,060 | |
Swap Agreements* | | | — | | | | 4,503,164 | | | | — | | | | 135,867 | | | | 4,639,031 | |
Total Value | | $ | — | | | $ | 4,503,164 | | | $ | — | | | $ | 1,424,630 | | | $ | 5,927,794 | |
Liability Derivatives | | | | | | | | | | | | | | | | | | | | |
Futures Contracts^^ | | $ | — | | | $ | — | | | $ | — | | | $ | (38,763 | ) | | $ | (38,763 | ) |
Swap Agreements^ | | | — | | | | — | | | | — | | | | (4,270 | ) | | | (4,270 | ) |
Total Value | | $ | — | | | $ | — | | | $ | — | | | $ | (43,033 | ) | | $ | (43,033 | ) |
179
Notes to Financial Statements (Continued) |
| | | Credit Risk | | | Equity Risk | | | Foreign
Exchange Risk | | | Interest
Rate Risk | | | Total | |
Realized Gain (Loss)# | | | | | | | | | | | | | | | | | | | | |
Purchased Options | | $ | — | | | $ | — | | | $ | — | | | $ | 708,753 | | | $ | 708,753 | |
Futures Contracts | | | — | | | | — | | | | — | | | | (440,672 | ) | | | (440,672 | ) |
Swap Agreements | | | 53,436 | | | | 18,635,561 | | | | — | | | | (2,696,568 | ) | | | 15,992,429 | |
Total Realized Gain (Loss) | | $ | 53,436 | | | $ | 18,635,561 | | | $ | — | | | $ | (2,428,487 | ) | | $ | 16,260,510 | |
Change in Appreciation (Depreciation)## | | | | | | | | | | | | | | | | | | | | |
Purchased Options | | $ | — | | | $ | — | | | $ | — | | | $ | (374,325 | ) | | $ | (374,325 | ) |
Futures Contracts | | | — | | | | — | | | | — | | | | 91,932 | | | | 91,932 | |
Swap Agreements | | | — | | | | 4,503,164 | | | | — | | | | (429,302 | ) | | | 4,073,862 | |
Total Change in Appreciation (Depreciation) | | $ | — | | | $ | 4,503,164 | | | $ | — | | | $ | (711,695 | ) | | $ | 3,791,469 | |
| | | | | | | | | | | | | | | | | | | | | |
Managed Bond Fund | | | | | | | | | | | | | | | | | | | | |
Asset Derivatives | | | | | | | | | | | | | | | | | | | | |
Purchased Options* | | $ | — | | | $ | — | | | $ | — | | | $ | 2,021,202 | | | $ | 2,021,202 | |
Futures Contracts^^ | | | — | | | | — | | | | — | | | | 200,445 | | | | 200,445 | |
Total Value | | $ | — | | | $ | — | | | $ | — | | | $ | 2,221,647 | | | $ | 2,221,647 | |
Liability Derivatives | | | | | | | | | | | | | | | | | | | | |
Futures Contracts^^ | | $ | — | | | $ | — | | | $ | — | | | $ | (1,795,635 | ) | | $ | (1,795,635 | ) |
Realized Gain (Loss)# | | | | | | | | | | | | | | | | | | | | |
Purchased Options | | $ | — | | | $ | — | | | $ | — | | | $ | 1,837,597 | | | $ | 1,837,597 | |
Futures Contracts | | | — | | | | — | | | | — | | | | 14,754,297 | | | | 14,754,297 | |
Swap Agreements | | | 802,496 | | | | — | | | | — | | | | — | | | | 802,496 | |
Total Realized Gain (Loss) | | $ | 802,496 | | | $ | — | | | $ | — | | | $ | 16,591,894 | | | $ | 17,394,390 | |
Change in Appreciation (Depreciation)## | | | | | | | | | | | | | | | | | | | | |
Purchased Options | | $ | — | | | $ | — | | | $ | — | | | $ | 81,409 | | | $ | 81,409 | |
Futures Contracts | | | — | | | | — | | | | — | | | | 581,116 | | | | 581,116 | |
Total Change in Appreciation (Depreciation) | | $ | — | | | $ | — | | | $ | — | | | $ | 662,525 | | | $ | 662,525 | |
| | | | | | | | | | | | | | | | | | | | | |
Short-Duration Bond Fund | | | | | | | | | | | | | | | | | | | | |
Asset Derivatives | | | | | | | | | | | | | | | | | | | | |
Purchased Options* | | $ | — | | | $ | — | | | $ | — | | | $ | 80,604 | | | $ | 80,604 | |
Futures Contracts^^ | | | — | | | | — | | | | — | | | | 51,295 | | | | 51,295 | |
Total Value | | $ | — | | | $ | — | | | $ | — | | | $ | 131,899 | | | $ | 131,899 | |
Liability Derivatives | | | | | | | | | | | | | | | | | | | | |
Futures Contracts^^ | | $ | — | | | $ | — | | | $ | — | | | $ | (315,261 | ) | | $ | (315,261 | ) |
Realized Gain (Loss)# | | | | | | | | | | | | | | | | | | | | |
Purchased Options | | $ | — | | | $ | — | | | $ | — | | | $ | 140,669 | | | $ | 140,669 | |
Futures Contracts | | | — | | | | — | | | | — | | | | (3,834,570 | ) | | | (3,834,570 | ) |
Swap Agreements | | | 146,163 | | | | — | | | | — | | | | — | | | | 146,163 | |
Total Realized Gain (Loss) | | $ | 146,163 | | | $ | — | | | $ | — | | | $ | (3,693,901 | ) | | $ | (3,547,738 | ) |
Change in Appreciation (Depreciation)## | | | | | | | | | | | | | | | | | | | | |
Purchased Options | | $ | — | | | $ | — | | | $ | — | | | $ | 140,658 | | | $ | 140,658 | |
Futures Contracts | | | — | | | | — | | | | — | | | | (462,606 | ) | | | (462,606 | ) |
Total Change in Appreciation (Depreciation) | | $ | — | | | $ | — | | | $ | — | | | $ | (321,948 | ) | | $ | (321,948 | ) |
* | Statements of Assets and Liabilities location: Investments, at value, or Receivables from: open swap agreements, at value, as applicable. |
180
Notes to Financial Statements (Continued) |
^ | Statements of Assets and Liabilities location: Payables for: open swap agreements, at value. |
^^ | Cumulative appreciation (depreciation) on futures contracts is reported in “Futures Contracts” in each applicable Fund’s Portfolio of Investments. Only current day’s variation margin, if any, is reported within the Statements of Assets and Liabilities. |
# | Statements of Operations location: Amounts are included in net realized gain (loss) on: investment transactions, forward contracts, futures contracts, or swap agreements, as applicable. |
## | Statements of Operations location: Amounts are included in net change in unrealized appreciation (depreciation) on: investment transactions, forward contracts, futures contracts, or swap agreements, as applicable. |
For the year ended December 31, 2020, the number of contracts, notional amounts, or shares/units for each derivative type was as follows:
| | | Number of Contracts, Notional Amounts, or Shares/Units† | |
Fund Name | | Futures
Contracts | | | Forward
Contracts | | | Swap
Agreements | | | Purchased
Options | | | Purchased
Swaptions | |
Blend Fund | | | 401 | | | | — | | | $ | 3,477,778 | | | | — | | | $ | 16,174,194 | |
Equity Momentum Fund | | | 140 | | | | 1,418,159 | | | | — | | | | 3,200 | | | | — | |
Inflation-Protected and Income Fund | | | 157 | | | | — | | | | 50,018,617 | | | | — | | | | 38,571,667 | |
Managed Bond Fund | | | 1,588 | | | | — | | | | 18,450,000 | | | | — | | | | 78,741,667 | |
Short-Duration Bond Fund | | | 919 | | | | — | | | | 3,470,000 | | | | — | | | | 8,285,833 | |
† | Amount(s) disclosed represent average number of contracts for futures contracts, notional amounts for forward contracts, swap agreements, and purchased swaptions, or shares/units outstanding for purchased options, based on absolute values, which is indicative of volume of this derivative type, for the months that the Fund held such derivatives during the year ended December 31, 2020. |
The Portfolio of Investments included in a Fund’s financial statements shows the assets or liabilities of the Fund associated with individual derivatives transactions. The terms of many of those transactions contemplate that derivatives receivables and payables between the same two parties may be netted and that the parties will collateralize certain obligations. The following tables provide an illustration of the possible effect of netting provisions and of collateral (delivered or received) on a Fund’s derivatives exposure as of December 31, 2020. Netting arrangements vary among different counterparties, and the actual disposition of derivatives receivables and payables, and of collateral, in a bankruptcy or insolvency can be complicated and difficult to predict.
The following table presents derivative assets by counterparty net of amounts available for offset under a master netting agreement (“MNA”) or similar agreement and net of the related collateral received by the Fund(s) as of December 31, 2020.
Counterparty | | Derivative
Assets Subject
to an MNA by
Counterparty† | | | Financial
Instruments
Available for
Offset | | | Collateral
Received*** | | | Net Amount* | |
Inflation-Protected and Income Fund | | | | | | | | | | | | | | | | |
Bank of America N.A. | | $ | 18,155 | | | $ | — | | | $ | — | | | $ | 18,155 | |
Barclays Bank PLC | | | 870,223 | | | | — | | | | (870,223 | ) | | | — | |
BNP Paribas SA | | | 1,809,918 | | | | — | | | | (1,160,000 | ) | | | 649,918 | |
Credit Suisse International | | | 329,480 | | | | — | | | | (329,480 | ) | | | — | |
Goldman Sachs & Co. | | | 42,733 | | | | — | | | | — | | | | 42,733 | |
Goldman Sachs International | | | 2,759,494 | | | | (4,270 | ) | | | (2,180,000 | ) | | | 575,224 | |
JP Morgan Chase Bank N.A. | | | 8,731 | | | | — | | | | — | | | | 8,731 | |
| | | $ | 5,838,734 | | | $ | (4,270 | ) | | $ | (4,539,703 | ) | | $ | 1,294,761 | |
Managed Bond Fund | | | | | | | | | | | | | | | | |
Barclays Bank PLC | | $ | 2,021,202 | | | $ | — | | | $ | (2,021,202 | ) | | $ | — | |
| | | | | | | | | | | | | | | | | |
Short-Duration Bond Fund | | | | | | | | | | | | | | | | |
Credit Suisse International | | $ | 80,604 | | | $ | — | | | $ | (80,604 | ) | | $ | — | |
181
Notes to Financial Statements (Continued) |
The following table presents derivative liabilities by counterparty net of amounts available for offset under an MNA or similar agreement and net of the related collateral pledged by the Fund(s) as of December 31, 2020.
Counterparty | | Derivative
Liabilities Subject
to an MNA by
Counterparty† | | | Financial
Instruments
Available for
Offset | | | Collateral
Pledged*** | | | Net Amount** | |
Inflation-Protected and Income Fund | | | | | | | | | | | | | | | | |
Goldman Sachs International | | $ | (4,270 | ) | | $ | 4,270 | | | $ | — | | | $ | — | |
* | Represents the net amount receivable from the counterparty in the event of default. |
** | Represents the net amount payable to the counterparty in the event of default. |
*** | The amount presented here may be less than the total amount of collateral received/pledged as the net amount of derivative assets and liabilities for a counterparty cannot be less than $0. |
† | The amount presented here may be less than the total amount shown in the Statements of Assets and Liabilities as some derivatives held by the counterparty are not covered within an MNA or similar agreement. |
Such agreements typically permit a single net payment in the event of default, including the bankruptcy or insolvency of the counterparty. Typically, the Fund(s) and counterparties are not permitted to sell, re-pledge, or use the collateral they receive.
Further details regarding the derivatives and other investments held by the Fund(s) during the year ended December 31, 2020 are discussed below.
Foreign Currency Exchange Transactions
A Fund may engage in foreign currency exchange transactions for hedging purposes in order to protect against uncertainty in the level of future foreign currency exchange rates, or for other, non-hedging purposes.
A Fund may enter into foreign currency exchange transactions, including foreign currency forward contracts. These contracts call for the Fund to deliver in the future an amount of one currency in return for an amount of another currency, at an exchange rate determined at the time the contract is entered into. Forward contracts are private contractual arrangements and a Fund is subject to the risk that its counterparty will not, or will not be able to, perform its obligations. This type of arrangement may require the Fund to post margin. A Fund may enter into foreign currency exchange transactions in order to hedge against changes in the values of the assets or liabilities denominated in one or more foreign currencies, or otherwise to increase or reduce a Fund’s exposure to various foreign currencies. The use of foreign currency exchange transactions may create investment leverage.
Whenever a Fund enters into a foreign currency exchange transaction, it is subject to the risk that the value of the transaction will move in a direction unfavorable to it. When the Fund uses the transactions for hedging purposes, it is likely that the Fund will have an asset or liability that will offset any loss (or gain) on the transactions, at least in part. If a Fund enters into foreign currency exchange transactions other than for hedging purposes (for example, seeking to profit from an anticipated change in the values of currencies by creating directional exposures in the portfolio with respect to one or more currencies), it will generally be subject to the same risks, but is less likely to have assets or liabilities that will offset any losses on the transactions. There can be no assurance that a Fund will be able to terminate any foreign currency exchange transaction prior to its maturity in order to limit its loss on the transaction.
Forward foreign currency contracts are marked to market daily and the change in their value is recorded by the Funds as an unrealized gain or loss. Forward foreign currency contracts are valued at the settlement price established through dealers or other market sources on the day which they are traded. When a forward foreign currency contract is extinguished, through delivery or offset by entering into another forward foreign currency contract, the Funds record a realized gain or loss equal to the difference between the value of the contract at the time it was opened and the value of the contract at the time it was extinguished or offset.
182
Notes to Financial Statements (Continued) |
The notional or contractual amounts of these instruments do not necessarily represent the amounts potentially subject to risk. The measurement of the risk associated with these instruments is meaningful only when all related and offsetting transactions and counterparty risks are considered.
A Fund’s current exposure to a counterparty is the unrealized appreciation on the contract.
Futures Contracts
A Fund may seek to manage a variety of different risks, such as interest rate risk, equity price risk, and currency risk, through the use of futures contracts. A Fund may use interest rate futures contracts to adjust the interest rate sensitivity (duration) of its portfolio or the credit exposure of the portfolio. Interest rate futures contracts obligate the long or short holder to take or make delivery of a specified quantity of a financial instrument, such as a specific fixed income security, during a specified future period at a specified price. A Fund may use index futures contracts to hedge against broad market risks to its portfolio or to gain broad market exposure when it holds uninvested cash or as an inexpensive substitute for cash investments directly in securities or other assets, including commodities and precious metals. Securities index futures contracts are contracts to buy or sell units of a securities index at a specified future date at a price agreed upon when the contract is made and are settled in cash. Positions in futures contracts may be closed out only on an exchange or board of trade which provides a secondary market for such futures. Because futures contracts are exchange-traded, they typically have minimal exposure to counterparty risk.
Parties to a futures contract are not required to post the entire notional amount of the contract, but rather a small percentage of that amount (by way of margin), both at the time they enter into futures transactions, and then on a daily basis if their positions decline in value; as a result, futures contracts are highly leveraged. Such payments are known as variation margin and are recorded by the Funds as unrealized gains or losses. Because futures markets are highly leveraged, they can be extremely volatile, and there can be no assurance that the pricing of a futures contract will correlate precisely with the pricing of the asset or index underlying it or the asset or liability of the Fund that is the subject of the hedge. It may not always be possible for a Fund to enter into a closing transaction with respect to a futures contract it has entered into, at a favorable time or price. When a Fund enters into a futures transaction, it is subject to the risk that the value of the futures contract will move in a direction unfavorable to it. When a Fund uses futures contracts for hedging purposes, it is likely that the Fund will have an asset or liability that will offset any loss (or gain) on the transactions, at least in part.
When a futures contract is closed, the Fund records a realized gain or loss equal to the difference between the value of the contract at the time it was opened and the value at the time it was closed. Futures contracts are valued at the settlement price established each day by the board of trade or exchange on which they are traded.
Swap Agreements
Swap agreements are typically two-party contracts entered into primarily by institutional investors. In a standard “swap” transaction, two parties agree to exchange the returns (or differentials in rates of return) earned or realized on particular predetermined investments or instruments or rates, which may be adjusted for an interest factor. The gross returns to be exchanged or “swapped” between the parties are generally calculated with respect to a “notional amount,” (i.e., the return on or increase in value of a particular dollar amount invested at a particular interest rate or in a “basket” of securities representing a particular index).
Interest Rate Swaps. When a Fund enters into an interest rate swap, it typically agrees to make payments to its counterparty based on a specified long- or short-term interest rate and will receive payments from its counterparty based on another interest rate. Other forms of interest rate swap agreements include, among others, interest rate caps, under which, in return for a specified payment stream, one party agrees to make payments to the other to the extent that interest rates exceed a specified rate, or “cap”; interest rate floors, under which, in return for a specified payment stream, one party agrees to make payments to the other to the extent that interest rates fall below a specified rate, or “floor”; and interest rate collars, under which a party sells a cap and purchases a floor or vice versa in an attempt to protect itself against interest rate movements exceeding given minimum or maximum levels. A Fund may enter into an interest rate swap in order, for example, to hedge against the effect of interest rate changes on the value of specific securities in its portfolio, or to adjust the interest rate sensitivity (duration) or the credit exposure of its portfolio overall, or otherwise as a substitute for a direct investment in debt securities.
183
Notes to Financial Statements (Continued) |
Total Return Swaps. A Fund also may enter into total return swaps. In a total return swap, one party typically agrees to pay to the other a short-term interest rate in return for a payment at one or more times in the future based on the increase in the value of an underlying security or other asset, or index of securities or assets; if the underlying security, asset, or index declines in value, the party that pays the short-term interest rate must also pay to its counterparty a payment based on the amount of the decline. A Fund may take either side of such a swap, and so may take a long or short position in the underlying security, asset, or index. A Fund may enter into a total return swap to hedge against an exposure in its portfolio — such as interest rate risk (including to adjust the duration or credit quality of a Fund’s bond portfolio), equity risk, or credit risk — or generally to put cash to work efficiently in the markets in anticipation of, or as a replacement for, cash investments. A Fund may also enter into a total return swap to gain exposure to securities or markets in which it might not be able to invest directly (in so-called market access transactions).
Credit Default Swaps. A Fund also may enter into credit default swap transactions, as a “buyer” or “seller” of credit protection. In a credit default swap, one party provides what is in effect insurance against a default or other adverse credit event affecting an issuer of debt securities (typically referred to as a “reference entity”). In general, the buyer of credit protection is obligated to pay the protection seller an upfront amount or a periodic stream of payments over the term of the swap. If a “credit event” occurs, the buyer has the right to deliver to the seller bonds or other obligations of the reference entity (with a value up to the full notional value of the swap), and to receive a payment equal to the par value of the bonds or other obligations. Credit events that would trigger a request that the seller make payment are specific to each credit default swap agreement, but generally include bankruptcy, failure to pay, restructuring, acceleration, default, or repudiation/moratorium. When a Fund buys protection, it may or may not own securities of the reference entity. If it does own securities of the reference entity, the swap serves as a hedge against a decline in the value of the securities due to the occurrence of a credit event involving the issuer of the securities. If the Fund does not own securities of the reference entity, the credit default swap may be seen to create a short position in the reference entity. If a Fund is a buyer and no credit event occurs, the Fund will typically recover nothing under the swap, but will have had to pay the required upfront payment and stream of continuing payments under the swap. When a Fund sells protection under a credit default swap, the position may have the effect of creating leverage in the Fund’s portfolio through the Fund’s indirect long exposure to the issuer or securities on which the swap is written. When a Fund sells protection, it may do so either to earn additional income or to create a “synthetic” long position.
Whenever a Fund enters into a swap agreement, it takes on counterparty risk — the risk that its counterparty will be unable or unwilling to meet its obligations under the swap agreement. The Fund also takes the risk that the market will move against its position in the swap agreement. In the case of an interest rate swap, the value of the swap may increase or decrease depending on changes in interest rates. In the case of a total return swap, the swap will change in value depending on the change in value of the asset or index on which the swap is written. In the case of a credit default swap, the swap will become more or less valuable depending on the credit of the issuer of the underlying security, and, if a credit event occurs under a swap where the Fund is the seller of credit protection, the Fund could be required to purchase the security at par value, resulting in a significant loss to the Fund. When the Fund enters into any type of swap for hedging purposes, it is likely that the Fund will have an asset or liability that will offset any loss (or gain) on the swap, at least in part. Swap agreements may be non-transferable or otherwise highly illiquid, and a Fund may not be able to terminate or transfer a swap agreement at any particular time or at an acceptable price.
Swaptions. A Fund may also enter into options on swap agreements (“swaptions”). A swaption is a contract that gives a counterparty the right (but not the obligation) to enter into a new swap agreement or to shorten, extend, cancel, or otherwise modify an existing swap agreement, at some designated future time on specified terms. A Fund may write (sell) and purchase put and call swaptions. Depending on the terms of the particular option agreement, a Fund will generally incur a greater degree of risk when it writes a swaption than it will incur when it purchases a swaption. When a Fund purchases a swaption, it risks losing only the amount of the premium it has paid should it decide to let the option expire unexercised. However, when a Fund writes a swaption, upon exercise of the option the Fund will become obligated according to the terms of the underlying agreement. A Fund may enter into swaptions for the same purposes as swaps. For information regarding the accounting treatment of options, see “Options, Rights, and Warrants” below.
Centrally Cleared Swaps. Certain clearinghouses currently offer clearing for limited types of derivatives transactions, principally certain interest rate swaps, certain index swaps, and credit derivatives. In a cleared derivative transaction, a Fund typically enters into the transaction with a financial institution counterparty, and performance of the transaction is effectively guaranteed by a central clearinghouse, thereby reducing or eliminating the Fund’s exposure to the credit risk of its original counterparty.
184
Notes to Financial Statements (Continued) |
The Fund will be required to post amounts (“initial margin”) with the clearinghouse or at the instruction of the clearinghouse. The initial margin required by a clearinghouse may be greater than the initial margin the Fund would be required to post in an uncleared transaction. If cash is deposited as the initial margin, it is shown as collateral on a Fund’s Statement of Assets and Liabilities. Swap agreements are marked-to-market daily and subsequent payments (“variation margin”) are made or received by a Fund depending on whether unrealized gains or losses are incurred. These amounts are reflected as receivables or payables on a Fund’s Statement of Assets and Liabilities (“Variation margin on open derivative instruments”) and as a component of net change in unrealized appreciation (depreciation) on a Fund’s Statement of Operations. Only a limited number of transaction types are currently eligible for clearing.
During the term of a swap transaction, changes in the value of the swap are recognized as unrealized gains or losses by marking to market to reflect the market value of the swap. When the swap is terminated, a Fund will record a realized gain or loss equal to the difference, if any, between the proceeds from (or cost of) the closing transaction and a Fund’s basis in the agreement. Upfront swap premium payments paid or received by a Fund, if any, are recorded within the value of the open swap agreement on the Fund’s Statement of Assets and Liabilities and represent payments paid or received upon entering into the swap agreement to compensate for differences between stated terms of the swap agreement and prevailing market conditions (credit spreads, currency exchange rates, and other relevant factors). These upfront payments are recorded as realized gain or loss on the Fund’s Statement of Operations upon termination or maturity of the swap agreement.
During the term of a swap transaction, the periodic net payments can be made for a set period of time or may be triggered by a predetermined credit event. The net periodic payments may be based on a fixed or variable interest rate, the change in market value of a specified security, basket of securities or index, or the return generated by a security. These periodic payments received or made by the Funds are recorded in the accompanying Statements of Operations as realized gains and losses, respectively.
A Fund’s current exposure to a counterparty is the fair value of the transaction.
Options, Rights, and Warrants
A Fund may purchase and sell put and call options on securities or an index of securities to enhance investment performance or to protect against changes in market prices. A Fund that invests in debt securities may also purchase and sell put and call options to adjust the interest rate sensitivity of its portfolio or the credit exposure of the portfolio.
Call Options. A call option gives the holder the right to purchase, and obligates the writer to sell, a security at the strike price at any time before the expiration date.
Put Options. A put option gives the holder the right to sell, and obligates the writer to buy, a security at the exercise price at any time before the expiration date.
Writing put and call options. A Fund may write call options on a security it owns, in a “directional” strategy hoping to realize a greater current return through the receipt of premiums. In return for the option premium, the Fund takes the risk that it will have to forego any increase in the value of the security over the strike price. When a Fund has written a call option on a security it does not own, its exposure on such an option is theoretically unlimited. A Fund may enter into closing purchase transactions in order to realize a profit or limit a loss on a previously written call option or, in the case of a call option on a security it owns, to free itself to sell the underlying security or to write another call on the security, or protect a security from being called in an unexpected market rise. Any profits from a closing purchase transaction in the case of a call option on a security a Fund owns may be offset by a decline in the value of the underlying security. Conversely, because increases in the market price of a call option will generally reflect increases in the market price of the underlying security, any loss resulting from a closing purchase transaction relating to a call option on a security a Fund owns is likely to be offset in whole or in part by unrealized appreciation of the underlying security owned by the Fund. A Fund may not be able to close out a call option that it has previously written. A Fund may write put options in order to enhance its current return by taking a long directional position as to a security or index of securities. By writing a put option, the Fund assumes the risk that it may be required to purchase the underlying security for an exercise price higher than its then current market value, resulting in a potential capital loss unless the security later appreciates
185
Notes to Financial Statements (Continued) |
in value. A Fund may terminate a put option that it has written before it expires by entering into a closing purchase transaction. Any loss from this transaction may be partially or entirely offset by the premium received on the terminated option. A Fund may not be able to close out a put option that it has previously written.
When a Fund writes a call or put option, an amount equal to the premium received is recorded as a liability. Premiums received from writing options which expire are treated as realized gains. Premiums received from writing options which are exercised or closed are added to the proceeds or offset against the amount paid on the underlying investment to determine the realized gain or loss.
Purchasing put and call options. A Fund may purchase put options to protect portfolio holdings against a decline in market value of a security or securities held by it. A Fund may also purchase a put option hoping to profit from an anticipated decline in the value of the underlying security. If the Fund holds the security underlying the option, the option premium and any transaction costs will reduce any profit the Fund might have realized had it sold the underlying security instead of buying the put option. A Fund may purchase call options to hedge against an increase in the price of securities that the Fund wants ultimately to buy. A Fund may also purchase a call option as a long directional investment hoping to profit from an anticipated increase in the value of the underlying security. In order for a call option to be profitable, the market price of the underlying security must rise sufficiently above the exercise price to cover the premium and transaction costs. These costs will reduce any profit the Fund might have realized had it bought the underlying security at the time it purchased the call option.
When a Fund purchases an option, it runs the risk that it will lose its entire investment in the option in a relatively short period of time, unless the Fund exercises the option or enters into a closing sale transaction before the option’s expiration. If the price of the underlying security does not rise (in the case of a call) or fall (in the case of a put) to an extent sufficient to cover the option premium and transaction costs, the Fund will lose part or all of its investment in the option. This contrasts with an investment by a Fund in the underlying security, since the Fund will not realize a loss if the security’s price does not change. Premiums paid for purchasing options that expire are treated as realized losses.
Exchange Traded Options. Exchange traded options purchased or sold by a Fund may be traded on a securities or options exchange or market. Such options typically have minimal exposure to counterparty risk. However, an exchange or market may at times find it necessary to impose restrictions on particular types of options transactions, such as opening transactions. If an underlying security ceases to meet qualifications imposed by the market or the Options Clearing Corporation, new series of options on that security will no longer be opened to replace expiring series, and opening transactions in existing series may be prohibited. Exchange traded options are valued at the last sale price, or if no sales are reported, the last bid price.
OTC Options. OTC options purchased or sold by a Fund are not traded on securities or options exchanges or backed by clearinghouses. Rather, they are entered into directly between a Fund and the counterparty to the option. In the case of an OTC option purchased by the Fund, the value of the option to the Fund will depend on the willingness and ability of the option writer to perform its obligations to the Fund. In addition, OTC options may not be transferable and there may be little or no secondary market for them, so they may be considered illiquid. It may not be possible to enter into closing transactions with respect to OTC options or otherwise to terminate such options, and as a result a Fund may be required to remain obligated on an unfavorable OTC option until its expiration. OTC options are valued using prices supplied by a primary pricing source, selected pursuant to procedures approved by the Trustees.
Rights and Warrants. A Fund may purchase or hold warrants or rights in order to gain exposure to the underlying security without owning the security, including, for example, cases where the Fund hopes to lock in the price today of a security it may wish to purchase in the future. Warrants generally give the holder the right, but not the obligation, to buy a security at a stated price. In order for a warrant to be profitable, the market price of the underlying security must rise sufficiently above the exercise price to cover any premium and transaction costs. Rights may similarly confer on the holder the right to purchase or acquire securities, including through participation in a so-called right offering. Bonds may be issued with warrants or other rights attached to purchase or acquire equity or other debt securities, typically of the bond issuer. The market prices of bonds with warrants or rights attached to purchase equity securities or bonds may, to some degree, reflect changes in the values of the underlying securities.
186
Notes to Financial Statements (Continued) |
When a Fund purchases or otherwise acquires warrants or other rights, it runs the risk that it will lose its entire investment in the warrants or rights, unless the Fund exercises the warrant or right, acquires the underlying securities, or enters into a closing transaction before expiration. If the price of the underlying security does not rise to an extent sufficient to cover any premium and transaction costs, the Fund will lose part or all of its investment. Any premiums or purchase price paid for warrants or other rights that expire are treated as realized losses. Warrants and similar rights differ from options in that they are typically written by the issuer of the security underlying the warrant or right. Although some warrants and rights may be non-transferable, others may be traded over-the-counter or on an exchange.
Inflation-Linked Securities
Inflation-linked securities are typically fixed income securities whose principal values are periodically adjusted according to a measure of inflation. If the index measuring inflation falls, the principal value of an inflation-linked security will be adjusted downward, and consequently the interest payable on the security (calculated with respect to a smaller principal amount) will be reduced. Repayment of the original principal of the security upon maturity (as adjusted for inflation) is guaranteed in the case of U.S. Treasury inflation-linked securities. For securities that do not provide a similar guarantee, the adjusted principal value of the security repaid at maturity may be less than the original principal.
Alternatively, the interest rates payable on certain inflation-linked securities may be adjusted according to a measure of inflation. As a result, the principal values of such securities do not adjust according to the rate of inflation, although the interest payable on such securities may decline during times of falling inflation.
The values of inflation-linked securities are expected to change in response to changes in real interest rates. Real interest rates are tied to the relationship between nominal interest rates and the rate of inflation. If nominal interest rates increase at a faster rate than inflation, real interest rates may rise, leading to a decrease in value of inflation-linked securities. Inflation-linked securities may cause a potential cash flow mismatch to investors, because an increase in the principal amount of an inflation-linked security will be treated as interest income currently subject to tax at ordinary income rates even though investors will not receive repayment of principal until maturity. If a Fund invests in such securities, it will be required to distribute such interest income in order to qualify for treatment as a regulated investment company and eliminate the Fund-level tax, without a corresponding receipt of cash, and therefore may be required to dispose of portfolio securities at a time when it may not be advantageous to do so in order to make such distributions.
Bank Loans
A Fund may invest in bank loans including, for example, corporate loans, loan participations, direct debt, bank debt, and bridge debt. A Fund may invest in a loan by lending money to a borrower directly as part of a syndicate of lenders. In a syndicated loan, the agent that originated and structured the loan typically administers and enforces the loan on behalf of the syndicate. Failure by the agent to fulfill its obligations may delay or adversely affect receipt of payment by a Fund. A Fund may also invest in loans through novations, assignments, and participation interests. In a novation, a Fund typically assumes all of the rights of a lending institution in a loan, including the right to receive payments of principal and interest and other amounts directly from the borrower and to enforce its rights as a lender directly against the borrower. When a Fund takes an assignment of a loan, the Fund acquires some or all of the interest of another lender (or assignee) in the loan. In such cases, the Fund may be required generally to rely upon the assignor to demand payment and enforce rights under the loan. If a Fund acquires a participation in the loan, the Fund purchases an indirect interest in a loan held by a third party and the Fund typically will have a contractual relationship only with the third party loan investor, not with the borrower. As a result, a Fund may have the right to receive payments of principal, interest, and any fees to which it is entitled only from the loan investor selling the participation and only upon receipt by such loan investor of such payments from the borrower. In such cases, a Fund assumes the credit risk of both the borrower and the loan investor selling the participation, and the Fund may be unable to realize some or all of the value of its interest in the loan in the event of the insolvency of the third party.
Changes in the financial condition of the borrower or economic conditions or other circumstances may reduce the capacity of the borrower to make principal and interest payments on such instruments and may lead to defaults. The value of any collateral securing a bank loan may decline after the Fund invests, and there is a risk that the value of the collateral may not be sufficient to cover the amount owed to the Fund.
187
Notes to Financial Statements (Continued) |
The Dynamic Bond Fund entered into certain loan agreements which are unfunded. The Dynamic Bond Fund is obligated to fund these commitments at the borrower’s discretion. These commitments are disclosed in the Dynamic Bond Fund’s Portfolio of Investments. At December 31, 2020, the Dynamic Bond Fund had sufficient cash and/or securities to cover these commitments.
Repurchase Agreements
Each Fund may enter into repurchase agreements with certain banks and broker-dealers whereby a Fund acquires a security for cash and obtains a simultaneous commitment from the seller to repurchase the security at an agreed upon price and date. A Fund, through its custodian, takes possession of the securities collateralizing the repurchase agreement in a segregated account. Repurchase agreements must be fully collateralized at all times, but involve some risk to a Fund if the other party should default on its obligation and the Fund is delayed or prevented from recovering the collateral, or if the Fund is required to return collateral to a borrower at a time when it may realize a loss on the investment of that collateral. Collateral for certain tri-party repurchase agreements is held at the Fund’s custodian or sub-custodian in a segregated account for the benefit of the Fund and the counterparty.
Reverse Repurchase Agreements
Each Fund may enter into reverse repurchase agreements with banks and broker-dealers to enhance return. Reverse repurchase agreements involve sales by a Fund of portfolio securities concurrently with an agreement by the Fund to repurchase the same securities at a later date at a fixed price (typically equal to the original sale price plus interest). During the reverse repurchase agreement period, the Fund continues to receive principal and interest payments on the securities and also has the opportunity to earn a return on the purchase price received by it from the counterparty.
Certain agreements have no stated maturity and can be terminated by either party at any time. Interest on the value of the reverse repurchase agreements issued and outstanding is based upon competitive market rates determined at the time of issuance. A Fund may utilize reverse repurchase agreements when it is anticipated that the interest income to be earned from the investment of the proceeds of the transaction is greater than the interest expense of the transaction. Reverse repurchase agreements generally create investment leverage and involve the risk that the market value of the security that a Fund is obligated to repurchase under the agreement may decline below the repurchase price. For financial reporting purposes, cash received in exchange for securities delivered plus accrued interest payments to be made to the counterparty is recorded as a liability in the Statements of Assets and Liabilities at face value including accrued interest. Due to the short term nature of reverse repurchase agreements, face value approximates fair value. Interest payments made by a Fund to the counterparties are recorded as a component of interest expense in the Statements of Operations. In periods of increased demand for a security, a Fund may receive a fee for use of the security by the counterparty, which may result in interest income to the Fund.
Reverse repurchase transactions are entered into by a Fund under a Master Repurchase Agreement (“MRA”), which permits the Fund, under certain circumstances, including an event of default (such as bankruptcy or insolvency), to offset payables and/or receivables under the MRA with collateral held and/or posted to the counterparty and creates one single net payment due to or from the Fund. With reverse repurchase transactions, typically a Fund and the counterparties are permitted to sell, re-pledge, or use the collateral associated with the transaction. However, bankruptcy or insolvency laws of a particular jurisdiction may impose restrictions on or prohibitions against such a right of offset in the event of an MRA counterparty’s bankruptcy or insolvency. Pursuant to the terms of the MRA, a Fund receives or posts securities as collateral with a market value in excess of the repurchase price to be paid or received by the Fund upon the maturity of the transaction. Upon a bankruptcy or insolvency of the MRA counterparty, the Fund is considered an unsecured creditor with respect to excess collateral and, as such, the return of excess collateral may be delayed.
In the event the buyer of securities under an MRA files for bankruptcy or becomes insolvent, a Fund’s use of the proceeds from the sale of its securities may be restricted or forfeited, and the counterparty may fail to return/resell the securities in question to the Fund.
During the year ended December 31, 2020, the average balance outstanding for reverse repurchase agreements for the Inflation-Protected and Income Fund was $22,122,150. The maximum balance outstanding for the Inflation-Protected and Income Fund was $259,597,229 during the year ended December 31, 2020. The weighted average maturity was 31 days, at a weighted average interest rate of 2.008%.
188
Notes to Financial Statements (Continued) |
Average balance outstanding was calculated based on daily balances outstanding during the period that the Inflation-Protected and Income Fund had entered into reverse repurchase transactions. The last reverse repurchase agreement was closed out on February 19, 2020.
When-Issued, Delayed-Delivery, Forward Commitment, and To-Be-Announced Transactions
A Fund may enter into when-issued, delayed-delivery, forward commitment, or to-be-announced (“TBA”) transactions (collectively, the “Forward Transactions”) in order to lock in the purchase price of the underlying security, or in order to adjust the interest rate exposure of the Fund’s existing portfolio. In Forward Transactions, a Fund commits to purchase or sell particular securities, with payment and delivery to take place at a future date. In the case of TBA purchase commitments, the unit price and the estimated principal amount are established when the Fund enters into a commitment, with the actual principal amount being within a specified range of the estimate. Although a Fund does not typically pay for the securities in these types of transactions until they are delivered, it immediately assumes the risks of ownership, including the risk of price fluctuation. As a result, each of these types of transactions may create investment leverage in a Fund’s portfolio and increase the volatility of the Fund. If a Fund’s counterparty fails to deliver a security purchased in a Forward Transaction, there may be a loss, and the Fund may have missed an opportunity to make an alternative investment.
These securities are valued on the basis of valuations furnished by a pricing service, selected pursuant to procedures approved by the Trustees, which determines valuations taking into account appropriate factors such as institutional-size trading in similar groups of securities, yield, quality, coupon rate, maturity, type of issue, trading characteristics, and other market data. Securities for which no market quotation is available are valued at fair value in accordance with procedures approved by the Trustees. The Funds record on a daily basis the unrealized appreciation (depreciation) based upon changes in the values of these securities. When a Forward Transaction is closed, the Funds record a realized gain or loss equal to the difference between the value of the transaction at the time it was opened and the value of the transaction at the time it was closed.
Dollar Roll Transactions
A Fund may enter into dollar roll transactions, in which the Fund sells mortgage-backed securities for delivery in the current month and simultaneously contracts to purchase substantially similar securities on a specified future date from the same party. A Fund may invest in dollar rolls in order to benefit from anticipated changes in pricing for the mortgage-backed securities during the term of the transaction, or for the purpose of creating investment leverage. In a dollar roll, the securities that are to be purchased will be of the same type as the securities sold, but will be supported by different pools of mortgages.
Dollar rolls involve the risk that the Fund’s counterparty will be unable to deliver the mortgage-backed securities underlying the dollar roll at the fixed time. If the counterparty files for bankruptcy or becomes insolvent, a Fund’s use of the transaction proceeds may be restricted pending a determination by the counterparty or its representative, whether to enforce the Fund’s obligation to repurchase the securities. A Fund can incur a loss on a dollar roll transaction (either because its counterparty fails to perform or because the value of the mortgages subject to the transaction declines) and on the investments made by the Fund with the proceeds of the dollar roll transaction.
A Fund accounts for a dollar roll transaction as a purchase and sale whereby the difference in the sales price and purchase price of the security sold is recorded as a realized gain (loss). If certain criteria are met, these dollar roll transactions may be considered financing transactions, whereby the difference in the sales price and the future purchase price is recorded as an adjustment to interest income. Dollar roll transactions generally have the effect of creating leverage in a Fund’s portfolio.
Securities Lending
Each Fund, other than the U.S. Government Money Market Fund, may lend its securities; however, lending cannot exceed 33% of the total assets of the Fund taken at current value. The Funds’ securities lending activities are governed by a Securities Lending Agency Agreement (“Lending Agreement”) between each Fund and the lending agent (“Agent”). The Lending Agreement authorizes the Agent to lend portfolio securities held by a Fund to approved borrowers (each, a “Borrower”).
189
Notes to Financial Statements (Continued) |
Each Fund expects that in connection with any securities on loan, the loan will be secured continuously by collateral consisting of cash (U.S. currency) and/or securities (U.S. Treasury and Agency obligations) adjusted daily to have value at least equal to the current market value of the securities loaned. The market value of the loaned securities is determined at the close of business of a Fund and any additional collateral is delivered to the Fund the next business day. The Funds bear the risk of loss with respect to the investment of cash collateral. As with other extensions of credit, the Funds may bear the risk of delay in recovery of the loaned securities or even loss of rights in the collateral should the Borrower of the securities fail financially. Pursuant to the Lending Agreement, the Agent has provided indemnification to the Funds in the event of default by a Borrower with respect to a loan. The Funds receive compensation for lending their securities in the form of a securities loan fee paid by the Borrower, as well as a share of the income earned on investment of the cash collateral received for the loaned securities. At December 31, 2020, the Funds’ collateral was equal to or greater than 100% of the market value of securities on loan.
Subject to the terms of the Lending Agreement and the agreement between the Agent and the applicable Borrower (“Borrowing Agreement”), security loans can be terminated by the Agent, the Fund, or the Borrower and the related securities must be returned within the earlier of the customary settlement period for such securities or the period of time specified in the Borrowing Agreement.
The Funds employ the Agent to implement their securities lending program and the Agent receives a fee from the Funds for its services. In addition, the Funds may be required to pay a rebate to the Borrower. Accordingly, a Fund’s compensation for lending its securities is reduced by any such fees or rebate paid to the Agent or Borrower, respectively. Income received by the Funds in securities lending transactions during the year ended December 31, 2020, is reflected as securities lending income on the Statement of Operations.
Accounting for Investment Transactions
Investment transactions are accounted for on the trade date. Realized gains and losses on sales of investments and unrealized appreciation and depreciation of investments are computed by the specific identification cost method. Proceeds received from litigation, if any, are included in realized gains on investment transactions for any investments that are no longer held in the portfolio and as a reduction in cost for investments that continue to be held in the portfolio. Interest income, adjusted for amortization of discounts and premiums on debt securities, is earned from the settlement date and is recorded on the accrual basis. Dividend income and realized capital gain distributions are recorded on the ex-dividend date. Withholding taxes on foreign interest, dividends, and capital gains have been provided for in accordance with the applicable country’s tax rules and rates. Foreign dividend income is recorded on the ex-dividend date or as soon as practicable after the Fund determines the existence of a dividend declaration after exercising reasonable due diligence. Distributions received on securities that represent a return of capital or capital gains are recorded as a reduction of cost of investments and/or as a realized gain. The Funds determine the classification of distributions received as return of capital distributions or capital gain distributions.
Foreign Currency Translation
The books and records of the Funds are maintained in U.S. dollars. The market values of foreign currencies, foreign securities, and other assets and liabilities denominated in foreign currencies are translated into U.S. dollars at the mean of the buying and selling rates of such currencies against the U.S. dollar at the end of each business day. Purchases and sales of foreign securities and income and expense items are translated at the rates of exchange prevailing on the respective dates of such transactions. The Funds do not isolate that portion of the results of operations arising from changes in the exchange rates from that portion arising from changes in the market prices of securities. Net realized foreign currency gains and losses resulting from changes in exchange rates include foreign currency gains and losses between trade date and settlement date on investment securities transactions, foreign currency transactions, and the difference between the amounts of dividends or interest recorded on the books of the Funds and the amount actually received.
190
Notes to Financial Statements (Continued) |
Allocation of Operating Activity
In maintaining the records for the Funds, the income and expense accounts are allocated daily to each class of shares. Investment income and loss, and unrealized and realized gains or losses are prorated among the classes of shares based on the relative net assets of each. Expenses are allocated to each class of shares depending on the nature of the expenditures. Administration and service fees, if any, which are directly attributable to a class of shares, are charged to that class’s operations. Expenses of a Fund not directly attributable to the operations of any specific class of shares of the Fund are prorated among the classes to which the expense relates based on relative net assets or another alternative method.
In addition, the Blend Fund will also incur certain fees and expenses indirectly as a shareholder in the underlying Funds. Because the underlying Funds have varied expense and fee levels, and the Blend Fund may own different proportions of underlying Funds at different times, the amount of fees and expenses indirectly incurred by the Blend Fund will vary.
Foreign Securities
The Strategic Emerging Markets Fund invests substantially all of its assets in foreign securities. The other Funds may also invest in foreign securities. Foreign securities, including American Depositary Receipts, are subject to additional risks compared to securities of U.S. issuers, including international trade, currency, political, regulatory, and diplomatic risks. In addition, fluctuations in currency exchange rates may adversely affect the values of foreign securities and the price of a Fund’s shares. Emerging markets securities are subject to greater risks than securities issued in developed foreign markets, including less liquidity, greater price volatility, higher relative rates of inflation, greater political, economic, and social instability, greater custody and operational risks, and greater volatility in currency exchange rates.
Federal Income Tax
It is each Fund’s intent to continue to comply with the provisions of Subchapter M of the Internal Revenue Code of 1986 as amended, applicable to a regulated investment company. Under such provisions, the Funds would not be subject to federal income taxes on their ordinary income and net realized capital gains to the extent they are distributed or deemed to have been distributed to their shareholders. Therefore, the Funds have not made any provision for federal income tax.
Dividends and Distributions to Shareholders
Dividends from net investment income of each Fund, other than the U.S. Government Money Market Fund, are declared and paid annually and at other times as may be required to satisfy tax or regulatory requirements. Dividends from net investment income are declared daily and paid monthly for the U.S. Government Money Market Fund. Distributions of any net realized capital gains of each Fund are declared and paid annually and at other times as may be required to satisfy tax or regulatory requirements.
Distributions to shareholders are recorded on the ex-dividend date. Income and capital gain distributions are determined in accordance with income tax regulations, which may differ from generally accepted accounting principles. As a result, net investment income and net realized capital gains on investment transactions for a reporting period may differ significantly from distributions during such period.
191
Notes to Financial Statements (Continued) |
3. | Advisory Fees and Other Transactions |
Investment Advisory Fees and Investment Subadvisers
MML Investment Advisers, LLC (“MML Advisers”), a wholly-owned subsidiary of MassMutual, serves as investment adviser to each Fund. Under the investment advisory agreements between MML Advisers and the Trust on behalf of each Fund, MML Advisers is responsible for providing investment management services for each Fund. In return for these services, MML Advisers receives advisory fees, based upon each Fund’s average daily net assets, computed and accrued daily and payable monthly, at the following annual rates:
Fund | Investment Advisory Fee |
Blend Fund | 0.50% on the first $100 million; |
| | 0.45% on the next $200 million; |
| | 0.40% on the next $200 million; and |
| | 0.35% on any excess over $500 million |
Dynamic Bond Fund | 0.40% on the first $1 billion; and |
| | 0.35% on any excess over $1 billion |
Equity Fund | 0.50% on the first $100 million; |
| | 0.45% on the next $200 million; |
| | 0.40% on the next $200 million; and |
| | 0.35% on any excess over $500 million |
Equity Momentum Fund | 0.60% on the first $500 million; and |
| | 0.55% on any excess over $500 million |
Equity Rotation Fund | 0.45% on the first $500 million; and |
| | 0.40% on any excess over $500 million |
High Yield Fund | 0.60% on the first $300 million; and |
| | 0.575% on any excess over $300 million |
Inflation-Protected and Income Fund | 0.60% on the first $100 million; |
| | 0.55% on the next $200 million; |
| | 0.50% on the next $200 million; and |
| | 0.45% on any excess over $500 million |
Managed Bond Fund | 0.50% on the first $100 million; |
| | 0.45% on the next $200 million; |
| | 0.40% on the next $200 million; and |
| | 0.35% on any excess over $500 million |
Short-Duration Bond Fund | 0.35% on the first $300 million; and |
| | 0.30% on any excess over $300 million |
Small Cap Equity Fund | 0.65% on the first $100 million; |
| | 0.60% on the next $100 million; |
| | 0.55% on the next $300 million; and |
| | 0.50% on any excess over $500 million |
Special Situations Fund | 0.60% on the first $500 million; and |
| | 0.55% on any excess over $500 million |
Strategic Emerging Markets Fund | 1.05% on the first $500 million; and |
| | 1.00% on any excess over $500 million |
U.S. Government Money Market Fund | 0.50% on the first $100 million; |
| | 0.45% on the next $200 million; |
| | 0.40% on the next $200 million; and |
| | 0.35% on any excess over $500 million |
192
Notes to Financial Statements (Continued) |
MML Advisers has entered into investment subadvisory agreements with Barings LLC (“Barings”), a wholly-owned subsidiary of MM Asset Management Holding LLC, itself a wholly-owned subsidiary of MassMutual Holding LLC, a controlled subsidiary of MassMutual, on behalf of certain Funds. These agreements provide that Barings manage the investment and reinvestment of assets of these Funds. Barings receives a subadvisory fee from MML Advisers, based upon each Fund’s average daily net assets, at the following annual rates:
Blend Fund* | 0.13% (Equity Segment) |
| | 0.09% (Money Market and Bond Segments) |
Equity Momentum Fund** | 0.475% |
Equity Rotation Fund*** | 0.30% |
High Yield Fund | 0.20% |
Inflation-Protected and Income Fund | 0.08% |
Managed Bond Fund | 0.10% |
Short-Duration Bond Fund | 0.08% |
Special Situations Fund** | 0.45% |
U.S. Government Money Market Fund | 0.05% |
* | Effective November 18, 2020, BlackRock Investment Management, LLC replaced Barings, LLC as subadviser to the Fund. |
** | Effective November 18, 2020, Invesco Advisers, Inc. replaced Barings, LLC as subadviser to the Fund. |
*** | Effective November 23, 2020, Invesco Advisers, Inc. replaced Barings, LLC as subadviser to the Fund. |
MML Advisers has entered into an investment subadvisory agreement with BlackRock Investment Management, LLC (“BlackRock”), pursuant to which BlackRock serves as the subadviser to the Blend Fund. This agreement provides that BlackRock manage the investment and reinvestment of the assets of the Fund. BlackRock receives a subadvisory fee from MML Advisers, based upon the average daily net assets of the Fund.
MML Advisers has entered into an investment subadvisory agreement with Brandywine Global Investment Management, LLC (“Brandywine Global”), pursuant to which Brandywine Global serves as one of the subadvisers to the Equity Fund. This agreement provides that Brandywine Global manage the investment and reinvestment of a portion of the assets of the Fund. Brandywine Global receives a subadvisory fee from MML Advisers, based upon the average daily net assets of the portion of the Fund that Brandywine Global manages.
MML Advisers has entered into an investment subadvisory agreement with DoubleLine Capital LP (“DoubleLine”), pursuant to which DoubleLine serves as the subadviser to the Dynamic Bond Fund. This agreement provides that DoubleLine manage the investment and reinvestment of the assets of the Fund. DoubleLine receives a subadvisory fee from MML Advisers, based upon the average daily net assets of the Fund.
MML Advisers has entered into investment subadvisory agreements with Invesco Advisers, Inc. (“Invesco”), pursuant to which Invesco serves as the subadviser to the Equity Momentum Fund, Equity Rotation Fund, Small Cap Equity Fund, Special Situations Fund, and Strategic Emerging Markets Fund. These agreements provide that Invesco manage the investment and reinvestment of the assets of the Funds. Invesco receives a subadvisory fee from MML Advisers, based upon the average daily net assets of each Fund.
MML Advisers has entered into an investment subadvisory agreement with T. Rowe Price Associates, Inc. (“T. Rowe Price”), pursuant to which T. Rowe Price serves as one of the subadvisers to the Equity Fund. This agreement provides that T. Rowe Price manage the investment and reinvestment of a portion of the assets of the Fund. T. Rowe Price receives a subadvisory fee from MML Advisers, based upon the average daily net assets of the portion of the Fund that T. Rowe Price manages.
The Funds’ subadvisory fees are paid monthly by MML Advisers out of the advisory fees previously disclosed above.
193
Notes to Financial Statements (Continued) |
Administration Fees
For the Funds noted below, under a separate Administrative and Shareholder Services Agreement between the Trust and MML Advisers, on behalf of each Fund, MML Advisers is obligated to provide administrative and shareholder services and bear some of the Fund specific administrative expenses. In return for these services, MML Advisers receives an administrative services fee, based upon the average daily net assets of the applicable class of shares of the Funds, at the following annual rates:
| | Class II | Service Class I |
Dynamic Bond Fund | 0.15% | 0.15% |
Equity Momentum Fund | 0.15% | 0.15% |
Equity Rotation Fund | 0.15% | 0.15% |
High Yield Fund | 0.15% | 0.15% |
Short-Duration Bond Fund | 0.15% | 0.15% |
Special Situations Fund | 0.15% | 0.15% |
Strategic Emerging Markets Fund | 0.15% | 0.15% |
Distribution and Service Fees
MML Distributors, LLC (the “Distributor”) acts as distributor to the Funds. Pursuant to a Distribution and Services Plan adopted by the Funds pursuant to Rule 12b-1 under the 1940 Act, Service Class shares and Service Class I shares of the Funds pay an annual fee of 0.25% of the average daily net asset value of Service Class shares and Service Class I shares. This fee, or a portion thereof, is paid to: (i) the Distributor for services provided and expenses incurred by it in connection with the distribution of Service Class shares or Service Class I shares, as applicable, of each Fund; and/or (ii) MassMutual for services provided and expenses incurred by it for purposes of maintaining or providing personal services to Service Class and Service Class I shareholders. The Distributor is a wholly-owned subsidiary of MassMutual.
Expense Caps and Waivers
MML Advisers has agreed to cap the fees and expenses of the Funds noted below (other than extraordinary litigation and legal expenses, Acquired Fund Fees and Expenses#, interest expense, short sale dividend and loan expense, or other non-recurring or unusual expenses such as organizational expenses and shareholder meeting expenses, as applicable) based upon the average daily net assets of the applicable class of shares of the Fund, as follows:
| | Class II | Service Class I |
Equity Momentum Fund* | 0.77% | 1.02% |
Strategic Emerging Markets Fund** | 1.35% | 1.60% |
MML Advisers has agreed to cap the fees and expenses of the Funds noted below (other than extraordinary litigation and legal expenses, Acquired Fund Fees and Expenses#, short sale dividend and loan expense, or other non-recurring or unusual expenses such as organizational expenses and shareholder meeting expenses, as applicable) based upon the average daily net assets of the applicable class of shares of the Fund, as follows:
| | Initial Class | Service Class |
Inflation-Protected and Income Fund*** | 0.60% | 0.85% |
# | Acquired Fund Fees and Expenses are expenses borne indirectly by a Fund through investments in other pooled investment vehicles. |
* | Expense caps in effect from November 18, 2020 through April 30, 2022. |
** | Expense caps in effect through April 30, 2021. |
*** | Expense caps in effect from May 1, 2020 through April 30, 2021. |
194
Notes to Financial Statements (Continued) |
MML Advisers has agreed to waive 0.07% of the advisory fee of the High Yield Fund through April 30, 2021.
MML Advisers has agreed to voluntarily waive 0.04% of the advisory fee of the Strategic Emerging Markets Fund. MML Advisers may amend or discontinue this waiver at any time without advance notice.
MML Advisers has agreed to voluntarily waive some or all of its advisory fees and, if necessary, reimburse some or all of the U.S. Government Money Market Fund’s other expenses, in an attempt to allow the Initial Class shares of the Fund to maintain a 1-day yield of at least approximately 0.00%. MML Advisers may amend or discontinue this waiver at any time without advance notice.
Effective November 18, 2020, MML Advisers has agreed to waive 0.25% of the advisory fee of the Equity Momentum Fund through April 30, 2022.
Effective November 18, 2020, MML Advisers has agreed to waive 0.05% of the advisory fee of the Special Situation Fund through April 30, 2022.
Effective November 23, 2020, MML Advisers has agreed to waive 0.05% of the advisory fee of the Equity Rotation Fund through April 30, 2022.
Expense caps and waiver amounts are reflected as a reduction of expenses on the Statements of Operations.
Deferred Compensation
Trustees of the Funds who are not officers or employees of MassMutual may elect to defer receipt of their annual fees in accordance with terms of a Non-Qualified Deferred Compensation Plan. Amounts deferred shall accrue interest or earnings and shall be recorded on the Funds’ books as other liabilities. Deferred compensation is included within Trustees’ fees and expenses in the Statements of Assets and Liabilities.
Other
Certain officers and trustees of the Funds may also be employees of MassMutual. The compensation of a trustee who is not an employee of MassMutual is borne by the Funds.
4. | Purchases and Sales of Investments |
Cost of purchases and proceeds from sales of investment securities (excluding short-term investments) for the year ended December 31, 2020, were as follows:
| | | Purchases | | | Sales | |
| | | Long-Term U.S.
Government
Securities | | | Other Long-
Term Securities | | | Long-Term U.S.
Government
Securities | | | Other Long-
Term Securities | |
Blend Fund | | $ | 750,385,232 | | | $ | 900,795,835 | | | $ | 825,669,491 | | | $ | 850,428,792 | |
Dynamic Bond Fund | | | 467,768,506 | | | | 81,987,470 | | | | 508,760,974 | | | | 114,603,528 | |
Equity Fund | | | — | | | | 578,109,228 | | | | — | | | | 627,235,684 | |
Equity Momentum Fund | | | 3,041,602 | | | | 47,541,847 | | | | 11,072,668 | | | | 30,784,913 | |
Equity Rotation Fund | | | — | | | | 47,355,425 | | | | — | | | | 45,490,451 | |
High Yield Fund | | | — | | | | 82,537,276 | | | | — | | | | 115,760,331 | |
Inflation-Protected and Income Fund | | | 97,741,670 | | | | 149,681,948 | | | | 350,308,362 | | | | 140,039,681 | |
Managed Bond Fund | | | 2,091,254,056 | | | | 217,998,859 | | | | 2,153,012,241 | | | | 267,845,411 | |
Short-Duration Bond Fund | | | 2,492,000 | | | | 78,598,256 | | | | 7,325,994 | | | | 95,446,097 | |
Small Cap Equity Fund | | | — | | | | 37,992,786 | | | | — | | | | 47,974,423 | |
Special Situations Fund | | | — | | | | 40,759,646 | | | | — | | | | 40,412,159 | |
Strategic Emerging Markets Fund | | | — | | | | 43,061,268 | | | | — | | | | 90,167,648 | |
195
Notes to Financial Statements (Continued) |
The Funds may purchase from, or sell securities to, other affiliated Funds under procedures adopted by the Trustees. These procedures have been designed to ensure that cross trades conducted by the Funds comply with Rule 17a-7 under the 1940 Act. The cross trades disclosed in the table below are included within the respective purchases and sales amounts shown in the table above, as applicable.
| | Purchases | Sales | Realized
Gains/Losses |
Equity Fund | $ 148,201 | $ — | $ — |
5. | Capital Share Transactions |
Changes in shares outstanding for each Fund were as follows:
| | | Year Ended December 31, 2020 | | | Year Ended December 31, 2019 | |
| | | Shares | | | Amount | | | Shares | | | Amount | |
Blend Fund Initial Class | | | | | | | | | | | | | | | | |
Sold | | | 887,437 | | | $ | 20,452,366 | | | | 528,012 | | | $ | 11,433,592 | |
Issued as reinvestment of dividends | | | 1,036,024 | | | | 24,201,102 | | | | 1,915,243 | | | | 40,979,710 | |
Redeemed | | | (3,117,796 | ) | | | (71,083,998 | ) | | | (3,276,700 | ) | | | (70,990,967 | ) |
Net increase (decrease) | | | (1,194,335 | ) | | $ | (26,430,530 | ) | | | (833,445 | ) | | $ | (18,577,665 | ) |
Blend Fund Service Class | | | | | | | | | | | | | | | | |
Sold | | | 934,409 | | | $ | 20,959,674 | | | | 1,391,604 | | | $ | 30,119,588 | |
Issued as reinvestment of dividends | | | 316,644 | | | | 7,363,875 | | | | 455,839 | | | | 9,724,022 | |
Redeemed | | | (797,796 | ) | | | (17,880,305 | ) | | | (614,951 | ) | | | (13,331,444 | ) |
Net increase (decrease) | | | 453,257 | | | $ | 10,443,244 | | | | 1,232,492 | | | $ | 26,512,166 | |
Dynamic Bond Fund Class II | | | | | | | | | | | | | | | | |
Sold | | | 7,449,711 | | | $ | 75,523,408 | | | | 2,486,863 | | | $ | 24,624,642 | |
Issued as reinvestment of dividends | | | 108,942 | | | | 1,117,750 | | | | 1,472,138 | | | | 14,724,090 | |
Redeemed | | | (15,810,401 | ) | | | (161,797,933 | ) | | | (9,204,024 | ) | | | (91,908,615 | ) |
Net increase (decrease) | | | (8,251,748 | ) | | $ | (85,156,775 | ) | | | (5,245,023 | ) | | $ | (52,559,883 | ) |
Dynamic Bond Fund Service Class I | | | | | | | | | | | | | | | | |
Sold | | | 344,611 | | | $ | 3,502,712 | | | | 400,531 | | | $ | 3,994,057 | |
Issued as reinvestment of dividends | | | 3,730 | | | | 38,159 | | | | 27,478 | | | | 274,456 | |
Redeemed | | | (157,142 | ) | | | (1,568,375 | ) | | | (74,418 | ) | | | (741,412 | ) |
Net increase (decrease) | | | 191,199 | | | $ | 1,972,496 | | | | 353,591 | | | $ | 3,527,101 | |
Equity Fund Initial Class | | | | | | | | | | | | | | | | |
Sold | | | 720,539 | | | $ | 16,792,666 | | | | 532,126 | | | $ | 14,313,375 | |
Issued as reinvestment of dividends | | | 3,838,034 | | | | 84,655,474 | | | | 2,049,701 | | | | 50,723,440 | |
Redeemed | | | (3,101,463 | ) | | | (73,921,732 | ) | | | (2,890,290 | ) | | | (77,762,357 | ) |
Net increase (decrease) | | | 1,457,110 | | | $ | 27,526,408 | | | | (308,463 | ) | | $ | (12,725,542 | ) |
Equity Fund Service Class | | | | | | | | | | | | | | | | |
Sold | | | 485,427 | | | $ | 10,932,484 | | | | 292,000 | | | $ | 7,614,027 | |
Issued as reinvestment of dividends | | | 547,220 | | | | 11,874,652 | | | | 271,310 | | | | 6,619,264 | |
Redeemed | | | (706,405 | ) | | | (16,197,506 | ) | | | (539,324 | ) | | | (14,333,325 | ) |
Net increase (decrease) | | | 326,242 | | | $ | 6,609,630 | | | | 23,986 | | | $ | (100,034 | ) |
Equity Momentum Fund Class II | | | | | | | | | | | | | | | | |
Sold | | | — | | | $ | — | | | | — | | | $ | — | |
Issued as reinvestment of dividends | | | 275,844 | | | | 3,595,440 | | | | 137,816 | | | | 1,657,921 | |
Redeemed | | | — | | | | — | | | | — | | | | — | |
Net increase (decrease) | | | 275,844 | | | $ | 3,595,440 | | | | 137,816 | | | $ | 1,657,921 | |
196
Notes to Financial Statements (Continued) |
| | | Year Ended December 31, 2020 | | | Year Ended December 31, 2019 | |
| | | Shares | | | Amount | | | Shares | | | Amount | |
Equity Momentum Fund Service Class I | | | | | | | | | | | | | | | | |
Sold | | | 7,047 | | | $ | 77,458 | | | | 15,169 | | | $ | 172,205 | |
Issued as reinvestment of dividends | | | 14,874 | | | | 192,350 | | | | 7,831 | | | | 93,583 | |
Redeemed | | | (22,665 | ) | | | (257,037 | ) | | | (15,399 | ) | | | (165,192 | ) |
Net increase (decrease) | | | (744 | ) | | $ | 12,771 | | | | 7,601 | | | $ | 100,596 | |
Equity Rotation Fund Class II | | | | | | | | | | | | | | | | |
Sold | | | — | | | $ | — | | | | — | | | $ | — | |
Issued as reinvestment of dividends | | | 77,814 | | | | 1,109,325 | | | | 57,537 | | | | 657,606 | |
Redeemed | | | — | | | | — | | | | — | | | | — | |
Net increase (decrease) | | | 77,814 | | | $ | 1,109,325 | | | | 57,537 | | | $ | 657,606 | |
Equity Rotation Fund Service Class I | | | | | | | | | | | | | | | | |
Sold | | | 4,249 | | | $ | 56,414 | | | | 13,914 | | | $ | 164,106 | |
Issued as reinvestment of dividends | | | 4,135 | | | | 58,536 | | | | 3,062 | | | | 34,524 | |
Redeemed | | | (11,940 | ) | | | (137,416 | ) | | | (10,618 | ) | | | (125,525 | ) |
Net increase (decrease) | | | (3,556 | ) | | $ | (22,466 | ) | | | 6,358 | | | $ | 73,105 | |
High Yield Fund Class II | | | | | | | | | | | | | | | | |
Sold | | | 614,107 | | | $ | 5,782,357 | | | | 2,120,691 | | | $ | 20,335,685 | |
Issued as reinvestment of dividends | | | 1,913 | | | | 18,037 | | | | 538,310 | | | | 5,130,049 | |
Redeemed | | | (4,643,589 | ) | | | (44,513,850 | ) | | | (2,371,349 | ) | | | (22,746,557 | ) |
Net increase (decrease) | | | (4,027,569 | ) | | $ | (38,713,456 | ) | | | 287,652 | | | $ | 2,719,177 | |
High Yield Fund Service Class I | | | | | | | | | | | | | | | | |
Sold | | | 502,880 | | | $ | 4,684,961 | | | | 920,037 | | | $ | 8,754,054 | |
Issued as reinvestment of dividends | | | 1,154 | | | | 10,822 | | | | 280,545 | | | | 2,664,581 | |
Redeemed | | | (822,293 | ) | | | (7,419,505 | ) | | | (652,228 | ) | | | (6,205,127 | ) |
Net increase (decrease) | | | (318,259 | ) | | $ | (2,723,722 | ) | | | 548,354 | | | $ | 5,213,508 | |
Inflation-Protected and Income Fund Initial Class | | | | | | | | | | | | | | | | |
Sold | | | 5,764,117 | | | $ | 63,752,483 | | | | 3,300,920 | | | $ | 33,165,216 | |
Issued as reinvestment of dividends | | | 28,441 | | | | 316,265 | | | | 741,556 | | | | 7,592,814 | |
Redeemed | | | (11,117,164 | ) | | | (119,258,328 | ) | | | (5,582,605 | ) | | | (56,660,183 | ) |
Net increase (decrease) | | | (5,324,606 | ) | | $ | (55,189,580 | ) | | | (1,540,129 | ) | | $ | (15,902,153 | ) |
Inflation-Protected and Income Fund Service Class | | | | | | | | | | | | | | | | |
Sold | | | 1,208,439 | | | $ | 13,079,822 | | | | 649,088 | | | $ | 6,580,148 | |
Issued as reinvestment of dividends | | | 4,632 | | | | 51,184 | | | | 91,684 | | | | 933,563 | |
Redeemed | | | (1,361,946 | ) | | | (14,634,662 | ) | | | (791,028 | ) | | | (7,981,423 | ) |
Net increase (decrease) | | | (148,875 | ) | | $ | (1,503,656 | ) | | | (50,256 | ) | | $ | (467,712 | ) |
Managed Bond Fund Initial Class | | | | | | | | | | | | | | | | |
Sold | | | 11,403,707 | | | $ | 149,341,369 | | | | 14,936,199 | | | $ | 182,884,753 | |
Issued as reinvestment of dividends | | | 55,451 | | | | 733,340 | | | | 2,518,423 | | | | 31,524,049 | |
Redeemed | | | (22,787,742 | ) | | | (296,934,778 | ) | | | (15,732,148 | ) | | | (196,260,115 | ) |
Net increase (decrease) | | | (11,328,584 | ) | | $ | (146,860,069 | ) | | | 1,722,474 | | | $ | 18,148,687 | |
Managed Bond Fund Service Class | | | | | | | | | | | | | | | | |
Sold | | | 3,122,244 | | | $ | 40,920,144 | | | | 2,178,139 | | | $ | 27,236,884 | |
Issued as reinvestment of dividends | | | 18,968 | | | | 249,878 | | | | 715,422 | | | | 8,931,167 | |
Redeemed | | | (4,114,313 | ) | | | (52,668,273 | ) | | | (3,220,012 | ) | | | (40,036,364 | ) |
Net increase (decrease) | | | (973,101 | ) | | $ | (11,498,251 | ) | | | (326,451 | ) | | $ | (3,868,313 | ) |
Short-Duration Bond Fund Class II | | | | | | | | | | | | | | | | |
Sold | | | 2,057,225 | | | $ | 19,693,406 | | | | 2,432,078 | | | $ | 23,653,689 | |
Issued as reinvestment of dividends | | | 45 | | | | 433 | | | | 585,428 | | | | 5,669,696 | |
Redeemed | | | (5,295,106 | ) | | | (51,081,156 | ) | | | (3,291,038 | ) | | | (31,928,114 | ) |
Net increase (decrease) | | | (3,237,836 | ) | | $ | (31,387,317 | ) | | | (273,532 | ) | | $ | (2,604,729 | ) |
197
Notes to Financial Statements (Continued) |
| | | Year Ended December 31, 2020 | | | Year Ended December 31, 2019 | |
| | | Shares | | | Amount | | | Shares | | | Amount | |
Short-Duration Bond Fund Service Class I | | | | | | | | | | | | | | | | |
Sold | | | 3,063,881 | | | $ | 29,480,845 | | | | 1,506,957 | | | $ | 14,628,910 | |
Issued as reinvestment of dividends | | | 9 | | | | 90 | | | | 101,973 | | | | 986,511 | |
Redeemed | | | (1,919,443 | ) | | | (18,365,937 | ) | | | (1,066,207 | ) | | | (10,331,865 | ) |
Net increase (decrease) | | | 1,144,447 | | | $ | 11,114,998 | | | | 542,723 | | | $ | 5,283,556 | |
Small Cap Equity Fund Initial Class | | | | | | | | | | | | | | | | |
Sold | | | 602,073 | | | $ | 5,077,485 | | | | 497,375 | | | $ | 4,508,334 | |
Issued as reinvestment of dividends | | | 140,334 | | | | 1,276,608 | | | | 1,011,971 | | | | 8,162,126 | |
Redeemed | | | (1,500,948 | ) | | | (13,281,105 | ) | | | (1,482,987 | ) | | | (13,407,802 | ) |
Net increase (decrease) | | | (758,541 | ) | | $ | (6,927,012 | ) | | | 26,359 | | | $ | (737,342 | ) |
Small Cap Equity Fund Service Class | | | | | | | | | | | | | | | | |
Sold | | | 564,885 | | | $ | 4,528,738 | | | | 324,752 | | | $ | 2,884,498 | |
Issued as reinvestment of dividends | | | 30,205 | | | | 269,088 | | | | 242,830 | | | | 1,918,740 | |
Redeemed | | | (746,182 | ) | | | (6,304,366 | ) | | | (385,124 | ) | | | (3,419,972 | ) |
Net increase (decrease) | | | (151,092 | ) | | $ | (1,506,540 | ) | | | 182,458 | | | $ | 1,383,266 | |
Special Situations Fund Class II | | | | | | | | | | | | | | | | |
Sold | | | — | | | $ | — | | | | — | | | $ | — | |
Issued as reinvestment of dividends | | | 273,469 | | | | 3,959,893 | | | | 3,024 | | | | 38,829 | |
Redeemed | | | — | | | | — | | | | — | | | | — | |
Net increase (decrease) | | | 273,469 | | | $ | 3,959,893 | | | | 3,024 | | | $ | 38,829 | |
Special Situations Fund Service Class I | | | | | | | | | | | | | | | | |
Sold | | | 2,476 | | | $ | 24,825 | | | | 8,036 | | | $ | 100,115 | |
Issued as reinvestment of dividends | | | 8,845 | | | | 127,231 | | | | — | | | | — | |
Redeemed | | | (10,387 | ) | | | (121,042 | ) | | | (4,760 | ) | | | (59,130 | ) |
Net increase (decrease) | | | 934 | | | $ | 31,014 | | | | 3,276 | | | $ | 40,985 | |
Strategic Emerging Markets Fund Class II | | | | | | | | | | | | | | | | |
Sold | | | 911,853 | | | $ | 10,597,124 | | | | 1,341,680 | | | $ | 15,011,572 | |
Issued as reinvestment of dividends | | | 307,481 | | | | 3,818,915 | | | | 29,362 | | | | 320,921 | |
Redeemed | | | (4,387,645 | ) | | | (57,245,548 | ) | | | (2,590,677 | ) | | | (29,799,334 | ) |
Net increase (decrease) | | | (3,168,311 | ) | | $ | (42,829,509 | ) | | | (1,219,635 | ) | | $ | (14,466,841 | ) |
Strategic Emerging Markets Fund Service Class I | | | | | | | | | | | | | | | | |
Sold | | | 128,408 | | | $ | 1,557,559 | | | | 199,744 | | | $ | 2,290,189 | |
Issued as reinvestment of dividends | | | 38,294 | | | | 476,372 | | | | 81 | | | | 885 | |
Redeemed | | | (306,542 | ) | | | (3,790,757 | ) | | | (236,412 | ) | | | (2,732,199 | ) |
Net increase (decrease) | | | (139,840 | ) | | $ | (1,756,826 | ) | | | (36,587 | ) | | $ | (441,125 | ) |
U.S. Government Money Market Fund Initial Class | | | | | | | | | | | | | | | | |
Sold | | | 351,041,873 | | | $ | 351,041,873 | | | | 81,377,141 | | | $ | 81,377,141 | |
Issued as reinvestment of dividends | | | 405,972 | | | | 405,972 | | | | 2,960,388 | | | | 2,960,388 | |
Redeemed | | | (302,959,713 | ) | | | (302,959,713 | ) | | | (88,542,372 | ) | | | (88,542,372 | ) |
Net increase (decrease) | | | 48,488,132 | | | $ | 48,488,132 | | | | (4,204,843 | ) | | $ | (4,204,843 | ) |
198
Notes to Financial Statements (Continued) |
6. | Federal Income Tax Information |
At December 31, 2020, the aggregate cost of investments and the unrealized appreciation (depreciation) in the value of all investments owned by the Fund(s), as computed on a federal income tax basis, were as follows:
| | | Federal Income
Tax Cost | | | Tax Basis
Unrealized
Appreciation | | | Tax Basis
Unrealized
(Depreciation) | | | Net Unrealized
Appreciation
(Depreciation) | |
Blend Fund | | $ | 771,573,488 | | | $ | 21,010,466 | | | $ | — | | | $ | 21,010,466 | |
Dynamic Bond Fund | | | 321,100,455 | | | | 13,753,754 | | | | (7,502,854 | ) | | | 6,250,900 | |
Equity Fund | | | 625,533,302 | | | | 159,977,512 | | | | (5,628,846 | ) | | | 154,348,666 | |
Equity Momentum Fund | | | 38,555,176 | | | | 2,109,158 | | | | (344,125 | ) | | | 1,765,033 | |
Equity Rotation Fund | | | 39,019,810 | | | | 2,712,190 | | | | (419,407 | ) | | | 2,292,783 | |
High Yield Fund | | | 94,998,328 | | | | 5,896,153 | | | | (3,769,550 | ) | | | 2,126,603 | |
Inflation-Protected and Income Fund | | | 321,275,795 | | | | 8,944,097 | | | | (1,821,777 | ) | | | 7,122,320 | |
Managed Bond Fund | | | 1,113,628,703 | | | | 46,334,446 | | | | (12,901,337 | ) | | | 33,433,109 | |
Short-Duration Bond Fund | | | 188,615,476 | | | | 3,262,141 | | | | (2,067,865 | ) | | | 1,194,276 | |
Small Cap Equity Fund | | | 91,317,089 | | | | 44,650,449 | | | | (5,543,187 | ) | | | 39,107,262 | |
Special Situations Fund | | | 32,603,763 | | | | 5,183,897 | | | | (681,658 | ) | | | 4,502,239 | |
Strategic Emerging Markets Fund | | | 84,141,401 | | | | 33,092,562 | | | | (3,153,238 | ) | | | 29,939,324 | |
Note: The aggregate cost for investments for the U.S. Government Money Market Fund at December 31, 2020, is the same for financial reporting and federal income tax purposes.
Net capital loss carryforwards may be applied against any net realized taxable gains in succeeding years, subject to the carryforward period limitations, where applicable. On December 22, 2010, the Regulated Investment Company Modernization Act of 2010 (the “Modernization Act”) was signed by the President. The Modernization Act changed the capital loss carryforward rules as they relate to regulated investment companies. Capital losses generated in tax years beginning after the date of enactment may now be carried forward indefinitely, and retain the character of the original loss.
At December 31, 2020, the following Fund(s) had post-enactment accumulated capital loss carryforwards:
| | | Short Term
Capital Loss
Carryforward | | | Long Term
Capital Loss
Carryforward | |
Dynamic Bond Fund | | $ | 265,728 | | | $ | 1,632,613 | |
Equity Fund | | | 27,453,969 | | | | 7,781,654 | |
High Yield Fund | | | 1,297,381 | | | | 11,233,755 | |
Short-Duration Bond Fund | | | 2,568,932 | | | | 8,355,978 | |
Net capital loss carryforwards for the Fund(s) shown in the above table are from post-enactment years and are, therefore, not subject to the eight-year carryforward period and possible expiration.
Generally accepted accounting principles in the United States of America require that only distributions in excess of tax basis earnings and profits be reported in the financial statements as a return of capital.
199
Notes to Financial Statements (Continued) |
The tax character of distributions (including capital gain dividends, if any, designated pursuant to Section 852 of the Code) paid during the year ended December 31, 2020, was as follows:
| | | Ordinary
Income | | | Long Term
Capital Gain | |
Blend Fund | | $ | 1,414,757 | | | $ | 30,150,220 | |
Dynamic Bond Fund | | | 1,155,909 | | | | — | |
Equity Fund | | | 16,293,607 | | | | 80,236,519 | |
Equity Momentum Fund | | | 1,202,462 | | | | 2,585,328 | |
Equity Rotation Fund | | | 706,083 | | | | 461,778 | |
High Yield Fund | | | 28,859 | | | | — | |
Inflation-Protected and Income Fund | | | 367,449 | | | | — | |
Managed Bond Fund | | | 983,218 | | | | — | |
Short-Duration Bond Fund | | | 523 | | | | — | |
Small Cap Equity Fund | | | 519,119 | | | | 1,026,577 | |
Special Situations Fund | | | 77,148 | | | | 4,009,976 | |
Strategic Emerging Markets Fund | | | 549,224 | | | | 3,746,063 | |
U.S. Government Money Market Fund | | | 405,972 | | | | — | |
The tax character of distributions (including capital gain dividends, if any, designated pursuant to Section 852 of the Code) paid during the year ended December 31, 2019, was as follows:
| | | Ordinary
Income | | | Long Term
Capital Gain | |
Blend Fund | | $ | 19,958,295 | | | $ | 30,745,437 | |
Dynamic Bond Fund | | | 14,998,546 | | | | — | |
Equity Fund | | | 16,300,088 | | | | 41,042,616 | |
Equity Momentum Fund | | | 268,383 | | | | 1,483,121 | |
Equity Rotation Fund | | | 128,591 | | | | 563,539 | |
High Yield Fund | | | 7,794,630 | | | | — | |
Inflation-Protected and Income Fund | | | 8,526,377 | | | | — | |
Managed Bond Fund | | | 40,455,216 | | | | — | |
Short-Duration Bond Fund | | | 6,656,207 | | | | — | |
Small Cap Equity Fund | | | 1,463,827 | | | | 8,617,039 | |
Special Situations Fund | | | 38,829 | | | | — | |
Strategic Emerging Markets Fund | | | 321,806 | | | | — | |
U.S. Government Money Market Fund | | | 2,960,404 | | | | — | |
Capital accounts within the financial statements are periodically adjusted for permanent differences between book and tax accounting. These adjustments have no impact on net assets or the results of operations. Temporary book and tax accounting differences will reverse in subsequent periods. At December 31, 2020, temporary book and tax accounting differences were primarily attributable to the deferral of wash sale losses, deferred Trustee compensation, and other temporary basis adjustments.
200
Notes to Financial Statements (Continued) |
At December 31, 2020, the components of distributable earnings on a tax basis were as follows:
| | | Undistributed
Ordinary
Income | | | Undistributed
Long Term
Capital Gain
(Capital Loss
Carryover) | | | Other
Temporary
Differences | | | Unrealized
Appreciation
(Depreciation) | |
Blend Fund | | $ | 36,943,932 | | | $ | 188,501,586 | | | $ | (173,842 | ) | | $ | 21,010,466 | |
Dynamic Bond Fund | | | 11,620,856 | | | | (1,898,341 | ) | | | (30,826 | ) | | | 6,250,900 | |
Equity Fund | | | 14,910,496 | | | | (35,235,623 | ) | | | (217,166 | ) | | | 154,348,666 | |
Equity Momentum Fund | | | 864,505 | | | | 5,468,826 | | | | (1,807 | ) | | | 1,765,778 | |
Equity Rotation Fund | | | 2,321,491 | | | | 6,806,895 | | | | (1,898 | ) | | | 2,292,783 | |
High Yield Fund | | | 6,789,832 | | | | (12,531,136 | ) | | | (18,187 | ) | | | 2,126,603 | |
Inflation-Protected and Income Fund | | | 21,218,150 | | | | 4,640,862 | | | | (74,367 | ) | | | 7,122,320 | |
Managed Bond Fund | | | 51,117,340 | | | | 3,103,218 | | | | (211,148 | ) | | | 33,433,109 | |
Short-Duration Bond Fund | | | 6,437,954 | | | | (10,924,910 | ) | | | (30,397 | ) | | | 1,194,276 | |
Small Cap Equity Fund | | | 1,558,131 | | | | 7,825,158 | | | | (27,282 | ) | | | 39,107,262 | |
Special Situations Fund | | | 2,811,359 | | | | 3,316,746 | | | | (1,592 | ) | | | 4,502,239 | |
Strategic Emerging Markets Fund | | | — | | | | 16,877,811 | | | | (12,380 | ) | | | 29,940,425 | |
U.S. Government Money Market Fund | | | 6,742 | | | | — | | | | (44,865 | ) | | | — | |
During the year ended December 31, 2020, the following amounts were reclassified due to permanent differences between book and tax accounting:
| | | Paid-in
Capital | | | Accumulated
Net Realized
Gain (Loss) on
Investments | | | Undistributed
Net Investment
Income (Loss) | |
Blend Fund | | $ | 76 | | | $ | (1,684,062 | ) | | $ | 1,683,986 | |
Dynamic Bond Fund | | | – | | | | (1,432,920 | ) | | | 1,432,920 | |
Equity Fund | | | – | | | | 265,343 | | | | (265,343 | ) |
Equity Momentum Fund | | | – | | | | (3,381 | ) | | | 3,381 | |
Equity Rotation Fund | | | 5 | | | | (72,228 | ) | | | 72,223 | |
High Yield Fund | | | – | | | | 132,291 | | | | (132,291 | ) |
Inflation-Protected and Income Fund | | | – | | | | 1,847,773 | | | | (1,847,773 | ) |
Managed Bond Fund | | | – | | | | (1,030,675 | ) | | | 1,030,675 | |
Short-Duration Bond Fund | | | – | | | | (378,467 | ) | | | 378,467 | |
Small Cap Equity Fund | | | (10,911 | ) | | | 31,713 | | | | (20,802 | ) |
Special Situations Fund | | | – | | | | (462 | ) | | | 462 | |
Strategic Emerging Markets Fund | | | (216,154 | ) | | | 42,835 | | | | 173,319 | |
The Funds did not have any unrecognized tax benefits at December 31, 2020, nor were there any increases or decreases in unrecognized tax benefits for the year then ended. The Funds recognize interest and penalties, if any, related to unrecognized tax benefits as an income tax expense in the Statements of Operations. During the year ended December 31, 2020, the Funds did not incur any such interest or penalties. The Funds are subject to examination by U.S. federal and state tax authorities for returns filed for the prior three fiscal years. Foreign taxes are provided for based on the Funds’ understanding of the tax rules and rates that exist in the foreign markets in which they invest.
201
Notes to Financial Statements (Continued) |
Under the Funds’ organizational documents, current and former Trustees and Officers are provided with specified rights to indemnification against liabilities arising in connection with the performance of their duties to the Funds, and shareholders are indemnified against personal liability for obligations of the Funds. In the normal course of business, the Funds may also enter into contracts that provide general indemnifications. The Funds’ maximum exposure under these arrangements is unknown as this would be dependent on future claims that may be made against the Funds. The risk of material loss from such claims is considered remote.
8. | New Accounting Pronouncements |
In October 2020, Accounting Standards Update 2017-08, Receivables — Nonrefundable Fees and Other Costs (Subtopic 310-20): Premium Amortization on Purchased Callable Debt Securities (“ASU 2017-08”) was amended by Accounting Standards Update 2020-08, Codification Improvements to Subtopic 310-20, Receivables—Nonrefundable Fees and Other Costs (“ASU 2020-08”). ASU 2020-08 requires entities to reevaluate whether callable debt securities fall within the scope of ASU 2017-08 at each reporting period. ASU 2020-08 also amends the relevant guidance to require premiums to be amortized to the “next call date” rather than the “earliest call date,” and further clarifies the definition of “next call date.” ASU 2020-08 is effective for fiscal years, and interim periods within those fiscal years, beginning after December 15, 2020. Early adoption of ASU 2020-08 is not permitted. Management is currently evaluating the impact, if any, of applying ASU 2020-08.
In March 2020, FASB issued Accounting Standards Update 2020-04 — Reference Rate Reform (Topic 848) — Facilitation of the Effects of Reference Rate Reform on Financial Reporting (“ASU 2020-04”). ASU 2020-04 provides optional temporary financial reporting relief from the effect of certain types of contract modifications due to the planned discontinuation of the London Interbank Offered Rate (“LIBOR”) and other interbank-offered based reference rates as of the end of 2021. ASU 2020-04 is effective for certain reference rate-related contract modifications that occur during the period March 12, 2020 through December 31, 2022. Management does not believe the adoption of 2020-04 will have a material impact on the financial statements.
On December 7, 2010, the Trust was named as a defendant and putative member of the proposed defendant class of shareholders named in an adversary proceeding brought by The Official Committee of Unsecured Creditors of Tribune Company (the “Official Committee”) in the U.S. Bankruptcy Court for the District of Delaware, in connection with Tribune Company’s Chapter 11 bankruptcy proceeding (In re Tribune Company). The proceeding relates to a leveraged buyout (“LBO”) transaction by which Tribune Company converted to a privately-held company in 2007, and the putative defendant class is comprised of beneficial owners of shares of Tribune Company who received proceeds (the “Proceeds”) of the LBO. The Official Committee seeks to recover payments of those Proceeds. On April 5, 2012, the adversary proceeding was transferred to the Southern District of New York for consolidated pretrial proceedings. The action is now being prosecuted by the litigation trustee (“Trustee”) for the Tribune Litigation Trust.
The potential amount sought to be recovered from the Blend Fund and Small Cap Equity Fund are approximately $207,400 and $93,500, respectively, plus interest and the Official Committee’s court costs.
In addition, on June 2, 2011, the Blend Fund was named as a defendant in a closely related, parallel adversary proceeding brought in connection with the Tribune Company’s LBO by Deutsche Bank Trust Company Americas, in its capacity as successor indenture trustee for a certain series of Senior Notes, Law Debenture Trust Company of New York, in its capacity as successor indenture trustee for a certain series of Senior Notes, and Wilmington Trust Company, in its capacity as successor indenture trustee for the PHONES Notes (together, the “Plaintiffs”), in the United States District Court for the District of Massachusetts. The Plaintiffs also seek to recover payments of the Proceeds. On December 20, 2011, this action was transferred to the Southern District of New York for consolidated pretrial proceedings.
202
Notes to Financial Statements (Continued) |
The Funds cannot predict the outcome of these proceedings. Accordingly, the Funds have not accrued any amounts related to these proceedings. If the proceedings were to be decided in a manner adverse to the Funds, or if the Funds were to enter into a settlement agreement with the Trustee or the Plaintiffs, as applicable, the payment of such judgment or settlement could potentially have a material adverse effect on the Funds’ net asset values depending on the net assets of each applicable Fund at the time of such judgment or settlement.
10. | Coronavirus (COVID-19) Pandemic |
The global pandemic outbreak of the novel coronavirus known as COVID-19 has produced, and will likely continue to produce, substantial market volatility, severe market dislocations and liquidity constraints in many markets, and global business disruption, and it may result in future significant adverse effects, such as exchange trading suspensions and closures, declines in global financial markets, higher default rates, and a substantial economic downturn or recession throughout the world. Such factors may have a significant adverse effect on a Fund’s performance and have the potential to impair the ability of a Fund’s investment adviser, subadviser, or other service providers to serve the Fund and could lead to disruptions that negatively impact the Fund.
203
Report of Independent Registered Public Accounting Firm |
To the Board of Trustees of MML Series Investment Fund II and Shareholders of MML Blend Fund, MML Dynamic Bond Fund, MML Equity Fund, MML Equity Momentum Fund (formerly known as MML Asset Momentum Fund), MML Equity Rotation Fund, MML High Yield Fund, MML Inflation-Protected and Income Fund, MML Managed Bond Fund, MML Short-Duration Bond Fund, MML Small Cap Equity Fund, MML Special Situations Fund, MML Strategic Emerging Markets Fund and MML U.S. Government Money Market Fund (collectively, the “Funds”):
Opinion on the Financial Statements and Financial Highlights
We have audited the accompanying statements of assets and liabilities of the Funds, including the portfolios of investments, as of December 31, 2020, the related statements of operations for the year then ended, the statements of changes in net assets for each of the two years in the period then ended, the financial highlights for each of the five years in the period then ended, and the related notes. In our opinion, the financial statements and financial highlights present fairly, in all material respects, the financial position of each of the Funds as of December 31, 2020, and the results of their operations for the year then ended, the changes in their net assets for each of the two years in the period then ended, and the financial highlights for each of the five years in the period then ended, in conformity with accounting principles generally accepted in the United States of America.
Basis for Opinion
These financial statements and financial highlights are the responsibility of the Funds’ management. Our responsibility is to express an opinion on the Funds’ financial statements and financial highlights based on our audits. We are a public accounting firm registered with the Public Company Accounting Oversight Board (United States) (PCAOB) and are required to be independent with respect to the Funds in accordance with the U.S. federal securities laws and the applicable rules and regulations of the Securities and Exchange Commission and the PCAOB.
We conducted our audits in accordance with the standards of the PCAOB. Those standards require that we plan and perform the audit to obtain reasonable assurance about whether the financial statements and financial highlights are free of material misstatement, whether due to error or fraud. The Funds are not required to have, nor were we engaged to perform, an audit of their internal control over financial reporting. As part of our audits we are required to obtain an understanding of internal control over financial reporting but not for the purpose of expressing an opinion on the effectiveness of the Funds’ internal control over financial reporting. Accordingly, we express no such opinion.
Our audits included performing procedures to assess the risks of material misstatement of the financial statements and financial highlights, whether due to error or fraud, and performing procedures that respond to those risks. Such procedures included examining, on a test basis, evidence regarding the amounts and disclosures in the financial statements and financial highlights. Our audits also included evaluating the accounting principles used and significant estimates made by management, as well as evaluating the overall presentation of the financial statements and financial highlights. Our procedures included confirmation of securities owned as of December 31, 2020, by correspondence with the custodian and brokers; when replies were not received from brokers, we performed other auditing procedures. We believe that our audits provide a reasonable basis for our opinion.
/s/ Deloitte & Touche LLP
Boston, Massachusetts
February 23, 2021
We have served as the auditor of one or more MassMutual investment companies since 1995.
204
Trustees and Principal Officers (Unaudited) |
The following table lists the Trust’s Trustees and Principal Officers; their address and year of birth; their position with the Trust; the length of time holding that position with the Trust; their principal occupation(s) during at least the past five years; the number of portfolios in the fund complex they oversee; and other directorships they hold in companies subject to registration or reporting requirements of the Securities Exchange Act of 1934 (generally called “public companies”) or in registered investment companies. The Trust’s Statement of Additional Information includes additional information about the Trust’s Trustees and is available, without charge, upon request by calling 1-888-309-3539 or by writing MML Series Investment Fund II, c/o Massachusetts Mutual Life Insurance Company, 100 Bright Meadow Blvd., Enfield, Connecticut 06082-1981, Attention: MassMutual U.S. Product and Marketing.
Independent Trustees
Name, Address*,
and Year of Birth | Position(s)
Held with
Trust | Term of
Office** and
Length of
Time Served | Principal Occupation(s)
During Past 5 Years | Number of
Portfolios in
Fund Complex
Overseen by
Trustee | Other Directorships
Held by Trustee |
Allan W. Blair Year of birth: 1948 | Trustee | Since 2012 | Retired. | 109 | Trustee (since 2003), MassMutual Select Funds (open-end investment company); Trustee (since 2003), MML Series Investment Fund (open-end investment company); Trustee (since 2012), MassMutual Premier Funds (open-end investment company). |
Nabil N. El-Hage Year of birth: 1958 | Trustee Chairman | Since 2005 2006-2012 | Founder and CEO (since 2018), AEE International LLC (a Puerto Rico LLC); Founder and sole member (2016-2018), PR Academy of Executive Education LLC (a Puerto Rico LLC). | 109 | Trustee (since 2012), MassMutual Select Funds (open-end investment company); Trustee (since 2012), MML Series Investment Fund (open-end investment company); Trustee (since 2003), Chairman (2006-2012), MassMutual Premier Funds (open-end investment company). |
Maria D. Furman Year of birth: 1954 | Trustee | Since 2005 | Retired. | 109 | Trustee (since 2011), GMO Series Trust (open-end investment company); Trustee (since 2012), MassMutual Select Funds (open-end investment company); Trustee (since 2012), MML Series Investment Fund (open-end investment company); Trustee (since 2004), MassMutual Premier Funds (open-end investment company). |
R. Alan Hunter, Jr. Year of birth: 1946 | Chairperson Trustee | Since 2016 Since 2012 | Retired. | 109 | Chairperson (since 2016), Trustee (since 2003), MassMutual Select Funds (open-end investment company); Chairperson (since 2016), Trustee (since 2003), MML Series Investment Fund (open-end investment company); Chairperson (since 2016), Trustee (since 2012), MassMutual Premier Funds (open-end investment company). |
205
Trustees and Principal Officers (Unaudited) (Continued) |
Name, Address*,
and Year of Birth | Position(s)
Held with
Trust | Term of
Office** and
Length of
Time Served | Principal Occupation(s)
During Past 5 Years | Number of
Portfolios in
Fund Complex
Overseen by
Trustee | Other Directorships
Held by Trustee |
C. Ann Merrifield Year of birth: 1951 | Trustee | Since 2005 | Retired. | 109 | Lead Director (since 2020), Lyra Therapeutics (a clinical-stage specialty pharmaceutical company); Director (since 2014), Flexion Therapeutics (specialty pharmaceutical company); Chairperson (2017-2018), Director (since 2014), InVivo Therapeutics (research and clinical-stage biomaterials and biotechnology company); Trustee (since 2012), MassMutual Select Funds (open-end investment company); Trustee (since 2012), MML Series Investment Fund (open-end investment company); Trustee (since 2004), MassMutual Premier Funds (open-end investment company). |
Susan B. Sweeney Year of birth: 1952 | Trustee | Since 2012 | Retired. | 111^ | Trustee (since 2012), Barings Corporate Investors (closed-end investment company); Trustee (since 2012), Barings Participation Investors (closed-end investment company); Trustee (since 2009), MassMutual Select Funds (open-end investment company); Trustee (since 2009), MML Series Investment Fund (open-end investment company); Trustee (since 2012), MassMutual Premier Funds (open-end investment company). |
Interested Trustees
Name, Address*,
and Year of Birth | Position(s)
Held with
Trust | Term of
Office** and
Length of
Time Served | Principal Occupation(s)
During Past 5 Years | Number of
Portfolios in
Fund Complex
Overseen by
Trustee | Other Directorships
Held by Trustee |
Michael R. Fanning^^ Year of birth: 1963 | Trustee | Since 2021 | Head of MassMutual U.S. (since 2016), Executive Vice President (2016-2018), Member of MassMutual’s Executive Leadership Team (since 2008), MassMutual. | 109 | Director (since 2016), MML Advisers; Trustee (since 2021), MassMutual Select Funds (open-end investment company); Trustee (since 2021), MML Series Investment Fund (open-end investment company); Trustee (since 2021), MassMutual Premier Funds (open-end investment company). |
206
Trustees and Principal Officers (Unaudited) (Continued) |
Name, Address*,
and Year of Birth | Position(s)
Held with
Trust | Term of
Office** and
Length of
Time Served | Principal Occupation(s)
During Past 5 Years | Number of
Portfolios in
Fund Complex
Overseen by
Trustee | Other Directorships
Held by Trustee |
Clifford M, Noreen^^^ Year of birth: 1957 | Trustee | Since 2021 | Head of Global Investment Strategy (since 2019), Deputy Chief Investment Officer (2016-2018), MassMutual; President (2008-2016), Vice Chairman (2007-2008), Member of the Board of Managers (2006-2016), Managing Director (2000-2016), Barings LLC. | 111^ | Chairman (since 2009), Trustee (since 2005), President (2005-2009), CI Subsidiary Trust and PI Subsidiary Trust; Chairman and Trustee (since 2009), Barings Corporate Investors (closed-end investment company); Chairman and Trustee (since 2009), Barings Participation Investors (closed-end investment company); Trustee (since 2021), MassMutual Select Funds (open-end investment company); Trustee (since 2021), MML Series Investment Fund (open-end investment company); Trustee (since 2021), MassMutual Premier Funds (open-end investment company). |
Principal Officers
Name, Address*,
and Year of Birth | Position(s)
Held with
Trust | Term of
Office# and
Length of
Time Served | Principal Occupation(s)
During Past 5 Years | Number of
Portfolios in
Fund Complex
Overseen by
Officer |
Joseph Fallon Year of birth: 1975 | Vice President Assistant Vice President | Since 2017 2015- 2017 | Investment Director (since 2014), MML Advisers; Head of Investment Consulting & Strategy (since 2017), Investment Director (2006-2017), MassMutual; Vice President (since 2017), Assistant Vice President (2015-2017), MassMutual Select Funds (open-end investment company); Vice President (since 2017), Assistant Vice President (2015-2017), MML Series Investment Fund (open-end investment company); Vice President (since 2017), Assistant Vice President (2015-2017), MassMutual Premier Funds (open-end investment company). | 109 |
Andrew M. Goldberg Year of birth: 1966 | Vice President, Secretary (formerly known as “Clerk”), and Chief Legal Officer Assistant Clerk | Since 2008 2005- 2008 | Lead Counsel, Investment Adviser & Mutual Funds (since 2018), Assistant Vice President and Counsel (2004-2018), MassMutual; Secretary (since 2015), Assistant Secretary (2013-2015), MML Advisers; Vice President, Secretary, and Chief Legal Officer (since 2008), Assistant Secretary (2001-2008), MassMutual Select Funds (open-end investment company); Vice President, Secretary, and Chief Legal Officer (since 2008), Assistant Secretary (2001-2008), MML Series Investment Fund (open-end investment company); Vice President, Secretary, (formerly known as “Clerk”), and Chief Legal Officer (since 2008), Assistant Clerk (2004-2008), MassMutual Premier Funds (openend investment company). | 109 |
Renee Hitchcock Year of birth: 1970 | Chief Financial Officer and Treasurer Assistant Treasurer | Since 2016 2007- 2016 | Head of Mutual Fund Administration (since 2018), Assistant Vice President (2015-2018), MassMutual; Chief Financial Officer and Treasurer (since 2016), Assistant Treasurer (2007-2016), MassMutual Select Funds (open-end investment company); Chief Financial Officer and Treasurer (since 2016), Assistant Treasurer (2007-2016), MML Series Investment Fund (open-end investment company); Chief Financial Officer and Treasurer (since 2016), Assistant Treasurer (2007-2016), MassMutual Premier Funds (open-end investment company). | 109 |
Paul LaPiana Year of birth: 1969 | President | Since 2021 | President (since 2021), MML Advisers; Head of MassMutual U.S. Product (since 2019), Head of Field Management (2016-2019), MassMutual; Executive Vice President, Head of Field Distribution (2012-2016), MetLife; President (since 2021), MassMutual Select Funds (open-end investment company); President (since 2021), MML Series Investment Fund (open-end investment company); President (since 2021), MassMutual Premier Funds (open-end investment company). | 109 |
207
Trustees and Principal Officers (Unaudited) (Continued) |
Name, Address*,
and Year of Birth | Position(s)
Held with
Trust | Term of
Office# and
Length of
Time Served | Principal Occupation(s)
During Past 5 Years | Number of
Portfolios in
Fund Complex
Overseen by
Officer |
Jill Nareau Robert Year of birth: 1972 | Vice President and Assistant Secretary Assistant Secretary (formerly known as “Assistant Clerk”) | Since 2017 2008- 2017 | Lead Counsel, Investment Adviser & Mutual Funds (since 2018), Assistant Vice President and Counsel (2009-2018), MassMutual; Assistant Secretary (since 2015), MML Advisers; Vice President and Assistant Secretary (since 2017), Assistant Secretary (2008- 2017), MassMutual Select Funds (open-end investment company); Vice President and Assistant Secretary (since 2017), Assistant Secretary (2008-2017), MML Series Investment Fund (open-end investment company); Vice President and Assistant Secretary (since 2017), Assistant Secretary (formerly known as “Assistant Clerk”) (2008-2017), MassMutual Premier Funds (open-end investment company). | 109 |
Douglas Steele Year of birth: 1975 | Vice President | Since 2016 | Vice President and Head of Investment Management (since 2017), Head of Investment Due Diligence (2016-2017), MML Advisers; Head of Investment Management (since 2017), Assistant Vice President (2013-2017), MassMutual; Vice President (since 2016), MassMutual Select Funds (open-end investment company); Vice President (since 2016), MML Series Investment Fund (open-end investment company); Vice President (since 2016), MassMutual Premier Funds (open-end investment company). | 109 |
Philip S. Wellman Year of birth: 1964 | Vice President and Chief Compliance Officer | Since 2007 | Vice President and Chief Compliance Officer (since 2013), MML Advisers; Head of Mutual Funds & RIA Compliance (since 2018), Vice President, Associate General Counsel, and Chief Compliance Officer (Mutual Funds) (2014-2018), MassMutual; Vice President and Chief Compliance Officer (since 2007), MassMutual Select Funds (open-end investment company); Vice President and Chief Compliance Officer (since 2007), MML Series Investment Fund (open-end investment company); Vice President and Chief Compliance Officer (since 2007), MassMutual Premier Funds (open-end investment company). | 109 |
* | The address of each Trustee and Principal Officer is the same as that for the Trust; 100 Bright Meadow Blvd., Enfield, Connecticut 06082-1981. |
** | Each Trustee of the Trust serves until the next meeting of shareholders called for the purpose of electing Trustees and until the election and qualification of his or her successor or until he or she dies, resigns, or is removed. Notwithstanding the foregoing, unless the Trustees determine that it is desirable and in the best interest of the Trust that an exception to the retirement policy of the Trust be made, a Trustee shall retire and cease to serve as a Trustee upon the conclusion of the calendar year in which such Trustee attains the age of seventy-five years, however, an interested Trustee of the Trust shall no longer serve as a Trustee if or when they are no longer an employee of MassMutual or an affiliate. |
| The Chairperson is elected to hold such office for a term of three years or until their successor is elected and qualified to carry out the duties and responsibilities of their office, or until he or she retires, dies, resigns, is removed, or becomes disqualified. The Chairperson shall hold office at the pleasure of the Trustees. |
^ | Barings Participation Investors and Barings Corporate Investors are deemed to be a part of the Fund Complex, because they are managed by Barings LLC, an affiliate of MML Advisers. |
^^ | Mr. Fanning is an “Interested Person,” as that term is defined in the 1940 Act, as an employee of MassMutual. |
^^^ | Mr. Noreen is an “Interested Person,” as that term is defined in the 1940 Act, as an employee of MassMutual. |
# | The President, Treasurer, and Secretary and such other officers as the Trustees may in their discretion from time to time elect are elected to hold such office until their successor is elected and qualified to carry out the duties and responsibilities of their office, or until he or she dies, resigns, is removed, or becomes disqualified. Each officer shall hold office at the pleasure of the Trustees. |
208
Federal Tax Information (Unaudited) |
For corporate shareholders, a portion of the ordinary dividends paid during the Fund(s)’ year ended December 31, 2020, qualified for the dividends received deduction, as follows:
| | | Dividends
Received
Deductions | |
Blend Fund | | | 36.51 | % |
Equity Fund | | | 100.00 | % |
Equity Momentum Fund | | | 9.33 | % |
Equity Rotation Fund | | | 33.69 | % |
Managed Bond Fund | | | 0.86 | % |
Short-Duration Bond Fund | | | 0.64 | % |
Small Cap Equity Fund | | | 100.00 | % |
Special Situations Fund | | | 10.79 | % |
Strategic Emerging Markets Fund | | | 3.92 | % |
The Fund(s) intend to pass through the maximum amount allowable as Section 163(j) Interest Dividends as defined in the Treasury Regulations §1.163(j)-1(b).
209
Other Information (Unaudited) |
Proxy Voting
A description of the policies and procedures that each Fund’s investment adviser and subadvisers use to vote proxies relating to the Fund’s portfolio securities is available, without charge, upon request, by calling 1-888-309-3539, and on the Securities and Exchange Commission’s (“SEC”) EDGAR database on its website at http://www.sec.gov.
Information regarding how the Funds voted proxies relating to portfolio securities during the most recent 12-month period ended June 30 is available, without charge, upon request, on the MassMutual website at http://www.massmutual.com/funds and on the SEC’s EDGAR database on its website at http://www.sec.gov.
Monthly Reporting
The U.S. Government Money Market Fund files its complete schedule of portfolio holdings with the SEC monthly on Form N-MFP. The U.S. Government Money Market Fund’s reports on Form N-MFP are available on the SEC’s EDGAR database on its website at http://www.sec.gov. In addition, the U.S. Government Money Market Fund makes portfolio holdings information available to shareholders at http://www.massmutual.com/funds.
Quarterly Reporting
The Funds, except for the U.S. Government Money Market Fund, file their complete schedule of portfolio holdings with the SEC for the first and third quarters of each fiscal year as an exhibit to their reports on Form N-PORT. The Funds’ Forms N-PORT are available on the SEC’s EDGAR database on its website at http://www.sec.gov. In addition, the Funds make the complete schedule of portfolio holdings from their filings on Form N-PORT available to shareholders at http://www.massmutual.com/funds.
Trustees’ Approval of Investment Advisory Contracts
At their meeting in September 2020, the Trustees, including the Trustees who are not “interested persons” (as such term is defined in the 1940 Act) of the Trust, MML Advisers, or the subadvisers (the “Independent Trustees”), reviewed and approved (i) new subadvisory agreements with Invesco for the Equity Momentum Fund, Equity Rotation Fund, and Special Situations Fund, and (ii) a new subadvisory agreement with BlackRock for the Blend Fund (together, the “Funds” and the “New Subadvisory Agreements”). In preparation for the meeting, the Trustees requested, and MML Advisers provided in advance, certain materials relevant to the consideration of the New Subadvisory Agreements. In all of their deliberations, the Trustees were advised by independent counsel. In reviewing the New Subadvisory Agreements, the Independent Trustees discussed with MML Advisers and considered a wide range of information about, among other things: (i) Invesco and BlackRock and their personnel with responsibility for providing services to the respective Funds; (ii) the terms of the New Subadvisory Agreements; (iii) the scope and quality of the services that Invesco and BlackRock will provide under the New Subadvisory Agreements; (iv) the historical and/or hypothetical investment performance track records of Invesco and BlackRock; and (v) the fees payable to Invesco and BlackRock by MML Advisers, the effect of such fees on the profitability to MML Advisers, and any information provided by Invesco and BlackRock regarding the fees paid to Invesco and BlackRock by other funds with similar investment objectives as the respective Funds. The Trustees also noted the fact that the Blend Fund’s advisory fees and total expenses were not expected to change as a result of its New Subadvisory Agreement, and that MML Advisers was proposing to implement contractual management fee waivers and/or expense caps for the Equity Momentum Fund, Equity Rotation Fund, and Special Situations Fund. In addition, the Trustees also approved new sub-subadvisory agreements between Invesco and Invesco Capital Management LLC for the Equity Momentum Fund, Equity Rotation Fund, and Special Situations Fund (the “New Sub-Subadvisory Agreements”).
Prior to the votes being taken to approve the New Subadvisory Agreements and New Sub-Subadvisory Agreements, the Independent Trustees met separately in executive session to discuss the appropriateness of such contracts. The Independent Trustees weighed the foregoing matters in light of the advice given to them by their independent legal counsel as to the law applicable to the review of investment advisory contracts. In arriving at a decision, the Trustees, including the Independent Trustees, did not identify any single matter as all-important or controlling. The foregoing summary does not detail all of the matters considered.
210
Other Information (Unaudited) (Continued) |
Based on the foregoing, and following their review, the Trustees concluded, with respect to the New Subadvisory Agreements, that (i) overall, they were satisfied with the nature, extent, and quality of services expected to be provided under the New Subadvisory Agreements; (ii) MML Advisers’ projected levels of profitability due to the New Subadvisory Agreements are not excessive and the subadvisory fee amounts under the New Subadvisory Agreements are fair and reasonable; (iii) the investment processes and strategies of each of Invesco and BlackRock appear well suited to the respective Funds given their investment objectives and policies; and (iv) the terms of the New Subadvisory Agreements are fair and reasonable with respect to the respective Funds, and are in the best interests of each Fund’s shareholders. After carefully considering the information summarized above, the Trustees, including a majority of the Independent Trustees voting separately, unanimously voted to approve the New Subadvisory Agreements and New Sub-Subadvisory Agreements.
The New Subadvisory Agreements and New Sub-Subadvisory Agreements for the Blend Fund, Equity Momentum Fund, and Special Situations Fund, as applicable, became effective on November 18, 2020.
The New Subadvisory Agreement and New Sub-Subadvisory Agreement for the Equity Rotation Fund became effective on November 23, 2020.
211
Other Information (Unaudited) (Continued) |
Fund Expenses December 31, 2020
Expense Examples:
The following information is in regards to expenses for the six months ended December 31, 2020:
As a shareholder of the Funds, you incur ongoing costs, including advisory fees, distribution and/or service (12b-1) fees, and other Fund expenses. These examples are intended to help you understand your ongoing costs (in dollars) of investing in the Funds and to compare these costs with the ongoing costs of investing in other mutual funds. These examples are based on an investment of $1,000 invested for the six months ended December 31, 2020.
Actual Expenses:
The first four columns of the table below provide information about actual account values and actual expenses. You may use this information, together with the amount you invested, to estimate the expenses that you paid over the period. Simply divide your account value by $1,000 (for example, an $8,600 account value divided by $1,000 = 8.6), then multiply the result by the number under the heading entitled “Operating Expenses Incurred” to estimate the expenses you paid on your account during this period.
Hypothetical Example for Comparison Purposes:
The last two columns of the table below provide information about hypothetical account values and hypothetical expenses based on the Fund’s actual expense ratio and an assumed rate of return of 5% per year before expenses, which is not the Fund’s actual return. The hypothetical account values and expenses may not be used to estimate the actual ending account balance or expenses you paid for the period. You may use this information to compare the ongoing costs of investing in the Fund and other funds. To do so, compare this 5% hypothetical example with the 5% hypothetical examples that appear in the shareholder reports of the other funds.
Please note that the expenses shown in the table are meant to highlight your ongoing costs only and do not reflect any transactional costs. Therefore, the last two columns of the table are useful in comparing ongoing costs only, and will not help you determine the relative total costs of owning different funds. In addition, if these transactional costs were included, your costs would have been higher.
| | Beginning
Value | Annualized
Expense
Ratio | Ending
Value (Based
on Actual
Returns and
Expenses) | Operating
Expenses
Incurred* | Ending Value
(Based on
Hypothetical
Returns and
Expenses) | Operating
Expenses
Incurred* |
Blend Fund | | | | | | |
Initial Class | $1,000 | 0.45% | $1,145.20 | $2.43 | $1,022.90 | $2.29 |
Service Class | 1,000 | 0.70% | 1,143.80 | 3.77 | 1,021.60 | 3.56 |
Dynamic Bond Fund | | | | | | |
Class II | 1,000 | 0.63% | 1,029.90 | 3.21 | 1,022.00 | 3.20 |
Service Class I | 1,000 | 0.88% | 1,028.00 | 4.49 | 1,020.70 | 4.47 |
Equity Fund | | | | | | |
Initial Class | 1,000 | 0.44% | 1,222.90 | 2.46 | 1,022.90 | 2.24 |
Service Class | 1,000 | 0.69% | 1,221.40 | 3.85 | 1,021.70 | 3.51 |
Equity Momentum Fund | | | | | | |
Class II | 1,000 | 0.87% | 1,213.60 | 4.84 | 1,020.80 | 4.42 |
Service Class I | 1,000 | 1.11% | 1,212.10 | 6.17 | 1,019.60 | 5.64 |
Equity Rotation Fund | | | | | | |
Class II | 1,000 | 0.75% | 1,244.20 | 4.23 | 1,021.40 | 3.81 |
Service Class I | 1,000 | 1.00% | 1,242.80 | 5.64 | 1,020.10 | 5.08 |
212
Other Information (Unaudited) (Continued) |
| | Beginning
Value | Annualized
Expense
Ratio | Ending
Value (Based
on Actual
Returns and
Expenses) | Operating
Expenses
Incurred* | Ending Value
(Based on
Hypothetical
Returns and
Expenses) | Operating
Expenses
Incurred* |
High Yield Fund | | | | | | |
Class II | $1,000 | 0.79% | $1,128.80 | $4.23 | $1,021.20 | $4.01 |
Service Class I | 1,000 | 1.05% | 1,127.10 | 5.61 | 1,019.90 | 5.33 |
Inflation-Protected and Income Fund | | | | | | |
Initial Class | 1,000 | 0.60% | 1,061.60 | 3.11 | 1,022.10 | 3.05 |
Service Class | 1,000 | 0.85% | 1,061.00 | 4.40 | 1,020.90 | 4.32 |
Managed Bond Fund | | | | | | |
Initial Class | 1,000 | 0.42% | 1,052.30 | 2.17 | 1,023.00 | 2.14 |
Service Class | 1,000 | 0.67% | 1,051.00 | 3.45 | 1,021.80 | 3.41 |
Short-Duration Bond Fund | | | | | | |
Class II | 1,000 | 0.56% | 1,045.70 | 2.88 | 1,022.30 | 2.85 |
Service Class I | 1,000 | 0.81% | 1,044.70 | 4.16 | 1,021.10 | 4.12 |
Small Cap Equity Fund | | | | | | |
Initial Class | 1,000 | 0.73% | 1,353.40 | 4.32 | 1,021.50 | 3.71 |
Service Class | 1,000 | 0.98% | 1,351.80 | 5.79 | 1,020.20 | 4.98 |
Special Situations Fund | | | | | | |
Class II | 1,000 | 0.93% | 1,462.90 | 5.76 | 1,020.50 | 4.72 |
Service Class I | 1,000 | 1.18% | 1,462.00 | 7.30 | 1,019.20 | 5.99 |
Strategic Emerging Markets Fund | | | | | | |
Class II | 1,000 | 1.39% | 1,288.30 | 8.00 | 1,018.10 | 7.05 |
Service Class I | 1,000 | 1.64% | 1,287.30 | 9.43 | 1,016.90 | 8.31 |
U.S. Government Money Market Fund | | | | | | |
Initial Class | 1,000 | 0.17% | 1,000.00 | 0.85 | 1,024.30 | 0.87 |
* | Expenses are calculated using the annualized expense ratio for the six months ended December 31, 2020, multiplied by the average account value over the period, multiplied by 184 days in the period, divided by 366 days in the year, unless stated otherwise. The annualized expense ratio does not reflect expenses deducted under the variable life insurance or variable annuity contract through which the Funds are invested in. Inclusion of these expenses would increase the annualized expense ratios shown. |
213
[THIS PAGE INTENTIONALLY LEFT BLANK]
[THIS PAGE INTENTIONALLY LEFT BLANK]
Underwriter:
MML Distributors, LLC
1295 State Street
Springfield, Massachusetts
01111-0001

© 2021 Massachusetts Mutual Life Insurance Company (MassMutual®), Springfield,MA 01111-0001. All rights reserved. www.MassMutual.com. Investment Adviser: MML Investment Advisers, LLC | RS-50505-00 |
Item 2. Code of Ethics.
As of December 31, 2020, the Registrant adopted a Code of Ethics that applies to the Principal Executive Officer, Principal Financial Officer, and other senior financial officers pursuant to the Sarbanes-Oxley Act of 2002. For the year ended December 31, 2020, there were no reportable amendments to any provisions of the Code of Ethics and the Registrant did not grant any waivers, including implicit waivers, from any provisions of the Code of Ethics. A copy of its Code of Ethics is filed with this Form N-CSR under Item 13(a)(1).
Item 3. Audit Committee Financial Expert.
The Registrant’s Board of Trustees has determined that Susan B. Sweeney and Nabil N. El-Hage, both members of the Audit Committee, are audit committee financial experts as defined by the Securities and Exchange Commission (the “SEC”). Ms. Sweeney and Mr. El-Hage are both “independent” as defined by the SEC for purposes of audit committee financial expert determinations.
Item 4. Principal Accountant Fees and Services.
References below to Deloitte & Touche LLP include its affiliates where applicable.
| (a) | AUDIT FEES: The aggregate fees billed to the Registrant for professional services rendered by its independent auditors, Deloitte & Touche LLP, for the audit of the Registrant’s annual financial statements for the fiscal years ended 2020 and 2019 were $660,178 and $425,231, respectively. |
| (b) | AUDIT RELATED FEES: No such fees were billed to the Registrant by Deloitte & Touche LLP for the fiscal years ended 2020 and 2019. No such fees were billed to the Registrant’s adviser and any entity controlling, controlled by, or under common control with the adviser that provides ongoing services to the Registrant by Deloitte & Touche LLP* for the fiscal years ended 2020 and 2019. |
| (c) | TAX FEES: The aggregate fees billed to the Registrant for professional services rendered by Deloitte & Touche LLP for the review of Form 1120-RIC, Form 8613, excise distribution projections, distribution calculation and reasonable out of pocket expenses for the fiscal years ended 2020 and 2019 were $46,531 and $89,142, respectively. No such fees were billed to the Registrant’s adviser and any entity controlling, controlled by, or under common control with the adviser that provides ongoing services to the Registrant by Deloitte & Touche LLP* for the fiscal years ended 2020 and 2019. |
| (d) | ALL OTHER FEES: No such fees were billed to the Registrant by Deloitte & Touche LLP for the fiscal years ended 2020 and 2019. No such fees were billed to the Registrant’s adviser and any entity controlling, controlled by, or under common control with the adviser that provides ongoing services to the Registrant by Deloitte & Touche LLP* for the fiscal years ended 2020 and 2019. |
| (e) | (1) AUDIT COMMITTEE PRE-APPOVAL POLICY: All services to be performed for the Registrant by Deloitte & Touche LLP must be pre-approved by the audit committee. All services performed during the fiscal years ended 2020 and 2019 were pre-approved by the committee. |
| | | (2) Not applicable. |
| (g) | The aggregate non-audit fees billed by Deloitte & Touche LLP for services rendered to the Registrant, the Registrant’s adviser and any entity controlling, controlled by, or under common control with the adviser that provides ongoing services to the Registrant, for the fiscal years ended 2020 and 2019 were $342,808 and 1,977,093, respectively. |
| (h) | The audit committee considers whether the provision of non-audit services by Deloitte & Touche LLP to the Registrant's adviser and any entity controlling, controlled by, or under common control with the adviser that provides ongoing services to the Registrant that were not pre-approved pursuant to paragraph (c)(7)(ii) of Rule 2-01 of Regulation S-X is compatible with maintaining Deloitte & Touche LLP's independence. |
| * | Refers to fees that were required to be approved by the audit committee for services that relate directly to the operations and financial reporting of the Registrant. |
Item 5. Audit Committee of Listed Registrants.
Not applicable to this filing.
Item 6. Investments.
Please see portfolio of investments contained in the Reports to Stockholders included under Item 1 of this form N-CSR.
Item 7. Disclosure of Proxy Voting Policies and Procedures for Closed-End Management Investment Companies.
Not applicable to this filing.
Item 8. Portfolio Managers of Closed-End Management Investment Companies.
Not applicable to this filing.
Item 9. Purchases of Equity Securities by Closed-End Management Investment Company and Affiliated Purchasers.
Not applicable to this filing.
Item 10. Submission of Matters to a Vote of Security Holders.
Not applicable to this filing.
Item 11. Controls and Procedures.
(a) The Registrant’s Principal Executive Officer and Principal Financial Officer have concluded that the Registrant’s disclosure controls and procedures (as defined in Rule 30a-3(c) under the Investment Company Act of 1940, as amended (the “1940 Act”) (17 CFR 270.30a-3(c))) are effective, as of a date within 90 days of the filing date of this Form N-CSR, to provide reasonable assurance that the information required to be disclosed by the Registrant on Form N-CSR is recorded, processed, summarized, and reported within the time periods specified in the SEC’s rules and forms, based on their evaluation of these disclosure controls and procedures required by Rule 30a-3(b) under the 1940 Act (17 CFR 270.30a-3(b)) and Rules 13a-15(b) or 15d-15(b) under the Securities Exchange Act of 1934 (17 CFR 240.13a-15(b) or 240.15d-15(b)).
(b) There were no changes in the Registrant’s internal control over financial reporting (as defined in Rule 30a-3(d) under the 1940 Act (17 CFR 270.30a-3(d))) that occurred during the period covered by this report that has materially affected, or is reasonably likely to materially affect, the Registrant’s internal control over financial reporting.
Item 12. Disclosure of Securities Lending Activities for Closed-End Management Investment Companies
Not applicable to this filing.
Item 13. Exhibits.
(a)(1) Code of Ethics (Item 2) is attached.
(a)(2) Certifications of the Principal Executive Officer and Principal Financial Officer of the Registrant as required by Rule 30a-2(a) under the 1940 Act (17 CFR 270.30a-2(a)) are attached hereto as Exhibit 99CERT.
(a)(3) Not applicable to this filing.
(a)(4) Not applicable to this filing.
(b) Certifications pursuant to Section 906 of the Sarbanes-Oxley Act of 2002 as required by Rule 30a-2(b), under the 1940 Act (17 CFR 270.30a-2(b)), Rule 15d-14(b) under the Securities Exchange Act of 1934 (17 CFR 240.15d-14(b)) and Section 1350 of Chapter 63 of Title 18 of the United States Code (18 U.S.C. 1350) are attached hereto as Exhibit 99.906CERT.
SIGNATURES |
| Pursuant to the requirements of the Securities Exchange Act of 1934 and the Investment Company Act of 1940, the registrant has duly caused this report to be signed on its behalf by the undersigned, thereunto duly authorized. |
| (Registrant) | MML Series Investment Fund II | |
| | | |
| By (Signature and Title) | /s/ Paul LaPiana | |
| Paul LaPiana, President and Principal Executive Officer | |
| Date | 2/23/2021 | |
Pursuant to the requirements of the Securities Exchange Act of 1934 and the Investment Company Act of 1940, this report has been signed below by the following persons on behalf of the registrant and in the capacities and on the dates indicated.
| By (Signature and Title) | /s/ Paul LaPiana | |
| Paul LaPiana, President and Principal Executive Officer | |
| | | |
| Date | 2/23/2021 | |
| | | |
| By (Signature and Title) | /s/ Renee Hitchcock | |
| Renee Hitchcock, Treasurer and Principal Financial Officer | |
| | | |
| Date | 2/23/2021 | |