Exhibit (c)(5) *

Privileged and Confidential / Not to be Copied or Distributed
14 October 2010
PROJECT OSAKA - BOARD MATERIALS
Information presented may vary subject to legal advice
* Certain slides not materially related to the Rule 13e-3 transaction have been removed
5
Privileged and Confidential / Not to be Copied or Distributed
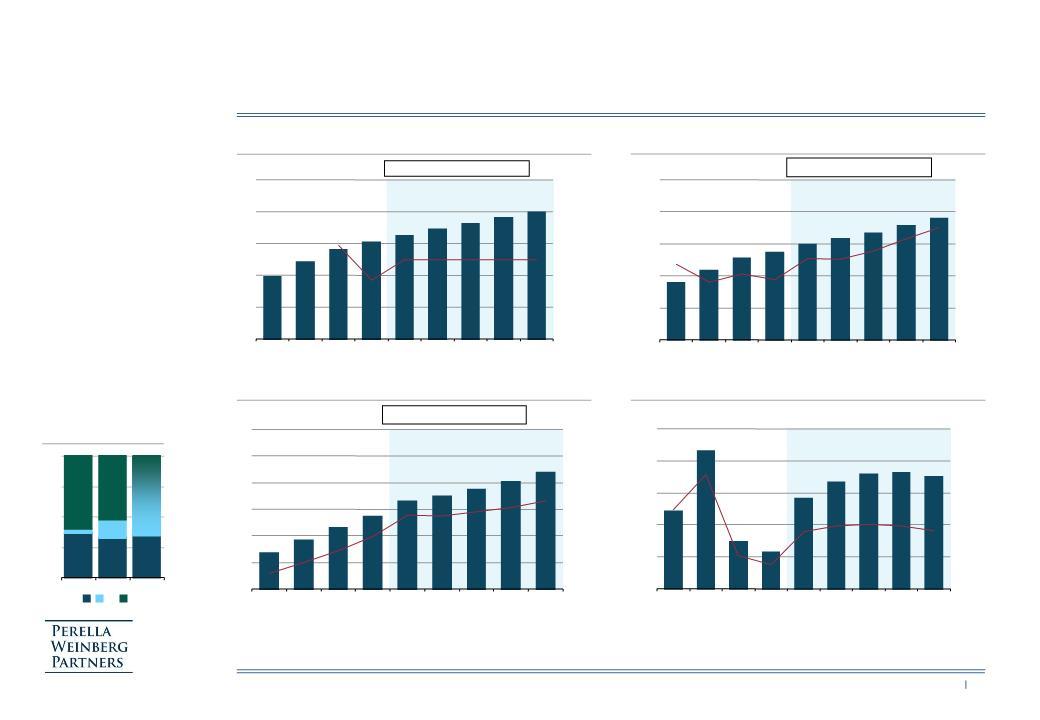
REVENUES
GROSS PROFIT
CAPITAL EXPENDITURE
EBITDA(2)
BASE CASE FINANCIALS (EXCL. SYNERGIES)
US$m
US$m
US$m
US$m
% Growth
% Revenues
% Revenues
% Revenues
Source: Shamrock filings, PWP analysis, FY 2009 financials pro forma adjusted for Australia and Thailand acquisitions
Note: (1) Organic revenue growth at constant FX rates; PwC analysis of organic revenue growth at constant FX rates for 2008 and 2009
(2) EBITDA on Non-GAAP basis but adjusted for stock option expenses (c. $0.5m per year)
– 5% organic growth consistent
with pro forma growth excl. FX
in 2008 (5.9%) and 2009
(3.7%), but at a discount to
growth observed in H1 2010
(8.5%) and to management
estimate for medium-term growth
(c. 9%)
with pro forma growth excl. FX
in 2008 (5.9%) and 2009
(3.7%), but at a discount to
growth observed in H1 2010
(8.5%) and to management
estimate for medium-term growth
(c. 9%)
– Margin developments in line
with management case
with management case
(1)
FX EXPOSURE 2010
CAGR 2010 - 2014: 5.2%
CAGR 2010 - 2014: 6.1%
CAGR 2010 - 2014: 7.3%
97
120
140
151
162
172
180
189
199
0
50
100
150
200
250
2006A
2007A
2008A
2009PF
2010E
2011E
2012E
2013E
2014E
0%
2%
4%
6%
8%
10%
53
65
76
81
89
94
100
106
113
0
30
60
90
120
150
2006A
2007A
2008A
2009PF
2010E
2011E
2012E
2013E
2014E
50%
52%
54%
56%
58%
60%
13.3
18.1
22.9
27.1
33.0
34.6
37.2
40.1
43.6
0
10
20
30
40
50
60
2006A
2007A
2008A
2009PF
2010E
2011E
2012E
2013E
2014E
12%
15%
18%
21%
24%
27%
30%
7.2
12.9
4.4
3.4
8.5
9.9
10.7
10.9
10.5
0
3
6
9
12
15
2006A
2007A
2008A
2009PF
2010B
2011E
2012E
2013E
2014E
0%
3%
6%
9%
12%
15%
37%
32%
34%
4%
16%
66%
60%
52%
0%
25%
50%
75%
100%
Sales
Opex
Capex
€
NIS
$/Other

6
Privileged and Confidential / Not to be Copied or Distributed
UPDATED VALUATION ANALYSIS (NET OF 2010 AGREED DIVIDEND)
Premium to current share price:
Sources: PWP analysis, Shamrock filings. All values net of agreed 2010 dividend of $0.8 per share.
Notes: (1) Enterprise value plus net cash ($16.8m), adjusted for 2010 dividend ($13.5m), less adjustments to net debt ($3.8m), less minorities ($10.5m; estimated by applying 11.0x EBIT multiple on 2010E
minority interest) plus associates ($1.3m) and less varying cost of buying out stock options (from $8.8m to $12.5m) . Based on 16.8m basic shares outstanding
minority interest) plus associates ($1.3m) and less varying cost of buying out stock options (from $8.8m to $12.5m) . Based on 16.8m basic shares outstanding
(2) Net of value attributed to the Definity® contract between Shamrock and Eric, representing $12.0m to $13.5m or $0.7 to $0.8 per share
(3) Base Case before adjustment for potential loss of Definity® contract; figures on Non-GAAP basis but adjusted for stock option expenses (c. $0.5m)
DCF range using
Eric WACC of 8.0%:
$18.3 - $21.2
Eric WACC of 8.0%:
$18.3 - $21.2
Dividend adjusted
current price: $10.09
current price: $10.09
Implied
(3)
(1),(2)
(2)
L3M
Trading Range
L3M trading (adjusted for 2010 dividend)
$7.10 - $10.11
129 - 179
2010E EV/EBITDA Comparable Multiples
8.0x - 9.0x
33.0
252 - 283
2010E EV/EBIT Multiples
11.0x - 12.0x
25.2
266 - 289
LFY EV/EBITDA transaction comparables
(LFY based on Dec-10 financials)
8.5x - 9.5x
33.0
268 - 300
LFY+1 EV/EBITDA transaction comparables
(LFY+1 based on Dec-11 financials)
8.0x - 9.0x
34.6
265 - 298
Discounted
Cash Flow
(2)
Based on 2011 - 2014 Base Case
Perpetuity growth methodology
1.5% - 2.5%
PGR
8.5% - 9.0%
WACC
272 - 334
Transaction
Valuation
(2)
Standalone
Market
Valuation
(2)
-50%
-25%
0%
25%
50%
75%
100%
125%
150%
15.7
14.7
14.9
14.0
7.1
19.3
16.5
16.6
16.0
15.7
10.1
14.7
Value Adjustment for Definity® Contract ($m)
Sales FY 2009
7.9
Assumed Gross Margin
22%
Estimated EBITDA impact
1.5
EBITDA Multiple Range
8.0x - 9.0x
Enterprise Value Range
12.0 - 13.5
Value Impact per Share ($)
0.7 - 0.8
7
Privileged and Confidential / Not to be Copied or Distributed
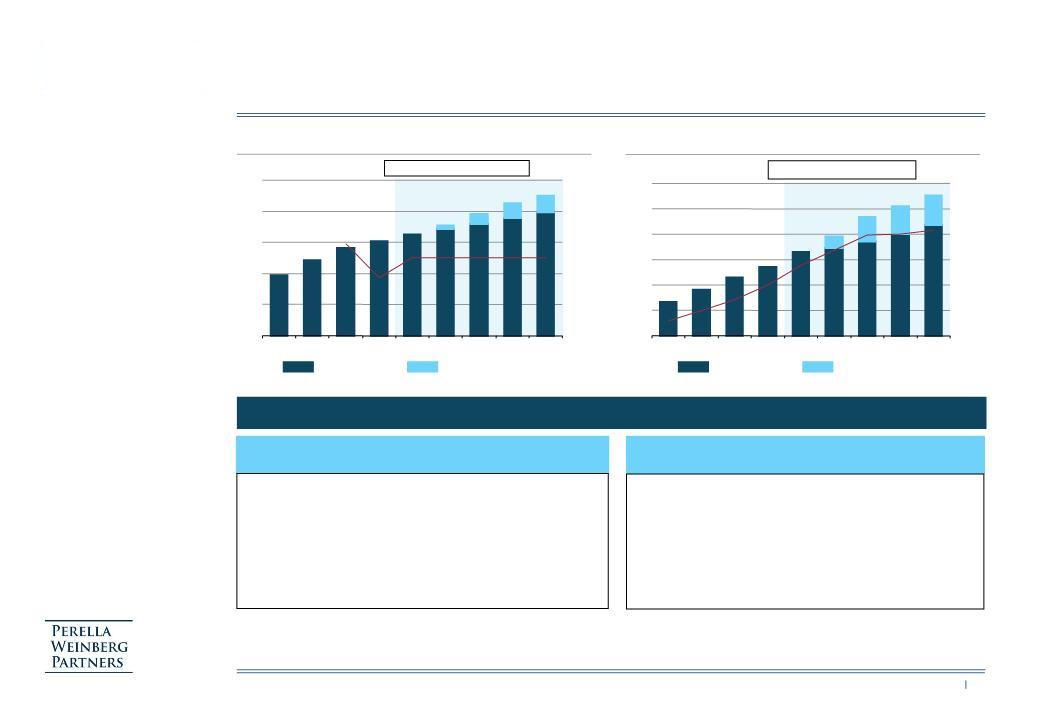
PRO FORMA SHAMROCK REVENUES
PRO FORMA SHAMROCK EBITDA(2)
PRELIMINARY ASSESSMENT OF POTENTIAL SYNERGIES
US$m
US$m
% Growth
% Revenues
Source: Shamrock filings, PWP analysis, FY 2009 financials pro forma adjusted for Australia and Thailand acquisitions
Note: (1) Organic revenue growth at constant FX rates; PwC analysis of organic revenue growth at constant FX rates for 2008 and 2009
(2) EBITDA on Non-GAAP basis but adjusted for stock option expenses (c. $0.5m per year)
(1)
CAGR 2010 - 2014: 8.5%
CAGR 2010 - 2014: 13.7%
Before synergies
Impact of synergies
Before synergies
Impact of synergies
Overview of Potential Synergies
Revenue Synergies
Cost Synergies
• Access to Eric distribution channels notably in the US
• Penetration of new markets (Asia, Central and Eastern
Europe)
Europe)
• Manufacturing subcontracting for Eric
• Increased sales through access to coating technology
(Crizal)
(Crizal)
• Reduction of raw materials costs (access to Eric’s
preferred terms)
preferred terms)
• Reduction in logistics costs
• Decrease in General & Administrative costs (delisting,
insurance)
insurance)
5
16
23
26
97
120
140
151
162
177
196
213
225
0
50
100
150
200
250
2006A
2007A
2008A
2009PF
2010E
2011E
2012E
2013E
2014E
0%
2%
4%
6%
8%
10%
4.3
9.5
10.9
11.4
13.3
18.1
22.9
27.1
33.0
38.9
46.7
51.1
55.0
0
10
20
30
40
50
60
2006A
2007A
2008A
2009PF
2010E
2011E
2012E
2013E
2014E
12%
15%
18%
21%
24%
27%
30%
8
Privileged and Confidential / Not to be Copied or Distributed
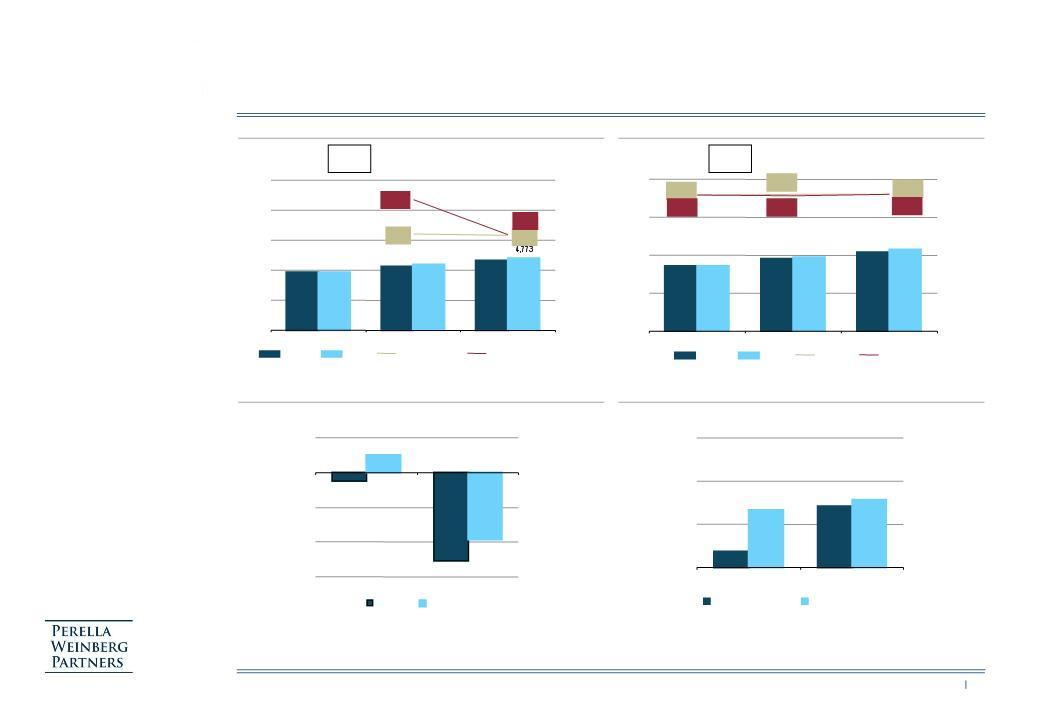
PRO FORMA IMPACT ON ERIC FINANCIAL PROFILE
Notes: (1) Shamrock financials converted to € at €/$1.35. Eric projections based on estimates from Jefferies 30-Aug10, UBS 27-Aug-10, Morgan Stanley 27-Aug-10 and Deutsche Bank 23-Aug10
(2) Contribution margin defined as operating profit before compensation costs of share-based payments, restructuring costs, other income and expense, and goodwill impairment. Corresponds to
Shamrock’s EBIT before stock option expense.
Shamrock’s EBIT before stock option expense.
(3) Based on an estimated net cash position for Shamrock of $12.8m at 31-Dec-10 plus payment of dividends for fiscal year 2011; Eric net debt projections excluding UBS forecasts
SALES EVOLUTION (1)
CONTRIBUTION MARGIN (1) (2)
€m
% Growth
€m
% Revenues
Standalone: 9.6%
Pro Forma: 11.3%
Pro Forma: 11.3%
Key Assumptions
– Assumed closing of
transaction 31-Dec-10
transaction 31-Dec-10
– Eric fully consolidates
Shamrock
Shamrock
– Purchase price financed
100% through debt
100% through debt
– Pre-tax interest rate on new
debt of 3%
debt of 3%
– Includes synergies net of
implementation costs
implementation costs
PPA
– Allocation to intangible
assets includes technology
($40.5m), brand ($15.8m)
and customer relationships
($7.2m)
assets includes technology
($40.5m), brand ($15.8m)
and customer relationships
($7.2m)
– Amortization periods:
technology 15 years, customer
relationships 12.5 years
technology 15 years, customer
relationships 12.5 years
– Revaluation of inventories of
$6.3m impacting 2011 gross
margin
$6.3m impacting 2011 gross
margin
– No amortization of brand
value and residual goodwill
value and residual goodwill
NET DEBT / (CASH)(3)
2011E - 2012E PRO FORMA EPS ACCRETION / DILUTION(1)
Transaction at $14.8 / share
CAGR
’10-‘12
’10-‘12
Standalone: 9.9%
Pro Forma: 11.5%
Pro Forma: 11.5%
CAGR
’10-‘12
’10-‘12
Transaction at $14.8 / share
3,855
4,628
3,855
4,226
4,357
9.5%
9.6%
9.5%
13.0%
0
2,000
4,000
6,000
8,000
10,000
2010
2011
2012
0%
3%
6%
9%
12%
15%
Standalone
Proforma
Standalone Growth
Proforma Growth
690
763
833
690
777
858
18.0%
18.0%
17.9%
18.0%
17.8%
17.9%
0
400
800
1,200
1,600
2010
2011
2012
0%
5%
10%
15%
20%
Standalone
Proforma
Standalone
Proforma
(25)
(254)
50
(194)
(300)
(200)
(100)
0
100
2011
2012
Standalone
Pro Forma
0.4%
1.4%
1.3%
1.6%
0%
1%
2%
3%
2011
2012
Incl. Amort. of Intangibles
Excl. Amort. of Intangibles
9
Privileged and Confidential / Not to be Copied or Distributed
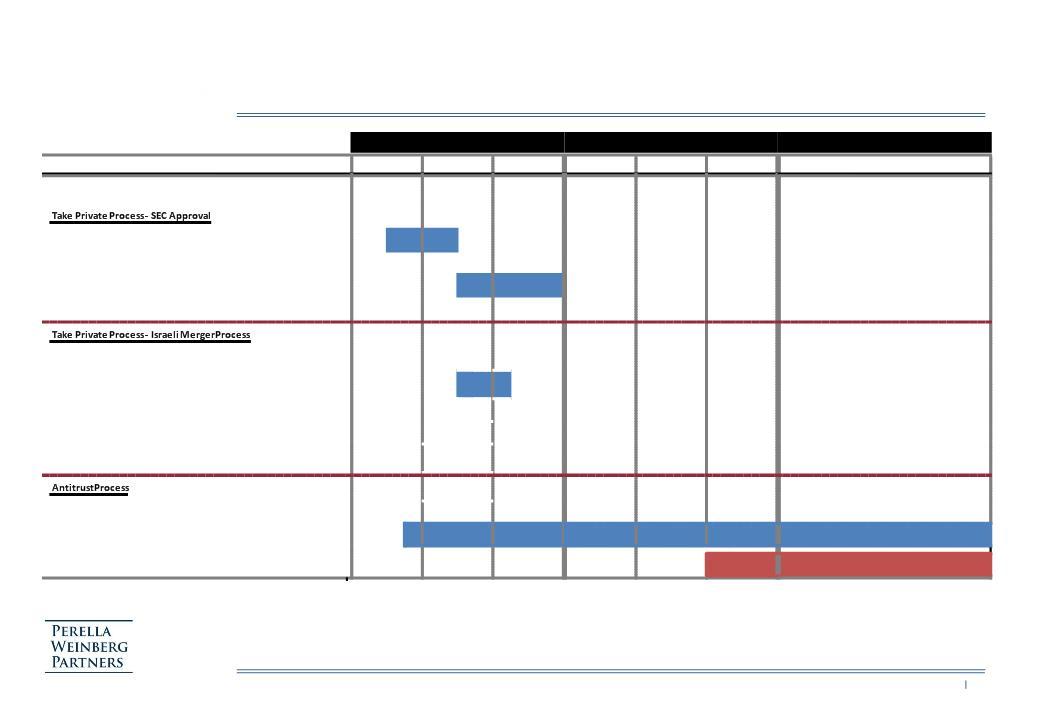
INDICATIVE TIMETABLE - KEY MILESTONES TO CLOSING
Q4 2010
Q1 2011
Q2 2011 - Q4 2011
Month
Oct
Nov
Dec
Jan
Feb
Mar
Transaction Announcement
(Subject to Shareholder Approval &
Antitrust Clearance)
Preparation of Proxy Statement
File Proxy Statement with SEC
SEC Review Period/ Incorporation of SEC Comments
SEC Approval of Proxy
u
Apply for Court Approval to Convene Shareholder Meeting
Court Reviews Merger Proposal & Authorizes Convening of
Shareholder Meeting
u
Convene Shareholder Meeting (Post SEC Approval)
u
Shareholder Meeting
Court Approval of Shareholder Meeting Resolution and
Merger Transaction (Subject to Antitrust Clearance)
u
Filing with Relevant Regulatory Authorities
u
Regulatory Review Process
Closing (Subject to Antitrust Clearance)
u
u
u
u

Privileged and Confidential / Not to be Copied or Distributed
APPENDIX
11
Privileged and Confidential / Not to be Copied or Distributed
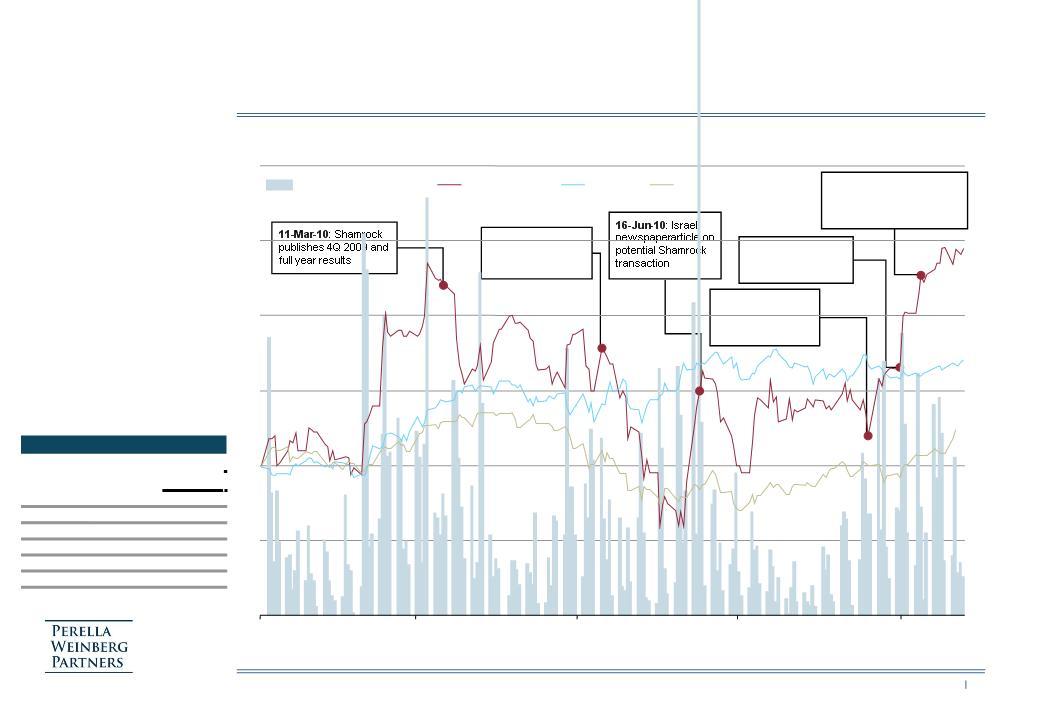
SHAMROCK YTD SHARE PRICE DEVELOPMENT
Source: Factset
US$
‘000s
08-Sep-10: Broker note
from CM-CIC on potential
Shamrock transaction
from CM-CIC on potential
Shamrock transaction
19-Aug-10:
Shamrock publishes
strong 1H 2010
results
Shamrock publishes
strong 1H 2010
results
10-May-10:
Shamrock publishes
1Q 2010 results
Shamrock publishes
1Q 2010 results
Rumours in the market have recently
supported the share price (up 26%
over the last 90 days)
supported the share price (up 26%
over the last 90 days)
31-Aug-10: Assumed
unaffected price
($9.33)
unaffected price
($9.33)
6
7
8
9
10
11
12
Jan-10
Mar-10
May-10
Jul-10
Sep-10
0
20
40
60
80
100
120
Shamrock Volume (RHS)
Shamrock (LHS)
Eric (LHS)
Tel Aviv 100 (LHS)
Shamrock Trading Statistics
Share
Performance
Last Week
(0.2%)
30 Days
18.4%
90 Days
26.0%
180 Days
19.1%
1 Year
59.0%
3 Years
(5.6%)