
ANNUAL REPORT
LIBERTY STREET
HORIZON FUND
April 30, 2009
TABLE OF CONTENTS
| | |
| |
A Message to Our Shareholders | | 1 |
| |
Performance Chart and Analysis | | 4 |
| |
Schedule of Investments | | 7 |
| |
Statement of Assets and Liabilities | | 11 |
| |
Statement of Operations | | 12 |
| |
Statements of Changes in Net Assets | | 13 |
| |
Financial Highlights | | 15 |
| |
Notes to Financial Statements | | 18 |
| |
Report of Independent Registered Public Accounting Firm | | 25 |
| |
Additional Information (Unaudited) | | 26 |
The views expressed is this report reflect those of the Liberty Street Horizon Fund’s (the “Fund”) Advisor as of the date this is written and may not reflect their views on the date this report is first published or anytime thereafter. These views are intended to assist shareholders in understanding the Fund’s investment methodology and do not constitute investment advice. This report may contain discussions about investments that may or may not be held by the Fund as of the date of this report. Holdings and allocations are subject to risks and to change.
The S&P 500 Index is a broad based unmanaged index representing the performance of 500 widely held common stocks. One cannot invest directly in an index.
There is no guarantee the Fund will achieve the investment objective. The Fund is non-diversified and may focus its investments in the securities of a comparatively small number of issuers. Investment in securities of a limited number of issuers exposes the Fund to greater market risk and potential monetary losses than if its assets were diversified among the securities of a greater number of issuers. The Fund may invest in small- and medium-sized companies, which involves greater risks than investing in larger, more established companies. The Fund may invest in foreign or emerging markets securities, which involve special risks, including the volatility of currency exchange rates and, in some cases limited geographic focus, political and economic instability, and relatively illiquid markets. The Fund may invest in debt securities, which are subject to interest rate risk. An increase in interest rates typically causes a fall in the value of debt securities in which the Fund may invest. The Fund may also invest in high yield, lower rated (junk) bonds, which involve a greater degree of risk and price fluctuation than investment grade bonds in return for higher yield potential. The Fund may also invest in derivatives, which can be volatile and involve various types and degrees of risk, depending upon the characteristics of a particular derivative. The Fund may purchase IPOs and distressed securities. IPOs have special risks as there may be a limited number of shares available, unseasoned trading, lack of investor knowledge of the company and a limited operating history. Distressed securities involve considerable risk and can result in substantial or even total loss on the Fund’s investment. These companies are more likely to become worth less than securities of more financially stable companies.
A MESSAGE TO OUR SHAREHOLDERS
Dear Fellow Shareholders:
We are pleased to present the Liberty Street Horizon Fund’s Annual Report for the period ending April 30th, 2009. The Liberty Street Horizon Fund (“the Fund”) had losses in the no-load, Institutional Class of -48.81% for the fiscal period ending April 30th, 2009. This can be compared to the total returns, including dividends and capital gains reinvested, of -35.31% for the Standard & Poor’s 500 Index ( “S&P 500”) over the same time period. The Fund’s most recent performance for calendar year 2009 as of April 30th is 2.58% vs. -2.49% for the S&P 500.
As to the reasons for the Fund’s underperformance, we certainly did not foresee the virtual collapse of the global financial system, the cessation of trading or price discovery in one of the largest and most liquid debt markets in the world; nor the attendant collapse of valuations across equities, bonds, bank loans and commodities. We did not anticipate valuations contracting to the degree that, in many cases, were never before witnessed. This past year, the Fund’s performance was substantially worse than the S&P 500, which undid much of the benefit of some historical outperformance by the Fund during part of the previous year.
There is another aspect of performance to which we pay attention: the business results of the companies whose shares we hold. By and large, these have performed, within the context of the economic environments in which they operate, quite well. This is one reason why we have not engaged in large-scale trading activity. It is our practice to not trade often, to make use of the equity yield curve, and await the results of value creation at the companies we hold. This past year actually saw more activity in the Fund than is typical. Additions to the portfolio, which numbered about 30, included Philip Morris International, Inc., Time Warner, Inc., The Walt Disney Co., Carnival Corp., MasterCard, Inc., (which is not a lender but, rather, a debt-free transaction processor), Burlington Northern Santa Fe Corp., and Anglo American PLC. These replaced companies such as the custodian bank Bank of New York/Mellon Corp., the speciality auto insurer Progressive Corp., and the unfortunate one-position size aggregate investment in the investment banks. As to the latter position, it was not responsible for the underperformance of the Fund this past year. Rather, our most favored sectors, which we continue to hold and purchase for new investments, such as the financial exchanges and the investments in China, had the greatest impact upon the portfolio.
The new positions, we continue to believe, are quite fine companies, with varying business profiles. Some, such as MasterCard, Inc., have historically been very profitable and we believe them to be more so. Others, such as Burlington Northern Santa Fe Corp., appear profitable but with lower than industry-average margins that we anticipate will expand significantly over time. Others, such as Anglo American PLC, were repurchasing large quantities of their own shares at discounted valuations in order to accelerate earnings growth. In most cases, the valuations at which they were purchased were at multi-year, even one-decade, lows. This did not prevent the share prices from dropping further.
We are now witness to the combination of the lowest valuations likely to be seen in our lifetimes, the most massive U.S. Central Bank intervention in history, and historically low interest rates. It is a powerful combination for a revaluation of depressed security prices. If the world’s central banks are determined to achieve a narrowing of credit spreads as a condition for a resumption of normal capital
1
A MESSAGE TO OUR SHAREHOLDERS
markets activity, and if it is more or less a coordinated effort, without any historical precedent, it is probably unwise to have an investment posture at variance to their declared intention to restore order. In our opinion, in time, credit spreads will narrow, the market will advance, and, given this rate of balance sheet expansion, it will probably not take a very long time. At the moment, we believe there now exists classic value opportunities that are only made possible because of this historic period in which the investment public’s demand for liquidity is greater than its demand for investment opportunities.
Despite the newspaper headlines, the economy has hardly come to a halt. Despite a level of home sales so low as to be below replacement levels, much less accommodate population growth, there are nevertheless 4.5 million homes being sold at the recent annual rate. That is a great deal of economic activity. However, it is insufficient. As of March 2009, the number of new single family homes being built on a seasonally adjusted basis, whether by reference to building permits or housing starts, is below 400,000; actual completions in March 2009 were 550,000. Yet, if there are roughly 70 million single family homes in the U.S., and if one makes the generous allowance that a home will last for 100 years before falling prey to storm or fire damage, ordinary decay, seizure under eminent domain, and so forth, then 700,000 homes must be built per year merely for replacement. The rate of home sales should eventually be much higher.
As for the banking system, as of April 1st, 2009, the aggregate assets of the nation’s commercial banks are 8.6% higher than in March 2008, and balance sheet equity is 7.3% higher. That is certainly surprising information, contrary to anything read by followers of financial media. If some banks fail, the deposits and loans do not disappear; they redound to the benefit of stronger banks that will thereupon expand more rapidly.
The financial ecosystem is active. It is not remarked upon much nowadays, but most companies have earnings. Accordingly, if they cannot borrow, they will eventually reduce their debt via cash flow, expand their businesses, and/or repurchase shares. Those that cannot will restructure or fail. In the latter case, stronger companies will inherit their competitors’ contracts and operating assets. What cannot happen, though, is that prices contract inexorably against rising economic value. Nor has China collapsed. Sales of automobiles in China reached an all-time record in March 2009, 5% higher than a year earlier. Residential property sales in China during the first quarter 2009 were 8.2% higher than last year, although the price index was 1.3% lower. There is of course, a wealth of negative statistics, but that is less the point than the financial ecosystem being far more complex and dynamic than the one-dimensional face presented by the financial media.
So, in our opinion, the operative question is not whether the recession will end but when. That being the case, we still wish to be invested in businesses that produce a reasonable return on capital. There is a difference now, however. Most of the time, the share prices of such companies will trade in some range modestly above or below their fair value, so that under normal circumstances, in order to achieve a successful investment outcome one requires a successful business outcome or successful operational outcome. Yet, once in a very long while, let us say once a generation, shares trade at great extremes above or below fair value. Our opinion is that this is one of those times. The opportunity now
2
A MESSAGE TO OUR SHAREHOLDERS
is not the probability of a successful outcome, which is what investors and analysts ordinarily try to gauge. Rather, the current opportunity is the extreme discount rate. Because the negative outlook embodied in share prices is so extreme, one does not require an “extremely successful” business-specific outcome to do extraordinarily well. In our opinion, the severe valuation contraction experienced over the past year will be looked back upon as one of the greatest investment opportunities in generations.
We value your continued trust and confidence in the Fund, and thank you for your support.
Liberty Street Horizon Fund
3
LIBERTY STREET HORIZON FUND
PERFORMANCE CHART AND ANALYSIS
APRIL 30, 2009
The graph and table reflect the change in value of a hypothetical $10,000 investment in the Liberty Street Horizon Fund, (the “Fund”) A shares and C Shares and the change in value of hypothetical $1,000,000 investment in the Liberty Street Horizon Fund Institutional Shares, including reinvestment of dividends and distributions, compared with a broad-based securities market index, since inception. The Standard and Poor’s 500 Index (the “Index”) is a market weighted index composed of 500 large capitalization companies and reflects the reinvestment of dividends. The total return of the Fund includes operating expenses that reduce returns, while the total return of the Index does not include expenses. The Fund is professionally managed while the Index is unmanaged and is not available for investment.
Past performance is not predictive of, nor a guarantee of future results. Results of an investment made today may differ substantially from the Fund’s historical performance. Investment return and principal value will fluctuate so that an investor’s shares, when redeemed, may be worth more or less than their original cost. As stated in the current prospectus, the Fund’s annual operating expense ratio (gross) for A Shares, C Shares and Institutional Shares are 3.64%, 4.18% and 2.59%, respectively. However, the Fund’s Adviser has agreed to contractually waive fees and/or reimburse expenses such that total operating expenses do not exceed 1.50%, 2.00% and 1.25%, respectively, through at least, August 31, 2009. During the period, certain fees were waived and/or expenses reimbursed; otherwise, returns would have been lower. Shares redeemed or exchanged within 90 days of purchase will be charged a 1.00% redemption fee, subject to limited exceptions. The performance table and graph do not reflect the deduction of taxes that a shareholder would pay on Fund distributions or the redemption of Fund shares. For the most recent month end performance, please call (800) 207-7108.
4
LIBERTY STREET HORIZON FUND
PERFORMANCE CHART AND ANALYSIS
APRIL 30, 2009
| | | | | |
Average Annual Total Return as of 4/30/09 | | One Year | | Since Inception
5/4/2007 | |
Liberty Street Horizon Fund — A Shares (w/sales charge) | | (51.24)% | | (32.38 | )% |
Liberty Street Horizon Fund — C Shares (w/sales charge)* | | (49.47)% | | (31.14 | )% |
Liberty Street Horizon Fund — Institutional Shares* | | (48.81)% | | (30.74 | )% |
S&P 500 Index | | (35.31)% | | (22.18 | )% |
A Shares & C Shares vs. S&P 500 Index — Hypothetical $10,000 Investment
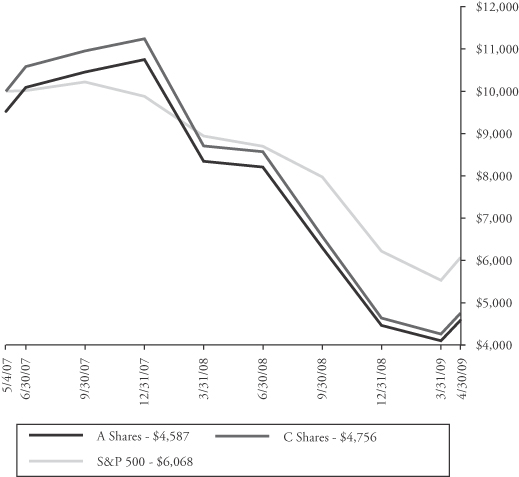
| * | Performance data quoted represents past performance and is no guarantee of future results. C Shares and Institutional Shares commenced operations on May 24, 2007 and July 11, 2007, respectively. The performance for C Shares and Institutional Shares prior to May 24, 2007 and July 11, 2007, respectively, is that of the A Shares as adjusted for the expenses applicable to C Shares and Institutional Shares. |
5
LIBERTY STREET HORIZON FUND
PERFORMANCE CHART AND ANALYSIS
APRIL 30, 2009
Institutional Shares vs. S&P 500 Index — Hypothetical $1,000,000 Investment
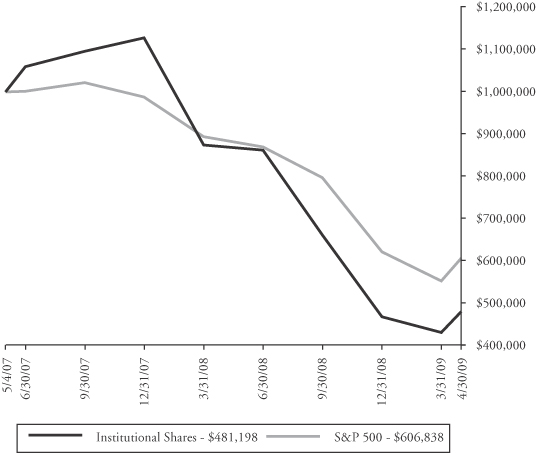
Performance data quoted represents past performance and is no guarantee of future results.
6
LIBERTY STREET HORIZON FUND
SCHEDULE OF INVESTMENTS
APRIL 30, 2009
| | | | | |
| Shares | | Security
Description | | Value |
Common Stock — 90.2% | | | |
Banks — 6.7% | | | |
| 9,100 | | Bank of Japan(a) | | $ | 5,545,630 |
| 22,614 | | ICICI Bank, Ltd., ADR | | | 466,527 |
| | | | | |
| | | | | 6,012,157 |
| | | | | |
| |
Commercial Services — 1.9% | | | |
| 49,991 | | Quanta Services, Inc.(a) | | | 1,136,295 |
| 18,730 | | Time Warner Cable, Inc. | | | 603,668 |
| | | | | |
| | | | | 1,739,963 |
| | | | | |
| |
Communications — 1.4% | | | |
| 108,597 | | China Unicom Hong Kong, Ltd., ADR | | | 1,256,467 |
| 125,100 | | RH Donnelley Corp.(a) | | | 16,889 |
| | | | | |
| | | | | 1,273,356 |
| | | | | |
| |
Consumer Discretionary — 8.7% | | | |
| 73,680 | | Carnival Corp. | | | 1,980,518 |
| 7,500 | | Mastercard, Inc., Class A | | | 1,375,875 |
| 64,172 | | Philip Morris International, Inc. | | | 2,323,026 |
| 20,703 | | Sears Holdings Corp.(a) | | | 1,293,316 |
| 76,037 | | Sotheby’s | | | 882,790 |
| | | | | |
| | | | | 7,855,525 |
| | | | | |
|
Diversified Financial Operations — 2.6% |
| 30,996 | | Icahn Enterprises, LP | | | 904,463 |
| 65,359 | | Leucadia National Corp. | | | 1,387,572 |
| | | | | |
| | | | | 2,292,035 |
| | | | | |
|
Energy — 13.3% |
| 59,319 | | Allegheny Energy, Inc. | | | 1,537,549 |
| 10,208 | | CNOOC, Ltd., ADR | | | 1,136,661 |
| | | | | |
| Shares | | Security
Description | | Value |
Energy (continued) |
| 101,270 | | El Paso Corp. | | $ | 698,763 |
| 54,012 | | EnCana Corp. | | | 2,469,969 |
| 52,786 | | Gazprom OAO, ADR | | | 932,993 |
| 80,260 | | Imperial Oil, Ltd. | | | 2,858,861 |
| 101,175 | | Penn West Energy Trust | | | 1,109,890 |
| 23,566 | | Texas Pacific Land Trust | | | 636,282 |
| 419,598 | | UTS Energy Corp.(a) | | | 522,687 |
| | | | | |
| | | | | 11,903,655 |
| | | | | |
| |
Exchanges — 12.0% | | | |
| 7,317 | | CME Group, Inc. | | | 1,619,618 |
| 140,000 | | Hong Kong Exchanges and Clearing, Ltd. | | | 1,620,360 |
| 18,426 | | IntercontinentalExchange, Inc.(a) | | | 1,614,118 |
| 190,020 | | London Stock Exchange Group, PLC | | | 2,108,987 |
| 101,263 | | Nasdaq OMX Group, Inc.(a) | | | 1,947,288 |
| 57,584 | | NYSE Euronext | | | 1,334,221 |
| 134,000 | | Singapore Exchange, Ltd. | | | 567,497 |
| | | | | |
| | | | | 10,812,089 |
| | | | | |
|
Finance — Capital Markets — 2.3% |
| 157,000 | | ICAP, PLC | | | 857,489 |
| 44,880 | | TMX Group, Inc. | | | 1,212,187 |
| | | | | |
| | | | | 2,069,676 |
| | | | | |
|
Finance — Mortgage Loan/Banker — 0.2% |
| 50,340 | | Federal National Mortgage Association | | | 39,265 |
See Notes to Financial Statements.
7
LIBERTY STREET HORIZON FUND
SCHEDULE OF INVESTMENTS
APRIL 30, 2009
| | | | | |
| Shares | | Security
Description | | Value |
Finance — Mortgage Loan/Banker (continued) |
| 133,800 | | Freddie Mac | | $ | 105,702 |
| | | | | |
| | | | | 144,967 |
| | | | | |
| |
Healthcare — 1.2% | | | |
| 19,550 | | Genzyme Corp.(a) | | | 1,042,602 |
| | | | | |
| |
Industrials — 6.0% | | | |
| 1,182,000 | | Beijing Capital International Airport Co., Ltd., Class H | | | 752,826 |
| 236,300 | | Bombardier, Inc., Class B | | | 751,800 |
| 34,149 | | Burlington Northern Santa Fe Corp. | | | 2,304,375 |
| 32,550 | | Union Pacific Corp. | | | 1,599,507 |
| | | | | |
| | | | | 5,408,508 |
| | | | | |
| |
Insurance — 6.8% | | | |
| 874 | | Berkshire Hathaway, Inc., Class B(a) | | | 2,678,810 |
| 26,581 | | China Life Insurance Co., Ltd., ADR | | | 1,407,464 |
| 74,110 | | MBIA, Inc.(a) | | | 350,540 |
| 90,797 | | Power Corp. of Canada | | | 1,704,975 |
| | | | | |
| | | | | 6,141,789 |
| | | | | |
|
Investment Management/Adviser — 3.8% |
| 143,689 | | Blackstone Group, LP | | | 1,406,715 |
| 37,400 | | Cohen & Steers, Inc. | | | 550,528 |
| 65,712 | | Legg Mason, Inc. | | | 1,318,840 |
| 471,000 | | Value Partners Group, Ltd. | | | 142,818 |
| | | | | |
| | | | | 3,418,901 |
| | | | | |
| | | | | |
| Shares | | Security
Description | | Value |
Materials — 4.8% | | | |
| 133,420 | | Anglo American PLC, ADR | | $ | 1,436,933 |
| 5,650 | | BHP Billiton, Ltd., ADR | | | 271,991 |
| 115,380 | | Franco-Nevada Corp. | | | 2,465,700 |
| 1,005 | | Rio Tinto PLC, ADR | | | 163,765 |
| | | | | |
| | | | | 4,338,389 |
| | | | | |
| |
Multimedia — 3.0% | | | |
| 50,028 | | The Walt Disney Co. | | | 1,095,613 |
| 74,621 | | Time Warner, Inc. | | | 1,628,976 |
| | | | | |
| | | | | 2,724,589 |
| | | | | |
| |
Real Estate — 8.9% | | | |
| 177,086 | | Brookfield Asset Management Inc., Class A | | | 2,750,146 |
| 34,700 | | Forest City Enterprises, Class A | | | 292,521 |
| 340,000 | | Henderson Land Development Co., Ltd. | | | 1,564,000 |
| 703,700 | | Link REIT | | | 1,372,887 |
| 21,939 | | The St. Joe Co.(a) | | | 545,842 |
| 13,500 | | Vornado Realty Trust | | | 660,015 |
| 253,000 | | Wharf Holdings, Ltd. | | | 822,250 |
| | | | | |
| | | | | 8,007,661 |
| | | | | |
| |
Utilities — 6.6% | | | |
| 496,711 | | Dynegy, Inc., Class A(a) | | | 884,146 |
| 25,023 | | Huaneng Power International, Inc., ADR | | | 681,376 |
| 86,310 | | Mirant Corp.(a) | | | 1,098,726 |
| 107,757 | | NRG Energy, Inc.(a) | | | 1,937,471 |
See Notes to Financial Statements.
8
LIBERTY STREET HORIZON FUND
SCHEDULE OF INVESTMENTS
APRIL 30, 2009
| | | | | |
| Shares | | Security
Description | | Value |
Utilities (continued) | | | |
| 264,262 | | RRI Energy, Inc.(a) | | $ | 1,310,740 |
| | | | | |
| | | | | 5,912,459 |
| | | | | |
Total Common Stock
(Cost $118,750,035) | | | 81,098,321 |
| | | | | |
| |
Exchange Traded Funds — 0.7% | | | |
| 29,800 | | Market Vectors-Gaming ETF
(Cost $523,106) | | | 605,536 |
| | | | | |
Total Investments — 90.9%
(Cost $119,273,141)* | | $ | 81,703,857 |
Other Assets & Liabilities, Net — 9.1% | | | 8,177,573 |
| | | | | |
NET ASSETS — 100.0% | | $ | 89,881,430 |
| | | | | |
| (a) | Non-income producing security |
| ADR | American Depositary Receipt |
| PLC | Public Limited Company |
| REIT | Real Estate Investment Trust |
| * | Cost of investments for Federal income tax purposes is $120,471,392 and net unrealized appreciation (depreciation) consists of: |
| | | | |
| Gross Unrealized Appreciation | | $ | 5,396,175 | |
| Gross Unrealized Depreciation | | | (44,163,710 | ) |
| | | | |
| Net Unrealized Appreciation (Depreciation) | | $ | (38,767,535 | ) |
| | | | |
The following is a summary of the inputs used to value the Fund’s investments as of April 30, 2009.
The inputs or methodology used for valuing securities are not necessarily an indication of the risk associated with investing in those securities. For more information on valuation inputs, and their aggregation into the levels used in the tables below, please refer to Note 2-Security Valuation section in the accompanying Notes to Financial Statements.
| | | | | | | |
Valuation
Inputs | | Investments in
Securities | | Other Financial
Instruments** | |
Level 1–Quoted Prices | | $ | 81,703,857 | | $ | (66 | ) |
Level 2–Other Significant Observable Inputs | | | — | | | — | |
Level 3–Significant Unobservable Inputs | | | — | | | — | |
| | | | | | | |
Total Investments | | $ | 81,703,857 | | $ | (66 | ) |
| | | | | | | |
| ** | Other Financial Instruments are derivative instruments not reflected in the Schedule of Investments, such as forward foreign currency contracts, which are valued at the unrealized appreciation (depreciation) of the instrument. |
See Notes to Financial Statements.
9
LIBERTY STREET HORIZON FUND
SCHEDULE OF INVESTMENTS
APRIL 30, 2009
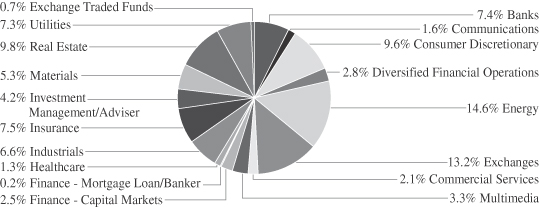
PORTFOLIO HOLDINGS (Unaudited)
% of Total Investments
See Notes to Financial Statements.
10
LIBERTY STREET HORIZON FUND
STATEMENT OF ASSETS AND LIABILITIES
APRIL 30, 2009
| | | | |
ASSETS | | | | |
Total investments, at value (Cost $119,273,141) | | $ | 81,703,857 | |
Cash | | | 9,329,417 | |
Foreign currency (Cost $207,816) | | | 209,712 | |
Receivables: | | | | |
Fund shares sold | | | 132,745 | |
Dividends and interest | | | 79,475 | |
Prepaid expenses | | | 20,254 | |
| | | | |
Total Assets | | | 91,475,460 | |
| | | | |
LIABILITIES | | | | |
Unrealized loss on forward foreign currency contracts | | | 66 | |
Payables: | | | | |
Fund shares redeemed | | | 2,624 | |
Investment securities purchased | | | 1,483,085 | |
Accrued Liabilities: | | | | |
Investment adviser fees | | | 36,544 | |
Trustees’ fees and expenses | | | 78 | |
Fund service fees | | | 21,667 | |
Professional fees | | | 20,855 | |
Compliance services fees | | | 2,083 | |
Other | | | 27,028 | |
| | | | |
Total Liabilities | | | 1,594,030 | |
| | | | |
NET ASSETS | | $ | 89,881,430 | |
| | | | |
COMPONENTS OF NET ASSETS | | | | |
Paid-in capital | | $ | 136,800,505 | |
Accumulated undistributed (distributions in excess of) net investment income | | | (132,865 | ) |
Accumulated net realized gain (loss) on investments and foreign currency transactions | | | (9,219,007 | ) |
Net unrealized appreciation (depreciation) on investments and foreign currency translations | | | (37,567,203 | ) |
| | | | |
NET ASSETS | | $ | 89,881,430 | |
| | | | |
SHARES OF BENEFICIAL INTEREST AT $0.00 PAR VALUE (UNLIMITED SHARES AUTHORIZED) | | | | |
A Shares | | | 4,038,556 | |
C Shares | | | 2,117,741 | |
Institutional Shares | | | 12,660,307 | |
NET ASSET VALUE, OFFERING AND REDEMPTION PRICE PER SHARE | | | | |
A Shares (based on net assets of $19,383,588) | | $ | 4.80 | |
| | | | |
A Shares Maximum Public Offering Price Per Share
(net asset value per share / 95.25%) | | $ | 5.04 | |
| | | | |
C Shares (based on net assets of $10,063,814) | | $ | 4.75 | |
| | | | |
Institutional Shares (based on net assets of $60,434,028) | | $ | 4.77 | |
| | | | |
See Notes to Financial Statements.
11
LIBERTY STREET HORIZON FUND
STATEMENT OF OPERATIONS
YEAR ENDED APRIL 30, 2009
| | | | |
INVESTMENT INCOME | | | | |
Dividend income (net of foreign withholding taxes of $79,063) | | $ | 1,346,791 | |
Interest income | | | 28,639 | |
| | | | |
Total Investment Income | | | 1,375,430 | |
| | | | |
EXPENSES | | | | |
Investment adviser fees | | | 702,332 | |
Fund service fees | | | 267,238 | |
Custody fees | | | 20,760 | |
Registration fees | | | 64,099 | |
Compliance services fees | | | 38,690 | |
Professional fees | | | 53,488 | |
Distribution fees: | | | | |
A Shares | | | 47,436 | |
C Shares | | | 73,971 | |
Trustees’ fees and expenses | | | 2,656 | |
Reporting expenses | | | 20,977 | |
Miscellaneous expenses | | | 14,419 | |
| | | | |
Total Expenses | | | 1,306,066 | |
| | | | |
Fees waived and expenses reimbursed | | | (305,285 | ) |
| | | | |
Net Expenses | | | 1,000,781 | |
| | | | |
NET INVESTMENT INCOME (LOSS) | | | 374,649 | |
| | | | |
NET REALIZED AND UNREALIZED GAIN (LOSS) ON INVESTMENTS AND FOREIGN CURRENCY TRANSACTIONS | | | | |
Realized Gain (Loss) on: | | | | |
Investments | | | (9,311,017 | ) |
Foreign currency transactions | | | (21,730 | ) |
| | | | |
Net Realized Gain (Loss) on Investments and Foreign Currency Transactions | | | (9,332,747 | ) |
| | | | |
Change in Unrealized Appreciation (Depreciation) on: | | | | |
Investments | | | (30,976,252 | ) |
Foreign currency translations | | | 2,081 | |
| | | | |
Net Change in Unrealized Appreciation (Depreciation) on Investments and Foreign Currency Translations | | | (30,974,171 | ) |
| | | | |
NET REALIZED AND UNREALIZED GAIN (LOSS) ON INVESTMENTS AND FOREIGN CURRENCY TRANSACTIONS | | | (40,306,918 | ) |
| | | | |
INCREASE (DECREASE) IN NET ASSETS FROM OPERATIONS | | $ | (39,932,269 | ) |
| | | | |
See Notes to Financial Statements.
12
LIBERTY STREET HORIZON FUND
STATEMENTS OF CHANGES IN NET ASSETS
| | | | | | | | |
| | | Year Ended
April 30, 2009 | | | May 4, 2007 (a)
to
April 30, 2008 | |
OPERATIONS | | | | | | | | |
Net investment income (loss) | | $ | 374,649 | | | $ | 92,695 | |
Net realized gain (loss) on investments and foreign currency transactions | | | (9,332,747 | ) | | | (53,851 | ) |
Net change in unrealized appreciation (depreciation) on investments and foreign currency transactions | | | (30,974,171 | ) | | | (6,593,032 | ) |
| | | | | | | | |
Increase (Decrease) in Net Assets from Operations | | | (39,932,269 | ) | | | (6,554,188 | ) |
| | | | | | | | |
DISTRIBUTIONS TO SHAREHOLDERS FROM | | | | | | | | |
Net investment income: | | | | | | | | |
A Shares | | | (29,486 | ) | | | (19,246 | ) |
C Shares | | | — | | | | (12,084 | ) |
Institutional Shares | | | (322,627 | ) | | | (49,466 | ) |
| | | | | | | | |
Net Decrease in Net Assets from Distributions | | | (352,113 | ) | | | (80,796 | ) |
| | | | | | | | |
CAPITAL SHARE TRANSACTIONS | | | | | | | | |
Sale of shares | | | | | | | | |
A Shares | | | 21,796,911 | | | | 20,167,304 | |
C Shares | | | 9,118,790 | | | | 13,495,806 | |
Institutional Shares | | | 73,756,539 | | | | 37,575,050 | |
Reinvestment of distributions: | | | | | | | | |
A Shares | | | 28,649 | | | | 19,232 | |
C Shares | | | — | | | | 12,003 | |
Institutional Shares | | | 318,102 | | | | 49,353 | |
Redemption of shares: | | | | | | | | |
A Shares | | | (6,311,969 | ) | | | (717,183 | ) |
C Shares | | | (4,074,363 | ) | | | (536,361 | ) |
Institutional Shares | | | (25,403,790 | ) | | | (2,570,341 | ) |
Redemption fees | | | | | | | | |
A Shares | | | 5,177 | | | | 2,485 | |
C Shares | | | 3,193 | | | | 4,208 | |
Institutional Shares | | | 53,504 | | | | 8,497 | |
| | | | | | | | |
Increase (Decrease) from Capital Transactions | | | 69,290,743 | | | | 67,510,053 | |
| | | | | | | | |
Increase (Decrease) in Net Assets | | | 29,006,361 | | | | 60,875,069 | |
| | | | | | | | |
NET ASSETS | | | | | | | | |
Beginning of period | | | 60,875,069 | | | | — | |
| | | | | | | | |
End of period (b) | | $ | 89,881,430 | | | $ | 60,875,069 | |
| | | | | | | | |
See Notes to Financial Statements.
13
LIBERTY STREET HORIZON FUND
STATEMENTS OF CHANGES IN NET ASSETS
| | | | | | | | |
| | | Year Ended
April 30, 2009 | | | May 4, 2007 (a)
to
April 30, 2008 | |
SHARE TRANSACTIONS | | | | | | | | |
Sale of shares: | | | | | | | | |
A Shares | | | 3,264,814 | | | | 1,933,849 | |
C Shares | | | 1,614,888 | | | | 1,291,228 | |
Institutional Shares | | | 13,939,649 | | | | 3,663,370 | |
Reinvestment of distributions | | | | | | | | |
A Shares | | | 6,122 | | | | 1,706 | |
C Shares | | | — | | | | 1,069 | |
Institutional Shares | | | 68,409 | | | | 4,391 | |
Redemption of shares: | | | — | | | | | |
A Shares | | | (1,097,257 | ) | | | (70,679 | ) |
C Shares | | | (737,870 | ) | | | (51,573 | ) |
Institutional Shares | | | (4,741,580 | ) | | | (273,932 | ) |
| | | | | | | | |
Increase (Decrease) in Shares | | | 12,317,175 | | | | 6,499,429 | |
| | | | | | | | |
(a) Commencement of operations (b) Includes accumulated undistributed (distributions in excess of) net investment income of: | | $ | (132,865 | ) | | $ | 12,686 | |
| | | | | | | | |
See Notes to Financial Statements.
14
LIBERTY STREET HORIZON FUND
FINANCIAL HIGHLIGHTS
These financial highlights reflect selected data for a share outstanding throughout each period.
| | | | | | | | |
| | | Year
Ended
April 30, 2009 | | | May 4, 2007 (a)
through
April 30, 2008 | |
A SHARES | | | | | | | | |
NET ASSET VALUE, Beginning of Period | | $ | 9.39 | | | $ | 10.00 | |
| | | | | | | | |
INVESTMENT OPERATIONS | | | | | | | | |
Net investment income (loss) (b) | | | 0.03 | | | | 0.05 | |
Net realized and unrealized gain (loss) | | | (4.61 | ) | | | (0.64 | ) |
| | | | | | | | |
Total from Investment Operations | | | (4.58 | ) | | | (0.59 | ) |
| | | | | | | | |
DISTRIBUTIONS TO SHAREHOLDERS FROM | | | | | | | | |
Net Investment Income | | | (0.01 | ) | | | (0.02 | ) |
| | | | | | | | |
REDEMPTION FEES (b) | | | — | (g) | | | — | (g) |
| | | | | | | | |
NET ASSET VALUE, End of Period | | $ | 4.80 | | | $ | 9.39 | |
| | | | | | | | |
TOTAL RETURN (d) | | | (48.80 | )% | | | (5.94 | )%(c) |
RATIOS/SUPPLEMENTARY DATA | | | | | | | | |
Net Assets at End of Period (000’s omitted) | | $ | 19,384 | | | $ | 17,506 | |
Ratios to Average Net Assets: | | | | | | | | |
Net investment income (loss) | | | 0.49 | % | | | 0.48 | %(e) |
Net expense | | | 1.50 | % | | | 1.50 | %(e) |
Gross expense (f) | | | 1.91 | % | | | 3.64 | %(e) |
PORTFOLIO TURNOVER RATE | | | 21 | % | | | 29 | %(c) |
See Notes to Financial Statements.
15
LIBERTY STREET HORIZON FUND
FINANCIAL HIGHLIGHTS
| | | | | | | | |
| | | Year
Ended
April 30, 2009 | | | May 24, 2007 (a)
through
April 30, 2008 | |
C SHARES | | | | | | | | |
NET ASSET VALUE, Beginning of Period | | $ | 9.33 | | | $ | 10.05 | |
| | | | | | | | |
INVESTMENT OPERATIONS | | | | | | | | |
Net investment income (loss) (b) | | | 0.00 | (g) | | | 0.00 | (g) |
Net realized and unrealized gain (loss) | | | (4.58 | ) | | | (0.71 | ) |
| | | | | | | | |
Total from Investment Operations | | | (4.58 | ) | | | (0.71 | ) |
| | | | | | | | |
DISTRIBUTIONS TO SHAREHOLDERS FROM | | | | | | | | |
Net Investment Income | | | — | | | | (0.02 | ) |
| | | | | | | | |
REDEMPTION FEES (b) | | | — | (g) | | | 0.01 | |
| | | | | | | | |
NET ASSET VALUE, End of Period | | $ | 4.75 | | | $ | 9.33 | |
| | | | | | | | |
TOTAL RETURN | | | (49.09 | )% | | | (7.02 | )%(c) |
RATIOS/SUPPLEMENTARY DATA | | | | | | | | |
Net Assets at End of Period (000’s omitted) | | $ | 10,064 | | | $ | 11,580 | |
Ratios to Average Net Assets: | | | | | | | | |
Net investment income (loss) | | | (0.03 | )% | | | (0.05 | )%(e) |
Net expense | | | 2.00 | % | | | 2.00 | %(e) |
Gross expense (f) | | | 2.50 | % | | | 4.19 | %(e) |
PORTFOLIO TURNOVER RATE | | | 21 | % | | | 29 | %(c) |
See Notes to Financial Statements.
16
LIBERTY STREET HORIZON FUND
FINANCIAL HIGHLIGHTS
| | | | | | | | |
| | | Year
Ended
April 30, 2009 | | | July 11, 2007 (a)
through
April 30, 2008 | |
INSTITUTIONAL SHARES | | | | | | | | |
NET ASSET VALUE, Beginning of Period | | $ | 9.37 | | | $ | 10.79 | |
| | | | | | | | |
INVESTMENT OPERATIONS | | | | | | | | |
Net investment income (loss) (b) | | | 0.04 | | | | 0.05 | |
Net realized and unrealized gain (loss) | | | (4.62 | ) | | | (1.44 | ) |
| | | | | | | | |
Total from Investment Operations | | | (4.58 | ) | | | (1.39 | ) |
| | | | | | | | |
DISTRIBUTIONS TO SHAREHOLDERS FROM | | | | | | | | |
Net Investment Income | | | (0.03 | ) | | | (0.04 | ) |
| | | | | | | | |
REDEMPTION FEES (b) | | | 0.01 | | | | 0.01 | |
| | | | | | | | |
NET ASSET VALUE, End of Period | | $ | 4.77 | | | $ | 9.37 | |
| | | | | | | | |
TOTAL RETURN | | | (48.81 | )% | | | (12.88 | )%(c) |
RATIOS/SUPPLEMENTARY DATA | | | | | | | | |
Net Assets at End of Period (000’s omitted) | | $ | 60,434 | | | $ | 31,788 | |
Ratios to Average Net Assets: | | | | | | | | |
Net investment income (loss) | | | 0.68 | % | | | 0.68 | %(e) |
Net expense | | | 1.25 | % | | | 1.25 | %(e) |
Gross expense (f) | | | 1.68 | % | | | 2.59 | %(e) |
PORTFOLIO TURNOVER RATE | | | 21 | % | | | 29 | %(c) |
| (a) | Commencement of operations. |
| (b) | Calculated based on average shares outstanding during the period. |
| (d) | Total return excludes the effect of the applicable sales load. |
| (f) | Reflects the expense ratio excluding any waivers and/or reimbursements. |
See Notes to Financial Statements.
17
LIBERTY STREET HORIZON FUND
NOTES TO FINANCIAL STATEMENTS
APRIL 30, 2009
Note 1. Organization
The Liberty Street Horizon Fund (the “Fund”) is a non-diversified portfolio of Forum Funds (the “Trust”). The Trust is a Delaware statutory trust that is registered as an open-end, management investment company under the Investment Company Act of 1940 (the “Act”), as amended. As of April 30, 2009, the Trust had twenty-eight investment portfolios. Under its Trust Instrument, the Trust is authorized to issue an unlimited number of the Fund’s shares of beneficial interest without par value. The Fund currently offers three classes of shares: A Shares, C Shares, and Institutional Shares. A Shares commenced operations on May 4, 2007. C Shares commenced operations on May 24, 2007. Institutional Shares commenced operations on July 11, 2007. The Fund seeks to achieve long-term growth of capital.
Note 2. Summary of Significant Accounting Policies
These financial statements are prepared in accordance with accounting principles generally accepted in the United States of America (“generally accepted accounting principles”), which require management to make estimates and assumptions that affect the reported amounts of assets and liabilities, the disclosure of contingent liabilities at the date of the financial statements, and the reported amounts of increase and decrease in net assets from operations during the fiscal period. Actual amounts could differ from those estimates. The following summarizes the significant accounting policies of the Fund:
Security Valuation–Exchange traded securities and over-the-counter securities are valued using the last quoted sale or official closing price, provided by independent pricing services as of the close of trading on the market or exchange for which they are primarily traded, on each Fund business day. In the absence of a sale, such securities are valued at the mean of the last bid and asked price. Non-exchange traded securities for which quotations are available are valued using the last quoted sales price, or in the absence of a sale at the mean of the last bid and asked prices provided by independent pricing services. Debt securities may be valued at prices supplied by a Fund’s pricing agent based on broker or dealer supplied valuations or matrix pricing, a method of valuing securities by reference to the value of other securities with similar characteristics such as rating, interest rate and maturity. Shares of open-end mutual funds are valued at net asset value. Short-term investments that mature in sixty days or less may be valued at amortized cost.
The Fund values its investments at fair value pursuant to procedures adopted by the Trust’s Board of Trustees (the “Board”) if (1) market quotations are insufficient or not readily available or (2) the adviser believes that the values available are unreliable. Fair valuation is based on subjective factors and as a result, the fair value price of an investment may differ from the security’s market price and may not be the price at which the asset may be sold. Fair valuation could result in a different net asset value (“NAV”) than a NAV determined by using market quotes.
The Fund has a three-tier fair value hierarchy. The basis of the tiers is dependent upon the various “inputs” used to determine the value of the Fund’s investments. These inputs are summarized in the three broad levels listed below:
18
LIBERTY STREET HORIZON FUND
NOTES TO FINANCIAL STATEMENTS
APRIL 30, 2009
Level 1–quoted prices in active markets for identical assets
Level 2–other significant observable inputs (including quoted prices of similar securities, interest rates, prepayment speeds, credit risk, etc.)
Level 3–significant unobservable inputs (including the Fund’s own assumptions in determining the fair value of investments)
The aggregate value by input level, as of April 30, 2009, for the Fund’s investments is included at the end of the Fund’s Schedule of Investments.
Security Transactions, Investment Income and Realized Gain and Loss–Investment transactions are accounted for on trade date. Dividend income is recorded on the ex-dividend date. Foreign dividend income is recorded on the ex-dividend date or as soon as practical after the Fund determines the existence of a dividend declaration after exercising reasonable due diligence. Income and capital gains on some foreign securities may be subject to foreign withholding taxes, which are accrued as applicable. Interest income is recorded on an accrual basis. Premium and discount is amortized and accreted in accordance with generally accepted accounting principles. Identified cost of investments sold is used to determine the gain and loss for both financial statement and Federal income tax purposes. The Fund estimates components of distribution from real estate investment trusts (“REITs”). Distributions received in excess of income are recorded as a reduction of the cost of the related investments.
Foreign Currency–Foreign currency amounts are translated into US dollars as follows: (i) assets and liabilities at the rate of exchange at the end of the respective period; and (ii) purchases and sales of securities and income and expenses at the rate of exchange prevailing on the dates of such transactions. The portion of the results of operations arising from changes in the exchange rates and the portion due to fluctuations arising from changes in the market prices of securities are not isolated. Such fluctuations are included with the net realized and unrealized gain or loss on investments.
The Fund may enter into transactions to purchase or sell foreign currencies to protect the U.S. dollar value of its underlying portfolio securities against the effect of possible adverse movements in foreign exchange rates. Principal risks associated with such transactions include the movement in value of the foreign currency relative to the U.S. dollar and the ability of the counterparty to perform. Fluctuations in the value of such forward currency transactions are recorded daily as unrealized gain or loss; realized gain or loss includes net gain or loss on transactions that have terminated by settlement or by the Fund entering into offsetting commitments. These instruments involve market risk, credit risk, or both kinds of risks, in excess of the amount recognized in the Statement of Assets and Liabilities. Risks arise from the possible inability of counterparties to meet the terms of their contracts and from movement in currency and securities values and interest rates.
Distributions to Shareholders–Distributions to shareholders of net investment income and net capital gains, if any, are declared and paid at least annually. Distributions are based on amounts calculated in accordance with applicable Federal income tax regulations, which may differ from generally accepted accounting principles. These differences are due primarily to differing treatments of income and gain
19
LIBERTY STREET HORIZON FUND
NOTES TO FINANCIAL STATEMENTS
APRIL 30, 2009
on various investment securities held by the Fund, timing differences and differing characterizations of distributions made by the Fund.
Federal Taxes–The Fund intends to qualify each year as a regulated investment company under Subchapter M of the Internal Revenue Code and distribute all its taxable income. In addition, by distributing in each calendar year substantially all its net investment income and capital gains, if any, the Fund will not be subject to a Federal excise tax. Therefore, no Federal income or excise tax provision is required.
As of April 30, 2009, there are no uncertain tax positions that would require financial statement recognition, de-recognition, or disclosure. The Fund’s Federal tax returns filed in the two-year period ended April 30, 2009, remain subject to examination by the Internal Revenue Service.
Income and Expense Allocation–The Trust accounts separately for the assets, liabilities and operations of each of its investment portfolios. Expenses that are directly attributable to more than one investment portfolio are allocated among the respective investment portfolios in an equitable manner.
The Fund currently offers Class A, Class C and Institutional Shares. Class C shares and Institutional Shares are offered at net asset value. Class A Shares are offered at net asset value plus a maximum sales charge of 4.75%. Class A Shares are subject to a contingent deferred sales charge (“CDSC”) of 1.00% on purchases of $1 million or more on all fund shares liquidated in whole or in part within 12 months of purchase. Class C Shares are subject to a CDSC of 0.75% on purchases of fund shares liquidated in whole or in part within 12 months of purchase. Each class represents an interest in the same assets of the Fund and classes are identical except for differences in their sales charge structures and ongoing service and distribution charges. All classes of shares have equal voting privileges except that each class has exclusive voting rights with respect to its service and/or distribution plans.
The Fund’s class specific expenses are charged to the operations of that class of shares. Income and expenses (other than expenses attributable to a specific class), and realized and unrealized gains or losses on investments are allocated to each class of shares based on the class’ respective net assets to the total net assets of the Fund.
Redemption Fees–A shareholder who redeems shares within 90 days of purchase will incur a redemption fee of 1.00% of the current net asset value of shares redeemed or exchanged, subject to certain limitations. The fee is charged for the benefit of the remaining shareholders and will be paid to the Fund to help offset transaction costs. The fee is accounted for as an addition to paid-in capital. The Fund reserves the right to modify the terms at any time. There are limited exceptions to the imposition of the redemption fee.
Commitments and Contingencies–In the normal course of business, the Fund enters into contracts that provide general indemnifications by the Fund to the counterparty to the contract. The Fund’s maximum exposure under these arrangements is dependent on future claims that may be made against the Fund and, therefore, cannot be estimated; however, based on experience, the risk of loss from such claims is considered remote.
20
LIBERTY STREET HORIZON FUND
NOTES TO FINANCIAL STATEMENTS
APRIL 30, 2009
New Accounting Pronouncements–In March 2008, Statement of Financial Accounting Standards No. 161, Disclosures about Derivative Instruments and Hedging Activities (“SFAS 161”), was issued and is effective for financial statements issued for fiscal years and interim periods beginning after November 15, 2008. SFAS 161 requires enhanced disclosures about the Fund’s use of and accounting for derivative instruments and the effect of derivative instruments on the Fund’s results of operations and financial position. At this time, management does not believe the adoption of SFAS 161 will impact the financial statement amounts; however, additional disclosures may be required about the use of derivative instruments and hedging items.
Note 3. Advisory Fees, Servicing Fees and Other Transactions
Investment Adviser–Liberty Street Advisors, Inc., (the “Adviser”) is the investment adviser to the Fund. Pursuant to an investment advisory agreement, the Adviser receives an advisory fee from the Fund at an annual rate of 1.00% of the Fund’s average daily net assets.
The sub-advisory fee, calculated as a percentage of the Fund’s average daily net assets, is paid by the Adviser.
Distribution–Foreside Fund Services, LLC serves as the Fund’s distributor (the “Distributor”). The Distributor is not affiliated with the Adviser or with Atlantic Fund Administration, LLC (“Atlantic”) or their affiliates. The Fund has adopted a distribution plan for A and C Shares of the Fund in accordance with Rule 12b-1 of the Act. The Fund pays the Distributor and any other entity as authorized by the Board an aggregate fee equal to 0.25% of the average daily net assets of A Shares of the Fund and an aggregate fee equal to 0.75% of the average daily net assets of C Shares of the Fund.
For the period ended April 30, 2009, the Distributor did not receive any of the front-end sales charges assessed on the sale of A Shares. The Distributor did not retain any commissions from contingent deferred sales charges assessed on purchases of $1 million or more of A Shares or C Shares that were liquidated in whole or in part within one year of purchase.
Other Service Providers–As of June 2, 2008, as to fund accounting and fund administration, and on June 16, 2008, as to transfer agency, Atlantic provides those services to the Fund. Pursuant to an Atlantic services agreement, the Fund pays Atlantic a bundled fee for administration, fund accounting and transfer agency services at an annual rate of: 0.12% on the first $150 million in Fund assets, 0.075% on the next $150 million in Fund assets, 0.05% on the next $300 million in Fund assets, 0.03% on the next $400 million in Fund assets and 0.02% on Fund assets exceeding $1 billion. The base fee is subject to an annual minimum. The fee is accrued daily by the Fund and is paid monthly based on the average net assets, transactions and positions for the previous month. The Fund’s transfer agent and fund accountant also receive certain shareholder account fees, surcharges and out-of-pocket expenses.
Atlantic provides a Principal Executive Officer, Principal Financial Officer, Chief Compliance Officer, and an Anti-Money Laundering Officer to the Fund, as well as certain additional compliance support functions.
21
LIBERTY STREET HORIZON FUND
NOTES TO FINANCIAL STATEMENTS
APRIL 30, 2009
For the period May 1, 2008 through June 1, 2008, as to fund accounting and fund administration and through June 15, 2008, as to transfer agency, Citigroup Fund Services, LLC provided these services to the Fund.
For the period May 1, 2008 through June 1, 2008, Foreside Compliance Services, LLC (“FCS”), an affiliate of the Distributor, provided a Principal Executive Officer, Principal Financial Officer, Chief Compliance Officer, and Anti-Money Laundering Officer as well as certain additional compliance support functions to the Fund. FCS had no role in determining the investment policies of, or the securities to be purchased or sold by the Trust or the Fund. Certain officers or employees of FCS were also officers of the Trust. The Principal Executive Officer was an affiliate of the Distributor due to his ownership interest in the Distributor.
Trustees and Officers–The Trust pays each independent Trustee an annual retainer fee of $16,000 for service to the Trust ($20,000 for the chairman), plus $1,500 for each regular Board meeting attended ($2,500 for the chairman), $500 for each short special Board meeting attended ($750 for the chairman) and $1,500 for each major special Board meeting attended ($2,250 for the chairman). In addition, a $3,000 annual stipend will be paid to each Trustee that serves as Chairman of one or more Board Committees. The amount of Trustees’ fees attributable to the Fund is disclosed in the Statement of Operations. Certain officers of the Trust are also officers or employees of the above named service providers, and during their terms of office received no compensation from the Fund.
Note 4. Expense Reimbursements and Fees Waived
The Adviser has contractually agreed to waive a portion of its fees and reimburse certain expenses to limit total annual operating expenses (excluding all interest, taxes, portfolio transaction expenses, dividends on short sales and extraordinary expenses) to 1.50% for A Shares, 2.00% for C Shares and 1.25% for Institutional Shares for each of the class’ average daily net assets through September 1, 2009. Other fund service providers have voluntarily agreed to waive a portion of their fees. Voluntary fee waivers may be reduced or eliminated at any time. For the year ended April 30, 2009, fees waived and reimbursed were as follows:
| | | | | | |
Investment Adviser Fees
Waived | | Fund Service Fees
Waived | | Investment Adviser Reimbursed | | Total Fees Waived and
Reimbursed |
$263,698 | | $3,437 | | $38,150 | | $305,285 |
Note 5. Security Transactions
The cost of purchases and proceeds from sales of investment securities (including maturities), other than short-term investments for the period ended April 30, 2009, were $77,181,743 and $13,701,806, respectively.
22
LIBERTY STREET HORIZON FUND
NOTES TO FINANCIAL STATEMENTS
APRIL 30, 2009
Note 6. Currency Contracts
| | | | | | | | |
Contract to
Purchase | | Settlement Date | | Settlement Value | | Market Value at
04/30/09 | | Net Unrealized
Appreciation
(Depreciation) |
534,967 HKD | | 05/05/09 | | $69,096 | | $69,030 | | $(66) |
Note 7. Federal Income Tax and Investment Transactions
Distributions during the fiscal periods ended as noted were characterized for tax purposes as follows:
| | | | | | |
| | | 2009 | | 2008 |
Ordinary Income | | $ | 352,113 | | $ | 80,796 |
As of April 30, 2009, distributable earnings (accumulated loss) on a tax basis were as follows:
| | | | |
Undistributed Ordinary Income | | $ | 883,885 | |
Unrealized Appreciation (Depreciation) on Investments and Foreign Currency Translations | | | (38,765,454 | ) |
Capital and Other Losses | | | (9,037,506 | ) |
| | | | |
Total | | $ | (46,919,075 | ) |
| | | | |
The difference between components of distributable earnings on a tax basis and the amounts reflected in the Statement of Assets and Liabilities are primarily due to post October losses, capital loss carryover and PFIC mark to market.
For tax purposes, the current year post-October loss was $3,620,632. This loss will be recognized for tax purposes on the first business day of the Fund’s next year.
As of April 30, 2009, the Fund has capital loss carryover to offset future capital gains of $1,062 and $5,415,812 expiring in 2016 and 2017, respectively.
On the Statement of Assets and Liabilities, as a result of permanent book to tax differences, certain amounts have been reclassified for the year ended April 30, 2009. The following reclassification was the result of currency losses, partnership distribution and K-1 reclassifications, and has no impact on the net assets of the Fund.
| | | | |
Accumulated Net Investment Income (Loss) | | $ | (168,087 | ) |
Undistributed Net Realized Gain (Loss) | | | 168,087 | |
Note 8. Change in Independent Registered Public Accounting Firm
The Board, with the approval and recommendation of the Audit Committee, selected Briggs, Bunting & Dougherty, LLP (“BBD”) to replace Deloitte & Touche, LLP (“D&T”), as the Fund’s independent registered public accounting firm for the Fund’s fiscal year ending April 30, 2009. D&T resigned
23
LIBERTY STREET HORIZON FUND
NOTES TO FINANCIAL STATEMENTS
APRIL 30, 2009
subsequent to the Board’s approval of BBD. Throughout D&T’s tenure, including the Fund’s two most recent fiscal periods, the Fund had no disagreements with D&T on any matter of accounting principles or practices, financial statement disclosure or auditing scope or procedures, and there were no reportable events of the kind described in Item 304(a)(1)(v) of Regulation S-K under the Securities Exchange Act of 1934. With respect to the Fund, D&T’s audit opinions, including the past two fiscal periods, have not contained either an adverse opinion or disclaimer of opinion, nor were they qualified or modified as to uncertainty, audit scope or accounting principles. Further, there were no disagreements between the Fund and D&T on accounting principles, financial statement disclosure or audit scope, which, if not resolved to the satisfaction of D&T would have caused D&T to make reference to the disagreement in a D&T report. During the last two fiscal years of the Fund, neither the Fund nor anyone on its behalf has consulted BBD on items concerning the application of accounting principles to a specified transaction (either completed or proposed) or the type of audit opinion that might be rendered on the Fund’s financial statements, or concerning the subject of a disagreement of the kind described in Item 304(a)(1)(iv) of Regulation S-K or reportable events of the kind described in Item 304(a)(1)(v) of Regulation S-K.
24
REPORT OF INDEPENDENT REGISTERED PUBLIC ACCOUNTING FIRM
To the Board of Trustees of Forum Funds and the Shareholders of Liberty Street Horizon Fund
We have audited the accompanying statement of assets and liabilities of the Liberty Street Horizon Fund, a series of shares of beneficial interest in the Forum Funds, including the schedule of investments, as of April 30, 2009, and the related statement of operations, the statement of changes in net assets and the financial highlights for the year then ended. These financial statements and financial highlights are the responsibility of the Fund’s management. Our responsibility is to express an opinion on these financial statements and financial highlights based on our audit. The statement of changes in net assets and the financial highlights for the period May 4, 2007 (commencement of operations) through April 30, 2008 were audited by other auditors whose report dated June 24, 2008, expressed an unqualified opinion on such financial statement and financial highlights.
We conducted our audit in accordance with the standards of the Public Company Accounting Oversight Board (United States). Those standards require that we plan and perform the audit to obtain reasonable assurance about whether the financial statements and financial highlights are free of material misstatement. An audit includes examining, on a test basis, evidence supporting the amounts and disclosures in the financial statements. Our procedures included confirmation of securities owned as of April 30, 2009 by correspondence with the custodian and brokers. An audit also includes assessing the accounting principles used and significant estimates made by management, as well as evaluating the overall financial statement presentation. We believe that our audit provides a reasonable basis for our opinion.
In our opinion, the financial statements and financial highlights referred to above present fairly, in all material respects, the financial position of the Liberty Street Horizon Fund as of April 30, 2009, and the results of its operations, the changes in its net assets and its financial highlights for the year then ended, in conformity with accounting principles generally accepted in the United States of America.

BRIGGS, BUNTING & DOUGHERTY, LLP
Philadelphia, Pennsylvania
June 25, 2009
25
LIBERTY STREET HORIZON FUND
ADDITIONAL INFORMATION (Unaudited)
APRIL 30, 2009
Investment Advisory Agreement Approval
At the April 14, 2009, Board meeting, the Board of Trustees (“Board”), including the Independent Trustees, considered the renewal of the investment advisory agreement pertaining to the Fund (the “Advisory Agreement”). In evaluating the Advisory Agreement for the Fund, the Board reviewed materials furnished by the Adviser and Atlantic, including information regarding the Adviser, its personnel, operations and financial condition. Specifically, the Board considered, among other matters: (1) the nature, extent and quality of the services to be provided to the Fund by the Adviser, including information on the investment performance of the Adviser; (2) the costs of the services to be provided and profitability to the Adviser with respect to its relationship with the Fund; (3) the advisory fee and total expense ratio of the Fund compared to relevant peer groups of funds; (4) the extent to which economies of scale would be realized as the Fund grows and whether the advisory fee would enable the Fund’s investors to share in the benefits of economies of scale; and (5) other benefits received by the Adviser from its relationship with the Fund. In their deliberations, the Board did not identify any particular information that was all-important or controlling and attributed different weights to the various factors. In particular, the Board focused on the factors discussed below.
Nature, Extent and Quality of the Services
The Board received a presentation from senior representatives of the Adviser and the Sub-adviser, and discussed the Adviser’s and Sub-adviser’s personnel, operations and financial condition. Specifically, the Board considered the quality of services provided by the Adviser and Sub-adviser under the Advisory and Sub-Advisory Agreements. In this regard, the Board considered information regarding the experience, qualifications and professional background of the portfolio managers and other personnel who have principal investment responsibility for the Fund’s investments; the investment philosophy and decision-making processes of those professionals; the capability and integrity of the Adviser’s and Sub-adviser’s senior management and staff; the quality of the Adviser’s and Sub-adviser’s services with respect to regulatory compliance and compliance with client investment policies and restrictions; and the financial condition and operational stability of the Adviser and Sub-adviser.
The Board also considered the adequacy of the Adviser’s and Sub-adviser’s resources. The Board noted the Adviser’s and Sub-adviser’s representations that they were financially stable and able to provide investment advisory and sub-advisory services, respectively, to the Fund.
The Board concluded that, overall, it was satisfied with the nature, extent and quality of services to be provided to the Fund under the Advisory and Sub-advisory Agreements.
Costs of Services and Profitability
The Board considered information provided by the Adviser and Sub-adviser regarding the costs of services and its profitability with respect to the Fund. Among other things, the Board also considered the Adviser’s and Sub-Adviser’s resources devoted to the Fund. In addition, the Board considered that the Adviser has contractually limited and continues to contractually limit certain advisory expenses for
26
LIBERTY STREET HORIZON FUND
ADDITIONAL INFORMATION (Unaudited)
APRIL 30, 2009
the Institutional, A and C share classes through August 31, 2009. The Board concluded that the level of the Adviser’s profits attributable to management of the Fund were not excessive in light of the services provided by the Adviser on behalf of the Fund.
Performance
In connection with a presentation by the Adviser regarding its approach to managing the Fund, the Board considered the Fund’s performance. The Board noted the Fund’s performance including that the Fund had underperformed its benchmark, the S&P 500, for the six month-, one-year and since inception (annualized) periods ended March 31, 2009. Noting the difficult market faced by the Fund over the last year, the Board concluded that the Fund’s performance was acceptable.
Compensation
The Board considered the Adviser’s compensation for providing advisory services to the Fund. The Board also considered comparative information on fees and total expenses of mutual funds in the relevant Lipper Inc. peer group. The Board noted that the Adviser’s actual advisory fee rate was lower than the median advisory fee rate for funds in its Lipper Inc. peer group. The Board also noted that the Fund’s actual total expense ratio was lower than the median total expense ratio for its Lipper Inc. peer group. The Adviser noted that since inception of the Fund, it and the Sub-Adviser have waived management fees and absorbed certain fees and expenses in connection with the expense limitation agreement with the Fund. In light of these factors, the Board concluded that the advisory fee charged to the Fund was reasonable under the circumstances.
Economies of Scale
The Board considered whether the Fund would benefit from any economies of scale. In this respect, the Board noted the Adviser’s representation that the Adviser did not expect an influx of assets that would necessitate the implementation of breakpoints. In this context, the Board concluded, based on all of the facts considered, that it would not be necessary to implement breakpoints at this time.
Other Benefits
The Board noted the Adviser’s representation that it does not receive significant ancillary benefits as a result of its relationship with the Fund, other than name recognition from providing advisory services to the Fund and other intangible benefits resulting from a potential long-term relationship with the Fund. The Adviser acknowledged, however, that its affiliated broker-dealer may derive benefits from marketing shares of the Fund and receiving Rule 12b-1 fees in connection with the distribution and services of such shares. The Board concluded that the Adviser’s receipt of ancillary benefits as a result of its relationship with the Fund was not a material consideration under all of the present facts and circumstances.
The Board reviewed a memorandum from Fund Counsel discussing the legal standards applicable to its consideration of the advisory agreements. Based on its review, including consideration of each of
27
LIBERTY STREET HORIZON FUND
ADDITIONAL INFORMATION (Unaudited)
APRIL 30, 2009
the factors referenced above, the Board determined, in the exercise of its business judgment, that the advisory arrangement, as outlined in the advisory agreements, was fair and reasonable in light of the services performed, expenses incurred and such other matters as the Board considered relevant in the exercise of its reasonable business judgment.
Proxy Voting Information
A description of the policies and procedures that the Fund uses to determine how to vote proxies relating to securities held in the Fund’s portfolio is available, without charge and upon request, by calling (800) 207-7108, on the SEC’s website at www.sec.gov and on the Fund’s website at www.libertysreetfunds.com. The Fund’s proxy voting records for the most recent twelve-month period ended June 30, is available, without charge and upon request, by calling (800) 207-7108, on the SEC’s website at www.sec.gov and on the Fund’s website at www.libertystreetfunds.com.
Availability of Quarterly Portfolio Schedules
The Fund files its complete schedule of portfolio holdings with the SEC for the first and third quarters of each fiscal year on Form N-Q. The Fund’s Forms N-Q are available, without charge and upon request on the SEC’s website at www.sec.gov or may be reviewed and copied at the SEC’s Public Reference Room in Washington, DC. Information on the operation of the Public Reference Room may be obtained by calling 1-(800)-SEC-0330.
Shareholder Expense Example
As a shareholder of the Fund, you incur two types of costs: (1) transaction costs, including sales charges (loads) on purchase payments on certain classes and redemption fees; and (2) ongoing costs, including management fees, distribution (12b-1) fees and other Fund expenses. This example is intended to help you understand your ongoing costs (in dollars) of investing in the Fund and to compare these costs with the ongoing costs of investing in other mutual funds.
The example is based on an investment of $1,000 invested at the beginning of the period and held for the entire period from November 1, 2008 through April 30, 2009.
Actual Expenses–The first line under each class of shares in the following table provides information about actual account values and actual expenses. You may use the information in this line, together with the amount you invested, to estimate the expenses that you paid over the period. Simply divide your account value by $1,000 (for example, an $8,600 account value divided by $1,000 = 8.6), then multiply the result by the number in the first line under the heading entitled “Expenses Paid During Period” to estimate the expenses you paid on your account during the period.
Hypothetical Example for Comparison Purposes–The second line under each class of shares in the following table provides information about hypothetical account values and hypothetical expenses based on a Fund’s actual expense ratio and an assumed rate of return of 5% per year before expenses, which is not the Fund’s actual return. The hypothetical account values and expenses may not be used to estimate the actual ending account balance or expenses you paid for the period. You may use this
28
LIBERTY STREET HORIZON FUND
ADDITIONAL INFORMATION (Unaudited)
APRIL 30, 2009
information to compare the ongoing cost of investing in the Fund and other funds. To do so, compare this 5% hypothetical example with the 5% hypothetical examples that appear in the shareholder reports of other funds.
Please note that expenses shown in the table are meant to highlight your ongoing costs only and do not reflect any transactional costs, such as sales charges (loads) for certain share classes and redemption fees. Therefore, the second line of the table is useful in comparing ongoing costs only, and will not help you determine the relative total costs of owning different funds. In addition, if these transactional costs had been included, your costs would have been higher.
| | | | | | | | | | | | |
| | | Beginning
Account Value
November 1, 2008 | | Ending
Account Value
April 30, 2009 | | Expenses
Paid During
Period* | | Annualized
Expense
Ratio* | |
A Shares | | | | | | | | | | | | |
Actual | | $ | 1,000.00 | | $ | 917.53 | | $ | 7.13 | | 1.50 | % |
Hypothetical
(5% return before expenses) | | $ | 1,000.00 | | $ | 1,017.36 | | $ | 7.50 | | 1.50 | % |
C Shares | | | | | | | | | | | | |
Actual | | $ | 1,000.00 | | $ | 915.22 | | $ | 9.50 | | 2.00 | % |
Hypothetical
(5% return before expenses) | | $ | 1,000.00 | | $ | 1,014.88 | | $ | 9.99 | | 2.00 | % |
Institutional Shares | | | | | | | | | | | | |
Actual | | $ | 1,000.00 | | $ | 917.07 | | $ | 5.94 | | 1.25 | % |
Hypothetical
(5% return before expenses) | | $ | 1,000.00 | | $ | 1,018.60 | | $ | 6.26 | | 1.25 | % |
| * | Expenses are equal to the Fund’s annualized expense ratio as indicated above multiplied by the average account value over the period, multiplied by the number of days in most recent fiscal half-year divided by 365 to reflect the half-year period. |
Federal Tax Status Dividends Declared during the Tax Year
Income Dividends–For Federal income tax purposes, dividends from short-term capital gains are classified as ordinary income. The Fund designates 49.49% of its income dividend distributed as qualifying for the corporate dividends-received deduction (DRD) and 96.14% for the qualified dividend rate (QDI) as defined in Section 1(h)(11) of the Internal Revenue Code. The Fund also designates 11.98% as qualified net investment income dividends exempt from U.S. tax for foreign shareholders. (QII).
Trustees and Officers of the Trust
The Board is responsible for oversight of the management of the Trust’s business affairs and of the exercise of all the Trust’s powers except those reserved for shareholders. The following tables give information about each Board member and certain officers of the Trust. The Trustees listed below also
serve in the capacities noted below for Monarch Funds. Mr. Keffer is considered an Interested Trustee
29
LIBERTY STREET HORIZON FUND
ADDITIONAL INFORMATION (Unaudited)
APRIL 30, 2009
due to his affiliation with Atlantic. Mr. Keffer is also an Interested Director of Wintergreen Fund, Inc. Each Trustee and officer holds office until the person resigns, is removed, or is replaced. Unless otherwise noted, the persons have held their principal occupations for more than five years. The address for all Trustees and officers is Three Canal Plaza, Suite 600, Portland, Maine, 04101, unless otherwise indicated. Each Trustee oversees twenty-eight portfolios in the Trust. The Fund’s Statement of Additional Information includes additional information about the Trustees and is available, without charge and upon request, by calling (800) 207-7108.
| | | | | | |
| Name and Year of Birth | | Position with
the Trust | | Length of
Time Served | | Principal Occupation(s)
During Past 5 Years |
| Independent Trustees | | | | | | |
J. Michael Parish Born: 1943 | | Chairman of the Board; Trustee; Chairman, Compliance Committee, Nominating Committee and Qualified Legal Compliance Committee | | Trustee since 1989 (Chairman since 2004) | | Retired; Partner, Wolf, Block, Schorr and Solis-Cohen, LLP (law firm) 2002 – 2003; Partner, Thelen Reid & Priest LLP (law firm) 1995 - 2002. |
Costas Azariadis Born: 1943 | | Trustee; Chairman, Valuation Committee | | Since 1989 | | Professor of Economics, Washington University (effective 2006); Professor of Economics, University of California-Los Angeles 1992 - 2006. |
James C. Cheng Born: 1942 | | Trustee; Chairman, Audit Committee | | Since 1989 | | President, Technology Marketing Associates (marketing company for small- and medium-sized businesses in New England) since 1991. |
| Interested Trustee | | | | | | |
John Y. Keffer (1) Born: 1942 | | Trustee; Chairman, Contracts Committee | | Since 1989 | | Chairman, Atlantic Fund Administration, LLC since 2008; President, Forum Foundation (a charitable organization) since 2005; President, Forum Trust, LLC (a non-depository trust company) since 1997; President, Citigroup Fund Services, LLC (Citigroup) 2003 - 2005; President, Forum Financial Group, LLC (“Forum”) (a fund services company acquired by Citibank, N.A.) 1986 - 2003. |
| Officers | | | | | | |
Stacey E. Hong Born: 1966 | | President; Principal Executive Officer | | Since June 2008 | | President, Atlantic Fund Administration, LLC since 2008; Director, Consulting Services, Foreside Fund Services, January 2007 - September 2007; Elder Care June 2005 - December 2006; Director, Fund Accounting, Citigroup December 2003 - May 2005; Director/Senior Manager/Manager, Accounting, Forum Financial Group April 1992 - November 2003; Auditor, Ernst & Young May 1988 - March 1992. |
30
LIBERTY STREET HORIZON FUND
ADDITIONAL INFORMATION (Unaudited)
APRIL 30, 2009
| | | | | | |
| Name and Year of Birth | | Position with
the Trust | | Length of
Time Served | | Principal Occupation(s)
During Past 5 Years |
Karen Shaw Born: 1972 | | Treasurer; Principal Financial Officer | | Since July 2008 | | Senior Manager, Atlantic Fund Administration, LLC since 2008; Section Manager/Vice President, Enterprise Support Services, Citigroup December 2003 - July 2008; Senior Manager, Support and Fund Accounting, Forum Financial Group, August 1994 - December 2003. |
David Faherty Born: 1970 | | Vice President | | Since July 2008 | | Senior Counsel, Atlantic Fund Administration, LLC since February 2009; Vice President, Citi Fund Services Ohio, Inc. June 2007 - February 2009; Associate Counsel Investors Bank & Trust Company August 2006 - June 2007; employee of FDIC January 2005 - September 2005; employee of IKON Office Solutions, Inc. September 1998 - January 2001. |
Lina Bhatnagar Born: 1971 | | Secretary | | Since June 2008 | | Senior Administration Specialist, Atlantic Fund Administration, LLC since May 2008; Regulatory Administration Specialist, Citigroup, June 2006 - May 2008; Money Market/Short Term Trader, Wellington Management, 1996 - 2002. |
| (1) | Since 1997, John Y. Keffer has been president and owner of Forum Trust, LLC, a state chartered, non-depository trust company; and vice chairman and trustee of the Trust. Atlantic Fund Administration, LLC, is a subsidiary of Forum Trust, LLC. |
31
FOR MORE INFORMATION
INVESTMENT ADVISOR
Liberty Street Advisors, Inc.
125 Maiden Lane, 6th Floor
New York, NY 10038
TRANSFER AGENT
Atlantic Fund Administration, LLC
P.O. Box 588
Portland, ME 04112
DISTRIBUTOR
Foreside Fund Services, LLC
Three Canal Plaza, Suite 100
Portland, ME 04101
www.foreside.com
This report is submitted for the general information of the shareholders of the Fund. It is not authorized for distribution to prospective investors unless preceded or accompanied by an effective prospectus, which includes information regarding the Fund’s risks, objectives, fees and expenses, experience of its management, and other information.
ANNUAL REPORT
LIBERTY STREET
HORIZON FUND
P.O. Box 588
Portland, ME 04112
1-800-207-7108
236 – ANR – 0409