
SEMI-ANNUAL REPORT
(Unaudited)
LIBERTY STREET
HORIZON FUND
October 31, 2008
TABLE OF CONTENTS
| | |
| |
Schedule of Investments | | 1 |
| |
Statement of Assets and Liabilities | | 4 |
| |
Statement of Operations | | 5 |
| |
Statements of Changes in Net Assets | | 6 |
| |
Financial Highlights | | 8 |
| |
Notes to Financial Statements | | 11 |
| |
Additional Information | | 16 |
LIBERTY STREET HORIZON FUND
SCHEDULE OF INVESTMENTS
OCTOBER 31, 2008
| | | | | |
| Shares | | Security
Description | | Value |
| Common Stock — 97.5% | | | |
| Banks — 6.1% | | | |
| 3,700 | | Bank of Japan(a) | | $ | 2,779,413 |
| 11,014 | | ICICI Bank, Ltd., ADR | | | 188,229 |
| | | | | |
| | | | | 2,967,642 |
| | | | | |
|
| Communications — 1.1% |
| 30,160 | | China Unicom Hong Kong, Ltd., ADR | | | 434,606 |
| 125,100 | | RH Donnelley Corp.(a) | | | 106,335 |
| | | | | |
| | | | | 540,941 |
| | | | | |
|
| Consumer Discretionary — 5.5% |
| 1,800 | | Mastercard, Inc., Class A | | | 266,076 |
| 31,350 | | Philip Morris International, Inc. | | | 1,362,785 |
| 10,903 | | Sears Holdings Corp.(a) | | | 629,539 |
| 7,700 | | Visa, Inc., Class A | | | 426,195 |
| | | | | |
| | | | | 2,684,595 |
| | | | | |
|
| Consumer Staples — 9.2% |
| 46,800 | | Carnival Corp. | | | 1,188,720 |
| 36,735 | | Las Vegas Sands Corp.(a) | | | 521,270 |
| 49,991 | | Quanta Services, Inc.(a) | | | 987,822 |
| 43,657 | | Sotheby’s | | | 406,447 |
| 134,500 | | Time Warner, Inc. | | | 1,357,105 |
| | | | | |
| | | | | 4,461,364 |
| | | | | |
|
| Diversified Financial Operations — 5.6% |
| 13,032 | | Franklin Resources, Inc. | | | 886,176 |
| 27,116 | | Icahn Enterprises, LP | | | 833,004 |
| 37,091 | | Leucadia National Corp. | | | 995,522 |
| | | | | |
| | | | | 2,714,702 |
| | | | | |
| | | | | |
| Shares | | Security
Description | | Value |
| Energy — 16.1% |
| 30,775 | | Allegheny Energy, Inc. | | $ | 927,866 |
| 16,550 | | CNOOC, Ltd., ADR | | | 1,351,970 |
| 61,900 | | El Paso Corp. | | | 600,430 |
| 29,952 | | EnCana Corp. | | | 1,524,856 |
| 28,926 | | Gazprom OAO, ADR | | | 589,367 |
| 46,246 | | Imperial Oil, Ltd. | | | 1,638,958 |
| 53,265 | | Penn West Energy Trust | | | 951,313 |
| 2,900 | | Texas Pacific Land Trust | | | 81,432 |
| 211,598 | | UTS Energy Corp.(a) | | | 160,110 |
| | | | | |
| | | | | 7,826,302 |
| | | | | |
|
| Exchanges — 14.8% |
| 4,319 | | CME Group, Inc. | | | 1,218,606 |
| 63,000 | | Hong Kong Exchanges and Clearing, Ltd. | | | 615,770 |
| 10,727 | | IntercontinentalExchange, Inc.(a) | | | 917,802 |
| 82,020 | | London Stock Exchange Group, PLC | | | 740,143 |
| 66,037 | | Nasdaq OMX Group(a) | | | 2,143,561 |
| 36,584 | | NYSE Euronext | | | 1,104,105 |
| 134,000 | | Singapore Exchange, Ltd. | | | 460,823 |
| | | | | |
| | | | | 7,200,810 |
| | | | | |
|
| Finance — Capital Markets — 0.7% |
| 71,000 | | ICAP, PLC | | | 350,790 |
| | | | | |
|
| Finance — Investment Banker/Broker — 0.0% |
| 4 | | JPMorgan Chase & Co. | | | 165 |
| | | | | |
|
| Finance — Mortgage Loan/Banker — 0.4% |
| 133,800 | | Federal Home Loan Mortgage Corp. | | | 137,814 |
| 50,340 | | Federal National Mortgage Association | | | 46,665 |
| | | | | |
| | | | | 184,479 |
| | | | | |
See Notes to Financial Statements.
1
LIBERTY STREET HORIZON FUND
SCHEDULE OF INVESTMENTS
OCTOBER 31, 2008
| | | | | |
| Shares | | Security
Description | | Value |
| Industrials — 7.8% |
| 938,000 | | Beijing Capital International Airport Co., Ltd., Class H | | $ | 508,332 |
| 122,000 | | Bombardier, Inc., Class B | | | 466,587 |
| 16,000 | | Burlington Northern Santa Fe Corp. | | | 1,424,960 |
| 20,770 | | Union Pacific Corp. | | | 1,386,813 |
| | | | | |
| | | | | 3,786,692 |
| | | | | |
|
| Insurance — 9.0% |
| 529 | | Berkshire Hathaway, Inc., Class B(a) | | | 2,031,360 |
| 27,000 | | China Life Insurance Co., Ltd., ADR | | | 1,069,740 |
| 55,713 | | Power Corp. of Canada | | | 1,200,543 |
| | | | | |
| | | | | 4,301,643 |
| | | | | |
|
| Investment Management/Adviser — 4.4% |
| 90,100 | | Blackstone Group, LP | | | 823,514 |
| 24,000 | | Cohen & Steers, Inc. | | | 436,080 |
| 38,568 | | Legg Mason, Inc. | | | 855,824 |
| | | | | |
| | | | | 2,115,418 |
| | | | | |
|
| Materials — 1.7% |
| 9,000 | | Anglo American PLC, ADR | | | 112,950 |
| 3,700 | | BHP Billiton, Ltd., ADR | | | 143,856 |
| 1,894 | | Brookfield Infrastructure Partners, LP | | | 28,410 |
| 29,600 | | Franco-Nevada Corp. | | | 420,440 |
| 675 | | RioTinto PLC, ADR | | | 125,462 |
| | | | | |
| | | | | 831,118 |
| | | | | |
| | | | | |
| Shares | | Security
Description | | Value |
| Real Estate — 6.9% |
| 97,060 | | Brookfield Asset Management Inc., Class A | | $ | 1,749,992 |
| 703,700 | | Link REIT | | | 1,216,712 |
| 12,850 | | The St. Joe Co.(a) | | | 397,322 |
| | | | | |
| | | | | 3,364,026 |
| | | | | |
|
| Utilities — 8.4% |
| 288,281 | | Dynegy, Inc., Class A(a) | | | 1,049,343 |
| 25,023 | | Huaneng Power International, Inc., ADR | | | 490,701 |
| 48,887 | | Mirant Corp.(a) | | | 856,500 |
| 52,422 | | NRG Energy, Inc.(a) | | | 1,218,812 |
| 80,492 | | Reliant Energy, Inc.(a) | | | 422,583 |
| | | | | |
| | | | | 4,037,939 |
| | | | | |
Total Common Stock
(Cost $86,473,326) | | | 47,368,626 |
| | | | | |
Total Investments — 97.5%
(Cost $86,473,326)* | | $ | 47,368,626 |
| Other Assets & Liabilities, Net — 2.5% | | | 1,227,846 |
| | | | | |
| NET ASSETS — 100.0% | | $ | 48,596,472 |
| | | |
| (a) | Non-income producing security |
| ADR | American Depositary Receipt |
| PLC | Public Limited Company |
| REIT | Real Estate Investment Trust |
See Notes to Financial Statements.
2
LIBERTY STREET HORIZON FUND
SCHEDULE OF INVESTMENTS
OCTOBER 31, 2008
| * | Cost for Federal income tax purposes is substantially the same as for financial statement purposes and net unrealized appreciation (depreciation) consists of: |
| | | | |
| Gross Unrealized Appreciation | | $ | 83,388 | |
| Gross Unrealized Depreciation | | | (39,188,088 | ) |
| | | | |
| Net Unrealized Appreciation (Depreciation) | | $ | (39,104,700 | ) |
| | | | |
The following is a summary of the inputs used to value the Fund’s net assets as of October 31, 2008.
The inputs or methodology used for valuing securities are not necessarily an indication of the risk associated with investing in those securities. For more information on valuation inputs, and their aggregation into the levels used in the tables below, please refer to Note 2–Security Valuation section in the accompanying Notes to Financial Statements.
| | | | | | |
Valuation
Inputs | | Investments in
Securities | | Other Financial
Instruments |
Level 1–Quoted Prices | | $ | 47,368,626 | | $ | — |
Level 2–Other Significant Observable Inputs | | | — | | | — |
Level 3–Significant Unobservable Inputs | | | — | | | — |
| | | | | | |
Total Investments | | $ | 47,368,626 | | $ | — |
| | | | | | |
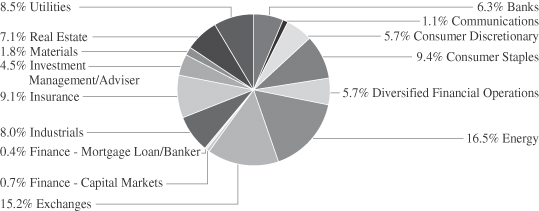
PORTFOLIO HOLDINGS
% of Total Investments
See Notes to Financial Statements.
3
LIBERTY STREET HORIZON FUND
STATEMENT OF ASSETS AND LIABILITIES
OCTOBER 31, 2008
| | | | |
ASSETS | | | | |
Total investments, at value (Cost $86,473,326) | | $ | 47,368,626 | |
Foreign currency (Cost $183,492) | | | 177,710 | |
Receivables: | | | | |
Fund shares sold | | | 355,216 | |
Investment securities sold | | | 990,335 | |
Dividends and interest | | | 28,399 | |
From investment adviser | | | 111,018 | |
From transfer agent | | | 3,787 | |
Prepaid expenses | | | 24,469 | |
| | | | |
Total Assets | | | 49,059,560 | |
| | | | |
LIABILITIES | | | | |
Payables: | | | | |
Fund shares redeemed | | | 49,225 | |
Investment securities purchased | | | 40,620 | |
Due to Custodian | | | 294,938 | |
Accrued Liabilities: | | | | |
Investment adviser fees | | | 31,650 | |
Accountant fees | | | 5,590 | |
Administration fees | | | 11,362 | |
Compliance services fees | | | 3,144 | |
Other | | | 26,559 | |
| | | | |
Total Liabilities | | | 463,088 | |
| | | | |
NET ASSETS | | $ | 48,596,472 | |
| | | | |
COMPONENTS OF NET ASSETS | | | | |
Paid-in capital | | $ | 93,277,246 | |
Accumulated undistributed (distributions in excess of) net investment income | | | 198,884 | |
Accumulated net realized gain (loss) on investments and foreign currency transactions | | | (5,769,321 | ) |
Net unrealized appreciation (depreciation) on investments and foreign currency translations | | | (39,110,337 | ) |
| | | | |
NET ASSETS | | $ | 48,596,472 | |
| | | | |
SHARES OF BENEFICIAL INTEREST (UNLIMITED SHARES AUTHORIZED) | | | | |
A Shares | | | 3,028,404 | |
C Shares | | | 1,466,060 | |
Institutional Shares | | | 4,792,414 | |
NET ASSET VALUE, Offering and Redemption Price Per Share | | | | |
A Shares (based on net assets of $15,889,401) | | $ | 5.25 | |
| | | | |
A Shares Maximum Public Offering Price Per Share
(net asset value per share/95.25%) | | $ | 5.67 | |
| | | | |
C Shares (based on net assets of $7,623,343) | | $ | 5.20 | |
| | | | |
Institutional Shares (based on net assets of $25,083,728) | | $ | 5.23 | |
| | | | |
See Notes to Financial Statements.
4
LIBERTY STREET HORIZON FUND
STATEMENT OF OPERATIONS
SIX MONTHS ENDED OCTOBER 31, 2008
| | | | |
INVESTMENT INCOME | | | | |
Dividend income (net of foreign withholding taxes of $35,444) | | $ | 646,388 | |
Interest income | | | 24,329 | |
| | | | |
Total Investment Income | | | 670,717 | |
| | | | |
EXPENSES | | | | |
Investment adviser fees | | | 332,676 | |
Administration fees | | | 65,822 | |
Transfer Agency Fees | | | | |
A Shares | | | 8,932 | |
C Shares | | | 4,388 | |
Institutional Shares | | | 10,321 | |
Custody Fees | | | 6,556 | |
Registration Fees | | | 19,595 | |
Compliance services Fees | | | 19,169 | |
Accountant Fees | | | 32,172 | |
Professional Fees | | | 26,375 | |
Distribution fees: | | | | |
A Shares | | | 26,924 | |
C Shares | | | 41,750 | |
Trustees’ fees and expenses | | | 871 | |
Reporting expenses | | | 11,392 | |
Miscellaneous expenses | | | 3,977 | |
| | | | |
Total Expenses | | | 610,920 | |
| | | | |
Fees waived and expenses reimbursed | | | (126,401 | ) |
| | | | |
Net Expenses | | | 484,519 | |
| | | | |
NET INVESTMENT INCOME (LOSS) | | | 186,198 | |
| | | | |
NET REALIZED AND UNREALIZED GAIN (LOSS) ON INVESTMENTS AND FOREIGN CURRENCY TRANSACTIONS | | | | |
Realized Gain (Loss) on: | | | | |
Investments | | | (5,708,189 | ) |
Foreign currency transactions | | | (6,785 | ) |
| | | | |
Net Realized Gain (Loss) on Investments and Foreign Currency Transactions | | | (5,714,974 | ) |
| | | | |
Change in Unrealized Appreciation (Depreciation) on: | | | | |
Investments | | | (32,511,668 | ) |
Foreign currency translations | | | (5,637 | ) |
| | | | |
Net change in unrealized appreciation (depreciation) on investments and foreign currency translations | | | (32,517,305 | ) |
| | | | |
NET REALIZED AND UNREALIZED GAIN (LOSS) ON INVESTMENTS AND FOREIGN CURRENCY TRANSACTIONS | | | (38,232,279 | ) |
| | | | |
INCREASE (DECREASE) IN NET ASSETS FROM OPERATIONS | | $ | (38,046,081 | ) |
| | | | |
See Notes to Financial Statements.
5
LIBERTY STREET HORIZON FUND
STATEMENTS OF CHANGES IN NET ASSETS
| | | | | | | | |
| | | Six Months
Ended
October 31, 2008 | | | May 4, 2007 (a)
to
April 30, 2008 | |
OPERATIONS | | | | | | | | |
Net investment income (loss) | | $ | 186,198 | | | $ | 92,695 | |
Net realized gain (loss) on investments and foreign currency transactions | | | (5,714,974 | ) | | | (53,851 | ) |
Net change in unrealized appreciation (depreciation) on investments and foreign currency transactions | | | (32,517,305 | ) | | | (6,593,032 | ) |
| | | | | | | | |
Increase (Decrease) in Net Assets from Operations | | | (38,046,081 | ) | | | (6,554,188 | ) |
| | | | | | | | |
DISTRIBUTIONS TO SHAREHOLDERS FROM | | | | | | | | |
Net investment income: | | | | | | | | |
A Shares | | | — | | | | (19,246 | ) |
C Shares | | | — | | | | (12,084 | ) |
Institutional Shares | | | — | | | | (49,466 | ) |
| | | | | | | | |
Net increase/(decrease) in net assets from distributions | | | — | | | | (80,796 | ) |
| | | | | | | | |
CAPITAL SHARE TRANSACTIONS | | | | | | | | |
Sale of Shares | | | | | | | | |
A Shares | | | 14,949,748 | | | | 20,167,304 | |
C Shares | | | 4,167,323 | | | | 13,495,806 | |
Institutional Shares | | | 27,868,457 | | | | 37,575,050 | |
Reinvestment of distributions: | | | | | | | | |
A Shares | | | — | | | | 19,232 | |
C Shares | | | — | | | | 12,003 | |
Institutional Shares | | | — | | | | 49,353 | |
Redemption of shares: | | | | | | | | |
A Shares | | | (4,176,123 | ) | | | (717,183 | ) |
C Shares | | | (2,112,879 | ) | | | (536,361 | ) |
Institutional Shares | | | (14,964,632 | ) | | | (2,570,341 | ) |
Redemption fees | | | | | | | | |
A Shares | | | 3,118 | | | | 2,485 | |
C Shares | | | 4,313 | | | | 4,208 | |
Institutional Shares | | | 28,159 | | | | 8,497 | |
| | | | | | | | |
Increase (Decrease) from Capital Transactions | | | 25,767,484 | | | | 67,510,053 | |
| | | | | | | | |
Increase (Decrease) in Net Assets | | | (12,278,597 | ) | | | 60,875,069 | |
| | | | | | | | |
NET ASSETS | | | | | | | | |
Beginning of Period | | | 60,875,069 | | | | — | |
| | | | | | | | |
End of Period (b) | | $ | 48,596,472 | | | $ | 60,875,069 | |
| | | | | | | | |
See Notes to Financial Statements.
6
LIBERTY STREET HORIZON FUND
STATEMENTS OF CHANGES IN NET ASSETS
| | | | | | | | |
| | | Six Months
Ended
October 31, 2008 | | | May 4, 2007 (a)
to
April 30, 2008 | |
SHARE TRANSACTIONS | | | | | | | | |
Sale of shares: | | | | | | | | |
A Shares | | $ | 1,757,919 | | | $ | 1,933,849 | |
C Shares | | | 507,890 | | | | 1,291,228 | |
Institutional Shares | | | 3,739,040 | | | | 3,663,370 | |
Reinvestment of distributions | | | | | | | | |
A Shares | | | — | | | | 1,706 | |
C Shares | | | — | | | | 1,069 | |
Institutional Shares | | | — | | | | 4,391 | |
Redemption of shares: | | | | | | | | |
A Shares | | | (594,392 | ) | | | (70,679 | ) |
C Shares | | | (282,553 | ) | | | (51,573 | ) |
Institutional Shares | | | (2,340,455 | ) | | | (273,932 | ) |
| | | | | | | | |
Increase (Decrease) in Shares | | | 2,787,449 | | | | 6,499,429 | |
| | | | | | | | |
(a) Commencement of operations | | | | | | | | |
(b) Accumulated undistributed (distributions in excess of) net investment income | | $ | 198,884 | | | $ | 12,686 | |
| | | | | | | | |
See Notes to Financial Statements.
7
LIBERTY STREET HORIZON FUND
FINANCIAL HIGHLIGHTS
These financial highlights reflect selected data for a share outstanding throughout each period.
| | | | | | | | |
| | | Six Months
Ended
October 31, 2008 | | | May 4, 2007 (a)
through
April 30, 2008 | |
A SHARES | | | | | | | | |
NET ASSET VALUE, Beginning of Period | | $ | 9.39 | | | $ | 10.00 | |
| | | | | | | | |
INVESTMENT OPERATIONS | | | | | | | | |
Net investment income (loss) (b) | | | 0.02 | | | | 0.05 | |
Net realized and unrealized gain (loss) | | | (4.16 | ) | | | (0.64 | ) |
| | | | | | | | |
Total from Investment Operations | | | (4.14 | ) | | | (0.59 | ) |
| | | | | | | | |
DISTRIBUTIONS TO SHAREHOLDERS FROM | | | | | | | | |
Net investment income | | | — | | | | (0.02 | ) |
| | | | | | | | |
REDEMPTION FEES (b) | | | — | (g) | | | — | (g) |
| | | | | | | | |
NET ASSET VALUE, End of Period | | $ | 5.25 | | | $ | 9.39 | |
| | | | | | | | |
TOTAL RETURN (c)(d) | | | (44.20 | )% | | | (5.94 | )% |
RATIOS/SUPPLEMENTARY DATA | | | | | | | | |
Net Assets at End of Period (000’s omitted) | | $ | 15,889 | | | $ | 17,506 | |
Ratios to Average Net Assets (e): | | | | | | | | |
Net investment income (loss) | | | 0.52 | % | | | 0.48 | % |
Net expense | | | 1.50 | % | | | 1.50 | % |
Gross expense (f) | | | 1.89 | % | | | 3.64 | % |
PORTFOLIO TURNOVER RATE (c) | | | 14 | % | | | 29 | % |
See Notes to Financial Statements.
8
LIBERTY STREET HORIZON FUND
FINANCIAL HIGHLIGHTS
| | | | | | | | |
| | | Six Months
Ended
October 31, 2008 | | | May 24, 2007 (a)
through
April 30, 2008 | |
C SHARES | | | | | | | | |
NET ASSET VALUE, Beginning of Period | | $ | 9.33 | | | $ | 10.05 | |
| | | | | | | | |
INVESTMENT OPERATIONS | | | | | | | | |
Net investment income (loss) (b) | | | 0.00 | (g) | | | 0.00 | (g) |
Net realized and unrealized gain (loss) | | | (4.13 | ) | | | (0.71 | ) |
| | | | | | | | |
Total from Investment Operations | | | (4.13 | ) | | | (0.71 | ) |
| | | | | | | | |
DISTRIBUTIONS TO SHAREHOLDERS FROM | | | | | | | | |
Net investment income | | | — | | | | (0.02 | ) |
| | | | | | | | |
REDEMPTION FEES (b) | | | — | (g) | | | 0.01 | |
| | | | | | | | |
NET ASSET VALUE, End of Period | | $ | 5.20 | | | $ | 9.33 | |
| | | | | | | | |
TOTAL RETURN (c)(d) | | | (44.37 | )% | | | (7.02 | )% |
RATIOS/SUPPLEMENTARY DATA | | | | | | | | |
Net Assets at End of Period (000’s omitted) | | $ | 7,623 | | | $ | 11,580 | |
Ratios to Average Net Assets (e): | | | | | | | | |
Net investment income (loss) | | | (0.01 | )% | | | (0.05 | )% |
Net expense | | | 1.99 | % | | | 2.00 | % |
Gross expense (f) | | | 2.41 | % | | | 4.19 | % |
PORTFOLIO TURNOVER RATE (c) | | | 14 | % | | | 29 | % |
See Notes to Financial Statements.
9
LIBERTY STREET HORIZON FUND
FINANCIAL HIGHLIGHTS
| | | | | | | | |
| | | Six Months
Ended
October 31, 2008 | | | July 11, 2007 (a)
through
April 30, 2008 | |
INSTITUTIONAL SHARES | | | | | | | | |
NET ASSET VALUE, Beginning of Period | | $ | 9.37 | | | $ | 10.79 | |
| | | | | | | | |
INVESTMENT OPERATIONS | | | | | | | | |
Net investment income (loss) (b) | | | 0.03 | | | | 0.05 | |
Net realized and unrealized gain (loss) | | | (4.17 | ) | | | (1.44 | ) |
| | | | | | | | |
Total from Investment Operations | | | (4.14 | ) | | | (1.39 | ) |
| | | | | | | | |
DISTRIBUTIONS TO SHAREHOLDERS FROM | | | | | | | | |
Net investment income | | | — | | | | (0.04 | ) |
| | | | | | | | |
REDEMPTION FEES (b) | | | — | (g) | | | 0.01 | |
| | | | | | | | |
NET ASSET VALUE, End of Period | | $ | 5.23 | | | $ | 9.37 | |
| | | | | | | | |
TOTAL RETURN (c) | | | (44.18 | )% | | | (12.88 | )% |
RATIOS/SUPPLEMENTARY DATA | | | | | | | | |
Net Assets at End of Period (000’s omitted) | | $ | 25,083 | | | $ | 31,788 | |
Ratios to Average Net Assets (e): | | | | | | | | |
Net investment income (loss) | | | 0.73 | % | | | 0.68 | % |
Net expense | | | 1.25 | % | | | 1.25 | % |
Gross expense (f) | | | 1.60 | % | | | 2.59 | % |
PORTFOLIO TURNOVER RATE (c) | | | 14 | % | | | 29 | % |
| (a) | Commencement of operations. |
| (b) | Calculated based on average shares outstanding during the period. |
| (c) | Not annualized for periods less than one year. |
| (d) | Total return excludes the effect of the applicable sales load. |
| (e) | Annualized for periods less than one year. |
| (f) | Reflects the expense ratio excluding any waivers and/or reimbursements. |
See Notes to Financial Statements.
10
LIBERTY STREET HORIZON FUND
NOTES TO FINANCIAL STATEMENTS
OCTOBER 31, 2008
Note 1. Organization
The Liberty Street Horizon Fund (the “Fund”) is a non-diversified portfolio of Forum Funds (the “Trust”). The Trust is a Delaware statutory trust that is registered as an open-end, management investment company under the Investment Company Act of 1940 (the “Act”), as amended. As of October 31, 2008, the Trust had twenty-seven investment portfolios. Under its Trust Instrument, the Trust is authorized to issue an unlimited number of the Fund’s shares of beneficial interest without par value. The Fund currently offers three classes of shares: A Shares, C Shares, and Institutional Shares. A Shares commenced operations on May 4, 2007. C Shares commenced operations on May 24, 2007. Institutional Shares commenced operations on July 11, 2007. The Fund seeks to achieve long-term growth of capital.
Note 2. Summary of Significant Accounting Policies
These financial statements are prepared in accordance with accounting principles generally accepted in the United States of America (“generally accepted accounting principles”), which require management to make estimates and assumptions that affect the reported amounts of assets and liabilities, the disclosure of contingent liabilities at the date of the financial statements, and the reported amounts of increase and decrease in net assets from operations during the fiscal period. Actual amounts could differ from those estimates. The following summarizes the significant accounting policies of the Fund:
Security Valuation–Exchange traded securities and over-the-counter securities are valued using the last quoted sale or official closing price, provided by independent pricing services as of the close of trading on the market or exchange for which they are primarily traded, on each Fund business day. In the absence of a sale, such securities are valued at the mean of the last bid and asked price. Non-exchange traded securities for which quotations are available are generally valued at the mean of the current bid and asked prices provided by independent pricing services. Debt securities may be valued at prices supplied by a Fund’s pricing agent based on broker or dealer supplied valuations or matrix pricing, a method of valuing securities by reference to the value of other securities with similar characteristics such as rating, interest rate and maturity. Shares of open-end mutual funds are valued at net asset value. Short-term investments that mature in sixty days or less may be valued at amortized cost.
The Fund values its investments at fair value pursuant to procedures adopted by the Trust’s Board of Trustees (the “Board”) if (1) market quotations are insufficient or not readily available or (2) the adviser believes that the values available are unreliable. Fair valuation is based on subjective factors and as a result, the fair value price of an investment may differ from the security’s market price and may not be the price at which the asset may be sold. Fair valuation could result in a different net asset value (“NAV”) than a NAV determined by using market quotes.
In September 2006, the Financial Accounting Standards Board issued Statement of Financial Accounting Standards No. 157, “Fair Value Measurements” (“SFAS 157”). This standard establishes a single authoritative definition of fair value, sets out a framework for measuring fair value, and requires additional disclosures about fair value measurements. SFAS 157 applies to fair value measurements
11
LIBERTY STREET HORIZON FUND
NOTES TO FINANCIAL STATEMENTS
OCTOBER 31, 2008
already required or permitted by existing standards. SFAS 157 is effective for financial statements issued for fiscal years beginning after November 15, 2007, and interim periods within those fiscal years. The changes to current GAAP from the application of this Statement relate to the definition of fair value, the methods used to measure fair value, and the expanded disclosures about fair value measurements.
One key component of the implementation of SFAS 157 includes the development of a three-tier fair value hierarchy. The basis of the tiers is dependant upon the various “inputs” used to determine the value of the Fund’s investments. These inputs are summarized in the three broad levels listed below:
Level 1–quoted prices in active markets for identical assets
Level 2–other significant observable inputs (including quoted prices of similar securities, interest rates, prepayments speeds, credit risk, etc.)
Level 3–significant unobservable inputs (including the Fund’s own assumptions in determining the fair value of investments)
The aggregate value by input level, as of October 31, 2008, for the Fund’s investments is included at the end of the Fund’s Schedule of Investments.
Security Transactions, Investment Income and Realized Gain and Loss–Investment transactions are accounted for on trade date. Dividend income is recorded on the ex-dividend date. Foreign dividend income is recorded on the ex-dividend date or as soon as practical after the Fund determines the existence of a dividend declaration after exercising reasonable due diligence. Income and capital gains on some foreign securities may be subject to foreign withholding taxes, which are accrued as applicable. Interest income is recorded on an accrual basis. Premium and discount is amortized and accreted in accordance with generally accepted accounting principles. Identified cost of investments sold is used to determine the gain and loss for both financial statement and Federal income tax purposes. The Fund estimates components of distribution from real estate investment trusts (“REITs”). Distributions received in excess of income are recorded as a reduction of the cost of the related investments.
Foreign Currency–Foreign currency amounts are translated into US dollars as follows: (i) assets and liabilities at the rate of exchange at the end of the respective period; and (ii) purchases and sales of securities and income and expenses at the rate of exchange prevailing on the dates of such transactions. The portion of the results of operations arising from changes in the exchange rates and the portion due to fluctuations arising from changes in the market prices of securities are not isolated. Such fluctuations are included with the net realized and unrealized gain or loss on investments.
The Fund may enter into transactions to purchase or sell foreign currencies to protect the U.S. dollar value of its underlying portfolio securities against the effect of possible adverse movements in foreign exchange rates. Principal risks associated with such transactions include the movement in value of the foreign currency relative to the U.S. dollar and the ability of the counterparty to perform. Fluctuations in the value of such forward currency transactions are recorded daily as unrealized gain or loss; realized gain or loss includes net gain or loss on transactions that have terminated by settlement or by
12
LIBERTY STREET HORIZON FUND
NOTES TO FINANCIAL STATEMENTS
OCTOBER 31, 2008
the Fund entering into offsetting commitments. These instruments involve market risk, credit risk, or both kinds of risks, in excess of the amount recognized in the Statement of Assets and Liabilities. Risks arise from the possible inability of counterparties to meet the terms of their contracts and from movement in currency and securities values and interest rates.
Distributions to Shareholders–Distributions to shareholders of net investment income and net capital gains, if any, are declared and paid at least annually. Distributions are based on amounts calculated in accordance with applicable Federal income tax regulations, which may differ from generally accepted accounting principles. These differences are due primarily to differing treatments of income and gain on various investment securities held by the Fund, timing differences and differing characterizations of distributions made by the Fund.
Federal Taxes–The Fund intends to qualify each year as a regulated investment company under Subchapter M of the Internal Revenue Code and distribute all its taxable income. In addition, by distributing in each calendar year substantially all its net investment income and capital gains, if any, the Fund will not be subject to a Federal excise tax. Therefore, no Federal income or excise tax provision is required.
The Fund adopted Financial Accounting Standards Board (“FASB”) Interpretation No. 48, Accounting for Uncertainty in Income Taxes–an interpretation of FAS 109 (“FIN 48”) on May 4, 2007. FIN 48 prescribes a minimum threshold for financial statement recognition of the benefit of a tax position taken or expected to be taken in a tax return, and requires certain expanded disclosures. Management concluded that as of April 30, 2008, there are no uncertain tax positions that would require financial statement recognition, de-recognition, or disclosure.
Income and Expense Allocation–The Trust accounts separately for the assets, liabilities and operations of each of its investment portfolios. Expenses that are directly attributable to more than one investment portfolio are allocated among the respective investment portfolios in an equitable manner.
The Fund’s class specific expenses are charged to the operations of that class of shares. Income and expenses (other than expenses attributable to a specific class), and realized and unrealized gains or losses on investments are allocated to each class of shares based on the class’ respective net assets to the total net assets of the Fund.
Redemption Fees–A shareholder who redeems shares within 90 days of purchase will incur a redemption fee of 1.00% of the current net asset value of shares redeemed or exchanged, subject to certain limitations. The fee is charged for the benefit of the remaining shareholders and will be paid to the Fund to help offset transaction costs. The fee is accounted for as an addition to paid-in capital. The Fund reserves the right to modify the terms at any time. There are limited exceptions to the imposition of the redemption fee.
13
LIBERTY STREET HORIZON FUND
NOTES TO FINANCIAL STATEMENTS
OCTOBER 31, 2008
New Accounting Pronouncements–FASB Statement No. 161, Disclosures about Derivative Instruments and Hedging Activities, effective for financial statements issued for fiscal years and interim periods beginning after November 15, 2008, and FASB Staff Position (FSP) 133-1, effective for fiscal years and interim periods ending after November 15, 2008 (the “Standards”) were recently issued. These Standards provide enhanced disclosures about the Fund’s use of and accounting for derivative instruments and the effect of derivative instruments on the Fund’s results of operations and financial position. Management is evaluating the application of the Standards to the Fund, and has not at this time determined the impact, resulting from the adoption of these Standards on the Fund’s financial statements.
Note 3. Advisory Fees, Servicing Fees and Other Transactions
Investment Adviser–Liberty Street Advisors, Inc., (the “Adviser”) is the investment adviser to the Fund. Pursuant to an investment advisory agreement, the Adviser receives an advisory fee from the Fund at an annual rate of 1.00% of the Fund’s average daily net assets.
The sub-advisory fee, calculated as a percentage of the Fund’s average daily net assets, is paid by the Adviser.
Distribution–Foreside Fund Services, LLC serves as the Fund’s distributor (the “Distributor”). The Distributor is not affiliated with the Adviser or with Atlantic Fund Administration, LLC (“Atlantic”) or their affiliates. The Fund has adopted a distribution plan for A and C Shares of the Fund in accordance with Rule 12b-1 of the Act. The Fund pays the Distributor and any other entity as authorized by the Board an aggregate fee equal to 0.25% of the average daily net assets of A Shares of the Fund and an aggregate fee equal to 0.75% of the average daily net assets of C Shares of the Fund.
For the period ended October 31, 2008, the Distributor did not receive any of the front-end sales charges assessed on the sale of A Shares. The Distributor did not retain any commissions from contingent deferred sales charges assessed on purchases of $1 million or more of A Shares that are liquidated in whole or in part within one year of purchase.
Other Service Providers–As of June 2, 2008, as to fund accounting and fund administration, and on June 16, 2008, as to transfer agency, Atlantic provides those services to the Fund. Pursuant to an Atlantic services agreement, the Fund pays Atlantic a bundled fee for administration, fund accounting and transfer agency services at an annual rate of: 0.12% on the first $150 million in Fund assets, 0.075% on the next $150 million in Fund assets, 0.05% on the next $300 million in Fund assets, 0.03% on the next $400 million in Fund assets and 0.02% on Fund assets exceeding $1 billion. The base fee is subject to an annual minimum of $135,000. The fee is accrued daily by the Fund and is paid monthly based on the average net assets for the previous month. The Fund’s transfer agent and fund accountant also receive certain shareholder account fees, surcharges and out-of-pocket expenses.
Atlantic provides a Principal Executive Officer, Principal Financial Officer, Chief Compliance Officer and an Anti-Money Laundering Officer to the Fund, as well as certain additional compliance support functions.
14
LIBERTY STREET HORIZON FUND
NOTES TO FINANCIAL STATEMENTS
OCTOBER 31, 2008
For the period May 1, 2008 through June 1, 2008, as to fund accounting and fund administration and through June 15, 2008 as to transfer agency, Citigroup Fund Services, LLC provided these services to the fund.
For the period May 1, 2008 through June 1, 2008, Foreside Compliance Services, LLC (“FCS”), an affiliate of the Distributor, provided a Principal Executive Officer, Principal Financial Officer, Chief Compliance Officer, and Anti-Money Laundering Officer as well as certain additional compliance support functions to the Fund. FCS had no role in determining the investment policies of, or the securities to be purchased or sold by the Trust or the Funds. Certain officers or employees of FCS were also officers of the Trust. The Principal Executive Officer was an affiliate of the Distributor due to his ownership interest in the Distributor.
Note 4. Expense Reimbursements and Fees Waived
The Adviser has contractually agreed to waive a portion of its fees and reimburse certain expenses to limit total annual operating expenses (excluding all interest, taxes, portfolio transaction expenses, dividends on short sales and extraordinary expenses) to 1.25% for Institutional Shares and 1.75% for A Shares for each of the class’ average daily net assets through September 1, 2009. For the period ended October 31, 2008, the Adviser waived $117,923 and reimbursed $8,478.
Note 5. Security Transactions
The cost of purchases and proceeds from sales of investment securities (including maturities), other than short-term investments for the period ended October 31, 2008, were $36,193,672 and $9,116,379, respectively.
Note 6. Federal Income Tax and Investment Transactions
As of April 30, 2008, distributable earnings (accumulated loss) on a tax basis were as follows:
| | | | |
Undistributed Ordinary Income | | $ | 102,223 | |
Unrealized Appreciation (Depreciation) | | | (6,682,569 | ) |
Capital and Other Losses | | | (54,347 | ) |
| | | | |
Total | | $ | (6,634,693 | ) |
| | | | |
The difference between components of distributable earnings on a tax basis and the amounts reflected in the Statement of Assets and Liabilities were primarily due to post October losses, capital loss carryover, nondeductible 12b-1 fees, nondeductible blue sky fees and cumulative PFIC mark to market.
For tax purposes, the current year post-October loss was $53,285. This loss was recognized for tax purposes on the first business day of the Fund’s next year.
15
LIBERTY STREET HORIZON FUND
ADDITIONAL INFORMATION
OCTOBER 31, 2008
Note 7. Other Information
On October 31, 2008 one shareholder held approximately 16% of the outstanding Institutional Shares of the Fund. This shareholder is an omnibus account, which is held on behalf of several underlying shareholders.
Proxy Voting Information
A description of the policies and procedures that the Fund uses to determine how to vote proxies relating to securities held in the Fund’s portfolio is available, without charge and upon request, by calling (800) 207-7108, on the SEC’s website at www.sec.gov and on the Fund’s website at www.libertystreetfunds.com. The Fund’s proxy voting records for the most recent twelve-month period ended June 30, is available, without charge and upon request, by calling (800) 207-7108 and on the SEC’s website at www.sec.gov and on the Fund’s website at www.libertystreetfunds.com.
Availability of Quarterly Portfolio Schedules
The Fund files its complete schedule of portfolio holdings with the SEC for the first and third quarters of each fiscal year on
Form N-Q. The Fund’s Forms N-Q are available, without charge and upon request on the SEC’s website at www.sec.gov or may be reviewed and copied at the SEC’s Public Reference Room in Washington, DC. Information on the operation of the Public Reference Room may be obtained by calling (202) 551-8090.
Shareholder Expense Example
As a shareholder of the Fund, you incur two types of costs: (1) transaction costs, including sales charges (loads) on purchase payments on certain classes and redemption fees; and (2) ongoing costs, including management fees, distribution (12b-1) fees and other Fund expenses. This example is intended to help you understand your ongoing costs (in dollars) of investing in the Fund and to compare these costs with the ongoing costs of investing in other mutual funds.
The following example is based on $1,000 invested at the beginning of the period and held for the entire period from May 1, 2008, through October 31, 2008.
Actual Expenses–The first line under each class of shares in the table below provides information about actual account values and actual expenses. You may use the information in this line, together with the amount you invested, to estimate the expenses that you paid over the period. Simply divide your account value by $1,000 (for example, an $8,600 account value divided by $1,000 = 8.6), then multiply the result by the number in the first line under the heading entitled “Expenses Paid During Period” to estimate the expenses you paid on your account during the period.
Hypothetical Example for Comparison Purposes–The second line under each class of shares in the table below provides information about hypothetical account values and hypothetical expenses based on a Fund’s actual expense ratio and an assumed rate of return of 5% per year before expenses, which is not the Fund’s actual return. The hypothetical account values and expenses may not be used to estimate the actual ending account balance or expenses you paid for the period. You may use this
16
LIBERTY STREET HORIZON FUND
ADDITIONAL INFORMATION
OCTOBER 31, 2008
information to compare the ongoing cost of investing in the Fund and other funds. To do so, compare this 5% hypothetical example with the 5% hypothetical examples that appear in the shareholder reports of other funds.
Please note that expenses shown in the table are meant to highlight your ongoing costs only and do not reflect any transactional costs, such as sales charges (loads) for certain share classes and redemption fees. Therefore, the second line of the table is useful in comparing ongoing costs only, and will not help you determine the relative total costs of owning different funds. In addition, if these transactional costs had been included, your costs would have been higher.
| | | | | | | | | | | | |
| | | Beginning
Account Value
May 1, 2008 | | Ending
Account Value
October 31, 2008 | | Expenses
Paid During
Period* | | Annualized
Expense
Ratio* | |
A Shares | | | | | | | | | | | | |
Actual | | $ | 1,000.00 | | $ | 558.04 | | $ | 5.89 | | 1.50 | % |
Hypothetical
(5% return before expenses) | | $ | 1,000.00 | | $ | 1,017.64 | | $ | 7.63 | | 1.50 | % |
C Shares | | | | | | | | | | | | |
Actual | | $ | 1,000.00 | | $ | 556.27 | | $ | 7.81 | | 1.99 | % |
Hypothetical
(5% return before expenses) | | $ | 1,000.00 | | $ | 1,015.17 | | $ | 10.11 | | 1.99 | % |
Institutional Shares | | | | | | | | | | | | |
Actual | | $ | 1,000.00 | | $ | 558.17 | | $ | 4.91 | | 1.25 | % |
Hypothetical
(5% return before expenses) | | $ | 1,000.00 | | $ | 1,018.90 | | $ | 6.36 | | 1.25 | % |
| * | Expenses are equal to the Fund’s annualized expense ratio as indicated above multiplied by the average account value over the period, multiplied by the number of days in most recent fiscal half-year divided by 365 to reflect the half-year period. |
17
FOR MORE INFORMATION
INVESTMENT ADVISOR
Liberty Street Advisors, Inc.
125 Maiden Lane, 6th Floor
New York, NY 10038
TRANSFER AGENT
P.O. Box 588
Portland, ME 04112
DISTRIBUTOR
Foreside Fund Services, LLC
Three Canal Plaza, Suite 100
Portland, ME 04101
www.foreside.com
This report is submitted for the general information of the shareholders of the Fund. It is not authorized for distribution to prospective investors unless preceded or accompanied by an effective prospectus, which includes information regarding the Fund’s risks, objectives, fees and expenses, experience of its management, and other information.
SEMI-ANNUAL REPORT
(UNAUDITED)
LIBERTY STREET
HORIZON FUND
P.O. Box 588
Portland, ME 04112
1-800-207-7108
236 – SAR – 1008