UNITED STATES
SECURITIES AND EXCHANGE COMMISSION
Washington, D.C. 20549
FORM N-CSR
CERTIFIED SHAREHOLDER REPORT OF REGISTERED MANAGEMENT INVESTMENT COMPANIES
Investment Company Act file number 811-21719
INVESTMENT MANAGERS SERIES TRUST
(Exact name of registrant as specified in charter)
235 West Galena Street
Milwaukee, WI 53212
(Address of principal executive offices) (Zip code)
Diane J. Drake
Mutual Fund Administration, LLC
2220 E. Route 66, Suite 226
Glendora, CA 91740
(Name and address of agent for service)
(626) 385-5777
Registrant's telephone number, including area code
Date of fiscal year end: December 31
Date of reporting period: December 31, 2023
Item 1. Report to Stockholders.
| (a) | The registrant’s annual report transmitted to shareholders pursuant to Rule 30e-1 under the Investment Company Act of 1940, as amended (the “Investment Company Act”), is as follows: |

Robinson Tax Advantaged Income Fund
(Class A: ROBAX)
(Class C: ROBCX)
(Institutional Class: ROBNX)
Robinson Opportunistic Income Fund
(Class A: RBNAX)
(Class C: RBNCX)
(Institutional Class: RBNNX)
ANNUAL REPORT
DECEMBER 31, 2023
Robinson Funds
Each a series of Investment Managers Series Trust
Table of Contents
| Robinson Tax Advantaged Income Fund | |
| Shareholder Letter | 1 |
| Fund Performance | 4 |
| Schedule of Investments | 6 |
| Statement of Assets and Liabilities | 10 |
| Statement of Operations | 11 |
| Statements of Changes in Net Assets | 12 |
| Financial Highlights | 13 |
| Robinson Opportunistic Income Fund | |
| Shareholder Letter | 16 |
| Fund Performance | 19 |
| Schedule of Investments | 21 |
| Statement of Assets and Liabilities | 25 |
| Statement of Operations | 26 |
| Statements of Changes in Net Assets | 27 |
| Financial Highlights | 28 |
| Notes to Financial Statements | 31 |
| Report of Independent Registered Public Accounting Firm | 45 |
| Supplemental Information | 47 |
| Expense Examples | 51 |
This report and the financial statements contained herein are provided for the general information of the shareholders of the Robinson Funds. This report is not authorized for distribution to prospective investors in the Funds unless preceded or accompanied by an effective prospectus.
www.libertystreetfunds.com

January 31, 2024
Dear Shareholders:
We are pleased to present the Robinson Tax-Advantaged Income Fund’s (“the Fund”) Annual Report covering the year ended December 31, 2023.
Investment Performance. Short to Intermediate (1-10 years to maturity) municipal bonds, as measured by the Bloomberg Short-Intermediate 1-10 Years Municipal Bond Index (the “Index”), were up 4.32 % for all of 2023, as the yield-to-worst on the Index declined from nearly 3% to 2.75% during the year (bond prices move in the opposite direction of their yields—falling bond yields means rising bond prices). Our strategy, even with the interest rate risk hedges we utilize, was able to also participate in this environment. The Fund’s Institutional Share Class returned 3.81% for the year, which was comprised of a $0.08 per share increase in net asset value, and $0.24 per share in income distributions to shareholders.
The Fund utilizes interest rate risk hedges (short positions in various US Treasury futures contracts) to attempt to minimize the impact changes in interest rates could have on the Fund’s returns. The net result of those hedges is to isolate, as much as practical, the inherent credit spreads of the underlying investment grade portfolio of municipal bonds as well as the discounts on the closed-end funds that hold those bonds. Our interest rate risk hedges were a modest drag (-0.4%) on the Fund’s performance last year. It would have been worse had the municipal market not outperformed the Treasury bond market. Taxable equivalent yields in the municipal bond market, as measured by the Bloomberg Municipal Bond Index, declined 0.56% in 2023, whereas Treasury yields, as measured by the Bloomberg Treasury Bond Index, declined 0.10%. In short, the credit spread between municipal bonds and Treasuries narrowed nearly 0.5% for the year. Unfortunately, discounts on tax-exempt closed-end funds also widened more than 5% during the year.
Portfolio Composition. In accordance with the Fund’s investment strategy, the Fund as of December 31, 2023, was invested primarily in municipal bond closed-end funds (97.3%), with the remainder (2.7%) held in cash equivalents. As of year-end, the Fund’s Institutional Share had a trailing 12-month yield of 2.67% (SEC 30-Day Yield of 3.55%; Unsubsidized SEC 30-Day Yield of 3.52%). The municipal bond closed-end funds held in the Fund had a weighted average levered taxable equivalent duration of 8.5 years — in other words, a 1% rise in interest rates would cause the net asset values of these funds to decline by approximately 8.5%. That interest rate risk was being hedged within the Fund with short positions in various U.S. Treasury futures contracts. As of December 31, 2023, the net exposure to changes in interest rates was approximately 2.2 years (i.e. a 1% rise in rates would result in roughly a 2.2% decline in net asset value). The municipal bond closed-end funds held in the portfolio were trading at a weighted average discount of 13.7% as of year-end. The 10-year weighted average discount for those same funds was 4.8%.
Market Outlook. We believe the Fund is well-positioned to extend its strong resurgence in Q4 2023. While the underlying tax-exempt bond market has recovered nicely in recent months, discounts on tax-exempt closed-end funds have barely budged. With the Fed signaling the end to this rate hike cycle, and the likely start to the next rate cutting cycle beginning in March, money market fund yields are almost certainly at their peak levels for this cycle. We would expect investors to continue to lock in these attractive longer-term yields. Moreover, any reduction in short-term yields reduces the cost of leverage for closed-end funds, which in turn, increases the amount of distributable income. We would point to the following as being particularly beneficial to the Tax-Advantaged Income Fund’s strategy in the current environment:
Potential Income Cushion: as of year-end, the Fund’s net income distribution yield divided by its net hedged duration suggests it can withstand another 1.5% rise in rates before eroding the income stream, whereas the Bloomberg Municipal Bond Index can only withstand a 0.54% rise in rates before its income has been wiped out.
Inflation: the Fund’s hedging strategy, which is designed to neutralize the negative impact higher inflation could have on bond prices, could provide potential stability should there be a reemergence of inflation.
| 1 |
Upside Potential: the weighted average discount of the closed-end funds held in the Fund as of year-end is -13.7%; the trailing 10-year historic average discount for those same funds is -4.8%.
We value your trust and confidence in the Fund and thank you for your support.
Best Regards,
James C. Robinson
Portfolio Manager
IMPORTANT RISKS AND DISCLOSURES
The views expressed in this report reflect those of the Fund’s Sub-Advisor as of the date this is written and may not reflect its views on the date this report is first published or anytime thereafter. These views are intended to assist shareholders in understanding the Fund’s investment methodology and do not constitute investment advice. This report may contain discussions about investments that may or may not be held by the Fund as of the date of this report. All current and future holdings are subject to risk and to change. To the extent this report contains forward looking statements, unforeseen circumstances may cause actual results to differ materially from the views expressed as of the date this is written.
An investment in the Fund is subject to risk, including the possible loss of principal amount invested and including, but not limited to, the following risks: Market Risk: The market price of a security may decline, sometimes rapidly or unpredictably, due to general market conditions that are not specifically related to a particular issuer, company, or asset class. Fixed income/interest rate risk: A rise in interest rates could negatively impact the value of the Fund’s shares. Generally, fixed income securities decrease in value if interest rates rise, and increase in value if interest rates fall, with longer-term securities being more sensitive than shorter-term securities. Municipal Bond risk: The underlying funds in which the Fund invests will invest primarily in municipal bonds. Litigation, legislation or other political events, local business or economic conditions or the bankruptcy of the issuer could have a significant effect on the ability of an issuer of municipal bonds to make payments of principal and/or interest. Changes related to taxation, legislation or the rights of municipal security holders can significantly affect municipal bonds and may cause them to decline in value. Closed-end fund (CEF), exchange-traded fund (ETF) and open-end fund (Mutual Fund) Risk: The Fund’s investments in CEFs, ETFs and Mutual Funds (“underlying funds”) are subject to various risks, including reliance on management’s ability to manage the underlying fund’s portfolio, risks associated with the fund’s portfolio, risks associated with the underlying securities held by the underlying fund, fluctuation in the market value of the underlying fund’s shares, and the Fund bearing a pro rata share of the fees and expenses of each underlying fund in which the Fund invests. U.S. Treasury Futures Contracts Hedge Risk: To the extent the Fund holds short positions in U.S. Treasury futures contracts, should market conditions cause U.S. Treasury prices to rise, the Fund’s portfolio could experience a loss; and should U.S. Treasury prices rise at the same time municipal bond prices fall, these losses may be greater than if the hedging strategy not been in place. Recent Market Events: Periods of market volatility may occur in response to market events and other economic, political, and global macro factors, such as governmental actions to mitigate the Covid-19 pandemic, and the recent rise of inflation, could adversely affect the value of the Fund’s investments. Management and Strategy: The evaluation and selection of the Fund’s investments depend on the judgment of the Fund’s Sub-Advisor, which may prove to be incorrect. Leveraging risk: The underlying funds in which the Fund will invest may be leveraged as a result of borrowing or other investment techniques. As a result, the Fund may be exposed indirectly to leverage, and may expose the Fund to higher volatility and possible diminishment of long-term returns. In addition, future regulations may hinder or restrict an underlying fund’s ability to maintain leverage; which in turn may reduce the total return and tax exempt income generated by the underlying funds and may cause a reduction in the value of the Fund’s shares. Tax Risk: There is no guarantee that the Fund’s income will be exempt from regular federal income taxes. Events occurring after the date of issuance of a municipal bond or after an underlying fund’s acquisition of a municipal bond may result in a determination that interest on that bond is subject to federal income tax. The Fund’s opportunistic trading strategies may also result in a portion of the Fund’s distributions to shareholders being characterized as capital gains. Portfolio Turnover Risk: The Fund’s turnover rate may be high. A high turnover rate may lead to higher transaction costs, a greater number of taxable transactions, and negatively affect the Fund’s performance. High Yield (“Junk”) Bond risk: The ETFs and Mutual Funds in which the Fund invests may invest in high yield (“junk”) bonds which involve greater risks of default, downgrade, or price declines and are more volatile and tend to be less liquid than investment-grade securities. Liquidity Risk: There can be no guarantee that an active market in shares of CEFs and ETFs held by the Fund will exist. The Fund may not be able to sell some or all of the investments it holds due to a lack of demand in the marketplace or other factors such as market turmoil, or if the Fund is forced to sell an asset to meet redemption requests, it may only be able to sell those investments at a loss. Derivatives Risk: The Fund and the underlying funds may use futures contracts, options, swap agreements, and/or sell securities short. Futures contracts may cause the value of the Fund’s shares to be more volatile and expose the Fund to leverage and tracking risks; the Fund may not fully benefit from or may lose money on option or shorting strategies; swaps may be leveraged, are subject to counterparty risk and may be difficult to value or liquidate.
| 2 |
30-Day SEC Yield is based on a 30-day period ending on the last day of the previous month and is computed by dividing the net investment income per share earned during the period by the maximum offering price per share on the last day of the period. This subsidized yield is based on the net expenses of the Fund of which the yield would be lower without the waivers in effect. Negative 30-Day SEC Yield results when accrued expenses of the past 30 days exceed the income collected during the past 30 days. Unsubsidized 30 Day SEC Yield is based on total expenses of the Fund. Distribution Yield is the measurement of cash flow paid by an income-paying vehicle. Rather than calculating the yield based on an aggregate of distributions, the most recent distribution is annualized and divided by the net asset value (NAV) of the security at the time of the payment. Credit Spreads are the difference between the quoted rates of return on two different investments, usually of different credit qualities but similar maturities. Yield to Worst is a measure of the lowest possible yield that can be received on a bond with an early retirement provision. Taxable-equivalent yield is the yield on a taxable bond that an investor would have to earn to match the return on a comparable tax-free municipal bond. Trailing 12-month yield is the average of the distribution yield over the last twelve months.
The Bloomberg Short-Intermediate 1-10 Years Municipal Bond Index is an unmanaged index that measures the performance of municipal bonds with time to maturity of between one and ten years. Bloomberg Municipal Bond Index covers the USD denominated long-term tax-exempt bond market. The index has four main sectors: state and local general obligation bonds, revenue bonds, insured bonds, and pre-refunded bonds. Bloomberg Treasury Index measures US dollar-denominated, fixed rate, nominal debt issued by the US Treasury with maturities of 1-year or longer.
One cannot invest directly in an index.
| 3 |
Robinson Tax Advantaged Income Fund
FUND PERFORMANCE at December 31, 2023 (Unaudited)

This graph compares a hypothetical $1,000,000 investment in the Fund’s Institutional Class shares, made at its inception, with a similar investment in the Bloomberg Short-Intermediate 1-10 Years Municipal Bond Index. The performance graph above is shown for the Fund’s Institutional Class shares; Class A shares and Class C shares performance may vary. Results include the reinvestment of all dividends and capital gains.
The Bloomberg Short-Intermediate 1-10 Years Municipal Bond Index is an unmanaged index that measures the performance of municipal bonds with time to maturity of between one and ten years. This index does not reflect expenses, fees or sales charge, which would lower performance. The index is unmanaged, and it is not available for investment.
| Average Annual Total Returns as of December 31, 2023 | 1 Year | 5 Years | Since Inception | Inception Date |
| Before deducting maximum sales charge | ||||
| Class A¹ | 3.67% | 3.46% | 2.35% | 09/30/14 |
| Class C² | 2.87% | 2.69% | 1.58% | 09/30/14 |
| Institutional Class³ | 3.81% | 3.70% | 2.59% | 09/30/14 |
| After deducting maximum sales charge | ||||
| Class A¹ | -0.27% | 2.66% | 1.69% | 09/30/14 |
| Class C² | 1.87% | 2.69% | 1.58% | 09/30/14 |
| Bloomberg Short-Intermediate 1-10 Years Municipal Bond Index | 4.32% | 1.82% | 1.76% | 09/30/14 |
| ¹ | Maximum initial sales charge for Class A shares is 3.75%. No initial sales charge is applied to purchases of $500,000 or more. A contingent deferred sales charge (“CDSC”) of 1.00% will be charged on certain purchases of $500,000 or more that are redeemed in whole or in part within 18 months of the date of purchase. |
| ² | A contingent deferred sales charge (“CDSC”) of 1.00% will be charge on Class C share purchases that are redeemed in whole or in part within 12 months of the date of purchase. |
| ³ | Institutional Class shares do not have any initial or contingent deferred sales charge. |
The performance data quoted here represents past performance and past performance is not a guarantee of future results. Investment return and principal value will fluctuate so that an investor's shares, when redeemed, may be worth more or less than their original cost. Current performance may be lower or higher than the performance information quoted. The most recent month end performance may be obtained by calling (800) 207-7108.
| 4 |
Robinson Tax Advantaged Income Fund
FUND PERFORMANCE at December 31, 2023 (Unaudited) - Continued
Gross and Net Expense Ratios for Class A shares were 2.90% and 2.80%, respectively, for Class C shares were 3.65% and 3.55%, respectively, and for Institutional Class shares were 2.65% and 2.55%, respectively, which were the amounts stated in the current prospectus dated April 30, 2023. For the Fund’s current one year expense ratios, please refer to the Financial Highlights section of this report. The Fund’s Advisor has contractually agreed to waive its fees and/or pay for operating expenses of the Fund to ensure that the total annual fund operating expenses (excluding, as applicable, taxes, leverage interest, brokerage commissions, dividend and interest expenses on short sales, acquired fund fees and expenses as determined in accordance with Form N-1A, expenses incurred in connection with any merger or reorganization and extraordinary expenses such as litigation expenses) do not exceed 1.60%, 2.35% and 1.35% of the average daily net assets of the Class A shares, Class C shares, and Institutional Class shares, respectively. This agreement is in effect until April 30, 2024 and may be terminated before that date only by the Trust’s Board of Trustee. In the absence of such waivers, the Fund’s returns would be lower.
Returns reflect the reinvestment of distributions made by the Fund, if any. The graph and the performance table above do not reflect the deduction of taxes that a shareholder would pay on Fund distributions or the redemption of Fund shares.
| 5 |
Robinson Tax Advantaged Income Fund
SCHEDULE OF INVESTMENTS
As of December 31, 2023
| Number of Shares | Value | |||||||
| CLOSED-END FUNDS — 98.1% | ||||||||
| 53,279 | ABRDN National Municipal Income Fund | $ | 543,979 | |||||
| 64,173 | BlackRock California Municipal Income Trust | 772,001 | ||||||
| 252,510 | BlackRock Investment Quality Municipal Trust, Inc. | 2,994,769 | ||||||
| 306,212 | BlackRock MuniAssets Fund, Inc. | 3,242,785 | ||||||
| 397,932 | BlackRock Municipal Income Fund, Inc. | 4,631,928 | ||||||
| 250,849 | BlackRock Municipal Income Quality Trust | 2,812,017 | ||||||
| 1,154,289 | BlackRock Municipal Income Trust | 11,623,690 | ||||||
| 825,355 | BlackRock Municipal Income Trust II | 8,814,791 | ||||||
| 536,459 | BlackRock MuniHoldings California Quality Fund, Inc. | 5,970,789 | ||||||
| 258,858 | BlackRock MuniHoldings Fund, Inc. | 3,082,999 | ||||||
| 264,949 | BlackRock MuniHoldings New Jersey Quality Fund, Inc. | 3,023,068 | ||||||
| 157,675 | BlackRock MuniHoldings New York Quality Fund, Inc. | 1,657,164 | ||||||
| 135,813 | BlackRock MuniHoldings Quality Fund II, Inc. | 1,360,846 | ||||||
| 540,045 | BlackRock MuniVest Fund II, Inc. | 5,816,285 | ||||||
| 875,307 | BlackRock MuniVest Fund, Inc. | 6,232,186 | ||||||
| 458,441 | BlackRock MuniYield Fund, Inc. | 4,941,994 | ||||||
| 544,410 | BlackRock MuniYield Michigan Quality Fund, Inc. | 6,184,498 | ||||||
| 260,041 | BlackRock MuniYield New York Quality Fund, Inc. | 2,686,224 | ||||||
| 515,250 | BlackRock MuniYield Quality Fund II, Inc. | 5,332,837 | ||||||
| 411,393 | BlackRock MuniYield Quality Fund III, Inc. | 4,788,615 | ||||||
| 769,871 | BlackRock MuniYield Quality Fund, Inc. | 9,384,727 | ||||||
| 12,000 | BlackRock New York Municipal Income Trust | 126,360 | ||||||
| 23,866 | BNY Mellon Strategic Municipal Bond Fund, Inc. | 136,275 | ||||||
| 162,972 | Eaton Vance California Municipal Bond Fund | 1,491,194 | ||||||
| 355,382 | Eaton Vance Municipal Bond Fund | 3,600,020 | ||||||
| 583,003 | Eaton Vance Municipal Income Trust | 5,725,089 | ||||||
| 698,975 | Invesco Advantage Municipal Income Trust II | 5,906,339 | ||||||
| 314,661 | Invesco California Value Municipal Income Trust | 3,083,678 | ||||||
| 737,934 | Invesco Municipal Opportunity Trust | 7,091,546 | ||||||
| 514,960 | Invesco Municipal Trust | 4,907,569 | ||||||
| 367,547 | Invesco Quality Municipal Income Trust | 3,495,372 | ||||||
| 586,706 | Invesco Trust for Investment Grade Municipals | 5,802,522 | ||||||
| 383,936 | Invesco Trust for Investment Grade New York Municipals | 3,996,774 | ||||||
| 477,328 | Invesco Value Municipal Income Trust | 5,599,057 | ||||||
| 10,930 | MainStay MacKay DefinedTerm Municipal Opportunities Fund | 177,612 | ||||||
| 188,338 | MFS High Yield Municipal Trust | 623,399 | ||||||
| 33,292 | MFS Investment Grade Municipal Trust | 252,020 | ||||||
| 265,180 | MFS Municipal Income Trust | 1,370,981 | ||||||
| 152,387 | Neuberger Berman Municipal Fund, Inc. | 1,577,205 | ||||||
| 1,076,270 | Nuveen AMT-Free Municipal Credit Income Fund | 12,721,511 | ||||||
| 1,070,997 | Nuveen AMT-Free Quality Municipal Income Fund | 11,780,967 | ||||||
| 70,472 | Nuveen Arizona Quality Municipal Income Fund | 754,755 | ||||||
| 309,923 | Nuveen California Quality Municipal Income Fund | 3,437,046 | ||||||
| 1,228,328 | Nuveen Municipal Credit Income Fund | 14,518,837 | ||||||
| 6 |
Robinson Tax Advantaged Income Fund
SCHEDULE OF INVESTMENTS - Continued
As of December 31, 2023
| Number of Shares | Value | |||||||
| CLOSED-END FUNDS (Continued) | ||||||||
| 177,196 | Nuveen Municipal Credit Opportunities Fund | $ | 1,766,644 | |||||
| 341,384 | Nuveen Municipal High Income Opportunity Fund | 3,372,874 | ||||||
| 54,017 | Nuveen New Jersey Quality Municipal Income Fund | 636,320 | ||||||
| 203,382 | Nuveen New York AMT-Free Quality Municipal Income Fund | 2,141,612 | ||||||
| 89,083 | Nuveen New York Quality Municipal Income Fund | 983,476 | ||||||
| 139,994 | Nuveen Pennsylvania Quality Municipal Income Fund | 1,621,131 | ||||||
| 1,238,800 | Nuveen Quality Municipal Income Fund | 14,184,260 | ||||||
| 161,056 | Nuveen Virginia Quality Municipal Income Fund | 1,736,184 | ||||||
| 148,281 | PIMCO California Municipal Income Fund | 1,381,979 | ||||||
| 164,128 | PIMCO New York Municipal Income Fund II | 1,245,732 | ||||||
| 413,907 | Pioneer Municipal High Income Advantage Fund, Inc. | 3,319,534 | ||||||
| 130,224 | Pioneer Municipal High Income Fund, Inc. | 1,123,833 | ||||||
| 168,542 | Pioneer Municipal High Income Opportunities Fund, Inc. | 1,781,489 | ||||||
| 404,437 | Putnam Managed Municipal Income Trust | 2,458,977 | ||||||
| 902,947 | Putnam Municipal Opportunities Trust | 9,237,148 | ||||||
| 45,081 | RiverNorth Opportunistic Municipal Income Fund, Inc. | 686,584 | ||||||
| 87,550 | Western Asset Intermediate Muni Fund, Inc. | 674,135 | ||||||
| 405,407 | Western Asset Managed Municipals Fund, Inc. | 4,122,989 | ||||||
| 273,036 | Western Asset Municipal High Income Fund, Inc. | 1,752,891 | ||||||
| TOTAL CLOSED-END FUNDS | ||||||||
| (Cost $ 237,647,028) | 248,302,112 | |||||||
| Principal Amount | ||||||||
| SHORT-TERM INVESTMENTS — 0.6% | ||||||||
| $ | 1,595,386 | UMB Bank Demand Deposit, 0.01%1 | 1,595,386 | |||||
| TOTAL SHORT-TERM INVESTMENTS | ||||||||
| (Cost $ 1,595,386) | 1,595,386 | |||||||
| TOTAL INVESTMENTS — 98.7% | ||||||||
| (Cost $239,242,414) | 249,897,498 | |||||||
| Other Assets in Excess of Liabilities — 1.3% | 3,373,324 | |||||||
| TOTAL NET ASSETS — 100.0% | $ | 253,270,822 | ||||||
| 1 | The rate is the annualized seven-day yield at period end. |
See accompanying Notes to Financial Statements.
| 7 |
Robinson Tax Advantaged Income Fund
SCHEDULE OF INVESTMENTS - Continued
As of December 31, 2023
FUTURES CONTRACTS
| Number of Contracts Long (Short) | Description | Expiration Date | Notional Amount | Value/Unrealized Appreciation (Depreciation) | ||||||||
| (400) | U.S. 10 Year Treasury Note | March 2024 | $ | (44,092,188 | ) | $ | (1,064,062 | ) | ||||
| (300) | U.S. Treasury Long Bond | March 2024 | (35,200,692 | ) | (2,280,558 | ) | ||||||
| (200) | Ultra Long Term U.S. Treasury Bond | March 2024 | (24,818,164 | ) | (1,900,586 | ) | ||||||
| TOTAL FUTURES CONTRACTS | $ | (104,111,044 | ) | $ | (5,245,206 | ) | ||||||
See accompanying Notes to Financial Statements.
| 8 |
Robinson Tax Advantaged Income Fund
SUMMARY OF INVESTMENTS
As of December 31, 2023
| Security Type/Sector | Percent of Total Net Assets | |||
| Closed-End Funds | 98.1 | % | ||
| Short-Term Investments | 0.6 | % | ||
| Total Investments | 98.7 | % | ||
| Other Assets in Excess of Liabilities | 1.3 | % | ||
| Total Net Assets | 100.0 | % | ||
See accompanying Notes to Financial Statements.
| 9 |
Robinson Tax Advantaged Income Fund
STATEMENT OF ASSETS AND LIABILITIES
As of December 31, 2023
| Assets: | ||||
| Investments, at value (cost $239,242,414) | $ | 249,897,498 | ||
| Cash deposited with brokers for futures contracts | 9,926,491 | |||
| Receivables: | ||||
| Fund shares sold | 239,339 | |||
| Dividends and interest | 58,702 | |||
| Prepaid expenses | 31,905 | |||
| Total assets | 260,153,935 | |||
| Liabilities: | ||||
| Payables: | ||||
| Investment securities purchased | 563,435 | |||
| Fund shares redeemed | 753,736 | |||
| Variation margin on futures contracts | 5,245,206 | |||
| Advisory fees | 229,574 | |||
| Shareholder servicing fees (Note 7) | 875 | |||
| Distribution fees - Class A & Class C (Note 6) | 9,922 | |||
| Fund services fees | 25,194 | |||
| Auditing fees | 20,709 | |||
| Trustees' deferred compensation (Note 3) | 16,805 | |||
| Commitment fees payable (Note 12) | 7,571 | |||
| Chief Compliance Officer fees | 2,504 | |||
| Trustees' fees and expenses | 1,197 | |||
| Accrued other expenses | 6,385 | |||
| Total liabilities | 6,883,113 | |||
| Commitments and contingencies (Note 3) | ||||
| Net Assets | $ | 253,270,822 | ||
| Components of Net Assets: | ||||
| Paid-in capital (par value of $0.01 per share with an unlimited number of shares authorized) | $ | 261,078,067 | ||
| Total distributable earnings (accumulated deficit) | (7,807,245 | ) | ||
| Net Assets | $ | 253,270,822 | ||
| Maximum Offering Price per Share: | ||||
| Class A Shares: | ||||
| Net assets applicable to shares outstanding | $ | 40,029,019 | ||
| Shares of beneficial interest issued and outstanding | 4,745,272 | |||
| Redemption price1 | $ | 8.44 | ||
| Maximum sales charge (3.75% of offering price)2 | 0.33 | |||
| Maximum offering price to public | $ | 8.77 | ||
| Class C Shares: | ||||
| Net assets applicable to shares outstanding | $ | 2,278,887 | ||
| Shares of beneficial interest issued and outstanding | 270,146 | |||
| Redemption price3 | $ | 8.44 | ||
| Institutional Class Shares: | ||||
| Net assets applicable to shares outstanding | $ | 210,962,916 | ||
| Shares of beneficial interest issued and outstanding | 25,024,759 | |||
| Redemption price | $ | 8.43 | ||
| 1 | A Contingent Deferred Sales Charge ("CDSC") of 1.00% may be charged on certain purchases of $500,000 or more that are redeemed in whole or in part within 18 months of the date of purchase. |
| 2 | No initial sales charge is applied to purchases of $500,000 or more. |
| 3 | A CDSC of 1.00% may be charged on purchases that are redeemed in whole or in part within 12 months of the date of purchase. |
See accompanying Notes to Financial Statements.
| 10 |
Robinson Tax Advantaged Income Fund
STATEMENT OF OPERATIONS
For the Year Ended December 31, 2023
| Investment income: | ||||
| Dividends | $ | 8,047,672 | ||
| Interest | 532 | |||
| Total investment income | 8,048,204 | |||
| Expenses: | ||||
| Advisory fees | 2,284,309 | |||
| Shareholder servicing fees (Note 7) | 102,772 | |||
| Distribution fees - Class A (Note 6) | 88,156 | |||
| Distribution fees - Class C (Note 6) | 43,960 | |||
| Fund services fees | 314,530 | |||
| Registration fees | 60,332 | |||
| Commitment fees (Note 12) | 29,514 | |||
| Auditing fees | 21,309 | |||
| Legal fees | 17,438 | |||
| Trustees' fees and expenses | 14,346 | |||
| Chief Compliance Officer fees | 13,665 | |||
| Shareholder reporting fees | 12,806 | |||
| Insurance fees | 3,794 | |||
| Miscellaneous | 2,875 | |||
| Total expenses | 3,009,806 | |||
| Advisory fees recovered (waived) | (44,710 | ) | ||
| Net expenses | 2,965,096 | |||
| Net investment income (loss) | 5,083,108 | |||
| Realized and Unrealized Gain (Loss) on: | ||||
| Net realized gain (loss) on: | ||||
| Investments | (14,223,157 | ) | ||
| Futures contracts | 6,298,247 | |||
| Net realized gain (loss) on: | (7,924,910 | ) | ||
| Net change in unrealized appreciation/depreciation on: | ||||
| Investments | 17,325,322 | |||
| Futures contracts | (6,136,222 | ) | ||
| Net change in unrealized appreciation/depreciation | 11,189,100 | |||
| Net realized and unrealized gain (loss) | 3,264,190 | |||
| Net Increase (Decrease) in Net Assets from Operations | $ | 8,347,298 | ||
See accompanying Notes to Financial Statements.
| 11 |
Robinson Tax Advantaged Income Fund
STATEMENTS OF CHANGES IN NET ASSETS
| For the Year Ended December 31, 2023 | For the Year Ended December 31, 2022 | |||||||
| Increase (Decrease) in Net Assets from: | ||||||||
| Operations: | ||||||||
| Net investment income (loss) | $ | 5,083,108 | $ | 2,994,431 | ||||
| Net realized gain (loss) on investments and futures contracts | (7,924,910 | ) | (4,279,105 | ) | ||||
| Capital gain distributions from regulated investment companies | - | 60,101 | ||||||
| Net change in unrealized appreciation/depreciation on investments and futures contracts | 11,189,100 | (8,256,684 | ) | |||||
| Net increase (decrease) in net assets resulting from operations | 8,347,298 | (9,481,257 | ) | |||||
| Distributions to Shareholders: | ||||||||
| Distributions: | ||||||||
| Class A | (807,448 | ) | (766,802 | ) | ||||
| Class C | (68,465 | ) | (160,605 | ) | ||||
| Institutional Class | (4,279,396 | ) | (3,040,470 | ) | ||||
| From return of capital: | ||||||||
| Class A | (85,349 | ) | - | |||||
| Class C | (7,237 | ) | - | |||||
| Institutional Class | (452,365 | ) | - | |||||
| Total distributions to shareholders | (5,700,260 | ) | (3,967,877 | ) | ||||
| Capital Transactions: | ||||||||
| Net proceeds from shares sold: | ||||||||
| Class A | 19,389,970 | 18,449,368 | ||||||
| Class C | 373,500 | 28,900 | ||||||
| Institutional Class | 133,502,710 | 86,187,117 | ||||||
| Reinvestment of distributions: | ||||||||
| Class A | 879,079 | 730,556 | ||||||
| Class C | 75,055 | 159,718 | ||||||
| Institutional Class | 4,254,888 | 2,713,834 | ||||||
| Cost of shares redeemed: | ||||||||
| Class A | (9,022,614 | ) | (11,913,192 | ) | ||||
| Class C | (3,574,412 | ) | (2,923,159 | ) | ||||
| Institutional Class | (63,829,873 | ) | (42,582,976 | ) | ||||
| Net increase (decrease) in net assets from capital transactions | 82,048,303 | 50,850,166 | ||||||
| Total increase (decrease) in net assets | 84,695,341 | 37,401,032 | ||||||
| Net Assets: | ||||||||
| Beginning of period | 168,575,481 | 131,174,449 | ||||||
| End of period | $ | 253,270,822 | $ | 168,575,481 | ||||
| Capital Share Transactions: | ||||||||
| Shares sold: | ||||||||
| Class A | 2,341,316 | 2,160,108 | ||||||
| Class C | 45,056 | 3,439 | ||||||
| Institutional Class | 16,311,145 | 10,523,509 | ||||||
| Shares reinvested: | ||||||||
| Class A | 107,464 | 87,176 | ||||||
| Class C | 9,148 | 19,035 | ||||||
| Institutional Class | 520,754 | 324,145 | ||||||
| Shares redeemed: | ||||||||
| Class A | (1,098,774 | ) | (1,412,245 | ) | ||||
| Class C | (437,895 | ) | (341,431 | ) | ||||
| Institutional Class | (7,950,173 | ) | (5,008,922 | ) | ||||
| Net increase (decrease) in capital share transactions | 9,848,041 | 6,354,814 | ||||||
See accompanying Notes to Financial Statements.
| 12 |
Robinson Tax Advantaged Income Fund
FINANCIAL HIGHLIGHTS
Class A
Per share operating performance.
For a capital share outstanding throughout each period.
| For the Year Ended December 31, | ||||||||||||||||||||
| 2023 | 2022 | 2021 | 2020 | 2019 | ||||||||||||||||
| Net asset value, beginning of period | $ | 8.35 | $ | 9.48 | $ | 9.38 | $ | 9.63 | $ | 8.64 | ||||||||||
| Income from Investment Operations: | ||||||||||||||||||||
| Net investment income (loss)1,2 | 0.19 | 0.21 | 0.25 | 0.27 | 0.28 | |||||||||||||||
| Net realized and unrealized gain (loss) | 0.11 | (1.07 | ) | 0.57 | (0.25 | ) | 1.00 | |||||||||||||
| Net increase from payment by affiliates | - | - | - | 3 | - | - | ||||||||||||||
| Total from investment operations | 0.30 | (0.86 | ) | 0.82 | 0.02 | 1.28 | ||||||||||||||
| Less Distributions: | ||||||||||||||||||||
| From net investment income | (0.19 | ) | (0.24 | ) | (0.26 | ) | (0.27 | ) | (0.28 | ) | ||||||||||
| From net realized gain | - | (0.03 | ) | (0.46 | ) | - | - | |||||||||||||
| From return of capital | (0.02 | ) | - | - | - | (0.01 | ) | |||||||||||||
| Total distributions | (0.21 | ) | (0.27 | ) | (0.72 | ) | (0.27 | ) | (0.29 | ) | ||||||||||
| Net asset value, end of period | $ | 8.44 | $ | 8.35 | $ | 9.48 | $ | 9.38 | $ | 9.63 | ||||||||||
| Total return4 | 3.67 | % | (9.02 | )% | 8.86 | %5 | 0.44 | % | 14.93 | % | ||||||||||
| Ratios and Supplemental Data: | ||||||||||||||||||||
| Net assets, end of period (in thousands) | $ | 40,029 | $ | 28,361 | $ | 24,282 | $ | 40,247 | $ | 36,465 | ||||||||||
| Ratio of expenses to average net assets (including interest expense and commitment fees): | ||||||||||||||||||||
| Before fees waived and expenses absorbed/recovered6,7 | 1.64 | % | 1.68 | % | 1.64 | % | 1.65 | % | 1.63 | % | ||||||||||
| After fees waived and expenses absorbed/recovered6,7 | 1.61 | % | 1.58 | %8 | 1.51 | % | 1.54 | % | 1.51 | % | ||||||||||
| Ratio of net investment income (loss) to average net assets (including interest expense and commitment fees): | ||||||||||||||||||||
| Before fees waived and expenses absorbed/recovered2 | 2.23 | % | 2.42 | % | 2.37 | % | 2.94 | % | 2.89 | % | ||||||||||
| After fees waived and expenses absorbed/recovered2 | 2.26 | % | 2.52 | % | 2.50 | % | 3.05 | % | 3.01 | % | ||||||||||
| Portfolio turnover rate | 105 | % | 255 | % | 270 | % | 185 | % | 78 | % | ||||||||||
| 1 | Based on average shares outstanding for the period. |
| 2 | Recognition of the net investment income by the Fund is affected by the timing of the declaration of dividends by the underlying investment companies in which the Fund invests. The ratio does not include net investment income of the investment companies in which the Fund invests. |
| 3 | Amount represents less than $0.01 per share. |
| 4 | Total returns would have been lower/higher had expenses not been waived or absorbed/recovered by the Advisor. Returns shown do not reflect the deduction of taxes that a shareholder would pay on Fund distributions or the redemption of Fund shares. Returns shown do not include payment of sales load of 3.75% of offering price which is reduced on sales of $100,000 or more and no initial sales charge is applied to purchases of $500,000 or more. Returns shown do not include payment of a Contingent Deferred Sales Charge ("CDSC") of 1.00% on certain purchases of $500,000 or more that are redeemed in whole or in part within 18 months of purchase. If these sales charges were included total returns would be lower. |
| 5 | The Advisor reimbursed the Tax Advantaged Income Fund $658 for losses from a trade error. This reimbursement had no impact to the total return. |
| 6 | Does not include expenses of the investment companies in which the Fund invests. |
| 7 | If interest expense and commitment fees had been excluded, the expense ratios would have been lowered by 0.01% for the year ended December 31, 2023. For the prior years ended December 31, 2022, 2021, 2020, and 2019, the ratios would have been lowered by 0.02%, 0.01%, 0.04%, and 0.01%, respectively. |
| 8 | Effective March 15, 2018 the Fund's advisor has voluntarily agreed to waive its fees and/or pay for operating expenses of the Fund to ensure that the total annual fund operating expenses (excluding, as applicable, any taxes, leverage interest, brokerage commissions, dividend and interest expenses on short sales, acquired fund fees and expenses (as determined in accordance with Form N-1A), expenses incurred in connection with any merger or reorganization, or extraordinary expenses such as litigation expenses) do not exceed 1.50% of the average daily net assets until April 30, 2022. The voluntary waiver was terminated effective May 1, 2022, and the expense limitation is 1.60%. |
See accompanying Notes to Financial Statements.
| 13 |
Robinson Tax Advantaged Income Fund
FINANCIAL HIGHLIGHTS
Class C
Per share operating performance.
For a capital share outstanding throughout each period.
| For the Year Ended December 31, | ||||||||||||||||||||
| 2023 | 2022 | 2021 | 2020 | 2019 | ||||||||||||||||
| Net asset value, beginning of period | $ | 8.35 | $ | 9.48 | $ | 9.37 | $ | 9.62 | $ | 8.63 | ||||||||||
| Income from Investment Operations: | ||||||||||||||||||||
| Net investment income (loss)1,2 | 0.12 | 0.15 | 0.17 | 0.21 | 0.21 | |||||||||||||||
| Net realized and unrealized gain (loss) | 0.11 | (1.08 | ) | 0.59 | (0.26 | ) | 0.99 | |||||||||||||
| Net increase from payment by affiliates | - | - | - | 3 | - | - | ||||||||||||||
| Total from investment operations | 0.23 | (0.93 | ) | 0.76 | (0.05 | ) | 1.20 | |||||||||||||
| Less Distributions: | ||||||||||||||||||||
| From net investment income | (0.13 | ) | (0.17 | ) | (0.19 | ) | (0.20 | ) | (0.21 | ) | ||||||||||
| From net realized gain | - | (0.03 | ) | (0.46 | ) | - | - | |||||||||||||
| From return of capital | (0.01 | ) | - | - | - | - | 3 | |||||||||||||
| Total distributions | (0.14 | ) | (0.20 | ) | (0.65 | ) | (0.20 | ) | (0.21 | ) | ||||||||||
| Net asset value, end of period | $ | 8.44 | $ | 8.35 | $ | 9.48 | $ | 9.37 | $ | 9.62 | ||||||||||
| Total return4 | 2.87 | % | (9.73 | )% | 8.17 | %5 | (0.33 | )% | 14.08 | % | ||||||||||
| Ratios and Supplemental Data: | ||||||||||||||||||||
| Net assets, end of period (in thousands) | $ | 2,279 | $ | 5,460 | $ | 9,221 | $ | 9,419 | $ | 7,706 | ||||||||||
| Ratio of expenses to average net assets (including interest expense and commitment fees): | ||||||||||||||||||||
| Before fees waived and expenses absorbed/recovered6,7 | 2.39 | % | 2.43 | % | 2.39 | % | 2.40 | % | 2.38 | % | ||||||||||
| After fees waived and expenses absorbed/recovered6,7 | 2.36 | % | 2.33 | %8 | 2.26 | % | 2.29 | % | 2.26 | % | ||||||||||
| Ratio of net investment income (loss) to average net assets (including interest expense and commitment fees): | ||||||||||||||||||||
| Before fees waived and expenses absorbed/recovered2 | 1.48 | % | 1.67 | % | 1.62 | % | 2.19 | % | 2.14 | % | ||||||||||
| After fees waived and expenses absorbed/recovered2 | 1.51 | % | 1.77 | % | 1.75 | % | 2.30 | % | 2.26 | % | ||||||||||
| Portfolio turnover rate | 105 | % | 255 | % | 270 | % | 185 | % | 78 | % | ||||||||||
| 1 | Based on average shares outstanding for the period. |
| 2 | Recognition of the net investment income by the Fund is affected by the timing of the declaration of dividends by the underlying investment companies in which the Fund invests. The ratio does not include net investment income of the investment companies in which the Fund invests. |
| 3 | Amount represents less than $0.01 per share. |
| 4 | Total returns would have been lower/higher had expenses not been waived or absorbed/recovered by the Advisor. Returns shown do not reflect the deduction of taxes that a shareholder would pay on Fund distributions or the redemption of Fund shares. Returns shown do not include payment of a Contingent Deferred Sales Charge ("CDSC") of 1.00% on purchases that are redeemed in whole or in part within 12 months of purchase. If these sales charges were included total returns would be lower. |
| 5 | The Advisor reimbursed the Tax Advantaged Income Fund $658 for losses from a trade error. This reimbursement had no impact to the total return. |
| 6 | Does not include expenses of the investment companies in which the Fund invests. |
| 7 | If interest expense and commitment fees had been excluded, the expense ratios would have been lowered by 0.01% for the year ended December 31, 2023. For the prior years ended December 31, 2022, 2021, 2020, and 2019, the ratios would have been lowered by 0.02%, 0.01%, 0.04%, and 0.01%, respectively. |
| 8 | Effective March 15, 2018 the Fund's advisor has voluntarily agreed to waive its fees and/or pay for operating expenses of the Fund to ensure that the total annual fund operating expenses (excluding, as applicable, any taxes, leverage interest, brokerage commissions, dividend and interest expenses on short sales, acquired fund fees and expenses (as determined in accordance with Form N-1A), expenses incurred in connection with any merger or reorganization, or extraordinary expenses such as litigation expenses) do not exceed 2.25% of the average daily net assets until April 30, 2022. The voluntary waiver was terminated effective May 1, 2022, and the expense limitation is 2.35%. |
See accompanying Notes to Financial Statements.
| 14 |
Robinson Tax Advantaged Income Fund
FINANCIAL HIGHLIGHTS
Institutional Class
Per share operating performance.
For a capital share outstanding throughout each period.
| For the Year Ended December 31, | ||||||||||||||||||||
| 2023 | 2022 | 2021 | 2020 | 2019 | ||||||||||||||||
| Net asset value, beginning of period | $ | 8.35 | $ | 9.48 | $ | 9.37 | $ | 9.62 | $ | 8.64 | ||||||||||
| Income from Investment Operations: | ||||||||||||||||||||
| Net investment income (loss) 1,2 | 0.21 | 0.24 | 0.27 | 0.29 | 0.31 | |||||||||||||||
| Net realized and unrealized gain (loss) | 0.10 | (1.08 | ) | 0.59 | (0.25 | ) | 0.99 | |||||||||||||
| Net increase from payment by affiliates | - | - | - | 3 | - | - | ||||||||||||||
| Total from investment operations | 0.31 | (0.84 | ) | 0.86 | 0.04 | 1.30 | ||||||||||||||
| Less Distributions: | ||||||||||||||||||||
| From net investment income | (0.21 | ) | (0.26 | ) | (0.29 | ) | (0.29 | ) | (0.31 | ) | ||||||||||
| From net realized gain | - | (0.03 | ) | (0.46 | ) | - | - | |||||||||||||
| From return of capital | (0.02 | ) | - | - | - | (0.01 | ) | |||||||||||||
| Total distributions | (0.23 | ) | (0.29 | ) | (0.75 | ) | (0.29 | ) | (0.32 | ) | ||||||||||
| Net asset value, end of period | $ | 8.43 | $ | 8.35 | $ | 9.48 | $ | 9.37 | $ | 9.62 | ||||||||||
| Total return4 | 3.81 | % | (8.79 | )% | 9.26 | %5 | 0.70 | % | 15.11 | % | ||||||||||
| Ratios and Supplemental Data: | ||||||||||||||||||||
| Net assets, end of period (in thousands) | $ | 210,963 | $ | 134,755 | $ | 97,671 | $ | 110,937 | $ | 213,150 | ||||||||||
| Ratio of expenses to average net assets (including interest expense and commitment fees): | ||||||||||||||||||||
| Before fees waived and expenses absorbed/recovered6,7 | 1.39 | % | 1.43 | % | 1.39 | % | 1.40 | % | 1.38 | % | ||||||||||
| After fees waived and expenses absorbed/recovered6,7 | 1.36 | % | 1.33 | %8 | 1.26 | % | 1.29 | % | 1.26 | % | ||||||||||
| Ratio of net investment income (loss) to average net assets (including interest expense and commitment fees): | ||||||||||||||||||||
| Before fees waived and expenses absorbed/recovered2 | 2.48 | % | 2.67 | % | 2.62 | % | 3.19 | % | 3.14 | % | ||||||||||
| After fees waived and expenses absorbed/recovered2 | 2.51 | % | 2.77 | % | 2.75 | % | 3.30 | % | 3.26 | % | ||||||||||
| Portfolio turnover rate | 105 | % | 255 | % | 270 | % | 185 | % | 78 | % | ||||||||||
| 1 | Based on average shares outstanding for the period. |
| 2 | Recognition of the net investment income by the Fund is affected by the timing of the declaration of dividends by the underlying investment companies in which the Fund invests. The ratio does not include net investment income of the investment companies in which the Fund invests. |
| 3 | Amount represents less than $0.01 per share. |
| 4 | Total returns would have been lower/higher had expenses not been waived or absorbed/recovered by the Advisor. Returns shown do not reflect the deduction of taxes that a shareholder would pay on Fund distributions or the redemption of Fund shares. |
| 5 | The Advisor reimbursed the Tax Advantaged Income Fund $658 for losses from a trade error. This reimbursement had no impact to the total return. |
| 6 | Does not include expenses of the investment companies in which the Fund invests. |
| 7 | If interest expense and commitment fees had been excluded, the expense ratios would have been lowered by 0.01% for the year ended December 31, 2023. For the prior years ended December 31, 2022, 2021, 2020, and 2019, the ratios would have been lowered by 0.02%, 0.01%, 0.04%, and 0.01%, respectively. |
| 8 | Effective March 15, 2018 the Fund's advisor has voluntarily agreed to waive its fees and/or pay for operating expenses of the Fund to ensure that the total annual fund operating expenses (excluding, as applicable, any taxes, leverage interest, brokerage commissions, dividend and interest expenses on short sales, acquired fund fees and expenses (as determined in accordance with Form N-1A), expenses incurred in connection with any merger or reorganization, or extraordinary expenses such as litigation expenses) do not exceed 1.25% of the average daily net assets until April 30, 2022. The voluntary waiver was terminated effective May 1, 2022, and the expense limitation is 1.35%. |
See accompanying Notes to Financial Statements.
| 15 |
January 31, 2024
Dear Shareholders:
We are pleased to present the Robinson Opportunistic Income Fund’s (“the Fund”) Annual Report covering the year ended December 31, 2023.
Investment Performance. Global credit markets, as measured by the Fund’s benchmark, the Bloomberg Global Aggregate Credit Index (the “Index”), managed to rally the last two months of the year to post a strong 9.24% return for 2023. The yield on that index started the year at 5%, got as high as 5.8% in late-October and then reversed course to close the year at 4.5%. The Robinson Opportunistic Income Fund more than kept pace, closing the year with a 12.38% total return. That return for the Fund’s Institutional Share Class was comprised of a $0.72 per share increase in net asset value and $0.35 per share in distributions to shareholders.
For the first nine months of the year the Fund’s strong performance was due to its nearly 60% exposure to variable rate asset classes (pre-merger Special Purpose Acquisition Companies and senior bank loan closed-end funds), which benefit directly from Fed rate hikes. Specifically, the Fund’s variable rate holdings were up more than 6.5% over the first nine months, whereas the Index returned 0.5% over that same period. As it became apparent early in Q4 2023 that the Fed was likely near the end of this rate hike cycle, we began reducing the Fund’s exposure to variable rate asset classes. Unfortunately, we did not move quick enough, and our variable rate holdings did not benefit at all in the 0.75% decline in longer-term interest rates during the quarter. The Fund’s variable rate holdings returned approximately 2.5% in the fourth quarter, whereas the Index returned 8.7%. Nonetheless, for the full year our asset allocation and security selection decisions were the primary contributors to the Fund’s more than 3% outperformance versus the Index.
Portfolio Composition. In accordance with the Fund’s investment strategy, as of December 31, 2023, 60% was invested in taxable closed-end funds (“CEFs”) with another 35% invested in pre-merger Special Purpose Acquisition Companies (“SPACs”). As of year-end the Fund’s Institutional Share had a net weighted average distribution yield of 5.1% (SEC 30-Day Yield of 5.18%; Unsubsidized 30 Day SEC Yield of 3.96%). The taxable CEFs held in the portfolio were trading at a weighted average discount of 11.7% as of year-end. The 10-year weighted average discount for those same funds is 3.8%. The Fund had exposure to 18 taxable CEFs in four different income-oriented asset classes representing 62% of the Fund’s value. The Fund’s largest asset class exposure as of year-end was pre-merger SPACs (35.2%) followed by traditional high yield fixed income CEFs (29.8%), equity income CEFs (13.9%), senior bank loan CEFs (10.6%), preferred stock CEFs (7.7%) and cash equivalents (2.8%).
Market Outlook. We believe the Fund is well-positioned to extend its strong resurgence last year. With the Fed signaling the end to this rate hike cycle, and the likely start to the next rate cutting cycle beginning in March, money market fund yields may be at their peak levels for this cycle. We would expect investors to continue to lock in these attractive longer-term yields. Moreover, any reduction in short-term yields reduces the cost of leverage for closed-end funds, which in turn, increases the amount of distributable income. Specifically, we would point to the following as being particularly beneficial to the Opportunistic Income Fund’s strategy:
Potential Income Cushion: as of year end the Fund’s net income distribution yield divided by its net hedged duration suggests it can withstand another 4% rise in rates before completely eroding the income stream, whereas the Bloomberg Global Aggregate Credit Index can only withstand a 0.75% rise in rates before its income has been wiped out.
Inflation: the Fund’s shorter net hedged duration, coupled with its remaining variable rate exposures, could provide potential stability should there be a reemergence of inflation.
| 16 |
Upside Potential: the Fund’s holdings of taxable credit CEFs have a weighted average discount of -11.7% versus the 10-year historic average discount for those same CEFs of -3.8%.
We value your trust and confidence in the Fund and thank you for your support.
Best Regards,
James C. Robinson
Portfolio Manager
IMPORTANT RISKS AND DISCLOSURES
The views expressed in this report reflect those of the Fund’s Sub-Advisor as of the date this is written and may not reflect its views on the date this report is first published or anytime thereafter. These views are intended to assist shareholders in understanding the Fund’s investment methodology and do not constitute investment advice. This report may contain discussions about investments that may or may not be held by the Fund as of the date of this report. All current and future holdings are subject to risk and to change. To the extent this report contains forward looking statements, unforeseen circumstances may cause actual results to differ materially from the views expressed as of the date this is written.
An investment in the Fund is subject to risk, including the possible loss of principal amount invested and including, but not limited to, the following risks, which are more fully described in the prospectus: Fixed income/interest rate risk: A rise in interest rates could negatively impact the value of the Fund’s shares. Generally, fixed income securities decrease in value if interest rates rise, and increase in value if interest rates fall, with longer-term securities being more sensitive than shorter-term securities. High yield (“junk bond”) risk: High yield (“junk”) bonds are speculative, involve greater risks of default, downgrade, or price declines and are more volatile and tend to be less liquid than investment-grade securities. Closed-end fund (CEF), exchange-traded fund (ETF) and open-end fund (Mutual Fund) risk: The Fund’s investments in CEFs, ETFs and Mutual Funds (“underlying funds”) are subject to various risks, including management’s ability to manage the underlying fund’s portfolio, risks associated with the underlying securities, fluctuation in the market value of the underlying fund’s shares, and the Fund bearing a pro rata share of the fees and expenses of each underlying fund in which the Fund invests. Recent Market Events: Periods of market volatility may occur in response to market events and other economic, political, and global macro factors, such as governmental actions to mitigate the Covid-19 pandemic, and the recent rise of inflation, could adversely affect the value of the Fund’s investments. Management Risk: selection of Fund investments is dependent on views of the Sub-advisor. Derivatives risk: The Fund and the underlying funds may use futures contracts, options, swap agreements, and/or sell securities short. Futures contracts may cause the value of the Fund’s shares to be more volatile and expose the Fund to leverage and tracking risks; the Fund may not fully benefit from or may lose money on option or shorting strategies; swaps may be leveraged, are subject to counterparty risk and may be difficult to value or liquidate. Leveraging risk: The underlying Funds in which the Fund invests may be leveraged as a result of borrowing or other investment techniques. As a result, the Fund will be exposed indirectly to leverage through its investment in an underlying fund that utilizes leverage. The use of leverage may magnify the Fund’s gains or losses and make the Fund more volatile. SPACs Risk: As SPACs and similar entities generally have no operating history or ongoing business other than seeking acquisitions, the value of their securities is particularly dependent on the ability of the entity’s management to identify and complete a profitable acquisition. ETN risk: Investing in ETNs exposes the Fund to the credit risks of the issuer. Tax risk: There is no guarantee that the Fund’s distributions will be characterized as income for U.S. federal income tax purposes. Liquidity Risk: There can be no guarantee that an active market in shares of CEFs and ETFs held by the Fund will exist. The Fund may not be able to sell some or all of the investments it holds due to a lack of demand in the marketplace or other factors such as market turmoil, or if the Fund is forced to sell an asset to meet redemption requests, it may only be able to sell those investments at a loss. Portfolio Turnover Risk: The Fund’s turnover rate may be high. A high turnover rate may lead to higher transaction costs, a greater number of taxable transactions, and negatively affect the Fund’s performance. Bank loan risk: The underlying funds may invest in loan participations of any quality, including “distressed” companies with respect to which there is a substantial risk of losing the entire amount invested. LIBOR risk: The underlying funds may invest in securities, such as senior bank loans, that utilize the London Interbank Offered Rate (“LIBOR”), a common benchmark interest rate index used to make adjustments to variable-rate loans. LIBOR is being phased out. The majority of the USD LIBOR publications are scheduled to be phased out by June 30, 2023, although the remainder of LIBOR publications ended on December 31, 2021. Any effects of the transition away from LIBOR could result in losses to the underlying funds in which the Fund invests and to the Fund. Convertible securities risk: The underlying funds may invest in convertible securities, which are subject to market risk, interest rate risk, and credit risk. Preferred stock risk: The underlying funds may invest in preferred stock, which is subject to company-specific and market risks applicable to equity securities, and is also sensitive to changes in the company’s creditworthiness and changes in interest rates.
| 17 |
30-Day SEC Yield is based on a 30-day period ending on the last day of the previous month and is computed by dividing the net investment income per share earned during the period by the maximum offering price per share on the last day of the period. This subsidized yield is based on the net expenses of the Fund of which the yield would be lower without the waivers in effect. Negative 30-Day SEC Yield results when accrued expenses of the past 30 days exceed the income collected during the past 30 days. Unsubsidized 30 Day SEC Yield is based on total expenses of the Fund.
Distribution Yield is the measurement of cash flow paid by an income-paying vehicle. Rather than calculating the yield based on an aggregate of distributions, the most recent distribution is annualized and divided by the net asset value (NAV) of the security at the time of the payment.
A special purpose acquisition company (SPAC) is a company that has no commercial operations and is formed strictly to raise capital through an initial public offering (IPO) or the purpose of acquiring or merging with an existing company. Weighted average discount is a measurement of a closed-end fund's trading at a discount to NAV. Weighted average is a calculation that takes into account the varying degrees of importance of the numbers in a data set, rather than a simple average.
Bloomberg Global Aggregate Credit Index covers the credit sector of the global investment grade fixed-rate bond market. Credit issuers include corporate, sovereign (when issuing in a currency other than the sovereign's home currency), supranational, and foreign local agencies/authorities.
One cannot invest directly in an index.
| 18 |
Robinson Opportunistic Income Fund
FUND PERFORMANCE at December 31, 2023 (Unaudited)
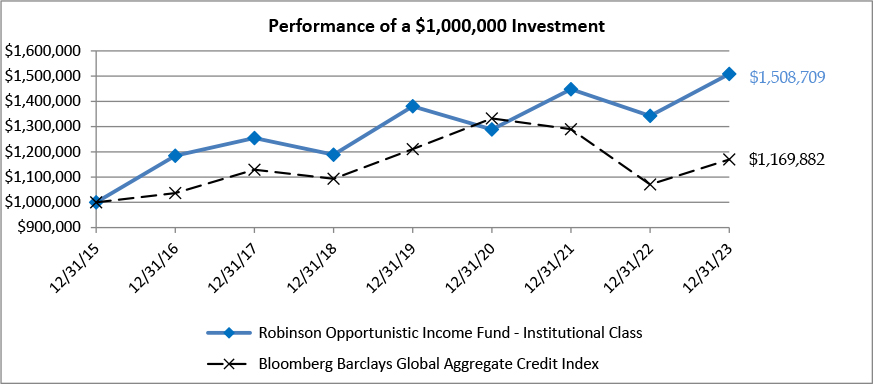
This graph compares a hypothetical $1,000,000 investment in the Fund’s Institutional Class shares, made at its inception, with a similar investment in the Bloomberg Global Aggregate Credit Index. The performance graph above is shown for the Fund’s Institutional Class shares; Class A shares and Class C shares performance may vary. Results include the reinvestment of all dividends and capital gains.
The Bloomberg Global Aggregate Credit Index covers the credit sector of the global investment grade fixed-rate bond market. Credit issuers include corporate, sovereign (when issuing in a currency other than the sovereign’s home currency), supranational, and foreign local agencies/authorities. This index does not reflect expenses, fees or sales charge, which would lower performance. The index is unmanaged, and it is not available for investment.
| Average Annual Total Returns as of December 31, 2023 | 1 Year | 5 Years | Since Inception | Inception Date |
| Before deducting maximum sales charge | ||||
| Class A¹ | 12.20% | 4.64% | 5.02% | 12/31/15 |
| Class C² | 11.41% | 3.85% | 4.23% | 12/31/15 |
| Institutional Class³ | 12.38% | 4.88% | 5.28% | 12/31/15 |
| After deducting maximum sales charge | ||||
| Class A¹ | 7.44% | 3.73% | 4.25% | 12/31/15 |
| Class C² | 10.41% | 3.85% | 4.23% | 12/31/15 |
| Bloomberg Global Aggregate Credit Index | 9.24% | 1.36% | 1.98% | 12/31/15 |
| ¹ | Maximum initial sales charge for Class A shares is 4.25%. No initial sales charge is applied to purchases of $1 million or more. A contingent deferred sales charge (“CSDC”) of 1.00% will be charged on certain Class A share purchases of $1 million or more that are redeemed in whole or in part within 12 months of the date of purchase. |
| ² | A contingent deferred sales charge (“CDSC”) of 1.00% will be charged on Class C share purchases that are redeemed in whole or in part within 12 months of the date of purchase. |
| ³ | Institutional Class shares do not have any initial or contingent deferred sales charge. |
The performance data quoted here represents past performance and past performance is not a guarantee of future results. Investment return and principal value will fluctuate so that an investor's shares, when redeemed, may be worth more or less than their original cost. Current performance may be lower or higher than the performance information quoted. The most recent month end performance may be obtained by calling (800) 207-7108.
| 19 |
Robinson Opportunistic Income Fund
FUND PERFORMANCE at December 31, 2023 (Unaudited) - Continued
Gross and Net Expense Ratios for Class A shares were 3.79% and 2.43%, respectively, for Class C shares were 4.54% and 3.18%, respectively, and for Institutional Class shares were 3.54% and 2.18%, respectively, which were the amounts stated in the current prospectus dated April 30, 2023. For the Fund’s current one year expense ratios, please refer to the Financial Highlights section of this report. The Fund’s Advisor has contractually agreed to waive its fees and/or pay for operating expenses of the Fund to ensure that the total annual fund operating expenses (excluding, as applicable, taxes, leverage interest, brokerage commissions, dividend and interest expenses on short sales, acquired fund fees and expenses (as determined in accordance with Form N-1A), expenses incurred in connection with any merger or reorganization and extraordinary expenses such as litigation expenses) do not exceed 1.60%, 2.35% and 1.35% of the average daily net assets of the Class A shares, Class C shares, and Institutional Class shares, respectively. This agreement is in effect until April 30, 2024, and may be terminated before that date only by the Trust’s Board of Trustee. In the absence of such waivers, the Fund’s returns would be lower.
Returns reflect the reinvestment of distributions made by the Fund, if any. The graph and the performance table above do not reflect the deduction of taxes that a shareholder would pay on Fund distributions or the redemption of Fund shares.
| 20 |
Robinson Opportunistic Income Fund
SCHEDULE OF INVESTMENTS
As of December 31, 2023
| Number of Shares | Value | |||||||
| CLOSED-END FUNDS — 62.2% | ||||||||
| 44,492 | Allspring Utilities and High Income Fund | $ | 409,772 | |||||
| 41,759 | Blackstone Strategic Credit 2027 Term Fund | 472,712 | ||||||
| 45,102 | Brookfield Real Assets Income Fund, Inc. | 577,757 | ||||||
| 15,000 | ClearBridge Energy Midstream Opportunity Fund, Inc. | 523,800 | ||||||
| 1,587 | ClearBridge MLP & Midstream Fund, Inc. | 63,623 | ||||||
| 6,101 | ClearBridge MLP & Midstream Total Return Fund, Inc. | 221,039 | ||||||
| 26,059 | Flaherty & Crumrine Dynamic Preferred and Income Fund, Inc. | 462,547 | ||||||
| 44,708 | Flaherty & Crumrine Preferred & Income Fund, Inc. | 441,715 | ||||||
| 83,152 | FS Credit Opportunities Corp. - Class USD | 471,472 | ||||||
| 33,114 | KKR Income Opportunities Fund | 416,243 | ||||||
| 23,154 | Nuveen Floating Rate Income Fund | 190,326 | ||||||
| 36,807 | PGIM High Yield Bond Fund, Inc. | 453,462 | ||||||
| 38,987 | PGIM Short Duration High Yield Opportunities Fund | 584,805 | ||||||
| 59,041 | Saba Capital Income & Opportunities Fund | 455,206 | ||||||
| 166,098 | Virtus Convertible & Income Fund | 559,750 | ||||||
| 141,348 | Virtus Convertible & Income Fund II | 421,217 | ||||||
| 40,000 | Western Asset Diversified Income Fund | 564,000 | ||||||
| TOTAL CLOSED-END FUNDS | ||||||||
| (Cost $ 7,291,899) | 7,289,446 | |||||||
| COMMON STOCKS — 35.1% | ||||||||
| SPECIFIED PURPOSE ACQUISITION COMPANIES – 35.1% | ||||||||
| 12,000 | Alchemy Investments Acquisition Corp. 1*,1 | 127,680 | ||||||
| 10,000 | AltEnergy Acquisition Corp. - Class A* | 109,000 | ||||||
| 17,500 | Battery Future Acquisition Corp. - Class A*,1 | 190,750 | ||||||
| 20,000 | Berenson Acquisition Corp. I - Class A* | 205,000 | ||||||
| 5,000 | Bowen Acquisition Corp.*,1 | 51,600 | ||||||
| 20,000 | BurTech Acquisition Corp. - Class A* | 214,900 | ||||||
| 20,000 | Chain Bridge I - Class A*,1 | 217,000 | ||||||
| 20,000 | Concord Acquisition Corp. II - Class A* | 207,600 | ||||||
| 20,000 | Crown PropTech Acquisitions - Class A*,1 | 213,000 | ||||||
| 20,000 | Direct Selling Acquisition Corp. - Class A* | 217,798 | ||||||
| 20,000 | EVe Mobility Acquisition Corp. - Class A*,1 | 216,200 | ||||||
| 11,267 | Focus Impact BH3 Acquisition Co. - Class A* | 117,402 | ||||||
| 20,000 | FTAC Emerald Acquisition Corp. - Class A* | 211,400 | ||||||
| 19,600 | Global Partner Acquisition Corp. II - Class A*,1 | 216,776 | ||||||
| 20,000 | Gores Holdings IX, Inc. - Class A* | 210,000 | ||||||
| 5,000 | Haymaker Acquisition Corp. 4*,1 | 51,350 | ||||||
| 16,447 | Hennessy Capital Investment Corp. VI - Class A* | 171,542 | ||||||
| 7,000 | Inflection Point Acquisition Corp. II - Class A*,1 | 72,310 | ||||||
| 17,500 | Kensington Capital Acquisition Corp. V - Class A*,1 | 187,075 | ||||||
| 20,000 | Northern Star Investment Corp. IV - Class A* | 210,000 | ||||||
| 19,059 | Project Energy Reimagined Acquisition Corp.*,1 | 201,644 | ||||||
| 1,062 | Roth CH Acquisition V Co.* | 11,289 | ||||||
| 21 |
Robinson Opportunistic Income Fund
SCHEDULE OF INVESTMENTS - Continued
As of December 31, 2023
| Number of Shares | Value | |||||||
| COMMON STOCKS (Continued) | ||||||||
| SPECIFIED PURPOSE ACQUISITION COMPANIES – (Continued) | ||||||||
| 10,000 | Southport Acquisition Corp.* | $ | 106,350 | |||||
| 20,000 | Twelve Seas Investment Co. II - Class A* | 211,700 | ||||||
| 16,092 | Welsbach Technology Metals Acquisition Corp.* | 172,346 | ||||||
| 4,121,712 | ||||||||
| TOTAL COMMON STOCKS | ||||||||
| (Cost $ 4,024,451) | 4,121,712 | |||||||
| RIGHTS — 0.0% | ||||||||
| 5,000 | Bowen Acquisition Corp., Expiration Date: November 26, 2026*,1 | 601 | ||||||
| TOTAL RIGHTS | ||||||||
| (Cost $ 0) | 601 | |||||||
| WARRANTS — 0.0% | ||||||||
| 6,000 | Alchemy Investments Acquisition Corp. 1, Expiration Date: June 26, 2028*,1 | 900 | ||||||
| 3,400 | Churchill Capital Corp. VII, Expiration Date: February 29, 2028* | 557 | ||||||
| 15,310 | Electriq Power Holdings, Inc., Expiration Date: January 25, 2028* | 15 | ||||||
| 11,805 | Estrella Immunopharma, Inc., Expiration Date: July 18, 2028* | 503 | ||||||
| 4,557 | Getaround, Inc., Expiration Date: December 31, 2027* | 16 | ||||||
| 5,000 | GigCapital5, Inc., Expiration Date: December 31, 2028* | 32 | ||||||
| 3,333 | Global Partner Acquisition Corp. II, Expiration Date: December 30, 2027*,1 | 84 | ||||||
| 2,500 | Haymaker Acquisition Corp. 4, Expiration Date: September 12, 2028*,1 | 413 | ||||||
| 3,500 | Inflection Point Acquisition Corp. II, Expiration Date: July 17, 2028*,1 | 350 | ||||||
| 3,703 | Northern Star Investment Corp. III, Expiration Date: February 24, 2028* | 63 | ||||||
| TOTAL WARRANTS | ||||||||
| (Cost $ 0) | 2,933 | |||||||
| Principal Amount | ||||||||
| SHORT-TERM INVESTMENTS — 2.0% | ||||||||
| $ | 236,221 | UMB Bank Demand Deposit, 0.01%2 | 236,221 | |||||
| TOTAL SHORT-TERM INVESTMENTS | ||||||||
| (Cost $ 236,221) | 236,221 | |||||||
| TOTAL INVESTMENTS — 99.3% | ||||||||
| (Cost $11,552,571) | 11,650,913 | |||||||
| Other Assets in Excess of Liabilities — 0.7% | 77,290 | |||||||
| TOTAL NET ASSETS — 100.0% | $ | 11,728,203 | ||||||
| * | Non-income producing security. |
| 1 | Foreign security denominated in U.S. Dollars. |
| 2 | The rate is the annualized seven-day yield at period end. |
See accompanying Notes to Financial Statements.
| 22 |
Robinson Opportunistic Income Fund
SCHEDULE OF INVESTMENTS - Continued
As of December 31, 2023
FUTURES CONTRACTS
| Number of Contracts Long (Short) | Description | Expiration Date | Notional Amount | Value/Unrealized Appreciation (Depreciation) | ||||||||
| (2) | E-mini Dow ($5) | March 2024 | $ | (374,810 | ) | $ | (5,310 | ) | ||||
| (4) | E-mini Russell 1000 | March 2024 | (324,540 | ) | (4,040 | ) | ||||||
| (10) | U.S. 10 Year Treasury Note | March 2024 | (1,102,500 | ) | (26,406 | ) | ||||||
| (3) | U.S. Treasury Long Bond | March 2024 | (352,175 | ) | (22,638 | ) | ||||||
| TOTAL FUTURES CONTRACTS | $ | (2,154,025 | ) | $ | (58,394 | ) | ||||||
See accompanying Notes to Financial Statements.
| 23 |
Robinson Opportunistic Income Fund
SUMMARY OF INVESTMENTS
As of December 31, 2023
| Security Type/Sector | Percent of Total Net Assets | |||
| Closed-End Funds | 62.2 | % | ||
| Common Stocks | 35.1 | % | ||
| Warrants | 0.0 | % | ||
| Rights | 0.0 | % | ||
| Short-Term Investments | 2.0 | % | ||
| Total Investments | 99.3 | % | ||
| Other Assets in Excess of Liabilities | 0.7 | % | ||
| Total Net Assets | 100.0 | % | ||
See accompanying Notes to Financial Statements.
| 24 |
Robinson Opportunistic Income Fund
STATEMENT OF ASSETS AND LIABILITIES
As of December 31, 2023
| Assets: | ||||
| Investments, at value (cost $11,552,571) | $ | 11,650,913 | ||
| Cash deposited with brokers for futures contracts | 295,743 | |||
| Receivables: | ||||
| Investment securities sold | 629,701 | |||
| Fund shares sold | 23,437 | |||
| Dividends and interest | 41,503 | |||
| Due from Advisor | 1,927 | |||
| Prepaid expenses | 19,426 | |||
| Total assets | 12,662,650 | |||
| Liabilities: | ||||
| Payables: | ||||
| Investment securities purchased | 808,951 | |||
| Variation margin on futures contracts | 58,394 | |||
| Shareholder servicing fees (Note 7) | 1,177 | |||
| Distribution fees - Class A & Class C (Note 6) | 1,241 | |||
| Fund services fees | 10,485 | |||
| Auditing fees | 20,765 | |||
| Trustees' deferred compensation (Note 3) | 14,369 | |||
| Chief Compliance Officer fees | 5,462 | |||
| Commitment fees payable (Note 12) | 4,009 | |||
| Trustees' fees and expenses | 189 | |||
| Accrued other expenses | 9,405 | |||
| Total liabilities | 934,447 | |||
| Commitments and contingencies (Note 3) | ||||
| Net Assets | $ | 11,728,203 | ||
| Components of Net Assets: | ||||
| Paid-in capital (par value of $0.01 per share with an unlimited number of shares authorized) | $ | 17,223,286 | ||
| Total distributable earnings (accumulated deficit) | (5,495,083 | ) | ||
| Net Assets | $ | 11,728,203 | ||
| Maximum Offering Price per Share: | ||||
| Class A Shares: | ||||
| Net assets applicable to shares outstanding | $ | 613,864 | ||
| Shares of beneficial interest issued and outstanding | 64,424 | |||
| Redemption price1 | $ | 9.53 | ||
| Maximum sales charge (4.25% of offering price)2 | 0.42 | |||
| Maximum offering price to public | $ | 9.95 | ||
| Class C Shares: | ||||
| Net assets applicable to shares outstanding | $ | 1,105,109 | ||
| Shares of beneficial interest issued and outstanding | 116,383 | |||
| Redemption price3 | $ | 9.50 | ||
| Institutional Class Shares: | ||||
| Net assets applicable to shares outstanding | $ | 10,009,230 | ||
| Shares of beneficial interest issued and outstanding | 1,050,936 | |||
| Redemption price | $ | 9.52 | ||
| 1 | A Contingent Deferred Sales Charge ("CDSC") of 1.00% may be imposed on certain purchases of $1 million or more that are redeemed in whole or in part within 12 months of purchase. |
| 2 | No initial sales charge is applied to purchases of $1 million or more. |
| 3 | A CDSC of 1.00% may be charged on purchases that are redeemed in whole or in part within 12 months of the date of purchase. |
See accompanying Notes to Financial Statements.
| 25 |
Robinson Opportunistic Income Fund
STATEMENT OF OPERATIONS
For the Year Ended December 31, 2023
| Investment income: | ||||
| Dividends | $ | 562,190 | ||
| Interest | 51 | |||
| Total investment income | 562,241 | |||
| Expenses: | ||||
| Advisory fees | 131,760 | |||
| Shareholder servicing fees (Note 7) | 2,020 | |||
| Distribution fees - Class A (Note 6) | 2,458 | |||
| Distribution fees - Class C (Note 6) | 12,029 | |||
| Fund services fees | 71,779 | |||
| Registration fees | 49,517 | |||
| Auditing fees | 21,309 | |||
| Chief Compliance Officer fees | 16,551 | |||
| Legal fees | 16,349 | |||
| Trustees' fees and expenses | 10,256 | |||
| Shareholder reporting fees | 7,727 | |||
| Miscellaneous | 3,612 | |||
| Insurance fees | 3,607 | |||
| Commitment fees (Note 12) | 1,212 | |||
| Total expenses | 350,186 | |||
| Advisory fees recovered (waived) | (131,760 | ) | ||
| Other expenses (waived) | (41,022 | ) | ||
| Net expenses | 177,404 | |||
| Net investment income (loss) | 384,837 | |||
| Realized and Unrealized Gain (Loss) on: | ||||
| Net realized gain (loss) on: | ||||
| Investments | (133,012 | ) | ||
| Futures contracts | 26,662 | |||
| Net realized gain (loss) on: | (106,350 | ) | ||
| Net change in unrealized appreciation/depreciation on: | ||||
| Investments | 1,240,855 | |||
| Futures contracts | (101,390 | ) | ||
| Net change in unrealized appreciation/depreciation | 1,139,465 | |||
| Net realized and unrealized gain (loss) | 1,033,115 | |||
| Net Increase (Decrease) in Net Assets from Operations | $ | 1,417,952 | ||
See accompanying Notes to Financial Statements.
| 26 |
Robinson Opportunistic Income Fund
STATEMENTS OF CHANGES IN NET ASSETS
| For the Year Ended December 31, 2023 | For the Year Ended December 31, 2022 | |||||||
| Increase (Decrease) in Net Assets from: | ||||||||
| Operations: | ||||||||
| Net investment income (loss) | $ | 384,837 | $ | 335,425 | ||||
| Net realized gain (loss) on investments and futures contracts | (106,350 | ) | 207,423 | |||||
| Net change in unrealized appreciation/depreciation on investments and futures contracts | 1,139,465 | (1,784,416 | ) | |||||
| Net increase (decrease) in net assets resulting from operations | 1,417,952 | (1,241,568 | ) | |||||
| Distributions to Shareholders: | ||||||||
| Distributions: | ||||||||
| Class A | (33,080 | ) | (26,984 | ) | ||||
| Class C | (33,193 | ) | (30,129 | ) | ||||
| Institutional Class | (372,699 | ) | (255,727 | ) | ||||
| Total distributions to shareholders | (438,972 | ) | (312,840 | ) | ||||
| Capital Transactions: | ||||||||
| Net proceeds from shares sold: | ||||||||
| Class A | 36,137 | 93,070 | ||||||
| Class C | 27,500 | 10,000 | ||||||
| Institutional Class | 3,154,462 | 3,445,795 | ||||||
| Reinvestment of distributions: | ||||||||
| Class A | 26,881 | 20,755 | ||||||
| Class C | 32,181 | 25,503 | ||||||
| Institutional Class | 164,421 | 124,896 | ||||||
| Cost of shares redeemed: | ||||||||
| Class A | (508,210 | ) | (465,705 | ) | ||||
| Class C | (314,513 | ) | (1,433,185 | ) | ||||
| Institutional Class | (3,309,996 | ) | (7,535,067 | ) | ||||
| Net increase (decrease) in net assets from capital transactions | (691,137 | ) | (5,713,938 | ) | ||||
| Total increase (decrease) in net assets | 287,843 | (7,268,346 | ) | |||||
| Net Assets: | ||||||||
| Beginning of period | 11,440,360 | 18,708,706 | ||||||
| End of period | $ | 11,728,203 | $ | 11,440,360 | ||||
| Capital Share Transactions: | ||||||||
| Shares sold: | ||||||||
| Class A | 3,939 | 10,085 | ||||||
| Class C | 2,949 | 1,074 | ||||||
| Institutional Class | 342,299 | 371,057 | ||||||
| Shares reinvested: | ||||||||
| Class A | 2,934 | 2,296 | ||||||
| Class C | 3,514 | 2,825 | ||||||
| Institutional Class | 17,803 | 13,799 | ||||||
| Shares redeemed: | ||||||||
| Class A | (53,686 | ) | (51,441 | ) | ||||
| Class C | (34,288 | ) | (158,581 | ) | ||||
| Institutional Class | (354,689 | ) | (814,304 | ) | ||||
| Net increase (decrease) in capital share transactions | (69,225 | ) | (623,190 | ) | ||||
See accompanying Notes to Financial Statements.
| 27 |
Robinson Opportunistic Income Fund
FINANCIAL HIGHLIGHTS
Class A
Per share operating performance.
For a capital share outstanding throughout each period.
| For the Year Ended December 31, | ||||||||||||||||||||
| 2023 | 2022 | 2021 | 2020 | 2019 | ||||||||||||||||
| Net asset value, beginning of period | $ | 8.80 | $ | 9.73 | $ | 9.00 | $ | 10.35 | $ | 9.47 | ||||||||||
| Income from Investment Operations: | ||||||||||||||||||||
| Net investment income (loss)1,2 | 0.28 | 0.21 | 0.28 | 0.57 | 0.58 | |||||||||||||||
| Net realized and unrealized gain (loss) | 0.78 | (0.94 | ) | 0.79 | (1.33 | ) | 0.89 | |||||||||||||
| Total from investment operations | 1.06 | (0.73 | ) | 1.07 | (0.76 | ) | 1.47 | |||||||||||||
| Less Distributions: | ||||||||||||||||||||
| From net investment income | (0.33 | ) | (0.20 | ) | (0.32 | ) | (0.59 | ) | (0.59 | ) | ||||||||||
| From return of capital | - | - | (0.02 | ) | - | - | ||||||||||||||
| Total distributions | (0.33 | ) | (0.20 | ) | (0.34 | ) | (0.59 | ) | (0.59 | ) | ||||||||||
| Net asset value, end of period | $ | 9.53 | $ | 8.80 | $ | 9.73 | $ | 9.00 | $ | 10.35 | ||||||||||
| Total return3 | 12.20 | % | (7.51 | )% | 12.08 | % | (6.90 | )% | 15.83 | % | ||||||||||
| Ratios and Supplemental Data: | ||||||||||||||||||||
| Net assets, end of period (in thousands) | $ | 614 | $ | 979 | $ | 1,463 | $ | 2,061 | $ | 4,553 | ||||||||||
| Ratio of expenses to average net assets (including interest expense and commitment fees): | ||||||||||||||||||||
| Before fees waived and expenses absorbed/recovered4,5 | 3.05 | % | 2.99 | % | 2.42 | % | 2.31 | % | 2.12 | % | ||||||||||
| After fees waived and expenses absorbed/recovered4,5 | 1.61 | % | 1.63 | % | 1.62 | % | 1.63 | % | 1.62 | % | ||||||||||
| Ratio of net investment income (loss) to average net assets (including interest expense and commitment fees): | ||||||||||||||||||||
| Before fees waived and expenses absorbed/recovered2 | 1.64 | % | 0.98 | % | 2.20 | % | 5.77 | % | 5.21 | % | ||||||||||
| After fees waived and expenses absorbed/recovered2 | 3.08 | % | 2.34 | % | 3.00 | % | 6.45 | % | 5.71 | % | ||||||||||
| Portfolio turnover rate | 120 | % | 38 | % | 112 | % | 124 | % | 114 | % | ||||||||||
| 1 | Based on average shares outstanding for the period. |
| 2 | Recognition of the net investment income by the Fund is affected by the timing of the declaration of dividends by the underlying investment companies in which the Fund invests. The ratio does not include net investment income of the investment companies in which the Fund invests. |
| 3 | Total returns would have been lower/higher had expenses not been waived or absorbed/recovered by the Advisor. Returns shown do not reflect the deduction of taxes that a shareholder would pay on Fund distributions or the redemption of Fund shares. Returns shown do not include payment of sales load of 5.75% of offering price which is reduced on sales of $50,000 or more and no initial sales charge is applied to purchases of $1 million or more. Effective February 15, 2017, the Fund has lowered the maximum sales charge imposed on purchases of Class A Shares from 5.75% to 4.25%. Returns shown do not include payment of a Contingent Deferred Sales Charge ("CDSC") of 1.00% on certain purchases of $1 million or more that are redeemed in whole or in part within 12 months of purchase. If these sales charges were included total returns would be lower. |
| 4 | Does not include expenses of the investment companies in which the Fund invests. |
| 5 | If interest expense and commitment fees had been excluded, the expense ratios would have been lowered by 0.01% for the year ended December 31, 2023. For the prior years ended December 31, 2022, 2021, 2020, and 2019, the ratios would have been lowered by 0.03%, 0.02%, 0.03%, and 0.02%, respectively. |
See accompanying Notes to Financial Statements.
| 28 |
Robinson Opportunistic Income Fund
FINANCIAL HIGHLIGHTS
Class C
Per share operating performance.
For a capital share outstanding throughout each period.
| For the Year Ended December 31, | ||||||||||||||||||||
| 2023 | 2022 | 2021 | 2020 | 2019 | ||||||||||||||||
| Net asset value, beginning of period | $ | 8.77 | $ | 9.70 | $ | 8.97 | $ | 10.33 | $ | 9.45 | ||||||||||
| Income from Investment Operations: | ||||||||||||||||||||
| Net investment income (loss)1,2 | 0.21 | 0.14 | 0.21 | 0.50 | 0.50 | |||||||||||||||
| Net realized and unrealized gain (loss) | 0.78 | (0.93 | ) | 0.78 | (1.33 | ) | 0.90 | |||||||||||||
| Total from investment operations | 0.99 | (0.79 | ) | 0.99 | (0.83 | ) | 1.40 | |||||||||||||
| Less Distributions: | ||||||||||||||||||||
| From net investment income | (0.26 | ) | (0.14 | ) | (0.25 | ) | (0.53 | ) | (0.52 | ) | ||||||||||
| From return of capital | - | - | (0.01 | ) | - | - | ||||||||||||||
| Total distributions | (0.26 | ) | (0.14 | ) | (0.26 | ) | (0.53 | ) | (0.52 | ) | ||||||||||
| Net asset value, end of period | $ | 9.50 | $ | 8.77 | $ | 9.70 | $ | 8.97 | $ | 10.33 | ||||||||||
| Total return3 | 11.41 | % | (8.19 | )% | 11.15 | % | (7.62 | )% | 15.01 | % | ||||||||||
| Ratios and Supplemental Data: | ||||||||||||||||||||
| Net assets, end of period (in thousands) | $ | 1,105 | $ | 1,265 | $ | 2,900 | $ | 3,316 | $ | 4,586 | ||||||||||
| Ratio of expenses to average net assets (including interest expense and commitment fees): | ||||||||||||||||||||
| Before fees waived and expenses absorbed/recovered4,5 | 3.80 | % | 3.74 | % | 3.17 | % | 3.06 | % | 2.87 | % | ||||||||||
| After fees waived and expenses absorbed/recovered4,5 | 2.36 | % | 2.38 | % | 2.37 | % | 2.38 | % | 2.37 | % | ||||||||||
| Ratio of net investment income (loss) to average net assets (including interest expense and commitment fees): | ||||||||||||||||||||
| Before fees waived and expenses absorbed/recovered2 | 0.89 | % | 0.23 | % | 1.45 | % | 5.02 | % | 4.46 | % | ||||||||||
| After fees waived and expenses absorbed/recovered2 | 2.33 | % | 1.59 | % | 2.25 | % | 5.70 | % | 4.96 | % | ||||||||||
| Portfolio turnover rate | 120 | % | 38 | % | 112 | % | 124 | % | 114 | % | ||||||||||
| 1 | Based on average shares outstanding for the period. |
| 2 | Recognition of the net investment income by the Fund is affected by the timing of the declaration of dividends by the underlying investment companies in which the Fund invests. The ratio does not include net investment income of the investment companies in which the Fund invests. |
| 3 | Total returns would have been lower/higher had expenses not been waived or absorbed/recovered by the Advisor. Returns shown do not reflect the deduction of taxes that a shareholder would pay on Fund distributions or the redemption of Fund shares. Returns shown do not include payment of a Contingent Deferred Sales Charge ("CDSC") of 1.00% on purchases that are redeemed in whole or in part within 12 months of purchase. If these sales charges were included total returns would be lower. |
| 4 | Does not include expenses of the investment companies in which the Fund invests. |
| 5 | If interest expense and commitment fees had been excluded, the expense ratios would have been lowered by 0.01% for the year ended December 31, 2023. For the prior years ended December 31, 2022, 2021, 2020, and 2019, the ratios would have been lowered by 0.03%, 0.02%, 0.03%, and 0.02%, respectively. |
See accompanying Notes to Financial Statements.
| 29 |
Robinson Opportunistic Income Fund
FINANCIAL HIGHLIGHTS
Institutional Class
Per share operating performance.
For a capital share outstanding throughout each period.
| For the Year Ended December 31, | ||||||||||||||||||||
| 2023 | 2022 | 2021 | 2020 | 2019 | ||||||||||||||||
| Net asset value, beginning of period | $ | 8.80 | $ | 9.73 | $ | 8.99 | $ | 10.35 | $ | 9.47 | ||||||||||
| Income from Investment Operations: | ||||||||||||||||||||
| Net investment income (loss) 1,2 | 0.31 | 0.24 | 0.31 | 0.59 | 0.61 | |||||||||||||||
| Net realized and unrealized gain (loss) | 0.76 | (0.95 | ) | 0.79 | (1.34 | ) | 0.89 | |||||||||||||
| Total from investment operations | 1.07 | (0.71 | ) | 1.10 | (0.75 | ) | 1.50 | |||||||||||||
| Less Distributions: | ||||||||||||||||||||
| From net investment income | (0.35 | ) | (0.22 | ) | (0.34 | ) | (0.61 | ) | (0.62 | ) | ||||||||||
| From return of capital | - | - | (0.02 | ) | - | - | ||||||||||||||
| Total distributions | (0.35 | ) | (0.22 | ) | (0.36 | ) | (0.61 | ) | (0.62 | ) | ||||||||||
| Net asset value, end of period | $ | 9.52 | $ | 8.80 | $ | 9.73 | $ | 8.99 | $ | 10.35 | ||||||||||
| Total return3 | 12.38 | % | (7.29 | )% | 12.37 | % | (6.65 | )% | 16.13 | % | ||||||||||
| Ratios and Supplemental Data: | ||||||||||||||||||||
| Net assets, end of period (in thousands) | $ | 10,009 | $ | 9,197 | $ | 14,346 | $ | 17,457 | $ | 22,711 | ||||||||||
| Ratio of expenses to average net assets (including interest expense and commitment fees): | ||||||||||||||||||||
| Before fees waived and expenses absorbed/recovered4,5 | 2.80 | % | 2.74 | % | 2.17 | % | 2.06 | % | 1.87 | % | ||||||||||
| After fees waived and expenses absorbed/recovered4,5 | 1.36 | % | 1.38 | % | 1.37 | % | 1.38 | % | 1.37 | % | ||||||||||
| Ratio of net investment income (loss) to average net assets (including interest expense and commitment fees): | ||||||||||||||||||||
| Before fees waived and expenses absorbed/recovered2 | 1.89 | % | 1.23 | % | 2.45 | % | 6.02 | % | 5.46 | % | ||||||||||
| After fees waived and expenses absorbed/recovered2 | 3.33 | % | 2.59 | % | 3.25 | % | 6.70 | % | 5.96 | % | ||||||||||
| Portfolio turnover rate | 120 | % | 38 | % | 112 | % | 124 | % | 114 | % | ||||||||||
| 1 | Based on average shares outstanding for the period. |
| 2 | Recognition of the net investment income by the Fund is affected by the timing of the declaration of dividends by the underlying investment companies in which the Fund invests. The ratio does not include net investment income of the investment companies in which the Fund invests. |
| 3 | Total returns would have been lower/higher had expenses not been waived or absorbed/recovered by the Advisor. Returns shown do not reflect the deduction of taxes that a shareholder would pay on Fund distributions or the redemption of Fund shares. |
| 4 | Does not include expenses of the investment companies in which the Fund invests. |
| 5 | If interest expense and commitment fees had been excluded, the expense ratios would have been lowered by 0.01% for the year ended December 31, 2023. For the prior years ended December 31, 2022, 2021, 2020, and 2019, the ratios would have been lowered by 0.03%, 0.02%, 0.03%, and 0.02%, respectively. |
See accompanying Notes to Financial Statements.
| 30 |
Robinson Funds
NOTES TO FINANCIAL STATEMENTS
December 31, 2023
Note 1 – Organization
Robinson Tax Advantaged Income Fund (“Tax Advantaged Income” or “Tax Advantaged Income Fund”) and Robinson Opportunistic Income Fund (“Opportunistic Income” or “Opportunistic Income Fund”) (collectively referred to as the “Funds”) are organized as diversified series of Investment Managers Series Trust, a Delaware statutory trust (the “Trust”) which is registered as an open-end management investment company under the Investment Company Act of 1940, as amended (the “1940 Act”).
The Tax Advantaged Income Fund seeks total return with an emphasis on providing current income, a substantial portion of which will be exempt from federal income taxes. The Fund commenced investment operations on September 30, 2014. The Fund currently offers four classes of shares: A shares, C shares, T shares and Institutional shares. Class T shares are not currently available for purchase.
The Opportunistic Income Fund seeks total return with an emphasis on providing current income. The Fund commenced operations on December 31, 2015, prior to which its only activity was the receipt of a $10,000 investment from principals of the Fund’s advisor and a $36,879,274 transfer of shares of the Fund in exchange for the net assets of the Robinson Income and Principal Preservation Fund I, LP, a Delaware limited partnership (the “Company”). This exchange was nontaxable, whereby the Fund’s Institutional Class issued 3,687,927 shares for the net assets of the Company on December 31, 2015. Assets with a fair market value of $36,879,274 consisting of cash, interest receivable and securities of the Company with a fair value of $33,516,116 (identified costs of investments transferred were $35,067,906) and cash were the primary assets received by the Fund on January 1, 2016. For financial reporting purposes, assets received and shares issued by the Fund were recorded at fair value; however, the cost basis of the investments received from the Partnership was carried forward to align ongoing reporting of the Fund’s realized and unrealized gains and losses with amount distributable to shareholders for tax purposes. The Fund currently offers four classes of shares: A shares, C shares, T shares and Institutional shares. Class T shares are not currently available for purchase.
The shares of each class represent an interest in the same portfolio of investments of the Funds and have equal rights as to voting, redemptions, dividends, liquidation, income and expenses, except class specific expenses, subject to the approval of the Trustees. Income, expenses (other than expenses attributable to a specific class) and realized and unrealized gains and losses on investments are allocated to each class of shares in proportion to their relative net assets. Shareholders of a class that bears distribution and service expenses under the terms of a distribution plan have exclusive voting rights to that distribution plan.
Each Fund is an investment company and accordingly follows the investment company accounting and reporting guidance of the Financial Accounting Standards Board (FASB) Accounting Standard Codification, “Financial Services – Investment Companies”, Topic 946 (ASC 946).
Note 2 – Accounting Policies
The following is a summary of the significant accounting policies consistently followed by the Funds in the preparation of their financial statements. The preparation of financial statements in conformity with accounting principles generally accepted in the United States of America (“GAAP”) requires management to make estimates and assumptions that affect the reported amounts and disclosures in the financial statements. Actual results could differ from these estimates.
(a) Valuation of Investments
The Funds value equity securities at the last reported sale price on the principal exchange or in the principal over the counter (“OTC”) market in which such securities are traded, as of the close of regular trading on the NYSE on the day the securities are being valued or, if the last-quoted sales price is not readily available, the securities will be valued at the last bid or the mean between the last available bid and ask price. Securities traded on the NASDAQ are valued at the NASDAQ Official Closing Price (“NOCP”). Investments in open-end investment companies are valued at the daily closing net asset value of the respective investment company. Debt securities are valued by utilizing a price supplied by independent pricing service providers. The independent pricing service providers may use various valuation methodologies including matrix pricing and other analytical pricing models as well as market transactions and dealer quotations. These models generally consider such factors as yields or prices of bonds of comparable quality, type of issue, coupon, maturity, ratings and general market conditions. If a price is not readily available for a portfolio security, the security will be valued at fair value (the amount which the Fund might reasonably expect to receive for the security upon its current sale). The Board of Trustees has designated the Advisor as the Fund’s valuation designee (the “Valuation Designee”) to make all fair value determinations with respect to the Fund’s portfolio investments, subject to the Board’s oversight. As the Valuation Designee, the Advisor has adopted and implemented policies and procedures to be followed when the Fund must utilize fair value pricing. Prior to September 8, 2022, security valued at fair value as determined in good faith by the Fund’s advisor, subject to review and approval by the Valuation Committee, pursuant to procedures adopted by the Board of Trustees. The actions of the Valuation Committee were subsequently reviewed by the Board at its next regularly scheduled board meeting. The Valuation Committee met as needed. The Valuation Committee was comprised of all the Trustees, but action may had been taken by any one of the Trustees.
| 31 |
Robinson Funds
NOTES TO FINANCIAL STATEMENTS - Continued
December 31, 2023
Trading in securities on many foreign securities exchanges and OTC markets is normally completed before the close of business on each U.S. business day. In addition, securities trading in a particular country or countries may not take place on all U.S. business days or may take place on days which are not U.S. business days. Changes in valuations on certain securities may occur at times or on days on which the Fund’s net asset values (“NAV”) are not calculated and on which the Fund does not effect sales and redemptions of its shares.
(b) Investment Transactions, Investment Income and Expenses
Investment transactions are accounted for on the trade date. Realized gains and losses on investments are determined on the identified cost basis. Dividend income is recorded net of applicable withholding taxes on the ex-dividend date and interest income is recorded on an accrual basis. Withholding taxes on foreign dividends, if applicable, are paid (a portion of which may be reclaimable) or provided for in accordance with the applicable country’s tax rules and rates and are disclosed in the Statement of Operations. Withholding tax reclaims are filed in certain countries to recover a portion of the amounts previously withheld. The Funds record a reclaim receivable based on a number of factors, including a jurisdiction’s legal obligation to pay reclaims as well as payment history and market convention. Discounts on debt securities are accreted or amortized to interest income over the lives of the respective securities using the effective interest method. Premiums for callable debt securities are amortized to the earliest call date, if the call price was less than the purchase price. If the call price was not at par and the security was not called, the security is amortized to the next call price and date. Income and expenses of the Funds are allocated on a pro rata basis to each class of shares relative net assets, except for distribution and service fees which are unique to each class of shares. Expenses incurred by the Trust with respect to more than one Fund are allocated in proportion to the net assets of each Fund except where allocation of direct expenses to each Fund or an alternative allocation method can be more appropriately made.
(c) Closed-End Funds
The Funds invest in shares of closed-end funds (“CEFs”). Investments in closed-end funds are subject to various risks, including reliance on management’s ability to meet the closed-end fund’s investment objective and to manage the closed-end fund portfolio; fluctuation in the net asset value of closed-end fund shares compared to the changes in the value of the underlying securities that the closed-end fund owns; and bearing a pro rata share of the management fees and expenses of each underlying closed-end fund resulting in Fund’s shareholders being subject to higher expenses than if he or she invested directly in the closed-end fund(s). The closed-end funds in which the Funds will invest may be leveraged. As a result, the Funds may be exposed indirectly to leverage through investment in a closed-end fund. An investment in securities of a closed-end fund that uses leverage may expose the Fund to higher volatility in the market value of such securities and the possibility that the Fund’s long-term returns on such securities (and, indirectly, the long-term returns of the shares) will be diminished.
| 32 |
Robinson Funds
NOTES TO FINANCIAL STATEMENTS - Continued
December 31, 2023
(d) Municipal Bonds Risk
The underlying closed-end funds, in which the Tax Advantaged Fund invests in, primarily invest in municipal bonds. Litigation, legislation or other political events, local business or economic conditions or the bankruptcy of the issuer could have a significant effect on the ability of an issuer of municipal bonds to make payments of principal and/or interest. Political changes and uncertainties in the municipal market related to taxation, legislative changes or the rights of municipal security holders can significantly affect municipal bonds. If the Internal Revenue Service (the “IRS”) determines that an issuer of a municipal security has not complied with applicable tax requirements, interest from the security could become taxable and the security could significantly decline in value.
(e) Futures Contracts
The Funds may enter into futures contracts (including contracts relating to foreign currencies, interest rates, commodities securities and other financial indexes and other commodities), and purchase and write (sell) related options traded on exchanges designated by the Commodity Futures Trading Commission (“CFTC”) or, consistent with CFTC regulations, on foreign exchanges. The Funds intend primarily to invest in short positions on U.S. Treasury Futures contracts. A futures contract provides for the future sale by one party and purchase by another party of a specified quantity of the security or other financial instrument at a specified price and time. A futures contract on an index is an agreement pursuant to which two parties agree to take or make delivery of an amount of cash equal to the difference between the value of the index at the close of the last trading day of the contract and the price at which the index contract originally was written. The clearing house of the exchange on which a futures contract is entered into becomes the counterparty to each purchaser and seller of the futures contract.
A futures contract held by a Fund is valued daily at the official settlement price on the exchange on which it is traded. Each day a futures contract is held, the Fund pays or receives cash, called “variation margin,” equal to the daily change in value of the futures contract. Variation margin does not represent borrowing or a loan by the Fund but is instead a settlement between the Fund and the broker of the amount one would owe the other if the futures contract expired. The Fund also is required to deposit and to maintain margin with respect to put and call options on futures contracts written by it. Such margin deposits will vary depending on the nature of the underlying futures contract (and the related initial margin requirements), the current market value of the option and other futures positions held by the Fund. Although some futures contracts call for making or taking delivery of the underlying assets, generally these obligations are closed out prior to delivery by offsetting purchases or sales of matching futures contracts (involving the same exchange, underlying security or index and delivery month). If an offsetting purchase price is less than the original sale price, a Fund realizes a capital gain, or if it is more, the Fund realizes a capital loss. Conversely, if an offsetting sale price is more than the original purchase price, a Fund realizes a capital gain, or if it is less, the Fund realizes a capital loss. The transaction costs also must be included in these calculations. As discussed below, however, the Funds may not always be able to make an offsetting purchase or sale. In the case of a physically settled futures contract, this could result in the Funds being required to deliver, or receive, the underlying physical commodity, which could be adverse to the Funds.
At any time prior to the expiration of a futures contract, a Fund may seek to close the position by seeking to take an opposite position, which would operate to terminate the Fund’s existing position in the contract. Positions in futures contracts and options on futures contracts may be closed out only on the exchange on which they were entered into (or through a linked exchange). No secondary market for such contracts exists. Although the Funds may enter into futures contracts only if there is an active market for such contracts, there is no assurance that an active market will exist at any particular time. Most futures exchanges limit the amount of fluctuation permitted in futures contract prices during a single trading day. Once the daily limit has been reached in a particular contract, no trades may be made that day at a price beyond that limit or trading may be suspended for specified periods during the day. It is possible that futures contract prices could move to the daily limit for several consecutive trading days with little or no trading, thereby preventing prompt liquidation of futures positions at an advantageous price and subjecting the Fund to substantial losses. In such event, and in the event of adverse price movements, the Fund would be required to make daily cash payments of variation margin. In such situations, if the Fund had insufficient cash, it might have to sell assets to meet daily variation margin requirements at a time when it would be disadvantageous to do so. In addition, if the transaction is entered into for hedging purposes, in such circumstances the Fund may realize a loss on a futures contract or option that is not offset by an increase in the value of the hedged position. Losses incurred in futures transactions and the costs of these transactions will affect the Fund’s performance.
| 33 |
Robinson Funds
NOTES TO FINANCIAL STATEMENTS - Continued
December 31, 2023
(f) Short Sales
The Funds and the CEFs held by the Funds may sell securities short. Short sales are transactions under which the Funds sell a security they do not own in anticipation of a decline in the value of that security. To complete such a transaction, the Funds must borrow the security to make delivery to the buyer. The Funds then are obligated to replace the security borrowed by purchasing the security at market price at the time of replacement. The price at such time may be more or less than the price at which the security was sold by the Funds. When a security is sold short a decrease in the value of the security will be recognized as a gain and an increase in the value of the security will be recognized as a loss, which is potentially limitless. Until the security is replaced, the Funds are required to pay the lender amounts equal to dividend or interest that accrue during the period of the loan which is recorded as an expense. To borrow the security, the Funds also may be required to pay a premium or an interest fee, which are recorded as interest expense. Cash or securities are segregated for the broker to meet the necessary margin requirements. The Funds are subject to the risk that it may not always be able to close out a short position at a particular time or at an acceptable price.
(g) Exchange Traded Funds (“ETFs”)
ETFs typically trade on securities exchanges and their shares may, at times, trade at a premium or discount to their net asset values. In addition, an ETF may not replicate exactly the performance of the benchmark index it seeks to track for a number of reasons, including transaction costs incurred by the ETF, the temporary unavailability of certain index securities in the secondary market or discrepancies between the ETF and the index with respect to the weighting of securities or the number of securities held. Investing in ETFs, which are investment companies, may involve duplication of advisory fees and certain other expenses. As a result, Fund shareholders indirectly bear their proportionate share of these acquired expenses. Therefore, the cost of investing in the Fund will be higher than the cost of investing directly in ETFs and may be higher than other mutual funds that invest directly in securities.
Each ETF in which the Fund invests is subject to specific risks, depending on the nature of the ETF. Each ETF is subject to the risks associated with direct ownership of the securities comprising the index on which the ETF is based. These risks could include liquidity risk, sector risk as well as risks associated with fixed-income securities.
(h) Distributions to Shareholders
The Funds will make dividend distributions of net investment income, if any, monthly and net capital gains distributions, if any, at least annually, typically in December. Each Fund may make an additional payment of dividends or distributions if it deems it desirable at any other time during the year. Distributions to shareholders are recorded on the ex-dividend date. The amount and timing of distributions are determined in accordance with federal income tax regulations, which may differ from GAAP.
| 34 |
Robinson Funds
NOTES TO FINANCIAL STATEMENTS - Continued
December 31, 2023
The character of distributions made during the year from net investment income or net realized gains may differ from the characterization for federal income tax purposes due to differences in the recognition of income, expense and gain (loss) items for financial statement and tax purposes.
(i) Illiquid Securities
Pursuant to Rule 22e-4 under the 1940 Act, the Funds have adopted a Liquidity Risk Management Program (“LRMP”) that requires, among other things, that the Funds limit their illiquid investments that are assets to no more than 15% of net assets. An illiquid investment is any security which may not reasonably be expected to be sold or disposed of in current market conditions in seven calendar days or less without the sale or disposition significantly changing the market value of the investment. If the Advisor, at any time, determines that the value of illiquid securities held by a Fund exceeds 15% of its net asset value, the Advisor will take such steps as it considers appropriate to reduce them as soon as reasonably practicable in accordance with the Funds’ written LRMP.
(j) Federal Income Taxes
The Funds intend to comply with the requirements of Subchapter M of the Internal Revenue Code applicable to regulated investment companies and to distribute substantially all of its net investment income and any net realized gains to its shareholders. Therefore, no provision is made for federal income or excise taxes. Due to the timing of dividend distributions and the differences in accounting for income and realized gains and losses for financial statement and federal income tax purposes, the fiscal year in which amounts are distributed may differ from the year in which the income and realized gains and losses are recorded by the Funds.
Accounting for Uncertainty in Income Taxes (the “Income Tax Statement”) requires an evaluation of tax positions taken (or expected to be taken) in the course of preparing a Funds’ tax returns to determine whether these positions meet a “more-likely-than-not” standard that, based on the technical merits, have a more than fifty percent likelihood of being sustained by a taxing authority upon examination. A tax position that meets the “more-likely-than-not” recognition threshold is measured to determine the amount of benefit to recognize in the financial statements. The Funds recognize interest and penalties, if any, related to unrecognized tax benefits as income tax expense in the Statements of Operations.
The Income Tax Statement requires management of the Funds to analyze tax positions taken in the prior three open tax years, if any, and tax positions expected to be taken in the Fund’s current tax year, as defined by the IRS statute of limitations for all major jurisdictions, including federal tax authorities and certain state tax authorities. As of December 31, 2023, and during the prior three open tax years, and during the prior three open tax years, the Funds did not have a liability for any unrecognized tax benefits. The Funds have no examination in progress and are not aware of any tax positions for which they are reasonably possible that the total amounts of unrecognized tax benefits will significantly change in the next twelve months.
Note 3 – Investment Advisory and Other Agreements
The Trust, on behalf of the Funds, entered into an Investment Advisory Agreement (the “Agreement”) with Liberty Street Advisors, Inc. (the “Advisor”). Under the terms of the Agreement, the Funds pay a monthly investment advisory fee to the Advisor at the annual rate of 1.10% of the Funds’ average daily net assets. The Advisor engages Robinson Capital Management, LLC (the “Sub-Advisor”) to manage the Funds and pays the Sub-Advisor from its advisory fees.
| 35 |
Robinson Funds
NOTES TO FINANCIAL STATEMENTS - Continued
December 31, 2023
The Advisor has contractually agreed to waive its fees and/or pay for operating expenses of the Funds to ensure that total annual operating expenses (excluding taxes, interest, portfolio transaction expenses, acquired fund fees and expenses as determined in accordance with Form N-1A, expenses incurred in connection with any merger or reorganization and extraordinary expenses such as litigation expenses) do not exceed 1.60%, 2.35% and 1.35% of the Funds’ average daily net assets for Class A, Class C, and Institutional Class, respectively. This agreement is in effect until April 30, 2024 for the Funds, and it may be terminated before that date only by the Trust’s Board of Trustees.
For the year ended December 31, 2023, the Advisor waived a portion of its advisory fees and other expenses totaling $44,710, and $172,782 for the Tax Advantaged Income Fund and Opportunistic Income Fund, respectively. The Fund’s advisor is permitted to seek reimbursement from the Fund, subject to certain limitations, of fees waived or payments made to the Fund for a period ending three full fiscal years after the date of the waiver or payment. This reimbursement may be requested from the Fund if the reimbursement will not cause the Fund’s annual expense ratio to exceed the lesser of (a) the expense limitation amount in effect at the time such fees were waived or payments made, or (b) the expense limitation amount in effect at the time of the reimbursement. The potential recoverable amount is noted as "Commitments and contingencies" as reported on the Statement of Assets and Liabilities. The Advisor may recapture all or a portion of this amount no later than December 31, of the years stated below:
| Tax Advantaged Income Fund | Opportunistic Income Fund | |||||||
| 2024 | 48,494 | * | 176,965 | |||||
| 2025 | 76,403 | * | 187,727 | |||||
| 2026 | 44,710 | 172,782 | ||||||
| Total | $ | 169,607 | $ | 537,474 | ||||
| * | Prior to May 1, 2022, the Advisor had agreed to voluntarily waive a portion of its advisory fee after expenses reimbursed. |
UMB Fund Services, Inc. (“UMBFS”), serves as the Funds’ fund accountant, transfer agent and co-administrator; and Mutual Fund Administration, LLC (“MFAC”) serves as the Funds’ other co-administrator. UMB Bank, n.a., an affiliate of UMBFS, serves as the Funds’ custodian. The Funds’ allocated fees incurred for fund accounting, fund administration, transfer agency and custody services for the year ended December 31, 2023 are reported on the Statement of Operations as Fund services fees.
Foreside Fund Services, LLC (d/b/a ACA Group) serves as the Funds’ distributor (the “Distributor”). The Distributor does not receive compensation from the Funds for its distribution services; the Advisor pays the Distributor a fee for its distribution-related services.
Certain trustees and officers of the Trust are employees of UMBFS or MFAC. The Funds do not compensate trustees and officers affiliated with the Funds’ co-administrators. For the year ended December 31, 2023, the Funds’ allocated fees incurred to Trustees who are not affiliated with the Funds’ co-administrators are reported on the Statement of Operations.
The Funds’ Board of Trustees has adopted a Deferred Compensation Plan (the “Plan”) for the Independent Trustees that enables Trustees to elect to receive payment in cash or the option to select various fund(s) in the Trust in which their deferred accounts shall be deemed to be invested. If a trustee elects to defer payment, the Plan provides for the creation of a deferred payment account. The Funds’ liability for these amounts is adjusted for market value changes in the invested fund(s) and remains a liability to the Funds until distributed in accordance with the Plan. The Trustees Deferred compensation liability under the Plan constitutes a general unsecured obligation of each Fund and is disclosed in the Statement of Assets and Liabilities. Contributions made under the plan and the change in unrealized appreciation/depreciation and income are included in the Trustees’ fees and expenses in the Statement of Operations.
| 36 |
Robinson Funds
NOTES TO FINANCIAL STATEMENTS - Continued
December 31, 2023
Dziura Compliance Consulting, LLC provides Chief Compliance Officer (“CCO”) services to the Trust. The Funds’ allocated fees incurred for CCO services for the year ended December 31, 2023 are reported on the Statement of Operations.
Note 4 – Federal Income Taxes
At December 31, 2023, gross unrealized appreciation and depreciation of investments, based on cost for federal income tax purposes were as follows:
| Tax Advantaged Income Fund | Opportunistic Income Fund | |||||||
| Cost of investments | $ | 240,382,629 | $ | 11,612,132 | ||||
| Gross unrealized appreciation | $ | 12,032,652 | $ | 372,086 | ||||
| Gross unrealized depreciation | (2,517,783 | ) | (333,305 | ) | ||||
| Net unrealized appreciation (depreciation) on investments | $ | 9,514,869 | $ | 38,781 | ||||
The difference between cost amounts for financial statement and federal income tax purposes is due primarily to timing differences in recognizing certain gains and losses in security transactions.
As of December 31, 2023, the components of accumulated earnings/(deficit) on a tax basis were as follows:
| Tax Advantaged Income Fund | Opportunistic Income Fund | |||||||
| Undistributed ordinary income | $ | - | $ | 72,481 | ||||
| Undistributed long-term gains | - | - | ||||||
| Tax accumulated earnings | - | 72,481 | ||||||
| Accumulated capital and other losses | (17,305,310 | ) | (5,591,976 | ) | ||||
| Unrealized appreciation on investments | 9,514,869 | 38,781 | ||||||
| Unrealized deferred compensation | (16,804 | ) | (14,369 | ) | ||||
| Total accumulated deficit | $ | (7,807,245 | ) | $ | (5,495,083 | ) | ||
| 37 |
Robinson Funds
NOTES TO FINANCIAL STATEMENTS - Continued
December 31, 2023
GAAP requires certain components of net assets to be reclassified between financial and tax reporting. These reclassifications have no effect on net assets or net asset value per share. For the year ended December 31, 2023, permanent differences in book and tax accounting have been reclassified to Capital and Total accumulated deficit
as follows:
| Increase (Decrease) | ||||||||
| Paid-In Capital | Total Accumulated Deficit | |||||||
| Tax Advantaged Income Fund | $ | (65,289 | ) | $ | 65,289 | |||
| Opportunistic Income Fund | 1,152 | (1,152 | ) | |||||
The tax character of distribution paid during the fiscal years ended December 31, 2023 and December 31, 2022 were as follows:
| Tax Advantaged Income Fund | Opportunistic Income Fund | |||||||||||||||
| Distribution paid from: | 2023 | 2022 | 2023 | 2022 | ||||||||||||
| Tax exempt income | $ | 5,099,532 | $ | 3,295,351 | $ | - | $ | - | ||||||||
| Ordinary income | 55,777 | 125,704 | 438,972 | 312,840 | ||||||||||||
| Net long-term capital gains | - | 546,822 | - | - | ||||||||||||
| Return of capital | 544,951 | - | - | - | ||||||||||||
| Total distributions paid | $ | 5,700,260 | $ | 3,967,877 | $ | 438,972 | $ | 312,840 | ||||||||
To the extent that a fund may realize future net capital gains, those gains will be offset by any of its unused capital loss carryforward. Future capital loss carryover utilization in any given year may be subject to Internal Revenue Code limitations.
As of December 31, 2023, The Funds had net capital loss carryovers as follows:
| Not subject to expiration: | Tax Advantaged Income Fund | Opportunistic Income Fund | ||||||
| Short Term | $ | 7,613,736 | $ | 2,064,922 | ||||
| Long Term | 9,691,574 | 3,527,054 | ||||||
| Total | $ | 17,305,310 | $ | 5,591,976 | ||||
Capital loss carryovers are available to offset future realized capital gains and thereby reduce further taxable gain distributions. During the year ended December 31, 2023, the Tax Advantaged Income Fund utilized $0 of its capital loss carryover and the Opportunistic Income Fund utilized $58,358 of its capital loss carryover.
| 38 |
Robinson Funds
NOTES TO FINANCIAL STATEMENTS - Continued
December 31, 2023
Note 5 – Investment Transactions
For the year ended December 31, 2023, purchases and sales of investments, excluding short-term investments, were as follows:
| Purchases | Sales | |||||||
| Tax Advantaged Income Fund | $ | 297,130,000 | $ | 210,003,134 | ||||
| Opportunistic Income Fund | 14,166,541 | 13,381,482 | ||||||
Note 6 – Distribution Plan
The Trust, on behalf of the Funds, has adopted a Distribution Plan (the “Plan”) pursuant to Rule 12b-1 under the 1940 Act, that allows the Funds to pay distribution fees for the sale and distribution of their Class A and Class C shares. For Class A shares, the maximum annual fee payable to the Distributor for such distribution and/or shareholder liaison services is 0.25% of the average daily net assets of such shares. For Class C shares, the maximum annual fees payable to the Distributor for distribution services and administrative services are 0.75% and 0.25%, respectively, of the average daily net assets of such shares. The Institutional Class does not pay any distribution fees.
For the year ended December 31, 2023, distribution fees incurred are disclosed on the Statement of Operations.
The Advisor’s affiliated broker-dealer, HRC Fund Associates, LLC (“HRC”), Member FINRA/SIPC, markets the Fund shares to financial intermediaries pursuant to a marketing agreement with the Advisor. The marketing agreement between the Advisor and HRC is not part of the Plan. The Advisor pays HRC out of its own resources and without additional cost to the Fund or its shareholders.
Note 7 – Shareholder Servicing Plan
The Trust, on behalf of the Funds, has adopted a Shareholder Servicing Plan to pay a fee at an annual rate of up to 0.15% of average daily net assets of shares serviced by shareholder servicing agents who provide administrative and support services to their customers.
For the year ended December 31, 2023, shareholder servicing fees incurred are disclosed on the Statement of Operations.
Note 8 – Indemnifications
In the normal course of business, the Funds enter into contracts that contain a variety of representations which provide general indemnifications. The Funds’ maximum exposure under these arrangements is unknown, as this would involve future claims that may be made against the Funds that have not yet occurred. However, the Funds expect the risk of loss to be remote.
| 39 |
Robinson Funds
NOTES TO FINANCIAL STATEMENTS - Continued
December 31, 2023
Note 9 – Fair Value Measurements and Disclosure
FASB Accounting Standard Codification, “Fair Value Measurement and Disclosures”, Topic 820 (ASC 820) Fair Value Measurements and Disclosures defines fair value, establishes a framework for measuring fair value in accordance with GAAP, and expands disclosure about fair value measurements. It also provides guidance on determining when there has been a significant decrease in the volume and level of activity for an asset or a liability, when a transaction is not orderly, and how that information must be incorporated into a fair value measurement.
Under ASC 820, various inputs are used in determining the value of the Funds’ investments. These inputs are summarized into three broad Levels as described below:
| · | Level 1 – Unadjusted quoted prices in active markets for identical assets or liabilities that the Fund has the ability to access. |
| · | Level 2 – Observable inputs other than quoted prices included in Level 1 that are observable for the asset or liability, either directly or indirectly. These inputs may include quoted prices for the identical instrument on an inactive market, prices for similar instruments, interest rates, prepayment speeds, credit risk, yield curves, default rates and similar data. |
| · | Level 3 – Unobservable inputs for the asset or liability, to the extent relevant observable inputs are not available, representing the Fund’s own assumptions about the assumptions a market participant would use in valuing the asset or liability, and would be based on the best information available. |
The availability of observable inputs can vary from security to security and is affected by a wide variety of factors, including, for example, the type of security, whether the security is new and not yet established in the marketplace, the liquidity of markets, and other characteristics particular to the security. To the extent that valuation is based on models or inputs that are less observable or unobservable in the market, the determination of fair value requires more judgment. Accordingly, the degree of judgment exercised in determining fair value is greatest for instruments categorized in Level 3.
The inputs used to measure fair value may fall into different Levels of the fair value hierarchy. In such cases, for disclosure purposes, the Level in the fair value hierarchy within which the fair value measurement falls in its entirety, is determined based on the lowest Level input that is significant to the fair value measurement in its entirety.
| 40 |
Robinson Funds
NOTES TO FINANCIAL STATEMENTS - Continued
December 31, 2023
The inputs or methodology used for valuing securities are not an indication of the risk associated with investing in those securities. The following is a summary of the inputs used, as of December 31, 2023, in valuing the Funds’ assets carried at fair value:
| Tax Advantaged Income Fund | Level 1 | Level 2** | Level 3*** | Total | ||||||||||||
| Assets | ||||||||||||||||
| Investments | ||||||||||||||||
| Closed-End Funds | $ | 248,302,112 | $ | - | $ | - | $ | 248,302,112 | ||||||||
| Short-Term Investments | 1,595,386 | - | - | 1,595,386 | ||||||||||||
| Total Assets | $ | 249,897,498 | $ | - | $ | - | $ | 249,897,498 | ||||||||
| Liabilities | ||||||||||||||||
| Other Financial Instruments* | ||||||||||||||||
| Futures Contracts | $ | 5,245,206 | $ | - | $ | - | $ | 5,245,206 | ||||||||
| Total Liabilities | $ | 5,245,206 | $ | - | $ | - | $ | 5,245,206 | ||||||||
| Opportunistic Income Fund | Level 1 | Level 2 | Level 3*** | Total | ||||||||||||
| Assets | ||||||||||||||||
| Investments | ||||||||||||||||
| Closed-End Funds | $ | 7,289,446 | $ | - | $ | - | $ | 7,289,446 | ||||||||
| Common Stocks | 2,819,447 | 1,302,265 | - | 4,121,712 | ||||||||||||
| Rights | - | 601 | - | 601 | ||||||||||||
| Warrants | 1,397 | 1,536 | - | 2,933 | ||||||||||||
| Short-Term Investments | 236,221 | - | - | 236,221 | ||||||||||||
| Total Assets | $ | 10,346,511 | $ | 1,304,402 | $ | - | $ | 11,650,913 | ||||||||
| Liabilities | ||||||||||||||||
| Other Financial Instruments* | ||||||||||||||||
| Futures Contracts | $ | 58,394 | $ | - | $ | - | $ | 58,394 | ||||||||
| Total Liabilities | $ | 58,394 | $ | - | $ | - | $ | 58,394 | ||||||||
| * | Other financial instruments are derivative instruments such as futures contracts. Futures contracts are valued at the unrealized appreciation (depreciation) on the instrument. |
| ** | The Fund did not hold any Level 2 securities at period end. |
| *** | The Funds did not hold any Level 3 securities at period end. |
Note 10 – Derivatives and Hedging Disclosures
FASB Accounting Standard Codification, “Derivative and Hedging”, Topic 815 (ASC 815) requires enhanced disclosures about each Fund’s derivative and hedging activities, including how such activities are accounted for and their effects on each Fund’s financial position, performance and cash flows. The Funds invested in futures contracts during the year ended December 31, 2023.
| 41 |
Robinson Funds
NOTES TO FINANCIAL STATEMENTS - Continued
December 31, 2023
The effects of these derivative instruments on each Fund’s financial position and financial performance as reflected in the Statement of Assets and Liabilities and Statement of Operations are presented in the tables below. The fair values of derivative instruments as of December 31, 2023 by risk category are as follows:
| Statement of Asset and | Derivatives not designated as | Asset Derivatives | Liability Derivatives | |||||||||
| Liabilities Location | hedging instruments | Value | Value | |||||||||
| Tax Advantaged Income Fund | Unrealized appreciation/ depreciation on open futures contracts* | Interest rate contracts | $ | - | $ | 5,245,206 | ||||||
| Opportunistic Income Fund | Unrealized appreciation/ depreciation on open futures contracts* | Equity contracts | - | 9,350 | ||||||||
| Unrealized appreciation/ depreciation on open futures contracts* | Interest rate contracts | - | 49,044 | |||||||||
*Includes cumulative appreciation/depreciation on futures contracts as reported in the Schedule of Investments. Variation margin is presented on the Statements of Assets and Liabilities.
The effects of derivative instruments on the Statement of Operations for the year ended December 31, 2023 are as follows:
Amount of Realized Gain or (Loss) on Derivatives Recognized in Income | ||||||||||||
| Derivatives not designated as hedging instruments | ||||||||||||
| Equity Contracts | Interest Rate Contracts | Total | ||||||||||
| Tax Advantaged Income Fund | ||||||||||||
| Futures contracts | $ | - | $ | 6,298,247 | $ | 6,298,247 | ||||||
| Opportunistic Income Fund | ||||||||||||
| Futures contracts | (67,585 | ) | 94,247 | 26,662 | ||||||||
Change in Unrealized Appreciation/Depreciation on Derivatives Recognized in Income | ||||||||||||
| Derivatives not designated as hedging instruments | ||||||||||||
| Equity Contracts | Interest Rate Contracts | Total | ||||||||||
| Tax Advantaged Income Fund | ||||||||||||
| Futures contracts | $ | - | $ | (6,136,222 | ) | $ | (6,136,222 | ) | ||||
| Opportunistic Income Fund | ||||||||||||
| Futures contracts | (40,299 | ) | (61,091 | ) | (101,390 | ) | ||||||
| 42 |
Robinson Funds
NOTES TO FINANCIAL STATEMENTS - Continued
December 31, 2023
The number of contracts are included on the Schedule of Investments. The quarterly average volumes of derivative instruments as of December 31, 2023 are as follows:
| Derivatives not designated as hedging instruments | Notional Value | |||||
| Tax Advantaged Income Fund | ||||||
| Futures contracts | Interest rate contracts | $ | (95,164,124 | ) | ||
| Opportunistic Income Fund | ||||||
| Futures contracts | Equity contracts | $ | (922,375 | ) | ||
| Futures contracts | Interest rate contracts | $ | (1,736,821 | ) | ||
Note 11 – ReFlow liquidity program
The Funds may participate in the ReFlow Fund, LLC (“ReFlow”) liquidity program, which is designed to provide an alternative liquidity source for mutual funds experiencing redemptions of their shares. In order to pay cash to shareholders who redeem their shares on a given day, a mutual fund typically must hold cash in its portfolio, liquidate portfolio securities, or borrow money, all of which impose certain costs on a fund. ReFlow provides participating mutual funds with another source of cash by standing ready to purchase shares from a fund equal to the amount of each fund’s net redemptions on a given day. ReFlow will purchase Institutional Class Shares of a Fund at net asset value and will not be subject to any investment minimum applicable to such shares. ReFlow is prohibited from acquiring more than 3% of the outstanding voting securities of each Fund. ReFlow will periodically redeem its entire share position in a Fund. For use of the ReFlow service, each Fund will pay a fee to ReFlow at a rate determined by a daily auction with other participating mutual funds. During the year ended December 31, 2023, ReFlow was not utilized by the Funds.
Note 12 – Line of Credit
The Funds together with Bramshill Multi-Strategy Income Fund managed by the Advisor (together “Liberty Street Funds”) have entered into a Senior Secured Revolving Credit Facility (“Facility”) of $25,000,000 (committed) and $25,000,000 (uncommitted) with UMB Bank, n.a. Each Fund is permitted to borrow up to the lesser of 20.00% of its adjusted net assets with the cap limit of $25,000,000, or the maximum amount permitted subject to the Fund’s investment limitations. The purpose of the Facility is to finance temporarily the repurchase or redemption of shares of each Fund. Borrowings under this agreement bear interest at the Secured Overnight Financing Rate plus 275 basis points, subject to daily floor rate of 6.00%. As compensation for holding the lending commitment available, the Liberty Street Funds are charged a commitment fee on the average daily unused balance of the Facility at the rate of 0.20% per annum. Commitment fees and interest expense for the year ended December 31, 2023 are disclosed in each Fund’s Statement of Operations. The Funds did not borrow under the line of credit agreement during the year ended December 31, 2023.
Note 13 – Market Disruption and Geopolitical Risks
Certain local, regional or global events such as war, acts of terrorism, the spread of infectious illnesses and/or other public health issues, financial institution instability or other events may have a significant impact on a security or instrument. These types of events and other like them are collectively referred to as “Market Disruptions and Geopolitical Risks” and they may have adverse impacts on the worldwide economy, as well as the economies of individual countries, the financial health of individual companies and the market in general in significant and unforeseen ways. Some of the impacts noted in recent times include but are not limited to embargos, political actions, supply chain disruptions, bank failures, restrictions to investment and/or monetary movement including the forced selling of securities or the inability to participate impacted markets. The duration of these events could adversely affect the Fund’s performance, the performance of the securities in which the Fund invests and may lead to losses on your investment. The ultimate impact of “Market Disruptions and Geopolitical Risks” on the financial performance of the Fund’s investments is not reasonably estimable at this time. Management is actively monitoring these events.
| 43 |
Robinson Funds
NOTES TO FINANCIAL STATEMENTS - Continued
December 31, 2023
Note 14- New Accounting Pronouncements and Regulatory Updates
Effective January 24, 2023, the SEC adopted rule and form amendments to require mutual funds and exchange-traded funds (ETFs) to transmit concise and visually engaging streamlined annual and semiannual reports to shareholders that highlight key information deemed important for retail investors to assess and monitor their fund investments. Other information, including financial statements, will no longer appear in the funds’ streamlined shareholder reports but must be available online, delivered free of charge upon request, and filed on a semiannual basis on Form N-CSR. The rule and form amendments have a compliance date of July 24, 2024. At this time, management is evaluating the impact of these rule and form amendment changes on the content of the current shareholder report and the newly created annual and semiannual streamlined shareholder reports.
In October 2020, the SEC adopted new regulations governing the use of derivatives by registered investment companies (“Rule 18f-4”). Rule 18f-4 imposed limits on the amount of derivatives a Fund can enter into, eliminate the asset segregation framework currently used by funds to comply with Section 18 of the 1940 Act, and require funds whose use of derivatives is greater than a limited specified amount to establish and maintain a comprehensive derivatives risk management program and appoint a derivatives risk manager. The Funds have adopted procedures in accordance with Rule 18f-4.
In December 2020, the SEC adopted a new rule providing a framework for fund valuation practices (“Rule 2a-5”). Rule 2a-5 establishes requirements for determining fair value in good faith for purposes of the 1940 Act. Rule 2a-5 will permit fund boards to designate certain parties to perform fair value determinations, subject to board oversight and certain other conditions. Rule 2a-5 also defines when market quotations are “readily available” for purposes of the 1940 Act and the threshold for determining whether a fund must fair value a security. In connection with Rule 2a-5, the SEC also adopted related recordkeeping requirements and is rescinding previously issued guidance, including with respect to the role of a board in determining fair value and the accounting and auditing of fund investments. The Funds have adopted procedures in accordance with Rule 2a-5.
In March 2020, the Financial Accounting Standards Board (FASB) issued Accounting Standards Update (ASU) No. 2020-04, Reference Rate Reform (Topic 848) – Facilitation of the Effects of Reference Rate Reform on Financial Reporting. The amendments in the ASU provide optional temporary financial reporting relief from the effect of certain types of contract modifications due to the planned discontinuation of the London Interbank Offered Rate and other interbank-offered based reference rates as of the end of 2021. The ASU is effective for certain reference rate-related contract modifications that occur during the period March 12, 2020 through December 31, 2022. In December 2022, the FASB issued ASU No. 2022-06, Reference Rate Reform (Topic 848) - Deferral of the Sunset Date of Topic 848, which extends the period through December 31, 2024. Management has reviewed the requirements and believes the adoption of these ASUs will not have a material impact on the financial statements..
Note 15 – Events Subsequent to the Fiscal Period End
The Funds have adopted financial reporting rules regarding subsequent events which require an entity to recognize in the financial statements the effects of all subsequent events that provide additional evidence about conditions that existed at the date of the balance sheet. Management has evaluated each Fund’s related events and transactions that occurred through the date of issuance of each Fund’s financial statements.
There were no events or transactions that occurred during this period that materially impacted the amounts or disclosures in each Fund’s financial statements.
| 44 |
REPORT OF INDEPENDENT REGISTERED PUBLIC ACCOUNTING FIRM
To the Board of Trustees of Investment Managers Series Trust and
Shareholders of Robinson Funds
Opinion on the Financial Statements
We have audited the accompanying statements of assets and liabilities of the Robinson Tax Advantaged Income Fund and Robinson Opportunistic Income Fund (the “Funds”), each a series of Investment Managers Series Trust (the “Trust”), including the schedules of investments, as of December 31, 2023, the related statements of operations for the year then ended, the statements of changes in net assets for each of the two years in the period then ended, the financial highlights for each of the five years in the period then ended, and the related notes (collectively referred to as the “financial statements”). In our opinion, the financial statements and financial highlights referred to above present fairly, in all material respects, the financial position of the Robinson Tax Advantaged Income Fund and the Robinson Opportunistic Fund as of December 31, 2023, the results of their operations for the year then ended, the changes in their net assets for each of the two years in the period then ended, and their financial highlights for each of the five years in the period then ended, in conformity with accounting principles generally accepted in the United States of America.
Basis for Opinion
These financial statements are the responsibility of the Funds’ management. Our responsibility is to express an opinion on the Funds’ financial statements based on our audits. We are a public accounting firm registered with the Public Company Accounting Oversight Board (United States) (“PCAOB”) and are required to be independent with respect to the Funds in accordance with the U.S. federal securities laws and the applicable rules and regulations of the Securities and Exchange Commission and the PCAOB. We have served as the auditor of one or more of the funds in the Trust since 2007.
We conducted our audits in accordance with the standards of the PCAOB. Those standards require that we plan and perform the audits to obtain reasonable assurance about whether the financial statements are free of material misstatement, whether due to error or fraud. The Funds are not required to have, nor were we engaged to perform, an audit of the Funds’ internal control over financial reporting. As part of our audits we are required to obtain an understanding of internal control over financial reporting, but not for the purpose of expressing an opinion on the effectiveness of the Funds’ internal control over financial reporting. Accordingly, we express no such opinion.
| 45 |
Our audits included performing procedures to assess the risks of material misstatement of the financial statements, whether due to error or fraud, and performing procedures that respond to those risks. Such procedures included examining, on a test basis, evidence regarding the amounts and disclosures in the financial statements. Our audits also included evaluating the accounting principles used and significant estimates made by management, as well as evaluating the overall presentation of the financial statements. Our procedures included confirmation of securities owned as of December 31, 2023 by correspondence with the custodian, and brokers; when replies from brokers were not received, we performed other auditing procedures. We believe that our audits provide a reasonable basis for our opinion.
 | |
| TAIT, WELLER & BAKER LLP |
Philadelphia, Pennsylvania
February 29, 2024
| 46 |
Robinson Funds
SUPPLEMENTAL INFORMATION (Unaudited)
Tax Information
For the year ended December 31, 2023, 12.81% of the dividends paid from net investment income, including short term capital gains (if any), for the Opportunistic Income Fund is designated as qualified dividend income.
For the year ended December 31, 2023, 0% of dividends to be paid from net investment income, including short-term capital gains from the Fund (if any), for Opportunistic Income Fund qualifies for the dividends received deduction available to corporate shareholders.
Trustees and Officers Information
Additional information about the Trustees is included in the Fund’s Statement of Additional Information, which is available, without charge, upon request by calling (800) 207-7108. The Trustees and officers of the Fund and their principal occupations during the past five years are as follows:
| Name, Address, Year of Birth and Position(s) held with Trust | Term of Officec and Length of Time Served | Principal Occupation During the Past Five Years and Other Affiliations | Number of Portfolios in the Fund Complex Overseen by Trusteed | Other Directorships Held by Trustee During the Past Five Yearse |
| Independent Trustees: | ||||
Charles H. Miller a (born 1947) Trustee | Since November 2007 | Retired (2013 – present). Executive Vice President, Client Management and Development, Access Data, a Broadridge company, a provider of technology and services to asset management firms (1997-2012). | 4 | None. |
Ashley Toomey Rabun a Trustee and Chairperson of the Board | Since November 2007 | Retired (2016 – present). President and Founder, InvestorReach, Inc., a financial services consulting firm (1996 – 2015). | 4 | Select Sector SPDR Trust, a registered investment company (includes 11 portfolios). |
William H. Young a Trustee | Since November 2007 | Retired (2014 - present). Independent financial services consultant (1996 – 2014). Interim CEO, Unified Fund Services Inc. (now Huntington Fund Services), a mutual fund service provider (2003 – 2006). Senior Vice President, Oppenheimer Management Company (1983 – 1996). Chairman, NICSA, an investment management trade association (1993 – 1996). | 4 | None. |
James E. Ross a (born 1965) Trustee | Since December 2022 | Non-Executive Chairman and Director, Fusion Acquisition Corp. II, a special purpose acquisition company (March 2021 – present); Non-Executive Chairman and Director, Fusion Acquisition Corp., a special purpose acquisition company (June 2020 – September 2021); Executive Vice President, State Street Global Advisors, a global asset management firm (2012 – March 2020); Chairman and Director, SSGA Funds Management, Inc., a registered investment advisor (2005 – March 2020); Chief Executive Officer, Manager and Director, SSGA Funds Distributor, LLC, a broker-dealer (2017 – March 2020). | 4 | SPDR Index Shares Funds, a registered investment company (includes 26 portfolios); SPDR Series Trust, a registered investment company (includes 125 portfolios); Select Sector SPDR Trust, a registered investment company (includes 11 portfolios); SSGA Active Trust, a registered investment company (includes 14 portfolios); Fusion Acquisition Corp II. |
| 47 |
Robinson Funds
SUPPLEMENTAL INFORMATION (Unaudited) - Continued
| Name, Address, Year of Birth and Position(s) held with Trust | Term of Officec and Length of Time Served | Principal Occupation During the Past Five Years and Other Affiliations | Number of Portfolios in the Fund Complex Overseen by Trusteed | Other Directorships Held by Trustee During the Past Five Yearse |
| Interested Trustee: | ||||
Maureen Quill a* (born 1963) Trustee and President | Since June 2019 | President, Investment Managers Series Trust (June 2014 – present); EVP/Executive Director Registered Funds (January 2018 – present), Chief Operating Officer (June 2014 – January 2018), and Executive Vice President (January 2007 – June 2014), UMB Fund Services, Inc.; President, UMB Distribution Services (March 2013 – December 2020); Vice President, Investment Managers Series Trust (December 2013 – June 2014). | 4 | Investment Managers Series Trust III, a registered investment company (includes 5 portfolios), Source Capital, Inc., a closed-end investment company. |
| 48 |
Robinson Funds
SUPPLEMENTAL INFORMATION (Unaudited) - Continued
| Name, Address, Year of Birth and Position(s) held with Trust | Term of Officec and Length of Time Served | Principal Occupation During the Past Five Years and Other Affiliations | Number of Portfolios in the Fund Complex Overseen by Trusteed | Other Directorships Held by Trustee During the Past Five Yearse |
| Officers of the Trust: | ||||
Rita Dam b (born 1966) Treasurer and Assistant Secretary | Since December 2007 | Co-Chief Executive Officer (2016 – present), and Vice President (2006 – 2015), Mutual Fund Administration, LLC; Co-President, Foothill Capital Management, LLC, a registered investment advisor (2018 – 2022). | N/A | N/A |
Joy Ausili b (born 1966) Vice President, Assistant Secretary, and Assistant Treasurer | Since March 2016 | Co-Chief Executive Officer (2016 – present), and Vice President (2006 – 2015), Mutual Fund Administration, LLC; Co-President, Foothill Capital Management, LLC, a registered investment advisor (2018 – 2022); Secretary and Assistant Treasurer, Investment Managers Series Trust (December 2007 – March 2016). | N/A | N/A |
Diane Drake b (born 1967) Secretary | Since March 2016 | Senior Counsel, Mutual Fund Administration, LLC (October 2015 – present); Chief Compliance Officer, Foothill Capital Management, LLC, a registered investment advisor (2018 – 2019). | N/A | N/A |
Martin Dziura b (born 1959) Chief Compliance Officer | Since June 2014 | Principal, Dziura Compliance Consulting, LLC (October 2014 – present); Managing Director, Cipperman Compliance Services (2010 – September 2014); Chief Compliance Officer, Hanlon Investment Management (2009 – 2010); and Vice President − Compliance, Morgan Stanley Investment Management (2000 − 2009). | N/A | N/A |
| a | Address for certain Trustees and certain officers: 235 West Galena Street, Milwaukee, Wisconsin 53212. |
| b | Address for Ms. Ausili, Ms. Dam and Ms. Drake: 2220 E. Route 66, Suite 226, Glendora, California 91740. |
Address for Mr. Dziura: 309 Woodridge Lane, Media, Pennsylvania 19063.
| c | Trustees and officers serve until their successors have been duly elected. |
| d | The Trust is comprised of 41 series managed by unaffiliated investment advisors. Each Trustee serves as Trustee of each series of the Trust. The term “Fund Complex” applies only to the Fund(s) managed by the same investment advisor. The Fund’s investment advisor also serves as the investment advisor to the Bramshill Multi-Strategy Income Fund, and West Loop Realty Fund which are offered in separate prospectus. The Fund does not hold itself out as related to any other series within the Trust, for purposes of investment and investor services. |
| 49 |
Robinson Funds
SUPPLEMENTAL INFORMATION (Unaudited) - Continued
| e | “Other Directorships Held” includes only directorship of companies required to register or file reports with the SEC under the Securities Exchange Act of 1934, as amended (that is, “public companies”) or other investment companies registered under the 1940 Act. |
| * | Ms. Quill is an “interested person” of the Trust by virtue of her position with UMB Fund Services, Inc. |
Effective June 16, 2022, Eric M. Banhazl, who served as a Trustee of the Trust from January 2008 to June 14, 2022, is serving as a Trustee Emeritus of the Trust. As a Trustee Emeritus, Mr. Banhazl may attend the meetings of the Board of Trustees or any of its committees, but has no duties, powers or responsibilities with respect to the Trust.
| 50 |
Robinson Funds
EXPENSE EXAMPLES
For the Six Months Ended December 31, 2023 (Unaudited)
Expense Example
As a shareholder of the Funds, you incur two types of costs: (1) transaction costs, including sales charges (loads) on purchase payments on certain classes, and (2) ongoing costs, including management fees; distribution and/or service (12b-1) fees (Class A and Class C only); and other Fund expenses. The examples below are intended to help you understand your ongoing costs (in dollars) of investing in the Funds and to compare these costs with the ongoing costs of investing in other mutual funds.
These examples are based on an investment of $1,000 invested at the beginning of the period and held for the entire period from July 1, 2023 to December 31, 2023.
Actual Expenses
The information in the row titled “Actual Performance” of the table below provides actual account values and actual expenses. You may use the information in these columns, together with the amount you invested, to estimate the expenses that you paid over the period. Simply divide your account value by $1,000 (for example, an $8,600 account value divided by $1,000 = 8.6), then multiply the result by the number in the appropriate row for your share class, under the column titled “Expenses Paid During Period” to estimate the expenses you paid on your account during this period.
Hypothetical Example for Comparison Purposes
The information in the row titled “Hypothetical (5% annual return before expenses)” of the table below provides hypothetical account values and hypothetical expenses based on the Fund’s actual expense ratios and an assumed rate of return of 5% per year before expenses, which is not the Fund’s actual return. The hypothetical account values and expenses may not be used to estimate the actual ending account balance or expenses you paid for the period. You may use this information to compare the ongoing costs of investing in the Fund and other funds. To do so, compare these 5% hypothetical examples with the 5% hypothetical examples that appear in the shareholder reports of the other funds.
Please note that the expenses shown in the table are meant to highlight your ongoing costs only and do not reflect any transaction costs, such as sales charges (load) or contingent deferred sales charges. Therefore, the information in the rows titled “Hypothetical (5% annual return before expenses)” is useful in comparing ongoing costs only, and will not help you determine the relative total costs of owning different funds. In addition, if these transactional costs were included, your costs would have been higher.
| Tax Advantaged Income Fund | Beginning Account Value | Ending Account Value | Expenses Paid During Period* | |
| 7/1/23 | 12/31/23 | 7/1/23 – 12/31/23 | ||
| Class A | Actual Performance | $ 1,000.00 | $ 1,033.80 | $ 8.29 |
| Hypothetical (5% annual return before expenses) | 1,000.00 | 1,017.06 | 8.22 | |
| Class C | Actual Performance | 1,000.00 | 1,029.70 | 12.11 |
| Hypothetical (5% annual return before expenses) | 1,000.00 | 1,013.27 | 12.02 | |
| Institutional Class | Actual Performance | 1,000.00 | 1,033.90 | 7.00 |
| Hypothetical (5% annual return before expenses) | 1,000.00 | 1,018.32 | 6.95 | |
| * | Expenses are equal to the Fund’s annualized expense ratios of 1.62%, 2.37% and 1.37% for Class A, Class C and Institutional Class, respectively, multiplied by the average account values over the period, multiplied by 184/365 (to reflect the six months period). The expense ratios reflect an expense waiver. Assumes all dividends and distributions were reinvested. |
| 51 |
Robinson Funds
EXPENSE EXAMPLES - Continued
For the Six Months Ended December 31, 2023 (Unaudited)
| Opportunistic Income Fund | Beginning Account Value | Ending Account Value | Expenses Paid During Period* | |
| 7/1/23 | 12/31/23 | 7/1/23 – 12/31/23 | ||
| Class A | Actual Performance | $ 1,000.00 | $ 1,072.20 | $ 8.37 |
| Hypothetical (5% annual return before expenses) | 1,000.00 | 1,017.12 | 8.15 | |
| Class C | Actual Performance | 1,000.00 | 1,069.60 | 12.27 |
| Hypothetical (5% annual return before expenses) | 1,000.00 | 1,013.35 | 11.94 | |
| Institutional Class | Actual Performance | 1,000.00 | 1,073.70 | 7.07 |
| Hypothetical (5% annual return before expenses) | 1,000.00 | 1,018.38 | 6.88 | |
| * | Expenses are equal to the Fund’s annualized expense ratios of 1.60%, 2.35% and 1.35% for Class A, Class C and Institutional Class, respectively, multiplied by the average account values over the period, multiplied by 184/365 (to reflect the six months period). The expense ratios reflect an expense waiver. Assumes all dividends and distributions were reinvested. |
| 52 |
Robinson Funds
Each a series of Investment Managers Series Trust
Investment Advisor
Liberty Street Advisors, Inc.
88 Pine Street 31st Floor, Suite 3101
New York, New York 10005
Investment Sub-Advisor
Robinson Capital Management, LLC
63 Kercheval Avenue, Suite 111
Grosse Pointe Farms, Michigan 48236
Independent Registered Public Accounting Firm
Tait, Weller, & Baker LLP
Two Liberty Place
50 South 16th Street Suite 2900
Philadelphia, Pennsylvania 19102
Custodian
UMB Bank, n.a.
928 Grand Boulevard, 5th Floor
Kansas City, Missouri 64106
Fund Co- Administrator
Mutual Fund Administration, LLC
2220 East Route 66, Suite 226
Glendora, California 91740
Fund Co-Administrator, Transfer Agent and Fund Accountant
UMB Fund Services, Inc.
235 West Galena Street
Milwaukee, Wisconsin 53212
Distributor
Foreside Fund Services, LLC
Three Canal Plaza, Suite 100
Portland, Maine 04101
www.foreside.com
FUND INFORMATION
| TICKER | CUSIP | |
| Robinson Tax Advantaged Income Fund – Class A | ROBAX | 46141Q 105 |
| Robinson Tax Advantaged Income Fund – Class C | ROBCX | 46141Q 204 |
| Robinson Tax Advantaged Income Fund – Institutional Class | ROBNX | 46141Q 303 |
| Robinson Opportunistic Income Fund – Class A | RBNAX | 46141Q 576 |
| Robinson Opportunistic Income Fund – Class C | RBNCX | 46141Q 568 |
| Robinson Opportunistic Income Fund – Institutional Class | RBNNX | 46141Q 550 |
Privacy Principles of the Robinson Funds for Shareholders
The Funds are committed to maintaining the privacy of their shareholders and to safeguarding their non-public personal information. The following information is provided to help you understand what personal information the Funds collect, how we protect that information and why, in certain cases, we may share information with select other parties.
Generally, the Funds do not receive any non-public personal information relating to their shareholders, although certain non-public personal information of their shareholders may become available to the Funds. The Funds do not disclose any non-public personal information about their shareholders or former shareholders to anyone, except as permitted by law or as is necessary in order to service shareholder accounts (for example, to a transfer agent or third party administrator).
This report is sent to shareholders of the Robinson Funds for their information. It is not a Prospectus, circular or representation intended for use in the purchase or sale of shares of the Funds or of any securities mentioned in this report.
Proxy Voting
The Funds’ proxy voting policies and procedures, as well as information regarding how the Funds voted proxies for portfolio securities, if applicable, during the most recent 12-month period ended June 30, are also available, without charge and upon request by calling the Funds at (800) 207-7108, on the Funds’ website at https://libertystreetfunds.com/ or on the SEC’s website at www.sec.gov.
Fund Portfolio Holdings
The Funds file their complete schedule of portfolio holdings with the SEC for the first and third quarters of each fiscal year on Form N-PORT within 60 days of the end of such fiscal quarter. Shareholders may obtain the Funds’ Form N-PORT on the SEC’s website at www.sec.gov.
Prior to the use of Form N-PORT, the Funds filed their complete schedule of portfolio holdings with the SEC on Form N-Q, which is available online at www.sec.gov.
Householding
The Funds will mail only one copy of shareholder documents, including prospectuses, and notice of annual and semi-annual reports availability and proxy statements, to shareholders with multiple accounts at the same address. This practice is commonly called “householding” and is intended to reduce expenses and eliminate duplicate mailings of shareholder documents. Mailings of your shareholder documents may be householded indefinitely unless you instruct us otherwise. If you do not want the mailing of these documents to be combined with those for other members of your household, please call the Funds at (800) 207-7108.
Robinson Funds
P.O. Box 2175
Milwaukee, WI 53201
Toll Free: (800) 207-7108
Item 1. Report to Stockholders (Continued).
| (b) | Not Applicable |
Item 2. Code of Ethics.
The registrant has adopted a code of ethics that applies to the registrant's principal executive officer and principal financial officer. The registrant has not made any amendments to its code of ethics during the period covered by this report. The registrant has not granted any waivers from any provisions of the code of ethics during the period covered by this report.
The registrant undertakes to provide to any person without charge, upon request, a copy of its code of ethics by mail when they call the registrant at (800) 207-7108.
Item 3. Audit Committee Financial Expert.
The registrant’s board of trustees has determined that there is at least one audit committee financial expert serving on its audit committee. William H. Young is the “audit committee financial expert” and is considered to be “independent” as each term is defined in Item 3 of Form N-CSR.
Item 4. Principal Accountant Fees and Services.
The registrant has engaged its principal accountant to perform audit services, audit-related services, tax services and other services during the past two fiscal years. "Audit services" refer to performing an audit of the registrant's annual financial statements or services that are normally provided by the accountant in connection with statutory and regulatory filings or engagements for those fiscal years. "Audit-related services" refer to the assurance and related services by the principal accountant that are reasonably related to the performance of the audit. "Tax services" refer to professional services rendered by the principal accountant for tax compliance, tax advice, and tax planning. There were no "other services" provided by the principal accountant. The following table details the aggregate fees billed or expected to be billed for each of the last two fiscal years for audit fees, audit-related fees, tax fees and other fees by the principal accountant.
| FYE 12/31/2023 | FYE 12/31/2022 | |
| Audit Fees | $ 38,300 | $ 37,100 |
| Audit-Related Fees | N/A | N/A |
| Tax Fees | $ 5,600 | $ 5,600 |
| All Other Fees | N/A | N/A |
The audit committee has adopted pre-approval policies and procedures that require the audit committee to pre-approve all audit and non-audit services of the registrant, including services provided to any entity affiliated with the registrant.
The percentage of fees billed by Tait, Weller, & Weller LLP applicable to non-audit services pursuant to waiver of pre-approval requirement were as follows:
| FYE 12/31/2023 | FYE 12/31/2022 | |
| Audit-Related Fees | 0% | 0% |
| Tax Fees | 0% | 0% |
| All Other Fees | 0% | 0% |
All of the principal accountant's hours spent on auditing the registrant's financial statements were attributed to work performed by full-time permanent employees of the principal accountant.
The following table indicates the non-audit fees billed or expected to be billed by the registrant's accountant for services to the registrant and to the registrant's investment adviser (and any other controlling entity, etc.—not sub-adviser) for the last two years. The audit committee of the Board of Trustees has considered whether the provision of non-audit services that were rendered to the registrant's investment adviser is compatible with maintaining the principal accountant's independence and has concluded that the provision of such non-audit services by the accountant has not compromised the accountant's independence.
| Non-Audit Related Fees | FYE 12/31/2023 | FYE 12/31/2022 |
| Registrant | N/A | N/A |
| Registrant’s Investment Advisor | N/A | N/A |
Item 5. Audit Committee of Listed Registrants.
| (a) | Not applicable to registrants who are not listed issuers (as defined in Rule 10A-3 under the Securities Exchange Act of 1934). |
| (b) | Not applicable. |
Item 6. Schedule of Investments.
(a) Schedule of Investments is included as part of the report to shareholders filed under Item 1 of this Form.
(b) Not Applicable.
Item 7. Disclosure of Proxy Voting Policies and Procedures for Closed-End Management Investment Companies.
Not applicable to open-end investment companies.
Item 8. Portfolio Managers of Closed-End Management Investment Companies.
Not applicable to open-end investment companies.
Item 9. Purchases of Equity Securities by Closed-End Management Investment Company and Affiliated Purchasers.
Not applicable.
Item 10. Submission of Matters to a Vote of Security Holders.
The registrant has not made any material changes to the procedures by which shareholders may recommend nominees to the registrant’s Board of Trustees.
Item 11. Controls and Procedures.
| (a) | The Registrant’s President/Chief Executive Officer and Treasurer/Chief Financial Officer have reviewed the Registrant's disclosure controls and procedures (as defined in Rule 30a-3(c) under the Investment Company Act of 1940 (the “Act”)) as of a date within 90 days of the filing of this report, as required by Rule 30a-3(b) under the Act and Rules 13a-15(b) or 15d-15(b) under the Securities Exchange Act of 1934. Based on their review, such officers have concluded that the disclosure controls and procedures are effective in ensuring that information required to be disclosed in this report is appropriately recorded, processed, summarized and reported and made known to them by others within the Registrant and by the Registrant’s service provider. |
| (b) | There were no changes in the Registrant's internal control over financial reporting (as defined in Rule 30a-3(d) under the Act) that occurred during the period covered by this report that has materially affected, or is reasonably likely to materially affect, the Registrant's internal control over financial reporting. |
Item 12. Disclosure of Securities Lending Activities for Closed-End Management Investment Companies.
Not applicable to open-end investment companies.
Item 13. Exhibits.
(2) Certifications pursuant to Section 302 of the Sarbanes-Oxley Act of 2002. Filed herewith.
(3) Any written solicitation to purchase securities under Rule 23c-1 under the Act sent or given during the period covered by the report by or on behalf of the registrant to 10 or more persons. Not applicable to open-end investment companies.
(4) Change in the registrant’s independent public accountant. There was no change in the registrant’s independent public accountant for the period covered by this report.
| (b) | Certification pursuant to Section 906 of the Sarbanes-Oxley Act of 2002. Furnished herewith. |
SIGNATURES
Pursuant to the requirements of the Securities Exchange Act of 1934 and the Investment Company Act of 1940, the registrant has duly caused this report to be signed on its behalf by the undersigned, thereunto duly authorized.
| (Registrant) | Investment Managers Series Trust | |
| By (Signature and Title) | /s/ Maureen Quill | |
| Maureen Quill, President/Chief Executive Officer | ||
| Date | 03/8/2024 |
Pursuant to the requirements of the Securities Exchange Act of 1934 and the Investment Company Act of 1940, this report has been signed below by the following persons on behalf of the registrant and in the capacities and on the dates indicated.
| By (Signature and Title) | /s/ Maureen Quill | |
| Maureen Quill, President/Chief Executive Officer | ||
| Date | 03/8/2024 | |
| By (Signature and Title) | /s/ Rita Dam | |
| Rita Dam, Treasurer/Chief Financial Officer | ||
| Date | 03/8/2024 |