UNITED STATES
SECURITIES AND EXCHANGE COMMISSION
Washington, D.C. 20549
FORM N-CSR
CERTIFIED SHAREHOLDER REPORT OF REGISTERED
MANAGEMENT INVESTMENT COMPANIES
Investment Company Act file number 811-21719
INVESTMENT MANAGERS SERIES TRUST
(Exact name of registrant as specified in charter)
235 W. Galena Street
Milwaukee, WI 53212
(Address of principal executive offices) (Zip code)
Diane J. Drake
Mutual Fund Administration, LLC
2220 E. Route 66, Suite 226
Glendora, CA 91740
(Name and address of agent for service)
(626) 385-5777
Registrant's telephone number, including area code
Date of fiscal year end: December 31
Date of reporting period: December 31, 2023
Item 1. Report to Stockholders.
The registrant’s annual report transmitted to shareholders pursuant to Rule 30e-1 under the Investment Company Act of 1940, as amended (the “Investment Company Act”), is as follows:

| WCM Focused International Growth Fund Investor Class Shares – WCMRX Institutional Class Shares – WCMIX | WCM Developing World Equity Fund Investor Class Shares – WCMUX Institutional Class Shares – WCMDX | |
WCM Focused Emerging Markets Fund Investor Class Shares – WFEMX Institutional Class Shares – WCMEX | WCM International Equity Fund Investor Class Shares – WESGX Institutional Class Shares – WCMMX | |
WCM Focused Global Growth Fund Investor Class Shares – WFGGX Institutional Class Shares – WCMGX | WCM Focused International Value Fund Investor Class Shares – WLIVX Institutional Class Shares – WCMVX | |
WCM International Small Cap Growth Fund Institutional Class Shares – WCMSX | WCM Focused International Opportunities Fund Investor Class Shares – WCFOX Institutional Class Shares – WCMOX | |
WCM Small Cap Growth Fund Investor Class Shares – WCMNX Institutional Class Shares – WCMLX | WCM Mid Cap Quality Value Fund Investor Class Shares – WMIDX Institutional Class Shares – WCMAX | |
WCM SMID Quality Value Fund Investor Class Shares – WCMJX Institutional Class Shares – WCMFX | WCM Focused Emerging Markets ex China Fund Investor Class Shares – WCFEX Institutional Class Shares – WCMWX | |
WCM China Quality Growth Fund Investor Class Shares – WCQGX Institutional Class Shares – WCMCX | WCM Quality Dividend Growth Fund Investor Class Shares – WQDGX Institutional Class Shares – WCMYX |
ANNUAL REPORT
DECEMBER 31, 2023
WCM Funds
Each a series of Investment Managers Series Trust
| Table of Contents | |
| Shareholder Letter | 1 |
| Fund Performance | 14 |
| Schedules of Investments | 35 |
| Statements of Assets and Liabilities | 86 |
| Statements of Operations | 95 |
| Statements of Changes in Net Assets | 100 |
| Financial Highlights | 114 |
| Notes to Financial Statements | 141 |
| Report of Independent Registered Public Accounting Firm | 170 |
| Supplemental Information | 172 |
| Expense Examples | 189 |
This report and the financial statements contained herein are provided for the general information of the shareholders of the WCM Funds. This report is not authorized for distribution to prospective investors in the Funds unless preceded or accompanied by an effective Prospectus.
www.wcminvestfunds.com

281 Brooks Street
949.380.0200 | Dear Fellow Shareholders,
We believe that understanding (and periodically reviewing) the “how” and the “why” behind our investment approach serves the valuable function of guarding our temperament in the face of all the noise and volatility that “the market” throws at us over time. To that end, and as is our habit, we are again starting this annual report by laying out some broad principles that aim to give you the basics of our philosophy, goals, strategies, and limitations.
It starts with our philosophical underpinnings. First and foremost is the idea that to achieve a different result than the benchmark (and everyone else), you absolutely have to do something different. This may seem obvious, but surprisingly few are willing to take the career risk to go there.
Second, we observe that the best investors in history (among whom we aspire to be counted) think long term and partner with great businesses. Long-term thinking also means paying attention to where the world is going, recognizing that great people are critical to long-term success, and minimizing portfolio turnover.
Third, we are convinced that success—whether great investments, great businesses, or otherwise—is most often the result of recognizing and capitalizing on the few big ideas that primarily drive the opportunity. Said negatively, more and more data does not always lead to better investment decisions. As evidence, ask yourself if the giant Wall Street firms with their armies of analysts are not counted among the best investors in history.
Fourth, managing to wealth preservation—losing less in the down periods (not every time, but over time)—is perhaps the surest path to long-term outperformance. Our shorthand is “winning by not losing.”
So, how does all that play out in the portfolios?
First is how it impacts portfolio construction. Philosophical underpinning #1— thinking differently about building our global growth portfolios—drives us to a focused, best ideas approach. If you believe you have a stock selection edge (see below), it makes no sense to dilute the portfolio with lower-conviction holdings. |
1
| Philosophical underpinning #2 is what drives us to partner with great businesses for the long run. And in that partnering is philosophical underpinning #3—keep it simple—that motivates our “bottom-up” quest to find “our” type of company, those that satisfy three simple requirements: a) they are on the threshold of a long growth runway, b) they exhibit a strengthening competitive advantage, and c) they possess and nurture a healthy culture that is aligned with, and propels, that competitive advantage. Consequently, our portfolios, almost by definition, display two distinctions. First, our holdings tend to be high quality, historically profitable businesses. Second, the portfolios have a bias toward healthcare, technology, consumer, and niche industrials, simply because there are many more of “our” types of companies among those sectors. | |
| These two ideas, a focused portfolio and quality businesses in growth sectors, translate to a portfolio construction difference that, in our opinion, explains a good portion of our funds’ historical excess return. | |
| In fact, we refer to this as our “structural advantage.” It’s based on our belief that growing global consumer prosperity – which advances in fits and starts – means that these growth sectors have become and will continue to become larger weights in those global benchmarks. It’s simply the idea that wealthier consumers will do just what you’d think: spend more on consumer goods, technology, and healthcare. That’s where the growth is most likely to be, and that trend provides a natural, long-term tailwind (advantage) to our portfolio strategies. | |
| Most importantly, all four of our philosophical underpinnings support and inform our primary distinction: stock selection. The essential elements here are principally two: 1) competitive advantage (“moat”) dynamics (improving? deteriorating?), and 2) the role corporate culture plays in sustaining and strengthening that moat. | |
Finally, and with due respect to valuation, a portfolio of these competitively advantaged businesses is built using thoughtful, multi-factor diversification. We believe this process gives us the best chance of achieving our objective: long-term capital appreciation.
|
2
| With that foundation laid, here is some context for the period 1 January through 31 December 2023. | |
| The dawn of 2023 brought promising developments from China as the government announced the conclusion of its stringent "Zero-COVID" policy, a measure that had previously posed challenges for both the Chinese consumer and global trade. The impact was particularly pronounced in the luxury goods sector, where a surge in demand was unleashed, marking a shift from pent-up consumer interest. Simultaneously, global businesses continued the trend of de-globalization, actively seeking alternative manufacturing locations to safeguard the resilience of their supply chains. | |
| In the technology and healthcare sectors, two significant global trends emerged. From a technological standpoint, the introduction of OpenAI's GPT-4 propelled artificial intelligence into the spotlight, revitalizing a previously stagnant semiconductor cycle. This prompted increased investor enthusiasm for generative AI, benefitting major tech players. The likes of Alphabet, Amazon, Apple, Meta, Microsoft, Nvidia, and Tesla—referred to as the "Magnificent Seven"—emerged as top choices for investors seeking exposure to this technological surge. This group's dominance in supplying AI models, or the infrastructure powering them, significantly influenced both US and global index returns. | |
| In healthcare, specific advancements stood out. The discovery of Glucagon-like-peptide-1 (GLP-1) proved highly effective in managing glucose levels among diabetes patients, offering an additional positive outcome of weight loss. This breakthrough in GLP-1 drugs by Novo Nordisk and Eli Lilly reverberated throughout the healthcare system, generating positive global health expectations while adversely affecting businesses catering to areas like cardiovascular machines, sleep apnea solutions, prosthetic devices, and even fast-food giants. | |
| On the financials front, the sector encountered a mini banking crisis. Silvergate Bank's voluntary liquidation, a deposit run leading to the failure of Silicon Valley Bank, and the weakened state of First Republic Bank culminating in its acquisition by JP Morgan Chase, marked significant events. These occurrences coincided with the latest interest rate hike, declining inflation, and a temporary resolution to the Debt Ceiling increase. | |
| While the cocktail of issues last year impacting markets was unique, it is typical to see markets react (overreact?) swiftly and significantly in response to change. Regardless of headlines and market moving events, we find it helpful to focus on a steady temperament, maintain a long-term perspective, and rely on the actions and activities that have served us well in past periods of market turmoil. Our portfolio activity in 2023 took advantage of dramatic price changes, across all sectors, to position the portfolios in high quality businesses, with growing competitive advantages and long-term tailwinds. |
3
| As for outlook on the market in the near-term, our view is unchanged – nobody really knows what’s next, least of all us. Uncertainty persists, and predictions about inflation, central bank policies, currency moves, geopolitics, etc. are low return on time exercises. Little wonder we choose to keep our focus on individual businesses – businesses that are adapting and finding ways to grow their competitive advantages. While we have no idea what they will do next quarter, we believe they will generate compelling returns over the long run. |
As always, we remain optimistic and steadfast in our commitment to owning businesses with expanding moats and complimentary cultures, which we believe will reward long-term investors.
| |
| Now to the specifics of our funds. | |
| The WCM Focused International Growth Fund (“FIG”; Institutional Class symbol WCMIX; Investor Class symbol WCMRX) returned 16.56% / 16.24%, respectively, and outperformed its benchmark for the 1- year period ending 31 December 2023. FIG’s benchmark, the MSCI ACWI ex USA Index, returned 15.62% over the same period. Attribution analysis reveals that the majority of the fund’s outperformance can be attributed to sector allocation. | |
| From a sector allocation perspective, Information Technology (overweight) was the largest positive contributor to the fund’s relative performance, followed by Industrials (overweight) and Communication Services (no weight). On the other hand, Health Care (overweight) detracted from the fund’s relative performance, as did Consumer Discretionary (overweight) and Financials (underweight). | |
Looking at stock selection, Health Care was the best performing sector relative to the benchmark, followed by Consumer Discretionary and Materials. On the flipside, Financials was the worst performing sector relative to the benchmark, followed by Information Technology and Industrials.
|
4
| The WCM Focused Emerging Markets Fund (“FEM”; Institutional Class symbol WCMEX; Investor Class symbol WFEMX) returned 4.54% / 4.25%, respectively, and underperformed its benchmark for the 1-year period ending 31 December 2023. FEM’s benchmark, the MSCI Emerging Markets Index, returned 9.83% over the same period. Attribution analysis reveals that the majority of the fund’s underperformance can be attributed to stock selection. |
| �� | |
| From a sector allocation perspective, Information Technology (overweight) was the largest positive contributor to the fund’s relative performance, followed by Communication Services (underweight) and Materials (underweight). On the other hand, Energy (no weight) detracted from the fund’s relative performance, as did Consumer Staples (overweight) and Health Care (overweight). | |
Looking at stock selection, Consumer Staples was the best performing sector relative to the benchmark, followed by Industrials and Financials. On the flip-side, Consumer Discretionary was the worst performing sector relative to the benchmark, followed by Information Technology and Materials.
| |
The WCM Focused Global Growth Fund (“FGG”; Institutional Class symbol WCMGX; Investor Class symbol WFGGX) returned 26.45% / 26.13%, respectively, and outperformed its benchmark for the 1-year period ending 31 December 2023. FGG’s benchmark, the MSCI ACWI Index, returned 22.20% over the same period. Attribution analysis reveals that the majority of the fund’s outperformance can be attributed to stock selection.
From a sector allocation perspective, Consumer Staples (underweight) was the largest positive contributor to the fund’s relative performance, followed by Energy (no weight) and Utilities (no weight). On the other hand, Health Care (overweight) detracted from the fund’s relative performance, as did Communication Services (no weight) and Financials (overweight).
Looking at stock selection, Health Care was the best performing sector relative to the benchmark, followed by Consumer Discretionary and Information Technology. On the flipside, Materials was the worst performing sector relative to the benchmark.
| |
| The WCM International Small Cap Growth Fund (“SIG”; Institutional Class symbol WCMSX) returned 22.26% and outperformed its benchmark for the 1-year period ending 31 December 2023. SIG’s benchmark, the MSCI ACWI ex USA Small Cap Index, returned 15.66% over the same period. Attribution analysis reveals that the majority of the fund’s outperformance can be attributed to stock selection. |
5
| From a sector allocation perspective, Information Technology (overweight) was the largest positive contributor to the fund’s relative performance, followed by Real Estate (underweight) and Materials (underweight). On the other hand, Health Care (overweight) detracted from the fund’s relative performance, as did Communication Services (overweight). |
Looking at stock selection, Financials was the best performing sector relative to the benchmark, followed by Communication Services and Health Care. On the flipside, Industrials was the worst performing sector relative to the benchmark, followed by Consumer Discretionary and Information Technology.
| |
| The WCM Small Cap Growth Fund (“SCG”; Institutional Class Symbol WCMLX, Investor Class symbol WCMNX) returned 15.88% / 15.64%, respectively, and underperformed its benchmark for the 1-year period ending 31 December 2023. SCG’s benchmark, the Russell 2000 Growth, returned 18.66% over the same period. Attribution analysis reveals that the majority of the fund’s underperformance can be attributed to stock selection. | |
| From a sector allocation perspective, Energy (underweight) was the largest positive contributor to the fund’s relative performance, followed by Health Care (underweight) and Utilities (no weight). On the other hand, Information Technology (underweight) detracted from the fund’s relative performance, as did Financials (overweight) and Consumer Staples (underweight). | |
Looking at stock selection, Financials was the best performing sector relative to the benchmark, followed by Energy and Industrials. On the flipside, Health Care was the worst performing sector relative to the benchmark, followed by Consumer Discretionary and Materials.
| |
| The WCM SMID Quality Value Fund (“SQV”; Institutional Class Symbol WCMFX, Investor Class Symbol WCMJX) returned 24.09% / 23.83%, respectively, and outperformed its benchmark for the 1-year period ending 31 December 2023. SQV’s benchmark, the Russell 2500 Value Index, returned 15.98% over the same period. Attribution analysis reveals that the majority of the fund’s outperformance can be attributed to stock selection. |
6
| From a sector allocation perspective, Industrials (overweight) was the largest positive contributor to the fund’s relative performance, followed by Utilities (no weight) and Information Technology (overweight). On the other hand, Health Care (overweight) detracted from the fund’s relative performance, as did Consumer Staples (overweight). | |
Looking at stock selection, Industrials was the best performing sector relative to the benchmark, followed by Financials and Health Care. On the flipside, Consumer Discretionary was the worst performing sector relative to the benchmark, followed by Materials and Real Estate.
| |
| The WCM China Quality Growth Fund (“CQG”; Institutional Class symbol WCMCX, Investor Class symbol WCQGX) returned -18.26% / -18.49%, respectively, and underperformed its benchmark for the 1-year period ending 31 December 2023. CQG’s benchmark, the MSCI China All Shares Index, returned -11.53% over the same period. Attribution analysis reveals that the majority of the fund’s underperformance can be attributed to stock selection. | |
| From a sector allocation perspective, Consumer Discretionary (underweight) was the largest positive contributor to the fund’s relative performance, followed by Health Care (overweight). On the other hand, Energy (no weight) detracted from the fund’s relative performance, as did Financials (underweight) and Industrials (overweight). | |
Looking at stock selection, Industrials was the best performing sector relative to the benchmark, followed by Information Technology. On the flipside, Financials was the worst performing sector relative to the benchmark, followed by Consumer Discretionary and Communication Services.
| |
| The WCM Developing World Equity Fund (“DW”; Institutional Class Symbol WCMDX, Investor Class symbol WCMUX) returned 6.86% / 6.59%, respectively, and underperformed its benchmark for the 1-year period ending 31 December 2023. DW’s benchmark, the MSCI Emerging Markets Index, returned 9.83% over the same period. Attribution analysis reveals that the majority of the fund’s underperformance can be attributed to stock selection. | |
| From a sector allocation perspective, Materials (underweight) was the largest positive contributor to the fund’s relative performance, followed by Consumer Discretionary (underweight) and Real Estate (no weight). On the other hand, Information Technology (underweight) detracted from the fund’s relative performance, as did Health Care (overweight) and Communication Services (overweight). |
7
Looking at stock selection, Consumer Discretionary was the best performing sector relative to the benchmark, followed by Industrials and Consumer Staples. On the flipside, Financials was the worst performing sector relative to the benchmark, followed by Information Technology.
| |
| The WCM International Equity Fund (“IE”; Institutional Class symbol WCMMX, Investor Class symbol WESGX) returned 13.83% / 13.59%, respectively, and underperformed its benchmark for the 1-year period ending 31 December 2023. IE’s benchmark, the MSCI ACWI ex USA Index, returned 15.62% over the same period. Attribution analysis reveals that the majority of the fund’s underperformance can be attributed to stock selection. | |
| From a sector allocation perspective, Consumer Staples (no weight) was the largest positive contributor to the fund’s relative performance, followed by Industrials (overweight) and Financials (overweight). On the other hand, Information Technology (underweight) detracted from the fund’s relative performance, as did Health Care (overweight) and Utilities (overweight). | |
Looking at stock selection, Health Care was the best performing sector relative to the benchmark, followed by Consumer Discretionary and Information Technology. On the flipside, Financials was the worst performing sector relative to the benchmark, followed by Industrials and Materials.
| |
| The WCM Focused International Value Fund (“FIV”; Institutional Class symbol WCMVX, Investor Class symbol WLIVX) returned 18.43% / 18.08%, respectively, and outperformed its benchmark for the 1-year period ending 31 December 2023. FIV’s benchmark, the MSCI ACWI ex USA Index, returned 15.62% over the same period. Attribution analysis reveals that the majority of the fund’s outperformance can be attributed to sector allocation. | |
| From a sector allocation perspective, Information Technology (overweight) was the largest positive contributor to the fund’s relative performance, followed by Consumer Staples (underweight) and Industrials (overweight). On the other hand, Communication Services (overweight) detracted from the fund’s relative performance, as did Health Care (overweight) and Financials (overweight). |
8
Looking at stock selection, Industrials was the best performing sector relative to the benchmark, followed by Financials and Information Technology. On the flipside, Consumer Staples was the worst performing sector relative to the benchmark, followed by Communication Services and Consumer Discretionary.
| |
| The WCM Focused International Opportunities Fund (“FIO”; Institutional Class symbol WCMOX, Investor Class symbol WCFOX) returned 25.80% / 25.65%, respectively, and outperformed its benchmark for the 1-year period ending 31 December 2023. FIO’s benchmark, the MSCI ACWI ex USA Index, returned 15.62% over the same period. Attribution analysis reveals that the majority of the fund’s outperformance can be attributed to stock selection. | |
| From a sector allocation perspective, Information Technology (overweight) was the largest positive contributor to the fund’s relative performance, followed by Industrials (underweight) and Communication Services (underweight). On the other hand, Health Care (overweight) was the only detractor from the fund’s relative performance. | |
Looking at stock selection, Information Technology was the best performing sector relative to the benchmark, followed by Health Care and Communication Services. On the flipside, Industrials was the worst performing sector relative to the benchmark, followed by Consumer Discretionary and Financials. �� | |
| The WCM Mid Cap Quality Value Fund (“MQV”; Institutional Class symbol WCMAX, Investor Class symbol WMIDX) returned 29.13% / 28.72%, respectively, and outperformed its benchmark for the 1-year period ending 31 December 2023. MQV’s benchmark, the Russell Midcap Value Index returned 12.71% over the same period. Attribution analysis reveals that the majority of the fund’s outperformance can be attributed to stock selection. | |
| From a sector allocation perspective, Industrials (overweight) was the largest positive contributor to the fund’s relative performance, followed by Utilities (no weight) and Information Technology (overweight). On the other hand, Health Care (overweight) detracted from the fund’s relative performance, as did Financials (underweight) and Materials (overweight). | |
Looking at stock selection, Information Technology was the best performing sector relative to the benchmark, followed by Industrials and Financials. On the flipside, Materials was the worst performing sector relative to the benchmark.
|
9
| The WCM Focused Emerging Market ex-China Fund (“EMXC”; Institutional Class symbol WCMWX, Investor Class symbol WCFEX) returned 29.00% / 28.70%, respectively, and outperformed its benchmark for the 1-year period ending 31 December 2023. EMXC’s benchmark, the MSCI Emerging Markets ex China Index returned 20.03% over the same period. Attribution analysis reveals that the majority of the fund’s outperformance can be attributed to stock selection. | |
| From a sector allocation perspective, Materials (underweight) was the largest positive contributor to the fund’s relative performance, followed by Information Technology (overweight) and Communication Services (underweight). On the other hand, Consumer Staples (overweight) detracted from the fund’s relative performance, as did Health Care (underweight) and Industrials (overweight). | |
Looking at stock selection, Energy was the best performing sector relative to the benchmark, followed by Financials and Information Technology. On the flipside, Consumer Discretionary was the worst performing sector relative to the benchmark, followed by Materials and Health Care.
| |
| The WCM Quality Dividend Growth Fund (“QDG”; Institutional Class symbol WCMYX, Investor Class symbol WQDGX), which launched 28 July 2023, returned 1.02% / 0.95%, respectively through 31 December 2023, and under-performed its benchmark over that period. The S&P 500 Index returned 4.83% over the same period. Attribution analysis reveals that while both allocation and selection detracted, the majority of the fund’s underperformance can be attributed to stock selection. | |
| From a sector allocation perspective, Materials (no exposure) was the only positive contributor to the fund’s relative performance. On the other hand, Consumer Staples (overweight) detracted from the fund’s relative performance, as did Information Technology (underweight) and Energy (overweight). | |
Looking at stock selection, Energy was the best performing sector relative to the benchmark, followed by Industrials and Utilities. On the flipside, Financials was the worst performing sector relative to the benchmark, followed by Information Technology and Communication Services.
|
10
| Thank you for your confidence and trust, | |
| WCM Investment Management, LLC | |
| 1 February 2024 |
11
| IMPORTANT INFORMATION |
| Performance data quoted represents net of fee past performance and is no guarantee of future results and includes the reinvestment of all dividends and income. | |
| Foreign investments present risks due to currency fluctuations, economic and political factors, government regulations, differences in accounting standards and other factors. The WCM China Quality Growth Fund and WCM Developing World Equity Fund are non-diversified and may hold fewer securities than a diversified fund. Holding fewer securities increases the risk that the value of the Fund could go down because of the poor performance of a single investment. | |
| The MSCI ACWI ex USA Index captures large-cap and mid-cap representation across 22 of 23 Developed Markets countries (excluding the U.S.) and 24 Emerging Markets countries. The index covers approximately 85% of the global equity opportunity set outside the U.S. The MSCI ACWI Index captures large-cap and mid-cap representation across Developed Markets countries (including the U.S.) and 21 Emerging Markets countries. The index covers approximately 85% of the global equity opportunity set outside the U.S. The MSCI Emerging Markets Index captures large-cap and mid-cap representation across 24 Emerging Markets (EM) countries. With 1,398 constituents, the index covers approximately 85% of the free-float-adjusted market capitalization in each country. The MSCI ACWI ex USA Small Cap Index captures small-cap representation across 22 of 23 large Developed Markets countries (excluding the U.S.). One cannot invest directly in an index. The Russell 2000 Growth Index measures the performance of the small-cap growth segment of the U.S. equity universe. It is unmanaged and represents total returns including reinvestment of dividends. It is a market-cap weighted index. The MSCI China All Shares Index captures large to mid-cap representation across China A-shares, B-shares, H-shares, Red-chips, P-chips and foreign listings. The index aims to reflect the opportunity set of China share classes listed in Hong Kong, Shanghai, Shenzhen and outside of China. The MSCI Emerging Markets ex China Index captures large and mid-cap representation across 23 of the 24 Emerging Markets (EM) countries excluding China. With 661 constituents, the index covers approximately 85% of the free float-adjusted market capitalization in each country. The Russell Midcap Value Index measures the performance of mid-cap value segment of the US equity universe. The index seeks to provide a comprehensive and unbiased barometer of the mid-cap value market. The Russell 2500 Value Index measures the performance of the 2,500 smallest-cap American companies in the Russell 3000 Index. It is a market-cap weighted index. The S&P 500 Index includes 500 of the top companies in leading industries of the US economy and covers roughly 80% of the available US market capitalization. It is a market cap weighted index. |
12
| The views in this report were those of the Fund managers as of the date this report was written and may not reflect their views on the date this report is first published or anytime thereafter. These views are intended to assist the shareholders of the Fund in understanding their investments in the Fund and do not constitute investment advice. This report may contain discussions about investments that may or may not be held by the Fund as of the date of this report. All current and future holdings are subject to risk and to change. |
13
WCM Focused International Growth Fund
FUND PERFORMANCE at December 31, 2023 (Unaudited)
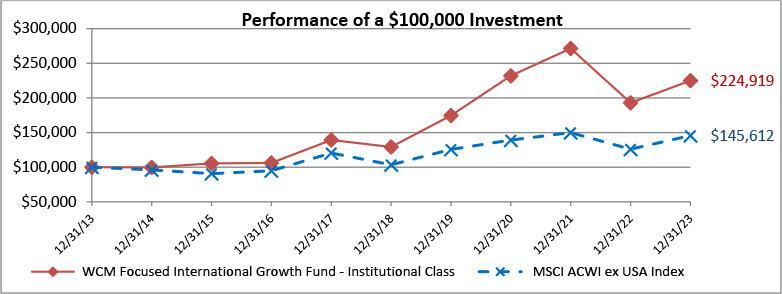
This graph compares a hypothetical $100,000 investment in the Fund’s Institutional Class shares, with a similar investment in the MSCI All Country World ex USA Index (MSCI ACWI ex USA). The performance graph above is shown for the Fund’s Institutional Class shares. Investor Class shares performance may vary. Results include the reinvestment of all dividends and capital gains.
The MSCI ACWI ex USA Index captures large and mid cap representation across Developed Markets countries (excluding the U.S.) and 21 Emerging Markets countries. The index covers approximately 85% of the global equity opportunity set outside the U.S. This index does not reflect expenses, fees or sales charge, which would lower performance. The index is unmanaged and it is not available for investment.
| Average Annual Total Returns as of December 31, 2023 | 1 Year | 5 Years | 10 years |
| Investor Class shares | 16.24% | 11.47% | 8.17% |
| Institutional Class shares | 16.56% | 11.73% | 8.44% |
| MSCI ACWI ex USA Index | 15.62% | 7.08% | 3.83% |
The performance data quoted here represents past performance and past performance is not a guarantee of future results. Investment return and principal value will fluctuate so that an investor's shares, when redeemed, may be worth more or less than their original cost. Current performance may be lower or higher than the performance information quoted. The most recent month end performance may be obtained by calling (888) 988-9801.
Expense ratios for the Investor Class and Institutional Class shares were 1.29% and 1.04%, respectively, which were stated in the current prospectus dated April 30, 2023. For the Fund’s current one year expense ratios, please refer to the Financial Highlights section of this report.
Returns reflect the reinvestment of distributions made by the Fund, if any. The graph and the performance table above do not reflect the deduction of taxes that a shareholder would pay on Fund distributions or the redemption of the Fund shares.
14
WCM Focused Emerging Markets Fund
FUND PERFORMANCE at December 31, 2023 (Unaudited)
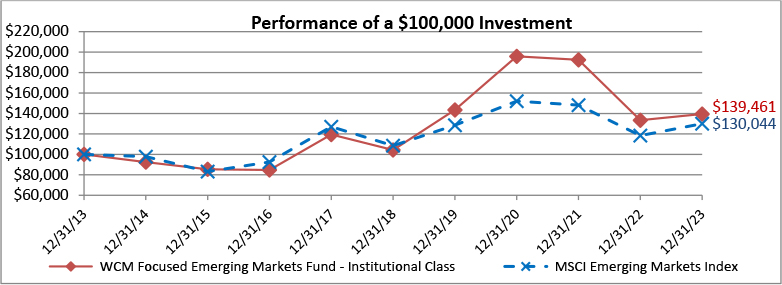
This graph compares a hypothetical $100,000 investment in the Fund’s Institutional Class shares, with a similar investment in the MSCI Emerging Markets Index (MSCI EM). The performance graph above is shown for the Fund’s Institutional Class shares. Investor Class shares performance may vary. Results include the reinvestment of all dividends and capital gains.
The MSCI EM Index is a free float-adjusted market capitalization index that is designed to measure equity market performance of the emerging markets. This index does not reflect expenses, fees or sales charge, which would lower performance. The index is unmanaged and it is not available for investment.
| Average Annual Total Returns as of December 31, 2023 | 1 Year | 5 Years | 10 Years |
| Investor Class shares | 4.25% | 5.74% | 3.23% |
| Institutional Class shares | 4.54% | 5.98% | 3.38% |
| MSCI EM Index | 9.83% | 3.68% | 2.66% |
The performance data quoted here represents past performance and past performance is not a guarantee of future results. Investment return and principal value will fluctuate so that an investor's shares, when redeemed, may be worth more or less than their original cost. Current performance may be lower or higher than the performance information quoted. The most recent month end performance may be obtained by calling (888) 988-9801.
Gross and net expense ratios for the Investor Class shares were 1.62% and 1.50%, respectively, and for the Institutional Class shares were 1.37% and 1.25%, respectively, which were stated in the current prospectus dated April 30, 2023. For the Fund’s current one year expense ratios, please refer to the Financial Highlights section of this report. The Fund’s Advisor has contractually agreed to waive its fees and/or pay for operating expenses of the Fund to ensure that total annual fund operating expenses (excluding, as applicable, taxes, leverage interest, brokerage commissions, dividend and interest expenses on short sales, acquired fund fees and expenses as determined in accordance with Form N-1A, professional fees related to services for the collection of foreign tax reclaims, expenses incurred in connection with any merger or reorganization, or extraordinary expenses such as litigation expenses) do not exceed 1.50% and 1.25% of the average daily net assets of the Fund’s Investor Class and Institutional Class shares, respectively. This agreement is in effect until April 30, 2024, and it may be terminated before that date only by the Trust’s Board of Trustees. In the absence of such waivers, the Fund’s returns would be lower.
Returns reflect the reinvestment of distributions made by the Fund, if any. The graph and the performance table above do not reflect the deduction of taxes that a shareholder would pay on Fund distributions or the redemption of the Fund shares.
15
WCM Focused Global Growth Fund
FUND PERFORMANCE at December 31, 2023 (Unaudited)

This graph compares a hypothetical $100,000 investment in the Fund’s Institutional Class shares, with a similar investment in the MSCI All Country World Index (MSCI ACWI). The performance graph above is shown for the Fund’s Institutional Class shares. Investor Class shares performance may vary. Results include the reinvestment of all dividends and capital gains.
The MSCI All Country World Index captures large to mid-cap representation across Developed Markets countries (including the U.S.) and 21 Emerging Markets countries. The index covers approximately 85% of the global equity opportunity set outside the U.S. This index does not reflect expenses, fees, or sales charge, which would lower performance. The index is unmanaged and it is not available for investment.
| Average Annual Total Returns as of December 31, 2023 | 1 Year | 5 Years | 10 Years |
| Investor Class shares | 26.13% | 13.19% | 9.76% |
| Institutional Class shares | 26.45% | 13.47% | 10.01% |
| MSCI ACWI Index | 22.20% | 11.72% | 7.93% |
The performance data quoted here represents past performance and past performance is not a guarantee of future results. Investment return and principal value will fluctuate so that an investor's shares, when redeemed, may be worth more or less than their original cost. Current performance may be lower or higher than the performance information quoted. The most recent month end performance may be obtained by calling (888) 988-9801.
Gross and net expense ratios for the Investor Class shares were 1.44% and 1.30%, respectively, and the Institutional Class shares were 1.19% and 1.05%, respectively, which were stated in the current prospectus dated April 30, 2023. For the Fund’s current one year expense ratios, please refer to the Financial Highlights section of this report. The Fund’s Advisor has contractually agreed to waive its fees and/or pay for operating expenses of the Fund to ensure that total annual fund operating expenses (excluding, as applicable, taxes, leverage interest, brokerage commissions, dividend and interest expenses on short sales, acquired fund fees and expenses as determined in accordance with Form N-1A, professional fees related to services for the collection of foreign tax reclaims, expenses incurred in connection with any merger or reorganization, or extraordinary expenses such as litigation expenses) do not exceed 1.30% and 1.05% of the average daily net assets of the Fund’s Investor Class and Institutional Class shares, respectively. This agreement is in effect until April 30, 2024, and it may be terminated before that date only by the Trust’s Board of Trustees. In the absence of such waivers, the Fund’s returns would be lower.
16
WCM Focused Global Growth Fund
FUND PERFORMANCE at December 31, 2023 (Unaudited) – Continued
Returns reflect the reinvestment of distributions made by the Fund, if any. The graph and the performance table above do not reflect the deduction of taxes that a shareholder would pay on Fund distributions or the redemption of the Fund shares.
17
WCM International Small Cap Growth Fund
FUND PERFORMANCE at December 31, 2023 (Unaudited)

This graph compares a hypothetical $100,000 investment in the Fund’s Institutional Class shares, made at its inception, with a similar investment in the MSCI All Country World ex USA Small Cap Index (MSCI ACWI ex USA Small Cap). Results include the reinvestment of all dividends and capital gains.
The MSCI ACWI ex USA Small Cap Index captures small cap representation across 22 of 23 large Developed Markets countries (excluding the U.S.). The index covers approximately 14% of the free float-adjusted market capitalization set outside the U.S. This index does not reflect expenses, fees or sales charge, which would lower performance. The index is unmanaged and it is not available for investment.
| Average Annual Total Returns as of December 31, 2023 | 1 Year | 5 Years | Since Inception | Inception Date |
| Institutional Class shares | 22.26% | 13.04% | 11.54% | 11/30/15 |
| MSCI ACWI ex USA Small Cap Index | 15.66% | 7.89% | 6.29% | 11/30/15 |
The performance data quoted here represents past performance and past performance is not a guarantee of future results. Investment return and principal value will fluctuate so that an investor's shares, when redeemed, may be worth more or less than their original cost. Current performance may be lower or higher than the performance information quoted. The most recent month end performance may be obtained by calling (888) 988-9801.
Gross and net expense ratios for the Institutional Class shares were 1.48% and 1.25%, respectively, which were stated in the current prospectus dated April 30, 2023. For the Fund’s current one year expense ratios, please refer to the Financial Highlights section of this report. The Fund’s Advisor has contractually agreed to waive its fees and/or pay for operating expenses of the Fund to ensure that total annual fund operating expenses (excluding, as applicable, taxes, leverage interest, brokerage commissions, dividend and interest expenses on short sales, acquired fund fees and expenses as determined in accordance with Form N-1A, professional fees related to services for the collection of foreign tax reclaims, expenses incurred in connection with any merger or reorganization, or extraordinary expenses such as litigation expenses) do not exceed 1.25% of the average daily net assets of the Institutional Class Shares of the Fund. This agreement is in effect until April 30, 2024 and it may be terminated before that date only by the Trust’s Board of Trustees. In the absence of such waivers, the Fund’s returns would be lower.
Returns reflect the reinvestment of distributions made by the Fund, if any. The graph and the performance table above do not reflect the deduction of taxes that a shareholder would pay on Fund distributions or the redemption of the Fund shares.
18
WCM Small Cap Growth Fund
FUND PERFORMANCE at December 31, 2023 (Unaudited)
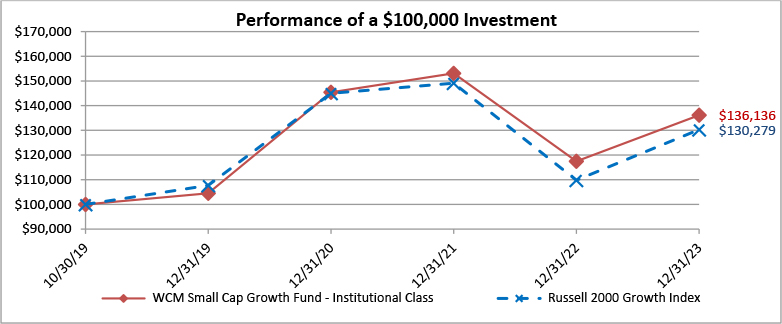
This graph compares a hypothetical $100,000 investment in the Fund’s Institutional Class shares, made at its inception, with a similar investment in the Russell 2000 Growth Index. The performance graph above is shown for the Fund’s Institutional Class shares. Investor Class shares performance may vary. Results include the reinvestment of all dividends and capital gains.
The Russell 2000 Growth Index measures the performance of the small-cap growth segment of the U.S. equity universe. It is unmanaged and represents total returns including reinvestment of dividends. This index does not reflect expenses, fees, or sales charge, which would lower performance. The index is unmanaged and it is not available for investment.
| Average Annual Total Returns as of December 31, 2023 | 1 Year | Since Inception | Inception Date |
| Investor Class shares | 15.64% | 7.42% | 10/30/19 |
| Institutional Class shares | 15.88% | 7.68% | 10/30/19 |
| Russell 2000 Growth Index | 18.66% | 6.55% | 10/30/19 |
The performance data quoted here represents past performance and past performance is not a guarantee of future results. Investment return and principal value will fluctuate so that an investor's shares, when redeemed, may be worth more or less than their original cost. Current performance may be lower or higher than the performance information quoted. The most recent month end performance may be obtained by calling (888) 988-9801.
Gross and net expense ratios for the Investor Class shares were 2.19% and 1.24%, respectively, and the Institutional Class shares were 1.94% and 0.99%, respectively, which were stated in the current prospectus dated April 30, 2023. For the Fund’s current one year expense ratios, please refer to the Financial Highlights section of this report. The Fund’s Advisor has contractually agreed to waive its fees and/or pay for operating expenses of the Fund to ensure that total annual fund operating expenses (excluding, as applicable, taxes, leverage interest, brokerage commissions, dividend and interest expenses on short sales, acquired fund fees and expenses as determined in accordance with Form N-1A, professional fees related to services for the collection of foreign tax reclaims, expenses incurred in connection with any merger or reorganization, or extraordinary expenses such as (litigation expenses) do not exceed 1.24% and 0.99% of the average daily net assets of the Fund’s Investor Class and Institutional Class shares, respectively. This agreement is in effect until April 30, 2033, and it may be terminated before that date only by the Trust’s Board of Trustees. In the absence of such waivers, the Fund’s returns would be lower.
Returns reflect the reinvestment of distributions made by the Fund, if any. The graph and the performance table above do not reflect the deduction of taxes that a shareholder would pay on Fund distributions or the redemption of the Fund shares.
19
WCM SMID Quality Value Fund
FUND PERFORMANCE at December 31, 2023 (Unaudited)
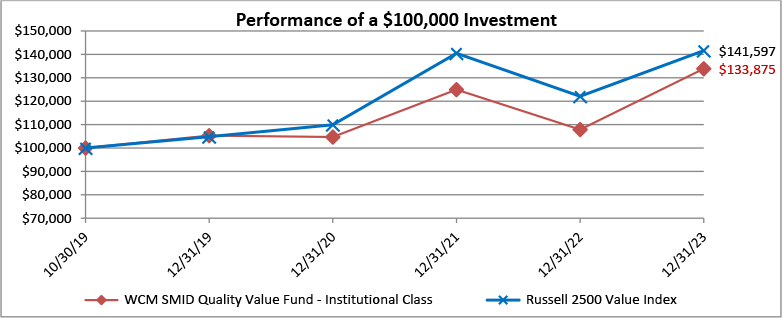
This graph compares a hypothetical $100,000 investment in the Fund’s Institutional Class shares, made at its inception, with a similar investment in the Russell 2500 Value Index. The performance graph above is shown for the Fund’s Institutional Class shares. Investor Class shares performance may vary. Results include the reinvestment of all dividends and capital gains.
The Russell 2500 Value Index measures the performance of the small to mid-cap value segment of the US equity universe. This index does not reflect expenses, fees, or sales charge, which would lower performance. The index is unmanaged and it is not available for investment.
| Average Annual Total Returns as of December 31, 2023 | 1 Year | Since Inception | Inception Date |
| Investor Class shares | 23.83% | 6.95% | 10/30/19 |
| Institutional Class shares | 24.09% | 7.25% | 10/30/19 |
| Russell 2500 Value Index | 15.98% | 8.70% | 10/30/19 |
The performance data quoted here represents past performance and past performance is not a guarantee of future results. Investment return and principal value will fluctuate so that an investor's shares, when redeemed, may be worth more or less than their original cost. Current performance may be lower or higher than the performance information quoted. The most recent month end performance may be obtained by calling (888) 988-9801.
Gross and net expense ratios for the Investor Class shares were 1.51% and 1.10%, respectively, and the Institutional Class shares were 1.26% and 0.85%, respectively, which were stated in the current prospectus dated April 30, 2023. For the Fund’s current one year expense ratios, please refer to the Financial Highlights section of this report. The Fund’s Advisor has contractually agreed to waive its fees and/or pay for operating expenses of the Fund to ensure that total annual fund operating expenses (excluding, as applicable, taxes, leverage interest, brokerage commissions, dividend and interest expenses on short sales, acquired fund fees and expenses as determined in accordance with Form N-1A, professional fees related to services for the collection of foreign tax reclaims, expenses incurred in connection with any merger or reorganization, or extraordinary expenses such as litigation expenses) do not exceed 1.10% and 0.85% of the average daily net assets of the Fund’s Investor Class and Institutional Class shares, respectively. This agreement is in effect until April 30, 2033, and it may be terminated before that date only by the Trust’s Board of Trustees. In the absence of such waivers, the Fund’s returns would be lower.
Returns reflect the reinvestment of distributions made by the Fund, if any. The graph and the performance table above do not reflect the deduction of taxes that a shareholder would pay on Fund distributions or the redemption of the Fund shares.
20
WCM China Quality Growth Fund
FUND PERFORMANCE at December 31, 2023 (Unaudited)
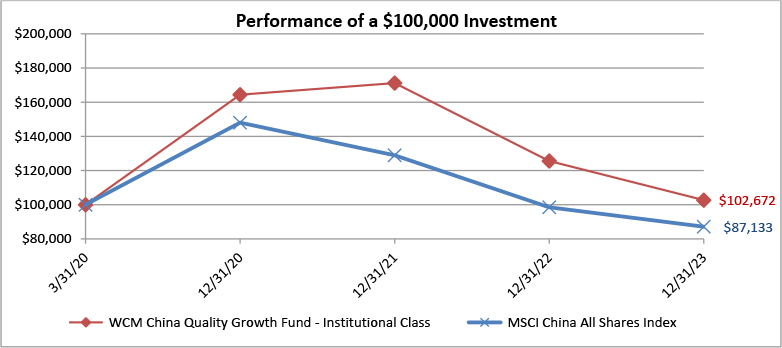
This graph compares a hypothetical $100,000 investment in the Fund’s Institutional Class shares, made at its inception, with a similar investment in the MSCI China All Shares Index (MSCI CASI). The performance graph above is shown for the Fund’s Institutional Class shares. Investor Class shares performance may vary. Results include the reinvestment of all dividends and capital gains.
The MSCI CASI Index captures large to mid-cap representation across China A-shares, B-shares, H-shares, Red-chips, P-chips and foreign listings. The index aims to reflect the opportunity set of China share classes listed in Hong Kong, Shanghai, Shenzhen and outside of China. This index does not reflect expenses, fees, or sales charge, which would lower performance. The index is unmanaged and it is not available for investment.
| Average Annual Total Returns as of December 31, 2023 | 1 Year | Since Inception | Inception Date |
| Investor Class shares | -18.49% | 0.46% | 3/31/20 |
| Institutional Class shares | -18.26% | 0.71% | 3/31/20 |
| MSCI China All Shares Index | -11.53% | -3.60% | 3/31/20 |
The performance data quoted here represents past performance and past performance is not a guarantee of future results. Investment return and principal value will fluctuate so that an investor's shares, when redeemed, may be worth more or less than their original cost. Current performance may be lower or higher than the performance information quoted. The most recent month end performance may be obtained by calling (888) 988-9801.
Gross and net expense ratios for the Investor Class shares were 4.52% and 1.50%, respectively, and the Institutional Class shares were 4.27% and 1.25%, respectively, which were stated in the current prospectus dated April 30, 2023. For the Fund’s current one year expense ratios, please refer to the Financial Highlights section of this report. The Fund’s Advisor has contractually agreed to waive its fees and/or pay for operating expenses of the Fund to ensure that total annual fund operating expenses (excluding, as applicable, taxes, leverage interest, brokerage commissions, dividend and interest expenses on short sales, acquired fund fees and expenses as determined in accordance with Form N-1A, professional fees related to services for the collection of foreign tax reclaims, expenses incurred in connection with any merger or reorganization, or extraordinary expenses such as litigation expenses) do not exceed 1.50% and 1.25% of the average daily net assets of the Fund’s Investor Class and Institutional Class shares, respectively. This agreement is in effect until April 30, 2033, and it may be terminated before that date only by the Trust’s Board of Trustees. In the absence of such waivers, the Fund’s returns would be lower.
21
WCM China Quality Growth Fund
FUND PERFORMANCE at December 31, 2023 (Unaudited) - Continued
Returns reflect the reinvestment of distributions made by the Fund, if any. The graph and the performance table above do not reflect the deduction of taxes that a shareholder would pay on Fund distributions or the redemption of the Fund shares.
22
WCM Developing World Equity Fund
FUND PERFORMANCE at December 31, 2023 (Unaudited)
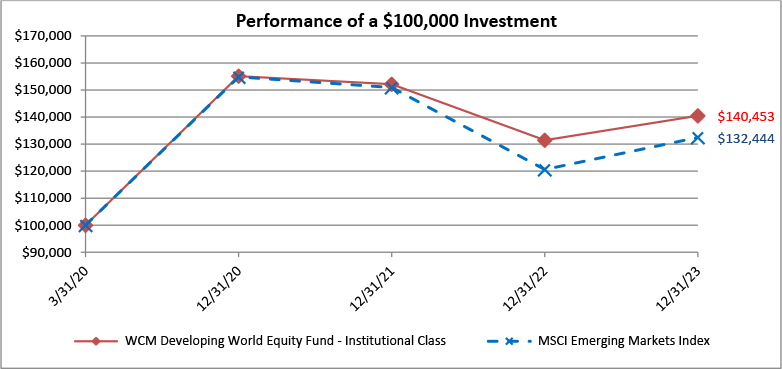
This graph compares a hypothetical $100,000 investment in the Fund’s Institutional Class shares, made at its inception, with a similar investment in the MSCI Emerging Markets Index (MSCI EMI). The performance graph above is shown for the Fund’s Institutional Class shares. Investor Class shares performance may vary. Results include the reinvestment of all dividends and capital gains.
The MSCI Emerging Markets Index is an index used to measure equity market performance in global emerging markets and captures mid to large cap across more than two dozen emerging markets. The index covers approximately 13% of the global market capitalization. This index does not reflect expenses, fees, or sales charge, which would lower performance. The index is unmanaged and it is not available for investment.
| Average Annual Total Returns as of December 31, 2023 | 1 Year | Since Inception | Inception Date |
| Investor Class shares | 6.59% | 9.20% | 3/31/20 |
| Institutional Class shares | 6.86% | 9.47% | 3/31/20 |
| MSCI Emerging Markets Index | 9.83% | 7.77% | 3/31/20 |
The performance data quoted here represents past performance and past performance is not a guarantee of future results. Investment return and principal value will fluctuate so that an investor's shares, when redeemed, may be worth more or less than their original cost. Current performance may be lower or higher than the performance information quoted. The most recent month end performance may be obtained by calling (888) 988-9801.
Gross and net expense ratios for the Investor Class shares were 13.95% and 1.20%, respectively, and the Institutional Class shares were 13.70% and 0.95%, respectively, which were stated in the current prospectus dated April 30, 2023, as supplemented September 20, 2023. For the Fund’s current one year expense ratios, please refer to the Financial Highlights section of this report. The Fund’s Advisor has contractually agreed to waive its fees and/or pay for operating expenses of the Fund to ensure that total annual fund operating expenses (excluding, as applicable, taxes, leverage interest, brokerage commissions, dividend and interest expenses on short sales, acquired fund fees and expenses as determined in accordance with Form N-1A, professional fees related to services for the collection of foreign tax reclaims, expenses incurred in connection with any merger or reorganization, or extraordinary expenses such as litigation expenses) do not exceed 1.20% and 0.95% of the average daily net assets of the Fund’s Investor Class and Institutional Class shares, respectively. Prior to October 1, 2023, the Fund’s annual operating expense limits were 1.50% and 1.25% of the average daily net assets of the Fund’s Investor Class and Institutional Class, respectively. This agreement is in effect until April 30, 2033, and it may be terminated before that date only by the Trust’s Board of Trustees. In the absence of such waivers, the Fund’s returns would be lower.
23
WCM Developing World Equity Fund
FUND PERFORMANCE at December, 2023 (Unaudited) - Continued
Returns reflect the reinvestment of distributions made by the Fund, if any. The graph and the performance table above do not reflect the deduction of taxes that a shareholder would pay on Fund distributions or the redemption of the Fund shares.
24
WCM International Equity Fund
FUND PERFORMANCE at December 31, 2023 (Unaudited)

This graph compares a hypothetical $100,000 investment in the Fund’s Institutional Class shares, made at its inception, with a similar investment in the MSCI All Country World ex USA Index (MSCI ACWI ex USA). The performance graph above is shown for the Fund’s Institutional Class shares. Investor Class shares performance may vary. Results include the reinvestment of all dividends and capital gains.
The MSCI ACWI ex USA Index captures large to mid-cap representation across Developed Markets countries (excluding the U.S.) and 21 Emerging Markets countries. The index covers approximately 85% of the global equity opportunity set outside the U.S. This index does not reflect expenses, fees, or sales charge, which would lower performance. The index is unmanaged and it is not available for investment.
| Average Annual Total Returns as of December 31, 2023 | 1 Year | Since Inception | Inception Date |
| Investor Class shares | 13.59% | 12.69% | 3/31/20 |
| Institutional Class shares | 13.83% | 12.98% | 3/31/20 |
| MSCI ACWI ex USA Index | 15.62% | 11.64% | 3/31/20 |
The performance data quoted here represents past performance and past performance is not a guarantee of future results. Investment return and principal value will fluctuate so that an investor's shares, when redeemed, may be worth more or less than their original cost. Current performance may be lower or higher than the performance information quoted. The most recent month end performance may be obtained by calling (888) 988-9801.
Gross and net expense ratios for the Investor Class shares were 2.98% and 1.10%, respectively, and the Institutional Class shares were 2.73% and 0.85%, respectively, which were stated in the current prospectus dated April 30, 2023, as supplemented September 20, 2023. For the Fund’s current one year expense ratios, please refer to the Financial Highlights section of this report. The Fund’s Advisor has contractually agreed to waive its fees and/or pay for operating expenses of the Fund to ensure that total annual fund operating expenses (excluding, as applicable, taxes, leverage interest, brokerage commissions, dividend and interest expenses on short sales, acquired fund fees and expenses as determined in accordance with Form N-1A, professional fees related to services for the collection of foreign tax reclaims, expenses incurred in connection with any merger or reorganization, or extraordinary expenses such as litigation expenses) do not exceed 1.10% and 0.85% of the average daily net assets of the Fund’s Investor Class and Institutional Class shares, respectively. Prior to October 1, 2023, the Fund’s annual operating expense limits were 1.35% and 1.10% of the average daily net assets of the Fund’s Investor Class and Institutional Class, respectively. This agreement is in effect until April 30, 2033, and it may be terminated before that date only by the Trust’s Board of Trustees. In the absence of such waivers, the Fund’s returns would be lower.
25
WCM International Equity Fund
FUND PERFORMANCE at December 31, 2023 (Unaudited) - Continued
Returns reflect the reinvestment of distributions made by the Fund, if any. The graph and the performance table above do not reflect the deduction of taxes that a shareholder would pay on Fund distributions or the redemption of the Fund shares.
26
WCM Focused International Value Fund
FUND PERFORMANCE at December 31, 2023 (Unaudited)
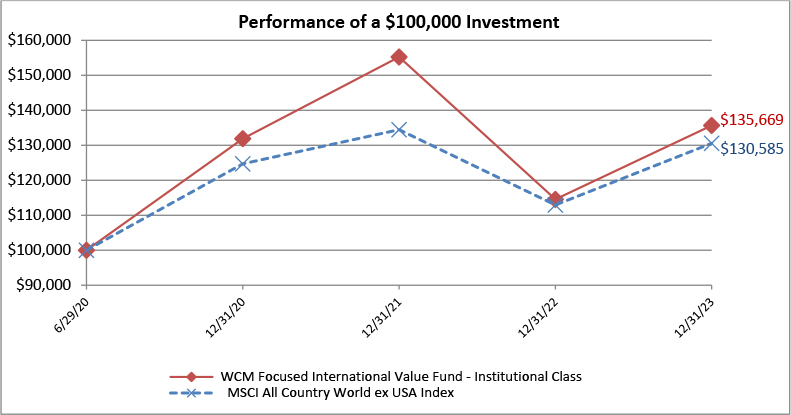
This graph compares a hypothetical $100,000 investment in the Fund’s Institutional Class shares, made at its inception, with a similar investment in the MSCI All Country World ex USA Index (MSCI ACWI ex USA). The performance graph above is shown for the Fund’s Institutional Class shares; Investor Class shares performance may vary. Results include the reinvestment of all dividends and capital gains.
The MSCI ACWI ex USA Index captures large and mid cap representation across Developed Markets countries (excluding the U.S.) and 21 Emerging Markets countries. The index covers approximately 85% of the global equity opportunity set outside the U.S. This index does not reflect expenses, fees or sales charge, which would lower performance. The index is unmanaged and it is not available for investment.
| Average Annual Total Returns as of December 31, 2023 | 1 Year | Since Inception | Inception Date |
| Investor Class shares | 18.08% | 8.81% | 6/29/20 |
| Institutional Class shares | 18.43% | 9.09% | 6/29/20 |
| MSCI ACWI ex USA Index | 15.62% | 7.91% | 6/29/20 |
The performance data quoted here represents past performance and past performance is not a guarantee of future results. Investment return and principal value will fluctuate so that an investor's shares, when redeemed, may be worth more or less than their original cost. Current performance may be lower or higher than the performance information quoted. The most recent month end performance may be obtained by calling (888) 988-9801.
Gross and net expense ratios for the Investor Class shares were 2.88% and 1.50%, respectively, and the Institutional Class shares were 2.63% and 1.25%, respectively, which were stated in the current prospectus dated April 30, 2023. For the Fund’s current one year expense ratios, please refer to the Financial Highlights section of this report. The Fund’s Advisor has contractually agreed to waive its fees and/or pay for operating expenses of the Fund to ensure that total annual fund operating expenses (excluding, as applicable, taxes, leverage interest, brokerage commissions, dividend and interest expenses on short sales, acquired fund fees and expenses as determined in accordance with Form N-1A, professional fees related to services for the collection of foreign tax reclaims, expenses incurred in connection with any merger or reorganization, or extraordinary expenses such as litigation expenses) do not exceed 1.50% and 1.25% of the average daily net assets of the Fund’s Investor Class and Institutional Class shares, respectively. This agreement is in effect until April 30, 2033, and it may be terminated before that date only by the Trust’s Board of Trustees. In the absence of such waivers, the Fund’s returns would be lower.
27
WCM Focused International Value Fund
FUND PERFORMANCE at December 31, 2023 (Unaudited) - Continued
Returns reflect the reinvestment of distributions made by the Fund, if any. The graph and the performance table above do not reflect the deduction of taxes that a shareholder would pay on Fund distributions or the redemption of the Fund shares.
28
WCM Focused International Opportunities Fund
FUND PERFORMANCE at December 31, 2023 (Unaudited)

This graph compares a hypothetical $100,000 investment in the Fund’s Institutional Class shares, made at its inception, with a similar investment in the MSCI ACWI ex USA Index. The performance graph above is shown for the Fund’s Institutional Class shares. Investor Class shares performance may vary. Results include the reinvestment of all dividends and capital gains.
The MSCI ACWI ex USA Index captures large and mid cap representation across Developed Markets countries (excluding the U.S.) and 21 Emerging Markets countries. The index covers approximately 85% of the global equity opportunity set outside the U.S. This index does not reflect expenses, fees or sales charge, which would lower performance. The index is unmanaged and it is not available for investment
| Average Annual Total Returns as of December 31, 2023 | 1 Year | Since Inception | Inception Date |
| Investor Class shares | 25.65% | -1.52% | 3/30/21 |
| Institutional Class shares | 25.80% | -1.29% | 3/30/21 |
| MSCI ACWI ex USA Index | 15.62% | 0.33% | 3/30/21 |
The performance data quoted here represents past performance and past performance is not a guarantee of future results. Investment return and principal value will fluctuate so that an investor's shares, when redeemed, may be worth more or less than their original cost. Current performance may be lower or higher than the performance information quoted. The most recent month end performance may be obtained by calling (888) 988-9801.
Gross and net expense ratios for the Investor Class shares were 2.84% and 1.50%, respectively, and the Institutional Class shares were 2.59% and 1.25%, respectively, which were stated in the current prospectus dated April 30, 2023. For the Fund’s current one year expense ratios, please refer to the Financial Highlights section of this report. The Fund’s Advisor has contractually agreed to waive its fees and/or pay for operating expenses of the Fund to ensure that total annual fund operating expenses (excluding, as applicable, taxes, leverage interest, brokerage commissions, dividend and interest expenses on short sales, acquired fund fees and expenses as determined in accordance with Form N-1A, professional fees related to services for the collection of foreign tax reclaims, expenses incurred in connection with any merger or reorganization, or extraordinary expenses such as litigation expenses) do not exceed 1.50% and 1.25% of the average daily net assets of the Fund’s Investor Class and Institutional Class shares, respectively. This agreement is in effect until April 30, 2033, and it may be terminated before that date only by the Trust’s Board of Trustees. In the absence of such waivers, the Fund’s returns would be lower.
29
WCM Focused International Opportunities Fund
FUND PERFORMANCE at December 31, 2023 (Unaudited) - Continued
Returns reflect the reinvestment of distributions made by the Fund, if any. The graph and the performance table above do not reflect the deduction of taxes that a shareholder would pay on Fund distributions or the redemption of the Fund shares.
30
WCM Mid Cap Quality Value Fund
FUND PERFORMANCE at December 31, 2023 (Unaudited)
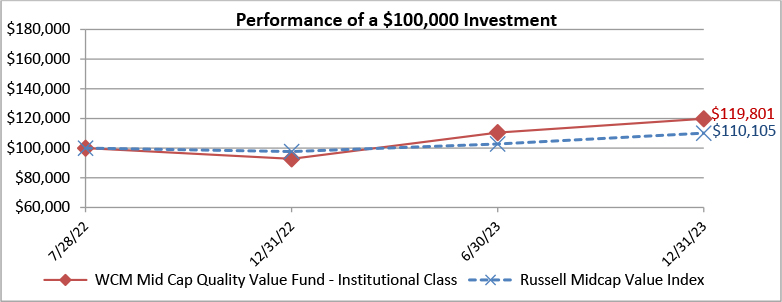
This graph compares a hypothetical $100,000 investment in the Fund’s Institutional Class shares, made at its inception, with a similar investment in the Russell Midcap Value Index. The performance graph above is shown for the Fund’s Institutional Class shares; Investor Class shares performance may vary. Results include the reinvestment of all dividends and capital gains.
The Russell Midcap Value Index measures the performance of the mid-cap value segment of the US equity universe. This index does not reflect expenses, fees, or sales charge, which would lower performance. The index is unmanaged and it is not available for investment.
| Average Annual Total Returns as of December 31, 2023 | 1 Year | Since Inception | Inception Date |
| Investor Class shares | 28.72% | 13.17% | 7/28/22 |
| Institutional Class shares | 29.13% | 13.49% | 7/28/22 |
| Russell Midcap Value Index | 12.71% | 6.98% | 7/28/22 |
The performance data quoted here represents past performance and past performance is not a guarantee of future results. Investment return and principal value will fluctuate so that an investor's shares, when redeemed, may be worth more or less than their original cost. Current performance may be lower or higher than the performance information quoted. The most recent month end performance may be obtained by calling (888) 988-9801.
Gross and net expense ratios for the Investor Class shares were 3.24% and 1.25%, respectively, and the Institutional Class shares were 2.99% and 1.00%, respectively, which were stated in the current prospectus dated April 30, 2023. For the Fund’s current one year expense ratios, please refer to the Financial Highlights section of this report. The Fund’s Advisor has contractually agreed to waive its fees and/or pay for operating expenses of the Fund to ensure that total annual fund operating expenses (excluding, as applicable, taxes, leverage interest, brokerage commissions, dividend and interest expenses on short sales, acquired fund fees and expenses as determined in accordance with Form N-1A, professional fees related to services for the collection of foreign tax reclaims, expenses incurred in connection with any merger or reorganization, or extraordinary expenses such as litigation expenses) do not exceed 1.25% and 1.00% of the average daily net assets of the Fund’s Investor Class and Institutional Class shares, respectively. This agreement is in effect until April 30, 2033, and it may be terminated before that date only by the Trust’s Board of Trustees. In the absence of such waivers, the Fund’s returns would be lower.
Returns reflect the reinvestment of distributions made by the Fund, if any. The performance table above do not reflect the deduction of taxes that a shareholder would pay on Fund distributions or the redemption of the Fund shares.
31
WCM Focused Emerging Markets ex China Fund
FUND PERFORMANCE at December 31, 2023 (Unaudited)
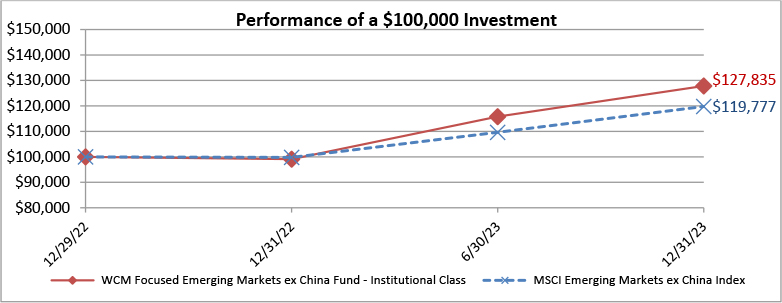
This graph compares a hypothetical $100,000 investment in the Fund’s Institutional Class shares, made at its inception, with a similar investment in the MSCI Emerging Markets ex China Index. The performance graph above is shown for the Fund’s Institutional Class shares; Investor Class shares performance may vary. Results include the reinvestment of all dividends and capital gains.
The MSCI Emerging Markets ex China Index captures large and mid-cap representation across 23 of the 24 Emerging Markets (EM) countries excluding China. With 663 constituents, the index covers approximately 85% of the free float-adjusted market capitalization in each country. This index does not reflect expenses, fees, or sales charge, which would lower performance. The index is unmanaged and it is not available for investment.
| Average Annual Total Returns as of December 31, 2023 | 1 Year | Since Inception | Inception Date |
| Investor Class shares | 28.70% | 27.37% | 12/29/2022 |
| Institutional Class shares | 29.00% | 27.66% | 12/29/2022 |
| MSCI Emerging Markets ex China Index | 20.03% | 19.66% | 12/29/2022 |
The performance data quoted here represents past performance and past performance is not a guarantee of future results. Investment return and principal value will fluctuate so that an investor's shares, when redeemed, may be worth more or less than their original cost. Current performance may be lower or higher than the performance information quoted. The most recent month end performance may be obtained by calling (888) 988-9801.
Gross and net expense ratios for the Investor Class shares were 3.70% and 1.50%, respectively, and the Institutional Class shares were 3.45% and 1.25%, respectively, which were stated in the current prospectus dated April 30, 2023. For the Fund’s current one year expense ratios, please refer to the Financial Highlights section of this report. The Fund’s Advisor has contractually agreed to waive its fees and/or pay for operating expenses of the Fund to ensure that total annual fund operating expenses (excluding, as applicable, taxes, leverage interest, brokerage commissions, dividend and interest expenses on short sales, acquired fund fees and expenses as determined in accordance with Form N-1A, professional fees related to services for the collection of foreign tax reclaims, expenses incurred in connection with any merger or reorganization, or extraordinary expenses such as litigation expenses) do not exceed 1.50% and 1.25% of the average daily net assets of the Fund’s Investor Class and Institutional Class shares, respectively. This agreement is in effect until April 30, 2033, and it may be terminated before that date only by the Trust’s Board of Trustees. In the absence of such waivers, the Fund’s returns would be lower.
32
WCM Focused Emerging Markets ex China Fund
FUND PERFORMANCE at December 31, 2023 (Unaudited) - Continued
Returns reflect the reinvestment of distributions made by the Fund, if any. The performance table above do not reflect the deduction of taxes that a shareholder would pay on Fund distributions or the redemption of the Fund shares.
33
WCM Quality Dividend Growth Fund
FUND PERFORMANCE at December 31, 2023 (Unaudited)
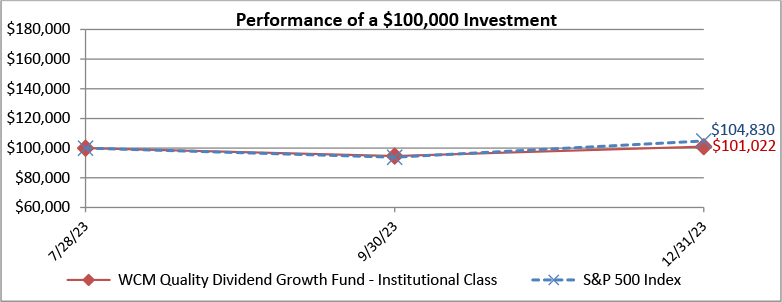
This graph compares a hypothetical $100,000 investment in the Fund’s Institutional Class shares, made at its inception, with a similar investment in the S&P 500 Index. The performance graph above is shown for the Fund’s Institutional Class shares; Investor Class shares performance may vary. Results include the reinvestment of all dividends and capital gains.
The S&P 500® Index is a broad based unmanaged index of 500 stocks and widely recognized as representative of the equity market in general. The index does not reflect expenses, fees or sales charge, which would lower performance. The index is unmanaged and it is not available for investment.
| Total Returns as of December 31, 2023 | 3 Months (Actual) | Since Inception (Cumulative) | Inception Date |
| Investor Class shares | 6.67% | 0.95% | 7/28/23 |
| Institutional Class shares | 6.70% | 1.02% | 7/28/23 |
| S&P 500 Index | 11.69% | 4.83% | 7/28/23 |
The performance data quoted here represents past performance and past performance is not a guarantee of future results. Investment return and principal value will fluctuate so that an investor's shares, when redeemed, may be worth more or less than their original cost. Current performance may be lower or higher than the performance information quoted. The most recent month end performance may be obtained by calling (888) 988-9801.
Gross and net expense ratios for the Investor Class shares were 3.09% and 1.24%, respectively, and the Institutional Class shares were 2.84% and 0.99%, respectively, which were stated in the current prospectus dated July 28, 2023. For the Fund’s current period ended December 31, 2023 expense ratios, please refer to the Financial Highlights section of this report. The Fund’s Advisor has contractually agreed to waive its fees and/or pay for operating expenses of the Fund to ensure that total annual fund operating expenses (excluding, as applicable, taxes, leverage interest, brokerage commissions, dividend and interest expenses on short sales, acquired fund fees and expenses as determined in accordance with Form N-1A, professional fees related to services for the collection of foreign tax reclaims, expenses incurred in connection with any merger or reorganization, or extraordinary expenses such as litigation expenses) do not exceed 1.24% and 0.99% of the average daily net assets of the Fund’s Investor Class and Institutional Class shares, respectively. This agreement is in effect until April 30, 2034, and it may be terminated before that date only by the Trust’s Board of Trustees. In the absence of such waivers, the Fund’s returns would be lower.
Returns reflect the reinvestment of distributions made by the Fund, if any. The performance table above do not reflect the deduction of taxes that a shareholder would pay on Fund distributions or the redemption of the Fund shares.
34
WCM Focused International Growth Fund
SCHEDULE OF INVESTMENTS
As of December 31, 2023
| Number of Shares | Value | |||||||
| COMMON STOCKS — 99.6% | ||||||||
| ARGENTINA — 4.4% | ||||||||
| 486,444 | MercadoLibre, Inc.* | $ | 764,466,204 | |||||
| AUSTRALIA — 4.4% | ||||||||
| 3,214,663 | Atlassian Corp. - Class A* | 764,639,741 | ||||||
| BERMUDA — 2.5% | ||||||||
| 5,929,797 | Arch Capital Group Ltd.* | 440,406,023 | ||||||
| CANADA — 11.7% | ||||||||
| 5,242,219 | Canadian Natural Resources Ltd. | 343,428,444 | ||||||
| 11,552,222 | Canadian Pacific Kansas City Ltd. | 913,318,671 | ||||||
| 2,644,293 | Thomson Reuters Corp. | 386,596,395 | ||||||
| 2,674,794 | Waste Connections, Inc. | 399,266,501 | ||||||
| 2,042,610,011 | ||||||||
| DENMARK — 5.7% | ||||||||
| 9,714,064 | Novo Nordisk A.S. - Class B | 1,004,248,386 | ||||||
| FRANCE — 10.2% | ||||||||
| 922,453 | L'Oreal S.A. | 458,935,134 | ||||||
| 578,385 | LVMH Moet Hennessy Louis Vuitton S.E. | 468,429,274 | ||||||
| 2,883,873 | Safran S.A. | 507,686,452 | ||||||
| 1,770,173 | Schneider Electric S.E. | 355,246,244 | ||||||
| 1,790,297,104 | ||||||||
| INDIA — 2.6% | ||||||||
| 18,910,459 | ICICI Bank Ltd. - ADR | 450,825,343 | ||||||
| IRELAND — 14.8% | ||||||||
| 1,207,131 | Accenture PLC - Class A | 423,594,339 | ||||||
| 1,850,566 | Aon PLC - Class A | 538,551,717 | ||||||
| 9,944,197 | Experian PLC | 405,880,418 | ||||||
| 2,801,222 | ICON PLC* | 792,941,912 | ||||||
| 1,983,624 | STERIS PLC | 436,099,736 | ||||||
| 2,597,068,122 | ||||||||
| ITALY — 4.4% | ||||||||
| 2,264,916 | Ferrari N.V. | 763,140,167 | ||||||
| JAPAN — 4.6% | ||||||||
| 10,669,500 | Advantest Corp. | 362,990,011 | ||||||
| 988,019 | Keyence Corp. | 435,288,938 | ||||||
| 798,278,949 | ||||||||
35
WCM Focused International Growth Fund
SCHEDULE OF INVESTMENTS - Continued
As of December 31, 2023
| Number of Shares | Value | |||||||
| COMMON STOCKS (Continued) | ||||||||
| NETHERLANDS — 10.0% | ||||||||
| 527,571 | Adyen N.V.* | $ | 679,470,444 | |||||
| 1,057,629 | ASM International N.V. | 548,722,399 | ||||||
| 678,758 | ASML Holding N.V. | 513,765,505 | ||||||
| 1,741,958,348 | ||||||||
| SWEDEN — 4.7% | ||||||||
| 19,328,025 | Atlas Copco A.B. - A Shares | 332,574,408 | ||||||
| 4,116,008 | Evolution A.B. | 490,602,395 | ||||||
| 823,176,803 | ||||||||
| SWITZERLAND — 4.8% | ||||||||
| 3,781,253 | Nestle S.A. | 438,366,401 | ||||||
| 12,881,641 | UBS Group A.G. | 399,727,536 | ||||||
| 838,093,937 | ||||||||
| UNITED KINGDOM — 13.2% | ||||||||
| 3,492,513 | AstraZeneca PLC | 471,901,055 | ||||||
| 40,751,632 | BAE Systems PLC | 576,860,259 | ||||||
| 12,429,647 | Compass Group PLC | 340,013,033 | ||||||
| 2,832,432 | Ferguson PLC | 544,642,916 | ||||||
| 907,424 | Linde PLC | 372,688,111 | ||||||
| 2,306,105,374 | ||||||||
| UNITED STATES — 1.6% | ||||||||
| 974,243 | EPAM Systems, Inc.* | 289,681,414 | ||||||
| TOTAL COMMON STOCKS | ||||||||
| (Cost $12,965,066,065) | 17,414,995,926 | |||||||
Principal Amount | ||||||||
| BANK DEPOSIT INVESTMENTS — 0.3% | ||||||||
| $ | 48,107,966 | UMB Bank, Money Market Special II, 5.18%1 | 48,107,966 | |||||
| TOTAL BANK DEPOSIT INVESTMENTS | ||||||||
| (Cost $48,107,966) | 48,107,966 | |||||||
| TOTAL INVESTMENTS — 99.9% | ||||||||
| (Cost $13,013,174,031) | 17,463,103,892 | |||||||
| Other Assets in Excess of Liabilities — 0.1% | 14,576,954 | |||||||
| TOTAL NET ASSETS — 100.0% | $ | 17,477,680,846 |
ADR – American Depository Receipt
PLC – Public Limited Company
| * | Non-income producing security. |
| 1 | The rate is the annualized seven-day yield at period end. |
See accompanying Notes to Financial Statements.
36
WCM Focused International Growth Fund
SUMMARY OF INVESTMENTS
As of December 31, 2023
| Security Type/Sector | Percent of Total Net Assets | |||
| Common Stocks | ||||
| Industrials | 25.2 | % | ||
| Technology | 25.0 | % | ||
| Health Care | 15.5 | % | ||
| Consumer Discretionary | 14.2 | % | ||
| Financials | 10.5 | % | ||
| Consumer Staples | 5.1 | % | ||
| Materials | 2.1 | % | ||
| Energy | 2.0 | % | ||
| Total Common Stocks | 99.6 | % | ||
| Bank Deposit Investments | 0.3 | % | ||
| Total Investments | 99.9 | % | ||
| Other Assets in Excess of Liabilities | 0.1 | % | ||
| Total Net Assets | 100.0 | % | ||
See accompanying Notes to Financial Statements.
37
WCM Focused Emerging Markets Fund
SCHEDULE OF INVESTMENTS
As of December 31, 2023
| Number of Shares | Value | |||||||
| COMMON STOCKS — 99.0% | ||||||||
| ARGENTINA — 2.7% | ||||||||
| 135,490 | Globant S.A.* | $ | 32,243,910 | |||||
| BRAZIL — 10.1% | ||||||||
| 1,621,400 | Equatorial Energia S.A. | 11,922,844 | ||||||
| 4,493,200 | GPS Participacoes e Empreendimentos S.A. | 17,435,940 | ||||||
| 2,152,979 | Localiza Rent a Car S.A. | 28,188,707 | ||||||
| 4,524,507 | NU Holdings Ltd. - Class A* | 37,689,144 | ||||||
| 2,074,600 | Porto Seguro S.A. | 12,274,375 | ||||||
| 1,764,800 | TOTVS S.A. | 12,239,812 | ||||||
| 119,750,822 | ||||||||
| CANADA — 2.2% | ||||||||
| 906,390 | Celestica, Inc.* | 26,539,099 | ||||||
| CHINA — 18.0% | ||||||||
| 18,015,000 | China Overseas Property Holdings Ltd. | 13,519,613 | ||||||
| 1,168,519 | Circuit Fabology Microelectronics Equipment Co., Ltd. - Class A* | 14,065,659 | ||||||
| 459,706 | Eastroc Beverage Group Co., Ltd. - Class A | 11,830,031 | ||||||
| 67,100 | Kweichow Moutai Co., Ltd. - Class A | 16,329,855 | ||||||
| 10,350,000 | Li Ning Co., Ltd. | 27,702,504 | ||||||
| 2,667,504 | Qingdao Haier Biomedical Co., Ltd. - Class A | 15,240,301 | ||||||
| 6,364,540 | Shenzhen H&T Intelligent Control Co., Ltd. - Class A | 12,823,845 | ||||||
| 4,356,520 | Shenzhou International Group Holdings Ltd. | 44,856,785 | ||||||
| 2,348,435 | Sunresin New Materials Co., Ltd. - Class A | 17,569,719 | ||||||
| 2,696,602 | WuXi AppTec Co., Ltd. - Class H | 27,437,412 | ||||||
| 595,616 | ZTO Express Cayman, Inc. - ADR | 12,674,709 | ||||||
| 214,050,433 | ||||||||
| HONG KONG — 5.5% | ||||||||
| 3,747,846 | AIA Group Ltd. | 32,661,961 | ||||||
| 474,717 | Hong Kong Exchanges & Clearing Ltd. | 16,293,034 | ||||||
| 1,436,385 | Techtronic Industries Co., Ltd. | 17,116,683 | ||||||
| 66,071,678 | ||||||||
| INDIA — 11.6% | ||||||||
| 8,698,081 | Bharat Electronics Ltd. | 19,253,856 | ||||||
| 534,995 | Divi's Laboratories Ltd. | 25,098,806 | ||||||
| 2,935,154 | ICICI Bank Ltd. | 35,152,517 | ||||||
| 1,361,820 | Kotak Mahindra Bank Ltd. | 31,226,656 | ||||||
| 1,655,038 | UPL Ltd. | 11,679,806 | ||||||
| 254,525 | WNS Holdings Ltd. - ADR* | 16,085,980 | ||||||
| 138,497,621 | ||||||||
38
WCM Focused Emerging Markets Fund
SCHEDULE OF INVESTMENTS - Continued
As of December 31, 2023
| Number of Shares | Value | |||||||
| COMMON STOCKS (Continued) | ||||||||
| INDONESIA — 4.0% | ||||||||
| 49,321,675 | Bank Central Asia Tbk P.T. | $ | 30,111,304 | |||||
| 45,902,000 | Bank Mandiri Persero Tbk P.T. | 18,036,442 | ||||||
| 48,147,746 | ||||||||
| MEXICO — 9.1% | ||||||||
| 369,076 | Fomento Economico Mexicano S.A.B. de C.V. - ADR | 48,109,057 | ||||||
| 1,043,187 | Grupo Aeroportuario del Pacifico S.A.B. de C.V. - Class B | 18,210,466 | ||||||
| 2,407,200 | Qualitas Controladora S.A.B. de C.V. | 24,322,912 | ||||||
| 4,316,089 | Wal-Mart de Mexico S.A.B. de C.V. | 18,191,066 | ||||||
| 108,833,501 | ||||||||
| NETHERLANDS — 1.3% | ||||||||
| 99,626 | BE Semiconductor Industries N.V. | 15,007,692 | ||||||
| PERU — 2.2% | ||||||||
| 175,085 | Credicorp Ltd. | 26,250,494 | ||||||
| POLAND — 1.4% | ||||||||
| 142,923 | Dino Polska S.A.* | 16,733,919 | ||||||
| RUSSIA — 0.0% | ||||||||
| 15,336,645 | Moscow Exchange MICEX-RTS PJSC1 | — | ||||||
| 801,002 | Yandex N.V. - Class A*,1 | — | ||||||
| — | ||||||||
| SOUTH AFRICA — 5.6% | ||||||||
| 201,176 | Capitec Bank Holdings Ltd. | 22,285,363 | ||||||
| 257,254 | Naspers Ltd. - N Shares | 43,990,188 | ||||||
| 66,275,551 | ||||||||
| SOUTH KOREA — 7.4% | ||||||||
| 1,077,003 | Coupang, Inc.* | 17,436,678 | ||||||
| 1,169,619 | Samsung Electronics Co., Ltd. | 70,992,179 | ||||||
| 88,428,857 | ||||||||
| TAIWAN — 11.1% | ||||||||
| 455,629 | Airtac International Group | 14,994,389 | ||||||
| 6,046,000 | Taiwan Semiconductor Manufacturing Co., Ltd. | 116,820,449 | ||||||
| 131,814,838 | ||||||||
| THAILAND — 2.7% | ||||||||
| 172,075 | Fabrinet* | 32,751,035 | ||||||
39
WCM Focused Emerging Markets Fund
SCHEDULE OF INVESTMENTS - Continued
As of December 31, 2023
| Number of Shares | Value | |||||||
| COMMON STOCKS (Continued) | ||||||||
| UNITED KINGDOM — 0.9% | ||||||||
| 362,451 | Wizz Air Holdings PLC* | $ | 10,215,158 | |||||
| UNITED STATES — 3.2% | ||||||||
| 126,440 | EPAM Systems, Inc.* | 37,595,670 | ||||||
| TOTAL COMMON STOCKS | ||||||||
| (Cost $1,200,699,693) | 1,179,208,024 | |||||||
| RIGHTS — 0.0% | ||||||||
| BRAZIL — 0.0% | ||||||||
| 7,725 | Localiza Rent a Car S.A. (Expires 3/11/2024)* | 31,805 | ||||||
| TOTAL RIGHTS | ||||||||
| (Cost $0) | 31,805 | |||||||
Principal Amount | ||||||||
| BANK DEPOSIT INVESTMENTS — 1.1% | ||||||||
| $ | 12,421,786 | UMB Bank, Money Market Special II, 5.18%2 | 12,421,786 | |||||
| TOTAL BANK DEPOSIT INVESTMENTS | ||||||||
| (Cost $12,421,786) | 12,421,786 | |||||||
| TOTAL INVESTMENTS — 100.1% | ||||||||
| (Cost $1,213,121,479) | 1,191,661,615 | |||||||
| Liabilities in Excess of Other Assets — (0.1)% | (837,970 | ) | ||||||
| TOTAL NET ASSETS — 100.0% | $ | 1,190,823,645 |
ADR – American Depository Receipt
PJSC – Public Joint Stock Company
PLC – Public Limited Company
| * | Non-income producing security. |
| 1 | Level 3 securities fair valued under procedures established by the Board of Trustees, represents 0.00% of Total Net Assets. The total value of these securities is $0. |
| 2 | The rate is the annualized seven-day yield at period end. |
See accompanying Notes to Financial Statements.
40
WCM Focused Emerging Markets Fund
SUMMARY OF INVESTMENTS
As of December 31, 2023
| Security Type/Sector | Percent of Total Net Assets | |||
| Common Stocks | ||||
| Technology | 31.3 | % | ||
| Financials | 24.1 | % | ||
| Consumer Discretionary | 11.1 | % | ||
| Consumer Staples | 9.3 | % | ||
| Industrials | 9.2 | % | ||
| Health Care | 5.7 | % | ||
| Communications | 3.7 | % | ||
| Materials | 2.5 | % | ||
| Real Estate | 1.1 | % | ||
| Utilities | 1.0 | % | ||
| Total Common Stocks | 99.0 | % | ||
| Rights | 0.0 | % | ||
| Bank Deposit Investments | 1.1 | % | ||
| Total Investments | 100.1 | % | ||
| Liabilities in Excess of Other Assets | (0.1 | )% | ||
| Total Net Assets | 100.0 | % | ||
See accompanying Notes to Financial Statements.
41
WCM Focused Global Growth Fund
SCHEDULE OF INVESTMENTS
As of December 31, 2023
| Number of Shares | Value | |||||||
| COMMON STOCKS — 99.4% | ||||||||
| AUSTRALIA — 2.8% | ||||||||
| 50,148 | Atlassian Corp. - Class A* | $ | 11,928,203 | |||||
| CANADA — 6.3% | ||||||||
| 186,370 | Canadian Pacific Kansas City Ltd. | 14,734,412 | ||||||
| 80,710 | Waste Connections, Inc. | 12,047,582 | ||||||
| 26,781,994 | ||||||||
| DENMARK — 4.5% | ||||||||
| 185,084 | Novo Nordisk A.S. - Class B | 19,134,145 | ||||||
| FRANCE — 2.8% | �� | |||||||
| 14,607 | LVMH Moet Hennessy Louis Vuitton S.E. | 11,830,090 | ||||||
| INDIA — 2.6% | ||||||||
| 471,354 | ICICI Bank Ltd. -ADR | 11,237,079 | ||||||
| ITALY — 1.7% | ||||||||
| 21,877 | Ferrari N.V. | 7,371,230 | ||||||
| NETHERLANDS — 3.5% | ||||||||
| 11,516 | Adyen N.V.* | 14,831,713 | ||||||
| SWEDEN — 4.0% | ||||||||
| 609,858 | Atlas Copco A.B. - A Shares | 10,493,735 | ||||||
| 57,159 | Evolution A.B. | 6,812,995 | ||||||
| 17,306,730 | ||||||||
| UNITED KINGDOM — 8.2% | ||||||||
| 438,280 | 3i Group PLC | 13,525,505 | ||||||
| 66,310 | AstraZeneca PLC | 8,959,669 | ||||||
| 30,533 | Linde PLC | 12,540,208 | ||||||
| 35,025,382 | ||||||||
| UNITED STATES — 63.0% | ||||||||
| 108,091 | Amazon.com, Inc.* | 16,423,346 | ||||||
| 69,385 | Arista Networks, Inc.* | 16,340,861 | ||||||
| 61,119 | Arthur J. Gallagher & Co. | 13,744,441 | ||||||
| 97,505 | Booz Allen Hamilton Holding Corp. | 12,471,865 | ||||||
| 172,230 | Corteva, Inc. | 8,253,262 | ||||||
| 12,506 | Costco Wholesale Corp. | 8,254,960 | ||||||
| 142,305 | Datadog, Inc.* | 17,272,981 | ||||||
| 116,179 | Entegris, Inc. | 13,920,568 | ||||||
| 105,418 | Floor & Decor Holdings, Inc. - Class A* | 11,760,432 | ||||||
42
WCM Focused Global Growth Fund
SCHEDULE OF INVESTMENTS - Continued
As of December 31, 2023
| Number of Shares | Value | |||||||
| COMMON STOCKS (Continued) | ||||||||
| UNITED STATES (Continued) | ||||||||
| 102,654 | General Electric Co. | $ | 13,101,730 | |||||
| 34,538 | HEICO Corp. - Class A | 4,919,593 | ||||||
| 40,629 | Intuitive Surgical, Inc.* | 13,706,599 | ||||||
| 14,292 | Lam Research Corp. | 11,194,352 | ||||||
| 35,991 | LPL Financial Holdings, Inc. | 8,192,271 | ||||||
| 25,661 | McKesson Corp. | 11,880,530 | ||||||
| 44,864 | Microsoft Corp. | 16,870,659 | ||||||
| 18,390 | NVIDIA Corp. | 9,107,096 | ||||||
| 24,760 | Old Dominion Freight Line, Inc. | 10,035,971 | ||||||
| 43,614 | Snowflake, Inc. - Class A* | 8,679,186 | ||||||
| 23,374 | Thermo Fisher Scientific, Inc. | 12,406,685 | ||||||
| 28,293 | UnitedHealth Group, Inc. | 14,895,416 | ||||||
| 58,718 | Visa, Inc. - Class A | 15,287,231 | ||||||
| 268,720,035 | ||||||||
| TOTAL COMMON STOCKS | ||||||||
| (Cost $353,210,633) | 424,166,601 | |||||||
| SHORT-TERM INVESTMENTS — 0.7% | ||||||||
| 3,070,215 | Morgan Stanley Institutional Liquidity Treasury Portfolio - Institutional Class, 5.14%1 | 3,070,215 | ||||||
| TOTAL SHORT-TERM INVESTMENTS | ||||||||
| (Cost $3,070,215) | 3,070,215 | |||||||
| TOTAL INVESTMENTS — 100.1% | ||||||||
| (Cost $356,280,848) | 427,236,816 | |||||||
| Liabilities in Excess of Other Assets — (0.1)% | (449,877 | ) | ||||||
| TOTAL NET ASSETS — 100.0% | $ | 426,786,939 | ||||||
ADR – American Depository Receipt
PLC – Public Limited Company
| * | Non-income producing security. |
| 1 | The rate is the annualized seven-day yield at period end. |
See accompanying Notes to Financial Statements.
43
WCM Focused Global Growth Fund
SUMMARY OF INVESTMENTS
As of December 31, 2023
| Security Type/Sector | Percent of Total Net Assets | |||
| Common Stocks | ||||
| Technology | 34.7 | % | ||
| Health Care | 19.0 | % | ||
| Industrials | 15.3 | % | ||
| Consumer Discretionary | 12.7 | % | ||
| Financials | 10.9 | % | ||
| Materials | 4.9 | % | ||
| Consumer Staples | 1.9 | % | ||
| Total Common Stocks | 99.4 | % | ||
| Short-Term Investments | 0.7 | % | ||
| Total Investments | 100.1 | % | ||
| Liabilities in Excess of Other Assets | (0.1 | )% | ||
| Total Net Assets | 100.0 | % | ||
See accompanying Notes to Financial Statements.
44
WCM International Small Cap Growth Fund
SCHEDULE OF INVESTMENTS
As of December 31, 2023
| Number of Shares | Value | |||||||
| COMMON STOCKS — 98.7% | ||||||||
| ARGENTINA — 2.2% | ||||||||
| 28,030 | Globant S.A.* | $ | 6,670,579 | |||||
| AUSTRALIA — 2.8% | ||||||||
| 189,376 | HUB24 Ltd. | 4,644,390 | ||||||
| 1,005,409 | Steadfast Group Ltd. | 3,987,380 | ||||||
| 8,631,770 | ||||||||
| BELGIUM — 2.2% | ||||||||
| 34,706 | D'ieteren Group | 6,777,977 | ||||||
| BRAZIL — 3.6% | ||||||||
| 366,994 | CI&T, Inc. - Class A* | 1,930,388 | ||||||
| 757,400 | GPS Participacoes e Empreendimentos S.A. | 2,939,104 | ||||||
| 1,716,010 | Grupo SBF S.A. | 4,143,774 | ||||||
| 1,064,510 | Vamos Locacao de Caminhoes Maquinas e Equipamentos S.A. | 2,206,772 | ||||||
| 11,220,038 | ||||||||
| CANADA — 7.7% | ||||||||
| 52,595 | Cargojet, Inc. | 4,730,017 | ||||||
| 220,485 | Celestica, Inc.* | 6,455,801 | ||||||
| 39,435 | Descartes Systems Group, Inc.* | 3,313,183 | ||||||
| 116,756 | Exchange Income Corp. | 3,973,810 | ||||||
| 318,649 | PrairieSky Royalty Ltd. | 5,578,943 | ||||||
| 24,051,754 | ||||||||
| CHINA — 3.1% | ||||||||
| 527,971 | Huali Industrial Group Co., Ltd. - Class A | 3,918,727 | ||||||
| 2,156,500 | Li Ning Co., Ltd. | 5,772,024 | ||||||
| 9,690,751 | ||||||||
| DENMARK — 1.2% | ||||||||
| 243,169 | ALK-Abello A/S* | 3,644,276 | ||||||
| FAROE ISLANDS — 1.5% | ||||||||
| 87,727 | Bakkafrost P/F | 4,593,624 | ||||||
| FRANCE — 4.2% | ||||||||
| 30,710 | Alten S.A. | 4,563,442 | ||||||
| 37,037 | Gaztransport Et Technigaz S.A. | 4,902,557 | ||||||
| 20,792 | SOITEC* | 3,714,005 | ||||||
| 13,180,004 | ||||||||
45
WCM International Small Cap Growth Fund
SCHEDULE OF INVESTMENTS - Continued
As of December 31, 2023
| Number of Shares | Value | |||||||
| COMMON STOCKS (Continued) | ||||||||
| GERMANY — 6.9% | ||||||||
| 172,543 | Evotec S.E.* | $ | 4,053,560 | |||||
| 84,519 | Puma S.E. | 4,713,954 | ||||||
| 142,444 | Schott Pharma A.G. & Co. KGaA* | 5,283,858 | ||||||
| 103,418 | Scout24 S.E. | 7,325,347 | ||||||
| 21,376,719 | ||||||||
| INDIA — 1.7% | ||||||||
| 956,849 | Muthoot Microfin Ltd.* | 2,887,894 | ||||||
| 352,433 | UPL Ltd. | 2,487,163 | ||||||
| 5,375,057 | ||||||||
| ITALY — 1.5% | ||||||||
| 502,124 | Technoprobe S.p.A.* | 4,792,296 | ||||||
| JAPAN — 17.4% | ||||||||
| 143,000 | BayCurrent Consulting, Inc. | 5,021,227 | ||||||
| 74,700 | GMO Payment Gateway, Inc. | 5,190,855 | ||||||
| 303,200 | Integral Corp.* | 5,719,943 | ||||||
| 181,960 | Japan Elevator Service Holdings Co., Ltd. | 3,017,181 | ||||||
| 130,900 | Jeol Ltd. | 5,746,603 | ||||||
| 116,740 | Kobe Bussan Co., Ltd. | 3,449,212 | ||||||
| 206,400 | M&A Research Institute Holdings, Inc.* | 6,550,638 | ||||||
| 273,900 | Plus Alpha Consulting Co., Ltd. | 5,511,023 | ||||||
| 259,100 | Rakus Co., Ltd. | 4,800,700 | ||||||
| 22,900 | SHIFT, Inc.* | 5,817,575 | ||||||
| 54,600 | Visional, Inc.* | 3,477,362 | ||||||
| 54,302,319 | ||||||||
| MEXICO — 6.4% | ||||||||
| 463,014 | Controladora Vuela Cia de Aviacion S.A.B. de C.V. - ADR* | 4,343,071 | ||||||
| 451,836 | Grupo Aeroportuario del Centro Norte S.A.B. de C.V. | 4,783,113 | ||||||
| 632,227 | Prologis Property Mexico S.A. de C.V. - REIT | 3,006,439 | ||||||
| 379,300 | Qualitas Controladora S.A.B. de C.V. | 3,832,536 | ||||||
| 422,300 | Regional S.A.B. de C.V. | 4,035,488 | ||||||
| 20,000,647 | ||||||||
| NETHERLANDS — 1.7% | ||||||||
| 47,232 | Elastic N.V.* | 5,323,046 | ||||||
| NORWAY — 3.1% | ||||||||
| 1,781,556 | AutoStore Holdings Ltd.* | 3,503,528 | ||||||
| 135,120 | Kongsberg Gruppen A.S.A. | 6,189,514 | ||||||
| 9,693,042 | ||||||||
46
WCM International Small Cap Growth Fund
SCHEDULE OF INVESTMENTS - Continued
As of December 31, 2023
| Number of Shares | Value | |||||||
| COMMON STOCKS (Continued) | ||||||||
| RUSSIA — 0.0% | ||||||||
| 781,116 | Cian PLC - ADR*,1 | $ | — | |||||
| SAUDI ARABIA — 2.5% | ||||||||
| 106,473 | Aldrees Petroleum and Transport Services Co. | 5,019,847 | ||||||
| 50,076 | Bupa Arabia for Cooperative Insurance Co. | 2,846,988 | ||||||
| 7,866,835 | ||||||||
| SOUTH KOREA — 1.9% | ||||||||
| 89,997 | Hana Materials, Inc.* | 3,484,743 | ||||||
| 72,948 | HPSP Co., Ltd.* | 2,463,474 | ||||||
| 5,948,217 | ||||||||
| SWEDEN — 10.7% | ||||||||
| 391,131 | Beijer Ref A.B. | 5,231,316 | ||||||
| 790,651 | Fortnox A.B. | 4,725,359 | ||||||
| 339,670 | Munters Group A.B. | 5,506,196 | ||||||
| 650,041 | NCAB Group A.B. | 4,720,903 | ||||||
| 239,718 | Nordnet A.B. publ | 4,064,185 | ||||||
| 96,965 | Saab A.B. - Class B | 5,841,300 | ||||||
| 114,654 | Thule Group A.B. | 3,120,386 | ||||||
| 33,209,645 | ||||||||
| SWITZERLAND — 3.7% | ||||||||
| 42,664 | Bachem Holding A.G. | 3,297,063 | ||||||
| 504,452 | Global Blue Group Holding A.G.* | 2,386,058 | ||||||
| 254,064 | Medmix A.G.2 | 5,739,170 | ||||||
| 11,422,291 | ||||||||
| UNITED KINGDOM — 11.1% | ||||||||
| 2,076,499 | Baltic Classifieds Group PLC | 6,259,936 | ||||||
| 598,565 | Bytes Technology Group PLC | 4,669,494 | ||||||
| 89,630 | Diploma PLC | 4,092,475 | ||||||
| 31,218 | Games Workshop Group PLC | 3,927,618 | ||||||
| 516,600 | RS GROUP PLC | 5,397,137 | ||||||
| 562,226 | Wise PLC - Class A* | 6,263,678 | ||||||
| 143,931 | Wizz Air Holdings PLC* | 4,056,487 | ||||||
| 34,666,825 | ||||||||
47
WCM International Small Cap Growth Fund
SCHEDULE OF INVESTMENTS - Continued
As of December 31, 2023
| Number of Shares | Value | |||||||
| COMMON STOCKS (Continued) | ||||||||
| VIETNAM — 1.6% | ||||||||
| 1,251,045 | FPT Corp. | $ | 4,955,297 | |||||
| TOTAL COMMON STOCKS | ||||||||
| (Cost $279,316,996) | 307,393,009 | |||||||
| SHORT-TERM INVESTMENTS — 1.3% | ||||||||
| 4,008,134 | Morgan Stanley Institutional Liquidity Treasury Portfolio - Institutional Class, 5.14%3 | 4,008,134 | ||||||
| TOTAL SHORT-TERM INVESTMENTS | ||||||||
| (Cost $4,008,134) | 4,008,134 | |||||||
| TOTAL INVESTMENTS — 100.0% | ||||||||
| (Cost $283,325,130) | 311,401,143 | |||||||
| Other Assets in Excess of Liabilities — 0.0% | 70,678 | |||||||
| TOTAL NET ASSETS — 100.0% | $ | 311,471,821 | ||||||
ADR – American Depository Receipt
PLC – Public Limited Company
REIT – Real Estate Investment Trust
| * | Non-income producing security. |
| 1 | Level 3 securities fair valued under procedures established by the Board of Trustees, represents 0.00% of Total Net Assets. The total value of these securities is $0. |
| 2 | Security exempt from registration under Rule 144A of the Securities Act of 1933. These securities are restricted and may be resold in transactions exempt from registration normally to qualified institutional buyers. The total value of these securities is $5,739,170, which represents 1.84% of total net assets of the Fund. |
| 3 | The rate is the annualized seven-day yield at period end. |
See accompanying Notes to Financial Statements.
48
WCM International Small Cap Growth Fund
SUMMARY OF INVESTMENTS
As of December 31, 2023
| Security Type/Sector | Percent of Total Net Assets | |||
| Common Stocks | ||||
| Technology | 32.2 | % | ||
| Industrials | 22.6 | % | ||
| Financials | 10.9 | % | ||
| Consumer Discretionary | 10.4 | % | ||
| Health Care | 8.9 | % | ||
| Energy | 5.0 | % | ||
| Communications | 4.3 | % | ||
| Consumer Staples | 2.6 | % | ||
| Real Estate | 1.0 | % | ||
| Materials | 0.8 | % | ||
| Total Common Stocks | 98.7 | % | ||
| Short-Term Investments | 1.3 | % | ||
| Total Investments | 100.0 | % | ||
| Other Assets in Excess of Liabilities | 0.0 | % | ||
| Total Net Assets | 100.0 | % | ||
See accompanying Notes to Financial Statements.
49
WCM Small Cap Growth Fund
SCHEDULE OF INVESTMENTS
As of December 31, 2023
| Number of Shares | Value | |||||||
| COMMON STOCKS — 98.0% | ||||||||
| COMMUNICATIONS — 1.5% | ||||||||
| 12,011 | IAC, Inc.* | $ | 629,136 | |||||
| CONSUMER DISCRETIONARY — 9.1% | ||||||||
| 7,427 | Boot Barn Holdings, Inc.* | 570,096 | ||||||
| 13,212 | Caesars Entertainment, Inc.* | 619,379 | ||||||
| 7,912 | Fox Factory Holding Corp.* | 533,902 | ||||||
| 9,391 | Planet Fitness, Inc. - Class A* | 685,543 | ||||||
| 5,714 | Texas Roadhouse, Inc. | 698,422 | ||||||
| 2,310 | Wingstop, Inc. | 592,700 | ||||||
| 3,700,042 | ||||||||
| CONSUMER STAPLES — 5.8% | ||||||||
| 2,574 | Casey's General Stores, Inc. | 707,181 | ||||||
| 4,342 | Five Below, Inc.* | 925,541 | ||||||
| 10,417 | Performance Food Group Co.* | 720,335 | ||||||
| 2,353,057 | ||||||||
| ENERGY — 3.6% | ||||||||
| 12,404 | Matador Resources Co. | 705,291 | ||||||
| 55,876 | Permian Resources Corp. | 759,914 | ||||||
| 1,465,205 | ||||||||
| FINANCIALS — 4.9% | ||||||||
| 5,191 | Evercore, Inc. - Class A | 887,921 | ||||||
| 3,112 | Primerica, Inc. | 640,325 | ||||||
| 6,814 | Western Alliance Bancorp | 448,293 | ||||||
| 1,976,539 | ||||||||
| HEALTH CARE — 17.5% | ||||||||
| 7,922 | Arrowhead Pharmaceuticals, Inc.* | 242,413 | ||||||
| 9,280 | AtriCure, Inc.* | 331,203 | ||||||
| 4,546 | Axsome Therapeutics, Inc.* | 361,816 | ||||||
| 10,370 | Azenta, Inc.* | 675,502 | ||||||
| 12,494 | Bridgebio Pharma, Inc.* | 504,383 | ||||||
| 13,204 | Halozyme Therapeutics, Inc.* | 488,020 | ||||||
| 4,628 | Immunovant, Inc.* | 194,978 | ||||||
| 14,326 | Insmed, Inc.* | 443,963 | ||||||
| 5,277 | iRhythm Technologies, Inc.* | 564,850 | ||||||
| 1,563 | Karuna Therapeutics, Inc.* | 494,705 | ||||||
| 7,180 | Keros Therapeutics, Inc.* | 285,477 | ||||||
| 6,304 | Natera, Inc.* | 394,883 | ||||||
| 2,544 | Repligen Corp.* | 457,411 | ||||||
| 13,584 | Rocket Pharmaceuticals, Inc.* | 407,112 | ||||||
| 1,911 | Shockwave Medical, Inc.* | 364,160 | ||||||
50
WCM Small Cap Growth Fund
SCHEDULE OF INVESTMENTS - Continued
As of December 31, 2023
| Number of Shares | Value | |||||||
| COMMON STOCKS (Continued) | ||||||||
| HEALTH CARE (Continued) | ||||||||
| 21,086 | Surgery Partners, Inc.* | $ | 674,541 | |||||
| 4,512 | Ultragenyx Pharmaceutical, Inc.* | 215,764 | ||||||
| 7,101,181 | ||||||||
| INDUSTRIALS — 20.2% | ||||||||
| 8,645 | AMN Healthcare Services, Inc.* | 647,337 | ||||||
| 4,893 | Applied Industrial Technologies, Inc. | 844,972 | ||||||
| 9,178 | Casella Waste Systems, Inc. - Class A* | 784,352 | ||||||
| 16,678 | Cognex Corp. | 696,140 | ||||||
| 13,734 | CryoPort, Inc.* | 212,740 | ||||||
| 6,863 | John Bean Technologies Corp. | 682,525 | ||||||
| 19,230 | Mercury Systems, Inc.* | 703,241 | ||||||
| 5,947 | Regal Rexnord Corp. | 880,275 | ||||||
| 1,603 | Saia, Inc.* | 702,467 | ||||||
| 4,025 | Tetra Tech, Inc. | 671,893 | ||||||
| 8,185 | Timken Co. | 656,028 | ||||||
| 15,903 | WillScot Mobile Mini Holdings Corp.* | 707,683 | ||||||
| 8,189,653 | ||||||||
| MATERIALS — 5.3% | ||||||||
| 16,630 | Avient Corp. | 691,309 | ||||||
| 9,908 | Trex Co., Inc.* | 820,283 | ||||||
| 4,965 | UFP Industries, Inc. | 623,356 | ||||||
| 2,134,948 | ||||||||
| REAL ESTATE — 1.5% | ||||||||
| 10,620 | Rexford Industrial Realty, Inc. - REIT | 595,782 | ||||||
| TECHNOLOGY — 28.6% | ||||||||
| 20,866 | ACI Worldwide, Inc.* | 638,500 | ||||||
| 2,985 | Appfolio, Inc. - Class A* | 517,121 | ||||||
| 9,604 | BILL Holdings, Inc.* | 783,590 | ||||||
| 5,729 | Euronet Worldwide, Inc.* | 581,436 | ||||||
| 11,765 | Five9, Inc.* | 925,788 | ||||||
| 8,170 | MACOM Technology Solutions Holdings, Inc.* | 759,402 | ||||||
| 7,829 | Power Integrations, Inc. | 642,839 | ||||||
| 22,603 | Privia Health Group, Inc.* | 520,547 | ||||||
| 10,252 | Procore Technologies, Inc.* | 709,643 | ||||||
| 9,490 | Rambus, Inc.* | 647,693 | ||||||
| 4,863 | Science Applications International Corp. | 604,568 | ||||||
| 7,942 | Shift4 Payments, Inc. - Class A* | 590,408 | ||||||
| 16,645 | Smartsheet, Inc. - Class A* | 795,964 | ||||||
| 4,193 | SPS Commerce, Inc.* | 812,771 | ||||||
| 1,689 | Super Micro Computer, Inc.* | 480,115 | ||||||
51
WCM Small Cap Growth Fund
SCHEDULE OF INVESTMENTS - Continued
As of December 31, 2023
| Number of Shares | Value | |||||||
| COMMON STOCKS (Continued) | ||||||||
| TECHNOLOGY (Continued) | ||||||||
| 4,621 | WEX, Inc.* | $ | 899,016 | |||||
| 10,738 | WNS Holdings Ltd. - ADR* | 678,642 | ||||||
| 11,588,043 | ||||||||
| TOTAL COMMON STOCKS | ||||||||
| (Cost $33,452,306) | 39,733,586 | |||||||
| SHORT-TERM INVESTMENTS — 2.2% | ||||||||
| 876,598 | Morgan Stanley Institutional Liquidity Treasury Portfolio - Institutional Class, 5.14%1 | 876,598 | ||||||
| TOTAL SHORT-TERM INVESTMENTS | ||||||||
| (Cost $876,598) | 876,598 | |||||||
| TOTAL INVESTMENTS — 100.2% | ||||||||
| (Cost $34,328,904) | 40,610,184 | |||||||
| Liabilities in Excess of Other Assets — (0.2)% | (83,127 | ) | ||||||
| TOTAL NET ASSETS — 100.0% | $ | 40,527,057 | ||||||
ADR – American Depository Receipt
REIT – Real Estate Investment Trust
| * | Non-income producing security. |
| 1 | The rate is the annualized seven-day yield at period end. |
See accompanying Notes to Financial Statements.
52
WCM Small Cap Growth Fund
SUMMARY OF INVESTMENTS
As of December 31, 2023
| Security Type/Sector | Percent of Total Net Assets | |||
| Common Stocks | ||||
| Technology | 28.6 | % | ||
| Industrials | 20.2 | % | ||
| Health Care | 17.5 | % | ||
| Consumer Discretionary | 9.1 | % | ||
| Consumer Staples | 5.8 | % | ||
| Materials | 5.3 | % | ||
| Financials | 4.9 | % | ||
| Energy | 3.6 | % | ||
| Communications | 1.5 | % | ||
| Real Estate | 1.5 | % | ||
| Total Common Stocks | 98.0 | % | ||
| Short-Term Investments | 2.2 | % | ||
| Total Investments | 100.2 | % | ||
| Liabilities in Excess of Other Assets | (0.2 | )% | ||
| Total Net Assets | 100.0 | % | ||
See accompanying Notes to Financial Statements.
53
WCM SMID Quality Value Fund
SCHEDULE OF INVESTMENTS
As of December 31, 2023
| Number of Shares | Value | |||||||
| COMMON STOCKS — 96.6% | ||||||||
| COMMUNICATIONS — 4.4% | ||||||||
| 59,200 | GoDaddy, Inc. - Class A* | $ | 6,284,672 | |||||
| CONSUMER DISCRETIONARY — 17.4% | ||||||||
| 48,900 | Beacon Roofing Supply, Inc.* | 4,255,278 | ||||||
| 31,700 | CarMax, Inc.* | 2,432,658 | ||||||
| 32,300 | Dorman Products, Inc.* | 2,694,143 | ||||||
| 55,200 | Masco Corp. | 3,697,296 | ||||||
| 7,500 | Pool Corp. | 2,990,325 | ||||||
| 55,700 | Wyndham Hotels & Resorts, Inc. | 4,478,837 | ||||||
| 83,800 | YETI Holdings, Inc.* | 4,339,164 | ||||||
| 24,887,701 | ||||||||
| CONSUMER STAPLES — 6.3% | ||||||||
| 127,200 | Grocery Outlet Holding Corp.* | 3,429,312 | ||||||
| 22,800 | Inter Parfums, Inc. | 3,283,428 | ||||||
| 13,700 | Lancaster Colony Corp. | 2,279,543 | ||||||
| 8,992,283 | ||||||||
| FINANCIALS — 6.7% | ||||||||
| 75,900 | Brown & Brown, Inc. | 5,397,249 | ||||||
| 14,400 | Enstar Group Ltd.* | 4,238,640 | ||||||
| 9,635,889 | ||||||||
| HEALTH CARE — 7.1% | ||||||||
| 33,800 | Addus HomeCare Corp.* | 3,138,330 | ||||||
| 35,900 | Ensign Group, Inc. | 4,028,339 | ||||||
| 29,436 | ICU Medical, Inc.* | 2,935,946 | ||||||
| 10,102,615 | ||||||||
| INDUSTRIALS — 26.8% | ||||||||
| 145,000 | API Group Corp.* | 5,017,000 | ||||||
| 89,600 | AZEK Co., Inc.* | 3,427,200 | ||||||
| 19,200 | EMCOR Group, Inc. | 4,136,256 | ||||||
| 46,400 | Graco, Inc. | 4,025,664 | ||||||
| 242,600 | Hayward Holdings, Inc.* | 3,299,360 | ||||||
| 22,800 | Landstar System, Inc. | 4,415,220 | ||||||
| 344,800 | R1 RCM, Inc.* | 3,644,536 | ||||||
| 23,300 | SiteOne Landscape Supply, Inc.* | 3,786,250 | ||||||
| 12,500 | Tetra Tech, Inc. | 2,086,625 | ||||||
| 10,500 | Watsco, Inc. | 4,498,935 | ||||||
| 38,337,046 | ||||||||
| MATERIALS — 6.5% | ||||||||
| 46,700 | Ashland, Inc. | 3,937,277 | ||||||
54
WCM SMID Quality Value Fund
SCHEDULE OF INVESTMENTS - Continued
As of December 31, 2023
| Number of Shares | Value | |||||||
| COMMON STOCKS (Continued) | ||||||||
| MATERIALS (Continued) | ||||||||
| 234,400 | Element Solutions, Inc. | $ | 5,424,016 | |||||
| 9,361,293 | ||||||||
| REAL ESTATE — 3.4% | ||||||||
| 26,000 | Jones Lang LaSalle, Inc.* | 4,910,620 | ||||||
| TECHNOLOGY — 18.0% | ||||||||
| 30,400 | Booz Allen Hamilton Holding Corp. | 3,888,464 | ||||||
| 44,500 | Entegris, Inc. | 5,331,990 | ||||||
| 35,100 | MKS Instruments, Inc. | 3,610,737 | ||||||
| 25,300 | PTC, Inc.* | 4,426,488 | ||||||
| 229,300 | Verra Mobility Corp.* | 5,280,779 | ||||||
| 11,600 | Zebra Technologies Corp. - Class A* | 3,170,628 | ||||||
| 25,709,086 | ||||||||
| TOTAL COMMON STOCKS | ||||||||
| (Cost $104,854,978) | 138,221,205 | |||||||
| SHORT-TERM INVESTMENTS — 3.5% | ||||||||
| 5,010,082 | Morgan Stanley Institutional Liquidity Treasury Portfolio - Institutional Class, 5.14%1 | 5,010,082 | ||||||
| TOTAL SHORT-TERM INVESTMENTS | ||||||||
| (Cost $5,010,082) | 5,010,082 | |||||||
| TOTAL INVESTMENTS — 100.1% | ||||||||
| (Cost $109,865,060) | 143,231,287 | |||||||
| Liabilities in Excess of Other Assets — (0.1)% | (148,407 | ) | ||||||
| TOTAL NET ASSETS — 100.0% | $ | 143,082,880 | ||||||
| * | Non-income producing security. |
| 1 | The rate is the annualized seven-day yield at period end. |
See accompanying Notes to Financial Statements.
55
WCM SMID Quality Value Fund
SUMMARY OF INVESTMENTS
As of December 31, 2023
| Security Type/Sector | Percent of Total Net Assets | |||
| Common Stocks | ||||
| Industrials | 26.8 | % | ||
| Technology | 18.0 | % | ||
| Consumer Discretionary | 17.4 | % | ||
| Health Care | 7.1 | % | ||
| Financials | 6.7 | % | ||
| Materials | 6.5 | % | ||
| Consumer Staples | 6.3 | % | ||
| Communications | 4.4 | % | ||
| Real Estate | 3.4 | % | ||
| Total Common Stocks | 96.6 | % | ||
| Short-Term Investments | 3.5 | % | ||
| Total Investments | 100.1 | % | ||
| Liabilities in Excess of Other Assets | (0.1 | )% | ||
| Total Net Assets | 100.0 | % | ||
See accompanying Notes to Financial Statements.
56
WCM China Quality Growth Fund
SCHEDULE OF INVESTMENTS
As of December 31, 2023
Number of Shares | Value | |||||||
| COMMON STOCKS — 94.3% | ||||||||
| CHINA — 80.2% | ||||||||
| 5,100 | Acrobiosystems Co., Ltd. - Class A | $ | 42,384 | |||||
| 10,980 | Asymchem Laboratories Tianjin Co., Ltd. - Class H | 127,961 | ||||||
| 28,200 | Beijing New Building Materials PLC - Class A | 92,884 | ||||||
| 220,000 | China Overseas Property Holdings Ltd. | 165,102 | ||||||
| 10,803 | Circuit Fabology Microelectronics Equipment Co., Ltd. - Class A* | 130,038 | ||||||
| 4,100 | Eastroc Beverage Group Co., Ltd. - Class A | 105,509 | ||||||
| 30,400 | Fuyao Glass Industry Group Co., Ltd. - Class H | 147,941 | ||||||
| 28,100 | Hangzhou Oxygen Plant Group Co., Ltd. - Class A | 115,733 | ||||||
| 15,700 | Huali Industrial Group Co., Ltd. - Class A | 116,529 | ||||||
| 10,444 | Hundsun Technologies, Inc. - Class A | 42,352 | ||||||
| 800 | Kweichow Moutai Co., Ltd. - Class A | 194,693 | ||||||
| 60,500 | Li Ning Co., Ltd. | 161,933 | ||||||
| 32,200 | NARI Technology Co., Ltd. - Class A | 101,337 | ||||||
| 876 | PDD Holdings, Inc. - ADR* | 128,168 | ||||||
| 27,568 | Qingdao Haier Biomedical Co., Ltd. - Class A | 157,505 | ||||||
| 40,057 | Qingdao Hiron Commercial Cold Chain Co., Ltd. - Class A | 85,624 | ||||||
| 25,600 | Shandong Sinocera Functional Material Co., Ltd. - Class A | 83,454 | ||||||
| 59,600 | Shenzhen H&T Intelligent Control Co., Ltd. - Class A | 120,087 | ||||||
| 2,800 | Shenzhen Mindray Bio-Medical Electronics Co., Ltd. - Class A | 114,729 | ||||||
| 21,800 | Shenzhou International Group Holdings Ltd. | 224,463 | ||||||
| 18,450 | Sunresin New Materials Co., Ltd. - Class A | 138,033 | ||||||
| 9,950 | Tencent Holdings Ltd. | 374,120 | ||||||
| 52,200 | Warom Technology, Inc. Co. - Class A | 146,910 | ||||||
| 17,064 | WuXi AppTec Co., Ltd. - Class H | 173,623 | ||||||
| 7,100 | Xi'an Sinofuse Electric Co., Ltd. - Class A | 130,904 | ||||||
| 46,600 | Zhejiang Jiemei Electronic & Technology Co., Ltd. - Class A | 163,936 | ||||||
| 4,198 | ZTO Express Cayman, Inc. - ADR | 89,333 | ||||||
| 3,675,285 | ||||||||
| HONG KONG — 10.1% | ||||||||
| 27,551 | AIA Group Ltd. | 240,103 | ||||||
| 3,100 | Hong Kong Exchanges & Clearing Ltd. | 106,397 | ||||||
| 9,528 | Techtronic Industries Co., Ltd. | 113,540 | ||||||
| 460,040 | ||||||||
| NETHERLANDS — 1.8% | ||||||||
| 14,000 | Prosus N.V. - ADR | 83,300 | ||||||
| TAIWAN — 2.2% | ||||||||
| 3,104 | Airtac International Group | 102,150 | ||||||
| TOTAL COMMON STOCKS | ||||||||
| (Cost $5,131,124) | 4,320,775 | |||||||
57
WCM China Quality Growth Fund
SCHEDULE OF INVESTMENTS - Continued
As of December 31, 2023
| Principal Amount | Value | |||||||
| BANK DEPOSIT INVESTMENTS — 4.2% | ||||||||
| $ | 192,430 | UMB Bank, Money Market Special II, 5.18%1 | $ | 192,430 | ||||
| TOTAL BANK DEPOSIT INVESTMENTS | ||||||||
| (Cost $192,430) | 192,430 | |||||||
| TOTAL INVESTMENTS — 98.5% | ||||||||
| (Cost $5,323,554) | 4,513,205 | |||||||
| Other Assets in Excess of Liabilities — 1.5% | 68,501 | |||||||
| TOTAL NET ASSETS — 100.0% | $ | 4,581,706 | ||||||
ADR – American Depository Receipt
PLC – Public Limited Company
| * | Non-income producing security. |
| 1 | The rate is the annualized seven-day yield at period end. |
See accompanying Notes to Financial Statements.
58
WCM China Quality Growth Fund
SUMMARY OF INVESTMENTS
As of December 31, 2023
| Security Type/Sector | Percent of Total Net Assets | |||
| Common Stocks | ||||
| Consumer Discretionary | 19.8 | % | ||
| Industrials | 16.8 | % | ||
| Health Care | 13.4 | % | ||
| Materials | 13.0 | % | ||
| Communications | 10.0 | % | ||
| Financials | 7.6 | % | ||
| Consumer Staples | 6.6 | % | ||
| Real Estate | 3.6 | % | ||
| Technology | 3.5 | % | ||
| Total Common Stocks | 94.3 | % | ||
| Bank Deposit Investments | 4.2 | % | ||
| Total Investments | 98.5 | % | ||
| Other Assets in Excess of Liabilities | 1.5 | % | ||
| Total Net Assets | 100.0 | % | ||
See accompanying Notes to Financial Statements.
59
WCM Developing World Equity Fund
SCHEDULE OF INVESTMENTS
As of December 31, 2023
| Number of Shares | Value | |||||||
| COMMON STOCKS — 101.1% | ||||||||
| ARGENTINA — 2.7% | ||||||||
| 36 | MercadoLibre, Inc.* | $ | 56,575 | |||||
| BRAZIL — 5.3% | ||||||||
| 48,200 | Hapvida Participacoes e Investimentos S.A.* | 44,156 | ||||||
| 9,300 | TOTVS S.A. | 64,500 | ||||||
| 108,656 | ||||||||
| CANADA — 4.2% | ||||||||
| 555 | Canadian Pacific Kansas City Ltd. | 43,911 | ||||||
| 4,521 | Ivanhoe Mines Ltd. - Class A* | 43,842 | ||||||
| 87,753 | ||||||||
| CHINA — 11.3% | ||||||||
| 8,160 | Glodon Co., Ltd. - Class A | 19,721 | ||||||
| 1,100 | Shenzhen Mindray Bio-Medical Electronics Co., Ltd. - Class A | 45,072 | ||||||
| 5,900 | Shenzhou International Group Holdings Ltd. | 60,749 | ||||||
| 1,700 | Tencent Holdings Ltd. | 63,920 | ||||||
| 4,300 | WuXi AppTec Co., Ltd. - Class H | 43,752 | ||||||
| 233,214 | ||||||||
| HONG KONG — 8.3% | ||||||||
| 12,214 | AIA Group Ltd. | 106,443 | ||||||
| 1,900 | Hong Kong Exchanges & Clearing Ltd. | 65,211 | ||||||
| 171,654 | ||||||||
| HUNGARY — 2.8% | ||||||||
| 2,306 | Richter Gedeon Nyrt | 58,163 | ||||||
| INDIA — 11.1% | ||||||||
| 3,400 | Bharti Airtel Ltd. | 42,174 | ||||||
| 1,370 | HDFC Bank Ltd. - ADR | 91,941 | ||||||
| 2,028 | ICICI Bank Ltd. - ADR | 48,348 | ||||||
| 1,031 | Tata Consultancy Services Ltd. | 46,999 | ||||||
| 229,462 | ||||||||
| INDONESIA — 4.9% | ||||||||
| 42,330 | Bank Central Asia Tbk P.T. | 25,843 | ||||||
| 295,932 | Telkom Indonesia Persero Tbk P.T. | 75,919 | ||||||
| 101,762 | ||||||||
| MALAYSIA — 2.0% | ||||||||
| 31,600 | IHH Healthcare Bhd | 41,469 | ||||||
60
WCM Developing World Equity Fund
SCHEDULE OF INVESTMENTS – Continued
As of December 31, 2023
| Number of Shares | Value | |||||||
| COMMON STOCKS (Continued) | ||||||||
| MEXICO — 5.4% | ||||||||
| 3,669 | Grupo Aeroportuario del Pacifico S.A.B. de C.V. - Class B | $ | 64,048 | |||||
| 21,516 | Megacable Holdings S.A.B. de C.V. | 48,047 | ||||||
| 112,095 | ||||||||
| NETHERLANDS — 3.0% | ||||||||
| 48 | Adyen N.V.* | 61,820 | ||||||
| PERU — 3.6% | ||||||||
| 503 | Credicorp Ltd. | 75,415 | ||||||
| SINGAPORE — 4.7% | ||||||||
| 4,477 | United Overseas Bank Ltd. | 96,508 | ||||||
| SOUTH AFRICA — 3.4% | ||||||||
| 3,033 | Bid Corp. Ltd. | 70,741 | ||||||
| SOUTH KOREA — 6.8% | ||||||||
| 3,573 | Coupang, Inc.* | 57,847 | ||||||
| 1,356 | Samsung Electronics Co., Ltd. | 82,305 | ||||||
| 140,152 | ||||||||
| SWEDEN — 3.3% | ||||||||
| 3,197 | Sandvik A.B. | 69,131 | ||||||
| SWITZERLAND — 2.4% | ||||||||
| 571 | SGS S.A. | 49,245 | ||||||
| TAIWAN — 5.9% | ||||||||
| 8,304 | Feng TAY Enterprise Co., Ltd. | 47,350 | ||||||
| 725 | Taiwan Semiconductor Manufacturing Co., Ltd. - ADR | 75,400 | ||||||
| 122,750 | ||||||||
| UNITED KINGDOM — 4.7% | ||||||||
| 407 | AstraZeneca PLC | 54,993 | ||||||
| 1,492 | Wizz Air Holdings PLC* | 42,050 | ||||||
| 97,043 | ||||||||
| UNITED STATES — 5.3% | ||||||||
| 1,890 | Baker Hughes Co. | 64,600 | ||||||
61
WCM Developing World Equity Fund
SCHEDULE OF INVESTMENTS – Continued
As of December 31, 2023
| Number of Shares | Value | |||||||
| COMMON STOCKS (Continued) | ||||||||
| UNITED STATES (Continued) | ||||||||
| 446 | Exxon Mobil Corp. | $ | 44,591 | |||||
| 109,191 | ||||||||
| TOTAL COMMON STOCKS | ||||||||
| (Cost $1,967,482) | 2,092,799 | |||||||
| Principal Amount | ||||||||
| BANK DEPOSIT INVESTMENTS — 2.0% | ||||||||
| $ | 41,346 | UMB Bank, Money Market Special II, 5.18%1 | 41,346 | |||||
| TOTAL BANK DEPOSIT INVESTMENTS | ||||||||
| (Cost $41,346) | 41,346 | |||||||
| TOTAL INVESTMENTS — 103.1% | ||||||||
| (Cost $2,008,828) | 2,134,145 | |||||||
| Liabilities in Excess of Other Assets — (3.1)% | (63,695 | ) | ||||||
| TOTAL NET ASSETS — 100.0% | $ | 2,070,450 | ||||||
ADR – American Depository Receipt
PLC – Public Limited Company
| * | Non-income producing security. |
| 1 | The rate is the annualized seven-day yield at period end. |
See accompanying Notes to Financial Statements.
62
WCM Developing World Equity Fund
SUMMARY OF INVESTMENTS
As of December 31, 2023
| Security Type/Sector | Percent of Total Net Assets | |||
| Common Stocks | ||||
| Financials | 24.6 | % | ||
| Technology | 16.9 | % | ||
| Health Care | 13.9 | % | ||
| Industrials | 13.0 | % | ||
| Communications | 11.1 | % | ||
| Consumer Discretionary | 10.8 | % | ||
| Energy | 5.3 | % | ||
| Consumer Staples | 3.4 | % | ||
| Materials | 2.1 | % | ||
| Total Common Stocks | 101.1 | % | ||
| Bank Deposit Investments | 2.0 | % | ||
| Total Investments | 103.1 | % | ||
| Liabilities in Excess of Other Assets | (3.1 | )% | ||
| Total Net Assets | 100.0 | % | ||
See accompanying Notes to Financial Statements.
63
WCM International Equity Fund
SCHEDULE OF INVESTMENTS
As of December 31, 2023
| Number of Shares | Value | |||||||
| COMMON STOCKS — 94.7% | ||||||||
| ARGENTINA — 1.3% | ||||||||
| 720 | MercadoLibre, Inc.* | $ | 1,131,509 | |||||
| CANADA — 8.0% | ||||||||
| 34,420 | Canadian National Railway Co. | 4,326,203 | ||||||
| 8,990 | Intact Financial Corp. | 1,383,066 | ||||||
| 135,940 | Ivanhoe Mines Ltd. - Class A* | 1,318,262 | ||||||
| 7,027,531 | ||||||||
| DENMARK — 2.1% | ||||||||
| 17,470 | Novo Nordisk A.S. - Class B | 1,806,064 | ||||||
| FRANCE — 3.6% | ||||||||
| 10,550 | Airbus S.E. | 1,628,041 | ||||||
| 5,620 | Sartorius Stedim Biotech | 1,485,968 | ||||||
| 3,114,009 | ||||||||
| GERMANY — 3.0% | ||||||||
| 57,190 | Evotec S.E.* | 1,343,567 | ||||||
| 47,100 | Hensoldt A.G. | 1,268,757 | ||||||
| 2,612,324 | ||||||||
| HONG KONG — 3.3% | ||||||||
| 332,080 | AIA Group Ltd. | 2,894,031 | ||||||
| HUNGARY — 1.8% | ||||||||
| 62,760 | Richter Gedeon Nyrt | 1,582,960 | ||||||
| INDIA — 3.6% | ||||||||
| 46,990 | HDFC Bank Ltd. - ADR | 3,153,499 | ||||||
| INDONESIA — 2.7% | ||||||||
| 9,216,100 | Telkom Indonesia Persero Tbk P.T. | 2,364,330 | ||||||
| IRELAND — 4.9% | ||||||||
| 5,950 | Accenture PLC - Class A | 2,087,914 | ||||||
| 7,680 | Aon PLC - Class A | 2,235,034 | ||||||
| 4,322,948 | ||||||||
| JAPAN — 4.1% | ||||||||
| 13,495 | Daikin Industries Ltd. | 2,199,876 | ||||||
| 125,100 | MonotaRO Co., Ltd. | 1,365,897 | ||||||
| 3,565,773 | ||||||||
64
WCM International Equity Fund
SCHEDULE OF INVESTMENTS - Continued
As of December 31, 2023
| Number of Shares | Value | |||||||
| COMMON STOCKS (Continued) | ||||||||
| MEXICO — 2.9% | ||||||||
| 68,480 | Grupo Aeroportuario del Pacifico S.A.B. de C.V. - Class B | $ | 1,195,426 | |||||
| 590,030 | Megacable Holdings S.A.B. de C.V. | 1,317,587 | ||||||
| 2,513,013 | ||||||||
| NETHERLANDS — 3.1% | ||||||||
| 2,120 | Adyen N.V.* | 2,730,395 | ||||||
| PERU — 2.7% | ||||||||
| 16,020 | Credicorp Ltd. | 2,401,879 | ||||||
| SINGAPORE — 4.4% | ||||||||
| 179,013 | United Overseas Bank Ltd. | 3,858,857 | ||||||
| SOUTH KOREA — 2.7% | ||||||||
| 39,240 | Samsung Electronics Co., Ltd. | 2,381,744 | ||||||
| SPAIN — 3.5% | ||||||||
| 233,470 | Iberdrola S.A. | 3,059,493 | ||||||
| SWEDEN — 3.1% | ||||||||
| 127,560 | Sandvik A.B. | 2,758,334 | ||||||
| SWITZERLAND — 4.5% | ||||||||
| 21,920 | Alcon, Inc. | 1,712,390 | ||||||
| 26,190 | SGS S.A. | 2,258,736 | ||||||
| 3,971,126 | ||||||||
| TAIWAN — 1.6% | ||||||||
| 242,960 | Feng TAY Enterprise Co., Ltd. | 1,385,380 | ||||||
| UNITED KINGDOM — 16.3% | ||||||||
| 57,440 | AstraZeneca PLC - ADR | 3,868,584 | ||||||
| 121,360 | Compass Group PLC | 3,319,803 | ||||||
| 27,350 | London Stock Exchange Group PLC | 3,233,192 | ||||||
| 128,770 | Persimmon PLC | 2,279,943 | ||||||
| 141,020 | Wise PLC - Class A* | 1,571,083 | ||||||
| 14,272,605 | ||||||||
| UNITED STATES — 11.5% | ||||||||
| 76,930 | Baker Hughes Co. | 2,629,468 | ||||||
| 17,850 | Exxon Mobil Corp. | 1,784,643 | ||||||
| 30,270 | International Flavors & Fragrances, Inc. | 2,450,962 | ||||||
65
WCM International Equity Fund
SCHEDULE OF INVESTMENTS - Continued
As of December 31, 2023
| Number of Shares | Value | |||||||
| COMMON STOCKS (Continued) | ||||||||
| UNITED STATES (Continued) | ||||||||
| 7,520 | Mastercard, Inc. - Class A | $ | 3,207,355 | |||||
| 10,072,428 | ||||||||
| TOTAL COMMON STOCKS | ||||||||
| (Cost $74,480,330) | 82,980,232 | |||||||
| SHORT-TERM INVESTMENTS — 5.1% | ||||||||
| 4,452,236 | Morgan Stanley Institutional Liquidity Treasury Portfolio - Institutional Class, 5.14%1 | 4,452,236 | ||||||
| TOTAL SHORT-TERM INVESTMENTS | ||||||||
| (Cost $4,452,236) | 4,452,236 | |||||||
| TOTAL INVESTMENTS — 99.8% | ||||||||
| (Cost $78,932,566) | 87,432,468 | |||||||
| Other Assets in Excess of Liabilities — 0.2% | 152,084 | |||||||
| TOTAL NET ASSETS — 100.0% | $ | 87,584,552 | ||||||
ADR – American Depository Receipt
PLC – Public Limited Company
| * | Non-income producing security. |
| 1 | The rate is the annualized seven-day yield at period end. |
See accompanying Notes to Financial Statements.
66
WCM International Equity Fund
SUMMARY OF INVESTMENTS
As of December 31, 2023
| Security Type/Sector | Percent of Total Net Assets | |||
| Common Stocks | ||||
| Financials | 21.9 | % | ||
| Industrials | 20.2 | % | ||
| Technology | 15.1 | % | ||
| Health Care | 13.5 | % | ||
| Consumer Discretionary | 7.0 | % | ||
| Energy | 5.0 | % | ||
| Materials | 4.3 | % | ||
| Communications | 4.2 | % | ||
| Utilities | 3.5 | % | ||
| Total Common Stocks | 94.7 | % | ||
| Short-Term Investments | 5.1 | % | ||
| Total Investments | 99.8 | % | ||
| Other Assets in Excess of Liabilities | 0.2 | % | ||
| Total Net Assets | 100.0 | % | ||
See accompanying Notes to Financial Statements.
67
WCM Focused International Value Fund
SCHEDULE OF INVESTMENTS
As of December 31, 2023
| Number of Shares | Value | |||||||
| COMMON STOCKS — 97.0% | ||||||||
| BELGIUM — 3.9% | ||||||||
| 1,440 | D'ieteren Group | $ | 281,228 | |||||
| 2,270 | KBC Group N.V. | 147,156 | ||||||
| 428,384 | ||||||||
| BRAZIL — 1.9% | ||||||||
| 26,000 | NU Holdings Ltd. - Class A* | 216,580 | ||||||
| CANADA — 10.6% | ||||||||
| 4,050 | Brookfield Asset Management Ltd. - Class A | 162,688 | ||||||
| 3,850 | Brookfield Corp. | 154,462 | ||||||
| 4,610 | Canadian Natural Resources Ltd. | 302,047 | ||||||
| 2,780 | CGI, Inc.* | 298,044 | ||||||
| 1,870 | TFI International, Inc. | 254,283 | ||||||
| 1,171,524 | ||||||||
| CHINA — 3.9% | ||||||||
| 1,610 | Baidu, Inc. - ADR* | 191,735 | ||||||
| 33,100 | China Mengniu Dairy Co., Ltd.* | 89,018 | ||||||
| 1,610 | NetEase, Inc. - ADR | 149,988 | ||||||
| 430,741 | ||||||||
| FRANCE — 3.6% | ||||||||
| 880 | Capgemini S.E. | 183,374 | ||||||
| 1,050 | Schneider Electric S.E. | 210,719 | ||||||
| 394,093 | ||||||||
| GERMANY — 12.3% | ||||||||
| 1,040 | adidas A.G. | 211,445 | ||||||
| 13,300 | Deutsche Telekom A.G. | 319,359 | ||||||
| 4,970 | Infineon Technologies A.G. | 207,403 | ||||||
| 1,425 | Merck KGaA | 226,697 | ||||||
| 490 | Muenchener Rueckversicherungs-Gesellschaft A.G. in Muenchen | 202,913 | ||||||
| 5,394 | Schott Pharma A.G. & Co. KGaA* | 200,087 | ||||||
| 1,367,904 | ||||||||
| HONG KONG — 0.7% | ||||||||
| 7,040 | Techtronic Industries Co., Ltd. | 83,892 | ||||||
| INDIA — 3.9% | ||||||||
| 10,450 | ICICI Bank Ltd. - ADR | 249,128 | ||||||
| 2,890 | Reliance Industries Ltd. - GDR | 180,625 | ||||||
| 429,753 | ||||||||
68
WCM Focused International Value Fund
SCHEDULE OF INVESTMENTS – Continued
As of December 31, 2023
| Number of Shares | Value | |||||||
| COMMON STOCKS (Continued) | ||||||||
| IRELAND — 4.7% | ||||||||
| 985 | ICON PLC* | $ | 278,824 | |||||
| 1,010 | Trane Technologies PLC | 246,339 | ||||||
| 525,163 | ||||||||
| ISRAEL — 1.2% | ||||||||
| 680 | Nice Ltd. - ADR* | 135,667 | ||||||
| ITALY — 1.6% | ||||||||
| 3,250 | Recordati Industria Chimica e Farmaceutica S.p.A. | 175,202 | ||||||
| JAPAN — 14.2% | ||||||||
| 9,000 | Advantest Corp. | 306,191 | ||||||
| 3,300 | FUJIFILM Holdings Corp. | 198,304 | ||||||
| 5,200 | Recruit Holdings Co., Ltd. | 219,912 | �� | |||||
| 3,500 | Sony Group Corp. - ADR | 331,415 | ||||||
| 3,600 | Square Enix Holdings Co., Ltd. | 129,268 | ||||||
| 5,700 | TechnoPro Holdings, Inc. | 150,181 | ||||||
| 1,300 | Tokyo Electron Ltd. | 232,848 | ||||||
| 1,568,119 | ||||||||
| MEXICO — 4.0% | ||||||||
| 10,360 | Grupo Aeroportuario del Pacifico S.A.B. de C.V. - Class B | 180,850 | ||||||
| 25,800 | Grupo Financiero Banorte S.A.B. de C.V. - Class O | 259,443 | ||||||
| 440,293 | ||||||||
| RUSSIA — 0.0% | ||||||||
| 34,600 | Sberbank of Russia PJSC - ADR*,1 | — | ||||||
| SWEDEN — 3.8% | ||||||||
| 13,310 | Atlas Copco A.B. - A Shares | 229,023 | ||||||
| 8,770 | Sandvik A.B. | 189,641 | ||||||
| 418,664 | ||||||||
| SWITZERLAND — 7.8% | ||||||||
| 820 | Chubb Ltd. | 185,320 | ||||||
| 45,500 | Glencore PLC | 273,812 | ||||||
| 13,000 | UBS Group A.G. | 401,700 | ||||||
| 860,832 | ||||||||
| TAIWAN — 1.9% | ||||||||
| 2,040 | Taiwan Semiconductor Manufacturing Co., Ltd. - ADR | 212,160 | ||||||
69
WCM Focused International Value Fund
SCHEDULE OF INVESTMENTS – Continued
As of December 31, 2023
| Number of Shares | Value | |||||||
| COMMON STOCKS (Continued) | ||||||||
| THAILAND — 2.0% | ||||||||
| 1,140 | Fabrinet* | $ | 216,976 | |||||
| UNITED KINGDOM — 13.0% | ||||||||
| 8,000 | 3i Group PLC | 246,883 | ||||||
| 2,740 | AstraZeneca PLC - ADR | 184,539 | ||||||
| 21,600 | Haleon PLC - ADR | 177,768 | ||||||
| 1,900 | London Stock Exchange Group PLC | 224,609 | ||||||
| 5,400 | RELX PLC - ADR | 214,164 | ||||||
| 103,000 | Rolls-Royce Holdings PLC* | 393,488 | ||||||
| 1,441,451 | ||||||||
| UNITED STATES — 2.0% | ||||||||
| 4,250 | Schlumberger N.V. | 221,170 | ||||||
| TOTAL COMMON STOCKS | ||||||||
| (Cost $9,711,072) | 10,738,568 | |||||||
| SHORT-TERM INVESTMENTS — 1.9% | ||||||||
| 205,904 | Morgan Stanley Institutional Liquidity Treasury Portfolio - Institutional Class, 5.14%2 | 205,904 | ||||||
| TOTAL SHORT-TERM INVESTMENTS | ||||||||
| (Cost $205,904) | 205,904 | |||||||
| TOTAL INVESTMENTS — 98.9% | ||||||||
| (Cost $9,916,976) | 10,944,472 | |||||||
| Other Assets in Excess of Liabilities — 1.1% | 125,443 | |||||||
| TOTAL NET ASSETS — 100.0% | $ | 11,069,915 | ||||||
ADR – American Depository Receipt
GDR – Global Depository Receipt
PJSC – Public Joint Stock Company
PLC – Public Limited Company
| * | Non-income producing security. |
| 1 | Level 3 securities fair valued under procedures established by the Board of Trustees, represents 0.00% of Total Net Assets. The total value of these securities is $0. |
| 2 | The rate is the annualized seven-day yield at period end. |
See accompanying Notes to Financial Statements.
70
WCM Focused International Value Fund
SUMMARY OF INVESTMENTS
As of December 31, 2023
| Security Type/Sector | Percent of Total Net Assets | |||
| Common Stocks | ||||
| Technology | 22.5 | % | ||
| Financials | 22.1 | % | ||
| Industrials | 18.1 | % | ||
| Health Care | 11.4 | % | ||
| Communications | 7.1 | % | ||
| Energy | 6.4 | % | ||
| Consumer Discretionary | 4.5 | % | ||
| Materials | 2.5 | % | ||
| Consumer Staples | 2.4 | % | ||
| Total Common Stocks | 97.0 | % | ||
| Short-Term Investments | 1.9 | % | ||
| Total Investments | 98.9 | % | ||
| Other Assets in Excess of Liabilities | 1.1 | % | ||
| Total Net Assets | 100.0 | % | ||
See accompanying Notes to Financial Statements.
71
WCM Focused International Opportunities Fund
SCHEDULE OF INVESTMENTS
As of December 31, 2023
| Number of Shares | Value | |||||||
| COMMON STOCKS — 96.2% | ||||||||
| ARGENTINA — 3.3% | ||||||||
| 5,140 | Globant S.A.* | $ | 1,223,217 | |||||
| AUSTRALIA — 4.6% | ||||||||
| 3,800 | Atlassian Corp. - Class A* | 903,868 | ||||||
| 203,670 | Steadfast Group Ltd. | 807,741 | ||||||
| 1,711,609 | ||||||||
| BELGIUM — 2.6% | ||||||||
| 4,840 | D'ieteren Group | 945,237 | ||||||
| BERMUDA — 1.9% | ||||||||
| 9,620 | Arch Capital Group Ltd.* | 714,477 | ||||||
| BRAZIL — 2.0% | ||||||||
| 88,190 | NU Holdings Ltd. - Class A* | 734,623 | ||||||
| CANADA — 8.4% | ||||||||
| 350 | Constellation Software, Inc. | 867,742 | ||||||
| 1,480 | Lululemon Athletica, Inc.* | 756,709 | ||||||
| 40,990 | PrairieSky Royalty Ltd. | 717,657 | ||||||
| 5,620 | TFI International, Inc. | 764,432 | ||||||
| 3,106,540 | ||||||||
| CHINA — 2.5% | ||||||||
| 89,500 | Shenzhou International Group Holdings Ltd. | 921,534 | ||||||
| DENMARK — 2.3% | ||||||||
| 8,170 | Novo Nordisk A.S. - Class B | 844,622 | ||||||
| FAROE ISLANDS — 1.6% | ||||||||
| 11,270 | Bakkafrost P/F | 590,128 | ||||||
| FRANCE — 4.7% | ||||||||
| 13,460 | Edenred S.E. | 804,509 | ||||||
| 7,170 | Gaztransport Et Technigaz S.A. | 949,087 | ||||||
| 1,753,596 | ||||||||
| GERMANY — 3.1% | ||||||||
| 16,210 | Scout24 S.E. | 1,148,193 | ||||||
| INDIA — 1.5% | ||||||||
| 11,490 | Divi's Laboratories Ltd. | 539,043 | ||||||
72
WCM Focused International Opportunities Fund
SCHEDULE OF INVESTMENTS - Continued
As of December 31, 2023
| Number of Shares | Value | |||||||
| COMMON STOCKS (Continued) | ||||||||
| IRELAND — 7.2% | ||||||||
| 3,340 | Flutter Entertainment PLC* | $ | 593,494 | |||||
| 7,990 | Ryanair Holdings PLC - ADR* | 1,065,546 | ||||||
| 4,630 | STERIS PLC | 1,017,906 | ||||||
| 2,676,946 | ||||||||
| ITALY — 4.0% | ||||||||
| 50,650 | Davide Campari-Milano N.V. | 571,196 | ||||||
| 14,910 | Moncler S.p.A. | 916,855 | ||||||
| 1,488,051 | ||||||||
| JAPAN — 12.5% | ||||||||
| 19,310 | BayCurrent Consulting, Inc. | 678,041 | ||||||
| 6,220 | Disco Corp. | 1,543,090 | ||||||
| 11,828 | GMO Payment Gateway, Inc. | 821,920 | ||||||
| 25,200 | Kobe Bussan Co., Ltd. | 744,562 | ||||||
| 3,167 | Lasertec Corp. | 834,875 | ||||||
| 4,622,488 | ||||||||
| MEXICO — 4.3% | ||||||||
| 6,500 | Fomento Economico Mexicano S.A.B. de C.V. - ADR | 847,275 | ||||||
| 68,840 | Grupo Aeroportuario del Centro Norte S.A.B. de C.V. | 728,737 | ||||||
| 1,576,012 | ||||||||
| NETHERLANDS — 9.7% | ||||||||
| 700 | Adyen N.V.* | 901,546 | ||||||
| 2,180 | ASM International N.V. | 1,131,034 | ||||||
| 7,350 | Elastic N.V.* | 828,345 | ||||||
| 8,210 | Euronext N.V. | 712,869 | ||||||
| 3,573,794 | ||||||||
| NORWAY — 1.5% | ||||||||
| 287,080 | AutoStore Holdings Ltd.* | 564,559 | ||||||
| RUSSIA — 0.0% | ||||||||
| 9,200 | Yandex N.V. - Class A*,1 | — | ||||||
| SOUTH KOREA — 1.3% | ||||||||
| 29,750 | Coupang, Inc.* | 481,653 | ||||||
| SPAIN — 1.6% | ||||||||
| 8,350 | Amadeus IT Group S.A. | 598,088 | ||||||
73
WCM Focused International Opportunities Fund
SCHEDULE OF INVESTMENTS - Continued
As of December 31, 2023
| Number of Shares | Value | |||||||
| COMMON STOCKS (Continued) | ||||||||
| SWEDEN — 4.2% | ||||||||
| 6,770 | Evolution A.B. | $ | 806,941 | |||||
| 12,240 | Saab A.B. - Class B | 737,354 | ||||||
| 1,544,295 | ||||||||
| SWITZERLAND — 4.8% | ||||||||
| 5,900 | Bachem Holding A.G. | 455,950 | ||||||
| 530 | Mettler-Toledo International, Inc.* | 642,869 | ||||||
| 2,090 | Sika A.G. | 680,101 | ||||||
| 1,778,920 | ||||||||
| UNITED KINGDOM — 6.6% | ||||||||
| 31,650 | 3i Group PLC | 976,732 | ||||||
| 27,080 | Compass Group PLC | 740,773 | ||||||
| 24,610 | Halma PLC | 716,498 | ||||||
| 2,434,003 | ||||||||
| TOTAL COMMON STOCKS | ||||||||
| (Cost $30,240,363) | 35,571,628 | |||||||
| WARRANTS — 0.0% | ||||||||
| CANADA — 0.0% | ||||||||
| 345 | Constellation Software, Inc. (Expires 4/01/2040)*,1 | — | ||||||
| TOTAL WARRANTS | ||||||||
(Cost $0) | — | |||||||
| SHORT-TERM INVESTMENTS — 3.8% | ||||||||
| 1,386,722 | Morgan Stanley Institutional Liquidity Treasury Portfolio - Institutional Class, 5.14%2 | 1,386,722 | ||||||
| TOTAL SHORT-TERM INVESTMENTS | ||||||||
| (Cost $1,386,722) | 1,386,722 | |||||||
| TOTAL INVESTMENTS — 100.0% | ||||||||
| (Cost $31,627,085) | 36,958,350 | |||||||
| Other Assets in Excess of Liabilities — 0.0% | 13,183 | |||||||
| TOTAL NET ASSETS — 100.0% | $ | 36,971,533 | ||||||
ADR – American Depository Receipt
PLC – Public Limited Company
| * | Non-income producing security. |
| 1 | Level 3 securities fair valued under procedures established by the Board of Trustees, represents 0.00% of Total Net Assets. The total value of these securities is $0. |
| 2 | The rate is the annualized seven-day yield at period end. |
See accompanying Notes to Financial Statements.
74
WCM Focused International Opportunities Fund
SUMMARY OF INVESTMENTS
As of December 31, 2023
| Security Type/Sector | Percent of Total Net Assets | |||
| Common Stocks | ||||
| Technology | 29.5 | % | ||
| Industrials | 15.0 | % | ||
| Consumer Discretionary | 14.7 | % | ||
| Financials | 10.7 | % | ||
| Health Care | 9.5 | % | ||
| Consumer Staples | 7.4 | % | ||
| Energy | 4.5 | % | ||
| Communications | 3.1 | % | ||
| Materials | 1.8 | % | ||
| Total Common Stocks | 96.2 | % | ||
| Warrants | 0.0 | % | ||
| Short-Term Investments | 3.8 | % | ||
| Total Investments | 100.0 | % | ||
| Other Assets in Excess of Liabilities | 0.0 | % | ||
| Total Net Assets | 100.0 | % | ||
See accompanying Notes to Financial Statements.
75
WCM Mid Cap Quality Value Fund
SCHEDULE OF INVESTMENTS
As of December 31, 2023
| Number of Shares | Value | |||||||
| COMMON STOCKS — 99.2% | ||||||||
| COMMUNICATIONS — 4.8% | ||||||||
| 409 | GoDaddy, Inc. - Class A* | $ | 43,419 | |||||
| CONSUMER DISCRETIONARY — 15.7% | ||||||||
| 358 | CarMax, Inc.* | 27,473 | ||||||
| 471 | Masco Corp. | 31,547 | ||||||
| 61 | Pool Corp. | 24,321 | ||||||
| 348 | Wyndham Hotels & Resorts, Inc. | 27,983 | ||||||
| 597 | YETI Holdings, Inc.* | 30,913 | ||||||
| 142,237 | ||||||||
| FINANCIALS — 7.2% | ||||||||
| 585 | Brown & Brown, Inc. | 41,600 | ||||||
| 17 | Markel Group, Inc.* | 24,138 | ||||||
| 65,738 | ||||||||
| HEALTH CARE — 9.0% | ||||||||
| 42 | Chemed Corp. | 24,559 | ||||||
| 100 | Molina Healthcare, Inc.* | 36,131 | ||||||
| 171 | Zimmer Biomet Holdings, Inc. | 20,811 | ||||||
| 81,501 | ||||||||
| INDUSTRIALS — 19.5% | ||||||||
| 323 | Graco, Inc. | 28,024 | ||||||
| 116 | IDEX Corp. | 25,185 | ||||||
| 159 | Landstar System, Inc. | 30,790 | ||||||
| 2,155 | R1 RCM, Inc.* | 22,778 | ||||||
| 151 | SiteOne Landscape Supply, Inc.* | 24,538 | ||||||
| 81 | Tetra Tech, Inc. | 13,521 | ||||||
| 75 | Watsco, Inc. | 32,135 | ||||||
| 176,971 | ||||||||
| MATERIALS — 15.8% | ||||||||
| 292 | Ashland, Inc. | 24,619 | ||||||
| 308 | Ball Corp. | 17,716 | ||||||
| 100 | Carlisle Cos., Inc. | 31,243 | ||||||
| 1,505 | Element Solutions, Inc. | 34,826 | ||||||
| 427 | Trex Co., Inc.* | 35,351 | ||||||
| 143,755 | ||||||||
| REAL ESTATE — 5.8% | ||||||||
| 246 | CBRE Group, Inc. - Class A* | 22,900 | ||||||
| 156 | Jones Lang LaSalle, Inc.* | 29,464 | ||||||
| 52,364 | ||||||||
76
WCM Mid Cap Quality Value Fund
SCHEDULE OF INVESTMENTS - Continued
As of December 31, 2023
| Number of Shares | Value | |||||||
| COMMON STOCKS (Continued) | ||||||||
| TECHNOLOGY — 21.4% | ||||||||
| 250 | Booz Allen Hamilton Holding Corp. | $ | 31,978 | |||||
| 182 | CDW Corp. | 41,372 | ||||||
| 334 | Entegris, Inc. | 40,020 | ||||||
| 222 | MKS Instruments, Inc. | 22,837 | ||||||
| 197 | PTC, Inc.* | 34,467 | ||||||
| 87 | Zebra Technologies Corp. - Class A* | 23,780 | ||||||
| 194,454 | ||||||||
| TOTAL COMMON STOCKS | ||||||||
| (Cost $743,564) | 900,439 | |||||||
| Principal Amount | ||||||||
| BANK DEPOSIT INVESTMENTS — 1.9% | ||||||||
| $ | 16,684 | UMB Bank, Money Market Special II, 5.18%1 | 16,684 | |||||
| TOTAL BANK DEPOSIT INVESTMENTS | ||||||||
| (Cost $16,684) | 16,684 | |||||||
| TOTAL INVESTMENTS — 101.1% | ||||||||
| (Cost $760,248) | 917,123 | |||||||
| Liabilities in Excess of Other Assets — (1.1)% | (9,718 | ) | ||||||
| TOTAL NET ASSETS — 100.0% | $ | 907,405 | ||||||
| * | Non-income producing security. |
| 1 | The rate is the annualized seven-day yield at period end. |
See accompanying Notes to Financial Statements.
77
WCM Mid Cap Quality Value Fund
SUMMARY OF INVESTMENTS
As of December 31, 2023
| Security Type/Sector | Percent of Total Net Assets | |||
| Common Stocks | ||||
| Technology | 21.4 | % | ||
| Industrials | 19.5 | % | ||
| Materials | 15.8 | % | ||
| Consumer Discretionary | 15.7 | % | ||
| Health Care | 9.0 | % | ||
| Financials | 7.2 | % | ||
| Real Estate | 5.8 | % | ||
| Communications | 4.8 | % | ||
| Total Common Stocks | 99.2 | % | ||
| Bank Deposit Investments | 1.9 | % | ||
| Total Investments | 101.1 | % | ||
| Liabilities in Excess of Other Assets | (1.1 | )% | ||
| Total Net Assets | 100.0 | % | ||
See accompanying Notes to Financial Statements.
78
WCM Focused Emerging Markets ex China Fund
SCHEDULE OF INVESTMENTS
As of December 31, 2023
| Number of Shares | Value | |||||||
| COMMON STOCKS — 97.9% | ||||||||
| ARGENTINA — 2.6% | ||||||||
| 710 | Globant S.A.* | $ | 168,966 | |||||
| BRAZIL — 10.7% | ||||||||
| 8,400 | Equatorial Energia S.A. | 61,769 | ||||||
| 40,100 | GPS Participacoes e Empreendimentos S.A. | 155,609 | ||||||
| 11,139 | Localiza Rent a Car S.A. | 145,842 | ||||||
| 21,649 | NU Holdings Ltd. - Class A* | 180,336 | ||||||
| 10,200 | Porto Seguro S.A. | 60,348 | ||||||
| 14,300 | TOTVS S.A. | 99,178 | ||||||
| 703,082 | ||||||||
| CANADA — 2.6% | ||||||||
| 5,716 | Celestica, Inc.* | 167,364 | ||||||
| INDIA — 14.6% | ||||||||
| 52,972 | Bharat Electronics Ltd. | 117,257 | ||||||
| 1,389 | Divi's Laboratories Ltd. | 65,164 | ||||||
| 5,532 | Elecon Engineering Co., Ltd. | 61,623 | ||||||
| 14,740 | ICICI Bank Ltd. | 176,532 | ||||||
| 7,434 | Kotak Mahindra Bank Ltd. | 170,462 | ||||||
| 6,082 | Muthoot Finance Ltd. | 107,901 | ||||||
| 4,718 | Poly Medicure Ltd. | 84,473 | ||||||
| 12,072 | UPL Ltd. | 85,194 | ||||||
| 1,443 | WNS Holdings Ltd. - ADR* | 91,198 | ||||||
| 959,804 | ||||||||
| INDONESIA — 5.0% | ||||||||
| 292,600 | Bank Central Asia Tbk P.T. | 178,635 | ||||||
| 379,800 | Bank Mandiri Persero Tbk P.T. | 149,236 | ||||||
| 327,871 | ||||||||
| MEXICO — 13.4% | ||||||||
| 68,100 | Becle S.A.B. de C.V. | 133,425 | ||||||
| 1,918 | Fomento Economico Mexicano S.A.B. de C.V. - ADR | 250,011 | ||||||
| 18 | GMexico Transportes S.A.B. de C.V. | 41 | ||||||
| 11,608 | Grupo Aeroportuario del Centro Norte S.A.B. de C.V. | 122,882 | ||||||
| 14,000 | Qualitas Controladora S.A.B. de C.V. | 141,459 | �� | |||||
| 15,100 | Regional S.A.B. de C.V. | 144,295 | ||||||
| 20,600 | Wal-Mart de Mexico S.A.B. de C.V. | 86,823 | ||||||
| 878,936 | ||||||||
| NETHERLANDS — 1.7% | ||||||||
| 761 | BE Semiconductor Industries N.V. | 114,637 | ||||||
79
WCM Focused Emerging Markets ex China Fund
SCHEDULE OF INVESTMENTS - Continued
As of December 31, 2023
| Number of Shares | Value | |||||||
| COMMON STOCKS (Continued) | ||||||||
| PERU — 2.4% | ||||||||
| 1,045 | Credicorp Ltd. | $ | 156,677 | |||||
| POLAND — 4.0% | ||||||||
| 893 | Dino Polska S.A.* | 104,555 | ||||||
| 11,457 | InPost S.A.* | 158,296 | ||||||
| 262,851 | ||||||||
| SAUDI ARABIA — 7.5% | ||||||||
| 6,648 | Aldrees Petroleum and Transport Services Co. | 313,431 | ||||||
| 3,156 | Bupa Arabia for Cooperative Insurance Co. | 179,429 | ||||||
| 492,860 | ||||||||
| SOUTH AFRICA — 3.9% | ||||||||
| 3,245 | Bid Corp. Ltd. | 75,686 | ||||||
| 1,080 | Capitec Bank Holdings Ltd. | 119,637 | ||||||
| 3,215 | Clicks Group Ltd. | 57,245 | ||||||
| 252,568 | ||||||||
| SOUTH KOREA — 10.3% | ||||||||
| 9,381 | Coupang, Inc.* | 151,878 | ||||||
| 1,554 | Hana Materials, Inc.* | 60,172 | ||||||
| 2,008 | HPSP Co., Ltd.* | 67,811 | ||||||
| 6,477 | Samsung Electronics Co., Ltd. | 393,133 | ||||||
| 672,994 | ||||||||
| TAIWAN — 10.7% | ||||||||
| 49 | Advantech Co., Ltd. | 594 | ||||||
| 2,300 | Airtac International Group | 75,691 | ||||||
| 2,266 | King Slide Works Co., Ltd. | 67,484 | ||||||
| 9,000 | Nien Made Enterprise Co., Ltd. | 103,517 | ||||||
| 23,487 | Taiwan Semiconductor Manufacturing Co., Ltd. | 453,815 | ||||||
| 701,101 | ||||||||
| THAILAND — 3.0% | ||||||||
| 1,042 | Fabrinet* | 198,324 | ||||||
| UNITED KINGDOM — 2.9% | ||||||||
| 35,836 | Baltic Classifieds Group PLC | 108,034 | ||||||
| 2,829 | Wizz Air Holdings PLC* | 79,731 | ||||||
| 187,765 | ||||||||
80
WCM Focused Emerging Markets ex China Fund
SCHEDULE OF INVESTMENTS - Continued
As of December 31, 2023
Number of Shares | Value | |||||||
| COMMON STOCKS (Continued) | ||||||||
| UNITED STATES — 2.6% | ||||||||
| 579 | EPAM Systems, Inc.* | $ | 172,160 | |||||
| TOTAL COMMON STOCKS | ||||||||
| (Cost $5,670,860) | 6,417,960 | |||||||
| RIGHTS — 0.0% | ||||||||
| BRAZIL — 0.0% | ||||||||
| 40 | Localiza Rent a Car S.A. (Expires 3/11/2024)* | 165 | ||||||
| TOTAL RIGHTS | ||||||||
| (Cost $0) | 165 | |||||||
| Principal Amount | ||||||||
| BANK DEPOSIT INVESTMENTS — 2.3% | ||||||||
| $ | 152,320 | UMB Bank, Money Market Special II, 5.18%1 | 152,320 | |||||
| TOTAL BANK DEPOSIT INVESTMENTS | ||||||||
| (Cost $152,320) | 152,320 | |||||||
| TOTAL INVESTMENTS — 100.2% | ||||||||
| (Cost $5,823,180) | 6,570,445 | |||||||
| Liabilities in Excess of Other Assets — (0.2)% | (11,007 | ) | ||||||
| TOTAL NET ASSETS — 100.0% | $ | 6,559,438 | ||||||
ADR – American Depository Receipt
PLC – Public Limited Company
| * | Non-income producing security. |
| 1 | The rate is the annualized seven-day yield at period end. |
See accompanying Notes to Financial Statements.
81
WCM Focused Emerging Markets ex China Fund
SUMMARY OF INVESTMENTS
As of December 31, 2023
| Security Type/Sector | Percent of Total Net Assets | |||
| Common Stocks | ||||
| Technology | 30.3 | % | ||
| Financials | 26.9 | % | ||
| Industrials | 12.8 | % | ||
| Consumer Staples | 10.8 | % | ||
| Consumer Discretionary | 6.1 | % | ||
| Energy | 4.8 | % | ||
| Health Care | 2.3 | % | ||
| Communications | 1.7 | % | ||
| Materials | 1.3 | % | ||
| Utilities | 0.9 | % | ||
| Total Common Stocks | 97.9 | % | ||
| Rights | 0.0 | % | ||
| Bank Deposit Investments | 2.3 | % | ||
| Total Investments | 100.2 | % | ||
| Liabilities in Excess of Other Assets | (0.2 | )% | ||
| Total Net Assets | 100.0 | % | ||
See accompanying Notes to Financial Statements.
82
WCM Quality Dividend Growth Fund
SCHEDULE OF INVESTMENTS
As of December 31, 2023
Number of Shares | Value | |||||||
| COMMON STOCKS — 92.3% | ||||||||
| COMMUNICATIONS — 6.2% | ||||||||
| 4,269 | Comcast Corp. - Class A | $ | 187,196 | |||||
| 5,585 | Verizon Communications, Inc. | 210,554 | ||||||
| 397,750 | ||||||||
| CONSUMER DISCRETIONARY — 2.6% | ||||||||
| 471 | Home Depot, Inc. | 163,225 | ||||||
| CONSUMER STAPLES — 13.6% | ||||||||
| 708 | Clorox Co. | 100,954 | ||||||
| 2,531 | Coca-Cola Co. | 149,152 | ||||||
| 1,712 | Coca-Cola Femsa S.A.B. de C.V. - ADR | 162,023 | ||||||
| 633 | PepsiCo, Inc. | 107,509 | ||||||
| 1,078 | Procter & Gamble Co. | 157,970 | ||||||
| 4,022 | Unilever PLC - ADR | 194,986 | ||||||
| 872,594 | ||||||||
| ENERGY — 10.9% | ||||||||
| 1,191 | Chevron Corp. | 177,649 | ||||||
| 2,029 | Devon Energy Corp. | 91,914 | ||||||
| 1,568 | Exxon Mobil Corp. | 156,769 | ||||||
| 992 | Phillips 66 | 132,075 | ||||||
| 2,112 | TotalEnergies S.E. - ADR | 142,306 | ||||||
| 700,713 | ||||||||
| FINANCIALS — 9.7% | ||||||||
| 2,028 | Cullen/Frost Bankers, Inc. | 220,018 | ||||||
| 1,376 | JPMorgan Chase & Co. | 234,058 | ||||||
| 1,563 | T. Rowe Price Group, Inc. | 168,319 | ||||||
| 622,395 | ||||||||
| HEALTH CARE — 17.2% | ||||||||
| 813 | Amgen, Inc. | 234,160 | ||||||
| 1,238 | Gilead Sciences, Inc. | 100,291 | ||||||
| 1,330 | Johnson & Johnson | 208,464 | ||||||
| 1,908 | Medtronic PLC | 157,181 | ||||||
| 1,660 | Merck & Co., Inc. | 180,973 | ||||||
| 3,440 | Pfizer, Inc. | 99,038 | ||||||
| 224 | UnitedHealth Group, Inc. | 117,929 | ||||||
| 1,098,036 | ||||||||
| INDUSTRIALS — 16.4% | ||||||||
| 877 | General Dynamics Corp. | 227,731 | ||||||
| 351 | Lockheed Martin Corp. | 159,087 | ||||||
| 1,785 | MSC Industrial Direct Co., Inc. - Class A | 180,749 | ||||||
83
WCM Quality Dividend Growth Fund
SCHEDULE OF INVESTMENTS - Continued
As of December 31, 2023
| Number of Shares | Value | |||||||
| COMMON STOCKS (Continued) | ||||||||
| INDUSTRIALS (Continued) | ||||||||
| 1,987 | Robert Half, Inc. | $ | 174,697 | |||||
| 707 | Union Pacific Corp. | 173,653 | ||||||
| 863 | United Parcel Service, Inc. - Class B | 135,690 | ||||||
| 1,051,607 | ||||||||
| TECHNOLOGY — 10.1% | ||||||||
| 3,330 | Cisco Systems, Inc. | 168,232 | ||||||
| 362 | Microsoft Corp. | 136,126 | ||||||
| 1,299 | Skyworks Solutions, Inc. | 146,034 | ||||||
| 1,164 | Texas Instruments, Inc. | 198,415 | ||||||
| 648,807 | ||||||||
| UTILITIES — 5.6% | ||||||||
| 1,978 | Entergy Corp. | 200,154 | ||||||
| 2,554 | Public Service Enterprise Group, Inc. | 156,177 | ||||||
| 356,331 | ||||||||
| TOTAL COMMON STOCKS | ||||||||
| (Cost $5,799,010) | 5,911,458 | |||||||
| Principal Amount | ||||||||
| BANK DEPOSIT INVESTMENTS — 8.1% | ||||||||
| $ | 516,750 | UMB Bank, Money Market Special II, 5.18%1 | 516,750 | |||||
| TOTAL BANK DEPOSIT INVESTMENTS | ||||||||
| (Cost $516,750) | 516,750 | |||||||
| TOTAL INVESTMENTS — 100.4% | ||||||||
| (Cost $6,315,760) | 6,428,208 | |||||||
| Liabilities in Excess of Other Assets — (0.4)% | (28,732 | ) | ||||||
| TOTAL NET ASSETS — 100.0% | $ | 6,399,476 |
ADR – American Depository Receipt
PLC – Public Limited Company
| 1 | The rate is the annualized seven-day yield at period end. |
See accompanying Notes to Financial Statements.
84
WCM Quality Dividend Growth Fund
SUMMARY OF INVESTMENTS
As of December 31, 2023
| Security Type/Sector | Percent of Total Net Assets | |||
| Common Stocks | ||||
| Health Care | 17.2 | % | ||
| Industrials | 16.4 | % | ||
| Consumer Staples | 13.6 | % | ||
| Energy | 10.9 | % | ||
| Technology | 10.1 | % | ||
| Financials | 9.7 | % | ||
| Communications | 6.2 | % | ||
| Utilities | 5.6 | % | ||
| Consumer Discretionary | 2.6 | % | ||
| Total Common Stocks | 92.3 | % | ||
| Bank Deposit Investments | 8.1 | % | ||
| Total Investments | 100.4 | % | ||
| Liabilities in Excess of Other Assets | (0.4 | )% | ||
| Total Net Assets | 100.0 | % | ||
See accompanying Notes to Financial Statements.
85
STATEMENTS OF ASSETS AND LIABILITIES
As of December 31, 2023
WCM Focused International Growth Fund | WCM Focused Emerging Markets Fund | WCM Focused Global Growth Fund | ||||||||||
| Assets: | ||||||||||||
| Investments, at cost | $ | 13,013,174,031 | $ | 1,213,121,479 | $ | 356,280,848 | ||||||
| Foreign currency, at cost | 4,480,013 | 571,882 | - | |||||||||
| Investments, at value | $ | 17,463,103,892 | $ | 1,191,661,615 | $ | 427,236,816 | ||||||
| Foreign currency, at value | 4,686,676 | 572,861 | - | |||||||||
| Receivables: | ||||||||||||
| Fund shares sold | 5,871,997 | 842,230 | 91,612 | |||||||||
| Reclaims receivable | 22,945,566 | - | 113,217 | |||||||||
| Dividends and interest | 7,618,517 | 2,710,764 | 343,123 | |||||||||
| Due from Advisor | - | - | - | |||||||||
| Offering costs | - | - | - | |||||||||
| Prepaid expenses | 130,162 | 10,441 | 17,864 | |||||||||
| Total assets | 17,504,356,810 | 1,195,797,911 | 427,802,632 | |||||||||
| Liabilities: | ||||||||||||
| Payables: | ||||||||||||
| Investment securities purchased | - | - | - | |||||||||
| Fund shares redeemed | 10,830,460 | 1,999,651 | 562,263 | |||||||||
| Due to custodian | - | - | - | |||||||||
| Advisory fees | 12,419,137 | 1,007,558 | 280,464 | |||||||||
| Shareholder servicing fees (Note 7) | 147,777 | 75,602 | 4,773 | |||||||||
| Distribution fees (Note 8) | 150,955 | 18,753 | 6,512 | |||||||||
| Fund administration fees | 1,203,732 | 123,859 | 39,425 | |||||||||
| Fund accounting fees | 348,215 | 46,842 | 34,879 | |||||||||
| Transfer agent fees and expenses | 279,668 | 43,484 | 13,185 | |||||||||
| Custody fees | 691,208 | 425,989 | 17,555 | |||||||||
| Shareholder reporting fees | 252,284 | 55,043 | 8,429 | |||||||||
| Trustees' deferred compensation (Note 3) | 234,141 | 28,410 | 15,137 | |||||||||
| Trustees' fees and expenses | 74,613 | 5,604 | 3,234 | |||||||||
| Auditing fees | 20,000 | 20,000 | 20,000 | |||||||||
| Legal fees | 18,800 | 6,836 | 3,843 | |||||||||
| Chief Compliance Officer fees | 1,510 | 1,379 | 2,336 | |||||||||
| Offering costs - Advisor | - | - | - | |||||||||
| Non-U.S. Taxes | - | 1,103,738 | - | |||||||||
| Registration fees | - | - | - | |||||||||
| Offering costs - Related Parties | - | - | - | |||||||||
| Accrued other expenses | 3,464 | 11,518 | 3,658 | |||||||||
| Total liabilities | 26,675,964 | 4,974,266 | 1,015,693 | |||||||||
| Commitments and Contingencies (Note 3) | ||||||||||||
| Net Assets | $ | 17,477,680,846 | $ | 1,190,823,645 | $ | 426,786,939 | ||||||
| Components of Net Assets: | ||||||||||||
| Paid-in capital (par value of $0.01 per share with an unlimited number of shares authorized) | $ | 12,698,951,392 | $ | 1,771,326,982 | $ | 378,818,332 | ||||||
| Total distributable earnings (accumulated deficit) | 4,778,729,454 | (580,503,337 | ) | 47,968,607 | ||||||||
| Net Assets | $ | 17,477,680,846 | $ | 1,190,823,645 | $ | 426,786,939 | ||||||
| Maximum Offering Price per Share: | ||||||||||||
| Investor Class: | ||||||||||||
| Net assets applicable to shares outstanding | $ | 719,670,371 | $ | 89,358,676 | $ | 38,795,031 | ||||||
| Shares of beneficial interest issued and outstanding | 32,071,918 | 6,745,141 | 1,822,028 | |||||||||
| Net asset value, offering and redemption price per share | $ | 22.44 | $ | 13.25 | $ | 21.29 | ||||||
See accompanying Notes to Financial Statements.
86
STATEMENTS OF ASSETS AND LIABILITIES - Continued
As of December 31, 2023
WCM Focused International Growth Fund | WCM Focused Emerging Markets Fund | WCM Focused Global Growth Fund | ||||||||||
| Institutional Class: | ||||||||||||
| Net assets applicable to shares outstanding | $ | 16,758,010,475 | $ | 1,101,464,969 | $ | 387,991,908 | ||||||
| Shares of beneficial interest issued and outstanding | 736,363,575 | 82,225,419 | 17,756,849 | |||||||||
| Net asset value, offering and redemption price per share | $ | 22.76 | $ | 13.40 | $ | 21.85 | ||||||
See accompanying Notes to Financial Statements.
87
STATEMENTS OF ASSETS AND LIABILITIES - Continued
As of December 31, 2023
WCM International Small Cap Growth Fund | WCM Small Cap Growth Fund | WCM SMID Quality Value Fund | ||||||||||
| Assets: | ||||||||||||
| Investments, at cost | $ | 283,325,130 | $ | 34,328,904 | $ | 109,865,060 | ||||||
| Foreign currency, at cost | 26,429 | - | - | |||||||||
| Investments, at value | $ | 311,401,143 | $ | 40,610,184 | $ | 143,231,287 | ||||||
| Foreign currency, at value | 26,474 | - | - | |||||||||
| Receivables: | ||||||||||||
| Fund shares sold | 88,186 | - | 98,676 | |||||||||
| Reclaims receivable | 404,936 | - | - | |||||||||
| Dividends and interest | 285,728 | 17,369 | 37,835 | |||||||||
| Due from Advisor | - | - | - | |||||||||
| Offering costs | - | - | - | |||||||||
| Prepaid expenses | 12,723 | 15,237 | 18,350 | |||||||||
| Total assets | 312,219,190 | 40,642,790 | 143,386,148 | |||||||||
| Liabilities: | ||||||||||||
| Payables: | ||||||||||||
| Investment securities purchased | - | 29,267 | - | |||||||||
| Fund shares redeemed | 165,301 | 50 | 169,729 | |||||||||
| Due to custodian | - | 9,491 | - | |||||||||
| Advisory fees | 265,862 | 6,272 | 44,059 | |||||||||
| Shareholder servicing fees (Note 7) | 12,056 | 918 | 2,095 | |||||||||
| Distribution fees (Note 8) | - | 22 | 49 | |||||||||
| Fund administration fees | 63,185 | 8,886 | 18,681 | |||||||||
| Fund accounting fees | 36,534 | 11,024 | 14,602 | |||||||||
| Transfer agent fees and expenses | 9,374 | 7,990 | 7,238 | |||||||||
| Custody fees | 87,378 | 4,130 | 5,646 | |||||||||
| Shareholder reporting fees | 8,841 | 2,847 | 4,124 | |||||||||
| Trustees' deferred compensation (Note 3) | 15,565 | 7,652 | 8,543 | |||||||||
| Trustees' fees and expenses | 3,192 | 1,325 | 1,360 | |||||||||
| Auditing fees | 20,000 | 20,000 | 20,000 | |||||||||
| Legal fees | 7,177 | 1,957 | 3,465 | |||||||||
| Chief Compliance Officer fees | 3,023 | 1,587 | 1,161 | |||||||||
| Offering costs - Advisor | - | - | - | |||||||||
| Non-U.S. Taxes | - | - | - | |||||||||
| Registration fees | 45,384 | - | - | |||||||||
| Offering costs - Related Parties | - | - | - | |||||||||
| Accrued other expenses | 4,497 | 2,315 | 2,516 | |||||||||
| Total liabilities | 747,369 | 115,733 | 303,268 | |||||||||
| Commitments and Contingencies (Note 3) | ||||||||||||
| Net Assets | $ | 311,471,821 | $ | 40,527,057 | $ | 143,082,880 | ||||||
| Components of Net Assets: | ||||||||||||
| Paid-in capital (par value of $0.01 per share with an unlimited number of shares authorized) | $ | 436,366,687 | $ | 40,519,561 | $ | 112,081,241 | ||||||
| Total distributable earnings (accumulated deficit) | (124,894,866 | ) | 7,496 | 31,001,639 | ||||||||
| Net Assets | $ | 311,471,821 | $ | 40,527,057 | $ | 143,082,880 | ||||||
| Maximum Offering Price per Share: | ||||||||||||
| Investor Class: | ||||||||||||
| Net assets applicable to shares outstanding | $ | - | $ | 107,058 | $ | 241,060 | ||||||
| Shares of beneficial interest issued and outstanding | - | 8,773 | 19,955 | |||||||||
| Net asset value, offering and redemption price per share | $ | - | $ | 12.20 | $ | 12.08 | ||||||
See accompanying Notes to Financial Statements.
88
STATEMENTS OF ASSETS AND LIABILITIES - Continued
As of December 31, 2023
WCM International Small Cap Growth Fund | WCM Small Cap Growth Fund | WCM SMID Quality Value Fund | ||||||||||
| Institutional Class: | ||||||||||||
| Net assets applicable to shares outstanding | $ | 311,471,821 | $ | 40,419,999 | $ | 142,841,820 | ||||||
| Shares of beneficial interest issued and outstanding | 15,453,624 | 3,277,886 | 11,680,305 | |||||||||
| Net asset value, offering and redemption price per share | $ | 20.16 | $ | 12.33 | $ | 12.23 | ||||||
See accompanying Notes to Financial Statements.
89
STATEMENTS OF ASSETS AND LIABILITIES - Continued
As of December 31, 2023
WCM China Quality Growth Fund | WCM Developing World Equity Fund | WCM International Equity Fund | ||||||||||
| Assets: | ||||||||||||
| Investments, at cost | $ | 5,323,554 | $ | 2,008,828 | $ | 78,932,566 | ||||||
| Foreign currency, at cost | 111,645 | - | 18,953 | |||||||||
| Investments, at value | $ | 4,513,205 | $ | 2,134,145 | $ | 87,432,468 | ||||||
| Foreign currency, at value | 117,025 | - | 18,933 | |||||||||
| Receivables: | ||||||||||||
| Fund shares sold | - | - | 175,077 | |||||||||
| Reclaims receivable | - | - | 8,147 | |||||||||
| Dividends and interest | 413 | 856 | 59,963 | |||||||||
| Due from Advisor | 18,742 | 27,080 | - | |||||||||
| Offering costs | - | - | - | |||||||||
| Prepaid expenses | 7,529 | 4,652 | 337 | |||||||||
| Total assets | 4,656,914 | 2,166,733 | 87,694,925 | |||||||||
| Liabilities: | ||||||||||||
| Payables: | ||||||||||||
| Investment securities purchased | - | - | - | |||||||||
| Fund shares redeemed | - | - | 2,525 | |||||||||
| Due to custodian | - | - | - | |||||||||
| Advisory fees | - | - | 18,009 | |||||||||
| Shareholder servicing fees (Note 7) | 1,407 | 1,022 | 1,998 | |||||||||
| Distribution fees (Note 8) | 26 | 35 | 137 | |||||||||
| Fund administration fees | 6,346 | 8,417 | 13,824 | |||||||||
| Fund accounting fees | 13,759 | 11,361 | 14,016 | |||||||||
| Transfer agent fees and expenses | 6,372 | 6,506 | 7,255 | |||||||||
| Custody fees | 9,280 | 23,002 | 13,132 | |||||||||
| Shareholder reporting fees | 1,991 | 2,290 | 3,091 | |||||||||
| Trustees' deferred compensation (Note 3) | 6,467 | 6,405 | 6,854 | |||||||||
| Trustees' fees and expenses | 745 | 4,123 | 3,091 | |||||||||
| Auditing fees | 20,000 | 20,000 | 19,450 | |||||||||
| Legal fees | 4,877 | 6,313 | 3,105 | |||||||||
| Chief Compliance Officer fees | 1,530 | 2,340 | 1,509 | |||||||||
| Offering costs - Advisor | - | - | - | |||||||||
| Non-U.S. Taxes | - | 1,749 | - | |||||||||
| Registration fees | - | - | - | |||||||||
| Offering costs - Related Parties | - | - | - | |||||||||
| Accrued other expenses | 2,408 | 2,720 | 2,377 | |||||||||
| Total liabilities | 75,208 | 96,283 | 110,373 | |||||||||
| Commitments and Contingencies (Note 3) | ||||||||||||
| Net Assets | $ | 4,581,706 | $ | 2,070,450 | $ | 87,584,552 | ||||||
| Components of Net Assets: | ||||||||||||
| Paid-in capital (par value of $0.01 per share with an unlimited number of shares authorized) | $ | 10,110,800 | $ | 2,241,006 | $ | 78,110,029 | ||||||
| Total distributable earnings (accumulated deficit) | (5,529,094 | ) | (170,556 | ) | 9,474,523 | |||||||
| Net Assets | $ | 4,581,706 | $ | 2,070,450 | $ | 87,584,552 | ||||||
| Maximum Offering Price per Share: | ||||||||||||
| Investor Class: | ||||||||||||
| Net assets applicable to shares outstanding | $ | 130,613 | $ | 169,270 | $ | 624,397 | ||||||
| Shares of beneficial interest issued and outstanding | 14,405 | 13,238 | 42,949 | |||||||||
| Net asset value, offering and redemption price per share | $ | 9.07 | $ | 12.79 | $ | 14.54 | ||||||
See accompanying Notes to Financial Statements.
90
STATEMENTS OF ASSETS AND LIABILITIES - Continued
As of December 31, 2023
WCM China Quality Growth Fund | WCM Developing World Equity Fund | WCM International Equity Fund | ||||||||||
| Institutional Class: | ||||||||||||
| Net assets applicable to shares outstanding | $ | 4,451,093 | $ | 1,901,180 | $ | 86,960,155 | ||||||
| Shares of beneficial interest issued and outstanding | 488,165 | 148,329 | 5,950,747 | |||||||||
| Net asset value, offering and redemption price per share | $ | 9.12 | $ | 12.82 | $ | 14.61 | ||||||
See accompanying Notes to Financial Statements.
91
STATEMENTS OF ASSETS AND LIABILITIES - Continued
As of December 31, 2023
WCM Focused International Value Fund | WCM Focused International Opportunities Fund | WCM Mid Cap Quality Value Fund | ||||||||||
| Assets: | ||||||||||||
| Investments, at cost | $ | 9,916,976 | $ | 31,627,085 | $ | 760,248 | ||||||
| Foreign currency, at cost | - | - | - | |||||||||
| Investments, at value | $ | 10,944,472 | $ | 36,958,350 | $ | 917,123 | ||||||
| Foreign currency, at value | - | - | - | |||||||||
| Receivables: | ||||||||||||
| Fund shares sold | 149,976 | 62,795 | - | |||||||||
| Reclaims receivable | 24,509 | 21,100 | - | |||||||||
| Dividends and interest | 10,407 | 31,753 | 135 | |||||||||
| Due from Advisor | 14,639 | - | 26,244 | |||||||||
| Offering costs | - | - | - | |||||||||
| Prepaid expenses | 6,364 | 5,674 | 14,119 | |||||||||
| Total assets | 11,150,367 | 37,079,672 | 957,621 | |||||||||
| Liabilities: | ||||||||||||
| Payables: | ||||||||||||
| Investment securities purchased | - | - | - | |||||||||
| Fund shares redeemed | - | 35 | - | |||||||||
| Due to custodian | - | - | - | |||||||||
| Advisory fees | - | 8,016 | - | |||||||||
| Shareholder servicing fees (Note 7) | 1,843 | 2,746 | 510 | |||||||||
| Distribution fees (Note 8) | 6 | 30 | 3 | |||||||||
| Fund administration fees | 9,208 | 7,973 | 6,583 | |||||||||
| Fund accounting fees | 13,184 | 14,319 | 8,354 | |||||||||
| Transfer agent fees and expenses | 7,241 | 6,110 | 5,391 | |||||||||
| Custody fees | 5,334 | 21,812 | 483 | |||||||||
| Shareholder reporting fees | 2,938 | 4,547 | 226 | |||||||||
| Trustees' deferred compensation (Note 3) | 6,264 | 5,973 | 4,132 | |||||||||
| Trustees' fees and expenses | 2,212 | 4,389 | 1,464 | |||||||||
| Auditing fees | 20,000 | 20,000 | 19,450 | |||||||||
| Legal fees | 5,278 | 5,371 | 2,497 | |||||||||
| Chief Compliance Officer fees | 3,325 | 3,411 | 517 | |||||||||
| Offering costs - Advisor | - | - | - | |||||||||
| Non-U.S. Taxes | - | - | - | |||||||||
| Registration fees | - | - | - | |||||||||
| Offering costs - Related Parties | - | - | - | |||||||||
| Accrued other expenses | 3,619 | 3,407 | 606 | |||||||||
| Total liabilities | 80,452 | 108,139 | 50,216 | |||||||||
| Commitments and Contingencies (Note 3) | ||||||||||||
| Net Assets | $ | 11,069,915 | $ | 36,971,533 | $ | 907,405 | ||||||
| Components of Net Assets: | ||||||||||||
| Paid-in capital (par value of $0.01 per share with an unlimited number of shares authorized) | $ | 13,402,655 | $ | 39,299,823 | $ | 747,900 | ||||||
| Total distributable earnings (accumulated deficit) | (2,332,740 | ) | (2,328,290 | ) | 159,505 | |||||||
| Net Assets | $ | 11,069,915 | $ | 36,971,533 | $ | 907,405 | ||||||
| Maximum Offering Price per Share: | ||||||||||||
| Investor Class: | ||||||||||||
| Net assets applicable to shares outstanding | $ | 27,764 | $ | 142,373 | $ | 12,255 | ||||||
| Shares of beneficial interest issued and outstanding | 2,086 | 14,914 | 1,045 | |||||||||
| Net asset value, offering and redemption price per share | $ | 13.31 | $ | 9.55 | $ | 11.73 | ||||||
See accompanying Notes to Financial Statements.
92
STATEMENTS OF ASSETS AND LIABILITIES - Continued
As of December 31, 2023
WCM Focused International Value Fund | WCM Focused International Opportunities Fund | WCM Mid Cap Quality Value Fund | ||||||||||
| Institutional Class: | ||||||||||||
| Net assets applicable to shares outstanding | $ | 11,042,151 | $ | 36,829,160 | $ | 895,150 | ||||||
| Shares of beneficial interest issued and outstanding | 827,934 | 3,839,566 | 76,280 | |||||||||
| Net asset value, offering and redemption price per share | $ | 13.34 | $ | 9.59 | $ | 11.74 | ||||||
See accompanying Notes to Financial Statements.
93
STATEMENTS OF ASSETS AND LIABILITIES - Continued
As of December 31, 2023
WCM Focused Emerging Markets ex China Fund | WCM Quality Dividend Growth Fund | |||||||
| Assets: | ||||||||
| Investments, at cost | $ | 5,823,180 | $ | 6,315,760 | ||||
| Foreign currency, at cost | - | - | ||||||
| Investments, at value | $ | 6,570,445 | $ | 6,428,208 | ||||
| Foreign currency, at value | - | - | ||||||
| Receivables: | ||||||||
| Fund shares sold | - | - | ||||||
| Reclaims receivable | - | - | ||||||
| Dividends and interest | 7,482 | 5,432 | ||||||
| Due from Advisor | 32,577 | 17,549 | ||||||
| Offering costs | - | 6,952 | ||||||
| Prepaid expenses | 30,094 | 29,926 | ||||||
| Total assets | 6,640,598 | 6,488,067 | ||||||
| Liabilities: | ||||||||
| Payables: | ||||||||
| Investment securities purchased | - | - | ||||||
| Fund shares redeemed | - | - | ||||||
| Due to custodian | - | - | ||||||
| Advisory fees | - | - | ||||||
| Shareholder servicing fees (Note 7) | 1,219 | 555 | ||||||
| Distribution fees (Note 8) | 3 | 8 | ||||||
| Fund administration fees | 8,000 | 7,967 | ||||||
| Fund accounting fees | 11,659 | 2,167 | ||||||
| Transfer agent fees and expenses | 5,616 | 4,490 | ||||||
| Custody fees | 12,123 | 1,325 | ||||||
| Shareholder reporting fees | 5,901 | 1,916 | ||||||
| Trustees' deferred compensation (Note 3) | 3,479 | 1,010 | ||||||
| Trustees' fees and expenses | 2,646 | 549 | ||||||
| Auditing fees | 19,450 | 15,099 | ||||||
| Legal fees | 3,634 | 905 | ||||||
| Chief Compliance Officer fees | 1,006 | 1,168 | ||||||
| Offering costs - Advisor | - | 42,306 | ||||||
| Non-U.S. Taxes | 5,807 | - | ||||||
| Registration fees | - | - | ||||||
| Offering costs - Related Parties | - | 8,484 | ||||||
| Accrued other expenses | 617 | 642 | ||||||
| Total liabilities | 81,160 | 88,591 | ||||||
| Commitments and Contingencies (Note 3) | ||||||||
| Net Assets | $ | 6,559,438 | $ | 6,399,476 | ||||
| Components of Net Assets: | ||||||||
| Paid-in capital (par value of $0.01 per share with an unlimited number of shares authorized) | $ | 5,823,419 | $ | 6,285,165 | ||||
| Total distributable earnings (accumulated deficit) | 736,019 | 114,311 | ||||||
| Net Assets | $ | 6,559,438 | $ | 6,399,476 | ||||
| Maximum Offering Price per Share: | ||||||||
| Investor Class: | ||||||||
| Net assets applicable to shares outstanding | $ | 12,753 | $ | 48,326 | ||||
| Shares of beneficial interest issued and outstanding | 1,000 | 4,817 | ||||||
| Net asset value, offering and redemption price per share | $ | 12.75 | $ | 10.03 | ||||
| Institutional Class: | ||||||||
| Net assets applicable to shares outstanding | $ | 6,546,685 | $ | 6,351,150 | ||||
| Shares of beneficial interest issued and outstanding | 513,579 | 633,225 | ||||||
| Net asset value, offering and redemption price per share | $ | 12.75 | $ | 10.03 | ||||
See accompanying Notes to Financial Statements.
94
STATEMENTS OF OPERATIONS
For the Year/Period Ended December 31, 2023
WCM Focused International Growth Fund | WCM Focused Emerging Markets Fund | WCM Focused Global Growth Fund | ||||||||||
| Investment Income: | ||||||||||||
| Dividends (net of foreign withholding taxes of $16,821,656, $2,393,133 and $140,973, respectively) | $ | 158,777,394 | $ | 20,904,060 | $ | 2,540,769 | ||||||
| Interest | 23,357,465 | 3,390,246 | 448,014 | |||||||||
| Total investment income | 182,134,859 | 24,294,306 | 2,988,783 | |||||||||
| Expenses: | ||||||||||||
| Advisory fees | 144,867,949 | 14,063,958 | 2,792,499 | |||||||||
| Shareholder servicing fees (Note 7) | 16,954,006 | 888,644 | 293,129 | |||||||||
| Distribution fees (Note 8) | 1,827,127 | 293,295 | 40,905 | |||||||||
| Fund administration fees | 8,584,200 | 817,081 | 277,772 | |||||||||
| Fund accounting fees | 1,612,679 | 215,473 | 114,147 | |||||||||
| Transfer agent fees and expenses | 1,325,686 | 171,214 | 50,362 | |||||||||
| Custody fees | 2,564,276 | 1,228,469 | 54,565 | |||||||||
| Shareholder reporting fees | 779,469 | 206,724 | 41,625 | |||||||||
| Trustees' fees and expenses | 328,559 | 33,112 | 14,789 | |||||||||
| Registration fees | 132,494 | 142,000 | 73,034 | |||||||||
| Tax reclaim service fees | 94,312 | - | 158 | |||||||||
| Legal fees | 58,699 | 14,501 | 12,001 | |||||||||
| Insurance fees | 44,116 | 7,345 | 4,377 | |||||||||
| Miscellaneous | 37,084 | 21,184 | 3,787 | |||||||||
| Auditing fees | 20,357 | 20,358 | 20,358 | |||||||||
| Chief Compliance Officer fees | 10,822 | 6,322 | 5,322 | |||||||||
| Offering costs | - | - | - | |||||||||
| Tax expense | - | - | - | |||||||||
| Total expenses | 179,241,835 | 18,129,680 | 3,798,830 | |||||||||
| Advisory fees (waived) recovered | - | (256,439 | ) | (308,207 | ) | |||||||
| Other expenses (absorbed) | - | - | - | |||||||||
| Net expenses | 179,241,835 | 17,873,241 | 3,490,623 | |||||||||
| Net investment income (loss) | 2,893,024 | 6,421,065 | (501,840 | ) | ||||||||
| Realized and Unrealized Gain (Loss): | ||||||||||||
| Net realized gain (loss) on: | ||||||||||||
| Investments | 763,763,777 | (183,517,416 | ) | 3,460,062 | ||||||||
| Foreign currency transactions | (158,674 | ) | (744,413 | ) | (2,750 | ) | ||||||
| Deferred non-U.S. taxes | - | (472,255 | ) | - | ||||||||
| Net realized gain (loss) | 763,605,103 | (184,734,084 | ) | 3,457,312 | ||||||||
| Net change in unrealized appreciation (depreciation) on: | ||||||||||||
| Investments | 1,806,168,190 | 221,791,414 | 78,714,857 | |||||||||
| Foreign currency translations | 1,637,246 | (23,972 | ) | 5,631 | ||||||||
| Deferred non-U.S. taxes | - | (1,105,158 | ) | - | ||||||||
| Net change in unrealized appreciation (depreciation) | 1,807,805,436 | 220,662,284 | 78,720,488 | |||||||||
| Net realized and unrealized gain (loss) | 2,571,410,539 | 35,928,200 | 82,177,800 | |||||||||
| Net Increase (Decrease) in Net Assets from Operations | $ | 2,574,303,563 | $ | 42,349,265 | $ | 81,675,960 | ||||||
See accompanying Notes to Financial Statements.
95
STATEMENTS OF OPERATIONS - Continued
For the Year/Period Ended December 31, 2023
WCM International Small Cap Growth Fund | WCM Small Cap Growth Fund | WCM SMID Quality Value Fund | ||||||||||
| Investment Income: | ||||||||||||
| Dividends (net of foreign withholding taxes of $508,448, $0 and $0, respectively) | $ | 4,275,951 | $ | 146,277 | $ | 794,653 | ||||||
| Interest | 379,375 | 61,083 | 155,398 | |||||||||
| Total investment income | 4,655,326 | 207,360 | 950,051 | |||||||||
| Expenses: | ||||||||||||
| Advisory fees | 3,084,217 | 348,236 | 1,116,310 | |||||||||
| Shareholder servicing fees (Note 7) | 149,237 | 30,237 | 128,181 | |||||||||
| Distribution fees (Note 8) | - | 249 | 567 | |||||||||
| Fund administration fees | 256,840 | 54,912 | 154,965 | |||||||||
| Fund accounting fees | 137,022 | 65,364 | 93,874 | |||||||||
| Transfer agent fees and expenses | 29,962 | 37,547 | 44,457 | |||||||||
| Custody fees | 307,205 | 13,603 | 18,853 | |||||||||
| Shareholder reporting fees | 8,876 | 6,480 | 18,757 | |||||||||
| Trustees' fees and expenses | 15,205 | 7,702 | 8,581 | |||||||||
| Registration fees | 51,494 | 46,658 | 32,850 | |||||||||
| Tax reclaim service fees | 5,277 | - | - | |||||||||
| Legal fees | 16,001 | 10,063 | 13,083 | |||||||||
| Insurance fees | 4,433 | 3,780 | 3,969 | |||||||||
| Miscellaneous | 4,932 | 2,572 | 2,623 | |||||||||
| Auditing fees | 20,361 | 20,361 | 20,358 | |||||||||
| Chief Compliance Officer fees | 8,322 | 6,822 | 5,922 | |||||||||
| Offering costs | - | - | - | |||||||||
| Tax expense | - | - | - | |||||||||
| Total expenses | 4,099,384 | 654,586 | 1,663,350 | |||||||||
| Advisory fees (waived) recovered | (238,836 | ) | (306,101 | ) | (546,548 | ) | ||||||
| Other expenses (absorbed) | - | - | - | |||||||||
| Net expenses | 3,860,548 | 348,485 | 1,116,802 | |||||||||
| Net investment income (loss) | 794,778 | (141,125 | ) | (166,751 | ) | |||||||
| Realized and Unrealized Gain (Loss): | ||||||||||||
| Net realized gain (loss) on: | ||||||||||||
| Investments | (21,592,325 | ) | (1,606,715 | ) | (1,745,981 | ) | ||||||
| Foreign currency transactions | (39,602 | ) | - | - | ||||||||
| Deferred non-U.S. taxes | 4,942 | - | - | |||||||||
| Net realized gain (loss) | (21,626,985 | ) | (1,606,715 | ) | (1,745,981 | ) | ||||||
| Net change in unrealized appreciation (depreciation) on: | ||||||||||||
| Investments | 79,735,099 | 7,092,603 | 29,946,271 | |||||||||
| Foreign currency translations | 11,787 | - | - | |||||||||
| Deferred non-U.S. taxes | 4,681 | - | - | |||||||||
| Net change in unrealized appreciation (depreciation) | 79,751,567 | 7,092,603 | 29,946,271 | |||||||||
| Net realized and unrealized gain (loss) | 58,124,582 | 5,485,888 | 28,200,290 | |||||||||
| Net Increase (Decrease) in Net Assets from Operations | $ | 58,919,360 | $ | 5,344,763 | $ | 28,033,539 | ||||||
See accompanying Notes to Financial Statements.
96
STATEMENTS OF OPERATIONS - Continued
For the Year/Period Ended December 31, 2023
WCM China Quality Growth Fund | WCM Developing World Equity Fund | WCM International Equity Fund | ||||||||||
| Investment Income: | ||||||||||||
| Dividends (net of foreign withholding taxes of $5,149, $4,075 and $75,940, respectively) | $ | 116,916 | $ | 51,570 | $ | 1,357,348 | ||||||
| Interest | 7,686 | 2,823 | 207,514 | |||||||||
| Total investment income | 124,602 | 54,393 | 1,564,862 | |||||||||
| Expenses: | ||||||||||||
| Advisory fees | 62,418 | 22,276 | 615,408 | |||||||||
| Shareholder servicing fees (Note 7) | 4,127 | 2,927 | 71,325 | |||||||||
| Distribution fees (Note 8) | 321 | 831 | 1,292 | |||||||||
| Fund administration fees | 50,656 | 52,629 | 98,469 | |||||||||
| Fund accounting fees | 59,181 | 52,243 | 74,465 | |||||||||
| Transfer agent fees and expenses | 31,066 | 34,014 | 43,014 | |||||||||
| Custody fees | 39,563 | 71,101 | 56,023 | |||||||||
| Shareholder reporting fees | 2,000 | 6,888 | 6,401 | |||||||||
| Trustees' fees and expenses | 6,501 | 8,702 | 8,702 | |||||||||
| Registration fees | 30,002 | 50,760 | 51,013 | |||||||||
| Tax reclaim service fees | - | - | - | |||||||||
| Legal fees | 6,501 | 9,959 | 11,221 | |||||||||
| Insurance fees | 3,787 | 4,251 | 4,017 | |||||||||
| Miscellaneous | 3,501 | 5,446 | 6,084 | |||||||||
| Auditing fees | 20,358 | 20,357 | 19,807 | |||||||||
| Chief Compliance Officer fees | 5,322 | 5,322 | 5,322 | |||||||||
| Offering costs | - | - | - | |||||||||
| Tax expense | 122 | 35 | - | |||||||||
| Total expenses | 325,426 | 347,741 | 1,072,563 | |||||||||
| Advisory fees (waived) recovered | (62,418 | ) | (22,276 | ) | (324,822 | ) | ||||||
| Other expenses (absorbed) | (184,541 | ) | (297,932 | ) | - | |||||||
| Net expenses | 78,467 | 27,533 | 747,741 | |||||||||
| Net investment income (loss) | 46,135 | 26,860 | 817,121 | |||||||||
| Realized and Unrealized Gain (Loss): | ||||||||||||
| Net realized gain (loss) on: | ||||||||||||
| Investments | (1,109,834 | ) | (53,727 | ) | 3,168,786 | |||||||
| Foreign currency transactions | 777 | (159 | ) | (13,053 | ) | |||||||
| Deferred non-U.S. taxes | - | (109 | ) | - | ||||||||
| Net realized gain (loss) | (1,109,057 | ) | (53,995 | ) | 3,155,733 | |||||||
| Net change in unrealized appreciation (depreciation) on: | ||||||||||||
| Investments | (207,187 | ) | 165,415 | 5,476,438 | ||||||||
| Foreign currency translations | 5,363 | (24 | ) | 22 | ||||||||
| Deferred non-U.S. taxes | - | (1,698 | ) | - | ||||||||
| Net change in unrealized appreciation (depreciation) | (201,824 | ) | 163,693 | 5,476,460 | ||||||||
| Net realized and unrealized gain (loss) | (1,310,881 | ) | 109,698 | 8,632,193 | ||||||||
| Net Increase (Decrease) in Net Assets from Operations | $ | (1,264,746 | ) | $ | 136,558 | $ | 9,449,314 | |||||
See accompanying Notes to Financial Statements.
97
STATEMENTS OF OPERATIONS - Continued
For the Year/Period Ended December 31, 2023
WCM Focused International Value Fund | WCM Focused International Opportunities Fund | WCM Mid Cap Quality Value Fund | ||||||||||
| Investment Income: | ||||||||||||
| Dividends (net of foreign withholding taxes of $21,835, $49,015 and $0, respectively) | $ | 210,526 | $ | 378,559 | $ | 5,729 | ||||||
| Interest | 10,487 | 76,453 | 1,643 | |||||||||
| Total investment income | 221,013 | 455,012 | 7,372 | |||||||||
| Expenses: | ||||||||||||
| Advisory fees | 97,416 | 322,107 | 6,615 | |||||||||
| Shareholder servicing fees (Note 7) | 8,476 | 22,610 | 1,166 | |||||||||
| Distribution fees (Note 8) | 93 | 327 | 27 | |||||||||
| Fund administration fees | 58,815 | 51,688 | 54,365 | |||||||||
| Fund accounting fees | 59,812 | 64,291 | 53,356 | |||||||||
| Transfer agent fees and expenses | 35,065 | 32,697 | 39,775 | |||||||||
| Custody fees | 25,163 | 70,384 | 8,873 | |||||||||
| Shareholder reporting fees | 5,825 | 6,261 | 5,238 | |||||||||
| Trustees' fees and expenses | 8,311 | 9,001 | 7,681 | |||||||||
| Registration fees | 41,001 | 37,083 | 52,266 | |||||||||
| Tax reclaim service fees | - | - | - | |||||||||
| Legal fees | 9,752 | 7,905 | 15,786 | |||||||||
| Insurance fees | 3,709 | 5,308 | 3,099 | |||||||||
| Miscellaneous | 3,724 | 4,124 | 3,674 | |||||||||
| Auditing fees | 20,358 | 20,274 | 19,987 | |||||||||
| Chief Compliance Officer fees | 6,522 | 5,500 | 5,501 | |||||||||
| Offering costs | - | - | 6,578 | |||||||||
| Tax expense | 613 | - | 16 | |||||||||
| Total expenses | 384,655 | 659,560 | 284,003 | |||||||||
| Advisory fees (waived) recovered | (97,416 | ) | (256,598 | ) | (6,615 | ) | ||||||
| Other expenses (absorbed) | (143,275 | ) | - | (269,561 | ) | |||||||
| Net expenses | 143,964 | 402,962 | 7,827 | |||||||||
| Net investment income (loss) | 77,049 | 52,050 | (455 | ) | ||||||||
| Realized and Unrealized Gain (Loss): | ||||||||||||
| Net realized gain (loss) on: | ||||||||||||
| Investments | (1,238,711 | ) | 1,127,575 | 20,811 | ||||||||
| Foreign currency transactions | (709 | ) | (537 | ) | - | |||||||
| Deferred non-U.S. taxes | - | - | - | |||||||||
| Net realized gain (loss) | (1,239,420 | ) | 1,127,038 | 20,811 | ||||||||
| Net change in unrealized appreciation (depreciation) on: | ||||||||||||
| Investments | 3,215,035 | 6,192,532 | 174,542 | |||||||||
| Foreign currency translations | 516 | 1,156 | - | |||||||||
| Deferred non-U.S. taxes | - | - | - | |||||||||
| Net change in unrealized appreciation (depreciation) | 3,215,551 | 6,193,688 | 174,542 | |||||||||
| Net realized and unrealized gain (loss) | 1,976,131 | 7,320,726 | 195,353 | |||||||||
| Net Increase (Decrease) in Net Assets from Operations | $ | 2,053,180 | $ | 7,372,776 | $ | 194,898 | ||||||
See accompanying Notes to Financial Statements.
98
STATEMENTS OF OPERATIONS - Continued
For the Year/Period Ended December 31, 2023
| WCM Focused Emerging Markets ex China Fund | WCM Quality Dividend Growth Fund* | |||||||
| Investment Income: | ||||||||
| Dividends (net of foreign withholding taxes of $3,855 and $279, respectively) | $ | 27,529 | $ | 7,802 | ||||
| Interest | 8,584 | 3,565 | ||||||
| Total investment income | 36,113 | 11,367 | ||||||
| Expenses: | ||||||||
| Advisory fees | 21,078 | 2,530 | ||||||
| Shareholder servicing fees (Note 7) | 3,137 | 555 | ||||||
| Distribution fees (Note 8) | 28 | 17 | ||||||
| Fund administration fees | 54,196 | 23,397 | ||||||
| Fund accounting fees | 53,812 | 12,922 | ||||||
| Transfer agent fees and expenses | 37,005 | 13,369 | ||||||
| Custody fees | 47,717 | 2,627 | ||||||
| Shareholder reporting fees | 9,989 | 2,025 | ||||||
| Trustees' fees and expenses | 10,100 | 2,125 | ||||||
| Registration fees | 53,870 | 16,028 | ||||||
| Tax reclaim service fees | - | - | ||||||
| Legal fees | 13,001 | 4,274 | ||||||
| Insurance fees | 3,605 | 536 | ||||||
| Miscellaneous | 4,967 | 972 | ||||||
| Auditing fees | 19,450 | 15,099 | ||||||
| Chief Compliance Officer fees | 5,899 | 2,351 | ||||||
| Offering costs | 10,596 | 5,189 | ||||||
| Tax expense | - | - | ||||||
| Total expenses | 348,450 | 104,016 | ||||||
| Advisory fees (waived) recovered | (21,078 | ) | (2,530 | ) | ||||
| Other expenses (absorbed) | (300,994 | ) | (97,615 | ) | ||||
| Net expenses | 26,378 | 3,871 | ||||||
| Net investment income (loss) | 9,735 | 7,496 | ||||||
| Realized and Unrealized Gain (Loss): | ||||||||
| Net realized gain (loss) on: | ||||||||
| Investments | 2,557 | (1,823 | ) | |||||
| Foreign currency transactions | (1,930 | ) | - | |||||
| Deferred non-U.S. taxes | 2,399 | - | ||||||
| Net realized gain (loss) | 3,026 | (1,823 | ) | |||||
| Net change in unrealized appreciation (depreciation) on: | ||||||||
| Investments | 751,629 | 112,448 | ||||||
| Foreign currency translations | 271 | - | ||||||
| Deferred non-U.S. taxes | (8,205 | ) | - | |||||
| Net change in unrealized appreciation (depreciation) | 743,695 | 112,448 | ||||||
| Net realized and unrealized gain (loss) | 746,721 | 110,625 | ||||||
| Net Increase (Decrease) in Net Assets from Operations | $ | 756,456 | $ | 118,121 | ||||
* | Commencement of operations July 28, 2023. |
See accompanying Notes to Financial Statements.
99
WCM Focused International Growth Fund
STATEMENTS OF CHANGES IN NET ASSETS
| For the Year Ended December 31, 2023 | For the Period May 1, 2022 through December 31, 2022^ | For the Year Ended April 30, 2022 | ||||||||||
| Increase (Decrease) in Net Assets from: | ||||||||||||
| Operations: | ||||||||||||
| Net investment income (loss) | $ | 2,893,024 | $ | (11,578,363 | ) | $ | (115,159,193 | ) | ||||
| Net realized gain (loss) on investments and foreign currency transactions | 763,605,103 | (309,782,636 | ) | 593,986,724 | ||||||||
| Net change in unrealized appreciation (depreciation) on investments and foreign currency translations | 1,807,805,436 | (671,781,740 | ) | (5,071,772,367 | ) | |||||||
| Net increase (decrease) in net assets resulting from operations | 2,574,303,563 | (993,142,739 | ) | (4,592,944,836 | ) | |||||||
| Distributions to Shareholders: | ||||||||||||
| Investor Class | (4,773,700 | ) | (792,458 | ) | (82,734,321 | ) | ||||||
| Institutional Class | (109,632,069 | ) | (16,408,459 | ) | (1,198,249,547 | ) | ||||||
| Total distributions to shareholders | (114,405,769 | ) | (17,200,917 | ) | (1,280,983,868 | ) | ||||||
| Capital Transactions: | ||||||||||||
| Net proceeds from shares sold: | ||||||||||||
| Investor Class | 62,428,701 | 27,358,771 | 518,278,322 | |||||||||
| Institutional Class | 2,042,924,436 | 1,609,897,154 | 5,873,297,782 | |||||||||
| Reinvestment of distributions: | ||||||||||||
| Investor Class | 4,757,567 | 790,531 | 82,592,645 | |||||||||
| Institutional Class | 98,628,972 | 14,876,353 | 1,094,411,720 | |||||||||
| Cost of shares redeemed: | ||||||||||||
| Investor Class | (143,595,486 | ) | (379,789,348 | ) | (665,394,020 | ) | ||||||
| Institutional Class | (3,133,246,250 | ) | (4,366,488,358 | ) | (5,269,046,333 | ) | ||||||
| Net increase (decrease) in net assets from capital transactions | (1,068,102,060 | ) | (3,093,354,897 | ) | 1,634,140,116 | |||||||
| Total increase (decrease) in net assets | 1,391,795,734 | (4,103,698,553 | ) | (4,239,788,588 | ) | |||||||
| Net Assets: | ||||||||||||
| Beginning of period | 16,085,885,112 | 20,189,583,665 | 24,429,372,253 | |||||||||
| End of period | $ | 17,477,680,846 | $ | 16,085,885,112 | $ | 20,189,583,665 | ||||||
| Capital Share Transactions: | ||||||||||||
| Shares sold: | ||||||||||||
| Investor Class | 2,936,995 | 1,436,244 | 19,728,497 | |||||||||
| Institutional Class | 95,056,126 | 83,127,015 | 222,042,533 | |||||||||
| Shares reinvested: | ||||||||||||
| Investor Class | 222,733 | 39,448 | 3,033,149 | |||||||||
| Institutional Class | 4,553,507 | 734,273 | 39,840,252 | |||||||||
| Shares redeemed: | ||||||||||||
| Investor Class | (6,849,770 | ) | (19,852,887 | ) | (27,769,262 | ) | ||||||
| Institutional Class | (146,101,259 | ) | (225,753,828 | ) | (211,447,870 | ) | ||||||
| Total increase (decrease) in capital share transactions | (50,181,668 | ) | (160,269,735 | ) | 45,427,299 | |||||||
| ^ | Fiscal year end changed to December 31, effective December 14, 2022. |
See accompanying Notes to Financial Statements.
100
WCM Focused Emerging Markets Fund
STATEMENTS OF CHANGES IN NET ASSETS
For the Year Ended | For the Period May 1, 2022 through December 31, 2022^ | For the Year Ended April 30, 2022 | ||||||||||
| Increase (Decrease) in Net Assets from: | ||||||||||||
| Operations: | ||||||||||||
| Net investment income (loss) | $ | 6,421,065 | $ | 3,596,479 | $ | (8,848,539 | ) | |||||
| Net realized gain (loss) on investments, foreign currency transactions and deferred non-U.S. taxes | (184,734,084 | ) | (270,240,147 | ) | (95,768,875 | ) | ||||||
| Net change in unrealized appreciation (depreciation) on investments, foreign currency translations and deferred non-U.S. taxes | 220,662,284 | 111,809,232 | (570,888,628 | ) | ||||||||
| Net increase (decrease) in net assets resulting from operations | 42,349,265 | (154,834,436 | ) | (675,506,042 | ) | |||||||
| Distributions to Shareholders: | ||||||||||||
| Investor Class | (145,271 | ) | (401,049 | ) | (2,826,823 | ) | ||||||
| Institutional Class | (5,200,854 | ) | (6,139,190 | ) | (100,035,505 | ) | ||||||
| Total distributions to shareholders | (5,346,125 | ) | (6,540,239 | ) | (102,862,328 | ) | ||||||
| Capital Transactions: | ||||||||||||
| Net proceeds from shares sold: | ||||||||||||
| Investor Class | 47,653,924 | 227,079,228 | 260,506,831 | |||||||||
| Institutional Class | 473,405,303 | 535,438,659 | 1,469,353,271 | |||||||||
| Reinvestment of distributions: | ||||||||||||
| Investor Class | 142,205 | 383,681 | 2,578,231 | |||||||||
| Institutional Class | 4,078,836 | 4,852,399 | 82,871,311 | |||||||||
| Cost of shares redeemed: | ||||||||||||
| Investor Class | (86,427,426 | ) | (236,672,893 | ) | (145,368,858 | ) | ||||||
| Institutional Class | (719,949,030 | ) | (793,473,817 | ) | (1,204,460,353 | ) | ||||||
| Net increase (decrease) in net assets from capital transactions | (281,096,188 | ) | (262,392,743 | ) | 465,480,433 | |||||||
| Total increase (decrease) in net assets | (244,093,048 | ) | (423,767,418 | ) | (312,887,937 | ) | ||||||
| Net Assets: | ||||||||||||
| Beginning of period | 1,434,916,693 | 1,858,684,111 | 2,171,572,048 | |||||||||
| End of period | $ | 1,190,823,645 | $ | 1,434,916,693 | $ | 1,858,684,111 | ||||||
| Capital Share Transactions: | ||||||||||||
| Shares sold: | ||||||||||||
| Investor Class | 3,801,352 | 18,212,188 | 16,099,076 | |||||||||
| Institutional Class | 35,950,382 | 41,082,828 | 78,903,465 | |||||||||
| Shares reinvested: | ||||||||||||
| Investor Class | 11,286 | 29,952 | 138,095 | |||||||||
| Institutional Class | 320,160 | 374,414 | 4,391,696 | |||||||||
| Shares redeemed: | ||||||||||||
| Investor Class | (6,936,959 | ) | (18,486,564 | ) | (8,907,137 | ) | ||||||
| Institutional Class | (55,689,766 | ) | (61,068,269 | ) | (67,542,974 | ) | ||||||
| Total increase (decrease) in capital share transactions | (22,543,545 | ) | (19,855,451 | ) | 23,082,221 | |||||||
| ^ | Fiscal year end changed to December 31, effective December 14, 2022. |
See accompanying Notes to Financial Statements.
101
WCM Focused Global Growth Fund
STATEMENTS OF CHANGES IN NET ASSETS
For the Year Ended | For the Period May 1, 2022 through December 31, 2022^ | For the Year Ended April 30, 2022 | ||||||||||
| Increase (Decrease) in Net Assets from: | ||||||||||||
| Operations: | ||||||||||||
| Net investment income (loss) | $ | (501,840 | ) | $ | (283,830 | ) | $ | (2,930,553 | ) | |||
| Net realized gain (loss) on investments and foreign currency transactions | 3,457,312 | (24,013,288 | ) | 28,741,903 | ||||||||
| Net change in unrealized appreciation (depreciation) on investments and foreign currency translations | 78,720,488 | (7,365,123 | ) | (126,836,766 | ) | |||||||
| Net increase (decrease) in net assets resulting from operations | 81,675,960 | (31,662,241 | ) | (101,025,416 | ) | |||||||
| Distributions to Shareholders: | ||||||||||||
| Investor Class | - | (472,100 | ) | (2,212,086 | ) | |||||||
| Institutional Class | - | (10,182,529 | ) | (53,428,250 | ) | |||||||
| Total distributions to shareholders | - | (10,654,629 | ) | (55,640,336 | ) | |||||||
| Capital Transactions: | ||||||||||||
| Net proceeds from shares sold: | ||||||||||||
| Investor Class | 38,069,550 | 2,112,178 | 6,366,794 | |||||||||
| Institutional Class | 116,823,566 | 95,208,490 | 280,075,915 | |||||||||
| Reinvestment of distributions: | ||||||||||||
| Investor Class | - | 471,972 | 2,212,087 | |||||||||
| Institutional Class | - | 10,162,459 | 53,350,711 | |||||||||
| Cost of shares redeemed: | ||||||||||||
| Investor Class | (16,897,202 | ) | (4,373,731 | ) | (7,873,611 | ) | ||||||
| Institutional Class | (83,265,452 | ) | (225,296,291 | ) | (212,504,626 | ) | ||||||
| Net increase (decrease) in net assets from capital transactions | 54,730,462 | (121,714,923 | ) | 121,627,270 | ||||||||
| Total increase (decrease) in net assets | 136,406,422 | (164,031,793 | ) | (35,038,482 | ) | |||||||
| Net Assets: | ||||||||||||
| Beginning of period | 290,380,517 | 454,412,310 | 489,450,792 | |||||||||
| End of period | $ | 426,786,939 | $ | 290,380,517 | $ | 454,412,310 | ||||||
| Capital Share Transactions: | ||||||||||||
| Shares sold: | ||||||||||||
| Investor Class | 1,915,129 | 117,851 | 257,604 | |||||||||
| Institutional Class | 6,013,394 | 5,227,604 | 11,465,445 | |||||||||
| Shares reinvested: | ||||||||||||
| Investor Class | - | 27,297 | 87,469 | |||||||||
| Institutional Class | - | 574,475 | 2,067,857 | |||||||||
| Shares redeemed: | ||||||||||||
| Investor Class | (859,871 | ) | (244,461 | ) | (324,608 | ) | ||||||
| Institutional Class | (4,313,378 | ) | (12,403,606 | ) | (9,086,122 | ) | ||||||
| Total increase (decrease) in capital share transactions | 2,755,274 | (6,700,840 | ) | 4,467,645 | ||||||||
| ^ | Fiscal year end changed to December 31, effective December 14, 2022. |
See accompanying Notes to Financial Statements.
102
WCM International Small Cap Growth Fund
STATEMENTS OF CHANGES IN NET ASSETS
For the Year Ended | For the Period May 1, 2022 through December 31, 2022^ | For the Year Ended April 30, 2022 | ||||||||||
| Increase (Decrease) in Net Assets from: | ||||||||||||
| Operations: | ||||||||||||
| Net investment income (loss) | $ | 794,778 | $ | (523,517 | ) | $ | (5,272,499 | ) | ||||
| Net realized gain (loss) on investments, foreign currency transactions and deferred non-U.S. taxes | (21,626,985 | ) | (107,950,422 | ) | 24,558,174 | |||||||
| Net change in unrealized appreciation (depreciation) on investments, foreign currency translations and deferred non-U.S. taxes | 79,751,567 | 19,722,278 | (189,687,801 | ) | ||||||||
| Net increase (decrease) in net assets resulting from operations | 58,919,360 | (88,751,661 | ) | (170,402,126 | ) | |||||||
| Distributions to Shareholders: | ||||||||||||
| Distributions | - | - | (85,948,627 | ) | ||||||||
| Total distributions to shareholders | - | - | (85,948,627 | ) | ||||||||
| Capital Transactions: | ||||||||||||
| Net proceeds from shares sold: | ||||||||||||
| Institutional class | 59,162,686 | 47,611,724 | 254,552,436 | |||||||||
| Reinvestment of distributions: | ||||||||||||
| Institutional class | - | - | 85,596,317 | |||||||||
| Cost of shares redeemed: | ||||||||||||
| Institutional class | (99,859,894 | ) | (198,878,717 | ) | (319,026,110 | ) | ||||||
| Net increase (decrease) in net assets from capital transactions | (40,697,208 | ) | (151,266,993 | ) | 21,122,643 | |||||||
| Total increase (decrease) in net assets | 18,222,152 | (240,018,654 | ) | (235,228,110 | ) | |||||||
| Net Assets: | ||||||||||||
| Beginning of period | 293,249,669 | 533,268,323 | 768,496,433 | |||||||||
| End of period | $ | 311,471,821 | $ | 293,249,669 | $ | 533,268,323 | ||||||
| Capital Share Transactions: | ||||||||||||
| Shares sold: | ||||||||||||
| Institutional class | 3,271,893 | 2,856,246 | 8,844,760 | |||||||||
| Shares reinvested: | ||||||||||||
| Institutional class | - | - | 3,022,469 | |||||||||
| Shares redeemed: | ||||||||||||
| Institutional class | (5,603,941 | ) | (11,443,636 | ) | (12,334,192 | ) | ||||||
| Total increase (decrease) in capital share transactions | (2,332,048 | ) | (8,587,390 | ) | (466,963 | ) | ||||||
| ^ | Fiscal year end changed to December 31, effective December 14, 2022. |
See accompanying Notes to Financial Statements.
103
WCM Small Cap Growth Fund
STATEMENTS OF CHANGES IN NET ASSETS
For the Year Ended | For the Period May 1, 2022 through December 31, 2022^ | For the Year Ended April 30, 2022 | ||||||||||
| Increase (Decrease) in Net Assets from: | ||||||||||||
| Operations: | ||||||||||||
| Net investment income (loss) | $ | (141,125 | ) | $ | (143,433 | ) | $ | (465,789 | ) | |||
| Net realized gain (loss) on investments | (1,606,715 | ) | (4,471,823 | ) | 2,964,759 | |||||||
| Net change in unrealized appreciation (depreciation) on investments | 7,092,603 | 2,654,126 | (15,542,258 | ) | ||||||||
| Net increase (decrease) in net assets resulting from operations | 5,344,763 | (1,961,130 | ) | (13,043,288 | ) | |||||||
| Distributions to Shareholders: | ||||||||||||
| Investor Class | - | (169 | ) | (8,947 | ) | |||||||
| Institutional Class | - | (59,625 | ) | (4,642,991 | ) | |||||||
| Total distributions to shareholders | - | (59,794 | ) | (4,651,938 | ) | |||||||
| Capital Transactions: | ||||||||||||
| Net proceeds from shares sold: | ||||||||||||
| Investor Class | 7,701 | 20,200 | 39,675 | |||||||||
| Institutional Class | 11,287,486 | 13,564,948 | 16,781,334 | |||||||||
| Reinvestment of distributions: | ||||||||||||
| Investor Class | - | 169 | 8,947 | |||||||||
| Institutional Class | - | 59,607 | 4,642,991 | |||||||||
| Cost of shares redeemed: | ||||||||||||
| Investor Class | (9,516 | ) | (1,825 | ) | (14,170 | ) | ||||||
| Institutional Class | (9,113,726 | ) | (19,128,791 | ) | (21,489,079 | ) | ||||||
| Net increase (decrease) in net assets from capital transactions | 2,171,945 | (5,485,692 | ) | (30,302 | ) | |||||||
| Total increase (decrease) in net assets | 7,516,708 | (7,506,616 | ) | (17,725,528 | ) | |||||||
| Net Assets: | ||||||||||||
| Beginning of period | 33,010,349 | 40,516,965 | 58,242,493 | |||||||||
| End of period | $ | 40,527,057 | $ | 33,010,349 | $ | 40,516,965 | ||||||
| Capital Share Transactions: | ||||||||||||
| Shares sold: | ||||||||||||
| Investor Class | 680 | 1,899 | 2,576 | |||||||||
| Institutional Class | 969,780 | 1,268,547 | 1,276,872 | |||||||||
| Shares reinvested: | ||||||||||||
| Investor Class | - | 16 | 640 | |||||||||
| Institutional Class | - | 5,504 | 330,227 | |||||||||
| Shares redeemed: | ||||||||||||
| Investor Class | (859 | ) | (174 | ) | (993 | ) | ||||||
| Institutional Class | (786,092 | ) | (1,832,463 | ) | (1,643,613 | ) | ||||||
| Total increase (decrease) in capital share transactions | 183,509 | (556,671 | ) | (34,291 | ) | |||||||
| ^ | Fiscal year end changed to December 31, effective December 14, 2022. |
See accompanying Notes to Financial Statements.
104
WCM SMID Quality Value Fund
STATEMENTS OF CHANGES IN NET ASSETS
For the Year Ended December 31, 2023 | For the Period May 1, 2022 through December 31, 2022^ | For the Year Ended April 30, 2022 | ||||||||||
| Increase (Decrease) in Net Assets from: | ||||||||||||
| Operations: | ||||||||||||
| Net investment income (loss) | $ | (166,751 | ) | $ | (218,677 | ) | $ | (506,679 | ) | |||
| Net realized gain (loss) on investments | (1,745,981 | ) | 1,598,172 | 6,151,683 | ||||||||
| Net change in unrealized appreciation (depreciation) on investments | 29,946,271 | (3,955,382 | ) | (15,414,433 | ) | |||||||
| Net increase (decrease) in net assets resulting from operations | 28,033,539 | (2,575,887 | ) | (9,769,429 | ) | |||||||
| Distributions to Shareholders: | ||||||||||||
| Investor Class | (1,936 | ) | (3,547 | ) | (11,632 | ) | ||||||
| Institutional Class | (1,131,847 | ) | (1,978,746 | ) | (6,732,771 | ) | ||||||
| Total distributions to shareholders | (1,133,783 | ) | (1,982,293 | ) | (6,744,403 | ) | ||||||
| Capital Transactions: | ||||||||||||
| Net proceeds from shares sold: | ||||||||||||
| Investor Class | 31,988 | 41,801 | 41,311 | |||||||||
| Institutional Class | 15,433,355 | 30,891,842 | 20,185,465 | |||||||||
| Reinvestment of distributions: | ||||||||||||
| Investor Class | 1,936 | 3,547 | 11,632 | |||||||||
| Institutional Class | 795,866 | 1,578,375 | 5,850,536 | |||||||||
| Cost of shares redeemed: | ||||||||||||
| Investor Class | (32,111 | ) | (12,679 | ) | (17,470 | ) | ||||||
| Institutional Class | (18,217,619 | ) | (8,986,247 | ) | (9,774,983 | ) | ||||||
| Net increase (decrease) in net assets from capital transactions | (1,986,585 | ) | 23,516,639 | 16,296,491 | ||||||||
| Total increase (decrease) in net assets | 24,913,171 | 18,958,459 | (217,341 | ) | ||||||||
| Net Assets: | ||||||||||||
| Beginning of period | 118,169,709 | 99,211,250 | 99,428,591 | |||||||||
| End of period | $ | 143,082,880 | $ | 118,169,709 | $ | 99,211,250 | ||||||
| Capital Share Transactions: | ||||||||||||
| Shares sold: | ||||||||||||
| Investor Class | 2,817 | 4,378 | 3,554 | |||||||||
| Institutional Class | 1,395,640 | 3,052,176 | 1,740,069 | |||||||||
| Shares reinvested: | ||||||||||||
| Investor Class | 171 | 358 | 1,022 | |||||||||
| Institutional Class | 69,630 | 157,837 | 510,518 | |||||||||
| Shares redeemed: | ||||||||||||
| Investor Class | (2,924 | ) | (1,256 | ) | (1,492 | ) | ||||||
| Institutional Class | (1,657,311 | ) | (882,030 | ) | (865,414 | ) | ||||||
| Total increase (decrease) in capital share transactions | (191,977 | ) | 2,331,463 | 1,388,257 | ||||||||
| ^ | Fiscal year end changed to December 31, effective December 14, 2022. |
See accompanying Notes to Financial Statements.
105
WCM China Quality Growth Fund
STATEMENTS OF CHANGES IN NET ASSETS
For the Year Ended | For the Period May 1, 2022 through December 31, 2022^ | For the Year Ended April 30, 2022 | ||||||||||
| Increase (Decrease) in Net Assets from: | ||||||||||||
| Operations: | ||||||||||||
| Net investment income (loss) | $ | 46,135 | $ | 35,813 | $ | (61,345 | ) | |||||
| Net realized gain (loss) on investments and foreign currency transactions | (1,109,057 | ) | (2,380,172 | ) | (913,731 | ) | ||||||
| Net change in unrealized appreciation (depreciation) on investments and foreign currency translations | (201,824 | ) | 1,998,077 | (4,354,363 | ) | |||||||
| Net increase (decrease) in net assets resulting from operations | (1,264,746 | ) | (346,282 | ) | (5,329,439 | ) | ||||||
| Distributions to Shareholders: | ||||||||||||
| Investor Class | (975 | ) | (224 | ) | (15,604 | ) | ||||||
| Institutional Class | (48,015 | ) | (20,988 | ) | (1,232,777 | ) | ||||||
| Total distributions to shareholders | (48,990 | ) | (21,212 | ) | (1,248,381 | ) | ||||||
| Capital Transactions: | ||||||||||||
| Net proceeds from shares sold: | ||||||||||||
| Investor Class | 33,494 | 23,591 | 117,302 | |||||||||
| Institutional Class | 943,910 | 521,178 | 6,652,617 | |||||||||
| Reinvestment of distributions: | ||||||||||||
| Investor Class | 975 | 223 | 15,604 | |||||||||
| Institutional Class | 48,015 | 20,988 | 1,232,777 | |||||||||
| Cost of shares redeemed: | ||||||||||||
| Investor Class | (38,532 | ) | (4,680 | ) | (85,426 | ) | ||||||
| Institutional Class | (2,098,681 | ) | (3,954,160 | ) | (4,369,953 | ) | ||||||
| Net increase (decrease) in net assets from capital transactions | (1,110,819 | ) | (3,392,860 | ) | 3,562,921 | |||||||
| Total increase (decrease) in net assets | (2,424,555 | ) | (3,760,354 | ) | (3,014,899 | ) | ||||||
| Net Assets: | ||||||||||||
| Beginning of period | 7,006,261 | 10,766,615 | 13,781,514 | |||||||||
| End of period | $ | 4,581,706 | $ | 7,006,261 | $ | 10,766,615 | ||||||
| Capital Share Transactions: | ||||||||||||
| Shares sold: | ||||||||||||
| Investor Class | 3,398 | 2,095 | 7,274 | |||||||||
| Institutional Class | 83,314 | 46,094 | 396,078 | |||||||||
| Shares reinvested: | ||||||||||||
| Investor Class | 109 | 21 | 994 | |||||||||
| Institutional Class | 5,317 | 1,910 | 78,172 | |||||||||
| Shares redeemed: | ||||||||||||
| Investor Class | (3,097 | ) | (448 | ) | (5,743 | ) | ||||||
| Institutional Class | (207,646 | ) | (385,449 | ) | (281,405 | ) | ||||||
| Total increase (decrease) in capital share transactions | (118,605 | ) | (335,777 | ) | 195,370 | |||||||
| ^ | Fiscal year end changed to December 31, effective December 14, 2022. |
See accompanying Notes to Financial Statements.
106
WCM Developing World Equity Fund
STATEMENTS OF CHANGES IN NET ASSETS
For the Year Ended | For the Period May 1, 2022 through December 31, 2022^ | For the Year Ended April 30, 2022 | ||||||||||
| Increase (Decrease) in Net Assets from: | ||||||||||||
| Operations: | ||||||||||||
| Net investment income (loss) | $ | 26,860 | $ | 19,558 | $ | 9,991 | ||||||
| Net realized gain (loss) on investments, foreign currency transactions and deferred non-U.S. taxes | (53,995 | ) | (200,948 | ) | (1,826 | ) | ||||||
| Net change in unrealized appreciation (depreciation) on investments, foreign currency translations and deferred non-U.S. taxes | 163,693 | 85,562 | (380,050 | ) | ||||||||
| Net increase (decrease) in net assets resulting from operations | 136,558 | (95,828 | ) | (371,885 | ) | |||||||
| Distributions to Shareholders: | ||||||||||||
| Investor Class | (1,623 | ) | (1,741 | ) | (1,061 | ) | ||||||
| Institutional Class | (27,320 | ) | (23,193 | ) | (95,777 | ) | ||||||
| Total distributions to shareholders | (28,943 | ) | (24,934 | ) | (96,838 | ) | ||||||
| Capital Transactions: | ||||||||||||
| Net proceeds from shares sold: | ||||||||||||
| Investor Class | 223,526 | 284,586 | 15,600 | |||||||||
| Institutional Class | 94,881 | 145,906 | 1,961,578 | |||||||||
| Reinvestment of distributions: | ||||||||||||
| Investor Class | 1,623 | 1,741 | 1,061 | |||||||||
| Institutional Class | 27,320 | 23,194 | 95,777 | |||||||||
| Cost of shares redeemed: | ||||||||||||
| Investor Class | (390,910 | ) | (5,109 | ) | (162 | ) | ||||||
| Institutional Class | (210,515 | ) | (914,794 | ) | (321,057 | ) | ||||||
| Net increase (decrease) in net assets from capital transactions | (254,075 | ) | (464,476 | ) | 1,752,797 | |||||||
| Total increase (decrease) in net assets | (146,460 | ) | (585,238 | ) | 1,284,074 | |||||||
| Net Assets: | ||||||||||||
| Beginning of period | 2,216,910 | 2,802,148 | 1,518,074 | |||||||||
| End of period | $ | 2,070,450 | $ | 2,216,910 | $ | 2,802,148 | ||||||
| Capital Share Transactions: | ||||||||||||
| Shares sold: | ||||||||||||
| Investor Class | 17,642 | 24,038 | 1,118 | |||||||||
| Institutional Class | 7,415 | 12,110 | 132,677 | |||||||||
| Shares reinvested: | ||||||||||||
| Investor Class | 132 | 144 | 75 | |||||||||
| Institutional Class | 2,227 | 1,906 | 6,769 | |||||||||
| Shares redeemed: | ||||||||||||
| Investor Class | (31,033 | ) | (426 | ) | (11 | ) | ||||||
| Institutional Class | (16,941 | ) | (73,227 | ) | (23,235 | ) | ||||||
| Total increase (decrease) in capital share transactions | (20,558 | ) | (35,455 | ) | 117,393 | |||||||
| ^ | Fiscal year end changed to December 31, effective December 14, 2022. |
See accompanying Notes to Financial Statements.
107
WCM International Equity Fund
STATEMENTS OF CHANGES IN NET ASSETS
For the Year Ended | For the Period May 1, 2022 through December 31, 2022^ | For the Year Ended April 30, 2022 | ||||||||||
| Increase (Decrease) in Net Assets from: | ||||||||||||
| Operations: | �� | |||||||||||
| Net investment income (loss) | $ | 817,121 | $ | 4,069 | $ | 19,437 | ||||||
| Net realized gain (loss) on investments and foreign currency transactions | 3,155,733 | (220,709 | ) | 69,985 | ||||||||
| Net change in unrealized appreciation (depreciation) on investments and foreign currency translations | 5,476,460 | 3,104,596 | (384,425 | ) | ||||||||
| Net increase (decrease) in net assets resulting from operations | 9,449,314 | 2,887,956 | (295,003 | ) | ||||||||
| Distributions to Shareholders: | ||||||||||||
| Investor Class | (19,199 | ) | (51 | ) | (620 | ) | ||||||
| Institutional Class | (2,737,224 | ) | (17,350 | ) | (117,649 | ) | ||||||
| Total distributions to shareholders | (2,756,423 | ) | (17,401 | ) | (118,269 | ) | ||||||
| Capital Transactions: | ||||||||||||
| Net proceeds from shares sold: | ||||||||||||
| Investor Class | 417,611 | 299,115 | 35,420 | |||||||||
| Institutional Class | 23,429,580 | 52,042,884 | 2,282,401 | |||||||||
| Reinvestment of distributions: | ||||||||||||
| Investor Class | 19,200 | 52 | 620 | |||||||||
| Institutional Class | 2,737,033 | 17,350 | 117,649 | |||||||||
| Cost of shares redeemed: | ||||||||||||
| Investor Class | (179,470 | ) | (10,000 | ) | (26,166 | ) | ||||||
| Institutional Class | (5,280,623 | ) | (226,294 | ) | (10,000 | ) | ||||||
| Net increase (decrease) in net assets from capital transactions | 21,143,331 | 52,123,107 | 2,399,924 | |||||||||
| Total increase (decrease) in net assets | 27,836,222 | 54,993,662 | 1,986,652 | |||||||||
| Net Assets: | ||||||||||||
| Beginning of period | 59,748,330 | 4,754,668 | 2,768,016 | |||||||||
| End of period | $ | 87,584,552 | $ | 59,748,330 | $ | 4,754,668 | ||||||
| Capital Share Transactions: | ||||||||||||
| Shares sold: | ||||||||||||
| Investor Class | 29,606 | 23,549 | 2,350 | |||||||||
| Institutional Class | 1,640,509 | 4,151,994 | 154,992 | |||||||||
| Shares reinvested: | ||||||||||||
| Investor Class | 1,390 | 3 | 41 | |||||||||
| Institutional Class | 197,193 | 1,302 | 7,812 | |||||||||
| Shares redeemed: | ||||||||||||
| Investor Class | (12,546 | ) | (759 | ) | (1,808 | ) | ||||||
| Institutional Class | (369,003 | ) | (17,741 | ) | (669 | ) | ||||||
| Total increase (decrease) in capital share transactions | 1,487,149 | 4,158,348 | 162,718 | |||||||||
| ^ | Fiscal year end changed to December 31, effective December 14, 2022. |
See accompanying Notes to Financial Statements.
108
WCM Focused International Value Fund
STATEMENTS OF CHANGES IN NET ASSETS
For the Year Ended | For the Period May 1, 2022 through December 31, 2022^ | For the Year Ended April 30, 2022 | ||||||||||
| Increase (Decrease) in Net Assets from: | ||||||||||||
| Operations: | ||||||||||||
| Net investment income (loss) | $ | 77,049 | $ | 102,650 | $ | 23,158 | ||||||
| Net realized gain (loss) on investments and foreign currency transactions | (1,239,420 | ) | (1,967,543 | ) | (146,571 | ) | ||||||
| Net change in unrealized appreciation (depreciation) on investments and foreign currency translations | 3,215,551 | 810,896 | (3,453,475 | ) | ||||||||
| Net increase (decrease) in net assets resulting from operations | 2,053,180 | (1,053,997 | ) | (3,576,888 | ) | |||||||
| Distributions to Shareholders: | ||||||||||||
| Investor Class | (179 | ) | (154 | ) | (17 | ) | ||||||
| Institutional Class | (104,387 | ) | (105,574 | ) | (3,047 | ) | ||||||
| Total distributions to shareholders | (104,566 | ) | (105,728 | ) | (3,064 | ) | ||||||
| Capital Transactions: | ||||||||||||
| Net proceeds from shares sold: | ||||||||||||
| Investor Class | 518 | 500 | 42,870 | |||||||||
| Institutional Class | 3,090,831 | 6,365,442 | 19,032,345 | |||||||||
| Reinvestment of distributions: | ||||||||||||
| Investor Class | 155 | 143 | 16 | |||||||||
| Institutional Class | 104,387 | 105,487 | 3,047 | |||||||||
| Cost of shares redeemed: | ||||||||||||
| Investor Class | (25,321 | ) | (25,806 | ) | (405 | ) | ||||||
| Institutional Class | (10,126,897 | ) | (6,061,766 | ) | (1,887,646 | ) | ||||||
| Net increase (decrease) in net assets from capital transactions | (6,956,327 | ) | 384,000 | 17,190,227 | ||||||||
| Total increase (decrease) in net assets | (5,007,713 | ) | (775,725 | ) | 13,610,275 | |||||||
| Net Assets: | ||||||||||||
| Beginning of period | 16,077,628 | 16,853,353 | 3,243,078 | |||||||||
| End of period | $ | 11,069,915 | $ | 16,077,628 | $ | 16,853,353 | ||||||
| Capital Share Transactions: | ||||||||||||
| Shares sold: | ||||||||||||
| Investor Class | 45 | 47 | 3,119 | |||||||||
| Institutional Class | 259,909 | 540,336 | 1,306,519 | |||||||||
| Shares reinvested: | ||||||||||||
| Investor Class | 12 | 12 | 1 | |||||||||
| Institutional Class | 8,324 | 9,141 | 197 | |||||||||
| Shares redeemed: | ||||||||||||
| Investor Class | (2,175 | ) | (2,367 | ) | (27 | ) | ||||||
| Institutional Class | (848,929 | ) | (528,223 | ) | (143,658 | ) | ||||||
| Total increase (decrease) in capital share transactions | (582,814 | ) | 18,946 | 1,166,151 | ||||||||
| ^ | Fiscal year end changed to December 31, effective December 14, 2022. |
See accompanying Notes to Financial Statements.
109
WCM Focused International Opportunities Fund
STATEMENTS OF CHANGES IN NET ASSETS
For the Year Ended | For the Period May 1, 2022 through December 31, 2022^ | For the Year Ended April 30, 2022 | ||||||||||
| Increase (Decrease) in Net Assets from: | ||||||||||||
| Operations: | ||||||||||||
| Net investment income (loss) | $ | 52,050 | $ | (22,852 | ) | $ | (83,539 | ) | ||||
| Net realized gain (loss) on investments and foreign currency transactions | 1,127,038 | (7,208,216 | ) | (1,407,744 | ) | |||||||
| Net change in unrealized appreciation (depreciation) on investments and foreign currency translations | 6,193,688 | 4,687,487 | (5,595,218 | ) | ||||||||
| Net increase (decrease) in net assets resulting from operations | 7,372,776 | (2,543,581 | ) | (7,086,501 | ) | |||||||
| Distributions to Shareholders: | ||||||||||||
| Investor Class | (358 | ) | - | (89 | ) | |||||||
| Institutional Class | (164,601 | ) | - | (18,947 | ) | |||||||
| Total distributions to shareholders | (164,959 | ) | - | (19,036 | ) | |||||||
| Capital Transactions: | ||||||||||||
| Net proceeds from shares sold: | ||||||||||||
| Investor Class | 136,590 | 80,250 | 202,021 | |||||||||
| Institutional Class | 21,694,439 | 21,883,721 | 30,809,705 | |||||||||
| Reinvestment of distributions: | ||||||||||||
| Investor Class | 358 | - | 89 | |||||||||
| Institutional Class | 164,602 | - | 18,947 | |||||||||
| Cost of shares redeemed: | ||||||||||||
| Investor Class | (107,586 | ) | (75,015 | ) | (71,875 | ) | ||||||
| Institutional Class | (16,487,523 | ) | (16,112,711 | ) | (3,500,177 | ) | ||||||
| Net increase (decrease) in net assets from capital transactions | 5,400,880 | 5,776,245 | 27,458,710 | |||||||||
| Total increase (decrease) in net assets | 12,608,697 | 3,232,664 | 20,353,173 | |||||||||
| Net Assets: | ||||||||||||
| Beginning of period | 24,362,836 | 21,130,172 | 776,999 | |||||||||
| End of period | $ | 36,971,533 | $ | 24,362,836 | $ | 21,130,172 | ||||||
| Capital Share Transactions: | ||||||||||||
| Shares sold: | ||||||||||||
| Investor Class | 15,949 | 10,409 | 17,139 | |||||||||
| Institutional Class | 2,541,225 | 2,895,718 | 2,817,914 | |||||||||
| Shares reinvested: | ||||||||||||
| Investor Class | 41 | - | 7 | |||||||||
| Institutional Class | 18,578 | - | 1,606 | |||||||||
| Shares redeemed: | ||||||||||||
| Investor Class | (12,501 | ) | (10,088 | ) | (7,042 | ) | ||||||
| Institutional Class | (1,888,802 | ) | (2,246,732 | ) | (370,520 | ) | ||||||
| Total increase (decrease) in capital share transactions | 674,490 | 649,307 | 2,459,104 | |||||||||
| ^ | Fiscal year end changed to December 31, effective December 14, 2022. |
See accompanying Notes to Financial Statements.
110
WCM Mid Cap Quality Value Fund
STATEMENTS OF CHANGES IN NET ASSETS
For the Year Ended | For the Period July 28, 2022* through December 31, 2022^ | |||||||
| Increase (Decrease) in Net Assets from: | ||||||||
| Operations: | ||||||||
| Net investment income (loss) | $ | (455 | ) | $ | (103 | ) | ||
| Net realized gain (loss) on investments | 20,811 | (1,293 | ) | |||||
| Net change in unrealized appreciation (depreciation) on investments | 174,542 | (17,667 | ) | |||||
| Net increase (decrease) in net assets resulting from operations | 194,898 | (19,063 | ) | |||||
| Distributions to Shareholders: | ||||||||
| Investor Class | (194 | ) | - | |||||
| Institutional Class | (16,072 | ) | (470 | ) | ||||
| Total distributions to shareholders | (16,266 | ) | (470 | ) | ||||
| Capital Transactions: | ||||||||
| Net proceeds from shares sold: | ||||||||
| Investor Class | 263 | 10,000 | ||||||
| Institutional Class | 131,800 | 589,506 | ||||||
| Reinvestment of distributions: | ||||||||
| Investor Class | 194 | - | ||||||
| Institutional Class | 16,072 | 471 | ||||||
| Net increase (decrease) in net assets from capital transactions | 148,329 | 599,977 | ||||||
| Total increase (decrease) in net assets | 326,961 | 580,444 | ||||||
| Net Assets: | ||||||||
| Beginning of period | 580,444 | - | ||||||
| End of period | $ | 907,405 | $ | 580,444 | ||||
| Capital Share Transactions: | ||||||||
| Shares sold: | ||||||||
| Investor Class | 27 | 1,000 | ||||||
| Institutional Class | 13,213 | 61,549 | ||||||
| Shares reinvested: | ||||||||
| Investor Class | 18 | - | ||||||
| Institutional Class | 1,468 | 50 | ||||||
| Total increase (decrease) in capital share transactions | 14,726 | 62,599 | ||||||
| * | Commencement of operations. |
| ^ | Fiscal year end changed to December 31, effective December 14, 2022. |
See accompanying Notes to Financial Statements.
111
WCM Focused Emerging Markets ex China Fund
STATEMENTS OF CHANGES IN NET ASSETS
For the Year Ended | For the Period December 29, 2022* through December 31, 2022 | |||||||
| Increase (Decrease) in Net Assets from: | ||||||||
| Operations: | ||||||||
| Net investment income (loss) | $ | 9,735 | $ | (51 | ) | |||
| Net realized gain (loss) on investments, foreign currency transactions and deferred non-U.S. taxes | 3,026 | (1 | ) | |||||
| Net change in unrealized appreciation (depreciation) on investments, foreign currency translations and deferred non-U.S. taxes | 743,695 | (4,567 | ) | |||||
| Net increase (decrease) in net assets resulting from operations | 756,456 | (4,619 | ) | |||||
| Distributions to Shareholders: | ||||||||
| Investor Class | (4 | ) | - | |||||
| Institutional Class | (15,866 | ) | - | |||||
| Total distributions to shareholders | (15,870 | ) | - | |||||
| Capital Transactions: | ||||||||
| Net proceeds from shares sold: | ||||||||
| Investor Class | - | 10,000 | ||||||
| Institutional Class | 5,435,920 | 490,000 | ||||||
| Reinvestment of distributions: | ||||||||
| Investor Class | 4 | - | ||||||
| Institutional Class | 15,866 | - | ||||||
| Cost of shares redeemed: | ||||||||
| Institutional Class | (128,319 | ) | - | |||||
| Net increase (decrease) in net assets from capital transactions | 5,323,471 | 500,000 | ||||||
| Total increase (decrease) in net assets | 6,064,057 | 495,381 | ||||||
| Net Assets: | ||||||||
| Beginning of period | 495,381 | - | ||||||
| End of period | $ | 6,559,438 | $ | 495,381 | ||||
| Capital Share Transactions: | ||||||||
| Shares sold: | ||||||||
| Investor Class | - | 1,000 | ||||||
| Institutional Class | 474,529 | 49,000 | ||||||
| Shares reinvested: | ||||||||
| Institutional Class | 1,340 | - | ||||||
| Shares redeemed: | ||||||||
| Institutional Class | (11,290 | ) | - | |||||
| Total increase (decrease) in capital share transactions | 464,579 | 50,000 | ||||||
| * | Commencement of operations. |
See accompanying Notes to Financial Statements.
112
WCM Quality Dividend Growth Fund
STATEMENT OF CHANGES IN NET ASSETS
| For the Period July 28, 2023* through December 31, 2023 | ||||
| Increase (Decrease) in Net Assets from: | ||||
| Operations: | ||||
| Net investment income (loss) | $ | 7,496 | ||
| Net realized gain (loss) on investments | (1,823 | ) | ||
| Net change in unrealized appreciation (depreciation) on investments | 112,448 | |||
| Net increase (decrease) in net assets resulting from operations | 118,121 | |||
| Distributions to Shareholders: | ||||
| Investor Class | (111 | ) | ||
| Institutional Class | (3,921 | ) | ||
| Total distributions to shareholders | (4,032 | ) | ||
| Capital Transactions: | ||||
| Net proceeds from shares sold: | ||||
| Investor Class | 46,980 | |||
| Institutional Class | 6,237,399 | |||
| Reinvestment of distributions: | ||||
| Investor Class | 111 | |||
| Institutional Class | 3,921 | |||
| Cost of shares redeemed: | ||||
| Institutional Class | (3,024 | ) | ||
| Net increase (decrease) in net assets from capital transactions | 6,285,387 | |||
| Total increase (decrease) in net assets | 6,399,476 | |||
| Net Assets: | ||||
| Beginning of period | - | |||
| End of period | $ | 6,399,476 | ||
| Capital Share Transactions: | ||||
| Shares sold: | ||||
| Investor Class | 4,805 | |||
| Institutional Class | 633,118 | |||
| Shares reinvested: | ||||
| Investor Class | 12 | |||
| Institutional Class | 408 | |||
| Shares redeemed: | ||||
| Institutional Class | (301 | ) | ||
| Total increase (decrease) in capital share transactions | 638,042 | |||
| * | Commencement of operations. |
See accompanying Notes to Financial Statements.
113
WCM Focused International Growth Fund
FINANCIAL HIGHLIGHTS
Investor Class
Per share operating performance.
For a capital share outstanding throughout each period.
| For the Year Ended December 31, | For the Period May 1, 2022 through December 31, | For the Year Ended April 30, | ||||||||||||||||||||||
| 2023 | 2022^ | 2022 | 2021 | 2020 | 2019 | |||||||||||||||||||
| Net asset value, beginning of period | $ | 19.44 | $ | 20.43 | $ | 26.00 | $ | 17.10 | $ | 16.51 | $ | 15.87 | ||||||||||||
| Income from Investment Operations: | ||||||||||||||||||||||||
| Net investment income (loss)1 | (0.05 | ) | (0.04 | ) | (0.18 | ) | (0.14 | ) | - | 0.03 | ||||||||||||||
| Net realized and unrealized gain (loss) | 3.20 | (0.93 | ) | (4.12 | ) | 9.39 | 0.60 | 1.15 | ||||||||||||||||
| Total from investment operations | 3.15 | (0.97 | ) | (4.30 | ) | 9.25 | 0.60 | 1.18 | ||||||||||||||||
| Less Distributions: | ||||||||||||||||||||||||
| From net investment income | - | - | - | (0.01 | ) | (0.01 | ) | (0.01 | ) | |||||||||||||||
| From net realized gain | (0.15 | ) | (0.02 | ) | (1.27 | ) | (0.34 | ) | - | (0.53 | ) | |||||||||||||
| Total distributions | (0.15 | ) | (0.02 | ) | (1.27 | ) | (0.35 | ) | (0.01 | ) | (0.54 | ) | ||||||||||||
| Redemption fee proceeds1 | - | - | - | - | - | - | 2 | |||||||||||||||||
| Net asset value, end of period | $ | 22.44 | $ | 19.44 | $ | 20.43 | $ | 26.00 | $ | 17.10 | $ | 16.51 | ||||||||||||
| Total return3 | 16.24 | % | (4.75 | )%4 | (17.75 | )% | 54.28 | % | 3.64 | % | 7.99 | % | ||||||||||||
| Ratios and Supplemental Data: | ||||||||||||||||||||||||
| Net assets, end of period (in thousands) | $ | 719,670 | $ | 695,036 | $ | 1,106,334 | $ | 1,537,934 | $ | 271,693 | $ | 200,100 | ||||||||||||
| Ratio of expenses to average net assets: | 1.29 | %5 | 1.29 | %6 | 1.31 | % | 1.30 | % | 1.26 | % | 1.24 | % | ||||||||||||
| Ratio of net investment income (loss) to average net assets: | (0.22 | )%5 | (0.34 | )%6 | (0.68 | )% | (0.62 | )% | (0.01 | )% | 0.17 | % | ||||||||||||
| Portfolio turnover rate | 33 | % | 17 | %4 | 23 | % | 25 | % | 20 | % | 21 | % | ||||||||||||
| ^ | Fiscal year end changed to December 31, effective December 14, 2022. |
| 1 | Calculated based on average shares outstanding for the period. |
| 2 | Amount represents less than $0.01 per share. |
| 3 | Returns shown include Rule 12b-1 fees of up to 0.25% and do not reflect the deduction of taxes that a shareholder would pay on Fund distributions or the redemption of Fund shares. |
| 4 | Not annualized. |
| 5 | If tax reclaim expense had been excluded, the expense ratios would of been lowered by 0.00% for the year ended December 31, 2023. |
| 6 | Annualized. |
See accompanying Notes to Financial Statements.
114
WCM Focused International Growth Fund
FINANCIAL HIGHLIGHTS
Institutional Class
Per share operating performance.
For a capital share outstanding throughout each period.
| For the Year Ended December 31, | For the Period May 1, 2022 through December 31, | For the Year Ended April 30, | ||||||||||||||||||||||
| 2023 | 2022^ | 2022 | 2021 | 2020 | 2019 | |||||||||||||||||||
| Net asset value, beginning of period | $ | 19.66 | $ | 20.64 | $ | 26.18 | $ | 17.17 | $ | 16.58 | $ | 15.94 | ||||||||||||
| Income from Investment Operations: | ||||||||||||||||||||||||
| Net investment income (loss)1 | 0.01 | (0.01 | ) | (0.11 | ) | (0.08 | ) | 0.04 | 0.06 | |||||||||||||||
| Net realized and unrealized gain (loss) | 3.24 | (0.95 | ) | (4.16 | ) | 9.44 | 0.59 | 1.16 | ||||||||||||||||
| Total from investment operations | 3.25 | (0.96 | ) | (4.27 | ) | 9.36 | 0.63 | 1.22 | ||||||||||||||||
| Less Distributions: | ||||||||||||||||||||||||
| From net investment income | - | - | - | (0.01 | ) | (0.04 | ) | (0.05 | ) | |||||||||||||||
| From net realized gain | (0.15 | ) | (0.02 | ) | (1.27 | ) | (0.34 | ) | - | (0.53 | ) | |||||||||||||
| Total distributions | (0.15 | ) | (0.02 | ) | (1.27 | ) | (0.35 | ) | (0.04 | ) | (0.58 | ) | ||||||||||||
| Redemption fee proceeds1 | - | - | - | - | - | - | 2 | |||||||||||||||||
| Net asset value, end of period | $ | 22.76 | $ | 19.66 | $ | 20.64 | $ | 26.18 | $ | 17.17 | $ | 16.58 | ||||||||||||
| Total return3 | 16.56 | % | (4.65 | )%4 | (17.51 | )% | 54.73 | % | 3.79 | % | 8.25 | % | ||||||||||||
| Ratios and Supplemental Data: | ||||||||||||||||||||||||
| Net assets, end of period (in thousands) | $ | 16,758,010 | $ | 15,390,849 | $ | 19,083,250 | $ | 22,891,438 | $ | 12,088,860 | $ | 7,420,808 | ||||||||||||
| Ratio of expenses to average net assets: | 1.04 | %5 | 1.04 | %6 | 1.06 | % | 1.05 | % | 1.04 | % | 1.03 | % | ||||||||||||
| Ratio of net investment income (loss) to average net assets: | 0.03 | %5 | (0.09 | )%6 | (0.43 | )% | (0.37 | )% | 0.21 | % | 0.38 | % | ||||||||||||
| Portfolio turnover rate | 33 | % | 17 | %4 | 23 | % | 25 | % | 20 | % | 21 | % | ||||||||||||
| ^ | Fiscal year end changed to December 31, effective December 14, 2022. |
| 1 | Calculated based on average shares outstanding for the period. |
| 2 | Amount represents less than $0.01 per share. |
| 3 | Returns do not reflect the deduction of taxes that a shareholder would pay on Fund distributions or the redemption of Fund shares. |
| 4 | Not annualized. |
| 5 | If tax reclaim expense had been excluded, the expense ratios would of been lowered by 0.00% for the year ended December 31, 2023. |
| 6 | Annualized. |
See accompanying Notes to Financial Statements.
115
WCM Focused Emerging Markets Fund
FINANCIAL HIGHLIGHTS
Investor Class
Per share operating performance.
For a capital share outstanding throughout each period.
| For the Year Ended December 31, | For the Period May 1, 2022 through December 31, | For the Year Ended April 30, | ||||||||||||||||||||||
| 2023 | 2022^ | 2022 | 2021 | 2020 | 2019 | |||||||||||||||||||
| Net asset value, beginning of period | $ | 12.73 | $ | 14.00 | $ | 19.89 | $ | 12.71 | $ | 12.91 | $ | 12.43 | ||||||||||||
| Income from Investment Operations: | ||||||||||||||||||||||||
| Net investment income (loss)1 | 0.03 | 0.01 | (0.11 | ) | (0.19 | ) | (0.05 | ) | 0.14 | |||||||||||||||
| Net realized and unrealized gain (loss) | 0.51 | (1.24 | ) | (4.96 | ) | 7.54 | (0.10 | ) | 0.42 | |||||||||||||||
| Net increase from payments by affiliates | - | - | - | - | - | - | 2 | |||||||||||||||||
| Total from investment operations | 0.54 | (1.23 | ) | (5.07 | ) | 7.35 | (0.15 | ) | 0.56 | |||||||||||||||
| Less Distributions: | ||||||||||||||||||||||||
| From net investment income | (0.02 | ) | (0.04 | ) | - | - | (0.03 | ) | (0.08 | ) | ||||||||||||||
| From net realized gain | - | - | (0.82 | ) | (0.17 | ) | (0.02 | ) | - | |||||||||||||||
| Total distributions | (0.02 | ) | (0.04 | ) | (0.82 | ) | (0.17 | ) | (0.05 | ) | (0.08 | ) | ||||||||||||
| Redemption fee proceeds1 | - | - | - | - | - | - | 2 | |||||||||||||||||
| Net asset value, end of period | $ | 13.25 | $ | 12.73 | $ | 14.00 | $ | 19.89 | $ | 12.71 | $ | 12.91 | ||||||||||||
| Total return3 | 4.25 | % | (8.78 | )%4 | (26.54 | )% | 57.93 | % | (1.17 | )% | 4.64 | %5 | ||||||||||||
| Ratios and Supplemental Data: | ||||||||||||||||||||||||
| Net assets, end of period (in thousands) | $ | 89,359 | $ | 125,641 | $ | 141,593 | $ | 55,369 | $ | 26,583 | $ | 6,540 | ||||||||||||
| Ratio of expenses to average net assets: | ||||||||||||||||||||||||
| Before fees waived and expenses absorbed | 1.52 | % | 1.62 | %6 | 1.59 | % | 1.53 | % | 1.69 | % | 2.05 | % | ||||||||||||
| After fees waived and expenses absorbed | 1.50 | % | 1.50 | %6 | 1.50 | % | 1.50 | % | 1.49 | %7 | 0.00 | % | ||||||||||||
| Ratio of net investment income (loss) to average net assets: | ||||||||||||||||||||||||
| Before fees waived and expenses absorbed | 0.21 | % | 0.00 | %6 | (0.71 | )% | (1.07 | )% | (0.59 | )% | (0.88 | )% | ||||||||||||
| After fees waived and expenses absorbed | 0.23 | % | 0.12 | %6 | (0.62 | )% | (1.04 | )% | (0.39 | )% | 1.17 | % | ||||||||||||
| Portfolio turnover rate | 62 | % | 18 | %4 | 39 | % | 35 | % | 23 | % | 48 | % | ||||||||||||
| ^ | Fiscal year end changed to December 31, effective December 14, 2022. |
| 1 | Calculated based on average shares outstanding for the period. |
| 2 | Amount represents less than $0.01 per share. |
| 3 | Total returns would have been lower had expenses not been waived or absorbed by the Advisor. Returns shown include Rule 12b-1 fees of up to 0.25% and do not reflect the deduction of taxes that a shareholder would pay on Fund distributions or the redemption of Fund shares. |
| 4 | Not annualized. |
| 5 | The Advisor reimbursed the Fund $327 for losses from a trade error. Payments had no impact to the total return. |
| 6 | Annualized. |
| 7 | Effective May 1, 2019, the Advisor has contractually agreed to limit the annual operating expenses to 1.50%. Prior to May 1, 2019, the Advisor had contractually agreed to limit the annual operating expenses to 1.65%, but also voluntarily waived all of its fees, and payed all of the operating expenses. |
See accompanying Notes to Financial Statements.
116
WCM Focused Emerging Markets Fund
FINANCIAL HIGHLIGHTS
Institutional Class
Per share operating performance.
For a capital share outstanding throughout each period.
| For the Year Ended December 31, | For the Period May 1, 2022 through December 31, | For the Year Ended April 30, | ||||||||||||||||||||||
| 2023 | 2022^ | 2022 | 2021 | 2020 | 2019 | |||||||||||||||||||
| Net asset value, beginning of period | $ | 12.88 | $ | 14.16 | $ | 20.06 | $ | 12.78 | $ | 12.96 | $ | 12.47 | ||||||||||||
| Income from Investment Operations: | ||||||||||||||||||||||||
| Net investment income (loss)1 | 0.06 | 0.03 | (0.07 | ) | (0.15 | ) | (0.02 | ) | 0.14 | |||||||||||||||
| Net realized and unrealized gain (loss) | 0.52 | (1.25 | ) | (5.01 | ) | 7.60 | (0.11 | ) | 0.43 | |||||||||||||||
| Net increase from payments by affiliates | - | - | - | - | - | - | 2 | |||||||||||||||||
| Total from investment operations | 0.58 | (1.22 | ) | (5.08 | ) | 7.45 | (0.13 | ) | 0.57 | |||||||||||||||
| Less Distributions: | ||||||||||||||||||||||||
| From net investment income | (0.06 | ) | (0.06 | ) | - | - | (0.03 | ) | (0.08 | ) | ||||||||||||||
| From net realized gain | - | - | (0.82 | ) | (0.17 | ) | (0.02 | ) | - | |||||||||||||||
| Total distributions | (0.06 | ) | (0.06 | ) | (0.82 | ) | (0.17 | ) | (0.05 | ) | (0.08 | ) | ||||||||||||
| Redemption fee proceeds1 | - | - | - | - | - | - | 2 | |||||||||||||||||
| Net asset value, end of period | $ | 13.40 | $ | 12.88 | $ | 14.16 | $ | 20.06 | $ | 12.78 | $ | 12.96 | ||||||||||||
| Total return3 | 4.54 | % | (8.62 | )%4 | (26.36 | )% | 58.39 | % | (1.01 | )% | 4.70 | %5 | ||||||||||||
| Ratios and Supplemental Data: | ||||||||||||||||||||||||
| Net assets, end of period (in thousands) | $ | 1,101,465 | $ | 1,309,276 | $ | 1,717,091 | $ | 2,116,203 | $ | 315,868 | $ | 50,850 | ||||||||||||
| Ratio of expenses to average net assets: | ||||||||||||||||||||||||
| Before fees waived and expenses absorbed | 1.27 | % | 1.37 | %6 | 1.34 | % | 1.28 | % | 1.45 | % | 1.80 | % | ||||||||||||
| After fees waived and expenses absorbed | 1.25 | % | 1.25 | %6 | 1.25 | % | 1.25 | % | 1.25 | %7 | 0.00 | % | ||||||||||||
| Ratio of net investment income (loss) to average net assets: | ||||||||||||||||||||||||
| Before fees waived and expenses absorbed | 0.46 | % | 0.25 | %6 | (0.46 | )% | (0.82 | )% | (0.35 | )% | (0.63 | )% | ||||||||||||
| After fees waived and expenses absorbed | 0.48 | % | 0.37 | %6 | (0.37 | )% | (0.79 | )% | (0.15 | )% | 1.17 | % | ||||||||||||
| Portfolio turnover rate | 62 | % | 18 | %4 | 39 | % | 35 | % | 23 | % | 48 | % | ||||||||||||
^ | Fiscal year end changed to December 31, effective December 14, 2022. |
| 1 | Calculated based on average shares outstanding for the period. |
| 2 | Amount represents less than $0.01 per share. |
| 3 | Total returns would have been lower had expenses not been waived or absorbed by the Advisor. Returns do not reflect the deduction of taxes that a shareholder would pay on Fund distributions or the redemption of Fund shares. |
| 4 | Not annualized. |
| 5 | The Advisor reimbursed the Fund $327 for losses from a trade error. Payments had no impact to the total return. |
| 6 | Annualized. |
| 7 | Effective May 1, 2019, the Advisor has contractually agreed to limit the annual operating expenses to 1.25%. Prior to May 1, 2019, the Advisor had contractually agreed to limit the annual operating expenses to 1.40%, but also voluntarily waived all of its fees, and payed all of the operating expenses. |
See accompanying Notes to Financial Statements.
117
WCM Focused Global Growth Fund
FINANCIAL HIGHLIGHTS
Investor Class
Per share operating performance.
For a capital share outstanding throughout each period.
| For the Year Ended December 31, | For the Period May 1, 2022 through December 31, | For the Year Ended April 30, | ||||||||||||||||||||||
| 2023 | 2022^ | 2022 | 2021 | 2020 | 2019 | |||||||||||||||||||
| Net asset value, beginning of period | $ | 16.88 | $ | 18.93 | $ | 25.28 | $ | 17.39 | $ | 16.68 | $ | 14.96 | ||||||||||||
| Income from Investment Operations: | ||||||||||||||||||||||||
| Net investment income (loss)1 | (0.07 | ) | (0.04 | ) | (0.19 | ) | (0.15 | ) | (0.05 | ) | (0.08 | ) | ||||||||||||
| Net realized and unrealized gain (loss) | 4.48 | (1.41 | ) | (3.52 | ) | 8.87 | 1.08 | 2.21 | ||||||||||||||||
| Total from investment operations | 4.41 | (1.45 | ) | (3.71 | ) | 8.72 | 1.03 | 2.13 | ||||||||||||||||
| Less Distributions: | ||||||||||||||||||||||||
| From net realized gain | - | (0.60 | ) | (2.64 | ) | (0.83 | ) | (0.32 | ) | (0.41 | ) | |||||||||||||
| Total distributions | - | (0.60 | ) | (2.64 | ) | (0.83 | ) | (0.32 | ) | (0.41 | ) | |||||||||||||
| Redemption fee proceeds1 | - | - | - | - | - | - | 2 | |||||||||||||||||
| Net asset value, end of period | $ | 21.29 | $ | 16.88 | $ | 18.93 | $ | 25.28 | $ | 17.39 | $ | 16.68 | ||||||||||||
| Total return3 | 26.13 | % | (7.71 | )%4 | (17.30 | )% | 50.55 | % | 6.15 | % | 14.59 | % | ||||||||||||
| Ratios and Supplemental Data: | ||||||||||||||||||||||||
| Net assets, end of period (in thousands) | $ | 38,795 | $ | 12,943 | $ | 16,396 | $ | 21,378 | $ | 8,865 | $ | 4,541 | ||||||||||||
| Ratio of expenses to average net assets: | ||||||||||||||||||||||||
| Before fees waived and expenses absorbed | 1.39 | %5 | 1.44 | %6 | 1.40 | % | 1.44 | % | 1.50 | % | 1.73 | % | ||||||||||||
| After fees waived and expenses absorbed | 1.30 | %5 | 1.30 | %6 | 1.30 | % | 1.30 | % | 1.28 | %7 | 1.40 | % | ||||||||||||
| Ratio of net investment income (loss) to average net assets: | ||||||||||||||||||||||||
| Before fees waived and expenses absorbed | (0.48 | )% | (0.51 | )%6 | (0.88 | )% | (0.80 | )% | (0.52 | )% | (0.83 | )% | ||||||||||||
| After fees waived and expenses absorbed | (0.39 | )% | (0.37 | )%6 | (0.78 | )% | (0.66 | )% | (0.30 | )% | (0.50 | )% | ||||||||||||
| Portfolio turnover rate | 32 | % | 36 | %4 | 44 | % | 56 | % | 37 | % | 48 | % | ||||||||||||
| ^ | Fiscal year end changed to December 31, effective December 14, 2022. |
| 1 | Calculated based on average shares outstanding for the period. |
| 2 | Amount represents less than $0.01 per share. |
| 3 | Total returns would have been lower had expenses not been waived or absorbed by the Advisor. Returns shown include Rule 12b-1 fees of up to 0.25% and do not reflect the deduction of taxes that a shareholder would pay on Fund distributions or the redemption of Fund shares. |
| 4 | Not annualized. |
| 5 | If tax reclaim expense had been excluded, the expense ratios would of been lowered by 0.00% for the year ended December 31, 2023. |
| 6 | Annualized. |
| 7 | Effective May 1, 2019, the Advisor has contractually agreed to limit the annual operating expenses to 1.30%. Prior to May 1, 2019, the Advisor had contractually agreed to limit the annual operating expenses to 1.40%. |
See accompanying Notes to Financial Statements.
118
WCM Focused Global Growth Fund
FINANCIAL HIGHLIGHTS
Institutional Class
Per share operating performance.
For a capital share outstanding throughout each period.
| For the Year Ended December 31, | For the Period May 1, 2022 through December 31, | For the Year Ended April 30, | ||||||||||||||||||||||
| 2023 | 2022^ | 2022 | 2021 | 2020 | 2019 | |||||||||||||||||||
| Net asset value, beginning of period | $ | 17.28 | $ | 19.33 | $ | 25.70 | $ | 17.63 | $ | 16.87 | $ | 15.06 | ||||||||||||
| Income from Investment Operations: | ||||||||||||||||||||||||
| Net investment income (loss)1 | (0.03 | ) | (0.01 | ) | (0.13 | ) | (0.09 | ) | (0.01 | ) | (0.04 | ) | ||||||||||||
| Net realized and unrealized gain (loss) | 4.60 | (1.44 | ) | (3.60 | ) | 8.99 | 1.09 | 2.25 | ||||||||||||||||
| Total from investment operations | 4.57 | (1.45 | ) | (3.73 | ) | 8.90 | 1.08 | 2.21 | ||||||||||||||||
| Less Distributions: | ||||||||||||||||||||||||
| From net realized gain | - | (0.60 | ) | (2.64 | ) | (0.83 | ) | (0.32 | ) | (0.41 | ) | |||||||||||||
| Total distributions | - | (0.60 | ) | (2.64 | ) | (0.83 | ) | (0.32 | ) | (0.41 | ) | |||||||||||||
| Redemption fee proceeds1 | - | - | - | - | - | 0.01 | ||||||||||||||||||
| Net asset value, end of period | $ | 21.85 | $ | 17.28 | $ | 19.33 | $ | 25.70 | $ | 17.63 | $ | 16.87 | ||||||||||||
| Total return2 | 26.45 | % | (7.55 | )%3 | (17.09 | )% | 50.89 | % | 6.38 | % | 15.09 | % | ||||||||||||
| Ratios and Supplemental Data: | ||||||||||||||||||||||||
| Net assets, end of period (in thousands) | $ | 387,992 | $ | 277,438 | $ | 438,016 | $ | 468,073 | $ | 245,101 | $ | 93,974 | ||||||||||||
| Ratio of expenses to average net assets: | ||||||||||||||||||||||||
| Before fees waived and expenses absorbed | 1.14 | %4 | 1.19 | %5 | 1.15 | % | 1.19 | % | 1.27 | % | 1.48 | % | ||||||||||||
| After fees waived and expenses absorbed | 1.05 | %4 | 1.05 | %5 | 1.05 | % | 1.05 | % | 1.05 | %6 | 1.15 | % | ||||||||||||
| Ratio of net investment income (loss) to average net assets: | ||||||||||||||||||||||||
| Before fees waived and expenses absorbed | (0.23 | )% | (0.26 | )%5 | (0.63 | )% | (0.55 | )% | (0.29 | )% | (0.58 | )% | ||||||||||||
| After fees waived and expenses absorbed | (0.14 | )% | (0.12 | )%5 | (0.53 | )% | (0.41 | )% | (0.07 | )% | (0.25 | )% | ||||||||||||
| Portfolio turnover rate | 32 | % | 36 | %3 | 44 | % | 56 | % | 37 | % | 48 | % | ||||||||||||
| ^ | Fiscal year end changed to December 31, effective December 14, 2022. |
| 1 | Calculated based on average shares outstanding for the period. |
| 2 | Total returns would have been lower had expenses not been waived or absorbed by the Advisor. Returns do not reflect the deduction of taxes that a shareholder would pay on Fund distributions or the redemption of Fund shares. |
| 3 | Not annualized. |
| 4 | If tax reclaim expense had been excluded, the expense ratios would of been lowered by 0.00% for the year ended December 31, 2023. |
| 5 | Annualized. |
| 6 | Effective May 1, 2019, the Advisor has contractually agreed to limit the annual operating expenses to 1.05%. Prior to May 1, 2019, the Advisor had contractually agreed to limit the annual operating expenses to 1.15%. |
See accompanying Notes to Financial Statements.
119
WCM International Small Cap Growth Fund
FINANCIAL HIGHLIGHTS
Institutional Class
Per share operating performance.
For a capital share outstanding throughout each period.
| For the Year Ended December 31, | For the Period May 1, 2022 through December 31, | For the Year Ended April 30, | ||||||||||||||||||||||
| 2023 | 2022^ | 2022 | 2021 | 2020 | 2019 | |||||||||||||||||||
| Net asset value, beginning of period | $ | 16.49 | $ | 20.22 | $ | 28.63 | $ | 16.80 | $ | 15.57 | $ | 14.79 | ||||||||||||
| Income from Investment Operations: | ||||||||||||||||||||||||
| Net investment income (loss)1 | 0.05 | (0.02 | ) | (0.18 | ) | (0.19 | ) | (0.10 | ) | (0.09 | ) | |||||||||||||
| Net realized and unrealized gain (loss) | 3.62 | (3.71 | ) | (5.30 | ) | 12.76 | 1.33 | 1.37 | ||||||||||||||||
| Net increase from payments by affiliates | - | - | - | - | 2 | - | - | |||||||||||||||||
| Total from investment operations | 3.67 | (3.73 | ) | (5.48 | ) | 12.57 | 1.23 | 1.28 | ||||||||||||||||
| Less Distributions: | ||||||||||||||||||||||||
| From net realized gain | - | - | (2.93 | ) | (0.74 | ) | - | (0.50 | ) | |||||||||||||||
| Total distributions | - | - | (2.93 | ) | (0.74 | ) | - | (0.50 | ) | |||||||||||||||
| Redemption fee proceeds1 | - | - | - | - | - | - | 2 | |||||||||||||||||
| Net asset value, end of period | $ | 20.16 | $ | 16.49 | $ | 20.22 | $ | 28.63 | $ | 16.80 | $ | 15.57 | ||||||||||||
| Total return3 | 22.26 | % | (18.45 | )%4 | (22.04 | )% | 75.46 | %5 | 7.90 | % | 9.29 | % | ||||||||||||
| Ratios and Supplemental Data: | ||||||||||||||||||||||||
| Net assets, end of period (in thousands) | $ | 311,472 | $ | 293,250 | $ | 533,268 | $ | 768,496 | $ | 86,504 | $ | 11,922 | ||||||||||||
| Ratio of expenses to average net assets: | ||||||||||||||||||||||||
| Before fees waived and expenses absorbed | 1.33 | %6 | 1.48 | %7 | 1.34 | % | 1.34 | % | 1.79 | % | 4.34 | % | ||||||||||||
| After fees waived and expenses absorbed | 1.25 | %6 | 1.25 | %7 | 1.25 | % | 1.25 | % | 1.25 | %8 | 1.40 | % | ||||||||||||
| Ratio of net investment income (loss) to average net assets: | ||||||||||||||||||||||||
| Before fees waived and expenses absorbed | 0.18 | % | (0.44 | )%7 | (0.73 | )% | (0.84 | )% | (1.17 | )% | (3.55 | )% | ||||||||||||
| After fees waived and expenses absorbed | 0.26 | % | (0.21 | )%7 | (0.64 | )% | (0.75 | )% | (0.63 | )% | (0.61 | )% | ||||||||||||
| Portfolio turnover rate | 81 | % | 56 | %4 | 87 | % | 82 | % | 67 | % | 81 | % | ||||||||||||
| ^ | Fiscal year end changed to December 31, effective December 14, 2022. |
| 1 | Calculated based on average shares outstanding for the period. |
| 2 | Amount represents less than $0.01 per share. |
| 3 | Total returns would have been lower had expenses not been waived or absorbed by the Advisor. Returns do not reflect the deduction of taxes that a shareholder would pay on Fund distributions or the redemption of Fund shares. |
| 4 | Not annualized. |
| 5 | The Advisor reimbursed the Fund $2,951 for losses from a trade error. Payment had no impact to the total return. |
| 6 | If tax reclaim expense had been excluded, the expense ratios would of been lowered by 0.00% for the year ended December 31, 2023. |
| 7 | Annualized. |
| 8 | Effective May 1, 2019, the Advisor has contractually agreed to limit the annual operating expenses to 1.25%. Prior to May 1, 2019, the Advisor had contractually agreed to limit the annual operating expenses to 1.40%. |
See accompanying Notes to Financial Statements.
120
WCM Small Cap Growth Fund
FINANCIAL HIGHLIGHTS
Investor Class
Per share operating performance.
For a capital share outstanding throughout each period.
| For the Year Ended December 31, | For the Period May 1, 2022 through December 31, | For the Year Ended April 30, | For the Period October 30, 2019* through April 30, | |||||||||||||||||
| 2023 | 2022^ | 2022 | 2021 | 2020 | ||||||||||||||||
| Net asset value, beginning of period | $ | 10.55 | $ | 11.00 | $ | 15.71 | $ | 9.27 | $ | 10.00 | ||||||||||
| Income from Investment Operations: | ||||||||||||||||||||
| Net investment income (loss)1 | (0.07 | ) | (0.06 | ) | (0.16 | ) | (0.16 | ) | (0.05 | ) | ||||||||||
| Net realized and unrealized gain (loss) | 1.72 | (0.37 | ) | (3.28 | ) | 6.75 | (0.68 | ) | ||||||||||||
| Total from investment operations | 1.65 | (0.43 | ) | (3.44 | ) | 6.59 | (0.73 | ) | ||||||||||||
| Less Distributions: | ||||||||||||||||||||
| From net realized gain | - | (0.02 | ) | (1.27 | ) | (0.15 | ) | - | ||||||||||||
| Total distributions | - | (0.02 | ) | (1.27 | ) | (0.15 | ) | - | ||||||||||||
| Net asset value, end of period | $ | 12.20 | $ | 10.55 | $ | 11.00 | $ | 15.71 | $ | 9.27 | ||||||||||
| Total return2 | 15.64 | % | (3.92 | )%3 | (23.65 | )% | 71.37 | % | (7.30 | )%3 | ||||||||||
| Ratios and Supplemental Data: | ||||||||||||||||||||
| Net assets, end of period (in thousands) | $ | 107 | $ | 94 | $ | 79 | $ | 78 | $ | 31 | ||||||||||
| Ratio of expenses to average net assets: | ||||||||||||||||||||
| Before fees waived and expenses absorbed | 2.11 | % | 2.19 | %4 | 1.85 | % | 2.33 | % | 10.10 | %4 | ||||||||||
| After fees waived and expenses absorbed | 1.24 | % | 1.30 | %4,5 | 1.50 | % | 1.50 | % | 1.50 | %4 | ||||||||||
| Ratio of net investment income (loss) to average net assets: | ||||||||||||||||||||
| Before fees waived and expenses absorbed | (1.52 | )% | (1.74 | )%4 | (1.48 | )% | (2.08 | )% | (9.69 | )%4 | ||||||||||
| After fees waived and expenses absorbed | (0.65 | )% | (0.85 | )%4 | (1.13 | )% | (1.25 | )% | (1.09 | )%4 | ||||||||||
| Portfolio turnover rate | 48 | % | 45 | %3 | 57 | % | 51 | % | 51 | %3 | ||||||||||
| * | Commencement of operations. |
| ^ | Fiscal year end changed to December 31, effective December 14, 2022. |
| 1 | Calculated based on average shares outstanding for the period. |
| 2 | Total returns would have been lower had expenses not been waived or absorbed by the Advisor. Returns shown include Rule 12b-1 fees of up to 0.25% and do not reflect the deduction of taxes that a shareholder would pay on Fund distributions or the redemption of Fund shares. |
| 3 | Not annualized. |
| 4 | Annualized. |
| 5 | Effective July 1, 2022, the Advisor has contractually agreed to limit the annual fund operating expenses to 1.24%. Prior to July 1, 2022, the annual fund operating expense limitation was 1.50%. |
See accompanying Notes to Financial Statements.
121
WCM Small Cap Growth Fund
FINANCIAL HIGHLIGHTS
Institutional Class
Per share operating performance.
For a capital share outstanding throughout each period.
For the Year December 31, | For the Period May 1, 2022 through December 31, | For the Year Ended April 30, | For the Period October 30, 2019* through April 30, | |||||||||||||||||
| 2023 | 2022^ | 2022 | 2021 | 2020 | ||||||||||||||||
| Net asset value, beginning of period | $ | 10.64 | $ | 11.07 | $ | 15.77 | $ | 9.28 | $ | 10.00 | ||||||||||
| Income from Investment Operations: | ||||||||||||||||||||
| Net investment income (loss)1 | (0.05 | ) | (0.04 | ) | (0.12 | ) | (0.14 | ) | (0.04 | ) | ||||||||||
| Net realized and unrealized gain (loss) | 1.74 | (0.37 | ) | (3.31 | ) | 6.78 | (0.68 | ) | ||||||||||||
| Total from investment operations | 1.69 | (0.41 | ) | (3.43 | ) | 6.64 | (0.72 | ) | ||||||||||||
| Less Distributions: | ||||||||||||||||||||
| From net realized gain | - | (0.02 | ) | (1.27 | ) | (0.15 | ) | - | ||||||||||||
| Total distributions | - | (0.02 | ) | (1.27 | ) | (0.15 | ) | - | ||||||||||||
| Net asset value, end of period | $ | 12.33 | $ | 10.64 | $ | 11.07 | $ | 15.77 | $ | 9.28 | ||||||||||
| Total return2 | 15.88 | % | (3.72 | )%3 | (23.49 | )% | 71.84 | % | (7.20 | )%3 | ||||||||||
| Ratios and Supplemental Data: | ||||||||||||||||||||
| Net assets, end of period (in thousands) | $ | 40,420 | $ | 32,916 | $ | 40,438 | $ | 58,164 | $ | 4,993 | ||||||||||
| Ratio of expenses to average net assets: | ||||||||||||||||||||
| Before fees waived and expenses absorbed | 1.86 | % | 1.94 | %4 | 1.60 | % | 2.08 | % | 9.85 | %4 | ||||||||||
| After fees waived and expenses absorbed | 0.99 | % | 1.05 | %4,5 | 1.25 | % | 1.25 | % | 1.25 | %4 | ||||||||||
| Ratio of net investment income (loss) to average net assets: | ||||||||||||||||||||
| Before fees waived and expenses absorbed | (1.27 | )% | (1.49 | )%4 | (1.23 | )% | (1.83 | )% | (9.43 | )%4 | ||||||||||
| After fees waived and expenses absorbed | (0.40 | )% | (0.60 | )%4 | (0.88 | )% | (1.00 | )% | (0.83 | )%4 | ||||||||||
| Portfolio turnover rate | 48 | % | 45 | %3 | 57 | % | 51 | % | 51 | %3 | ||||||||||
| * | Commencement of operations. |
| ^ | Fiscal year end changed to December 31, effective December 14, 2022. |
| 1 | Calculated based on average shares outstanding for the period. |
| 2 | Total returns would have been lower had expenses not been waived or absorbed by the Advisor. Returns do not reflect the deduction of taxes that a shareholder would pay on Fund distributions or the redemption of Fund shares. |
| 3 | Not annualized. |
| 4 | Annualized. |
| 5 | Effective July 1, 2022, the Advisor has contractually agreed to limit the annual fund operating expenses to 0.99%. Prior to July 1, 2022, the annual fund operating expense limitation was 1.25%. |
See accompanying Notes to Financial Statements.
122
WCM SMID Quality Value Fund
FINANCIAL HIGHLIGHTS
Investor Class
Per share operating performance.
For a capital share outstanding throughout each period.
| For the Year Ended December 31, | For the Period May 1, 2022 through December 31, | For the Year Ended April 30, | For the Period October 30, 2019* through April 30, | |||||||||||||||||
| 2023 | 2022^ | 2022 | 2021 | 2020 | ||||||||||||||||
| Net asset value, beginning of period | $ | 9.84 | $ | 10.30 | $ | 12.11 | $ | 7.71 | $ | 10.00 | ||||||||||
| Income from Investment Operations: | ||||||||||||||||||||
| Net investment income (loss)1 | (0.04 | ) | (0.04 | ) | (0.08 | ) | (0.07 | ) | (0.02 | ) | ||||||||||
| Net realized and unrealized gain (loss) | 2.38 | (0.24 | ) | (0.97 | ) | 4.47 | (2.27 | ) | ||||||||||||
| Total from investment operations | 2.34 | (0.28 | ) | (1.05 | ) | 4.40 | (2.29 | ) | ||||||||||||
| Less Distributions: | ||||||||||||||||||||
| From net realized gain | (0.10 | ) | (0.18 | ) | (0.76 | ) | - | - | ||||||||||||
| Total distributions | (0.10 | ) | (0.18 | ) | (0.76 | ) | - | - | ||||||||||||
| Net asset value, end of period | $ | 12.08 | $ | 9.84 | $ | 10.30 | $ | 12.11 | $ | 7.71 | ||||||||||
| Total return2 | 23.83 | % | (2.71 | )%3 | (9.29 | )% | 57.07 | % | (22.90 | )%3 | ||||||||||
| Ratios and Supplemental Data: | ||||||||||||||||||||
| Net assets, end of period (in thousands) | $ | 241 | $ | 196 | $ | 169 | $ | 161 | $ | 27 | ||||||||||
| Ratio of expenses to average net assets: | �� | |||||||||||||||||||
| Before fees waived and expenses absorbed | 1.52 | % | 1.64 | %4 | 1.77 | % | 1.97 | % | 15.49 | %4 | ||||||||||
| After fees waived and expenses absorbed | 1.10 | % | 1.23 | %4,5 | 1.25 | % | 1.25 | %6 | 1.50 | %4 | ||||||||||
| Ratio of net investment income (loss) to average net assets: | ||||||||||||||||||||
| Before fees waived and expenses absorbed | (0.79 | )% | (0.98 | )%4 | (1.26 | )% | (1.43 | )% | (14.51 | )%4 | ||||||||||
| After fees waived and expenses absorbed | (0.37 | )% | (0.57 | )%4 | (0.74 | )% | (0.71 | )% | (0.52 | )%4 | ||||||||||
| Portfolio turnover rate | 22 | % | 53 | %3 | 32 | % | 32 | % | 5 | %3 | ||||||||||
| * | Commencement of operations. |
| ^ | Fiscal year end changed to December 31, effective December 14, 2022. |
| 1 | Calculated based on average shares outstanding for the period. |
| 2 | Total returns would have been lower had expenses not been waived or absorbed by the Advisor. Returns shown include Rule 12b-1 fees of up to 0.25% and do not reflect the deduction of taxes that a shareholder would pay on Fund distributions or the redemption of Fund shares. |
| 3 | Not annualized. |
| 4 | Annualized. |
| 5 | Effective November 30, 2022, the Advisor has contractually agreed to limit the annual fund operating expenses to 1.10%. Prior to November 30, 2022, the annual fund operating expense limitation was 1.25%. |
| 6 | Effective July 1, 2020, the Advisor has contractually agreed to limit the annual fund operating expenses to 1.25%. Prior to July 1, 2020, the annual fund operating expense limitation was 1.50%. |
See accompanying Notes to Financial Statements.
123
WCM SMID Quality Value Fund
FINANCIAL HIGHLIGHTS
Institutional Class
Per share operating performance.
For a capital share outstanding throughout each period.
| For the Year Ended December 31, | For the Period May 1, 2022 through December 31, | For the Year Ended April 30, | For the Period October 30, 2019* through April 30, | |||||||||||||||||
| 2023 | 2022^ | 2022 | 2021 | 2020 | ||||||||||||||||
| Net asset value, beginning of period | $ | 9.94 | $ | 10.38 | $ | 12.17 | $ | 7.73 | $ | 10.00 | ||||||||||
| Income from Investment Operations: | ||||||||||||||||||||
| Net investment income (loss)1 | (0.01 | ) | (0.02 | ) | (0.06 | ) | (0.05 | ) | (0.01 | ) | ||||||||||
| Net realized and unrealized gain (loss) | 2.40 | (0.24 | ) | (0.97 | ) | 4.49 | (2.26 | ) | ||||||||||||
| Total from investment operations | 2.39 | (0.26 | ) | (1.03 | ) | 4.44 | (2.27 | ) | ||||||||||||
| Less Distributions: | ||||||||||||||||||||
| From net realized gain | (0.10 | ) | (0.18 | ) | (0.76 | ) | - | - | ||||||||||||
| Total distributions | (0.10 | ) | (0.18 | ) | (0.76 | ) | - | - | ||||||||||||
| Net asset value, end of period | $ | 12.23 | $ | 9.94 | $ | 10.38 | $ | 12.17 | $ | 7.73 | ||||||||||
| Total return2 | 24.09 | % | (2.50 | )%3 | (9.08 | )% | 57.44 | % | (22.70 | )%3 | ||||||||||
| Ratios and Supplemental Data: | ||||||||||||||||||||
| Net assets, end of period (in thousands) | $ | 142,842 | $ | 117,974 | $ | 99,042 | $ | 99,267 | $ | 4,716 | ||||||||||
| Ratio of expenses to average net assets: | ||||||||||||||||||||
| Before fees waived and expenses absorbed | 1.27 | % | 1.39 | %4 | 1.52 | % | 1.72 | % | 15.24 | %4 | ||||||||||
| After fees waived and expenses absorbed | 0.85 | % | 0.98 | %4,5 | 1.00 | % | 1.00 | %6 | 1.25 | %4 | ||||||||||
| Ratio of net investment income (loss) to average net assets: | ||||||||||||||||||||
| Before fees waived and expenses absorbed | (0.54 | )% | (0.73 | )%4 | (1.01 | )% | (1.18 | )% | (14.26 | )%4 | ||||||||||
| After fees waived and expenses absorbed | (0.12 | )% | (0.32 | )%4 | (0.49 | )% | (0.46 | )% | (0.27 | )%4 | ||||||||||
| Portfolio turnover rate | 22 | % | 53 | %3 | 32 | % | 32 | % | 5 | %3 | ||||||||||
| * | Commencement of operations. |
| ^ | Fiscal year end changed to December 31, effective December 14, 2022. |
| 1 | Calculated based on average shares outstanding for the period. |
| 2 | Total returns would have been lower had expenses not been waived or absorbed by the Advisor. Returns do not reflect the deduction of taxes that a shareholder would pay on Fund distributions or the redemption of Fund shares. |
| 3 | Not annualized. |
| 4 | Annualized. |
| 5 | Effective November 30, 2022, the Advisor has contractually agreed to limit the annual fund operating expenses to 0.85%. Prior to November 30, 2022, the annual fund operating expense limitation was 1.00%. |
| 6 | Effective July 1, 2020, the Advisor has contractually agreed to limit the annual fund operating expenses to 1.00%. Prior to July 1, 2020, the annual fund operating expense limitation was 1.25%. |
See accompanying Notes to Financial Statements.
124
WCM China Quality Growth Fund
FINANCIAL HIGHLIGHTS
Investor Class
Per share operating performance.
For a capital share outstanding throughout each period.
| For the Year Ended December 31, | For the Period May 1, 2022 through December 31, | For the Year Ended April 30, | For the Period March 31, 2020* through April 30, | |||||||||||||||||
| 2023 | 2022^ | 2022 | 2021 | 2020 | ||||||||||||||||
| Net asset value, beginning of period | $ | 11.22 | $ | 11.19 | $ | 18.05 | $ | 10.65 | $ | 10.00 | ||||||||||
| Income from Investment Operations: | ||||||||||||||||||||
| Net investment income (loss)1 | 0.05 | 0.02 | (0.11 | ) | (0.17 | ) | (0.01 | ) | ||||||||||||
| Net realized and unrealized gain (loss) | (2.13 | ) | 0.03 | (5.44 | ) | 7.95 | 0.66 | |||||||||||||
| Net increase from payments by affiliates | - | - | - | - | 2 | - | ||||||||||||||
| Total from investment operations | (2.08 | ) | 0.05 | (5.55 | ) | 7.78 | 0.65 | |||||||||||||
| Less Distributions: | ||||||||||||||||||||
| From net investment income | (0.07 | ) | (0.02 | ) | - | - | - | |||||||||||||
| From net realized gain | - | - | (1.31 | ) | (0.38 | ) | - | |||||||||||||
| Total distributions | (0.07 | ) | (0.02 | ) | (1.31 | ) | (0.38 | ) | - | |||||||||||
| Net asset value, end of period | $ | 9.07 | $ | 11.22 | $ | 11.19 | $ | 18.05 | $ | 10.65 | ||||||||||
| Total return3 | (18.49 | )% | 0.42 | %4 | (32.83 | )% | 73.73 | %5 | 6.50 | %4 | ||||||||||
| Ratios and Supplemental Data: | ||||||||||||||||||||
| Net assets, end of period (in thousands) | $ | 131 | $ | 157 | $ | 138 | $ | 177 | $ | 11 | ||||||||||
| Ratio of expenses to average net assets: | ||||||||||||||||||||
| Before fees waived and expenses absorbed | 5.46 | %6 | 4.52 | %7 | 3.92 | % | 6.21 | % | 18.03 | %7 | ||||||||||
| After fees waived and expenses absorbed | 1.50 | %6 | 1.50 | %7 | 1.50 | % | 1.50 | % | 1.50 | %7 | ||||||||||
| Ratio of net investment income (loss) to average net assets: | ||||||||||||||||||||
| Before fees waived and expenses absorbed | (3.46 | )% | (2.70 | )%7 | (3.09 | )% | (5.72 | )% | (17.69 | )%7 | ||||||||||
| After fees waived and expenses absorbed | 0.50 | % | 0.32 | %7 | (0.67 | )% | (1.01 | )% | (1.16 | )%7 | ||||||||||
| Portfolio turnover rate | 57 | % | 26 | %4 | 56 | % | 57 | % | - | %4 | ||||||||||
| * | Commencement of operations. |
| ^ | Fiscal year end changed to December 31, effective December 14, 2022. |
| 1 | Calculated based on average shares outstanding for the period. |
| 2 | Amount represents less than $0.01 per share. |
| 3 | Total returns would have been lower had expenses not been waived or absorbed by the Advisor. Returns shown include Rule 12b-1 fees of up to 0.25% and do not reflect the deduction of taxes that a shareholder would pay on Fund distributions or the redemption of Fund shares. |
| 4 | Not annualized. |
| 5 | The Advisor reimbursed the Fund $1,692 for losses from a trade error. This reimbursement had a positive 0.10% impact on the total return. |
| 6 | If tax expense had been excluded, the expense ratios would have been lowered by 0.00% for the year ended December 31, 2023. |
| 7 | Annualized. |
See accompanying Notes to Financial Statements.
125
WCM China Quality Growth Fund
FINANCIAL HIGHLIGHTS
Institutional Class
Per share operating performance.
For a capital share outstanding throughout each period.
| For the Year Ended December 31, | For the Period May 1, 2022 through December 31, | For the Year Ended April 30, | For the Period March 31, 2020* through April 30, | |||||||||||||||||
| 2023 | 2022^ | 2022 | 2021 | 2020 | ||||||||||||||||
| Net asset value, beginning of period | $ | 11.28 | $ | 11.25 | $ | 18.10 | $ | 10.65 | $ | 10.00 | ||||||||||
| Income from Investment Operations: | ||||||||||||||||||||
| Net investment income (loss)1 | 0.08 | 0.04 | (0.07 | ) | (0.12 | ) | (0.01 | ) | ||||||||||||
| Net realized and unrealized gain (loss) | (2.14 | ) | 0.02 | (5.47 | ) | 7.95 | 0.66 | |||||||||||||
| Net increase from payments by affiliates | - | - | - | - | 2 | - | ||||||||||||||
| Total from investment operations | (2.06 | ) | 0.06 | (5.54 | ) | 7.83 | 0.65 | |||||||||||||
| Less Distributions: | ||||||||||||||||||||
| From net investment income | (0.10 | ) | (0.03 | ) | - | - | - | |||||||||||||
| From net realized gain | - | - | (1.31 | ) | (0.38 | ) | - | |||||||||||||
| Total distributions | (0.10 | ) | (0.03 | ) | (1.31 | ) | (0.38 | ) | - | |||||||||||
| Net asset value, end of period | $ | 9.12 | $ | 11.28 | $ | 11.25 | $ | 18.10 | $ | 10.65 | ||||||||||
| Total return3 | (18.26 | )% | 0.57 | %4 | (32.68 | )% | 74.20 | %5 | 6.50 | %4 | ||||||||||
| Ratios and Supplemental Data: | ||||||||||||||||||||
| Net assets, end of period (in thousands) | $ | 4,451 | $ | 6,849 | $ | 10,629 | $ | 13,605 | $ | 2,391 | ||||||||||
| Ratio of expenses to average net assets: | ||||||||||||||||||||
| Before fees waived and expenses absorbed | 5.21 | %6 | 4.27 | %7 | 3.67 | % | 5.96 | % | 17.78 | %7 | ||||||||||
| After fees waived and expenses absorbed | 1.25 | %6 | 1.25 | %7 | 1.25 | % | 1.25 | % | 1.25 | %7 | ||||||||||
| Ratio of net investment income (loss) to average net assets: | ||||||||||||||||||||
| Before fees waived and expenses absorbed | (3.21 | )% | (2.45 | )%7 | (2.84 | )% | (5.47 | )% | (17.42 | )%7 | ||||||||||
| After fees waived and expenses absorbed | 0.75 | % | 0.57 | %7 | (0.42 | )% | (0.76 | )% | (0.89 | )%7 | ||||||||||
| Portfolio turnover rate | 57 | % | 26 | %4 | 56 | % | 57 | % | - | %4 | ||||||||||
| * | Commencement of operations. |
| ^ | Fiscal year end changed to December 31, effective December 14, 2022. |
| 1 | Calculated based on average shares outstanding for the period. |
| 2 | Amount represents less than $0.01 per share. |
| 3 | Total returns would have been lower had expenses not been waived or absorbed by the Advisor. Returns do not reflect the deduction of taxes that a shareholder would pay on Fund distributions or the redemption of Fund shares. |
| 4 | Not annualized. |
| 5 | The Advisor reimbursed the Fund $1,692 for losses from a trade error. This reimbursement had a positive 0.10% impact on the total return. |
| 6 | If tax expense had been excluded, the expense ratios would have been lowered by 0.00% for the year ended December 31, 2023. |
| 7 | Annualized. |
See accompanying Notes to Financial Statements.
126
WCM Developing World Equity Fund
FINANCIAL HIGHLIGHTS
Investor Class
Per share operating performance.
For a capital share outstanding throughout each period.
| For the Year Ended December 31, | For the Period May 1, 2022 through December 31, | For the Year Ended April 30, | For the Period March 31, 2020* through April 30, | |||||||||||||||||
| 2023 | 2022^ | 2022 | 2021 | 2020 | ||||||||||||||||
| Net asset value, beginning of period | $ | 12.12 | $ | 12.83 | $ | 15.11 | $ | 10.99 | $ | 10.00 | ||||||||||
| Income from Investment Operations: | ||||||||||||||||||||
| Net investment income (loss)1 | 0.12 | 0.07 | 0.02 | (0.03 | ) | 0.03 | ||||||||||||||
| Net realized and unrealized gain (loss) | 0.67 | (0.64 | ) | (1.83 | ) | 4.59 | 0.96 | |||||||||||||
| Total from investment operations | 0.79 | (0.57 | ) | (1.81 | ) | 4.56 | 0.99 | |||||||||||||
| Less Distributions: | ||||||||||||||||||||
| From net investment income | (0.12 | ) | (0.14 | ) | - | (0.03 | ) | - | ||||||||||||
| From net realized gain | - | - | (0.47 | ) | (0.41 | ) | - | |||||||||||||
| Total distributions | (0.12 | ) | (0.14 | ) | (0.47 | ) | (0.44 | ) | - | |||||||||||
| Net asset value, end of period | $ | 12.79 | $ | 12.12 | $ | 12.83 | $ | 15.11 | $ | 10.99 | ||||||||||
| Total return2 | 6.59 | % | (4.42 | )%3 | (12.24 | )% | 41.48 | % | 10.00 | %3 | ||||||||||
| Ratios and Supplemental Data: | ||||||||||||||||||||
| Net assets, end of period (in thousands) | $ | 169 | $ | 321 | $ | 35 | $ | 24 | $ | 11 | ||||||||||
| Ratio of expenses to average net assets: | ||||||||||||||||||||
| Before fees waived and expenses absorbed | 15.66 | %4 | 14.00 | %5 | 13.25 | % | 32.13 | % | 71.14 | %5 | ||||||||||
| After fees waived and expenses absorbed | 1.44 | %4,6 | 1.50 | %5 | 1.50 | % | 1.50 | % | 1.50 | %5 | ||||||||||
| Ratio of net investment income (loss) to average net assets: | ||||||||||||||||||||
| Before fees waived and expenses absorbed | (13.24 | )% | (11.57 | )%5 | (11.60 | )% | (30.87 | )% | (66.39 | )%5 | ||||||||||
| After fees waived and expenses absorbed | 0.98 | % | 0.93 | %5 | 0.15 | % | (0.24 | )% | 3.25 | %5 | ||||||||||
| Portfolio turnover rate | 46 | % | 30 | %3 | 67 | % | 41 | % | 6 | %3 | ||||||||||
| * | Commencement of operations. |
| ^ | Fiscal year end changed to December 31, effective December 14, 2022. |
| 1 | Calculated based on average shares outstanding for the period. |
| 2 | Total returns would have been lower had expenses not been waived or absorbed by the Advisor. Returns shown include Rule 12b-1 fees of up to 0.25% and do not reflect the deduction of taxes that a shareholder would pay on Fund distributions or the redemption of Fund shares. |
| 3 | Not annualized. |
| 4 | If tax expense had been excluded, the expense ratios would have been lowered by 0.00% for the year ended December 31, 2023. |
| 5 | Annualized. |
| 6 | Effective October 1, 2023, the Advisor has contractually agreed to limit the annual operating expenses to 1.20%. Prior to October 1, 2023, the Advisor had contractually agreed to limit the annual operating expenses to 1.50%. |
See accompanying Notes to Financial Statements.
127
WCM Developing World Equity Fund
FINANCIAL HIGHLIGHTS
Institutional Class
Per share operating performance.
For a capital share outstanding throughout each period.
| For the Year Ended December 31, | For the Period May 1, 2022 through December 31, | For the Year Ended April 30, | For the Period March 31, 2020* through April 30, | |||||||||||||||||
| 2023 | 2022^ | 2022 | 2021 | 2020 | ||||||||||||||||
| Net asset value, beginning of period | $ | 12.18 | $ | 12.88 | $ | 15.15 | $ | 10.99 | $ | 10.00 | ||||||||||
| Income from Investment Operations: | ||||||||||||||||||||
| Net investment income (loss)1 | 0.15 | 0.09 | 0.06 | - | 0.03 | |||||||||||||||
| Net realized and unrealized gain (loss) | 0.68 | (0.63 | ) | (1.85 | ) | 4.60 | 0.96 | |||||||||||||
| Total from investment operations | 0.83 | (0.54 | ) | (1.79 | ) | 4.60 | 0.99 | |||||||||||||
| Less Distributions: | ||||||||||||||||||||
| From net investment income | (0.19 | ) | (0.16 | ) | (0.01 | ) | (0.03 | ) | - | |||||||||||
| From net realized gain | - | - | (0.47 | ) | (0.41 | ) | - | |||||||||||||
| Total distributions | (0.19 | ) | (0.16 | ) | (0.48 | ) | (0.44 | ) | - | |||||||||||
| Net asset value, end of period | $ | 12.82 | $ | 12.18 | $ | 12.88 | $ | 15.15 | $ | 10.99 | ||||||||||
| Total return2 | 6.86 | % | (4.22 | )%3 | (12.06 | )% | 41.73 | % | 10.10 | %3 | ||||||||||
| Ratios and Supplemental Data: | ||||||||||||||||||||
| Net assets, end of period (in thousands) | $ | 1,901 | $ | 1,896 | $ | 2,767 | $ | 1,495 | $ | 571 | ||||||||||
| Ratio of expenses to average net assets: | ||||||||||||||||||||
| Before fees waived and expenses absorbed | 15.41 | %4 | 13.75 | %5 | 13.00 | % | 31.88 | % | 70.89 | %5 | ||||||||||
| After fees waived and expenses absorbed | 1.19 | %4,6 | 1.25 | %5 | 1.25 | % | 1.25 | % | 1.25 | %5 | ||||||||||
| Ratio of net investment income (loss) to average net assets: | ||||||||||||||||||||
| Before fees waived and expenses absorbed | (12.99 | )% | (11.32 | )%5 | (11.35 | )% | (30.62 | )% | (66.08 | )%5 | ||||||||||
| After fees waived and expenses absorbed | 1.23 | % | 1.18 | %5 | 0.40 | % | 0.01 | % | 3.56 | %5 | ||||||||||
| Portfolio turnover rate | 46 | % | 30 | %3 | 67 | % | 41 | % | 6 | %3 | ||||||||||
| * | Commencement of operations. |
| ^ | Fiscal year end changed to December 31, effective December 14, 2022. |
| 1 | Calculated based on average shares outstanding for the period. |
| 2 | Total returns would have been lower had expenses not been waived or absorbed by the Advisor. Returns do not reflect the deduction of taxes that a shareholder would pay on Fund distributions or the redemption of Fund shares. |
| 3 | Not annualized. |
| 4 | If tax expense had been excluded, the expense ratios would have been lowered by 0.00% for the year ended December 31, 2023. |
| 5 | Annualized. |
| 6 | Effective October 1, 2023, the Advisor has contractually agreed to limit the annual operating expenses to 0.95%. Prior to October 1, 2023, the Advisor had contractually agreed to limit the annual operating expenses to 1.25%. |
See accompanying Notes to Financial Statements.
128
WCM International Equity Fund
FINANCIAL HIGHLIGHTS
Investor Class
Per share operating performance.
For a capital share outstanding throughout each period.
| For the Year Ended December 31, | For the Period May 1, 2022 through December 31, | For the Year Ended April 30, | For the Period March 31, 2020* through April 30, | |||||||||||||||||
| 2023 | 2022^ | 2022 | 2021 | 2020 | ||||||||||||||||
| Net asset value, beginning of period | $ | 13.20 | $ | 13.62 | $ | 14.90 | $ | 10.92 | $ | 10.00 | ||||||||||
| Income from Investment Operations: | ||||||||||||||||||||
| Net investment income (loss)1 | 0.12 | (0.02 | ) | 0.04 | (0.02 | ) | 0.01 | |||||||||||||
| Net realized and unrealized gain (loss) | 1.65 | (0.40 | ) | (0.90 | ) | 4.22 | 0.91 | |||||||||||||
| Total from investment operations | 1.77 | (0.42 | ) | (0.86 | ) | 4.20 | 0.92 | |||||||||||||
| Less Distributions: | ||||||||||||||||||||
| From net investment income | (0.10 | ) | - | 2 | (0.01 | ) | - | - | ||||||||||||
| From net realized gain | (0.33 | ) | - | 2 | (0.41 | ) | (0.22 | ) | - | |||||||||||
| Total distributions | (0.43 | ) | - | (0.42 | ) | (0.22 | ) | - | ||||||||||||
| Net asset value, end of period | $ | 14.54 | $ | 13.20 | $ | 13.62 | $ | 14.90 | $ | 10.92 | ||||||||||
| Total return3 | 13.59 | % | (3.07 | )%4 | (6.04 | )% | 38.49 | % | 9.30 | %4 | ||||||||||
| Ratios and Supplemental Data: | ||||||||||||||||||||
| Net assets, end of period (in thousands) | $ | 624 | $ | 323 | $ | 23 | $ | 17 | $ | 11 | ||||||||||
| Ratio of expenses to average net assets: | ||||||||||||||||||||
| Before fees waived and expenses absorbed | 1.73 | % | 2.98 | %5 | 7.92 | % | 29.79 | % | 69.30 | %5 | ||||||||||
| After fees waived and expenses absorbed | 1.28 | %6 | 1.50 | %5,7 | 1.50 | % | 1.50 | % | 1.50 | %5 | ||||||||||
| Ratio of net investment income (loss) to average net assets: | ||||||||||||||||||||
| Before fees waived and expenses absorbed | 0.43 | % | (1.69 | )%5 | (6.17 | )% | (28.46 | )% | (66.82 | )%5 | ||||||||||
| After fees waived and expenses absorbed | 0.88 | % | (0.21 | )%5 | 0.25 | % | (0.17 | )% | 0.98 | %5 | ||||||||||
| Portfolio turnover rate | 39 | % | 20 | %4 | 59 | % | 19 | % | 9 | %4 | ||||||||||
| * | Commencement of operations. |
| ^ | Fiscal year end changed to December 31, effective December 14, 2022. |
| 1 | Calculated based on average shares outstanding for the period. |
| 2 | Amount represents less than $0.01 per share. |
| 3 | Total returns would have been lower had expenses not been waived or absorbed by the Advisor. Returns shown include Rule 12b-1 fees of up to 0.25% and do not reflect the deduction of taxes that a shareholder would pay on Fund distributions or the redemption of Fund shares. |
| 4 | Not annualized. |
| 5 | Annualized. |
| 6 | Effective October 1, 2023, the Advisor has contractually agreed to limit the annual operating expenses to 1.10%. Prior to October 1, 2023, the Advisor had contractually agreed to limit the annual operating expenses to 1.35%. |
| 7 | Effective December 31, 2022, the Advisor has contractually agreed to limit the annual operating expenses to 1.35%. Prior to December 31, 2022, the Advisor had contractually agreed to limit the annual operating expenses to 1.50%. |
See accompanying Notes to Financial Statements.
129
WCM International Equity Fund
FINANCIAL HIGHLIGHTS
Institutional Class
Per share operating performance.
For a capital share outstanding throughout each period.
| For the Year Ended December 31, | For the Period May 1, 2022 through December 31, | For the Year Ended April 30, | For the Period March 31, 2020* through April 30, | |||||||||||||||||
| 2023 | 2022^ | 2022 | 2021 | 2020 | ||||||||||||||||
| Net asset value, beginning of period | $ | 13.26 | $ | 13.66 | $ | 14.92 | $ | 10.92 | $ | 10.00 | ||||||||||
| Income from Investment Operations: | ||||||||||||||||||||
| Net investment income (loss)1 | 0.16 | - | 0.07 | 0.01 | 0.01 | |||||||||||||||
| Net realized and unrealized gain (loss) | 1.65 | (0.40 | ) | (0.89 | ) | 4.23 | 0.91 | |||||||||||||
| Total from investment operations | 1.81 | (0.40 | ) | (0.82 | ) | 4.24 | 0.92 | |||||||||||||
| Less Distributions: | ||||||||||||||||||||
| From net investment income | (0.13 | ) | - | 2 | (0.03 | ) | (0.02 | ) | - | |||||||||||
| From net realized gain | (0.33 | ) | - | 2 | (0.41 | ) | (0.22 | ) | - | |||||||||||
| Total distributions | (0.46 | ) | - | (0.44 | ) | (0.24 | ) | - | ||||||||||||
| Net asset value, end of period | $ | 14.61 | $ | 13.26 | $ | 13.66 | $ | 14.92 | $ | 10.92 | ||||||||||
| Total return3 | 13.83 | % | (2.90 | )%4 | (5.74 | )% | 38.83 | % | 9.30 | %4 | ||||||||||
| Ratios and Supplemental Data: | ||||||||||||||||||||
| Net assets, end of period (in thousands) | $ | 86,960 | $ | 59,425 | $ | 4,731 | $ | 2,751 | $ | 596 | ||||||||||
| Ratio of expenses to average net assets: | ||||||||||||||||||||
| Before fees waived and expenses absorbed | 1.48 | % | 2.73 | %5 | 7.67 | % | 29.54 | % | 69.05 | %5 | ||||||||||
| After fees waived and expenses absorbed | 1.03 | %6 | 1.25 | %5,7 | 1.25 | % | 1.25 | % | 1.25 | %5 | ||||||||||
| Ratio of net investment income (loss) to average net assets: | ||||||||||||||||||||
| Before fees waived and expenses absorbed | 0.68 | % | (1.44 | )%5 | (5.92 | )% | (28.21 | )% | (66.62 | )%5 | ||||||||||
| After fees waived and expenses absorbed | 1.13 | % | 0.04 | %5 | 0.50 | % | 0.08 | % | 1.18 | %5 | ||||||||||
| Portfolio turnover rate | 39 | % | 20 | %4 | 59 | % | 19 | % | 9 | %4 | ||||||||||
| * | Commencement of operations. |
| ^ | Fiscal year end changed to December 31, effective December 14, 2022. |
| 1 | Calculated based on average shares outstanding for the period. |
| 2 | Amount represents less than $0.01 per share. |
| 3 | Total returns would have been lower had expenses not been waived or absorbed by the Advisor. Returns do not reflect the deduction of taxes that a shareholder would pay on Fund distributions or the redemption of Fund shares. |
| 4 | Not annualized. |
| 5 | Annualized. |
| 6 | Effective October 1, 2023, the Advisor has contractually agreed to limit the annual operating expenses to 0.85%. Prior to October 1, 2023, the Advisor had contractually agreed to limit the annual operating expenses to 1.10%. |
| 7 | Effective December 31, 2022, the Advisor has contractually agreed to limit the annual operating expenses to 1.10%. Prior to December 31, 2022, the Advisor had contractually agreed to limit the annual operating expenses to 1.25%. |
See accompanying Notes to Financial Statements.
130
WCM Focused International Value Fund
FINANCIAL HIGHLIGHTS
Investor Class
Per share operating performance.
For a capital share outstanding throughout each period.
| For the Year Ended December 31, 2023 | For the Period May 1, 2022 through December 31, 2022^ | For the Year Ended April 30, 2022 | For the Period June 29, 2020* through April 30, 2021 | |||||||||||||
| Net asset value, beginning of period | $ | 11.35 | $ | 12.04 | $ | 14.22 | $ | 10.00 | ||||||||
| Income from Investment Operations: | ||||||||||||||||
| Net investment income (loss)1 | 0.05 | 0.05 | - | 2 | (0.03 | ) | ||||||||||
| Net realized and unrealized gain (loss) | 2.00 | (0.70 | ) | (2.18 | ) | 4.25 | ||||||||||
| Total from investment operations | 2.05 | (0.65 | ) | (2.18 | ) | 4.22 | ||||||||||
| Less Distributions: | ||||||||||||||||
| From net investment income | (0.09 | ) | (0.04 | ) | - | - | ||||||||||
| From net realized gain | - | - | - | 2 | - | |||||||||||
| Total distributions | (0.09 | ) | (0.04 | ) | - | 2 | - | |||||||||
| Net asset value, end of period | $ | 13.31 | $ | 11.35 | $ | 12.04 | $ | 14.22 | ||||||||
| Total return3 | 18.08 | % | (5.43 | )%4 | (15.31 | )% | 42.20 | %4 | ||||||||
| Ratios and Supplemental Data: | ||||||||||||||||
| Net assets, end of period (in thousands) | $ | 28 | $ | 48 | $ | 78 | $ | 49 | ||||||||
| Ratio of expenses to average net assets: | ||||||||||||||||
| Before fees waived and expenses absorbed | 3.61 | %5 | 2.88 | %6 | 4.36 | % | 18.35 | %6 | ||||||||
| After fees waived and expenses absorbed | 1.51 | %5 | 1.50 | %6 | 1.50 | % | 1.50 | %6 | ||||||||
| Ratio of net investment income (loss) to average net assets: | ||||||||||||||||
| Before fees waived and expenses absorbed | (1.68 | )% | (0.76 | )%6 | (2.86 | )% | (17.16 | )%6 | ||||||||
| After fees waived and expenses absorbed | 0.42 | % | 0.62 | %6 | 0.00 | % | (0.31 | )%6 | ||||||||
| Portfolio turnover rate | 38 | % | 43 | %4 | 23 | % | 12 | %4 | ||||||||
| * | Commencement of operations. |
| ^ | Fiscal year end changed to December 31, effective December 14, 2022. |
| 1 | Calculated based on average shares outstanding for the period. |
| 2 | Amount represents less than $0.01 per share. |
| 3 | Total returns would have been lower had expenses not been waived or absorbed by the Advisor. Returns shown include Rule 12b-1 fees of up to 0.25% and do not reflect the deduction of taxes that a shareholder would pay on Fund distributions or the redemption of Fund shares. |
| 4 | Not annualized. |
| 5 | If tax expense had been excluded, the expense ratios would have been lowered by 0.01% for the year ended December 31, 2023. |
| 6 | Annualized. |
See accompanying Notes to Financial Statements.
131
WCM Focused International Value Fund
FINANCIAL HIGHLIGHTS
Institutional Class
Per share operating performance.
For a capital share outstanding throughout each period.
| For the Year Ended December 31, 2023 | For the Period May 1, 2022 through December 31, 2022^ | For the Year Ended April 30, 2022 | For the Period June 29, 2020* through April 30, 2021 | |||||||||||||
| Net asset value, beginning of period | $ | 11.38 | $ | 12.09 | $ | 14.24 | $ | 10.00 | ||||||||
| Income from Investment Operations: | ||||||||||||||||
| Net investment income (loss)1 | 0.08 | 0.07 | 0.04 | (0.01 | ) | |||||||||||
| Net realized and unrealized gain (loss) | 2.01 | (0.71 | ) | (2.19 | ) | 4.25 | ||||||||||
| Total from investment operations | 2.09 | (0.64 | ) | (2.15 | ) | 4.24 | ||||||||||
| Less Distributions: | ||||||||||||||||
| From net investment income | (0.13 | ) | (0.07 | ) | - | 2 | - | |||||||||
| From net realized gain | - | - | - | 2 | - | |||||||||||
| Total distributions | (0.13 | ) | (0.07 | ) | - | 2 | - | |||||||||
| Net asset value, end of period | $ | 13.34 | $ | 11.38 | $ | 12.09 | $ | 14.24 | ||||||||
| Total return3 | 18.43 | % | (5.28 | )%4 | (15.07 | )% | 42.40 | %4 | ||||||||
| Ratios and Supplemental Data: | ||||||||||||||||
| Net assets, end of period (in thousands) | $ | 11,042 | $ | 16,030 | $ | 16,775 | $ | 3,194 | ||||||||
| Ratio of expenses to average net assets: | ||||||||||||||||
| Before fees waived and expenses absorbed | 3.36 | %5 | 2.63 | %6 | 4.11 | % | 18.10 | %6 | ||||||||
| After fees waived and expenses absorbed | 1.26 | %5 | 1.25 | %6 | 1.25 | % | 1.25 | %6 | ||||||||
| Ratio of net investment income (loss) to average net assets: | ||||||||||||||||
| Before fees waived and expenses absorbed | (1.43 | )% | (0.51 | )%6 | (2.61 | )% | (16.91 | )%6 | ||||||||
| After fees waived and expenses absorbed | 0.67 | % | 0.87 | %6 | 0.25 | % | (0.06 | )%6 | ||||||||
| Portfolio turnover rate | 38 | % | 43 | %4 | 23 | % | 12 | %4 | ||||||||
| * | Commencement of operations. |
| ^ | Fiscal year end changed to December 31, effective December 14, 2022. |
| 1 | Calculated based on average shares outstanding for the period. |
| 2 | Amount represents less than $0.01 per share. |
| 3 | Total returns would have been lower had expenses not been waived or absorbed by the Advisor. Returns do not reflect the deduction of taxes that a shareholder would pay on Fund distributions or the redemption of Fund shares. |
| 4 | Not annualized. |
| 5 | If tax expense had been excluded, the expense ratios would have been lowered by 0.01% for the year ended December 31, 2023. |
| 6 | Annualized. |
See accompanying Notes to Financial Statements.
132
WCM Focused International Opportunities Fund
FINANCIAL HIGHLIGHTS
Investor Class
Per share operating performance.
For a capital share outstanding throughout each period.
| For the Year Ended December 31, 2023 | For the Period May 1, 2022 through December 31, 2022^ | For the Year Ended April 30, 2022 | For the Period March 30, 2021* through April 30, 2021 | |||||||||||||
| Net asset value, beginning of period | $ | 7.62 | $ | 8.33 | $ | 10.85 | $ | 10.00 | ||||||||
| Income from Investment Operations: | ||||||||||||||||
| Net investment income (loss)1 | (0.01 | ) | (0.02 | ) | (0.11 | ) | - | 2 | ||||||||
| Net realized and unrealized gain (loss) | 1.96 | (0.69 | ) | (2.40 | ) | 0.85 | ||||||||||
| Total from investment operations | 1.95 | (0.71 | ) | (2.51 | ) | 0.85 | ||||||||||
| Less Distributions: | ||||||||||||||||
| From net investment income | (0.02 | ) | - | - | - | |||||||||||
| From net realized gain | - | - | (0.01 | ) | - | |||||||||||
| Total distributions | (0.02 | ) | - | (0.01 | ) | - | ||||||||||
| Net asset value, end of period | $ | 9.55 | $ | 7.62 | $ | 8.33 | $ | 10.85 | ||||||||
| Total return3 | 25.65 | % | (8.52 | )%4 | (23.14 | )% | 8.50 | %4 | ||||||||
| Ratios and Supplemental Data: | ||||||||||||||||
| Net assets, end of period (in thousands) | $ | 142 | $ | 87 | $ | 92 | $ | 11 | ||||||||
| Ratio of expenses to average net assets: | ||||||||||||||||
| Before fees waived and expenses absorbed | 2.30 | % | 2.84 | %5 | 5.20 | % | 60.78 | %5 | ||||||||
| After fees waived and expenses absorbed | 1.50 | % | 1.50 | %5 | 1.50 | % | 1.50 | %5 | ||||||||
| Ratio of net investment income (loss) to average net assets: | ||||||||||||||||
| Before fees waived and expenses absorbed | (0.89 | )% | (1.72 | )%5 | (4.77 | )% | (59.25 | )%5 | ||||||||
| After fees waived and expenses absorbed | (0.09 | )% | (0.38 | )%5 | (1.07 | )% | 0.03 | %5 | ||||||||
| Portfolio turnover rate | 87 | % | 74 | %4 | 59 | % | 3 | %4 | ||||||||
| * | Commencement of operations. |
| ^ | Fiscal year end changed to December 31, effective December 14, 2022. |
| 1 | Calculated based on average shares outstanding for the period. |
| 2 | Amount represents less than $0.01 per share. |
| 3 | Total returns would have been lower had expenses not been waived or absorbed by the Advisor. Returns shown include Rule 12b-1 fees of up to 0.25% and do not reflect the deduction of taxes that a shareholder would pay on Fund distributions or the redemption of Fund shares. |
| 4 | Not annualized. |
| 5 | Annualized. |
See accompanying Notes to Financial Statements.
133
WCM Focused International Opportunities Fund
FINANCIAL HIGHLIGHTS
Institutional Class
Per share operating performance.
For a capital share outstanding throughout each period.
| For the Year Ended December 31, 2023 | For the Period May 1, 2022 through December 31, 2022^ | For the Year Ended April 30, 2022 | For the Period March 30, 2021* through April 30, 2021 | |||||||||||||
| Net asset value, beginning of period | $ | 7.66 | $ | 8.35 | $ | 10.86 | $ | 10.00 | ||||||||
| Income from Investment Operations: | ||||||||||||||||
| Net investment income (loss)1 | 0.01 | (0.01 | ) | (0.09 | ) | - | 2 | |||||||||
| Net realized and unrealized gain (loss) | 1.96 | (0.68 | ) | (2.41 | ) | 0.86 | ||||||||||
| Total from investment operations | 1.97 | (0.69 | ) | (2.50 | ) | 0.86 | ||||||||||
| Less Distributions: | ||||||||||||||||
| From net investment income | (0.04 | ) | - | - | - | |||||||||||
| From net realized gain | - | - | (0.01 | ) | - | |||||||||||
| Total distributions | (0.04 | ) | - | (0.01 | ) | - | ||||||||||
| Net asset value, end of period | $ | 9.59 | $ | 7.66 | $ | 8.35 | $ | 10.86 | ||||||||
| Total return3 | 25.80 | % | (8.26 | )%4 | (23.02 | )% | 8.60 | %4 | ||||||||
| Ratios and Supplemental Data: | ||||||||||||||||
| Net assets, end of period (in thousands) | $ | 36,829 | $ | 24,276 | $ | 21,038 | $ | 766 | ||||||||
| Ratio of expenses to average net assets: | ||||||||||||||||
| Before fees waived and expenses absorbed | 2.05 | % | 2.59 | %5 | 4.95 | % | 60.53 | %5 | ||||||||
| After fees waived and expenses absorbed | 1.25 | % | 1.25 | %5 | 1.25 | % | 1.25 | %5 | ||||||||
| Ratio of net investment income (loss) to average net assets: | ||||||||||||||||
| Before fees waived and expenses absorbed | (0.64 | )% | (1.47 | )%5 | (4.52 | )% | (59.00 | )%5 | ||||||||
| After fees waived and expenses absorbed | 0.16 | % | (0.13 | )%5 | (0.82 | )% | 0.28 | %5 | ||||||||
| Portfolio turnover rate | 87 | % | 74 | %4 | 59 | % | 3 | %4 | ||||||||
| * | Commencement of operations. |
| ^ | Fiscal year end changed to December 31, effective December 14, 2022. |
| 1 | Calculated based on average shares outstanding for the period. |
| 2 | Amount represents less than $0.01 per share. |
| 3 | Total returns would have been lower had expenses not been waived or absorbed by the Advisor. Returns do not reflect the deduction of taxes that a shareholder would pay on Fund distributions or the redemption of Fund shares. |
| 4 | Not annualized. |
| 5 | Annualized. |
See accompanying Notes to Financial Statements.
134
WCM Mid Cap Quality Value Fund
FINANCIAL HIGHLIGHTS
Investor Class
Per share operating performance.
For a capital share outstanding throughout each period.
| For the Year Ended December 31, 2023 | For the Period July 28, 2022* through December 31, 2022^ | |||||||
| Net asset value, beginning of period | $ | 9.27 | $ | 10.00 | ||||
| Income from Investment Operations: | ||||||||
| Net investment income (loss)1 | (0.03 | ) | (0.01 | ) | ||||
| Net realized and unrealized gain (loss) | 2.68 | (0.72 | ) | |||||
| Total from investment operations | 2.65 | (0.73 | ) | |||||
| Less Distributions: | ||||||||
| From net investment income | (0.01 | ) | - | |||||
| From net realized gain | (0.18 | ) | - | |||||
| Total distributions | (0.19 | ) | - | |||||
| Net asset value, end of period | $ | 11.73 | $ | 9.27 | ||||
| Total return2 | 28.72 | % | (7.30 | )%3 | ||||
| Ratios and Supplemental Data: | ||||||||
| Net assets, end of period (in thousands) | $ | 12 | $ | 9 | ||||
| Ratio of expenses to average net assets: | ||||||||
| Before fees waived and expenses absorbed | 36.72 | %4 | 56.33 | %5 | ||||
| After fees waived and expenses absorbed | 1.25 | %4 | 1.25 | %5 | ||||
| Ratio of net investment income (loss) to average net assets: | ||||||||
| Before fees waived and expenses absorbed | (35.78 | )% | (55.37 | )%5 | ||||
| After fees waived and expenses absorbed | (0.31 | )% | (0.29 | )%5 | ||||
| Portfolio turnover rate | 15 | % | 13 | %3 | ||||
| * | Commencement of operations. |
| ^ | Fiscal year end changed to December 31, effective December 14, 2022. |
| 1 | Calculated based on average shares outstanding for the period. |
| 2 | Total returns would have been lower had expenses not been waived or absorbed by the Advisor. Returns shown include Rule 12b-1 fees of up to 0.25% and do not reflect the deduction of taxes that a shareholder would pay on Fund distributions or the redemption of Fund shares. |
| 3 | Not annualized. |
| 4 | If tax expense had been excluded, the expense ratios would have been lowered by 0.00% for the year ended December 31, 2023. |
| 5 | Annualized. |
See accompanying Notes to Financial Statements.
135
WCM Mid Cap Quality Value Fund
FINANCIAL HIGHLIGHTS
Institutional Class
Per share operating performance.
For a capital share outstanding throughout each period.
| For the Year Ended December 31, 2023 | For the Period July 28, 2022* through December 31, 2022^ | |||||||
| Net asset value, beginning of period | $ | 9.27 | $ | 10.00 | ||||
| Income from Investment Operations: | ||||||||
| Net investment income (loss)1 | (0.01 | ) | - | 2 | ||||
| Net realized and unrealized gain (loss) | 2.70 | (0.72 | ) | |||||
| Total from investment operations | 2.69 | (0.72 | ) | |||||
| Less Distributions: | ||||||||
| From net investment income | (0.04 | ) | (0.01 | ) | ||||
| From net realized gain | (0.18 | ) | - | |||||
| Total distributions | (0.22 | ) | (0.01 | ) | ||||
| Net asset value, end of period | $ | 11.74 | $ | 9.27 | ||||
| Total return3 | 29.13 | % | (7.22 | )%4 | ||||
| Ratios and Supplemental Data: | ||||||||
| Net assets, end of period (in thousands) | $ | 895 | $ | 571 | ||||
| Ratio of expenses to average net assets: | ||||||||
| Before fees waived and expenses absorbed | 36.47 | %5 | 56.08 | %6 | ||||
| After fees waived and expenses absorbed | 1.00 | %5 | 1.00 | %6 | ||||
| Ratio of net investment income (loss) to average net assets: | ||||||||
| Before fees waived and expenses absorbed | (35.53 | )% | (55.12 | )%6 | ||||
| After fees waived and expenses absorbed | (0.06 | )% | (0.04 | )%6 | ||||
| Portfolio turnover rate | 15 | % | 13 | %4 | ||||
| * | Commencement of operations. |
| ^ | Fiscal year end changed to December 31, effective December 14, 2022. |
| 1 | Calculated based on average shares outstanding for the period. |
| 2 | Amount represents less than $0.01 per share. |
| 3 | Total returns would have been lower had expenses not been waived or absorbed by the Advisor. Returns do not reflect the deduction of taxes that a shareholder would pay on Fund distributions or the redemption of Fund shares. |
| 4 | Not annualized. |
| 5 | If tax expense had been excluded, the expense ratios would have been lowered by 0.00% for the year ended December 31, 2023. |
| 6 | Annualized. |
See accompanying Notes to Financial Statements.
136
WCM Focused Emerging Markets ex China Fund
FINANCIAL HIGHLIGHTS
Investor Class
Per share operating performance.
For a capital share outstanding throughout each period.
| For the Year Ended December 31, 2023 | For the Period December 29, 2022* through December 31, 2022 | |||||||
| Net asset value, beginning of period | $ | 9.91 | $ | 10.00 | ||||
| Income from Investment Operations: | ||||||||
| Net investment income (loss)1 | 0.02 | - | ||||||
| Net realized and unrealized gain (loss) | 2.82 | (0.09 | ) | |||||
| Total from investment operations | 2.84 | (0.09 | ) | |||||
| Less Distributions: | ||||||||
| From net investment income | - | 2 | - | |||||
| Total distributions | - | - | ||||||
| Net asset value, end of period | $ | 12.75 | $ | 9.91 | ||||
| Total return3 | 28.70 | % | (0.90 | )%4 | ||||
| Ratios and Supplemental Data: | ||||||||
| Net assets, end of period (in thousands) | $ | 13 | $ | 10 | ||||
| Ratio of expenses to average net assets: | ||||||||
| Before fees waived and expenses absorbed | 16.78 | % | 416.99 | %5 | ||||
| After fees waived and expenses absorbed | 1.50 | % | 1.50 | %5 | ||||
| Ratio of net investment income (loss) to average net assets: | ||||||||
| Before fees waived and expenses absorbed | (15.07 | )% | (416.99 | )%5 | ||||
| After fees waived and expenses absorbed | 0.21 | % | (1.50 | )%5 | ||||
| Portfolio turnover rate | 37 | % | - | %4 | ||||
| * | Commencement of operations. |
| 1 | Calculated based on average shares outstanding for the period. |
| 2 | Amount represents less than $0.01 per share. |
| 3 | Total returns would have been lower had expenses not been waived or absorbed by the Advisor. Returns shown include Rule 12b-1 fees of up to 0.25% and do not reflect the deduction of taxes that a shareholder would pay on Fund distributions or the redemption of Fund shares. |
| 4 | Not annualized. |
| 5 | Annualized. |
See accompanying Notes to Financial Statements.
137
WCM Focused Emerging Markets ex China Fund
FINANCIAL HIGHLIGHTS
Institutional Class
Per share operating performance.
For a capital share outstanding throughout each period.
| For the Year Ended December 31, 2023 | For the Period December 29, 2022* through December 31, 2022 | |||||||
| Net asset value, beginning of period | $ | 9.91 | $ | 10.00 | ||||
| Income from Investment Operations: | ||||||||
| Net investment income (loss)1 | 0.05 | - | ||||||
| Net realized and unrealized gain (loss) | 2.82 | (0.09 | ) | |||||
| Total from investment operations | 2.87 | (0.09 | ) | |||||
| Less Distributions: | ||||||||
| From net investment income | (0.03 | ) | - | |||||
| Total distributions | (0.03 | ) | - | |||||
| Net asset value, end of period | $ | 12.75 | $ | 9.91 | ||||
| Total return2 | 29.00 | % | (0.90 | )%3 | ||||
| Ratios and Supplemental Data: | ||||||||
| Net assets, end of period (in thousands) | $ | 6,547 | $ | 485 | ||||
| Ratio of expenses to average net assets: | ||||||||
| Before fees waived and expenses absorbed | 16.53 | % | 416.74 | %4 | ||||
| After fees waived and expenses absorbed | 1.25 | % | 1.25 | %4 | ||||
| Ratio of net investment income (loss) to average net assets: | ||||||||
| Before fees waived and expenses absorbed | (14.82 | )% | (416.74 | )%4 | ||||
| After fees waived and expenses absorbed | 0.46 | % | (1.25 | )%4 | ||||
| Portfolio turnover rate | 37 | % | - | %3 | ||||
| * | Commencement of operations. |
| 1 | Calculated based on average shares outstanding for the period. |
| 2 | Total returns would have been lower had expenses not been waived or absorbed by the Advisor. Returns do not reflect the deduction of taxes that a shareholder would pay on Fund distributions or the redemption of Fund shares. |
| 3 | Not annualized. |
| 4 | Annualized. |
See accompanying Notes to Financial Statements.
138
WCM Quality Dividend Growth Fund
FINANCIAL HIGHLIGHTS
Investor Class
Per share operating performance.
For a capital share outstanding throughout each period.
For the Period July 28, 2023* through December 31, 2023 | ||||
| Net asset value, beginning of period | $ | 10.00 | ||
| Income from Investment Operations: | ||||
| Net investment income (loss)1 | 0.07 | |||
| Net realized and unrealized gain (loss) | 0.02 | |||
| Total from investment operations | 0.09 | |||
| Less Distributions: | ||||
| From net investment income | (0.06 | ) | ||
| Total distributions | (0.06 | ) | ||
| Net asset value, end of period | $ | 10.03 | ||
| Total return2 | 0.95 | %3 | ||
| Ratios and Supplemental Data: | ||||
| Net assets, end of period (in thousands) | $ | 48 | ||
| Ratio of expenses to average net assets: | ||||
| Before fees waived and expenses absorbed | 26.97 | %4 | ||
| After fees waived and expenses absorbed | 1.24 | %4 | ||
| Ratio of net investment income (loss) to average net assets: | ||||
| Before fees waived and expenses absorbed | (24.05 | )%4 | ||
| After fees waived and expenses absorbed | 1.68 | %4 | ||
| Portfolio turnover rate | 1 | %3 | ||
| * | Commencement of operations. |
| 1 | Calculated based on average shares outstanding for the period. |
| 2 | Total returns would have been lower had expenses not been waived or absorbed by the Advisor. Returns do not reflect the deduction of taxes that a shareholder would pay on Fund distributions or the redemption of Fund shares. |
| 3 | Not annualized. |
| 4 | Annualized. |
See accompanying Notes to Financial Statements.
139
WCM Quality Dividend Growth Fund
FINANCIAL HIGHLIGHTS
Institutional Class
Per share operating performance.
For a capital share outstanding throughout each period.
For the Period July 28, 2023* through December 31, 2023 | ||||
| Net asset value, beginning of period | $ | 10.00 | ||
| Income from Investment Operations: | ||||
| Net investment income (loss)1 | 0.08 | |||
| Net realized and unrealized gain (loss) | 0.02 | |||
| Total from investment operations | 0.10 | |||
| Less Distributions: | ||||
| From net investment income | (0.07 | ) | ||
| Total distributions | (0.07 | ) | ||
| Net asset value, end of period | $ | 10.03 | ||
| Total return2 | 1.02 | %3 | ||
| Ratios and Supplemental Data: | ||||
| Net assets, end of period (in thousands) | $ | 6,351 | ||
| Ratio of expenses to average net assets: | ||||
| Before fees waived and expenses absorbed | 26.72 | %4 | ||
| After fees waived and expenses absorbed | 0.99 | %4 | ||
| Ratio of net investment income (loss) to average net assets: | ||||
| Before fees waived and expenses absorbed | (23.80 | )%4 | ||
| After fees waived and expenses absorbed | 1.93 | %4 | ||
| Portfolio turnover rate | 1 | %3 | ||
| * | Commencement of operations. |
| 1 | Calculated based on average shares outstanding for the period. |
| 2 | Total returns would have been lower had expenses not been waived or absorbed by the Advisor. Returns do not reflect the deduction of taxes that a shareholder would pay on Fund distributions or the redemption of Fund shares. |
| 3 | Not annualized. |
| 4 | Annualized. |
See accompanying Notes to Financial Statements.
140
WCM Funds
NOTES TO FINANCIAL STATEMENTS
December 31, 2023
Note 1 – Organization
WCM Focused International Growth Fund (‘‘International Growth” or “International Growth Fund”), WCM Focused Emerging Markets Fund (“Emerging Markets” or “Emerging Markets Fund”), WCM Focused Global Growth Fund (“Global Growth” or “Global Growth Fund”), WCM International Small Cap Growth Fund (the ‘‘International Small Cap Growth” or “International Small Cap Growth Fund”), WCM Small Cap Growth Fund (“Small Cap Growth” or “Small Cap Growth Fund”), WCM SMID Quality Value Fund (“SMID Quality Value” or “SMID Quality Value Fund”), WCM China Quality Growth Fund (“China Quality Growth” or “China Quality Growth Fund”), WCM Developing World Equity Fund (”Developing World Equity” or “Developing World Equity Fund”), WCM International Equity Fund (”International Equity” or “International Equity Fund”), WCM Focused International Value Fund (“International Value” or “International Value Fund”), WCM Focused International Opportunities Fund (“International Opportunities” or “International Opportunities Fund”), WCM Mid Cap Quality Value Fund (“Mid Cap Quality Value” or “Mid Cap Quality Value Fund”), WCM Focused Emerging Markets ex China Fund (“Emerging Markets ex China” or “Emerging Markets ex China Fund”), and WCM Quality Dividend Growth Fund (“Quality Dividend Growth” or “Quality Dividend Growth Fund”), (each a “Fund” and collectively the ‘‘Funds’’) are organized as a series of Investment Managers Series Trust, a Delaware statutory trust (the “Trust”) which is registered as an open-end management investment company under the Investment Company Act of 1940, as amended (the “1940 Act”). The International Growth Fund, Emerging Markets Fund, Global Growth Fund, International Small Cap Growth Fund, Small Cap Growth Fund, SMID Quality Value Fund, International Equity Fund, International Value Fund, International Opportunities Fund, Mid Cap Quality Value Fund, Emerging Markets ex China Fund, and Quality Dividend Growth Fund are diversified Funds. The China Quality Growth Fund and Developing World Equity Fund are non-diversified Funds.
The Funds’ investment objectives and dates each share class commenced operations are as follows:
Commencement of Operations | |||
| Fund Name | Investment Objective | Institutional Class | Investor Class |
| International Growth Fund | Provide long-term capital appreciation | 5/31/2011 | 8/31/2011 |
| Emerging Markets Fund | Provide long-term capital appreciation | 6/28/2013 | 6/28/2013 |
| Global Growth Fund | Provide long-term capital appreciation | 6/28/2013 | 6/28/2013 |
| International Small Cap Growth Fund | Provide long-term capital appreciation | 11/30/2015 | - |
| Small Cap Growth Fund | Provide long-term capital appreciation | 10/30/2019 | 10/30/2019 |
| SMID Quality Value Fund | Provide long-term capital appreciation | 10/30/2019 | 10/30/2019 |
| China Quality Growth Fund | Provide long-term capital appreciation | 3/31/2020 | 3/31/2020 |
| Developing World Equity Fund | Provide long-term capital appreciation | 3/31/2020 | 3/31/2020 |
| International Equity Fund | Provide long-term capital appreciation | 3/31/2020 | 3/31/2020 |
| International Value Fund | Provide long-term capital appreciation | 6/29/2020 | 6/29/2020 |
| International Opportunities Fund | Provide long-term capital appreciation | 3/30/2021 | 3/30/2021 |
| Mid Cap Quality Value Fund | Provide long-term capital appreciation | 7/28/2022 | 7/28/2022 |
| Emerging Markets ex China Fund | Provide long-term capital appreciation | 12/29/2022 | 12/29/2022 |
| Quality Dividend Growth Fund | Current and growing dividend income and long-term capital appreciation | 7/28/2023 | 7/28/2023 |
The shares of each class of each Fund represent an interest in the same portfolio of investments of each particular Fund and have equal rights as to voting, redemptions, dividends and liquidation, subject to the approval of the Trustees. Income, expenses (other than expenses attributable to a specific class) and realized and unrealized gains and losses on investments are allocated to each class of shares in proportion to their relative net assets. Shareholders of a class that bears distribution and service expenses under the terms of a distribution plan have exclusive voting rights to that distribution plan.
141
WCM Funds
NOTES TO FINANCIAL STATEMENTS - Continued
December 31, 2023
Each Fund is an investment company and accordingly follows the investment company accounting and reporting guidance of the Financial Accounting Standards Board (FASB) Accounting Standard Codification Topic 946 “Financial Services—Investment Companies”.
Note 2 – Accounting Policies
The following is a summary of the significant accounting policies consistently followed by the Funds in the preparation of their financial statements. The preparation of financial statements in conformity with accounting principles generally accepted in the United States of America (“GAAP”) requires management to make estimates and assumptions that affect the reported amounts and disclosures in the financial statements. Actual results could differ from these estimates.
(a) Valuation of Investments
Each Fund values equity securities at the last reported sale price on the principal exchange or in the principal over the counter (“OTC”) market in which such securities are traded, as of the close of regular trading on the NYSE on the day the securities are being valued or, if the last-quoted sales price is not readily available, the securities will be valued at the last bid or the mean between the last available bid and ask price. Securities traded on the NASDAQ are valued at the NASDAQ Official Closing Price (“NOCP”). Participation certificates are valued at the last sale price of the underlying security as of the close of the primary exchange. Investments in open-end investment companies are valued at the daily closing net asset value of the respective investment company. Debt securities are valued by utilizing a price supplied by independent pricing service providers. The independent pricing service providers may use various valuation methodologies including matrix pricing and other analytical pricing models as well as market transactions and dealer quotations. These models generally consider such factors as yields or prices of bonds of comparable quality, type of issue, coupon, maturity, ratings and general market conditions. If a price is not readily available for a portfolio security, the security will be valued at fair value (the amount which the Fund might reasonably expect to receive for the security upon its current sale). The Board of Trustees has designated the Advisor as the Funds’ valuation designee (the “Valuation Designee”) to make all fair value determinations with respect to the Funds’ portfolio investments, subject to the Board’s oversight. As the Valuation Designee, the Advisor has adopted and implemented policies and procedures to be followed when each Fund must utilize fair value pricing. Prior to September 8, 2022, securities were valued at fair value as determined in good faith by the Funds’ advisor, subject to review and approval by the Valuation Committee, pursuant to procedures adopted by the Board of Trustees. The actions of the Valuation Committee were subsequently reviewed by the Board at its next regularly scheduled board meeting. The Valuation Committee met as needed. The Valuation Committee was comprised of all the Trustees, but action may have been taken by any one of the Trustees.
(b) Investment Transactions, Investment Income and Expenses
Investment transactions are accounted for on the trade date. Realized gains and losses on investments are determined on the identified cost basis. Dividend income is recorded net of applicable withholding taxes on the exdividend date and interest income is recorded on an accrual basis. Withholding taxes on foreign dividends, if applicable, are paid (a portion of which may be reclaimable) or provided for in accordance with the applicable country’s tax rules and rates and are disclosed in the Statement of Operations. Withholding tax reclaims are filed in certain countries to recover a portion of the amounts previously withheld. The Funds record a reclaim receivable based on a number of factors, including a jurisdiction’s legal obligation to pay reclaims as well as payment history and market convention. Discounts on debt securities are accreted or amortized to interest income over the lives of the respective securities using the effective interest method. Premiums for callable debt securities are amortized to the earliest call date, if the call price was less than the purchase price. If the call price was not at par and the security was not called, the security is amortized to the next call price and date. Income and expenses of the Funds are allocated on a pro rata basis to each class of shares relative net assets. Expenses incurred by the Trust with respect to more than one fund are allocated in proportion to the net assets of each fund except where allocation of direct expenses to each fund or an alternative allocation method can be more appropriately made.
142
WCM Funds
NOTES TO FINANCIAL STATEMENTS - Continued
December 31, 2023
The Mid Cap Quality Value Fund incurred offering costs of approximately $11,826, which were amortized over a one-year period from July 28, 2022 (commencement of operations).
The Emerging Markets ex China Fund incurred offering costs of approximately $10,650, which were amortized over a one-year period from December 29, 2022 (commencement of operations).
The Quality Dividend Growth Fund incurred offering costs of approximately $12,141 which are being amortized over a one-year period from July 28, 2023 (commencement of operations).
(c) Foreign Currency Translation
The Funds’ records are maintained in U.S. dollars. The value of securities, currencies and other assets and liabilities denominated in currencies other than U.S. dollars are translated into U.S. dollars based upon foreign exchange rates prevailing at the end of the reporting period. The currencies are translated into U.S. dollars by using the exchange rates quoted at the close of the London Stock Exchange prior to when the Funds’ NAV is next determined. Purchases and sales of investment securities, income and expenses are translated on the respective dates of such transactions.
The Funds do not isolate that portion of their net realized and unrealized gains and losses on investments resulting from changes in foreign exchange rates from the impact arising from changes in market prices. Such fluctuations are included with net realized and unrealized gain or loss from investments and foreign currency.
Net realized foreign currency transaction gains and losses arise from sales of foreign currencies, currency gains or losses realized between the trade and settlement dates on securities transactions, and the differences between the amounts of dividends, interest, and foreign withholding taxes recorded on the Funds’ books and the U.S. dollar equivalent of the amounts actually received or paid. Net unrealized foreign currency translation gains and losses arise from changes in the value of assets and liabilities, other than investments in securities, resulting from changes in the exchange rates.
(d) Exchange Traded Funds (“ETFs”)
ETFs typically trade on securities exchanges and their shares may, at times, trade at a premium or discount to their net asset values. In addition, an ETF may not replicate exactly the performance of the benchmark index it seeks to track for a number of reasons, including transaction costs incurred by the ETF, the temporary unavailability of certain index securities in the secondary market or discrepancies between the ETF and the index with respect to the weighting of securities or the number of securities held. Investing in ETFs, which are investment companies, may involve duplication of advisory fees and certain other expenses. As a result, Fund shareholders indirectly bear their proportionate share of these acquired expenses. Therefore, the cost of investing in the Fund will be higher than the cost of investing directly in ETFs and may be higher than other mutual funds that invest directly in securities.
143
WCM Funds
NOTES TO FINANCIAL STATEMENTS - Continued
December 31, 2023
Each ETF in which the Fund invests is subject to specific risks, depending on the nature of the ETF. Each ETF is subject to the risks associated with direct ownership of the securities comprising the index on which the ETF is based. These risks could include liquidity risk, sector risk as well as risks associated with fixed-income securities.
(e) Federal Income Taxes
The Funds intend to comply with the requirements of Subchapter M of the Internal Revenue Code applicable to regulated investment companies and to distribute substantially all of its net investment income and any net realized gains to its shareholders. Therefore, no provision is made for federal income or excise taxes. Due to the timing of dividend distributions and the differences in accounting for income and realized gains and losses for financial statement and federal income tax purposes, the fiscal year in which amounts are distributed may differ from the year in which the income and realized gains and losses are recorded by the Funds.
Accounting for Uncertainty in Income Taxes (the “Income Tax Statement”) requires an evaluation of tax positions taken (or expected to be taken) in the course of preparing a Funds’ tax returns to determine whether these positions meet a “more-likely-than-not” standard that, based on the technical merits, have a more than fifty percent likelihood of being sustained by a taxing authority upon examination. A tax position that meets the “more-likely-than-not” recognition threshold is measured to determine the amount of benefit to recognize in the financial statements. The Funds recognize interest and penalties, if any, related to unrecognized tax benefits as income tax expense in the Statements of Operations.
The Income Tax Statement requires management of the Funds to analyze tax positions taken in the prior three open tax years, if any, and tax positions expected to be taken in the Fund’s current tax year, as defined by the IRS statute of limitations for all major jurisdictions, including federal tax authorities and certain state tax authorities. As of December 31, 2023, and during the prior three open tax years, the Funds did not have a liability for any unrecognized tax benefits. The Funds have no examination in progress and are not aware of any tax positions for which they are reasonably possible that the total amounts of unrecognized tax benefits will significantly change in the next twelve months.
(f) Distributions to Shareholders
The Funds will make distributions of net investment income and net capital gains, if any, at least annually, except for the Quality Dividend Growth Fund which will distribute net investment income, if any, quarterly. Distributions to shareholders are recorded on the ex-dividend date. The amount and timing of distributions are determined in accordance with federal income tax regulations, which may differ from GAAP.
The character of distributions made during the year from net investment income or net realized gains may differ from the characterization for federal income tax purposes due to differences in the recognition of income, expense and gain (loss) items for financial statement and tax purposes. Where appropriate, reclassifications between net asset accounts are made for such differences that are permanent in nature. Certain funds may utilize earnings and profits on redemption of shares as part of the dividends paid deduction.
144
WCM Funds
NOTES TO FINANCIAL STATEMENTS - Continued
December 31, 2023
(g) Illiquid Securities.
Pursuant to Rule 22e-4 under the 1940 Act, the Funds have adopted a Liquidity Risk Management Program (“LRMP”) that requires, among other things, that the Funds limit their illiquid investments that are assets to no more than 15% of net assets. An illiquid investment is any security which may not reasonably be expected to be sold or disposed of in current market conditions in seven calendar days or less without the sale or disposition significantly changing the market value of the investment. If the Advisor, at any time, determines that the value of illiquid securities held by a Fund exceeds 15% of its net asset value, the Advisor will take such steps as it considers appropriate to reduce them as soon as reasonably practicable in accordance with the Funds’ written LRMP.
(h) Warrants and Rights
The Funds may invest in warrants or rights (including those acquired in units or attached to other securities) that entitle (but do not obligate) the holder to buy equity securities at a specific price for a specific period of time but will do so only if such equity securities are deemed appropriate by the Advisor. Rights are similar to warrants but typically have a shorter duration and are issued by a company to existing stockholders to provide those holders the right to purchase additional shares of stock at a later date. Warrants and rights do not have voting rights, do not earn dividends, and do not entitle the holder to any rights with respect to the assets of the company that has issued them. They do not represent ownership of the underlying companies but only the right to purchase shares of those companies at a specified price on or before a specified exercise date. Warrants and rights tend to be more volatile than the underlying stock, and if at a warrant’s expiration date the stock is trading at a price below the price set in the warrant, the warrant will expire worthless. Conversely, if at the expiration date the stock is trading at a price higher than the price set in the warrant or right, a Fund can acquire the stock at a price below its market value. The prices of warrants and rights do not necessarily parallel the prices of the underlying securities. An investment in warrants or rights may be considered speculative.
Note 3 – Investment Advisory and Other Agreements
The Trust, on behalf of the Funds, entered into Investment Advisory Agreements (the “Agreements”) with WCM Investment Management (the “Advisor”). Under the terms of the Agreements, Funds pay a monthly investment advisory fee to the Advisor. The annual rates are listed by Fund in the table below. The Advisor has contractually agreed to waive its fees and/or pay for operating expenses of the Funds to ensure that total annual fund operating expenses (excluding taxes, leverage interest, brokerage commissions, dividend expenses on short sales, acquired fund fees and expenses as determined in accordance with Form N-1A, professional fees related to services for the collection of foreign tax reclaims, expenses incurred in connection with any merger or reorganization, or extraordinary expenses such as litigation expenses) in order to limit total annual operating expenses of each fund.
These agreements are in effect until April 30, 2024 for the International Growth Fund, Emerging Markets Fund, Global Growth Fund, and International Small Cap Growth Fund, and April 30, 2033 for the Small Cap Growth Fund, SMID Quality Value Fund, China Quality Growth Fund, Developing World Equity Fund, International Equity Fund, International Value Fund, International Opportunities Fund, Mid Cap Quality Value Fund, and Emerging Markets ex China Fund, and April 30, 2034 for the Quality Dividend Growth Fund, and they may be terminated before that date only by the Trust's Board of Trustees. The table below contains the expense cap by Fund and by Class:
145
WCM Funds
NOTES TO FINANCIAL STATEMENTS - Continued
December 31, 2023
Investment Advisory Fees | Total Limit on Annual Operating Expenses Investor Class† | Total Limit on Annual Operating Expenses Institutional Class† | |
| International Growth Fund | 0.85% | 1.50% | 1.25% |
| Emerging Markets Fund | 1.00% | 1.50% | 1.25% |
| Global Growth Fund | 0.85% | 1.30% | 1.05% |
| International Small Cap Growth Fund | 1.00% | - | 1.25% |
| Small Cap Growth Fund | 0.99% | 1.24% | 0.99% |
| SMID Quality Value Fund | 0.85% | 1.10% | 0.85% |
| China Quality Growth Fund | 1.00% | 1.50% | 1.25% |
| Developing World Equity Fund* | 0.95% | 1.20% | 0.95% |
| International Equity Fund** | 0.85% | 1.10% | 0.85% |
| International Value Fund | 0.85% | 1.50% | 1.25% |
| International Opportunities Fund | 1.00% | 1.50% | 1.25% |
| Mid Cap Quality Value Fund | 0.85% | 1.25% | 1.00% |
| Emerging Markets ex China Fund | 1.00% | 1.50% | 1.25% |
| Quality Dividend Growth Fund | 0.65% | 1.24% | 0.99% |
| † | The total limit on annual operating expenses is calculated based on each Fund’s average daily net assets. |
| * | Effective October 1, 2023, the Advisor agreed to lower its management fee from 1.00% to 0.95% as well as reduce the expense caps from 1.50% and 1.25% to 1.20% and 0.95% for the Investor Class and Institutional Class shares, respectively. |
| ** | Effective October 1, 2023, the Advisor agreed to reduce the expense caps from 1.35% and 1.10% to 1.10% and 0.85% for the Investor Class and Institutional Class shares, respectively. |
146
WCM Funds
NOTES TO FINANCIAL STATEMENTS - Continued
December 31, 2023
The table below contains the advisory fees waived and absorbed other expenses for the year/period ended December 31, 2023:
| Emerging Markets Fund | $ | 256,439 | ||
| Global Growth Fund | 308,207 | |||
| International Small Cap Growth Fund | 238,836 | |||
| Small Cap Growth Fund | 306,101 | |||
| SMID Quality Value Fund | 546,548 | |||
| China Quality Growth Fund | 246,959 | |||
| Developing World Equity Fund | 320,208 | |||
| International Equity Fund | 324,822 | |||
| International Value Fund | 240,691 | |||
| International Opportunities Fund | 256,598 | |||
| Mid Cap Quality Value Fund | 276,176 | |||
| Emerging Markets ex China Fund | 322,072 | |||
| Quality Dividend Growth Fund | 100,145 |
The Advisor is permitted to seek reimbursement from the Funds, subject to certain limitations, of fees waived or payments made to the Fund for a period ending three full fiscal years after the date of the waiver or payment with respect to the Emerging Markets, Global Growth and International Small Cap Growth. The Advisor is permitted to seek reimbursement from the Funds, subject to certain limitations, of fees waived or payments made to the Fund for a period ending three full years after the date of the waiver or payment with respect to the Small Cap Growth, SMID Quality Value, China Quality Growth, Developing World Equity, International Equity, International Value, International Opportunities, Mid Cap Quality Value, Emerging Markets ex China , and Quality Dividend Growth. This reimbursement may be requested from the Fund if the reimbursement will not cause the Fund’s annual expense ratio to exceed the lesser of (a) the expense limitation amount in effect at the time such fees were waived or payments made, or (b) the expense limitation amount in effect at the time of the reimbursement.
The potential recoverable amount is noted as “Commitments and contingencies” as reported on the Statements of Assets and Liabilities. The Advisor may recapture all or a portion of these amounts no later than the dates stated below. The total is the amount of these potentially recoverable expenses as of December 31, 2023.
| Emerging Markets Fund | Global Growth Fund | International Small Cap Growth Fund | |||||||||||
| 4/30/2024 | $ | 376,409 | $ | 560,831 | $ | 325,930 | |||||||
| 4/30/2025 | 2,194,968 | 512,187 | 753,667 | ||||||||||
| 12/31/2025 | 1,199,965 | 330,902 | 579,715 | ||||||||||
| 12/31/2026 | 256,439 | 308,207 | 238,836 | ||||||||||
| Total | $ | 4,027,781 | $ | 1,712,127 | $ | 1,898,148 | |||||||
147
WCM Funds
NOTES TO FINANCIAL STATEMENTS - Continued
December 31, 2023
| Small Cap Growth Fund | SMID Quality Value Fund | China Quality Growth Fund | |||||||||||
| 4/30/2024 | $ | 254,994 | $ | 421,601 | $ | 322,890 | |||||||
| 4/30/2025 | 188,353 | 533,195 | 349,581 | ||||||||||
| 12/31/2025 | 210,046 | 276,881 | 193,141 | ||||||||||
| 12/31/2026 | 306,101 | 546,548 | 246,959 | ||||||||||
| Total | $ | 959,494 | $ | 1,778,225 | $ | 1,112,571 | |||||||
Developing World Equity Fund | International Equity Fund | International Value Fund | |||||||||||
| 4/30/2024 | $ | 296,104 | $ | 287,224 | $ | 227,076 | |||||||
| 4/30/2025 | 295,536 | 252,723 | 261,051 | ||||||||||
| 12/31/2025 | 208,876 | 172,226 | 162,492 | ||||||||||
| 12/31/2026 | 320,208 | 324,822 | 240,691 | ||||||||||
| Total | $ | 1,120,724 | $ | 1,036,995 | $ | 891,310 | |||||||
| International Opportunities Fund | Mid Cap Quality Value Fund | Emerging Markets ex China Fund | |||||||||||
| 4/30/2024 | $ | 33,627 | $ | - | $ | - | |||||||
| 4/30/2025 | 374,446 | - | - | ||||||||||
| 12/31/2025 | 234,885 | 111,044 | 16,970 | ||||||||||
| 12/31/2026 | 256,598 | 276,176 | 322,072 | ||||||||||
| Total | $ | 899,556 | $ | 387,220 | $ | 339,042 | |||||||
Quality Dividend Growth Fund | |||||
| 12/31/2026 | $ | 100,145 | |||
| Total | $ | 100,145 | |||
UMB Fund Services, Inc. (“UMBFS”) serves as the Funds’ fund accountant, transfer agent and co-administrator; and Mutual Fund Administration, LLC (“MFAC”) serves as the Funds’ other co-administrator. UMB Bank, n.a., an affiliate of UMBFS, serves as the Funds’ custodian. The Funds’ allocated fees incurred for fund accounting, fund administration, transfer agency and custody services for the year/period ended December 31, 2023, are reported on the Statements of Operations.
Natixis Distribution, LLC, an affiliate of the Advisor, serves as the Funds’ distributor (the “Distributor”). The Distributor does not receive compensation from the Funds for its distribution services; the Advisor pays the Distributor a fee for its distribution-related services.
Certain trustees and officers of the Trust are employees of UMBFS or MFAC. The Funds do not compensate trustees and officers affiliated with the Funds’ co-administrators. For the year/period ended December 31, 2023, the Funds’ allocated fees incurred to Trustees who are not affiliated with the Funds’ co-administrators are reported on the Statements of Operations.
148
WCM Funds
NOTES TO FINANCIAL STATEMENTS - Continued
December 31, 2023
The Funds’ Board of Trustees has adopted a Deferred Compensation Plan (the “Plan”) for the Independent Trustees that enables Trustees to elect to receive payment in cash or the option to select various Fund in the Trust in which their deferred accounts shall be deemed to be invested. If a trustee elects to defer payment, the Plan provides for the creation of a deferred payment account. The Funds’ liability for these amounts are adjusted for market value changes in the invested Fund and remains a liability to the Fund until distributed in accordance with the Plan. The Trustees Deferred compensation liability under the Plan constitutes a general unsecured obligation of the Funds and are disclosed in the Statements of Assets and Liabilities. Contributions made under the plan and the change in unrealized appreciation (depreciation) and income are included in the Trustees' fees and expenses in the Statements of Operations.
Dziura Compliance Consulting, LLC provides Chief Compliance Officer (“CCO”) services to the Trust. The Funds’ allocated fees incurred for CCO services for the year/period ended December 31, 2023, are reported on the Statements of Operations.
Note 4 – Federal Income Taxes
At December 31, 2023, gross unrealized appreciation and depreciation of investments, based on cost for federal income tax purposes were as follows:
| International Growth Fund | Emerging Markets Fund | Global Growth Fund | ||||||||||
| Cost of investments | $ | 13,111,780,761 | $ | 1,233,643,563 | $ | 363,812,129 | ||||||
| Gross unrealized appreciation | $ | 4,846,575,724 | $ | 157,668,417 | $ | 75,597,530 | ||||||
| Gross unrealized depreciation | (495,252,593 | ) | (199,650,365 | ) | (12,172,843 | ) | ||||||
| Net unrealized appreciation (depreciation) on investments | $ | 4,351,323,131 | $ | (41,981,948 | ) | $ | 63,424,687 | |||||
| International Small Cap Growth Fund | Small Cap Growth Fund | SMID Quality Value Fund | ||||||||||
| Cost of investments | $ | 297,749,465 | $ | 35,865,726 | $ | 110,149,906 | ||||||
| Gross unrealized appreciation | $ | 48,868,929 | $ | 7,385,029 | $ | 36,403,341 | ||||||
| Gross unrealized depreciation | (35,217,251 | ) | (2,640,571 | ) | (3,321,960 | ) | ||||||
| Net unrealized appreciation (depreciation) on investments | $ | 13,651,678 | $ | 4,744,458 | $ | 33,081,381 | ||||||
149
WCM Funds
NOTES TO FINANCIAL STATEMENTS - Continued
December 31, 2023
| China Quality Growth Fund | Developing World Equity Fund | International Equity Fund | ||||||||||
| Cost of investments | $ | 5,541,444 | $ | 2,082,237 | $ | 79,231,686 | ||||||
| Gross unrealized appreciation | $ | 174,547 | $ | 249,646 | $ | 10,019,861 | ||||||
| Gross unrealized depreciation | (1,202,786 | ) | (197,738 | ) | (1,819,079 | ) | ||||||
| Net unrealized appreciation (depreciation) on investments | $ | (1,028,239 | ) | $ | 51,908 | $ | 8,200,782 | |||||
| International Value Fund | International Opportunities Fund | Mid Cap Quality Value Fund | ||||||||||
| Cost of investments | $ | 10,229,996 | $ | 32,890,872 | $ | 760,248 | ||||||
| Gross unrealized appreciation | $ | 1,690,041 | $ | 5,859,571 | $ | 169,504 | ||||||
| Gross unrealized depreciation | (975,565 | ) | (1,792,093 | ) | (12,629 | ) | ||||||
| Net unrealized appreciation (depreciation) on investments | $ | 714,476 | $ | 4,067,478 | $ | 156,875 | ||||||
Emerging Markets ex China | Quality Dividend Growth Fund | ||||||||
| Cost of investments | $ | 5,839,089 | $ | 6,315,760 | |||||
| Gross unrealized appreciation | $ | 807,808 | $ | 139,097 | |||||
| Gross unrealized depreciation | (76,452 | ) | (26,649 | ) | |||||
| Net unrealized appreciation (depreciation) on investments | $ | 731,356 | $ | 112,448 | |||||
The differences between cost amounts for financial statement and federal income tax purposes are due primarily to wash sales and PFIC’s.
150
WCM Funds
NOTES TO FINANCIAL STATEMENTS - Continued
December 31, 2023
GAAP requires that certain components of net assets be reclassified between financial and tax reporting. These reclassifications have no effect on the net assets or net asset value per share. For the periods ended December 31, 2023, permanent differences in book and tax accounting have been reclassified to paid-in-capital and distributable earnings/(accumulated deficit) as follows:
| Paid in Capital | Total Distributable Earnings/(Accumulated Deficit) | |||||||
| International Growth Fund | $ | 1,821 | $ | 1,821 | ||||
| Emerging Markets Fund | (127,270 | ) | 127,270 | |||||
| Global Growth Fund | - | - | ||||||
| International Small Cap Growth Fund | 17,964 | (17,964 | ) | |||||
| Small Cap Growth Fund | (137,001 | ) | 137,001 | |||||
| SMID Quality Value Fund | (162,056 | ) | 162,056 | |||||
| China Quality Growth Fund | (122 | ) | 122 | |||||
| Developing World Equity Fund | (35 | ) | 35 | |||||
| International Equity Fund | - | - | ||||||
| International Value Fund | (613 | ) | 613 | |||||
| International Opportunities Fund | - | - | ||||||
| Mid Cap Quality Value Fund | (15 | ) | 15 | |||||
| Emerging Markets ex China Fund | - | - | ||||||
| Quality Dividend Growth Fund | (222 | ) | 222 | |||||
As of December 31, 2023, the components of accumulated earnings/(deficit) on a tax basis were as follows:
| International Growth Fund | Emerging Markets Fund | Global Growth Fund | ||||||||||
| Undistributed ordinary income | $ | 2,858,684 | $ | - | $ | 36,823 | ||||||
| Undistributed long-term capital gains | 423,117,291 | - | - | |||||||||
| Tax accumulated earnings | 425,975,975 | - | 36,823 | |||||||||
| Accumulated capital and other losses | - | (537,398,157 | ) | (15,480,232 | ) | |||||||
| Unrealized appreciation (depreciation) on foreign currency | 1,664,489 | (1,094,824 | ) | 2,465 | ||||||||
| Unrealized appreciation (depreciation) on investments | 4,351,323,131 | (41,981,948 | ) | 63,424,687 | ||||||||
| Deferred compensation | (234,141 | ) | (28,408 | ) | (15,136 | ) | ||||||
| Total accumulated earnings | $ | 4,778,729,454 | $ | (580,503,337 | ) | $ | 47,968,607 | |||||
151
WCM Funds
NOTES TO FINANCIAL STATEMENTS - Continued
December 31, 2023
| International Small Cap Growth Fund | Small Cap Growth Fund | SMID Quality Value Fund | ||||||||||
| Undistributed ordinary income | $ | 2,443,725 | $ | - | $ | - | ||||||
| Undistributed long-term capital gains | - | - | - | |||||||||
| Tax accumulated earnings | 2,443,725 | - | - | |||||||||
| Accumulated capital and other losses | (140,986,597 | ) | (4,729,310 | ) | (2,071,200 | ) | ||||||
| Unrealized appreciation (depreciation) on foreign currency | 11,893 | - | - | |||||||||
| Unrealized appreciation (depreciation) on investments | 13,651,678 | 4,744,458 | 33,081,381 | |||||||||
| Deferred compensation | (15,565 | ) | (7,652 | ) | (8,542 | ) | ||||||
| Unrealized Non-U.S. Taxes | - | - | - | |||||||||
| Total accumulated earnings | $ | (124,894,866 | ) | $ | 7,496 | $ | 31,001,639 | |||||
| China Quality Growth Fund | Developing World Equity Fund | International Equity Fund | ||||||||||
| Undistributed ordinary income | $ | 6,699 | $ | 1,485 | $ | 876,521 | ||||||
| Undistributed long-term capital gains | - | - | 403,939 | |||||||||
| Tax accumulated earnings | 6,699 | 1,485 | 1,280,460 | |||||||||
| Accumulated capital and other losses | (4,506,466 | ) | (215,846 | ) | - | |||||||
| Unrealized appreciation (depreciation) on foreign currency | 5,379 | (1,698 | ) | 135 | ||||||||
| Unrealized appreciation (depreciation) on investments | (1,028,239 | ) | 51,908 | 8,200,782 | ||||||||
| Deferred compensation | (6,467 | ) | (6,405 | ) | (6,854 | ) | ||||||
| Total accumulated earnings | $ | (5,529,094 | ) | $ | (170,556 | ) | $ | 9,474,523 | ||||
152
WCM Funds
NOTES TO FINANCIAL STATEMENTS - Continued
December 31, 2023
| International Value Fund | International Opportunities Fund | Mid Cap Quality Value Fund | ||||||||||
| Undistributed ordinary income | $ | 42,505 | $ | 192,275 | $ | 2,064 | ||||||
| Undistributed long-term capital gains | - | - | 4,698 | |||||||||
| Tax accumulated earnings | 42,505 | 192,275 | 6,762 | |||||||||
| Accumulated capital and other losses | (3,084,032 | ) | (6,583,140 | ) | - | |||||||
| Unrealized appreciation (depreciation) on foreign currency | 573 | 1,070 | - | |||||||||
| Unrealized appreciation (depreciation) on investments | 714,476 | 4,067,478 | 156,875 | |||||||||
| Deferred compensation | (6,262 | ) | (5,973 | ) | (4,132 | ) | ||||||
| Total accumulated earnings | $ | (2,332,740 | ) | $ | (2,328,290 | ) | $ | 159,505 | ||||
| Emerging Markets ex China Fund | Quality Dividend Growth Fund | ||||||||
| Undistributed ordinary income | $ | 16,279 | $ | 4,696 | |||||
| Undistributed long-term capital gains | - | - | |||||||
| Tax accumulated earnings | 16,279 | 4,696 | |||||||
| Accumulated capital and other losses | - | (1,823 | ) | ||||||
| Unrealized appreciation (depreciation) on foreign currency | 68 | - | |||||||
| Unrealized appreciation (depreciation) on investments | 731,356 | 112,448 | |||||||
| Deferred compensation | (3,479 | ) | (1,010 | ) | |||||
| Unrealized Non-U.S. Taxes | (8,205 | ) | - | ||||||
| Total accumulated earnings | $ | 736,019 | $ | 114,311 | |||||
The tax character of the distributions paid during the periods ended December 31, 2023, December 31, 2022, and April 30, 2022, for the Funds were as follows:
| International Growth Fund | ||||||||||||
| Distributions paid from: | 2023 | 2022 | 2022 | |||||||||
| Ordinary Income | $ | - | $ | - | $ | - | ||||||
| Net long-term capital gains | 114,405,769 | 17,200,917 | 1,280,983,868 | |||||||||
| Total distributions paid | $ | 114,405,769 | $ | 17,200,917 | $ | 1,280,983,868 | ||||||
153
WCM Funds
NOTES TO FINANCIAL STATEMENTS - Continued
December 31, 2023
| Emerging Markets Fund | ||||||||||||
| Distributions paid from: | 2023 | 2022 | 2022 | |||||||||
| Ordinary Income | $ | 5,346,125 | $ | 6,540,239 | $ | 67,237,247 | ||||||
| Net long-term capital gains | - | - | 35,625,081 | |||||||||
| Total distributions paid | $ | 5,346,125 | $ | 6,540,239 | $ | 102,862,328 | ||||||
| Global Growth Fund | ||||||||||||
| Distributions paid from: | 2023 | 2022 | 2022 | |||||||||
| Ordinary Income | $ | - | $ | - | $ | 6,694,647 | ||||||
| Net long-term capital gains | - | 10,654,629 | 48,945,689 | |||||||||
| Total distributions paid | $ | - | $ | 10,654,629 | $ | 55,640,336 | ||||||
| International Small Cap Growth Fund | ||||||||||||
| Distributions paid from: | 2023 | 2022 | 2022 | |||||||||
| Ordinary Income | $ | - | $ | - | $ | 24,827,933 | ||||||
| Net long-term capital gains | - | - | 61,120,694 | |||||||||
| Total distributions paid | $ | - | $ | - | $ | 85,948,627 | ||||||
| Small Cap Growth Fund | ||||||||||||
| Distributions paid from: | 2023 | 2022 | 2022 | |||||||||
| Ordinary Income | $ | - | $ | - | $ | 1,546,154 | ||||||
| Net long-term capital gains | - | 59,794 | 3,105,784 | |||||||||
| Total distributions paid | $ | - | $ | 59,794 | $ | 4,651,938 | ||||||
| SMID Quality Value Fund | ||||||||||||
| Distributions paid from: | 2023 | 2022 | 2022 | |||||||||
| Ordinary Income | $ | - | $ | 202,517 | $ | 3,645,341 | ||||||
| Net long-term capital gains | 1,133,783 | 1,779,776 | 3,099,062 | |||||||||
| Total distributions paid | $ | 1,133,783 | $ | 1,982,293 | $ | 6,744,403 | ||||||
| China Quality Growth Fund | ||||||||||||
| Distributions paid from: | 2023 | 2022 | 2022 | |||||||||
| Ordinary Income | $ | 48,990 | $ | 21,212 | $ | 906,564 | ||||||
| Net long-term capital gains | - | - | 341,817 | |||||||||
| Total distributions paid | $ | 48,990 | $ | 21,212 | $ | 1,248,381 | ||||||
154
WCM Funds
NOTES TO FINANCIAL STATEMENTS - Continued
December 31, 2023
| Developing World Equity Fund | ||||||||||||
| Distributions paid from: | 2023 | 2022 | 2022 | |||||||||
| Ordinary Income | $ | 28,943 | $ | 24,934 | $ | 50,590 | ||||||
| Net long-term capital gains | - | - | 46,248 | |||||||||
| Total distributions paid | $ | 28,943 | $ | 24,934 | $ | 96,838 | ||||||
| International Equity Fund | ||||||||||||
| Distributions paid from: | 2023 | 2022 | 2022 | |||||||||
| Ordinary Income | $ | 2,504,825 | $ | 12,735 | $ | 29,788 | ||||||
| Net long-term capital gains | 251,598 | 4,666 | 88,481 | |||||||||
| Total distributions paid | $ | 2,756,423 | $ | 17,401 | $ | 118,269 | ||||||
| International Value Fund | ||||||||||||
| Distributions paid from: | 2023 | 2022 | 2022 | |||||||||
| Ordinary Income | $ | 104,566 | $ | 105,728 | $ | 3,064 | ||||||
| Net long-term capital gains | - | - | - | |||||||||
| Total distributions paid | $ | 104,566 | $ | 105,728 | $ | 3,604 | ||||||
| International Opportunities Fund | ||||||||||||
| Distributions paid from: | 2023 | 2022 | 2022 | |||||||||
| Ordinary Income | $ | 164,959 | $ | - | $ | 19,036 | ||||||
| Net long-term capital gains | - | - | - | |||||||||
| Total distributions paid | $ | 164,959 | $ | - | $ | 19,036 | ||||||
| Mid Cap Quality Value Fund | |||||||||
| Distributions paid from: | 2023 | 2022 | |||||||
| Ordinary Income | $ | 14,977 | $ | 470 | |||||
| Net long-term capital gains | 1,289 | - | |||||||
| Total distributions paid | $ | 16,266 | $ | 470 | |||||
| Emerging Markets Ex China | |||||||||
| Distributions paid from: | 2023 | 2022 | |||||||
| Ordinary Income | $ | 15,870 | $ | - | |||||
| Net long-term capital gains | - | - | |||||||
| Total distributions paid | $ | 15,870 | $ | - | |||||
155
WCM Funds
NOTES TO FINANCIAL STATEMENTS - Continued
December 31, 2023
Quality Dividend Growth Fund | ||||
| Distributions paid from: | 2023 | |||
| Ordinary Income | $ | 4,032 | ||
| Net long-term capital gains | - | |||
| Total distributions paid | $ | 4,032 | ||
At December 31, 2023, the below Funds had an accumulated capital loss carry forward as follows:
| Short-term Capital Loss Carryforward | Long-term Capital Loss Carryforward | |||||||
| Emerging Markets Fund | $ | 98,596,371 | $ | 438,801,786 | ||||
| Global Growth Fund | 15,480,232 | - | ||||||
| International Small Cap Growth Fund | 72,184,213 | 68,802,384 | ||||||
| Small Cap Growth Fund | 656,593 | 4,072,717 | ||||||
| SMID Quality Value Fund | 304,493 | 1,766,707 | ||||||
| China Quality Growth Fund | 1,531,285 | 2,975,181 | ||||||
| Developing World Equity Fund | 60,932 | 154,914 | ||||||
| International Value Fund | 1,081,697 | 2,002,335 | ||||||
| International Opportunities Fund | 5,118,768 | 1,464,372 | ||||||
| Quality Dividend Growth Fund | 1,823 | - | ||||||
The International Growth Fund, International Equity Fund, Mid Cap Quality Value Fund, and Emerging Markets ex China Fund did not have accumulated capital loss carryforwards. To the extent that a Fund may realize future net capital gains, those gains will be offset by any of its unused capital loss carryforward. Future capital loss carryover utilization in any given year may be subject to Internal Revenue Code limitations.
The International Growth Fund utilized $268,462,293 of capital loss carryforward for the tax year ended December 31, 2023.
The Global Growth Fund utilized $2,538,688 of capital loss carryforward for the tax year ended December 31, 2023.
The International Opportunities Fund utilized $332,739 of capital loss carryforward for the tax year ended December 31, 2023.
The Mid Cap Quality Value Fund utilized $1,293 of capital loss carryforward for the tax year ended December 31, 2023.
The International Equity Fund utilized $61,517 of capital loss carryforward for the tax year ended December 31, 2023.
156
WCM Funds
NOTES TO FINANCIAL STATEMENTS - Continued
December 31, 2023
As of December 31, 2023, the Funds did not have qualified Late-Year Losses, or Post October losses.
Note 5 – Redemption Fee
Effective May 1, 2019, the International Growth, Emerging Markets, Global Growth, and International Small Cap Growth Funds no longer charge a redemption fee.
Note 6 – Investment Transactions
For the year/period ended December 31, 2023, purchases and sales of investments, excluding short-term investments, futures contracts, options contracts and securities sold short, were as follows:
| Purchases | Sales | |||||||
| International Growth Fund | $ | 5,437,218,288 | $ | 6,366,630,661 | ||||
| Emerging Markets Fund | 829,532,215 | 1,050,346,022 | ||||||
| Global Growth Fund | 163,727,446 | 101,440,101 | ||||||
| International Small Cap Growth Fund | 241,974,969 | 281,230,548 | ||||||
| Small Cap Growth Fund | 17,442,200 | 16,395,451 | ||||||
| SMID Quality Value Fund | 27,864,562 | 34,193,414 | ||||||
| China Quality Growth Fund | 3,470,152 | 4,780,975 | ||||||
| Developing World Equity Fund | 1,012,933 | 1,118,304 | ||||||
| International Equity Fund | 44,112,209 | 26,199,285 | ||||||
| International Value Fund | 4,299,561 | 11,490,553 | ||||||
| International Opportunities Fund | 32,604,031 | 26,851,207 | ||||||
| Mid Cap Quality Value Fund | 240,097 | 117,811 | ||||||
| Emerging Markets ex China Fund | 5,983,933 | 771,413 | ||||||
| Quality Dividend Growth Fund | 5,811,718 | 10,885 | ||||||
Note 7 – Shareholder Servicing Plan
The Trust, on behalf of each Fund, has adopted a Shareholder Servicing Plan to pay a fee at an annual rate of up to 0.15% of each Fund’s average daily net assets of shares serviced by shareholder servicing agents who provide administrative and support services to their customers.
For the year/period ended December 31, 2023, the Funds’ shareholder servicing fees incurred are disclosed on the Statements of Operations.
Note 8 – Distribution Plan
The Trust, on behalf of each Fund, has adopted a Distribution Plan (the “Plan”) pursuant to Rule 12b-1 under the 1940 Act, which allows each Fund to pay distribution fees for the sale and distribution of its Investor Class shares. The Plan provides for the payment of distribution fees at the annual rate of up to 0.25% of each Fund’s average daily net assets attributable to Investor Class shares, payable to the Distributor. The Institutional Class shares do not pay any distribution fees.
157
WCM Funds
NOTES TO FINANCIAL STATEMENTS - Continued
December 31, 2023
For the year/period ended December 31, 2023, distribution fees incurred by each Fund’s Investor Class shares are disclosed on the Statements of Operations.
Note 9 – Indemnifications
In the normal course of business, the Funds enter into contracts that contain a variety of representations which provide general indemnifications. The Funds’ maximum exposure under these arrangements is unknown, as this would involve future claims that may be made against the Funds that have not yet occurred. However, the Funds expect the risk of loss to be remote.
Note 10 – Fair Value Measurements and Disclosure
Fair Value Measurements and Disclosures defines fair value, establishes a framework for measuring fair value in accordance with GAAP, and expands disclosure about fair value measurements. It also provides guidance on determining when there has been a significant decrease in the volume and level of activity for an asset or a liability, when a transaction is not orderly, and how that information must be incorporated into a fair value measurement.
Under Fair Value Measurements and Disclosures, various inputs are used in determining the value of the Funds’ investments. These inputs are summarized into three broad Levels as described below:
| · | Level 1 – Unadjusted quoted prices in active markets for identical assets or liabilities that the Funds have the ability to access. |
| · | Level 2 – Observable inputs other than quoted prices included in Level 1 that are observable for the asset or liability, either directly or indirectly. These inputs may include quoted prices for the identical instrument on an inactive market, prices for similar instruments, interest rates, prepayment speeds, credit risk, yield curves, default rates and similar data. |
| · | Level 3 – Unobservable inputs for the asset or liability, to the extent relevant observable inputs are not available; representing the Funds’ own assumptions about the assumptions a market participant would use in valuing the asset or liability, and would be based on the best information available. |
The availability of observable inputs can vary from security to security and is affected by a wide variety of factors, including, for example, the type of security, whether the security is new and not yet established in the marketplace, the liquidity of markets, and other characteristics particular to the security. To the extent that valuation is based on models or inputs that are less observable or unobservable in the market, the determination of fair value requires more judgment. Accordingly, the degree of judgment exercised in determining fair value is greatest for instruments categorized in Level 3.
The inputs used to measure fair value may fall into different Levels of the fair value hierarchy. In such cases, for disclosure purposes, the Level in the fair value hierarchy within which the fair value measurement falls in its entirety, is determined based on the lowest Level input that is significant to the fair value measurement in its entirety.
158
WCM Funds
NOTES TO FINANCIAL STATEMENTS - Continued
December 31, 2023
The inputs or methodology used for valuing securities are not an indication of the risk associated with investing in those securities. The following is a summary of the inputs used, as of December 31, 2023, in valuing the Funds’ assets carried at fair value:
| International Growth | Level 1 | Level 2* | Level 3** | Total | ||||||||||||
| Investments | ||||||||||||||||
| Common Stock | $ | 17,414,995,926 | $ | - | $ | - | $ | 17,414,995,926 | ||||||||
| Bank Deposit | ||||||||||||||||
| Investments | 48,107,966 | - | - | 48,107,966 | ||||||||||||
| Total Investments | $ | 17,463,103,892 | $ | - | $ | - | $ | 17,463,103,892 | ||||||||
| Emerging Markets Fund | Level 1 | Level 2 | Level 3^ | Total | ||||||||||||
| Investments | ||||||||||||||||
| Common Stock | ||||||||||||||||
| Argentina | $ | 32,243,910 | $ | - | $ | - | $ | 32,243,910 | ||||||||
| Brazil | 119,750,822 | - | - | 119,750,822 | ||||||||||||
| Canada | 26,539,099 | - | - | 26,539,099 | ||||||||||||
| China | 214,050,433 | - | - | 214,050,433 | ||||||||||||
| Hong Kong | 66,071,678 | - | - | 66,071,678 | ||||||||||||
| India | 138,497,621 | - | - | 138,497,621 | ||||||||||||
| Indonesia | 48,147,746 | - | - | 48,147,746 | ||||||||||||
| Mexico | 108,833,501 | - | - | 108,833,501 | ||||||||||||
| Netherlands | 15,007,692 | - | - | 15,007,692 | ||||||||||||
| Peru | 26,250,494 | - | - | 26,250,494 | ||||||||||||
| Poland | 16,733,919 | - | - | 16,733,919 | ||||||||||||
| Russia | - | - | 0 | 0 | ||||||||||||
| South Africa | 66,275,551 | - | - | 66,275,551 | ||||||||||||
| South Korea | 17,436,678 | 70,992,179 | - | 88,428,857 | ||||||||||||
| Taiwan | 131,814,838 | - | - | 131,814,838 | ||||||||||||
| Thailand | 32,751,035 | - | - | 32,751,035 | ||||||||||||
| United Kingdom | 10,215,158 | - | - | 10,215,158 | ||||||||||||
| United States | 37,595,670 | - | - | 37,595,670 | ||||||||||||
| Rights | ||||||||||||||||
| Brazil | 31,805 | - | - | 31,805 | ||||||||||||
| Bank Deposit | ||||||||||||||||
| Investments | 12,421,786 | - | - | 12,421,786 | ||||||||||||
| Total Investments | $ | 1,120,669,436 | $ | 70,992,179 | $ | 0 | $ | 1,191,661,615 | ||||||||
159
WCM Funds
NOTES TO FINANCIAL STATEMENTS - Continued
December 31, 2023
| Global Growth Fund | Level 1 | Level 2* | Level 3** | Total | ||||||||||||
| Investments | ||||||||||||||||
| Common Stocks1 | $ | 424,166,601 | $ | - | $ | - | $ | 424,166,601 | ||||||||
| Short-Term Investments | 3,070,215 | - | - | 3,070,215 | ||||||||||||
| Total Investments | $ | 427,236,816 | $ | - | $ | - | $ | 427,236,816 | ||||||||
International Small Cap Growth Fund | Level 1 | Level 2 | Level 3^ | Total | ||||||||||||
| Investments | ||||||||||||||||
| Common Stocks | ||||||||||||||||
| Argentina | $ | 6,670,579 | $ | - | $ | - | $ | 6,670,579 | ||||||||
| Australia | 8,631,770 | - | - | 8,631,770 | ||||||||||||
| Belgium | 6,777,977 | - | - | 6,777,977 | ||||||||||||
| Brazil | 11,220,038 | - | - | 11,220,038 | ||||||||||||
| Canada | 24,051,754 | - | - | 24,051,754 | ||||||||||||
| China | 9,690,751 | - | - | 9,690,751 | ||||||||||||
| Denmark | 3,644,276 | - | - | 3,644,276 | ||||||||||||
| Faroe Islands | 4,593,624 | - | - | 4,593,624 | ||||||||||||
| France | 13,180,004 | - | - | 13,180,004 | ||||||||||||
| Germany | 21,376,719 | - | - | 21,376,719 | ||||||||||||
| India | 5,375,057 | - | - | 5,375,057 | ||||||||||||
| Italy | 4,792,296 | - | - | 4,792,296 | ||||||||||||
| Japan | 54,302,319 | - | - | 54,302,319 | ||||||||||||
| Mexico | 20,000,647 | - | - | 20,000,647 | ||||||||||||
| Netherlands | 5,323,046 | - | - | 5,323,046 | ||||||||||||
| Norway | 9,693,042 | - | - | 9,693,042 | ||||||||||||
| Russia^ | - | - | 0 | 0 | ||||||||||||
| Saudi Arabia | 7,866,835 | - | - | 7,866,835 | ||||||||||||
| South Korea | - | 5,948,217 | - | 5,948,217 | ||||||||||||
| Sweden | 33,209,645 | - | - | 33,209,645 | ||||||||||||
| Switzerland | 11,422,291 | - | - | 11,422,291 | ||||||||||||
| United Kingdom | 34,666,825 | - | - | 34,666,825 | ||||||||||||
| Vietnam | 4,955,297 | - | - | 4,955,297 | ||||||||||||
| Short-Term Investments | 4,008,134 | - | - | 4,008,134 | ||||||||||||
| Total Investments | $ | 305,452,926 | $ | 5,948,217 | $ | 0 | $ | 311,401,143 | ||||||||
160
WCM Funds
NOTES TO FINANCIAL STATEMENTS - Continued
December 31, 2023
| Small Cap Growth Fund | Level 1 | Level 2* | Level 3** | Total | ||||||||||||
| Investments | ||||||||||||||||
| Common Stocks1 | $ | 39,733,586 | $ | - | $ | - | $ | 39,733,586 | ||||||||
| Short-Term Investments | 876,598 | - | - | 876,598 | ||||||||||||
| Total Investments | $ | 40,610,184 | $ | - | $ | - | $ | 40,610,184 | ||||||||
| SMID Quality Value Fund | Level 1 | Level 2* | Level 3** | Total | ||||||||||||
| Investments | ||||||||||||||||
| Common Stocks1 | $ | 138,221,205 | $ | - | $ | - | $ | 138,221,205 | ||||||||
| Short-Term Investments | 5,010,082 | - | - | 5,010,082 | ||||||||||||
| Total Investments | $ | 143,231,287 | $ | - | $ | - | $ | 143,231,287 | ||||||||
| China Quality Growth Fund | Level 1 | Level 2* | Level 3** | Total | ||||||||||||
| Investments | ||||||||||||||||
| Common Stocks1 | $ | 4,320,775 | $ | - | $ | - | $ | 4,320,775 | ||||||||
| Bank Deposit | ||||||||||||||||
| Investments | 192,430 | - | - | 192,430 | ||||||||||||
| Total Investments | $ | 4,513,205 | $ | - | $ | - | $ | 4,513,205 | ||||||||
161
WCM Funds
NOTES TO FINANCIAL STATEMENTS - Continued
December 31, 2023
| Developing World Equity Fund | Level 1 | Level 2 | Level 3** | Total | ||||||||||||
| Investments | ||||||||||||||||
| Common Stock | ||||||||||||||||
| Argentina | $ | 56,575 | $ | - | $ | - | $ | 56,575 | ||||||||
| Brazil | 108,656 | - | - | 108,656 | ||||||||||||
| Canada | 87,753 | - | - | 87,753 | ||||||||||||
| China | 233,214 | - | - | 233,214 | ||||||||||||
| Hong Kong | 171,654 | - | - | 171,654 | ||||||||||||
| Hungary | 58,163 | - | - | 58,163 | ||||||||||||
| India | 229,462 | - | - | 229,462 | ||||||||||||
| Indonesia | 101,762 | - | - | 101,762 | ||||||||||||
| Malaysia | 41,469 | - | - | 41,469 | ||||||||||||
| Mexico | 112,095 | - | - | 112,095 | ||||||||||||
| Netherlands | 61,820 | - | - | 61,820 | ||||||||||||
| Peru | 75,415 | - | - | 75,415 | ||||||||||||
| Singapore | 96,508 | - | - | 96,508 | ||||||||||||
| South Africa | 70,741 | - | - | 70,741 | ||||||||||||
| South Korea | 57,847 | 82,305 | - | 140,152 | ||||||||||||
| Sweden | 69,131 | - | - | 69,131 | ||||||||||||
| Switzerland | 49,245 | - | - | 49,245 | ||||||||||||
| Taiwan | 122,750 | - | - | 122,750 | ||||||||||||
| United Kingdom | 97,043 | - | - | 97,043 | ||||||||||||
| United States | 109,191 | - | - | 109,191 | ||||||||||||
| Bank Deposit | ||||||||||||||||
| Investments | 41,346 | - | - | 41,346 | ||||||||||||
| Total Investments | $ | 2,051,840 | $ | 82,305 | $ | - | $ | 2,134,145 | ||||||||
162
WCM Funds
NOTES TO FINANCIAL STATEMENTS - Continued
December 31, 2023
| International Equity Fund | Level 1 | Level 2 | Level 3** | Total | ||||||||||||
| Investments | ||||||||||||||||
| Common Stock | ||||||||||||||||
| Argentina | $ | 1,131,509 | $ | - | $ | - | $ | 1,131,509 | ||||||||
| Canada | 7,027,531 | - | - | 7,027,531 | ||||||||||||
| Denmark | 1,806,064 | - | - | 1,806,064 | ||||||||||||
| France | 3,114,009 | - | - | 3,114,009 | ||||||||||||
| Germany | 2,612,324 | - | - | 2,612,324 | ||||||||||||
| Hong Kong | 2,894,031 | - | - | 2,894,031 | ||||||||||||
| Hungary | 1,582,960 | - | - | 1,582,960 | ||||||||||||
| India | 3,153,499 | - | - | 3,153,499 | ||||||||||||
| Indonesia | 2,364,330 | - | - | 2,364,330 | ||||||||||||
| Ireland | 4,322,948 | - | - | 4,322,948 | ||||||||||||
| Japan | 3,565,773 | - | - | 3,565,773 | ||||||||||||
| Mexico | 2,513,013 | - | - | 2,513,013 | ||||||||||||
| Netherlands | 2,730,395 | - | - | 2,730,395 | ||||||||||||
| Peru | 2,401,879 | - | - | 2,401,879 | ||||||||||||
| Singapore | 3,858,857 | - | - | 3,858,857 | ||||||||||||
| South Korea | - | 2,381,744 | - | 2,381,744 | ||||||||||||
| Spain | 3,059,493 | - | - | 3,059,493 | ||||||||||||
| Sweden | 2,758,334 | - | - | 2,758,334 | ||||||||||||
| Switzerland | 3,971,126 | - | - | 3,971,126 | ||||||||||||
| Taiwan | 1,385,380 | - | - | 1,385,380 | ||||||||||||
| United Kingdom | 14,272,605 | - | - | 14,272,605 | ||||||||||||
| United States | 10,072,428 | - | - | 10,072,428 | ||||||||||||
| Short-Term | ||||||||||||||||
| Investments | 4,452,236 | - | - | 4,452,236 | ||||||||||||
| Total Investments | $ | 85,050,724 | $ | 2,381,744 | $ | - | $ | 87,432,468 | ||||||||
163
WCM Funds
NOTES TO FINANCIAL STATEMENTS - Continued
December 31, 2023
| International Value Fund | Level 1 | Level 2* | Level 3^ | Total | ||||||||||||
| Investments | ||||||||||||||||
| Common Stock | ||||||||||||||||
| Belgium | $ | 428,384 | $ | - | $ | - | $ | 428,384 | ||||||||
| Brazil | 216,580 | - | - | 216,580 | ||||||||||||
| Canada | 1,171,524 | - | - | 1,171,524 | ||||||||||||
| China | 430,741 | - | - | 430,741 | ||||||||||||
| France | 394,093 | - | - | 394,093 | ||||||||||||
| Germany | 1,367,904 | - | - | 1,367,904 | ||||||||||||
| Hong Kong | 83,892 | - | - | 83,892 | ||||||||||||
| India | 429,753 | - | - | 429,753 | ||||||||||||
| Ireland | 525,163 | - | - | 525,163 | ||||||||||||
| Israel | 135,667 | - | - | 135,667 | ||||||||||||
| Italy | 175,202 | - | - | 175,202 | ||||||||||||
| Japan | 1,568,119 | - | - | 1,568,119 | ||||||||||||
| Mexico | 440,293 | - | - | 440,293 | ||||||||||||
| Russia | - | - | 0 | 0 | ||||||||||||
| Sweden | 418,664 | - | - | 418,664 | ||||||||||||
| Switzerland | 860,832 | - | - | 860,832 | ||||||||||||
| Taiwan | 212,160 | - | - | 212,160 | ||||||||||||
| Thailand | 216,976 | - | - | 216,976 | ||||||||||||
| United Kingdom | 1,441,451 | - | - | 1,441,451 | ||||||||||||
| United States | 221,170 | - | - | 221,170 | ||||||||||||
| Short-Term | ||||||||||||||||
| Investments | 205,904 | - | - | 205,904 | ||||||||||||
| Total Investments | $ | 10,944,472 | $ | - | $ | 0 | $ | 10,944,472 | ||||||||
164
WCM Funds
NOTES TO FINANCIAL STATEMENTS - Continued
December 31, 2023
International Opportunities Fund | Level 1 | Level 2 | Level 3^ | Total | ||||||||||||
| Investments | ||||||||||||||||
| Common Stock | ||||||||||||||||
| Argentina | $ | 1,223,217 | $ | - | $ | - | $ | 1,223,217 | ||||||||
| Australia | 1,711,609 | - | - | 1,711,609 | ||||||||||||
| Belgium | 945,237 | - | - | 945,237 | ||||||||||||
| Brazil | 714,477 | - | - | 714,477 | ||||||||||||
| Bermuda | 734,623 | - | 734,623 | |||||||||||||
| Canada | 3,106,540 | - | - | 3,106,540 | ||||||||||||
| China | 921,534 | - | - | 921,534 | ||||||||||||
| Denmark | 844,622 | - | - | 844,622 | ||||||||||||
| Faroe Islands | 590,128 | - | - | 590,128 | ||||||||||||
| France | 1,753,596 | - | - | 1,753,596 | ||||||||||||
| Germany | 1,148,193 | - | - | 1,148,193 | ||||||||||||
| India | 539,043 | - | - | 539,043 | ||||||||||||
| Ireland | 2,676,946 | - | - | 2,676,946 | ||||||||||||
| Italy | 1,488,051 | - | - | 1,488,051 | ||||||||||||
| Japan | 4,622,488 | - | - | 4,622,488 | ||||||||||||
| Mexico | 1,576,012 | - | - | 1,576,012 | ||||||||||||
| Netherlands | 3,573,794 | - | - | 3,573,794 | ||||||||||||
| Norway | 564,559 | - | - | 564,559 | ||||||||||||
| Russia^ | - | - | 0 | 0 | ||||||||||||
| South Korea | 481,653 | - | - | 481,653 | ||||||||||||
| Spain | 598,088 | - | - | 598,088 | ||||||||||||
| Sweden | 1,544,295 | - | - | 1,544,295 | ||||||||||||
| Switzerland | 1,778,920 | - | - | 1,778,920 | ||||||||||||
| United Kingdom | 2,434,003 | - | - | 2,434,003 | ||||||||||||
| Warrants | ||||||||||||||||
| Canada | - | - | 0 | 0 | ||||||||||||
| Short-Term Investments | 1,386,722 | - | - | 1,386,722 | ||||||||||||
| Total Investments | $ | 36,958,350 | $ | - | $ | 0 | $ | 36,958,350 | ||||||||
| Mid Cap Quality Value Fund | Level 1 | Level 2* | Level 3** | Total | ||||||||||||
| Investments | ||||||||||||||||
| Common Stocks1 | $ | 900,439 | $ | - | $ | - | $ | 900,439 | ||||||||
| Bank Deposit Investments | 16,684 | - | - | 16,684 | ||||||||||||
| Total Investments | $ | 917,123 | $ | - | $ | - | $ | 917,123 | ||||||||
165
WCM Funds
NOTES TO FINANCIAL STATEMENTS - Continued
December 31, 2023
| Emerging Markets ex China Fund | Level 1 | Level 2 | Level 3** | Total | ||||||||||||
| Investments | ||||||||||||||||
| Common Stock | ||||||||||||||||
| Argentina | $ | 168,966 | $ | - | $ | - | $ | 168,966 | ||||||||
| Brazil | 703,082 | - | - | 703,082 | ||||||||||||
| Canada | 167,364 | - | - | 167,364 | ||||||||||||
| India | 959,804 | - | - | 959,804 | ||||||||||||
| Indonesia | 327,871 | - | - | 327,871 | ||||||||||||
| Mexico | 878,936 | - | - | 878,936 | ||||||||||||
| Netherlands | 114,637 | - | - | 114,637 | ||||||||||||
| Peru | 156,677 | - | - | 156,677 | ||||||||||||
| Poland | 262,851 | - | - | 262,851 | ||||||||||||
| Saudi Arabia | 492,860 | - | - | 492,860 | ||||||||||||
| South Africa | 252,568 | - | - | 252,568 | ||||||||||||
| South Korea | 151,878 | 521,116 | - | 672,994 | ||||||||||||
| Taiwan | 701,101 | - | - | 701,101 | ||||||||||||
| Thailand | 198,324 | - | - | 198,324 | ||||||||||||
| United Kingdom | 187,765 | - | - | 187,765 | ||||||||||||
| United States | 172,160 | - | - | 172,160 | ||||||||||||
| Rights Brazil | 165 | - | - | 165 | ||||||||||||
| Bank Deposit Investments | 152,320 | - | - | 152,320 | ||||||||||||
| Total Investments | $ | 6,049,329 | $ | 521,116 | $ | - | $ | 6,570,445 | ||||||||
| Quality Dividend Growth Fund | Level 1 | Level 2* | Level 3** | Total | ||||||||||||
| Investments | ||||||||||||||||
| Common Stocks1 | $ | 5,911,458 | $ | - | $ | - | $ | 5,911,458 | ||||||||
| Bank Deposit Investments | 516,750 | - | - | 516,750 | ||||||||||||
| Total Investments | $ | 6,428,208 | $ | - | $ | - | $ | 6,428,208 | ||||||||
| ^ | The Funds held a security valued at zero at period end. |
| * | The Funds did not hold any Level 2 securities at period end. |
| ** | The Funds did not hold any Level 3 securities at period end. |
| 1 | All common stocks held in the Funds are Level 1 securities. For a detailed break-out of common stocks by country or sector, please refer to the Schedule of Investments. |
166
WCM Funds
NOTES TO FINANCIAL STATEMENTS - Continued
December 31, 2023
The following is a reconciliation of assets in which significant unobservable inputs (Level 3) were used in determining value:
Emerging Markets Fund | International Small Cap Growth Fund | |||||||
| Common Stocks | Common Stocks | |||||||
| Balance as of December 31, 2022 | $ | - | $ | - | ||||
| Transfers into Level 3(1) | - | - | ||||||
| Transfers out of Level 3 | - | - | ||||||
| Total gains or losses for the period | ||||||||
| Realized loss included in earnings (or changes in net assets) | (27,708,448 | ) | (2,474,183 | ) | ||||
| Unrealized appreciation (depreciation) included in earnings (or changes in net assets) | 32,729,058 | 4,415,496 | ||||||
| Included in other comprehensive income | - | - | ||||||
| Net purchases | - | - | ||||||
| Net sales | (5,020,610 | ) | (1,941,313 | ) | ||||
| Balance as of December 31, 2023 | $ | - | $ | - | ||||
Change in unrealized gains or losses for the period included in earnings (or changes in net assets) for assets held at the end of the reporting period | $ | - | $ | - | ||||
International Value Fund | International Opportunities Fund | |||||||
| Common Stocks | Common Stocks | |||||||
| Balance as of December 31, 2022 | $ | - | $ | - | ||||
| Transfers into Level 3(1) | - | - | ||||||
| Transfers out of Level 3 | - | - | ||||||
| Total gains or losses for the period | - | |||||||
| Realized loss included in earnings (or changes in net assets) | (258,786 | ) | (288,071 | ) | ||||
| Unrealized appreciation (depreciation) included in earnings (or changes in net assets) | 384,645 | 339,871 | ||||||
| Included in other comprehensive income | - | - | ||||||
| Net purchases | - | - | ||||||
| Net sales | (125,859 | ) | (51,800 | ) | ||||
| Balance as of December 31, 2023 | $ | - | $ | 0 | ||||
| Change in unrealized gains or losses for the period included in earnings (or changes in net assets) for assets held at the end of the reporting period | $ | - | $ | - | ||||
167
WCM Funds
NOTES TO FINANCIAL STATEMENTS - Continued
December 31, 2023
The following table presents additional quantitative information about valuation methodologies and inputs used for investments that are measured at fair value and categorized within Level 3 as of December 31, 2023:
| Fund | Asset Class | Fair Value at December 31, 2023 | Valuation Technique(s) | Unobservable Input | Range of Input | Weighted Average | Impact to Valuation from an Increase in Input(1) | |
| Emerging Markets Fund | Common Stocks | $ | - | Market Approach | Liquidity Discount | 100% | N/A | Decrease |
| International Small Cap Growth Fund | Common Stocks | $ | - | Market Approach | Liquidity Discount | 100% | N/A | Decrease |
| International Value Fund | Common Stocks | $ | - | Market Approach | Liquidity Discount | 100% | N/A | Decrease |
| International Opportunities Fund | Common Stocks | $ | - | Market Approach | Liquidity Discount | 100% | N/A | Decrease |
| International Opportunities Fund | Warrants | $ | - | Market Approach | Liquidity Discount | 100% | N/A | Decrease |
| (1) | This column represents the directional change in the fair value of the Level 3 investments that would result from an increase to the corresponding unobservable input. A decrease to the unobservable input would have the opposite effect. |
Note 11 - Investments by Other Registered Investment Companies
For purposes of the 1940 Act, the Focused International Growth Fund and Focused Emerging Markets Fund are treated as a registered investment company. Section 12(d)(1) of the 1940 Act restricts investments by investment companies in the securities of other investment companies, including shares of the Fund. Rule 12d1-4 of the 1940 Act permits other investment companies to invest in the Fund beyond the limits in Section 12(d)(1), subject to certain terms and conditions, including that such investment companies enter into an agreement with the Fund.
Note 12 – Market Disruption and Geopolitical Risks
Certain local, regional or global events such as war, acts of terrorism, the spread of infectious illnesses and/or other public health issues, financial institution instability or other events may have a significant impact on a security or instrument. These types of events and other like them are collectively referred to as “Market Disruptions and Geopolitical Risks” and they may have adverse impacts on the worldwide economy, as well as the economies of individual countries, the financial health of individual companies and the market in general in significant and unforeseen ways. Some of the impacts noted in recent times include but are not limited to embargos, political actions, supply chain disruptions, bank failures, restrictions to investment and/or monetary movement including the forced selling of securities or the inability to participate impacted markets. The duration of these events could adversely affect the Fund’s performance, the performance of the securities in which the Fund invests and may lead to losses on your investment. The ultimate impact of “Market Disruptions and Geopolitical Risks” on the financial performance of the Fund’s investments is not reasonably estimable at this time. Management is actively monitoring these events.
168
WCM Funds
NOTES TO FINANCIAL STATEMENTS - Continued
December 31, 2023
Note 13 – New Accounting Pronouncements and Regulatory Updates
Effective January 24, 2023, the SEC adopted rule and form amendments to require mutual funds and exchange-traded funds (ETFs) to transmit concise and visually engaging streamlined annual and semiannual reports to shareholders that highlight key information deemed important for retail investors to assess and monitor their fund investments. Other information, including financial statements, will no longer appear in the funds’ streamlined shareholder reports but must be available online, delivered free of charge upon request, and filed on a semiannual basis on Form N-CSR. The rule and form amendments have a compliance date of July 24, 2024. At this time, management is evaluating the impact of these rule and form amendment changes on the content of the current shareholder report and the newly created annual and semiannual streamlined shareholder reports.
In December 2020, the SEC adopted a new rule providing a framework for fund valuation practices (“Rule 2a-5”). Rule 2a-5 establishes requirements for determining fair value in good faith for purposes of the 1940 Act. Rule 2a-5 will permit fund boards to designate certain parties to perform fair value determinations, subject to board oversight and certain other conditions. Rule 2a-5 also defines when market quotations are “readily available” for purposes of the 1940 Act and the threshold for determining whether a fund must fair value a security. In connection with Rule 2a-5, the SEC also adopted related recordkeeping requirements and is rescinding previously issued guidance, including with respect to the role of a board in determining fair value and the accounting and auditing of fund investments. The Fund has adopted procedures in accordance with Rule 2a-5.
Note 14 – Events Subsequent to the Fiscal Period End
The Funds have adopted financial reporting rules regarding subsequent events which require an entity to recognize in the financial statements the effects of all subsequent events that provide additional evidence about conditions that existed at the date of the balance sheet. Management has evaluated the Funds’ related events and transactions that occurred through the date of issuance of the Funds’ financial statements.
There were no events or transactions that occurred during this period that materially impacted the amounts or disclosures in the Funds’ Financial Statements.
169
REPORT OF INDEPENDENT REGISTERED PUBLIC ACCOUNTING FIRM
To the Board of Trustees of Investment Managers Series Trust and
Shareholders of WCM Funds
Opinion on the Financial Statements
We have audited the accompanying statements of assets and liabilities of the WCM Focused International Growth Fund, WCM Focused Emerging Markets Fund, WCM Focused Global Growth Fund, WCM International Small Cap Growth Fund, WCM Small Cap Growth Fund, WCM SMID Quality Value Fund, WCM China Quality Growth Fund, WCM Developing World Equity Fund, WCM International Equity Fund, WCM Focused International Value Fund, WCM Focused International Opportunities Fund, WCM Mid Cap Quality Value Fund, WCM Focused Emerging Markets ex China Fund, and WCM Quality Dividend Growth Fund (the “Funds”), each a series of Investment Managers Series Trust (the “Trust”), including the schedules of investments, as of December 31, 2023, the related statements of operations, the statements of changes in net assets, and the financial highlights for each of the periods indicated in the table below, and the related notes (collectively referred to as the “financial statements”). In our opinion, the financial statements present fairly, in all material respects, the financial position of the Funds as of December 31, 2023, the results of their operations, the changes in their net assets, and their financial highlights for each of the periods indicated in the table below, in conformity with accounting principles generally accepted in the United States of America.
| Individual Funds Constituting WCM Funds | Statement Of Operations | Statements Of Changes In Net Assets | Financial Highlights | |||
| WCM Focused International Growth Fund, WCM Focused Emerging Markets Fund, WCM Focused Global Growth Fund, and WCM International Small Cap Growth Fund | For the year ended December 31, 2023 | For the year ended December 31, 2023, for the eight months period ended December 31, 2022 and for the year ended April 30, 2022 | For the year ended December 31, 2023, for the eight months period ended December 31, 2022 and for each of the four years in the period ended April 30, 2022 | |||
| WCM Small Cap Growth Fund and WCM SMID Quality Value Fund | For the year ended December 31, 2023 | For the year ended December 31, 2023, for the eight months period ended December 31, 2022 and for the year ended April 30, 2022 | For the year ended December 31, 2023, for the eight months period ended December 31, 2022 and for each of the two years in the period ended April 30, 2022 and the period October 30, 2019 (commencement of operations) through April 30, 2020 | |||
| WCM China Quality Growth Fund, WCM Developing World Equity Fund, and WCM International Equity Fund | For the year ended December 31, 2023 | For the year ended December 31, 2023, for the eight months period ended December 31, 2022 and for the year ended April 30, 2022 | For the year ended December 31, 2023, for the eight months period ended December 31, 2022 and for each of the two years in the period ended April 30, 2022 and the period March 31, 2020 (commencement of operations) through April 30, 2020 | |||
| WCM Focused International Value Fund | For the year ended December 31, 2023 | For the year ended December 31, 2023, for the eight months period ended December 31, 2022 and for the year ended April 30, 2022 | For the year ended December 31, 2023, for the eight months period ended December 31, 2022, for the year ended April 30, 2022 and for the period June 29, 2020 (commencement of operations) through April 30, 2021 | |||
| WCM Focused International Opportunities Fund | For the year ended December 31, 2023 | For the year ended December 31, 2023, for the eight months period ended December 31, 2022 and for the year ended April 30, 2022 | For the year ended December 31, 2023, for the eight months period ended December 31, 2022, for the year ended April 30, 2022 and for the period March 30, 2021 (commencement of operations) through April 30, 2021 | |||
| WCM Mid Cap Quality Value Fund | For the year ended December 31, 2023 | For the year ended December 31, 2023 and for the period July 28, 2022 (commencement of operations) through December 31, 2022 | For the year ended December 31, 2023 and for the period July 28, 2022 (commencement of operations) through December 31, 2022 | |||
| WCM Focused Emerging Markets Ex China Fund | For the year ended December 31, 2023 | For the year ended December 31, 2023 and for the period December 29, 2022 (commencement of operations) through December 31, 2022 | For the year ended December 31, 2023 and for the period December 29, 2022 (commencement of operations) through December 31, 2022 | |||
| WCM Quality Dividend Growth Fund | For the period July 28, 2023 (commencement of operations) through December 31, 2023 | For the period July 28, 2023 (commencement of operations) through December 31, 2023 | For the period July 28, 2023 (commencement of operations) through December 31, 2023 |
170
To the Board of Trustees of Investment Managers Series Trust and
Shareholders of WCM Funds
Page Two
Basis for Opinion
These financial statements are the responsibility of the Funds’ management. Our responsibility is to express an opinion on the Funds’ financial statements based on our audits. We are a public accounting firm registered with the Public Company Accounting Oversight Board (United States) (“PCAOB”) and are required to be independent with respect to the Funds in accordance with the U.S. federal securities laws and the applicable rules and regulations of the Securities and Exchange Commission and the PCAOB. We have served as the auditor of one or more of the funds in the Trust since 2007.
We conducted our audits in accordance with the standards of the PCAOB. Those standards require that we plan and perform the audits to obtain reasonable assurance about whether the financial statements are free of material misstatement, whether due to error or fraud. The Funds are not required to have, nor were we engaged to perform, an audit of the Funds’ internal control over financial reporting. As part of our audits we are required to obtain an understanding of internal control over financial reporting, but not for the purpose of expressing an opinion on the effectiveness of the Funds’ internal control over financial reporting. Accordingly, we express no such opinion.
Our audits included performing procedures to assess the risks of material misstatement of the financial statements, whether due to error or fraud, and performing procedures that respond to those risks. Such procedures included examining, on a test basis, evidence regarding the amounts and disclosures in the financial statements. Our audits also included evaluating the accounting principles used and significant estimates made by management, as well as evaluating the overall presentation of the financial statements. Our procedures included confirmation of securities owned as of December 31, 2023 by correspondence with the custodian and brokers; when replies were not received from brokers, we performed other auditing procedures. We believe that our audits provide a reasonable basis for our opinion.
 | |
| TAIT, WELLER & BAKER LLP | |
| Philadelphia, Pennsylvania February 29, 2024 |
171
WCM Funds
SUPPLEMENTAL INFORMATION (Unaudited)
For Federal income tax purposes, the International Growth Fund, SMID Quality Value Fund, International Equity Fund and Mid Cap Quality Value Fund, designates long-term capital gain dividends of $114,405,772, $1,133,783, $251,598, $1,289, respectively, or amounts determined to be necessary, for the year ended December 31, 2023.
For the period ended December 31, 2023, 100%, 87.70%, 100%, 34.39%, 100%, 97.55%, 36.21%, 92.91% and 92.39% of dividends paid from net investment income, including short-term capital gains from the Emerging Markets Fund, China Quality Growth Fund, Developing World Equity Fund, International Equity Fund, International Value Fund, International Opportunities Fund, Mid Cap Quality Value Fund, Emerging Markets ex China Fund and Quality Dividend Growth Fund respectively, are designated as qualified dividend income.
For the period ended December 31, 2023, 7.87%, 4.85%, 36.21%, 0.46% and 63.85% of the dividends paid from net investment income, including short-term capital gains from the Developing World Equity Fund, International Equity Fund, Mid Cap Quality Value Fund, Emerging Markets ex China Fund and Quality Dividend Growth Fund respectively, are designated as dividends received deduction available to corporate shareholders.
Pursuant to Section 853 of the Internal Revenue Code of 1986, the Emerging Markets Fund, Developing World Equity Fund and International Equity Fund designates $6,219,627, $28,847, $1,044,827, respectively, of income derived from foreign sources and $2,393,133, $4,075, $75,940, respectively, of foreign taxes paid for the year ended December 31, 2023.
Of the ordinary income (including short-term capital gain) distributions made during the year ended December 31, 2023 the proportionate share of income derived from foreign sources and foreign taxes paid attributable to one share of stock is:
| Foreign Source Income | Foreign Taxes Paid | |
| Emerging Markets Fund | $0.0679 | $0.0261 |
| Developing World Equity Fund | $0.1812 | $0.0256 |
| International Equity Fund | $0.1743 | $0.0127 |
Trustees and Officers Information
Additional information about the Trustees is included in the Funds’ Statement of Additional Information which is available, without charge, upon request by calling (888) 988-9801. The Trustees and officers of the Funds and their principal occupations during the past five years are as follows:
Name, Address, Year of Birth and Position(s) held with Trust | Term of Officec and Length of Time Served | Principal Occupation During the Past Five Years and Other Affiliations | Number of Portfolios in the Fund Complex Overseen by Trusteed | Other Directorships Held During the Past Five Years by Trusteee |
| Independent Trustees: | ||||
| Charles H. Miller a (born 1947) Trustee | Since November 2007 | Retired (2013 – present). Executive Vice President, Client Management and Development, Access Data, a Broadridge company, a provider of technology and services to asset management firms (1997-2012). | 14 | None. |
Ashley Toomey Rabun a (born 1952) Trustee and Chairperson of the Board | Since November 2007 | Retired (2016 – present). President and Founder, InvestorReach, Inc., a financial services consulting firm (1996 – 2015). | 14 | Select Sector SPDR Trust, a registered investment company (includes 11 portfolios). |
172
WCM Funds
SUPPLEMENTAL INFORMATION (Unaudited) – Continued
Name, Address, Year of Birth and Position(s) held with Trust | Term of Officec and Length of Time Served | Principal Occupation During the Past Five Years and Other Affiliations | Number of Portfolios in the Fund Complex Overseen by Trusteed | Other Directorships Held During the Past Five Years by Trusteee |
| William H. Young a (born 1950) Trustee | Since November 2007 | Retired (2014 - present). Independent financial services consultant (1996 – 2014). Interim CEO, Unified Fund Services Inc. (now Huntington Fund Services), a mutual fund service provider (2003 – 2006). Senior Vice President, Oppenheimer Management Company (1983 – 1996). Chairman, NICSA, an investment management trade association (1993 – 1996). | 14 | None. |
| James E. Ross a (born 1965) Trustee | Since December 2022 | Non-Executive Chairman and Director, Fusion Acquisition Corp. II, a special purpose acquisition company (March 2021 – present); Non-Executive Chairman and Director, Fusion Acquisition Corp., a special purpose acquisition company (June 2020 – September 2021); Executive Vice President, State Street Global Advisors, a global asset management firm (2012 – March 2020); Chairman and Director, SSGA Funds Management, Inc., a registered investment advisor (2005 – March 2020); Chief Executive Officer, Manager and Director, SSGA Funds Distributor, LLC, a broker-dealer (2017 – March 2020). | 14 | SPDR Index Shares Funds, a registered investment company (includes 26 portfolios); SPDR Series Trust, a registered investment company (includes 125 portfolios); Select Sector SPDR Trust, a registered investment company (includes 11 portfolios); SSGA Active Trust, a registered investment company (includes 14 portfolios); Fusion Acquisition Corp II. |
173
WCM Funds
SUPPLEMENTAL INFORMATION (Unaudited) – Continued
| Interested Trustee: | ||||
Maureen Quill ᵃ* (born 1963) Trustee and President | Since June 2019 | President, Investment Managers Series Trust (June 2014 – present); EVP/Executive Director Registered Funds (January 2018 – present), Chief Operating Officer (June 2014 – January 2018), and Executive Vice President (January 2007 – June 2014), UMB Fund Services, Inc.; President, UMB Distribution Services (March 2013 – December 2020); Vice President, Investment Managers Series Trust (December 2013 – June 2014). | 14 | Investment Managers Series Trust III, a registered investment company (includes 5 portfolios), Source Capital, Inc., a closed-end investment company. |
| Officers of the Trust: | ||||
Rita Dam b (born 1966) Treasurer and Assistant Secretary | Since December 2007 | Co-Chief Executive Officer (2016 – present), and Vice President (2006 – 2015), Mutual Fund Administration, LLC; Co-President, Foothill Capital Management, LLC, a registered investment advisor (2018 – 2022). | N/A | N/A |
Joy Ausili b (born 1966) Vice President, Assistant Secretary and Assistant Treasurer | Since March 2016 | Co-Chief Executive Officer (2016 – present), and Vice President (2006 – 2015), Mutual Fund Administration, LLC; Co-President, Foothill Capital Management, LLC, a registered investment advisor (2018 – 2022); Secretary and Assistant Treasurer, Investment Managers Series Trust (December 2007 – March 2016). | N/A | N/A |
| Diane Drakeb (born 1967) Secretary | Since March 2016 | Senior Counsel, Mutual Fund Administration, LLC (October 2015 – present); Chief Compliance Officer, Foothill Capital Management, LLC, a registered investment advisor (2018 – 2019). | N/A | N/A |
Martin Dziura b (born 1959) Chief Compliance Officer | Since June 2014 | Principal, Dziura Compliance Consulting, LLC (October 2014 – present); Managing Director, Cipperman Compliance Services (2010 – September 2014); Chief Compliance Officer, Hanlon Investment Management (2009 – 2010); Vice President - Compliance, Morgan Stanley Investment Management (2000 - 2009). | N/A | N/A |
| a | Address for certain Trustees and certain officers: 235 West Galena Street, Milwaukee, Wisconsin 53212. |
| b | Address for Ms. Ausili, Ms. Dam and Ms. Drake: 2220 E. Route 66, Suite 226, Glendora, California 91740. Address for Mr. Dziura: 309 Woodridge Lane, Media, Pennsylvania 19063. |
| c | Trustees and officers serve until their successors have been duly elected. |
| d | The Trust is comprised of 41 series managed by unaffiliated investment advisors. The term “Fund Complex” applies only to the Funds managed by the same investment advisor. The Funds do not hold themselves out as related to any other series within the Trust, for purposes of investment and investor services, nor do they share the same investment advisor with any other series. |
| e | “Other Directorships Held” includes only directorships of companies required to register or file reports with the SEC under the Securities Exchange Act of 1934, as amended (that is, “public companies”) or other investment companies registered under the 1940 Act. |
174
WCM Funds
SUPPLEMENTAL INFORMATION (Unaudited) - Continued
| * | Ms. Quill is an “interested person” of the Trust by virtue of her position with UMB Fund Services, Inc. |
Effective June 16, 2022, Eric M. Banhazl, who served as a Trustee of the Trust from January 2008 to June 14, 2022, is serving as a Trustee Emeritus of the Trust. As a Trustee Emeritus, Mr. Banhazl may attend the meetings of the Board of Trustees or any of its committees, but has no duties, powers or responsibilities with respect to the Trust.
175
WCM Funds
SUPPLEMENTAL INFORMATION (Unaudited) – Continued
Board Consideration of Investment Advisory Agreement
At an in-person meeting held on June 13-14, 2023, the Board of Trustees (the “Board”) of Investment Managers Series Trust (the “Trust”), including the trustees who are not “interested persons” of the Trust (the “Independent Trustees”) as defined in the Investment Company Act of 1940, as amended (the “1940 Act”), reviewed and unanimously approved the investment advisory agreement (the “Advisory Agreement”) between the Trust and WCM Investment Management, LLC (the “Advisor”) for an initial two-year term with respect to the WCM Quality Dividend Growth Fund (the “New Fund”), a new series of the Trust.
At an in-person meeting held on December 4-5, 2023, the Board and the Independent Trustees also reviewed and unanimously approved the renewal of the Advisory Agreement between the Trust and the Advisor for an additional one-year term from when it otherwise would expire, with respect to the following series of the Trust (each, a “Fund” and collectively, the “Funds”):
| · | WCM China Quality Growth Fund (the “China Quality Growth Fund”), |
| · | WCM Developing World Equity Fund (the “Developing World Equity Fund”), |
| · | WCM Focused Emerging Markets Fund (the “Focused Emerging Markets Fund”), |
| · | WCM Focused Global Growth Fund (the “Focused Global Growth Fund”), |
| · | WCM Focused International Growth Fund (the “Focused International Growth Fund”), |
| · | WCM Focused International Opportunities Fund (the “Focused International Opportunities Fund”), |
| · | WCM Focused International Value Fund (the “Focused International Value Fund”), |
| · | WCM International Equity Fund (the “International Equity Fund”), |
| · | WCM International Small Cap Growth Fund (the “International Small Cap Growth Fund”), |
| · | WCM Mid Cap Quality Value Fund (the “Mid Cap Quality Value Fund”), |
| · | WCM Small Cap Growth Fund (the “Small Cap Growth Fund”), and |
| · | WCM SMID Quality Value Fund (the “SMID Quality Value Fund”). |
In approving the Advisory Agreement with respect to the New Fund, the Board, including the Independent Trustees, determined that such approval was in the best interests of the New Fund and its shareholders. In renewing the Advisory Agreement with respect to each Fund, the Board, including the Independent Trustees, determined that such renewal was in the best interests of the Fund and its shareholders.
WCM Quality Dividend Growth Fund
Background
In advance of the June meeting, the Board received information about the New Fund and the Advisory Agreement from the Advisor and from Mutual Fund Administration, LLC and UMB Fund Services, Inc., the Trust’s coadministrators, certain portions of which are discussed below. The materials, among other things, included information about the organization and financial condition of the Advisor; information regarding the background, experience, and compensation structure of relevant personnel who would be providing services to the New Fund; information about the Advisor’s compliance policies and procedures, disaster recovery and contingency planning, and policies with respect to portfolio execution and trading; information regarding the estimated profitability of the Advisor’s overall relationship with the New Fund; information regarding the performance of a composite of accounts managed by the portfolio managers of the New Fund, while employed by Martin Capital Partners LLC, pursuant to a Core Dividend Strategy that has investment objectives, policies, strategies, and risks substantially similar to those of the New Fund for the one-, three-, five-, and ten-year periods ended December 31, 2022; and a report prepared by Broadridge Financial Solutions, Inc. (“Broadridge”) comparing the proposed advisory fee and estimated total expenses of the New Fund with those of a group of comparable funds selected by Broadridge (the “Peer Group”) from Morningstar, Inc.’s Large Blend category (the “Fund Universe”). The Board also received a memorandum from legal counsel to the Trust discussing the legal standards under the 1940 Act and other applicable law for their consideration of the proposed approval of the Advisory Agreement. In addition, the Board considered information reviewed by the Board regarding other series of the Trust managed by the Advisor during the year at other Board and Board committee meetings. No representatives of the Advisor were present during the Board’s consideration of the Advisory Agreement, and the Independent Trustees were represented by their legal counsel with respect to the matters considered.
176
WCM Funds
SUPPLEMENTAL INFORMATION (Unaudited) - Continued
In approving the Advisory Agreement, the Board and the Independent Trustees considered a variety of factors, including those discussed below. In their deliberations, the Board and the Independent Trustees did not identify any particular factor that was controlling, and each Trustee may have attributed different weights to the various factors.
Nature, Extent, and Quality of Services
With respect to the relevant performance information, the meeting materials indicated that the returns of the Core Dividend Strategy (net of fees) outperformed the MSCI World High Dividend Yield Index for the one-, three-, five-, and ten-year periods. The Board noted its familiarity with the Advisor as the investment advisor for a number of other series of the Trust, and considered the services to be provided by the Advisor to the New Fund. In doing so, the Board considered the Advisor’s specific responsibilities in day-to-day management and oversight of the New Fund, as well as the qualifications, experience, and responsibilities of the personnel of the Advisor who would be involved in the activities of the New Fund. The Board also considered the overall quality of the organization and operations of the Advisor, as well as its compliance structure and compliance procedures.
The Board and the Independent Trustees concluded that based on the various factors they had reviewed, the Advisor would have the capabilities, resources, and personnel necessary to manage the New Fund, and that the Advisor would provide the New Fund with a reasonable potential for good investment results.
Advisory Fee and Expense Ratio
The Board reviewed information regarding the New Fund’s proposed advisory fee and estimated total expenses. The meeting materials indicated that the New Fund’s proposed annual investment advisory fee (gross of fee waivers) was lower than the Peer Group median, but higher than the Fund Universe median by 0.05%. The Trustees considered that the Advisor does not manage any other mutual funds, pension funds, or institutional separate accounts using the same objectives and policies as the New Fund, and therefore they did not have a good basis for comparing the New Fund’s proposed advisory fee with those of other similar accounts of the Advisor. The Trustees also noted that the proposed advisory fee was lower than the advisory fees paid by other series of the Trust managed by the Advisor.
The meeting materials indicated that the estimated annual total expenses (net of fee waivers) of the New Fund were higher than the Peer Group and Fund Universe medians by 0.14% and 0.30%, respectively. The Trustees noted, however, that the estimated assets of the New Fund were significantly lower than the average net assets of corresponding classes of funds in the Peer Group and Fund Universe, and that certain of those other funds also had significant assets in other classes.
177
WCM Funds
SUPPLEMENTAL INFORMATION (Unaudited) - Continued
The Board and the Independent Trustees concluded that the proposed compensation payable to the Advisor under the Advisory Agreement would be fair and reasonable in light of the nature and quality of the services proposed to be provided by the Advisor to the New Fund.
Profitability, Benefits to the Advisor, and Economies of Scale
The Board next reviewed the estimated profitability to the Advisor of its relationship with the New Fund in the New Fund’s first year of operations, taking into account estimated assets of $10 million. The Board observed that the Advisor anticipated waiving its entire advisory fee and subsidizing certain of the operating expenses for the New Fund, and that the Advisor anticipated that it would not realize a profit with respect to the New Fund in the first year of operations.
The Board noted that the potential benefits received by the Advisor as a result of its relationship with the New Fund, other than the receipt of its advisory fee, would include the usual types of “fall out” benefits received by advisors to the Trust, including any research received from broker-dealers providing execution services to the New Fund, the beneficial effects from the review by the Trust’s Chief Compliance Officer of the Advisor’s compliance program, the intangible benefits of its association with the New Fund generally, and any favorable publicity arising in connection with the New Fund’s performance. The Board also noted that although the Advisory Agreement does not provide for any advisory fee breakpoints, the New Fund’s asset level would likely be too low to achieve significant economies of scale during the initial startup period, and that any such economies would be considered in the future as the New Fund’s assets grow.
Conclusion
Based on these and other factors, the Board and the Independent Trustees concluded that approval of the Advisory Agreement was in the best interests of the New Fund and its shareholders and, accordingly, approved the Advisory Agreement with respect to the New Fund.
WCM China Quality Growth Fund, WCM Developing World Equity Fund, WCM Focused Emerging Markets Fund, WCM Focused Global Growth Fund, WCM Focused International Growth Fund, WCM Focused International Opportunities Fund, WCM Focused International Value Fund, WCM International Equity Fund, WCM International Small Cap Growth Fund, WCM Mid Cap Quality Value Fund, WCM Small Cap Growth Fund, and WCM SMID Quality Value Fund
Background
In advance of the December meeting, the Board received information about the Funds and the Advisory Agreement from the Advisor and from Mutual Fund Administration, LLC and UMB Fund Services, Inc., the Trust’s coadministrators, certain portions of which are discussed below. The materials, among other things, included information about the Advisor’s organization and financial condition; information regarding the background, experience, and compensation structure of relevant personnel providing services to the Funds; information about the Advisor’s compliance policies and procedures, disaster recovery and contingency planning, and policies with respect to portfolio execution and trading; information regarding the profitability of the Advisor’s overall relationship with the Funds; reports comparing the performance of each Fund with returns of its benchmark index and its Peer Group selected by Broadridge from Morningstar, Inc.’s relevant Fund Universe for various periods ended September 30, 2023; and reports comparing the investment advisory fee and total expenses of each Fund with those of its Peer Group and Fund Universe. The Board also received a memorandum from legal counsel to the Trust discussing the legal standards under the 1940 Act and other applicable law for their consideration of the proposed renewal of the Advisory Agreement. In addition, the Board considered information reviewed by the Board during the year at other Board and Board committee meetings. No representatives of the Advisor were present during the Board’s consideration of the Advisory Agreement, and the Independent Trustees were represented by their legal counsel with respect to the matters considered.
178
WCM Funds
SUPPLEMENTAL INFORMATION (Unaudited) - Continued
In renewing the Advisory Agreement, the Board and the Independent Trustees considered a variety of factors, including those discussed below. In their deliberations, the Board and the Independent Trustees did not identify any particular factor that was controlling, and each Trustee may have attributed different weights to the various factors.
Nature, Extent, and Quality of Services
The Board considered information included in the meeting materials regarding the performance of each Fund. The materials they reviewed indicated the following:
· | The China Quality Growth Fund’s annualized total return for the three-year period was above the MSCI China Index return, the MSCI China All Shares Index return, and the China Region Fund Universe median return, but below the Peer Group median return by 0.04%. The Fund’s total return for the one-year period was above the Peer Group and Fund Universe median returns, but below the MSCI China All Shares Index return and the MSCI China Index return by 1.81% and 6.69%, respectively. The Trustees observed that the Fund’s volatility of returns, as measured by its standard deviation; its risk-adjusted returns, as measured by its Sharpe ratio; its downside volatility, as measured by its Morningstar risk score; and its risk-adjusted returns relative to the benchmark, as measured by its information ratio, ranked it in the first or second quartile of the funds (which are the most favorable) in the Peer Group and Fund Universe for the one-year period. The Trustees also considered the Advisor’s belief that the Fund’s underperformance relative to the Peer Group over the three-year period was primarily due to the Fund’s avoidance of the energy sector, which was the best performing sector in the MSCI China All Shares Index during the period. |
· | The Developing World Equity Fund’s annualized total return for the three-year period was above the Peer Group and Diversified Emerging Markets Fund Universe median returns and the MSCI Emerging Markets Index return. For the one-year period, the Fund’s total return was above the Peer Group median return and the MSCI Index return, but below the Fund Universe median return by 0.17%. The Trustees observed that the Fund’s volatility of returns, as measured by its standard deviation, and its downside volatility, as measured by its Morningstar risk score, ranked it in the first or second quartile of the funds (which are the most favorable) in the Peer Group and Fund Universe for the one- and three-year periods. |
· | The Focused Emerging Markets Fund’s annualized total returns for the five- and ten-year periods were above the Peer Group and Diversified Emerging Markets Fund Universe median returns and the MSCI Emerging Markets Index returns. For the three-year period, the Fund’s annualized total return was below the Peer Group and Fund Universe median returns and the MSCI Index return by 1.04%, 5.86%, and 6.37%, respectively. The Fund’s total return for the one-year period was below the Peer Group median return by 3.58%, the MSCI Index return by 6.45%, and the Fund Universe median return by 8.60%. The Trustees considered the Advisor’s assertion that the Fund’s underperformance relative to the Peer Group and the MSCI Index over the one- and three-year periods was mainly due to stock selection, including in the information technology and consumer discretionary sectors, among others. |
· | The Focused Global Growth Fund’s annualized total returns for the five- and ten-year periods were above the Peer Group and Global Large-Stock Growth Fund Universe median returns and the MSCI All Country World Index returns. For the three-year period, the Fund’s annualized total return was the same as the Peer Group median return, but below the Fund Universe median return and the MSCI Index return by 1.26% and 5.67%, respectively. The Fund’s total return for the one-year period was below the Fund Universe and Peer Group median returns and the MSCI Index return by 2.22%, 2.56%, and 3.67%, respectively. The Trustees considered the Advisor’s assertion that the Fund’s underperformance relative to the Peer Group and the MSCI Index for the one-year period was mainly due to stock selection in the information technology and financial sectors, an overweight allocation to the healthcare sector, and the Fund’s avoidance of the energy sector, which was the best performing sector in the MSCI Index during the period. The Trustees also observed that the Fund’s volatility of returns, as measured by its standard deviation, and its downside volatility, as measured by its Morningstar risk score, ranked it in the first or second quartile of the funds (which are the most favorable) in the Peer Group and Fund Universe for the one-, three-, five-, and ten-year periods. |
179
WCM Funds
SUPPLEMENTAL INFORMATION (Unaudited) - Continued
· | The Focused International Growth Fund’s annualized total returns for the five- and ten-year periods were above the Peer Group and Foreign Large Growth Fund Universe median returns and the MSCI All Country World Ex-USA Index returns. For the three-year period, the Fund’s annualized total return was above the Peer Group and Fund Universe median returns, but below the MSCI Index return by 3.28%. The Fund’s total return for the one-year period was below the Fund Universe median return by 0.01%, the MSCI Index return by 2.18%, and the Peer Group median return by 2.53%. The Trustees considered the Advisor’s assertion that the Fund’s underperformance relative to the Peer Group and the MSCI Index for the one-year period was mainly due to stock selection in the financial and information technology sectors, an overweight allocation to the healthcare sector, and the Fund’s avoidance of the energy sector, which was the best performing sector in the MSCI Index during the period. The Trustees also observed that the Fund’s risk-adjusted returns, as measured by its Sharpe ratio, and its risk-adjusted returns relative to the benchmark, as measured by its information ratio, ranked it in the first or second quartile of the funds (which are the most favorable) in the Peer Group and Fund Universe for the three-, five-, and ten-year periods. |
· | The Focused International Opportunities Fund’s total return for the one-year period was above the Peer Group and Foreign Small/Mid Blend Fund Universe median returns and the MSCI All Country World Ex-USA Index return. |
· | The Focused International Value Fund’s annualized total return for the three-year period was below the MSCI All Country World Ex-USA Index return and the Foreign Large Blend Fund Universe and Peer Group median returns by 0.75%, 1.58%, and 2.66%, respectively. The Fund’s total return for the one-year period was below the MSCI Index return and the Fund Universe and Peer Group median returns by 0.53%, 3.95%, and 5.04%, respectively. The Trustees considered the Advisor’s belief that the Fund’s underperformance relative to the Peer Group and the MSCI Index was due primarily to stock selection in the consumer discretionary sector over the one-year period, and over the three-year period, the Fund’s underweight allocation to the energy sector, which was the best performing sector in the MSCI Index, and stock selection in the industrials and materials sectors. The Trustees also observed that the Fund’s volatility of returns, as measured by its standard deviation, and its downside volatility, as measured by its Morningstar risk score, ranked it in the first or second quartile of the funds (which are the most favorable) in the Peer Group and Fund Universe for the one-year period. |
· | The International Equity Fund’s annualized total return for the three-year period was above the Peer Group and Foreign Large Growth Fund Universe median returns and the MSCI All Country World Ex-USA Index return. The Fund’s total return for the one-year period was above the Peer Group and Fund Universe median returns, but below the MSCI Index return by 0.81%. The Trustees considered the Advisor’s assertion that the Fund’s underperformance relative to the MSCI Index over the one-year period, was due primarily to stock selection, particularly in the financial, materials, and communications services sectors. |
· | The International Small Cap Growth Fund’s annualized total return for the five-year period was above the Peer Group and Foreign Small/Mid Growth Fund Universe median returns and the MSCI All Country World Ex-USA Small Cap Index return. The Fund’s total return for the one-year period was above the Peer Group and Fund Universe median returns, but below the MSCI Index return by 3.80%. The Fund’s annualized total return for the three-year period was below the Peer Group and Fund Universe median returns and the MSCI Index return by 1.00%, 2.31%, and 9.22%, respectively. The Trustees considered the Advisor’s belief that the Fund’s underperformance relative to the Peer Group and the MSCI Index over the three-year period was due to stock selection in the information technology, industrials, consumer discretionary, and financial sectors, and the Fund’s overweight allocation to the health care sector. The Trustees observed that the Fund’s risk-adjusted returns, as measured by its Sharpe ratio, and its risk-adjusted returns relative to the benchmark, as measured by its information ratio, ranked it in the first or second quartile of the funds (which are the most favorable) in the Peer Group and Fund Universe for the one- and five-year periods. |
180
WCM Funds
SUPPLEMENTAL INFORMATION (Unaudited) – Continued
· | The Mid Cap Quality Value Fund’s total return for the one-year period was above the Peer Group and MidCap Blend Fund Universe median returns and the Russell Mid Cap Value Index return. |
· | The Small Cap Growth Fund’s total return for the one-year period was above the Peer Group and Small Growth Fund Universe median returns and the Russell 2000 Growth Index return. The Fund’s annualized total return for the three-year period was above the Fund Universe median return and the Russell Index return, but below the Peer Group median return by 0.27%. The Trustees considered the Advisor’s assertion that the Fund’s underperformance relative to the Peer Group over the three-year period was largely due to stock selection in health care sector and the Fund’s underweight allocation to the energy sector, which was the best performing sector in the Russell Index during the period. |
· | The SMID Quality Value Fund’s total return for the one-year period was above the Peer Group and Small Value Fund Universe median returns and the Russell 2500 Value Index return. The Fund’s annualized total return for the three-year period was below the Russell Index return and the Peer Group and Fund Universe median returns by 0.89%, 2.63%, and 3.49%, respectively. The Trustees considered the Advisor’s explanation that the Fund’s underperformance relative to the Peer Group and the Russell Index for the three-year period was mainly due to the Fund’s avoidance of the energy sector, which was the best performing sector in the Russell Index during the period. The Trustees also observed that the Fund’s volatility of returns, as measured by its standard deviation, and its downside volatility, as measured by its Morningstar risk score, ranked it in the first quartile of the funds (which is the most favorable) in the Peer Group and Fund Universe for the three-year period. |
The Board considered the overall quality of services provided by the Advisor to the Funds. In doing so, the Board considered the Advisor’s specific responsibilities in day-to-day management and oversight of the Funds, as well as the qualifications, experience, and responsibilities of the personnel involved in the activities of the Funds. The Board also considered the overall quality of the organization and operations of the Advisor, as well as its compliance structure. The Board and the Independent Trustees concluded that based on the various factors they had reviewed, the nature, overall quality, and extent of the management and oversight services provided by the Advisor to each Fund were satisfactory.
Advisory Fees and Expense Ratios
With respect to the advisory fees and expenses paid by the Funds, the meeting materials indicated the following:
· | The China Quality Growth Fund’s annual investment advisory fee (gross of fee waivers) was higher than the Peer Group and China Region Fund Universe medians by 0.10% and 0.115%, respectively. The Trustees noted that the Fund’s advisory fee was higher than the sub-advisory fees that the Advisor charges to subadvise mutual funds using the same strategy as the Fund. The Trustees observed, however, that the Advisor provides more services to the Fund than it does to funds for which it serves as sub-advisor. The Trustees also considered that the Fund’s advisory fee was within the range of advisory fees paid by other series of the Trust managed by the Advisor. |
181
WCM Funds
SUPPLEMENTAL INFORMATION (Unaudited) - Continued
The annual total expenses paid by the Fund (net of fee waivers) for the Fund’s most recent fiscal year were higher than the Peer Group and Fund Universe medians by 0.10% and 0.12%, respectively. The Trustees considered that the Fund’s total net expenses were not in the highest quartile of those funds in the Peer Group or the Fund Universe. The Trustees also noted that the average net assets of the Fund’s class considered by Broadridge were significantly lower than the average net assets of corresponding classes of funds in the Fund Universe, and that certain of those other funds also had significant assets in other classes.
· | The Developing World Equity Fund’s annual investment advisory fee (gross of fee waivers) was higher than the Diversified Emerging Markets Fund Universe and Peer Group medians by 0.05% and 0.15%, respectively. The Trustees considered that the Advisor does not manage any other accounts with the same objectives and policies as the Fund, and therefore they did not have a good basis for comparing the Fund’s advisory fee with those of other similar client accounts of the Advisor. The Trustees also considered that the Fund’s advisory fee was within the range of advisory fees paid by other series of the Trust managed by the Advisor. |
The annual total expenses paid by the Fund (net of fee waivers) for the Fund’s most recent fiscal year were lower than the Peer Group and Fund Universe medians.
· | The Focused Emerging Markets Fund’s annual investment advisory fee (gross of fee waivers) was higher than the Peer Group and Diversified Emerging Markets Fund Universe medians by 0.0375% and 0.13%, respectively. The Trustees noted that the Fund’s advisory fee was within the range of advisory fees that the Advisor charges to manage private funds using the same strategy as the Fund, but higher than the fees that the Advisor charges to sub-advise mutual funds using the same strategy as the Fund. The Trustees observed, however, that management of mutual fund assets requires compliance with certain requirements under the 1940 Act that do not apply to the private funds that the Advisor manages, that the demands on the Advisor’s personnel and trading infrastructure are greater for the Fund as a result of the daily cash inflows and outflows, that the Advisor provides more services to the Fund than it does to funds for which it serves as sub-advisor, and that the Advisor has contractually agreed to limit the Fund’s total operating expenses. The Trustees also considered that the Fund’s advisory fee was within the range of advisory fees paid by other series of the Trust managed by the Advisor. |
The annual total expenses paid by the Fund (net of fee waivers) for the Fund’s most recent fiscal year were higher than the Peer Group and Fund Universe medians by 0.20% and 0.24%, respectively. The Trustees noted the Advisor’s observation that some of the funds in the Peer Group are part of larger fund complexes and therefore could have lower expenses or support lower expense caps.
· | The Focused Global Growth Fund’s annual investment advisory fee (gross of fee waivers) was higher than the Peer Group and Global Large-Stock Growth Fund Universe medians by 0.05% and 0.10%, respectively. The Trustees noted that the Fund’s advisory fee was within the range of advisory fees that the Advisor charges to manage private funds using the same strategy as the Fund, but higher than the sub-advisory fees that the Advisor charges to sub-advise mutual funds using the same strategy as the Fund. The Trustees observed, however, that management of mutual fund assets requires compliance with certain requirements under the 1940 Act that do not apply to the private funds that the Advisor manages, that the demands on the Advisor’s personnel and trading infrastructure are greater for the Fund as a result of the daily cash inflows and outflows, that the Advisor provides more services to the Fund than it does to funds for which it serves as sub-advisor, and that the Advisor has contractually agreed to limit the Fund’s total expenses. The Trustees also considered that the Fund’s advisory fee was within the range of advisory fees paid by other series of the Trust managed by the Advisor. |
182
WCM Funds
SUPPLEMENTAL INFORMATION (Unaudited) - Continued
The annual total expenses paid by the Fund (net of fee waivers) for the Fund’s most recent fiscal year were higher than the Peer Group and Fund Universe medians by 0.07% and 0.15%, respectively. The Trustees noted the Advisor’s observation that some of the funds in the Peer Group are part of larger fund complexes and therefore could have lower expenses or support lower expense caps.
· | The Focused International Growth Fund’s annual investment advisory fee (gross of fee waivers) was higher than the Peer Group and Foreign Large Growth Fund Universe medians by 0.116% and 0.1527%, respectively. The Trustees considered the Advisor’s belief that the Fund’s advisory fee is reasonable given the active style of management and the limited capacity of the strategy. The Trustees noted that the Fund’s advisory fee was within the range of advisory fees that the Advisor charges to manage private funds using the same strategy as the Fund, but higher than the sub-advisory fees that the Advisor charges to sub-advise mutual funds using the same strategy as the Fund. The Trustees observed, however, that management of mutual fund assets requires compliance with certain requirements under the 1940 Act that do not apply to the private funds that the Advisor manages, that the demands on the Advisor’s personnel and trading infrastructure are greater for the Fund as a result of the daily cash inflows and outflows, and that the Advisor provides more services to the Fund than it does to funds for which it serves as sub-advisor. The Trustees also considered that the Fund’s advisory fee was within the range of advisory fees paid by other series of the Trust managed by the Advisor. |
The annual total expenses paid by the Fund (net of fee waivers) for the Fund’s most recent fiscal year were higher than the Peer Group and Fund Universe medians by 0.21% and 0.22%, respectively. The Trustees noted the Advisor’s observation that some of the funds in the Peer Group are part of larger fund complexes and therefore could have lower expenses or support lower expense caps.
· | The Focused International Opportunities Fund’s annual investment advisory fee (gross of fee waivers) was higher than the Foreign Small/Mid Blend Fund Universe and Peer Group medians by 0.05% and 0.075%, respectively. The Trustees considered that the Advisor does not manage any other accounts with the same objectives and policies as the Fund, and therefore they did not have a good basis for comparing the Fund’s advisory fee with those of other similar client accounts of the Advisor. The Trustees also considered that the Fund’s advisory fee was within the range of advisory fees paid by other series of the Trust managed by the Advisor. |
The annual total expenses paid by the Fund (net of fee waivers) for the Fund’s most recent fiscal year were higher than the Fund Universe and Peer Group medians by 0.22% and 0.23%, respectively. The Trustees noted, however, that the average net assets of the Fund’s class considered by Broadridge were significantly lower than the average net assets of corresponding classes of funds in the Peer Group and Fund Universe, and that certain of those other funds also had significant assets in other classes.
· | The Focused International Value Fund’s annual investment advisory fee (gross of fee waivers) was higher than the Peer Group and Foreign Large Blend Fund Universe medians by 0.10% and 0.11%, respectively. The Trustees noted that the Advisor does not manage any other accounts with the same objectives and policies as the Fund, and therefore they did not have a good basis for comparing the Fund’s advisory fee with those of other similar client accounts of the Advisor. The Trustees also considered that the Fund’s advisory fee was within the range of advisory fees paid by other series of the Trust managed by the Advisor. |
183
WCM Funds
SUPPLEMENTAL INFORMATION (Unaudited) - Continued
The annual total expenses paid by the Fund (net of fee waivers) for the Fund’s most recent fiscal year were higher than the Peer Group and Fund Universe medians by 0.35% and 0.43%, respectively. The Trustees noted, however, that the average net assets of the Fund’s class considered by Broadridge were significantly lower than the average net assets of corresponding classes of funds in the Peer Group and Fund Universe, and that certain of those other funds also had significant assets in other classes.
· | The International Equity Fund’s annual investment advisory fee (gross of fee waivers) was slightly higher than the Peer Group median by 0.025%, and higher than the Foreign Large Growth Fund Universe median by 0.10%. The Trustees noted that the Advisor does not manage any other accounts with the same objectives and policies as the Fund, and therefore they did not have a good basis for comparing the Fund’s advisory fee with those of other similar client accounts of the Advisor. The Trustees also considered that the Fund’s advisory fee was within the range of advisory fees paid by other series of the Trust managed by the Advisor. |
The annual total expenses paid by the Fund (net of fee waivers) for the Fund’s most recent fiscal year were lower than the Peer Group median and the same as the Fund Universe median. The Trustees noted, however, that the average net assets of the Fund’s class considered by Broadridge were significantly lower than the average net assets of corresponding classes of funds in the Fund Universe, and that certain of those other funds also had significant assets in other classes.
· | The International Small Cap Growth Fund’s annual investment advisory fee (gross of fee waivers) was slightly higher than the Peer Group median by 0.005%, and higher than the Foreign Small/Mid Growth Fund Universe median by 0.05%. The Trustees noted that the Fund’s advisory fee was within the range of advisory fees that the Advisor charges to manage private funds using the same strategy as the Fund, but higher than the sub-advisory fees that the Advisor charges to sub-advise mutual funds using the same strategy as the Fund. The Trustees observed, however, that management of mutual fund assets requires compliance with certain requirements under the 1940 Act that do not apply to the private funds that the Advisor manages, that the demands on the Advisor’s personnel and trading infrastructure are greater for the Fund as a result of the daily cash inflows and outflows, and that the Advisor provides more services to the Fund than it does to funds for which it serves as sub-advisor. The Trustees also considered that the Fund’s advisory fee was within the range of advisory fees paid by other series of the Trust managed by the Advisor. |
The annual total expenses paid by the Fund (net of fee waivers) for the Fund’s most recent fiscal year were higher than the Peer Group and Fund Universe medians by 0.09% and 0.19%, respectively. The Trustees considered that the Fund’s total expenses were not in the highest quartile of those funds in the Peer Group.
· | The Mid Cap Quality Value Fund’s annual investment advisory fee (gross of fee waivers) was higher than both the Peer Group and Mid-Cap Blend Fund Universe medians by 0.10%. The Trustees noted that the Advisor does not manage any other accounts with the same objectives and policies as the Fund, and therefore they did not have a good basis for comparing the Fund’s advisory fee with those of other similar client accounts of the Advisor. The Trustees also considered that the Fund’s advisory fee was within the range of advisory fees paid by other series of the Trust managed by the Advisor. |
The annual total expenses paid by the Fund (net of fee waivers) for the Fund’s most recent fiscal year were higher than the Peer Group and Fund Universe medians by 0.07% and 0.12%, respectively. The Trustees noted, however, that the average net assets of the Fund’s class considered by Broadridge were quite low and were significantly lower than the average net assets of corresponding classes of funds in the Peer Group and Fund Universe, and that certain of those other funds also had significant assets in other classes.
184
WCM Funds
SUPPLEMENTAL INFORMATION (Unaudited) - Continued
· | The Small Cap Growth Fund’s annual investment advisory fee (gross of fee waivers) was higher than the Small Growth Fund Universe and Peer Group medians by 0.18% and 0.19%, respectively. The Trustees considered the Advisor’s belief that the Fund’s advisory fee is reasonable given the active, concentrated style of management and the limited capacity of the strategy. The Trustees noted that the Fund’s advisory fee was higher than the sub-advisory fees that the Advisor charges to sub-advise mutual funds using the same strategy as the Fund. The Trustees observed, however, that the Advisor provides more services to the Fund than it does to funds for which it serves as sub-advisor. The Trustees also considered that the Fund’s advisory fee was within the range of advisory fees paid by other series of the Trust managed by the Advisor. |
The annual total expenses paid by the Fund (net of fee waivers) for the Fund’s most recent fiscal year were the same as the Peer Group median, but slightly higher than the Fund Universe median by 0.02%. The Trustees noted, however, that the average net assets of the Fund’s class considered by Broadridge were significantly lower than the average net assets of corresponding classes of funds in the Peer Group and Fund Universe, and that certain of those other funds also had significant assets in other classes.
· | The SMID Quality Value Fund’s annual investment advisory fee (gross of fee waivers) was the same as the Peer Group median, but higher than the Small Value Fund Universe median by 0.05%. The Trustees noted that the Advisor does not manage any other accounts with the same objectives and policies as the Fund, and therefore they did not have a good basis for comparing the Fund’s advisory fee with those of other similar client accounts of the Advisor. The Trustees also considered that the Fund’s advisory fee was within the range of advisory fees paid by other series of the Trust managed by the Advisor. |
The annual total expenses paid by the Fund (net of fee waivers) for the Fund’s most recent fiscal year were lower than the Peer Group and Fund Universe medians.
The Board and the Independent Trustees concluded that based on the factors they had reviewed, the compensation payable to the Advisor under the Advisory Agreement was fair and reasonable in light of the nature and quality of the services the Advisor provides to the Funds.
Profitability, Benefits to the Advisor, and Economies of Scale
The Board next considered information prepared by the Advisor relating to its costs and profits with respect to each Fund for the year ended September 30, 2023, noting that the Advisor had waived its entire advisory fee and subsidized certain of the operating expenses for the China Quality Growth Fund, Developing World Equity Fund, Focused International Value Fund, and Mid Cap Quality Value Fund; had waived almost its entire advisory fee for the Focused International Opportunities Fund and Small Cap Growth Fund; had waived a significant portion of its advisory fee for the SMID Quality Value Fund and International Equity Fund; had waived a portion of its advisory fee for the Focused Emerging Markets Fund, Focused Global Growth Fund, and International Small Cap Growth Fund; and had not realized a profit with respect to the China Quality Growth Fund, Developing World Equity Fund, Focused International Opportunities Fund, Focused International Value Fund, Mid Cap Quality Value Fund, and Small Cap Growth Fund. Recognizing the difficulty in evaluating an investment advisor’s profitability with respect to the funds it manages in the context of an advisor with multiple lines of business, and noting that other profitability methodologies might also be reasonable, the Board and the Independent Trustees concluded that the profits of the Advisor from its relationships with the Focused Emerging Markets Fund, Focused Global Growth Fund, Focused International Growth Fund, SMID Quality Value Fund, International Equity Fund, and International Small Cap Growth Fund were reasonable.
The Board also considered the benefits received by the Advisor as a result of the Advisor’s relationship with the Funds, other than the receipt of its investment advisory fees, including any research received from broker-dealers providing execution services to the Funds, the beneficial effects from the review by the Trust’s Chief Compliance Officer of the Advisor’s compliance program, the intangible benefits of the Advisor’s association with the Funds generally, and any favorable publicity arising in connection with the Funds’ performance. The Board noted that although there were no advisory fee breakpoints, the asset levels of the Funds, other than the Focused International Growth Fund and Focused Emerging Markets Fund, were not currently likely to lead to significant economies of scale, and that any such economies would be considered in the future as the assets of the Funds grow. With respect to the Focused International Growth Fund and Focused Emerging Markets Fund, the Board noted that the Advisor was sharing some benefits of economies of scale with the Funds’ shareholders by making additional investments with respect to personnel, compliance and regulatory monitoring and reporting, network infrastructure and cybersecurity, and updates to the office space to accommodate those investments, in order to ensure the level and quality of service to the Funds.
185
WCM Funds
SUPPLEMENTAL INFORMATION (Unaudited) - Continued
Conclusion
Based on these and other factors, the Board and the Independent Trustees concluded that renewal of the Advisory Agreement was in the best interests of each Fund and its shareholders and, accordingly, approved the renewal of the Advisory Agreement with respect to each Fund.
186
WCM Funds
SUPPLEMENTAL INFORMATION (Unaudited) – Continued
Statement Regarding Liquidity Risk Management Program
The Securities and Exchange Commission adopted Rule 22e-4 under the Investment Company Act of 1940, as amended (the “Liquidity Rule”), to promote effective liquidity risk management throughout the open-end investment company industry, thereby reducing the risk that funds will be unable to meet their redemption obligations and mitigating dilution of the interests of fund shareholders.
The Board of Trustees (the “Board”) of Investment Managers Series Trust (the “Trust”) met on December 4-5, 2023 (the “Meeting”), to review the liquidity risk management program (the “Fund Program”) applicable to the following series of the Trust (each, a “Fund” and together, the “Funds”) pursuant to the Liquidity Rule:
Reporting Period – October 1, 2022 through September 30, 2023
WCM China Quality Growth Fund
WCM Developing World Equity Fund
WCM Focused Emerging Markets Fund
WCM Focused Global Growth Fund
WCM Focused International Growth Fund
WCM Focused International Opportunities Fund
WCM Focused International Value Fund
WCM International Equity Fund
WCM International Small Cap Growth Fund
WCM Mid Cap Quality Value Fund
WCM Small Cap Growth Fund
WCM SMID Quality Value Fund
Reporting Period – December 29, 2022 through September 30, 2023
WCM Focused Emerging Markets ex China Fund1
Reporting Period – July 28, 2023 through September 30, 2023
WCM Quality Dividend Growth Fund2
The Board has appointed WCM Investment Management, LLC, the investment adviser to the Funds, as the program administrator (“Program Administrator”) for the Fund Program. Under the Trust’s liquidity risk management program (the “Trust Program”), the Board has delegated oversight of the Trust Program to the Liquidity Oversight Committee (the “Oversight Committee”). At the Meeting, the Oversight Committee, on behalf of Program Administrator and the Funds, provided the Board with a written report (the “Report”) that addressed the operation, adequacy, and effectiveness of implementation of the Fund Program, and any material changes to it for the periods detailed above (the “Program Reporting Periods”).
In assessing the adequacy and effectiveness of implementation of the Fund Program, the Report discussed the following, among other things:
| · | The Fund Program’s liquidity classification methodology for categorizing each Fund’s investments; | |
| · | An overview of market liquidity for each Fund during the Program Reporting Periods; | |
| · | Each Fund’s ability to meet redemption requests; | |
| · | Each Fund’s cash management; | |
| · | Each Fund’s borrowing activity, if any, in order to meet redemption requests; | |
| · | Each Fund’s compliance with the 15% limit of illiquid investments; and |
| 1 | Fund inception date – December 29, 2022. |
| 2 | Fund inception date – July 28, 2023. |
187
WCM Funds
SUPPLEMENTAL INFORMATION (Unaudited) – Continued
| · | Each Fund’s status as a primarily highly liquid fund (“PHLF”), the effectiveness of the implementation of the PHLF standard, and whether it would be appropriate for each Fund to adopt a highly liquid investment minimum (“HLIM”). |
The Report stated that the Funds primarily hold assets that are defined under the Liquidity Rule as "highly liquid investments," and therefore each Fund is not required to establish an HLIM. Highly liquid investments are defined as cash and any investment reasonably expected to be convertible to cash in current market conditions in three business days or less without the conversion to cash significantly changing the market value of the investment. The Report also stated that there were no material changes made to the Fund Program during the Program Reporting Periods.
In the Report, the Program Administrator concluded that: (i) the Fund Program, as adopted and implemented, remains reasonably designed to assess and manage each Fund’s liquidity risk; (ii) each Fund continues to qualify as a PHLF and therefore is not required to adopt an HLIM; (iii) during the Program Reporting Periods, each Fund was able to meet redemption requests without significant dilution of remaining investors’ interests; and (iv) there were no weaknesses in the design or implementation of the Fund Program during the Program Reporting Periods.
There can be no assurance that the Fund Program will achieve its objectives in the future. Please refer to the Funds’ prospectus for more information regarding each Fund’s exposure to liquidity risk and other principal risks to which an investment in the Funds may be subject.
188
WCM Funds
EXPENSE EXAMPLES
For the Six Months Ended December 31, 2023 (Unaudited)
Expense Examples
As a shareholder of the Funds, you incur two types of costs: (1) transaction costs and redemption fees; and (2) ongoing costs, including management fees; distribution and/or service (12b-1) fees (Investor Class only); and other Fund expenses. The examples below are intended to help you understand your ongoing costs (in dollars) of investing in the Fund and to compare these costs with the ongoing costs of investing in other mutual funds.
The examples are based on an investment of $1,000 invested at the beginning of the period and held for the entire period from July 1, 2023 to December 31, 2023, except for the Quality Dividend Growth Fund, which is based on an investment of $1,000 invested at the beginning of the period and held for the entire since inception period from July 28, 2023 (commencement of operations) to December 31, 2023.
Actual Expenses
The information in the row titled “Actual Performance” of the table below provides actual account values and actual expenses. You may use the information in these columns, together with the amount you invested, to estimate the expenses that you paid over the period. Simply divide your account value by $1,000 (for example, an $8,600 account value divided by $1,000 = 8.6), then multiply the result by the number in the appropriate row for your share class, in the column titled “Expenses Paid During Period” to estimate the expenses you paid on your account during this period.
Hypothetical Example for Comparison Purposes
The information in the row titled “Hypothetical (5% annual return before expenses)” of the table below provides hypothetical account values and hypothetical expenses based on the Fund’s actual expense ratios and an assumed rate of return of 5% per year before expenses, which is not the Fund’s actual return. The hypothetical account values and expenses may not be used to estimate the actual ending account balance or expenses you paid for the period. You may use this information to compare the ongoing costs of investing in the Fund and other funds. To do so, compare these 5% hypothetical examples with the 5% hypothetical examples that appear in the shareholder reports of the other funds.
Please note that the expenses shown in the table are meant to highlight your ongoing costs only and do not reflect any transaction costs, such as sales charges (loads) or redemption fees. Therefore, the information in the row titled “Hypothetical (5% annual return before expenses)” is useful in comparing ongoing costs only, and will not help you determine the relative total costs of owning different funds. In addition, if these transactional costs were included, your costs would have been higher.
| Beginning Account Value | Ending Account Value | Expenses Paid During Period* | |
| International Growth Fund | 7/1/23 | 12/31/23 | 7/1/23 – 12/31/23 | |
| Investor Class | Actual Performance | $ 1,000.00 | $ 1,016.50 | $ 6.48 |
| Hypothetical (5% annual return before expenses) | 1,000.00 | 1,018.77 | 6.49 | |
| Institutional Class | Actual Performance | 1,000.00 | 1,017.60 | 5.22 |
| Hypothetical (5% annual return before expenses) | 1,000.00 | 1,020.03 | 5.22 | |
| * | Expenses are equal to the Fund’s annualized expense ratio of 1.28% and 1.03% for Investor Class and Institutional Class, respectively, multiplied by the average account value over the period, multiplied by 184/365 (to reflect the six month period). Assumes all dividends and distributions were reinvested. |
189
WCM Funds
EXPENSE EXAMPLES - Continued
For the Six Months Ended December 31, 2023 (Unaudited)
| Beginning Account Value | Ending Account Value | Expenses Paid During Period* | ||
| Emerging Markets Fund | 7/1/23 | 12/31/23 | 7/1/23 – 12/31/23 | |
| Investor Class | Actual Performance | $ 1,000.00 | $ 1,023.20 | $ 7.65 |
| Hypothetical (5% annual return before expenses) | 1,000.00 | 1,017.64 | 7.63 | |
| Institutional Class | Actual Performance | 1,000.00 | 1,024.70 | 6.38 |
| Hypothetical (5% annual return before expenses) | 1,000.00 | 1,018.90 | 6.36 | |
| * | Expenses are equal to the Fund’s annualized expense ratio of 1.50% and 1.25% for Investor Class and Institutional Class, respectively, multiplied by the average account value over the period, multiplied by 184/365 (to reflect the six month period). The expense ratio reflects an expense waiver. Assumes all dividends and distributions were reinvested. |
| Beginning Account Value | Ending Account Value | Expenses Paid During Period* | ||
| Global Growth Fund | 7/1/23 | 12/31/23 | 7/1/23 – 12/31/23 | |
| Investor Class | Actual Performance | $ 1,000.00 | $ 1,079.60 | $ 6.82 |
| Hypothetical (5% annual return before expenses) | 1,000.00 | 1,018.65 | 6.62 | |
| Institutional Class | Actual Performance | 1,000.00 | 1,081.10 | 5.51 |
| Hypothetical (5% annual return before expenses) | 1,000.00 | 1,019.91 | 5.35 | |
| * | Expenses are equal to the Fund’s annualized expense ratio of 1.30% and 1.05% for Investor Class and Institutional Class, respectively, multiplied by the average account value over the period, multiplied by 184/365 (to reflect the six month period). The expense ratio reflects an expense waiver. Assumes all dividends and distributions were reinvested. |
| Beginning Account Value | Ending Account Value | Expenses Paid During Period* | ||
| International Small Cap Growth Fund | 7/1/23 | 12/31/23 | 7/1/23 – 12/31/23 | |
| Institutional Class | Actual Performance | $ 1,000.00 | $ 1,086.80 | $ 6.59 |
| Hypothetical (5% annual return before expenses) | 1,000.00 | 1,018.89 | 6.38 | |
| * | Expenses are equal to the Fund’s annualized expense ratio of 1.25%, multiplied by the average account value over the period, multiplied by 184/365 (to reflect the six month period). The expense ratios reflect an expense waiver. Assumes all dividends and distributions were reinvested. |
190
WCM Funds
EXPENSE EXAMPLES - Continued
For the Six Months Ended December 31, 2023 (Unaudited)
| Beginning Account Value | Ending Account Value | Expenses Paid During Period* | ||
| Small Cap Growth Fund | 7/1/23 | 12/31/23 | 7/1/23 – 12/31/23 | |
| Investor Class | Actual Performance | $ 1,000.00 | $ 1,024.30 | $ 6.32 |
| Hypothetical (5% annual return before expenses) | 1,000.00 | 1,018.96 | 6.31 | |
| Institutional Class | Actual Performance | 1,000.00 | 1,025.80 | 5.06 |
| Hypothetical (5% annual return before expenses) | 1,000.00 | 1,020.21 | 5.04 | |
| * | Expenses are equal to the Fund’s annualized expense ratio of 1.24% and 0.99% for Investor Class and Institutional Class, respectively, multiplied by the average account value over the period, multiplied by 184/365 (to reflect the since inception period). The expense ratio reflects an expense waiver. Assumes all dividends and distributions were reinvested. |
| Beginning Account Value | Ending Account Value | Expenses Paid During Period* | ||
| SMID Quality Value Fund | 7/1/23 | 12/31/23 | 7/1/23 – 12/31/23 | |
| Investor Class | Actual Performance | $ 1,000.00 | $ 1,045.90 | $ 5.67 |
| Hypothetical (5% annual return before expenses) | 1,000.00 | 1,019.66 | 5.60 | |
| Institutional Class | Actual Performance | 1,000.00 | 1,047.10 | 4.39 |
| Hypothetical (5% annual return before expenses) | 1,000.00 | 1,020.92 | 4.33 | |
| * | Expenses are equal to the Fund’s annualized expense ratio of 1.10% and 0.85% for Investor Class and Institutional Class, respectively, multiplied by the average account value over the period, multiplied by 184/365 (to reflect the six month period). The expense ratio reflects an expense waiver. Assumes all dividends and distributions were reinvested. |
| Beginning Account Value | Ending Account Value | Expenses Paid During Period* | ||
| China Quality Growth Fund | 7/1/23 | 12/31/23 | 7/1/23 – 12/31/23 | |
| Investor Class | Actual Performance | $ 1,000.00 | $ 898.30 | $ 7.18 |
| Hypothetical (5% annual return before expenses) | 1,000.00 | 1,017.64 | 7.64 | |
| Institutional Class | Actual Performance | 1,000.00 | 899.50 | 5.99 |
| Hypothetical (5% annual return before expenses) | 1,000.00 | 1,018.90 | 6.37 | |
| * | Expenses are equal to the Fund’s annualized expense ratio of 1.50% and 1.25% for Investor Class and Institutional Class, respectively, multiplied by the average account value over the period, multiplied by 184/365 (to reflect the since inception period). The expense ratio reflects an expense waiver and expenses absorbed. Assumes all dividends and distributions were reinvested. |
191
WCM Funds
EXPENSE EXAMPLES - Continued
For the Six Months Ended December 31, 2023 (Unaudited)
| Beginning Account Value | Ending Account Value | Expenses Paid During Period* | ||
| Developing World Equity Fund | 7/1/23 | 12/31/23 | 7/1/23 – 12/31/23 | |
| Investor Class | Actual Performance | $ 1,000.00 | $ 1,016 | $ 5.69 |
| Hypothetical (5% annual return before expenses) | 1,000.00 | 1,019.56 | 5.70 | |
| Institutional Class | Actual Performance | 1,000.00 | 1,014.10 | 6.57 |
| Hypothetical (5% annual return before expenses) | 1,000.00 | 1,018.68 | 6.58 | |
| * | Expenses are equal to the Fund’s annualized expense ratio of 1.36% and 1.11% for Investor Class and Institutional Class, respectively, multiplied by the average account value over the period, multiplied by 184/365 (to reflect the six month period). The expense ratio reflects an expense waiver and expenses absorbed. Assumes all dividends and distributions were reinvested. |
| Beginning Account Value | Ending Account Value | Expenses Paid During Period* | ||
| International Equity Fund | 7/1/23 | 12/31/23 | 7/1/23 – 12/31/23 | |
| Investor Class | Actual Performance | $ 1,000.00 | $ 1,032.60 | $ 6.30 |
| Hypothetical (5% annual return before expenses) | 1,000.00 | 1,019.00 | 6.26 | |
| Institutional Class | Actual Performance | 1,000.00 | 1,033.90 | 4.99 |
| Hypothetical (5% annual return before expenses) | 1,000.00 | 1,020.30 | 4.96 | |
| * | Expenses are equal to the Fund’s annualized expense ratio of 1.22% and 0.97% for Investor Class and Institutional Class, respectively, multiplied by the average account value over the period, multiplied by 184/365 (to reflect the since inception period). The expense ratio reflects an expense waiver. Assumes all dividends and distributions were reinvested. |
| Beginning Account Value | Ending Account Value | Expenses Paid During Period* | ||
| International Value Fund | 7/1/23 | 12/31/23 | 7/1/23 – 12/31/23 | |
| Investor Class | Actual Performance | $ 1,000.00 | $ 1,111.30 | $ 8.04 |
| Hypothetical (5% annual return before expenses) | 1,000.00 | 1,017.59 | 7.69 | |
| Institutional Class | Actual Performance | 1,000.00 | 1,112.90 | 6.72 |
| Hypothetical (5% annual return before expenses) | 1,000.00 | 1,018.85 | 6.42 | |
| * | Expenses are equal to the Fund’s annualized expense ratio of 1.51% and 1.26% for Investor Class and Institutional Class, respectively, multiplied by the average account value over the period, multiplied by 184/365 (to reflect the since inception period). The expense ratio reflects an expense waiver and expenses absorbed. Assumes all dividends and distributions were reinvested. |
192
WCM Funds
EXPENSE EXAMPLES - Continued
For the Six Months Ended December 31, 2023 (Unaudited)
| Beginning Account Value | Ending Account Value | Expenses Paid During Period* | ||
| International Opportunities Fund | 7/1/23 | 12/31/23 | 7/1/23 – 12/31/23 | |
| Investor Class | Actual Performance | $ 1,000.00 | $ 1,095.50 | $ 7.92 |
| Hypothetical (5% annual return before expenses) | 1,000.00 | 1,017.64 | 7.63 | |
| Institutional Class | Actual Performance | 1,000.00 | 1,095.00 | 6.60 |
| Hypothetical (5% annual return before expenses) | 1,000.00 | 1,018.90 | 6.36 | |
| * | Expenses are equal to the Fund’s annualized expense ratio of 1.50% and 1.25% for Investor Class and Institutional Class, respectively, multiplied by the average account value over the period, multiplied by 184/365 (to reflect the since inception period). The expense ratio reflects an expense waiver. Assumes all dividends and distributions were reinvested. |
| Beginning Account Value | Ending Account Value | Expenses Paid During Period* | ||
| Mid Cap Quality Value Fund | 7/1/23 | 12/31/23 | 7/1/23– 12/31/23 | |
| Investor Class | Actual Performance | $ 1,000.00 | $ 1,082.80 | $ 6.61 |
| Hypothetical (5% annual return before expenses) | 1,000.00 | 1,018.86 | 6.41 | |
| Institutional Class | Actual Performance | 1,000.00 | 1,084.30 | 5.27 |
| Hypothetical (5% annual return before expenses) | 1,000.00 | 1,020.14 | 5.11 | |
| * | Expenses are equal to the Fund’s annualized expense ratio of 1.25% and 1.00% for Investor Class and Institutional Class, respectively, multiplied by the average account value over the period, multiplied by 184/365 (to reflect the six month period). The expense ratio reflects an expense waiver and expenses absorbed. Assumes all dividends and distributions were reinvested. |
| Beginning Account Value | Ending Account Value | Expenses Paid During Period | ||
| Emerging Markets ex China Fund | 7/1/23 | 12/31/23 | 7/1/23 – 12/31/23 | |
| Investor Class | Actual Performance* | $ 1,000.00 | $ 1,102.40 | $ 7.99 |
| Hypothetical (5% annual return before expenses) | 1,000.00 | 1,017.60 | 7.67 | |
| Institutional Class | Actual Performance* | 1,000.00 | 1,103.90 | 6.63 |
| Hypothetical (5% annual return before expenses) | 1,000.00 | 1,018.90 | 6.36 | |
| * | Expenses are equal to the Fund’s annualized expense ratio of 1.50% and 1.25% for Investor Class and Institutional Class, respectively, multiplied by the average account value over the period, multiplied by 184/365 (to reflect the six month period). The expense ratio reflects an expense waiver and expenses absorbed. Assumes all dividends and distributions were reinvested. |
193
WCM Funds
EXPENSE EXAMPLES - Continued
For the Six Months Ended December 31, 2023 (Unaudited)
| Beginning Account Value | Ending Account Value | Expenses Paid During Period | ||
| Quality Dividend Growth Fund | 7/28/23^ | 12/31/23 | 7/28/23^ – 12/31/23 | |
| Investor Class | Actual Performance* | $ 1,000.00 | $ 1,009.50 | $ 5.35 |
| 7/1/23 | 12/31/23 | 7/1/23 – 12/31/23 | ||
| Hypothetical (5% annual return before expenses)** | 1,000.00 | 1,018.97 | 6.30 | |
| Institutional Class | Actual Performance* | 1,000.00 | 1,010.20 | 4.28 |
| 7/1/23 | 12/31/23 | 7/1/23 – 12/31/23 | ||
| Hypothetical (5% annual return before expenses)** | 1,000.00 | 1,020.21 | 5.04 | |
| ^ | Commencement of operations. |
| * | Expenses are equal to the Fund’s annualized expense ratio of 1.24% and 0.99% for Investor Class and Institutional Class, respectively, multiplied by the average account value over the period, multiplied by 157/365 (to reflect the since inception period). The expense ratio reflects an expense waiver and expenses absorbed. Assumes all dividends and distributions were reinvested. |
| ** | Expenses are equal to the Fund’s annualized expense ratio of 1.24% and 0.99% for Investor Class and Institutional Class, respectively, multiplied by the average account value over the period, multiplied by 184/365 (to reflect the six month period). The expense ratio reflects an expense waiver and expenses absorbed. Assumes all dividends and distributions were reinvested. |
194
This page is intentionally left blank
WCM Funds
Each a series of Investment Managers Series Trust
Investment Advisor
WCM Investment Management, LLC
281 Brooks Street
Laguna Beach, California 92651
Independent Registered Public Accounting Firm
Tait, Weller & Baker LLP
Two Liberty Place
50 South 16th Street, Suite 2900
Philadelphia, Pennsylvania 19102
Custodian
UMB Bank, n.a.
928 Grand Boulevard, 5th Floor
Kansas City, Missouri 64106
Fund Co-Administrator
Mutual Fund Administration, LLC
2220 East Route 66, Suite 226
Glendora, California 91740
Fund Co-Administrator, Transfer Agent and Fund Accountant
UMB Fund Services, Inc.
235 West Galena Street
Milwaukee, Wisconsin 53212
Distributor
Natixis Distribution, LLC
888 Boylston Street, Suite 800
Boston, Massachusetts 02199-8197
FUND INFORMATION
| TICKER | CUSIP |
| WCM Focused International Growth Fund - Investor Class | WCMRX | 461418 386 |
| WCM Focused International Growth Fund - Institutional Class | WCMIX | 461418 444 |
| WCM Focused Emerging Markets Fund - Investor Class | WFEMX | 46141P 842 |
| WCM Focused Emerging Markets Fund - Institutional Class | WCMEX | 46141P 834 |
| WCM Focused Global Growth Fund - Investor Class | WFGGX | 46141P 826 |
| WCM Focused Global Growth Fund - Institutional Class | WCMGX | 46141P 818 |
| WCM International Small Cap Growth Fund - Institutional Class | WCMSX | 46141Q 683 |
| WCM Small Cap Growth Fund - Investor Class | WCMNX | 46143U 104 |
| WCM Small Cap Growth Fund - Institutional Class | WCMLX | 46143U 203 |
| WCM SMID Quality Value Fund - Investor Class | WCMJX | 46143U 302 |
| WCM SMID Quality Value Fund - Institutional Class | WCMFX | 46143U 401 |
| WCM China Quality Growth Fund - Investor Class | WCQGX | 46143U 708 |
| WCM China Quality Growth Fund - Institutional Class | WCMCX | 46143U 807 |
| WCM Developing World Equity Fund - Investor Class | WCMUX | 46143U 864 |
| WCM Developing World Equity Fund - Institutional Class | WCMDX | 46143U 856 |
| WCM International Equity Fund - Investor Class | WESGX | 46143U 880 |
| WCM International Equity Fund - Institutional Class | WCMMX | 46143U 872 |
| WCM Focused International Value Fund - Investor Class | WLIVX | 46143U 831 |
| WCM Focused International Value Fund - Institutional Class | WCMVX | 46143U 823 |
| WCM Focused International Opportunities Fund - Investor Class | WCFOX | 46143U 690 |
| WCM Focused International Opportunities Fund - Institutional Class | WCMOX | 46143U 682 |
| WCM Mid Cap Quality Value Fund - Investor Class | WMIDX | 46143U 658 |
| WCM Mid Cap Quality Value Fund - Institutional Class | WCMAX | 46143U 666 |
| WCM Focused Emerging Markets ex China Fund - Investor Class | WCFEX | 46143U 641 |
| WCM Focused Emerging Markets ex China Fund - Institutional Class | WCMWX | 46143U 633 |
| WCM Quality Dividend Growth Fund – Investor Class | WQDGX | 46143U 625 |
| WCM Quality Dividend Growth Fund – Institutional Class | WCMYX | 46143U 617 |
Privacy Principles of the WCM Funds for Shareholders
The Funds are committed to maintaining the privacy of their shareholders and to safeguarding their non-public personal information. The following information is provided to help you understand what personal information the Funds collect, how we protect that information and why, in certain cases, we may share information with select other parties.
Generally, the Funds do not receive any non-public personal information relating to their shareholders, although certain nonpublic personal information of their shareholders may become available to the Funds. The Funds do not disclose any nonpublic personal information about their shareholders or former shareholders to anyone, except as permitted by law or as is necessary in order to service shareholder accounts (for example, to a transfer agent or third party administrator).
This report is sent to shareholders of the WCM Funds for their information. It is not a Prospectus, circular or representation intended for use in the purchase or sale of shares of the Funds or of any securities mentioned in this report.
Proxy Voting
The Funds’ proxy voting policies and procedures, as well as information regarding how the Funds voted proxies for portfolio securities, if applicable, during the most recent 12-month period ended June 30, are available, without charge and upon request by calling (888) 988-9801 or on the SEC’s website at www.sec.gov.
Fund Portfolio Holdings
The Funds file a complete schedule of their portfolio holdings with the SEC for the first and third quarters of each fiscal year on Form N-PORT within 60 days of the end of such fiscal quarter. Shareholders may obtain the Funds’ Form N-PORT on the SEC’s website at www.sec.gov.
Prior to the use of Form N-PORT, the Funds filed their complete schedule of portfolio holdings with the SEC on Form N-Q, which is available online at www.sec.gov.
Householding
The Funds will mail only one copy of shareholder documents, including prospectuses, notice of annual and semi-annual reports availability and proxy statements, to shareholders with multiple accounts at the same address. This practice is commonly called “householding” and is intended to reduce expenses and eliminate duplicate mailings of shareholder documents. Mailings of your shareholder documents may be householded indefinitely unless you instruct us otherwise. If you do not want the mailing of these documents to be combined with those for other members of your household, please call the Funds at (888) 988-9801.
WCM Funds
P.O. Box 2175
Milwaukee, WI 53201
Toll Free: (888) 988-9801
Item 1. Report to Stockholders (Continued).
(b) Not applicable.
Item 2. Code of Ethics.
The registrant has adopted a code of ethics that applies to the registrant's principal executive officer and principal financial officer. The registrant has not made any amendments to its code of ethics during the period covered by this report. The registrant has not granted any waivers from any provisions of the code of ethics during the period covered by this report.
The registrant undertakes to provide to any person without charge, upon request, a copy of its code of ethics by mail when they call the registrant at 1-888-988-9801
Item 3. Audit Committee Financial Expert.
The registrant’s board of trustees has determined that there is at least one audit committee financial expert serving on its audit committee. William H. Young is the “audit committee financial expert” and is considered to be “independent” as each term is defined in Item 3 of Form N-CSR.
Item 4. Principal Accountant Fees and Services.
The registrant has engaged its principal accountant to perform audit services, audit-related services, tax services and other services during the past two fiscal years. "Audit services" refer to performing an audit of the registrant's annual financial statements or services that are normally provided by the accountant in connection with statutory and regulatory filings or engagements for those fiscal years. "Audit-related services" refer to the assurance and related services by the principal accountant that are reasonably related to the performance of the audit. "Tax services" refer to professional services rendered by the principal accountant for tax compliance, tax advice, and tax planning. There were no "other services" provided by the principal accountant. The following table details the aggregate fees billed or expected to be billed for each of the last two fiscal years for audit fees, audit-related fees, tax fees and other fees by the principal accountant.
| FYE 12/31/2023 | FYE 12/31/2022 | |
| Audit Fees | $236,300 | $208,550 |
| Audit-Related Fees | N/A | N/A |
| Tax Fees | $39,200 | $36,400 |
| All Other Fees | N/A | N/A |
The audit committee has adopted pre-approval policies and procedures that require the audit committee to pre-approve all audit and non-audit services of the registrant, including services provided to any entity affiliated with the registrant.
The percentage of fees billed by Tait, Weller, & Weller LLP applicable to non-audit services pursuant to waiver of pre-approval requirement were as follows:
| FYE 12/31/2023 | FYE 12/31/2022 | |
| Audit-Related Fees | 0% | 0% |
| Tax Fees | 0% | 0% |
| All Other Fees | 0% | 0% |
All of the principal accountant's hours spent on auditing the registrant's financial statements were attributed to work performed by full-time permanent employees of the principal accountant.
The following table indicates the non-audit fees billed or expected to be billed by the registrant's accountant for services to the registrant and to the registrant's investment adviser (and any other controlling entity, etc.—not sub-adviser) for the last two years. The audit committee of the Board of Trustees has considered whether the provision of non-audit services that were rendered to the registrant's investment adviser is compatible with maintaining the principal accountant's independence and has concluded that the provision of such non-audit services by the accountant has not compromised the accountant's independence.
| Non-Audit Related Fees | FYE 12/31/2023 | FYE 12/31/2022 |
| Registrant | N/A | N/A |
| Registrant’s Investment Advisor | N/A | N/A |
Item 5. Audit Committee of Listed Registrants.
| (a) | Not applicable to registrants who are not listed issuers (as defined in Rule 10A-3 under the Securities Exchange Act of 1934). |
| (b) | Not applicable. |
Item 6. Schedule of Investments.
| (a) | Schedule of Investments is included as part of the report to shareholders filed under Item 1 of this Form. |
| (b) | Not Applicable. |
Item 7. Disclosure of Proxy Voting Policies and Procedures for Closed-End Management Investment Companies.
Not applicable to open-end investment companies.
Item 8. Portfolio Managers of Closed-End Management Investment Companies.
Not applicable to open-end investment companies.
Item 9. Purchases of Equity Securities by Closed-End Management Investment Company and Affiliated Purchasers.
Not applicable.
Item 10. Submission of Matters to a Vote of Security Holders.
The registrant has not made any material changes to the procedures by which shareholders may recommend nominees to the registrant’s Board of Trustees.
Item 11. Controls and Procedures.
| (a) | The Registrant’s President/Chief Executive Officer and Treasurer/Chief Financial Officer have reviewed the Registrant's disclosure controls and procedures (as defined in Rule 30a-3(c) under the Investment Company Act of 1940 (the “Act”)) as of a date within 90 days of the filing of this report, as required by Rule 30a-3(b) under the Act and Rules 13a-15(b) or 15d-15(b) under the Securities Exchange Act of 1934. Based on their review, such officers have concluded that the disclosure controls and procedures are effective in ensuring that information required to be disclosed in this report is appropriately recorded, processed, summarized and reported and made known to them by others within the Registrant and by the Registrant’s service provider. |
| (b) | There were no changes in the Registrant's internal control over financial reporting (as defined in Rule 30a-3(d) under the Act) that occurred during the period covered by this report that has materially affected, or is reasonably likely to materially affect, the Registrant's internal control over financial reporting. |
Item 12. Disclosure of Securities Lending Activities for Closed-End Management Investment Companies.
Not applicable to open-end investment companies.
Item 13. Exhibits.
| (a) | (1) Any code of ethics or amendment thereto, that is subject of the disclosure required by Item 2, to the extent that the registrant intends to satisfy Item 2 requirements through filing an exhibit. Incorporated by reference to the Registrant’s Form N-CSR filed June 8, 2018. |
(2) Certifications pursuant to Section 302 of the Sarbanes-Oxley Act of 2002. Filed herewith.
(3) Any written solicitation to purchase securities under Rule 23c-1 under the Act sent or given during the period covered by the report by or on behalf of the registrant to 10 or more persons. Not applicable to open-end investment companies.
(4) Change in the registrant’s independent public accountant. There was no change in the registrant’s independent public accountant for the period covered by this report.
| (b) | Certification pursuant to Section 906 of the Sarbanes-Oxley Act of 2002. Furnished herewith. |
SIGNATURES
Pursuant to the requirements of the Securities Exchange Act of 1934 and the Investment Company Act of 1940, the registrant has duly caused this report to be signed on its behalf by the undersigned, thereunto duly authorized.
| (Registrant) | Investment Managers Series Trust | |
| By (Signature and Title) | /s/ Maureen Quill | |
| Maureen Quill, President/Chief Executive Officer | ||
| Date | 3/8/2024 |
Pursuant to the requirements of the Securities Exchange Act of 1934 and the Investment Company Act of 1940, this report has been signed below by the following persons on behalf of the registrant and in the capacities and on the dates indicated.
| By (Signature and Title) | /s/ Maureen Quill | |
| Maureen Quill, President/Chief Executive Officer | ||
| Date | 3/8/2024 | |
| By (Signature and Title) | /s/ Rita Dam | |
| Rita Dam, Treasurer/Chief Financial Officer | ||
| Date | 3/8/2024 |