UNITED STATES
SECURITIES AND EXCHANGE COMMISSION
Washington, D.C. 20549
| x | QUARTERLY REPORT PURSUANT TO SECTION 13 OR 15(d) OF THE SECURITIES EXCHANGE ACT OF 1934 |
For the quarterly period ended September 30, 2012
OR
| ¨ | TRANSITION REPORT PURSUANT TO SECTION 13 OR 15(d) OF THE SECURITIES EXCHANGE ACT OF 1934 |
For the transition period from to
| Commission file number: 001-33894 |

MIDWAY GOLD CORP.
(Exact name of registrant as specified in its charter)
| British Columbia | | 98-0459178 |
| (State of other jurisdiction of incorporation or organization) | | (I.R.S. Employer Identification No.) |
| | | |
| Suite 280 – 8310 South Valley Highway | | |
| Englewood, Colorado | | 80112 |
| (Address of principal executive offices) | | (Zip Code) |
(720) 979-0900
(Registrant’s Telephone Number, including area code)
(Former name, former address and former fiscal year, if changed since last report)
Indicate by check mark whether the registrant (1) has filed all reports required to be filed by Section 13 or 15(d) of the Securities Exchange Act of 1934 during the preceding 12 months (or for such shorter period that the Registrant was required to file such reports), and (2) has been subject to the filing requirements for the past 90 days.x Yes ¨ No
Indicate by check mark whether the registrant has submitted electronically and posted on its corporate Web site, if any, every Interactive Data File required to be submitted and posted pursuant to Rule 405 of Regulation S-T (§232.405 of this chapter) during the preceding 12 months (or for such shorter period that the registrant was required to submit and post such files).x Yes ¨ No
Indicate by check mark whether the registrant is a large accelerated filer, an accelerated filer, a non-accelerated filer or a smaller reporting company. See the definitions of “large accelerated filer” and “accelerated filer” and “smaller reporting company” in Rule 12b-2 of the Exchange Act (Check one):
Large accelerated filer ¨ Accelerated filer x Non-accelerated filer ¨ Smaller Reporting Company ¨
Indicate by check mark whether the Registrant is a shell company (as defined in Rule 12b-2 of the Exchange Act)¨ Yes x No
Number of Common Shares outstanding at November 5, 2012:128,251,298
TABLE OF CONTENTS
| PART I – FINANCIAL INFORMATION | 4 |
| | | |
| Item 1. | Financial Statements. | 4 |
| Item 2. | Management's Discussion and Analysis of Financial Condition and Results of Operations. | 28 |
| Item 3. | Quantitative and Qualitative Disclosures about Market Risk. | 43 |
| Item 4. | Controls and Procedures. | 43 |
| | | |
| PART II - OTHER INFORMATION | 43 |
| | | |
| Item 1. | Legal Proceedings. | 43 |
| Item 1A. | Risk Factors. | 43 |
| Item 2. | Unregistered Sale of Equity Securities and Use of Proceeds. | 43 |
| Item 3. | Defaults Upon Senior Securities. | 43 |
| Item 4. | Mine Safety Disclosures. | 43 |
| Item 5. | Other information. | 43 |
| Item 6. | Exhibits. | 44 |
| | | |
| SIGNATURES | 45 |
EXPLANATORY NOTE
All amounts in this interim report on Form 10-Q are expressed in Canadian dollars. Unless otherwise indicated, the United States dollar is denoted as “US$.”
Financial information is presented in accordance with generally accepted accounting principles in the United States (“U.S. GAAP”).
PART I – FINANCIAL INFORMATION
Item 1. Financial Statements.
MIDWAY GOLD CORP.
CONSOLIDATED INTERIM BALANCE SHEETS
(Expressed in Canadian dollars)
| | | September 30,
2012 | | | December 31,
2011 | |
| | | (unaudited) | | | | |
| Assets | | | | | | | | |
| | | | | | | | | |
| Current assets: | | | | | | | | |
| Cash and cash equivalents | | $ | 10,931,300 | | | $ | 10,191,069 | |
| Amounts receivable | | | 67,853 | | | | 31,866 | |
| Prepaid expenses and other current assets | | | 251,428 | | | | 465,608 | |
| | | | 11,250,581 | | | | 10,688,543 | |
| | | | | | | | | |
| Investments (notes 4 and 5) | | | 18,750 | | | | 78,933 | |
| Reclamation deposit (note 8) | | | 843,077 | | | | 603,062 | |
| Property and Equipment, net (note 6) | | | 6,293,323 | | | | 1,638,280 | |
| Mineral properties (note 7) | | | 49,745,747 | | | | 49,563,134 | |
| | | | | | | | | |
| | | $ | 68,151,478 | | | $ | 62,571,952 | |
| | | | | | | | | |
| Liabilities and Stockholders’ Equity | | | | | | | | |
| | | | | | | | | |
| Current Liabilities: | | | | | | | | |
| Accounts payable and accrued liabilities | | $ | 1,534,962 | | | $ | 1,188,041 | |
| | | | | | | | | |
| Warrant liability (note 9) | | | 2,439,491 | | | | - | |
| | | | | | | | | |
| Future income tax liability | | | 3,759,612 | | | | 4,103,278 | |
| | | | | | | | | |
| Stockholders’ Equity (note 9): | | | | | | | | |
| Common stock authorized – unlimited, no par value | | | | | | | | |
| Issued – 128,031,298 (2011 – 113,849,475) | | | 137,930,594 | | | | 123,925,404 | |
| Additional paid in capital | | | 11,884,105 | | | | 10,950,108 | |
| Accumulated other comprehensive income (loss) | | | (959,974 | ) | | | 26,875 | |
| Deficit accumulated during exploration stage | | | (88,437,312 | ) | | | (77,621,754 | ) |
| | | | 60,417,413 | | | | 57,280,633 | |
| | | | | | | | | |
| | | $ | 68,151,478 | | | $ | 62,571,952 | |
Commitments (note 10)
The accompanying notes are an integral part of these consolidated interim financial statements.
MIDWAY GOLD CORP.
CONSOLIDATED INTERIM STATEMENTS OF OPERATIONS
(Expressed in Canadian dollars) (unaudited)
| | | Three
months
ended
September
30, 2012 | | | Three
months
ended
September
30, 2011 | | | Nine
months
ended
September
30, 2012 | | | Nine
months
ended
September
30, 2011 | | | Cumulative
period from
inception (May
14,1996) to
September 30,
2012 | |
| | | | | | | | | | | | | | | | |
| Expenses | | | | | | | | | | | | | | | | | | | | |
| Consulting (note 11) | | $ | 181,609 | | | $ | 53,731 | | | $ | 285,484 | | | $ | 160,880 | | | $ | 1,408,113 | |
| Depreciation | | | 116,899 | | | | 80,744 | | | | 283,903 | | | | 108,164 | | | | 1,142,183 | |
| Gain on sale of subsidiary | | | - | | | | - | | | | - | | | | - | | | | (2,806,312 | ) |
| Interest and bank charges | | | 958 | | | | 5,934 | | | | 2,202 | | | | 16,903 | | | | 914,406 | |
| Investor relations | | | 20,122 | | | | 18,857 | | | | 99,913 | | | | 120,655 | | | | 1,479,741 | |
| Legal, audit and accounting | | | 289,977 | | | | 279,134 | | | | 727,999 | | | | 459,910 | | | | 4,112,121 | |
| Management fees | | | - | | | | (3,066 | ) | | | 8 | | | | (8,748 | ) | | | 210,778 | |
| Mineral exploration expenditures (Schedule) | | | 1,929,882 | | | | 2,785,005 | | | | 5,097,446 | | | | 7,319,020 | | | | 63,598,096 | |
| Mineral property interests written-off | | | - | | | | - | | | | - | | | | - | | | | 4,643,637 | |
| Mineral property interests recovered | | | - | | | | - | | | | - | | | | - | | | | (60,120 | ) |
| Office and administration | | | 270,769 | | | | 200,737 | | | | 646,332 | | | | 347,234 | | | | 2,644,546 | |
| Salaries and benefits | | | 1,096,261 | | | | 724,721 | | | | 3,284,169 | | | | 1,972,660 | | | | 17,509,721 | |
| Transfer agent and filing fees | | | (9,073 | ) | | | 96,855 | | | | 97,397 | | | | 207,347 | | | | 942,719 | |
| Travel | | | 76,079 | | | | 52,984 | | | | 223,839 | | | | 167,316 | | | | 1,434,844 | |
| Operating Loss | | | 3,973,483 | | | | 4,295,636 | | | | 10,748,692 | | | | 10,871,341 | | | | 97,174,473 | |
| | | | | | | | | | | | | | | | | | | | | |
| Other Income (Expense): | | | | | | | | | | | | | | | | | | | | |
| Foreign exchange gain (loss) | | | 45,292 | | | | 213,369 | | | | 28,739 | | | | 321,450 | | | | 1,557,270 | |
| Gain (loss) on change in fair value of warrant liability (note 9) | | | 176,515 | | | | - | | | | 176,515 | | | | (592,026 | ) | | | (1,059,185 | ) |
| Interest and investment income | | | 7,103 | | | | 9,725 | | | | 23,176 | | | | 18,850 | | | | 912,820 | |
| Gain on sale of equipment | | | - | | | | 491,386 | | | | - | | | | 491,386 | | | | 526,149 | |
| Gain on sale of investments | | | - | | | | - | | | | - | | | | - | | | | 44,077 | |
| Investment write down | | | - | | | | - | | | | - | | | | - | | | | (130,000 | ) |
| Unrealized loss on investments (note 5) | | | (346 | ) | | | (11,893 | ) | | | (8,933 | ) | | | (10,359 | ) | | | (609,220 | ) |
| Write down of deferred financing costs | | | - | | | | - | | | | (450,717 | ) | | | - | | | | (450,717 | ) |
| Other income (expense) | | | (2,633 | ) | | | (82,890 | ) | | | (39,418 | ) | | | (83,163 | ) | | | 30,209 | |
| | | | 225,931 | | | | 619,697 | | | | (270,638 | ) | | | 146,138 | | | | 821,403 | |
| | | | | | | | | | | | | | | | | | | | | |
| Net Loss Before Income Tax | | | 3,747,552 | | | | 3,675,939 | | | | 11,019,330 | | | | 10,725,203 | | | | 96,353,070 | |
| Income Tax Recovery | | | 231,633 | | | | 422,000 | | | | 203,772 | | | | 1,456,000 | | | | 7,915,758 | |
| Net Loss | | $ | 3,515,919 | | | $ | 3,253,939 | | | $ | 10,815,558 | | | $ | 9,269,203 | | | $ | 88,437,312 | |
| | | | | | | | | | | | | | | | | | | | | |
| Basic and Diluted Loss Per Share | | $ | 0.03 | | | $ | 0.03 | | | $ | 0.09 | | | $ | 0.09 | | | | | |
| | | | | | | | | | | | | | | | | | | | | |
| Weighted Average Number of Shares Outstanding | | | 127,188,712 | | | | 111,671,380 | | | | 118,571,642 | | | | 104,858,345 | | | | | |
The accompanying notes are an integral part of these consolidated interim financial statements.
MIDWAY GOLD CORP.
Consolidated Statements of COMPREHENSIVE Loss
(Expressed in Canadian dollars) (unaudited)
| | | Three Months
ended
September 30,
2012 | | | Three Months
ended
September 30,
2011 | | | Nine months
ended
September 30,
2012 | | | Nine months
ended
September 30,
2011 | |
| Net Loss for the Period Before Other Comprehensive Loss | | $ | 3,515,919 | | | $ | 3,253,939 | | | $ | 10,815,558 | | | $ | 9,269,203 | |
| Unrealized (gain) loss on investment (note 5) | | | - | | | | 12,500 | | | | 51,250 | | | | (6,250 | ) |
| Currency Translation Adjustment | | | 872,514 | | | | - | | | | 935,599 | | | | - | |
| Comprehensive Loss | | $ | 4,388,433 | | | $ | 3,266,439 | | | $ | 11,802,407 | | | $ | 9,262,953 | |
The accompanying notes are an integral part of these consolidated interim financial statements.
MIDWAY GOLD CORP.
CONSOLIDATED INTERIM STATEMENTS OF CASH FLOWS
(Expressed in Canadian dollars) (unaudited)
| | | Three months
ended September
30, 2012 | | | Three months
ended
September 30,
2011 | | | Nine months
ended
September 30,
2012 | | | Nine months
ended
September 30,
2011 | | | Cumulative
period from
inception (May
14,1996) to
September 30,
2012 | |
| Cash Provided By (Used In): | | | | | | | | | | | | | | | | | | | | |
| Operating Activities: | | | | | | | | | | | | | | | | | | | | |
| Net loss | | $ | (3,515,919 | ) | | $ | (3,253,939 | ) | | $ | (10,815,558 | ) | | $ | (9,269,203 | ) | | $ | (88,437,312 | ) |
| Items not involving cash: | | | | | | | | | | | | | | | | | | | | |
| Depreciation | | | 116,899 | | | | 80,744 | | | | 283,903 | | | | 108,164 | | | | 1,142,183 | |
| Stock-based compensation | | | 331,677 | | | | 87,313 | | | | 1,477,501 | | | | 826,792 | | | | 12,078,914 | |
| Unrealized foreign exchange loss (gain) | | | (142,852 | ) | | | 641,745 | | | | (139,894 | ) | | | 267,762 | | | | (1,714,418 | ) |
| Investment write down | | | - | | | | - | | | | - | | | | - | | | | 130,000 | |
| Unrealized (gain) loss on investment | | | 346 | | | | 11,893 | | | | 8,933 | | | | 10,359 | | | | 609,220 | |
| Non-cash interest expense | | | - | | | | - | | | | - | | | | - | | | | 234,765 | |
| Loss on change in liability of warrants | | | (176,515 | ) | | | - | | | | (176,515 | ) | | | 592,026 | | | | 1,059,185 | |
| Other current assets written off | | | - | | | | - | | | | 218,044 | | | | 0 | | | | 218,044 | |
| Future income tax recovery | | | (231,633 | ) | | | (422,000 | ) | | | (203,772 | ) | | | (1,456,000 | ) | | | (7,915,758 | ) |
| Gain on sale of subsidiary | | | - | | | | - | | | | - | | | | - | | | | (2,806,312 | ) |
| Gains on sale of equipment | | | - | | | | (491,386 | ) | | | - | | | | (491,386 | ) | | | (526,149 | ) |
| Gain on sale of investments | | | - | | | | - | | | | - | | | | - | | | | (44,077 | ) |
| Mineral property interests written off | | | - | | | | - | | | | - | | | | - | | | | 4,643,637 | |
| Mineral property interest recovery | | | - | | | | - | | | | - | | | | - | | | | (60,120 | ) |
| Change in non-cash working capital items: | | | | | | | | | | | | | | | | | | | | |
| Amounts receivable | | | (20,092 | ) | | | 39,211 | | | | (36,447 | ) | | | 40,577 | | | | (50,026 | ) |
| Prepaid expenses | | | 418,274 | | | | (9,049 | ) | | | 259,923 | | | | (369,639 | ) | | | (225,727 | ) |
| Accounts payable and accrued liabilities | | | (890,423 | ) | | | 58,418 | | | | 398,710 | | | | 690,722 | | | | 1,681,754 | |
| | | | (4,110,238 | ) | | | (3,257,050 | ) | | | (8,725,172 | ) | | | (9,049,826 | ) | | | (79,982,197 | ) |
| Investment Activities: | | | | | | | | | | | | | | | | | | | | |
| Proceeds on sale of subsidiary | | | - | | | | - | | | | - | | | | - | | | | 254,366 | |
| Proceeds on sale of equipment | | | - | | | | - | | | | - | | | | - | | | | 22,820 | |
| Proceeds on sale of mineral property | | | - | | | | 1,105,543 | | | | - | | | | 1,105,543 | | | | 1,339,002 | |
| Proceeds on sale of investments | | | - | | | | - | | | | - | | | | - | | | | 321,852 | |
| Mineral property acquisitions | | | (294,960 | ) | | | (345,613 | ) | | | (913,718 | ) | | | (814,676 | ) | | | (23,007,408 | ) |
| Deferred acquisition costs | | | - | | | | - | | | | - | | | | - | | | | (23,316 | ) |
| Purchase of equipment | | | (2,357,817 | ) | | | (429,971 | ) | | | (5,004,881 | ) | | | (1,384,210 | ) | | | (8,515,450 | ) |
| Reclamation deposit | | | (237,955 | ) | | | (231,997 | ) | | | (249,120 | ) | | | (240,345 | ) | | | (1,267,565 | ) |
| | | | (2,890,732 | ) | | | 97,962 | | | | (6,167,719 | ) | | | (1,333,688 | ) | | | (30,875,699 | ) |
| Financing Activities: | | | | | | | | | | | | | | | | | | | | |
| Advance from Red Emerald Ltd. | | | - | | | | - | | | | - | | | | - | | | | 12,010,075 | |
| Common stock issued, net of issue costs | | | 14,688,073 | | | | 1,891,942 | | | | 15,803,591 | | | | 18,312,506 | | | | 103,624,985 | |
| Promissory note | | | - | | | | - | | | | - | | | | - | | | | 2,000,000 | |
| Repayment of promissory note | | | - | | | | - | | | | - | | | | - | | | | (2,000,000 | ) |
| Convertible debenture | | | - | | | | - | | | | - | | | | - | | | | 6,324,605 | |
| | | | 14,688,073 | | | | 1,891,942 | | | | 15,803,591 | | | | 18,312,506 | | | | 121,959,665 | |
| Effect of Exchange Rate Changes on Cash: | | | (427,853 | ) | | | - | | | | (170,469 | ) | | | - | | | | (170,469 | ) |
| | | | | | | | | | | | | | | | | | | | | |
| Increase (Decrease) in Cash and Cash Equivalents | | | 7,259,250 | | | | (1,267,146 | ) | | | 740,231 | | | | 7,928,992 | | | | 10,931,300 | |
| Cash and Cash Equivalents, Beginning | | | 3,672,050 | | | | 15,258,954 | | | | 10,191,069 | | | | 6,062,816 | | | | - | |
| Cash and Cash Equivalents, Ending | | $ | 10,931,300 | | | $ | 13,991,808 | | | $ | 10,931,300 | | | $ | 13,991,808 | | | $ | 10,931,300 | |
Supplementary cash flow information (note 13)
The accompanying notes are an integral part of these consolidated interim financial statements.
MIDWAY GOLD CORP.
CONSOLIDATED STATEMENT OF STOCKHOLDERS’ EQUITY
(Expressed in Canadian dollars) (unaudited)
| | | Number of
shares | | | Common
stock | | | Additional
paid-in capital | | | Accumulated
other
comprehensive
loss | | | Accumulated
deficit during
the exploration
stage | | | Total
stockholders’
equity | |
| Balance, May 14, 1996 (date of inception) | | | - | | | $ | - | | | $ | - | | | $ | - | | | $ | - | | | $ | - | |
| Shares issued: | | | | | | | | | | | | | | | | | | | | | | | | |
| Private placements | | | 700,000 | | | | 168,722 | | | | - | | | | - | | | | - | | | | 168,722 | |
| Net loss | | | - | | | | - | | | | - | | | | - | | | | (114,800 | ) | | | (114,800 | ) |
| Balance, December 31, 1996 | | | 700,000 | | | | 168,722 | | | | | | | | | | | | (114,800 | ) | | | 53,922 | |
| Shares issued: | | | | | | | | | | | | | | | | | | | | | | | | |
| Initial public offering | | | 2,025,000 | | | | 590,570 | | | | - | | | | - | | | | - | | | | 590,570 | |
| Principal shares | | | 750,000 | | | | 7,500 | | | | - | | | | - | | | | - | | | | 7,500 | |
| Private placement | | | 1,000,000 | | | | 1,932,554 | | | | 321,239 | | | | - | | | | - | | | | 2,253,793 | |
| Exercise of share purchase warrants | | | 1,000,000 | | | | 2,803,205 | | | | - | | | | - | | | | - | | | | 2,803,205 | |
| Acquisition of mineral property interest | | | 1,000,000 | | | | 2,065,500 | | | | - | | | | - | | | | - | | | | 2,065,500 | |
| Finder’s fee | | | 150,000 | | | | 309,825 | | | | - | | | | - | | | | - | | | | 309,825 | |
| Net loss | | | - | | | | - | | | | - | | | | - | | | | (2,027,672 | ) | | | (2,027,672 | ) |
| Balance, December 31, 1997 | | | 6,625,000 | | | | 7,877,876 | | | | 321,239 | | | | - | | | | (2,142,472 | ) | | | 6,056,643 | |
| Shares issued: | | | | | | | | | | | | | | | | | | | | | | | | |
| Exercise of share purchase warrants | | | 100,000 | | | | 332,124 | | | | (32,124 | ) | | | - | | | | - | | | | 300,000 | |
| Acquisition of mineral property interest | | | 200,000 | | | | 246,000 | | | | - | | | | - | | | | - | | | | 246,000 | |
| Finder’s fee | | | 150,000 | | | | 224,250 | | | | - | | | | - | | | | - | | | | 224,250 | |
| Net loss | | | - | | | | - | | | | - | | | | - | | | | (1,943,674 | ) | | | (1,943,674 | ) |
| Balance, December 31, 1998 | | | 7,075,000 | | | | 8,680,250 | | | | 289,115 | | | | - | | | | (4,086,146 | ) | | | 4,883,219 | |
| Consolidation of shares on a two for one basis | | | (3,537,500 | ) | | | - | | | | - | | | | - | | | | - | | | | - | |
| Net loss | | | - | | | | - | | | | - | | | | - | | | | (2,378,063 | ) | | | (2,378,063 | ) |
| Balance, December 31, 1999 | | | 3,537,500 | | | | 8,680,250 | | | | 289,115 | | | | - | | | | (6,464,209 | ) | | | 2,505,156 | |
| Net loss | | | - | | | | - | | | | - | | | | - | | | | (4,718,044 | ) | | | (4,718,044 | ) |
| Balance, December 31, 2000 | | | 3,537,500 | | | | 8,680,250 | | | | 289,115 | | | | - | | | | (11,182,253 | ) | | | (2,212,888 | ) |
| Net earnings | | | - | | | | - | | | | - | | | | - | | | | 2,427,256 | | | | 2,427,256 | |
| Balance, December 31, 2001 | | | 3,537,500 | | | | 8,680,250 | | | | 289,115 | | | | - | | | | (8,754,997 | ) | | | 214,368 | |
| Shares issued: | | | | | | | | | | | | | | | | | | | | | | | | |
| Private placement | | | 4,824,500 | | | | 2,133,786 | | | | 246,839 | | | | - | | | | - | | | | 2,380,625 | |
| Exercise of share purchase warrants | | | 4,028,000 | | | | 1,007,000 | | | | - | | | | - | | | | - | | | | 1,007,000 | |
| Exercise of stock options | | | 32,000 | | | | 12,800 | | | | - | | | | - | | | | - | | | | 12,800 | |
| Financing shares issued | | | 31,250 | | | | 35,000 | | | | - | | | | - | | | | - | | | | 35,000 | |
| Acquisition of mineral property interest | | | 4,500,000 | | | | 3,600,000 | | | | - | | | | - | | | | - | | | | 3,600,000 | |
| Share issue costs | | | - | | | | (544,260 | ) | | | - | | | | - | | | | - | | | | (544,260 | ) |
| Stock based compensation | | | - | | | | - | | | | 27,000 | | | | - | | | | - | | | | 27,000 | |
| Net loss | | | - | | | | - | | | | - | | | | - | | | | (1,657,651 | ) | | | (1,657,651 | ) |
| Balance, December 31, 2002 | | | 16,953,250 | | | | 14,924,576 | | | | 562,954 | | | | - | | | | (10,412,648 | ) | | | 5,074,882 | |
| Shares issued: | | | | | | | | | | | | | | | | | | | | | | | | |
| Private placement | | | 700,000 | | | | 638,838 | | | | 201,162 | | | | - | | | | - | | | | 840,000 | |
| Exercise of share purchase warrants | | | 294,500 | | | | 73,625 | | | | - | | | | - | | | | - | | | | 73,625 | |
| Share issue costs | | | - | | | | (19,932 | ) | | | - | | | | - | | | | - | | | | (19,932 | ) |
| Stock based compensation | | | - | | | | - | | | | 531,000 | | | | - | | | | - | | | | 531,000 | |
| Net loss | | | - | | | | - | | | | - | | | | - | | | | (1,352,679 | ) | | | (1,352,679 | ) |
| Balance, December 31, 2003 | | | 17,947,750 | | | | 15,617,107 | | | | 1,295,116 | | | | | | | | (11,765,327 | ) | | | 5,146,896 | |
| Shares issued: | | | | | | | | | | | | | | | | | | | | | | | | |
| Private placement | | | 2,234,400 | | | | 2,122,269 | | | | 175,407 | | | | - | | | | - | | | | 2,297,676 | |
| Exercise of share purchase warrants | | | 213,500 | | | | 300,892 | | | | (46,267 | ) | | | - | | | | - | | | | 254,625 | |
| Exercise of stock options | | | 250,000 | | | | 157,000 | | | | (27,000 | ) | | | - | | | | - | | | | 130,000 | |
| Share issue costs | | | - | | | | (183,512 | ) | | | - | | | | - | | | | - | | | | (183,512 | ) |
| Stock based compensation | | | - | | | | - | | | | 941,478 | | | | - | | | | - | | | | 941,478 | |
| Net loss | | | - | | | | - | | | | - | | | | - | | | | (2,994,702 | ) | | | (2,994,702 | ) |
| Balance, December 31, 2004 carried forward | | | 20,645,650 | | | $ | 18,013,756 | | | $ | 2,338,734 | | | $ | - | | | $ | (14,760,029 | ) | | $ | 5,592,461 | |
The accompanying notes are an integral part of these consolidated interim financial statements.
MIDWAY GOLD CORP.
CONSOLIDATED STATEMENT OF STOCKHOLDERS’ EQUITY - CONTINUED
(Expressed in Canadian dollars) (unaudited)
| | | Number of
shares | | | Common
stock | | | Additional
paid-in capital | | | Accumulated
other
comprehensive
loss | | | Accumulated
deficit during
the exploration
stage | | | Total
stockholders’
equity | |
| Balance, December 31, 2004 brought forward | | | 20,645,650 | | | $ | 18,013,756 | | | $ | 2,338,734 | | | $ | - | | | $ | (14,760,029 | ) | | $ | 5,592,461 | |
| Shares issued: | | | | | | | | | | | | | | | | | | | | | | | | |
| Private placement | | | 4,075,800 | | | | 3,266,095 | | | | 773,335 | | | | - | | | | - | | | | 4,039,430 | |
| Exercise of stock options | | | 165,500 | | | | 124,364 | | | | (31,964 | ) | | | - | | | | - | | | | 92,400 | |
| Exercise of share purchase warrants | | | 1,743,000 | | | | 1,543,844 | | | | (4,844 | ) | | | - | | | | - | | | | 1,539,000 | |
| Share issue costs | | | - | | | | - | | | | - | | | | - | | | | - | | | | - | |
| Stock based compensation | | | - | | | | (184,660 | ) | | | 488,075 | | | | - | | | | - | | | | 303,415 | |
| Net loss | | | - | | | | - | | | | - | | | | - | | | | (4,402,715 | ) | | | (4,402,715 | ) |
| Balance, December 31, 2005 | | | 26,629,950 | | | | 22,763,399 | | | | 3,563,336 | | | | - | | | | (19,162,744 | ) | | | 7,163,991 | |
| Shares issued: | | | | | | | | | | | | | | | | | | | | | | | | |
| Private placements | | | 5,725,000 | | | | 10,760,355 | | | | 944,645 | | | | - | | | | - | | | | 11,705,000 | |
| Exercise of stock options | | | 306,000 | | | | 325,530 | | | | (111,330 | ) | | | - | | | | - | | | | 214,200 | |
| Exercise of share purchase warrants | | | 3,227,000 | | | | 4,182,991 | | | | (768,491 | ) | | | - | | | | - | | | | 3,414,500 | |
| Acquisition of mineral property interest | | | 40,000 | | | | 88,000 | | | | - | | | | - | | | | - | | | | 88,000 | |
| Share issue costs | | | - | | | | (248,512 | ) | | | - | | | | - | | | | - | | | | (248,512 | ) |
| Stock based compensation | | | - | | | | - | | | | 992,400 | | | | - | | | | - | | | | 992,400 | |
| Net loss | | | - | | | | - | | | | - | | | | - | | | | (7,241,228 | ) | | | (7,241,228 | ) |
| Balance, December 31, 2006 | | | 35,927,950 | | | | 37,871,763 | | | | 4,620,560 | | | | - | | | | (26,403,972 | ) | | | 16,088,351 | |
| Shares issued: | | | | | | | | | | | | | | | | | | | | | | | | |
| Private placement | | | 2,000,000 | | | | 5,400,000 | | | | - | | | | - | | | | - | | | | 5,400,000 | |
| Pan-Nevada acquisition | | | 7,764,109 | | | | 25,000,431 | | | | 2,028,074 | | | | - | | | | - | | | | 27,028,505 | |
| Exercise of stock options | | | 595,000 | | | | 1,485,415 | | | | (694,515 | ) | | | - | | | | - | | | | 790,900 | |
| Exercise of share purchase warrants | | | 3,395,605 | | | | 10,777,930 | | | | (2,081,407 | ) | | | - | | | | - | | | | 8,696,523 | |
| Share issue costs | | | - | | | | (28,000 | ) | | | - | | | | - | | | | - | | | | (28,000 | ) |
| Stock based compensation | | | - | | | | - | | | | 1,502,912 | | | | - | | | | - | | | | 1,502,912 | |
| Unrealized loss on investments | | | - | | | | - | | | | - | | | | (120,000 | ) | | | - | | | | (120,000 | ) |
| Adjustment of future income tax liability to mineral properties (note 2(p)) | | | - | | | | - | | | | - | | | | - | | | | (389,955 | ) | | | (389,955 | ) |
| Net loss | | | - | | | | - | | | | - | | | | - | | | | (10,666,106 | ) | | | (10,666,106 | ) |
| Balance, December 31, 2007 | | | 49,682,664 | | | | 80,507,539 | | | | 5,375,624 | | | | (120,000 | ) | | | (37,460,033 | ) | | | 48,303,130 | |
| Shares issued: | | | | | | | | | | | | | | | | | | | | | | | | |
| Private placement | | | 14,521,500 | | | | 6,174,441 | | | | 956,509 | | | | - | | | | - | | | | 7,130,950 | |
| Acquisition of mineral property interest | | | 30,000 | | | | 88,500 | | | | - | | | | - | | | | - | | | | 88,500 | |
| Exercise of stock options | | | 479,000 | | | | 1,186,462 | | | | (453,212 | ) | | | - | | | | - | | | | 733,250 | |
| Exercise of share purchase warrants | | | 108,500 | | | | 364,404 | | | | (209,405 | ) | | | - | | | | - | | | | 154,999 | |
| Share issue costs | | | - | | | | (139,705 | ) | | | - | | | | - | | | | - | | | | (139,705 | ) |
| Stock based compensation | | | - | | | | - | | | | 501,028 | | | | - | | | | - | | | | 501,028 | |
| Unrealized loss on investments | | | - | | | | - | | | | - | | | | (502,225 | ) | | | - | | | | (502,225 | ) |
| Investment write-down | | | - | | | | - | | | | - | | | | 622,225 | | | | - | | | | 622,225 | |
| Net loss | | | - | | | | - | | | | - | | | | - | | | | (16,165,394 | ) | | | (16,165,394 | ) |
| Balance, December 31, 2008 | | | 64,821,664 | | | | 88,181,641 | | | | 6,170,544 | | | | - | | | | (53,625,427 | ) | | | 40,726,758 | |
| Shares issued: | | | | | | | | | | | | | | | | | | | | | | | | |
| Exercise of stock options | | | 33,333 | | | | 32,815 | | | | (11,164 | ) | | | - | | | | - | | | | 21,651 | |
| Exercise of share purchase warrants | | | 12,500,000 | | | | 4,456,509 | | | | (956,509 | ) | | | - | | | | - | | | | 3,500,000 | |
| Stock based compensation | | | - | | | | - | | | | 1,152,238 | | | | - | | | | - | | | | 1,152,238 | |
| Unrealized gain on investment | | | - | | | | - | | | | - | | | | 53,850 | | | | - | | | | 53,850 | |
| Realized gain on sale of investments | | | - | | | | - | | | | - | | | | (53,850 | ) | | | - | | | | (53,850 | ) |
| Net loss | | | - | | | | - | | | | - | | | | - | | | | (2,642,176 | ) | | | (2,642,176 | ) |
| Balance, December 31, 2009, carried forward | | | 77,354,997 | | | $ | 92,670,965 | | | $ | 6,355,109 | | | $ | - | | | $ | (56,267,603 | ) | | $ | 42,758,471 | |
The accompanying notes are an integral part of these consolidated interim financial statements.
MIDWAY GOLD CORP.
CONSOLIDATED STATEMENT OF STOCKHOLDERS’ EQUITY - CONTINUED
(Expressed in Canadian dollars) (unaudited)
| | | Number of
shares | | | Common
stock | | | Additional
paid-in capital | | | Accumulated
other
comprehensive
loss | | | Accumulated
deficit during
the exploration
stage | | | Total
stockholders’
equity | |
| Balance, December 31, 2009, brought forward | | | 77,354,997 | | | $ | 92,670,965 | | | $ | 6,355,109 | | | $ | - | | | $ | (56,267,603 | ) | | $ | 42,758,471 | |
| Shares issued: | | | | | | | | | | | | | | | | | | | | | | | | |
| Private placement | | | 1,333,333 | | | | 514,365 | | | | 285,635 | | | | - | | | | - | | | | 800,000 | |
| Public offerings | | | 17,738,666 | | | | 8,294,058 | | | | 1,504,996 | | | | - | | | | - | | | | 9,799,054 | |
| Share issue costs | | | - | | | | (1,431,027 | ) | | | 212,109 | | | | - | | | | - | | | | (1,218,918 | ) |
| Exercise of share purchase warrants | | | 12,500 | | | | 14,024 | | | | (4,024 | ) | | | - | | | | - | | | | 10,000 | |
| Stock based compensation | | | - | | | | - | | | | 838,601 | | | | - | | | | - | | | | 838,601 | |
| Unrealized gain on investment | | | - | | | | - | | | | - | | | | 13,125 | | | | - | | | | 13,125 | |
| Net loss | | | - | | | | - | | | | - | | | | - | | | | (5,826,972 | ) | | | (5,826,972 | ) |
| Balance, December 31, 2010 | | | 96,439,496 | | | | 100,062,385 | | | | 9,192,426 | | | | 13,125 | | | | (62,094,575 | ) | | | 47,173,361 | |
| Shares issued: | | | | | | | | | | | | | | | | | | | | | | | | |
| Exercise of share purchase warrants | | | 8,611,356 | | | | 10,849,874 | | | | (1,578,554 | ) | | | - | | | | - | | | | 9,271,320 | |
| Exercise of stock options | | | 729,997 | | | | 743,200 | | | | (290,451 | ) | | | - | | | | - | | | | 452,749 | |
| Bought deal offering | | | 7,500,000 | | | | 11,742,000 | | | | - | | | | - | | | | - | | | | 11,742,000 | |
| Share issuance under At-the-Market Program | | | 568,626 | | | | 1,518,845 | | | | - | | | | - | | | | - | | | | 1,518,845 | |
| Share issue costs | | | - | | | | (990,900 | ) | | | - | | | | - | | | | - | | | | (990,900 | ) |
| Stock-based compensation | | | - | | | | - | | | | 3,626,687 | | | | - | | | | - | | | | 3,626,687 | |
| Unrealized gain on investment | | | - | | | | - | | | | - | | | | 13,750 | | | | - | | | | 13,750 | |
| Net loss | | | - | | | | - | | | | - | | | | - | | | | (15,527,179 | ) | | | (15,527,179 | ) |
| Balance, December 31, 2011 | | | 113,849,475 | | | $ | 123,925,404 | | | $ | 10,950,108 | | | $ | 26,875 | | | $ | (77,621,754 | ) | | $ | 57,280,633 | |
| Shares issued: | | | | | | | | | | | | | | | | | | | | | | | | |
| Public offerings | | | 12,261,562 | | | | 13,370,717 | | | | - | | | | - | | | | - | | | | 13,370,717 | |
| Exercise of share purchase warrants | | | 1,533,650 | | | | 1,644,074 | | | | (417,153 | ) | | | - | | | | - | | | | 1,226,921 | |
| Exercise of stock options | | | 317,501 | | | | 312,837 | | | | (126,351 | ) | | | - | | | | - | | | | 186,486 | |
| Share issuance under ATM Program | | | 69,110 | | | | 100,433 | | | | - | | | | - | | | | - | | | | 100,433 | |
| Share issue costs | | | - | | | | (1,422,871 | ) | | | - | | | | - | | | | - | | | | (1,422,871 | ) |
| Stock based compensation | | | - | | | | - | | | | 1,477,501 | | | | - | | | | - | | | | 1,477,501 | |
| Unrealized gain (loss) on investment | | | - | | | | - | | | | - | | | | (51,250 | ) | | | - | | | | (51,250 | ) |
| Currency translation adjustment | | | - | | | | - | | | | - | | | | (935,599 | ) | | | - | | | | (935,599 | ) |
| Net loss | | | - | | | | - | | | | - | | | | - | | | | (10,815,558 | ) | | | (10,815,558 | ) |
| Balance, September 30, 2012 | | | 128,031,298 | | | $ | 137,930,594 | | | $ | 11,884,105 | | | $ | (959,974 | ) | | $ | (88,437,312 | ) | | $ | 60,417,413 | |
The accompanying notes are an integral part of these consolidated interim financial statements.
MIDWAY GOLD CORP.
SCHEDULE OF MINERAL EXPLORATION EXPENDITURES
(Expressed in Canadian dollars) (unaudited)
| | | Three months
ended
September 30,
2012 | | | Three months
ended
September 30,
2011 | | | Nine months
ended
September 30,
2012 | | | Nine months
ended
September 30,
2011 | | | Cumulative
period from
inception
(May
14,1996) to
September 30,
2012 | |
| Exploration costs incurred are summarized as follows: | | | | | | | | | | | | | | | | | | | | |
| Tonopah project | | | | | | | | | | | | | | | | | | | | |
| Assays and analysis | | $ | - | | | $ | 118,699 | | | $ | 19,496 | | | $ | 118,699 | | | $ | 552,388 | |
| Communication | | | 34 | | | | - | | | | 151 | | | | - | | | | 9,664 | |
| Drilling | | | - | | | | 313,567 | | | | (64 | ) | | | 813,362 | | | | 2,834,782 | |
| Engineering and consulting | | | 14 | | | | 82,549 | | | | 14,545 | | | | 238,068 | | | | 4,447,399 | |
| Environmental | | | - | | | | - | | | | - | | | | 2,440 | | | | 236,138 | |
| Field office and supplies | | | 2,700 | | | | 13,006 | | | | 14,735 | | | | 25,157 | | | | 280,886 | |
| Legal | | | 46 | | | | 8,085 | | | | 440 | | | | 14,516 | | | | 165,787 | |
| Property maintenance and taxes | | | 73,963 | | | | 33,659 | | | | 74,471 | | | | 37,526 | | | | 633,280 | |
| Reclamation costs | | | - | | | | - | | | | 4,912 | | | | 1,154 | | | | 39,238 | |
| Reproduction and drafting | | | 79 | | | | - | | | | 177 | | | | 2,602 | | | | 23,623 | |
| Salaries and labor | | | 12,615 | | | | 85,617 | | | | 86,815 | | | | 176,397 | | | | 953,666 | |
| Travel, transportation and accommodation | | | 1,132 | | | | 25,664 | | | | 6,925 | | | | 63,774 | | | | 479,734 | |
| | | | 90,583 | | | | 680,846 | | | | 222,603 | | | | 1,493,695 | | | | 10,656,585 | |
| Spring Valley project | | | | | | | | | | | | | | | | | | | | |
| Assays and analysis | | | - | | | | - | | | | - | | | | - | | | | 3,329,900 | |
| Communication | | | 9 | | | | - | | | | 37 | | | | - | | | | 10,344 | |
| Drilling | | | - | | | | - | | | | - | | | | - | | | | 10,261,359 | |
| Engineering and consulting | | | 4 | | | | (8,509 | ) | | | 30,347 | | | | 188,938 | | | | 2,662,798 | |
| Environmental | | | - | | | | - | | | | - | | | | - | | | | 300,445 | |
| Equipment rental | | | - | | | | - | | | | - | | | | - | | | | 64,651 | |
| Field office and supplies | | | 684 | | | | 228 | | | | 6,923 | | | | 255 | | | | 556,170 | |
| Legal | | | 9,703 | | | | 19,400 | | | | 63,282 | | | | 56,148 | | | | 498,957 | |
| Operator fee | | | - | | | | - | | | | - | | | | - | | | | 108,339 | |
| Property maintenance and taxes | | | 8,396 | | | | - | | | | 8,396 | | | | (144 | ) | | | 496,317 | |
| Reclamation costs | | | (45 | ) | | | - | | | | 89 | | | | 127 | | | | 30,963 | |
| Reproduction and drafting | | | 20 | | | | - | | | | 110 | | | | 324 | | | | 30,158 | |
| Salaries and labor | | | 2,822 | | | | 2,618 | | | | 18,040 | | | | 18,201 | | | | 1,277,707 | |
| Travel, transportation and accommodation | | | 112 | | | | 659 | | | | 1,692 | | | | 2,574 | | | | 858,416 | |
| | | | 21,705 | | | | 14,396 | | | | 128,916 | | | | 266,423 | | | | 20,486,524 | |
| Pan project | | | | | | | | | | | | | | | | | | | | |
| Assays and analysis | | | - | | | | 16,388 | | | | 3,807 | | | | 218,627 | | | | 931,888 | |
| Communication | | | 1,255 | | | | - | | | | 2,322 | | | | - | | | | 2,322 | |
| Drilling | | | 451 | | | | (72,739 | ) | | | (58,436 | ) | | | 833,689 | | | | 3,712,101 | |
| Engineering and consulting | | | 1,666 | | | | 594,209 | | | | 27,303 | | | | 1,486,774 | | | | 3,585,128 | |
| Environmental | | | 3,441 | | | | 87,298 | | | | 10,493 | | | | 177,155 | | | | 706,649 | |
| Equipment rental | | | 1,058 | | | | - | | | | 1,058 | | | | - | | | | 1,058 | |
| Field office and supplies | | | 101,598 | | | | 311,423 | | | | 228,145 | | | | 402,856 | | | | 901,747 | |
| Legal | | | 1,814 | | | | 30,354 | | | | 32,887 | | | | 111,869 | | | | 337,519 | |
| Property maintenance and taxes | | | 86,102 | | | | 76,913 | | | | 89,047 | | | | 390,677 | | | | 958,651 | |
| Reclamation costs | | | 2,245 | | | | (43,356 | ) | | | 6,014 | | | | (15,221 | ) | | | (8,752 | ) |
| Reproduction and drafting | | | 2,998 | | | | 60,972 | | | | 6,415 | | | | 66,290 | | | | 78,443 | |
| Salaries and labor | | | 410,196 | | | | 182,182 | | | | 687,280 | | | | 550,047 | | | | 2,711,188 | |
| Travel, transportation and accommodation | | | 87,963 | | | | 31,754 | | | | 116,541 | | | | 143,796 | | | | 590,374 | |
| | | | 700,787 | | | | 1,275,398 | | | | 1,152,876 | | | | 4,366,559 | | | | 14,508,316 | |
| Sub-total balance carried forward | | $ | 813,075 | | | $ | 1,970,640 | | | $ | 1,504,395 | | | $ | 6,126,677 | | | $ | 45,651,425 | |
The accompanying notes are an integral part of these consolidated interim financial statements.
MIDWAY GOLD CORP.
SCHEDULE OF MINERAL EXPLORATION EXPENDITURES - CONTINUED
(Expressed in Canadian dollars) (unaudited)
| | | Three
months
ended
September
30, 2012 | | | Three months
ended
September 30,
2011 | | | Nine months
ended
September
30, 2012 | | | Nine months
ended
September
30, 2011 | | | Cumulative
period from
inception (May
14,1996) to
September 30,
2012 | |
| Sub-total balance brought forward | | $ | 813,075 | | | $ | 1,970,640 | | | $ | 1,504,395 | | | $ | 6,126,677 | | | $ | 45,651,425 | |
| Thunder Mountain project | | | | | | | | | | | | | | | | | | | | |
| Assays and analysis | | | 859 | | | | - | | | | 71,799 | | | | - | | | | 86,367 | |
| Drilling | | | - | | | | - | | | | 177,012 | | | | - | | | | 254,968 | |
| Engineering and consulting | | | 3 | | | | - | | | | 46,465 | | | | - | | | | 47,171 | |
| Environmental | | | - | | | | - | | | | - | | | | - | | | | 1,717 | |
| Field office and supplies | | | 185 | | | | 23 | | | | 35,591 | | | | 23 | | | | 36,784 | |
| Legal and Accounting | | | 2 | | | | - | | | | 3,233 | | | | - | | | | 3,233 | |
| Property maintenance and taxes | | | 12,204 | | | | - | | | | 32,653 | | | | 82 | | | | 51,640 | |
| Reclamation costs | | | - | | | | - | | | | 1,382 | | | | 5,365 | | | | 6,169 | |
| Salaries and labor | | | 2,875 | | | | 57 | | | | 111,547 | | | | 620 | | | | 115,222 | |
| Travel, transportation and accommodation | | | 125 | | | | - | | | | 21,735 | | | | - | | | | 21,790 | |
| | | | 16,253 | | | | 80 | | | | 501,417 | | | | 6,090 | | | | 625,061 | |
| Gold Rock project | | | | | | | | | | | | | | | | | | | | |
| Assays and analysis | | | 46,789 | | | | 47,564 | | | | 136,202 | | | | 47,758 | | | | 326,745 | |
| Communication | | | 416 | | | | | | | | 1,035 | | | | | | | | 1,035 | |
| Drilling | | | 395,422 | | | | 531,339 | | | | 421,749 | | | | 552,719 | | | | 1,474,134 | |
| Engineering and consulting | | | 63,811 | | | | 16,737 | | | | 287,361 | | | | 68,661 | | | | 557,368 | |
| Environmental | | | 181,337 | | | | - | | | | 533,274 | | | | 2,440 | | | | 618,833 | |
| Equipment rental | | | 295 | | | | - | | | | 295 | | | | - | | | | 295 | |
| Field office and supplies | | | 65,920 | | | | 23,246 | | | | 151,194 | | | | 24,580 | | | | 230,957 | |
| Legal | | | 875 | | | | - | | | | 8,581 | | | | 9,157 | | | | 36,854 | |
| Property maintenance and taxes | | | 98,654 | | | | 69,253 | | | | 112,985 | | | | 70,080 | | | | 536,680 | |
| Reclamation costs | | | 122 | | | | 265 | | | | 12,301 | | | | 15,886 | | | | 37,487 | |
| Reproduction and drafting | | | 1,720 | | | | 34,969 | | | | 2,503 | | | | 35,077 | | | | 37,919 | |
| Salaries and labor | | | 151,473 | | | | 56,352 | | | | 361,812 | | | | 88,501 | | | | 577,175 | |
| Travel, transportation and accommodation | | | 14,973 | | | | 9,913 | | | | 45,729 | | | | 11,632 | | | | 103,951 | |
| | | | 1,021,807 | | | | 789,638 | | | | 2,075,021 | | | | 926,491 | | | | 4,539,433 | |
| Golden Eagle project | | | | | | | | | | | | | | | | | | | | |
| Assays and analysis | | | 7 | | | | - | | | | 7 | | | | - | | | | 21,697 | |
| Drilling | | | - | | | | - | | | | - | | | | - | | | | 3,638 | |
| Engineering and consulting | | | 13,734 | | | | - | | | | 62,579 | | | | 205,417 | | | | 443,560 | |
| Field office and supplies | | | 569 | | | | 39 | | | | 3,098 | | | | 39 | | | | 5,363 | |
| Legal | | | 18 | | | | - | | | | 527 | | | | 1,950 | | | | 22,046 | |
| Property maintenance and taxes | | | - | | | | 475 | | | | 8,527 | | | | 4,743 | | | | 29,904 | |
| Salaries and labor | | | 2,227 | | | | 551 | | | | 7,167 | | | | 7,760 | | | | 15,605 | |
| Travel, transportation and accommodation | | | 89 | | | | - | | | | 539 | | | | 5,343 | | | | 21,605 | |
| | | | 16,644 | | | | 1,065 | | | | 82,444 | | | | 225,252 | | | | 563,418 | |
| Sub-total balance carried forward | | $ | 1,867,779 | | | $ | 2,761,423 | | | $ | 4,163,277 | | | $ | 7,284,510 | | | $ | 51,379,337 | |
The accompanying notes are an integral part of these consolidated interim financial statements.
MIDWAY GOLD CORP.
SCHEDULE OF MINERAL EXPLORATION EXPENDITURES - CONTINUED
(Expressed in Canadian dollars) (unaudited)
| | | Three
months
ended
September
30, 2012 | | | Three months
ended
September 30,
2011 | | | Nine
months
ended
September
30, 2012 | | | Nine months
ended
September 30,
2011 | | | Cumulative
period from
inception (May
14,1996) to
September 30,
2012 | |
| Sub-total balance brought forward | | $ | 1,867,779 | | | $ | 2,761,423 | | | $ | 4,163,277 | | | $ | 7,284,510 | | | $ | 51,379,337 | |
| Abandoned properties | | | | | | | | | | | | | | | | | | | | |
| Acquisition costs and option payments | | | - | | | | - | | | | - | | | | - | | | | 40,340 | |
| Assays and analysis | | | - | | | | - | | | | 5,296 | | | | - | | | | 101,908 | |
| Communications | | | - | | | | - | | | | - | | | | - | | | | 119,734 | |
| Drilling | | | - | | | | - | | | | - | | | | - | | | | 1,018,952 | |
| Engineering and consulting | | | - | | | | 3,433 | | | | 9,894 | | | | 3,433 | | | | 3,404,185 | |
| Equipment rental | | | - | | | | - | | | | - | | | | - | | | | 348,377 | |
| Field office and supplies | | | 34 | | | | 36 | | | | 2,480 | | | | 101 | | | | 312,850 | |
| Foreign exchange gain | | | - | | | | - | | | | - | | | | - | | | | (38,134 | ) |
| Freight | | | - | | | | - | | | | - | | | | - | | | | 234,956 | |
| Interest on convertible loans | | | - | | | | - | | | | - | | | | - | | | | 1,288,897 | |
| Legal and accounting | | | - | | | | - | | | | - | | | | 1,402 | | | | 466,764 | |
| Marketing | | | - | | | | - | | | | - | | | | - | | | | 91,917 | |
| Mining costs | | | - | | | | - | | | | - | | | | - | | | | 693,985 | |
| Processing and laboratory supplies | | | - | | | | - | | | | - | | | | - | | | | 941,335 | |
| Property maintenance and taxes | | | - | | | | 13,596 | | | | - | | | | 13,596 | | | | 511,445 | |
| Reclamation costs | | | (50 | ) | | | - | | | | 6,919 | | | | 150 | | | | 45,428 | |
| Recoveries | | | - | | | | - | | | | - | | | | - | | | | (39,850 | ) |
| Reproduction and drafting | | | - | | | | - | | | | - | | | | - | | | | 6,215 | |
| Security | | | - | | | | - | | | | - | | | | - | | | | 350,584 | |
| Salaries and labor | | | - | | | | 2,483 | | | | 9,833 | | | | 4,603 | | | | 47,552 | |
| Travel, transportation and accommodation | | | - | | | | 1,564 | | | | 3,084 | | | | 2,426 | | | | 448,862 | |
| Utilities and water | | | - | | | | - | | | | - | | | | - | | | | 59,425 | |
| | | | (16 | ) | | | 21,112 | | | | 37,506 | | | | 25,711 | | | | 10,455,727 | |
| Property investigations | | | | | | | | | | | | | | | | | | | | |
| Assays and analysis | | | 12,820 | | | | 488 | | | | 22,254 | | | | 488 | | | | 197,650 | |
| Drilling | | | - | | | | - | | | | 565 | | | | - | | | | 169,694 | |
| Engineering and consulting | | | - | | | | - | | | | 174,734 | | | | - | | | | 385,125 | |
| Environmental | | | - | | | | - | | | | - | | | | - | | | | 22,761 | |
| Field office and supplies | | | - | | | | 59 | | | | 5,545 | | | | (38 | ) | | | 25,539 | |
| Legal | | | - | | | | - | | | | - | | | | - | | | | 10,952 | |
| Property maintenance and taxes | | | 46,867 | | | | - | | | | 655,437 | | | | - | | | | 778,667 | |
| Reclamation costs | | | - | | | | - | | | | - | | | | - | | | | 3,048 | |
| Reproduction and drafting | | | - | | | | - | | | | 394 | | | | - | | | | 5,336 | |
| Salaries and labor | | | 2,432 | | | | 1,923 | | | | 27,421 | | | | 7,630 | | | | 38,725 | |
| Travel, transportation and accommodation | | | - | | | | - | | | | 10,313 | | | | 719 | | | | 125,535 | |
| | | | 62,119 | | | | 2,470 | | | | 896,663 | | | | 8,799 | | | | 1,763,032 | |
| | | $ | 1,929,882 | | | $ | 2,785,005 | | | $ | 5,097,446 | | | $ | 7,319,020 | | | $ | 63,598,096 | |
The accompanying notes are an integral part of these consolidated interim financial statements.
MIDWAY GOLD CORP.
NOTES TO UNAUDITED CONSOLIDATED FINANCIAL STATEMENTS
| 1. | Nature and continuance of operations |
Midway Gold Corp. (the “Company” or “Midway”) was incorporated on May 14, 1996 under the laws of the Province of British Columbia and its principal business activities are the acquisition, exploration and development of mineral properties.
The consolidated financial statements for the three and nine months ended September 30, 2012 were prepared on the basis that the Company is a going concern, which contemplates the realization of its assets and the settlement of its liabilities in the normal course of operations. These financial statements do not reflect adjustments that would be necessary if the going concern assumption were not appropriate.
The Company has not generated any revenues from operations. The Company has incurred losses for the three and nine months ended September 30, 2012 of $3,515,919 and $10,815,558, respectively, and since inception of May 14, 1996 to September 30, 2012 resulting in an accumulated deficit of $88,437,312; further losses are anticipated in the development of its business. At September 30, 2012, the Company had $10,931,300 in cash and cash equivalents. As of the date of this report, management believes the Company has sufficient funds for ordinary operations through at least the next twelve months.
The Company’s ability to continue as a going concern is dependent upon its ability to successfully raise additional financing for the substantial capital expenditures required to achieve planned principal operations. While the Company has been successful in the past in obtaining financing, there is no assurance that it will be able to obtain adequate financing in the future or that such financing will be on terms acceptable to the Company.
| 2. | Significant accounting policies and change in accounting policy |
The interim consolidated financial statements included herein have been prepared by the Company, without audit, in accordance with the rules and regulations of the Securities and Exchange Commission (“SEC”) pursuant to Rule 10-01 of Regulation S-X. Certain information and footnote disclosures normally included in financial statements prepared in accordance with accounting principles generally accepted in the United States of America (“US GAAP”) have been condensed or omitted pursuant to such SEC rules and regulations, although the Company believes that the disclosures included are adequate to make the information presented not misleading. Certain reclassifications have been made to prior period financial statements to conform to the current period presentation.
In management’s opinion, the unaudited consolidated financial statements contained herein reflect all adjustments, consisting primarily of normal recurring items, which are necessary for the fair presentation of our financial position, results of operations, and cash flows on a basis consistent with that of our prior audited consolidated financial statements. However, the results of operations for interim periods may not be indicative of results to be expected for the full fiscal year. Therefore, these financial statements should be read in conjunction with the Company’s audited consolidated financial statements including the notes thereto for the year ended December 31, 2011 which may be found under the Company’s profile on SEDAR and EDGAR.
The accounting policies followed by the Company are set out in note 2 to the audited consolidated financial statements for the year ended December 31, 2011 and have been consistently followed in the preparation of these consolidated interim financial statements, with the exception of those policies outlined below:
Foreign Currency Transactions
Effective January 1, 2012, the Company changed the functional currency for its U.S. operations to the United States dollar and its reporting currency is the Canadian dollar.
The Company’s financial statements are translated from its U.S. functional currency, the United States dollar, to the reporting currency, the Canadian dollar, using the current rate method. Assets and liabilities are translated using the current rate in effect at the balance sheet date and revenues and expenses are translated at the average rate for the period. Adjustments resulting from the translation, if any, are included in accumulated other comprehensive income (loss) in stockholders’ equity.
Mineral Properties
The Company expenses all costs related to the maintenance and exploration of mineral properties in which it has secured rights prior to establishment of commercial feasibility. Mineral property acquisition costs are initially capitalized when incurred. The Company assesses the carrying cost for impairment under ASC 360-10 “Accounting for Impairment or Disposal of Long Lived Assets”. When it has been determined that a mineral property has been deemed economically feasible, the costs then incurred to develop such property and construct a mine are capitalized. The costs of construction and development will be amortized using either straight-line or the units-of-production method over the estimated life of the mine. If mineral properties are subsequently abandoned or impaired, any capitalized costs will be charged to operations.
Recent Accounting Pronouncements
We evaluate the pronouncements of various authoritative accounting organizations, primarily the Financial Accounting Standards Board (“FASB”), the SEC, and the Emerging Issues Task Force (“EITF”), to determine the impact of new pronouncements on US GAAP and the impact on the Company.
Recently Adopted Accounting Policies
In May 2011, the FASB issued ASU No. 2011-04, which updated the guidance in ASC Topic 820, Fair Value Measurement. The amendments in this update generally represent clarifications of Topic 820, but also include some instances where a particular principle or requirement for measuring fair value or disclosing information about fair value measurements has changed. This update results in common principles and requirements for measuring fair value and for disclosing information about fair value measurements in accordance with U.S. GAAP and IFRS. The amendments in this update are to be applied prospectively. This guidance became effective for the Company as of January 1, 2012. The adoption of this guidance did not have a material impact on our financial position or results of operations.
In June 2011, the FASB issued ASU No. 2011-05, which updated the guidance in ASC Topic 220, Comprehensive Income. Under the amendments in this update, an entity has the option to present the total of comprehensive income, the components of net income, and the components of other comprehensive income either in a single continuous statement of comprehensive income or in two separate but consecutive statements. In both choices, an entity is required to present each component of net income along with total net income, each component of other comprehensive income along with a total for other comprehensive income, and a total amount for comprehensive income. This update eliminates the option to present the components of other comprehensive income as part of the statement of changes in stockholders' equity. The amendments in this update do not change the items that must be reported in other comprehensive income or when an item of other comprehensive income must be reclassified to net income. This guidance became effective for the Company as of January 1, 2012.
In December of 2011, the FASB issued ASU No. 2011-12, which defers only those provisions within ASU 2011-05 pertaining to reclassification adjustments out of accumulated other comprehensive income. This guidance, except for those provisions deferred by ASU 2011-12, became effective for the Company as of the beginning January 1, 2012. The adoption of this guidance did not have an impact on our financial position or results of operations.
Basic net loss per share is computed by dividing the net loss for the period attributable to common stockholders by the weighted average number of shares of common stock outstanding during the period. Diluted net loss per share takes into consideration shares of common stock outstanding (computed under basic loss per share) and potentially dilutive shares of common stock. Diluted net loss per share is not presented separately from basic net loss per share as the conversion of outstanding stock options and warrants into common shares would be anti-dilutive.
| 4. | Fair Value Measurements |
ASC 820 establishes a fair value hierarchy which prioritizes the inputs used in measuring fair value into three broad levels as follows:
Level 1- Quoted prices in active markets for identical assets or liabilities.
Level 2- Inputs other than the quoted prices in active markets that are observable either directly or indirectly.
Level 3- Unobservable inputs based on the Company’s assumptions.
The Company’s Level 1 assets include common shares available for sale with no trading restrictions as determined using a market approach based upon unadjusted quoted prices for identical assets in an active market. Level 1 assets also included warrants that are considered derivatives and are marked to market each reporting period based upon unadjusted quoted prices for identical assets in active markets.
The Company’s Level 2 liabilities include a warrant liability due to warrants issued as part of a public offering on July 6, 2012. The Company recorded the fair value of the warrant liability using the Black-Scholes option pricing model.
The Company did not have any Level 3 assets or liabilities as of September 30, 2012.
The determination of fair value for financial reporting purposes at September 30, 2012 utilizing the applicable framework is as follows:
| Financial Instrument | | Quoted
Prices in
Active
Markets for
Identical
Assets | | | Significant
other
observable
inputs | | | Significant
unobservable
inputs | | | Total at
September 30,
2012 | |
| Assets | | | | | | | | | | | | | | | | |
| Available-for-sale securities | | $ | 18,750 | | | $ | - | | | $ | - | | | $ | 18,750 | |
| Derivatives | | | - | | | | - | | | | - | | | | - | |
| Liabilities | | | | | | | | | | | | | | | | |
| Warrant Liability | | $ | - | | | $ | (2,439,491 | ) | | $ | - | | | $ | (2,439,491 | ) |
Financial instruments measured at fair value as at December 31, 2011 were as follows:
| Financial Instrument | | Quoted
Prices in
Active
Markets for
Identical
Assets | | | Significant
other
observable
inputs | | | Significant
unobservable
inputs | | | Total at
December 31,
2011 | |
| Assets | | | | | | | | | | | | | | | | |
| Available-for-sale securities | | $ | 70,000 | | | $ | - | | | $ | - | | | $ | 70,000 | |
| Derivatives | | | - | | | | 8,933 | | | | - | | | | 8,933 | |
As consideration of certain area of interest obligations of NV Gold Corporation (“NVX”) that apply to the Roberts Gold project, the Company was issued 250,000 common shares of NVX and 250,000 common share purchase warrants (the “NVX Warrants”) on October 26, 2010. The NVX Warrants entitle the Company to purchase one common share of NVX at an exercise price of $0.40 until October 26, 2012. If the volume weighted average price of the common shares of NVX exceeds $0.60 for twenty consecutive trading days, NVX may notify the Company in writing that the NVX Warrants will expire 15 trading days from receipt of such notice unless exercised by the Company before such date.
The NVX Warrants are considered derivatives. The NVX Warrants will be revalued each reporting period with gains or losses recorded in the Statement of Operations. The following Black-Scholes valuation assumptions were used on September 30, 2012: expected life of 0.1 years; volatility of 106%; no dividend yield; and a risk free interest rate of 1.4%. The following Black-Scholes valuation assumptions were used on December 31, 2011: expected life of 0.82 years; volatility of 68%; no dividend yield; and a risk free interest rate of 0.91%.
| | | September 30, 2012 | |
| | | Number of
shares or
warrants | | | Cost | | | Accumulated
unrealized
gains (losses) | | | Fair Value | |
| Available for sale – common shares | | | 250,000 | | | $ | 43,125 | | | $ | (24,375 | ) | | $ | 18,750 | |
| Warrants | | | 250,000 | | | | 16,995 | | | | (16,995 | ) | | | - | |
| Total investments | | | | | | $ | 60,120 | | | $ | (41,370 | ) | | $ | 18,750 | |
| | | December 31, 2011 | |
| | | Number of
shares or
warrants | | | Cost | | | Accumulated
unrealized
gains (losses) | | | Fair Value | |
| Available for sale – common shares | | | 250,000 | | | $ | 43,125 | | | $ | 26,875 | | | $ | 70,000 | |
| Warrants | | | 250,000 | | | | 16,995 | | | | (8,062 | ) | | | 8,933 | |
| Total investments | | | | | | $ | 60,120 | | | $ | 18,813 | | | $ | 78,933 | |
During the three month period ended September 30, 2012, the Company recorded a net unrealized loss on the NVX Warrants of $346 in the Statement of Operations for the difference in the fair value at September 30, 2012 as compared to June 30, 2012.
During the nine month period ended September 30, 2012, the Company recorded a net unrealized loss on the common shares of NVX of $51,250 in accumulated other comprehensive incomeand a net unrealized loss on the NVX Warrants of $8,933 in the Statement of Operations for the difference in the fair value at September 30, 2012 as compared to December 31, 2011.
At September 30, 2012 and December 31, 2011, property and equipment consisted of the following:
| | | September 30,
2012 | | | December 31,
2011 | |
| | | | | | | |
| Land | | $ | 541,679 | | | $ | 536,854 | |
| Buildings and leasehold improvements | | | 513,587 | | | | 434,864 | |
| Computer equipment and software | | | 926,225 | | | | 497,317 | |
| Trucks and autos | | | 361,446 | | | | 293,946 | |
| Field equipment | | | 225,171 | | | | 247,826 | |
| Office equipment | | | 188,478 | | | | 133,893 | |
| Construction in progress | | | 4,255,876 | | | | - | |
| Subtotal | | | 7,012,462 | | | | 2,144,700 | |
| Accumulated depreciation | | | (719,139 | ) | | | (506,420 | ) |
| Totals | | $ | 6,293,323 | | | $ | 1,638,280 | |
Depreciation expense for the three and nine months ended September 30, 2012 and 2011 was $116,899 and $283,903, and $80,744 and $108,164, respectively. The Company evaluates the recoverability of property and equipment when events and circumstances indicate that such assets might be impaired.
Details on the Company’s mineral properties are found in note 6 to the audited consolidated financial statements for the year ended December 31, 2011.
| Mineral property | | September 30,
2012 | | | December 31,
2011 | |
| Tonopah | | $ | 7,485,487 | | | $ | 7,324,586 | |
| Spring Valley | | | 4,739,152 | | | | 5,099,159 | |
| Pan | | | 34,255,287 | | | | 34,020,664 | |
| Gold Rock | | | 1,129,819 | | | | 863,112 | |
| Golden Eagle | | | 2,136,002 | | | | 2,255,613 | |
| | | $ | 49,745,747 | | | $ | 49,563,134 | |
| (a) | Tonopah property, Nye County, Nevada |
Through a series of agreements, amendments and payments the Company acquired a 100% interest in the Tonopah property subject only to a sliding scale royalty on Net Smelter Returns (“NSR”) from any commercial production of between 2% to 7%, based on changes in gold prices and an advance minimum royalty, recoverable from commercial production, of US$300,000 per year on each August 15. On August 1, 2012, the company paid $300,510 (US$300,000).
| (b) | Spring Valley property, Nevada |
At September 30, 2012, no amounts were due from Barrick Gold Exploration Inc. (“Barrick”). At December 31, 2011, the Company had an amount receivable of $6,537 (US$6,428), for recoverable salaries and expenses, from Barrick pursuant to the Spring Valley exploration option and joint venture agreement, which was subsequently paid.
The Company assumed a mineral lease agreement in April 2007, with Newark Valley Mining Corp. (“NVMC”) (formerly Gold Standard Royalty Corporation (“GSRC”) and earlier the Lyle Campbell Trust) for a 100% interest in the Pan property. The Company must pay an advance minimum royalty of the greater of US$60,000 or the US dollar equivalent of 174 ounces of gold valued by the average of the London afternoon fixing for the third calendar quarter proceeding January 1 of the year in which the payment is due. The minimum advance royalties will be creditable against a sliding scale NSR production royalty of between 2.5% and 4%. On January 1, 2012, the Company paid $295,428 (US$296,169). The Company must incur a minimum of US$65,000 per year for work expenditures, including claim maintenance fees, during the term of the mining lease.
| (d) | Gold Rock property, Nevada |
The Company assumed the mineral lease agreement in April 2007, with NVMC for a 100% interest in the Gold Rock property. Annually the Company must pay an advance minimum royalty of the greater of US$60,000 or the US dollar equivalent of 108.05 ounces of gold valued by the average of the London afternoon fixing for the third calendar quarter proceeding January 1 of the year in which the payment is due. The minimum advance royalties will be creditable against a sliding scale NSR production royalty of between 2.5% and 4%. On January 1, 2012 the Company paid $183,454 (US$183,914). The Company must incur a minimum of US$75,000 per year for work expenditures, including claim maintenance fees, during the term of the mining lease.
| (e) | Golden Eagle property, Washington |
The Company purchased a 75% interest in the Golden Eagle, Washington project from Kinross Gold USA Inc. (“Kinross”) in August 2008, at a cost of $1,537,950 (US$1,500,000) and purchased a 25% interest in the Golden Eagle project from Hecla Limited at a cost of $500,200 (US$483,333). Kinross retained a 2% NSR royalty and should the Company elect in the future to toll mill ore from the Golden Eagle property, Kinross has a first right of refusal to toll mill ore at their Kettle River Mill.
The Company is required to post bonds with the Bureau of Land Management (“BLM”) for reclamation of planned mineral exploration programs work associated with the Company’s mineral properties located in the United States. For the Company’s mineral properties that are being actively explored under funding arrangement agreements, the funding partners are responsible for bonding for the surface disturbance created by the exploration programs funded by each of them on those projects.
At September 30, 2012 the Company had posted a total of $843,077 reclamation deposits compared to $603,062 at December 31, 2011.
| (a) | The Company is authorized to issue an unlimited number of common shares. |
| (i) | During 1996, the Company issued 420,000 common shares at $0.25 per share by way of a non-brokered private placement for proceeds of $98,722 net of issue costs. In addition the Company issued 280,000 flow-through common shares at $0.25 per share by way of a non-brokered private placement for proceeds of $70,000. |
| (ii) | During 1997, the Company completed an initial public offering of 2,000,000 common shares at $0.35 per share for proceeds of $590,570, net of issue costs. In connection with this offering, the Company’s agent received a selling commission of 10% or $0.035 per share and was issued 25,000 shares as a corporate finance fee. |
| (iii) | During 1997, the Company issued 1,000,000 units at $2.50 per unit by way of a private placement for proceeds of $2,253,793 net of issue costs. Each unit consisted of one common share and one non-transferable share purchase to purchase one additional common share at $3.00 per share until February 14, 1998. The proceeds of the financing of $2,500,000 were allocated $2,178,761 as to the common shares and $321,239 as to the warrants. During 1998 100,000 of the warrants were exercised and 900,000 expired. In connection with this private placement, the Company’s agent received a selling commission of 7.5% of the proceeds of the units sold or $0.1875 per unit and a corporate finance fee of $15,000. |
| (iv) | During 1997, the Company issued 750,000 common shares as performance shares for proceeds of $7,500 that were held in escrow in accordance with the rules of the regulatory authorities of British Columbia. The shares were released 25% in each of 1998, 1999, 2000 and 2001. |
| (v) | During 1997, pursuant to an equity participation agreement to acquire an interest in Gemstone Mining Inc. (“Gemstone”), a Utah Corporation that by agreement the creditors of Gemstone were issued 1,000,000 units of the Company on conversion of a debt of $2,065,500 (US$1,500,000). Each unit consisted of one common share and one non-transferable share purchase to purchase one additional common share at US$2.00 per share that was immediately exercised for proceeds of $2,803,205 (US$2,000,000). The first one-third tranche of a conditional finders’ fee was satisfied by the issue of 150,000 common shares in connection with the acquisition of Gemstone. |
| (vi) | During 1998, the Company issued 100,000 common shares pursuant to the exercise of share purchase warrants for proceeds of $300,000. |
| (vii) | During 1998, the Company issued 200,000 common shares in connection with the acquisition of Gemstone as well as the second tranche of finder’s fee in connection with that acquisition. The Company’s option to acquire Gemstone expired on January 31, 1998 and the remaining one-third tranche were not issued. |
| (viii) | During 1999, the Company consolidated its issued share capital on a two old for one new basis and changed its name from Neary Resources Corporation to Red Emerald Resource Corp. |
| (ix) | During 2002, the Company issued 3,500,000 units at $0.25 per unit for proceeds of $875,000 by way of a short form offering document under the policies of the TSX Venture Exchange. Each unit consists of one common share and one common share purchase warrant that entitled the holder to purchase one additional common share at $0.25 per share until October 19, 2002. The Company also issued 150,000 common shares as a finance fee in connection with this offering, and issued the agent 875,000 share purchase warrants exercisable at $0.25 per share until April 19, 2004. During 2002 the Company issued 1,134,500 special warrants at $1.25 per special warrant for proceeds of $1,418,125. Each Special Warrant automatically converted to a unit comprising one common share and one share purchase warrant that entitled the holder to purchase one additional common share at $1.55 per share until November 6, 2003. The proceeds of the financing of $1,418,125 were allocated on a relative fair value basis as $1,171,286 to common shares and $246,839 as to the warrants. During 2003 all of the warrants expired unexercised. In connection with the offering the Company paid the agent a 10% commission totaling $113,450, issued the agent 40,000 common shares as a finance fee in connection with this offering, and issued the agent 170,175 share purchase warrant exercisable at $1.55 per share until July 5, 2003. |
| (x) | During 2002, the Company issued 4,028,000 common shares pursuant to the exercise of share purchase warrants for proceeds of $1,007,000. |
| (xi) | During 2002, the Company issued 32,000 common shares pursuant to the exercise of stock options for proceeds of $12,800. |
| (xii) | During 2002, the Company issued 31,250 common shares as additional consideration to a director who loaned the Company $780,000 bearing interest at 12% per annum. The loan and interest was repaid prior to December 31, 2002. |
| (xiii) | During 2002, the Company acquired Rex Exploration Corp. (“Rex”) in exchange for 4,500,000 common shares of the Company. |
| (xiv) | During 2003, the Company issued 700,000 units at $1.20 per unit for proceeds of $840,000 by way of a non-brokered private placement. Each unit consists of one common share and one share purchase warrant that entitled the holder to purchase one additional common share at $1.50 until May 25, 2004. The proceeds of the financing of $840,000 were allocated $638,838 as to common shares and $201,162 as to the warrants. During 2004 161,000 of the warrants were exercised and 539,000 expired. Share issue expenses were $19,932. |
| (xv) | During 2003, the Company issued 294,500 common shares pursuant to the exercise of share purchase warrants for proceeds of $73,625. |
| (xvi) | In January 2004, the Company issued 400,000 units at $2.00 per unit for proceeds of $800,000 by way of a private placement. Each unit consisted of one common share and one non-transferable share purchase warrant that entitled the holder to purchase one additional common share at $2.35 per share for a six month period. The proceeds of the financing of $800,000 were allocated on a relative fair value basis as $624,593 to common shares and $175,407 as to the warrants. All of the warrants expired unexercised in 2004. The Company issued 40,000 common shares as a finder’s fee for this private placement. |
| (xvii) | In August 2004, the Company issued 1,020,000 units at $0.75 per unit for proceeds of $765,000 by way of a private placement. Each unit consisted of one common share and one non-transferable share purchase warrant that entitled the holder to purchase one additional common share at $0.80 per share until November 25, 2005. All of the warrants were subsequently exercised. The Company issued 55,650 common shares as a finder’s fee for this private placement. |
| (xviii) | In December 2004, the Company issued 700,000 units at $0.85 per unit for proceeds of $595,000 by way of a private placement. Each unit consisted of one common share and one non-transferable share purchase warrant that entitled the holder to purchase one additional common share at $1.00 per share until December 20, 2005. All of the warrants were subsequently exercised. The Company issued 18,750 common shares as a finder’s fee for this private placement. |
| (xix) | In February 2005, the Company issued 2,500,000 units at $0.85 per unit for proceeds of $2,125,000 by way of a private placement. Each unit consisted of one common share and one non-transferable share purchase warrant that entitled the holder to purchase one additional common share at $1.00 per share until February 16, 2006. The proceeds of the financing of $2,125,000 were allocated on a relative fair value basis as $1,598,457 to common shares and $526,543 as to warrants. There were 23,000 warrants exercised in fiscal year 2005 and the balance exercised in fiscal year 2006. The Company issued 75,800 common shares for $64,430 and paid $69,700 in cash as a finder’s fee and incurred $26,709 in additional issue costs for this private placement. |
| (xx) | In July 2005, the Company issued 1,000,000 units at $1.15 per unit for proceeds of $1,150,000 by way of a private placement. Each unit consisted of one common share and one-half non-transferable share purchase warrant that entitled the holder to purchase one additional common share at $1.15 per share until July 27, 2006. The proceeds of the financing of $1,150,000 were allocated on a relative fair value basis as $995,193 to common shares and $154,807 as to warrants. All of the warrants were exercised in fiscal year 2006. The Company incurred $15,560 in issue costs. |
| (xxi) | In August 2005, the Company issued 500,000 units at $1.40 per unit for proceeds of $700,000 by way of a private placement. Each unit consisted of one common share and one-half nontransferable share purchase warrant that entitled the holder to purchase one additional common share at $1.45 per share until November 22, 2006. The proceeds of the financing of $700,000 were allocated on a relative fair value basis as $608,015 to common shares and $91,985 as to warrants. All of the warrants were exercised in fiscal year 2006. The Company incurred $8,261 in issue costs. |
| (xxii) | In January 2006, the Company issued 40,000 common shares at a value of $88,000 pursuant to a purchase and sale agreement to purchase mining claims for the Spring Valley project. |
| (xxiii) | In May 2006, the Company issued 3,725,000 units at $1.80 per unit for proceeds of $6,705,000 by way of a private placement. Each unit consisted of one common share and one-half nontransferable share purchase warrant. Each whole warrant entitled the holder to purchase one additional common share at $2.70 per share until May 16, 2007. The proceeds of the financing of $6,705,000 were allocated on a relative fair value basis as $5,998,846 to common shares and $706,154 as to warrants. The Company incurred $65,216 in issue costs. By May 16, 2007 1,725,000 of the warrants were exercised and 137,500 expired unexercised. |
| (xxiv) | In November 2006, the Company issued 2,000,000 units at $2.50 per unit for proceeds of $5,000,000 by way of a private placement. Each unit consisted of one common share and one-half nontransferable share purchase warrant. Each whole warrant entitles the holder to purchase one additional common share at $3.00 per share until November 10, 2007. The proceeds of the financing of $2,000,000 were allocated on a relative fair value basis as $1,761,509 to common shares and $238,491 as to warrants. The Company paid $88,750 in finders’ fees and incurred $94,546 in issue costs for this private placement. By November 10, 2007 908,782 of the warrants were exercised and 91,218 expired unexercised. |
| (xxv) | On April 16, 2007, the Company issued 7,764,109 common shares at a value of $25,000,431, 308,000 stock options at a value of $608,020 and 870,323 share purchase warrants at a value of $1,420,054 in connection with the acquisition of Pan-Nevada Gold Corporation. By December 31, 2007, 154,000 of the stock options had been exercised and 761,823 share purchase warrants had been exercised. By December 31, 2008 the remaining 108,500 share purchase warrants were exercised and 84,000 stock options had been exercised. On October 11, 2008 the final 70,000 stock options expired not exercised. |
| (xxvi) | On August 24, 2007, the Company issued 2,000,000 common shares at $2.70 per common share for proceeds of $5,400,000 by way of a private placement. The Company incurred $28,000 in share issue costs. |
| (xxvii) | On March 31, 2008, the Company issued 30,000 common shares at a value of $88,500 pursuant to a lease assignment of mining claims for the Gold Rock project. The Company incurred $1,489 in share issue costs. |
| (xxviii) | On June 12, 2008, the Company issued 1,421,500 common shares at $2.00 per common share for proceeds of $2,843,000 by way of a private placement. The Company incurred $75,371 in share issue costs. |
| (xxix) | On August 1, 2008 the Company issued 600,000 common shares at US$2.50 per common share for proceeds of $1,537,950 (US$1,500,000) by way of a private placement with Kinross Gold USA Inc. The Company incurred $39,450 in share issue costs. |
| (xxx) | On November 12, 2008 the Company issued 12,500,000 units at $0.22 per unit for proceeds of $2,750,000 by way of a private placement. Each unit consisted of one common share and one share purchase warrant. Each warrant entitles the holder to purchase one additional common share at $0.28 per share until May 12, 2009. The proceeds of the financing of $2,750,000 were allocated on a relative fair value basis as $1,793,491 to common shares and $956,509 as to warrants. The Company incurred $23,395 in issue costs for this private placement. In the year ended December 31, 2009 all of the 12,500,000 warrants were exercised for proceeds of $3,500,000. |
| (xxxi) | In addition to the 84,000 stock options reported exercised in paragraph xxv, during 2008, the Company issued a further 395,000 common shares pursuant to the exercise of stock options for proceeds of $613,250. |
| (xxxii) | During 2009, the Company issued 33,333 common shares pursuant to the exercise of stock options for proceeds of $21,651. |
| (xxxiii) | On April 9, 2010, the Company issued 1,333,000 units at $0.60 per unit for proceeds of $800,000 by way of a private placement. Each unit consisted of one common share and one share purchase warrant. Each warrant entitles the holder to purchase one additional common share until October 9, 2011 at an exercise price as follows: $0.70 if exercised on or before October 9, 2010; $0.80 if exercised after October 9, 2010 but on or before April 9, 2011; and $0.90 if exercised after April 9, 2011 but on or before October 9, 2011. The proceeds of the financing of $800,000 were allocated on a relative fair value basis as $514,365 to common shares and $285,635 as to warrants. The Company incurred $95,529 in issue costs for this private placement. |
| (xxxiv) | On June 16, 2010, the Company issued 11,078,666 units at $0.60 per unit for proceeds of $6,647,199 by way of a brokered offering in Canada and a non-brokered offering in the United States. Each unit consisted of one common share and one-half share purchase warrant. Each whole warrant entitled the holder to purchase one additional common share until June 16, 2012 at an exercise price of $0.80. The proceeds of the financing of $6,647,199 were allocated on a relative fair value basis as $5,142,202 to common shares and $1,504,997 as to warrants. The Company issued 658,840 agent’s warrants which entitle the holder to purchase one common share until June 16, 2010 at an exercise price of $0.80. These warrants were recorded at the estimated fair value at the issue date of $212,109.The fair value of warrants was determined using a risk free interest rate of 1.82%, an expected volatility of 131%, an expected life of 2 years, and zero dividends for a fair value per warrant of $0.32. In addition, the Company paid finders’ fees in the amount of $395,304 and incurred other cash share issue costs of $307,553. |
| (xxxv) | In September 2010, the Company issued 12,500 common shares pursuant to the exercise of share purchase warrants for proceeds of $10,000. |
| (xxxvi) | In November 2010, the Company closed a public offering and the Company issued 6,660,000 units at US$0.60 per unit, each unit comprising one common share and one half of one non-transferable common share purchase warrant. Each whole warrant entitles the holder to purchase one common share of the Company at a price of US$0.90 per share until November 12, 2012, subject to acceleration provisions. The proceeds of the financing of $4,070,725 were allocated first to the fair value of the warrants at $918,870 with the residual amount of $3,151,855 to common shares. |
The Company incurred $176,288 in issue costs and paid $244,244 to the agent as commission for this public offering. On February 9, 2011, the Company gave notice to the Warrant holders that it accelerated the expiry date of the warrants to March 14, 2011 and by that date 2,650,000 warrants were exercised and 680,000 warrants expired unexercised.
| (xxxvii) | On June 6, 2011, the Company issued 7,500,000 common shares upon the close of a “bought deal” public offering for US$1.60 per share. Gross proceeds on the purchase were $11,742,000 (US$12,000,000). The Company incurred $151,839 in issue costs and paid the agent $587,100 (US$600,000) as a commission for this public offering. |
| (xxxviii) | On September 23, 2011, the Company announced that it had established an "At-the-Market" ("ATM") issuance program under which it may sell up to a maximum of 6,000,000 of its common shares. The ATM issuance program is available to the Company on an as needed basis. Subject to market conditions and funding requirements, the Company may, at its discretion, from time to time sell all, some, or none of the reserved shares during the term of the ATM program. Any common shares issued under the ATM program will be sold through ATM issuances in the United States. No ATM issuances will be made through the facilities of any Canadian securities exchange. Any ATM issuances will be made at market prices prevailing at the time of the sale and, as a result, prices may vary. During the nine months ended September 30, 2012, the Company issued 69,110 shares pursuant to the ATM program. As of September 30, 2012, the Company has issued a total of 637,736 shares and received net proceeds of $1,554,957 pursuant to the ATM program. |
| (xxxix) | In July 2012, the Company closed a public offering and issued 12,261,562 units at US$1.28 per unit, each unit comprising one common share and one half of one non-transferable common share purchase warrant. Each whole warrant entitles the holder to purchase one common share of the Company at a price of US$1.85 per share for a period of 18 months following the closing of the public offering, subject to acceleration provisions. The gross proceeds of the financing of US$15,694,799 were allocated first to the fair value of the warrants at US$2,616,006 with the residual amount of US$13,725,687 to common shares. The Company incurred $1,419,817 in issue costs and paid $244,244 to the agent as commission for this public offering. |
| (xl) | During the nine months ended September 30, 2012, the Company issued 1,533,650 common shares pursuant to the exercise of share purchase warrants. Proceeds received on the 1,533,650 common shares issued totalled $1,226,920. |
Additionally, during the nine months ended September 30, 2012, the Company issued 317,501 common shares pursuant to the exercise of employee stock options. Proceeds received on the options exercised totalled $186,486.
The Company has an incentive stock option plan (the “Plan”) that allows it to grant incentive stock options to its officers, directors, employees and consultants. The Plan was amended on May 12, 2008 to add an appendix called the 2008 Stock Incentive Plan for United States Resident Employees (the “U.S. Plan”) to supplement and be a part of the Plan. The purpose of the U.S. Plan is to enable the Company to grant incentive stock options, as that term is defined under Section 422 of the Internal Revenue Code of 1986, as amended from time to time, and any regulations promulgated thereunder to qualifying employees who are citizens or residents of the United States of America. This does not change the aggregate number of options that can be granted pursuant to the Plan.
The purpose of the Plan permits the Company’s directors to grant incentive stock options for the purchase of shares of the Company to persons in consideration for services. Stock options must be non-transferable and the aggregate number of shares that may be reserved for issuance pursuant to stock options may not exceed 10% of the issued shares of the Company at the time of granting and may not exceed 5% to any individual (maximum of 2% to any consultant). The exercise price of stock options is determined by the board of directors of the Company at the time of grant and may not be less than the closing price of the Company’s shares on the trading day immediatelypreceding the date on which the option is granted and publicly announced, less an applicable discount, and may not otherwise be less than $0.10 per share. Options have a maximum term of ten years and terminate 90 days following the termination of the optionee’s employment, except in the case of death or disability, in which case they terminate one year after the event.
The fair value of each option award is estimated on the date of grant using the Black-Scholes option pricing model. The option pricing model requires the input of subjective assumptions which are based on several different criteria. Expected volatility is based on the historical price volatility of the Company’s common stock. Expected dividend yield is assumed to be nil, as the Company has not paid dividends since inception. Based on historical experience, forfeitures and cancellations are not significant. The expected life is estimated in accordance with SEC Staff Accounting Bulletin No. 107, “Share-Based Payment” for “plain vanilla” options. Risk free interest rates are based on U.S. government obligations with a term approximating the expected life of the option.
The Company recorded stock-based compensation expense, net of forfeitures, of $1,477,501 in the nine months ended September 30, 2012 compared to $826,792 for the nine months ended September 30, 2011 and $331,677 in the three months ended September 30, 2012 compared to $87,313 for the three months ended September 31, 2011. For options vesting during the nine months ended September 30, 2012 and 2011, $1,234,527 and $692,258 was included in salaries and benefits in the statement of operations, respectively, $188,023 and $96,499 was included in salaries and labor in the schedule of mineral exploration expenditures and $54,952 and $38,036 was included in consulting in the statement of operations for non-employee stock-based compensation. For options vesting during the three months ended September 30, 2012 and 2011, $331,677 and $56,571 was included in salaries and benefits in the statement of operations, respectively, $83,408 and $20,426 was included in salaries and labor in the schedule of mineral exploration expenditures and $72,488 and $9,866 was included in consulting in the statement of operations for non-employee stock-based compensation. The estimated unrecognized compensation cost from unvested options as of September 30, 2012 was approximately $648,579, which is expected to be recognized over the remaining vesting period of 1.0 years.
The weighted-average grant date fair value of options granted was $1.33 per option during the nine months ended September 30, 2012 and $0.81 for the comparable period in 2011. The weighted average grant date fair value of options vested was $0.85 per option during the nine months ended September 30, 2012 and $0.66 for the comparable period in 2011.
The following table summarizes activity for compensatory stock options during the nine months ended September 30, 2012:
| | | Number of
Shares | | | Weighted
Average
Exercise
Price | | | Aggregate
Intrinsic Value | | | Number of
Shares
Exercisable | |
| Outstanding, January 1, 2012 | | | 8,881,668 | | | $ | 1.36 | | | $ | 6,318,733 | | | | 6,933,329 | |
| Granted | | | 250,000 | | | | 1.89 | | | | - | | | | - | |
| Exercised | | | (317,501 | ) | | | 0.59 | | | | 92,292 | | | | - | |
| Cancelled | | | (478,333 | ) | | | 2.69 | | | | - | | | | - | |
| Outstanding, September 30, 2012 | | | 8,335,834 | | | $ | 1.33 | | | $ | 4,052,201 | | | | 6,850,831 | |
The following table summarizes information about outstanding compensatory stock options as of September 30, 2012:
| | | Options Outstanding | | | Options Exercisable | |
| Exercise Prices | | Number of
Shares | | | Remaining
Contractual Life
(in years) | | | Weighted
Average
Exercise
Price | | | Number
Exercisable | | | Weighted
Average
Exercise Price | | | Aggregate
Intrinsic Value | |
| $0.40 - $1.00 | | | 4,554,167 | | | | 2.4 | | | $ | 0.71 | | | | 4,402,500 | | | $ | 2.37 | | | $ | 3,898,783 | |
| $1.01 - $1.60 | | | 216,667 | | | | 3.6 | | | | 1.53 | | | | 133,334 | | | | 3.65 | | | | 8,667 | |
| $1.61 - $2.20 | | | 3,450,000 | | | | 3.7 | | | | 2.07 | | | | 2,216,664 | | | | 3.50 | | | | - | |
| $2.21 - $2.80 | | | 50,000 | | | | 3.9 | | | | 2.34 | | | | 33,333 | | | | 3.87 | | | | - | |
| $2.81 - $3.36 | | | 65,000 | | | | 0.1 | | | | 3.35 | | | | 65,000 | | | | 0.11 | | | | - | |
| | | | 8,335,834 | | | | 3.0 | | | $ | 1.33 | | | | 6,850,831 | | | $ | 2.75 | | | $ | 3,907,450 | |
| d) | Share purchase warrants: |
On July 6, 2012 the Company issued 6,130,781 warrants as part of a unit by way of a public offering. Each warrant entitles the holder to purchase one additional common share at US$1.85 per share until December 6, 2013 subject to acceleration provisions. ASC US GAAP requires the value of share purchase warrants issued with an exercise price denominated in a currency other than the Company’s Canadian dollar functional currency to be considered as a liability and this liability is stated at fair value each reporting period. The Company recorded a fair value of $2,616,006 to warrant liability on July 6, 2012, calculated using the Black-Scholes option pricing model with the following assumptions: expected life of 18 months; volatility of 76%; no dividend yield; and a risk free interest rate of 0.29% and an exchange rate of 1.0186. On September 30, 2012, the fair value of the warrant liability was adjusted to $2,439,491, calculated using the following assumptions: expected life of 15.2 months; volatility of 65%; no dividend yield; and a risk free interest rate of 0.18% and an exchange rate of 0.9832.
A summary of the Company’s stock purchase warrants as of September 30, 2012 is presented below:
| | | Number of
Warrants | | | Weighted
Average
Exercise
Price | | | Remaining
Contractual
Life (in years) | |
| Balance, December 31, 2011 | | | 1,557,650 | | | $ | 0.80 | | | | 0.4 | |
| Issued | | | 6,130,781 | | | | 1.85 | | | | 1.3 | |
| Exercised | | | (1,533,650 | ) | | | 0.80 | | | | - | |
| Expired | | | (24,000 | ) | | | 0.80 | | | | - | |
| Balance, September 30, 2012 | | | 6,130,781 | | | $ | 1.85 | | | | 1.3 | |
Total outstanding warrants as of September 30, 2012 were 6,130,781. The exercise price on all warrants outstanding was $1.85 per share. The warrants are exercisable immediately upon issuance and expire eighteen months from the date of issuance.
The Company has obligations under operating leases for its corporate offices in Englewood, Colorado and Ely, Nevada and office equipment until 2014. Future minimum lease payments for non-cancellable leases with initial lease terms in excess of one year are included.
In addition, the Company has cancellable purchase obligations related to consulting service agreements until 2014.
| | | Fiscal Year | | | | |
| | | 2012 | | | 2013 | | | 2014 | | | Total | |
| Operating Lease obligations | | $ | 38,393 | | | $ | 157,106 | | | $ | 134,070 | | | $ | 329,569 | |
| Purchase obligations | | | 44,244 | | | | 63,908 | | | | - | | | | 108,152 | |
| Total | | $ | 82,637 | | | $ | 221,014 | | | $ | 134,070 | | | $ | 437,721 | |
| 11. | Related party transactions |
For the three and nine month periods ended September 30, 2011, the Company paid consulting fees of nil and $53,901, respectively to a company controlled by the former Chief Financial Officer of the Company for accounting and corporate compliance services. The Company’s former Chief Financial Officer resigned effective March 18, 2011, but, remained as Corporate Secretary until just prior to the Annual General Meeting on May 5, 2011.
On May 19, 2012, the Company entered into a consulting agreement with its former Chief Executive Officer for a term of twelve months. Under this agreement the former Chief Executive Officer will provide advisory services from time to time to the Company. For the three and nine month periods ended September 30, 2012, the Company paid consulting fees of $44,244 and $65,177, respectively, to the former Chief Executive Officer under this agreement. As of September 30, 2012 the remaining amount due under the agreement was $108,152.
Included in accounts payable and accrued liabilities, amounts payable to directors and officers at September 30, 2012 and December 31, 2011, were $15,927 and $12,761, respectively.
These transactions are in the normal course of operations and are measured at the exchange amount, which is the amount of consideration established and agreed to by the related parties.
In all material respects, the carrying amounts for the Company’s cash and cash equivalents, amounts receivable and accounts payable and accrued liabilities approximate their fair values due to the short term nature of these instruments. Investments at September 30, 2012 and December 31, 2011 are recorded at fair values (note 4).
| 13. | Supplemental disclosure with respect to cash flows |
The significant non-cash transactions for the three and nine month periods ended September 30, 2012 were nil.
The significant non-cash transactions for the three and nine month periods ended September 30, 2011, were nil and consisted of the transfer of $2,154,570 for the fair value of share purchase warrants exercised or expired from warrant liability to share capital, respectively.
The Company considers itself to operate in a single segment, being mineral exploration and development, with all of the Company’s long lived assets being located in the United States at September 30, 2012 and December 31, 2011.
| Item 2. | Management's Discussion and Analysis of Financial Condition and Results of Operations. |
You should read the following discussion and analysis of our financial condition and results of operations together with our financial statements and related notes appearing elsewhere in this Quarterly Report filed on Form 10-Q. This discussion and analysis contains forward-looking statements that involve risks, uncertainties and assumptions. Our actual results may differ materially from those anticipated in these forward-looking statements as a result of many factors, including, but not limited to, those set forth under the heading “Risk Factors and Uncertainties” in our Form 10-K filed with the SEC on March 9, 2012, and elsewhere in this report.
This discussion and analysis should be read in conjunction with the accompanying unaudited interim consolidated financial statements and related notes. The discussion and analysis of the financial condition and results of operations are based upon the unaudited interim consolidated financial statements, which have been prepared in accordance with accounting principles generally accepted in the United States. The preparation of financial statements in conformity with accounting principles generally accepted in the United States of America requires Midway to make estimates and assumptions that affect the reported amounts of assets and liabilities, disclosure of any contingent liabilities at the financial statement date and reported amounts of revenue and expenses during the reporting period. On an on-going basis Midway reviews its estimates and assumptions. The estimates were based on historical experience and other assumptions that Midway believes to be reasonable under the circumstances. Actual results are likely to differ from those estimates under different assumptions or conditions, but Midway does not believe such differences will materially affect our financial position or results of operations. Critical accounting policies, the policies Midway believes are most important to the presentation of its financial statements and require the most difficult, subjective and complex judgments, are outlined below in “Critical Accounting Policies,” and have not changed significantly.
Cautionary Note Regarding Forward-Looking Statements
In addition, certain statements made in this report may constitute “forward-looking statements”. These forward-looking statements involve known or unknown risks, uncertainties and other factors that may cause the actual results, performance, or achievements of Midway to be materially different from any future results, performance or achievements expressed or implied by the forward-looking statements. Such forward-looking statements include, without limitation, the statements regarding Midway’s strategy, future plans for production, future expenses and costs, future liquidity and capital resources, and estimates of mineralized material. Except for historical information, the matters set forth herein, which are forward-looking statements, involve certain risks and uncertainties that could cause actual results to differ. Potential risks and uncertainties include, but are not limited to, risks and uncertainties related to: our expected plans of operation to continue as a going concern; the establishment and estimates of mineral reserves and resources; the grade of mineral reserves and resources; anticipated expenditures and costs in our operations; planned exploration activities and the anticipated outcome of such exploration activities; plans and anticipated timing for obtaining permits and licenses for our properties; anticipated closure costs; anticipated liquidity to meet expected operating costs and capital requirements; estimates of environmental liabilities; our ability to obtain financing to fund our estimated expenditure and capital requirements; factors expected to impact our results of operations; the expected impact of the adoption of new accounting standards; and risks related to development, bonding, permitting, construction, other activities related to mine development; unexpected changes in business and economic conditions; significant increases or decreases in gold prices; changes in interest and currency exchange rates; metallurgy, processing, access, availability of materials, equipment, supplies and water; results of pending and future feasibility studies; joint venture relationships; political or economic instability, either globally or in the countries in which we operate; local and community impacts and issues; accidents and labor disputes; competitive factors, including competition for property acquisitions; availability of external financing at reasonable rates or at all and those additional risks as described under the heading “Risk Factors” in our Annual Report on Form 10-K as filed with the Securities and Exchange Commission on March 9, 2012. Forward-looking statements can be identified by terminology such as “may,” “will,” “should,” “expects,” “intends,” “plans,” “anticipates,” “believes,” “estimates,” “predicts,” “potential,” “continues” or the negative of these terms or other comparable terminology. Although Midway believes that the expectations reflected in the forward-looking statements contained herein are reasonable, it cannot guarantee future results, levels of activity, performance or achievements. Forward-looking statements are made based on management’s beliefs, estimates, and opinions on the date the statements are made, and Midway undertakes no obligation to update such forward-looking statements if these beliefs, estimates, and opinions should change, except as required by law.
Cautionary Note to U.S. Investors Regarding Reserve and Resource Estimates
The mineral estimates in this Form 10-Q have been prepared in accordance with the requirements of the securities laws in effect in Canada, which differ from the requirements of United States securities laws. The terms “mineral reserve”, “proven mineral reserve” and “probable mineral reserve” are Canadian mining terms as defined in accordance with Canadian National Instrument 43-101 – Standards of Disclosure for Mineral Projects (“NI 43-101”) and the Canadian Institute of Mining, Metallurgy and Petroleum (the “CIM”) - CIM Definition Standards on Mineral Resources and Mineral Reserves, adopted by the CIM Council, as amended. These definitions differ from the definitions in United States Securities and Exchange Commission (“SEC”) Industry Guide 7 under the United States Securities Act of 1933, as amended. Under SEC Industry Guide 7 standards, a “final” or “bankable” feasibility study is required to report reserves, the three-year historical average price is used in any reserve or cash flow analysis to designate reserves and the primary environmental analysis or report must be filed with the appropriate governmental authority.
In addition, the terms “mineral resource”, “measured mineral resource”, “indicated mineral resource” and “inferred mineral resource” are defined in and required to be disclosed by NI 43-101; however, these terms are not defined terms under SEC Industry Guide 7 and are normally not permitted to be used in reports and registration statements filed with the SEC. Investors are cautioned not to assume that any part or all of mineral deposits in these categories will ever be converted into reserves. “Inferred mineral resources” have a great amount of uncertainty as to their existence, and great uncertainty as to their economic and legal feasibility. It cannot be assumed that all or any part of an inferred mineral resource will ever be upgraded to a higher category. Under Canadian rules, estimates of inferred mineral resources may not form the basis of feasibility or pre-feasibility studies, except in rare cases.
Investors are cautioned not to assume that all or any part of an inferred mineral resource exists or is economically or legally mineable. Disclosure of “contained ounces” in a resource is permitted disclosure under Canadian regulations; however, the SEC normally only permits issuers to report mineralization that does not constitute “reserves” by SEC Industry Guide 7 standards as in place tonnage and grade without reference to unit measures.
Accordingly, information contained in this Quarterly Report on Form 10-Q and the documents incorporated by reference herein contain descriptions of our mineral deposits that may not be comparable to similar information made public by U.S. companies subject to the reporting and disclosure requirements under the United States federal securities laws and the rules and regulations thereunder.
Overview
Company Overview
Midway isa development stage company engaged in the acquisition, exploration, and, if warranted, development of gold and silver mineral properties in North America. Our mineral properties are located in Nevada and Washington. Our Pan project is in the development stage.The Tonopah, Spring Valley, Gold Rock and Golden Eagle gold properties are exploratory stage projects with identified gold mineralization. The Thunder Mountain project is an earlier stage gold and silver exploration project.
Business Strategy and Development
We are currentlyworking towards transitioning from a development stage company to a gold production company with plans to advance the Pan gold property located in White Pine County, Nevada through to production by the second half of 2014.
The map below shows the location of Midway’s properties located in Nevada, USA.
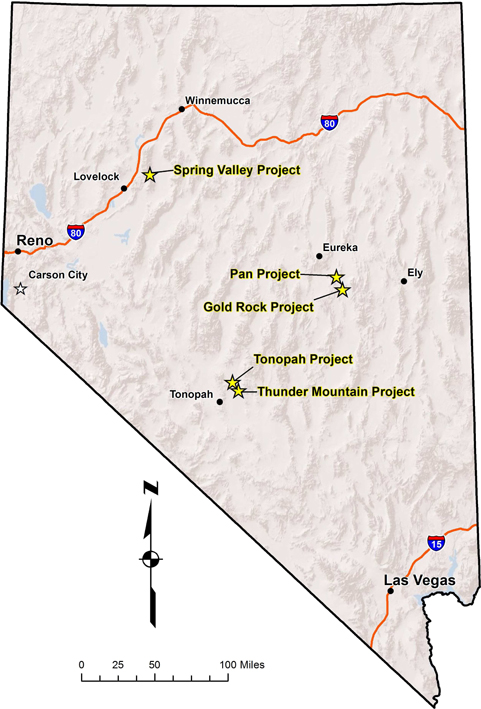
Highlights for the third quarter 2012:
| · | Pan project – An Environmental Impact Statement (“EIS”) is being prepared by the Bureau of Land Management (“BLM”) and cooperating agencies as part of the permitting process for a mining plan of operations submitted by Midway. |
| · | Spring Valley project – Assay results were received from drilling by Barrick conducted in the second quarter of fiscal year 2012. |
| · | Gold Rock project – Commenced the drilling program, designed to support production start-up in 2016. |
Pan Project, White Pine County, Nevada
The Pan property is located at the northern end of the Pancake mountain range in western White Pine County, Nevada, approximately 22 miles southeast of Eureka, Nevada, and 50 miles west of Ely, Nevada. Access is via a seven mile dirt road running south-southeast from US Highway 50, at a point about 17 miles southeast of Eureka, Nevada. Eureka has a population of about 2,000. Water is readily available from wells west of the property.In March 2011, we contracted a third party vendor to obtain permits to extend power lines to the property.
Highlights
Engineering and permitting activities continue to progress on schedule. Recent developments for the Pan project include:
| · | Completion of the scoping phase of the federal permitting process, including public meetings. Baseline studies are complete and JBR Environmental, a third-party consulting firm, is currently preparing a draft version of the Environmental Impact Statement (EIS). |
| · | Selection of Jacobs Engineering Group for front-end engineering of mine related infrastructure including project buildings, roads, electrical and water supply. |
| · | Acquisition of adequate water rights for mineral processing and completion of a production size water well and five monitor wells. |
| · | Completion of engineering for the heap leach pad and ponds by SRK Consulting. |
| · | Completion of engineering design and permitting for a new access road and selection of a contractor. |
| · | Selection of Summit Valley Technologies (SV), a division of FL Smidth, to provide gold recovery equipment for the processing plant. SV is a world-wide leader for supplying gold recovery equipment. |
| · | Ongoing large scale column tests to determine gold recovery amounts from larger size material which could reduce crushing requirements and lower capital costs. |
| · | Ongoing diamond drilling for crusher site characterization, reverse circulation drilling to test deep exploration targets, and follow-up condemnation drilling beneath proposed mine facilities. |
Mineral Reserves and Resources
Cautionary Note to U.S. Investors– In this Quarterly Report we use the terms “mineral resource”, “measured mineral resource”, “indicated mineral resource” and “inferred mineral resource”, which are geological and mining terms as defined in accordance with NI 43-101 under the guidelines adopted by CIM, as CIM Standards in Mineral Resources and Reserve Definition and Guidelines. U.S. investors in particular are advised to read carefully the definitions of these terms as well as the “Cautionary Note to U.S. Investors Regarding Reserve and Resource Estimates” above.
In October 2011, we reported an updated resource estimate for the Pan project based on results from 2011 drilling received to date. The updated measured and indicated resource estimate exceeds one million ounces of gold. The 1.13 million ounces of gold are contained in 37 million tonnes of 0.49 grams per tonne (gpt) gold in the Measured category and 43 million tonnes of 0.40 gpt gold in the Indicated category using a 0.14 gpt gold cutoff grade. The updated resource was prepared by Gustavson Associates, LLC (“Gustavson”). The mineral resources are summarized below.
Updated Resource Estimate, Pan Project, Nevada
| Measured Resource | |
| Cutoff (gpt) | | | Tonnes | | | Grade (gpt) | | | Gold ounces | |
| | 0.27 | | | | 27,352,000 | | | | 0.59 | | | | 520,000 | |
| | 0.21 | | | | 30,857,000 | | | | 0.55 | | | | 547,000 | |
| | 0.14 | | | | 36,920,000 | | | | 0.49 | | | | 579,000 | |
| | 0.07 | | | | 50,924,000 | | | | 0.38 | | | | 622,000 | |
| Indicated Resource | |
| Cutoff (gpt) | | | Tonnes | | | Grade (gpt) | | | Gold ounces | |
| | 0.27 | | | | 27,126,000 | | | | 0.52 | | | | 453,000 | |
| | 0.21 | | | | 32,652,000 | | | | 0.47 | | | | 495,000 | |
| | 0.14 | | | | 43,118,000 | | | | 0.40 | | | | 551,000 | |
| | 0.07 | | | | 73,925,000 | | | | 0.27 | | | | 645,000 | |
| Measured Plus Indicated Resource | |
| Cutoff (gpt) | | | Tonnes | | | Grade (gpt) | | | Gold ounces | |
| | 0.27 | | | | 54,478,000 | | | | 0.56 | | | | 974,000 | |
| | 0.21 | | | | 63,509,000 | | | | 0.51 | | | | 1,042,000 | |
| | 0.14 | | | | 80,037,000 | | | | 0.44 | | | | 1,130,000 | |
| | 0.07 | | | | 124,849,000 | | | | 0.32 | | | | 1,268,000 | |
| Inferred Resource | |
| Cutoff (gpt) | | | Tonnes | | | Grade (gpt) | | | Gold ounces | |
| | 0.27 | | | | 1,771,000 | | | | 0.58 | | | | 33,000 | |
| | 0.21 | | | | 2,229,000 | | | | 0.51 | | | | 37,000 | |
| | 0.14 | | | | 3,928,000 | | | | 0.36 | | | | 45,000 | |
| | 0.07 | | | | 9,693,000 | | | | 0.20 | | | | 63,000 | |
Note: The tonnage and total ounces of gold were determined from the statistical block model. Average grades were calculated from the tonnage and total ounces and then rounded to the significant digits shown. Calculations based on this table may differ due to the effect of rounding. See “Cautionary Note to U.S. Investors Regarding Reserve and Resource Estimates.”
On November 15, 2011, we announced completion of a Feasibility Study showing robust economics for the Pan project. Mineral reserves were based upon a design pit using Lerchs Grossmann generated pit surfaces that maximize revenue based on a $1,200 per ounce three-year trailing average price of gold. Cutoff grades of 0.21 gpt in the South pit and 0.27 gpt in the North & Central pits produced the project’s highest NPV.
Table 2: Total Pan Mineral Reserves, November 2011
Pit
Area | | Cutoff Grade
(grams/tonne) | | | Metric Tonnes
(x 1000) | | | Gold Grade
(grams/tonne) | | | Ounces Gold
(x 1000) | |
| | | | | | | | | | | | | |
| Proven |
| North & Central | | | 0.27 | | | | 13,085 | | | | 0.60 | | | | 251 | |
| South | | | 0.21 | | | | 12,160 | | | | 0.61 | | | | 236 | |
| All Pits | | | | | | | 25,245 | | | | 0.60 | | | | 487 | |
| | | | | | | | | | | | | | | | | |
| Probable |
| North & Central | | | 0.27 | | | | 10,994 | | | | 0.50 | | | | 178 | |
| South | | | 0.21 | | | | 12,073 | | | | 0.51 | | | | 199 | |
| All Pits | | | | | | | 23,067 | | | | 0.51 | | | | 377 | |
| | | | | | | | | | | | | | | | | |
| Proven plus Probable |
| North & Central | | | 0.27 | | | | 24,078 | | | | 0.55 | | | | 429 | |
| South | | | 0.21 | | | | 24,233 | | | | 0.56 | | | | 435 | |
| All Pits | | | | | | | 48,311 | | | | 0.56 | | | | 864 | |
Note: The tonnage and total ounces of gold were determined from the statistical block model. Average grades were calculated from the tonnage and total ounces and then rounded to the significant digits shown. Calculations based on this table may differ due to the effect of rounding.
We have determined that the Feasibility Study and the status of the project’s permitting meets the requirements to establish proven and probable reserves, as defined under SEC Industry Guide 7, and the proposed program for the property is developmental in nature.
Mining and Production
The Pan gold deposit contains mineralization at or near the surface and spatially distributed in a manner that is ideal for open pit mining methods. Gold grade distribution and the results of preliminary mineral processing testing indicate that ore from the Pan deposit can be processed by conventional heap leaching methods. The method of material transport evaluated for this study is open pit mining using a 21.6-yd3 front end shovel as the main loading unit with a 16-yd3 front end loader as a backup loading unit. The ore will be loaded into 150-ton haul trucks and transported to the primary jaw crusher, which will be set up at the mouth of the pit. The primary jaw crusher is a semi-mobile unit mounted on skids that will be moved to the mouth of whichever pit is being mined. The crushed ore material will be conveyed to the secondary crushing site, crushed to P80 ½-inch (North) and P80 1½-inch (South), agglomerated, and conveyed to the heap leach pad. The waste material will be loaded into the 150-ton haul trucks and hauled directly to the waste dump. The truck haul method was chosen over in-pit mobile crushers and mobile conveyors in order to simplify waste dump construction and allow for more flexibility in day to day mining activities.
Operating Costs
| Description | | US$
Per ton of ore | | | US$
Per oz of gold | |
| Mining | | | 2.78 | | | | 227.97 | |
| Processing | | | 2.58 | | | | 211.82 | |
| G&A | | | 0.37 | | | | 30.49 | |
| Production Taxes | | | 0.52 | | | | 42.99 | |
| Contingency – 10% | | | 0.29 | | | | 23.51 | |
| Total Operating Cost | | $ | 6.54 | | | $ | 536.78 | |
Initial Capital Costs
| Description | | US$ | |
| Construction and owner’s capital | | | 84.2 million | |
| Contingency (5%) | | | 6.8 million | |
| Working capital and inventory | | | 8.2 million | |
| Total | | $ | 99.2 million | |
Metallurgy and Processing
Material from the North and South Pan pits will be processed using conventional heap leaching methods. Ore from both pits will be crushed by the primary in-pit mobile jaw crusher and secondary and tertiary cone crushers to P80 ½-inch (North) and P80 ½-inch (South) prior to leaching. The fines will be agglomerated. Crush size and leach kinetics are based on current metallurgical testing. Additional testing for optimization is underway.
Barren solution will be distributed on the leach pad with drip tube emitters. Pregnant solution and storm water storage ponds are integral to the leach pad system. Pregnant solutions will be treated in an adsorption/desorption refining (ADR) plant using conventional unit processes.
The Feasibility Study was prepared to the standards of NI 43-101. The open pit Mineral reserves and resources were completed by Gustavson, with Terre Lane and Donald E. Hulse acting as the qualified persons.
We incurred $1,152,876 and $4,366,559 of Mineral Exploration Expenditures at the Pan project in the nine months ended September 30, 2012 and 2011, respectively. These expenditures were primarily for salaries and labor, which represented 60% of total expenditures during the nine months ended September 30, 2012. For the comparable period during 2011, expenditures were primarily for engineering and consulting, and drilling which represented 34% and 19% of the total expenditures for the Pan project, respectively. Beginning on January 1, 2012, we began to capitalize certain permitting and engineering activities as part of our plans to advance the Pan project to production and in the nine months ended September 30, 2012 we capitalized $4,224,020 of these costs as compared to nil for the comparable period in 2011 and $2,176,070 for the three months ended September 30, 2012 as compared to nil for the comparable period in 2011.
Tonopah Project, Nye County, Nevada
The Tonopah property is located in Nye County, Nevada, approximately 15 miles northeast of the town of Tonopah, 210 miles northwest of Las Vegas and 236 miles southeast of Reno. The property is over the northeastern flank of the San Antonio Mountains and in the Ralston Valley. Water for exploration purposes is available from water wells for a fee from municipal sources.Power is accessible from existing power lines crossing the property, however capacity is unknown and may be limited.
There was no activity on this project during the third quarter of 2012.
We incurred $222,603 and $1,493,695 of expenditures at the Tonopah project in the nine months ended September 30, 2012 and 2011, respectively. Salaries and wages, and property maintenance and taxes represented 39% and 33% of total expenditures during the nine months ended September 30, 2012. Drilling expenses for the comparable period in 2011 represented 54% of total expenditures. The Tonopah project is without known reserves, as defined under SEC Industry Guide 7, and the proposed program for the property is exploratory in nature.
Spring Valley Project, Pershing County, Nevada
The Spring Valley property is located in the Spring Valley Mining District, Pershing County, Nevada, approximately 20 miles northeast of the town of Lovelock. The property is accessed from Nevada State Highway 50, which extends eastward from US Interstate 80 and is paved to the Rochester turn-off; thereafter it is a dirt road. Water for exploration purposes is available from water wells drilled on the property under temporary grant of water rights. Power is accessible from existing power lines; however capacity is unknown and may be limited.
Gold has been intercepted over an area 5,200 feet long by 3,500 feet wide that extended to a depth of 1,400 feet, suggesting the presence of a large mineral system. The Spring Valley project is under an exploration and option to joint venture agreement with Barrick. Barrick is funding 100% of the costs to earn an interest in this project.Barrick spent $7.6 million (unaudited) in 2011. Barrick's total expenditure through the end of fiscal year 2011 of approximately $17.7 million exceeds the cumulative $16 million expenditure required. Barrick has informed Midway that it intends to conduct and fund an $11 million program in fiscal year 2012 that includes both exploration drilling and development work in preparation for an internal pre-feasibility study. Exploration will be focused on in-fill drilling in the north resource area and expansion drilling of the south resource area. The development work will include metallurgical, geotechnical and hydrological studies. This program exceeds the minimum required 2012 program.
Barrick provided us with results from second quarter 2012 drilling. During the quarter, Barrick completed 6,035 meters of reverse circulation and 2,970 meters of core drilling. Highlights of the drill intercepts include:
| · | 157 meters of 1.75 grams per tonne (gpt) gold in SV12-561c including 17.1 meters of 8.06 gpt |
| · | 144.9 meters of 1.65 gpt gold in SV12-565c including 1.5 meters of 113.52 gpt |
| · | 80.8 meters of 1.61 gpt gold in SV12-570 including 1.5 meters of 45.60 gpt gold |
| · | 30.5 meters of 1.20 gpt gold in SV12-568 including 1.5 meters of 8.33 gpt and |
| · | 13.7 meters of 5.38 gpt gold including 3.0 meters of 15.05 gpt and |
| · | 80.8 meters of 1.10 gpt gold including 1.5 meters of 5.21 gpt |
Other higher grade intercepts include
| · | 1.2 meters of 14.16 gpt gold in SV12-571c |
| · | 1.5 meters of 8.30 gpt gold in SV12-572c |
| · | 1.5 meters of 12.14 gpt gold in SV12-579 |
| · | 3.0 meters of 10.39 gpt gold in SV12-589 |
Development drilling is gathering metallurgical, hydrological and geotechnical data for a scoping-level economic evaluation. Hydrology studies are underway and geotechnical drilling will follow. A second round of metallurgical test work is expected to begin later this year.
Spring Valley has an estimated 2.16 million ounces of gold in the measured and indicated categories, consisting of 0.93 million ounces in the measured category and 1.23 million ounces in the indicated category at a cut-off grade of 0.14 grams per tonne (g/t). There is an additional inferred resource of 1.97 million ounces of gold at the same cut-off grade. The measured resource is contained within 59.0 million tonnes grading 0.49 g/t, the indicated resource is contained within 85.8 million tonnes grading 0.45 g/t and the inferred resource is contained within 103.9 million tonnes grading 0.59 g/t.
Measured and indicated resources are estimated pursuant to Canadian industry standards. See “Cautionary Note to U.S. Investors Regarding Reserve and Resource Estimates” above.The Spring Valley project is without known reserves, as defined under SEC Industry Guide 7, and the proposed program for the property is exploratory in nature.
Barrick is funding the majority of the ongoing costs of this project. In the nine months ended September 30, 2012 and 2011, we incurred $128,916 and $266,423, respectively, primarily to fund engineering and legal costs incurred on the portion of the Seymork land that falls outside of the area of interest under the Barrick joint venture agreement.
Gold Rock Project, White Pine County, Nevada
The Gold Rock property is situated in the eastern Pancake Range in western White Pine County, Nevada. The property is 8 miles southeast of our Pan project. Access is via the Green Springs road from US Highway 50 approximately 65 miles from Ely, Nevada. Water for exploration purposes is available from wells in the region under temporary grant of water rights. It is anticipated that power will be available from the line being extended to serve the nearby Pan Project.
An Environmental Assessment (EA) study for expanded drilling at Gold Rock has been completed and permits have been received. An amendment to the EA is currently in progress to add additional exploration targets.
A core rig and a reverse circulation (RC) rig are now operating on the property. The drilling program, designed to support production start-up in 2016, will consist of approximately 20,000 meters of core and RC drilling designed to significantly expand and upgrade the current Gold Rock resource. A new resource estimate will be included in a Preliminary Economic Assessment, which is scheduled for completion in the first quarter of 2013. In anticipation of mine permitting, two seasons of baseline biology and archeology fieldwork have been completed at Gold Rock. These data will be used in the environmental analyses of a mining Plan of Operations.
Gold Rock has an estimated 310,000 ounces (oz.) of gold in the indicated category and 331,000 oz. of gold in the inferred category. The indicated resource is contained in 12,968,000 tonnes at a grade of 0.74 grams per tonne (gpt) gold. The inferred resource is contained in 17,894,000 tonnes at a grade of 0.58 gpt gold. The gold resource appears to be open in all directions and represents a significant increase above the previously reported 344,700 oz. historic estimate.
Resource Estimate
Gold Rock Project, Nevada | |
| | | | Inferred Resource | | | Indicated Resource | |
| Cutoff (gpt) | | | Tonnes | | | Grade (gpt) | | | Gold ounces | | | Tonnes | | | Grade (gpt) | | | Gold ounces | |
| | 0.51 | | | | 7,866,000 | | | | 0.83 | | | | 211,000 | | | | 7,820,000 | | | | 0.98 | | | | 247,000 | |
| | 0.41 | | | | 10,857,000 | | | | 0.73 | | | | 255,000 | | | | 9,593,000 | | | | 0.89 | | | | 273,000 | |
| | 0.27 | | | | 17,894,000 | | | | 0.58 | | | | 331,000 | | | | 12,968,000 | | | | 0.74 | | | | 310,000 | |
| | 0.14 | | | | 30,460,000 | | | | 0.42 | | | | 409,000 | | | | 18,010,000 | | | | 0.59 | | | | 343,000 | |
Note: The tonnage and total ounces of gold were determined from the statistical block model. Average grades were calculated from the tonnage and total ounces and then rounded to the significant digits shown. Calculations based on this table may differ due to the effect of rounding. See “Cautionary Note to U.S. Investors Regarding Reserve and Resource Estimates.”
The indicated and inferred resource estimates include all data available through February, 2012, and were prepared by Gustavson, under the direction of Donald E. Hulse and Donald J. Baker, independent qualified persons.
We incurred $2,075,021 of expenditures at the Gold Rock project in the nine months ended September 30, 2012 of which 20% was related to drilling, 17% was for salaries and labor and 40% were the cost of engineering studies and environmental programs. For the comparable period in 2011, we incurred $926,491, of which 60% related to drilling. The Gold Rock project is without known reserves, as defined under SEC Industry Guide 7, and the proposed program for the property is exploratory in nature.
Thunder Mountain Project, Nye County, Nevada
Thunder Mountain is a gold and silver rich epithermal vein and disseminated gold system hosted in rhyolite tuffs and flow dome complexes located six miles southeast of the Tonopah project in Nye County, Nevada.
There was no activity on this project during the third quarter of 2012.
We incurred $501,417 of expenditures at the Thunder Mountain project in the nine months ended September 30, 2012 of which 35% was related to drilling and 22% related to salaries and wages. For the comparable period in 2011, we incurred $6,090 primarily for reclamation work around the project. The Thunder Mountain project is without known reserves, as defined under SEC Industry Guide 7, and the proposed program for the property is exploratory in nature.
Golden Eagle Project, Ferry County, Washington
The Golden Eagle property is located on private land in the Eureka (Republic) mining district in Ferry County,
Washington. The property is two miles northwest of the town of Republic, Washington and is accessed by the Knob Hill county road.
Engineering studies are continuing, including evaluations of methods for processing sulfide mineralization and issues related to permitting.
We incurred $82,444 and $225,252 of expenditures at the Golden Eagle project in the nine months ended September 30, 2012 and 2011, primarily for engineering studies. The Golden Eagle project is without known reserves, as defined under SEC Industry Guide 7, and the proposed program for the property is exploratory in nature.
Results of Operations
Three months ended September 30, 2012 compared to the three months ended September 30, 2011
The following table summarizes our results of operations for the three months ended September 30, 2012 compared to the three months ended September 30, 2011:
| | | Three Months
ended September
30, 2012 | | | Three Months
ended September
30, 2011 | | | Change | |
| | | | | | | | | | |
| Expenses | | | | | | | | | | | | |
| Consulting | | $ | 181,609 | | | $ | 53,731 | | | $ | 127,878 | |
| Depreciation | | | 116,899 | | | | 80,744 | | | | 36,155 | |
| Interest and bank charges | | | 958 | | | | 5,934 | | | | (4,976 | ) |
| Investor relations | | | 20,122 | | | | 18,857 | | | | 1,265 | |
| Legal, audit and accounting | | | 289,977 | | | | 279,134 | | | | 10,843 | |
| Management fees | | | - | | | | (3,066 | ) | | | 3,066 | |
| Mineral exploration expenditures (see schedule) | | | 1,929,882 | | | | 2,785,005 | | | | (855,123 | ) |
| Office and administration | | | 270,769 | | | | 200,737 | | | | 70,032 | |
| Salaries and benefits | | | 1,096,261 | | | | 724,721 | | | | 371,540 | |
| Transfer agent and filing fees | | | (9,073 | ) | | | 96,855 | | | | (105,928 | ) |
| Travel | | | 76,079 | | | | 52,984 | | | | 23,095 | |
| Operating loss | | | 3,973,483 | | | | 4,295,636 | | | | 322,153 | |
| | | | | | | | | | | | | |
| Other income (expense) | | | 225,931 | | | | 619,697 | | | | (393,766 | ) |
| Income tax recovery | | | 231,633 | | | | 422,000 | | | | 190,367 | |
| | | | | | | | | | | | | |
| Net loss | | $ | 3,515,919 | | | $ | 3,253,939 | | | $ | 261,980 | |
Significant differences between the periods are as follows:
Consulting expense during the three months ended September 30, 2012 was $181,609 compared to $53,731, an increase of $127,878. This was primarily due to a consulting arrangement with our former Chief Executive Officer which was entered into during the three months ended June 30, 2012. Further, the non-cash estimated fair value of stock based compensation for stock options granted to our former CEO is now a Consulting expense, as opposed to Salaries & Benefits prior to his consulting arrangement.
Depreciation expense during the three months ended September 30, 2012 was $116,899 compared to $80,744 during the comparable period of 2011, an increase of $36,155. This was primarily due to an increase of 60% in depreciable assets from the comparable period of 2011.
Exploration expenses for the three months ended September 30, 2012 decreased $855,123, or 31%, from the same period of 2011. Details of the expenses in each period may be found in the Schedule of Mineral Exploration Expenditures to the unaudited consolidated interim financial statements. Exploration levels are determined by the success of previous exploration programs on each project and cash available to fund additional programs. Exploration salaries and labor include the non-cash estimated fair value of stock based compensation for stock options granted to technical employees for the three months ended September 30, 2012 of $83,408 compared to $20,420 during the comparable period of 2011. Additionally,beginning on January 1, 2012, we began to capitalize certain permitting and engineering activities as part of our plans to advance the Pan project to production and for the three months ended September 30, 2012 we capitalized $2,176,070 of these costs as compared to nil for the comparable period in 2011.
Director’s fees, salaries and benefits during the three months ended September 30, 2012 were $1,096,261 compared to $724,721 during the comparable period of 2011, an increase of $371,540, or 51%. Director’s fees, salaries and benefits is inclusive of $175,782 of non-cash stock based compensation for the three months ended September 30, 2012 as compared to $56,571 for the comparable period of 2011, an increase of $119,211. We use an option pricing model to estimate the value of stock options granted to officers, directors, employees and consultants. We use the Black-Scholes model, which requires considerable judgment selecting the subjective assumptions that are critical to the results produced by the model, to calculate the estimated fair value. We record the estimated fair value as an expense on a pro-rata basis over the vesting period of the options. The increase in the cash component of salaries and benefits is attributable to a five employee increase within the Company from 29 to 34 as of September 30, 2011.
Transfer agent and filing fees for the three months ended September 30, 2012 decreased $150,928, from the same period of 2011. The decrease is primarily related to fees paid to the Nevada Bureau of Land Management during the three months ended September 30, 2011, that were not incurred during the comparable period in 2012.
Other income (expense) during the three months ended September 30, 2012 and 2011, was an income of $225,931 and $619,697, respectively, a net change of $393,766. This change was primarily due to a gain of $491,386 on the sale of property and equipment related to Seymork Investments Limited, which we recorded during the three months ended September 30, 2011. This was offset by the change in the fair value of our warrant liability of $176,515 we recorded during the three months ended September 30, 2012.
Income tax recovery for the three months ended September 30, 2012 decreased $190,367, or 45%, from the same period of 2011. The decrease is primarily related to an adjustment to the future income tax liability that is associated with the acquisition of the Pan-Nevada and Gold Rock projects.
Nine months ended September 30, 2012 compared to the nine months ended September 30, 2011
The following table summarizes our results of operations for the nine months ended September 30, 2012 compared to the nine months ended September 30, 2011:
| | | Nine months
ended September
30, 2012 | | | Nine months
ended September
30, 2011 | | | Change | |
| | | | | | | | | | |
| Expenses | | | | | | | | | | | | |
| Consulting | | $ | 285,484 | | | $ | 160,880 | | | $ | 124,604 | |
| Depreciation | | | 283,903 | | | | 108,164 | | | | 175,739 | |
| Interest and bank charges | | | 2,202 | | | | 16,903 | | | | (14,701 | ) |
| Investor relations | | | 99,913 | | | | 120,655 | | | | (20,742 | ) |
| Legal, audit and accounting | | | 727,999 | | | | 459,910 | | | | 268,089 | |
| Management fees | | | 8 | | | | (8,748 | ) | | | 8,756 | |
| Mineral exploration expenditures (see schedule) | | | 5,097,446 | | | | 7,319,020 | | | | (2,221,574 | ) |
| Office and administration | | | 646,332 | | | | 347,234 | | | | 299,098 | |
| Salaries and benefits | | | 3,284,169 | | | | 1,972,660 | | | | 1,311,509 | |
| Transfer agent and filing fees | | | 97,397 | | | | 207,347 | | | | (109,950 | ) |
| Travel | | | 223,839 | | | | 167,316 | | | | 56,523 | |
| Operating loss | | | 10,748,692 | | | | 10,871,341 | | | | (122,649 | ) |
| | | | | | | | | | | | | |
| Other income (expense) | | | (270,638 | ) | | | 146,138 | | | | (416,776 | ) |
| Income tax recovery | | | 203,772 | | | | 1,456,000 | | | | (1,252,228 | ) |
| | | | | | | | | | | | | |
| Net loss | | $ | 10,815,558 | | | $ | 9,269,203 | | | $ | 1,546,355 | |
Significant differences between the periods are as follows:
Consulting expense during the nine months ended September 30, 2012 was $285,484 compared to $160,880, an increase of $124,604. This was primarily due to a consulting arrangement with our former Chief Executive Officer that was entered into during the three months ended June 30, 2012. Further, the non-cash estimated fair value of stock based compensation for stock options granted to our former CEO is now a Consulting expense, as opposed to Salaries & Benefits prior to his consulting arrangement.
Depreciation expense during the nine months ended September 30, 2012 was $283,903 compared to $108,164 during the comparable period of 2011, an increase of $175,739. This was primarily due to a 60% increase in depreciable assets from the comparable period of 2011.
Legal, audit and accounting fees totaled $727,999 for the nine months ended September 30, 2012, an increase of $268,089 or 58% for the period. The increase primarily relates to an entity restructuring analysis for tax planning purposes and a full internal control re-evaluation, implementation and testing as required under the Sarbanes-Oxley Act.
Exploration expenses for the nine months ended September 30, 2012 decreased $2,221,574, or 30%, from the same period of 2011. Details of the expenses in each period may be found in the Schedule of Mineral Exploration Expenditures to the unaudited consolidated interim financial statements. Exploration levels are determined by the success of previous exploration programs on each project and cash available to fund additional programs. Exploration salaries and labor include the non-cash estimated fair value of stock based compensation for stock options granted to technical employees for the nine months ended September 30, 2012 of $188,023 compared to $96,499 during the comparable period of 2011. Additionally,beginning on January 1, 2012, we began to capitalize certain permitting and engineering activities as part of our plans to advance the Pan project to production and in the nine months ended September 30, 2012 we capitalized $4,224,020 of these costs as compared to nil for the comparable period in 2011.
Office and administration expenses for the nine months ended September 30, 2012 were $646,332 compared to $347,234 during the comparable period of 2011, an increase of $299,098 or 86%. This increase is primarily a result of additional overhead costs related to our increase in employees, as discussed further below.
Director’s fees, salaries and benefits during the nine months ended September 30, 2012 were $3,284,169 inclusive of $1,234,527 of non-cash stock based compensation, compared to $1,972,660 and $692,258 respectively, during the comparable period of 2011, an increase of $1,311,509. We use an option pricing model to estimate the value of stock options granted to officers, directors, employees and consultants. We use the Black-Scholes model, which requires considerable judgment selecting the subjective assumptions that are critical to the results produced by the model, to calculate the estimated fair value. We record the estimated fair value as an expense on a pro-rata basis over the vesting period of the options. The increase in the cash component of salaries and benefits is attributable to a five employee increase within the Company from 29 to 34 as of September 30, 2011.
Other income (expense) during the nine months ended September 30, 2012 was an expense of $270,638 compared to an income of $146,138 during the comparable period of 2011, a net change of $416,776. During the nine months ended September 30, 2012, we incurred costs in evaluating certain specific financing options that management had considered and, recorded a foreign exchange gain of $28,739, which combined was a decrease of $743,428 from the comparable period in 2011. This decrease was offset by a net increase of $768,541 from the change in the fair value of our warrant liability. In addition, during the nine months ended September 30, 2011 we recorded a gain of $491,386 on the sale of property and equipment related to Seymork Investments Limited.
Income tax recovery for the nine months ended September 30, 2012 decreased $1,252,228, or 86%, from the same period of 2011. The decrease is primarily related to an adjustment to the future income tax liability that is associated with the acquisition of the Pan-Nevada and Gold Rock projects.
Liquidity and Capital Resources
As of September 30, 2012, we had working capital of $9,715,619, consisting of current assets of $11,250,581 and current liabilities of $1,534,962. This represents an increase of $215,117 from the working capital balance of $9,500,502 as of December 31, 2011. Consistent with our plans, our working capital balance fluctuates as we use cash to fund our exploration, development activities and other operating expenses.
We have not generated revenues from operations. These consolidated financial statements have been prepared on the basis that the Company is a going concern, which contemplates the realization of its assets and the settlement of its liabilities in the normal course of operations. The continuation of the Company as a going concern is dependent upon the continued financial support from its shareholders, the ability of the Company to obtain necessary equity financing to continue operations, confirmation of our interests in the underlying properties, the attainment of profitable operations and/or realizing proceeds from the sale of one or more of our properties. As of September 30, 2012, the Company had an accumulated deficit of $88,528,271 and working capital of $9,715,619. On July 6, 2012, the Company closed a public offering for the aggregate gross proceeds of US$15,694,799. Management believes that the proceeds of the offering along with existing working capital is sufficient to fund ordinary operations through at least the subsequent twelve months. However we intend to raise additional capital through debt and/or equity placements as the opportunity presents itself.
We have historically relied on equity financings to fund our operations. From inception through September 30, 2012, we received $103,624,985 in cash, services, and other consideration through issuance of shares of our common stock. As of September 30, 2012, we did not have any outstanding debt.
Our most significant expenditures for the remainder of 2012 are expected to be costs associated with the development of our Pan project and further exploration of our other properties. We also continue to incur operating expenses approximating $720,000 per month for salaries and benefits (exclusive of non-cash stock-based compensation), professional fees, community relations, investor relations, travel and other overhead expenses at our Colorado executive offices and Ely, Nevada locations.
The balance of cash and equivalents as of September 30, 2012 increased to $10,931,300 from $10,191,069 as of December 31, 2011, a net increase in cash of $740,231. The increase was primarily the result of the Company closing a public offering on July 6, 2012 for the aggregate gross proceeds of US$15,594,799 offset by cash used to fund exploration activities and the development costs related to our Pan project.
Net cash used in operating activities was $8,725,172 during the nine months ended September 30, 2012 compared to $9,049,826 during the comparable period in 2011, a decrease of $324,653. Our use of operating cash during the 2012 period has shifted from exploration activities to development activities, consistent with ourplans to advance the Pan property through to production.
Net cash used in investing activities for the nine months ended September 30, 2012 was $6,167,719, compared to net cash used in investing activities of $1,333,688 for the nine months ended September 30, 2011. The majority of our exploration stage expenditures are recorded as an expense. However, we capitalize the acquisition cost of land and mineral rights and certain equipment that has alternative future uses or significant salvage value, including furniture and electronics, and the cost of these capitalized assets is reflected in our investing activities. Cash used during the nine months ended September 30, 2012 related to mineral property acquisition costs were $913,718. In addition, we also capitalize certain permitting and engineering activities as part of our plans to advance the Pan project to production. Cash used to advance the Pan project during the nine months ended September 30, 2012 was $4,224,020 and $780,861 for equipment purchases.
Net cash provided by financing activities for the nine months ended September 30, 2012 was $15,803,591, consisting primarily of proceeds from the public offering that closed on July 6, 2012 wherein 12,261,562 units were issued at US$1.28 per unit, with each unit comprising of one common share and one half of one non-transferable common share purchase warrant. These proceeds were partially offset by the related deferred share issuance costs of $1,419,817. During the comparable period in 2011, cash provided by financing activities was $18,312,506, consisting of proceeds from the sale of common shares.
Contractual Obligations
We have obligations under operating leases for its corporate offices in Englewood, Colorado and Ely, Nevada and office equipment until 2014. Future minimum lease payments for non-cancellable leases with initial lease terms in excess of one year are included.
In addition, we have purchase obligations related to consulting service agreements until 2014.
| | | Fiscal Year | | | | |
| | | 2012 | | | 2013 | | | 2014 | | | Total | |
| Operating Lease obligations | | $ | 38,393 | | | $ | 157,106 | | | $ | 134,070 | | | $ | 329,569 | |
| Purchase obligations | | | 44,244 | | | | 63,908 | | | | - | | | | 108,152 | |
| Total | | $ | 82,637 | | | $ | 221,014 | | | $ | 134,070 | | | $ | 437,721 | |
Off-balance sheet arrangements
There are no off balance sheet arrangements.
Inflation
We do not believe that inflation has had a significant impact on our consolidated results of operations or financial condition.
Environmental Compliance
Our current and future exploration and development activities, as well as our future mining and processing operations, are subject to various federal, state and local laws and regulations in the countries in which we conduct our activities. These laws and regulations govern the protection of the environment, prospecting, development, production, taxes, labor standards, occupational health, mine safety, toxic substances and other matters. We expect to be able to comply with those laws and do not believe that compliance will have a material adverse effect on our competitive position. We intend to obtain all licenses and permits required by all applicable regulatory agencies in connection with our mining operations and exploration activities. We intend to maintain standards of environmental compliance consistent with regulatory requirements.
Midway has an obligation to reclaim its properties after the surface has been disturbed by exploration methods at the site. As of September 30, 2012, we have accrued $15,818 compared to $7,805 at December 31, 2011 related to reclamation and other closure requirements at our properties. These liabilities are covered by a combination of surety bonds and restricted cash totaling $843,077 at September 30, 2012 as compared to $603,062 as of December 31, 2011. We have accrued as a current liability what management believes is the present value of our best estimate of the liabilities as of September 30, 2012; however, it is possible that our obligations may change in the near or long term depending on a number of factors.
Critical accounting policies
Critical accounting estimates used in the preparation of the financial statements include our estimate of recoverable value on our property, plant and equipment, site reclamation and rehabilitation as well as the value assigned to stock-based compensation expense. These estimates involve considerable judgment and are, or could be, affected by significant factors that are out of our control.
The factors affecting stock-based compensation include estimates of when stock options might be exercised and the stock price volatility. The timing for exercise of options is out of our control and will depend, among other things, upon a variety of factors including the market value of Midway shares and financial objectives of the holders of the options. We used historical data to determine volatility in accordance with Black-Scholes modeling, however the future volatility is inherently uncertain and the model has its limitations. While these estimates can have a material impact on the stock-based compensation expense and hence results of operations, there is no impact on our financial condition.
Midway’s recoverability evaluation of its mineral properties and equipment is based on market conditions for minerals, underlying mineral resources associated with the assets and future costs that may be required for ultimate realization through mining operations or by sale. Midway is in an industry that is exposed to a number of risks and uncertainties, including exploration risk, development risk, commodity price risk, operating risk, ownership and political risk, funding and currency risk, as well as environmental risk. Bearing these risks in mind, Midway has assumed recent world commodity prices will be achievable. We have considered the mineral resource reports by independent engineers on the Tonopah, Spring Valley, Pan and Golden Eagle projects in considering the recoverability of the carrying costs of the mineral properties. All of these assumptions are potentially subject to change and most are out of our control; however changes to the assumptions are not determinable. Accordingly, there is always the potential for a material adjustment to the value assigned to mineral properties and equipment.
Midway has an obligation to reclaim its properties after the surface has been disturbed by exploration methods at the site. As a result Midway has recorded a liability for the fair value of the reclamation costs it expects to incur. We estimated applicable inflation and credit-adjusted risk-free rates as well as expected reclamation time frames. To the extent that the estimated reclamation costs change, such changes will impact future reclamation expense recorded.
Related Party Transactions
For the three and nine month periods ended September 30, 2011, we paid consulting fees of nil and $53,901, respectively to a company controlled by the former Chief Financial Officer of the Company for accounting and corporate compliance services. Our former Chief Financial Officer resigned effective March 18, 2011, but, remained as Corporate Secretary until just prior to the Annual General Meeting on May 5, 2011.
On May 19, 2012, we entered into a consulting agreement with its former Chief Executive Officer for a term of twelve months. Under this agreement the former Chief Executive Officer will provide advisory services from time to time to the Company. For the three and nine month periods ended September 30, 2012, we paid consulting fees of $44,244 and $65,177, respectively, to the former Chief Executive Officer under this agreement. As of September 30, 2012 the remaining amount due under the agreement was $108,152.
Included in accounts payable and accrued liabilities, amounts payable to directors and officers at September 30, 2012 and December 31, 2011, were $15,927 and $12,761, respectively.
These transactions are in the normal course of operations and are measured at the exchange amount, which is the amount of consideration established and agreed to by the related parties.
| Item 3. | Quantitative and Qualitative Disclosures about Market Risk. |
None.
| Item 4. | Controls and Procedures. |
Disclosure Controls and Procedures
At the end of the period covered by this Quarterly Report on Form 10-Q for the three months ended September 30, 2012, an evaluation was carried out under the supervision of and with the participation of the Company's management, including the Chief Executive Officer ("CEO") and Chief Financial Officer ("CFO"), of the effectiveness of the design and operation of the Company's disclosure controls and procedures (as defined in Rule 13a-15(e) and Rule 15d-15(e) under the Securities Exchange Act of 1934, as amended (“Exchange Act”)). Based on that evaluation the CEO and the CFO have concluded that as of the end of the period covered by this report, the Company's disclosure controls and procedures are effective in ensuring that: (i) information required to be disclosed by the Company in reports that it files or submits to the SEC under the Exchange Act is recorded, processed, summarized and reported within the time periods specified in applicable rules and forms and (ii) material information required to be disclosed in our reports filed under the Exchange Act is accumulated and communicated to our management, including our CEO and CFO, as appropriate, to allow for accurate and timely decisions regarding required disclosure.
Changes in Internal Control over Financial Reporting
During the period covered by this report, there were no changes to internal control over financial reporting that materially affected or are reasonably likely to materially affect our internal control over financial reporting.
PART II - OTHER INFORMATION
| Item 1. | Legal Proceedings. |
None.
Item 1A. Risk Factors.
There are no material changes from the risk factors previously disclosed in Midway’s Annual Report on Form 10-K for the period ended December 31, 2011, as filed on March 9, 2012 with the SEC.
| Item 2. | Unregistered Sale of Equity Securities and Use of Proceeds. |
None.
| Item 3. | Defaults Upon Senior Securities. |
None.
| Item 4. | Mine Safety Disclosures. |
None.
| Item 5. | Other information. |
None.
Documents filed as part of this Quarterly Report on Form 10-Q or incorporated by reference:
| Exhibit Number | | Description |
| | | |
| 3.1 | | Notice of Articles,previously filed with the initial registration statement on Form S-1 filed with the Securities and Exchange Commission on August 6, 2007 and incorporated herein by reference. |
| | | |
| 3.2 | | Articles,previously filed with the initial registration statement on Form S-1 filed with the Securities and Exchange Commission on August 6, 2007 and incorporated herein by reference. |
| | | |
| 4.1 | | Warrant Indenture dated July 6, 2012, previously filed with the current report on Form 8-K filed with the Securities and Exchange Commission on July 6, 2012, and incorporated herein by reference. |
| | | |
| 31.1 | | Certification of Chief Executive Officer pursuant to Rule 13a-15(f) of the Exchange Act |
| | | |
| 31.2 | | Certification of Chief Financial Officer pursuant to Rule 13a-15(f) of the Exchange Act |
| | | |
| 32 | | Certification of Chief Executive Officer and Chief Financial Officer pursuant to Rule 13a or 15(d) of the Exchange Act and 18 U.S.C. Section 1350, as adopted pursuant to Section 906 of the Sarbanes-Oxley Act of 2002 |
SIGNATURES
Pursuant to requirements of the Securities Exchange Act of 1934, the Registrant has duly caused this report to be signed on its behalf by the undersigned thereunto duly authorized.
| | MIDWAY GOLD CORP. |
| | |
| November 9, 2012 | By: | /s/ Kenneth A. Brunk |
| | | Kenneth A. Brunk |
| | | Chairman, Chief Executive Officer President and |
| | | Director |
| | | (Principal Executive Officer) |
| | |
| November 9, 2012 | By: | /s/ Fritz K. Schaudies |
| | | Fritz K. Schaudies |
| | | Chief Financial Officer |
| | | (Principal Financial and Accounting Officer) |