UNITED STATES
SECURITIES AND EXCHANGE COMMISSION
Washington, D.C. 20549
FORM 10-Q
| x | | QUARTERLY REPORT PURSUANT TO SECTION 13 OR 15(d) OF THE SECURITIES EXCHANGE ACT OF 1934 |
| For the quarterly period ended March 31, 2013 |
| OR |
| ¨ | | TRANSITION REPORT PURSUANT TO SECTION 13 OR 15(d) OF THE SECURITIES EXCHANGE ACT OF 1934 |
For the transition period from to
Commission file number: 001-33894

MIDWAY GOLD CORP.
(Exact name of registrant as specified in its charter)
| British Columbia | | 98-0459178 |
| (State of other jurisdiction of incorporation or organization) | | (I.R.S. Employer Identification No.) |
| | | |
| Suite 280 – 8310 South Valley Highway | | |
| Englewood, Colorado | | 80112 |
| (Address of principal executive offices) | | (Zip Code) |
(720) 979-0900
(Registrant’s Telephone Number, including area code)
(Former name, former address and former fiscal year, if changed since last report)
Indicate by check mark whether the registrant (1) has filed all reports required to be filed by Section 13 or 15(d) of the Securities Exchange Act of 1934 during the preceding 12 months (or for such shorter period that the Registrant was required to file such reports), and (2) has been subject to the filing requirements for the past 90 days. x Yes¨ No
Indicate by check mark whether the registrant has submitted electronically and posted on its corporate Web site, if any, every Interactive Data File required to be submitted and posted pursuant to Rule 405 of Regulation S-T (§232.405 of this chapter) during the preceding 12 months (or for such shorter period that the registrant was required to submit and post such files). xYes¨ No
Indicate by check mark whether the registrant is a large accelerated filer, an accelerated filer, a non-accelerated filer or a smaller reporting company. See the definitions of “large accelerated filer” and “accelerated filer” and “smaller reporting company” in Rule 12b-2 of the Exchange Act (Check one):
Large accelerated filer¨ Accelerated filerx Non-accelerated filer¨ Smaller Reporting Company¨
Indicate by check mark whether the Registrant is a shell company (as defined in Rule 12b-2 of the Exchange Act)¨ Yesx No
Number of Common Shares outstanding at May 1, 2013:128,451,298
TABLE OF CONTENTS
| PART I – FINANCIAL INFORMATION | 4 |
| | |
| Item 1. | Financial Statements | 4 |
| Item 2. | Management's Discussion and Analysis of Financial Condition and Results of Operations | 30 |
| Item 3. | Quantitative and Qualitative Disclosures about Market Risk | 44 |
| Item 4. | Controls and Procedures | 44 |
| | | |
| PART II - OTHER INFORMATION | 45 |
| | |
| Item 1. | Legal Proceedings | 45 |
| Item 1A. | Risk Factors | 45 |
| Item 2. | Unregistered Sale of Equity Securities and Use of Proceeds | 45 |
| Item 3. | Defaults Upon Senior Securities | 45 |
| Item 4. | Mine Safety Disclosures | 45 |
| Item 5. | Other information | 45 |
| Item 6. | Exhibits | 46 |
| | | |
| SIGNATURES | 47 |
EXPLANATORY NOTE
All amounts in this interim report on Form 10-Q are expressed in Canadian dollars. Unless otherwise indicated, the United States dollar is denoted as “U.S.$.”
PART I – FINANCIAL INFORMATION
| Item1. | Financial Statements. |
MIDWAY GOLD CORP.
CONSOLIDATED INTERIM BALANCE SHEETS
(Expressed in Canadian dollars, except shares) (unaudited)
| | | March 31,
2013 | | | December 31,
2012 | |
| Assets | | | | | | | | |
| | | | | | | | | |
| Current assets: | | | | | | | | |
| Cash and cash equivalents | | $ | 70,255,117 | | | $ | 75,052,836 | |
| Amounts receivable | | | 28,064 | | | | 39,379 | |
| Prepaid expenses and other current assets | | | 510,436 | | | | 142,643 | |
| | | | 70,793,617 | | | | 75,234,858 | |
| | | | | | | | | |
| Investments (notes 4 and 5) | | | 10,000 | | | | 13,750 | |
| Reclamation deposits (note 8) | | | 871,597 | | | | 853,110 | |
| Property, equipment and mine development (note 6) | | | 8,955,523 | | | | 8,005,959 | |
| Mineral properties (note 7) | | | 51,265,426 | | | | 49,922,926 | |
| | | | | | | | | |
| | | $ | 131,896,163 | | | $ | 134,030,603 | |
| | | | | | | | | |
| Liabilities and stockholders’ equity | | | | | | | | |
| | | | | | | | | |
| Current liabilities: | | | | | | | | |
| Accounts payable and accrued liabilities (note 13) | | $ | 2,411,597 | | | $ | 1,710,674 | |
| Preferred stock dividends payable | | | 1,698,304 | | | | - | |
| Total current liabilities | | | 4,109,901 | | | | 1,710,674 | |
| | | | | | | | | |
| Long term liabilities: | | | | | | | | |
| Derivative liabilities (note 4) | | | 19,047,371 | | | | 28,496,516 | |
| Future income tax liability | | | 2,868,021 | | | | 3,172,512 | |
| Other long term liabilities | | | 47,764 | | | | - | |
| Total liabilities | | | 26,073,057 | | | | 33,379,702 | |
| | | | | | | | | |
Redeemable preferred stock (note 10)
Series A preferred shares - unlimited, no par value;
Issued and outstanding – 37,837,838 (2013 and 2012);
redemption price - U.S.$1.85 | | | 44,839,786 | | | | 44,261,122 | |
| | | | | | | | | |
| Stockholders’ equity (note 9): | | | | | | | | |
| Common stock authorized – unlimited, no par value Issued and outstanding – 128,451,298 (2013 and 2012) | | | 138,304,344 | | | | 138,304,344 | |
| Additional paid in capital | | | 9,710,082 | | | | 11,418,155 | |
| Accumulated other comprehensive income (loss) (note 11) | | | (12,282 | ) | | | (436,344 | ) |
| Deficit accumulated during exploration stage | | | (87,018,824 | ) | | | (92,896,376 | ) |
| | | | 60,983,320 | | | | 56,389,779 | |
| | | | | | | | | |
| | | $ | 131,896,163 | | | $ | 134,030,603 | |
Commitments (note 12)
Subsequent events (notes 8(b), 10 and 17)
The accompanying notes are an integral part of these unaudited consolidated interimfinancial statements.
MIDWAY GOLD CORP.
CONSOLIDATED INTERIM STATEMENTS OF OPERATIONS
(Expressed in Canadian dollars, except share and per share amounts) (unaudited)
| | | Three months
ended March 31,
2013 | | | Three months
ended March 31,
2012 | | | Cumulative period
from inception
(May 14,1996) to
March 31, 2013 | |
| Expenses | | | | | | | | | | | | |
| Consulting (note 13) | | $ | 218,456 | | | $ | 22,720 | | | $ | 1,714,848 | |
| Depreciation | | | 117,824 | | | | 83,710 | | | | 1,376,235 | |
| Gain on sale of subsidiary | | | - | | | | - | | | | (2,806,312 | ) |
| Interest and bank charges | | | 1,074 | | | | 661 | | | | 915,976 | |
| Investor relations | | | 5,553 | | | | 59,758 | | | | 1,505,543 | |
| Legal, audit and accounting | | | 972,136 | | | | 247,617 | | | | 5,690,277 | |
| Management fees | | | - | | | | (8 | ) | | | 210,778 | |
| Mineral exploration expenditures (Schedule) | | | 1,818,446 | | | | 1,034,261 | | | | 67,501,676 | |
| Mineral property interests written-off | | | - | | | | - | | | | 4,643,637 | |
| Mineral property interests recovered | | | - | | | | - | | | | (60,120 | ) |
| Office and administration | | | 240,957 | | | | 187,134 | | | | 3,029,215 | |
| Salaries and benefits | | | 1,444,227 | | | | 1,251,600 | | | | 19,686,945 | |
| Transfer agent and filing fees | | | 38,388 | | | | 37,675 | | | | 1,067,326 | |
| Travel | | | 70,988 | | | | 67,820 | | | | 1,611,869 | |
| Operating loss | | | 4,928,049 | | | | 2,992,948 | | | | 106,087,893 | |
| | | | | | | | | | | | | |
| Other income (expense): | | | | | | | | | | | | |
| Foreign exchange gain (loss) | | | 1,370,342 | | | | 49,265 | | | | 3,402,948 | |
| Gain (loss) on change in fair value of derivative liabilities | | | 9,448,970 | | | | - | | | | 6,799,028 | |
| Interest and investment income | | | 45,556 | | | | 14,675 | | | | 967,303 | |
| Gain (loss) on sale of equipment | | | - | | | | - | | | | 526,149 | |
| Gain (loss) on sale of investments | | | - | | | | - | | | | 44,077 | |
| Investment write down | | | - | | | | - | | | | (130,000 | ) |
| Unrealized gain (loss) on investments | | | - | | | | (2,257 | ) | | | (609,220 | ) |
| Other income | | | (3,893 | ) | | | (7,396 | ) | | | (430,232 | ) |
| | | | 10,860,975 | | | | 54,287 | | | | 10,570,053 | |
| | | | | | | | | | | | | |
| Net (income) loss before income tax | | | (5,932,926 | ) | | | 2,938,661 | | | | 95,517,840 | |
| Income tax recovery (expense) | | | (55,374 | ) | | | (133,732 | ) | | | 8,499,016 | |
| Net (income) loss | | $ | (5,877,552 | ) | | $ | 3,072,393 | | | $ | 87,018,824 | |
| | | | | | | | | | | | | |
| Preferred stock cumulative dividend | | | 1,419,732 | | | | - | | | | 1,698,304 | |
| Accretion of Redeemable preferred stock | | | 857,550 | | | | - | | | | 1,011,212 | |
| | | | | | | | | | | | | |
| Net (income) loss attributable to common shareholders | | $ | (3,600,270 | ) | | $ | 3,072,393 | | | $ | 89,728,340 | |
| | | | | | | | | | | | | |
| Net (income) loss per share (note 3) | | | | | | | | | | | | |
| Basic: | | | | | | | | | | | | |
| Weighted average number of shares outstanding | | | 128,451,298 | | | | 113,960,618 | | | | | |
| Net (income) loss per share | | $ | (0.03 | ) | | $ | 0.03 | | | | | |
| Diluted: | | | | | | | | | | | | |
| Weighted average number of shares outstanding | | | 166,289,136 | | | | 113,960,618 | | | | | |
| Net (income) loss per share | | $ | 0.02 | | | $ | 0.03 | | | | | |
The accompanying notes are an integral part of these unaudited consolidated interim financial statements.
MIDWAY GOLD CORP.
Consolidated INTERIM StatementS of COMPREHENSIVE Loss
(Expressed in Canadian dollars) (unaudited)
| | | Three Months ended
March 31, 2013 | | | Three Months ended
March 31, 2012 | |
| Net (income) loss for the period | | $ | (5,877,552 | ) | | $ | 3,072,393 | |
| Unrealized (gain) loss on investment (Note 5) | | | 3,750 | | | | (7,500 | ) |
| Currency Translation Adjustment | | | (427,812 | ) | | | (622,921 | ) |
| Comprehensive (income) loss | | $ | (6,301,614 | ) | | $ | 2,441,972 | |
The accompanying notes are an integral part of these unaudited consolidated interim financial statements.
MIDWAY GOLD CORP.
CONSOLIDATED INTERIM STATEMENTS OF CASH FLOWS
(Expressed in Canadian dollars) (unaudited)
| | | Three months
ended March 31,
2013 | | | Three months
ended March 31,
2012 | | | Cumulative period
from inception
(May 14,1996) to
March 31, 2013 | |
| Cash provided by (used in): | | | | | | | | | | | | |
| Operating activities: | | | | | | | | | | | | |
| Net income (loss) | | $ | 5,877,552 | | | $ | (3,072,393 | ) | | $ | (87,018,824 | ) |
| Items not involving cash: | | | | | | | | | | | | |
| Depreciation | | | 117,824 | | | | 83,710 | | | | 1,376,235 | |
| Stock-based compensation | | | 569,209 | | | | 695,107 | | | | 12,763,762 | |
| Unrealized foreign exchange loss (gain) | | | 64,711 | | | | (82,042 | ) | | | (1,598,175 | ) |
| Investment write down | | | - | | | | - | | | | 130,000 | |
| Unrealized (gain) loss on investment | | | - | | | | 2,257 | | | | 609,220 | |
| Non-cash interest expense | | | - | | | | - | | | | 234,765 | |
| (Gain) loss on change in derivative liabilities | | | (9,448,970 | ) | | | - | | | | (6,799,028 | ) |
| Other current assets written off | | | - | | | | - | | | | 218,044 | |
| Future income tax recovery | | | (369,202 | ) | | | 133,732 | | | | (8,923,592 | ) |
| Gain on sale of subsidiary | | | - | | | | - | | | | (2,806,312 | ) |
| Loss (gain) on sale of equipment | | | - | | | | - | | | | (526,149 | ) |
| Loss (gain) on sale of investments | | | - | | | | - | | | | (44,077 | ) |
| Mineral property interests written off | | | - | | | | - | | | | 4,643,637 | |
| Mineral property interest recovery | | | - | | | | - | | | | (60,120 | ) |
| Change in non-cash working capital items: | | | | | | | | | | | | |
| Amounts receivable | | | 11,409 | | | | (2,927 | ) | | | (10,051 | ) |
| Prepaid expenses | | | (362,445 | ) | | | (383,524 | ) | | | (476,983 | ) |
| Accounts payable and accrued liabilities | | | 669,424 | | | | 240,489 | | | | 2,509,874 | |
| | | | (2,870,488 | ) | | | (2,385,591 | ) | | | (85,777,774 | ) |
| Investment activities: | | | | | | | | | | | | |
| Proceeds on sale of subsidiary | | | - | | | | - | | | | 254,366 | |
| Proceeds on sale of equipment | | | - | | | | - | | | | 22,820 | |
| Proceeds on sale of mineral property | | | - | | | | - | | | | 1,339,002 | |
| Proceeds on sale of investments | | | - | | | | - | | | | 321,852 | |
| Mineral property acquisitions | | | (1,134,576 | ) | | | (618,758 | ) | | | (24,141,984 | ) |
| Deferred acquisition costs | | | - | | | | - | | | | (23,316 | ) |
| Purchase of property, equipment and mine development | | | (847,463 | ) | | | (914,246 | ) | | | (11,117,000 | ) |
| Reclamation deposit | | | (394 | ) | | | (7,241 | ) | | | (1,267,959 | ) |
| | | | (1,982,433 | ) | | | (1,540,245 | ) | | | (34,612,219 | ) |
| Financing activities: | | | | | | | | | | | | |
| Advance from Red Emerald Ltd. | | | - | | | | - | | | | 12,010,075 | |
| Common stock issued, net of issue costs | | | - | | | | 125,744 | | | | 103,849,381 | |
| Preferred shares issued, net of issue costs | | | - | | | | - | | | | 68,295,156 | |
| Promissory note | | | - | | | | - | | | | 2,000,000 | |
| Repayment of promissory note | | | - | | | | - | | | | (2,000,000 | ) |
| Convertible debenture | | | - | | | | - | | | | 6,324,605 | |
| | | | - | | | | 125,744 | | | | 190,479,217 | |
| Effect of exchange rate changes on cash: | | | 55,202 | | | | (41,450 | ) | | | 165,893 | |
| | | | | | | | | | | | | |
| Increase (decrease) in cash and cash equivalents | | | (4,797,719 | ) | | | (3,841,542 | ) | | | 70,255,117 | |
| Cash and cash equivalents, beginning of period | | | 75,052,836 | | | | 10,191,069 | | | | - | |
| Cash and cash equivalents, end of period | | $ | 70,255,117 | | | $ | 6,349,527 | | | $ | 70,255,117 | |
Supplementary cash flow information (note 15)
The accompanying notes are an integral part of these unaudited consolidated interim financial statements.
MIDWAY GOLD CORP.
CONSOLIDATED INTERIM STATEMENT OF STOCKHOLDERS’ EQUITY
(Expressed in Canadian dollars, except shares) (unaudited)
| | | Convertible Preferred Stock | | | Stockholder’s Equity (Deficit) | |
| | | Number of
Preferred
Shares | | | Preferred
Stock | | | Number of
shares | | | Common stock | | | Additional paid-in
capital | | | Accumulated other
comprehensive loss | | | Accumulated deficit
during the
development stage | | | Total
stockholders’
equity | |
| Balance, May 14, 1996 (date of inception) | | | - | | | $ | - | | | | - | | | $ | - | | | $ | - | | | $ | - | | | $ | - | | | $ | - | |
| Shares issued: | | | - | | | | - | | | | | | | | | | | | | | | | | | | | | | | | | |
| Private placements | | | - | | | | - | | | | 700,000 | | | | 168,722 | | | | - | | | | - | | | | - | | | | 168,722 | |
| Net loss | | | - | | | | - | | | | - | | | | - | | | | - | | | | - | | | | (114,800 | ) | | | (114,800 | ) |
| Balance, December 31, 1996 | | | - | | | | - | | | | 700,000 | | | | 168,722 | | | | | | | | | | | | (114,800 | ) | | | 53,922 | |
| Shares issued: | | | - | | | | - | | | | | | | | | | | | | | | | | | | | | | | | | |
| Initial public offering | | | - | | | | - | | | | 2,025,000 | | | | 590,570 | | | | - | | | | - | | | | - | | | | 590,570 | |
| Principal shares | | | - | | | | - | | | | 750,000 | | | | 7,500 | | | | - | | | | - | | | | - | | | | 7,500 | |
| Private placement | | | - | | | | - | | | | 1,000,000 | | | | 1,932,554 | | | | 321,239 | | | | - | | | | - | | | | 2,253,793 | |
| Exercise of share purchase warrants | | | - | | | | - | | | | 1,000,000 | | | | 2,803,205 | | | | - | | | | - | | | | - | | | | 2,803,205 | |
| Acquisition of mineral property interest | | | - | | | | - | | | | 1,000,000 | | | | 2,065,500 | | | | - | | | | - | | | | - | | | | 2,065,500 | |
| Finder’s fee | | | - | | | | - | | | | 150,000 | | | | 309,825 | | | | - | | | | - | | | | - | | | | 309,825 | |
| Net loss | | | - | | | | - | | | | - | | | | - | | | | - | | | | - | | | | (2,027,672 | ) | | | (2,027,672 | ) |
| Balance, December 31, 1997 | | | - | | | | - | | | | 6,625,000 | | | | 7,877,876 | | | | 321,239 | | | | - | | | | (2,142,472 | ) | | | 6,056,643 | |
| Shares issued: | | | - | | | | - | | | | | | | | | | | | | | | | | | | | | | | | | |
| Exercise of share purchase warrants | | | - | | | | - | | | | 100,000 | | | | 332,124 | | | | (32,124 | ) | | | - | | | | - | | | | 300,000 | |
| Acquisition of mineral property interest | | | - | | | | - | | | | 200,000 | | | | 246,000 | | | | - | | | | - | | | | - | | | | 246,000 | |
| Finder’s fee | | | - | | | | - | | | | 150,000 | | | | 224,250 | | | | - | | | | - | | | | - | | | | 224,250 | |
| Net loss | | | - | | | | - | | | | - | | | | - | | | | - | | | | - | | | | (1,943,674 | ) | | | (1,943,674 | ) |
| Balance, December 31, 1998 | | | - | | | | - | | | | 7,075,000 | | | | 8,680,250 | | | | 289,115 | | | | - | | | | (4,086,146 | ) | | | 4,883,219 | |
| Consolidation of shares on a two for one basis | | | - | | | | - | | | | (3,537,500 | ) | | | - | | | | - | | | | - | | | | - | | | | - | |
| Net loss | | | - | | | | - | | | | - | | | | - | | | | - | | | | - | | | | (2,378,063 | ) | | | (2,378,063 | ) |
| Balance, December 31, 1999 | | | - | | | | - | | | | 3,537,500 | | | | 8,680,250 | | | | 289,115 | | | | - | | | | (6,464,209 | ) | | | 2,505,156 | |
| Net loss | | | - | | | | - | | | | - | | | | - | | | | - | | | | - | | | | (4,718,044 | ) | | | (4,718,044 | ) |
| Balance, December 31, 2000 | | | - | | | | - | | | | 3,537,500 | | | | 8,680,250 | | | | 289,115 | | | | - | | | | (11,182,253 | ) | | | (2,212,888 | ) |
| Net earnings | | | - | | | | - | | | | - | | | | - | | | | - | | | | - | | | | 2,427,256 | | | | 2,427,256 | |
| Balance, December 31, 2001 | | | - | | | | - | | | | 3,537,500 | | | | 8,680,250 | | | | 289,115 | | | | - | | | | (8,754,997 | ) | | | 214,368 | |
| Shares issued: | | | - | | | | - | | | | | | | | | | | | | | | | | | | | | | | | | |
| Private placement | | | - | | | | - | | | | 4,824,500 | | | | 2,133,786 | | | | 246,839 | | | | - | | | | - | | | | 2,380,625 | |
| Exercise of share purchase warrants | | | - | | | | - | | | | 4,028,000 | | | | 1,007,000 | | | | - | | | | - | | | | - | | | | 1,007,000 | |
| Exercise of stock options | | | - | | | | - | | | | 32,000 | | | | 12,800 | | | | - | | | | - | | | | - | | | | 12,800 | |
| Financing shares issued | | | - | | | | - | | | | 31,250 | | | | 35,000 | | | | - | | | | - | | | | - | | | | 35,000 | |
| Acquisition of mineral property interest | | | - | | | | - | | | | 4,500,000 | | | | 3,600,000 | | | | - | | | | - | | | | - | | | | 3,600,000 | |
| Share issue costs | | | - | | | | - | | | | - | | | | (544,260 | ) | | | - | | | | - | | | | - | | | | (544,260 | ) |
| Stock-based compensation | | | - | | | | - | | | | - | | | | - | | | | 27,000 | | | | - | | | | - | | | | 27,000 | |
| Net loss | | | - | | | | - | | | | - | | | | - | | | | - | | | | - | | | | (1,657,651 | ) | | | (1,657,651 | ) |
| Balance, December 31, 2002 | | | - | | | | - | | | | 16,953,250 | | | | 14,924,576 | | | | 562,954 | | | | - | | | | (10,412,648 | ) | | | 5,074,882 | |
| Shares issued: | | | - | | | | - | | | | | | | | | | | | | | | | | | | | | | | | | |
| Private placement | | | - | | | | - | | | | 700,000 | | | | 638,838 | | | | 201,162 | | | | - | | | | - | | | | 840,000 | |
| Exercise of share purchase warrants | | | - | | | | - | | | | 294,500 | | | | 73,625 | | | | - | | | | - | | | | - | | | | 73,625 | |
| Share issue costs | | | - | | | | - | | | | - | | | | (19,932 | ) | | | - | | | | - | | | | - | | | | (19,932 | ) |
| Stock-based compensation | | | - | | | | - | | | | - | | | | - | | | | 531,000 | | | | - | | | | - | | | | 531,000 | |
| Net loss | | | - | | | | - | | | | - | | | | - | | | | - | | | | - | | | | (1,352,679 | ) | | | (1,352,679 | ) |
| Balance, December 31, 2003 | | | - | | | | - | | | | 17,947,750 | | | | 15,617,107 | | | | 1,295,116 | | | | | | | | (11,765,327 | ) | | | 5,146,896 | |
| Shares issued: | | | - | | | | - | | | | | | | | | | | | | | | | | | | | | | | | | |
| Private placement | | | - | | | | - | | | | 2,234,400 | | | | 2,122,269 | | | | 175,407 | | | | - | | | | - | | | | 2,297,676 | |
| Exercise of share purchase warrants | | | - | | | | - | | | | 213,500 | | | | 300,892 | | | | (46,267 | ) | | | - | | | | - | | | | 254,625 | |
| Exercise of stock options | | | - | | | | - | | | | 250,000 | | | | 157,000 | | | | (27,000 | ) | | | - | | | | - | | | | 130,000 | |
| Share issue costs | | | - | | | | - | | | | - | | | | (183,512 | ) | | | - | | | | - | | | | - | | | | (183,512 | ) |
| Stock-based compensation | | | - | | | | - | | | | - | | | | - | | | | 941,478 | | | | - | | | | - | | | | 941,478 | |
| Net loss | | | - | | | | - | | | | - | | | | - | | | | - | | | | - | | | | (2,994,702 | ) | | | (2,994,702 | ) |
| Balance, December 31, 2004 carried forward | | | - | | | | - | | | | 20,645,650 | | | $ | 18,013,756 | | | $ | 2,338,734 | | | $ | - | | | $ | (14,760,029 | ) | | $ | 5,592,461 | |
The accompanying notes are an integral part of these unaudited consolidated interim financial statements.
MIDWAY GOLD CORP.
CONSOLIDATED INTERIM STATEMENT OF STOCKHOLDERS’ EQUITY - CONTINUED
(Expressed in Canadian dollars, except shares) (unaudited)
| | | Convertible Preferred Stock | | | Stockholder’s Equity (Deficit) | |
| | | Number of
Preferred
Shares | | | Preferred
Stock | | | Number of
shares | | | Common stock | | | Additional paid-in
capital | | | Accumulated other
comprehensive loss | | | Accumulated
deficit during the
development stage | | | Total
stockholders’
equity | |
| Balance, December 31, 2004 brought forward | | | - | | | $ | - | | | | 20,645,650 | | | $ | 18,013,756 | | | $ | 2,338,734 | | | $ | - | | | $ | (14,760,029 | ) | | $ | 5,592,461 | |
| Shares issued: | | | - | | | | - | | | | | | | | | | | | | | | | | | | | | | | | | |
| Private placement | | | - | | | | - | | | | 4,075,800 | | | | 3,266,095 | | | | 773,335 | | | | - | | | | - | | | | 4,039,430 | |
| Exercise of stock options | | | - | | | | - | | | | 165,500 | | | | 124,364 | | | | (31,964 | ) | | | - | | | | - | | | | 92,400 | |
| Exercise of share purchase warrants | | | - | | | | - | | | | 1,743,000 | | | | 1,543,844 | | | | (4,844 | ) | | | - | | | | - | | | | 1,539,000 | |
| Share issue costs | | | - | | | | - | | | | - | | | | (184,660 | ) | | | - | | | | - | | | | - | | | | (184,660 | ) |
| Stock-based compensation | | | - | | | | - | | | | - | | | | - | | | | 488,075 | | | | - | | | | - | | | | 488,075 | |
| Net loss | | | - | | | | - | | | | - | | | | - | | | | - | | | | - | | | | (4,402,715 | ) | | | (4,402,715 | ) |
| Balance, December 31, 2005 | | | - | | | | - | | | | 26,629,950 | | | | 22,763,399 | | | | 3,563,336 | | | | - | | | | (19,162,744 | ) | | | 7,163,991 | |
| Shares issued: | | | - | | | | - | | | | | | | | | | | | | | | | | | | | | | | | | |
| Private placements | | | - | | | | - | | | | 5,725,000 | | | | 10,760,355 | | | | 944,645 | | | | - | | | | - | | | | 11,705,000 | |
| Exercise of stock options | | | - | | | | - | | | | 306,000 | | | | 325,530 | | | | (111,330 | ) | | | - | | | | - | | | | 214,200 | |
| Exercise of share purchase warrants | | | - | | | | - | | | | 3,227,000 | | | | 4,182,991 | | | | (768,491 | ) | | | - | | | | - | | | | 3,414,500 | |
| Acquisition of mineral property interest | | | - | | | | - | | | | 40,000 | | | | 88,000 | | | | - | | | | - | | | | - | | | | 88,000 | |
| Share issue costs | | | - | | | | - | | | | - | | | | (248,512 | ) | | | - | | | | - | | | | - | | | | (248,512 | ) |
| Stock-based compensation | | | - | | | | - | | | | - | | | | - | | | | 992,400 | | | | - | | | | - | | | | 992,400 | |
| Net loss | | | - | | | | - | | | | - | | | | - | | | | - | | | | - | | | | (7,241,228 | ) | | | (7,241,228 | ) |
| Balance, December 31, 2006 | | | - | | | | - | | | | 35,927,950 | | | | 37,871,763 | | | | 4,620,560 | | | | - | | | | (26,403,972 | ) | | | 16,088,351 | |
| Shares issued: | | | - | | | | - | | | | | | | | | | | | | | | | | | | | | | | | | |
| Private placement | | | - | | | | - | | | | 2,000,000 | | | | 5,400,000 | | | | - | | | | - | | | | - | | | | 5,400,000 | |
| Pan-Nevada acquisition | | | - | | | | - | | | | 7,764,109 | | | | 25,000,431 | | | | 2,028,074 | | | | - | | | | - | | | | 27,028,505 | |
| Exercise of stock options | | | - | | | | - | | | | 595,000 | | | | 1,485,415 | | | | (694,515 | ) | | | - | | | | - | | | | 790,900 | |
| Exercise of share purchase warrants | | | - | | | | - | | | | 3,395,605 | | | | 10,777,930 | | | | (2,081,407 | ) | | | - | | | | - | | | | 8,696,523 | |
| Share issue costs | | | - | | | | - | | | | - | | | | (28,000 | ) | | | - | | | | - | | | | - | | | | (28,000 | ) |
| Stock-based compensation | | | - | | | | - | | | | - | | | | - | | | | 1,502,912 | | | | - | | | | - | | | | 1,502,912 | |
| Unrealized loss on investments | | | - | | | | - | | | | - | | | | - | | | | - | | | | (120,000 | ) | | | - | | | | (120,000 | ) |
| Adjustment of future income tax liability to | | | - | | | | - | | | | | | | | | | | | | | | | | | | | | | | | | |
| mineral properties | | | - | | | | - | | | | - | | | | - | | | | - | | | | - | | | | (389,955 | ) | | | (389,955 | ) |
| Net loss | | | - | | | | - | | | | - | | | | - | | | | - | | | | - | | | | (10,666,106 | ) | | | (10,666,106 | ) |
| Balance, December 31, 2007 | | | - | | | | - | | | | 49,682,664 | | | | 80,507,539 | | | | 5,375,624 | | | | (120,000 | ) | | | (37,460,033 | ) | | | 48,303,130 | |
| Shares issued: | | | - | | | | - | | | | | | | | | | | | | | | | | | | | | | | | | |
| Private placement | | | - | | | | - | | | | 14,521,500 | | | | 6,174,441 | | | | 956,509 | | | | - | | | | - | | | | 7,130,950 | |
| Acquisition of mineral property interest | | | - | | | | - | | | | 30,000 | | | | 88,500 | | | | - | | | | - | | | | - | | | | 88,500 | |
| Exercise of stock options | | | - | | | | - | | | | 479,000 | | | | 1,186,462 | | | | (453,212 | ) | | | - | | | | - | | | | 733,250 | |
| Exercise of share purchase warrants | | | - | | | | - | | | | 108,500 | | | | 364,404 | | | | (209,405 | ) | | | - | | | | - | | | | 154,999 | |
| Share issue costs | | | - | | | | - | | | | - | | | | (139,705 | ) | | | - | | | | - | | | | - | | | | (139,705 | ) |
| Stock-based compensation | | | - | | | | - | | | | - | | | | - | | | | 501,028 | | | | - | | | | - | | | | 501,028 | |
| Unrealized loss on investments | | | - | | | | - | | | | - | | | | - | | | | - | | | | (502,225 | ) | | | - | | | | (502,225 | ) |
| Investment write-down | | | - | | | | - | | | | - | | | | - | | | | - | | | | 622,225 | | | | - | | | | 622,225 | |
| Net loss | | | - | | | | - | | | | - | | | | - | | | | - | | | | - | | | | (16,165,394 | ) | | | (16,165,394 | ) |
| Balance, December 31, 2008 | | | - | | | | - | | | | 64,821,664 | | | | 88,181,641 | | | | 6,170,544 | | | | - | | | | (53,625,427 | ) | | | 40,726,758 | |
| Shares issued: | | | - | | | | - | | | | | | | | | | | | | | | | | | | | | | | | | |
| Exercise of stock options | | | - | | | | - | | | | 33,333 | | | | 32,815 | | | | (11,164 | ) | | | - | | | | - | | | | 21,651 | |
| Exercise of share purchase warrants | | | - | | | | - | | | | 12,500,000 | | | | 4,456,509 | | | | (956,509 | ) | | | - | | | | - | | | | 3,500,000 | |
| Stock-based compensation | | | - | | | | - | | | | - | | | | - | | | | 1,152,238 | | | | - | | | | - | | | | 1,152,238 | |
| Unrealized gain on investment | | | - | | | | - | | | | - | | | | - | | | | - | | | | 53,850 | | | | - | | | | 53,850 | |
| Realized gain on sale of investments | | | - | | | | - | | | | - | | | | - | | | | - | | | | (53,850 | ) | | | - | | | | (53,850 | ) |
| Net loss | | | - | | | | - | | | | - | | | | - | | | | - | | | | - | | | | (2,642,176 | ) | | | (2,642,176 | ) |
| Balance, December 31, 2009, carried forward | | | - | | | $ | - | | | | 77,354,997 | | | $ | 92,670,965 | | | $ | 6,355,109 | | | $ | - | | | $ | (56,267,603 | ) | | $ | 42,758,471 | |
The accompanying notes are an integral part of these unaudited consolidated interim financial statements.
MIDWAY GOLD CORP.
CONSOLIDATED INTERIM STATEMENT OF STOCKHOLDERS’ EQUITY - CONTINUED
(Expressed in Canadian dollars) (unaudited)
| | | Convertible Preferred Stock | | | Stockholder’s Equity (Deficit) | |
| | | Number of
Preferred
Shares | | | Preferred
Stock | | | Number of
shares | | | Common stock | | | Additional paid-
in capital | | | Accumulated other
comprehensive loss | | | Accumulated
deficit during the
development stage | | | Total
stockholders’
equity | |
| Balance, December 31, 2009, brought forward | | | - | | | $ | - | | | | 77,354,997 | | | $ | 92,670,965 | | | $ | 6,355,109 | | | $ | - | | | $ | (56,267,603 | ) | | $ | 42,758,471 | |
| Shares issued: | | | - | | | | - | | | | | | | | | | | | | | | | | | | | | | | | | |
| Private placement | | | - | | | | - | | | | 1,333,333 | | | | 514,365 | | | | 285,635 | | | | - | | | | - | | | | 800,000 | |
| Public offerings | | | - | | | | - | | | | 17,738,666 | | | | 8,294,058 | | | | 1,504,996 | | | | - | | | | - | | | | 9,799,054 | |
| Share issue costs | | | - | | | | - | | | | - | | | | (1,431,027 | ) | | | 212,109 | | | | - | | | | - | | | | (1,218,918 | ) |
| Exercise of share purchase warrants | | | - | | | | - | | | | 12,500 | | | | 14,024 | | | | (4,024 | ) | | | - | | | | - | | | | 10,000 | |
| Stock-based compensation | | | - | | | | - | | | | - | | | | - | | | | 838,601 | | | | - | | | | - | | | | 838,601 | |
| Unrealized gain on investment | | | - | | | | - | | | | - | | | | - | | | | - | | | | 13,125 | | | | - | | | | 13,125 | |
| Net loss | | | - | | | | - | | | | - | | | | - | | | | - | | | | - | | | | (5,826,972 | ) | | | (5,826,972 | ) |
| Balance, December 31, 2010 | | | - | | | | - | | | | 96,439,496 | | | | 100,062,385 | | | | 9,192,426 | | | | 13,125 | | | | (62,094,575 | ) | | | 47,173,361 | |
| Shares issued: | | | - | | | | - | | | | | | | | | | | | | | | | | | | | | | | | | |
| Exercise of share purchase warrants | | | - | | | | - | | | | 8,611,356 | | | | 10,849,874 | | | | (1,578,554 | ) | | | - | | | | - | | | | 9,271,320 | |
| Exercise of stock options | | | - | | | | - | | | | 729,997 | | | | 743,200 | | | | (290,451 | ) | | | - | | | | - | | | | 452,749 | |
| Bought deal offering | | | - | | | | - | | | | 7,500,000 | | | | 11,742,000 | | | | - | | | | - | | | | - | | | | 11,742,000 | |
| Share issuance At-the-Market Program | | | - | | | | - | | | | 568,626 | | | | 1,518,845 | | | | - | | | | - | | | | - | | | | 1,518,845 | |
| Share issue costs | | | - | | | | - | | | | - | | | | (990,900 | ) | | | - | | | | - | | | | - | | | | (990,900 | ) |
| Stock-based compensation | | | - | | | | - | | | | - | | | | - | | | | 3,626,687 | | | | - | | | | - | | | | 3,626,687 | |
| Unrealized gain on investment | | | - | | | | - | | | | - | | | | - | | | | - | | | | 13,750 | | | | - | | | | 13,750 | |
| Net loss | | | - | | | | - | | | | - | | | | - | | | | - | | | | - | | | | (15,527,179 | ) | | | (15,527,179 | ) |
| Balance, December 31, 2011 | | | - | | | | - | | | | 113,849,475 | | | | 123,925,404 | | | | 10,950,108 | | | | 26,875 | | | | (77,621,754 | ) | | | 57,280,633 | |
| Shares issued: | | | | | | | | | | | | | | | | | | | | | | | | | | | | | | | | |
| Public offerings | | | - | | | | - | | | | 12,261,562 | | | | 13,370,717 | | | | - | | | | - | | | | - | | | | 13,370,717 | |
| Issuance of Preferred Stock | | | 37,837,838 | | | | 44,240,154 | | | | - | | | | - | | | | - | | | | - | | | | - | | | | - | |
| Share issue costs | | | - | | | | (411,266 | ) | | | - | | | | (1,437,675 | ) | | | - | | | | - | | | | - | | | | (1,437,675 | ) |
| Exercise of share purchase warrants | | | - | | | | - | | | | 1,533,650 | | | | 1,644,073 | | | | (417,153 | ) | | | - | | | | - | | | | 1,226,920 | |
| Exercise of stock options | | | - | | | | - | | | | 737,501 | | | | 701,391 | | | | (275,706 | ) | | | - | | | | - | | | | 425,685 | |
| Share issuance At-the-Market Program | | | - | | | | - | | | | 69,110 | | | | 100,434 | | | | - | | | | - | | | | - | | | | 100,434 | |
| Stock-based compensation | | | - | | | | - | | | | - | | | | - | | | | 1,593,140 | | | | - | | | | - | | | | 1,593,140 | |
| Accretion of cost of Redeemable preferred stock | | | - | | | | 153,662 | | | | - | | | | - | | | | (153,662 | ) | | | - | | | | - | | | | (153,662 | ) |
| Dividends Payable | | | - | | | | 278,572 | | | | - | | | | - | | | | (278,572 | ) | | | - | | | | - | | | | (278,572 | ) |
| Unrealized gain / (loss) on investment | | | - | | | | - | | | | - | | | | - | | | | - | | | | (56,250 | ) | | | - | | | | (56,250 | ) |
| Unrealized foreign exchange gain / (loss) | | | - | | | | - | | | | - | | | | - | | | | - | | | | (406,969 | ) | | | - | | | | (406,969 | ) |
| Net loss | | | - | | | | - | | | | - | | | | - | | | | - | | | | - | | | | (15,274,622 | ) | | | (15,274,622 | ) |
| Balance, December 31, 2012 | | | 37,837,838 | | | $ | 44,261,122 | | | | 128,451,298 | | | $ | 138,304,344 | | | $ | 11,418,155 | | | $ | (436,344 | ) | | $ | (92,896,376 | ) | | $ | 56,389,779 | |
| Shares issued: | | | | | | | | | | | | | | | | | | | | | | | | | | | | | | | | |
| Share issue costs | | | - | | | | (314 | ) | | | - | | | | - | | | | - | | | | - | | | | - | | | | - | |
| Stock-based compensation | | | - | | | | - | | | | - | | | | - | | | | 569,209 | | | | - | | | | - | | | | 569,209 | |
| Accretion of cost of Redeemable preferred stock | | | - | | | | 857,550 | | | | - | | | | - | | | | (857,550 | ) | | | - | | | | - | | | | (857,550 | ) |
| Dividends Payable | | | - | | | | (278,572 | ) | | | - | | | | - | | | | (1,419,732 | ) | | | - | | | | - | | | | (1,419,732 | ) |
| Unrealized gain / (loss) on investment | | | - | | | | - | | | | - | | | | - | | | | - | | | | (3,750 | ) | | | - | | | | (3,750 | ) |
| Unrealized foreign exchange gain / (loss) | | | - | | | | - | | | | - | | | | - | | | | - | | | | 427,812 | | | | - | | | | 427,812 | |
| Net income (loss) | | | - | | | | - | | | | - | | | | - | | | | - | | | | - | | | | 5,877,552 | | | | 5,877,552 | |
| Balance, March 31, 2013 | | | 37,837,838 | | | $ | 44,839,786 | | | | 128,451,298 | | | $ | 138,304,344 | | | $ | 9,710,082 | | | $ | (12,282 | ) | | $ | (87,018,824 | ) | | $ | 60,983,320 | |
The accompanying notes are an integral part of these unaudited consolidated interim financial statements.
MIDWAY GOLD CORP.
SCHEDULE OF MINERAL EXPLORATION EXPENDITURES
(Expressed in Canadian dollars) (unaudited)
| | | Three months
ended March 31,
2013 | | | Three months
ended March 31,
2012 | | | Cumulative period
from inception
(May 14,1996) to
March 31, 2013 | |
| Exploration costs incurred are summarized as follows: | | | | | | | | | | | | |
| Tonopah project | | | | | | | | | | | | |
| Assays and analysis | | $ | - | | | $ | 2,847 | | | $ | 552,388 | |
| Drilling | | | - | | | | (64 | ) | | | 2,834,782 | |
| Engineering and consulting | | | 2,321 | | | | 5,816 | | | | 4,453,392 | |
| Environmental | | | 773 | | | | - | | | | 236,911 | |
| Field office and supplies | | | 220 | | | | 11,335 | | | | 290,996 | |
| Legal | | | 30 | | | | (183 | ) | | | 165,817 | |
| Property maintenance and taxes | | | - | | | | - | | | | 638,467 | |
| Reclamation costs | | | 268 | | | | 1,582 | | | | 39,506 | |
| Reproduction and drafting | | | 6 | | | | - | | | | 23,637 | |
| Salaries and labor | | | 1,335 | | | | 53,079 | | | | 956,103 | |
| Travel, transportation and accommodation | | | 176 | | | | 3,272 | | | | 479,992 | |
| | | | 5,129 | | | | 77,684 | | | | 10,671,991 | |
| Spring Valley project | | | | | | | | | | | | |
| Assays and analysis | | | - | | | | - | | | | 3,329,900 | |
| Drilling | | | - | | | | - | | | | 10,261,359 | |
| Engineering and consulting | | | (248 | ) | | | 22,355 | | | | 2,738,376 | |
| Environmental | | | - | | | | - | | | | 300,445 | |
| Field office and supplies | | | 111 | | | | 3,725 | | | | 566,911 | |
| Legal | | | 1,970 | | | | 22,654 | | | | 500,927 | |
| Operator fee | | | - | | | | - | | | | 108,339 | |
| Property maintenance and taxes | | | - | | | | - | | | | 496,317 | |
| Reclamation costs | | | 1 | | | | - | | | | 30,964 | |
| Reproduction and drafting | | | 3 | | | | - | | | | 30,171 | |
| Salaries and labor | | | 670 | | | | 10,050 | | | | 1,279,772 | |
| Travel, transportation and accommodation | | | 54 | | | | 1,110 | | | | 858,597 | |
| | | | 2,561 | | | | 59,894 | | | | 20,502,078 | |
| Pan project | | | | | | | | | | | | |
| Assays and analysis | | | - | | | | 3,843 | | | | 931,888 | |
| Drilling | | | - | | | | - | | | | 3,712,110 | |
| Engineering and consulting | | | 8,857 | | | | 23,864 | | | | 3,600,136 | |
| Environmental | | | 36 | | | | - | | | | 706,685 | |
| Field office and supplies | | �� | 51,700 | | | | 30,901 | | | | 995,709 | |
| Legal | | | 6,928 | | | | (2,969 | ) | | | 344,447 | |
| Property maintenance and taxes | | | 1,200 | | | | (275 | ) | | | 960,347 | |
| Reclamation costs | | | 378 | | | | 5,081 | | | | (8,374 | ) |
| Reproduction and drafting | | | 1,453 | | | | - | | | | 81,218 | |
| Salaries and labor | | | 306,603 | | | | 82,390 | | | | 3,203,417 | |
| Travel, transportation and accommodation | | | 35,339 | | | | 7,569 | | | | 655,540 | |
| | | | 412,494 | | | | 150,404 | | | | 15,183,123 | |
| Sub-total balance carried forward | | $ | 420,184 | | | $ | 287,982 | | | $ | 46,357,192 | |
The accompanying notes are an integral part of these unaudited consolidated interim financial statements.
MIDWAY GOLD CORP.
SCHEDULE OF MINERAL EXPLORATION EXPENDITURES - CONTINUED
(Expressed in Canadian dollars) (unaudited)
| | | Three months
ended March
31, 2013 | | | Three months
ended March 31,
2012 | | | Cumulative period
from inception
(May 14,1996) to
March 31, 2013 | |
| Sub-total balance brought forward | | $ | 420,184 | | | $ | 287,982 | | | $ | 46,357,192 | |
| Thunder Mountain project | | | | | | | | | | | | |
| Assays and analysis | | | - | | | | 1,719 | | | | 86,367 | |
| Drilling | | | - | | | | 68,983 | | | | 254,968 | |
| Engineering and consulting | | | - | | | | 24,941 | | | | 47,171 | |
| Environmental | | | - | | | | - | | | | 1,717 | |
| Field office and supplies | | | 3 | | | | 11,950 | | | | 36,787 | |
| Legal | | | - | | | | - | | | | 3,233 | |
| Property maintenance and taxes | | | - | | | | 20,449 | | | | 51,640 | |
| Reclamation costs | | | - | | | | - | | | | 6,169 | |
| Salaries and labor | | | 17 | | | | 59,455 | | | | 115,239 | |
| Travel, transportation and accommodation | | | 44 | | | | 8,532 | | | | 21,834 | |
| | | | 64 | | | | 196,029 | | | | 625,125 | |
| Gold Rock project | | | | | | | | | | | | |
| Assays and analysis | | | 116,376 | | | | 59,875 | | | | 604,328 | |
| Drilling | | | 409,531 | | | | 21,766 | | | | 2,675,256 | |
| Engineering and consulting | | | 179,981 | | | | 94,975 | | | | 883,655 | |
| Environmental | | | 57,159 | | | | 80,586 | | | | 930,080 | |
| Field office and supplies | | | 122,148 | | | | 53,553 | | | | 516,112 | |
| Legal | | | 12,012 | | | | 1,360 | | | | 55,978 | |
| Property maintenance and taxes | | | 67,792 | | | | 13,547 | | | | 608,315 | |
| Reclamation costs | | | 305 | | | | 9,685 | | | | 33,103 | |
| Reproduction and drafting | | | 1,679 | | | | - | | | | 41,062 | |
| Salaries and labor | | | 350,783 | | | | 122,895 | | | | 1,111,958 | |
| Travel, transportation and accommodation | | | 33,912 | | | | 14,986 | | | | 171,848 | |
| | | | 1,351,678 | | | | 473,228 | | | | 7,631,695 | |
| Pinyon project | | | | | | | | | | | | |
| Engineering and consulting | | | 273 | | | | - | | | | 273 | |
| Field office and supplies | | | 3,477 | | | | - | | | | 3,477 | |
| Legal | | | 480 | | | | - | | | | 480 | |
| Property maintenance and taxes | | | 55,116 | | | | - | | | | 55,116 | |
| Reclamation costs | | | 26 | | | | - | | | | 26 | |
| Reproduction and drafting | | | 101 | | | | - | | | | 101 | |
| Salaries and labor | | | 21,048 | | | | - | | | | 21,048 | |
| Travel, transportation and accommodation | | | 1,693 | | | | - | | | | 1,693 | |
| | | | 82,214 | | | | - | | | | 82,214 | |
| Golden Eagle project | | | | | | | | | | | | |
| Assays and analysis | | | - | | | | - | | | | 21,700 | |
| Drilling | | | - | | | | - | | | | 3,638 | |
| Engineering and consulting | | | 38 | | | | 21,101 | | | | 446,571 | |
| Field office and supplies | | | 498 | | | | - | | | | 5,934 | |
| Legal | | | 66 | | | | - | | | | 22,115 | |
| Property maintenance and taxes | | | 7,613 | | | | - | | | | 37,517 | |
| Salaries and labor | | | 2,907 | | | | - | | | | 18,883 | |
| Travel, transportation and accommodation | | | 234 | | | | - | | | | 21,873 | |
| | | | 11,356 | | | | 21,101 | | | | 578,231 | |
| Sub-total balance carried forward | | $ | 1,865,496 | | | $ | 1,013,438 | | | $ | 55,274,457 | |
The accompanying notes are an integral part of these unaudited consolidated interim financial statements.
MIDWAY GOLD CORP.
SCHEDULE OF MINERAL EXPLORATION EXPENDITURES - CONTINUED
(Expressed in Canadian dollars) (unaudited)
| | | Three months
ended March 31,
2013 | | | Three months
ended March 31,
2012 | | | Cumulative period
from inception
(May 14,1996) to
March 31, 2013 | |
| Sub-total balance brought forward | | $ | 1,865,496 | | | $ | 1,013,438 | | | $ | 55,274,457 | |
| Abandoned properties | | | | | | | | | | | | |
| Acquisition costs and option payments | | | - | | | | - | | | | 40,340 | |
| Assays and analysis | | | - | | | | - | | | | 101,908 | |
| Drilling | | | - | | | | - | | | | 1,018,952 | |
| Engineering and consulting | | | - | | | | - | | | | 3,753,510 | |
| Field office and supplies | | | - | | | | - | | | | 312,850 | |
| Foreign exchange gain | | | - | | | | - | | | | 81,600 | |
| Freight | | | - | | | | - | | | | 234,956 | |
| Interest on convertible loans | | | - | | | | - | | | | 1,288,897 | |
| Legal and accounting | | | - | | | | - | | | | 466,764 | |
| Marketing | | | - | | | | - | | | | 91,917 | |
| Mining costs | | | - | | | | - | | | | 693,985 | |
| Processing and laboratory supplies | | | - | | | | - | | | | 941,335 | |
| Property maintenance and taxes | | | - | | | | - | | | | 511,445 | |
| Reclamation costs | | | - | | | | - | | | | 45,428 | |
| Recoveries | | | - | | | | - | | | | (39,850 | ) |
| Reproduction and drafting | | | - | | | | - | | | | 6,215 | |
| Security | | | - | | | | - | | | | 47,552 | |
| Salaries and labor | | | - | | | | - | | | | 350,584 | |
| Travel, transportation and accommodation | | | - | | | | - | | | | 448,862 | |
| Utilities and water | | | - | | | | - | | | | 59,425 | |
| | | | - | | | | - | | | | 10,456,675 | |
| Property investigations | | | | | | | | | | | | |
| Assays and analysis | | | - | | | | - | | | | 198,528 | |
| Drilling | | | - | | | | - | | | | 169,694 | |
| Engineering and consulting | | | - | | | | - | | | | 385,125 | |
| Environmental | | | - | | | | - | | | | 22,761 | |
| Field office and supplies | | | - | | | | 5,680 | | | | 25,539 | |
| Legal | | | - | | | | - | | | | 10,952 | |
| Property maintenance and taxes | | | (55,064 | ) | | | - | | | | 777,180 | |
| Reclamation costs | | | - | | | | - | | | | 3,048 | |
| Reproduction and drafting | | | - | | | | - | | | | 5,336 | |
| Salaries and labor | | | - | | | | 13,596 | | | | 38,725 | |
| Travel, transportation and accommodation | | | 8,014 | | | | 1,547 | | | | 133,656 | |
| | | | (47,050 | ) | | | 20,823 | | | | 1,770,544 | |
| | | $ | 1,818,446 | | | $ | 1,034,261 | | | $ | 67,501,676 | |
The accompanying notes are an integral part of these unaudited consolidated interim financial statements.
MIDWAY GOLD CORP.
NOTES TO UNAUDITED CONSOLIDATED INTERIM FINANCIAL STATEMENTS
| 1. | Nature and continuance of operations |
Midway Gold Corp. (the “Company” or “Midway”) was incorporated on May 14, 1996 under the laws of the Province of British Columbia and its principal business activities are the acquisition, exploration and development of mineral properties.
The Company has not generated any revenues from operations. These consolidated financial statements have been prepared on a going concern basis which assumes the Company will be able to realize its assets and discharge its liabilities in the normal course of business in the foreseeable future. The Company has incurred operating losses for the three months ended March 31, 2013 of $4,928,049; further operating losses are anticipated in the development of its business. Since inception of May 14, 1996 to March 31, 2013 the Company’s accumulated deficit totals $87,018,824. Management believes that the Company’s cash on hand of $70,255,117 at March 31, 2013 is sufficient to finance exploration and development activities and operations through at least the next twelve months.
The Company’s ability to continue on a going concern basis beyond the next twelve months depends on its ability to successfully raise additional financing for the substantial capital expenditures required to achieve planned principal operations. While the Company has been successful in the past in obtaining financing, there is no assurance that it will be able to obtain adequate financing in the future or that such financing will be on terms acceptable to the Company.
These financial statements do not reflect adjustments that would be necessary if the going concern assumption were not appropriate.
| 2. | Significant accounting policies and change in accounting policy |
The consolidated interim financial statements included herein have been prepared by the Company, without audit, in accordance with the rules and regulations of the Securities and Exchange Commission (“SEC”) pursuant to Rule 10-01 of Regulation S-X. Certain information and footnote disclosures normally included in financial statements prepared in accordance with accounting principles generally accepted in the United States of America (“US GAAP”) have been condensed or omitted pursuant to such SEC rules and regulations, although the Company believes that the disclosures included are adequate to make the information presented not misleading. Certain reclassifications have been made to prior period financial statements to conform to the current period presentation.
In management’s opinion, the unaudited consolidated interim financial statements contained herein reflect all adjustments, consisting solely of normal recurring items, which are necessary for the fair presentation of our financial position, results of operations, and cash flows on a basis consistent with that of our prior audited consolidated financial statements. However, the results of operations for interim periods may not be indicative of results to be expected for the full fiscal year. Therefore, these financial statements should be read in conjunction with the Company’s audited consolidated financial statements including the notes thereto for the year ended December 31, 2012 which may be found under the Company’s profile on SEDAR and EDGAR.
The accounting policies followed by the Company are set out in note 2 to the audited consolidated financial statements for the year ended December 31, 2012 and have been consistently followed in the preparation of these consolidated interim financial statements.
Recent Accounting Pronouncements
The Company evaluates the pronouncements of various authoritative accounting organizations, primarily the Financial Accounting Standards Board (“FASB”), the SEC, and the Emerging Issues Task Force (“EITF”), to determine the impact of new pronouncements on U.S. GAAP and the impact on the Company’s financial statements.
MIDWAY GOLD CORP.
NOTES TO UNAUDITED CONSOLIDATED INTERIM FINANCIAL STATEMENTS
Recently issued accounting pronouncements
In March 2013, the FASB issued Accounting Standards Update ("ASU") 2013-05, “Parent's Accounting for the Cumulative Translation Adjustment upon Derecognition of Certain Subsidiaries or Groups of Assets within a Foreign Entity or of an Investment in a Foreign Entity”, an amendment to FASB Accounting Standards Codification ("ASC") Topic 830, “Foreign Currency Matters” ("FASB ASC Topic 830"). The update clarifies that complete or substantially complete liquidation of a foreign entity is required to release the cumulative translation adjustment ("CTA") for transactions occurring within a foreign entity. However, transactions impacting investments in a foreign entity may result in a full or partial release of CTA even though complete or substantially complete liquidation of the foreign entity has not occurred. Furthermore, for transactions involving step acquisitions, the CTA associated with the previous equity-method investment will be fully released when control is obtained and consolidation occurs. This ASU is effective for fiscal years beginning after December 15, 2013. The Company is currently assessing the potential impact of adopting this guidance.
In February 2013, the FASB issued ASU 2013-04, “Obligations Resulting From Joint and Several Liability Arrangements for Which the Total Amount of the Obligation is Fixed at the Reporting Date, an amendment to FASB ASC Topic 405, Liabilities” ("FASB ASC Topic 405"). The update requires an entity to measure obligations resulting from joint and several liability arrangements for which the total amount of the obligation is fixed as of the reporting date as the sum of the obligation the entity agreed to pay among its co-obligors and any additional amount the entity expects to pay on behalf of its co-obligors. This ASU is effective for annual and interim periods beginning after December 15, 2013 and is required to be applied retrospectively to all prior periods presented for those obligations that existed upon adoption of the ASU. The Company is currently assessing the potential impact of adopting this guidance.
Recently adopted accounting policies
In February 2013, the FASB issued ASU 2013-02, “Other Comprehensive Income (Topic 220)”. The objective of this update is to improve the reporting of reclassifications out of accumulated other comprehensive income. The amendments in this update seek to attain that objective by requiring an entity to report the effect of significant reclassifications out of accumulated other comprehensive income on the respective line items in net income if the amount being reclassified is required under U.S. GAAP to be reclassified in its entirety to net income in the same reporting period. For other amounts that are not required under U.S. GAAP to be reclassified in their entirety to net income in the same reporting period, an entity is required to cross-reference other disclosures required under U.S. GAAP that provide additional detail about those amounts. This accounting standard update is effective prospectively for annual and interim periods beginning after December 15, 2012. The Company adopted ASU 2013-02 on January 1, 2013 and its adoption did not have a material impact on our financial position or results of operations.
In October 2012, the FASB issued ASU 2012-04, “Technical Corrections and Improvements”. The amendments in this update cover a wide range of Topics in the Accounting Standards Codification. These amendments include technical corrections and improvements to the Accounting Standards Codification and conforming amendments related to fair value measurements. The amendments in this update were effective for fiscal periods beginning after December 15, 2012. The Company adopted ASU 2012-04 on January 1, 2013 and its adoption did not have a material impact on our financial position or results of operations.
In December 2011, the FASB issued ASU 2011-11 “Balance Sheet: Disclosures about Offsetting Assets and Liabilities” (“ASU 2011-11”). This update requires an entity to disclose information about offsetting and related arrangements to enable users of its financial statements to understand the effect of those arrangements on its financial position. The objective of this disclosure is to facilitate comparison between those entities that prepare their financial statements on the basis of U.S. GAAP and those entities that prepare their financial statements on the basis of IFRS. The amended guidance is effective for annual reporting periods beginning on or after January 1, 2013, and interim periods within those annual periods. The Company adopted ASU 2011-11 on January 1, 2013 and its adoption did not have a material impact on our financial position or results of operations.
MIDWAY GOLD CORP.
NOTES TO UNAUDITED CONSOLIDATED INTERIM FINANCIAL STATEMENTS
| 3. | Net (income) loss per share |
Basic loss per common share is computed using the weighted-average number of common shares outstanding during the period. Diluted loss per common share amounts are calculated using the weighted-average number of common shares outstanding for the period and include the dilutive effect of preferred stock using the if-converted method and exercise of stock options and warrants.
The two-class method is used to calculate basic and diluted (income) loss per common share since preferred stock is a participating security under ASC 260 Earnings per share. The two-class method is an earnings allocation formula that determines income per share for each class of common stock and participating security according to dividends declared (or accumulated) and participation rights in undistributed earnings. Under the two-class method, basic (income) loss per common share is computed by dividing net (income) loss attributable to common shareholders after allocation of income to participating securities by the weighted-average number of common shares outstanding during the year. Diluted (income) loss per common share is computed using the more dilutive of the two-class method or the if-converted method. In periods of net loss, no effect is given to participating securities since they do not contractually participate in the losses of the Company.
Basic and diluted (income) loss per share for the three-month periods ended March 31, 2013 and 2012 are calculated as follows:
| | | Three months ended
March 31, | |
| | | 2013 | | | 2012 | |
| Basic (income) loss per share: | | | | | | | | |
| Numerator: | | | | | | | | |
| Net (income) loss attributable to common shareholders | | $ | (3,600,270 | ) | | $ | 3,072,393 | |
| Denominator: | | | | | | | | |
Weighted-average common shares for basic
(income) loss per share | | | 128,451,298 | | | | 113,960,618 | |
| Basic (income) loss per share | | $ | (0.03 | ) | | $ | 0.03 | |
| | | | | | | | | |
| Diluted (income) loss per share: | | | | | | | | |
| Numerator: | | | | | | | | |
| Net (income) loss attributable to common shareholders | | $ | (3,600,270 | ) | | $ | 3,072,393 | |
| Effect of Gain on change in fair value of derivative liability | | | 8,872,226 | | | | - | |
| Effect of Accretion of Redeemable Preferred stock | | | (857,550 | ) | | | | |
| Effect of Preferred Stock dividend | | | (1,419,732 | ) | | | | |
| Effect of Canadian corporate dividend tax | | | (424,576 | ) | | | - | |
| | | $ | 2,570,098 | | | $ | 3,072,393 | |
| Denominator: | | | | | | | | |
| Weighted-average common shares for basic (income) loss per share | | | 128,451,298 | | | | 113,960,618 | |
| Effect of dilutive securities: | | | | | | | | |
| Preferred Series A shares | | | 37,837,838 | | | | - | |
| Dilutive potential common shares | | | 37,837,838 | | | | 113,960,618 | |
| Total shares | | | 166,289,136 | | | | 113,960,618 | |
| Diluted (income) loss per share | | $ | 0.02 | | | $ | 0.03 | |
For the three months ended March 31, 2013 and 2012, the effects of the assumed exercise of the combined stock options and warrants of 4,982,489 and 4,740,002 shares of common stock, respectively, were excluded from the calculation of diluted net income per share as the effect would be anti-dilutive.
MIDWAY GOLD CORP.
NOTES TO UNAUDITED CONSOLIDATED INTERIM FINANCIAL STATEMENTS
| 4. | Fair Value Measurements |
ASC 820 establishes a fair value hierarchy which prioritizes the inputs used in measuring fair value into three broad levels as follows:
Level 1- Quoted prices in active markets for identical assets or liabilities.
Level 2- Inputs other than the quoted prices in active markets that are observable either directly or indirectly.
Level 3- Unobservable inputs based on the Company’s assumptions.
The Company’s Level 1 assets include investments in common shares available for sale with no trading restrictions as determined using a market approach based upon unadjusted quoted prices for identical assets in an active market.
The Company’s Level 2 liabilities include two derivative liabilities. The first relates to warrants issued as part of a public offering on July 6, 2012 (note 9(xxxix)). The Company records the fair value of the warrant liability using the Black-Scholes option pricing model. The second is an embedded derivative liability related to the convertible Series A Preferred Shares issued as part of a private offering closed on December 13, 2012 (note 10). The Company engaged a third party valuation firm and records the fair value of the derivative liability using the Monte Carlo valuation model.
The Company did not have any Level 3 assets or liabilities as of March 31, 2013.
The determination of fair value for financial reporting purposes at March 31, 2013 utilizing the applicable framework is as follows:
| Financial Instrument | | Quoted
Prices in
Active
Markets for
Identical
Assets | | | Significant
other
observable
inputs | | | Significant
unobservable
inputs | | | Total at March
31, 2013 | |
| Assets | | | | | | | | | | | | | | | | |
| Available-for-sale securities | | $ | 10,000 | | | $ | - | | | $ | - | | | $ | 10,000 | |
| Liabilities | | | | | | | | | | | | | | | | |
| Warrant liability | | $ | - | | | $ | (589,637 | ) | | $ | - | | | $ | (589,637 | ) |
| Preferred share liability | | | - | | | | (18,457,734 | ) | | | - | | | | (18,457,734 | ) |
Financial instruments measured at fair value as at December 31, 2012 were as follows:
| Financial Instrument | | Quoted
Prices in
Active
Markets for
Identical
Assets | | | Significant
other
observable
inputs | | | Significant
unobservable
inputs | | | Total at
December 31,
2012 | |
| Assets | | | | | | | | | | | | | | | | |
| Available-for-sale securities | | $ | 13,750 | | | $ | - | | | $ | - | | | $ | 13,750 | |
| Liabilities | | | | | | | | | | | | | | | | |
| Warrant liability | | $ | - | | | $ | (1,166,381 | ) | | $ | - | | | $ | (1,166,381 | ) |
| Preferred share liability | | | - | | | | (27,330,135 | ) | | | - | | | | (27,330,135 | ) |
On October 26, 2010, as consideration of certain area of interest obligations of NV Gold Corporation (“NVX”) that applied to the Roberts Gold project, the Company was issued 250,000 common shares of NVX.
MIDWAY GOLD CORP.
NOTES TO UNAUDITED CONSOLIDATED INTERIM FINANCIAL STATEMENTS
During the three month periods ended March 31, 2013 and 2012, the Company recorded a net unrealized loss of $3,750 and a net unrealized gain of $7,500, respectively, on the common shares of NVX in accumulated other comprehensive income.
| | | March 31, 2013 | |
| | | Number of
shares | | | Cost | | | Accumulated
unrealized
gains (losses) | | | Fair Value | |
| Available for sale – common shares | | | 250,000 | | | $ | 43,125 | | | $ | (33,125 | ) | | $ | 10,000 | |
| | | December 31, 2012 | |
| | | Number of
shares | | | Cost | | | Accumulated
unrealized
gains (losses) | | | Fair Value | |
| Available for sale – common shares | | | 250,000 | | | $ | 43,125 | | | $ | (29,375 | ) | | $ | 13,750 | |
| 6. | Property, equipment and mine development |
At March 31, 2013 and December 31, 2012, property, equipment and mine development consisted of the following:
| | | March 31,
2013 | | | December 31,
2012 | |
| Land | | $ | 559,750 | | | $ | 548,125 | |
| Buildings and leasehold improvements | | | 546,817 | | | | 519,699 | |
| Computer equipment and software | | | 968,864 | | | | 944,708 | |
| Trucks and autos | | | 373,504 | | | | 365,747 | |
| Office equipment | | | 194,766 | | | | 190,721 | |
| Field equipment | | | 232,683 | | | | 227,850 | |
| Mine development | | | 7,067,162 | | | | 6,057,111 | |
| Subtotal | | | 9,943,546 | | | | 8,853,961 | |
| Accumulated depreciation | | | (988,023 | ) | | | (848,002 | ) |
| Totals | | $ | 8,955,523 | | | $ | 8,005,959 | |
Depreciation expense for the three months ended March 31, 2013 and 2012 was $117,440 and $83,710, respectively. The Company evaluates the recoverability of long lived assets when events and circumstances indicate that such assets might be impaired.
Beginning on January 1, 2012, the Company began to capitalize permitting, engineering and other development activities as part of the Company’s plans to advance the Pan gold project to production. When a project is determined to contain proven or probable reserves, costs incurred in anticipation of production are capitalized into Mine development. Interest costs, if any, incurred during the development phase, would be capitalized until the assets are ready for their intended use. If a project commences commercial production and the project is determined to contain proven or probable reserves, amortization and depletion of capitalized costs will be computed on a unit-of–production basis over the expected reserves of the project based on estimated recoverable gold equivalent ounces. Depreciation of related capitalized equipment is computed on a straight-line basis over the estimated economic life.
MIDWAY GOLD CORP.
NOTES TO UNAUDITED CONSOLIDATED INTERIM FINANCIAL STATEMENTS
Details on the Company’s mineral properties are found in note 6 to the audited consolidated financial statements for the year ended December 31, 2012.
| Mineral property | | March 31,
2013 | | | December 31,
2012 | |
| Tonopah | | $ | 7,548,753 | | | $ | 7,508,054 | |
| Spring Valley | | | 4,882,517 | | | | 4,790,292 | |
| Pan | | | 34,774,109 | | | | 34,490,915 | |
| Gold Rock | | | 1,810,233 | | | | 972,245 | |
| Pinyon | | | 42,554 | | | | - | |
| Golden Eagle | | | 2,207,260 | | | | 2,161,420 | |
| | | $ | 51,265,426 | | | $ | 49,922,926 | |
| (a) | Tonopah property, Nye County, Nevada |
Through a series of agreements, amendments and payments the Company acquired a 100% interest in the Tonopah property subject only to a sliding scale royalty on Net Smelter Returns (“NSR”) from any commercial production of between 2% to 7%, based on changes in gold prices, and an advance minimum royalty, recoverable from commercial production, of U.S.$300,000 per year on each August 15.
| (b) | Spring Valley property, Nevada |
| | The Company signed an exploration and option to joint venture agreement (the “Barrick Agreement”) with Barrick Gold Exploration Inc., a wholly owned subsidiary of Barrick Gold Corporation, effective on March 9, 2009, on the Spring Valley gold project that superseded a term sheet executed on October 17, 2008. Barrick is granted the exclusive right to earn a 60% interest in the project by spending US$30,000,000 on the property over five years. Barrick may increase its interest by 10% (70% total) by spending an additional US$8,000,000 in the year immediately after vesting at 60%. At the Company’s election, Barrick may also earn an additional 5% (75% total) by carrying the Company to a production decision and arranging financing for the Company’s share of mine construction expenses with the carrying and financing costs plus interest to be recouped by Barrick once production has been established. The Company will coordinate geologic and administrative activities under the direction of Barrick, billing monthly at cost plus an administrative fee of 5%. |
| | At March 31, 2013 and December 31, 2012, no amounts were due from Barrick Gold Exploration Inc. (“Barrick”) for recoverable salaries and expenses, pursuant to the Spring Valley exploration option and joint venture agreement. Barrick has informed the Company that they have earned a 60% interest in the Spring Valley property as of April 19, 2013, and that they intend to incur the additional U.S.$8,000,000 in exploration expenditures to increase their interest in the property to 70%. |
The Company assumed a mineral lease agreement in April 2007, with Newark Valley Mining Corp. (“NVMC”) (formerly Gold Standard Royalty Corporation (“GSRC”) and earlier the Lyle Campbell Trust) for a 100% interest in the Pan property. The Company must pay an advance minimum royalty of the greater of U.S.$60,000 or the US dollar equivalent of 174 ounces of gold valued by the average of the London afternoon fixing for the third calendar quarter proceeding January 1 of the year in which the payment is due. The minimum advance royalties will be creditable against a sliding scale NSR production royalty of between 2.5% and 4%. On January 2, 2013, the Company paid $283,194 (U.S.$287,448). The Company must incur a minimum of U.S.$65,000 per year for work expenditures, including claim maintenance fees, during the term of the mining lease.
MIDWAY GOLD CORP.
NOTES TO UNAUDITED CONSOLIDATED INTERIM FINANCIAL STATEMENTS
| (d) | Gold Rock property, Nevada |
The Company assumed the mineral lease agreement in April 2007, with NVMC for a 100% interest in the Gold Rock property. Annually the Company must pay an advance minimum royalty of the greater of U.S.$60,000 or the US dollar equivalent of 108.05 ounces of gold valued by the average of the London afternoon fixing for the third calendar quarter preceding January 1 of the year in which the payment is due. The minimum advance royalties will be creditable against a sliding scale NSR production royalty of between 2.5% and 4%. On January 2, 2013 the Company paid $175,857 (U.S.$178,499). The Company must incur a minimum of U.S.$75,000 per year for work expenditures, including claim maintenance fees, during the term of the mining lease.
| (e) | Pinyon property, Nevada |
The Company entered into an earn-in agreement with Aurion Resources (“Aurion”) in November 2012 for claims east of the Company’s Pan property and north of the Company's Gold Rock property. The Company can earn an initial 50% interest by completing $2 million in expenditures over 5 years ("Primary" earn-in), after which it can elect to either declare a 50-50 joint venture or spend a further $2 million over 2 years ("Secondary" earn-in) to earn an additional 20% for a total 70% interest. The Company can also earn an additional 5% (75% total) by arranging mine financing. The Company reimbursed Aurion for claim maintenance fees paid in September of 2012 of U.S.$52,830.
| (f) | Golden Eagle property, Nevada |
The Company purchased a 75% interest in the Golden Eagle, Washington project from Kinross Gold USA Inc. (“Kinross”) in August 2008, at a cost of $1,537,950 (U.S.$1,500,000) and purchased a 25% interest in the Golden Eagle project from Hecla Limited at a cost of $500,200 (U.S.$483,333). Kinross retained a 2% NSR royalty and was granted a first right of refusal to toll mill ore from the Golden Eagle property at their Kettle River Mill.
The Company is required to post bonds with the Bureau of Land Management (“BLM”) for reclamation of planned mineral exploration programs work associated with the Company’s mineral properties located in the United States. For the Company’s mineral properties that are being actively explored under funding arrangement agreements, the funding partners are responsible for bonding for the surface disturbance created by the exploration programs funded by each of them on those projects.
At March 31, 2013 the Company had posted a total of $871,597 (U.S.$857,871) reclamation deposits compared to $853,110 (U.S.$857,525) at December 31, 2012.
| (a) | The Company is authorized to issue an unlimited number of common shares and preferred shares. |
| (i) | During 1996, the Company issued 420,000 common shares at $0.25 per share by way of a non-brokered private placement for proceeds of $98,722 net of issue costs. In addition the Company issued 280,000 flow-through common shares at $0.25 per share by way of a non-brokered private placement for proceeds of $70,000. |
| (ii) | During 1997, the Company completed an initial public offering of 2,000,000 common shares at $0.35 per share for proceeds of $590,570, net of issue costs. In connection with this offering, the Company’s agent received a selling commission of 10% or $0.035 per share and was issued 25,000 shares as a corporate finance fee. |
MIDWAY GOLD CORP.
NOTES TO UNAUDITED CONSOLIDATED INTERIM FINANCIAL STATEMENTS
| (iii) | During 1997, the Company issued 1,000,000 units at $2.50 per unit by way of a private placement for proceeds of $2,253,793 net of issue costs. Each unit consisted of one common share and one non-transferable share purchase to purchase one additional common share at $3.00 per share until February 14, 1998. The proceeds of the financing of $2,500,000 were allocated $2,178,761 as to the common shares and $321,239 as to the warrants. During 1998 100,000 of the warrants were exercised and 900,000 expired. In connection with this private placement, the Company’s agent received a selling commission of 7.5% of the proceeds of the units sold or $0.1875 per unit and a corporate finance fee of $15,000. |
| (iv) | During 1997, the Company issued 750,000 common shares as performance shares for proceeds of $7,500 that were held in escrow in accordance with the rules of the regulatory authorities of British Columbia. The shares were released 25% in each of 1998, 1999, 2000 and 2001. |
| (v) | During 1997, pursuant to an equity participation agreement to acquire an interest in Gemstone Mining Inc. (“Gemstone”), a Utah Corporation that by agreement the creditors of Gemstone were issued 1,000,000 units of the Company on conversion of a debt of $2,065,500 (U.S.$1,500,000). Each unit consisted of one common share and one non-transferable share purchase to purchase one additional common share at U.S.$2.00 per share that was immediately exercised for proceeds of $2,803,205 (U.S.$2,000,000). The first one-third tranche of a conditional finders’ fee was satisfied by the issue of 150,000 common shares in connection with the acquisition of Gemstone. |
| (vi) | During 1998, the Company issued 100,000 common shares pursuant to the exercise of share purchase warrants for proceeds of $300,000. |
| (vii) | During 1998, the Company issued 200,000 common shares in connection with the acquisition of Gemstone as well as the second tranche of finder’s fee in connection with that acquisition. The Company’s option to acquire Gemstone expired on January 31, 1998 and the remaining one-third tranche were not issued. |
| (viii) | During 1999, the Company consolidated its issued share capital on a two old for one new basis and changed its name from Neary Resources Corporation to Red Emerald Resource Corp. |
| (ix) | During 2002, the Company issued 3,500,000 units at $0.25 per unit for proceeds of $875,000 by way of a short form offering document under the policies of the TSX Venture Exchange. Each unit consists of one common share and one common share purchase warrant that entitled the holder to purchase one additional common share at $0.25 per share until October 19, 2002. The Company also issued 150,000 common shares as a finance fee in connection with this offering, and issued the agent 875,000 share purchase warrants exercisable at $0.25 per share until April 19, 2004. During 2002 the Company issued 1,134,500 special warrants at $1.25 per special warrant for proceeds of $1,418,125. Each Special Warrant automatically converted to a unit comprising one common share and one share purchase warrant that entitled the holder to purchase one additional common share at $1.55 per share until November 6, 2003. The proceeds of the financing of $1,418,125 were allocated on a relative fair value basis as $1,171,286 to common shares and $246,839 as to the warrants. During 2003 all of the warrants expired unexercised. In connection with the offering the Company paid the agent a 10% commission totaling $113,450, issued the agent 40,000 common shares as a finance fee in connection with this offering, and issued the agent 170,175 share purchase warrant exercisable at $1.55 per share until July 5, 2003. |
| (x) | During 2002, the Company issued 4,028,000 common shares pursuant to the exercise of share purchase warrants for proceeds of $1,007,000. |
| (xi) | During 2002, the Company issued 32,000 common shares pursuant to the exercise of stock options for proceeds of $12,800. |
| (xii) | During 2002, the Company issued 31,250 common shares as additional consideration to a director who loaned the Company $780,000 bearing interest at 12% per annum. The loan and interest was repaid prior to December 31, 2002. |
MIDWAY GOLD CORP.
NOTES TO UNAUDITED CONSOLIDATED INTERIM FINANCIAL STATEMENTS
| (xiii) | During 2002, the Company acquired Rex Exploration Corp. (“Rex”) in exchange for 4,500,000 common shares of the Company. |
| (xiv) | During 2003, the Company issued 700,000 units at $1.20 per unit for proceeds of $840,000 by way of a non-brokered private placement. Each unit consists of one common share and one share purchase warrant that entitled the holder to purchase one additional common share at $1.50 until May 25, 2004. The proceeds of the financing of $840,000 were allocated $638,838 as to common shares and $201,162 as to the warrants. During 2004 161,000 of the warrants were exercised and 539,000 expired. Share issue expenses were $19,932. |
| (xv) | During 2003, the Company issued 294,500 common shares pursuant to the exercise of share purchase warrants for proceeds of $73,625. |
| (xvi) | In January 2004, the Company issued 400,000 units at $2.00 per unit for proceeds of $800,000 by way of a private placement. Each unit consisted of one common share and one non-transferable share purchase warrant that entitled the holder to purchase one additional common share at $2.35 per share for a six month period. The proceeds of the financing of $800,000 were allocated on a relative fair value basis as $624,593 to common shares and $175,407 as to the warrants. All of the warrants expired unexercised in 2004. The Company issued 40,000 common shares as a finder’s fee for this private placement. |
| (xvii) | In August 2004, the Company issued 1,020,000 units at $0.75 per unit for proceeds of $765,000 by way of a private placement. Each unit consisted of one common share and one non-transferable share purchase warrant that entitled the holder to purchase one additional common share at $0.80 per share until August 25, 2005. All of the warrants were subsequently exercised. The Company issued 55,650 common shares as a finder’s fee for this private placement. |
| (xviii) | In December 2004, the Company issued 700,000 units at $0.85 per unit for proceeds of $595,000 by way of a private placement. Each unit consisted of one common share and one non-transferable share purchase warrant that entitled the holder to purchase one additional common share at $1.00 per share until December 20, 2005. All of the warrants were subsequently exercised. The Company issued 18,750 common shares as a finder’s fee for this private placement. |
| (xix) | In February 2005, the Company issued 2,500,000 units at $0.85 per unit for proceeds of $2,125,000 by way of a private placement. Each unit consisted of one common share and one non-transferable share purchase warrant that entitled the holder to purchase one additional common share at $1.00 per share until February 16, 2006. The proceeds of the financing of $2,125,000 were allocated on a relative fair value basis as $1,598,457 to common shares and $526,543 as to warrants. There were 23,000 warrants exercised in fiscal year 2005 and the balance exercised in fiscal year 2006. The Company issued 75,800 common shares for $64,430 and paid $69,700 in cash as a finder’s fee and incurred $26,709 in additional issue costs for this private placement. |
| (xx) | In July 2005, the Company issued 1,000,000 units at $1.15 per unit for proceeds of $1,150,000 by way of a private placement. Each unit consisted of one common share and one-half non-transferable share purchase warrant that entitled the holder to purchase one additional common share at $1.15 per share until July 27, 2006. The proceeds of the financing of $1,150,000 were allocated on a relative fair value basis as $995,193 to common shares and $154,807 as to warrants. All of the warrants were exercised in fiscal year 2006. The Company incurred $15,560 in issue costs. |
| (xxi) | In August 2005, the Company issued 500,000 units at $1.40 per unit for proceeds of $700,000 by way of a private placement. Each unit consisted of one common share and one-half nontransferable share purchase warrant that entitled the holder to purchase one additional common share at $1.45 per share until August 22, 2006. The proceeds of the financing of $700,000 were allocated on a relative fair value basis as $608,015 to common shares and $91,985 as to warrants. All of the warrants were exercised in fiscal year 2006. The Company incurred $8,261 in issue costs. |
MIDWAY GOLD CORP.
NOTES TO UNAUDITED CONSOLIDATED INTERIM FINANCIAL STATEMENTS
| (xxii) | In January 2006, the Company issued 40,000 common shares at a value of $88,000 pursuant to a purchase and sale agreement to purchase mining claims for the Spring Valley project. |
| (xxiii) | In May 2006, the Company issued 3,725,000 units at $1.80 per unit for proceeds of $6,705,000 by way of a private placement. Each unit consisted of one common share and one-half nontransferable share purchase warrant. Each whole warrant entitled the holder to purchase one additional common share at $2.70 per share until May 16, 2007. The proceeds of the financing of $6,705,000 were allocated on a relative fair value basis as $5,998,846 to common shares and $706,154 as to warrants. The Company incurred $65,216 in issue costs. By May 16, 2007 1,725,000 of the warrants were exercised and 137,500 expired unexercised. |
| (xxiv) | In November 2006, the Company issued 2,000,000 units at $2.50 per unit for proceeds of $5,000,000 by way of a private placement. Each unit consisted of one common share and one-half nontransferable share purchase warrant. Each whole warrant entitles the holder to purchase one additional common share at $3.00 per share until November 10, 2007. The proceeds of the financing of $2,000,000 were allocated on a relative fair value basis as $1,761,509 to common shares and $238,491 as to warrants. The Company paid $88,750 in finders’ fees and incurred $94,546 in issue costs for this private placement. By November 10, 2007 908,782 of the warrants were exercised and 91,218 expired unexercised. |
| (xxv) | On April 16, 2007, the Company issued 7,764,109 common shares at a value of $25,000,431, 308,000 stock options at a value of $608,020 and 870,323 share purchase warrants at a value of $1,420,054 in connection with the acquisition of Pan-Nevada Gold Corporation. By December 31, 2007, 154,000 of the stock options had been exercised and 761,823 share purchase warrants had been exercised. By December 31, 2008 the remaining 108,500 share purchase warrants were exercised and 84,000 stock options had been exercised. On October 11, 2008 the final 70,000 stock options expired not exercised. |
| (xxvi) | On August 24, 2007, the Company issued 2,000,000 common shares at $2.70 per common share for proceeds of $5,400,000 by way of a private placement. The Company incurred $28,000 in share issue costs. |
| (xxvii) | On March 31, 2008, the Company issued 30,000 common shares at a value of $88,500 pursuant to a lease assignment of mining claims for the Gold Rock project. The Company incurred $1,489 in share issue costs. |
| (xxviii) | On June 12, 2008, the Company issued 1,421,500 common shares at $2.00 per common share for proceeds of $2,843,000 by way of a private placement. The Company incurred $75,371 in share issue costs. |
| (xxix) | On August 1, 2008 the Company issued 600,000 common shares at U.S.$2.50 per common share for proceeds of $1,537,950 (U.S.$1,500,000) by way of a private placement with Kinross. The Company incurred $39,450 in share issue costs. |
| (xxx) | On November 12, 2008 the Company issued 12,500,000 units at $0.22 per unit for proceeds of $2,750,000 by way of a private placement. Each unit consisted of one common share and one share purchase warrant. Each warrant entitles the holder to purchase one additional common share at $0.28 per share until May 12, 2009. The proceeds of the financing of $2,750,000 were allocated on a relative fair value basis as $1,793,491 to common shares and $956,509 as to warrants. The Company incurred $23,395 in issue costs for this private placement. In the year ended December 31, 2009 all of the 12,500,000 warrants were exercised for proceeds of $3,500,000. |
| (xxxi) | In addition to the 84,000 stock options reported exercised in paragraph xxv, during 2008, the Company issued a further 395,000 common shares pursuant to the exercise of stock options for proceeds of $613,250. |
MIDWAY GOLD CORP.
NOTES TO UNAUDITED CONSOLIDATED INTERIM FINANCIAL STATEMENTS
| (xxxii) | During 2009, the Company issued 33,333 common shares pursuant to the exercise of stock options for proceeds of $21,651. |
| (xxxiii) | On April 9, 2010, the Company issued 1,333,000 units at $0.60 per unit for proceeds of $800,000 by way of a private placement. Each unit consisted of one common share and one share purchase warrant. Each warrant entitles the holder to purchase one additional common share until October 9, 2011 at an exercise price as follows: $0.70 if exercised on or before October 9, 2010; $0.80 if exercised after October 9, 2010 but on or before April 9, 2011; and $0.90 if exercised after April 9, 2011 but on or before October 9, 2011. The proceeds of the financing of $800,000 were allocated on a relative fair value basis as $514,365 to common shares and $285,635 as to warrants. The Company incurred $95,529 in issue costs for this private placement. |
| (xxxiv) | On June 16, 2010, the Company issued 11,078,666 units at $0.60 per unit for proceeds of $6,647,199 by way of a brokered offering in Canada and a non-brokered offering in the United States. Each unit consisted of one common share and one-half share purchase warrant. Each whole warrant entitles the holder to purchase one additional common share until June 16, 2012 at an exercise price of $0.80. The proceeds of the financing of $6,647,199 were allocated on a relative fair value basis as $5,142,202 to common shares and $1,504,997 as to warrants. The Company issued 658,840 agent’s warrants which entitle the holder to purchase one common share until June 16, 2010 at an exercise price of $0.80. These warrants have been recorded at the estimated fair value at the issue date of $212,109.The fair value of warrants was determined using a risk free interest rate of 1.82%, an expected volatility of 131%, an expected life of 2 years, and zero dividends for a fair value per warrant of $0.32. In addition, the Company paid finders’ fees in the amount of $395,304 and incurred other cash share issue costs of $307,553. |
| (xxxv) | In September 2010, the Company issued 12,500 common shares pursuant to the exercise of share purchase warrants for proceeds of $10,000. |
| (xxxvi) | In November 2010, the Company closed a public offering and the Company issued 6,660,000 units at U.S.$0.60 per unit, each unit comprising one common share and one half of one non-transferable common share purchase warrant. Each whole warrant entitles the holder to purchase one common share of the Company at a price of U.S.$0.90 per share until November 12, 2012, subject to acceleration provisions. The proceeds of the financing of $4,070,725 were allocated first to the fair value of the warrants at $918,870 with the residual amount of $3,151,855 to common shares. |
The Company incurred $176,288 in issue costs and paid $244,244 to the agent as commission for this public offering. On February 9, 2011, the Company gave notice to the Warrant holders that it accelerated the expiry date of the warrants to March 14, 2011 and by that date 2,650,000 warrants were exercised and 680,000 warrants expired unexercised.
| (xxxvii) | On June 6, 2011, the Company issued 7,500,000 common shares upon the close of a “bought deal” public offering for U.S.$1.60 per share. Gross proceeds on the purchase were $11,742,000 (U.S.$12,000,000). The Company incurred $151,839 in issue costs and paid the agent $587,100 (U.S.$600,000) as a commission for this public offering. |
| (xxxviii) | On September 23, 2011, the Company announced that it had established an "At-the-Market" ("ATM") issuance program under which it may sell up to a maximum of 6,000,000 of its common shares. The ATM issuance program is available to the Company on an as needed basis. Subject to market conditions and funding requirements, the Company may, at its discretion, from time to time sell all, some, or none of the reserved shares during the term of the ATM program. Any common shares issued under the ATM program will be sold through ATM issuances in the United States. No ATM issuances will be made through the facilities of any Canadian securities exchange. Any ATM issuances will be made at market prices prevailing at the time of the sale and, as a result, prices may vary. During the three months ended March 31, 2013, the Company did not issue any shares pursuant to the ATM program. As of March 31, 2013, the Company has issued a total of 637,736 shares and received net proceeds of $1,554,957 pursuant to the ATM program. The ATM issuance program is currently set to expire during the three months ending June 30, 2013. |
MIDWAY GOLD CORP.
NOTES TO UNAUDITED CONSOLIDATED INTERIM FINANCIAL STATEMENTS
| (xxxix) | In July 2012, the Company closed a public offering and issued 12,261,562 units at U.S.$1.28 per unit, each unit comprising one common share and one half of one non-transferable common share purchase warrant. Each whole warrant entitles the holder to purchase one common share of the Company at a price of U.S.$1.85 per share for a period of 18 months following the closing of the public offering, subject to acceleration provisions. The gross proceeds of the financing of U.S.$15,694,799 were allocated first to the fair value of the warrants at U.S.$2,616,006 with the residual amount of U.S.$13,725,687 to common shares. The Company incurred $1,437,675 in issue costs and paid $244,244 to the agent as commission for this public offering which was expensed during Q3 of 2012. |
The Company has an incentive stock option plan (the “Plan”) that allows it to grant incentive stock options to its officers, directors, employees and consultants. The Plan was amended on May 12, 2008 to add an appendix called the 2008 Stock Incentive Plan for United States Resident Employees (the “U.S. Plan”) to supplement and be a part of the Plan. The purpose of the U.S. Plan is to enable the Company to grant incentive stock options, as that term is defined under Section 422 of the Internal Revenue Code of 1986, as amended from time to time, and any regulations promulgated thereunder to qualifying employees who are citizens or residents of the United States of America. This does not change the aggregate number of options that can be granted pursuant to the Plan.
The Plan permits the Company’s directors to grant incentive stock options for the purchase of shares of the Company to persons in consideration for services. Stock options must be non-transferable and the aggregate number of shares that may be reserved for issuance pursuant to stock options may not exceed 10% of the issued shares of the Company at the time of granting and may not exceed 5% to any individual (maximum of 2% to any consultant). The exercise price of stock options is determined by the board of directors of the Company at the time of grant and should not be less than the closing price of the Company’s shares on the date of grant of such option. Options have a maximum term of ten years and terminate 90 days following the termination of the optionee’s employment, except in the case of death or disability, in which case they terminate one year after the event.
The fair value of each option award is estimated on the date of grant using the Black-Scholes option pricing model. The option pricing model requires the input of subjective assumptions which are based on several different criteria. Expected volatility is based on the historical price volatility of the Company’s common stock. Expected dividend yield is assumed to be nil, as the Company has not paid dividends since inception on common shares. Expected forfeitures are calculated based upon historical experience of options. The expected life is estimated in accordance with SEC Staff Accounting Bulletin No. 107, “Share-Based Payment” for “plain vanilla” options. Risk free interest rates are based on U.S. government obligations with a term approximating the expected life of the option.
The fair value of stock option grants is amortized over the respective vesting periods. The Company recorded stock-based compensation expense, net of forfeitures, of $569,209 and $695,107 in the three months ended March 31, 2013 and 2012, respectively. During the three months ended March 31, 2013 and 2012, $394,970 and $680,719, respectively, were included in salaries and benefits in the statement of operations, $120,854 and $42,019, respectively, were included in salaries and labor in the schedule of mineral exploration expenditures, and $53,385 and $(27,631), respectively, were included in consulting fees in the statement of operations for non-employee stock-based compensation, for options vesting in that period. The estimated unrecognized compensation cost from unvested options as of March 31, 2013 was approximately $1,152,972, which is expected to be recognized over the remaining vesting period of 1.8 years, and has a weighted average remaining contractual term of 4.54 years.
MIDWAY GOLD CORP.
NOTES TO UNAUDITED CONSOLIDATED INTERIM FINANCIAL STATEMENTS
The weighted-average grant date fair value of options is summarized below for the three months ended March 31, 2013 and 2012.
| | | March 31,
2013 | | | March 31,
2012 | |
| Unvested Beginning of Year | | $ | 2.12 | | | $ | 1.80 | |
| Granted | | | 0.55 | | | | 1.33 | |
| Vested | | | 0.56 | | | | 1.24 | |
| Expired | | | 1.65 | | | | 1.49 | |
| Unvested End of Period | | $ | 0.84 | | | $ | 1.29 | |
The following table summarizes activity for compensatory stock options during the three months ended March 31, 2013:
| | | Number of
Shares | | | Weighted
Average
Exercise
Price | | | Aggregate
Intrinsic Value | | | Number of
Shares
Exercisable | |
| Outstanding, January 1, 2013 | | | 7,817,501 | | | $ | 1.35 | | | $ | 2,570,692 | | | | 7,082,504 | |
| Granted | | | 2,545,000 | | | | 1.15 | | | | - | | | | - | |
| Exercised | | | - | | | | - | | | | - | | | | - | |
| Cancelled | | | (144,167 | ) | | | 2.10 | | | | - | | | | - | |
| Outstanding, March 31, 2013 | | | 10,218,334 | | | $ | 1.29 | | | $ | 2,211,400 | | | | 7,849,159 | |
The following table summarizes information about outstanding compensatory stock options as of March 31, 2013:
| | | | Options Outstanding | | | Options Exercisable | |
| Exercise Prices | | | Number of
Shares | | | Remaining
Contractual Life
(in years) | | | Weighted
Average
Exercise
Price | | | Number
Exercisable | | | Weighted
Average
Exercise Price | | | Aggregate
Intrinsic Value | |
| $0.56 - $1.00 | | | | 4,134,167 | | | | 1.9 | | | $ | 0.73 | | | | 4,134,167 | | | $ | 0.73 | | | $ | 2,033,250 | |
| $1.01 - $1.60 | | | | 2,761,667 | | | | 4.8 | | | | 1.18 | | | | 981,656 | | | | 1.20 | | | | 59,383 | |
| $1.61 - $2.20 | | | | 3,272,500 | | | | 3.2 | | | | 2.07 | | | | 2,700,003 | | | | 2.07 | | | | - | |
| $2.21 - $2.80 | | | | 50,000 | | | | 3.4 | | | | 2.34 | | | | 33,333 | | | | 2.34 | | | | - | |
| | | | | | 10,218,334 | | | | 3.1 | | | $ | 1.29 | | | | 7,849,159 | | | $ | 1.26 | | | $ | 2,092,633 | |
| d) | Share purchase warrants: |
Total outstanding warrants at March 31, 2013 were 6,130,781. The exercise price on all warrants outstanding was U.S.$1.85 per share and entitles the holder to purchase one additional common share until December 6, 2013, subject to acceleration provisions. US GAAP requires the value of share purchase warrants issued with an exercise price denominated in a currency other than the Company’s Canadian dollar functional currency to be considered as a liability and this liability is stated at fair value each reporting period. The Company adjusted the fair value of the warrant liability as of December 31, 2012 to $1,166,381, calculated using the Black-Scholes option pricing model. As of March 31, 2013, the fair value of the warrant liability was adjusted to $589,637, calculated using the following assumptions: common share price of $1.22; expected life of 9.24 months; volatility of 60%; no dividend yield; a risk free interest rate of 0.16% and an exchange rate of 1.016. The gain of $576,744 related to the change in the fair value of the warrants has been reported in Other Income in the Consolidated Statement of Operations for the three months ended March 31, 2013.
During the three months ended March 31, 2013, the Company did not issue any warrants.
MIDWAY GOLD CORP.
NOTES TO UNAUDITED CONSOLIDATED INTERIM FINANCIAL STATEMENTS
A summary of the Company’s stock purchase warrants as of March 31, 2013 is presented below:
| | | Number of
Warrants | | | Weighted
Average
Exercise
Price | | | Remaining
Contractual
Life (in years) | |
| Balance, December 31, 2012 | | | 6,130,781 | | | $ | 1.85 | | | | 1.02 | |
| Issued | | | - | | | | - | | | | - | |
| Exercised | | | - | | | | - | | | | - | |
| Expired | | | - | | | | - | | | | - | |
| Balance, March 31, 2013 | | | 6,130,781 | | | $ | 1.85 | | | | 0.77 | |
10. Redeemable preferred stock
In December 2012, the Company issued 37,837,838 Series A Preferred Shares at U.S.$1.85 per share for gross proceeds of $68,936,000 (U.S.$70,000,000) by way of a private placement. The Company incurred a total of $641,333 in share issuance costs, of which the Company proportionately allocated $229,753 to the embedded derivative liability and, the remaining share issuance costs of $411,580 are presented net of the Redeemable preferred stock on the Consolidated Balance Sheet. There is an eight percent (8%) annual dividend, compounding monthly, payable quarterly on the Series A Preferred Shares. At the Company’s option, it may pay the 8% dividend with common shares, in-lieu of cash, based on the closing price of the Company’s common shares as quoted by the NYSE MKT on the trading day immediately prior to the payment date. On March 11, 2013 the Board of Directors declared the first dividend payment to the holders of Series A Preferred Stock with a record date of March 25, 2013 to be paid in cash totaling $1,698,304 (U.S.$1,671,559), which was paid on April 1, 2013. Canadian tax legislation requires a corporate tax to be paid on all cash or in-kind dividends declared and paid by a Canadian entity on taxable preferred shares. Therefore, the dividend payment resulted in recording of a Canadian corporate “Part VI.1” tax payable of $424,576, which is due during the three months ending March 31, 2014. We are entitled to a deduction for tax purposes equal to 3.5 times Part VI.1 taxes paid. Therefore, future Canadian corporate tax savings, if able to be realized, should approximately offset the preferred dividend tax expense.
The holders of each Series A Preferred Share are able to convert the shares into a common share on a one-for-one basis at any time. After December 13, 2013, the Company can pro-ratably force conversion of the shares into common shares on a one-for-one basis provided that the weighted average price of the common shares exceeds U.S.$3.70 on each trading day during 20 consecutive trading days immediately prior to both the delivery of an applicable mandatory conversion notice and the applicable mandatory conversion date. From and after the date which is five years from the issuance date of the Series A Preferred Shares (December 13, 2017), the Company or each holder of Series A Preferred Shares has the right, exercisable by 30 days' notice in writing, to redeem or to require the Company to redeem in cash any portion of the Series A Preferred Shares at U.S.$1.85 per share plus accumulated unpaid dividends. If the outstanding Series A Preferred Shares had been converted as of March 31, 2013, 37,837,838 common shares would have been issued and the fair value of those common shares based upon the closing price on the NYSE as of March 31, 2013 of U.S.$1.22 would have been U.S.$46,162,162. If the common share price was above U.S.$1.85, then the number of common shares issued upon conversion would be reduced proportionally.
The Company is seeking shareholder approval for the holders of the Series A Preferred Shares to, (i) have certain governance rights in the event the Company fails to redeem the Series A Preferred Shares when due and (ii) grant the holders of the Series A Preferred Shares the right, voting as a separate class, to nominate and elect one director to the Company’s board of directors at each annual or special meeting of the Company’s shareholders or action by written consent of the Company’s shareholders at which directors will be elected. The Company is seeking shareholder approval on the aforementioned matters at its 2013 Annual General and Special Meeting of shareholders, to be held on June 20, 2013.
Holders of the Series A Preferred Shares have consent rights over a variety of significant corporate and financing matters, including, but not limited to, the voluntary or involuntary liquidation, dissolution or winding-up of the affairs of the Company, the issuance of any common shares or common share equivalents for less than $1.85 per share or any amendment to the Company’s articles in a manner adverse to the holders of Series A Preferred Shares.
MIDWAY GOLD CORP.
NOTES TO UNAUDITED CONSOLIDATED INTERIM FINANCIAL STATEMENTS
Of the 37,837,838 Series A Preferred Shares sold, EREF-MID II, LLC and HCP-MID, LLC purchased a combined 17,837,838 Series A Preferred Shares. Hale Fund Management, LLC, (“HFM”) is the manager of EREF-MID II, LLC. Hale Capital Partners, LP, (“HCP”) is the sole member of HCP-MID, LLC. Hale Fund Partners, LLC, (“HFP”) is the general partner of HCP. Hale Capital Management, LP, (“HCM”) is the manager of HCP. Hale Fund Management, LLC, (“HFM”), is the general partner of HCM and exercises voting and investment power over the Series A Preferred Shares held by HCP-MID, LLC. Mr. Martin Hale, a member of the Company’s board of directors is the (i) CEO of HCP, (ii) the sole owner and managing member of HFP and (iii) the sole owner and CEO of HFM.
US GAAP requires that embedded derivatives not closely related to the host contract be bifurcated from the host contract and accounted for at fair value. Because the convertible instrument is denominated in a foreign currency, the Company recorded an embedded derivative liability to account for the conversion features of the Series A Preferred Shares. Pursuant to derivative accounting guidance under ASC 815, the embedded derivative liability is to be re-measured at each reporting period with changes in the liability being recorded through earnings. The fair value of the embedded derivative liability as of March 31, 2013 was U.S.$18,167,061, calculated using a volatility of 45.8%, a credit spread of 20.0%, common stock closing price of U.S.$1.22, risk-free rate of 0.89% and USD to CAD exchange rate of 1.016. The income of $8,872,401 included in gain (loss) on change in fair value of derivative liabilities has been reported in Other Income in the Consolidated Statement of Operations, for the three months ended March 31, 2013.
The balance of the Company’s Redeemable preferred stock and changes in the carrying amount of the Redeemable preferred stock are as follows:
| | | Redeemable Preferred Stock | |
| Balance as of December 13, 2012 | | $ | 43,828,888 | |
| Accretion of Redeemable preferred stock | | | 153,662 | |
| Preferred stock cumulative dividend | | | 278,572 | |
| Balance as of December 31, 2012 | | $ | 44,261,122 | |
| Accretion of Redeemable preferred stock | | | 857,550 | |
| Preferred stock cumulative dividend | | | 1,419,732 | |
| Declared Preferred stock cumulative dividend | | | (1,698,304 | ) |
| Share issuance costs | | | (314 | ) |
| Balance as of March 31, 2013 | | $ | 44,839,786 | |
11. Accumulated Other Comprehensive Income
The components of AOCI for the three months ended March 31, 2013 were as follows:
| | | Unrealized (gain)
loss on investment | | | Currency
Translation
Adjustment | | | Total AOCI | |
| Beginning balance | | $ | 29,375 | | | $ | 406,969 | | | $ | 436,344 | |
| Other comprehensive income before reclassifications | | | 3,750 | | | | (427,812 | ) | | | (424,062 | ) |
| Amounts reclassified from accumulated other comprehensive income | | | - | | | | - | | | | - | |
| Net current-period other comprehensive income | | | 3,750 | | | | (427,812 | ) | | | (424,062 | ) |
| Ending balance | | $ | 33,125 | | | $ | (20,843 | ) | | $ | 12,282 | |
12. Commitments
The Company has obligations under operating leases until 2020 for its corporate offices in Englewood, Colorado, until 2014 for offices in Ely, Nevada and until 2015 for office equipment. Future minimum lease payments for non-cancellable leases with initial lease terms in excess of one year are included in the table below.
MIDWAY GOLD CORP.
NOTES TO UNAUDITED CONSOLIDATED INTERIM FINANCIAL STATEMENTS
In addition, the Company has cancellable contract obligations related to consulting service agreements until 2016.
| | | Payments due by period | |
| | | Current Year | | | One – Three
Years | | | Three –
Five Years | | | Thereafter | | | Total | |
| Operating Lease obligations | | $ | 205,755 | | | $ | 582,674 | | | $ | 560,199 | | | $ | 688,577 | | | $ | 2,037,205 | |
| Contract obligations | | | 106,566 | | | | 43,925 | | | | 1,016 | | | | - | | | | 151,507 | |
| Total | | $ | 312,322 | | | $ | 626,599 | | | $ | 561,215 | | | $ | 688,577 | | | $ | 2,188,713 | |
13. Related party transactions
For the three months ended March 31, 2013 and 2012, the Company paid consulting fees of $49,784 and nil, respectively to the Company’s former Chief Executive Officer (“CEO”) for advisory services provided under a consulting agreement. The Company’s former CEO resigned effective May 19, 2012. As of March 31, 2013 the remaining amount due under the agreement was $16,256.
Included in accounts payable and accrued liabilities, amounts payable to directors and officers at March 31, 2013 and December 31, 2012, were $27,268 and $15,032, respectively.
These transactions are in the normal course of operations and are measured at the exchange amount, which is the amount of consideration established and agreed to by the related parties.
For information on the related parties involved in the Series A Preferred transaction see note 10.
14. Financial instruments
In all material respects, the carrying amounts for the Company’s cash and cash equivalents, amounts receivable, accounts payable and accrued liabilities approximate their fair values due to the short term nature of these instruments. Investments and derivative liabilities at March 31, 2013 and December 31, 2012 are recorded at fair values (note 4).
15. Supplemental disclosure with respect to cash flows
The significant non-cash transactions for the three month period ended March 31, 2013 were the accrual of the Preferred stock cumulative dividend of $1,419,732 and Accretion of Redeemable preferred stock of $857,551 (note 10). Both items are transfers of Stockholder’s Equity to Redeemable preferred Stock.
The significant non-cash transactions for the three month period ended March 31, 2012 were nil.
16. Segment disclosures
The Company considers itself to operate in a single segment, being mineral exploration and development, with all of the Company’s long-lived assets being located in the United States at March 31, 2013 and December 31, 2012.
17. Subsequent Events
Chief Financial Officer Appointment
On April 12, 2013, the Board of Directors appointed John Labate, age 64, to serve as our Chief Financial Officer commencing on or about May 9, 2013. Mr. Fritz K. Schaudies, our current Chief Financial Officer who previously announced his intent to resign for personal reasons, will continue to serve as our principal financial and accounting officer for a transition period to assist with an orderly transition of his duties as Chief Financial Officer until on or about May 9, 2013.
MIDWAY GOLD CORP.
NOTES TO UNAUDITED CONSOLIDATED INTERIM FINANCIAL STATEMENTS
Mr. Labate’s annual base salary will be $215,000, which is payable per bi-weekly period. In addition, Mr. Labate will be eligible to participate in (i) our short term incentive plan on a pro-rated basis, (ii) our stock option plan and (iii) any other benefit program offered by us to our employees. As authorized by the Company’s Board of Directors, Mr. Labate received a grant of incentive stock options on a total of 200,000 shares of common stock, exercisable for five years from date of grant at an exercise price of $0.98. The Stock Options will vest one year from the Effective Date in increments of one-third over a three-year period.
Mr. Labate currently serves as managing director in the management-consulting group of Behre Dolbear. Prior to joining Behre Dolbear, Mr. Labate served as Senior Vice President and Chief Financial Officer of Golden Star Resources Ltd (“Golden Star”) from August 2008 to February 2012. Prior to joining Golden Star, Mr. Labate was Vice President and Chief Financial Officer for Constellation Copper Corporation from March 2004 until August 2008. Mr. Labate received his B.S. in Accounting from San Diego State University.
Barrick Earn-in to Spring Valley Project
On April 23, 2013, the Company announced that Barrick Gold Exploration Inc. had informed the Company that it has completed expenditures totaling $30 million at the Company’s Spring Valley Project. This meets the requirements for Barrick to earn a 60% interest in the project. The notice further states Barrick’s intent to expend an additional $8 million on the property before December 31, 2014 to earn a 70% interest in the Spring Valley Project. There are currently four drill rigs working at the Spring Valley Project.
Barrick’s 2013 budget includes $8 million for infill drilling in the main resource area, where the objective is to upgrade the quality of the resource. An additional $3.08 million is budgeted for development activities including metallurgical, geotechnical, and hydrology work as well as the completion of a scoping-level economic evaluation.
| Item 2. | Management's Discussion and Analysis of Financial Condition and Results of Operations. |
You should read the following discussion and analysis of our financial condition and results of operations together with our financial statements and related notes appearing elsewhere in this Quarterly Report on Form 10-Q. This discussion and analysis contains forward-looking statements that involve risks, uncertainties and assumptions. Our actual results may differ materially from those anticipated in these forward-looking statements as a result of many factors, including, but not limited to, those set forth under the heading “Risk Factors and Uncertainties” in our Annual Report on Form 10-K filed with the SEC on March 12, 2013, and elsewhere in this Quarterly Report on Form 10-Q.
This discussion and analysis should be read in conjunction with the accompanying unaudited interim consolidated financial statements and related notes. The discussion and analysis of the financial condition and results of operations are based upon the unaudited interim consolidated financial statements, which have been prepared in accordance with accounting principles generally accepted in the United States. The preparation of financial statements in conformity with accounting principles generally accepted in the United States requires us to make estimates and assumptions that affect the reported amounts of our assets and liabilities, disclosure of any contingent liabilities at the financial statement date and reported amounts of revenue and expenses during the reporting period. On an on-going basis we review our estimates and assumptions. The estimates were based on historical experience and other assumptions that we believe to be reasonable under the circumstances. Actual results are likely to differ from those estimates under different assumptions or conditions, but we do not believe such differences will materially affect our financial position or results of operations. Critical accounting policies, the policies we believe are most important to the presentation of our financial statements and require the most difficult, subjective and complex judgments, are outlined below in “Critical Accounting Policies,” and have not changed significantly.
Cautionary Note Regarding Forward-Looking Statements
In addition, certain statements made in this Quarterly Report on Form 10-Q may constitute “forward-looking statements”. These forward-looking statements involve known or unknown risks, uncertainties and other factors that may cause our actual results, performance, or achievements to be materially different from any future results, performance or achievements expressed or implied by the forward-looking statements. Except for historical information, the matters set forth herein, which are forward-looking statements, involve certain risks and uncertainties that could cause actual results to differ. Potential risks and uncertainties include, but are not limited to, unexpected changes in business and economic conditions; significant increases or decreases in gold prices; changes in interest and currency exchange rates; unanticipated grade changes; metallurgy, processing, access, availability of materials, equipment, supplies and water; determination of reserves; results of current and future exploration activities; results of pending and future feasibility studies; joint venture relationships; political or economic instability, either globally or in the countries in which we operate; local and community impacts and issues; timing of receipt of government approvals; accidents and labor disputes; environmental costs and risks; competitive factors, including competition for property acquisitions; and availability of external financing at reasonable rates or at all. Forward-looking statements can be identified by terminology such as “may,” “will,” “should,” “expects,” “intends,” “plans,” “anticipates,” “believes,” “estimates,” “predicts,” “potential,” “continues” or the negative of these terms or other comparable terminology. Although we believe that the expectations reflected in the forward-looking statements contained herein are reasonable, we cannot guarantee future results, levels of activity, performance or achievements.Forward-looking statements are made based on management’s beliefs, estimates, and opinions on the date the statements are made, and we undertake no obligation to update such forward-looking statements if these beliefs, estimates, and opinions should change, except as required by law.
Cautionary Note to U.S. Investors Regarding Reserve and Resource Estimates
The mineral estimates in this Quarterly Report on Form 10-Q have been prepared in accordance with the requirements of the securities laws in effect in Canada, which differ from the requirements of United States securities laws. The terms “mineral reserve”, “proven mineral reserve” and “probable mineral reserve” are Canadian mining terms as defined in accordance with Canadian National Instrument 43-101 – Standards of Disclosure for Mineral Projects (“NI 43-101”) and the Canadian Institute of Mining, Metallurgy and Petroleum (the “CIM”) - CIM Definition Standards on Mineral Resources and Mineral Reserves, adopted by the CIM Council, as amended. These definitions differ from the definitions in United States Securities and Exchange Commission (“SEC”) Industry Guide 7 under the United States Securities Act of 1933, as amended. Under SEC Industry Guide 7 standards, a “final” or “bankable” feasibility study is required to report reserves, the three-year historical average price is used in any reserve or cash flow analysis to designate reserves and the primary environmental analysis or report must be filed with the appropriate governmental authority.
In addition, the terms “mineral resource”, “measured mineral resource”, “indicated mineral resource” and “inferred mineral resource” are defined in and required to be disclosed by NI 43-101; however, these terms are not defined terms under SEC Industry Guide 7 and are normally not permitted to be used in reports and registration statements filed with the SEC. Investors are cautioned not to assume that any part or all of mineral deposits in these categories will ever be converted into reserves. “Inferred mineral resources” have a great amount of uncertainty as to their existence, and great uncertainty as to their economic and legal feasibility. It cannot be assumed that all or any part of an inferred mineral resource will ever be upgraded to a higher category. Under Canadian rules, estimates of inferred mineral resources may not form the basis of feasibility or pre-feasibility studies, except in rare cases.
Investors are cautioned not to assume that all or any part of an inferred mineral resource exists or is economically or legally mineable. Disclosure of “contained ounces” in a resource is permitted disclosure under Canadian regulations; however, the SEC normally only permits issuers to report mineralization that does not constitute “reserves” by SEC Industry Guide 7 standards as in place tonnage and grade without reference to unit measures.
Accordingly, information contained in this Quarterly Report on Form 10-Q and the documents incorporated by reference herein contain descriptions of our mineral deposits that may not be comparable to similar information made public by U.S. companies subject to the reporting and disclosure requirements under the United States federal securities laws and the rules and regulations thereunder.
Overview
Company Overview
We area development stage company engaged in the acquisition, exploration, and, if warranted, development of gold and silver mineral properties in North America. Our mineral properties are located in Nevada and Washington. Our Pan gold project is in the development stage. The Tonopah, Spring Valley, Gold Rock and Golden Eagle gold properties are exploratory stage projects with identified gold mineralization. The Thunder Mountain and Pinyon projects are earlier stage gold and silver exploration projects.
We are currentlyworking towards transitioning from a development stage company to a gold production company with plans to advance the Pan gold property, located in White Pine County, Nevada, through to production by the second half of 2014.
Recent Developments
Preferred Series A Dividend Declared and Paid
On March 11, 2013 our Board of Directors declared the first dividend payment to the holders of Series A Preferred Stock with a record date of March 25, 2013 to be paid in cash totaling $1,698,304 (U.S.$1,671,559), which was paid on April 1, 2013. Canadian tax legislation requires a corporate tax to be paid on all cash or in-kind dividends declared and paid by a Canadian entity on taxable preferred shares. Therefore, the dividend payment resulted in recording of a Canadian corporate “Part VI.1” tax payable of $424,576, which is due during the three months ending March 31, 2014. We are entitled to a deduction for tax purposes equal to 3.5 times Part VI.1 taxes paid. Therefore, future Canadian corporate tax savings, if able to be realized, should approximately offset the preferred dividend tax expense.
Mr. Labate appointed as our new Chief Financial Officer
On April 12, 2013, our Board of Directors appointed Mr. John Labate to serve as our Chief Financial Officer commencing on or about May 9, 2013. Mr. Schaudies, our current Chief Financial Officer, who previously announced his intent to resign for personal reasons, will continue to serve as our principal financial and accounting officer for a transition period to assist with an orderly transition of his duties as Chief Financial Officer until on or about May 9, 2013.
Annual General Meeting set for June 20, 2013
Our Board of Directors has set the date for our 2013 Annual General and Special Meeting of shareholders to be held on June 20, 2013 at 10:00 a.m. (Vancouver time) at the offices of Stikeman Elliott LLP, Suite 1700, Park Place, 666 Burrard Street, Vancouver, BC, Canada V6C 2X8. We anticipate that our Proxy Statement and the form of proxy will first be mailed to holders of our common shares and Series A Preferred Shares on or about May 27, 2013.
Property Highlights for the First Quarter 2013:
| · | Pan project – Permitting continues to advance with the publication of the Draft Environmental Impact Statement by the Bureau of Land Management (“BLM”). In addition, a Water Pollution Control Permit was received from the Nevada Division of Environmental Protection (“NDEP”). Permitting remains on schedule with production planned in 2014. |
| · | Spring Valley project – Barrick has informed us that they have earned a 60% interest in the Spring Valley property as of April 19, 2013, and intend on incurring the additional $8,000,000 in exploration expenditures to increase their interest in the property to 70%. |
| · | Gold Rock project – A mining Plan of Operations was submitted to the BLM and the NDEP in March 2013. It was declared complete by the agencies, starting the EIS process. Gold Rock is scheduled to be the Company's second operating gold mine and is currently targeted for production in 2016. |
Activities on our properties in the first quarter ended March 31, 2013, and up to the date of this Quarterly Report on Form 10-Q, are described in further detail below.
The map below shows the location of our properties located in Nevada, USA.
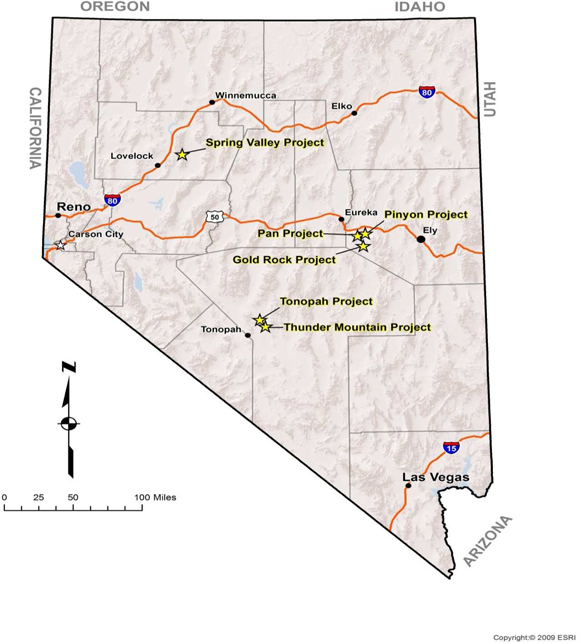
Pan Project, White Pine County, Nevada
The Pan property is located at the northern end of the Pancake mountain range in western White Pine County, Nevada, approximately 22 miles southeast of Eureka, Nevada, and 50 miles west of Ely, Nevada. Access is via a seven mile dirt road running south-southeast from US Highway 50, at a point about 17 miles southeast of Eureka, Nevada. Eureka has a population of about 2,000. Water is readily available from wells west of the property.Permitting and engineering are underway to extend power lines to the property.
Highlights
Permitting continues to be a high priority with a goal of initial production on the Pan project in 2014. The Draft Environmental Impact Statement (DEIS) has been completed and was released by the BLM for public comment. We held public information meetings on April 2 and 3, 2013 in Ely and Eureka, Nevada. The BLM held public comment meetings on April 9 and 10, 2013 in Ely and Eureka, Nevada. Applications for over 40 other permits are in progress. We have received some critical permits such as the Water Pollution Control Permit, which authorizes the construction, operation and closure of approved mining facilities once the EIS is complete and a Record of Decision has been received from the BLM. This permit reflects that there are no surface waters in the project area and the proposed pit does not reach the groundwater table.
Our engineers continue to optimize details of the proposed mining operation in order to streamline construction and keep costs low. On-going efforts during the quarter included:
| · | Optimizing pit plans and mining equipment needs |
| · | Updating capital and operating costs |
| · | Continuing gold recovery tests on bulk samples from the mining area |
| · | Work with Jacobs Engineering for detail design of facilities |
| · | Detailed engineering of power line to site |
Mineral Reserves and Resources
Cautionary Note to U.S. Investors– In this Quarterly Report on Form 10-Q we use the terms “mineral resource”, “measured mineral resource”, “indicated mineral resource” and “inferred mineral resource”, which are geological and mining terms as defined in accordance with NI 43-101 under the guidelines adopted by CIM, as CIM Standards in Mineral Resources and Reserve Definition and Guidelines. U.S. investors in particular are advised to read carefully the definitions of these terms as well as the “Cautionary Note to U.S. Investors Regarding Reserve and Resource Estimates” above.
A resource estimate for the Pan project was reported in October 2011 based on results from 2011 drilling. The Measured and indicated resource estimate exceeds one million ounces of gold. The 1.13 million ounces of gold are contained in 37 million tonnes of 0.49 grams per tonne (gpt) gold in the Measured category and 43 million tonnes of 0.40 gpt gold in the Indicated category using a 0.14 gpt gold cutoff grade. The updated resource was prepared by Gustavson Associates, LLC (“Gustavson”). The mineral resources are summarized below.
Updated Resource Estimate, Pan Project, Nevada
| Measured Resource | |
| Cutoff (gpt) | | | Tonnes | | | Grade (gpt) | | | Gold ounces | |
| | 0.27 | | | | 27,352,000 | | | | 0.59 | | | | 520,000 | |
| | 0.21 | | | | 30,857,000 | | | | 0.55 | | | | 547,000 | |
| | 0.14 | | | | 36,920,000 | | | | 0.49 | | | | 579,000 | |
| | 0.07 | | | | 50,924,000 | | | | 0.38 | | | | 622,000 | |
| Indicated Resource | |
| Cutoff (gpt) | | | Tonnes | | | Grade (gpt) | | | Gold ounces | |
| | 0.27 | | | | 27,126,000 | | | | 0.52 | | | | 453,000 | |
| | 0.21 | | | | 32,652,000 | | | | 0.47 | | | | 495,000 | |
| | 0.14 | | | | 43,118,000 | | | | 0.40 | | | | 551,000 | |
| | 0.07 | | | | 73,925,000 | | | | 0.27 | | | | 645,000 | |
| Measured Plus Indicated Resource | |
| Cutoff (gpt) | | | Tonnes | | | Grade (gpt) | | | Gold ounces | |
| | 0.27 | | | | 54,478,000 | | | | 0.56 | | | | 974,000 | |
| | 0.21 | | | | 63,509,000 | | | | 0.51 | | | | 1,042,000 | |
| | 0.14 | | | | 80,037,000 | | | | 0.44 | | | | 1,130,000 | |
| | 0.07 | | | | 124,849,000 | | | | 0.32 | | | | 1,268,000 | |
| Inferred Resource | |
| Cutoff (gpt) | | | Tonnes | | | Grade (gpt) | | | Gold ounces | |
| | 0.27 | | | | 1,771,000 | | | | 0.58 | | | | 33,000 | |
| | 0.21 | | | | 2,229,000 | | | | 0.51 | | | | 37,000 | |
| | 0.14 | | | | 3,928,000 | | | | 0.36 | | | | 45,000 | |
| | 0.07 | | | | 9,693,000 | | | | 0.20 | | | | 63,000 | |
Note: The tonnage and total ounces of gold were determined from the statistical block model. Average grades were calculated from the tonnage and total ounces and then rounded to the significant digits shown. Calculations based on this table may differ due to the effect of rounding. See “Cautionary Note to U.S. Investors Regarding Reserve and Resource Estimates.”
A Feasibility Study was completed November 15, 2011 showing robust economics for the Pan project. Mineral reserves were based upon a design pit that maximized revenue based on a $1,200 per ounce three-year trailing average price of gold. Cutoff grades of 0.21 gpt in the South pit and 0.27 gpt in the North & Central pits produced the project’s highest NPV.
Table 2: Total Pan Mineral Reserves, November 2011
Pit
Area | | Cutoff Grade
(grams/tonne) | | | Metric Tonnes
(x 1000) | | | Gold Grade
(grams/tonne) | | | Ounces Gold
(x 1000) | |
| Proven | |
| North & Central | | | 0.27 | | | | 13,085 | | | | 0.60 | | | | 251 | |
| South | | | 0.21 | | | | 12,160 | | | | 0.61 | | | | 236 | |
| All Pits | | | | | | | 25,245 | | | | 0.60 | | | | 487 | |
| Probable | |
| North & Central | | | 0.27 | | | | 10,994 | | | | 0.50 | | | | 178 | |
| South | | | 0.21 | | | | 12,073 | | | | 0.51 | | | | 199 | |
| All Pits | | | | | | | 23,067 | | | | 0.51 | | | | 377 | |
| Proven plus Probable | |
| North & Central | | | 0.27 | | | | 24,078 | | | | 0.55 | | | | 429 | |
| South | | | 0.21 | | | | 24,233 | | | | 0.56 | | | | 435 | |
| All Pits | | | | | | | 48,311 | | | | 0.56 | | | | 864 | |
Note: The tonnage and total ounces of gold were determined from the statistical block model. Average grades were calculated from the tonnage and total ounces and then rounded to the significant digits shown. Calculations based on this table may differ due to the effect of rounding. See “Cautionary Note to U.S. Investors Regarding Reserve and Resource Estimates.”
Mining and Production
The Pan gold deposit contains mineralization at or near the surface and spatially distributed in a manner that is ideal for open pit mining methods. The results of mineral extraction tests indicate that ore from the Pan deposit can be processed by conventional heap leaching methods. Ore will be loaded into 150-ton haul trucks and transported to the primary jaw crusher near the mouth of the pit. The crushed ore material will be agglomerated, and conveyed to the heap leach pad. Pregnant solutions will be treated in an adsorption/desorption refining (ADR) plant. Crush size and leach kinetics are based on metallurgical testing used in the Feasibility Study. Additional testing for optimization is underway.
Operating Costs from Feasibility Study
| Description | | U.S.$
Per ton of ore | | | U.S.$
Per oz of gold | |
| Mining | | | 2.78 | | | | 227.97 | |
| Processing | | | 2.58 | | | | 211.82 | |
| G&A | | | 0.37 | | | | 30.49 | |
| Production Taxes | | | 0.52 | | | | 42.99 | |
| Contingency – 10% | | | 0.29 | | | | 23.51 | |
| Total Operating Cost | | $ | 6.54 | | | $ | 536.78 | |
Initial Capital Costs from Feasibility Study
| Description | | U.S.$ |
| Construction and owner’s capital | | 84.2 million |
| Contingency (5%) | | 6.8 million |
| Working capital and inventory | | 8.2 million |
| Total | | $99.2 million |
The Feasibility Study was prepared to the standards of NI 43-101. The open pit Mineral reserves and resources were completed by Gustavson, with Terre Lane and Donald E. Hulse acting as the qualified persons. An updated report “Updated NI 43-101 Technical Report, Feasibility Study for the Pan Project, White Pine County, Nevada” dated November 29, 2012 was filed to clarify responsibilities of the Qualified Persons. This updated report made no changes in the feasibility study numbers.
We incurred $412,494 and $150,404 of expenditures at the Pan project in the three months ended March 31, 2013 and 2012, respectively. These expenditures were primarily for salaries and labor, which were 74% of mineral exploration expenditures during the three months ended March 31, 2013. For the comparable period during 2012, expenditures were primarily for salaries and labor, which were 55% of mineral exploration expenditures during the three months ended March 31, 2012.
During the three months ended March 31, 2013, we capitalized into Property, equipment and mine development $831,158 of Pan expenditures for permitting, mitigation, engineering, site characterization, metallurgy, mine planning, and detailed design.
Spring Valley Project, Pershing County, Nevada
The Spring Valley property is located in the Spring Valley Mining District, Pershing County, Nevada, approximately 20 miles northeast of the town of Lovelock. The property is accessed from Nevada State Highway 50, which extends eastward from US Interstate 80 and is paved to the Rochester turn-off; thereafter it is a dirt road. Water for exploration purposes is available from water wells drilled on the property under temporary grant of water rights. Power is accessible from existing power lines; however capacity is unknown and may be limited.
Gold has been intercepted over an area 5,200 feet long by 3,500 feet wide that extended to a depth of 1,400 feet, suggesting the presence of a large mineral system. The Spring Valley project is under an exploration and option agreement to enter into a joint venture with Barrick. Barrick is funding 100% of the costs to earn an interest in the project.Barrick spent $10.04 million on the project in 2012 and has informed us that they have incurred $30,000,000 in exploration expenditures as of April 19, 2013, completing the earn-in requirement for a 60% interest in the property. Additionally, Barrick stated their intention to spend an additional $8,000,000 in exploration expenditures to increase their interest in the property to 70%. Exploration expenditures in 2013 will focus on in-fill drilling in the main resource area.
Spring Valley has an estimated resource of 2.16 million ounces of gold, consisting of 0.93 million ounces in the measured category and 1.23 million ounces in the Indicated category at a cut-off grade of 0.14 grams per tonne (gpt). There is an additional inferred resource of 1.97 million ounces of gold at the same cut-off grade. The measured resource is contained within 59.0 million tonnes grading 0.49 gpt, the indicated resource is contained within 85.8 million tonnes grading 0.45 gpt and the inferred resource is contained within 103.9 million tonnes grading 0.59 gpt.The report was prepared by William J. Crowl, Donald E. Hulse, Donald J. Baker, Terre A. Lane, Deepak Malhotra, under the supervision of Gustavson Associates LLC who are “independent” and “qualified persons” under NI 43-101.An updated report “Updated NI 43-101 Technical Report on the Spring Valley Project, Pershing County, Nevada” dated November 29, 2012 was filed to clarify responsibilities of the Qualified Persons and to clarify language regarding capping, density, and cut-off values. This updated report made no changes to the resource estimate.
Measured and indicated resources are estimated pursuant to Canadian industry standards. See “Cautionary Note to U.S. Investors Regarding Reserve and Resource Estimates” above.The Spring Valley project is without known reserves, as defined under SEC Guide 7, and the proposed program for the property is exploratory in nature.
In the three months ended March 31, 2013 and 2012, we incurred $2,561 and $59,894, respectively. The March 31, 2012 costs primarily related to funding engineering and legal costs incurred on the portion of the Seymork land that falls outside of the area of interest under the Barrick joint venture agreement.
Gold Rock Project, White Pine County, Nevada
The Gold Rock property is situated in the eastern Pancake Range in western White Pine County, Nevada. The property is 8 miles southeast of our Pan project. Access is via the Green Springs road from US Highway 50 approximately 65 miles from Ely, Nevada. Water for exploration purposes is available from wells in the region under temporary grant of water rights. It is anticipated that power will be available from the line being extended to serve the nearby Pan Project.
The first phase of a drilling program to expand the gold resource at Gold Rock was begun in 2012 and completed during the quarter. Highlights of the drill results include 106 meters of 1.23 gpt gold in GR12-17 and 83 meters of 0.89 gpt gold in GR12-01c. See press release from January 7, 2013 for additional drill results. Additional assay results are pending. Drill targets outside of the resource area have been identified from surface mapping and sampling along a 12 km trend. Additional surface work is planned to better define these targets.
A mining Plan of Operations was submitted to the BLM on March 21, 2013. It was declared complete by the BLM, officially beginning the Environmental Impact Statement process. Gold Rock is scheduled to be the Company's second operating gold mine and is currently targeted for production in 2016.
An NI 43-101 Technical Report based on historic drilling and fiscal year 2011 drilling estimated a new Indicated resource of 310,000 ounces (oz) of gold and inferred resource of 331,000 oz of gold. The gold resource, which appears to be open in all directions, represents a significant increase above the previously reported 344,700 oz historic estimate. The indicated resource is contained in 12,968,000 tonnes at a grade of 0.74 grams per tonne (gpt) gold. The inferred resource is contained in 17,894,000 tonnes at a grade of 0.58 gpt gold. The new resource includes results from 466 verified historic drill holes and 31 verification holes that we drilled in 2011. The Gold Rock project lies 8 kilometers southeast of our Pan project.
The 2,500 meter-long gold resource extends north and south from the historic Easy Junior open pit gold mine. The inferred resource includes cyanide solution assays. These solution assays, from historic drill holes by previous owners, appear to significantly understate the gold grade as compared to fire assay results. The indicated resource was calculated using only samples with verified fire assays.
A rigorous two-stage verification program was used to validate the historic drill hole database at Gold Rock. This review resulted in validation of drill results from 52,000 meters of previous drilling in 466 holes. Our 2011 drilling program independently confirmed gold grades, geology, and rock alteration reported from the earlier drill holes.
| Resource Estimate, Gold Rock Project, Nevada | |
| | | | Inferred Resource | | | Indicated Resource | |
| Cutoff (gpt) | | | Tonnes | | | Grade (gpt) | | | Gold ounces | | | Tonnes | | | Grade (gpt) | | | Gold ounces | |
| | 0.51 | | | | 7,866,000 | | | | 0.83 | | | | 211,000 | | | | 7,820,000 | | | | 0.98 | | | | 247,000 | |
| | 0.41 | | | | 10,857,000 | | | | 0.73 | | | | 255,000 | | | | 9,593,000 | | | | 0.89 | | | | 273,000 | |
| | 0.27 | | | | 17,894,000 | | | | 0.58 | | | | 331,000 | | | | 12,968,000 | | | | 0.74 | | | | 310,000 | |
| | 0.14 | | | | 30,460,000 | | | | 0.42 | | | | 409,000 | | | | 18,010,000 | | | | 0.59 | | | | 343,000 | |
Note: The tonnage and total ounces of gold were determined from the statistical block model. Average grades were calculated from the tonnage and total ounces and then rounded to the significant digits shown. Calculations based on this table may differ due to the effect of rounding. See “Cautionary Note to U.S. Investors Regarding Reserve and Resource Estimates.”
The resource estimate included data available through February, 2012, and was prepared by Gustavson, under the direction of Donald E. Hulse and Donald J. Baker, independent qualified persons. See “NI 43-101 Technical Report on Resources, Gold Rock Project, White Pine County, Nevada” dated April 10, 2012. An updated report “Updated NI 43-101 Technical Report on Resources Gold Rock Project, White Pine County, Nevada” dated November 29, 2012 was filed to clarify responsibilities of the Qualified Persons and to clarify language regarding capping, density, and cut-off values. This updated report made no changes to the resource estimate.
We incurred $1,351,678 of expenditures at the Gold Rock project in the three months ended March 31, 2013 of which 26% was related to salaries and wages, 39% related to reverse circulation drilling costs, 13% related to the cost of engineering studies and the balance on geological programs and general administrative costs. For the comparable period in 2012, we incurred $473,228, of which 26% was related to salaries and wages, 20% were cost of engineering studies and the balance on geological programs.
Tonopah Project, Nye County, Nevada
The Tonopah property is located in Nye County, Nevada, approximately 15 miles northeast of the town of Tonopah, 210 miles northwest of Las Vegas and 236 miles southeast of Reno. The property is over the northeastern flank of the San Antonio Mountains and in the Ralston Valley. Water for exploration purposes is available from water wells for a fee from municipal sources.Power is accessible from existing power lines crossing the property, however capacity is unknown and may be limited.
There was no new exploration activity on the property during the quarter.
We incurred $5,129 and $77,684 of expenditures at the Tonopah project in the three months ended March 31, 2013 and 2012, respectively. The expenditures were comprised of 46% related to engineering and consulting expenses for the three months ended March 31, 2013 and 68% related to engineering and consulting expenses for the comparable period in 2012.
Thunder Mountain Project, Nye County, Nevada
Thunder Mountain is a gold and silver rich epithermal vein and disseminated gold system hosted in rhyolite tuffs and flow dome complexes located six miles southeast of the Tonopah project in Nye County, Nevada.
There was no new exploration activity on the project during the quarter.
We incurred minimal expenditures at the Thunder Mountain project in the three months ended March 31, 2013. For the comparable period in 2012, we incurred $196,029 of which 35% was related to drilling and 30% related to salaries and wages.
Golden Eagle Project, Ferry County, Washington
The Golden Eagle property is located on private land in the Eureka (Republic) mining district in Ferry County, Washington. The property is two miles northwest of the town of Republic, Washington and is accessed by the Knob Hill county road.
There was no new exploration activity on the project during the quarter.
We incurred $11,356 of expenditures at the Golden Eagle project in the three months ended March 31, 2013 primarily related to property maintenance and taxes. For the comparable period in 2012, we incurred $21,101 primarily for engineering studies.
Pinyon Project, White Pine County, Nevada
Pinyon is a disseminated gold target near the Gold Rock and Pan projects. Exposed mineralization is hosted in similar rock types with similar alteration as seen at Pan and Gold Rock. A portion of the claims were acquired in 2012 as part of an Exploration, Development and Mine Operating Agreement with Aurion Resources. The Pinyon property is located in White Pine County, Nevada approximately 20 miles southeast of Eureka, Nevada. It is 10 miles north of the Gold Rock project and 6 miles east of the Pan project. Access is by 5 miles of dirt road running south-southeast from US Highway 50, at a point about 17 miles southeast of Eureka, Nevada. Water is available from wells that service the Pan and Gold Rock projects. Power is expected to be available from the Pan or Gold Rock projects. On January 2, 2013 we paid a lease payment of $41,265 (U.S.$41,884).
There was no new exploration activity on the project during the quarter.
We incurred $82,214 and nil of expenditures at the Pinyon project in the three months ended March 31, 2013 and 2012, primarily for property maintenance and taxes.
Results of Operations
Three months ended March 31, 2013 compared to the three months ended March 31, 2012
The following table summarizes our results of operation for the three months ended March 31, 2013 compared to the three months ended March 31, 2012:
| | | March 31, 2013 | | | March 31, 2012 | |
| | | | | | | |
| Expenses | | | | | | | | |
| Consulting | | $ | 218,456 | | | $ | 22,720 | |
| Depreciation | | | 117,824 | | | | 83,710 | |
| Interest and bank charges | | | 1,074 | | | | 661 | |
| Investor relations | | | 5,553 | | | | 59,758 | |
| Legal, audit and accounting | | | 972,136 | | | | 247,617 | |
| Management fees | | | - | | | | (8 | ) |
| Mineral exploration expenditures (see schedule) | | | 1,818,446 | | | | 1,034,261 | |
| Office and administration | | | 240,957 | | | | 187,134 | |
| Salaries and benefits | | | 1,444,227 | | | | 1,251,600 | |
| Transfer agent and filing fees | | | 38,388 | | | | 37,675 | |
| Travel | | | 70,988 | | | | 67,820 | |
| Operating loss | | | 4,928,049 | | | | 2,992,948 | |
| | | | | | | | | |
| Other income (expense) | | | 10,860,975 | | | | 54,287 | |
| Income tax (expense) | | | (55,374 | ) | | | (133,732 | ) |
| | | | | | | | | |
| Net loss | | $ | (5,877,552 | ) | | $ | 3,072,393 | |
Significant differences between the periods are as follows:
Consulting expense during the three months ended March 31, 2013 was $218,456 compared to $22,720, an increase of $195,736. This was primarily due to a consulting arrangement with our former Chief Executive Officer which was entered into during the three months ended June 30, 2012, see “Related Party Transactions” discussion below. In addition, consulting expenses in 2013 included costs related to third-party executive compensation studies. Further, there was an increase in the non-cash estimated fair value of stock based compensation for stock options granted to consultants of $53,385 compared to $(27,631) in the comparable period. The stock based compensation expense for our former Chief Executive Officer is now recorded within Consulting expense as compared to Salaries & Benefits prior to his consulting arrangement.
Depreciation expense during the three months ended March 31, 2013 was $117,824 compared to $83,710 during the comparable period of 2012, an increase of $34,114, or 41%. This was primarily due to a 19% increase in depreciable assets from the comparable period of 2012.
Legal, audit and accounting totaled $972,136 for the three months ended March 31, 2013, compared to $247,617 in the comparable period, an increase of $724,519. We incurred a significant increase in legal expenses related to general, land and other corporate matters. We also continued to utilize financial consultants during the three months ended March 31, 2013 to meet the demands related to SEC and SEDAR filing requirements and the investigation of different financing options to meet our capital demands as we bring the Pan Gold project into production.
Mineral exploration expenses for the three months ended March 31, 2013 increased $784,185, or 76%, from the same period of 2012. Details of the expenses in each period may be found in the schedule of mineral exploration expenses to the unaudited consolidated interim financial statements. Exploration levels are determined by the success of previous exploration programs on each project and cash available to fund additional programs. Exploration salaries and labor include the non-cash estimated fair value of stock based compensation for stock options granted to technical employees for the three months ended March 31, 2013 of $120,854 compared to $42,019 during the comparable period of 2012.
Office and administration expensesfor the three months ended March 31, 2013 were $240,957 compared to $187,134 during the comparable period of 2012, an increase of $53,823 or 29%. This increase is a result of additional overhead costs related to our increase in employees, including increased rent expense in both our Englewood and Ely offices, increased information system costs due to our continued growth and higher premiums for our 2013 Director’s and Officer’s insurance policy.
Salaries and benefits during the three months ended March 31, 2013 were $1,444,227 inclusive of $394,970 of non-cash stock based compensation, compared to $1,251,600 and $680,719 during the comparable period of 2012, respectively, an increase of $192,627, or 15%. We use an option pricing model to estimate the value of stock options granted to officers, directors, employees and consultants. We use the Black-Scholes model, which requires considerable judgment selecting the subjective assumptions that are critical to the results produced by the model, to calculate the estimated fair value. We record the estimated fair value as an expense on a pro-rata basis over the vesting period of the options. The cash component of salaries and benefits has increased period over period as a result of 10 additional employees as of March 31, 2013 from 27 as of March 31, 2012 as well as a cash bonus accrual of $418,796, which was paid out on April 9, 2013.
Other income (expense) for the three months ended March 31, 2013 was an income of $10,860,975 compared to $54,287 during the comparable period of 2012, a net change of $10,806,688. During the three months ended March 31, 2013 we recorded a gain on the change in the fair value of derivative liabilities of $9,448,970 ($576,744 warrant liability, $8,872,401 derivative preferred liability and $175 preferred share issuance cost expense) and a foreign exchange gain of $1,370,342.
US GAAP requires the value of share purchase warrants issued with an exercise price denominated in a currency other than the functional currency (Canadian dollar) to be considered as a liability and this liability is stated at fair value for each reporting period with changes in the liability being recorded through earnings. The share purchase warrants included in the public offering of units that closed in July 2012, had an exercise price of U.S.$1.85. We adjusted the fair value of the warrant liability as of December 31, 2012 to $1,166,381, calculated using the Black-Scholes option pricing model. As of March 31, 2013, the fair value of the warrant liability was adjusted to $589,637, calculated using the following assumptions: expected life of 9.24 months; volatility of 60%; no dividend yield; a risk free interest rate of 0.16% and an exchange rate of 1.016. The income of $576,744 has been reported in Other Income in the Consolidated Statement of Operations, for the three months ended March 31, 2013.
Due to the mandatory and voluntary conversion features, we recorded a derivative liability to account for the conversion features of the Series A Preferred Shares. An independent third party was engaged by us to perform a valuation of the associated liability based upon the terms of the Preferred shares. Pursuant to derivative accounting guidance under ASC 815, the embedded derivative liability is to be re-measured at each reporting period with changes in the liability being recorded through earnings. The fair value of the embedded derivative liability as of March 31, 2013 was U.S.$18,167,061, calculated using a volatility of 45.8%, a credit spread of 20.0%, common stock closing price of U.S.$1.22, risk-free rate of 0.89% and USD to CAD exchange rate of 1.016. The gain of $8,872,401 related to the change in fair value has been reported in Other Income in the Consolidated Statement of Operations, for the three months ended March 31, 2013. The change in the fair value of the derivative liability as of March 31, 2013 was primarily due to the decrease in our stock price from U.S.$1.39 as of December 31, 2012 to U.S.$1.22 as of March 31, 2013.
Income tax expense for the three months ended March 31, 2013 was $55,374 compared to $133,732 during the comparable period of 2012. During the three months ended March 31, 2013 we recorded a tax recovery of $369,902 which relates to a decrease of the future income tax liability that is associated with the acquisition of the Pan-Nevada and Gold Rock projects. This was offset by a Canadian preferred dividend tax expense of $424,576, see discussion above “Preferred Series A Dividend Declared and Paid.”
Liquidity and Capital Resources
As of March 31, 2013, we had working capital of $68,382,020, consisting of current assets of $70,793,617 and current liabilities of $4,109,901. This represents a decrease of $6,840,468 from the working capital balance of $73,524,184 as of December 31, 2012. Consistent with our plans, our working capital balance fluctuates as we use cash to fund our exploration, development activities and other operating expenses.
We have not generated any revenues from operations. These consolidated financial statements have been prepared on a going concern basis which assumes we will be able to realize our assets and discharge our liabilities in the normal course of business in the foreseeable future. We have incurred operating losses for the three months ended March 31, 2013 of $4,928,049; further operating losses are anticipated in the development of our business. Since inception of May 14, 1996 to March 31, 2013 our accumulated deficit totals $87,018,824. Management believes that our cash on hand of $70,255,117 at March 31, 2013 is sufficient to finance exploration and development activities and operations through at least the next twelve months.
Our ability to continue on a going concern basis beyond the next twelve months depends on our ability to successfully raise additional financing for the substantial capital expenditures required to achieve planned principal operations. While we have been successful in the past in obtaining financing, there is no assurance that we will be able to obtain adequate financing in the future or that such financing will be on terms acceptable to us.
We have historically relied on equity financings to fund our operations. From inception through to March 31, 2013, we received $103,849,381 in cash, services, and other consideration through issuance of shares of our common stock and $68,295,156 through issuance of shares of our preferred shares. As of March 31, 2013, we did not have any outstanding debt.
Our most significant expenditures for the remainder of 2013 are expected to be costs associated with the development of our Pan project and further exploration of our other properties. We also continue to incur operating expenses approximating $850,000 per month for salaries and benefits (exclusive of non-cash stock-based compensation), professional fees, community relations, investor relations, travel and other overhead expenses at our Colorado executive offices and Ely, Nevada locations.
Net cash used in operating activities was $2,870,488 during the three months ended March 31, 2013 compared to $2,385,591 during the comparable period in 2012, an increase of $484,897. The increase of cash used in operating activities during the 2013 period is primarily attributable to an increase in the mineral exploration expenditures of $784,185 driven by drilling activity at our Gold Rock project. In addition, legal, audit and accounting expenses increased by $724,519, as discussed above. These items were offset by a Foreign exchange gain of $1,370,342 on our USD denominated cash balances during the period due to the U.S. Dollar to Canadian Dollar exchange rate increasing from 0.9949 as of December 31, 2012 to 1.016 as of March 31, 2013.
Net cash used in investing activities for the three months ended March 31, 2013 was $1,982,433, compared to net cash used by investing activities of $1,540,245 for the three months ended March 31, 2012. Although most of our exploration stage expenditures are recorded as an expense rather than an investment, we capitalize the acquisition cost of land and mineral rights and certain equipment that has alternative future uses or significant salvage value, including furniture, and electronics, and the cost of these capitalized assets is reflected in our investing activities. We also capitalize permitting and engineering activities as part of our plans to advance the Pan project. Cash used in investing activities during the three months ended March 31, 2013 consisted of mineral property acquisition costs of $1,134,576, permitting and engineering activities on the Pan project of $831,158, and additional equipment purchases of $16,305.
Net cash used in financing activities for the three months ended March 31, 2013 was nil. During the comparable period in 2012, cash provided by financing activities was $125,744, consisting of the issuance of shares of our common stock as a result of options and warrants exercised during the period.
Contractual Obligations
We have obligations under operating leases for our corporate offices in Englewood, Colorado and Ely, Nevada and office equipment until 2020. Future minimum lease payments for non-cancellable leases with initial lease terms in excess of one year are included in the table below.
In addition, we have cancellable contract obligations related to consulting service agreements until 2016.
| | | Payments due by period | |
| | | Current Year | | | One – Three
Years | | | Three –
Five Years | | | Thereafter | | | Total | |
| Operating Lease obligations | | $ | 205,755 | | | $ | 582,674 | | | $ | 560,199 | | | $ | 688,577 | | | $ | 2,037,205 | |
| Contract obligations | | | 106,566 | | | | 43,925 | | | | 1,016 | | | | - | | | | 151,507 | |
| Total | | $ | 312,322 | | | $ | 626,599 | | | $ | 561,215 | | | $ | 688,577 | | | $ | 2,188,713 | |
Off-balance sheet arrangements
There are no off balance sheet arrangements.
Inflation
We do not believe that inflation has had a significant impact on our consolidated results of operations or financial condition.
Environmental Compliance
Our current and future exploration and development activities, as well as our future mining and processing operations, are subject to various federal, state and local laws and regulations in the countries in which we conduct our activities. These laws and regulations govern the protection of the environment, prospecting, development, production, taxes, labor standards, occupational health, mine safety, toxic substances and other matters. We expect to be able to comply with those laws and do not believe that compliance will have a material adverse effect on our competitive position. We intend to obtain all licenses and permits required by all applicable regulatory agencies in connection with our mining operations and exploration activities. We intend to maintain standards of environmental compliance consistent with regulatory requirements.
We have an obligation to reclaim our properties after the surface has been disturbed by exploration methods at the site. As of March 31, 2013, we have accrued $6,096 as a current liability included in Accounts payable and accrued liabilities and $47,764 as a long-term liability, compared to $6,656 as a current liability at December 31, 2012, related to reclamation and other closure requirements at our properties. These liabilities are covered by restricted cash deposits totaling $871,597 at March 31, 2013 as compared to $853,110 as of December 31, 2012. We have accrued as liabilities what management believes is the present value of our best estimate of the liabilities as of March 31, 2013; however, it is possible that our obligations may change in the near or long term depending on a number of factors.
Critical accounting policies
Critical accounting estimates used in the preparation of the financial statements include our estimate of recoverable value on our property, equipment and mine development, site reclamation and rehabilitation as well as the value assigned to stock-based compensation expense and derivative liabilities. These estimates involve considerable judgment and are, or could be, affected by significant factors that are out of our control.
The factors affecting stock-based compensation include estimates of when stock options might be exercised, stock price volatility and expected forfeitures. The timing for exercise of options is out of our control and will depend, among other things, upon a variety of factors including the market value of our shares and financial objectives of the holders of the options. We used historical data to determine volatility in accordance with Black-Scholes modeling; however, the future volatility is inherently uncertain and the model has its limitations. While these estimates can have a material impact on the stock-based compensation expense and hence results of operations, there is no impact on our financial condition.
Embedded conversion derivative liabilities are recorded as liabilities at their estimated fair value at the date of issuance, with subsequent changes in estimated fair value recorded in other income (expense) in our statement of operations in each subsequent period. The embedded conversion derivative liabilities are measured at estimated fair value using either the Monte Carlo model or Black-Scholes model. Inherent in these models are assumptions related to expected stock-price volatility, expected life, risk-free interest rate and dividend yield. We estimate volatility at the date of issuance, and at each subsequent reporting period, based on historical volatility. The risk-free interest rate is based on the U.S. Treasury zero-coupon yield curve. The expected life of the embedded conversion derivative liabilities is assumed to be equivalent to their remaining contractual term. The dividend rate is based on contractual terms of the host contract or historical dividend performance on our common shares. The assumptions used in calculating the estimated fair value of the embedded derivative liabilities represent our best estimates; however, these estimates involve inherent uncertainties and the application of management judgment. As a result, if factors change and different assumptions are used, the embedded derivative liabilities and the change in estimated fair value could be materially different.
Our recoverability evaluation of mineral properties and equipment is based on market conditions for minerals, underlying mineral resources associated with the assets and future costs that may be required for ultimate realization through mining operations or by sale. We are in an industry that is exposed to a number of risks and uncertainties, including exploration risk, development risk, commodity price risk, operating risk, ownership and political risk, funding and currency risk, as well as environmental risk. Bearing these risks in mind, we have assumed recent world commodity prices will be achievable. We have considered the mineral resource reports by independent engineers on the Tonopah, Spring Valley, Gold Rock, Pan and Golden Eagle projects in considering the recoverability of the carrying costs of the mineral properties. All of these assumptions are potentially subject to change and most are out of our control; however, changes to the assumptions are not determinable. Accordingly, there is always the potential for a material adjustment to the value assigned to mineral properties and equipment.
We have an obligation to reclaim its properties after the surface has been disturbed by exploration methods at the site. As a result we have recorded a liability for the fair value of the reclamation costs we expect to incur. We estimate applicable inflation and credit-adjusted risk-free rates as well as expected reclamation time frames. To the extent that the estimated reclamation costs change, such changes will impact future reclamation expense recorded.
| Item 3. | Quantitative and Qualitative Disclosures about Market Risk. |
During the period covered by this Quarterly Report on Form 10-Q there has not been a material change in our market risk from the information disclosed in our Annual Report on Form 10-K filed with the SEC on March 12, 2013.
| Item 4. | Controls and Procedures. |
Disclosure Controls and Procedures
At the end of the period covered by this Quarterly Report on Form 10-Q for the three months ended March 31, 2013, an evaluation was carried out under the supervision of and with the participation of our management, including the Chief Executive Officer (“CEO”) and Chief Financial Officer (“CFO”), of the effectiveness of the design and operation of our disclosure controls and procedures (as defined in Rule 13a-15(e) and Rule 15d-15(e) under the Securities Exchange Act of 1934, as amended (“Exchange Act”)). Based on that evaluation the CEO and the CFO have concluded that as of the end of the period covered by this Quarterly Report on Form 10-Q, our disclosure controls and procedures are effective in ensuring that: (i) information required to be disclosed by us in reports that we file or submit to the SEC under the Exchange Act are recorded, processed, summarized and reported within the time periods specified in applicable rules and forms and (ii) material information required to be disclosed in our reports filed under the Exchange Act is accumulated and communicated to our management, including our CEO and CFO, as appropriate, to allow for accurate and timely decisions regarding required disclosure.
Changes in Internal Control over Financial Reporting
During the period covered by this Quarterly Report on Form 10-Q, there were no changes to internal control over financial reporting that materially affected or are reasonably likely to materially affect our internal control over financial reporting.
PART II - OTHER INFORMATION
| Item 1. | Legal Proceedings. |
None.
There are no material changes from the risk factors previously disclosed in Midway’s Annual Report on Form 10-K for the period ended December 31, 2012, as filed on March 12, 2013 with the SEC.
| Item 2. | Unregistered Sale of Equity Securities and Use of Proceeds. |
None.
| Item 3. | Defaults Upon Senior Securities. |
None.
| Item 4. | Mine Safety Disclosures. |
We consider health, safety and environmental stewardship to be a core value for our Company.
Pursuant to Section 1503(a) of the recently enacted Dodd-Frank Act, issuers that are operators, or that have a subsidiary that is an operator, of a coal or other mine in the United States are required to disclose in their periodic reports filed with the SEC information regarding specified health and safety violations, orders and citations, related assessments and legal actions, and mining-related fatalities under the regulation of the Federal Mine Safety and Health Administration (‘‘MSHA’’) under theFederal Mine Safety and Health Act of 1977(the ‘‘Mine Act’’). During the three months ended March 31, 2013, our U.S exploration and development properties were not subject to regulation by the MSHA under the Mine Act and consequently no disclosure is required under Section 1503(a) of the Dodd-Frank Act.
| Item 5. | Other Information. |
U.S. shareholders of shares of our common stock (the “Common Shares”) should be aware that the Company believes it was classified as a PFIC during the taxable year ended December 31, 2012, and based on current business plans and financial projections, management believes there is a significant likelihood that the Company will be a PFIC during the current taxable year. If the Company is a PFIC for any year during a U.S. shareholder’s holding period, then such U.S. shareholder generally will be required to treat any gain realized upon a disposition of common shares, or any so-called “excess distribution” received on their common shares, as ordinary income, and to pay an interest charge on a portion of such gain or distributions, unless the shareholder makes a timely and effective “qualified electing fund” (“QEF Election”) or a “mark-to-market” election with respect to the common shares. A U.S. shareholder who makes a QEF Election generally must report on a current basis its share of the net capital gain and ordinary earnings for any year in which the Company is PFIC, whether or not the Company distributes any amounts to its shareholders. However, U.S. shareholders should be aware that there can be no assurance that the Company will satisfy record keeping requirements that apply to a QEF Election, or that the Company will supply U.S. shareholders with information that such U.S. shareholders require to report under the QEF Election rules, in event that the Company is a PFIC and a U.S. shareholder wishes to make a QEF Election.
Thus, U.S. shareholders may not be able to make a QEF Election with respect to their common shares. A U.S. shareholder who makes the mark-to-market election generally must include as ordinary income each year the excess of the fair market value of the common shares over the taxpayer’s basis therein. Each U.S. shareholder should consult his or her own tax advisor regarding the U.S. federal, U.S. state and local, and foreign tax consequences of the PFIC rules and the acquisition, ownership, and disposition of Common Shares.
Documents filed as part of this Quarterly Report on Form 10-Q or incorporated by reference:
| Exhibit Number | Description |
| | |
| 2.1 | Amended and Restated Arrangement Agreement between Midway Gold Corp. and Pan-Nevada Gold Corporation, dated February 26, 2007,previously filed with the initial registration statement on Form S-1 filed with the Securities and Exchange Commission on August 6, 2007 and incorporated herein by reference. |
| | |
| 3.1 | Notice of Articles,previously filed with the initial registration statement on Form S-1 filed with the Securities and Exchange Commission on August 6, 2007 and incorporated herein by reference. |
| | |
| 3.2 | Articles,previously filed with the initial registration statement on Form S-1 filed with the Securities and Exchange Commission on August 6, 2007 and incorporated herein by reference. |
| | |
| 3.3 | Articles and Notice of Alteration for Series A Rights, previously filed on Form 8-K with the Securities and Exchange Commission on November 26, 2012 and incorporated herein by reference. |
| | |
| 31.1* | Certification of Chief Executive Officer pursuant to Rule 13a-15(f) of the Exchange Act |
| | |
| 31.2* | Certification of Chief Financial Officer pursuant to Rule 13a-15(f) of the Exchange Act |
| | |
| 32* | Certification of Chief Executive Officer and Chief Financial Officer pursuant to Rule 13a or 15(d) of the Exchange Act and 18 U.S.C. Section 1350, as adopted pursuant to Section 906 of the Sarbanes-Oxley Act of 2002 |
| | |
| 101** | Financial statements from the Quarterly Report on Form 10-Q of Midway Gold Corp. for the three months ended March 31, 2012, formatted in XBRL: (i) the Unaudited Consolidated Balance Sheets, (ii) the Unaudited Consolidated Statements of Operations, (iii) the Unaudited Consolidated Statements of Cash Flows, and (iv) the Notes to the Unaudited Consolidated Financial Statements. |
* filed herewith
**furnished herewith
SIGNATURES
Pursuant to requirements of the Securities Exchange Act of 1934, the Registrant has duly caused this report to be signed on its behalf by the undersigned thereunto duly authorized.
| | MIDWAY GOLD CORP. |
| | |
| May 7, 2013 | By: | /s/ Kenneth A. Brunk |
| | | Kenneth A. Brunk |
| | | Chairman, Chief Executive Officer, President and |
| | | Director |
| | | (Principal Executive Officer) |
| | | |
| May 7, 2013 | By: | /s/ Fritz K. Schaudies |
| | | Fritz Schaudies |
| | | Chief Financial Officer |
| | | (Principal Financial and Accounting Officer) |